
Marta Peris-Ortiz · José Álvarez-García Editors - NIBM eHub
197
Marta Peris-Ortiz · José Álvarez-García Editors Action-Based Quality Management Strategy and Tools for Continuous Improvement
-
Upload
khangminh22 -
Category
Documents
-
view
9 -
download
0
Transcript of Marta Peris-Ortiz · José Álvarez-García Editors - NIBM eHub

Marta Peris-Ortiz · José Álvarez-García Editors
Action-Based Quality ManagementStrategy and Tools for Continuous Improvement

Action-Based Quality Management

Marta Peris-Ortiz • José Álvarez-García Editors
Action-Based Quality Management
Strategy and Tools for Continuous Improvement

ISBN 978-3-319-06452-9 ISBN 978-3-319-06453-6 (eBook) DOI 10.1007/978-3-319-06453-6 Springer Cham Heidelberg New York Dordrecht London
Library of Congress Control Number: 2014941203
© Springer International Publishing Switzerland 2014 This work is subject to copyright. All rights are reserved by the Publisher, whether the whole or part of the material is concerned, specifi cally the rights of translation, reprinting, reuse of illustrations, recitation, broadcasting, reproduction on microfi lms or in any other physical way, and transmission or information storage and retrieval, electronic adaptation, computer software, or by similar or dissimilar methodology now known or hereafter developed. Exempted from this legal reservation are brief excerpts in connection with reviews or scholarly analysis or material supplied specifi cally for the purpose of being entered and executed on a computer system, for exclusive use by the purchaser of the work. Duplication of this publication or parts thereof is permitted only under the provisions of the Copyright Law of the Publisher’s location, in its current version, and permission for use must always be obtained from Springer. Permissions for use may be obtained through RightsLink at the Copyright Clearance Center. Violations are liable to prosecution under the respective Copyright Law. The use of general descriptive names, registered names, trademarks, service marks, etc. in this publication does not imply, even in the absence of a specifi c statement, that such names are exempt from the relevant protective laws and regulations and therefore free for general use. While the advice and information in this book are believed to be true and accurate at the date of publication, neither the authors nor the editors nor the publisher can accept any legal responsibility for any errors or omissions that may be made. The publisher makes no warranty, express or implied, with respect to the material contained herein.
Printed on acid-free paper
Springer is part of Springer Science+Business Media (www.springer.com)
Editors Marta Peris-Ortiz Department of Business Administration Universitat Politècnica de València Valencia , Spain
José Álvarez-García Accounting and Financial
Economy Department University of Extremadura Cáceres , Spain

v
Foreword
Quality is a vast and complex subject. While on one hand, everyone has a perception of the quality of products they buy and the services they are provided with, on the other, most have no notion of the technical aspects embedded in the products and/or processes related to the manufacturing/service delivery. Moreover, it is only experts who have an understanding of how organizational solutions impact the quality of products/services, even though this is critical. However, everyone is in search of good quality and expects a positive relationship between money spent and the value received.
Quality is understood in this book as a wide range of techniques and methods framed by principles of management and business development.
Decision makers have some reservations about quality as a functional area within an organization, namely in terms of its relevance and scope either due to the nature of control of their typical activities or because it is insuffi ciently integrated into business priorities. This is not helped by the sometimes-hermetic language used by quality professionals. Nowadays, organizations are multifaceted and operate in a competitive environment which calls for highly skilled managers. Unless the quality movement faces these challenges, it will fail to bring all the potential benefi ts to the organization.
At the organizational level, innovation is particularly important because com-petitiveness moves quickly towards the upstream areas of production/service deliv-ery. In today’s world, the means (technologies) of production in many activities are often consumer goods that can be bought by anyone. They do bring gains, but they are not lasting gains. In contrast, organizational knowledge that enables quality and innovation provides a sustainable competitive advantage. Quality may not in itself be suffi cient for competitiveness, but it is certainly an indispensable factor. The accumulated knowledge in the fi eld of quality not only has the advantage of being public but also has proven results and is not costly.
This is a timely and well-organized book that examines several cases in which quality techniques and methods are applied. It is timely because many of the recent studies on quality have focused on areas of management and organizational devel-opment (soft skills), and the production area has been overlooked. However,

vi
techniques and quality methods enable great improvements to be made and this should not be forgotten. Moreover, the tools and methodologies of quality described and fully illustrated in the book are particularly relevant at this time of economic crisis which has had a devastating effect on organizations.
Indeed, the strong focus on soft areas and the neglect of operational areas have given rise to approaches that favor short- and medium-term results and not long- term. For instance, although the lean and 6 sigma approaches were developed in the fi eld of quality management, they are presented as new alternative approaches.
On the other hand, the easy and quick access to information resulting from new information and communication technologies can lead to the illusion that rapid solutions can be found effortlessly and with little knowledge. However, we know that an understanding of widely used techniques and methods, like quality, is essen-tial before turning to the more elaborated and sophisticated ones that are often deci-sive in more aggressive competitive environments. Complexity can only be effectively managed by those with the most advanced levels of knowledge and experience.
Even though the horizons of knowledge today are greater than ever before, they sometimes seem beyond reach. Academia must respond to the needs of the business world by making knowledge more concise and accessible so that companies can put theory into practice. This book identifi es the ways in which academia and the busi-ness world can work together to their mutual advantage.
This book offers managers in the private and public spheres, academics studying organizations, as well as students of engineering not only concepts, thoughts, per-spectives and examples of techniques and methods, but also technical and scientifi c contributions to understanding the deeper relationships between quality manage-ment practices and organizational performance.
There is a growing community of academics studying various aspects of quality management and producing a range of interesting and exciting new insights. In early 2013, José Alvarez Garcia took the initiative to organize a book on quality management themes, bringing together academics from several countries and regions whose work addresses different aspects of quality management.
The chapters present the different but complementary points of view necessary for a comprehensive understanding of quality management. The book also embraces a variety of quantitative and qualitative methodological approaches that is desirable in research on organizations but absolutely crucial to improving our understanding of quality management issues.
The chapters cover a wide range of subjects, including relationships between quality management and organization performance; evaluation of service delivery quality; quality and environmental management systems (ISO 9001, 14001, EMAS); management system integration; TQM and EFQM Excellence model; innovative value propositions; process management; active cooperation of employees; quality- related costs; and data treatment, using statistical tools. More technical issues like robot programming and the use of international regulations and standards to ensure the quality of services in information technology companies are also covered, as
Foreword

vii
well as how the implementation of a quality management system promotes the implementation of High-Involvement Human Resources Management Practices.
I was delighted to be asked to write this foreword and am grateful to the editors for allowing me to be part of this journey. I am sure the reader will enjoy this book and will take away new insights from it.
Setúbal, Portugal António Ramos Pires
Foreword


ix
1 Quality Management and Performance in the Hotel Industry: A Literature Review .......................................... 1 Juan José Tarí , José F. Molina-Azorín , Jorge Pereira-Moliner , María D. López-Gamero, and Eva M. Pertusa-Ortega
2 Two Views for Understanding How TQM Fosters Learning and Value Innovation: Absorptive Capabilities and Action-Based Management ............................................................. 13 Tomas Gonzalez Cruz , Fernando J. Garrigos-Simon , Sonia Cruz Ros , and Yeamduan Narangajavana
3 An Application of SERVQUAL Model in Termas of Chaves .............. 27 María de la Cruz del Río Rama , José Álvarez García, Carlos Rueda- Armengot , and José Luís Coca Pérez
4 Management by Processes: An Effective Tool for Employee Motivation ........................................................................ 43 Maria Moreno-Mas , Sofi a Estelles-Miguel , Jose Maria Merigo , and Encarnación González-Vázquez
5 Eco-Management and Audit Scheme: Effects on the Profitability of Their Adherence ................................................ 53 Natalia López-Mosquera García , Marta Peris-Ortiz , and José Álvarez García
6 An Integrated View of the Use of Quality Cost Information, the Improvement of the Quality Management System and Effects on Performance: A Study in Portuguese Companies ........................................................ 67 Jorge Novas and Margarida Saraiva
Contents

x
7 Processes Approach, Quality Management and Key Business Results ....................................................................... 83 Rafael Periañez-Cristobal , Arturo Calvo-Mora , and Antonio Navarro-García
8 Quality Management Systems ISO 9901 and the Use of High Involvement Work Practices ................................ 97 Amable Juárez- Tárraga , Jose Miguel Albarracin - Guillem , Marta Palmer -Gato , and Juan A. Marin-Garcia
9 Implementing Multiple Management Systems: Is It Sustainable? ..................................................................................... 115 Merce Bernardo and Alexandra Simon
10 The Impact of TQM Critical Success Factors on Business Performance. The Mediating Role of Implementation Factors in Linking Enabler and Instrumental Factors ..................................... 127 Francisco J. Carmona-Márquez , Antonio G. Leal-Millán , Adolfo E. Vázquez- Sánchez , and Antonio L. Leal-Rodríguez
11 Student Perception of Quality in Higher Education Institutions ....... 143 Paula Fernandes , Rui Lopes , and Fátima Silva
12 Optimisation Methodology Based on Genetic Algorithms to Increase the Quality and Performance in Autotrading Robots............................................................................. 157 Antonio Alonso-Gonzalez , Vicent Almenar-Llongo , and Marta Peris-Ortiz
13 Implementation Methodology of Effective Governance to Ensure the Quality of IT Service ....................................................... 175 Ignacio Gil-Pechuán , Patrick Pullicino , and M. Pilar Conesa García
Index ................................................................................................................. 193
Contents

1M. Peris-Ortiz and J. Álvarez-García (eds.), Action-Based Quality Management: Strategy and Tools for Continuous Improvement, DOI 10.1007/978-3-319-06453-6_1,© Springer International Publishing Switzerland 2014
Abstract This paper presents a literature review of the quantitative empirical studies that have analyzed the relationship between quality management and performance in the hotel industry. It is based on a search of the databases ScienceDirect, ABI/Inform and Emerald, and it identifi es the quality management and performance variables used, the analyses carried out and the main fi ndings. The results show that, in general terms, quality management has positive effects on operational and fi nancial perfor-mance, that quality certifi cation leads to positive benefi ts for many hotels, that spe-cifi c variables such as the number of stars or the size of hotel could be an infl uence on this relationship, and that other variables could also help us to understand better the relationship between quality management and performance, for example the motives for certifi cation. Based on these results the paper offers implications for managers and future lines of research.
1.1 Introduction
Quality management helps companies to improve performance and competitive-ness. The positive benefi ts of quality management have persuaded many companies to implement quality management systems and academics to examine the relation-ship between quality initiatives and performance. The studies examining the effects of quality management on performance in hotels are not so fully developed as those in manufacturing industries (Wilkins et al. 2007 ; Rubio-Andrada et al. 2011 ).
Chapter 1 Quality Management and Performance in the Hotel Industry: A Literature Review
Juan José Tarí , José F. Molina-Azorín , Jorge Pereira-Moliner , María D. López-Gamero , and Eva M. Pertusa-Ortega
J. J. Tarí (*) • J. F. Molina-Azorín • J. Pereira-Moliner M. D. López-Gamero • E. M. Pertusa-Ortega Department of Business Management , University of Alicante Campus de Sant Vicent del Raspeig , E-03080 , Spain e-mail: [email protected]; [email protected]; [email protected]; [email protected]; [email protected]

2
Most of studies are empirical studies, and although there are literature reviews on quality management (Sila and Ebrahimpour 2003 ; Nair 2006 ; Molina-Azorín et al. 2009 ; Heras-Saizarbitoria and Boiral 2013 ), to best of our knowledge there are no literature reviews on quality management in the hotel industry. A literature review about quality management in hotels is valuable in that it might inform practitioners about the trends in managing quality in hotels and provide information that could inform future research into quality management in hotels.
This chapter presents a literature review that identifi es empirical academic stud-ies on the relationship between quality management and performance in hotels. The ScienceDirect, ABI/Inform and Emerald databases were interrogated by means of searches with the following key words: (1) hotels or hospitality, (2) quality manage-ment or ISO 9001 or ISO 9000, and (3) performance or competitive advantage or profi tability. The references in the papers identifi ed by these searches were also reviewed. The work identifi es the dimensions of quality management and perfor-mance and the relationships between these variables in a hotel context. It also sug-gests other variables that can play a role in this relationship.
The remainder of the chapter is organized as follows. First the chapter presents a short overview of quality management and performance. Next the literature review on quality management in hotels is described. The chapter ends with a summary of the main conclusions and implications for future research.
1.2 Quality Management and Performance
Quality management is a management system that includes a set of practices in order to manage an organization. Organizations can develop their own quality pro-grammes or follow academic models or those that exist in the market (e.g., European Foundation for Quality Management model, Malcom Baldrige National Quality Award model, ISO 9001 standard).
Based on quality management studies, the most common quality management practices are: leadership, people management, planning, information and analysis, process management, supplier management, customer/stakeholder focus and design. The literature suggests that these quality management practices may have positive effects on performance and competitiveness.
This relationship between quality management and competitiveness was fi rst analysed from an academic and empirical point of view in the 1990s, with mixed conclusions. While some studies found a positive relationship between these vari-ables (Powell 1995 ; Easton and Jarrell 1998 ; Fotopoulos and Psomas 2010 ), other have shown that this relationship does not always exist, or is not a clear one (Boje and Winsor 1993 ; Taylor and Wright 2003 ), probably because employees and/or managers lack the motivation to implement a real quality culture, or the fi rm imple-ments the system ineffi ciently, or there is lack of support from the management. The studies examining these relationships have examined both manufacturing and
J.J. Tarí et al.

3
service fi rms, although studies have mainly focused on manufacturing fi rms (Molina-Azorín et al. 2009 ). Also, regarding the analysis of quality management variables, mention must be made of the studies focusing on the total quality man-agement (TQM) variable, and those considering the ISO 9001 certifi cate or other quality models as a variable. In turn, within the fi rst group, a distinction should be drawn between those studies measuring the TQM variable as a single construct and those using a multidimensional construct. All these studies show that, in general terms, quality management may have a positive infl uence on results.
However, the results of the ISO 9001 quality management system are not so clear. Firstly, there are a number of studies pointing out that the ISO 9001 standard improves issues such as effi ciency, customer and employee satisfaction, service quality and profi tability (Häversjö 2000 ; Tzelepis et al. 2006 ; Lee et al. 2009 ; Mak 2011 ). According to this group of studies, the ISO 9001 standard has clear opera-tional benefi ts, such as those related to quality results (e.g., customer and employee satisfaction). A second set of studies indicates that certifi ed fi rms have improved fi nancial results (Heras et al. 2002 ; Chow-Chua et al. 2003 ; Mokhtar and Muda 2012 ). A third set of studies, which are the most negative, states that certifi cation has no impact on a fi rm’s results (Rahman 2001 ; Singels et al. 2001 ; Tsekouras et al. 2002 ; Martínez-Costa et al. 2009 ; Lo et al. 2011 ). These three positions indicate that, in general terms, an ISO 9001 quality management system usually improves quality results, although the effects on fi nancial results are not conclusive.
All these studies suggest that quality management may have positive effects on operational and fi nancial performance. Similarly, quality management may infl u-ence competitiveness. Deming ( 1982 ) pointed out that quality improves competi-tiveness, and this idea is also advanced by quality models and scholarly studies. In this regards, some works on quality management show that human issues are the key to explaining competitiveness (Powell 1995 ), that quality management is related to a fi rm’s differentiation strategy (Prajogo and Sohal 2006 ) and that ISO 9001 certifi -cate can create competitive advantages (Chow-Chua et al. 2003 ; Feng et al. 2008 ).
1.3 Quality Management and Performance in the Hotel Industry
The literature also shows the application of these ideas in hotels in theoretical and empirical studies. The empirical studies, of a qualitative and quantitative nature, include those that analyse the level of implementation of quality management in hotels but do not establish any relationship with operational and fi nancial results and competitiveness (Arasli 2002 ; Harrington and Keating 2006 ), and also those dealing with the effects of quality management on hotels’ results and competitive-ness (see Appendix). Both qualitative and quantitative studies show that hotels may successfully adopt quality management practices or quality models, as has been demonstrated to be the case for manufacturing fi rms.
1 Quality Management and Performance in the Hotel Industry: A Literature Review

4
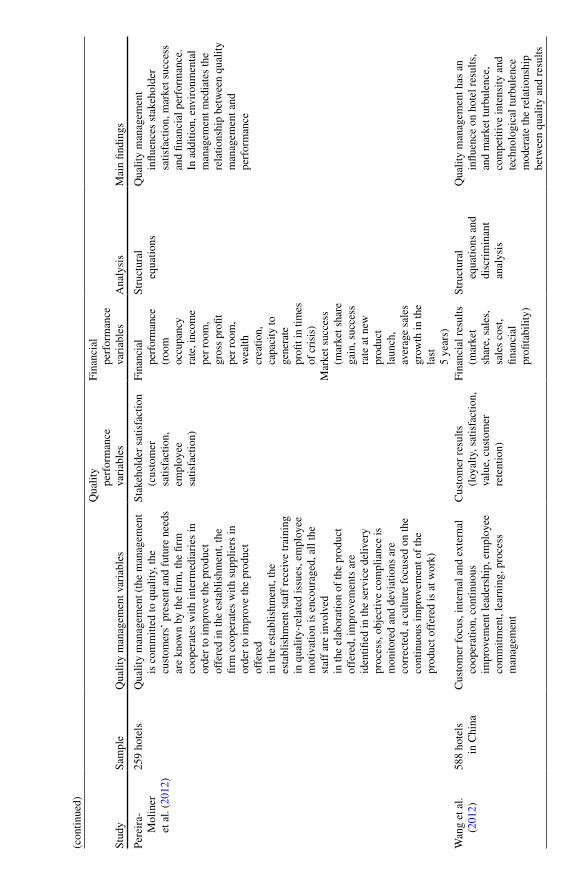
The Appendix summarizes the principal empirical studies examining the effects of quality management on performance dimensions in hotels, based on the search carried out. It identifi es the variables used to measure quality management, quality/operational performance, and fi nancial performance, as well as the analysis used and the main fi ndings. In this context, those studies focusing only on a specifi c per-formance dimension, for example, only on employee satisfaction, were not included (e.g., Sharpley and Forster 2003 ). In the end, 14 empirical studies examining the effects of quality management on different performance dimensions were identifi ed (see Appendix).
The majority of these studies have used perceptual measures based on surveys (e.g, questionnaires) and a few studies used objective measures. As is common in quality management studies, the studies in the Appendix measured quality manage-ment mainly in terms of TQM and the ISO 9001 standard. Seven studies measures quality management using ISO 9001 certifi cation, four used TQM as a multidimen-sional construct and two used TQM as a single construct. One study used other ratios to measure quality management. Similarly, the effects of quality management initiatives focused on operational/quality performance and fi nancial performance. Operational and/or quality performance measures were usually customer and employee satisfaction, although some studies also used other operational measures such as a reduction in the number of errors or impact on society, among others. Regarding fi nancial performance, the studies focused mainly on market share, sales and other hotel performance measures such as gross profi t per room.
These studies analyzed this relationship based on different statistical techniques. Two studies used descriptive analyses, fi ve used signifi cance differences, two applied factor analysis and/or cluster analysis, two used regressions, and three used structural equations.
The main fi nding of these studies show that the positive benefi ts are related to customer satisfaction, people satisfaction, the satisfaction of other stakeholders, and improvements in operational performance, effi ciency, hotel image, the level of dif-ferentiation and fi nancial performance.
This indicates that quality management may improve a hotel’s internal functions, which allows it to increase the productivity of both employees and facilities, improve effi ciency, and reduce costs and waste when providing a service. In turn, this may have a positive effect on customer satisfaction, which may allow the hotel to increase its sales and market share, create guest loyalty, attract new guests, and improve its image. In this way, quality management may improve the results and the competi-tiveness of hotels through process standardization, waste reduction, more effi cient services and error reduction.
However, the literature also mentions a number of problems in the implementa-tion of quality management which detract from its success, and may even prevent it from yielding positive outcomes for some hotels. In this respect, Breiter and Bloomquist ( 1998 ) pointed out that 14 out of the 116 hotels that they analysed which implemented quality management were not successful. Nield and Kozak
J.J. Tarí et al.
5
( 1999 ) showed that only a few hotels improved customer satisfaction and competi-tiveness as a result of the implementation of a quality system. This could be due mainly to a lack of managerial commitment (Viada-Stenger et al. 2010 ) or lack of employee participation (Baldacchino 1995 ). Alongside these issues, other barriers indicated by the literature, which may hinder the implementation of a quality man-agement system in hotels, are lack of fi nancial resources, employee resistance to change, the fact that employees do not consider quality an important factor, and lack of enthusiasm (Harrington and Keating 2006 ). Lack of commitment on the part of managers and employees is a key problem, and the two are mutually related: lack of commitment by the management prevents it from delegating responsibility to employees and from giving them suffi cient training. In order to improve commit-ment among employees, the management must promote greater responsibility for quality among employees, allowing them, for instance, to modify certain processes and deal with customers’ complaints (Partlow 1993 ).
The effects of quality management on these issues can be direct or indirect, and other variables could be considered to explain this relationship better. For example, environmental management has parallels with quality management and may possi-bly mediate the relationship between quality management and performance (Pereira- Moliner et al. 2012 ). Market orientation may also mediate the relationship between quality management and hotel performance (Wang et al. 2012 ). Similarly, environ-mental factors (market turbulence, competitive intensity, technological turbulence) may moderate the relationship between quality management and hotel performance (Wang et al. 2012 ).
Other variables can play a role in this relationship. For example, some studies have shown that hotels with a higher level of quality management usually have a higher category and are chain-affi liated. Nevertheless, there is no overall consensus on the role of size in the relationship.
Finally, hotels that implement a quality management system can do it for both internal and external reasons. Whether quality certifi cation is sought for internal or external reasons may affect how much it contributes to improving hotel perfor-mance (Alonso-Almeida et al. 2012 ) and that may, in turn, infl uence the level of adoption of the quality management system, as some studies in manufacturing organizations have shown.
1.4 Conclusions and Future Research
The objective of this chapter is to analyze the main fi ndings on the effects of quality management on different performance dimensions in hotels. Based on the empiri-cal studies listed in the Appendix, it can be said that quality management infl u-ences competitive performance, stakeholder satisfaction and other operational measures (e.g., effi ciency) and can have positive effects on fi nancial performance.
1 Quality Management and Performance in the Hotel Industry: A Literature Review

6
In this context, quality certifi cates may also have positive effects on performance. The Appendix also shows how quality management and performance dimensions have been measured in the context of hotels. The category of a hotel and whether or not it is chain-affi liated could lead hotels to show more commitment to quality issues, and these and other variables could be included in research to develop a better understanding of the relationship between quality initiatives and perfor-mance. For example, regarding quality certifi cates, as in other industries, whether the certifi cation is driven by internal or external reasons can infl uence the imple-mentation of quality systems and, consequently, their benefi ts. In addition, mediat-ing and moderating factors can play a role in this relationship (e.g., environmental management initiatives, market orientation, and environmental factors).
Based on the empirical studies analyzed in this chapter and other studies about quality management in hotels and in manufacturing organizations, several ideas for future research can be proposed. First, it would be interesting to analyze the effects of quality management on operational performance and the impact of the latter on fi nancial performance. In this context, the quality management measures in Appendix can be used as a guide for the measurement of quality management in hotels in future studies. Second, different mediating and moderating variables could be included to understand better the relationship between quality management and performance. Such mediating variables might include environmental management, environmental turbulence, competitive intensity, culture, category and affi liation. Third, empirical studies about the relationship between quality and environmental management systems, or between quality and environmental certifi cates, and their impacts on performance could provide interesting insights. Fourth, success factors for effective implementation of quality initiatives are needed. In this context, studies of reasons for certifi cation, internalization and/or other antecedent factors (e.g., leadership, employee involvement, stakeholder pressure) are also needed in order to develop a better understanding of the level of implementation of quality initiatives in hotels and their effects on performance. Obtaining the perceptions of various stakeholders (e.g., employees and customers) could supplement the surveys of man-agers’ opinions that form the backbone of the majority of studies considered here. Finally, longitudinal studies, mixed methods studies (qualitative and quantitative studies) and works from different countries could extend the range of applicability and the richness of the results that have been found in previous studies.
Acknowledgements This work has been carried out as part of the research project ECO2009- 12231 funded by the Spanish Government. The authors thank and acknowledge the support received.
Appendix
Summary of quantitative studies on the effects of quality management in hotels
J.J. Tarí et al.

Stud
y Sa
mpl
e Q
ualit
y m
anag
emen
t var
iabl
es
Qua
lity
perf
orm
ance
va
riab
les
Fina
ncia
l pe
rfor
man
ce
vari
able
s A
naly
sis
Mai
n fi n
ding
s
Cam
isón
( 1
996 )
38
Val
enci
an
hote
ls
and
250
cust
omer
s
Lea
ders
hip,
pol
icy
and
stra
tegy
, pe
ople
man
agem
ent,
reso
urce
s,
proc
esse
s
Cus
tom
er s
atis
fact
ion,
pe
ople
sat
isfa
ctio
n,
soci
al im
pact
Fina
ncia
l res
ults
D
escr
iptiv
e an
alys
is
Qua
lity
man
agem
ent i
s bas
ic fo
r co
mpe
titiv
enes
s, al
thou
gh th
ere
are
diffe
renc
es b
etw
een
man
ager
s’ a
nd c
usto
mer
s’
perc
eptio
ns
Bre
iter
and
Blo
omqu
ist
( 199
8 )
230
US
hote
ls
Lea
ders
hip,
cus
tom
er f
ocus
, em
pow
erm
ent,
proc
ess
impr
ovem
ent,
fact
-bas
ed d
ecis
ions
, tr
aini
ng, r
ecog
nitio
n, fl
exib
ility
, te
chni
ques
and
tool
s, s
trat
egy
plan
ning
, tea
ms,
sup
plie
r m
anag
emen
t, IS
O 9
000
cert
ifi ca
tion
Succ
essf
ul q
ualit
y m
anag
emen
t pr
ogra
mm
e,
non-
succ
essf
ul
qual
ity m
anag
emen
t pr
ogra
mm
e
Des
crip
tive
anal
ysis
and
si
gnifi
cant
di
ffer
ence
s be
twee
n gr
oups
Mos
t hot
els
deri
ve b
enefi
t fr
om
qual
ity a
nd fi
nd th
e ob
stac
les
men
tione
d in
the
liter
atur
e on
qua
lity
in in
dust
rial
fi rm
s
Nie
ld a
nd
Koz
ak
( 199
9 )
34 I
SO-9
001-
ce
rtifi
ed
tour
ist fi
rm
s (i
nclu
ding
ho
tels
)
ISO
900
0 ce
rtifi
catio
n O
pera
tiona
l ben
efi ts
, pe
ople
ben
efi ts
, m
arke
ting
bene
fi ts
(cus
tom
er
satis
fact
ion,
co
mpe
titiv
e ad
vant
age,
imag
e)
Des
crip
tive
anal
ysis
and
in
terv
iew
s w
ith
thre
e of
the
orga
niza
tions
an
alys
ed
The
ISO
900
1 ha
s cl
ear b
enefi
ts
for o
pera
tiona
l res
ults
, med
ium
be
nefi t
s fo
r mar
ketin
g re
sults
, an
d re
sults
rega
rdin
g em
ploy
ees.
Als
o, th
e m
anag
ers
inte
rvie
w p
oint
ed o
ut th
at th
ere
seem
s to
be
no d
irect
co
nnec
tion
with
fi na
ncia
l re
sults
, bec
ause
cus
tom
ers
do
not u
sual
ly s
eek
certi
fi cat
ion.
K
imes
( 20
01 )
1,13
5 H
olid
ay
Inn
hote
ls
The
stu
dy a
naly
sed
the
ratio
s in
the
hote
ls’
qual
ity a
ssur
ance
rep
orts
N
umbe
r of
def
ects
in
each
hot
el a
rea
Inco
me
per
avai
labl
e ro
om
(Rev
PAR
)
Sign
ifi ca
nt d
iffer
ence
s be
twee
n ho
tels
with
de
fect
s an
d ho
tels
w
ithou
t def
ects
, an
d be
twee
n de
fi cie
nt h
otel
s an
d no
n- de
fi cie
nt h
otel
s
The
re is
a d
irec
t rel
atio
nshi
p be
twee
n pr
oduc
t qua
lity
and
fi nan
cial
res
ults
. Def
ects
in
the
exte
rior
, in
room
s an
d ba
thro
oms
are
criti
cal,
whe
reas
pro
blem
s in
oth
er
hote
l are
as d
o no
t hav
e an
im
port
ant e
ffec
t on
Rev
PAR
(con
tinue
d)

Stud
y Sa
mpl
e Q
ualit
y m
anag
emen
t var
iabl
es
Qua
lity
perf
orm
ance
va
riab
les
Fina
ncia
l pe
rfor
man
ce
vari
able
s A
naly
sis
Mai
n fi n
ding
s
Cla
ver-
Cor
tés
et a
l. ( 2
008 )
30
1 Sp
anis
h ho
tels
C
omm
itmen
t to
qual
ity m
anag
emen
t (m
anag
eria
l com
mitm
ent,
cust
omer
sa
tisfa
ctio
n, c
oope
ratio
n w
ith
inte
rmed
iari
es a
nd s
uppl
iers
, tr
aini
ng, m
otiv
atio
n, e
mpl
oyee
in
volv
emen
t, co
ntin
uous
im
prov
emen
t, co
ntro
l)
Cus
tom
er s
atis
fact
ion,
em
ploy
ee s
atis
fact
ion
Mar
ket s
hare
, sa
les,
gro
ss
profi
t pe
r ro
om, e
tc.
Clu
ster
ana
lysi
s an
d re
gres
sion
an
alys
is
Tho
se h
otel
s th
at d
evel
op q
ualit
y pr
actic
es to
a h
ighe
r ext
ent
have
bet
ter o
pera
tiona
l res
ults
, im
prov
ed c
ompe
titiv
enes
s an
d hi
gher
sat
isfa
ctio
n am
ong
thei
r int
eres
t gro
ups
(cus
tom
ers
and
empl
oyee
s).
Qua
lity
man
agem
ent h
as a
n im
pact
on
com
petit
iven
ess
and
inte
rest
gro
up s
atis
fact
ion
Tarí
et a
l. ( 2
009 )
30
3 Sp
anis
h ho
tels
with
an
d w
ithou
t qu
ality
ce
rtifi
catio
n
Qua
lity
cert
ifi ca
te
Cus
tom
er s
atis
fact
ion,
em
ploy
ee s
atis
fact
ion
Mar
ket s
hare
, sa
les,
gro
ss
profi
t pe
r ro
om, e
tc.
Sign
ifi ca
nt
diff
eren
ces
betw
een
grou
ps
Cer
tifi e
d ho
tels
hav
e be
tter
oper
atio
nal r
esul
ts, a
lthou
gh
no s
igni
fi can
t dif
fere
nces
are
sh
own
rega
rdin
g th
e sa
tisfa
ctio
n of
inte
rest
gro
ups
and
fi nan
cial
res
ults
N
icol
au a
nd
Selle
rs
( 201
0 )
24 q
ualit
y ce
rtifi
cate
s Q
ualit
y ce
rtifi
cate
Fi
rm’s
mar
ket
valu
e (s
hare
pr
ice)
Eve
nt s
tudy
an
d re
gres
sion
an
alys
is
The
pri
ce o
f sh
ares
rea
cts
posi
tivel
y to
the
anno
unce
men
t of
the
cert
ifi ca
te
Rub
io-A
ndra
da
et a
l. ( 2
011 )
11
1 ce
rtifi
ed
Span
ish
hote
ls
ISO
900
1 or
Q C
ertifi
cat
e E
rror
red
uctio
n,
impr
oved
ope
ratio
ns,
trai
ning
, use
of
new
te
chno
logi
es,
wor
king
con
ditio
ns,
mot
ivat
ion,
few
er
com
plai
nts,
cus
tom
er
satis
fact
ion
(am
ongs
t ot
hers
)
Inco
me,
pro
fi ts,
fi n
anci
al
ratio
Fact
or a
naly
sis
The
qua
lity
cert
ifi ca
te h
as a
po
sitiv
e ef
fect
on
oper
atio
nal
and
cust
omer
res
ults
, and
al
so im
prov
es fi
nanc
ial
resu
lts
(con
tinue
d)

(con
tinue
d)
Stud
y Sa
mpl
e Q
ualit
y m
anag
emen
t var
iabl
es
Qua
lity
perf
orm
ance
va
riab
les
Fina
ncia
l pe
rfor
man
ce
vari
able
s A
naly
sis
Mai
n fi n
ding
s
Ara
sli (
2012
) 23
hot
els
in
Tehr
an
Lea
ders
hip,
sat
isfi e
d cu
stom
ers,
fa
ct-b
ased
, peo
ple-
base
d m
anag
emen
t, co
ntin
uous
im
prov
emen
t
Bus
ines
s ex
celle
nce
outc
omes
A
NO
VA
test
M
ost m
anag
ers,
chi
efs,
and
em
ploy
ees
gave
thei
r lo
wes
t sc
ores
to q
ualit
y cu
lture
pr
actic
es a
nd b
usin
ess
exce
llenc
e pe
rfor
man
ce
Alo
nso-
Alm
eida
et
al.
( 201
2 )
162
Span
ish
hote
ls
cert
ifi ed
w
ith th
e 90
01 I
SO
stan
dard
or
the
Q
cert
ifi ca
te
Qua
lity
cert
ifi ca
tion
(ISO
900
1 or
Q
cert
ifi ca
te)
Res
ults
reg
ardi
ng
cust
omer
s,
supp
liers
and
oth
er
inte
rest
gro
ups,
em
ploy
ee r
esul
ts,
oper
atio
nal r
esul
ts
Fina
ncia
l res
ults
St
ruct
ural
eq
uatio
ns
The
rea
sons
for
cer
tifi c
atio
n ha
ve a
n in
fl uen
ce o
n em
ploy
ee s
atis
fact
ion,
whi
ch
in tu
rn h
as a
n im
pact
on
the
qual
ity o
f th
e se
rvic
es
offe
red.
In
turn
, th
is h
as a
n in
fl uen
ce o
n th
e re
sults
reg
ardi
ng c
usto
mer
s,
supp
liers
and
oth
er in
tere
st
grou
ps. S
imila
rly,
the
qual
ity o
f se
rvic
es a
nd
oper
atio
ns h
as p
ositi
ve
impa
cts
on fi
nanc
ial r
esul
ts
Álv
arez
G
arcí
a et
al.
( 201
2a )
186
Span
ish
hote
ls w
ith
the
Q
cert
ifi ca
te
Q C
ertifi
cat
e C
usto
mer
res
ults
, em
ploy
ee r
esul
ts,
soci
ety
resu
lts
Key
out
com
es
Fact
or a
nd
clus
ter
anal
ysis
C
ertifi
ed
hote
ls w
ith g
reat
er
conc
ern
for
inte
rnal
and
ex
tern
al r
easo
ns f
or
cert
ifi ca
tion
have
a h
ighe
r le
vel o
f de
velo
pmen
t of
qual
ity p
ract
ices
and
bet
ter
resu
lts in
gen
eral
Á
lvar
ez
Gar
cía
et a
l. ( 2
012b
)
34 c
ompa
nies
w
ith th
e Q
fo
r qu
ality
ce
rtifi
cate
Q C
ertifi
cat
e C
usto
mer
res
ults
, em
ploy
ee r
esul
ts,
soci
ety
resu
lts
Key
per
form
ance
re
sults
St
uden
t t te
st
The
com
pani
es s
tudi
ed,
incl
udin
g ho
tels
, tha
t hav
e im
plem
ente
d th
e “Q
for
qu
ality
” ha
ve im
prov
ed
thei
r le
vels
of
perf
orm
ance
Stud
y Sa
mpl
e Q
ualit
y m
anag
emen
t var
iabl
es
Qua
lity
perf
orm
ance
va
riab
les
Fina
ncia
l pe
rfor
man
ce
vari
able
s A
naly
sis
Mai
n fi n
ding
s
Pere
ira-
Mol
iner
et
al.
( 201
2 )
259
hote
ls
Qua
lity
man
agem
ent (
the
man
agem
ent
is c
omm
itted
to q
ualit
y, th
e cu
stom
ers’
pre
sent
and
fut
ure
need
s ar
e kn
own
by th
e fi r
m, t
he fi
rm
coop
erat
es w
ith in
term
edia
ries
in
orde
r to
impr
ove
the
prod
uct
offe
red
in th
e es
tabl
ishm
ent,
the
fi rm
coo
pera
tes
with
sup
plie
rs in
or
der
to im
prov
e th
e pr
oduc
t of
fere
d in
the
esta
blis
hmen
t, th
e es
tabl
ishm
ent s
taff
rec
eive
trai
ning
in
qua
lity-
rela
ted
issu
es, e
mpl
oyee
m
otiv
atio
n is
enc
oura
ged,
all
the
staf
f ar
e in
volv
ed
in th
e el
abor
atio
n of
the
prod
uct
offe
red,
impr
ovem
ents
are
id
entifi
ed
in th
e se
rvic
e de
liver
y pr
oces
s, o
bjec
tive
com
plia
nce
is
mon
itore
d an
d de
viat
ions
are
co
rrec
ted,
a c
ultu
re f
ocus
ed o
n th
e co
ntin
uous
impr
ovem
ent o
f th
e pr
oduc
t off
ered
is a
t wor
k)
Stak
ehol
der
satis
fact
ion
(cus
tom
er
satis
fact
ion,
em
ploy
ee
satis
fact
ion)
Fina
ncia
l pe
rfor
man
ce
(roo
m
occu
panc
y ra
te, i
ncom
e pe
r ro
om,
gros
s pr
ofi t
per
room
, w
ealth
cr
eatio
n,
capa
city
to
gene
rate
pr
ofi t
in ti
mes
of
cri
sis)
M
arke
t suc
cess
(m
arke
t sha
re
gain
, suc
cess
ra
te a
t new
pr
oduc
t la
unch
, av
erag
e sa
les
grow
th in
the
last
5
year
s)
Stru
ctur
al
equa
tions
Q
ualit
y m
anag
emen
t in
fl uen
ces
stak
ehol
der
satis
fact
ion,
mar
ket s
ucce
ss
and
fi nan
cial
per
form
ance
. In
add
ition
, env
iron
men
tal
man
agem
ent m
edia
tes
the
rela
tions
hip
betw
een
qual
ity
man
agem
ent a
nd
perf
orm
ance
Wan
g et
al.
( 201
2 )
588
hote
ls
in C
hina
C
usto
mer
foc
us, i
nter
nal a
nd e
xter
nal
coop
erat
ion,
con
tinuo
us
impr
ovem
ent l
eade
rshi
p, e
mpl
oyee
co
mm
itmen
t, le
arni
ng, p
roce
ss
man
agem
ent
Cus
tom
er r
esul
ts
(loy
alty
, sat
isfa
ctio
n,
valu
e, c
usto
mer
re
tent
ion)
Fina
ncia
l res
ults
(m
arke
t sh
are,
sal
es,
sale
s co
st,
fi nan
cial
pr
ofi ta
bilit
y)
Stru
ctur
al
equa
tions
and
di
scri
min
ant
anal
ysis
Qua
lity
man
agem
ent h
as a
n in
fl uen
ce o
n ho
tel r
esul
ts,
and
mar
ket t
urbu
lenc
e,
com
petit
ive
inte
nsity
and
te
chno
logi
cal t
urbu
lenc
e m
oder
ate
the
rela
tions
hip
betw
een
qual
ity a
nd r
esul
ts
(con
tinue
d)

11
References
Alonso-Almeida MM, Rodríguez-Antón JM, Rubio-Andrada L (2012) Reasons for implementing certifi ed quality systems and impact on performance: an analysis of the hotel industry. Serv Indust J 32:919–936
Álvarez García J, Fraiz Brea JA, Del Río Rama MC (2012a) Análisis de las motivaciones para certifi car la marca “Q de calidad turística”. Sector de alojamiento. Investigaciones Europeas de Dirección y Economía de la Empresa 18:101–121
Álvarez García J, Fraiz Brea JA, Del Río Rama MC (2012b) The effects of implementing “Q” for quality on the business performance. Eur J Tourism Hospit Recreat 3(1):53–75
Arasli H (2002) Gearing total quality into small-and medium-sized hotels in North Cyprus. J Small Bus Manage 40(4):350–359
Arasli H (2012) Towards business excellence in the hospitality industry: a case for 3-, 4-, and 5-star hotels in Iran. Total Qual Manag Bus Excel 23:573–590
Baldacchino G (1995) Total quality management in a luxury hotel: a critique of practice. Int J Hospital Manage 14(1):67–78
Boje DM, Winsor RD (1993) The resurrection of Taylorism: total quality management’s hidden agenda. J Organ Change Manag 6(4):57–70
Breiter D, Bloomquist P (1998) TQM in American hotels. Cornell Restaur Adm Q 39(1):26–33 Camisón C (1996) Total quality management in hospitality: an application of the EFQM model.
Tour Manage 17(3):191–201 Chow-Chua C, Goh M, Wan TB (2003) Does ISO 9000 certifi cation improve business perfor-
mance? Int J Qual Reliab Manag 20:936–953 Claver-Cortés E, Pereira-Moliner J, Tarí JJ, Molina-Azorín JF (2008) TQM, managerial factors
and performance in the Spanish hotel industry. Ind Manag Data Syst 108(2):228–244 Deming WE (1982) Quality, productivity and competitive position. MIT Center for Advanced
Engineering, Cambridge, MA Easton GS, Jarrell SL (1998) The effects of total quality management on corporate performance:
an empirical investigation. J Bus 71:253–307 Feng M, Terziovski M, Samson D (2008) Relationship of ISO 9001:2000 quality system certifi ca-
tion with operational and business performance. A survey in Australia and New Zealand-based manufacturing and service companies. J Manuf Tech Manag 19(1):22–37
Fotopoulos CV, Psomas EL (2010) The structural relationships between TQM factors and organi-zational performance. TQM J 22(5):539–552
Harrington D, Keating M (2006) Quality management initiatives in Irish hotels-emerging agendas in a changing environment. Tourism Hospit Res 6(4):267–283
Häversjö T (2000) The fi nancial effects of ISO 9000 registration for Danish companies. Manag Audit J 15:47–52
Heras I, Dick GPM, Casadesús M (2002) ISO 9000 registration’s impact on sales and profi tability: a longitudinal analysis of performance before and after accreditation. Int J Qual Reliab Manag 19(6):774–791
Heras-Saizarbitoria I, Boiral O (2013) ISO 9001 and ISO 14001: towards a research agenda on management system standards. Int J Manag Rev 15:47–65
Kimes SE (2001) How product quality drives profi tability. The experience at Holiday Inn. Cornell Hotel Restaur Adm 42(3):25–28
Lee PKC, To WM, Yu BTW (2009) The implementation and performance outcomes of ISO 9000 in service organizations: an empirical taxonomy. Int J Qual Reliab Manag 26:646–662
Lo CKY, Yeung ACL, Cheng TCE (2011) Meta-standards, fi nancial performance and senior exec-utive compensation in China: an institutional perspective. Int J Prod Econ 129:119–126
Mak BLM (2011) ISO certifi cation in the tour operator sector. Int J Contemp Hospit Manag 23:115–130
Martínez-Costa M, Choi TY, Marínez JA, Martínez-Lorente AR (2009) ISO 9000/1994, ISO 9001/2000 and TQM: the performance debate revisited. J Oper Manag 27:495–511
1 Quality Management and Performance in the Hotel Industry: A Literature Review

12
Mokhtar MZ, Muda MS (2012) Comparative study on performance measure and attributes between ISO and non-ISO certifi cation companies. Int J Bus Manag 7:185–193
Molina-Azorín JF, Tarí J, Claver-Cortés E, López-Gamero MD (2009) Quality management, environmental management and fi rm performance: a review of empirical studies and issues of integration. Int J Manag Rev 11(2):197–222
Nair A (2006) Meta-analysis of the relationship between quality management practices and fi rm performance-implications for quality management theory development. J Oper Manag 24:948–975
Nicolau JL, Sellers R (2010) The quality of quality awards: diminishing information asymmetries in a hotel chain. J Bus Res 63:832–839
Nield K, Kozak M (1999) Quality certifi cation in the hospitality industry: analyzing the benefi ts of ISO 9000. Cornell Hotel Restaur Adm Q 40:40–45
Partlow CG (1993) How Ritz-Carlton applies TQM. Cornell Hotel Restaur Adm Q 34(4):16–24 Pereira-Moliner J, Claver-Cortés E, Molina-Azorín JF, Tarí JJ (2012) Quality management,
environmental management and fi rm performance: direct and mediating effects in the hotel industry. J Cleaner Prod 37:82–92
Powell TC (1995) Total quality management as competitive advantage: a review and empirical study. Strat Manag J 16:15–37
Prajogo DI, Sohal AS (2006) The relationship between organization strategy, total quality manage-ment (TQM), and organization performance─the mediating role of TQM. Eur J Oper Res 168:35–50
Rahman S (2001) A comparative study of TQM practice and organisational performance of SMEs with and without ISO 9000 certifi cation. Int J Qual Reliab Manag 18:35–49
Rubio-Andrada L, Alonso-Almeida MM, Rodríguez-Antón J (2011) Motivations and impacts in the fi rm and stakeholders of quality certifi cation: evidence from small- and medium-sized ser-vice enterprises. Total Qual Manag Bus Excel 22:833–852
Sharpley R, Forster G (2003) The implications of hotel employee attitudes for the development of quality tourism: the case of Cyprus. Tour Manage 24:687–697
Sila I, Ebrahimpour M (2003) Examination and comparison of the critical factors of total quality management (TQM) across countries. Int J Prod Res 41:235–263
Singels J, Ruël G, van de Water H (2001) ISO 9000 series certifi cation and performance. Int J Qual Reliab Manag 18(1):62–75
Tarí JJ, Claver-Cortés E, Pereira-Moliner J, Molina-Azorín JF (2009) Is it worthwhile to be a qual-ity certifi ed hotel? Evidence from Spain. Int J Qual Reliab Manag 26(9):850–864
Taylor W, Wright G (2003) A longitudinal study of TQM implementation: factors infl uencing suc-cess and failure. Omega 31:97–111
Tsekouras K, Dimara E, Skuras D (2002) Adoption of a quality assurance scheme and its effect on fi rm performance: a study of Greek fi rms implementing ISO 9000. Total Qual Manag 13:827–841
Tzelepis D, Tsekouras K, Skuras D, Dimara E (2006) The effects of ISO 9001 on fi rms’ productive effi ciency. Int J Oper Prod Manag 26(10):1146–1165
Viada-Stenger MC, Balbastre-Benavent F, Redondo-Cano AM (2010) The implementation of a quality management system based on the Q tourist quality standard. The case of hotel sector. Serv Bus 4:177–196
Wang C-H, Chen K-Y, Chen S-C (2012) Total quality management, market orientation and hotel performance: the moderating effects of external environmental factors. Int J Hospit Manag 31:119–129
Wilkins H, Merrilees B, Herington C (2007) Towards an understanding of total service quality hotels. Int J Hospit Manag 26:840–53
J.J. Tarí et al.

13M. Peris-Ortiz and J. Álvarez-García (eds.), Action-Based Quality Management: Strategy and Tools for Continuous Improvement, DOI 10.1007/978-3-319-06453-6_2,© Springer International Publishing Switzerland 2014
Abstract In the last decade some frameworks have tried to explain how to devise strategies for innovation in value by determining the needs of customers and non-customers, also creating new industries in which competition becomes irrele-vant (Hax, The delta model. Reinventing your business strategy. New York: Springer, 2010; Kim and Mauborgne, Blue ocean strategy. Boston: Harvard Business School Press, 2005; Madhok and Marques 2013 ). These reference frameworks are based on a common set of principles: Value is created through the relationship with the cus-tomer (Priem, Acad Manag Rev 23; 219–235, 2007; Vargo and Lusch 2008 ); Strategy is considered to be a continuous process of exploring new opportunities, through observation of customer behaviour, intuition of opportunities (as a result of inductive reasoning) and the defi nition of value proposals characterized by being focused, clear, and original (Hax, The delta model. Reinventing your business strat-egy. New York: Springer, 2010; Kim and Mauborgne, Blue ocean strategy. Boston: Harvard Business School Press, 2005); agility and speed to intuit and capture new opportunities, as well as fl exibility to operationalize them through experimentation and subsequent trial and error actions (Madhok and Marques 2013 ).
Chapter 2 Two Views for Understanding How TQM Fosters Learning and Value Innovation: Absorptive Capabilities and Action-Based Management
Tomas Gonzalez Cruz , Fernando J. Garrigos-Simon , Sonia Cruz Ros , and Yeamduan Narangajavana
T. Gonzalez Cruz (*) • S. Cruz Ros Departamento de Organización de Empresas Juan José Renau Piqueras , Universitat de Valencia , Avda. dels Taronjers , Valencia 46022 , Spain e-mail: [email protected]; [email protected]
F. J. Garrigos-Simon Departamento de Organización de Empresas , Universitat Politecnica de Valencia Camino de Vera , Valencia 46022 , Spain e-mail: [email protected]
Y. Narangajavana Department of Management , Walailak University, School of Management , 222 Thaiburi , Thasala , Nakhon Si Thammarat 80160 , Thailand e-mail: [email protected]

14
This approach to strategy is relevant in the case of services with high customer contact, in which the management of the relationship with the customer is at the centre of the process of value creation, and in which the implementation of the prin-ciples previously mentioned produces links which lead the customer to perceive the value proposition as valuable, unique and irreplaceable (high switching costs). In this paper we highlight that a substantial part of the above principles are common to those proposed by TQM. The central aim of this essay is to show that organizations which have successfully implemented TQM are in an optimal position to fi nd, defi ne and create innovative value propositions.
2.1 Introduction
TQM has been considered both as a managerial philosophy (Camisón et al. 2006 ) and as a management innovation (Volverda et al. 2013 ) which fosters internal knowledge creation (Camisón et al. 2009 ) and increases internal knowledge transfer (Molina et al. 2004 ) through basic TQM principles such as continuous improvement and learning. However, only recently has attention been devoted to TQM as an ante-cedent of the capability of absorbing external knowledge. Fernández-Pérez and Gutiérrez-Gutiérrez ( 2013 ) show that TQM improves a CEO’s external social net-work, which results in higher strategic fl exibility and improves organizational learn-ing. Likewise, Arumugam et al. ( 2013 ) state that TQM practices increase fi rm and team activities devoted to seeking information from customers and suppliers. Nevertheless, TQM is usually considered at an operational level, as Porter ( 1996 ) states, TQM is about operating effi ciency, but that is not strategy. Research remains scant, Volverda et al. ( 2013 , p. 11) suggest that few scholars have examined how TQM practices contribute to exploratory processes which lead to strategic innovation.
Departing from the absorptive capability framework (Cohen and Levinthal 1990 ) which considers both sides of knowledge creation (internal and external), this paper considers TQM from recently proposed strategy models based on Austrian Economics postulates (Roberts and Eisenhardt 2003 ; Guerras-Martín et al. 2013 ), which highlight customer-oriented value creation, inductive reasoning, entrepre-neurial behavior, strategic fl exibility and agile execution (Madhok and Marques 2013 ). From this point of view, learning produced by TQM is not only useful to reach the productivity frontier as Porter stats ( 1996 ), but also has the potential to foster deep customer understanding which leads to value innovation, resulting in the development of new and uncontested markets where competition becomes irrele-vant (Kim and Mauborgne 2005 ).
The rest of the paper is organized as follows: fi rstly, we develop a brief but com-plete revision of the absorptive capability framework; secondly, the literature that analyzes the relationship between TQM and absorptive capability is outlined; thirdly, customer-oriented strategic models are considered; and fi nally some research questions are proposed.
T. Gonzalez Cruz et al.

15
2.2 Absorptive Capacity in the Context of Strategic Management
Strategic management literature in recent decades has focused on two fundamental paradigms, as being the most infl uential ones: Competitive Positioning, as pro-posed by Michael Porter ( 1980 ), and the Resources and Capabilities-Based View (Wernerfeld 1984 ; Prahalad and Hamel 1990 ). Porter’s view is that, “the essence of formulating competitive strategy is relating a company to its environment” (Porter 1980 , p. 3). On the other hand, the Resources and Capabilities-Based View focuses “on the distinctive competences and the resource and capability assets within the enterprise, as determinant key success factors” (Garrigos and Palacios 2008 , p. 85). However, as Coulter ( 1997 , p. 40) points out regarding these two perspectives, “both are important to understand how organizations achieve a sus-tainable competitive advantage”. In the same vein, newer approaches, such as the Dynamic Capabilities perspective, have tackled strategies enabling fl exibility and responsiveness to environmental changes (Teece et al. 1997 ). Moreover, as Posen and Levinthal ( 2012 ) stress, the literature increasingly focuses attention on high-velocity markets (Brown and Eisenhardt 1997 ), and hypercompetition (D’Aveni and Gunther 1994 ).
In addition, the perspectives centred on internal resources and capabilities agree that the most strategically important resource is knowledge (Kogut and Zander 1996 ). Thus, “knowledge management has become a line of research attracting much interest” (Palacios and Garrigos 2006 ), and as Garrigos ( 2009 , p. 2) points out, “the importance of information and knowledge as increasingly key aspects of competitive advantage in the activities of both individuals and organizations, is widely recognized by authors and practitioners”.
Following a combined perspective, Cohen and Levinthal ( 1990 , p. 128), labelled the term “absorptive capacity”, as “the ability of fi rms to recognize the value of new, external information, assimilate it, and apply it to commercial ends”. “These abili-ties collectively constitute what we have termed a fi rm’s “absorptive capacity” (Cohen and Levinthal 1989a , 1990 , 1994 , p. 227). As these authors point out, “A critical factor in industrial competitiveness is the ability of fi rms to exploit new technological developments. We term this ability a fi rm’s absorptive capacity and argue that such a capability not only enables a fi rm to exploit new extramural knowl-edge, but to more accurately predict the nature of future technological advance” (Cohen and Levinthal 1994 , p. 227).
2.2.1 Absorptive Capacity: Exploration, Exploitation, and Ambidextrous Firms
As Cohen and Levinthal 1994 , p. 227, point out, the capacity to “exploit” outside knowledge is comprised of the set of closely related abilities to evaluate the techno-logical and commercial potential of knowledge in a particular domain, assimilate it, and apply it to commercial ends. The importance of recognizing, assimilating, and
2 Two Views for Understanding How TQM Fosters Learning…

16
applying new knowledge, as the centre of the absorptive capacity, is also stressed by Andriopoulos and Lewis ( 2009 ), who point out the importance of combining exploita-tion and exploration of knowledge, together with the relevance of ambidextrous fi rms.
According to Subramaniam and Youndt ( 2005 ), and Andriopoulos and Lewis ( 2009 , p. 696) “Innovation denotes intricate knowledge about the management pro-cesses of identifying and utilizing ideas, tools, and opportunities to create new or enhanced products or services”. The importance of combining exploration and exploitation is crucial, as Andriopoulos and Lewis ( 2009 , p. 708) point out, in essence, the two modes of innovation are mutually reinforcing. But what is explora-tion and what is exploitation? As Atuahene-Gima ( 2005 ), and Andriopoulos and Lewis ( 2009 , p. 696) explain “exploitation hones and extends current knowledge, seeking greater effi ciency and improvements to enable incremental innovation”, in addition, exploration, “entails the development of new knowledge, experimenting to foster the variation and novelty needed for more radical innovation”. Exploration is essential for fi rms, as Posen and Levinthal ( 2012 , p. 598) stress, “we conceive of strategies as refl ecting managerial and organizational attempts to understand the world and act appropriately”. However, as Andriopoulos and Lewis ( 2009 , p. 708) point out “Exploitative efforts help transform knowledge into commercial ends, but without exploration a fi rm’s stock of knowledge will wane (e.g., being used repeat-edly until a fi rm is stuck in a specifi c product or industry niche). Likewise, explor-atory efforts help to continuously renew and expand a fi rm’s knowledge base, but without exploitation that knowledge may not be utilized fully (e.g., recombined in varying ways across projects or product iterations)”.
Nevertheless, sometimes organizations do not balance these factors appropri-ately. In the same vein, organizational ambidexterity signifi es a fi rm’s ability to manage tensions between the exploration and exploitation (Duncan 1976 ). Hence, ambidextrous fi rms are those “capable of simultaneous, yet contradictory, knowl-edge management processes, exploiting current competencies and exploring new domains with equal dexterity” (Lubatkin et al. 2006 ; Andriopoulos and Lewis ( 2009 , p. 696). This point was stressed previously by March ( 1991 ), who identifi es the need to allocate limited resources across both the exploitation of the known and exploration of the novel as a central strategic trade-off, and also highlighted by Gupta et al. ( 2006 ) and Posen and Levinthal ( 2012 , p. 587), who point out that “bal-ancing exploration and exploitation is central to a fi rm’s performance”.
2.2.2 Antecedents of Absorptive Capacity
However, how can companies enhance these processes? According to Cohen and Levinthal ( 1994 , p. 244) “a fi rm’s absorptive capacity - not only permits fi rms to exploit new, valuable developments, but also to better envision their emergence”.
Similarly, the intention in this chapter is to stress the link between quality man-agement and the use of absorptive capabilities to enhance the exploitation and exploration of knowledge by fi rms. Let us start by emphasizing the main ways of
T. Gonzalez Cruz et al.
17
developing absorptive capacity. According to Cohen and Levinthal ( 1994 , p. 227), “a fi rm may develop its absorptive capacity in a variety of ways:
1. “ It may do so directly by sending employees for advanced technical training or by encouraging employees to monitor and read the technical literature in their areas of expertise” Cohen and Levinthal ( 1994 , p. 227).
– First of all, Cohen and Levinthal ( 1990 , p. 128) point out that March and Simon ( 1958 , p. 188) suggest that most innovations result from borrowing rather than invention”, so monitoring the external environment, and also the literature is essential.
– However, and apart from this, “the ability to evaluate and use outside knowl-edge is largely a function of the level of prior related knowledge” (Cohen and Levinthal 1990 , p.128). Moreover, “The premise of the notion of absorptive capacity is that the organization needs prior related knowledge to assimilate and use new knowledge” Cohen and Levinthal ( 1990 , p. 129). According to these authors, prior knowledge is essential as it permits not only the assimila-tion ( ibid , p. 135), but also the exploitation of new knowledge ( ibid , p. 136). Hence, prior knowledge will affect innovative performance in an evolving, uncertain environment (Cohen and Levinthal 1989b ; Cohen and Levinthal, ( 1990 , p. 136). Following Cohen and Levinthal ( 1994 , pp. 227–228) “fi rms develop their absorptive capacities largely through the accumulation of related knowledge that permits them to evaluate and exploit subsequent develop-ments within a fi eld…. To use such knowledge, a fi rm must typically acquire complementary internal expertise to create what we call absorptive capacity”. As Cohen and Levinthal ( 1990 , p. 136) mention, “the possession of related expertise will permit the fi rm to better understand and therefore evaluate the import of intermediate technological advances that provide signals as to the eventual merit of a new technological development”. These postulates are also stressed by Subramaniam and Youndt ( 2005 , p. 453), who point out that “An organization’s preserved knowledge infl uences its propensity to reinforce its knowledge”.
– Thirdly, according to Cohen and Levinthal ( 1990 , p. 129) “the concept of absorptive capacity can best be developed through an examination of the cognitive structures that underlie learning”. In addition, this learning depends on individuals, not only on the organization. Cohen and Levinthal ( 1990 , pp. 131–132) postulate that, “An organization’s absorptive capacity will depend on the absorptive capacities of its individual members… an organiza-tion’s absorptive capacity does not simply depend on the organization’s direct interface with the external environment. It also depends on transfers of knowl-edge across and within subunits that may be quite removed from the original point of entry”. Likewise, according to Cohen and Levinthal ( 1990 , p. 132), to understand the sources of a fi rm’s absorptive capacity, we must focus on the structure of communication between the external environment and the organi-zation, as well as between the subunits of the organization, and also on the character and distribution of expertise within the organization.
2 Two Views for Understanding How TQM Fosters Learning…
18
– Moreover, Cohen and Levinthal ( 1990 , p. 130) postulate that “problem solv-ing and learning capabilities are so similar that there is little reason to differ-entiate their modes of development”.
• Similarly “some psychologists suggest that prior knowledge enhances learning” Cohen and Levinthal ( 1990 , p. 129).
• In addition, according to Cohen and Levinthal ( 1990 , p. 130) “the literature also suggests that problem-solving skills develop similarly. In this case, prob-lem-solving methods and heuristics typically constitute the prior knowledge that permits individuals to acquire related problem solving capabilities…”.
– Hence “the fi rm invests in absorptive capacity by developing the expertise that subsequently permits evaluation, assimilation, and exploitation of knowl-edge from the environment” Cohen and Levinthal ( 1994 , p. 230).
2. However, Cohen and Levinthal posited other ways of developing this prior related knowledge, stressing that, “More typically, however, absorptive capacity is developed as a by-product of some other activities such as R&D or manufac-turing” Cohen and Levinthal ( 1994 , p. 227).
– Innovation is the intended outcome of most R&D efforts (Cohen 1995 ). Cohen and Levinthal ( 1990 ) formulate a model in which R&D contributes to a fi rm’s absorptive capacity. As Cohen and Levinthal ( 1990 , p. 229) stress, “absorptive capacity may be created as a by-product of a fi rm’s R&D invest-ment”, or as they also highlight, “a fi rm’s ability to exploit external knowl-edge is often generated as a by-product of its R&D…. we assume that R&D not only generates new knowledge but also contributes to the fi rm’s absorp-tive capacity” Cohen and Levinthal ( 1990 , p. 138). Likewise, “With regard to R&D….fi rms which conduct complementary research in-house are better able to exploit contract research…” (Cohen and Levinthal 1994 , p. 227).
– “With regard to manufacturing,…..through direct involvement in the manu-facture of a product, a fi rm is better able to recognize and exploit new infor-mation relevant to that particular product market” (Cohen and Levinthal 1994 , p. 227). Similarly, Cohen and Levinthal ( 1990 , p. 129) point out that “product experience provides the fi rm with the background necessary both to recognize the value of and implement methods to reorganize or automate par-ticular manufacturing processes”. Moreover, “when organizations harness their preserved knowledge through structured recurrent activities, they deepen their knowledge and further legitimize its perceived value….. Eventually, such processes create a path-dependent trajectory of reinforced knowledge” (Cohen and Levinthal 1990 ; Subramaniam and Youndt 2005 , p. 453).
2.3 TQM as an Antecedent to Absorptive Capacity
The consideration of TQM as a source of knowledge creation is not a new issue (Rose and Ito 1996 ). TQM principles such as continuous improvement and learning orientation suggest that the deployment of TQM practices would have a positive
T. Gonzalez Cruz et al.

19
impact on internal knowledge creation (Lima et al. 1999 ) and transfer (Molina et al. 2004 ). Different tools and assessment practices enable knowledge creation which fosters product and process innovation, and greater customer satisfaction (Camisón et al. 2009 ). The PDCA cycle and the generalized use of analytical tools throughout the organization contribute to building a shared vision and knowledge base which is continuously renewed (Choo et al. 2007 ). Likewise, TQM fosters inductive learning through experimentation (Ruiz-Moreno et al. 2005 ; Martínez-Costa and Jiménez-Jiménez 2008 ). The most important thing is that learning occurs at all levels of the organization and is related to regular activities.
Equally, TQM principles promote cooperative relationships with suppliers and customers. The entire supply chain is considered in the process of value creation (Powell 1995 ), and stable trustful relationships are developed. TQM stimulates cus-tomer loyalty and satisfaction (Black and Porter 1995 ; Powell 1995 ; Tummala and Tang 1996 ) and promotes the consideration of value from the customer’s side. This requires a deep understanding of the customer’s explicit and latent needs. Customer Orientation, the fi rst TQM principle, encourages scanning and identifying user’s latent and explicit needs (Linderman et al. 2004 ; Prajogo and Sohal 2001 ).
Suppliers are as important as customers, considering the entire supply chain enables a long term relationship which makes cooperation and knowledge exchange possible (Ruiz-Moreno et al. 2005 ; Tarí et al. 2007 ). As a consequence of such orga-nizational openness, TQM enables the acquisition and assimilation of external knowledge (Arumugam et al. 2013 ; Martínez-Costa and Jiménez-Jiménez 2008 ; Ruiz-Moreno et al. 2005 ; Molina et al. 2007 ).
According to Moreno-Luzón et al. ( 2000 ), TQM develops an extensive and close internal network. Process management and teamwork enables mutual learning and knowledge transfer. In the same line of research, Molina et al. ( 2004 ) confi rm that ISO standards improve knowledge transferability, while TQM enables internal knowledge transference.
Likewise, TQM promotes the development of multiple communication channels linking the organization to its environment (Fernández-Pérez and Gutiérrez- Gutiérrez 2013 ). As Moreno-Luzón et al. ( 2000 ) show, when this network is decen-tralized throughout all departments and hierarchical levels, a fi rm’s absorptive capability increases due to the symmetry of experience and expertise between part-ners. As Cohen and Levinthal ( 1990 , p. 129) state, “some psychologists suggest that prior knowledge enhances learning”.
The above paragraphs show a wide body of literature research that clearly dem-onstrates how TQM promotes internal and external learning. However, this learning is mainly focused on improving the effectiveness and effi ciency of the established strategy and its current processes (Birkinshaw et al. 2008 ; Walker et al. 2011 ). As Volverda et al. ( 2013 , p. 11) underline, little research is devoted to analyzing how TQM contributes to managerial innovation.
In this regard, we must remember that TQM was developed in the fi eld of opera-tions and its major gurus are mainly engineers (Camisón et al. 2006 ). During the last decade of the twentieth century, most of the research in the managerial fi eld analyzed TQM from resources and capabilities based views, theoretical frameworks which provide an outside-in focus. In the same vein it is well recognized how TQM increases a fi rm’s resource endowment and learning capabilities. However a strategic
2 Two Views for Understanding How TQM Fosters Learning…

20
customer- focused view with an inside-out focus (McGrath 2010 ) is lacking. In the next sections, we propose how recently proposed customer-oriented strategic mod-els, based on Austrian Economics principles, could help Academics and practitioners to better understand how TQM fosters exploratory innovation.
2.4 Action-Based Management
Here we use the term Action-Based Management (ABM) from Madhok and Marques ( 2013 ). Under this label we will consider a set of different strategic models based on Austrian Economics principles. Without intending to be exhaustive, we present an outline of the basic and shared axioms characterizing these models:
• Customer orientation . The strategy is centred on the customer. Thus, deep customer knowledge becomes paramount (Hax 2010 ; Kim and Mauborgne 2005 ; Madhok and Marques 2013 ). The fi rm must embark on a continuous search process, looking for present and potential user’s needs—what Kim and Mauborgne ( 2005 ) label as ‘visual exploration’ and Hax ( 2010 ) terms ‘customer segmentation’.
• Focus on Value Innovation . This principle is based on theoretical propositions from the fi eld of marketing, namely Service-Dominant Logic (Lusch and Vargo 2006 ; Vargo and Lusch 2004a , b , 2006 , 2008 ), and from the fi eld of strategy (Priem 2007 ). Firms can only articulate value propositions because ‘value is always uniquely and phenomenologically determined by the benefi ciary’ (Vargo and Lusch 2004a ). A value proposition is innovative when it creates dispropor-tionate value at a low cost (Kim and Mauborgne 2005 ). Value innovation is a conjunction of creativity, customer understanding and technology (Ibid.) and is the result of an entrepreneurial strategic process (Ireland et al. 2003 ).
• Opportunities are created and captured . Markets are in a constant state of fl ux (Schumpeter 1942 ; Kirzner 1997 ; Jacobson 1992 ). From this ‘reconstructionist’ view of strategy, restrictions on fi rm behaviour are due to the absence of entrepre-neurial knowledge. That is, innovation depends on a cognitive reconstruction of existing data and market elements in a fundamental new way (Kim and Mauborgne 2005 ). Thus, mature businesses exist only in the minds of mature managers ( Baden-Fuller and Stopford 1994 ) or in a similar way; commodities only exist in the mind of the inept (Hax 2010 , p. 11). Therefore, the relevant chal-lenge is not catching a competitor’s market share, but creating totally new mar-kets where competition becomes irrelevant (Kim and Mauborgne 2005 ). In order to capture and capitalize transient opportunities, timing and organizational fl exibil-ity are critical success factors (Madhok and Marques 2013 ).
• Consider the extended enterprise . That is, align the whole system of activities, including those carried out by customers, suppliers and complementors (Hax 2010 ; Kim and Mauborgne 2005 ). Creating or reconstructing an industry requires changes in the entire system, and in the way constituents create, deliver and cap-ture value ( Zott and Amit 2010 ). Thus, suppliers and complementors become
T. Gonzalez Cruz et al.

21
partners in the value creation process, and the fi rm must choose to engage in those activities which constitute the cornerstones of the entire system (Zott et al. 2011 ).
• Strategic Planning as a fair process . The Strategic process requires organiza-tional engagement and open dialog throughout the organization leading to con-sensus (Hax 2010 , p. 12). That is agreement, at least between key executives and everybody’s buy-in. Also transparency is important for two purposes: Everyone involved in the new value proposition should understand it and the underlying assumptions behind it; and expectation clarity, that is, everyone understands his new role (Kim and Mauborgne 2005 , pp. 175–176).
• Leadership guides the searching process and promotes change . Given that the entrepreneurial, strategic process is a ‘crossing of the desert’ that requires vision and guidance. This model presents a pragmatic leadership focus, the leader concentrates his efforts on the people and activities which have a dispro-portionate contribution to value creation (Kim and Mauborgne 2005 , p. 151).
• Metrics and experimentation: key success factors for organizational learn-ing . As Alvarez and Barney ( 2007 , p. 15) state: “rarely will entrepreneurs be able to see ‘the end from the beginning’”. Thus, intuitive thinking (Kim and Mauborgne 2005 , p. 67), experimentation by trial and error and proper assess-ment and measurement tools, to quantify value created for customers and other constituents (Hax 2010 ; Madhok and Marques 2013 ), are key elements for discovery and learning.
These principles sustain an alternative way of carrying out innovation and value creation. The traditional way is based on possessing the proper resource base (knowledge and fi nancial), tight process control (fi nancial risk control), and a top-down elitist focus, where a few (engineers and scientists) create innovations based on the cutting edge of knowledge technology. ABM proposes a different way where resources are secondary, what’s really important is sensing and creating new oppor-tunities. The customer is the key, not only today’s customers but also underserved customers. Customer contact becomes a cornerstone and, as a consequence the process should be participative in a bottom-up-bottom way. Finally, the process is fl exible and recursive, based on intuition, trial and error and learning by doing.
After presenting axioms that make up these entrepreneurial, customer-oriented strategic models we will devote the last section to showing how AMB axioms and TQM principles present relevant coincidences.
2.5 TQM as ABM Enabler
This paragraph looks at the correspondence between TQM principles and ABM axioms (Table 2.1 ).
As Table 2.1 shows, correspondences are numerous and relevant. TQM principles provide a sound basis for ABM deployment. These similarities indicate that TQM systems could be focused not only toward operational excellence and deliberate planning, assumptions that underlie Business Excellence Models. Alternatively,
2 Two Views for Understanding How TQM Fosters Learning…

22
TQM could be focused on unleashing entrepreneurial strategic processes oriented to create and capture new market opportunities. As Volverda et al. ( 2013 ) stress, the relationship between TQM and exploratory innovation remains unexplored, but it seems promising. Here we propose developing future research to examine how TQM contributes to performance in exploration-oriented fi rms. Likewise, new evi-dence is required in order to understand how traditional innovation processes and ABM innovation dynamic could be harmonized and generate synergies. Finally, it is necessary to determine the circumstances under which each of the two innovation focuses is more appropriate.
References
Alvarez S, Barney J (2007) Discovery and creation: alternative theories of entrepreneurial action. Strat Entrepren J 26(November):11–26
Andriopoulos C, Lewis MW (2009) Exploitation-exploration tensions and organizational ambi-dexterity. Organ Sci 20(4):696–717
Arumugam V, Antony J, Kumar M (2013) Linking learning and knowledge creation to project in Six Sigma projects: an empirical investigation. Int J Prod Econ 141:388–402
Atuahene-Gima K (2005) Resolving the capability-rigidity paradox in new product innovation. J Market 69:61–83
Baden-Fuller C, Stopford JM (1994) Rejuvenating the mature business. Harvard Business School Press, Boston, MA, USA
Birkinshaw J, Hamel G, Mol MJ (2008) Management innovation. Acad Manage Rev 33:825–845 Black S, Porter LJ (1995) An empirical model for total quality management. Total Qual Manag
6(2):149–164
Table 2.1 TQM and ABM correspondences
ABN axioms TQM principles Degree of matching
Customer orientation Customer orientation Very High . Both are demand-side/Customer-oriented focus
Focus on value innovation
Strategic orientation to value creation
Low . While TQM fosters traditional deliberated strategic planning, ABM advocates inductive processes where the strategy is shaped by action
Opportunities are created
Null . TQM focus on operational excellence and incremental value creation
Consider the extended enterprise
Development of Alliances and External Cooperation
High . Both advocate considering the entire supply chain while ABM highlights network effects
Strategy as a fair and open process
Teamwork and Internal Cooperation
High . Both require the entire organization's engagement, but role division may differ
Leadership guides searching processes
Visionary Leadership High . Both highlight the need for a leader who leads the way and protects from fear
Metrics and experimentation
Managing by Facts Very High . Both foster experimentation and learning from hard facts through key performance indicators
T. Gonzalez Cruz et al.

23
Brown S, Eisenhardt K (1997) The art of continuous change: linking complexity theory and time- paced evolution in relentlessly shifting organizations. Adm Sci Q 42(1):1–34
Camisón C, Bornonat M, Villar A, Puig A (2009) Sistemas de gestión de la calidad y desempeño: importancia de las prácticas de gestión del conocimiento y de I + D. Revista Europea de Dirección Y Economía de la Empresa 18(1):123–134
Camisón C, Cruz S, González T (2006) Gestión de la calidad: conceptos, enfoques, modelos y sistemas. Prentice-Hall, Madrid
Choo AS, Linderman KW, Schroeder RG (2007) Method and psychological effects on learning and knowledge creation in quality improvement projects. Manag Sci 53(3):437–450
Cohen WM (1995) Empirical studies of innovative activity. In: Stoneham P (ed) Handbook of the economics of innovation and technological change. Blackwell, Oxford, England, pp 182–264
Cohen WM, Levinthal DA (1989a) Innovation and learning: the two faces of R&D. Econ J 99:569–596
Cohen WM, Levinthal D (1994) A fortune favors the prepared fi rm. Manag Sci 40(2):227–251 Cohen WM, Levinthal DA (1989b) Fortune favors the prepared fi rm. Technical Report, Department
of Social and Decision Sciences: Carnegie Mellon University Cohen WM, Levinthal DA (1990) Absorptive capacity: a new perspective on learning and innovation.
Adm Sci Q 35(1):128–152 Coulter MK (1997) Strategic management in action. Prentice-Hall, Upper Sanddle River, New Jersey,
USA D’Aveni RA, Gunther RE (1994) Hypercompetition: managing the dynamics of strategic
maneuvering. Simon and Schuster, New York Duncan R (1976) The ambidextrous organization: designing dual structures for innovation. In:
Kilman R, Pondy L (eds) The management of organizational design. North Holland, New York, pp 167–188
Fernández-Pérez V, Gutiérrez-Gutiérrez L (2013) External managerial networks, strategic fl exibil-ity and organisational learning: a comparative study among non-QM, ISO and TQM fi rms. Total Qual Manag Bus Excel 24(3–4):243–258
Garrigos F (2009) Interrelationships between professional virtual communities and social net-works, and the importance of virtual communities in creating and sharing knowledge. In: Camison C, Palacios D, Garrigos F, Devece C (Eds) Connectivity and knowledge management in virtual organizations. Information Science Reference. pp 1–22
Garrigos F, Palacios D (2008) Infl uence of industrial structure on managerial knowledge: a new vision of Porter’S fi ve forces scheme. In: Domíngez AL (ed) Global management strategy, challenges and uncertanties. Nova, NY, pp 81–106
Guerras-Martín LA, Madhok A, Montoro-Sánchez A (2013) The evolution of strategic manage-ment research: recent trends and current directions. Business Research Quarterly. Disposable at SSRN: http://ssrn.com/abstract=2374845 or http://dx.doi.org/ 10.2139/ssrn.2374845
Gupta A, Smith K, Shalley C (2006) The interplay between exploration and exploitation. Acad Manage J 49(4):693–706
Hax A (2010) The delta model. Reinventing your business strategy. Springer, New York Ireland RD, Hitt MA, Sirmon DG (2003) A model of strategic entrepreneurship: the construct and
its dimensions. J Manag 29(6):963–989 Jacobson R (1992) The ‘Austrian’ school of strategy. Acad Manage Rev 17(4):782–807 Kim WC, Mauborgne R (2005) Blue ocean strategy. Harvard Business School Press, Boston Kirzner IM (1997) Entrepreneurial discovery and the competitive market process: an Austrian
approach. J Econ Lit 35(1):60–85 Kogut B, Zander U (1996) What do fi rms do? Coordination, identity and learning. Organ Sci
7:502–518 Lima KK, Ahmed PK, Zairi M (1999) Managing for quality through knowledge management.
Total Qual Manag 10(4–5):615–621 Linderman K, Schroeder RG, Zaheer S, Liedtke C, Choo AS (2004) Integrating quality manage-
ment practices with knowledge creation processes. J Oper Manag 22:589–607
2 Two Views for Understanding How TQM Fosters Learning…
24
Lubatkin MH, Simsek Z, Ling Y, Veiga JF (2006) Ambidexterity and performance in small-to- medium-sized fi rms: the pivotal role of top management team behavioral integration. J Manag 32:646–672
Lusch RF, Vargo SL (2006) The service-dominant logic of marketing: reactions, refl ections, and refi nements. Market Theor 6(3):281–288
Madhok A, Marques R (2013) Competing on action: business models and the competitiveness of emerging market enterprises. Disposable at SSRN: http://ssrn.com/abstract=2376337 or http://dx.doi.org/ 10.2139/ssrn.2376337
March JG (1991) Exploration and exploitation in organizational learning. Organ Sci 2(1):71–87 March JG, Simon HA (1958) Organizations, John Wiley & Sons Inc., New York Martínez-Costa M, Jiménez-Jiménez D (2008) Are companies that implement TQM better learn-
ing organisations? An empirical study. Total Qual Manag Bus Excel 19(11):1101–1115 McGrath RG (2010) Business models: a discovery driven approach. Long Range Plann
43(2–3):247–261 Molina LM, Lloréns-Montes FJ, Fuentes-Fuentes MM (2004) TQM and ISO 9000 effects on
knowledge transferability and knowledge transfers. Total Qual Manag Bus Excel 15(7):1001–1015
Molina LM, Lloréns-Montes J, Ruiz-Moreno A (2007) Relationship between quality management practices and knowledge transfer. J OperManag 25:682–701
Moreno-Luzón M, Peris FJ, González T (2000) Gestión de calidad y diseño de organizaciones. Prentice-Hall, Madrid
Palacios D, Garrigos F (2006) The effect of knowledge management practices on fi rm perfor-mance. J Knowledge Manag 10(3):143–156
Porter ME (1980) Competitive strategy: techniques for analyzing industries and competitors. The Free Press, New York
Porter ME (1996) What is strategy? Harvard Business Review, November–December, 61–78 Posen HE, Levinthal DA (2012) Chasing a moving target: exploitation and exploration in dynamic
environments. Manag Sci 58(3):587–601 Powell TC (1995) Total quality management as a competitive advantage: a review and empirical
study. Strat Manag J 16:15–37 Prahalad C, Hamel G (1990) The core competence of the corporation. Harv Bus Rev
68(3):79–91 Prajogo DI, Sohal AS (2001) TQM and innovation: a literature review and research framework.
Technovation 21:539–558 Priem RL (2007) A consumer perspective on value. Acad Manage Rev 23(1):219–235 Roberts PW, Eisenhardt KM (2003) Austrian insights on strategic organization: from market
insights to implications for fi rms. Strat Organ 1(3):345–352 Rose EL, Ito K (1996) Knowledge creation through the internal information market: an integration
of total quality management. Qual Manag J 3:87–102 Ruiz-Moreno A, García-Morales V, Lloréns-Montes FJ (2005) Learning during the quality man-
agement process. Antecedents and effects in service fi rms. Ind Manag Data Syst 105(8): 1001–1021
Schumpeter J (1942) Capitalism, socialism, and democracy. Harper & Row, New York Subramaniam M, Youndt MA (2005) The infl uence of intellectual capital on the types of innova-
tive capabilities. Acad Manag J 48:450–463 Tarí JJ, Molina JF, Castejón JL (2007) The relationship between quality management practices and
their effects on quality outcomes. Eur J Operat Res 183(2):483–501 Teece D, Pisano G, Schuen A (1997) Dynamic capabilities and strategic management. Strat Manag
J 18(7):509–533 Tummala VM, Tang CL (1996) Strategic quality management, Malcolm Baldrige and European
quality awards and ISO 9000 certifi cation. Core concepts and comparative analysis. Int J Qual Reliab Manag 13(4):8–38
Vargo SL, Lusch RF (2004a) Evolving to a new dominant logic for marketing. J Market 68:1–17
T. Gonzalez Cruz et al.

25
Vargo SL, Lusch RF (2004b) The four services marketing myths: remnants from a manufacturing model. J Serv Res 6(May):324–335
Vargo SL, Lusch RF (2006) Service-dominant logic: what it is, what it is not, what it might be. In: Lusch RF, Vargo SL (eds) The service-dominant logic of marketing: dialog, debate, and direc-tions. M.E. Sharpe, Armonk, New York, pp 43–56
Vargo SL, Lusch RF (2008) Service-dominant logic: continuing the evolution. J Acad Market Sci 36(Spring):1–10
Volverda HW, Van Den Bosch FAJ, Heij C (2013) Management innovation: management as fertile ground for innovation. Eur Manag Rev 10:1–15
Walker RM, Damanpour F, Devece CA (2011) Management innovation and organizational perfor-mance: the mediating effect of performance management. J Pub Adm Res Theor 21:367–386
Wernerfeld B (1984) A resource-based view of the fi rm. Strat Manag J 5:171–180 Zott C, Amit R (2010) Business model design: An activity system perspective. Long range plan-
ning 43(2-3):216–226. doi: 10.1016/j.lrp.2009.07.004 Zott C, Amit R, Massa L (2011) The business model: recent developments and future research.
J Manag 37(4):1019–1042
2 Two Views for Understanding How TQM Fosters Learning…
27M. Peris-Ortiz and J. Álvarez-García (eds.), Action-Based Quality Management: Strategy and Tools for Continuous Improvement, DOI 10.1007/978-3-319-06453-6_3,© Springer International Publishing Switzerland 2014
Abstract The perceived quality of service of users is a necessary concept to be taken into account by the managers of the Termas, due to its capability to guide them on how to improve the service they provide. To make this concept operational, per-ceived quality is analyzed by applying the SERVQUAL model. The objective of this chapter is to evaluate the service provision model in the Termas of Chaves (Portugal), in order to guide managers on the development of improvements to the present model, considering the weaknesses found. The results show good internal and exter-nal validity of the measurement scale, while having high reliability, becoming a tool capable of evaluating the perceived quality of service provided by the Termas de Chaves. In general, users rate the service received in terms of quality with 6.57, on a 7-point Likert scale, detecting safety and empathy as areas to be improved.
Chapter 3 An Application of SERVQUAL Model in Termas of Chaves
María de la Cruz del Río Rama , José Álvarez García , Carlos Rueda- Armengot , and José Luís Coca Pérez
M. C. del Río Rama (*) Departamento de Organización de Empresas y Márketing , University of Vigo , As Lagoas , Ourense 32004 , Spain e-mail: [email protected]
J. Á. García • J. L. C. Pérez Departamento de Economía Financiera y Contabilidad , University of Extremadura, Avda. Universidad , Cáceres , Extremadura 10071 , Spain e-mail: [email protected]; [email protected]
C. Rueda-Armengot Departamento de Organización de Empresas , Universitat Politècnica de València, Camino de Vera , Valencia 46022 , Spain e-mail: [email protected]

28
3.1 Introduction
Nowadays the Termas are being established as an alternative to conventional tourism, due to consumers’ change in values “ who get to interpret health as a broader concept than the absence of disease, but as a synonym of quality of life ” (Bonfada et al. 2011 ), and on the other hand, as an increase in quality of life and greater availability of time that leads consumers to demand leisure and recreation. In this context, the Termas in Portugal “ have returned to add value to the wealth of their natural resource, face the present century with renovated facilities that without losing a shred of the therapeutic character they have shown, are incorporating the moder-nity needed to satisfy this new public segment that seeks more recreational aspects in hydrotherapy, focused on relaxation and well-being ” (Pacheco and García 2011 : 14). Thus, at present these establishments in their process of adaptation to demand have acquired a broader approach; customers come to the thermal baths, either to treat or prevent ailments or to take a break and spend a few days off enjoying a real health holiday.
The aim of health tourism is to recover, improve or maintain health and is a term that encompasses two aspects: therapeutics-medical services and well-being- wellness services (Global Spa Summit LLC 2011 ), and thermal baths as the main representative of this type of tourism (Artal Tur et al. 2004 ) brings two different approaches together: medical infrastructures and the combination of rehabilitation and well-being activities. In 1973, thermal tourism was defi ned by the United Nations World Tourism Organization as “ tourism that is based on the provision of health infrastructures using the country’s resources, in particular its mineral waters and climate ” (Mintel 2007 ).
Thermalists like any other customer, are today much more demanding and informed (Talón et al. 2007 ). This together with the intensifi cation of market com-petition has led to the provision of a quality service becoming an element of strategic differentiation, as it is one of the main factors that have an infl uence on competitive-ness (Sureshchandar et al. 2002 ). In this sense, numerous studies have shown that managing quality has a notable infl uence on the competitiveness of fi rms (Kim 1995 ), so therefore quality becomes at present, one of the priorities for management and improving competitiveness a key strategic objective for establishments.
In this context, thermal baths seek to adapt to customer demand and face the challenge of increasing the level of perceived quality of service by thermalistas. In addition to increasing leisure activities, ie, complementary services (wide range of needs), with the aim of achieving customer satisfaction and therefore loyalty of cur-rent customers and increasing the possibility of capturing new customers by word of mouth, in order to survive in an environment in which they have to compete with other tourist products.
To reach this goal, according to Serrano and López ( 2000 ), in the fi rst place, it is necessary to measure the level of quality service provided, which involves identifying the key dimensions of the service and evaluating their impact on the client’s global satisfaction. Secondly, it is necessary to complement the activities of operational
M.C. del Río Rama et al.

29
nature (those that have to do with the performance of the service) with strategic ones, where both internal and external customer satisfaction is the priority objective.
Knowing thermalist expectations on quality service, constitutes a way of focus-ing and designing the offer in accordance with market requirements and thereby developing programs and actions capable of meeting these expectations, taking into account that the factors that have an infl uence on quality of service are; the physical aspects that include infrastructures, internal environment, etc., human aspects, ie, staff attitudes and qualities and operational aspects, service performance. All of these aspects are to be considered, since they have a great decisive infl uence on quality perceived by the thermalist.
One of the greatest challenges faced by thermal establishments to reach and maintain high levels of quality of service is the development and control of the interactions between the company staff, since employees have a direct relationship with thermalists and quality of service is going to depend on how they provide the service, being personnel qualifi cation, attitudes and motivation, fundamental aspects to bear in mind. “ Human resources are the basis of obtaining competitive sales in the tourism sector, due to the fact that their relationship and motivation are strate-gic elements that infl uence the quality of service ” (Gutierrez and Rubio 2009 : 141).
In summary, taking into account the literature on quality of service, it will pro-vide thermal establishments with great benefi ts in terms of improved market share and competitiveness, operational performance (productivity and costs), increase in personnel motivation and satisfaction, as well as, increase in customer satisfaction that will allow us to generate a long-term profi table relationship with the client, assuring us their loyalty (Jones and Sasser 1995 : 89), differentiation with regard to competition, capturing new clients, amongst others. These benefi ts are the neces-sary impetus for quality service management to become a priority strategy for ther-mal baths, hence the importance of defi ning and measuring the quality at each establishment.
Taking into account the above, we propose this study with the purpose of evaluat-ing the quality of service offered by a Thermal Centre in Portugal, comparing ther-malists’ perceptions and expectations, in order to improve the quality of services provided and customer satisfaction. The evaluation will allow us to analyze and interpret quality dimensions and identify gaps, with the aim of proposing actions for improvement.
We proposed this empirical study in the thermal sector for two reasons: (1) the Thermal sector in Portugal has not been a subject of investigation in this area; (2) the boom and importance health tourism is gaining in today’s society, that although it is a small market niche, it has great possibilities to grow compared to traditional tourism, motivated by health concern, aging population, impulse of social Thermalism linked to a new younger public segment, that seeks relaxation and well-being.
For the achievement of this goal, we have structured the work into two parts. In the fi rst place, we conducted a literature review and the second part of the paper presents the empirical part, which includes: methodology, validation and reliability of the measurement scale, data analysis and conclusions.
3 An Application of SERVQUAL Model in Termas of Chaves
30
3.2 Literature Review
3.2.1 Concept of Perceived Quality of Services
At present, the quality of service is increasingly being used by many organizations as the main competitive tool, given the diffi culty of imitation by competing fi rms. Following authors such as Grönroos ( 1982 , 1984 ), Lethinen and Lethinen ( 1991 ), Lewis ( 1993 ), service quality is a multidimensional concept made up of two dimen-sions, one related to the technical aspects of provision (technical quality) and the other with the interactions that take place between the client and company staff who provide the service (functional quality).
Although there are many defi nitions of quality of service, due to its complex and diffuse nature, none are universally accepted, “m ost agree in considering its subjec-tive nature and the fact that it is determined by customer perception (perceived quality) ” (Laguna and Palacios 2009 ). Researchers like Koelemeijer et al. ( 1993 ), Carman ( 1990 : 33) and Zeithaml ( 1988 ) show the different conceptualizations.
Many of these defi nitions focus on the idea proposed by Parasuraman et al. ( 1988 ) “ the quality of service perceived by the client is the customer’s global view on the excellence or superiority of the service ”, that derives from the comparison made by customers between expectations about the service they will receive and perceptions about the performance of the service received (Grönroos 1984 ; Parasuraman et al. 1985 ), so the quality of service depends on the person who evalu-ates it, and therefore quality turns from something objective to something subjec-tive, where the customer says what it is and what he perceives it to be (Buzzell and Gale 1987 ), which has been expressed by Zeithaml et al. ( 1990 ) “ only consumers judge the quality, all other judgments are essentially irrelevant ”.
The key to providing an excellent service is to understanding and responding to customers’ expectations, which represent what they expect to receive during the service and constitute an element of judgment or fundamental reference point, when assessing quality (Parasuraman et al. 1985 , 1988 , 1991 ; Zeithaml et al. 1993 ). Since many companies currently implement Quality Management Systems, ie they pro-vide technical quality assurance, they are more likely to exceed customers’ expecta-tions through the development of interactions between client and company staff, being this quality the most diffi cult to achieve and to imitate by competitors.
3.2.2 Relationship Between Quality of Service and Customer Satisfaction
Considering that quality is defi ned as “customer satisfaction”, it is necessary to defi ne both concepts and their relationship. Westbrook and Oliver ( 1991 ) and Oliver ( 1997 ) defi ne satisfaction in terms of evaluation or judgment made by the customer once the service has been received. This evaluation depends on the client’s prior
M.C. del Río Rama et al.

31
expectations (Kotler 1991 ). For Zeithaml et al. ( 1996 ) quality of service and cus-tomer satisfaction are two similar concepts but to some extent, establishing the dif-ference between them in the fact that satisfaction involves an evaluation by the customer for a specifi c transaction, which requires previous experience as it is com-pletely experimental (Rust and Oliver 1994 ); while quality of service may be per-ceived without the existence of a direct experience with it (Parasuraman et al. 1988 ).
Many authors claim that there is a relationship between the two concepts (Zeithaml 1988 ; Parasuraman et al. 1988 ; Cronin and Taylor 1992 ; Swan and Bowers 1998 ), by focusing the debate on the causal relationship between the two concepts, with two clearly differentiated views. Some authors consider that customer satisfac-tion is an important goal and the way to achieve it is by quality of service (Goode et al. 1996 ), therefore quality of service is considered the antecedent of satisfaction (Lassar et al. 2000 ; Jamal and Nasser 2002 ; Karatepe et al. 2005 .), but others like Carman ( 1990 ), Patterson and Johnson ( 1993 ) and Casado et al. ( 2004 ) consider satisfaction as an antecedent of quality of service. In the tourism fi eld, this relation-ship has also given rise to numerous studies, accommodation (Albacete et al. 2007 ; Reichel et al. 2000 ), hotels (Tsaur and Lin 2004 ; Briggs et al. 2007 ).
3.2.3 Measurement of Quality of Service: SERVQUAL Model
The measurement of the quality of services is a crucial element, so that organiza-tions can assess the perception of quality of service from the client’s point of view, which will enable implementation and monitoring of continuous improvement processes.
However, its measurement is one of the major problems which companies are faced with. On the one hand, due to market variability and on the other hand due to the intrinsic characteristics of the services, which makes it more diffi cult to assess the quality of a service than that of a tangible product, since the quality of service lies basically on intangible aspects, which are diffi cult to identify and quantify, besides being susceptible to valuations of very diverse nature by customers (Zeithaml 1988 ; Rosenbloom 1991 ; Stanton et al. 1996 ; Martin 1999 ). According to Parasuraman et al. ( 1985 : 36), “ the difference between the evaluation of the quality of service and evaluation of a product by a consumer is not in the process, but rather in the nature of the characteristics upon which the assessment is made ”.
The fi rst relevant research in the fi eld of measurement of quality of service per-ceived was developed by Parasuraman et al. ( 1985 , 1988 ), belonging to the North American school, one of the two great schools of quality research in the service quality fi eld (Brady and Cronin 2001 ). The North American school, revolves around the contributions made by Parasuraman et al. ( 1985 , 1988 ), which follow an approach to quality of service considering the customer’s viewpoint, which gives rise to the concept of quality of service perceived, being the most used approach in scientifi c literature, and defi ned by Parasuraman et al. ( 1988 : 16) “ perceived quality as the global judgment made by the consumer on service excellence or superiority,
3 An Application of SERVQUAL Model in Termas of Chaves

32
which results from the comparison between consumers’ prior expectations on the service and perceptions on the performance of the service received ”.
Furthermore, the Nordic School (Grönroos 1982 , 1983 , 1988 ; Gummesson 1988 ; Lethinen and Lethinen 1991 ), focuses on the quality of service from the point of view of the product and claims that one can distinguish two dimensions of quality of service, technical and functional quality, thus interaction among them a is a key factor for the formation of the company’s corporate image in terms of quality.
The researcher who form part of the North American school, taking into account its approach, undertook three basic aspects of perceived quality of service: the defi -nition of quality of service and identifying the dimensions of the quality of service concept used by customers when it comes to evaluating services.
Furthermore, given the absence of objective measures that enable the evaluation of the quality of service (as opposed to the quality of goods that can be measured by specifi c indicators), they established that a good approximation is on the one hand, measuring quality of service perceived by the client creating a model for it called Servqual scale (quality measuring instrument), defi ned as “ a summarized multi- scale instrument, with a high level of reliability and validity that companies can use to better understand customers’ expectations and perceptions regarding a service ”.
And fi nally, a quality of service model was developed, based on the existence of gaps, which explains the differences between the expected and received service, called Model of Defi ciencies or Gaps, which aims to identify the causes of a poor service (Parasuraman et al. 1985 ).
In order to develop the measurement model, a qualitative exploratory study was performed, carried out in different types of services, which enabled them to develop an instrument to measure perceived quality of service, which as we have seen, defi nes quality of service as a gap between prior expectations and perception of the service provided, which can be measured by the difference between both. The larger the dif-ference between the perception and expectations of the service, the higher the quality.
Initially, in their research, they determined an initial list of ten aspects which they considered fundamental in providing the service and that have an impact on percep-tion (Zeithaml et al. 1993 : 24–25). In the statistical analysis of the ten criteria, high correlations between some of them were found, which motivated their grouping, leaving a fi nal list of fi ve attributes (Zeithaml et al. 1993 ): tangible elements, reli-ability, response capacity, security (which includes professionalism, courtesy, cred-ibility and security) and empathy (including accessibility, communication and comprehension of the user).
Since quality of service is dependent on the difference between perceptions and expectations, managing both is essential. For their understanding, these authors examined which ones were the main factors in the formation of expectations and concluded that prior expectations are conditioned by mouth-ear communication, per-sonal needs, prior expectations and external communication carried out by the com-pany providing the service, usually through advertising or promotional activities.
With the aim of performing the measurement, the SERVQUAL model proposes a questionnaire that collects the expectations prior to consumption and post- consumer perception, using a Likert scale of 1–7. The customers determine their degree of adjustment with a series of questions that measure the fi ve key elements
M.C. del Río Rama et al.

33
of quality of service. Each of the model’s attributes can range from −6 to +6 with three possibilities (Zeithaml et al. 1993 , in Santomá et al. 2008 : 100):
1. The difference is positive (P > E) and therefore the perception is superior to the expectation. In this case, the quality is positive.
2. The difference is negative (P < E) and is therefore a situation in which the expec-tation exceeds the perception, causing a poor quality situation.
3. Both values are equal (P = E) and is therefore a situation where the client receives what he expected.
At present, this is the most used approach of measuring the quality of service in the business fi eld (Bigné et al. 1996 ) and is an obligatory point of reference in the study and management of service quality. Thus, Schiffman and Lazar ( 2001 ) consider this model as a powerful, in-depth marketing research technique, which enables measuring the quality level of any type of service company, enabling to know what expectations the customers have, and how they appreciate the service; also globally diagnosing the service process studied.
3.3 Methodology
The instrument used to comply with the proposed objective is the multidimensional SERVQUAL scale (Parasuraman et al. 1985 ), dividing the survey into four distinct parts; respondent’s profi le, expectations about the service received (22 items), per-ceptions after receiving the service (22 items) and fi nally they were asked about the global assessment on the Thermal Center (Table 3.1 ).
Two interviews were conducted to thermalists, the fi rst one when arriving at the Thermal Centre, before receiving the service in which they were requested to assess their expectations on the service they were going to receive, and the other one on the departure day with the purpose of knowing their opinion about the service they had received. A pretest of the questionnaire was previously performed, with the purpose of validating its content and improving the wording of the questions, where neces-sary. Table 3.2 shows technical information of the fi eld work.
Once designed the research and collected the data, the next step was to check the reliability and validity of the measuring instrument and the unidimensionality of the proposed scales. The analysis of the expectations scale (expected quality), perceptions scale (perceived quality) and the quality measurement were performed separately, ie perceptions minus expectations. We applied the exploratory factor analysis (Spss v.17), which allows you to evaluate whether the proposed scales measure the construct in a consistent and stable manner, and if they are free of systematic and random errors.
To calculate reliability, we used the internal consistency method or Kunder Richardson method, the most used according to Sánchez and Sarabia ( 1999 ). With the aim of testing the reliability of the scale, the following tests are performed: we check that all the scale items have acceptable values of item-total correlation (above 0.3), and analyze the α Cronbach (1951) and Standardized Cronbach α, checking that they exceed the minimum limit of 0.7. With this process we delimit the number of items that measure each concept (Table 3.3 ).
3 An Application of SERVQUAL Model in Termas of Chaves
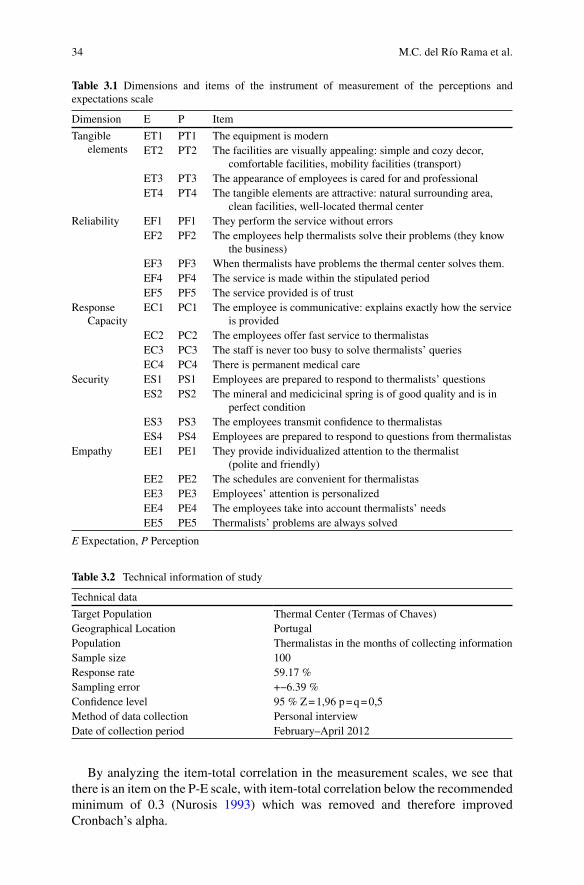
34
By analyzing the item-total correlation in the measurement scales, we see that there is an item on the P-E scale, with item-total correlation below the recommended minimum of 0.3 ( Nurosis 1993 ) which was removed and therefore improved Cronbach’s alpha.
Table 3.1 Dimensions and items of the instrument of measurement of the perceptions and expectations scale
Dimension E P Item
Tangible elements
ET1 PT1 The equipment is modern ET2 PT2 The facilities are visually appealing: simple and cozy decor,
comfortable facilities, mobility facilities (transport) ET3 PT3 The appearance of employees is cared for and professional ET4 PT4 The tangible elements are attractive: natural surrounding area,
clean facilities, well-located thermal center Reliability EF1 PF1 They perform the service without errors
EF2 PF2 The employees help thermalists solve their problems (they know the business)
EF3 PF3 When thermalists have problems the thermal center solves them. EF4 PF4 The service is made within the stipulated period EF5 PF5 The service provided is of trust
Response Capacity
EC1 PC1 The employee is communicative: explains exactly how the service is provided
EC2 PC2 The employees offer fast service to thermalistas EC3 PC3 The staff is never too busy to solve thermalists’ queries EC4 PC4 There is permanent medical care
Security ES1 PS1 Employees are prepared to respond to thermalists’ questions ES2 PS2 The mineral and medicicinal spring is of good quality and is in
perfect condition ES3 PS3 The employees transmit confi dence to thermalistas ES4 PS4 Employees are prepared to respond to questions from thermalistas
Empathy EE1 PE1 They provide individualized attention to the thermalist (polite and friendly)
EE2 PE2 The schedules are convenient for thermalistas EE3 PE3 Employees’ attention is personalized EE4 PE4 The employees take into account thermalists’ needs EE5 PE5 Thermalists’ problems are always solved
E Expectation, P Perception
Table 3.2 Technical information of study
Technical data
Target Population Thermal Center (Termas of Chaves) Geographical Location Portugal Population Thermalistas in the months of collecting information Sample size 100 Response rate 59.17 % Sampling error +−6.39 % Confi dence level 95 % Z = 1,96 p = q = 0,5 Method of data collection Personal interview Date of collection period February–April 2012
M.C. del Río Rama et al.

35
To confi rm the unidimensionality of the proposed scales, we conducted an Exploratory Factor Analysis of principal components with varimax rotation to iden-tify the underlying dimensions in each of the constructs, by sharing the variance among the different factors.
As a preliminary step to carrying out the factor analysis, it is necessary to specify that the data obtained through the questionnaire are suitable for factor analysis. This requires examining the correlation matrix and checking whether indeed it is appro-priate to continue with it. In this way: (1) we check that the correlation matrix between all variables available has a signifi cant number of high correlations (>0.5), and also that the determinant of the correlation matrix takes a value close to zero in all scales; (2) Bartlett Sphericity Test, in our case, we can reject in all the scales this hypothesis because the test value is high and is associated with a signifi cance level less than 0.05; (3) test of Kaiser-Meyer-Olkin (KMO), in our case has a value greater than 0.7; (4) The MSA index is unacceptable for values below 0.5; it has a value greater than 0.7 (Table 3.4 ).
The application of factor analysis did not involve removing any items, in all cases the loadings are greater than 0.5, not considering factor loadings below 0.3 as signifi cant ( Hair et al. 1999 ). In all scales, the cumulative percentage of explained variance is greater than 50 % (Table 3.5 ).
Table 3.3 Reliability analysis of measurement scales
Item
Correlation Item-Total
Alpha if Item is removed
Coeffi cient α of Cronbrach
E P P-E E P P-E E P P-E
Tangible elements
T1 0.564 0.579 0.217 ---- 0.741 0.868 0.821 ---- 0.781 0.849 0.821 T2 0.600 0.816 0.689 0.720 0.728 0.749 0.609 0.742 T3 0.552 0.642 0.657 0.693 0.744 0.828 0.621 0.740
T4 0.662 0.796 0.682 0.677 0.700 0.783 0.621 0.777 Reliability F1 0.493 0.457 0.786 0.824 0.947 0.886 0,819 0.896 0.909
F2 0.716 0.906 0.900 0.749 0.840 0.861 F3 0.752 0.885 0.901 0.737 0.840 0.860 F4 0.561 0.780 0.682 0.797 0.865 0.907 F5 0.584 0.812 0.645 0.797 0.865 0.916
Response Capacity
C1 0.584 0.888 0.709 0.912 0.942 0.963 0.887 0.955 0.939 C2 0.926 0.926 0.953 0.781 0.930 0.888 C3 0.848 0.903 0.917 0.816 0.937 0.900 C4 0.687 0.848 0.866 0.879 0.953 0.917
Security S1 0.567 0.753 0.728 0.937 0.930 0.974 0.900 0.926 0.946 S2 0.874 0.824 0.977 0.833 0.906 0.895 S3 0.906 0.860 0.958 0.820 0.893 0.902 S4 0.782 0.886 0.871 0.869 0.884 0.930
Empathy E1 0.831 0.834 0.888 0.899 0.968 0.871 0.923 0.966 0.912 E2 0.881 0.910 0.918 0.889 0.958 0.863 E3 0.938 0.931 0.936 0.876 0.952 0.859 E4 0.860 0.952 0.806 0.893 0.950 0.888 E5 0.501 0.897 0.477 0.954 0.958 0.972
E expectation, P perception, P-E perception-expectation
3 An Application of SERVQUAL Model in Termas of Chaves

36
Table 3.4 Indicators of the degree of association between variables
Correlation matrix
Determinant of correlation matrix
Bartlett Test of sphericity
Measure of sample adequacy
KMO index
IndicatorEscale
Tangible elements
E V. correlated 0.308 114.045 sig. 0.000 (0.796–0.712) 0.744 P 0.111 212.889 sig. 0.000 (0.842–0.742) 0.778 P-E 0.311 113.345 sig. 0.000 (0.698–0.745) 0.722
Reliability E V. correlated 0.044 549.194 sig. 0.000 (0.553–0.550) 0.594 P 0.009 452.555 sig. 0.000 (0.688–0.925) 0.832 P-E 0.003 212.889 sig. 0.000 (0.817–0.692) 0.733
Response Capacity
E V. correlated 0.046 297.640 sig. 0.000 (0.783–0.814) 0.726 P 0.012 465.060 sig. 0.000 (0.892–0.926) 0.869 P-E 0.008 212.889 sig. 0.000 (0.857–0.942) 0.790
Security E V. correlated 0.037 320.280 sig. 0.000 (0.867–0.783) 0.771 P 0.033 331.687 sig. 0.000 (0.917–0.775) 0.835 P-E 0.003 575.952 sig. 0.000 (0.756–0.891) 0.761
Empathy E V. correlated 0.007 447.476 sig. 0.000 (0.873–0.853) 0.857 P 0.001 672.991 sig. 0.000 (0.883–0.907) 0.849 P-E 0.001 657.296 sig. 0.000 (0.898–0.839) 0.840
Table 3.5 Unidimensionality study
Item
Weight of each variable in the factor
Percentage of explained information
Coeffi cient α fof Cronbrach
E P P-E E P P-E E P P-E
Tangible elements
T1 0.750 0.734 eliminado 61.408 71.332 75.115 0.781 0.849 0.821 T2 0.787 0.915 0.881 T3 0.762 0.811 0.864 T4 0.833 0.905 0.855
Reliability F1 0.655 0.580 0.855 59.216 74.872 74.012 0.819 0.896 0.909 F2 0.828 0.953 0.934 F3 0.863 0.945 0.934 F4 0.752 0.900 0.801 F5 0.733 0.893 0.764
Response Capacity
C1 0.733 0.937 0.818 74.700 88.243 84.684 0.887 0.955 0.939 C2 0.965 0.960 0.975 C3 0.923 0.947 0.954 C4 0.817 0.913 0.925
Security S1 0.714 0.550 0.832 76.941 82.236 86.682 0.900 0.926 0.946 S2 0.936 0.903 0.987 S3 0.955 0.926 0.975 S4 0.883 0.941 0.922
Empathy E1 0.898 0.891 0.947 76.536 88.289 79.452 0.923 0.966 0.912 E2 0.931 0.943 0.974 E3 0.965 0.958 0.980 E4 0.916 0.970 0.906 E5 0.619 0.934 0.587
M.C. del Río Rama et al.

37
Therefore we can conclude that the proposed scales are highly reliable, being therefore random error-free and capable of providing consistent results. Besides this, all measurement scales are unidimensional.
3.4 Data Analysis
Before analyzing the results obtained, the most relevant characteristics of the sample are collected in the Table 3.6 .
In the analysis of expectations and perceptions in the graph, considering that we have used a 7-point Likert scale ranging from 1—strongly disagree to 7—strongly agree, we observe that perceptions are above expectations for most parts of the items, so we can say that the thermalist gets a superior service to what was expected. Analyzing the gaps we can see that the positive gaps of higher value are: response capacity and tangible elements, and there is a negative gap in the empathy dimen-sion, ie the thermalist for this dimension had greater expectations than what was received (Fig. 3.1 ) .
Table 3.6 Sample characteristics
Gender Male 32 % Female 68 % Marital status Single 10 Married 66 Divorced 6 Widower 18
Age 24–44 18 termalistas 45–64 25 termalistas > 65 57 termalistas Studies No education 3 Primary Studies 36 Secondary education 30 Undergraduate 31
Place of residence Northern Portugal 38 Central Portugal 27 Southern Portugal 4 Spain 5 France 5 Monthly Income Up to 500 € 15 From 501 € to 1000 € 11 From 1001 € to 1.500 € 13 More 1501€ 31 No answer 22
Duration of the stay From 3 to 5 days 2 1 week 11 More than 1 week 63 Resident 24 Professional status Self-employed 9 Businessman 9 Unemployed 1 Retired 59 Other 22
Dimensions E P E-P
Tangible elements 6.44 6.47 0.030
Reliability 6.53 6.56 0.029
Response capacity 6.54 6.58 0.045
Security 6.59 6.61 0.015
Empathy 6.59 6.58 -0.006
Global average 6.54 6.56
6
6,1
6,2
6,3
6,4
6,5
6,6
6,7
T2 T3 T4 F1 F2 F3 F4 F5 C1 C2 C3 C4 S1 S2 S3 S4 E1 E2 E3 E4 E5
Tangibleelements
Reliability Responsecapacity
Security Empathy
E P
Fig. 3.1 Perception vs. expectation
3 An Application of SERVQUAL Model in Termas of Chaves
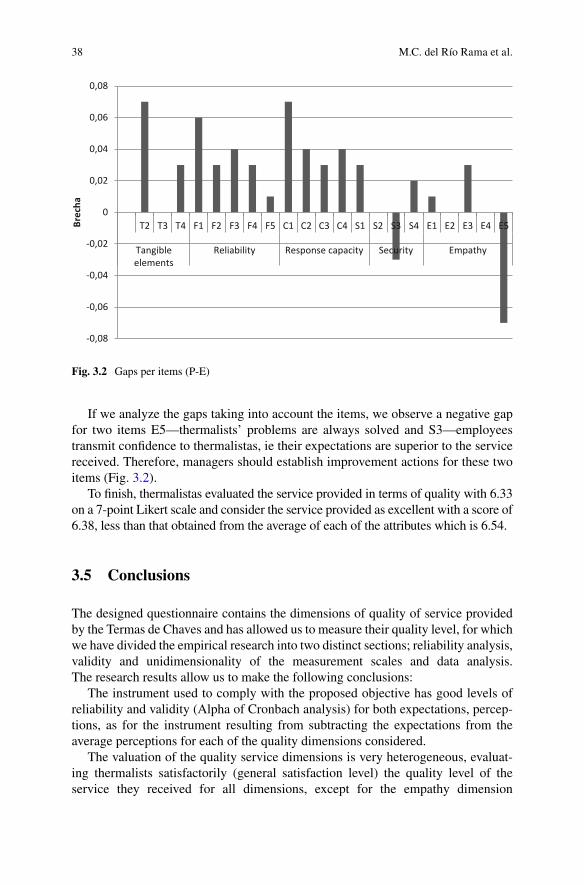
38
If we analyze the gaps taking into account the items, we observe a negative gap for two items E5—thermalists’ problems are always solved and S3—employees transmit confi dence to thermalistas, ie their expectations are superior to the service received. Therefore, managers should establish improvement actions for these two items (Fig. 3.2 ).
To fi nish, thermalistas evaluated the service provided in terms of quality with 6.33 on a 7-point Likert scale and consider the service provided as excellent with a score of 6.38, less than that obtained from the average of each of the attributes which is 6.54.
3.5 Conclusions
The designed questionnaire contains the dimensions of quality of service provided by the Termas de Chaves and has allowed us to measure their quality level, for which we have divided the empirical research into two distinct sections; reliability analysis, validity and unidimensionality of the measurement scales and data analysis. The research results allow us to make the following conclusions:
The instrument used to comply with the proposed objective has good levels of reliability and validity (Alpha of Cronbach analysis) for both expectations, percep-tions, as for the instrument resulting from subtracting the expectations from the average perceptions for each of the quality dimensions considered.
The valuation of the quality service dimensions is very heterogeneous, evaluat-ing thermalists satisfactorily (general satisfaction level) the quality level of the service they received for all dimensions, except for the empathy dimension
-0,08
-0,06
-0,04
-0,02
0
0,02
0,04
0,06
0,08
T2 T3 T4 F1 F2 F3 F4 F5 C1 C2 C3 C4 S1 S2 S3 S4 E1 E2 E3 E4 E5
Tangibleelements
Reliability Response capacity Security Empathy
Brecha
Fig. 3.2 Gaps per items (P-E)
M.C. del Río Rama et al.

39
(negative gap-lower satisfaction level). It has been detected that the staff of the thermal baths does not respond effectively to the thermalists’ requirements; solving problems faced by a thermalist during his/her stay and transmitting greater confi dence when providing the service by employees.
Thermalists’ expectations are very high (6.54 on average), expecting a good service from the thermal baths. Regarding the service, their valuation also has a very high average of 6.57 above expectations, being security the best rated aspect.
We propose as business implications:
– The regular use of the measurement model used, in order to have a statistical evolution of the dimensions after the implementation of improvement actions necessary at each moment, as well as identifying needs for improvement in each of the areas and detecting possible changes of the customers.
– It is recommended to improve the confi dence transmitted from employees to thermalistas, as well as the ability of employees to respond to the problems posed by thermalistas. In that regard, we consider necessary to propose improvement actions aimed at more training and professionalization of the thermal bath personnel, which will improve the quality of service provided.
References
Albacete CA, Fuentes MM, Lloréns FJ (2007) Quality of service measurement in rural accom-modation. Ann Tourism Res 34(1):45–65
Artal Tur A, García Sánchez A, Ruiz Belijar J (2004) El turismo de salud, características de la demanda: implicaciones y consecuencias para el tegido empresarial de la región de Murcia. I Jornadas de Economía del Turismo, Mallorca
Bigné J, Camisón C, Martínez C, Miquel M, Belloch A (1996) Las Agencias de Viajes: Factores de Calidad e Implicaciones de Marketing. V Congreso Nacional de Economía, Las Palmas de Gran Canaria, España, pp 189–210
Bonfada PLB, Bonfada MRH, Alén E, Gandara JMG (2011) El turismo de salud y el uso terapéutico del agua. Estudios y Perspectivas en Turismo 20:462–477
Buzzell R, Gale BT (1987) The PIMS principles. The Free Press, Nueva York Brady M, Cronin JJ (2001) Some new thoughts on conceptualizing perceived services quality: a
hierarchical approach. J Market 65:34–49 Briggs S, Sutherland J, Drummond S (2007) Are hotels serving quality? Anexploratory study of
quality of service in the Scottish hotel sector. Tour Manage 28(4):1006–1019 Carman JM (1990) Consumer perceptions of quality of service: an assessment of the SERVQUAL
dimensions. J Retail 66(1):33–35 Casado AB, Más FJ, Azorín A (2004) Atribución, satisfacción, calidad percibida e intención de
conducta en encuentros de servicio fracasados. Revista Europea de Dirección y Economía de la Empresa 13(1):45–62
Cronin JJ, Taylor SA (1992) Measuring quality of service: a reexamination and extension. J Market 56(3):55–68
Global Spa Summit Llc (2011) Wellness Tourism and Medical Tourism: Where Do Spas Fit?. New York: Global Spa Summit. ( http://www.leadingspasofcanada.com/fi les/fi le/Business%20Tools/spas_wellness_medical_tourism_report_fi nal.pdf )
Goode MMH, Moutinho LA, Chien C (1996) Structural equation modeling of overall satisfaction and full use of services for ATMs. Int J Bank Market 7:4–11
3 An Application of SERVQUAL Model in Termas of Chaves
40
Grönroos C (1982) Strategic management and marketing in the service sector. Swedish School of Economics and Business Administration, Helsinki
Grönroos C (1983) Seven key areas of research according to the Nordic school of service marketing. Emerging Perspectives on Services Marketing. Proceedings Series. American Association. 108–110
Grönroos C (1984) A quality of service model and its marketing implications. Eur J Market 18(4):36–44
Grönroos C (1988) Quality of service: the sixcriteria of good quality of service. Review of business. St. John’s University Press, New York
Gummesson E (1988) Quality of service and product quality combined. Rev Bus 3(invierno):14–19 Gutierrez S, Rubio M (2009) El factor humano en los sistemas de gestión de la calidad del servicio:
un cambio de cultura en las empresas turísticas. Cuadernos de Turismo 23:129–147 Hair J, Anderson R, Tathaman R, Black W (1999) Análisis multivariante, 5th edn. Prentice Hall,
Madrid Jamal A, Nasser K (2002) Customer satisfaction and retail banking: an assessment of some of the
key antecedents of customer satisfaction in retail banking. Int J Bank Market 20(4):146–160 Jones TO, Sasser WE (1995) Why satisfi ed customers defect. Harv Bus Rev 73(6):88–99 Karatepe OM, Yavas U, Babakus E (2005) Measuring quality of service of banks: scale development
and validation. J Retail Consumer Serv 12:373–383 Kim JS (1995) Strategic discoveries trough manufacturing lessons from the 1994. International
Manufacturing Futures Survey. Proceedings Annual Conference, Strategic Management Society Kotler P (1991) Marketing management - analysis, planning, implementation and control. Prentice
Hall, Inc, Englewood Cliffs, NJ Koelemeijer K, Roest H, Verhallen T (1993) An integrative framework of percieved quality and its
relations to satisfactions/dissatisfaction, attitude and repurchase intention. A multinivel approach. European Marketing Academy (EMAC) . Proceedings, Barcelona, ESADE 25–28. 683–699
Laguna M, Palacios A (2009) La calidad percibida como determinante de tipologias de clients y su relación con la satisfacción: aplicación a los servicios hoteleros. Revista Europea de Dirección y Economía de la Empresa 18(3):189–210
Lassar WM, Manolis C, Windsor R (2000) Quality of service perspectives and satisfaction in pri-vate banking. Revista de Empresa 9:78–86
Lethinen U, Lethinen J (1991) Two approaches to quality of service dimensions. Serv Ind J 11(3):287–303
Lewis BR (1993) Quality of service: recent developments in fi nancial services. Int J Bank Market 11(6):19–25
Martín Armario E (1999) Marketing. Barcelona, Ariel Economía Mintel International Group Ltd (2007) Spa tourism en travel & tourism analyst, No. 9. London Nurosis MJ (1993) SPSS. Statistical data análisis. SPSS Inc. Oliver RL (1997) Satisfaction: A behavioral perspective on the customer. New York Pacheco T, García R (2011) Región de Porto y Norte de Portugal 23:14–15 Patterson PG, Johnson LW (1993) Disconfi rmation of expectations and the gap model of quality of
service: an integrated paradigm. J Consumer Satis Dissatis Complain Behav 6:90–99 Parasuraman A, Zeithaml VA, Berry LL (1988) SERVQUAL: a multiple– item scale for measuring
customer perceptions of quality of service. J Retail 64(1):12–40 Parasuraman A, Zeithaml VA, Berry LL (1985) A conceptual model of quality of service and its
implications for future research. J Market 49(4):41–50 Parasuraman A, Zeithaml VA, Berry LL (1991) Refi nement and reassessment of the SERVQUAL
scale. J Retail 67(4):420–450 Reichel A, Lowengart O, Milman A (2000) Rural tourism in Israel: quality of service and orienta-
tion. Tour Manage 21:451–459 Rosenbloom B (1991) Marketing channels. A management view, 4th edn. The Dryden Press,
Orlando, E.E.U.U
M.C. del Río Rama et al.

41
Rust RA, Oliver RL (1994) Quality of service. New directions in theory and practice. Sage, California
Sánchez Pérez M, Sarabia Sánchez FJ (1999) Validez y fi abilidad de escalas. En: Sarabia, FJ (coord) Metodología para la investigación en marketing y administración de empresas, Ed. Pirámide, Madrid, pp 363–393
Santomá R, Batallé P, Rovira X, Costa G, Vila M (2008) Determinación de los aspectos de gestión que llevan a la cadena hotelera a mejorar la calidad de su servicio. Revista de Circulación Internacional (14)
Schiffman L, Lazar L (2001) Comportamiento delconsumidor. Editorial Prentice Hall, México Serrano AM, López MC (2000) Dimensions and measurement of quality service in hotels. Actas
del I World Conference on Production and Operations Management. CD ROM ISBN 84-8009-103-7
Stanton WJ, Etzel MJ, Walker BJ (1996) Fundamentos de marketing, 10th edn. Méjico, McGraw-Hill
Sureshchandar GS, Rajendran C, Anantharaman RN (2002) The relationship between manage-ment’s perception of total quality service and customer perceptions of quality of service. Total Qual Manage 13(1):69
Swan JE, Bowers MR (1998) Services quality and satisfaction: the process of people doing things together. J Serv Market 12(1):59–72
Talón P, González L, Figueroa C (2007) La nueva realidad del sector hotelero español. In: Idoeta C (ed) Empresa global y mercados locales. XXI Congreso Anual AEDEM, Madrid
Tsaur SH, Lin YC (2004) Promoting quality of service in tourist hotels: the role of HRM practices and service behaviour. Tour Manage 25:471–481
Westbrook RA, Oliver RL (1991) The dimensionality of consumption emotion patterns and consumer satisfaction. J Consumer Res 18:84–91
Zeithaml VA (1988) Consumer perceptions of price, quality and value: a means-model and synthesis of evidence. J Market 52(3):2–22
Zeithaml VA, Parasuraman A, Berry LL (1990) Delivering quality service: balancing customer perceptions and expectations . New York: Simon and Schuster.
Zeithaml VA, Parasuraman A, Berry LL (1993) Calidad Total en la Gestión de Servicios. Díaz de Santos, Madrid
Zeithaml VA, Berry LL, Parasuraman A (1996) The behavioural consequences of quality of service. J Market 60:31–46
3 An Application of SERVQUAL Model in Termas of Chaves

43M. Peris-Ortiz and J. Álvarez-García (eds.), Action-Based Quality Management: Strategy and Tools for Continuous Improvement, DOI 10.1007/978-3-319-06453-6_4,© Springer International Publishing Switzerland 2014
Abstract This article shows, through different case studies, how the introduction of Management by Processes methodology not only has contributed to improve quality services and effi ciency at different type of organizations, but it has also rein-forced team spirit, achieving high levels of employee motivation. When a radical change is needed in a company, and a “process management culture” is named to substitute the “function culture”, the “Management by process” concept becomes an effective way of introducing behaviour changes. Innovation is generally defi ned as the development or use of new products, services, production, processes, organi-zational structures or administrative systems that are new to the adopting. And Management by Processes is a kind of innovation. It has been verifi ed that explain-ing and involving employees in the process from the beginning, by means of train-ing and communicating, from the fi rst steps, the methodology, skills and techniques that are involved in the “Management by Processes Approach”, encourages employ-ees to cooperate actively in the whole process.
Chapter 4 Management by Processes: An Effective Tool for Employee Motivation
Maria Moreno-Mas , Sofi a Estelles-Miguel , Jose Maria Merigo , and Encarnación González-Vázquez
M. Moreno-Mas • S. Estelles-Miguel (*) Departamento de Organización de Empresas (DOE) , Universitat Politècnica de València, Camino de Vera , València, València 46022 , Spain e-mail: [email protected]; [email protected]
J. M. Merigo Manchester Business School , University of Manchester, Booth Street West , Manchester, Manchester M156PB , UK e-mail: [email protected]
E. González-Vázquez Departamento de Comercialización e Investigación de Mercados , Universidad de Vigo, Facultad de Ciencias Económicas y Empresariales de Vigo , Campus de Lagoas-Marcosende , Vigo , Pontevedra 36200 , Spain e-mail: [email protected]
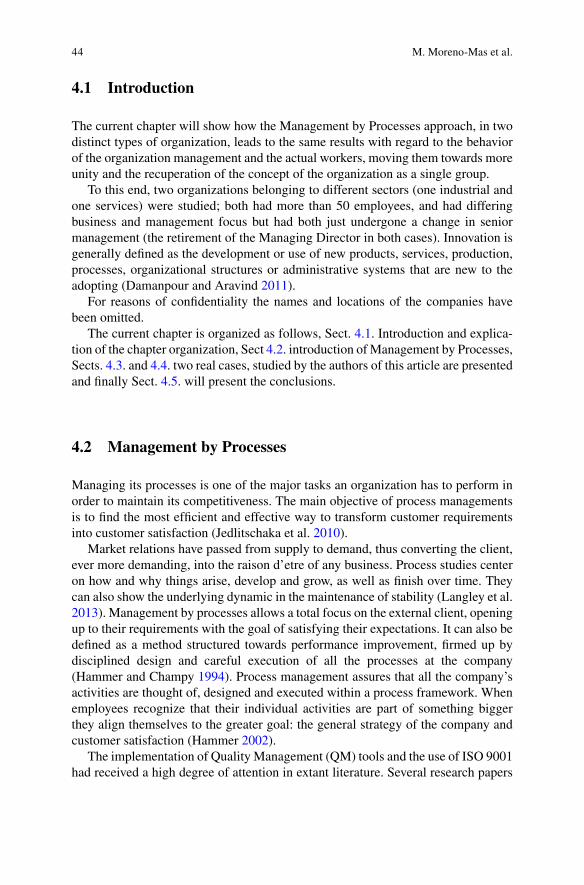
44
4.1 Introduction
The current chapter will show how the Management by Processes approach, in two distinct types of organization, leads to the same results with regard to the behavior of the organization management and the actual workers, moving them towards more unity and the recuperation of the concept of the organization as a single group.
To this end, two organizations belonging to different sectors (one industrial and one services) were studied; both had more than 50 employees, and had differing business and management focus but had both just undergone a change in senior management (the retirement of the Managing Director in both cases). Innovation is generally defi ned as the development or use of new products, services, production, processes, organizational structures or administrative systems that are new to the adopting (Damanpour and Aravind 2011 ).
For reasons of confi dentiality the names and locations of the companies have been omitted.
The current chapter is organized as follows, Sect. 4.1 . Introduction and explica-tion of the chapter organization, Sect 4.2 . introduction of Management by Processes, Sects. 4.3 . and 4.4 . two real cases, studied by the authors of this article are presented and fi nally Sect. 4.5 . will present the conclusions.
4.2 Management by Processes
Managing its processes is one of the major tasks an organization has to perform in order to maintain its competitiveness. The main objective of process managements is to fi nd the most effi cient and effective way to transform customer requirements into customer satisfaction (Jedlitschaka et al. 2010 ).
Market relations have passed from supply to demand, thus converting the client, ever more demanding, into the raison d’etre of any business. Process studies center on how and why things arise, develop and grow, as well as fi nish over time. They can also show the underlying dynamic in the maintenance of stability (Langley et al. 2013 ). Management by processes allows a total focus on the external client, opening up to their requirements with the goal of satisfying their expectations. It can also be defi ned as a method structured towards performance improvement, fi rmed up by disciplined design and careful execution of all the processes at the company (Hammer and Champy 1994 ). Process management assures that all the company’s activities are thought of, designed and executed within a process framework. When employees recognize that their individual activities are part of something bigger they align themselves to the greater goal: the general strategy of the company and customer satisfaction (Hammer 2002 ).
The implementation of Quality Management (QM) tools and the use of ISO 9001 had received a high degree of attention in extant literature. Several research papers
M. Moreno-Mas et al.

45
attribute superior fi rm performance to adoption of QM practices, and while there have been doubts about QM’s return on the investment, more recent research found that effective implementation of QM practices will contribute to better fi nancial, marketing, and even innovation performance by improving quality performance and/or operational performance (Nair 2006 ).
The organizations (the systems) are as effi cient as their processes (Prajago 2006 ). Departmental organizations, power niches and their excessive inertia against change need to be transformed, empowering the concept of the process, with a common focus and working with a vision of the customer objectives (Chang 1996 ).
Traditional management has been orientated towards objectives, profi t (the goal), forgetting the principal immediate motive, to keep customers happy and loyal. Each person concentrates their efforts on their assigned task, dealing with it according to the instructions and specifi cations received, but with limited information as regards the fi nal result of the work. It is still not uncommon in the manufacturing sector for a worker to not know, or at least not clearly, how they contribute to the fi nal product. In administrative and management jobs this is even more common.
The fragmentation of natural processes, product of the Taylorian division of work and posterior grouping of resultant specialized tasks in functional areas or departments, facilitated the formation of feudal powers by department, thus obligat-ing the management to frequently intervene in overall processes. This is due to the fact that many departments or areas with distinct responsibilities and objectives take part in a given process, which only the senior management can succeed in coordi-nating (Player and Lacaerda 2002 ).
It consists of reunifying the activities surrounding the processes that had previ-ously been fragmented as a consequence of a series of deliberate decisions as well as an informal evolution. This leads us to recognize that the processes come fi rst, and after the organization needed to make them operative. This is to see the process as the natural form of work organization. The structure can or not coincide with the process, given that in one workplace various different roles (not functions) can be undertaken for different processes.
In process management, attention is concentrated on the result of the processes and not on the tasks or activities. There is information about the fi nal result and everyone knows how their individual effort contributes to the global process; this translates into a responsibility for the overall process and not just for their personal task (Purvis et al. 2013 ).
The following stages can be seen in the two cases that will be commented upon in Sects. 4.3 . and 4.4 :
• Sensitization to process management workshop. • Evaluation of the current solution. • Everybody works on the ideal process. • Creation of improvement teams and action plans. • Monitoring of the above.
4 Management by Processes: An Effective Tool for Employee Motivation
46
4.3 Development of the Industrial Company Case
The fi rst organization is a family company, part of the tissue of the Valencian indus-trial sector, working in the metallurgy sector. Owing to the imminent retirement of the Managing Director and founder of the company, the new senior management team, composed of members of the family, decided to push forward with a process of reorganization and the introduction of Management by Process. This followed the confi rmation that in the prior 2 years the company had grown rapidly and many departments had specialized which meant that the majority of the middle manage-ment had lost a global vision of the organization, something which is very important in a family business.
The fi rm, which is a leader in its sector, produces steel parts which are distributed to wholesalers in Spain and other Mediterranean counties.
The fi rm is characterized by its close relationship with its customers (the major-ity being distributors, with not many clients being the end customer). They make made to measure products very quickly thanks to a strong design department, which marks them out from their closest competitors who only make standard dimension products.
The company has fi ve production centers with big spaces and warehousing for the products, something which allows them to offer their clients the possibility to produce the goods (in general very large) and keep them in the factory’s warehous-ing until they are needed, with storage times of less than a month.
The company does not distribute the products, it is the customer which organizes the collection of the goods from the company’s loading bays.
The profi le of the outgoing Managing Director, who managed the company and production for 20 years, is one of a charismatic strong willed man who formed a large company from a small metallurgy workshop. The Managing Director in all his years at the head of the fi rm never delegated the day to day supervision of the pro-duction, maintaining direct contact with the workers and management of each pro-duction center.
As the company grew, the work became more specialized and new factories, offi ces and warehousing were acquired. New products were added to the catalogue, with made to measure products standing out. Customers would make an enquiry, discuss the requirements with the technical department and the specifi cation and requirements would be agreed. In the early years, production was scaled back to a catalogue of standard products, with made to measure comprising only 10 % of turnover.
To win market share, the departing Managing Director, 2 years before his retire-ment, decided to increase the range of made to measure products (thus increasing the turnover on this sort of product to 40 % of the overall turnover), but this also increased the complexity of production. He also decided to mix standard products (generally available from stock) with made to measure products (with special lead times) in single client orders.
To this end the company, over only 2 years, acquired two new production centers which it set up, investing in new production machinery and new industrial processes
M. Moreno-Mas et al.

47
(painting and drying processes which prior to the acquisition had been subcon-tracted). This notably increased the variety of products that the company was able to offer its clients, as well as the complexity of managing this offer.
The organization immediately began to have problems regarding coordination between senior management from the different factories about ex works delivery dates. Until some months before undertaking the new investments each production center produced and delivered their products in an independent manner in such a way that the customers had to place separate orders which were delivered with dif-fering leadtimes. One of the major problems was that each fabric knew only a cer-tain part of the global picture which produced certain internal tensions.
The new Company Management, upon seeing the circumstances, decided to look to the implantation of a Process Management System which would allow them to organize the production and transmit a global vision of the business to the employ-ees, thus improving internal communications and empowering teamwork.
To this end they contracted a consultant who would undertake an initial 3 month period, basically to diagnose the situation. This initial work led to the creation of a Quality and Process Department, inexistent up to that point.
The starting point found by the consultant was one of a certain reticence from some senior and middle managers who did not understand the type of work that the consul-tant as going to do, and also of some general resistance to change. Another problem was between the senior managers of differing production centers. Three of them opposed any changes in management style, whilst the others considered it necessary to undergo a reorganization of production, which in itself led to problems between them.
The differences in management style of each of the production center managers, added to the fact that they had stopped having direct contact with the new Managing Director (he did not visit the factories on a daily basis to supervise production as the previous Managing Director had done), led to a certain lack of coordination in the production of orders which then led to delivery delays with the subsequent loss of face with the customers.
The work plan of the consultant was as follows:
• During the fi rst three working months, the consultant planned, together with the senior management, two work meetings with all the administrative department directors (commercial, fi nancial, HR, purchasing, design) and the fi ve managers of the production plants.
– This type of meeting had never been organized before, thus it was the fi rst time that many managers, new as well as those who had been in the company for many years, had met at a meeting. Some of them hardly knew each other.
• After an initial presentation, in which the fundamentals of Management by Processes (Pérez Fernández 2010 ) and (Salgueiro 1999 ) was explained to all those present, a plan of actions was approved. This consisted of three phases:
– Phase I: First meeting between the consultant and each one of the departments, and compilation of information regarding the tasks each department under-took. The objective was to familiarize the staff to the presence of the consultant.
4 Management by Processes: An Effective Tool for Employee Motivation

48
The consultant was aware at every level in the business, any confusions or questions needed to be cleared up. The consultant was in the company on a daily basis during this phase.
– Phase II: Formation of the Process Map of the company. Once initial reserva-tions about Management by Process had been overcome, the consultant pre-sented the Process Map to the management team who analyzed, revised and completed it. This phase lasted a month.
– Phase III: Formation of the Process Improvement Proposal. Using the Process Map as a starting point, improvements and modifi cations were put forward, starting from indicators and targets that had been proposed for each of the processes. This task took a month, and begun with those processes than con-tained critical point tasks and/or bottlenecks.
• After 3 months of work, there had been success in motivating the management and supervisors, who saw applicable solutions within their work processes, as well as having a global vision of the company and the products produced, which they had not had until that time. The incorporation of proposals put together from the point of view of the customer regarding products and leadtimes were espe-cially motivating, given that before this time the changes requested by the com-mercial team had not always been understood by production managers. Internal communication between the two areas improved substantially as well as the coordination between the different production centers.
• At the end of the work, a new Quality and Process Department was formed. It began with the implantation of a Quality Management System.
Similar processes can be found in Figuera 2007 .
4.4 Development of Case 2: Health Centre
The second case is one of a Health Centre belonging to the Valencian public health system. It has more than 50 people working there, including medical staff (doctors, University trained nurses and nursing auxiliaries) working under a recently announced Center Director, who had been named as the replacement of the previous holder of the position, also a doctor, who had recently retired.
This type of organization undergoes regular changes in management, under insti-tutional guidelines. The internal organization of personnel and resources, even if coordinated by the Center Director, does not depend upon him, at least in terms of rostering and HR. The general services such as maintenance, IT and provision of health and administrative materials are assigned by a Health Department Manager. With the materials provided Center and patient needs must be covered.
The provision of health services is a very complicated activity that requires excellent planning skills, especially in moments of crisis.
Unexpected staff shortages are not uncommon, especially in holiday periods (when absences can admittedly be predicted to an extent). These can combine with
M. Moreno-Mas et al.
49
unexpected increases in patient numbers (for example when there is a fl u epidemic, or an accident near the center).
The new Center Director, interested in the Management by Process methodol-ogy, decided to put forward the idea of a Process Work Group to the senior manag-ers of the different medical specialty areas to provide answers for the gaps detected that were causing a poor perception on the part of the patient in relation to the delays in the assignation of appointments, or in the waiting times within the center itself.
An increase in the number of patient complaints had been detected and the administrative staff asked for a change in the management of appointments.
Additionally, in recent months an IT program for patient management had been installed, with which the medical staff were not familiar (before this time, only paper records were kept). The idea, at least from the senior health management, was to move away from paper records and to move towards electronic retention of patient records which could be updated during the patient visit. Some doctors rejected the abandonment of the traditional method of taking notes on preset formu-lated sheets.
This is to say that the new Director found himself in a center undergoing a sub-stantial change in its work methods, especially in reference to the documentation generated during patient visits. All of this, without being able to take decisions regarding the timeframe of the implantation of the new IT system, nor with respect to the resources available for this change.
The Director made contact with an expert in Management by Process from out-side the health area and planned a series of meetings with the different senior man-agers in the different specializations as well as with representatives of the university trained nursing staff, administrative auxiliaries, nursing auxiliaries and porters.
The meetings took place every 2 weeks over a 3 month period. During these meetings, and following a Training and Work Group Plan, the consultant helped them answer a series of activities that had been previously put forward and com-municated to the participants.
The fi rst sessions were for training. On one hand the assistants were familiarized with the methodology and nomenclature of the Processes (Beltrán Sanz et al. 2012 ) and (Galloway 1998 ). One the other, the consultant familiarized himself with the activity of the center during the most complicated part of the day, that of the morn-ing when the majority of the patients attended the center.
Flow diagrams of some of the patient care processes were drawn, from different treatment areas selected by the Process Group.
The rapid identifi cation of points for improvement in the succession of repre-sented activities motivated the Group members. They went to the meetings with interesting consultations and work proposals.
The results and solutions set out during the meetings were immediately implanted by the Center Director which resulted in a visible improvement in the work environ-ment and staff relations. Although a positive response was not unanimous, it was suffi ciently widespread to allow smaller and more specifi c work groups in some medical specialties.
4 Management by Processes: An Effective Tool for Employee Motivation
50
The general impression was that despite the fact that the implementation of the new IT system would bring welcome modernization in the near future, the initial faults as much as the fact that the lack of specifi c IT knowledge amongst the major-ity of the Center’s staff meant they were unable to resolve problems caused by the constant system failures (the Center did not have an IT worker amongst its staff) meant a poor reaction to the new system. For this reason the medical staff rejected it and resisted the abandonment of paper records in consultations.
The health department’s senior management was informed about the Process Group’s advances and proposals, since minutes were taken at every meeting. The consultant completed the information in the notes with support documents used for the meetings.
Three months after the beginning of the work, an IT technician was sent to the center and undertook the monitoring “in situ”.
The news that some of the problems detected by the group were being solved inspired other health centers to take on the Management by Processes initiative.
The experience was presented to the senior health management. Some of the participants of the successive Process Groups published articles specifi c to Management by Process in Patient Service.
4.5 Conclusions
Independent of the sector in which it is working, its size, the type of organization or the management style, it has been shown that the introduction of the Management by Processes methodology is a very useful tool, as well as having a motivating effect on the personnel when introducing changes to the organization paradigm.
On many occasions the workers do not feel that they are part of the process, since they only know and see a small part of it (Taylorian vision). When they know the whole process and feel a part of it, they are motivated, something which has a posi-tive repercussion for the company.
Some authors have published specifi c pieces about the importance of the people in successful process management in organizations (González and Hervás 2009 ).
The principal conclusion of this article is that the Management by Process meth-odology is a powerful tool in terms of staff motivation. With this in mind, it is fun-damental to communicate well, and with all the staff, the type of work that is going to be undertaken, forming a process team in which everyone is represented. People must be informed about the advances that are occurring within the organization. An important part of this is the sensitization stage, and at times the training on Management by Process.
A correct and well-judged introduction to the Management by Process tool does not only give a global vision of the organization and the work undertaken in it, but also has a positive repercussion on the atmosphere in the work environment, con-tributing to the relaxation of tensions between departments or areas that are not closely interrelated in this business.
M. Moreno-Mas et al.

51
This is especially demonstrable in organizations that are very orientated towards the customer, who immediately perceives improvement in their relationship with the organization.
References
Beltrán Sanz J, Carmona Calvo MA, Carrasco Pérez R, Rivas Zapata MA, Tejedor Panchon F (2012) Guía para una gestión basada en procesos. Fundación Valenciana de la Calidad y Generalitat Valenciana
Chang R (1996) Mejora Continua de Procesos: Guía práctica para mejorar procesos y lograr resul-tados medibles. Ediciones Granica S.A
Damanpour F, Aravind D (2011) Managerial innovation in organizations: conceptions, processes and antecedents. Manag Organ Rev 8(2):423–454
Figuera Vineu P (2007) Optimización de Productos y Procesos Industriales. Ediciones Gestión 2000
Galloway D (1998) Mejora Continua de Procesos: Cómo rediseñar los Procesos con Diagramas de Flujos y Análisis de Tareas. GESTIÓN 2000
González C, Hervás M (2009) El Papel de las Personas en la Gestión por Procesos. Revista de la AEC. Julio-Septiembre Nº2 2009. pp 32–43
Hammer M (2002) Bajo el mismo paraguas. Revista Gestión Bogotá 5(4):38–48 Hammer M, Champy J (1994) Reingeniería. Editorial NORMA. Bogotá Jedlitschaka A, Salo O, Bomarius F (2010) Process management. J Software Mainten Evol: Res
Pract Mayo 22(5):325–328 Langley A, Smallman C, Tsoukas H, Van de Ven A (2013) Process studies of change in organiza-
tion and management: unveiling temporality, activity and fl ow. J Acad Manag 56(1):1–13 Nair A (2006) Meta-analysis of the relationship between quality management practices and fi rm
performance implications for quality management theory development. J Oper Manag 24(6):948–975
Pérez Fernández de Velasco JA (2010) Gestión por Procesos. ESIC Player S, Lacaerda T (2002) Gerencia Basada en Actividades. Andersen McGraw-Hill, Colombia Prajago DI (2006) The relationship between innovation and business performance a comparative
study between manufacturing and service fi rms. Knowledge Process Manag 13:218–225 Purvis L, Naim MM, Towill D (2013) Intermediation in agile global fashion supply chains. Int J
Eng Sci Technol 5(2):38–48 Salgueiro A (1999) Cómo mejorar los procesos y la productividad. AENOR
4 Management by Processes: An Effective Tool for Employee Motivation

53M. Peris-Ortiz and J. Álvarez-García (eds.), Action-Based Quality Management: Strategy and Tools for Continuous Improvement, DOI 10.1007/978-3-319-06453-6_5,© Springer International Publishing Switzerland 2014
Abstract The environmental behavior of companies is one the principal measures that the European Union has promoted in recent years. In this sense, Community Regulation for Eco-Management and Audit Scheme (EMAS) is the main tool to promote and improve environmental behavior, being a voluntary adherence. The objective of this chapter is to identify the main motivations, barriers of certifi ed companies. Additionally, the infl uence of these factors on the profi tability of their accession will be analyzed by using a structural equation model. To achieve the objectives proposed, we use a sample of 114 of the 255 companies certifi ed EMAS Autonomous Community of Galicia in 2012. The results obtained allow us to iden-tify important implications for managers, which will help them establish manage-ment strategies in the future and carry out an environmental planning.
5.1 Introduction
Companies receive many pressures in order to cope with the impact they are having on the environment, by adopting environmental policies, implementing new practices to reduce environmental impact (Shrivastava 1995 ) and conducting environmental audits and tests. Pressures exerted by different stakeholders (Berry and Rondinelli 1998 ), such as consumers who are increasingly aware of
Chapter 5 Eco-Management and Audit Scheme: Effects on the Profi tability of Their Adherence
Natalia López-Mosquera García , Marta Peris-Ortiz , and José Álvarez García
N. López-Mosquera García • J. Álvarez García (*) Departamento de Economía Financiera y Contabilidad , University of Extremadura Avda. Universidad , Cáceres , Extremadura 10071 , Spain e-mail: [email protected]; [email protected]
M. Peris-Ortiz Departamento de Organización de Empresas , Universitat Politècnica de València Camino de Vera s/n , Valencia 46022 , Spain e-mail: [email protected]
54
prioritizing the preservation of natural resources related to economic growth (Mainieri et al. 1997 ; Eurobarometer 58.0 2002 ), NGOs, governments that through increasingly severe environmental regulations exert great pressure on the produc-tion system and stockholders and investors who are increasingly reluctant to take environmental risks (Waddock et al. 2003 ).
Nowadays, companies are adopting Environmental Management Systems (EMS) and obtaining certifi cation in response to these pressures, which show the need for fi rms to start a process of adaptation to changing times; characterized in developed countries by high economic growth, which in turn leads to high consumption rates of natural resources; so it is necessary to ensure sustainability and the generation of large amounts of waste ( González-Benito and González-Benito 2005 ) whose removal should be managed by companies.
The EMS “is part of the general management system which includes the organi-zational structure, planning of activities, responsibilities, practices, procedures, pro-cesses and resources for developing, implementing, carrying out, reviewing and maintaining the organization’s environmental policy” (EMAS III 2009 ). The basis for the implementation of an EMS is the environmental analysis by the organization of its activities, identifying and quantifying the environmental aspects it can control and those which it can only exert an indirect infl uence on (Petrosillo et al. 2012 :264).
For the development and implementation of an EMS we can opt for two widely accepted standards, which in turn can be certifi ed ensuring the recognition by stake-holders; such as the ISO 14001 standard, created by the International Organization for Standardization (ISO) and Regulation 1221/2009, relating to voluntary partici-pation in the European Environmental Management and Audit System known as EMAS-Eco-Management and Audit Scheme (European Commission 2009 ).
The implementation of the EMAS III (Eco-Management and Audit Scheme) has two implications within the company, on the one hand, the emergence of new costs and on the other hand, some benefi ts associated with its implementation due to con-sumption reduction, improved image, compliance with legislation, enhanced envi-ronmental performance, etc. In summary, many authors claim that it helps to improve both its environmental performance (Potoski and Prakash 2005 ; Link and Naveh 2006 ) and fi nancial performance (Trung and Kumar 2005 ; Heras-Saizarbitoria et al. 2011 ). It also helps to improve its competitive advantage as a result of improv-ing the internal effi ciency of the organization (Kollman and Prakash 2002 ).
Studies aimed at studying the relationships between the motivations and benefi ts of certifi cation of an EMS are scarce, just like the relationship between the barriers and benefi ts. Therefore, we propose this study in order to fi ll this gap by analyzing the relationship between the motivations for implementing an EMS and the barriers encountered in the whole process with the perceived benefi ts associated with the implementation of the system.
The present paper is organized as follows: fi rst we briefl y describe the reference scheme EMAS III for the implementation of an EMS, then the theoretical frame-work used to conduct research and from the theoretical review, a theoretical model and hypotheses are established. In the following section the methodology used is described, while the third one includes the analysis of the results. The fi nal section gives the main conclusions and implications of the work.
N. López-Mosquera García et al.

55
5.1.1 What Is EMAS III?
The fi rst Community Eco-management and Eco-auditing Regulation (Regulation (EC) No. 1836/1993) called EMASI (Eco-Management and Audit Scheme) was published in 1993 and allowed companies of the industrial sector to voluntarily adhere to a Community system of environmental management and auditing. With time, it has proved to be an effective tool to promote continuous improvement of the environmental performance of companies and two reviews of the Regulation have been conducted with the aim of expanding the scope of the system to all types of organizations that wish to improve their environmental performance; EMAS II pub-lished in 2001 (Regulation (EC) No 761/2001) was open to any organization, unlike the fi rst regulation which was restricted to industrial sector organizations and EMAS III in 2009 (Regulation (EC) No 1221/2009) applicable to all types of organizations, both at Community and non-EU level.
In the Regulation (EC) Nº 1221/2009, Eco-Management and Audit Scheme (EMAS) is defi ned as “a system at the disposal of organizations that voluntarily wish on the one hand, to evaluate and improve their environmental performance and on the other hand, to disseminate any information regarding their environmental management to both the public or other stakeholders” and we are told that “the goal is to promote continuous improvement of environmental performance of organiza-tions, through the establishment of environmental management systems, evaluation of such systems, requirement of legal compliance, dissemination of information on environmental performance and dialogue with stakeholders, as well as, the active involvement of employees in the organization to improve environmental perfor-mance and ensuring their environmental training” (European Commission 2009 ).
The current EMAS III Regulation came into effect on January 11, 2011, with some important new points; the participation of organizations both at Community and non-EU level is authorized, it ensures compliance with the existing environmental legisla-tion to date promoting the work of the verifi er, measures to reduce administrative burdens and create incentives are established, procedures for accreditation and verifi ca-tion are defi ned and complemented in an attempt to harmonize the rules of the Member States through the simplifi cation of the registration process and the use of logos.
EMAS III is still based on the Environmental Management System foreseen in the ISO 14001, which is similar in its components and requirements (Ridolfi et al. 2008 ) and in this latest version the ISO 14001 standard (European Commission 2010a ) was adopted entirely. We should note that the objectives of both reference standards are different, “EMAS was designed to achieve changes in environmental performance, while ISO 14001 was designed to improve management by providing guidelines that can be implemented by any organization in any country” (Morrow and Rondinelli 2002 :162).
In this latest revision of the Regulation, certain differentiating elements are rein-forced like demonstrating that they comply with the effective legislation in the fi rst EMAS registration and there are stricter requirements for submission of environ-mental reports, in which nine basic indicators on energy effi ciency, material and resource consumption, waste, emissions and land use (European Commission 2010b ) must be collected, which measure the direct environmental aspects that must
5 Eco-Management and Audit Scheme…

56
be taken into account and are related to each activity carried out by the organization (European Commission 2009 ).
To adhere to EMAS III, any company should abide by the following norms: con-duct a previous environmental analysis of its activities, implement an Environmental Management System, perform environmental audits, prepare an Environmental Declaration, obtain verifi cation by an independent EMAS verifi er and register in a Competent Body of a Member State.
From 1997 to 2014, in Spain there has been a steady increase in the number of adhesions to the Regulation, reaching in January 2014, a total of 1,299 work centers and 1,095 organizations, strengthening its leadership position in environmental management in Europe, being the second country in the European Union with more organizations and EMAS certifi ed centers behind Italy, with 9 % in 2014 of total European workplaces with EMAS (European Commission 2014 ). At regional level, Galicia (21.97 %), Catalonia (20.9 %) and the Community of Madrid (19.54 %) make up for over 60 % of all workplaces with EMAS (OSE 2011 ).
5.2 Theorethical Framework
5.2.1 Motivations
The implementation of EMS has proved to provide many benefi ts which should be suffi cient to motivate the management of organizations to implement this system, since both the motivations and the benefi ts of implementing an EMS are the same, what differs is the context in which they operate. The former are prior to implementa-tion/certifi cation, while the benefi ts are generated once the system is implemented.
From the review of the literature, we observe that the main motivations for implementing an EMS like EMAS III are: the satisfaction of pressures from cus-tomers and to ensure that suppliers are operating in a responsible manner on envi-ronmental issues by requiring them (Woodside 2000 ) to meet current legal requirements, which are increasingly stricter and tougher (Harrington and Knight 1999 ; Woodside 2000 ; Morrow and Rondinelli 2002 ), money savings for companies due to effi ciency increase and improvement and reduction of costs: materials, energy, fi nes and penalties (Harrington and Knight 1999 ; Woodside 2000 ; Morrow and Rondinelli 2002 ), environmental performance enhancement (Umweltbendesamt 2000 ; Andrews et al. 2001 ; Morrow and Rondinelli 2002 ), improvement of the image that the company offers its customers (Umweltbendesamt 2000 ; Morrow and Rondinelli 2002 ; Schylander and Martinuzzi 2007 ) and becoming an advertising tool and favoring the possibility of receiving state aid and gaining a competitive advantage (Kirkpatrick and Pouliot 1996 ; Morrow and Rondinelli 2002 ).
Quazi et al. ( 2001 ), through a review of the literature on environmental manage-ment and quality have identifi ed eight possible factors driving organizations to adopt the ISO 1400 standard. Along the same lines, Bansal and Roth ( 2000 ) identifi ed three groups of motivations; (1) ethical motivations, which arise from the company’s
N. López-Mosquera García et al.

57
concern for its social obligations and values, that is, a response to the sense of eco-logical responsibility of the company, (2) competitiveness reasons that arise from the search for competitive advantages, which respond to the objective of improving prof-itability, and (3) relational motivations where the company implements environmen-tal practices in an attempt to adapt its performance to the standards and seeks to establish cordial relations through its environmental practices with its stakeholders.
For Neumayer and Perkins ( 2005 ) there are two major groups of reasons, which are internal reasons related to effi ciency (performance enhancement, productivity and profi tability) and external or institutional reasons, related with stakeholders’ social pressure. In Heras-Saizarbitoria et al. ( 2011 :195), a summary of the empirical literature on the motivations to adopt ISO 14001 can be seen.
5.2.2 Benefi ts
There are many benefi ts, both tangible and intangible or economic and organiza-tional that can be attributed to the implementation of EMS. In Zutshi and Sohal ( 2004 ), in appendix A, a detailed review of the literature on the benefi ts of EMS can be seen, together with the review made by Claver et al. ( 2005 ) on benefi ts that drive organizations to start the implementation of environmental systems.
These authors summarize them in: cost reduction and savings derived from waste minimization, recycling and saving in the use of energy, water, gas and raw materials; improvement in the exploitation processes as a consequence of both savings from the use of raw materials and increased security. The following can also be generated: an increase in employee motivation, improved communication throughout the organiza-tion resulting from the use of the same terminology related to EMS, improved corpo-rate image leading to better relationships with stakeholders, increase in insurances of fi nancial institutions, improvement of long-term relationships with suppliers and reduction of fi nes for compliance with the current legislation (Zutshi and Sohal 2004 :339). In Heras-Saizarbitoria et al. ( 2011 :198), a survey of the empirical litera-ture on the benefi ts of implementing and certifying ISO 14001, can be viewed.
5.2.3 Motivations-Profi tability
The implementation of an EMS can be seen as the fi rst solid step to achieve better output (performance/fi nance), because a framework is established in which the differ-ent environmental initiatives can be developed in a coordinated or controlled way (Bansal and Bogner 2002 ). In the last few years, there have been empirical studies that support a positive relationship between the implementation of an EMS and economic development and operational performance of the company (Christmann 2000 ; Morrow and Rondinelli 2002 ; Álvarez Gil et al. 2001 ; Gerald et al. 2004 ; among oth-ers), stating in numerous studies that the stronger the motivations, either internal or external, the greater the degree of perceived benefi ts by organizations (Hillary 2000 ;
5 Eco-Management and Audit Scheme…

58
Darnall et al. 2001 ; Kitazawa and Sarkis 2000 ; Molina-Azorín et al. 2009 ; Heras-Saizarbitoria et al. 2011 ). For these reasons we propose the following hypothesis:
H1. Companies with strong motivations to implement EMAS have profi ted more from its implementation.
5.2.4 Barriers-Profi tability
Like any other quality management system, EMAS III is not exempt of barriers or internal resistance, which the organization will have to face, during and after the implementation process. The main drawbacks mentioned by critics of ISO 14001 mainly derive from the lack of understanding of the standard and the wide scope and ambiguity of the standard. In Zutshi and Sohal ( 2004 ), in appendix B, a detailed review of the literature on the barriers that organizations can encounter in the pro-cess of implementation of the EMS, can be viewed.
Zutshi and Sohal ( 2004 :339) make a summary of them: costs required for their implementation and certifi cation (training, audit fees, audits), in addition to mainte-nance costs; a lack of available resources and external collaboration (technical or economic), obtained either from subsidies or aid for SMEs, unclear guidelines for implementation in companies with non-regular workers, like in the construction sector; a lack of established guidelines for the establishment of goals and objectives and degree of employee involvement, suppliers and other stakeholders; a lack of guidelines on how to bring continuous improvement; interpretation of standard terms. However, the costs incurred in implementing the EMAS certifi cation are recovered once the Environmental Management System is activated.
Iraldo et al. ( 2009 :9) classify the external barriers (economic, low consumer awareness and interest, lack of recognition and incentives by public institutions) and internal barriers, broad and heterogeneous category which goes from lack of resources to the diffi culty of understanding and perception of the EMAS.
Zutshi and Sohal ( 2004 :216) state that it would be “benefi cial for organizations to try to reduce and if possible remove as many obstacles as possible before starting the implementation process”. There is no doubt that the barriers that companies have to face when implementing their system will affect the perception of managers on the profi tability of its implementation, which leads us to consider the following hypothesis:
H2. Companies that have found more barriers when implementing EMAS have profi ted less from its implementation.
To summarize, in Fig. 5.1 a sequence diagram or “path diagram” is shown with all the fi rst-order latent variables, including the hypotheses to be contrasted, which make up the theoretical model to be tested in this research.
N. López-Mosquera García et al.

59
5.3 Metodology
5.3.1 Sample and Survey Process
The sample used is constituted by companies certifi ed EMAS III in Galicia (Spain). The source used to select the companies studied was the website of the Ministry of Agriculture, Food and Environment (MAGRAMA, http://www.magrama.gob.es/es ). Through this site, only certifi ed companies in EMAS III were selected, which led to the elimination of several companies from the fi nal database. Thus, the initial number was reduced from 286 to 255 companies. Out of the 255 companies sur-veyed, only 140 agreed to cooperate in this investigation.
Prior to the survey, a pilot study was carried out on a sample of 20 subjects to ensure the validity and user-friendliness of the questionnaire. The pilot study was developed and administered in a series of meetings and interviews with experts and focus groups that helped us make minor adjustments. Once the pilot study was car-ried out, we proceeded to carry out the survey process aimed at the managing direc-tors or quality managers of Galician companies certifi ed EMAS III. Data were collected between April and May 2012 via three different means: mail, telephone and personal interviews, obtaining a total of 140 surveys. On average, respondents took 10–15 min to complete the questionnaire with the interviewers’ assistance. The fi nal total of usable questionnaires was 114 with 26 refusals. Thus, the acceptance rate was 81.4 %. On the basis of the fi nal sample, it can be seen that the sample obtained was made up of 47 % of the province of A Coruña (47 % population), 36 % Pontevedra (36 % population), 9 % Lugo and 6 % Ourense. If we consider the company sectors in the sample, 69 belong to the service sector, 38 to the secondary sector and 7 to the primary sector.
Fig. 5.1 Study model. Impact of motivations and barriers on profi tability
5 Eco-Management and Audit Scheme…
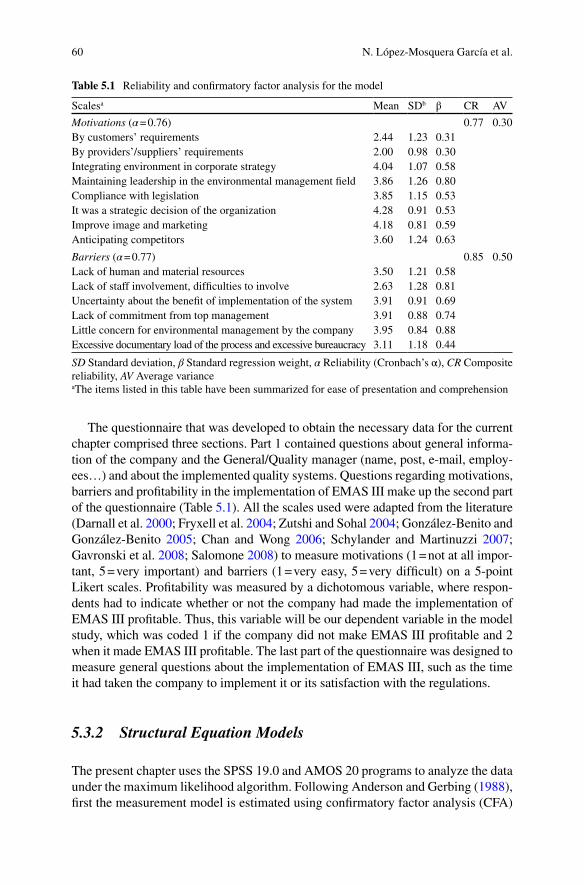
60
The questionnaire that was developed to obtain the necessary data for the current chapter comprised three sections. Part 1 contained questions about general informa-tion of the company and the General/Quality manager (name, post, e-mail, employ-ees…) and about the implemented quality systems. Questions regarding motivations, barriers and profi tability in the implementation of EMAS III make up the second part of the questionnaire (Table 5.1 ). All the scales used were adapted from the literature (Darnall et al. 2000 ; Fryxell et al. 2004 ; Zutshi and Sohal 2004 ; González- Benito and González-Benito 2005 ; Chan and Wong 2006 ; Schylander and Martinuzzi 2007 ; Gavronski et al. 2008 ; Salomone 2008 ) to measure motivations (1 = not at all impor-tant, 5 = very important) and barriers (1 = very easy, 5 = very diffi cult) on a 5-point Likert scales. Profi tability was measured by a dichotomous variable, where respon-dents had to indicate whether or not the company had made the implementation of EMAS III profi table. Thus, this variable will be our dependent variable in the model study, which was coded 1 if the company did not make EMAS III profi table and 2 when it made EMAS III profi table. The last part of the questionnaire was designed to measure general questions about the implementation of EMAS III, such as the time it had taken the company to implement it or its satisfaction with the regulations.
5.3.2 Structural Equation Models
The present chapter uses the SPSS 19.0 and AMOS 20 programs to analyze the data under the maximum likelihood algorithm. Following Anderson and Gerbing ( 1988 ), fi rst the measurement model is estimated using confi rmatory factor analysis (CFA)
Table 5.1 Reliability and confi rmatory factor analysis for the model
Scales a Mean SD b β CR AV
Motivations ( α = 0.76) 0.77 0.30 By customers’ requirements 2.44 1.23 0.31 By providers’/suppliers’ requirements 2.00 0.98 0.30 Integrating environment in corporate strategy 4.04 1.07 0.58 Maintaining leadership in the environmental management fi eld 3.86 1.26 0.80 Compliance with legislation 3.85 1.15 0.53 It was a strategic decision of the organization 4.28 0.91 0.53 Improve image and marketing 4.18 0.81 0.59 Anticipating competitors 3.60 1.24 0.63
Barriers ( α = 0.77) 0.85 0.50 Lack of human and material resources 3.50 1.21 0.58 Lack of staff involvement, diffi culties to involve 2.63 1.28 0.81 Uncertainty about the benefi t of implementation of the system 3.91 0.91 0.69 Lack of commitment from top management 3.91 0.88 0.74 Little concern for environmental management by the company 3.95 0.84 0.88 Excessive documentary load of the process and excessive bureaucracy 3.11 1.18 0.44
SD Standard deviation, β Standard regression weight, α Reliability (Cronbach’s α), CR Composite reliability, AV Average variance a The items listed in this table have been summarized for ease of presentation and comprehension
N. López-Mosquera García et al.
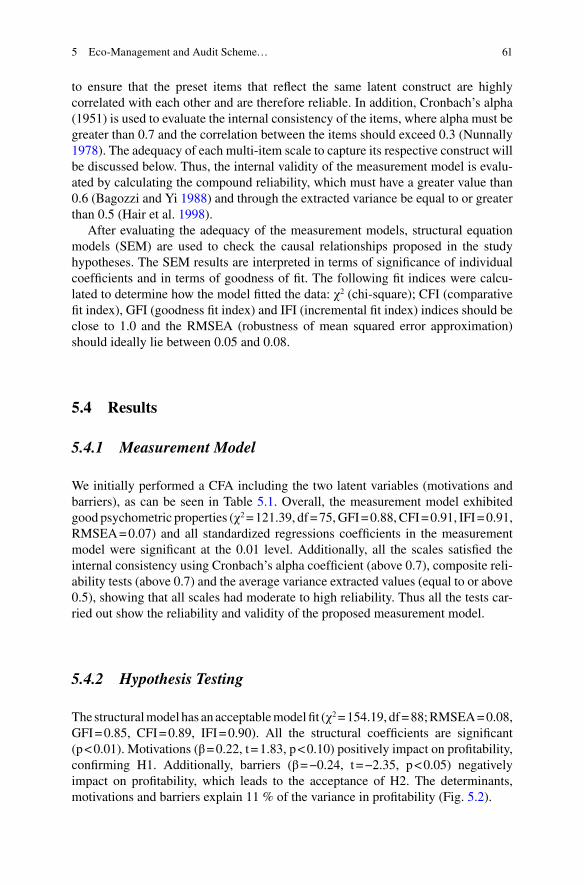
61
to ensure that the preset items that refl ect the same latent construct are highly correlated with each other and are therefore reliable. In addition, Cronbach’s alpha (1951) is used to evaluate the internal consistency of the items, where alpha must be greater than 0.7 and the correlation between the items should exceed 0.3 (Nunnally 1978 ). The adequacy of each multi-item scale to capture its respective construct will be discussed below. Thus, the internal validity of the measurement model is evalu-ated by calculating the compound reliability, which must have a greater value than 0.6 ( Bagozzi and Yi 1988 ) and through the extracted variance be equal to or greater than 0.5 (Hair et al. 1998 ).
After evaluating the adequacy of the measurement models, structural equation models (SEM) are used to check the causal relationships proposed in the study hypotheses. The SEM results are interpreted in terms of signifi cance of individual coeffi cients and in terms of goodness of fi t. The following fi t indices were calcu-lated to determine how the model fi tted the data: χ 2 (chi-square); CFI (comparative fi t index), GFI (goodness fi t index) and IFI (incremental fi t index) indices should be close to 1.0 and the RMSEA (robustness of mean squared error approximation) should ideally lie between 0.05 and 0.08.
5.4 Results
5.4.1 Measurement Model
We initially performed a CFA including the two latent variables (motivations and barriers), as can be seen in Table 5.1 . Overall, the measurement model exhibited good psychometric properties (χ 2 = 121.39, df = 75, GFI = 0.88, CFI = 0.91, IFI = 0.91, RMSEA = 0.07) and all standardized regressions coeffi cients in the measurement model were signifi cant at the 0.01 level. Additionally, all the scales satisfi ed the internal consistency using Cronbach’s alpha coeffi cient (above 0.7), composite reli-ability tests (above 0.7) and the average variance extracted values (equal to or above 0.5), showing that all scales had moderate to high reliability. Thus all the tests car-ried out show the reliability and validity of the proposed measurement model.
5.4.2 Hypothesis Testing
The structural model has an acceptable model fi t (χ 2 = 154.19, df = 88; RMSEA = 0.08, GFI = 0.85, CFI = 0.89, IFI = 0.90). All the structural coeffi cients are signifi cant (p < 0.01). Motivations (β = 0.22, t = 1.83, p < 0.10) positively impact on profi tability, confi rming H1. Additionally, barriers (β = −0.24, t = −2.35, p < 0.05) negatively impact on profi tability, which leads to the acceptance of H2. The determinants, motivations and barriers explain 11 % of the variance in profi tability (Fig. 5.2 ).
5 Eco-Management and Audit Scheme…

62
5.5 Conclusions and Implications
Model results confi rm the two hypotheses raised. It was found that there is a positive relationship between the motivations when implementing an EMS and the percep-tion of managing directors or quality managers about whether they have made their implementation profi table and the relationship is negative in the case of barriers, i.e. the higher the level of barriers encountered, the lower their perception of profi tabil-ity of implementation.
This study not only has important implications for the academic fi eld, but also for organizations and public administrations. For organizations that wish to imple-ment Environmental Quality Management seeing that it provides on the one hand, evidence that organizations should keep in mind, that is, knowing and understand-ing the barriers which they are going to face, before implementing the system, so that they are positioned in a better position to anticipate and resolve problems that may arise and thus increase their chances of success by decreasing the barriers. On the other hand, evidence shows that companies that have implemented the system have made it profi table and it has satisfi ed their expectations, being a major refer-ence point for companies that still have doubts about the benefi ts that EMS would have for their organization.
In the public administration fi eld, the investigation provides evidence that an important motivational job should be done among organizations in order to promote and encourage the implementation of EMS, with emphasis on obtaining signifi cant competitive advantages, compliance with current legislation, improved image and enhanced environmental performance which will have an important impact on per-ceived fi nancial and operational benefi ts. On the other hand, the removal of barriers should be promoted.
Finally, Zutshi and Sohal ( 2004 :349) “Top management´s commitment, leader-ship, vision and motivation are required to successfully implement and maintain any system, including the EMS”.
Fig. 5.2 Structural model of profi tability based on motivations and barriers. β: Standard regres-sion weight. All the coeffi cients are signifi cant
N. López-Mosquera García et al.

63
The fi rst limitation of this research is derived from conducting the study and the specifi c characteristics of the geographical area where the study was conducted “Autonomous Community of Galicia – Spain”. The generalization of its conclu-sions must be analyzed with caution and always from a previous analysis of the characteristics of the population to be studied. A second limitation is related to the cross section thereof, as this paper has analyzed the relationship at a specifi c moment in time, so to overcome this limitation, it would be necessary to carry out longitudi-nal studies over time, so as to assess and observe environmental motivations at dif-ferent points in time.
The last limitation is derived from the methodology used to obtain the data. In this regard, Heras-Saizarbitoria et al. ( 2011 :208) claim that “even though it is fairly conventional and similar to approaches that have generally been accepted, it does have limitations”. The information comes from the perception of managing direc-tors or quality managers who have participated in the implementation process so it is likely to be biased ( Yin and Schmeidler 2009 ). This limitation can be resolved by involving all the human resources of the organization (middle managers, staff) in the collection of data.
References
Álvarez Gil MJ, Burgos Jiménez J, Céspedes Lorente JJ (2001) An analysis of environmental management organizational context and performance of Spanish hotels. Omega 29:457–471
Anderson JC, Gerbing DW (1988) Structural equation modeling in practice: a review and recom-mended two-step approach. Psychol Bull 103:411–423, Copyright 1988 by the American Psychological Association
Andrews RNL, Darnall N, Gallagher DR, Keiner ST, Feldman E, Mitchell ML, Amaral D, Jacoby J (2001) Environmental management systems: history, theory and implementation research. In: Coglianese C, Nash J (eds) Regulating from the inside: can environmental management systems achieve policy goals? Resources for the Future Press, Washington, DC, pp 31–60
Bagozzi RP, Yi Y (1988) On the evaluation of structural equation models. J Acad Market Sci 16(1):74–94
Bansal P, Bogner W (2002) Deciding on ISO 14001: economics, institutions, and context. Long Range Plann 35(3):269–290
Bansal P, Roth K (2000) Why companies go green: a model of ecological responsiveness. Acad Manage J 43(4):717–736
Berry MA, Rondinelli DA (1998) Proactive corporate environmental management: a new indus-trial revolution. Acad Manage Exec 12(2):38–50
Chan ES, Wong SC (2006) Motivations for ISO 14001 in the hotel industry. Tour Manage 27(3):481–492
Christmann P (2000) Effects of “best practices” of environmental management on cost advantage: the role of complementary assets. Acad Manage J 43(4):663–680
Claver-Cortés E, Molina-Azorín JF, Tarí JJ, López-Gamero MD (2005) Environmental manage-ment, quality management and fi rm performance: a review of empirical studies. In: Sharma S, Aragón-Correa JA (eds) Corporate environmental strategy and competitive advantage. Edward Elgar, Cheltenham, pp 157–182
5 Eco-Management and Audit Scheme…

64
Darnall N, Gallagher DR, Andrews R, Amaral D (2000) Environmental management systems: opportunities for improved environmental and business strategy. Environ Qual Manage 9(3):1–9
Darnall N, Gallagher DR, Andrews RNL (2001) ISO 14001: greening management systems. In: Sarkis J (ed) Greener manufacturing and operations. Greenleaf, Sheffi eld, pp 179–190
EMAS III (2009) Regulation (EC) No 1221/2009. Voluntary participation by organisations in a community eco-management and audit scheme (EMAS)
Eurobarometer 58.0 (2002) The attitudes of Europeans towards the environment, The European Opinion Research Group, Directorate-General Environment, European Commision
European Commission (2009) Regulation (EC) N. 1221/2009 of the European Parliament and of the Council of 25 November 2009 on the voluntary participation by organisations in a com-munity eco-management and audit scheme (EMAS), repealing regulation (EC) N. 761/2001 and Commission Decisions 2001/681/EC and 2006/193/EC. http://eur-lex.europa.eu/LexUriServ/LexUriServ.do?uri=OJ:L:2009:342:0001:0045:EN:PD.F
European Commission (2010a) What are the differences between ISO 14001 and EMAS. http://ec.europa.eu/environment/emas/tools/faqen.htm#Toc259178108
European Commission (2010b) What are environmental core indicators. http://ec.europa.eu/envi-ronment/emas/tools/faqen.htm#Toc259178093
European Commission (2014) Reports and statistics. Disponible en http://ec.europa.eu . [fecha consulta 01/01/2014]
Fryxell GE, Lo CWH, Chung SS (2004) Infl uence of motivations for seeking ISO 14001 certifi ca-tion on perceptions of EMS effectiveness in China. Environ Manage 33(2):239–251
Gavronski I, Ferrer G, Paiva EL (2008) ISO 14001 certifi cation in Brazil: motivations and benefi ts. J Clean Prod 16(1):87–94
Gerald EF, Chung SS, Carlos WH (2004) Does the selection of ISO 14001 registrars matter? Registrar reputation and environmental policy statements in China. J Environ Manage 71:45–57
González-Benito J, González-Benito O (2005) An analysis of the relationship between environ-mental motivations and ISO14001 certifi cation. Brit J Manage 16(2):133–148
Hair JF, Anderson RE, Tatham RL, Black WC (1998) Multivariate data analysis, 5th edn. Prentice Hall, Upper Saddle River, NJ
Harrington HJ, Knight A (1999) ISO 14000 implementation—upgrading your EMS effectively. McGraw-Hill, New York
Heras-Saizarbitoria I, Arana G, Molina-Azorín JF (2011) Do drivers matter for the benefi ts of ISO 14001? Int J Oper Manag 31(2):192–215
Hillary R (2000) EMS: environmental protection the voluntary way. Health Safety Pract 18(4):52–54
Iraldo F, Testa F, Frey M (2009) Is an environmental management system able to infl uence envi-ronmental and competitive performance? The case of the eco-management and audit scheme (EMAS) in the European Union. J Clean Prod 17(16):1444–1452
Kirkpatrick D, Pouliot C (1996) Environmental management, ISO 14000 offers multiple rewards. Pollut Eng 28(6):62–65
Kitazawa S, Sarkis J (2000) The relationship between ISO 14001 and continuous source reduction programs. Int J Oper Prod Manage 20(2):225–248
Kollman K, Prakash A (2002) EMS-based environmental regimes as club goods: examining varia-tions in fi rmlevel adoption of ISO 14001 and EMAS in UK, US, and Germany. Policy Sci 35(1):43–67
Link S, Naveh E (2006) Standardization and discretion: does the environmental standard ISO 14001 lead to performance benefi ts? IEEE Trans Eng Manage 53:508–519
Mainieri T, Barnett EG, Valdero TR, Unipan JB, Oskamp S (1997) Green buying: the infl uence of environmental concern on consumer behavior. J Soc Psychol 137(2):189–204
Molina-Azorín JF, Claver-Cortés E, Pereira-Moliner J, Tarí JJ (2009) Environmental practices and fi rm performance: an empirical analysis in the Spanish hotel industry. J Clean Prod 17(5):516–524
N. López-Mosquera García et al.

65
Morrow D, Rondinelli D (2002) Adopting corporate environmental management systems: motivations and results of ISO 14001 and EMAS certifi cation. Eur Manage J 20(2):159–171
Neumayer E, Perkins R (2005) Uneven geographies of organizational practice: explaining the cross-national transfer and adoption of ISO 9000. Econ Geogr 81(3):237–259
Nunnally JC (1978) Psychometric theory. McGraw-Hill, New York OSE (2011) Informe de Sostenibilidad en España. Observatorio para la Sostenibilidad en España.
Disponible en http://www.sostenibilidades.org/sites/default/fi les/Informes/anuales/2011/ sostenibilidadenespana2011.pdf
Petrosillo I, De Marco A, Botta S, Comoglio C (2012) EMAS in local authorities: suitable indicators in adopting environmental management systems. Ecol Indic 13(1):263–274
Potoski M, Prakash A (2005) Covenants with weak swords: ISO 14001 and facilities’ environmental performance. J Policy Anal Manage 24(4):745–769
Quazi HA, Khoo YK, Tan CM, Wong PS (2001) Motivation for ISO 14000 certifi cation: development of a predictive model. Int J Manage Sci 29(6):525–542
Ridolfi R, Andreis D, Panzieri M, Ceccherini F (2008) The application of environmental certifi cation to the Province of Siena. J Environ Manage 86:390–395
Salomone R (2008) Integrated management systems: experiences in Italian organizations. J Clean Prod 16(16):1786–1806
Schylander E, Martinuzzi A (2007) ISO 14001–experiences, effects and future challenges: a national study in Austria. Bus Strat Environ 16(2):133–147
Shrivastava P (1995) The role of corporations in achieving ecological sustainability. Acad Manage Rev 20(4):936–960
Trung DN, Kumar S (2005) Resource use and waste management in Vietnam hotel industry. J Clean Prod 13(2):109–116
Umweltbendesamt (2000) EMAS in Germany, systematic environmental management: report on experience 1995 to 1998. Federal Environmental Agency, Berlin
Waddock SA, Bodwell C, Graves SR (2003) Responsibility: the new business imperative. Acad Manage Exec 16(2):132–148
Woodside G (2000) ISO 14001 auditing manual. McGraw-Hill, New York Yin H, Schmeidler PJ (2009) Why do standardized ISO 14001 environmental management systems
lead to heterogeneous environmental outcomes? Bus Strat Environ 18(7):469–486 Zutshi A, Sohal A (2004) Environmental management system adoption by Austalasian
organisations: part 1: reasons, benefi ts and impediments. Technovation 24:335–357
5 Eco-Management and Audit Scheme…

67M. Peris-Ortiz and J. Álvarez-García (eds.), Action-Based Quality Management: Strategy and Tools for Continuous Improvement, DOI 10.1007/978-3-319-06453-6_6,© Springer International Publishing Switzerland 2014
Abstract The literature focusing on quality costs has placed great importance on issues related to identifying, measuring and reporting quality cost information. Less attention has been paid to how this information is used in the management process and how it can enhance internal capabilities and thereby improve company perfor-mance. In addition to addressing this question, we analyse how the extensive use of quality costs can boost organisational learning and innovation in organisations’ internal processes, thus leading to an overall improvement in the quality manage-ment system that is refl ected in fi nancial and non-fi nancial performance. The con-ceptual model developed involves these relationships and has been tested using the structural equation modelling technique. To this end, a questionnaire survey was conducted in Portuguese companies with the ISO 9000 certifi cation. The results shed light on the causal links between the variables, and thus validate the conceptual model indicating that the use of quality cost information has a positive effect on both the development of quality management systems and performance.
6.1 Introduction
The literature focusing on quality costs (QC) has placed great importance on issues related to identifying, measuring and reporting quality cost information (QCI). Less attention has been paid to how this information is used in the management process
Chapter 6 An Integrated View of the Use of Quality Cost Information, the Improvement of the Quality Management System and Effects on Performance: A Study in Portuguese Companies
Jorge Novas and Margarida Saraiva
J. Novas (*) Management Department and CEFAGE-UE , University of Évora Largo dos Colegiais , 2, 7000-803 Évora , Portugal e-mail: [email protected]
M. Saraiva Management Department and BRU-UNIDE/ISCTE-IUL , University of Évora , Largo dos Colegiais , 2, 7000-803 Évora , Portugal e-mail: [email protected]

68
and how it can enhance internal capabilities and thereby improve company perfor-mance. In addition to addressing this question, we analyse how the extensive use of QC can boost organisational learning and innovation in organisations’ internal pro-cesses, thus leading to an overall improvement in the quality management system (QMS) that is refl ected in fi nancial and non-fi nancial performance. The conceptual model developed involves these relationships and has been tested using the structural equation modelling technique. To this end, a questionnaire survey was conducted in Portuguese companies with the ISO 9000 certifi cation. The results shed light on the causal links between the variables, and thus validate the conceptual model indicating that the use of QCI has a positive effect on both the development of QMS and per-formance. The chapter is structured as follows: the next section begins with a discus-sion of the relationship between the use of QCI, the development of QMS and the impacts on performance, and then introduces the conceptual model; Sect. 6.3 describes the variables and develops research hypotheses; Sect. 6.4 presents the methodological issues; Sect. 6.5 sets out the main results of the statistical analysis; fi nally, Sect. 6.6 discusses the results and presents the conclusions of the study.
6.2 QC and the Development of a QMS
The importance of QCI to continuous improvement processes is widely acknowl-edged in the literature. Signifi cant benefi ts may be obtained from quality costing, because the resulting information converts quality into a measurable concept and thus makes its impact on the organisation more understandable ( Crosby 1979 ). As a result, the literature has become greatly focused on QC, notably on their identifi ca-tion, measurement and reporting. However, as Sansalvador and Brotons ( 2013 ) state, despite the importance of implementing a system that provides information about the distinct components of QC, the full benefi t can only be derived if the information obtained is analysed in detail. Moreover, the way this information is applied in the management process may determine the momentum and expected results of that pro-cess. The mere existence of information on QC does not necessarily mean that com-panies are applying it in their management processes, and routines must therefore be created to use the information. Sower et al. ( 2007 ) noted that quality costing pro-grams alone do not lead to improved quality. Regardless of the adequacy of the qual-ity costing system implemented, its effectiveness will be intrinsically associated to and dependent upon the way in which the QMS uses the resulting information to improve quality. The extensive and systematic use of QCI is a prerequisite for the development of the QMS. Quality cost should not be seen as solving a problem with a unique defi nition; there is a whole range of reasonable notions of quality improve-ments, and that these notions can be seen as actionable guidelines (Jajua et al. 2009 ). The extensive use of QCI is thus likely to increase both the level of knowledge and awareness of quality, and foster an organisational understanding of quality issues (organisational learning) and innovativeness. Quality improvement initiatives should result in higher levels of (fi nancial and non- fi nancial) performance. We therefore propose the conceptual model depicted in Fig. 6.1 .
J. Novas and M. Saraiva

69
6.3 Variables and Hypotheses
6.3.1 Use of QCI
For the purposes of this work, a quality costing system is broadly defi ned as a sys-tem conveying useful information to the QMS. The literature has largely ignored the ways in which information provided by the quality costing system is used. However, analysing profi les of the use of information not only allows us to evaluate how the management process relies on that information, but also the effects of this use. This work adopts a structure proposed by Simons that distinguishes between diagnostic and interactive control systems. This structure has been widely used to analyse the profi le of use of management accounting and control systems, and the information systems they provide (cf. e.g. Abernethy and Brownell 1999 ; Hartmann and Vaassen 2003 ; Lukka and Granlund 2003 ; Roberts 2003 ; Henri 2006 ; Naranjo-Gil and Hartmann 2006 ; Kominis and Dudau 2012 ).
The diagnostic and interactive notions of control proposed by Simons are part of a broader conceptual framework that the author explained extensively in Levers of Control (Simons 1995 ). Diagnostic systems are formal systems that managers use to monitor results and correct deviations from pre-established performance standards (Simons 1995 ). They are associated to the traditional notion of management control because they are described in terms of the ability to measure the outputs of processes and by the existence of standards through which achievements may be compared, so that decisions can be taken to correct deviations verifi ed. Diagnostic systems permit the close control of the critical variables of organisational performance without the constant intervention of managers; attention is focused on negotiation and goal set-ting, on periodic reports that inform about ongoing actions, and on sporadic inter-ventions when a critical variable is out of control (Simons 1995 ). They are systems that limit the search for innovative solutions and the identifi cation of opportunities because they focus on the critical variables of performance. In contrast, interactive systems stimulate the interactive exploration of innovative solutions and learning, allowing new strategies to grow as participants interact, debate and dialogue in response to perceived opportunities and threats. However, research dedicated spe-cifi cally to the use of diagnostic information has led to new perspectives. Specifi cally, it is maintained that the use of this type of information may not constitute an end in itself, but is a necessary means to start and support interactive use of information that favours strategic dialogue and communication among the parties, i.e. diagnostic use constitutes a pre-requisite for interactive use (Haas and Kleingeld 1999 ).
Improvement of QMS
Use of QCI Performance
Fig. 6.1 Conceptual model
6 An Integrated View of the Use of Quality Cost Information, the Improvement…

70
6.3.2 Organisational Learning
Organisational learning is the process by which new knowledge and ideas are devel-oped by organisations (Slater and Narver 1995 ); it enables companies to acquire, interpret, disseminate and store information and the results of the organisational expe-rience with a view to making continuous improvements (Gilley and Maycunich 2000 ; Tippins and Sohi 2003 ; Chenhall 2005 ). Organisational learning is a personal skill that can generate changes in employees’ behaviour; it focuses on routines, processes, practices and organisational standards through the sharing of information and institu-tionalisation of knowledge between individuals, and it therefore plays a specifi c role in the development of other skills at the strategic level (Zoolo and Winter 2002 ).
6.3.3 Innovativeness
Innovativeness is the capacity to innovate. Innovation is the process of recombin-ing or generating new ideas for the development and improvement of products and organisational processes; when successful, it creates competitive advantage (Hurley and Hult 1998 ; Van de Ven and Engleman 2004 ; Grant 2008 ). It is there-fore the process of renewing not only products and/or services, including opera-tional processes within the production, distribution and marketing, but also business processes such as new forms of organisational design or management (Sundbo 2001 ). On the other hand, from an institutional perspective widely linked to continuous improvement, innovation is the process of developing and imple-menting new ideas that come from employees (Van de Ven and Engleman 2004 ). Innovation may have exogenous origins, e.g. technological, political and regula-tory changes, or demographic and social changes, but also endogenous motiva-tions caused by organisational structure that facilitate the development of innovative ideas and the adoption of innovation as a permanent organisational value (Shane 2003 ; Grant 2008 ).
6.3.4 Performance
Performance is used herein as a broad concept and is defi ned as a complex variable with a multiplicity of factors contributing to the overall level of performance at any point of time (Perera et al. 1997 ). Although the major source of information continues to be a combination of internal-quantitative data expressed in fi nancial and accounting terms (Smith 2005 ), not all organisational complexities can be expressed within a quantifi ed frame of reference (Bromwich and Bhimani 1996 ). As a result, performance measurement should take both fi nancial and non-fi nancial perspectives into account.
J. Novas and M. Saraiva

71
6.3.5 Hypotheses
There is widespread acknowledgement of the importance of using QCI as a vehicle for the continuous improvement of quality-related processes. Many companies that develop and implement costing systems make extensive use of QCI; it is used for planning and control purposes and to foster organisational learning and explore innovative solutions. Quality costing must be understood not only as a mechanism for managers to evaluate and monitor the economics, effectiveness and effi ciency of quality activities in their organisation but also as a bridge between line and top man-agement (Vaxevanidis et al. 2009 ). Thus, quality costing systems are used as “answer machines” as well as “learning machines” (See Burchell et al. 1980 ). According to Simons’ ( 1995 ) framework, the extensive use of quality costing systems and the resulting information enable companies to focus on the importance of balancing the inevitable tensions between the need for control and achieving pre- established objectives on one hand, and the organisational need for learning and innovation on the other (Kominis and Dudau 2012 ). We thus formulate the following hypothesis:
H1 (a, b): The extensive use of QCI is positively related with the development of (a) organisational learning and (b) innovativeness, thus contributing to the development of the QMS.
QCI fosters communication about the general control of quality within the organ-isation (Prickett and Rapley 2001 ). According to Yang ( 2008 ), the implementation of quality costing can produce signifi cant benefi ts. The most important is that organ-isations are able to focus on the areas that require improvement. This capacity to improve falls between organisational learning and innovation, i.e. it is the ability to learn and the knowledge generated by this that permits the identifi cation of needs and the opportunities for improvement which, in turn, leads to the development of innovation processes. Accordingly, organisational learning is a pre-requisite for innovativeness. Thus, we formulate the following hypothesis:
H2: QCI has an indirect positive effect on innovativeness through the development of organisational learning.
Organisations without a quality costing system often develop insular ways of maintaining control over each area of responsibility. This gives rise to uncoordinated information gathering, reporting, and management as well as the need for multiple re-drawing and re-keying of information (Jafari and Rodchua 2014 ). QC enable organisations to concentrate on low performance areas that need improving whilst also making continuous improvements and planning how to raise quality (Prickett and Rapley 2001 ). In addition to enabling organisations to focus on areas that require improvement, quality costing increases awareness (within the organisation) of the potential effects of poor quality on overall business results (Prickett and Rapley 2001 ; Makhopadhyay 2004 ; Yang 2008 ). We therefore formulate the following hypothesis:
H3 (a, b): Greater (a) organisational learning and (b) innovativeness, which contribute to the development of the QMS, are positively related with performance.
6 An Integrated View of the Use of Quality Cost Information, the Improvement…

72
6.4 Research Method
6.4.1 Sampling Procedure
This study uses primary data obtained through a questionnaire survey applied to Portuguese companies with the ISO 9001:2008 certifi cation. Focus is given to certi-fi ed companies as they are more aware of quality issues and the importance of man-aging quality variables, including QC, even though they are not required to implement or certify formal quality cost systems. The companies were selected from the last edition of the Quality & Certifi cation Yearbook, published in 2011. A random stratifi ed and systematised sample procedure was adopted to obtain a broad picture of Portuguese certifi ed companies. Given the objectives of the study, only certifi ed companies with a staff of 20 or more were considered because manage-ment accounting systems in larger companies tend to be more developed and better structured (Lal and Srivastava 2009 ).
Every fourth company in the Quality & Certifi cation Yearbook was selected with the aim of surveying 25 % of all companies. If a company did not meet the staff size criteria, the next company fulfi lling the criteria was selected. Our sample comprised 1,272 companies and we obtained a response rate of 25.4 %, corresponding to 323 validated questionnaires, which is consistent with the response rate of other similar studies (cf. e.g. Henri 2006 ).
A pre-test was performed in ten companies and led to some small modifi cations to the original questionnaire. The questionnaire was addressed to the boards of directors who decided who would answer it. Of the 323 validated questionnaires, 200 (61.9 %) were answered by the quality manager, 97 (30.0 %) by administrators/directors and the remainder by other staff members.
In terms of the representativeness of the fi nal sample, there were no signifi cant differences in the distribution of fi rms by sector and by size (in accordance with the number of employees). In fact, 50.5 % of companies employed 20–49 persons, 16.1 % employed 50–99, 19.2 % employed 100–249 and 14.2 % more than 249. In terms of sales volume, 54.8 % of companies reported a volume of up to €5 million, 14.2 % reported between €5m and €15m, 4.3 % between €15m and €25m, 8.7 % between €25m and €40m and 18.0 % over €40m.
6.4.2 Measurement of Variables
The literature was used to construct the data collection instrument. The fi rst ques-tion was based on a section of a questionnaire developed by Naranjo-Gil and Hartmann ( 2006 ); some adaptations were made that allowed us to measure the pro-fi le of the use of QCI provided by the system (see Appendix 1 — Panel 1 ). The vari-able was measured on a fi ve-point Likert scale (1—Not used; 5—Used extensively). The second question addresses the extent of organisational learning and
J. Novas and M. Saraiva

73
innovativeness (see Appendix 1 — Panel 2 ). Although the structure of this question is supported by the extensive bibliography and some empirical research, it does not reproduce any instruments used in previous studies. The variable was measured on a fi ve-point Likert scale (1—Completely disagree; 5—Completely agree). The third question deals with the degree of compliance with a set of company objec-tives. We used a slightly modifi ed version of the Scott and Tiessen ( 1999 ) instru-ment for exploring the incidence and importance of measuring the performance of management teams. The original structure of the questionnaire was simplifi ed and respondents were asked questions on three fi nancial categories (cost, sales and prof-itability) and fi ve non-fi nancial categories (productivity, quality, service, innovation and human resources). Respondents were asked to rate the level of achievement of each target over the previous 3 years, thus allowing for a dynamic view of perfor-mance measurement and simultaneously providing a mechanism to prevent circum-stantial effects on the process (see Appendix 1 — Panel 3 ). The variable was measured on a fi ve-point Likert scale (1—Much lower than expected; 5—Greater than expected).
6.4.3 Preliminary Analysis
Companies that collect information on costs of quality do not necessarily use that information extensively in the management process. Thus, the data collected were fi rst analysed to identify signifi cant differences in the way companies used the information on activities described in Question 1 (see Appendix 1 — Panel 1 ). This procedure also enables us to identify companies with broad-scope costing systems and which make effective and extensive use of their QCI. To that end, we performed a cluster analysis to identify groups of companies with different use profi les for the QCI provided by the system. The cluster analysis is an exploratory multivariate analysis technique that groups subjects based on the existing information; as a result, the subjects belonging to a group are as similar as possible and always more similar to members of their group than to those of the remaining groups (Hair Jr. et al. 2010 ). The objective is to maximise the homogeneity within each group as well as the heterogeneity among groups. Data was analysed using IBM SPSS Statistics 21 software.
6.4.4 Estimation and Analysis of the Proposed Model
A structural equation modelling procedure with AMOS (version 21) was used to test the proposed model. The recommended two-step approach (Anderson and Gerbing 1988 ) was followed. Before estimating the structural model, which describes the causal relationships between constructs and their relative explanatory power, we assessed the relationships between observable indicators in order to
6 An Integrated View of the Use of Quality Cost Information, the Improvement…
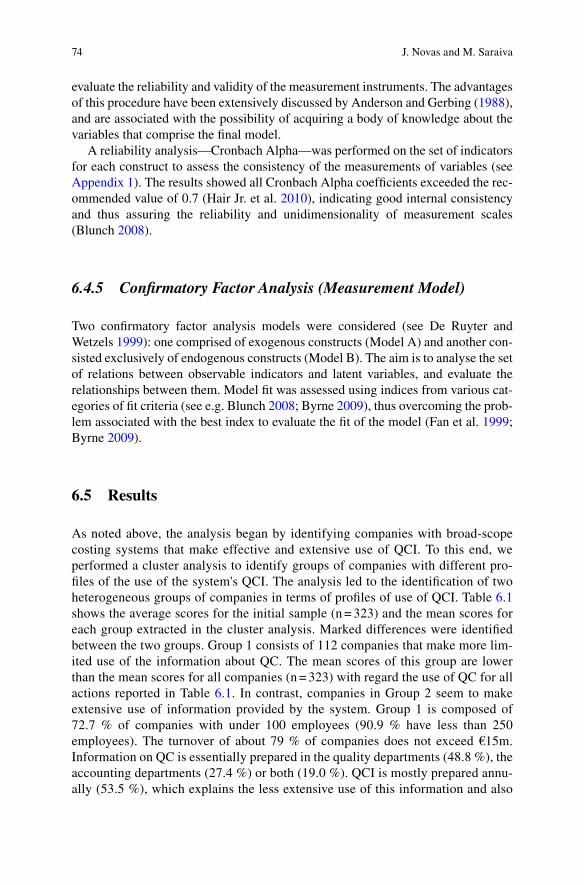
74
evaluate the reliability and validity of the measurement instruments. The advantages of this procedure have been extensively discussed by Anderson and Gerbing ( 1988 ), and are associated with the possibility of acquiring a body of knowledge about the variables that comprise the fi nal model.
A reliability analysis—Cronbach Alpha—was performed on the set of indicators for each construct to assess the consistency of the measurements of variables (see Appendix 1 ). The results showed all Cronbach Alpha coeffi cients exceeded the rec-ommended value of 0.7 (Hair Jr. et al. 2010 ), indicating good internal consistency and thus assuring the reliability and unidimensionality of measurement scales (Blunch 2008 ).
6.4.5 Confi rmatory Factor Analysis (Measurement Model)
Two confi rmatory factor analysis models were considered (see De Ruyter and Wetzels 1999 ): one comprised of exogenous constructs (Model A) and another con-sisted exclusively of endogenous constructs (Model B). The aim is to analyse the set of relations between observable indicators and latent variables, and evaluate the relationships between them. Model fi t was assessed using indices from various cat-egories of fi t criteria (see e.g. Blunch 2008 ; Byrne 2009 ), thus overcoming the prob-lem associated with the best index to evaluate the fi t of the model (Fan et al. 1999 ; Byrne 2009 ).
6.5 Results
As noted above, the analysis began by identifying companies with broad-scope costing systems that make effective and extensive use of QCI. To this end, we performed a cluster analysis to identify groups of companies with different pro-fi les of the use of the system's QCI. The analysis led to the identifi cation of two heterogeneous groups of companies in terms of profi les of use of QCI. Table 6.1 shows the average scores for the initial sample (n = 323) and the mean scores for each group extracted in the cluster analysis. Marked differences were identifi ed between the two groups. Group 1 consists of 112 companies that make more lim-ited use of the information about QC. The mean scores of this group are lower than the mean scores for all companies (n = 323) with regard the use of QC for all actions reported in Table 6.1 . In contrast, companies in Group 2 seem to make extensive use of information provided by the system. Group 1 is composed of 72.7 % of companies with under 100 employees (90.9 % have less than 250 employees). The turnover of about 79 % of companies does not exceed €15m. Information on QC is essentially prepared in the quality departments (48.8 %), the accounting departments (27.4 %) or both (19.0 %). QCI is mostly prepared annu-ally (53.5 %), which explains the less extensive use of this information and also
J. Novas and M. Saraiva

75
that it is not such an important support in the management process. Only 22.1 and 18.6 % of companies prepare monthly and quarterly information on QC, respec-tively. Group 2 consists of 211 companies. These companies are larger than those of Group 1, both in terms of number of employees and sales volume. About 64 % of companies have less than 100 employees (83.5 % have less than 250 employees and 93.4 % less than 500 employees). The turnover of 76.8 % of the companies is below €40m (69.2 % have a turnover of less than €25m and 65.6 % less than €15m). In these companies, the QCI is mainly prepared in the quality departments (61.3 %). Information is prepared in the accounting department in 15.7 % and by both departments in 14.2 % of the companies. QCI is issued monthly and quar-terly in 32.7 and 30.1 % of companies respectively. This information is prepared twice a year in 11.7 % and annually in 25.5 % of companies. This group of com-panies therefore makes more extensive and recurrent use of QCI, which suggests it is a useful support for the management process.
Our next step was to detect signifi cant differences between the two groups of companies in relation to the use of QCI. T-test showed statistically signifi cant dif-ferences between the two groups in relation to the use of QCI for all actions pre-sented in Table 6.1 . Given the purposes of this study, we then estimated the model using only the companies in Group 2.
As mentioned above, two models were initially considered for a confi rmatory factor analysis to evaluate and validate the measurement model. Model A is a recur-sive model, since the variables in this model are not infl uenced by others. An admis-sible solution was obtained from the estimation process and allowed for an acceptable fi t. The value of χ 2 /df was 2.150, below the recommended maximum of 3.00. TLI, NFI and CFI indices range from zero (poor fi t) to one (perfect fi t), with
Table 6.1 Use of information about QC
Actions
All companies (n = 323)
Groups (mean scores)
Mean SD Gr. 1 Gr. 2
Signalling key strategic areas 3.16 1.19 2.35 4.05 Implementing new ideas and ways of doing tasks 3.19 1.16 2.35 4.10 Setting targets and objectives 3.67 1.14 2.45 4.48 Negotiating targets and objectives 3.43 1.14 2.39 4.26 Debating data assumptions and action plans 3.45 1.10 2.40 4.32 Following up signifi cant exceptions and deviations 3.59 1.08 2.41 4.36 Following up pre-set plans and goals 3.64 1.04 2.46 4.37 Aligning performance measures with strategic goals 3.77 1.05 2.58 4.45 Involvement in permanent coordination with others 3.49 1.03 2.53 4.21 Developing, implementing and operating evaluation
and control systems 3.50 1.05 2.58 4.20
Learning tool 3.25 1.09 2.56 4.01 Allowing the company to focus on the critical factors
for success 3.44 1.05 2.69 4.19
6 An Integrated View of the Use of Quality Cost Information, the Improvement…

76
an acceptable minimum level of 0.90 (Hair Jr. et al. 2010 ). All indices were above the minimum recommended levels, indicating that the hypothesised model fi ts the data to a reasonable degree: NFI = 0.937; TLI = 0.906; CFI = 0.944. The RMSEA value was 0.07. Values below 0.05 indicate good fi t and values less than 0.08 are acceptable values (Hair Jr. et al. 2010 ). The associated confi dence interval (which ranges from 0.060 to 0.077) indicated the RMSEA value had a good level of accu-racy in replicating the model in the population. Model B consists of the endogenous constructs. The estimation process also resulted in an acceptable solution, since the fi t quality measures are below the minimum recommended levels: χ 2 /df = 1.945; NFI = 0.920; TLI = 0.945; CFI = 0.954; RMSEA = 0.055.
Once the structure inherent in the measurement model was confi rmed and validated, we proceeded to the estimation of the conceptual model to test the research hypotheses. Figure 6.2 shows the results after the estimation process, suggesting that the hypothe-sised model has a reasonable fi t with the data. Factor loadings (standardised regression weights) are also presented and represent statistically signifi cant relationships. Each value refers to the increase in the dependent variable in standard deviation units due to the variation of one unit of standard deviation in the independent variable.
Notes : χ 2 /df = 1.833; NFI = 0.935; TLI = 0.955; CFI = 0.945; RMSEA = 0.065. Standardised values; Statistically signifi cant at *p < 0.001 level.
6.6 Discussion and Conclusion
The main objective of this study is to analyse the relationship between the use of QC, improvements in the QMS (through the development of organisational learning and innovativeness) and organisational performance. We claimed that extensive use
0.745*
0.756*
0.545*
0.954*
Diagnostic use ofQCI
Financialperformance
Improvement of QMS
0.451*
0.246*
Non-financialperformance
Performance
Interactive use ofQCI
0.941*
Use of QCI
Organisationallearning
Innovativeness
0.667*
0.614*
Fig. 6.2 Extended conceptual model
J. Novas and M. Saraiva

77
of QCI is likely to foster organisational learning and the capacity to innovate. This means that it is being used in a diagnostic fashion to motivate and guide organ-isations towards achieving goals by focussing on and correcting deviations from pre- set performance standards (Henri 2006 ); it is also used interactively to expand opportunity seeking and learning by focussing attention and fostering dialogue throughout the organisation (Henri 2006 ).
As noted above, companies that make effective and extensive use of QCI (i.e. that are using this information diagnostically and interactively) were selected. Diagnostic use of information acts as a negative force as it constrains innovation and opportunity-seeking to ensure the achievement of goals set (Simons 1995 ). However, it is also seen as a prerequisite to interactive use (Haas and Kleingeld 1999 ). Thus, the diagnostic and interactive styles of use are formative elements of the “use of QCI” construct. The estimation process showed that the extensive use of QCI had a positive and statistically significant effect on improving the QMS through the incremental effect on organisational learning and innovativeness; this means that the information provided by the quality costing system is being used by companies to balance tensions between the need for control and the achievement of pre- established objectives—which is the traditional focus of quality costing processes—and the need for learning and innovation (Kominis and Dudau 2012 ).
Our hypothesis that a positive causal relationship existed between organisa-tional learning and innovativeness was also supported. This is consistent with theoretical assumptions that organisational learning constitutes a major com-ponent of innovative ability. Organisational learning fosters knowledge and the associations among past actions, the effectiveness of these actions, and future actions (Fiol and Lyles 1985 ). The organisation’s capacity to use this knowl-edge for the continuous improvement of quality related processes is an innova-tive capability.
The causal relationship between organisational learning and the ability to inno-vate was also positive and statistically signifi cant. This is relevant in that it shows how the improvements in the QMS impact performance. In light of the positive and statistically signifi cant direct effect of the use of QCI on improving QMS noted above, it is concluded that the extensive use of QCI may have an indirect positive effect on performance, in keeping with previous research.
This chapter highlighted the issue of using QCI to promote the development of QMS through the improvement of organisational learning and innovation. Companies have developed and implemented quality costing systems to provide information to support quality management processes. However, many of these companies do not make extensive use of this information, thus limiting the benefi ts that can be obtained in terms of the development of organisational capabilities, such as organisational learning and innovativeness. More research is needed and addi-tional efforts must be made to highlight this issue and to encourage managers to use QCI to promote participation, dialogue and involvement of all participants and not just to control the accomplishment of predetermined objectives.
6 An Integrated View of the Use of Quality Cost Information, the Improvement…

78
Appendix 1: Questionnaire and Results Extracted from the Statistical Analysis
Panel 1: Profi le of Use of Information About Costs and Other Quality Indicators Provided by the Information System
Indicate in which way the information provided by the information system about costs and other quality indicators is used for the following actions: (1—Not used; 5—Used extensively)
Diagnostic use Interactive use Setting targets and objectives. Signalling key strategic areas. Negotiating targets and objectives. Implementing new ideas and ways for doing tasks. Following up signifi cant exceptions
and deviations. Debating data assumptions and action plans.
Following up pre-set plans and goals. Aligning performance measures
with strategic goals.
Developing, implementing and operating evaluation and control systems.
Involvement in systematic contact with employees.
Learning tool.
Allowing the company to focus on the critical factors for success.
Diagnostic profi le of use: Cronbach’s alpha = 0.957; Interactive profi le of use: Cronbach’s alpha = 0.939
Panel 2: Improvement of QMS
Indicate the degree of agreement with the following statements: (1—Completely disagree; 5—Completely agree)
Innovativeness There is a culture of innovation and therefore a predisposition to innovate and to deal with the
risks and uncertainties associated with innovation processes. The company encourages and values the innovation processes (emergence of new ideas,
improving current processes, etc.) of its employees. The ideas and innovation processes suggested by people in the company are often implemented. The company is on the “front line” in terms of developing new products, processes, techniques, etc. There are routines in the company to exploit and/or consult the market with the aim of identifying
opportunities to develop new products /services and /or improve existing products /services. Senior managers develop and communicate a vision focused on continuous quality improvement. In the company there are routines that involve members from several areas (marketing,
production, quality, etc.) in the development of new products/services and/or improvement of existing products/services.
(continued)
J. Novas and M. Saraiva
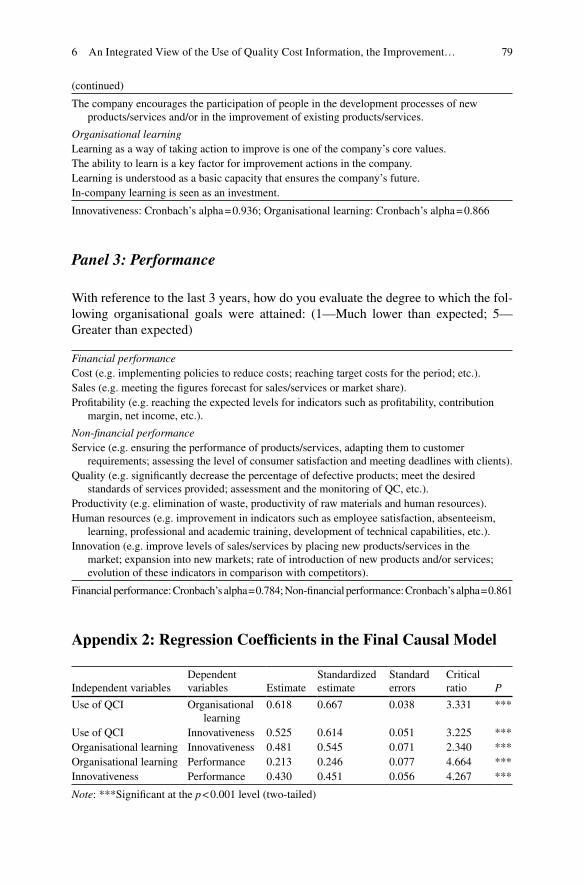
79
The company encourages the participation of people in the development processes of new products/services and/or in the improvement of existing products/services.
Organisational learning Learning as a way of taking action to improve is one of the company’s core values. The ability to learn is a key factor for improvement actions in the company. Learning is understood as a basic capacity that ensures the company’s future. In-company learning is seen as an investment.
Innovativeness: Cronbach’s alpha = 0.936; Organisational learning: Cronbach’s alpha = 0.866
Panel 3: Performance
With reference to the last 3 years, how do you evaluate the degree to which the fol-lowing organisational goals were attained: (1—Much lower than expected; 5—Greater than expected)
Financial performance Cost (e.g. implementing policies to reduce costs; reaching target costs for the period; etc.). Sales (e.g. meeting the fi gures forecast for sales/services or market share). Profi tability (e.g. reaching the expected levels for indicators such as profi tability, contribution
margin, net income, etc.).
Non-fi nancial performance Service (e.g. ensuring the performance of products/services, adapting them to customer
requirements; assessing the level of consumer satisfaction and meeting deadlines with clients). Quality (e.g. signifi cantly decrease the percentage of defective products; meet the desired
standards of services provided; assessment and the monitoring of QC, etc.). Productivity (e.g. elimination of waste, productivity of raw materials and human resources). Human resources (e.g. improvement in indicators such as employee satisfaction, absenteeism,
learning, professional and academic training, development of technical capabilities, etc.). Innovation (e.g. improve levels of sales/services by placing new products/services in the
market; expansion into new markets; rate of introduction of new products and/or services; evolution of these indicators in comparison with competitors).
Financial performance: Cronbach’s alpha = 0.784; Non-fi nancial performance: Cronbach’s alpha = 0.861
Appendix 2: Regression Coeffi cients in the Final Causal Model
Independent variables Dependent variables Estimate
Standardized estimate
Standard errors
Critical ratio P
Use of QCI Organisational learning
0.618 0.667 0.038 3.331 ***
Use of QCI Innovativeness 0.525 0.614 0.051 3.225 *** Organisational learning Innovativeness 0.481 0.545 0.071 2.340 *** Organisational learning Performance 0.213 0.246 0.077 4.664 *** Innovativeness Performance 0.430 0.451 0.056 4.267 ***
Note : ***Signifi cant at the p < 0.001 level (two-tailed)
(continued)
6 An Integrated View of the Use of Quality Cost Information, the Improvement…

80
References
Abernethy M, Brownell P (1999) The role of budgets in organizations facing strategic change: an exploratory study. Account Org Soc 24(3):189–204
Anderson J, Gerbing D (1988) Structural equation modeling in practice: a review and recom-mended two-step approach. Psychol Bull 103(3):411–423
Blunch N (2008) Introduction to structural equation modelling using SPSS and AMOS. SAGE Publications, London
Bromwich M, Bhimani A (1996) Management accounting: pathways to progress. Chartered Institute of Management Accountants Publishing, London
Burchell S, Clubb C, Hopwood A, Hughes J, Nahapiet J (1980) The roles of accounting in organi-zations and society. Accoun Org Soc 5(1):5–27
Byrne B (2009) Structural equation modeling with AMOS: basic concepts, applications, and pro-gramming, 2nd edn. Taylor & Francis Group, New York
Chenhall R (2005) Integrative strategic performance measurement systems, strategic alignment of manufacturing, learning and strategic outcomes: an exploratory study. Accoun Org Soc 30(5):395–422
Crosby P (1979) Quality is free. Mc-Graw-Hill, New York De Ruyter K, Wetzels M (1999) Commitment in auditor–client relationships: antecedents and
consequences. Accoun Org Soc 24(1):57–75 Fan X, Thompson B, Wang L (1999) Effects of sample size, estimation methods, and model speci-
fi cation on structural equation modeling fi t indexes. Struct Equ Model 6(1):56–83 Fiol C, Lyles M (1985) Organizational learning. Acad Manage Rev 10(4):803–813 Gilley J, Maycunich A (2000) Organizational learning, performance and change. Perseus
Publishing, Cambridge, MA Grant R (2008) Contemporary strategy analysis. Blackwell Publishers, Oxford Haas M, Kleingeld A (1999) Multilevel design of performance measurement systems: enhancing
strategic dialogue throughout the organization. Manage Account Res 10(3):233–261 Hair J Jr, Black W, Babin B, Anderson R (2010) Multivariate data analysis – a global perspective,
7th edn. Pearson Prentice Hall, Upper Saddle River, NJ Hartmann F, Vaassen E (2003) The Changing Role of Management Accounting and Control
Systems. In: Bhimani A (ed) Management accounting in the digital economy. Oxford University Press, Oxford, pp 112–132
Henri J-F (2006) Management control systems and strategy: a resource-based perspective. Accoun Org Soc 31(6):529–558
Hurley R, Hult G (1998) Innovation, market orientation, and organizational learning: an integra-tion and empirical examination. J Market 62:42–54
Jafari A, Rodchua S (2014) Survey research on quality costs and problems in the construction environment. Total Qual Manag Bus Excel 25(3–4):222–234
Jajua S, Mohantyb R, Lakhe R (2009) Towards managing quality cost: a case study. Total Qual Manage 20(10):1075–1094
Kominis G, Dudau A (2012) Time for interactive control systems in the public sector? The case of the Every Child Matters policy change in England. Manage Account Res 23(2):142–155
Lal J, Srivastava S (2009) Cost accounting, 4th edn. Tata McGraw-Hill, New Delhi Lukka K, Granlund M (2003) Management and Control in a New Economy Firm. In: Bhimani A
(ed) Management accounting in the digital economy. Oxford University Press, Oxford, pp 239–259
Makhopadhyay A (2004) Estimation of cost of quality in an Indian textile industry for reducing cost of non-conformance. Total Qual Manag Bus Excel 15(2):229–234
Naranjo-Gil D, Hartmann F (2006) How top management teams use management accounting systems to implement strategy. J Manage Account Res 18(1):21–53
Perera S, Harrison G, Poole M (1997) Customer-focused manufacturing strategy and the use of operations-based non-fi nancial performance measures: a research note. Accoun Org Soc 22(6):557–572
J. Novas and M. Saraiva

81
Prickett T, Rapley C (2001) Quality costing: a study of manufacturing organizations. Part 2: main survey. Total Qual Manage 12(2):211–222
Roberts H (2003) Management Accounting and the Knowledge Production Process. In: Bhimani A (ed) Management accounting in the digital economy. Oxford University Press, Oxford, pp 260–283
Sansalvador M, Brotons J (2013) Quality costing analysis: a case study of a Spanish organisation. Total Qual Manag Bus Excel 24(4):378–396
Scott T, Tiessen P (1999) Performance measurement and managerial teams. Accoun Org Soc 24(3):263–285
Shane S (2003) A general theory of entrepreneurship: the individual-opportunity nexus. Edward Elgar Publishing, Northampton, MA
Simons R (1995) Levers of control: how managers use innovative control systems to drive strategic renewal. Harvard Business School Press, Boston, MA
Slater S, Narver J (1995) Market orientation and the learning organization. J Market 59(3):63–74 Smith M (2005) Performance measurement & management – a strategic approach to management
accounting. SAGE Publications, London Sower V, Quarles R, Broussard E (2007) Cost of quality usage and its relationship to quality sys-
tem maturity. Int J Qual Reliab Manage 24(2):121–140 Sundbo J (2001) The strategic management of innovation: a sociological and economic theory.
Edward Elgar Publishing, Cheltenham, UK Tippins J, Sohi R (2003) IT competency and fi rm performance: is organizational learning a
missing link? Strategic Manage J 24(8):745–761 Van de Ven A, Engleman R (2004) Central problems in managing corporate innovation and entre-
preneurship. In: Shepherd A, Katz J (eds) Corporate entrepreneurship. Elsevier, Amsterdam, pp 47–72
Vaxevanidis N, Petropoulos G, Avakumovic J, Mourlas A (2009) Cost of quality models and their implementation in manufacturing fi rms. Int J Qual Res 3(1):27–36
Yang C (2008) Improving the defi nition and quantifi cation of quality costs. Total Qual Manage 19(3):175–191
Zoolo M, Winter S (2002) Deliberate learning and the evolution of dynamic capabilities. Organ Sci 13(3):339–351
6 An Integrated View of the Use of Quality Cost Information, the Improvement…

83M. Peris-Ortiz and J. Álvarez-García (eds.), Action-Based Quality Management: Strategy and Tools for Continuous Improvement, DOI 10.1007/978-3-319-06453-6_7, © Springer International Publishing Switzerland 2014
Abstract A great deal of research has shown how quality management (QM) can help organizations to improve their performance. The indispensable elements for QM to produce the desired effect are called critical factors. Among those, process approach is considered a management principle and a fundamental requirement in QM implementation framework. In Europe, the most frequently used frameworks are the international family of standards, ISO 9000, and the EFQM excellence model. In this context, the paper aims to (1) describe the practical implications of process management system; (2) analyse the impact of implementation actions on classical schemes of management and the structural design of organizations; and, (3) provide evidence of how process management is positively related with key organizational business results. For this purpose, the study uses a sample of 225 Spanish firms which have been subjected to complete assessment processes accord-ing to the EFQM model.
7.1 Introduction
The connection between the application of the principles and techniques of quality management and obtaining results has been an important object of research for years. The subject has evident importance as the implementation of quality systems (with all the implications it entails regarding cultural change, production of docu-mentation, implementation of new working methods, investments in R&D,
Chapter 7Processes Approach, Quality Management and Key Business Results
Rafael Periañez-Cristobal, Arturo Calvo-Mora, and Antonio Navarro-García
R. Periañez-Cristobal (*) • A. Calvo-Mora • A. Navarro-GarcíaDepartamento de Administración de Empresas y Márketing, Universidad de Sevilla Avda.Ramón y Cajal 1, Sevilla 41018, Spaine-mail: [email protected]; [email protected]; [email protected]

84
permanent analysis of the market, implementation of new technologies and man-agement techniques, continuous improvement activities, etc.) involves assuming costs which must be seen to be compensated by obtaining results that are clearly differentiated, with respect to organizations which orient their management systems in other directions.Nevertheless, the different ways in which researchers interpret the true signifi -
cance and practical implications of adopting a TQM strategy, together with the exis-tence of some research which question the importance of quality management as an instrument for the achievement of excellent results, has brought about a knowledge gap that obliges new evidence on the matter to be sought (Kim et al. 2010). It becomes necessary, therefore, to start with an approach that characterizes the key elements of a reliable quality management, based on a generally recognized scheme or model, from which to define those variables which most precisely determine a TQM system and the results that might be expected from it.
Among the models with greater prestige within the organizational world, that proposed by the European Foundation for Quality Management (EFQM) undoubt-edly stands out. Without detracting importance from the use of other approaches which are more focused on the design of management systems and quality assur-ance (ISO 9000, for example), it is evident that the EFQM Model approaches the implementation of quality management under the premise of “Excellence”, which grants it a broader and more ambitious character in terms of expected results. It is also more in accordance with what would be expected of a modern, economically and socially profitable organization, aware of the impacts that its activity exerts on multiple stakeholders whose expectations and levels of satisfaction must be prop-erly managed.
Starting from these considerations, the present work approaches the empirical verification of the relationship between those organizations which base their man-agement on the premise of excellence according to the EFQM model, and the achievement of key results at both operational and strategic levels. Within this gen-eral framework the study assumes that, within the multiple facets which character-ize quality management, the implementation of process management systems constitutes a necessary, although insufficient, condition to be able to properly speak of true excellence. However, this understanding is not exclusive to the management approaches based on models of excellence. In fact, all the internationally recog-nized management schemes (from those which seek excellence to those which limit their objectives to achieving high levels of quality assurance in products and ser-vices) assume that without process management it becomes impossible to hope to achieve excellent results.
To achieve the proposed objectives, the chapter has been structured in the follow-ing manner. Firstly, the theoretical framework is presented, defining the key concepts of process management, its different stages, and the EFQM model. The theoretical framework allows the establishment of the research hypothesis which will be exam-ined. Secondly, the research methodology is defined from an empirical study with a sample of 225 companies which apply the EFQM model. Thirdly, the data are anal-ysed and the results are obtained, to finally offer the main conclusions of the work.
R. Periañez-Cristobal et al.

85
7.2 Theoretical Background
7.2.1 Processes Management Methodology
When an organization has designed its hierarchy and its departmental structure, it has already established a consistent reference framework based on coordination by means of direct supervision to make decisions and to confront certain recurrent problems. Nevertheless, the compartmentalization of organizational activity intojobs and differentiated departments can generate serious coordination problems. Internally this causes the organization to suffer losses of efficiency through non- quality costs and the client is affected by receiving products and services that do not always satisfy their expectations (Çiflikli and Kahya-Özyirmidokuz 2012).
Process management links the activities of the posts and the departments by means of a standardized working system that specifies the actions to seek maximum possible efficiency, whilst obtaining predictable results to satisfy client expecta-tions. When a process management is designed and implemented it is necessary to adopt a horizontal and dynamic view of the organization that is clearly different from the strictly vertical and static nature, indicated by its organizational chart (Armistead et al. 1999). The complete commissioning of a process management system obliges a series of well-defined stages to be followed:
– Process identification. Classification, sequencing and analysis of interactions. Process mapping.
– Process prioritization. Description and standardization of key processes. – Process monitoring and control systems: Indicators. – Process improvement.
7.2.1.1 Processes Identification. Classification, Sequencing and Analysis of Interactions. Process Mapping
The processes of the organization exist prior to the implementation of the system. In this first stage, an analysis is made of what is already done, and homogenous and coherent sequences of activities (processes) are located which allows the analysis of the work of the organization (Çiflikli and Kahya-Özyirmidokuz 2012). There is no infallible technique for the identification of the processes, although some general guidelines can be given. If an organization specifies the mission, identifies the tar-gets of its work, and clarifies its sustainable competitive advantage, it will also know how its activity is realized and who it affects or has a legitimate interest in it. The organization’s products or services are the result of chains of activities that can be analysed one by one. A simple reflection on the stages that lead to obtaining each product or service, and on the elements upon which the competitive advantage of the organization are based, will allow most of the so-called “key” or “operational” processes to be identified (Singh 2012). Clearly, those are not its only activities, and
7 Processes Approach, Quality Management and Key Business Results

86
all the others will also have to be identified and analysed in homogenous blocks whenever they lead to obtaining results with sufficient weight to be considered as “processes”. Once all the processes have been identified (including the sub- processes of lesser weight that they might contain) they will be classified and placed in the most suitable position within the process map (as “key”, “strategic” or “sup-port” processes) (Pardo-Álvarez 2012).
It is logical that all, or a good part, of them are interconnected. When the process map is compiled and each process is put in its corresponding position, it will be necessary to consider the most important relationships that occur among them. The activities which comprise each process are of course related, but the processes are also related to each other. Although the identification of each process already sup-poses the establishment of a series of interdependences between the activities that compose it, some interdependences between differentiated processes can be very important for the correct operation of the organization (Palmberg 2010). Identifying them, and later reflecting on the best way to handle them, must also be an important part of the process management system.
7.2.1.2 Processes Prioritization. Description and Standardization of Key Processes
Converting a process of certain complexity into a standardized procedure can involve considerable work if it is required to be done with rigour. If it were to be done with all the processes of the organization, the task would be enormous and the effort-benefit ratio would probably not be profitable. There must be scrupulous selection of the processes to be standardized and of those which will not. Only those processes which exert a special control on both the development and the results of the organiza-tion will be subjected to this standardization mechanism (Shahin and Mahbod 2007).
Consequently, the identified processes must be prioritized. The criteria to be con-sidered in each case in order to carry out this task will depend on the circumstances of the organization, the characteristics of its work, the way it performs such work (its know-how), and on the hierarchical and departmental configuration that has been decided to be used in its structure. As a minimum, the “key” processes, the results of which ultimately impact directly on the client, would have to be standard-ized (Repa 2011). This does not exclude the application of different criteria to select other processes, whether supporting or strategic. Among other criteria, organiza-tions often use some of the following:
– Emergencies posed by the process – Resources consumed in its execution – Possible demands of legality – Level of predictability of the actions and the results – Need for restructuring due to the application of new technologies or working
methodologies – Feasibility of accomplishing the standardization – Impact on interested third-parties, etc.
R. Periañez-Cristobal et al.

87
When the organization has decided on the processes to be standardized, it will have to make a detailed analysis of how each is undertaken to be able to describe them exhaustively. All the resulting information will shape its Procedures Manual (Bell and Omachonu 2011), the writing of which will have completed one of the most impor-tant parts of that organization’s quality system documentation. For each process that is standardized the following information, at least, will have to be specified:
– Code and name of the process. – Current edition and date of entry into force. – Mission or objective that the process pursues. – Scope (interval of activities that the process includes). – Organizational units linked to the execution of the process activities. – Proprietor of the process. This will be the person who is assigned the responsibil-
ity of catalysing all the activities that comprise the process, with independence from the department that executes them in each case.
– Regulations (of a strictly legal character, or dictated by the organization itself) which must be generally considered when executing the process.
– Detailed and sequential description of the activities of the processes, indicating the positions and departments which execute them. The technical instructions which could be associated with some of those activities will be included.
– Records associated with the execution of the process. They will serve as proof of the way in which the process has been developed and to thus have primary data for continuous improvement.
– Clients and Suppliers (internal and external) of the process.
7.2.1.3 Processes Monitoring and Control Systems: Indicators
The monitoring and control of a process requires the previous establishment of sen-sors that can alert to the appearance of anomalous situations. The process indicators fulfil this purpose (Kronz 2006). An indicator is any magnitude (absolute or rela-tive) obtained from primary data that allows the characteristics of a given situation to be known, described or evaluated. To speak of indicators is to speak of measure-ment, and, for that reason, it is essential that all those that are established are reliable (must be consistent and credible) and valid (it must be shown that they actually measure what is desired to be measured). The indicators are measures that summa-rize important situations whose evolution over time is of interest. They are con-structed from the information available and are designed to give answers to concrete questions formulated for a specific context. They are the product of a selection and must be produced from the possibilities offered by the data extracted from the oper-ation of the process (Parmenter 2010).
All processes must be associated with their corresponding indicators, and the possibility of obtaining them with available means, must be ensured (feasibility). It is not a question of calculating an enormous amount of indicators, nor of conducting complex mathematical operations or calculations devoid of practical use for control and improvement. Formulas must be sought that can be applied without great
7 Processes Approach, Quality Management and Key Business Results

88
difficulties, or because the data are easily accessible, or because there are other data that are easily deduced from information the organization already handles, even though it may be for another purpose. In short, it must be ensured that there are information systems that effectively allow the proposed indicators to be calculated with normality (Fanning and Centers 2013).
For each selected indicator the following elements, at least, would have to be specified:
– Code and name – Mathematical formula – Regularity and circumstances in which it will be calculated – Limiting value/s, which will alert to the moment the process is out of control and
requires rapid action – Objective value/s, indicative of the desired or optimal values of the indicator – Those responsible for the taking of data, measurement, monitoring of the results
and liaising with the decision centres on the data obtained.
7.2.1.4 Processes Improvement
Process management must represent a permanent systematic performance and not a sporadic way of acting to manage the work of the organization. Process manage-ment attempts to improve the coordination and the operation of the organization, not as an aim in itself but as the instrument that must allow the permanent improvement of efficiency and the best service to the client. To summarize, it is a system that attempts to make the reduction of costs (by avoidance of failures) compatible with the increase in market satisfaction levels, all by means of a fluid operation of the structural design (Trkman 2010).
Looking at the problem from this perspective, it is evident that mechanisms must be implemented to permanently advance in the two directions: improvement of effi-ciency and of the products/services offered to the market. Assuming that perfection does not exist, it is a matter of using the available information to find what does not appear satisfactory and to act consequently through gradual improvements. The base information for this improvement will be given, fundamentally, by the values obtained from the indicators and by the nature of the records or evidence that remain after the execution of the process. Those which give clues about the failures will be those which will allow reflection on the best way to avoid their repetition (Neely et al. 2000).
The best way to approach this systematic improvement is to constantly pose elementary questions relative to different aspects of the execution of each process: what is really pursued with each action; is it certain that each activity is being under-taken by the most appropriate position; can we be completely sure that the times at which the tasks are undertaken are the correct ones, etc. The improvement of effi-ciency and the generation of added value must be basic criteria in process improve-ment. As a general rule, it is possible to clearly state that all those activities which do not contribute value (the concept of “value” as understood beyond its mere economic meaning) must be eliminated (Zellner 2011).
R. Periañez-Cristobal et al.

89
From a quality standpoint, process improvement must be considered as a gradual process of team-work in which the ideas of all the members of the organization can have a place. In an optimal situation, the improvement process will assume the exis-tence of certain starting situations that cannot be radically changed overnight. It is as unrealistic to propose improvement as a mere theoretical speculation abstract from the existing reality, as it is to take everything that exists as good. The imple-mentation of technological improvements and the innovation stemming from the creativity of the people, must coexist harmoniously so that process management is consolidated as a dynamic system, and is constantly evolving to become ever more adapted to the improvement of efficiency and to the expectations of the clients (Ahire and Dreyfus 2000).
As a summary, it could be said that process management involves, to a certain extent, the introduction of the perspective of using the market to evaluate the suit-ability of the work developed by the organization into its daily management. Contrary to a management based exclusively on the departmental compartmental-ization of tasks (and which are taken directly from the organizational chart), process management works with complete sequences of activities which, finally, materialize in what the client receives, perceives and values. Concern for each of the stages of a process understood in isolation does not always lead to an efficient whole that is in line with market demands. One of the functions of the proprietor of each process will be to ensure the coordination of its activities from a global perspective (Rummler and Brache 2013). The benefit of this global perspective (which, to a certain degree, is not concerned with means, but only with ends) will be evident later when the cli-ent judges the quality of the work of the organization and its conformity with their expectations.
7.2.2 Processes Management and the EFQM Model
7.2.2.1 The EFQM Excellence Model
The aim of the EFQM model is to support organizations to achieve business excel-lence through continuous improvement, learning, innovation and the deployment of key processes. Furthermore, it is a basis for the use of a language and a way of thinking that is common in European organizations. The model presents a non- prescriptive work framework that analyses the relationships between what an orga-nization does, and the results that it is able to attain, assuming that there are different approaches to attaining excellence.
The EFQM model includes eight fundamental concepts of excellence and nine criteria. The fundamental concepts outline the foundation for achieving sustain-able excellence in any organization. They can be used as the basis to describe the attributes of an excellent organizational culture. The criteria that the model pro-poses represent the indicative elements of the degree of progression that a certain organization follows to achieve excellence. These criteria, or dimensions, are
7 Processes Approach, Quality Management and Key Business Results

90
specified in five key implementation factors or enablers (what the organization “does and how it does it”), and the four remaining dimensions reflect the results that the organization attains, concerning their customers, employees, society and other key results.
The logic of the model is based on the fact that achieving excellent results in the four former management areas (customers, employees, society and strategy) is directly related to the leadership capacity, the strategy quality and its deployment through people, partners, resources and processes (EFQM 2012). Moreover, the EFQM model has a dynamic nature. It indicates that activities such as innovation, learning or creativity, boost and empower the impact that the model's agents have on the results. This refers to the system's continuous improvement in the search for excellence.
7.2.2.2 Processes Management in the EFQM Model
Criterion 5 of the EFQM Model (EFQM 2012) is reserved for analysing the way an excellent organization manages its processes. It specifically states that “Excellent organizations design, manage and improve their processes, products and services to generate ever greater value for their clients and other interest groups”. To contrib-ute greater detail to this generic statement, EFQM Model 2003 established 5 dif-ferentiated sub-criteria (Club Gestión de Calidad 2005). Two of them (5a and 5b) deal generically with the systems of design, management, innovation and improve-ment of the organization’s processes, without differentiating between their charac-teristics. The other three (5c, 5d and 5e) are reserved for dealing specifically with the processes termed operational or key because of the way they affect the basic elements of the value chain of the organization: development of products and ser-vices, production delivery and ancillary services, and, finally, relationships with the clients (EFQM 2012).
The conceptual scheme followed by the EFQM Model is perfectly consistent with the systematic of implementing the process management raised in the previous point. It starts with the identification of all the processes inherent to the work of the organization; these are classified taking into account their particular nature towards fulfilling the mission; and the pertinent responsibilities are assigned within the hier-archy to ensure effective coordination of activities. As has been noted, only those processes which display a special criticality will be formalized or standardized to ensure, as far as possible, that predictable results are attained. Among these pro-cesses worthy of special analysis are, without a doubt, those most bound to the basic activities of the value chain of the organization. Their correct management and con-trol will enable high levels of client satisfaction to be attained. The effective imple-mentation of process management necessarily entails the start-up of continuous improvement systems which enable learning from experience, improvement of results and, ultimately, to provide the market with the products and services which satisfy its needs and at prices that match its expectations.
R. Periañez-Cristobal et al.

91
7.2.3 Processes Management and Key Business Results
Process management is a key factor for effective quality implementation that has the greatest consensus in the TQM literature (Curkovic et al. 2000). The EFQM model establishes process management as being the nexus between the remaining key implementation factors and the measurements of the results. Therefore, Claver et al. (2003) point out that organizations act more effectively in achieving their aims and in obtaining better results when all their activities are systematically developed, administered and improved through processes.
In the industrial area, process management implies the development of activities such as the management, control and improvement of all the phases of design and manufacturing, the preventative maintenance of teams, the statistical control of pro-cesses, and the reduction of inspections or process variability (Fotopoulos and Psomas 2010). These aspects are positively related to productivity or economic effi-ciency (Flynn et al. 1994; Curkovic et al. 2000). To compete in the markets, firms must back the prevention of errors and a key process management that leads them to fulfil customers’ requirements and specifications and the achievement of excel-lent results (Murat et al. 2004). In the services area, process management is associ-ated with service provision (Prajogo 2005). This is the determining factor of how clients perceive its quality and, therefore, their satisfaction level. Perception is assessed via tangible elements, reliability, security, empathy, and response capacity (Parasuraman et al. 1994).
In fact, process management is a broad concept that includes the design of prod-ucts, services and organizational processes which fulfil the expectations of the cli-ents and others stakeholders, the prevention of errors, control and continuous improvement, the search for zero-defects, cycle time reduction and innovation (Sila and Ebrahimpour 2003). These aspects have a direct impact on the operational and economic results of any type of business (Kaynak 2003). From the aforementioned, we can put forward the following hypotheses:
H1: The companies which manage their processes more in accordance with the EFQM model obtain better key strategic results than those that do not.H2: The companies which manage their processes more in accordance with the EFQM model obtain better key operational results than those that do not.
7.3 Methodology
7.3.1 Sample
The sample is composed 225 Spanish companies that have undergone self and external assessment processes on the basis of the EFQM Excellence Model between 2003 and 2010. The sample includes large companies, as well as small and medium
7 Processes Approach, Quality Management and Key Business Results

92
sized companies (SMEs), according to the definition by the European Commission (Recommendation of the European Commission 96/280/EC). In addition, as can be seen in Table 7.1, the sample also includes companies of the main sectors of activity (primary, secondary and tertiary), as well as privately and publically owned companies.
7.3.2 Measures
The variables and their respective measurement indicators were obtained from the EFQM Model (EFQM 2003). Specifically, Processes and the measurement of results which refer to Key results are analysed (Table 7.2).
7.3.3 Data Analysis and Results
Data analysis was performed on the available information. Firstly, the reliability of the measurement scales was verified. Thus, Cronbach’s alpha values were obtained, both for the process management indicators (0.911) and for the key results (0.900), which can be considered excellent following the recommendations of George andMallery (2003), as they exceed the value of 0.9. Therefore, the scales associated with process management and key results are reliable.Next, the sample companies were differentiated according to the process man -
agement developed and key results attained. This involved calculating, in each com-pany, the process management aggregate index, defined by the average value of the process management indicators. Subsequently, the average value of the process management index, as well as the key results, were calculated for the total of the companies. Comparing the individual value of the indices, of processes and results,
Table 7.1 Sample characteristics
Frequency Percentage
Ownership of CapitalPrivate 188 83.5Public 37 16.5Total 225 100
Company sizeSmall and medium 146 64.8Large 79 35.2Total 225 100
Type of businessServices 161 71.5Manufacturing and construction 45 20Agriculture and mining 19 8.5Total 225 100
R. Periañez-Cristobal et al.

93
in each company with the total average of the sample, differentiation was made between those companies that undertake process management more (or less) in accordance with the EFQM model and/or obtain better (or worse) results than the average. Thus, the group catalogued as 1 includes companies that are above aver-age, and group 0 includes those below average, in process management or in key results. This allowed the sample to be divided into 4 sub-groups and thus for each of the key results considered (Table 7.3).
Against this background, Table 7.3 reflects that the proportion of companies that obtain better than average results, as much in strategic terms as operational, are those which tend to undertake process management in their organization more in accordance (above the average) with the EFQM model.
Table 7.2 Measures
EFQM Criteria
Criteria 5 → Processes5a. Systemic design and management of the processes5b. Introduction of the necessary improvements via innovation, in order to fully satisfy the
customers and other interest groups, increasingly generating a greater value5c. Design and development of the products and services based on the needs and expectations of
the customers5d. Production, distribution and attention service of the products and services5e. Management and improvement of the relationships with customers
Criteria 9 →Key results9a. Key performance outcomes. These measurements include:(1) Economic and financial results: (a) General data→ sales volume, share or dividend
prices; (b) Aspects related to profitability → gross margins, share profits, profits before interests and taxes or operating margin; (c) Information about investments and assets → profitability of invested capital, of net assets, of capital used, etc.
(2) Non-economic results: Market share, time of launching new products, success indices,processes performance, etc.
9b. Key performance indicators. These measurements include:(1) Economic and financial measurements: treasury, depreciation, maintenance costs, credit
qualification, etc.(2) Non-financial measurements: (a) Processes→ performance, assessments or
innovations; (b) External resources → performance of suppliers, nº and added value of partnerships, nº and added value of joint improvements attained with partners; (c) Buildings, teams and materials → indices of defects, inventory rotation, use; (d) Technology → rhythm of innovation, value of intellectual property, patents, royalties; (e) Information and knowledge → accessibility, integrity, value of intellectual capital.
Table 7.3 Contingency table
Key performance outcomes Key performance indicators
0 1 0 1
Independent (Processes) n % n % n % n %0 = below average 71 31.5 33 14.6 76 33.7 28 12.51 = above average 33 14.6 88 39.3 38 16.9 83 36.9
7 Processes Approach, Quality Management and Key Business Results

94
Chi-Square test was used to compare averages, and the results shown in Table 7.4 confirm the existence of significant differences (p < 0.05) in terms of key, opera-tional and strategic results, based on the process management undertaken in the organization.
The analysis of the corrected standardized residuals (Table 7.5) confirms, in the proposed direction, the mooted research hypotheses. Thus, in the group of compa-nies with process management in accordance with the EFQM model, the frequen-cies observed in relation to the key results, both strategic (6.149) and operational (6.233) are significantly greater than the expected frequencies. The opposite occurs with those companies whose process management is below average, whose observed frequencies are significantly smaller than those expected for both key results (−6.149; −6,233). Therefore, hypotheses H1 and H2 are confirmed.
In summary, the obtained results confirm the hypothesis of the existence of a positive, and statistically significant, relationship between the development of pro-cess management more in accordance with the EFQM model and the achievement of superior key results, both in strategic and operational terms.
7.4 Conclusions
This work shows that the conceptual scheme followed by the EFQM Model is per-fectly consistent with the systematics of process management implementation. It can generate a positive and direct impact on the strategic and operational results of the organization. It must be taken into account that the aim of the EFQM model is to support organizations to achieve business excellence, through continuous improvement, learning, innovation and the deployment of key processes.
Process management in relation to the EFQM model enables standardizing actions, increasing the effectiveness and efficiency of human resources, and the use of technology, increasing the probabilities of satisfying the expectations of the client.
Table 7.4 Chi-Square test for contingency tables
χ2 Degrees of freedom p-value
H1: Processes—Key performance outcomes 37.816* 1 0.000H2: Processes—Key performance indicators 38.856* 1 0.000
Note: * p < 0.05
Table 7.5 Analysis of the corrected standardized residuals for contingency tables
Key performance outcomes Key performance indicators
Processes 0 1 0 10 = below average 6.149* −6.149* 6.233* −6.233*1 = above average −6.149* 6.149 * −6.233* 6.233*
Note: * p < 0.05 (standardized residuals in absolute value greater than 1.96)
R. Periañez-Cristobal et al.

95
It generates value in the supply of the organization’s products and services, increas-ing the probability of obtaining key results that are superior to the competition.
The results obtained corroborate the hypotheses that those companies which undertake process management in accordance with the principles of the EFQM model obtain better key results, in strategic and operational terms, than those that do not. For that reason, it is advisable that the companies which follow the EFQM model systematize the processes undertaken in their organizations, as soon as pos-sible, as this will have positive effects on the results of the activity in the medium to long term.
References
Ahire SL, Dreyfus P (2000) The impact of design management and process management on qual-ity: an empirical investigation. J Oper Manag 18:549–575
Armistead C, Pritchard JP, Machin S (1999) Strategic business process management for organiza-tional effectiveness. Long Range Plann 32(1):96–106
Bell M, Omachonu V (2011) Quality system implementation process for business success. Int J Qual Reliab Manag 28(7):723–734
Çiflikli C, Kahya-Özyirmidokuz E (2012) Enhancing product quality of a process. Ind Manag Data Syst 112(8):1181–1200
Claver E, Tarí JJ, Molina JF (2003) Critical factors and results of quality management: an empiri-cal study. Total Qual Manag 14(1):91–118
Curkovic S, Vickery S, Dröge C (2000) Quality-related action programs: their impact on quality performance and firm performance. Decis Sci 31(4):885–905
Club Gestión de Calidad (2005) Interpretando el Modelo EFQM de Excelencia, CGC, MadridEFQM (2003) EFQM excellence model. European Foundation for Quality Management, BrusselsEFQM (2012) Modelo EFQM de Excelencia. European Foundation for Quality Management,
MadridFanning K, Centers DP (2013) Intelligent business process management: hype or reality? J Corp
Account Financ 24(5):9–14Flynn B, Schroeder RG, Sakakibara S (1994) A framework for quality management research and
an associated measurement instrument. J Oper Manag 11(4):339–366Fotopoulos CV, Psomas EL (2010) The structural relationships between TQM factors and organi-
zational performance. Total Qual Manag Bus Excel 22(5):539–552George D, Mallery P (2003) SPSS for Windows step by step: a simple guide and reference. 11.0
update, 4th edn. Allyn & Bacon, BostonKaynak H (2003) The relationship between total quality management practices and their effects on
firm performance. J Oper Manag 21:405–435Kim DY, Kumar V, Murphy SA (2010) European foundation for quality management business
excellence model: an integrative review and research agenda. Int J Qual Reliab Manag 27(6):684–701
Kronz A (2006) Managing of process key performance indicators as part of the ARIS methodol-ogy. In: Scheer AW et al. (eds) “Corporate performance management. ARIS in practice”. Springer Berlin, Heidelberg, New York, pp 31–44
Murat JA, Yasin M, Zimmerer T (2004) TQM practices in service organizations: an exploratory study into the implementation, outcome and effectiveness. Manag Serv Qual 14(5):377–389
Neely A, Mills J, Platts K, Richards H, Gregory M, Bourne M, Kennerley M (2000) Performancemeasurement system design: developing and testing a process-based approach. Int J Oper Prod Manag 20(10):1119–1145
7 Processes Approach, Quality Management and Key Business Results

96
Palmberg K (2010) Experiences of implementing process management: a multiple case study. Bus Process Manag J 16(1):93–113
Parasuraman A, Zeithaml VA, Berry LL (1994) Reassessment of expectations as a comparison standard in measuring service quality: implications for further research. J Market 58:114–124
Pardo-Álvarez JM (2012) Configuración y usos de un mapa de procesos. AENOR Eds, MadridParmenter D (2010) Key performance indicators. Developing, implementing and using winning KPIs. Wiley, Hoboken, New Jersey
Prajogo DI (2005) The comparative analysis of TQM practices and quality performance between manufacturing and service firms. Int J Serv Ind Manag 16(3):217–228
Repa V (2011) Building the process-managed organization by means of services. J Syst Integr 2:11–16
Rummler GA, Brache AP (2013) Improving performance: how to manage the white space on theorganization chart, 3rd edn. Wiley, San Francisco, CA
Shahin A, Mahbod MA (2007) Prioritization of key performance indicators: an integration of analytical hierarchy process and goal setting. Int J Prod Perform Manag 56(3):226–240
Sila I, Ebrahimpour M (2003) Examination and comparison of the critical factors of total quality management (TQM) across countries. Int J Prod Res 41(2):235–268
Singh PK (2012) Management of business processes can help an organization achieve competitive advantage. Int Manag Rev 8(2):19–26
Trkman P (2010) The critical success factors of business process management. Int J Inform Manag 30:125–134
Zellner G (2011) A structured evaluation of business process improvement approaches. BusProcess Manag J 17(2):203–237
R. Periañez-Cristobal et al.

97M. Peris-Ortiz and J. Álvarez-García (eds.), Action-Based Quality Management: Strategy and Tools for Continuous Improvement, DOI 10.1007/978-3-319-06453-6_8,© Springer International Publishing Switzerland 2014
Abstract Quality management systems place great emphasis upon HR management as a key factor in assuring the attainment of an organization’s objectives, given that they can sustain the competitive window and bring great effi ciency, being a valuable and intangible active factor in an organization. Starting from this vision, and by applying a purely instrumental point of view centered upon results, in this chapter we will analyze to what extent the implementation of a quality management system based on the application of ISO 9001 favors the putting into action of High Involvement Work Practices, and what is the impact of this on the results of the organizations.
High Involvement Work Practices or High Performance Work Practices (HIWP or HPWP) are a group of HR management practices that act synergistically and improve the organizational effi ciency by creating work conditions that increase employee satisfaction, incentivize closeness and loyalty to the company and create an environment where work tasks are better performed.
8.1 Introduction
The ISO 9001 forms part of the ISO 9000 family of quality management system standards which were produced at the heart of the ISO/TC 176 committee (see http://www.iso.org/iso/iso_9000 ), and is currently made up of.
Chapter 8 Quality Management Systems ISO 9901 and the Use of High Involvement Work Practices
Amable Juárez-Tárraga , Jose Miguel Albarracin-Guillem , Marta Palmer-Gato , and Juan A. Marin-Garcia
A. Juárez- Tárraga (*) • J. M. Albarracin-Guillem • M. Palmer-Gato • J. A. Marin-Garcia Departamento de Organización de Empresas , Universitat Politècnica de València , Camino de Vera , Valencia 46022 , Spain e-mail: [email protected]; [email protected]; [email protected]; [email protected]

98
• ISO 9000:2005 “Quality management systems—Fundamentals and vocabulary”. Covers the basic concepts and language.
• ISO 9001:2008 “Quality management systems—Requirements”. Sets out the requirements of a quality management system
• ISO 9004:2009 “Managing for the sustained success of an organization—A quality management approach”. Focuses on how to make a quality management system more effi cient and effective
• ISO 19011:2011—“Guidelines for auditing management systems”. Sets out guidance on internal and external audits of quality management systems.
The standard ISO 9004 proposes the following example to identify the stake-holders (Freeman 1984 ) in the sustained success of a company, though this can differ signifi cantly over time and between organizations, industries, sector and environment.
As is shown in the Table 8.1 , each interested party has different needs and expec-tations regarding the sustained success of the company, but with regard to owners and shareholders the principal objective of any company is to maximize the eco-nomic effi ciency and/or the shareholders’ dividends (Becker et al. 1998 ).
The implementation of Quality Management (QM) tools and the use of ISO 9001 had received a high degree of attention in extant literature. Several research papers attribute superior fi rm performance to adoption of QM practices, and while there have been doubts about QM’s return on the investment, more recent research found that effective implementation of QM practices will contribute to better fi nancial, marketing, and even innovation performance by improving quality performance and/or operational performance (Nair 2006 ).
In the concrete case of the infl uence of human resource on quality management systems, the meta-analysis undertaken by Nair in 2006 (Nair 2006 ) shows that people management has a positive relationship with aggregate performance, fi nan-cial performance and operational performance. This reaffi rms the importance attributed to the human resource management component of QM practices, includ-ing ISO 9001.
Table 8.1 Needs and expectations of the stakeholders (Source ISO 9004:2009)
Interested party Needs and expectations
Customers Quality, price and delivery performance of products Owners/shareholders Sustained profi tability
Transparency People in the organization Good work environment
Job security Recognition and reward
Suppliers and partners Mutual benefi ts and continuity Society Environmental protection
Ethical behaviour
A. Juárez-Tárraga et al.

99
In the current environment two main Quality Management tendencies co-exist, and offer two distinct models:
• To adopt a normalization focus and design a quality system using the standard ISO 9001 as reference.
• To consider one of the models that underlie the quality awards as a base for qual-ity management. The principal awards, at an international level, are the Deming Award in Japan, the Malcolm Baldridge National Quality Award (PNCMB) in the USA, and the European Quality Award, given by the EFQM.
In this chapter we will focus on the fi rst of these models, the regulatory one; fi rstly because of its wide diffusion in Europe, and secondly because it is commonly the fi rst phase that companies use when they consider implementing the EFQM model. EFQM.
With regard to the motives that push a company to contemplate the implantation and posterior certifi cation of a quality management system based upon ISO 9001, two fundamental aspects can be identifi ed that can be combined in variable propor-tions depending upon the organization:
• External motives: pressure from clients, utilization of the certifi cation as an argument for sales with commercial or image goals.
• Internal motives: to utilize the certifi cation as a management tool within the organization.
Those studies that analyze company motivation to implant ISO 9001 give higher relevance to external motives, which is to say pressure from customers or publicity aims (Hughes et al. 2000 ). However, companies obtain better results when the motivation to implant an ISO 9001 quality management system is internal (Manders et al. 2013 ; Martínez-Costa et al. 2009 )
In the fi rst case, companies tend not to go deeply with the implantation of the requirements marked out by the standard, and stay with the minimum demanded for certifi cation; while those organizations that use the certifi cation as a management tool from the beginning of the process are those that are able to take full advantage of the improvements, just as much in work methods as in result indicators that are obtained following the implantation of the quality system (Martínez-Costa et al. 2009 )
Independently of the motive that pushed the company towards ISO 9001, the implantation process as much as the posterior maintenance are not easy tasks, and the result depends in great part on appropriate human resource management, requir-ing the assurance that the knowledge, preparation and above all appropriate attitude and motivation are taken into account at all times (Alfalla-Luque et al. 2012 ; Marin- Garcia 2002 ).
We will start this chapter by undertaking a brief introduction to HIWP, to be able to afterwards analyze ISO 9001:2008, including a brief reference to the changes that are being considered in the new version, ISO 9001:2015 in that which concerns personnel management. We will also analyze ISO 10018, and we will evaluate, at a descriptive level, to what extent high involvement practices fi t within the framework of these standards.
8 Quality Management Systems ISO 9901 and the Use of High Involvement Work…

100
The results of this analysis will aid company managers as well as HR and quality management consultants to identify which of the HIWP tools are clearly identifi ed in the ISO 9001 standard, and which are not, with the goal of establishing the start-ing point laid down by ISO 9001, and thus approach the next stage with a higher level of success in the implementation of these tools.
8.2 High Involvement Work Practices
Faced with the most traditional management practices, HIWP has as its basic objec-tive the improvement of worker capacity and their greater involvement in the fi rm. It can be considered that those companies that develop these practices to the greatest extent are those that present the most advanced or proactive HR strategy (Ordiz- Fuertes and Fernandez-Sanchez 2003 ).
The defi nitions of the HIWPs all have different nuances according to the investi-gators that analyzed their use and consequences, although in general all coincide in that there is a relationship to the results of the company (Conci 2012 ; Marin Garcia and Conci 2013 )):
• They are a group of practices of human resources management that act synergis-tically and improve organizational effi ciency by creating working conditions that increase worker satisfaction, encourage him to be linked to the Organization and to better perform their tasks (Huselid 1995 )
• High involvement work practices are a set of human resources practices that focus on giving employees opportunities to make informed decisions concerning the conduct of their Jobs (Lawler et al. 1992 ).
• The HIWP represent a set of Human resource management practices that trans-form the workforce into a source of sustainable competitive advantage, provided they use integrated with the company’s strategy (Guerrero and Barraud-Didier 2004 ; Guthrie et al. 2002 )
With respect to which practices to include in HIWP, there is no consensus amongst the investigators (Marin Garcia 2013 ). In 2006 a meta-analysis was pub-lished showing the results of 92 investigations in which the infl uence of the applica-tion of these techniques upon business performance was analyzed (Combs et al. 2006 ). In this meta-analysis, Combs et al. ( 2006 ) analyzes the infl uence of 13 prac-tices, which are the most utilized in the investigations upon which the study is based: incentive compensation, training, compensation level, participation, selectiv-ity, internal promotion, HR planning, fl exible work, performance appraisal, griev-ance procedures, teams, information sharing, and employment security.
But perhaps the predominant at the moment is the AMO model (Jiang et al. 2012 ; Subramony 2009 ; Marin Garcia 2013 ) (Fig. 8.1 ) .
Investigations relating to the use of, and the results obtained by, HIWP have been plentiful over recent years, and one of the most interesting questions that has
A. Juárez-Tárraga et al.
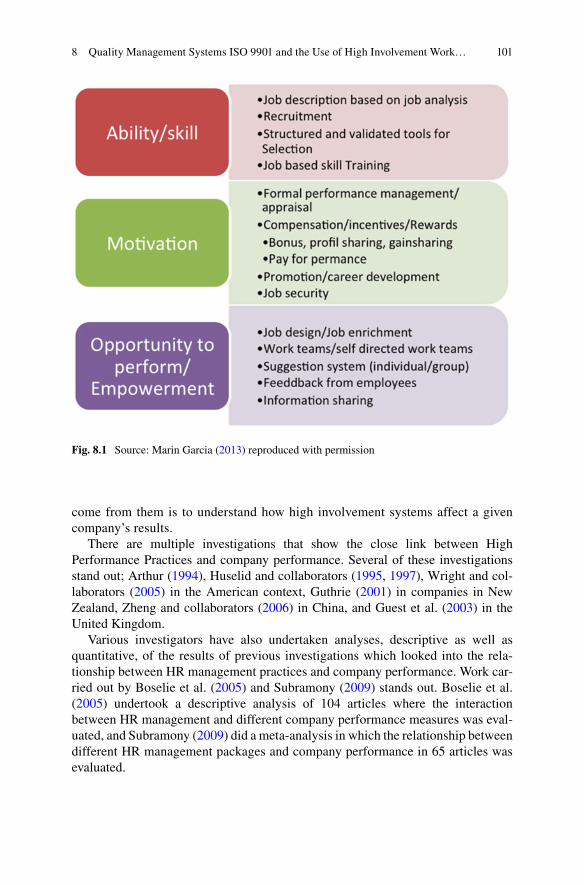
101
come from them is to understand how high involvement systems affect a given company’s results.
There are multiple investigations that show the close link between High Performance Practices and company performance. Several of these investigations stand out; Arthur ( 1994 ), Huselid and collaborators ( 1995 , 1997 ), Wright and col-laborators ( 2005 ) in the American context, Guthrie ( 2001 ) in companies in New Zealand, Zheng and collaborators ( 2006 ) in China, and Guest et al. ( 2003 ) in the United Kingdom.
Various investigators have also undertaken analyses, descriptive as well as quantitative, of the results of previous investigations which looked into the rela-tionship between HR management practices and company performance. Work car-ried out by Boselie et al. ( 2005 ) and Subramony ( 2009 ) stands out. Boselie et al. ( 2005 ) undertook a descriptive analysis of 104 articles where the interaction between HR management and different company performance measures was eval-uated, and Subramony ( 2009 ) did a meta-analysis in which the relationship between different HR management packages and company performance in 65 articles was evaluated.
Fig. 8.1 Source: Marin Garcia ( 2013 ) reproduced with permission
8 Quality Management Systems ISO 9901 and the Use of High Involvement Work…

102
Combs (2006) sets out a model in which the contributions of their meta-analysis are refl ected, amongst which the below stand out:
• High Performance Practices positively affect company performance. • High Performance Practice systems have a greater effect than the individual use
of these practices. • The identifi cation of the three most widely analyzed elements that moderate
the results obtained: company strategy (differentiation/costs), the context (fabrication/services) and the design of the investigation (selection of the performance measures).
8.3 HR in ISO 9001
The importance that ISO 9001 places upon human resources is refl ected in 2 of the 8 principles purported by the standard:
Principle 2: Leadership
Leaders establish unity of purpose and direction of the organization. They should create and maintain the internal environment in which people can become fully involved in achieving the organization’s objectives.
a) Key benefi ts
• people will understand and be motivated towards the organization’s goals and objectives,
• activities are evaluated, aligned and implemented in a unifi ed way, • miscommunication between levels of an organization will be minimized.
b) Applying the principle of leadership typically leads to
• considering the needs of all interested parties including customers, owners, employees, suppliers,
• fi nanciers, local communities and society as a whole, • establishing a clear vision of the organization’s future, • setting challenging goals and targets, • creating and sustaining shared values, fairness and ethical role models at all
levels of the • organization, • establishing trust and eliminating fear, • providing people with the required resources, training and freedom to act
with responsibility and • accountability, • inspiring, encouraging and recognizing people’s contributions.
A. Juárez-Tárraga et al.

103
Principle 3: Involvement of People
People at all levels are the essence of an organization and their full involvement enables their abilities to be used for the organization’s benefi t.
a) Key benefi ts
• motivated, committed and involved people within the organization, • innovation and creativity in furthering the organization’s objectives, • people being accountable for their own performance, • people eager to participate in and contribute to continual improvement.
b) Applying the principle of involvement of people typically leads to
• people understanding the importance of their contribution and role in the organization,
• people identifying constraints to their performance, • people accepting ownership of problems and their responsibility for solv-
ing them, • people evaluating their performance against their personal goals and
objectives, • people actively seeking opportunities to enhance their competence, knowl-
edge and experience, • people freely sharing knowledge and experience, • people openly discussing problems and issues.
Taking this aspect into account, ISO 9001:2008 translates this principle into a series of requirements that the organizations need to fulfi ll in relation to the man-agement of their human resources, given that they are the ones who will put the quality system into work once developed.
Presented below, in Fig. 8.2 , are the guidelines laid out by ISO 9001:2008 with respect to people management, which is considered in Sects. 5.5.1 and 6.2. These guidelines establish the need to defi ne personnel responsibilities and authority, determine the competencies needed to address the processes, undertake actions to assure that the company has the identifi ed competences available, periodically eval-uate the effi ciency of the actions undertaken, promote raising awareness amongst all personnel, and to maintain records of peoples’ competences.
The management of the organization has the responsibility to defi ne the structure of the same, and to establish which activities each person should be able to under-take according to the work roles that have been designed. Although this requirement is not considered in Sect. 6.2, it is the key aspect upon which the personnel manage-ment system that lays out the standard is supported, and appears in Sect. 5.5.1 “Responsibility and authority”.
Once the tasks of all the work roles created are defi ned, the fi rst activity estab-lished by the standard in Sect. 6.2.2 is to determine the competence required to fi ll the role, i.e. what training, what experience, what education and what skills are needed by the person or persons who fi ll the role.
Standard ISO 9001:2008 also demands that the organization does not rest on its laurels with the actions undertaken, given that providing training or placing
8 Quality Management Systems ISO 9901 and the Use of High Involvement Work…

104
competent people is not enough. It should be guaranteed that the said actions have covered the necessities, and the effi ciency of those actions should be evaluated, with the objective of checking to see if the objectives laid out have been achieved, which in the last instance should result in an improvement in the capacities and results.
The requirements analyzed thus far can be assimilated into the general “know- how”, but the standard also concerns itself with “want to do”, given that it estab-lishes that actions should be undertaken to ensure that the personnel is aware of the pertinence and importance of their activities and how they contribute to the achieve-ment of the quality objectives.
In that which concerns the evidence of the activities undertaken (we must not forget that the standard centers on the effi ciency of the quality management system in meeting the requirements of the customer, and that the companies can use it to “demonstrate their capacity to consistently provide products that satisfy the require-ments of the customer as well as applicable legal and regulatory requirements”—section 1.1a), ISO 9001:2008 requires that the organization has within its power information and data that show the competence of its members. This means it is necessary to create records that include information about the competence prior to the incorporation and actualizations in line with how that competence grows by way of the different actions undertaken and achieved.
Fig. 8.2 Guidelines about HR in ISO 9001. Source: authors
A. Juárez-Tárraga et al.

105
Once the requirements of ISO 9001:2008 are analyzed, included below, in Fig. 8.3 , an illustration of the relationships of the different HR management tools that can be used to satisfy these requirements.
Although it is evident that the requirements laid out by the standard with reference to HR management do not constitute a program of personnel management, they can be seen as the fi rst steps in this direction.
After undertaking this analysis we must consider that this version of ISO 9001 is in the process of revision. On the 3rd of June 2013 the ISO TC 176 committee pub-lished the fi rst draft of ISO 9001:2015. This new version does not lay out a formal-ized or cosmetic revision but in fact a deep and important revision of ISO 9001, with changes of focus and new clauses that suppose an important change of direction.
With respect to the orientation, the below stand out in the draft of the new version:
– Greater orientation toward service companies. The term “product” has been sub-stituted for “goods and services”, and some sections specifi c to production com-panies have been revised.
– Attention is focused on the total quality diagrams given that it is necessary to understand the needs and expectations of all interested parties (not just the cus-tomer’s), and this obliges us to consider the socioeconomic environment of the organization in the planning of a quality system.
– The focus on processes is reinforced
Fig. 8.3 HR management tools to satisfy requirements of ISO 9001:2008. Source: authors
8 Quality Management Systems ISO 9901 and the Use of High Involvement Work…

106
– Change management. Planning and control of change gains more relevance given the importance of continuous adaption to changes in environments, which are ever less stable.
– Inclusion of risk management aspects, and the term “preventative action” disappears given that the whole system is considered as a prevention instrument.
With respect to HR management, the principal newness is centered upon:
– Organization leadership is widened and gone into in more depth. The new stan-dard explicitly goes into the requirements of management leadership
– The new standard expressly contemplates the management of knowledge and considers it an important intangible in quality management.
– Competence management. The new version explicitly looks at the need to man-age competences.
Without a doubt, these changes increase the need to put new HR management tools into practice, amongst which HIWP will have great importance, although until the defi nitive new version is published, changes in the content could affect HR management.
8.4 The Standard ISO 10018:2012
As was commented upon in previous section, ISO 9001:2008 does not set out a system of HR management, and following this line the technical committee ISO/TC 176 put together, in the heart of GT 15, the standard ISO 10018:2012, “Quality management—Guidelines on people involvement and competence”. This standard provides a framework for getting the best out of people in the implementation of a quality management system based on ISO 9001:2008, and develops a process for encouraging personnel involvement and competence. It also reviews each element of ISO 9001, identifi es typical management system problems that can occur through lack of personnel involvement, and specifi es actions to overcome those problems.
In the introductory text to the standard one thing that stands out is that “the global performance of a quality management system and its processes depend upon the participation of competent persons” and that “it is very important to identify, develop and evaluate the knowledge, abilities, behavior and work environment necessary for the effective participation of those persons with the necessary competence”.
ISO 10018:2012 describes:
– The processes that an organization can use to implement and maintain participa-tion and competence in the quality management systems
– Actions that can be taken to strengthen participation – Actions that can be taken to fulfi l the individual requirements of the quality
management system, such as those specifi ed in ISO 9001, although other man-agement system standards can be used.
A. Juárez-Tárraga et al.

107
In the Annex A, this standard describes the factors (13) that impact on people involvement and competence, and explains why each is important, and outlines the benefi ts gained from their implementation. The analysis of the different dimensions of the human factor remains centered on three aspects and for each one the putting into place of various tools is laid out:
• Leadership factors
– Leadership (A.9) – Sensibilizacion (A.3)
• Personnel participation factors:
– Communication (A.4) – Teamwork and collaboration (A.14) – Networking (A.10) – Discipline—Motivation (A.2) – Responsability and autority (A.13) – Recognition and rewards (A.11)
• Competence factors:
– Recruitment (A.12) – Awareness (A.8) – Education and learning (A.6) – Creativity and innovation (A.5) – Competence (A.7)
The standard ISO 10018:2012 analyzes to what extent these factors and tools need to be applied when approaching the development and implantation of ISO 9001. In Table 8.2 the extent to which each of these tools has an application in one or various differing sections of ISO 9001:2008, with differing levels of intensity.
8.5 Relationship Between Standards ISO 9001 and ISO 10018 and the HIWP. Conclusions
As we have seen, ISO 10018:2012 sets out an important qualitative leap in relation to the requirements demanded by ISO 9001:2008 with respect to personnel manage-ment. This leap translates into a greater possibility of implanting HIWP.
Before beginning to analyze to what level each one of the analyzed standards foster the putting into use of HIWP, we are going to analyze in detail the principles of quality management that are related to HR management (principles 2 and 3), so as to determine to what level these principles leave room for the use of HIWP in the organizations. To undertake this analysis as reference we will use the AMO model described in Sect. 8.3 and we will indicate with which intensity the different prac-tices can contribute to obtaining the results set out for with the application of these principles.
8 Quality Management Systems ISO 9901 and the Use of High Involvement Work…

108
Tabl
e 8.
2 So
urce
: aut
hors
4.1
4.2
5.1
5.2
5.3
5.4
5.5
5.6
6.1
6.2
6.3
6.4
7.1
7.2
7.3
7.4
7.5
7.6
8.1
8.2
8.3
8.4
8.5
Aw
aren
ess
**
**
**
**
* *
* *
* **
**
**
**
C
omm
unic
atio
n **
* **
**
* **
**
**
*
* *
* *
**
**
**
**
Com
pete
nce
***
**
* *
* *
* *
* *
* *
Cre
ativ
ity
***
**
**
**
**
**
**
Edu
catio
n **
* L
eade
rshi
p **
* **
* **
* **
* M
otiv
atio
n **
* *
* *
* *
* *
* *
* N
etw
orki
ng
**
***
Rec
ogni
tion
***
***
***
***
Rec
ruitm
ent
***
***
Res
pons
ibili
ty
***
***
Sens
ibili
tatio
n **
* Te
amw
ork
***
***
***
***
***
***
**
**
A. Juárez-Tárraga et al.

Tabl
e 8.
3 R
elat
ions
hips
and
inte
nsity
bet
wee
n pr
inci
ples
and
mod
els
Sour
ce: a
utho
rs
Abi
lity/
skill
M
otiv
atio
n O
ppor
tuni
ty to
per
form
/Em
pow
erm
ent
Prin
cipl
e R
esul
ts
Job
desc
ript
ion
base
d on
jo
b an
alys
is
Rec
ruitm
ent
Stru
ctur
ed
and
valid
ated
to
ols
for
sele
ctio
n
Job
base
d sk
ill
trai
ning
Form
al
perf
orm
ance
m
anag
eria
l/ ap
prai
sal
Com
pens
atio
n/
ince
ntiv
es/
rew
ards
Prom
otio
n/
care
er
deve
lopm
ent
Job
secu
rity
Job
desi
gn/
Job
enri
chm
ent
Wor
ks
team
s/se
lf
dire
cted
w
ork
team
s
Sugg
estio
n sy
stem
s (i
ndiv
idua
l/ gr
oup)
Feed
back
fr
om
empl
oyee
s In
form
atio
n sh
arin
g
2. L
eade
rshi
p C
onsi
deri
ng th
e ne
eds
of a
ll in
tere
sted
par
ties
incl
udin
g cu
stom
ers,
ow
ners
, em
ploy
ees,
su
pplie
rs, fi
nan
cier
s,
loca
l com
mun
ities
and
so
ciet
y as
a w
hole
* *
*
Est
ablis
hing
a c
lear
vis
ion
of th
e or
gani
zatio
n’s
futu
re
*
Setti
ng c
halle
ngin
g go
als
and
targ
ets
**
Cre
atin
g an
d su
stai
ning
sh
ared
val
ues,
fai
rnes
s an
d et
hica
l rol
e m
odel
s at
all
leve
ls o
f th
e or
gani
zatio
n
*
Est
ablis
hing
trus
t and
el
imin
atin
g fe
ar
***
Prov
idin
g pe
ople
with
th
e re
quir
ed r
esou
rces
, tr
aini
ng a
nd f
reed
om to
ac
t with
res
pons
ibili
ty
and
acco
unta
bilit
y
**
***
Insp
irin
g, e
ncou
ragi
ng
and
reco
gniz
ing
peop
le’s
con
trib
utio
ns
***
***
(con
tinue
d)

Tabl
e 8.
3 (c
ontin
ued)
Abi
lity/
skill
M
otiv
atio
n O
ppor
tuni
ty to
per
form
/Em
pow
erm
ent
Prin
cipl
e R
esul
ts
Job
desc
ript
ion
base
d on
jo
b an
alys
is
Rec
ruitm
ent
Stru
ctur
ed
and
valid
ated
to
ols
for
sele
ctio
n
Job
base
d sk
ill
trai
ning
Form
al
perf
orm
ance
m
anag
eria
l/ ap
prai
sal
Com
pens
atio
n/
ince
ntiv
es/
rew
ards
Prom
otio
n/
care
er
deve
lopm
ent
Job
secu
rity
Job
desi
gn/
Job
enri
chm
ent
Wor
ks
team
s/se
lf
dire
cted
w
ork
team
s
Sugg
estio
n sy
stem
s (i
ndiv
idua
l/ gr
oup)
Feed
back
fr
om
empl
oyee
s In
form
atio
n sh
arin
g
3. I
nvol
vem
ent
Peop
le u
nder
stan
ding
the
impo
rtan
ce o
f th
eir
cont
ribu
tion
and
role
in
the
orga
niza
tion
***
Peop
le id
entif
ying
co
nstr
aint
s to
thei
r pe
rfor
man
ce
***
**
Peop
le a
ccep
ting
owne
rshi
p of
pro
blem
s an
d th
eir
resp
onsi
bilit
y fo
r so
lvin
g th
em
***
**
Peop
le e
valu
atin
g th
eir
perf
orm
ance
aga
inst
th
eir
pers
onal
goa
ls a
nd
obje
ctiv
es
***
Peop
le a
ctiv
ely
seek
ing
oppo
rtun
ities
to
enha
nce
thei
r co
mpe
tenc
e, k
now
ledg
e an
d ex
peri
ence
***
***
Peop
le f
reel
y sh
arin
g kn
owle
dge
and
expe
rien
ce
***
***
***
Peop
le o
penl
y di
scus
sing
pr
oble
ms
and
issu
es
***
***
***

111
Following the analysis and discussion of the available documents, the group of authors proposes the following relationships and intensity between principles and models (Table 8.3 ), HIWP and standards (Table 8.4 ).
Following the same outline laid out, in the Table 8.4 the different intensity level with which each standard fosters the use of HIWP is shown.
In this sense, different investigators have evaluated to what extent those compa-nies which have put quality management systems into place have also initiated HIWP programmes or fl exible work practices, (Alfalla-Luque et al. 2012 ; Bayo-Moriones et al. 2011 ; Bayo-Moriones and Merino Diaz de Cerio 2001 ; Marin Garcia 2013 ), and their conclusions confi rm that the implantation of quality man-agement systems fosters the use of HIWP, although with higher frequency of non regulatory models (EFQM) than regulatory models (ISO 9001).
From the analysis undertaken it can de deduced that the use of HIWP tools in unlikely in those companies that look to meet the minimum requirements of ISO 9001:2008, given that this standard sets out a very limited requirement level with respect to the use of HR management tools.
However, the draft of the new version of ISO 9001:2015, as well as ISO 10018:2012, set out a scenario much more propitious to the use of HIWP.
This situation needs to be taken into account by the professionals that take on the adoption or improvement of quality management systems and the use of HIWP to improve the results of the organizations.
Table 8.4 Relationships and intensity between HIWP and standards. Source: authors
Program HIWP (AMO model) ISO 9001:2008
DIS/ISO 9001:2015
ISO 10018:2012
Ability/skill Job description based on job analysis * ** *** Recruitment * ** *** Structured and validated tools for selection – * *** Job based skill training * ** *
Motivation Formal performance managerial/appraisal – * ** Compensation/incentives/rewards – * * Promotion/career development – * ** Job security * * ***
Opportunity to perform/Empower-ment
Job design/Job enrichment – * ** Works teams/self directed work teams – * ** Suggestion systems (individual/group) – * ** Feedback from employees * ** *** Information sharing * ** **
8 Quality Management Systems ISO 9901 and the Use of High Involvement Work…

112
References
Alfalla-Luque R, Marin-Garcia JA, Medina-López C (2012) Is worker commitment necessary for achieving competitive advantage and customer satisfaction when companies use HRM and TQM practices? Universia Bus Rev 36:64–89
Arthur JB (1994) Effects of human resource systems on manufacturing performance and turnover. Acad Manag J 37(3):670–687
Bayo-Moriones A, Merino Diaz de Cerio J (2001) Quality management and high performance work practices: do they coexist? Int J Prod Econ 73(3):251–259
Bayo-Moriones A, Merino Diaz de Cerio J, Antonio Escamilla-de-León S, Mary Selvam R (2011) The impact of ISO 9000 and EFQM on the use of fl exible work practices. Int J Prod Econ 130(1):33–42
Becker BE, Sunny B, Huselid MA, Rutgers U, Ferris GR (1998) High performance work systems and fi rm performance: a synthesis of research and managerial implications. Res Personnel Hum Resour Manag 16:53–101
Boselie P, Dietz G, Boon C (2005) Commonalities and contradictions in HRM and performance research. Hum Resour Manag J 15(3):67–94
Combs J, Liu YM, Hall A, Ketchen D (2006) How much do high-performance work practices matter? A meta-analysis of their effects on organizational performance. Personnel Psychol 59(3):501–528
Conci G (2012) Perceived results obtained by companies associated to the use of high involvement work practices (HIWP). Working Papers on Operations Management 3(1):01–15
Freeman, R. (1984). Strategic Management: A Stakeholder Approach Guerrero S, Barraud-Didier V (2004) High-involvement practices and performance of French
fi rms. Int J Hum Resour Manag 15(8):1408–1423 Guest DE, Michie J, Conway N, Sheehan M (2003) Human resource management and corporate
performance in the UK. Br J Ind Relat 41(2):291–314 Guthrie JP (2001) High-involvement work practices, turnover, and productivity: evidence from
New Zealand. Acad Manag J 44(1):180–190 Guthrie JP, Spell CS, Nyamori RO (2002) Correlates and consequences of high involvement work
practices: the role of competitive strategy. Int J Hum Resour Manag 13(1):183–197 Hughes T, Williams T, Ryall P (2000) It is not what you achieve it is the way you achieve it. Total
Qual Manag 11(3):329–340 Huselid MA (1995) The impact of human-resource management-practices on turnover, productiv-
ity, and corporate fi nancial performance. Acad Manag J 38(3):635–672 Huselid MA, Jackson SE, Schuler RS (1997) Technical and strategic human resource management
effectiveness as determinants of fi rm performance. Acad Manag J 40(1):171–188 Jiang K, Lepak DP, Hu J, Baer JC (2012) How does human resource management infl uence
organizational outcomes? A meta-analytic investigation of mediating mechanisms. Acad Manag J 55(6):1264–1294
Lawler, EE, Mohrman SD, Ledford GE (1992) Employee involvement and total quality manage-ment practices and results in fortune 1000 companies. Jossey-Bass business and management series
Manders B, de Vries H, Blind K (2013) The relationship between ISO 9001 and fi nancial performance: a meta-analysis. Acad Manag Proc 2013(1)
Marin Garcia JA (2013) ¿Qué sabemos sobre la relación de los programas de recursos humanos de alto rendimiento y el desempeño organizativo? (What do we know about the relationship between High Involvement Work Practices and Performance? WPOM - Working Papers On Operations Management 4(2):01–15
Marin Garcia JA, Conci G (2013) Validación de un cuestionario para medir el grado de uso de las prácticas de alta implicación de los trabajadores. Intangible Capital 9(3):854–882
A. Juárez-Tárraga et al.

113
Marin-Garcia JA (2002) La gestión participativa en las grandes empresas industriales españolas: grado de uso, resultados obtenidos y comparación internacional. ProQuest Information and Learning, sección UMI (publication number: 3025050)
Martínez-Costa M, Choi TY, Martínez JA, Martínez-Lorente AR (2009) ISO 9000/1994, ISO 9001/2000 and TQM: The performance debate revisited. J Oper Manag. doi: 10.1016/j.jom.2009.04.002
Nair A (2006) Meta-analysis of the relationship between quality management practices and fi rm performanceGÇöimplications for quality management theory development. J Oper Manag 24(6):948–975
Ordiz-Fuertes M, Fernandez-Sanchez E (2003) High-involvement practices in human resource management: concept and factors that motivate their adoption. Int J Hum Resour Manag 14(4):511–529
Subramony M (2009) A meta-analytic investigation of the relationship between HRM bundles and fi rm performance. Hum Resour Manag 48(5):745–768
Wright PM, Gardner TM, Moynihan LM, Allen MR (2005) The relationship between HR practices and fi rm performance: examining causal order. Personnel Psychol 58(2):409–446
Zheng C, Morrison M, O’Neill G (2006) An empirical study of high performance HRM practices in Chinese SMEs. Int J Hum Resour Manag 17(10):1772–1803
8 Quality Management Systems ISO 9901 and the Use of High Involvement Work…
115M. Peris-Ortiz and J. Álvarez-García (eds.), Action-Based Quality Management: Strategy and Tools for Continuous Improvement, DOI 10.1007/978-3-319-06453-6_9, © Springer International Publishing Switzerland 2014
Abstract The aim of this paper is to analyze, through a literature review, the implementation of several management systems (MSs) and their sustainable man-agement. Three main scenarios and their outcomes are analyzed. In the first, organi-zations implement management systems but do not certify them, explaining the decertification phenomenon. In the second, organizations implement management systems and certify them. Organizations in the above scenarios contribute to the MSs diffusion phenomenon. In the third, organizations may or may not implement additional management systems, but they do internalize their requirements. Organizations in this scenario may decide to improve their efficiency by using the requirements of the standards for their internal benefits regardless of their certifica-tion or even to manage their MSs by implementing an integrated management sys-tem. Both internal and external motivations to implement and manage these MSs will also be analyzed, as will the correlations among them and each scenario. Due to the strong impact of ISO 9001 and ISO 14001 on organizations worldwide, the existing literature has focused on the implementation of these MS standards. Therefore, the analysis presented in this chapter will primarily consider these stan-dards, although some attention will be paid to other MSs. The main contribution of this study is the presentation of three possible scenarios that standardization bodies, organizations and academia should consider for the future study of MSs.
Chapter 9Implementing Multiple Management Systems: Is It Sustainable?
Merce Bernardo and Alexandra Simon
M. Bernardo (*) Economy and Business Management, Universitat de Barcelona, 690 Av Diagonal, 8034 Barcelona, Barcelona, Spaine-mail: [email protected]
A. Simon Business Department, Universitat Autònoma de Barcelona, Campus de la UAB, Edifici B, 8193 Bellaterra, Barcelona, Spaine-mail: [email protected]

116
9.1 Introduction
Over the few last decades, the number of standards published to improve the imple-mentation of managerial and operational practices has increased (see ISO 2013). The most productive institution publishing these standards has been and is currently the International Organization for Standardization (ISO), whose standards are the most implemented and certified worldwide. According to the available data on ISO certification, the quality management system (QMS) standard based on ISO 9001 has been the most highly implemented, with over one million certificates issued worldwide, as well as ISO 14001 for environmental management systems (EMSs), with over 285,000 certificates worldwide (ISO 2013). There exist other standards and MSs that are more focused on specific sectors (ISO 22000 for food and safety MS for example) or that are issued by other certification bodies, such as SA 8000 for working conditions management, AA 1000 for corporate accounting and UNE 166002 for innovation management, among others.
The implementation of these standards as managerial practices is motivated by the improvement of the internal organization of the corporation; more specifically, the internal motivations are related to productivity, internal communication, process performance team work, measurement of performance and communication, and continuous improvement (see, e.g., Sampaio et al. 2010), whereas external motiva-tions are more related to providing an answer to the market’s pressure to ensure that the function-specific requirements of the standard are met or, more specifically, to promotional and marketing issues, such as customer and market pressures or market share (see, e.g., Escapa 2004; Kaziliūnas 2010; Sampaio et al. 2010). These motiva-tions may condition the implementation of these practices, e.g., Sampaio et al. (2011a) concluded that this is “a critical success factor in the impact of the quality management system over the company economic performance”.
Regardless of these motivations, the evolution of the implementation of ISO 9001 and ISO 14001 has been analyzed in-depth in papers on diffusion. This phe-nomenon may be studied from three different perspectives: factors, scope and model. Diffusion factors are related to a positive institutional environment (Delmas 2002), foreign direct investment (Prakash and Potoski 2007) and geographic and cultural affinity (Albuquerque et al. 2007), among others. The scope of diffusion may be international (Delmas and Montiel 2008), national (Specchiarello and Giagnorio 2009) or sectoral (Alonso-Almeida et al. 2013). The most highly accepted diffusion model is the S-curve model (Franceschini et al. 2004; Llach et al. 2011; Marimon et al. 2011).
The implementation and diffusion of these standards covers two additional con-cepts: internalization and decertification. The former entails the degree of adoption of these practices, how organizations implement and work with them and the pro-cess of becoming a routine, all of which may not be homogeneous (see, e.g., Heras- Saizarbitoria 2011). Decertification means not renewing the certification, although this does not always mean abandoning the managerial practices implemented (Alcalà 2013). This latter phenomenon is increasing its importance, and ISO covers withdrawals in its survey (ISO 2013).
M. Bernardo and A. Simon
117
Another aspect that should also be considered in this analysis is how organizations manage the multiple management systems implemented. Two main possibilities arise: separated or integrated. The former means managing the different function-specific MSs, paying no attention to their similarities, whereas the latter means man-aging all of them as a unique and more efficient MS that benefits from the existing synergies among them (Douglas and Glen 2000; Karapetrovic and Casadesús 2009; Karapetrovic and Willborn 1998; Rocha et al. 2007).
Therefore, considering all the aspects related to the adoption of MSSs, the aim of this paper is to analyze, through a literature review, the implementation of several MSs and its sustainable management. Three main scenarios and their outcomes are analyzed: (1) organizations implement MSs but do not certify them, (2) organiza-tions implement MSs and certify them, and (3) organizations may or may not imple-ment additional management systems but do internalize their requirements.
The structure of the chapter is as follows. After this introduction, the methodol-ogy for the literature review is presented. Then, the main conclusions of the sce-narios proposed are discussed.
9.2 Methodology
The paper conducts a literature review to identify the several scenarios firms may face related to the implementation of several MSs and their sustainable manage-ment. We decided to conduct a systematic literature review to find information from various research articles that shed light on each of these possible scenarios. Therefore, in this literature review, theoretical and empirical studies related to the implementation process of several standards are reviewed.
9.2.1 Literature Search Strategy
Relevant papers were identified through a computer search from two databases: Scopus and ISI Web of Science. The search strategy used was to identify papers with “ISO 9001” or “ISO 14001” and that contained “decertification”, “internaliza-tion”, and “diffusion” as main subject headings or text words in the title or the abstract of the paper. Papers published in all years were considered.
9.2.2 Selection of Articles for Review
Our literature search identified 289 references. Their titles, abstracts and text were reviewed in detail by the two authors for relevance to the study. We thus conducted a research literature review, contrasting it with more subjective examinations of the
9 Implementing Multiple Management Systems: Is It Sustainable?

118
recorded information. Papers were included if they contained reference to the differ-ent scenarios regarding MSs namely diffusion, decertification and internalization. Only 56 empirical papers met the inclusion/exclusion criteria for review. Consequently, these papers were identified and reviewed regarding the different scenarios of MSs implementation.
9.3 Literature Review
The literature review is divided into the three scenarios proposed, namely: decerti-fication, diffusion and internalization.
9.3.1 Decertification
As far as we know, the issue of decertification has been not studied up to now, and we have not found any papers that cover this topic. Only the doctoral work of Alcalà (2013) offers an exploratory approximation of this issue. Other authors have mainly reviewed the tendencies of the certificates, their diffusion, and the benefits and dif-ficulties of certification as related topics (see, e.g., Marimon et al. 2009; Bernardo et al. 2012; Simon et al. 2012) but have done so without specifically investigating why firms might actually want to leave or are abandoning the certificates.
There are several studies that suggest that MSSs such as ISO 9001 or ISO 14001 have stagnated and that the number of certifications is declining (ISO 2013). Some countries are observing how the certification numbers slowdown, whereas others are experiencing a saturation effect (Marimon et al. 2009). Many companies have not decertified, but they raise doubts about the future of certification and mainly continue to be certified for external reasons (image, clients requirements). According to Alcalà (2013), there are four possible scenarios when a firm faces the renewal of its certificates. First, there are firms that explore decertification or will do decertify in the short term. Second, there are firms that already have abandoned their certifi-cates. The third scenario includes the companies that have two MSs but have not certified one or both of them. Finally, the organizations that have the certificates and want to keep them.
Several authors have uncovered the possible causes for decertification, which include the following:
– Not passing the corresponding audit (Marimon et al. 2009). – Lack of administration support (Casadesus et al. 2001; Heras and Casadesus
2006). – Level of certification intensity of a country (Corbett and Kirsch 2001) or sector
(Franceschini et al. 2004; Marimon et al. 2009).
M. Bernardo and A. Simon

119
The empirical study of Alcalà (2013) of case studies of companies in the paper sector uncovers several results regarding the decertification phenomenon. First, many companies keep their certificates due to stakeholder pressure. Second, one of the most important reasons for renewing the certifications is the improvement of the organization’s image in front of its clients and other stakeholders. There are mixed results regarding the maintenance of the certificates to improve the firm’s competi-tive advantage. Although this phenomenon appears to be true for the ISO 14001 certificate, it is not a motivation for ISO 9001 in the sample of companies of this study. Similarly, the implementation and renovation costs condition the renewal of ISO 9001 but do not appear to affect ISO 14001.
In conclusion, for the two most diffused MSSs worldwide, there appears to be a stagnation in the certification renewals due to different causes. However, with other existing MSSs and standards, research is needed to determine whether this phenom-enon will continue and replicate in the future.
9.3.2 Diffusion
The diffusion of ISO 9001 and ISO 14001 has been widely studied in the literature. As commented previously, diffusion can be studied from three different points of view: factors, scope and model.
Diffusion factors refer to those aspects conditioning or easing the diffusion of these two MSSs. Berliner and Prakash (2013) found that bilateral export and invest-ment in countries with poor regulatory government pressure companies to adopt ISO 14001 (see also Delmas and Montiel 2008; Perkins and Neumayer 2010). In addition, Delmas and Montes-Sancho (2011) found the impact to be significant in the early phases of the adoption. Adopting a wider scope, Qi et al. (2011) analyzed the stakeholders’ roles in the diffusion of ISO 14001 in China, finding a significant relationship among foreign customers and community stakeholders but not with organizational stakeholders. Direct foreign investment is another aspect considered as a factor. For example, in Prakash and Potoski (2007), the authors conclude that home countries’ investors with higher levels of ISO 14001 implementation are related with higher levels of the standard in the host country. The same authors also found similar evidence considering export markets (Prakash and Potoski 2006).
The diffusion scope concerns the geographical scope, i.e., if the analysis is per-formed at an international, national or sectoral level. For example, Bodas Freita and Iizuka (2012) compared the diffusion of ISO 9001 and ISO 14001 in different scopes and found that diffusion is significant at the country and industry levels. This framework is usually analyzed together with the diffusion model generally accepted to be the S-curve model. Several studies propose different stages in the evolution of MSSs (see, e.g., Casadesus et al. 2008; Sampaio et al. 2011b): (1) the initial stage, in which the adoption is applied by few companies; (2) the growth stage, in which the great majority of organizations implement the MSS; (3) the saturation stage, in which almost all organizations have the MSSs in place and (4) the decline stage, in
9 Implementing Multiple Management Systems: Is It Sustainable?

120
which the organizations decertify, i.e., not renew the certificate. Casadesus et al. (2008) analyzed the different diffusion stages for ISO 9001 and ISO 14001 at the global level, finding that more mature countries in terms of MSSs adoption are in the third and fourth stages. Similar to this but considering the sectors of activity, Marimon et al. (2011) analyzed the diffusion of ISO 14001 at the worldwide level, finding differences in the evolution stage among sectors. In Llach et al. (2011) the analysis and results were the same, but ISO 9001 certificates were considered. Three groups of sectors categorized by the possible evolution of certificates were identi-fied. The model was also analyzed in comparing ISO 9001 diffusion and sectoral MSSs, as in Casadesus et al. (2010) and Alonso-Almeida et al. (2013), to analyze the tourism sector in Spain.
In conclusion, the different stages of diffusion of MSSs are leading to decertifi-cation and the implementation sectoral standards more focused on organizations’ activities (Llach et al. 2011; Alonso-Almeida et al. 2013).
9.3.3 Internalization
Due to the diffusion of ISO 9001, ISO 14001 and similar standards, the academic research on their implementation is wide; however, little is known on the practical differences existing in their adoption (Nair and Prajogo 2009). The implementation of MSSs, such as ISO 9001 or ISO 14001, has led some authors to consider whether this implementation has been a homogeneous process among companies. The adop-tion of MSSs and their certification may be a means of obtaining higher business performance (Heras-Saizarbitoria 2011). However, there is mixed evidence from the results that companies obtain from certification (Casadesus and Karapetrovic 2005; Casadesus et al. 2008). These differences may result from degree of the MSs’ internalization (Heras-Saizarbitoria 2011). In this line, Briscoe et al. (2005) state that if the complex adoption process of the MSs and its certification are not internal-ized properly, the benefits on company performance could be hindered.
A good definition of internalization is provided by Qi et al. (2013), who define it as “the process that consolidates and embeds a firm’s beliefs, attitudes, and values into its management and employees”. Ataseven et al. (2014) define it as confor-mance or compliance to requirements of a standard of practice but also as a process of building capital, which would provide a competitive advantage to organizations. For their part, Llorens-Montes and Ruiz-Moreno (2005) complement this defini-tion, adding that it provides benefits to the company by selecting workers capable of following the rules and by embedding jobs in hierarchical structures that socialize workers, monitor behavior, etc.
There are different terms in the literature that describe the implementation pro-cess of the MSs and its linkage to the firms’ performance (Nair and Prajogo 2009; Castka and Prajogo 2013). The issue is referred to as “rigorous compliance” (Boiral 2007), “maintenance” of certifications (Balzarova and Castka 2008), “daily usage” of ISO 9001 (Naveh and Marcus 2004), “substantive versus symbolic adoption”
M. Bernardo and A. Simon

121
(Christmann and Taylor 2006), “integration” (Boiral and Roy 2007), “depth of implementation” (Jang and Lin 2008) or “level of adoption” (Lee et al. 2009). Finally, authors such as Briscoe et al. 2005; Nair and Prajogo (2009), Heras- Saizarbitoria (2011), Heras and Boiral (2013) or Tarí et al. (2013) refer to “internal-ization”, with which they describe a higher, more rigorous or more active fulfillment of the requirements of the systems. According to the authors’ conceptualization of internalization, companies should actively understand and use the MS practices to modify the organization’s behavior and decision-making processes (Nair and Prajogo 2009). These practices include employee training, acquainting employees with the company’s quality policy and practices, establishing the documentation required by the standards as well as updating them, maintaining daily practices to meet the documented procedures based on the MS’ requirements; and, finally, con-ducting internal audits to regularly improve the processes (Nair and Prajogo 2009).
This last term has been gaining more attention in the literature (e.g., Briscoe et al. 2005; Nair and Prajogo 2009; Prajogo 2011; Heras-Saizarbitoria 2011), espe-cially for the case of the internalization of ISO 9001, the most diffused standard worldwide (ISO 2013). However, due to the similarities between ISO 9001 and ISO 14001 (the other prominent global meta-standard, which shares many similarities in terms of structure, techniques and principles with ISO 9001 (Heras and Boiral 2013), the same principles of internalization may be applied to the latter standard, as several recent studies focusing on the internalization of ISO 14001 have done (Qi et al. 2012; Castka and Prajogo 2013).
In this direction, the recent work of Heras-Saizarbitoria (2011) and Heras and Boiral (2013) shed some light on the differences in adoption levels of the standards. The authors find in their exploratory analysis of the internalization of ISO 9001 that “the standard tends to be adopted in organizations in such a way as to be adapted to the various needs and internal contingencies of the organizations”. For their part, Boiral (2003, 2007) and Christmann and Taylor (2006) find a discrepancy between written documentation and daily practices, whereas Boiral (2007) finds that the internalization rationale depends on institutional pressures and internal involve-ment. Other authors find that internal drivers motivate the level of adoption (Boiral and Amara 2009; Jang and Lin 2008; Yin and Schmeidler 2009), whereas some focus on the relationship between internalization and performance (Nair and Prajogo 2009). In general, the authors conclude that there is a heterogeneous internalization of ISO 9001 and ISO 14001 standards (Boiral 2007; Christmann and Taylor 2006; Heras-Saizarbitoria 2011; Yin and Schmeidler 2009).
Some authors question the fact that internalization leads to better results, this being a recent line of research in the field (Nair and Prajogo 2009). A partially con-tradictory conclusion is reached by all these studies that firms achieve better results if the requirements of certifications are internalized (Nair and Prajogo 2009; Heras and Boiral 2013). However, the factors that facilitate the positive effects of internal-ization are not evident, and the diversity in the adoption of MSs requires thorough examination (Tarí et al. 2013).
To identify the factors that affect the outcomes of MS adoption, some studies have delved into studying how the variation in the implementation of ISO 9001 and
9 Implementing Multiple Management Systems: Is It Sustainable?

122
ISO 14001 may provide different benefits to companies (Huarng et al. 1999; Jones and Arndt 1997; Naveh and Marcus 2004; Lee et al. 2009).
Qi et al. (2013) propose two sources of motivations related to obtaining the great-est benefits perceived by companies that implement and become certified. The authors distinguish between internal and external motivations, which lead to differ-ent performance outcomes. Some authors have argued that that companies that implement and certify MS due to internal motives obtain better results than those that implement it only for external reasons, both in the case of ISO 9001 (Boiral and Roy 2007) and in the case of ISO 14001 (Heras et al. 2008). Furthermore, recent studies have established that benefits of internalization driven by internal factors are greater than those for types of implementation associated with external sources of motivation (Christmann and Taylor 2006; Boiral and Roy 2007; Jang and Lin 2008; Nair and Prajogo 2009).
In conclusion, the decision to adopt and internalize MSSs is constrained by both external pressure and internal motivation (Boiral 2001; Johnstone and Labonne 2009). Different combinations of the internal and external motivations lead to firms’ heterogeneous implementation strategies (Qi et al. 2013). Firms may also choose to integrate their MSSs into a single one to increase their efficiency and profit from their synergies (Simon et al. 2012). In addition, if firms have internalized the prac-tices required by the standards, they may choose not to certify against the standards, as the benefits from implementing the processes internally will be the same.
9.4 Conclusions
The aim of this paper is to analyze, through a literature review, the implementation of several MSs and their sustainable management. Three main scenarios and their outcomes are analyzed: (1) decertification (2) diffusion and (3) internalization.
The decertification scenario describes organizations implementing MSs but not renewing certification. This scenario tends to result in sectoral MS implementation, both certifiable and not.
The diffusion scenario describes organizations implementing and certifying MSs. The different diffusion stages defined are closely linked to the previous scenario.
In the internalization scenario, organizations may or may not implement addi-tional management systems, but they do internalize their requirements.
All three scenarios are related. Organizations may implement and certify MSSs to improve their efficiency, among other benefits. When companies implement MSs, they may do so superficially, only to obtain the certificate (mainly driven by external motivations or market pressures), or they may try to gain the greatest pos-sible benefit to improve their internal organization (mainly because their implemen-tation is based on internal motivations). In this situation, the latter company is internalizing the requirements of the MSSs, and the degree of internalization or making the practice becoming a routine may differ among companies.
M. Bernardo and A. Simon

123
When the organization perceives that having the certificate is no longer provid-ing a competitive advantage (i.e., it is in the saturation stage of diffusion), it may decide not to renew the certificate and invest the money saved in implementing and certifying in another MS that may give it the opportunity to differentiate itself from competitors. In such a case, the organization is decertifying (in the decline phase of diffusion). This situation does not imply that the organization is abandoning the MS; rather, it may have internalized the MS.
Regardless of whether certification is held, managing these MSs within the organization may be accomplished by integrating the MSs into a single and more efficient MS.
The implications of this research are for both practitioners and academia. The former group benefits because this research may help certification and stan-dardization bodies to promote and publish standards that best fit with organizations’ needs. In addition, consultants may use these findings to train companies to inter-nalize the MSs to profit from their implementation. For organizations, it is impor-tant to consider these possibilities, as doing so may help to improve their management and ensure their sustainable future. Academics may find in the three scenarios a set of contexts ripe for analysis to increase knowledge on this issue. According to the literature review presented here, decertification is the scenario the least analyzed. Identifying a decertification pattern will be the base for future research.
Finally, the main limitations of this study are the selection criteria used to find previous studies and the availability of these studies.
References
Albuquerque P, Bronnenberg B, Corbett C (2007) A spatiotemporal analysis of the global diffusion of ISO 9000 and ISO 14000 certification. Manag Sci 53(3):451–468
Alcalá M (2013) Tendències dels sistemes de gestió estandaritzats: elcas del sector paperer, Universitat de Girona, p 467
Alonso-Almeida MM, Marimon F, Bernardo M (2013) Diffusion of quality standards in the hospi-tality sector. Int J Oper Prod Manag 33(5):504–527
Ataseven C, Prajogo DI, Nair A (2014) ISO 9000 internalization and organizational commitment—implications for process improvement and operational performance. IEEE Trans Eng Manag 61(1):1–5
Balzarova MA, Castka P (2008) Underlying mechanisms in the maintenance of ISO 14001 environmental management system. J Clean Prod 16(18):1949–1957
Berliner D, Prakash A (2013) Signaling environmental Stewardship in the shadow of weak gover-nance: the global diffusion of ISO 14001. Law Soc Rev 47(2):345–373
Bernardo M, Casadesús M, Karapetrovic S, Heras I (2012) Do integration difficulties influence management system integration levels? J Clean Prod 21(1):23–33
Bodas Freita IM, Iizuka M (2012) Openness to international markets and the diffusion of standards compliance in Latin America. A multi level analysis. Res Policy 41(1):201–215
Boiral O (2001) ISO 14001 certification in multinational firms: the paradoxes of integration. Glob Focus 13(1):79–94
Boiral O (2003) ISO 9000, outside the iron cage. Organ Sci 14(6):720–737Boiral O (2007) Corporate greening through ISO 14001: a rational myth? Organ Sci 18(1):
127–146Boiral O, Amara N (2009) Paradoxes of ISO 9000 performance: a configurational approach. Qual
Manag J 16(3):36–60
9 Implementing Multiple Management Systems: Is It Sustainable?

124
Boiral O, Roy MJ (2007) ISO 9000: integration rationales and organizational impacts. Int J Oper Prod Manag 27(2):226–247
Briscoe JA, Fawcett SE, Todd RH (2005) The implementation and impact of ISO 9000 among small manufacturing enterprises. J Small Bus Manag 43(14):309–30
Casadesus M, Karapetrovic S (2005) The erosion of ISO 9000 benefits: a temporal study. Int J Qual Reliab Manag 22(2):120–36
Casadesus MG, Leal G, Heras I (2001) Benefits of ISO 9000 implementation in Spanish industry. Eur Bus Rev 13(6):327–335
Casadesus M, Marimon F, Heras I (2008) ISO 14001 diffusion after the success of the ISO 9001 model. J Clean Prod 16(16):1741–1754
Casadesus M, Marimon F, Alonso M (2010) The future of standardised quality management in tourism: evidence from the Spanish tourist sector. Serv Ind J 30(14):2457–2474
Castka P, Prajogo D (2013) The effect of pressure from secondary stakeholders on the internaliza-tion of ISO 14001. J Clean Prod 47(May):245–252
Christmann P, Taylor G (2006) Firm self-regulation through international certifiable standards: determinants of symbolic versus substantive implementation. J Int Bus Stud 37(6):863–883
Corbett CJ, Kirsch DA (2001) International diffusion of ISO 14000 certification. Prod Oper Manag 10(3):327–342
Delmas M (2002) The diffusion of environmental management standards in Europe and in the United States: an institutional perspective. Policy Sci 35(1):91–119
Delmas M, Montes-Sancho MJ (2011) An institutional perspective on the diffusion of interna-tional management system standards: the case of the environmental management standard ISO 14001. Bus Ethics Q 21(1):103–132
Delmas M, Montiel I (2008) The diffusion of voluntary international management standards: responsible care, ISO 9000, and ISO 14001 in the chemical industry. Policy Stud J 36(1): 65–93
Douglas A, Glen D (2000) Integrated management systems in small and medium enterprises. Total Qual Manag 11(4):686–690
Escapa C (2004) Motivations and Barriers of Implementing an EMS in Spanish Organizations. Thesis presented in part-fulfillment of the degree of Master of Science in accordance with the regulations of the University of East Anglia School of Environmental Sciences, University of East Anglia, University Plain, Norwich, August 2004
Franceschini F, Galetto M, Gianni G (2004) A new forecasting model for the diffusion of ISO 9000 standard certifications in European countries. Int J Qual Reliab Manage 21(1):32–50
Guoyou Q, Saixing Z, Xiaodong L, Chiming T (2012) Role of internalization process in defining the relationship between ISO 14001 Certification and corporate environmental performance. Corp Soc Responsib Environ Manag 19(3):129–140
Heras I, Boiral O (2013) ISO 9001 and ISO 14001: towards a research agenda on management system standards. Int J Manag Rev 15(1):47–65
Heras I, Casadesus M (2006) Los estándares internacionales de sistemas de gestión: pasado, pre-sente y futuro. Boletín ICE - Revista del Ministerio de Industria, Turismo y Comercio 2876: 45–61
Heras I, Arana GD, de Junguitu A, Espí M, Molina JF (2008) Los SGM y la competitividad de las empresas de la CAPV. Instituto Vasco de Competitividad, San Sebastián
Heras-Saizarbitoria I (2011) Internalization of ISO 9000: an exploratory study. Ind Manag Data Syst 111(8):1214–1237
Huarng F, Horng C, Chen C (1999) A study of ISO 9000 process, motivation and performance. Total Qual Manag 10(7):1009–1025
ISO (2013) The ISO survey of certifications–2012. International Organisation for Standardization, Geneva, Switzerland
Jang W, Lin C (2008) An integrated framework for ISO 9000 motivation, depth of ISO implemen-tation and firm performance. The case of Taiwan. J Manuf Tech Manag 19(2):194–216
Johnstone N, Labonne J (2009) Why do manufacturing facilities introduce environmental management systems? Improving and/or signaling performance. Ecol Econ 68(3):719–730
M. Bernardo and A. Simon

125
Jones R, Arndt G (1997) ISO 9000 among Australian companies: impact of time and reasons for seeking certification on perceptions of benefits received. Int J Qual Reliab Manag 14(7): 650–660
Karapetrovic S, Casadesús M (2009) Implementing environmental with other standardized management systems: scope, sequence, time and integration. J Clean Prod 17(5):533–540
Karapetrovic S, Willborn W (1998) Integration of quality and environmental management systems. TQM Mag 10(3):204–213
Kaziliūna A (2010) Impacts of different factors on the implementation of quality management systems and performance outcomes. Curr Iss Bus Law 2:75–92
Lee PKC, To WM, Yu BTW (2009) The implementation and performance outcomes of ISO 9000 in service organizations. Int J Qual Reliab Manag 26(7):646–662
Llach J, Marimon F, Bernardo M (2011) ISO 9001 diffusion analysis according to activity sectors. Ind Manag Data Syst 111(1–2):298–316
Llorens-Montes FJ, Ruiz-Moreno A (2005) Self-implementation of ISO 9001 versus external support: an examination in laboratories involved in chemical measurement. Accred Qual Assur 10(6):304–307
Marimon F, Heras I, Casadesus M (2009) ISO 9000 and ISO 14000 standards: A projection model for the decline phase. Total Qual Manag Bus Excel 20(1):1–21
Marimon F, Llach J, Bernardo M (2011) Comparative analysis of diffusion of the ISO 14001 standard by sector of activity. J Clean Prod 19(15):1734–1744
Nair A, Prajogo D (2009) Internalisation of ISO 9000 standards: the antecedent role of functional-ist and institutionalist drivers and performance implications. Int J Prod Res 47(16):4545–4568
Naveh E, Marcus AA (2004) When does the ISO 9000 quality assurance standard lead to perfor-mance improvement? Assimilation and going beyond. IEEE Trans Eng Manag 51(3):352–363
Perkins R, Neumayer E (2010) Geographic variations in the early diffusion of corporate voluntary standards: comparing ISO 14001 and the global compact. Environ Plan 42(2):347–365
Prakash A, Potoski M (2006) Racing to the bottom? Trade, environmental governance, and ISO 14001. Am J Polit Sci 50(2):350–364
Prakash A, Potoski M (2007) Investing up: FDI and the cross-country diffusion of ISO 14001 management systems. Int Stud Q 51:723–744
Prajogo D (2011) The roles of firms’ motives in affecting the outcomes of ISO 9000 adoption. Int J Oper Prod Manage 31(1):78–100
Qi GY, Zeng SX, Tam CM, Yin HT, Wu JF, Dai ZH (2011) Diffusion of ISO 14001 environmental management systems in China: rethinking on stakeholders’ roles. J Clean Prod 19(11): 1250–1256
Qi G, Zeng S, Yin H, Lin H (2013) ISO and OHSAS certifications: how stakeholders affect corpo-rate decisions on sustainability. Manage Dec 51(10):1983–2005
Rocha M, Searcy C, Karapetrovic S (2007) Integrating sustainable development into existing management systems. Total Qual Manag Bus Excel 18(1):83–92
Sampaio P, Saraiva P, Guimaraes-Rodrigues A (2010) A classification model for prediction of certification motivations from the contents of ISO 9001 audit reports. Total Qual Manag 21(12):1279–1298
Sampaio P, Saraiva P, Guimaraes-Rodrigues A (2011a) The economic impact of quality manage-ment systems in Portuguese certified companies. Empirical evidence. Int J Qual Reliab Manag 28(9):929–950
Sampaio P, Saraiva P, Rodrigues AG (2011b) ISO 9001 certification forecasting models. Int J Qual Reliab Manag 28(1):5–26
Simon A, Karapetrovic S, Casadesús M (2012) Difficulties and benefits of integrated management systems. Ind Manag Data Syst 112(5):828–846
Specchiarello M, Giagnorio M (2009) An appraisal of quality standards diffusion in the national economic system. J Commod Sci Technol Qual 48(2):155–176
Tarí JJ, Heras I, Pereira J (2013) Internalization of quality management in service organizations. Manag Serv Qual 23(6):456–473
Yin H, Schmeidler PJ (2009) Why do standardized ISO 14001 environmental management systems lead to heterogeneous environmental outcomes? Bus Strateg Environ 18(7):469–486
9 Implementing Multiple Management Systems: Is It Sustainable?

127M. Peris-Ortiz and J. Álvarez-García (eds.), Action-Based Quality Management: Strategy and Tools for Continuous Improvement, DOI 10.1007/978-3-319-06453-6_10,© Springer International Publishing Switzerland 2014
Abstract Total Quality Management (TQM) is a management philosophy focused on customer satisfaction and continuous improvement, and positively related to organizational performance. TQM implementation programs sometimes fail, caus-ing a loss of resources, distrust in top management and a lack of the outcomes expected. This chapter examines the relationship between the implementation of Critical Success Factors and Business performance. For a better understanding, we have divided these factors into three constructs, hypothesizing causal relationships between them and how they affect business performance. We use data collected from a sample of 113 Spanish organizations. Three hypotheses were tested simulta-neously using Partial Least Squares, a variance-based Structural Equation Modeling technique. The results support the existence of a mediating role played by imple-mentation factors in ties between enablers and instrumental factors. Our research fi ndings provide practical insights for managers in order to prioritize those critical factors on which they focus their actions to enhance business performance.
10.1 Introduction
The study of Critical TQM Success Factors (CSFs) has been approached from vari-ous perspectives and methodologies. Rigorous attempts to identify them come from authors such as Saraph et al. ( 1989 ), Flynn et al. ( 1994 ), Powell ( 1995 ), Black and
Chapter 10 The Impact of TQM Critical Success Factors on Business Performance. The Mediating Role of Implementation Factors in Linking Enabler and Instrumental Factors
Francisco J. Carmona-Márquez , Antonio G. Leal-Millán , Adolfo E. Vázquez- Sánchez , and Antonio L. Leal-Rodríguez
F. J. Carmona-Márquez (*) • A. E. Vázquez-Sánchez Departamento de Administración de Empresas y Marketing , Universidad de Sevilla , Avda. Ramón y Cajal , Seville 41018 , Spain e-mail: [email protected]; [email protected]; [email protected]
A. L. Leal-Rodríguez • A. G. Leal-Millán Departamento de Organización de Empresas , Universidad Loyola Andalucía , 1, Energía Solar , Sevilla 41014 , Spain e-mail: [email protected]

128
Porter ( 1996 ), Ahire et al. ( 1996 ), Grandzol and Gershon ( 1998 ), Dow et al. ( 1999 ) and Rahman ( 2001 ). CSFs can be defi ned as the critical areas of managerial plan-ning and action that must be fostered in order to achieve effective quality manage-ment within a business unit, ensuring its successful implementation (Saraph et al. 1989 ; Zairi and Leonard 1994 ). CSFs are what organizations must accomplish in order to achieve their mission, according to the examination and categorization of their impacts (Oakland 1995 ).
Plenty of authors have used different sets of factors. Black and Porter ( 1996 ) applied the Malcolm Baldrige Award criteria. Tamimi and Gershon ( 1995 ) devel-oped an instrument to measure quality management practices adapted from Deming’s approach. Ahire et al. ( 1996 ) proposed a set of quality management strategies derived from the literature. Many others, according to Talib and Rahman ( 2010 ), have selected different sets of factors (Fotopoulos and Psomas 2009 ; Lenka and Suar 2008 ; Rahman and Siddiqui 2006 ; Yusuf et al. 2007 ). This study proposes a model within which three distinct constructs have been identifi ed. These three constructs gather the different CSFs according to their features and specifi cations. Therefore, we have distinguished the following clusters: enabler factors, implementation fac-tors and instrumental factors and have developed a brief theoretical statement (Table 10.1 ) concerning the different factors to be considered in the present study.
TQM practices have brought many benefi ts to the organizations that have suc-cessfully adopted them (Douglas and Judge 2001 ; Rahman and Sohal 2002 ).
Table 10.1 TQM factor classifi cation
Constructs Critical success factors Studies
Enabler factors 1. Top Management commitment and leadership
Ahire et al. ( 1996 ), Flynn et al. ( 1994 ), Rao et al. ( 1999 ), Saraph et al. ( 1989 ), Waldman ( 1994 ), Khanna et al. ( 2011 ), Roldán et al. ( 2012 )
2. TQM philosophy adoption
Black and Porter ( 1996 ), Powell ( 1995 ), Roldán et al. ( 2012 )
Implementation factors
3. Customer involvement Black and Porter ( 1996 ), Flynn et al. ( 1994 ), Waldman ( 1994 ), Khanna et al. ( 2011 )
4. Supplier involvement Ahire et al. ( 1996 ), Flynn et al. ( 1994 ), Powell ( 1995 ), Rao et al. ( 1999 ), Saraph et al. ( 1989 ), Waldman ( 1994 )
5. Open and fl exible structure
Black and Porter ( 1996 ), Powell ( 1995 ), Khanna et al. ( 2011 )
6. Employee education and training
Ahire et al. ( 1996 ), Powell ( 1995 ), Rao et al. ( 1999 ), Waldman ( 1994 ), Agus ( 2005 ), Sadikoglu and Zehir ( 2010 )
7. Empowerment Ahire et al. ( 1996 ), Powell ( 1995 ), Waldman ( 1994 ), Chung ( 1999 )
Instrumental factors
8. Benchmarking Ahire et al. ( 1996 ), Powell ( 1995 ), Rao et al. ( 1999 ), Waldman ( 1994 ), Boone and Wilkins ( 1995 )
9. Process improvements Flynn et al. ( 1994 ), Powell ( 1995 ), Rao et al. ( 1999 ), Fuentes et al. ( 2006 )
10. Zero-defects mentality Black and Porter ( 1996 ), Powell ( 1995 ), Agus ( 2005 )
F.J. Carmona-Márquez et al.

129
According to Ahire et al. ( 1996 ) and Powell ( 1995 ), TQM not only increases competitiveness, it also improves organizational and business performance. York and Miree ( 2004 , p. 292) go further and argue: “doing the right thing, and doing it more effi ciently, should have a positive effect on many measures of fi nancial perfor-mance of the fi rm”. Many other research studies have sustained the link between an effective implementation of TQM and fi nancial performance improvement (Christiansen and Lee 1994 ; Easton and Jarrell 1998 ; Flynn et al. 1996 ; Hendricks and Singhal 1997 ; Ittner and Larcker 1996 ).
However, many other authors have discussed the failure of the TQM model, point-ing out causes due to implementation rather than shortcomings in TQM contents (Gurnani 1999 ; Harari 1993 ; Krumwiede and Lavelle 2000 ; Thiagaragan et al. 2001 ; Mohamed Zairi 1996 ). There is no consensus on the reasons that cause failures in TQM implementation. This situation drives organizations to waste resources, not achieving the results desired and, occasionally, leading them to abandoning the imple-mentation and progress of the TQM philosophy (Idris and Zairi 2006 ; Rahman 2001 ).
The purpose of this study is to empirically investigate the relationships existing between critical TQM success factors with the aim of prioritizing their successful implementation. Identifying cause and effect relationships between them may allow managers not to neglect the order of implementation to achieve the fi rm’s expected performance. To accomplish this, we cluster the factors by means of the three above- mentioned constructs. Their relationships are assessed through the use of Partial Least Squares (PLS), a variance-based structural equation modeling technique applied to a sample of 113 Spanish organizations with experience in implementing a TQM program.
This paper is organized as follows. Section 10.2 includes the research model and hypotheses of the study. Here we set out the relationship between the enablers and instrumental factors. Then we propose a mediating relationship performed by the implementation factors in the link between the enablers and instrumental factors. This section concludes with the assessment of the relationship between instrumental factors and business performance. Section 10.3 introduces the methodology applied, data collection and samples as well as the measures and data analysis. Section 10.4 summarizes the results of both the measurement model and the structural model, while Sect. 10.5 presents the discussion, practical implications and limitations.
10.2 Research Model and Hypotheses
10.2.1 From Enabler Factors to Instrumental Factors
There is a great deal of literature concerning the main features or strategic elements that lead to the successful implementation of the TQM program in fi rms. A review of the literature suggests, in fact, that a great many factors can be considered criti-cal. Nevertheless, few attempts have been made to establish some sort of order or hierarchy among these factors. In a recent study, Salaheldin ( 2009 ) distinguished a
10 The Impact of TQM Critical Success Factors on Business Performance.…

130
set of what he labelled “Critical success factors of TQM practices”. These critical success factors can be seen as those aspects that must go well to guarantee the suc-cessful implementation of the TQM program in a fi rm. In another relatively recent work, Llorens Montes et al. ( 2003 , p. 195) argue that the main TQM elements “will always be guidelines to appraise the effectiveness of a TQM programme following implementation. Company results will differ depending on the successful imple-mentation of said elements. Nevertheless, these elements have different degrees of importance in terms of their fi nal contribution to the results”.
The present study identifi es enabler factors with a construct that is shaped by top management commitment and leadership and by the extent to which TQM philoso-phy is effectively adopted by the fi rm. Many studies identify the role of top manage-ment as a key factor for TQM success. In this sense, Ahire et al. ( 1996 ) asserts the importance of top management commitment. Anderson et al. ( 1995 ) labelled this as “visionary leadership”; and Flynn et al. ( 1995 ) defend top management support. Top management commitment and leadership require an unconditional and active defense of quality principles, complete involvement with the TQM program, and an effi cient communication of this attitude.
When this paper refers to top management leadership, it means “visionary lead-ership”, more closely linked to a transformational rather than a transactional leader-ship style. This style of leadership implies top management that is able to defi ne, apply and communicate the long-term vision of the fi rm, and motivate all employ-ees to accept this vision and commit themselves to it. In a total quality management focus, it is essential for defi ning and communicating and motivating this philosophy to be the role of senior managers.
On the other hand, TQM is not an activity in which fi rms can involve themselves easily. Conversely, it requires a critical change in organizational mentality and pro-cedures—in short, a new way of managing and working. An effective adoption of the TQM philosophy and principles also seems to be of signifi cant relevance. According to Roldán et al. ( 2012 , p. 124), “some researchers have begun to explore TQM as a cultural phenomenon rather than as a set of tools and techniques”. TQM philosophy adoption deals with the extent to which quality doctrine and principles are embedded within the values, mission and vision of the company. Performing as candidates for business excellence or quality awards such as the EFQM award is a good symptom of a properly adopted TQM philosophy.
It seems essential that, in order to foster quality improvement practices such as benchmarking, process improvement and zero-defects mentality, the fi rm’s orienta-tion toward and support of total quality management become crucial. A fi rm will be more oriented to this set of instrumental factors if there is a high degree of commit-ment and leadership from senior managers, and the TQM philosophy is well impreg-nated in all the fi rm’s culture, strategies and procedures. Hence, we propose the following fi rst hypothesis (Fig. 10.1 ).
H1: Top management commitment and TQM philosophy adoption (enabler factors) are positively related to benchmarking, process improvement and zero-defects men-tality (instrumental factors).
F.J. Carmona-Márquez et al.

131
10.2.2 The Mediating Role of Implementation Factors in the Link Between Enabler Factors and Instrumental Factors
According to Sila and Ebrahimpour ( 2005 ), TQM key factors are considered best practices that fi rms and employees ought to follow in order to effectively foster quality. As discussed above, facilitating factors such as top management commit-ment and the adoption of TQM philosophy have a positive direct relationship with what we called instrumental factors (benchmarking, process improvement and zero- defects mentality).
Salaheldin’s ( 2009 ) study aimed to investigate the relationship presented between TQM critical success factors and organizational performance. To this end, this study did not only operationalize these factors in terms of their importance, but also in terms of the relative importance associated with or given to each one. In this sense, this author distinguishes between “strategic factors”, “tactical factors” and “opera-tional factors”. The fi rst subset of CSFs includes factors such as top management commitment, organizational culture, leadership or quality goals and policy. The sec-ond group contains the following factors: employee involvement and empower-ment, supplier involvement, employee training and instruction, teambuilding and problem-solving. Finally, the third subset has factors such as product and service design, process control or resource conservation and utilization.
As can be appreciated, there is a remarkable similarity between the groups of TQM success factors proposed in this paper and those suggested by Salaheldin ( 2009 ). Firstly, what this author labels as strategic factors includes most of the issues that we identify as enabler factors. Secondly, his tactical factors are made up of the factors which we include in our framework as instrumental factors. Finally, the set of elements that we included in a group called instrumental factors is very similar to the author’s operational factors subset.
H2: The relationship between enabler factors and instrumental factors is positively mediated by implementation factors (Fig. 10.1 ).
Fig. 10.1 Research model and hypotheses
10 The Impact of TQM Critical Success Factors on Business Performance.…

132
10.2.3 The Relationship Between Instrumental Factors and Business Performance
Above, we have discussed the impact of facilitators or enabler factors as well as the mediator role of the set of factors linked to the TQM program implementation. Finally, we will assess the nature of the relationship between the TQM program and business results.
Several studies have addressed the issue concerning the link between TQM factors and business results. Sila and Ebrahimpour ( 2005 ) suggest that the outcome of these studies deals with the possibility of detecting which TQM factors have a positive impact on business results, to therefore recommend to managers the factors that should be more thoroughly implemented. Kaynak ( 2003 ) found that TQM has a positive infl uence on both fi nancial and market performance through operational performance. Matsui ( 2002 ) posited in turn that TQM plays a signifi cant role while determining the competitive performance of manufacturing fi rms. According to Das et al. ( 2000 ), TQM practices are strongly linked to customer satisfaction, and hence, to business performance.
Within this section we will address a set of issues that we label as instrumental factors. These factors are benchmarking, process improvement and zero-defects mentality. These instrumental factors are the most visible and operative part of the TQM program and constitute the driving force of its constant improvement and enhancement. Most authors who have addressed this topic coincided in positing the existence of a positive relationship between the TQM program implementation and fi rm performance and results.
Following what Richman and Zachary ( 1993 , p. 3) proposed, “setting a goal of zero defects and continuing to renew one’s commitment to moving ever closer toward that goal will lead to improvements that continue to approach absolute per-fection over time”. These authors also discuss the importance of getting all employ-ees to commit themselves to always doing things right the fi rst time, which is usually known as process improvement.
Brah and Lim ( 2006 ) highlighted the positive relationship existing between oper-ational factors and fi rm performance. Operational factors can be understood as instrumental factors, given that they comply with being the observable or most evi-dent part of TQM program implementation. Specifi cally, their mission deals with carrying out the TQM philosophy. Thus, we hypothesize that:
H3: There is a positive relationship between instrumental factors and business per-formance (Fig. 10.1 ).
10.3 Method
10.3.1 Data Collection and Sample
This study took place in two phases. During the fi rst phase we visited 27 fi rms involved in the implementation of TQM programs. Around 20 of these 27 compa-nies have been organizations belonging to the “Spanish Excellence Management
F.J. Carmona-Márquez et al.

133
Club”, which periodically organizes open days for members. Some of these fi rms have obtained the European Quality Award. Throughout this fi rst phase, we have been observing, noting and lastly assessing the similarities and dissimilarities we found in the different practices and TQM focus in these fi rms. We also carried out a total of 39 personal interviews with the senior managers responsible for coordinat-ing TQM programs in Spanish fi rms. The main objective of these interviews was to test and debug the questionnaire and measurement instruments used. Previously we had carried out an exhaustive revision of the most relevant literature on TQM in diverse scientifi c journals.
Once this fi rst phase fi nished and the research design was established, the second phase of the study considered the following study populations: the Spanish fi rms which offered clear and suffi cient indications of having implemented TQM strate-gies. Our sample was made up of 554 organizations which had implemented a TQM program. This sample consisted of 502 fi rms with ISO 9000 from the Spanish Agency of Standardization and Certifi cation (AENOR), as well as 79 fi rms belong-ing to the Spanish Excellence Management Club. The survey was aimed at the CEOs or senior managers of the companies chosen. Finally, a total of 113 valid responses were obtained, which meant a response rate of 20.4 %. Table 10.2 displays a review of their demographic features.
10.3.2 Measures
The items used to measure the different constructs of the model have been derived and adapted from previously verifi ed sources. The questionnaire was designed on the basis of the literature review described in the article. We essentially used exist-ing scales taken from a previous study carried out by Leal-Millán ( 1995 ). The ques-tionnaire items are listed in full in the Appendix.
The three constructs related to TQM factors that make up our research model have been designed as multidimensional constructs. We have followed a super- ordinate procedure (Polites et al. 2012 ) in which relationships fl ow from the
Table 10.2 Respondent demographics
Number Percentage
Type of business Manufacturing company 70 62.0 % Service company 21 18.6 % Mixed 22 19.4 %
Number of years implementing TQM Five years or more 57 50.50 % Less than fi ve years 56 49.50 % Size of the company Big enterprise 62 54.9 % Small/Medium enterprise (SME) 51 45.1 %
Multinational Yes 49 43.4 % No 64 56.6 %
10 The Impact of TQM Critical Success Factors on Business Performance.…

134
construct to its dimensions. A super-ordinate construct characterizes a broad con-cept which is manifested by its dimensions (Edwards 2001 ). Each dimension repre-sents a distinct manifestation or realization of the underlying high-order construct. This particular design of the measurement model includes refl ective fi rst-order dimensions and refl ective second-order constructs. In this case, we are interested in common variance, that is, the variance shared by the three dimensions. Each of the TQM factors modeled is identifi ed as a refl ective fi rst-order construct. Then four second- order constructs have been modeled which are composed of the fi rst-order ones. Three indicators or manifest variables have been used to measure each of the TQM factors. In this section the respondent was asked to indicate the extent to which the following aspects of quality are being implemented in his company. To do so, we used a fi ve-point Likert scale ranging from “1 = we have not implemented this yet, although we have the intention of doing so in the future” to “5 = implemen-tation is at a very advanced stage”. The fi nal measurement instrument for this block of TQM key factors is made up of 30 items (3 items for each factor).
As for the business performance construct, this has been modeled as a refl ective fi rst-order construct, composed of fi ve items or manifest variables essentially related to fi nancial performance indicators. A subjective measurement of performance has been widely accepted in organizational research for many years. Therefore, in this study we have preferred the use of these measures instead of fi nancial data from the fi rm’s annual accounts, considering the heterogeneity underlying the sample we used. This section of the questionnaire was intended to require the respondent to express the global performance of the fi rm for the previous 4 years. For this pur-pose, we also used a fi ve-point Likert scale ranging from “1 = I totally disagree” to “5 = I totally agree”.
10.3.3 Data Analysis
In order to assess the relationships between constructs as well as the predictive power of the research model, we have applied Structural Equations Modeling (SEM). Our research model has been specifi cally tested using Partial Least Squares (PLS), variance-based structural equation modeling ( Roldán and Sánchez-Franco 2012 ), an alternative to classic covariance-based techniques such as AMOS, Lisrel or EQS. The PLS approach has been used because this technique is mainly ori-ented to causal-predictive analysis, in which the problems explored are complex (high numbers of variables and relationships) and theoretical knowledge is limited (Wold 1979 ). According to Barclay et al. ( 1985 ), this technique is generally recom-mended for predictive research models which stress theoretical development, such as this study.
PLS represents a mathematical and statistical data-analysis technique that fi ts the conditions and requirements inherent to social sciences. Wold ( 1980 ) called this “soft modeling” because the mathematical and statistical procedures underlying this
F.J. Carmona-Márquez et al.

135
technique are robust and rigorous. However, the mathematical model is fl exible in the sense that it does not make suppositions related to measuring levels, data distri-bution or sample size. In addition, the size of the fi nal sample used also suggested the use of PLS with regard to covariance-based structural equation modeling (maximum- likelihood) (Reinartz et al. 2009 ).
The purpose of PLS modeling is the prediction of manifest and latent variables (Wold 1985 ). This means that this technique endeavors to explain the variances in both observed and unobserved variables (Fornell and Bookstein 1982 ). This goal translates into the attempt to maximize the explained variance (R 2 ) of dependent variables. This leads to the fact that parameter estimations are based upon the inde-pendent variables’ capacity to minimize residual variances ( Chin 1998 ).
For this reason, the software that has been selected to carry out the PLS analysis was SmartPLS, developed by Ringle et al. ( 2005 ).
10.4 Results
PLS models are assessed and interpreted through two phases: (1) the evaluation of the reliability and validity of the measurement model (outer model), and (2) the evaluation of the structural model (inner model). Following this sequential proce-dure guarantees the validity and reliability of the constructs’ measures before attempting to draw conclusions concerning the links between constructs (Roldán and Sánchez-Franco 2012 ).
10.4.1 Measurement Model
The evaluation of the measurement model is comprised of assessing the individual item reliability, the construct reliability, the convergent validity and, fi nally, the dis-criminant validity. As our study satisfactorily meets the requirements of these four tests, we can sustain the strength and reliance showed by the measurement model proposed.
For the case of variables with refl ective indicators, like our model’s, individual item reliability is considered satisfactory when the items’ factor loadings are greater than 0.707 on their respective constructs (Carmines and Zeller 1979 ).
The construct reliability assessment leads us to verify the internal consistency of all the items while measuring the concept. What we aim to defi nitely verify here is how rigorous the manifest variables measuring the same latent variable are. To this end we use a measure called composite reliability of the construct (ρ c ). In order to assess this measure, we follow the indications posited by Nunnally ( 1978 ), who suggests a level of 0.7 for a modest reliability in early research stages, and 0.8 for a more strict research.
10 The Impact of TQM Critical Success Factors on Business Performance.…

136
The evaluation of convergent validity is carried out through a measure developed by Fornell and Larcker ( 1981 ), called Average Variance Extracted (AVE). This mea-sure provides the amount of variance a construct obtains from its indicators in rela-tion to the amount of variance due to the measurement error. According to these authors, the AVE has to be greater than 0.5, which means that more than a half of the construct’s variance is due to its indicators.
Finally, the construct’s discriminant validity must be assessed. Discriminant Validity shows the extent to which a given construct is different from the others. This is accomplished through the comparison of the square root of AVE versus cor-relations. In order to obtain acceptable discriminant validity, the diagonal elements should be considerably greater than the off-diagonal elements in the corresponding rows and columns.
10.4.2 Structural Model
The structural model was tested on the basis of the path coeffi cients intensity or standardized regression weights (β) and the endogenous variables’ explained vari-ance (R 2 ). Both coeffi cients were obtained from carrying out the SmartPLS soft-ware. In addition, we use a non-parametric Bootstrap resampling technique in order to assess the accuracy and stability of the estimates provided by SmartPLS.
Consistent with Hair et al. ( 2011 ), we used a bootstrapping technique (5,000 resamples) to generate standard errors and t -statistics, which permit the assessment of the statistical signifi cance of the links contemplated in the models. The results corroborate that the structural model has acceptable predictive relevance for the two endogenous variables: instrumental factors and business performance.
We have followed the methodological approach proposed by Preacher and Hayes ( 2008 ) and Taylor et al. ( 2008 ) in order to verify our mediation hypothesis (H2). We also assessed the total and direct effects of the independent variable on the endog-enous variable (i.e., instrumental factors). In accordance with Williams and MacKinnon ( 2008 ) proposals, we used the bootstrapping technique to test the medi-ation effect. Chin ( 2010 ) suggested a two-step procedure for assessing indirect effects in PLS. The fi rst step deals with using the specifi c model in questions includ-ing both the direct and the indirect paths, performing N bootstrap resampling and fi nally multiplying the direct paths that make up the indirect path we are evaluating. The second step is the estimation of signifi cance through the use of percentile boot-strap (Williams and MacKinnon 2008 ). This provides a 95 % confi dence interval (CI) for mediators. If the interval for a mediation hypothesis does not include zero, this means that the indirect effect is meaningfully distinct from zero with 95 % confi dence (Castro and Roldán 2013 ). As Fig. 10.2a illustrates, the enabler factors construct has a signifi cant total effect on the instrumental factors (path a). When the mediator variable is introduced into the model (Fig. 10.2b ), the relationship between the enabler factors and the instrumental factors (path a’) becomes non-signifi cant. This means that implementation factors fully mediate the infl uence of enabler fac-tors on instrumental factors.
F.J. Carmona-Márquez et al.
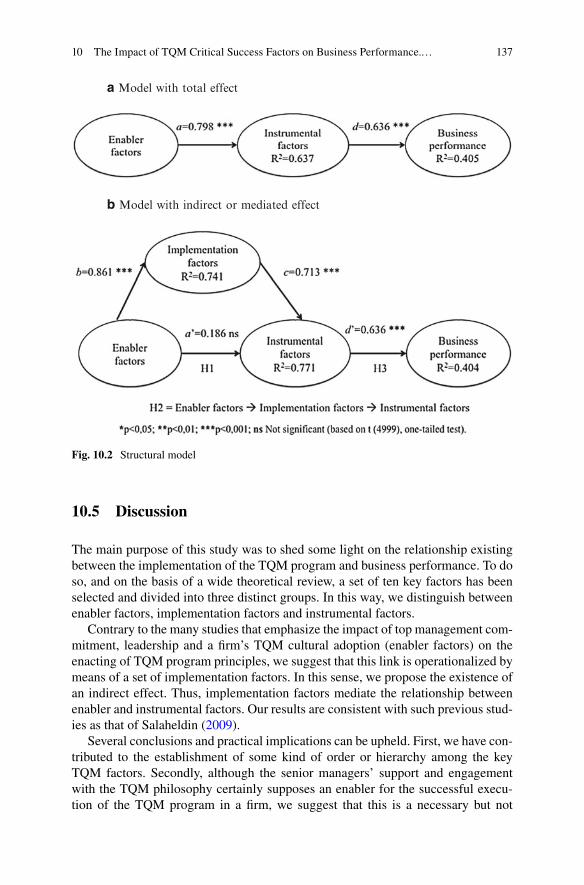
137
10.5 Discussion
The main purpose of this study was to shed some light on the relationship existing between the implementation of the TQM program and business performance. To do so, and on the basis of a wide theoretical review, a set of ten key factors has been selected and divided into three distinct groups. In this way, we distinguish between enabler factors, implementation factors and instrumental factors.
Contrary to the many studies that emphasize the impact of top management com-mitment, leadership and a fi rm’s TQM cultural adoption (enabler factors) on the enacting of TQM program principles, we suggest that this link is operationalized by means of a set of implementation factors. In this sense, we propose the existence of an indirect effect. Thus, implementation factors mediate the relationship between enabler and instrumental factors. Our results are consistent with such previous stud-ies as that of Salaheldin ( 2009 ).
Several conclusions and practical implications can be upheld. First, we have con-tributed to the establishment of some kind of order or hierarchy among the key TQM factors. Secondly, although the senior managers’ support and engagement with the TQM philosophy certainly supposes an enabler for the successful execu-tion of the TQM program in a fi rm, we suggest that this is a necessary but not
a Model with total effect
b Model with indirect or mediated effect
Fig. 10.2 Structural model
10 The Impact of TQM Critical Success Factors on Business Performance.…

138
suffi cient condition. There is a series of factors that should be taken into account if the manager really wishes this program to succeed. The involvement of customers and suppliers, fostering an open and fl exible structure within the company, the effective training and education of employees in TQM principles and empowerment are practices that ought to be encouraged by managers. Thirdly, we confi rm the strong impact that instrumental factors such as benchmarking, process improve-ment and zero-defects mentality have upon a fi rm’s performance. Favouring the practices mentioned can lead the company to obtain an enhanced performance.
There are several limitations within this work that should be mentioned. The fi rst is related to organizational bias. It seems likely that those fi rms which are not pleased with their TQM system performance would be less liable and motivated to contribute to the development of this study. Therefore, we have included in the sam-ple a higher proportion of “good” systems than is the case in the population. Secondly, although we provide evidence of causality, causality itself has not been proven. According to Fornell ( 1982 ), causal relationship between variables cannot be proven; they are always assumed by the researcher. Thirdly, this research relies mainly on perceptions and we only used a single method to elicit these perceptions. Finally, we carried out this research in a specifi c geographical setting (Spanish com-panies). Thus, we must be cautious about generalizing the results in other contexts.
References
Agus A (2005) The structural linkages between TQM, product quality performance, and business performance: preliminary empirical study in electronics companies. Singapore Manag Rev 27(1):87–105
Ahire SL, Golhar DY, Waller MA (1996) Development and validation of TQM implementation constructs. Decis Sci 27(1):23–56
Anderson JC, Rungtusanatham M, Schroeder RG, Devaraj S (1995) A path analytic model of a theory of quality management underlying the Deming management method: preliminary empirical fi ndings. Decis Sci 26(5):637
Barclay D, Higgins C, Thompson R (1985) The partial least squares (PLS) approach to causal modelling: personal computer adoption and use as an illustration. Technol Stud 2:285–309
Black SA, Porter LJ (1996) Identifi cation of the critical factors of TQM. Decis Sci 27(1):1–22 Boone LE, Wilkins D (1995) The role of benchmarking in total quality management. Int J Manag
12(1):123 Brah SA, Lim HY (2006) The effects of technology and TQM on the performance of logistics
companies. Int J Phys Distrib Logist Manag 36(3):192–209 Carmines EG, Zeller RA (1979) Reliability and validity assessment. Sage, Beverly Hills, CA Castro I, Roldán JL (2013) A mediation model between dimensions of social capital. Int Bus Rev
22(6):1034–1050 Chin WW (1998) Structural equation modeling in IS research. Presentado en ISWorld Net Virtual
Meeting Center at Temple University Chin WW (2010) How to write up and report PLS analyses. In: Esposito Vinzi V, Chin WW,
Henseler J, Wang H (eds) Handbook of partial least squares concepts, methods and applica-tions. Springer, Dordrecht, pp 645–689, Recuperado a partir de http://www.msvu.ca:2048/login?url=http://www.msvu.eblib.com/patron/FullRecord.aspx?p=993596
F.J. Carmona-Márquez et al.

139
Christiansen JS, Lee WY (1994) Total quality management and corporate performance: an empirical investigation (Ford Motor Co. and Kent State University. USA. Working Paper)
Chung CH (1999) It is the process: a philosophical foundation for quality management. Total Qual Manag 10(2):187–197. doi: 10.1080/0954412997947
Das A, Handfi eld RB, Calantone RJ, Ghosh S (2000) A contingent view of quality management- the impact of international competition on quality. Decis Sci 31(3):649–690
Douglas TJ, Judge WQ Jr (2001) Total quality management implementation and competitive advantage: the role of structural control and exploration. Acad Manage J 44(1):158–169. doi: 10.2307/3069343
Dow D, Samson D, Ford S (1999) Exploding the myth: do all quality management practices con-tribute to superior quality performance? Prod Oper Manag 8(1):1–27
Easton GS, Jarrell SL (1998) The effects of total quality management on corporate performance: an empirical investigation. J Bus 71(2):253–307
Edwards JR (2001) Multidimensional constructs in organizational behavior research: an integra-tive analytical framework. Organ Res Meth 4(2):144–192
Flynn BB, Schroeder RG, Sakakibara S (1994) A framework for quality management research and an associated measurement instrument. J Oper Manag 11(4):339–366
Flynn BB, Schroeder RO, Sakakibara S (1995) The impact of quality management practices on performance and competitive advantage. Decis Sci 26(5):659–691
Flynn BB, Schroeder RG, Sakakibara S (1996) Determinants of quality performance in high and low quality plants. Qual Contr Appl Stat 41(1):73–76
Fornell C (1982) A second generation of multivariate analysis: an overview. In: Fornell C (ed) A second generation of multivariate analysis, vol 1. Praeger, New York, NY, pp 1–121
Fornell C, Bookstein FL (1982) Two structural equation models: LISREL and PLS applied to consumer exit-voice theory. J Market Res 19(4):440–440
Fornell C, Larcker DF (1981) Structural equation models with unobservable variables and mea-surement error: Algebra and statistics. J Market Res 382–388
Fotopoulos CB, Psomas EL (2009) The impact of «soft» and «hard» TQM elements on quality management results. Int J Qual Reliab Manag 26(2):150–163
Fuentes MMF, Montes FJL, Fernández L (2006) Total quality management, strategic orientation and organizational performance: the case of Spanish companies. Total Qual Manag Bus Excel 17(3):303–323. doi: 10.1080/14783360500451358
Grandzol JR, Gershon M (1998) A survey instrument for standardizing TQM modeling research. Int J Qual Sci 3(1):80
Gurnani H (1999) Pitfalls in total quality management implementation: the case of a Hong Kong company. Total Qual Manag 10(2):209–228. doi: 10.1080/0954412997965
Hair JF, Ringle CM, Sarstedt M (2011) PLS-SEM: indeed a silver bullet. J Market Theor Pract 19(2):139–152
Harari O (1993) Ten reasons why TQM doesn’t work. Manage Rev 82(1):33–38 Hendricks KB, Singhal VR (1997) Does implementing an effective TQM program actually
improve operating performance? Manag Sci 43(9):1258–1274 Idris MA, Zairi M (2006) Sustaining TQM: a synthesis of literature and proposed research frame-
work. Total Qual Manag Bus Excel 17(9):1245–1260. doi: 10.1080/14783360600750535 Ittner CD, Larcker DF (1996) Measuring the impact of quality initiatives on fi rm fi nancial perfor-
mance. In: Fedor DF, Ghosh S (eds) Advances in management of organization quality, vol 1. JAI Press, Greenwich, Conn, London, pp 1–37
Kaynak H (2003) The relationship between total quality management practices and their effects on fi rm performance. J Oper Manag 21(4):405–435
Khanna HK, Sharma DD, Laroiya SC (2011) Identifying and ranking critical success factors for implementation of total quality management in the Indian manufacturing industry using TOPSIS. Asian J Qual 12(1):124–138. doi: 10.1108/15982681111140598
Krumwiede DW, Lavelle JP (2000) The effect of top manager personality on a total quality management environment. Eng Manag J 12(2):9–14
10 The Impact of TQM Critical Success Factors on Business Performance.…

140
Leal-Millán A (1995) TQM y su infl uencia en la organización. En Trabajo de investigación para acceso a cátedra. Universidad de Sevilla
Lenka U, Suar D (2008) A holistic model of total quality management in services. ICFAI J Manag Res 7(3):56–72
Llorens Montes FJ, Verdu Jover A, Molina Fernandez LM (2003) Factors affecting the relationship between total quality management and organizational performance. Int J Qual Reliab Manag 20(2):189–209
Matsui Y (2002) Contribution of manufacturing departments to technology development: an empirical analysis for machinery, electrical and electronics, and automobile plants in Japan. PROECO Int J Prod Econ 80(2):185–197
Nunnally JC (1978) Psychometric theory. McGraw-Hill, New York Oakland JS (1995) Total quality management: text with cases. Butterworth-Heinemann, Oxford Polites GL, Roberts N, Thatcher J (2012) Conceptualizing models using multidimensional con-
structs: a review and guidelines for their use. Eur J Inform Syst 21(1):22–48 Powell TC (1995) Total quality management as competitive advantage: a review and empirical
study. Strat Manag J 16(1):15–37 Preacher KJ, Hayes AF (2008) Asymptotic and resampling strategies for assessing and comparing
indirect effects in multiple mediator models. Behav Res Methods 40(3):879–91 Rahman S (2001) A comparative study of TQM practice and organisational performance of SMEs
with and without ISO 9000 certifi cation. Int J Qual Reliab Manag 18(1):35–49 Rahman S, Siddiqui J (2006) Exploring total quality management for information systems in
Indian fi rms: application and benefi ts. Bus Process Manag J 12(5):622–631 Rahman S, Sohal AS (2002) A review and classifi cation of total quality management research in
Australia and an agenda for future research. Int J Qual Reliab Manag 19(1):46–66 Rao SS, Solis LE, Raghunathan TS (1999) A framework for international quality management
research: development and validation of a measurement instrument. Total Qual Manag 10(7):1047–1075. doi: 10.1080/0954412997226
Reinartz W, Haenlein M, Henseler J (2009) An empirical comparison of the effi cacy of covariance- based and variance-based SEM. Int J Res Market 26(4):332–344
Richman E, Zachary WB (1993) Building an operations management foundation that will last: TQM, JIT and CIM. Industrial Engineering -New York Then Atlanta Norcross- American Institute of Industrial Engineers Incorporated 25(8):39
Ringle CM, Wende S, Will A (2005) SmartPLS 2.0 (M3) beta. Hamburg, Germany Roldán JL, Sánchez-Franco MJ (2012) Variance-based structural equation modeling: guidelines
for using partial least squares in information systems research. In: Mora M, Gelman O, Steenkamp A, Raisinghani M (eds) Research methodologies, innovations, and philosophies in software systems engineering and information systems. Information Science Reference, Hershey, PA
Roldán JL, Leal-Rodríguez AL, Leal AG (2012) The infl uence of organisational culture on the total quality management programme performance. Investigaciones Europeas de Dirección y Economía de la Empresa 18(3):183–189. doi: 10.1016/j.iedee.2012.05.005
Sadikoglu E, Zehir C (2010) Investigating the effects of innovation and employee performance on the relationship between total quality management practices and fi rm performance: an empiri-cal study of Turkish fi rms. Int J Prod Econ 127(1):13–26. doi: 10.1016/j.ijpe.2010.02.013
Salaheldin S (2009) Critical success factors for TQM implementation and their impact on perfor-mance of SMEs. Int J Prod Perform Manag 58(3):215–237
Saraph JV, Benson PG, Schroeder RG (1989) An instrument for measuring the critical factors of quality management. Decis Sci 20(4):810–829
Sila I, Ebrahimpour M (2005) Critical linkages among TQM factors and business results. Int J Oper Prod Manag 25(11):1123–1155
Talib F, Rahman Z (2010) Critical success factors of TQM in service organizations: a proposed model. Serv Market Quart 31(3):363–380. doi: 10.1080/15332969.2010.486700
Tamimi N, Gershon M (1995) A tool for assessing industry Tqm practice versus the Deming phi-losophy. Prod Invent Manag J 36(1):27–32
F.J. Carmona-Márquez et al.

141
Taylor A, MacKinnon D, Tein JY (2008) Tests of the three-path mediated effect. Organ Res Meth 11(2):241–269
Thiagaragan T, Zairi M, Dale BG (2001) A proposed model of TQM implementation based on an empirical study of Malaysian industry. Int J Qual Reliab Manag 18(3):289–306
Waldman DA (1994) The contributions of total quality management to a theory of work perfor-mance. Acad Manage Rev 19(3):510–536. doi: 10.5465/AMR.1994.9412271811
Williams J, MacKinnon D (2008) Resampling and distribution of the product methods for testing indirect effects in complex models. Struct Equ Model: A Multidisciplinary Journal 15(1):23–51
Wold H (1979) Model construction and evaluation when theoretical knowledge is scarce: an exam-ple of the use of partial least squares. Université de Genève Faculté des sciences économiques et sociales, Genève
Wold H (1980) Soft modeling: intermediate between traditional model building and data analysis. Math Stat 2:333–346
Wold H (1985) Systems analysis by partial least squares. In: P Nijkamp, H Leitner, N Wrigley (Eds.), Measuring the unmeasurable. Dordrecht ; Boston : M. Nijhoff ; Hingham, MA, pp 221–251 (Distributors for the US and Canada)
York KM, Miree CE (2004) Causation or covariation: an empirical re-examination of the link between TQM and fi nancial performance. J Oper Manag 22(3):291–311. doi: 10.1016/j.jom.2004.02.001
Yusuf Y, Gunasekaran A, Dan G (2007) Implementation of TQM in China and organisation per-formance: an empirical investigation. Total Qual Manag Bus Excel 18(5):509–530. doi: 10.1080/14783360701239982
Zairi M (1996) Benchmarking for best practice: continuous learning through sustainable innova-tion. Butterworth Heinemann, Oxford, Boston
Zairi M, Leonard P (1994) Practical benchmarking: the complete guide. Chapman & Hall, London
10 The Impact of TQM Critical Success Factors on Business Performance.…

143M. Peris-Ortiz and J. Álvarez-García (eds.), Action-Based Quality Management: Strategy and Tools for Continuous Improvement, DOI 10.1007/978-3-319-06453-6_11, © Springer International Publishing Switzerland 2014
Abstract Higher education institutions have adopted education, research and cooperation as their main missions. Students, teachers and non-teaching staff articu-late for lecturing, researching and developing projects and internships, according to the institution goals and strategy. Quality evaluation is of the utmost importance in the whole process, as it allows providing a competent and rigorous service as well as maintaining high level of attractiveness for additional funding, through coopera-tion and research projects. This chapter describes the results of an empirical study, performed in the Technology and Management School of the Polytechnic Institute of Bragança, to assess and compare the perceptions of students about the satisfac-tion and quality of the institutions’ services and its importance. The universe com-prised 2,031 students and we concluded that globally they have a high values of satisfaction. We also differentiate between study cycles (graduation and master) and field of study (Technological and Business).
11.1 Introduction
Higher education has, in its guidelines, the role of producing knowledge based on the development of science, technology and citizenship. In turn, Higher Education Institutions (HEI) directly influence the economic, cultural and social development
Chapter 11Student Perception of Quality in Higher Education Institutions
Paula Fernandes, Rui Lopes, and Fátima Silva
P. Fernandes • F. SilvaEconomics and Management, Polytechnic Institute of Bragança (IPB), Campus de St. Apolónia, Bragança, TMAD 5300-253, Portugal
R. Lopes (*) Informatics and Communications, Polytechnic Institute of Bragança (IPB), Campus de St. Apolónia, Bragança, TMAD 5300-253, Portugale-mail: [email protected]

144
in regions where they operate, requiring a strong commitment on the quality of services provided. The positive attitudes of a service lead to increased customer retention. The withdrawal or loss of a client (student) results in revenue reduction and the weakening of their image among potential candidates.
The evaluation of the quality of service is based significantly on the characteris-tics of past experiences and beliefs, comprising various attributes. According to Kotler and Keller (2005), to meet and satisfy customers better than competition is the key to a profitable development.
Quality has become a crucial and strategic subject of discussion among HEI, and has been extensively studied in recent years. Just like any other organizations, to be successful, HEI have to perform their role effectively. In this context one of the main ways to attract students (costumers) is to guarantee their satisfaction with the performance of the institution, when compared to their expectations at the arrival and also during the academic years.
According to this, it is crucial that HEI make an authentic effort to measure their performance on a regular basis. The Importance-Satisfaction Analysis can be used to evaluate the performance of a Higher Education Institution. This methodology is supported by the intersection of two dimensions, such as the level of satisfaction derived from students who use the services and the degree of importance they attach to the services, it is possible to determine whether a HEI has provided the services that fulfilled the needs of its students.
Therefore, the main reason for this study is to increase the literature available in management service quality in higher education. This will be completed through assessing and comparing the perception of undergraduate students at School of Technology and Management of Polytechnic Institute of Bragança (Portugal).
The data for this study was collected in classroom via a questionnaire answered by students who attended the graduate and master programs at School of Technology and Management of Polytechnic Institute of Bragança, located in the town of Bragança, Portugal.
The instrument used was divided into two sections:
Section I—students’ personal information;Section II—students’ perceptions of the importance and their satisfaction towards
with several attributes. The attributes under consideration were: Quality of General Aspects, Quality of the Library, Quality of Computer Laboratory Facilities, Quality of Academic Services, Quality of Teaching Aspects, Quality of Studies Programs, and Quality of External Relations.
A total of 695 valid questionnaires were received, which represents 34 % of the total student population (2031 students). The sample size showed a sampling error of 3.7 %, assuming a 95 % accuracy level.
Our research is structured as follows, after this introductory section; we carry out a review of the literature relevant about Importance-Satisfaction Model. The meth-odology adopted, the sample size, the variables used and the statistical methods were described in the Sect. 11.3. This is followed by analysis and discussion of our results before putting forward our final considerations.
P. Fernandes et al.

145
11.2 Theoretical Background
The capacity of HEI to attract and retain students strongly depend on the provided satisfaction. According to Aktas et al. (2007) the image of an institution influences their choice and affects the behavior of students. Loyalty is the result of the recogni-tion that attracts and retains customers and linked to the ability to differentiate ser-vices, as well as the conviction that the institution will offer them a consistent quality. This analysis involves the simultaneous consideration of evaluations from customers about the importance of the most important attributes and their level of satisfaction with the service provided.
Therefore, the application of Importance-Satisfaction Analysis (ISA) was based on the Importance-Performance Analysis developed by Martilla and James (1977). The performance has been replaced by satisfaction, since it considers that satisfac-tion has become the main measure of service quality (Matzler et al. 2003; Tonge and Moore 2007; Aktas et al. 2007).
For Baker and Cromptom (2000), cited by Tonge and Moore (2007), they define performance as a measure of production that results in satisfaction. According to these authors, the satisfaction provides information to analyze the performance of a results-based institution. When comparing the importance to the satisfaction of cer-tain attributes, it identifies the areas in which to intervene and focus on service performance/satisfaction.
The ISA consists of a pair of coordinate axis where the ‘importance’ (y-axis) and the ‘satisfaction’ (x-axis) of the different elements involved in the service are com-pared (see Fig. 11.1). Each of the quadrants combines the importance and the satis-faction assigned by the customers/user given element of the service and possesses a different value in terms of management and the respective mean of self-stated raw importance and attribute satisfaction data is the original point of this ISA matrix (Martilla and James 1977; Guadagnolo 1985; Bacon 2003; Matzler et al. 2003; Zhang and Chow 2004; Pike 2004; Go and Zhang 2008; Silva and Fernandes 2010). Each quadrant suggests a different marketing strategy.
The four quadrants in importance-performance analysis are characterized as (Martilla and James 1977; Matzler et al. 2003; Silva and Fernandes 2010):
– Low satisfaction on highly important attributes demands immediate attention, in order to improve overall satisfaction, HEI should ‘Concentrate Here’ (Quadrant A). If they are ignored, this poses a serious threat;
– Attributes in Quadrant B evaluate high both in satisfaction and importance, rep-resenting opportunities for gaining or maintaining competitive advantages. In this area a HEI should ‘Keep Up the Good Work’;
– Quadrant C contains attributes both low in satisfaction and importance. Typically, it is not necessary to focus additional effort here. These product or service attri-butes are of ‘Low Priority’;
11 Student Perception of Quality in Higher Education Institutions

146
– Attributes located in Quadrant D are rated high in satisfaction but low in impor-tance. This implies that resources committed to these attributes would be better employed elsewhere. High performance/satisfaction on unimportant attributes indicates a ‘Possible Overkill’.
It should be noted that the definition of the x-axis of the Cartesian graph was maintained over the years by some authors and changed by others, analyzing the performance or satisfaction depending on the phenomenon under study.
To construct the matrix Martilla and James (1977), Tonge and Moore (2007) recommend the use of the average range of the scale for crossing axes. Martilla and James (1977), Lynch et al. (1996) indicates that should still be considered the median value of the data presented to cross the axes, based on the trend of responses. Other authors e.g., Zhang and Chow (2004), Aktas et al. (2007), Abalo et al. (2007), Rial et al. (2008), Lee and Lee (2009), Matzler et al. (2003), recommend the use of average results, to define the intersection of the axes of Cartesian graph, found for each axis.
After the application of ISA, we also formulated some hypothesis to further assess the relation between the services provided and the origin, course and field of the students.
Fig. 11.1 Importance-satisfaction matrix (Adapted from Matzler et al. 2003, p. 115)
P. Fernandes et al.

147
11.3 Methodology Design
11.3.1 Sampling and Survey Instrument
The data for this study were collected in classroom, applying a questionnaire to the students who attend the undergraduate and master degree programmes at the School of Technology and Management (ESTiG) of Polytechnic Institute of Bragança, located in Bragança, Portugal.
The questionnaire contained 42 items reflecting the dimensionality of impor-tance and satisfaction with service levels of Higher Education Institutions.
The final questionnaire was divided into three parts, as follows:
(i) Demographics survey; (ii) Importance survey: Responses requested on a five-point Likert scale ranging
from ‘Very unimportant’ (1) to ‘Very important’ (5); (iii) Satisfaction survey: Responses requested on a five-point Likert scale ranging
from ‘Strongly Disagree’ (1) to ‘Strongly Agree’ (5).
The survey was conducted during April and May of 2010, in second semester of the 2009/2010 academic year. A total of 695 valid questionnaires were received, which represents 34 % of total population (2.031 students). The sample size resulted in sampling error of 3.7 %, assuming a significance level of 0.05.
11.3.2 Selection of Variables
As for the selection of the determinants of students’ satisfaction, the choice has been made on the basis of previous literature (e.g., Joseph and Joseph 1997; Alves 1998; Pike 2004); as result we decided to focus on the following attributes:
(i) Quality of General Aspects: it includes Moderns facilities, Clean facilities, Sports activities, Cultural activities, Associations of students;
(ii) Quality of the Library: Easy access to shelves; Ways of consulted rapidly; Warmth of its staff and Interest in solving the problems of student;
(iii) Quality of Computer Laboratory Facilities: Availability of laboratories and computer facilities; Ability to use after classes and Existence of training in computer tools;
(iv) Quality of Social Services: Financial aid for students; Existence of medical support to students; Availability of accommodation for students; Existence of canteens; Knowledge of rules and procedures; Trust and safety in service; Information service completion; Interest in solving the problems of student; Simple rules and procedures and Warmth of its staff;
(v) Quality of Academic Services: Simple procedures; Knowledge of rules and procedures Simple procedures; Interest in solving the problems of student; Trust and safety in service; Information service completion; Quick response and Warmth of its staff;
11 Student Perception of Quality in Higher Education Institutions

148
(vi) Quality of Teaching Aspects: Friendliness of the teachers; Personalized atten-tion; Easy communication with teachers; Clarity and precision in the expo-sure of knowledge; Scientific expertise of the teacher; Fair assessment and Advice the basic bibliography;
(vii) Quality of Undergraduate Programmes: Updated content and Several career opportunities;
(viii) Quality of External Relations: Getting the internships; Exchange programs with foreign; Conferences and seminars and Internet connection.
11.3.3 Data Analysis
Descriptive analyses such as frequency, mean and standard deviation were con-ducted to examine students’ demographic profiles. Cronbach’s alpha was calculated to test the reliability of the dimensionality of importance and satisfaction with ser-vice levels of HEI perceived by students. A factor was considered significant if its Cronbach’s alpha was 0.70 or above. In this study it was achieved for an alpha reli-ability on the importance ratings of the 42 attributes was high (0.972). The alpha reliability on the satisfaction ratings was also high (0.954).
Mean scores rating was calculated for the importance and satisfaction dimen-sions. Then, the mean scores of the 42 service quality attributes were plotted on the ISA matrix according to their perceived importance and the satisfaction levels as perceived by students.
In addition, we formulated three sets of hypothesis, tested for statistical rele-vance using mean-comparison t-test. For example, the test allows us to see if the students’ satisfaction from a given region is higher than other regions. This requires that we calculate the average for the students’ satisfaction from that region and then for all the other regions, doing a simple t-test to see if they are different. We restricted the results to the ones that shown a statistical relevance higher than 90 %, discarting all the others as non-relevant.
11.4 Findings and Discussion
11.4.1 Profile of Respondents
Table 11.1 lists some of the socio-demographic characteristics of the respondents.The original sample consisted in 695 students, 46 % female and 54 % male, and
the majority has between 18 and 22 years old and coming from undergraduate pro-grams, 57.8 % from technological fields and 42.2 % from business sciences.
As to their origin, this sample is characterized by 87.9 % of students come from the area north of Portugal, and the, district of Bragança, Braga and Porto the main contributors, with respectively 37.5 %, 22.4 % and 20.1 %.
P. Fernandes et al.

149
The Central Region represents 7.5 % of the sample, and the districts of Aveiro and Viseu are the most representative with respectively 3.7 % and 2.4 %. The area referred to as Other is responsible for 4.6 % of the sample, among which are stu-dents with 1.2 % PALOP (African Countries of Portuguese Official Language).
11.4.2 Importance-Satisfaction Analysis
After the sample characterization is intended to make the analysis Importance- Satisfaction applied to ESTiG. It is useful to check not only the importance that students attach to different attributes of the service, as well as the students’ satisfac-tion or dissatisfaction. To this end, this study was based on analysis of eight attri-butes and variables that are different in each category and are an integral part of the questionnaire. The attributes were explain in Sect. 11.3, point 3.2.
From the below table it is possible to learn the mean rating for both Importance and Satisfaction scale, and is possible to conclude that students are quite satisfied with the quality of all services (mean of 3.519, 0.908 for the standard deviation), but results also convey a higher importance to each of the items under analysis, register-ing a mean of 4.336 (and 0.783 for the standard deviation) (Table 11.2).
The results are spread over 3 quadrants (Fig. 11.2).In Quadrant B where are positioned aspects of the undergraduate programmes.
These aspects are a paramount importance for students and high satisfaction, the ESTiG has a good performance, and should continue to work and continue to meet the needs of their students.
Table 11.1 Socio- demographic characteristics of respondents [n = 695]
Variable No. %
GenderFemale 320 46.0Male 375 54.0
Age18–22 years old 510 73.022–27 years old 133 19.0>28 years old 52 8.0
Study FieldsTechnological 402 57.8Business 293 42.2
Academic Year1st 262 38.02nd 226 32.03rd 145 21.01st master degree 62 9.0
Geographical locationNorthern 611 87.9Central 52 7.5Others 32 4.6
11 Student Perception of Quality in Higher Education Institutions
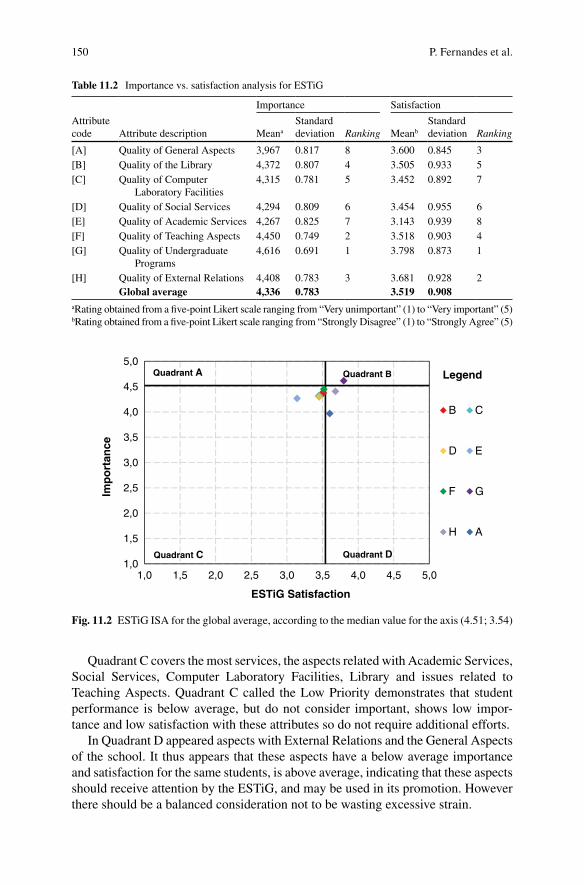
150
Quadrant C covers the most services, the aspects related with Academic Services, Social Services, Computer Laboratory Facilities, Library and issues related to Teaching Aspects. Quadrant C called the Low Priority demonstrates that student performance is below average, but do not consider important, shows low impor-tance and low satisfaction with these attributes so do not require additional efforts.
In Quadrant D appeared aspects with External Relations and the General Aspects of the school. It thus appears that these aspects have a below average importance and satisfaction for the same students, is above average, indicating that these aspects should receive attention by the ESTiG, and may be used in its promotion. However there should be a balanced consideration not to be wasting excessive strain.
Table 11.2 Importance vs. satisfaction analysis for ESTiG
Attribute code Attribute description
Importance Satisfaction
Meana
Standard deviation Ranking Meanb
Standard deviation Ranking
[A] Quality of General Aspects 3,967 0.817 8 3.600 0.845 3[B] Quality of the Library 4,372 0.807 4 3.505 0.933 5[C] Quality of Computer
Laboratory Facilities4,315 0.781 5 3.452 0.892 7
[D] Quality of Social Services 4,294 0.809 6 3.454 0.955 6[E] Quality of Academic Services 4,267 0.825 7 3.143 0.939 8[F] Quality of Teaching Aspects 4,450 0.749 2 3.518 0.903 4[G] Quality of Undergraduate
Programs4,616 0.691 1 3.798 0.873 1
[H] Quality of External Relations 4,408 0.783 3 3.681 0.928 2Global average 4,336 0.783 3.519 0.908
aRating obtained from a five-point Likert scale ranging from “Very unimportant” (1) to “Very important” (5)bRating obtained from a five-point Likert scale ranging from “Strongly Disagree” (1) to “Strongly Agree” (5)
1,0
1,5
2,0
2,5
3,0
3,5
4,0
4,5
5,0
1,0 1,5 2,0 2,5 3,0 3,5 4,0 4,5 5,0
Imp
ort
ance
ESTiG Satisfaction
B C
D E
F G
H
Quadrant A
A
Quadrant C Quadrant D
Quadrant B Legend
Fig. 11.2 ESTiG ISA for the global average, according to the median value for the axis (4.51; 3.54)
P. Fernandes et al.

151
11.4.3 Hypothesis
We formulated an hypothesis to the student perception of importance, as follows: the students from <region> give more importance to <service> than the others.
It was tested and its statistical relevance was measured, considering that only relevance above 90 % was meaningful. We also only considered the regions repre-sented with over 90 students (Fig. 11.3).
We also formulated three sets of hypothesis relative to satisfaction, as follows:
• The students from <region> are more satisfied with the <service> than the others.
• The students from technological courses are more satisfied than the others.• The students from the master courses are more satisfied than the others.
Each hypothesis was tested and the statistical relevance was measured. Only relevance above 90 % was considered. We also only considered the regions repre-sented with over 90 students (Fig. 11.4).
Students from Braga (137) are consistently less satisfied with the library and the Social Services, with statistical relevance over 90 %. The 229 students from Bragança present a contradictory view, revealing high degree of satisfaction with both parameters. The students from Vila Real (97) are essentially dissatisfied. The exceptions are the Quality of Computer Laboratory Facilities, the Social Services and the Quality of Undergraduate Programs.
For the second hypothesis, there is no clear distinction between technological and management area courses. Only regarding the Quality of Teaching Aspects the management area students show less satisfaction than of the other students, with 100 % statistical relevance.
In the last hypothesis, master students (2nd cycle of study) are indeed more satis-fied with the Quality of Computer Laboratory Facilities, the Teaching Aspects and
-0,15
-0,1
-0,05
0
0,05
0,1
0,15
0,2
0,25
Braga Bragança Porto Vila RealMea
n di
ffere
nce
Region
Quality of General Aspects
Quality of the Library
Quality of Computer Laboratory Facilities
Quality of Social Services
Quality of Academic Services
Quality of Teaching Aspects
Quality of External Relations
Fig. 11.3 Mean difference for student perception importance by region
11 Student Perception of Quality in Higher Education Institutions

152
the External Relations than graduation students (first cycle of study) (Table 11.3). This can probably result from more specialization and, consequently, more close access to informatic tools relevant to the area of choice.
11.5 Conclusions and Suggestions for Further Study
The increasing importance of higher education for social participation and citizen-ship as well as for knowledge development and education at a high level, demands a culture of quality that ultimately reflects on the HEI mission development. Based on literature review and empirical studies, this study identifies nine Quality Factors: General Aspects, Library, Computer Laboratory Facilities, Social Services, Academic Services, Teaching Aspects, Undergraduate Programs and External Relations.
Within each, the quality is assessed through the perception of students, in rela-tion to the importance and satisfaction of each attribute. The questionnaires data was analysed through the Importance-Satisfaction Analysis, based on the Importance-Performance Analysis, replacing the performance by satisfaction.
According to the Quadrant Analysis which results from the Importance- Satisfaction Matrix, we conclude that only the aspects related to the course are in Quadrant B, aspects that are of extreme importance and high satisfaction to the students—Quality of Undergraduate Programs. Quadrant C has most of the ser-vices, such as the Quality of Academic Services, Quality of Social Services, Quality of Computer Laboratory Facilities, Quality of the Library and Quality of Teaching Aspects. This quadrant is considered as Low Priority, representing low importance and satisfaction, revealing that this factors do not demand additional effort from the
-0,2
-0,15
-0,1
-0,05
0
0,05
0,1
0,15
0,2
Braga Bragança Porto Vila RealMea
n di
ffere
nce
Region
Quality of General Aspects
Quality of the Library
Quality of Computer Laboratory Facilities
Quality of Social Services
Quality of Academic Services
Quality of Teaching Aspects
Quality of Undergraduate Programs
Quality of External Relations
Fig. 11.4 Mean difference for student perception satisfaction by region
P. Fernandes et al.
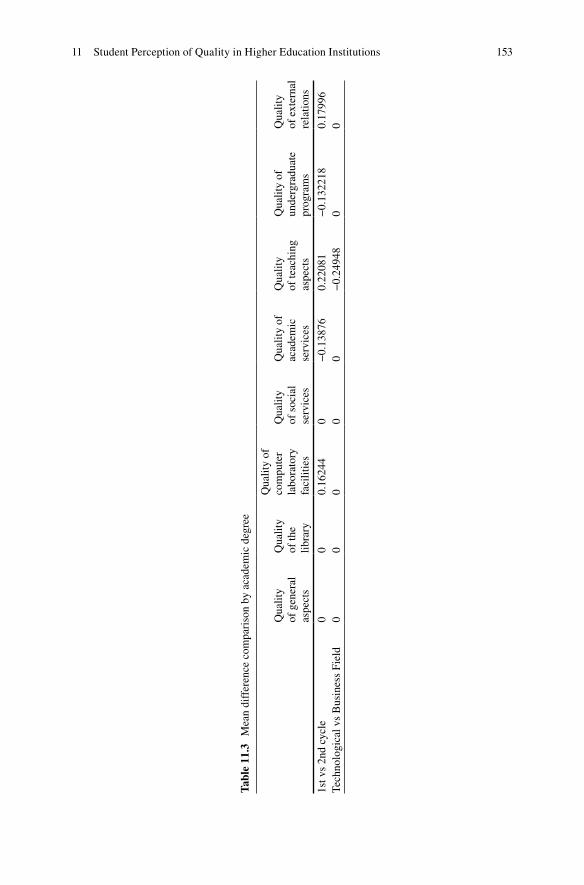
153
Tabl
e 11
.3
Mea
n di
ffer
ence
com
pari
son
by a
cade
mic
deg
ree
Qua
lity
of
gen
eral
as
pect
s
Qua
lity
of
the
libra
ry
Qua
lity
of
com
pute
r
labo
rato
ry
faci
litie
s
Qua
lity
of
soc
ial
serv
ices
Qua
lity
of
acad
emic
se
rvic
es
Qua
lity
of
teac
hing
as
pect
s
Qua
lity
of
unde
rgra
duat
e
prog
ram
s
Qua
lity
of
ext
erna
l re
latio
ns
1st v
s 2n
d cy
cle
00
0.16
244
0−
0.13
876
0.22
081
−0.
1322
180.
1799
6Te
chno
logi
cal v
s B
usin
ess
Fiel
d0
00
00
−0.
2494
80
0
11 Student Perception of Quality in Higher Education Institutions

154
institution. In Quadrant D we can find the aspect related to the Quality of External Relations and Quality of General Aspects. These have a low importance and an above average importance, which indicate that, if necessary, some effort in these aspects can be rationalized. The results showed that in general, students are satisfied with the services provided by ESTiG since the average of all aggregate variables are above the middle value. The attributes considered by the students, with greater sat-isfaction beheld: the Quality of Undergraduate Programs was positioned in first Place; in second Place the Quality of External Relations, at third Place the Quality of General Aspects, and Quality of Teaching Aspects was positioned in fourth Place. The two attributes that showed low level of satisfaction were Quality of Computer Laboratory Facilities and Quality of Academic Services. These aspects should be put under the director consideration, in order be considered for improvement.
To further assess the differences and to characterize particularities and tenden-cies among the respondents, some importance and satisfaction hypothesis where formulated. These were assessed using a mean-comparison t-test, identifying spe-cific approaches among study cycles (master and undergraduate) and field of study (technological and business).
It would also be of interest to extend this analysis to the others schools of Polytechnic Institute of Bragança to see if the students’ perceptions regarding satis-faction with services offered by HEI is the same, once the field of study of each school are very distinct of School of Technology and Management. In addition, a more in-depth review of a few of the most important variables cited in this study would also be of interest.
Acknowledgments This work has been supported by the School of Technology and Management of the Polytechnic Institute of Bragança (Portugal). The authors would like to thank the students who answered the questionnaires and the teachers at ESTiG for allowing time in their classes for carrying out the investigation. We would also like to thank ESTiG’s Principal for authorizing the use of the questionnaires in the Institution.
References
Abalo J, Varela J, Manzano V (2007) Importance values for importance-performance analysis: a formula for spreading out values derived from preference rankings. J Bus Res 60(2):115–121
Aktas A, Aksu A, Çizel B (2007) Destination choice: an important-satisfaction analysis. Quality & Quality 41(2):265–273
Alves H (1998) O Marketing das Instituições de Ensino Superior: O caso da Universidade da Beira Interior. Dissertação de Mestrado em Gestão apresentada na Universidade da Beira Interior. Universidade da Beira Interior, Covilhã
Bacon D (2003) A comparison of approaches to importance-performance analysis. Int J Market Res 45(1):55–71
Baker DA, Crompton JL (2000) Quality, satisfaction and behavioral intentions. Ann Tour Res 27(3):785–804
Go F, Zhang W (2008) Applying importance-performance analysis to Beijing as an international meeting destination. J Travel Res 35(1):42–49
P. Fernandes et al.
155
Guadagnolo F (1985) The importance-performance analysis: an evaluation and marketing tool. J Park Recreat Adm 3:13–22
Joseph M, Joseph B (1997) Employers‘ perceptions of service quality in higher education. J Market Higher Edu 8(2):1–13
Kotler P, Keller K (2005) Administração de Marketing (12.ª Edição). Prentice Hall, São PauloLee G, Lee C (2009) Cross-cultural comparison of the image of Guan perceived by Korean and
Japanese leisure travelers: importance-performance analysis. Tourism Manage 30(6):922–931Lynch J, Carver R, Virgo J (1996) Quadrant analysis as a strategic planning technique in curricu-
lum development and program marketing. J Market Higher Edu 7(2):17–32Martilla J, James J (1977) Importance-performance analysis. J Market 41(1):77–79Matzler K, Sauerwein E, Heischmidt K (2003) Importance-performance analysis revisited: the role
of the factor structure of customer satisfaction. Serv Ind J 23(2):112–129Pike S (2004) The use of repertory grid analysis and importance-performance analysis to identify
determinant attributes of universities. J Market Higher Edu 14(2):1–18Rial A, Rial J, Varela J, Real E (2008) An application of importance-performance analysis (IPA)
to the management of sport centres. Manag Leisure 13(3/4):179–188Silva F, Fernandes P (2010) Using importance-performance analysis in evaluating of higher
education: a case study. ICEMT 2010 International conference on education and management techonogy. IEEE, 121–123
Tonge J, Moore S (2007) Importance-satisfaction analysis for marine-park hinterlands: a Western Australian case study. Tourism Manage 28(3):768–776
Zhang H, Chow I (2004) Application of importance-performance model in tour guides’ perfor-mance: evidence from mainland Chinese outbound visitors in Hong Kong. Tourism Manage 25(1):81–91
11 Student Perception of Quality in Higher Education Institutions

157M. Peris-Ortiz and J. Álvarez-García (eds.), Action-Based Quality Management: Strategy and Tools for Continuous Improvement, DOI 10.1007/978-3-319-06453-6_12, © Springer International Publishing Switzerland 2014
Abstract Genetic algorithms are an application of evolutionary models derived and used in solving various problems of modelling, programming and optimisation. In this paper, we developed an optimisation methodology using the free Indicore SDK 2.0 software to increase the quality and performance of the results of autotrading robots programmed in the LUA 5.1 language with various parameters optimisable in number and range, by dividing the overall process optimisation into various sub phases. This methodology was applied to an autotrading robot built on the basis of the Moving Average Convergence Divergence technique for the currency pair of EUR/USD. This application was for a time scale of 1 h, during a period of annual in-sample optimisation between 2001 and 2007. We then tested this algorithm by applying the optimal configuration yielded by this process to an out-of-sample phase spanning 2008 to August 2011. The results show that the optimal configuration yielded by the optimisation methodology could be used as a tool to increase the quality of autotrad-ing robots, because, in addition to producing positive results in the optimisation phase, the technique improves performance and behaviour when applied in the testing phase.
12.1 Introduction
Genetic algorithms are the paradigmatic example of evolutionary computation (Mitchell 1995). Genetic algorithms (and other evolutionary techniques) consist of transparent evolutionary models not based on a “black box”, but rather inspired by
Chapter 12Optimisation Methodology Based on Genetic Algorithms to Increase the Quality and Performance in Autotrading Robots
Antonio Alonso-Gonzalez, Vicent Almenar-Llongo, and Marta Peris-Ortiz
A. Alonso-Gonzalez (*) • V. Almenar-LlongoEconomics Department, Universidad Catolica de Valencia “San Vicente Martir”, San Bartolome, Godella, Valencia 46110, Spain
M. Peris-Ortiz Departamento de Organización de Empresas, Universitat Politecnica de Valencia, Camino de Vera s/n, Valencia 46022, Spaine-mail: [email protected]

158
Darwinian evolutionary theory (Dempster et al. 2001). Thus, these models have their axioms rooted in the concept of the “survival of the fittest”, defined as the ease of the best members of a population to breed successfully and pass their most satis-factory features on to the next generation (Holland 1975; Koza 1992; Lazarus and Hu 2001; Noguer 2010). From a computational perspective, the evolutionary mech-anism is the key area in which the researcher can choose and freely set parameters and evolutionary goals.
In this paper we propose an optimisation methodology applicable to autotrading robots as a tool to increase the quality of results in these robots, allowing computa-tional cost reduction through the subdivision of the optimisation process into differ-ent sub phases, performing partial optimisations using genetic algorithms and reaching the optimisation of the last parameter by a final, exhaustive optimisation. To test this methodology, we optimise an autotrading robot based on the divergence signals of the Moving Average Convergence Divergence technique by applying this technique to a scale of 1 h and to the currency pair of EUR/USD. This obtains an optimal configuration which can then, in turn, be applied to a subsequent testing phase to check the final results, quality, and performance levels attained. This chap-ter has the following structure. In the second section, “Theoretical Background”, we present the range of uses and functionality of genetic algorithms, as well as their quality concepts and some interesting results from existing research. In the third section, “Methodology”, we exhaustively describe the optimisation methodology and the notation used in our optimisation proposal, both in terms of general nota-tion, and that applied to test the methodology for the currency pair of EUR/USD, during both the optimisation and testing phases. We also present the data obtained from the optimisation process, testing the described autotrading robot through a detailed and comprehensive analysis, and evaluating the performance of the method as a tool to increase the quality of the overall process. Finally, we highlight the con-clusions of this analysis in the “Conclusions” section.
12.2 Theoretical Background
12.2.1 Genetic Algorithms
The study of genetic algorithms began in 1975 with the publication of John Henry Holland’s book, “Adaptation in Natural and Artificial Systems. An Introductory Analysis with Applications to Biology, Control and Artificial Intelligence.” These studies were subsequently extended by Koza (1992). The work of both authors lays the foundation for what is now known as genetic algorithms, a tool for solving a variety of problems in a wide range of scientific fields. In 1995, Mitchell (1995) defined some of the more common applications of genetic algorithms including genetic programming, machine learning, optimisation problems, economic models,
A. Alonso-Gonzalez et al.

159
models of immune systems, ecological models, and social models. Some of the key applications of genetic algorithms are to help scientists solve problems where the solution space is too large to use standard procedures, as well as providing invalu-able tools where the solution space generates anomalous or irregular behaviour in the system under study.
It is rare to encounter studies where genetic algorithms have been used to define optimisation methodologies to increase the quality of the optimal configurations of trading strategies. In the field of financial markets, genetic algorithms have been implemented mostly to increase the performance of strategies, yielding satisfactory results; usually in conjunction with technical/operational rules. In this vein, Roberts (2002) generated rules using techniques based on genetic algorithms—although the author omits transaction costs from his analysis, and the profits arising from these rules should thus be viewed with caution—, and demonstrated that the application of these rules can distinguish between periods of high profit, and, conversely, slumps and periods of volatility. Lohpetch and Corne (2009) also used genetic algorithms to test the performance of technical rules, obtaining acceptable results in some cases. In summary, these two studies report good results, albeit with limitations such as the need to consider operational commissions or the technical/operational strategy when implementing the genetic algorithm. Some studies state that a limita-tion on the use of genetic algorithms to generate rules or optimisation techniques lies in the need to consider operational commissions. Allen and Karjalainen (1999) discussed the need to take into account transaction costs in research in this field, as their work reveals that the use of genetic algorithms in generating technical rules for equity markets cannot be considered satisfactory when operating fees, although positive results can be observed in very liquid markets with low transaction costs (such as the Foreign Exchange Market).
12.2.2 Utilities of Genetic Algorithms
The three basic uses of genetic algorithms in financial markets are the following.
1) Data classification, using genetic techniques combined with technical or fundamental analysis, yielding successful results in classifying financial data (Doherty 2003).
2) Genetic programming, applied to financial markets, which has had acceptable results (Farnsworth et al. 2004; Subramanian et al. 2006; Matsui and Sato 2011; Chan and Wonk 2012). Outstanding studies in this area are those of Li and Tsang (1999), who successfully predicted the prices of the Dow Jones index based only on historical data using genetic programming techniques and basic rules for making negotiation decisions, although they argue that they ignored transaction costs and initial capital adequacy. Chen et al. (2000) conducted a study along the same lines, successfully using genetic algorithms to generate operational trading rules based on technical analysis.
12 Optimisation Methodology Based on Genetic Algorithms…

160
3) Optimisation, which, as Chen (2005) clearly expounds, is of definite interest in terms of nomenclature and notation. The author provides an operational strategy based on a combination of several techniques and rules, setting out an optimisa-tion methodology, based on genetic algorithms and the detailed definition of various optimisation windows, and then testing this methodology. Lin et al. (2004) answered the question as to whether the savings in computation time resulting from genetic algorithms compensates for the failure to obtain an opti-mal solution and having to settle for an approximation. In their study, they com-pare performance and computation time in the process of the optimisation of a genetic algorithm versus an exhaustive algorithm, concluding that the resulting configurations obtained with the genetic algorithm generate similar benefits to the best solution provided by the exhaustive algorithm, with enormous cost sav-ings in computation time. Subramanian’s (2004) research points to similar find-ings, with this scholar also claiming that, although the convergence of the solutions generated by genetic algorithms is unassured, they are quite robust in the production of near-optimal solutions for a wide variety of problems, particu-larly those for which the explicit formulation of a precise mathematical notation proves difficult.
In this study, the genetic algorithm is used as an optimisation tool combined with a novel methodology to choose the best optimal solution according to a quality cri-teria, to optimise and test an autotrading robot in a Foreign Exchange Market envi-ronment. For the Foreign Exchange Market, studies have mainly focused on the application of genetic algorithms to trading. Neely et al. (1997) used genetic pro-gramming tools to establish rules and negotiation techniques, obtaining strong evi-dence for benefit with these rules in six currency pairs, for a study period from 1981 to 1995. The results show that the rules used detected techniques and data patterns that remain unidentified by the current standard statistical models. Drake and Marks (1998) claim that, although genetic algorithms were initially used in this market for the generation of operational rules for technical or fundamental analysis (in the lat-ter case with more limited results), the real utility of genetic algorithms is their use as a tool to optimise operational technical rules (based on moving average filters, etc.), as the computation time required for this process is massively reduced com-pared to standard optimisation processes. In the same vein, Dunis et al. (1999) used a genetic algorithm as a parametric optimiser indicator based on moving averages applied to historical quotes of the Foreign Exchange Market, with optimisation (in- sample) and testing (out-of-sample) phases. They conclude that, although most of the models used yield good results in the optimisation period, some fail to generate profits in the testing phase, although they go on to explain that limitations in their study might have influenced these results. Subsequently, Hryshko and Downs (2003) found the same problem in their research, when they optimised various rules derived from technical analysis (indicators based on moving averages, relative strength, momentum, etc.) using genetic algorithms. Their results were good for the in-sample period, but not for the out-of-sample period. Hirabayashi et al. (2009) results were acceptable—despite their vulnerability to sudden movements in the
A. Alonso-Gonzalez et al.

161
market—by means of optimisation of technical rules with a genetic algorithm, which is fed back with new quotes to prompt the recalculation of the optimal values for the technical rules.
12.2.3 Problem Resolution Through Genetic Algorithms
According to the literature (Holland 1975; Koza 1992; Kapishnikov and Borisov 2001; Hryshko and Downs 2003; Ergin 2007; Koskinen et al. 2008; Pappu 2011) the common steps of problem solving through genetic algorithms are as follows.
1) Generation of the initial, randomly generated population, creating a number of potential solutions in the search space. The larger the population size, the better the diversity of solutions, although, accordingly, more powerful computational resources will be required.
2) Calculation of the individual elements’ performances, depending on the task performed. The better an element’s performance, the more probability it has to take part in the creation process of the next generation.
3) Selection of individual elements in relation to their income. The best individual elements will be involved in the reproductive stage or calculation of the next generation.
4) Calculation of the next generation, restarting the process, commencing with thefirst phase.
Therefore, in this study, we will introduce a new step that will ensure the introduction of a quality maximisation rule to improve the performance and results of the autotrading robot:
5) Quality control criteria, to select the best optimal solution from the available alternatives.
The concept of quality is very broad and can be defined differently depending on the specific field of the financial markets under study. In terms of financial markets in general, and Foreign Exchange Market in particular, some authors have claimed that the quality of markets are different if concepts and features such as liquidity, volatility, transaction costs, technology, connectivity, ownership, governance, or even the performance of the trading services operating the markets are taken into account (Fu et al. 2003; Allen et al. 2001). Following this view, and shifting the focus from from the general concept of quality of the market to a specific concept of quality related to automation, Hendershott and Moulton (2010) found that the evolution of markets, increasing automation, and reducing the execution time for market orders increases the cost of immediacy (bid-ask spreads)—because of increased adverse selection—and reduces the noise in prices, making prices more efficient and increasing the market’s overall quality. Boehmer (2005), on the other hand, asserts that market quality equates to the cost of order execution in terms of price and time—what he refers to as “execution quality”. This view is supported by Boehmer et al. (2007) study, in which these scholars analyse this execution quality
12 Optimisation Methodology Based on Genetic Algorithms…

162
in decisions taken by investors, and this concept’s relationship with other market information. Garvey and Wu (2009) studied the behaviour of this execution quality in relation to the trading time during the day. Sato and Hawkings (2001) maintain that the quality of services related to any financial market is essential to assess its quality, whilst Weber and Zysman (2001) state that the type of market participants is crucial for market behaviour and therefore influences quality levels of the market. Finally, Nieto (2001) considers information accessibility and quality one of the most important conditions to ensure market quality.
Obviously these prior definitions of market quality are too broad for the scope of this study, since we focus on an optimisation methodology based on genetic algo-rithms applied to an autotrading robot to increase the quality of results and perfor-mance. So, considering just the quality concept applied to automated trading, Payo-Molina and Perez-Gonzalez (2010) define three different quality criteria that must be applied to an autotrading robot in order to study its quality, robustness, and reliability. These are: out-of-sample testing, in which the methodology is used in an optimisation period to obtain the optimal solutions that will be applied in the test phase; in-sample testing, where the optimal solutions are tested during a period and evaluated according to their performance; and online testing, in which the system is connected directly to the market and tested in real time.
12.3 Methodology
12.3.1 Sample
An autotrading robot based on the divergence operation signals of the Moving Average Convergence Divergence technique (hereinafter MACD) was used to study the optimisation methodology proposed and the quality criteria formulated. The data used in the optimisation and testing process were historical quotes from the EUR/USD FOREX market, on a time scale of 1 h, for the period running from the first trading day in January 2001 to the last trading day in August 2011. The historical data series of quotes were taken from the website FXCodeBase.com.
12.3.2 Quality Criteria and General Notation Applied to the Optimisation Process
The optimisation process proposed in this chapter is based on optimising autotrad-ing robots that have a high number of parameters to be optimised in terms of num-ber and range of solutions, which makes it unfeasible for full optimisation due to the massive computational costs and time that this would entail. Therefore, to solve for the parameters of the optimisation phase, we propose a division of the optimisation
A. Alonso-Gonzalez et al.

163
process into several sub phases, using a number of genetic optimisations for resolv-ing most of the parameters until the remaining number of parameters and their range of values permit a final exhaustive optimisation. Before starting the process, most decisive parameters to be optimised are set aside for optimisation in the final exhaus-tive phase, leaving the remaining optimisable parameters to be solved during the series of genetic optimisations. Below, we describe the quality method to be applied at the end of the optimisation process.
Given a robot with m autotrading parameters for optimisation (p1, p2 …, pm) and whose optimisation phase consists of n periods, the Quality Criteria equation applied to the optimisation function of the proposed methodology would minimise the relative deviation parameter (RD), with the following notation:
QualityCriteria RDAD
FinalLiquidityn
wi
i
= ( ) ==
=
∑∑
min min ,i
n
i
n1
1
hhereFinalLiquidity
nICi
i
n
=∑ >
1
where ADi is the absolute deviation (deviation of the final liquidity obtained by the autotrading robot during period i, in comparison with the final liquidity obtained for the whole period of study, in absolute value):
AD Final Liquidity
Final Liquidity
ni ii= −
=∑i
n
1
and where n is the number of periods of the optimisation phase, IC is the initial capi-tal for each period, and Final Liquidity is the final liquidity for period i:
Final Liquidity OptExh m OptGen m OptGeni i i i= ( ) ( ) … ( )( )( )( )f f f−1 1(( )( )
Final Liquidity remains the overall computation function of all the optimisation phases: the corresponding m-1 genetic optimisations and the final, exhaustive opti-misation. Each of the m-1 genetic optimisation allows the constraint of the solutions for the m parameters. Suppose that the first genetic optimisation optimises the parameter p1, the notation is as follows:
OptGen Final Liquidity p si1
11 1= ( ) →
=∑maxi
n
f
Once this first solution s1 for the parameter p1 is bounded, the algorithm passes to the second genetic optimisation to solve the optimal parameter value p2, accord-ing to the solution for parameter p1:
OptGen Final Liquidity p si2
12 2
1= ( ) →=∑maxi
nsf
12 Optimisation Methodology Based on Genetic Algorithms…

164
This process repeats, noting the solution for each parameters according to the previously optimised parameter, up to the m-1th genetic optimisation:
OptGen m Final Liquidity p si m−( ) = ( ) →
=
…− −∑1
11 1
1 2max , ,
i
ns s
mf
The process then arrives to the exhaustive optimisation, solving for the most critical process parameter optimisation pm, depending on the previously solved parameters s1, s2, …, sm-1:
OptExh m Final Liquidity p s
i
n
i m( ) = ( ) →=
…∑ −max , , ,,
1
1 2 1f s s sm
m
12.3.3 Quality Criteria and Notation Applied to the Autotrading Robot
The optimisation problem applied to the autotrading robot was to determine the parameters of the moving average technique MACD m, n, r (where m is the short period exponential moving average, n is the long period exponential moving aver-age, and r is the signal line exponential moving average). The minimum percentage of margin in the account to open a new position (%), the equidistance parameter delta (D), and the quality method discussed above were used to minimise the rela-tive deviation (RD) from the computation of each year, with a final average liquidity that is higher than the initial capital.
In the optimisation process of the autotrading robot, we chose to split the process into four distinct sub phases for each year: two approaching phases to the optimal solutions using genetic algorithms (to reduce the range of total solutions), a resolu-tion phase to find optimal solutions by an exhaustive algorithm (when the spectrum of solutions makes the process viable), and a final phase once these solutions for each year and specific currency pair had been obtained. At this point, the Quality Criteria equation seeks the best solution, measured in terms of the relative deviation of global liquidity, with a final average liquidity that is higher than the initial capital.
In this case, the genetic optimisation depends on two configurable parameters.
• Initial population: the initial number of possible solutions that will participate in the optimisation process. If the initial population is equal to the total population, the optimisation process is exactly the same as the exhaustive process. If, on the other hand, the initial population is smaller, although the process will be faster, it will leave satisfactory or optimal solutions that can later be evaluated.
• Maximum number of generations: the number of attempts made by the genetic algorithm to try to find a better solution for each parameter in the initial popula-tion. The higher the number, the more costly the process, although the probabil-ity of finding a better solution will be higher.
A. Alonso-Gonzalez et al.

165
The default parameters for optimisation provided by the module are:
population
set size set size
set sizeset size=
<
≤ ≤
,
,
log
25
225 256
2 10 sset size otherwise+( )
1 5, ,
generationsset size
otherwiseset size=
<
+( )
1 256
2 10 2
,
,log
where the set size parameter for a sample of n parameters is:
set sizevalue value
stepi i
i
=−
+
=∑i
n
1
1max min
Optimisation processes were configured to maximise the final balance of the capital in the account at the end of each year, with the measure of optimisation being the final value of liquidity, as we deem that, at the end of each period, all open posi-tions should be closed, joining the floating losses or gains to the final balance. The notation for the quality method applied to the optimisation methodology is:
QualityCriteria RDAD
FinalLiquidityn
wi
i
= ( ) ==
=
∑∑
min min ,i
n
i
n1
1
hhereFinalLiquidity
nICi
i
n
=∑ >
1
where n is the number of years of the optimisation period (2001–2007), IC is the initial capital for each period (6,000monetary units), andFinal Liquidity is the final liquidity for a given year:
Final Liquidity OptExh OptGen OptGeni i i i= ( )( )( )( )( )f f f2 1
where Final Liquidity is a function of the three optimisation phases: the first optimi-sation using genetic algorithms, the second optimisation also using genetic algo-rithms, and the final exhaustive optimisation. The first phase allowed for optimising the equidistance parameter delta D, obtaining, in this first optimisation process, the best solution for that parameter given by the following notation:
OptGen Final Liquidity D Di1
1
= ( ) →=∑maxi
n
f
In the second process optimisation, applying the results of the parameter D, and also using optimisation by genetic algorithms, the best solution for the minimum margin percentage in the account to open a new position parameter is:
OptGen Final Liquidityi2
1
= ( ) →=∑max % %i
nDf
12 Optimisation Methodology Based on Genetic Algorithms…

166
Finally, once parameters D and % have been obtained, the exhaustive optimisa-tion is performed, reducing the range of solutions for each year and a particular currency pair to 176 solutions, for which an optimal solution should be selectedusing the optimisation criterion described above:
OptExh Final Liquidity m, n, r m n r
i
n
i= ( ) →=∑max , , .%
1
f D
After obtaining the parameters m, n, r, % and D, optimised for the period 2001–2007 and applying the quality selection to find the optimal solution (according to the methodology and the conditions described above) for the currency pair of EUR/USD, we proceeded to perform the testing results for the out-of-sample period (2008–2011). This required: loading of the automated operating strategy with the same conditions as those established in the preliminary optimisation phase; setting the same constant values for non-optimisable parameters; and establishing the opti-mal values resulting from the optimisation process. The notation for this process is:
Res Final Liquidity Opti= ( )
=∑i
n
f1
where Opt is the optimisation function where the optimal parameters are obtained.
12.3.4 Results
From the optimisation process of the currency pair of EUR/USD the following results were obtained for each of the three phases of optimisation (genetic 1, genetic 2, and exhaustive) and for each optimisable parameter, with the quality control nota-tion after the final optimisation phase given in Tables 12.1 and 12.2:
For parameters D = 0.08 and %=96.4 % obtained in the previous stages of geneticoptimisation, the configuration that meets the Quality Criteria—lowest relative devi-ation and positive (higher than 6,000 m.u.) average final liquidity value of the opti -misation period (2001–2007)—was the second result shown in the table (as opposed to the first), with a configuration of moving averages of m = 2, n=44, and r = 2.
Table 12.1 Parameters after the optimisation process and quality control
Parameter First optimisation Second optimisation Third optimisation
D 0.08 0.08 0.08% – 96.4 96.4M – – 2N – – 44R – – 2
A. Alonso-Gonzalez et al.
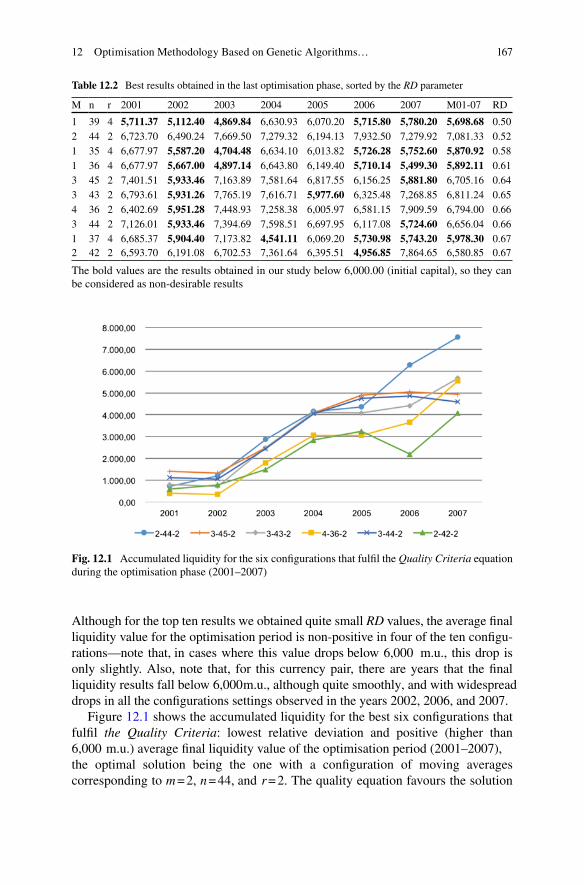
167
Although for the top ten results we obtained quite small RD values, the average final liquidity value for the optimisation period is non-positive in four of the ten configu-rations—note that, in cases where this value drops below 6,000 m.u., this drop isonly slightly. Also, note that, for this currency pair, there are years that the final liquidity results fall below 6,000m.u., although quite smoothly, and with widespreaddrops in all the configurations settings observed in the years 2002, 2006, and 2007.
Figure 12.1 shows the accumulated liquidity for the best six configurations that fulfil the Quality Criteria: lowest relative deviation and positive (higher than 6,000 m.u.) average final liquidity value of the optimisation period (2001–2007),the optimal solution being the one with a configuration of moving averages corresponding to m = 2, n=44, and r = 2. The quality equation favours the solution
Table 12.2 Best results obtained in the last optimisation phase, sorted by the RD parameter
M n r 2001 2002 2003 2004 2005 2006 2007 M01-07 RD
1 39 4 5,711.37 5,112.40 4,869.84 6,630.93 6,070.20 5,715.80 5,780.20 5,698.68 0.502 44 2 6,723.70 6,490.24 7,669.50 7,279.32 6,194.13 7,932.50 7,279.92 7,081.33 0.521 35 4 6,677.97 5,587.20 4,704.48 6,634.10 6,013.82 5,726.28 5,752.60 5,870.92 0.581 36 4 6,677.97 5,667.00 4,897.14 6,643.80 6,149.40 5,710.14 5,499.30 5,892.11 0.613 45 2 7,401.51 5,933.46 7,163.89 7,581.64 6,817.55 6,156.25 5,881.80 6,705.16 0.643 43 2 6,793.61 5,931.26 7,765.19 7,616.71 5,977.60 6,325.48 7,268.85 6,811.24 0.654 36 2 6,402.69 5,951.28 7,448.93 7,258.38 6,005.97 6,581.15 7,909.59 6,794.00 0.663 44 2 7,126.01 5,933.46 7,394.69 7,598.51 6,697.95 6,117.08 5,724.60 6,656.04 0.661 37 4 6,685.37 5,904.40 7,173.82 4,541.11 6,069.20 5,730.98 5,743.20 5,978.30 0.672 42 2 6,593.70 6,191.08 6,702.53 7,361.64 6,395.51 4,956.85 7,864.65 6,580.85 0.67
The bold values are the results obtained in our study below 6,000.00 (initial capital), so they canbe considered as non-desirable results
Fig. 12.1 Accumulated liquidity for the six configurations that fulfil the Quality Criteria equation during the optimisation phase (2001–2007)
12 Optimisation Methodology Based on Genetic Algorithms…

168
with a better linearity among all solutions with final liquidity over 6,000 m.u. Thisoptimal solution is the one that yields the highest final accumulated liquidity (namely, 7,081.33 m.u.) and a general overall linear behaviour, with the exception of the years 2002 and 2005. The other solutions achieve worse accumulated liquid-ity results (from 6,811.24 to 6,580.85 m.u.), as well as linear behaviour. In general,years 2002, 2005, and 2006 diverge from linearity in most of the configurations.
Once the optimal configuration for the optimisable parameters of the autotrading robot in the currency pair of EUR/USD was obtained through the Quality Criteria notation, in addition to analysing the optimal solution yielded by the quality control method, we also analysed the other nine best configurations obtained in the optimi-sation phase, in order to present a more complete analysis of the results from the testing phase. Table 12.3 summarises the results of the annual final liquidity for the test period, the average final liquidity and the relative deviation of each configura-tion for the study period, and the average final liquidity and overall relative devia-tion, encompassing the optimisation and testing phases.
In Table 12.3, the resulting values of average final liquidity in the testing phase are all positive and very high, despite there being some configurations with values of average final liquidity under 6,000 m.u. in the optimisation phase. Also note thatmost of relative deviation values increase in testing period relative to the optimisa-tion period—doubling in some cases—, due to the disparity in results obtained in liquidity values in the testing period for most configurations. The only year in which liquidity values are under 6,000 m.u. across the board is 2011, where falls are quiteconsiderable in some configurations—up to 25% of the initial capital—albeit offer-ing benefits in the case of the optimal setting for this year. For the optimal configu-ration (m = 2, n=44, and r = 2), the relative deviation is 0.09, practically null due to the similarity of the average final liquidity values generated across all the phases during testing, and the total average value of liquidity is 7,297.02 m.u.
Figure 12.2 shows the accumulated liquidity during the testing phase (2001–2007) for the best six configurations that fulfil the Quality Criteria: lowest relative
Table 12.3 Testing phase results for the first 10 configurations obtained from the quality criteria
M n r M01–07 DR 2008 2009 2010 2011 M08–11 DR M01–11 DR
1 39 4 5,698.68 0.50 7,153.06 11,126.06 5,866.14 5,292.99 7,359.56 1.02 6,302.64 1.902 44 2 7,081.33 0.52 7,585.04 7,193.13 7,344.93 7,064.98 7,297.02 0.09 7,159.76 0.611 35 4 5,870.92 0.58 7,986.26 9,338.90 5,158.97 5,683.80 7,041.98 0.92 6,296.76 1.731 36 4 5,892.11 0.61 8,114.39 8,318.52 5,223.68 5,677.23 6,833.46 0.81 6,234.42 1.553 45 2 6,705.16 0.64 8,680.56 7,122.20 10,089.60 5,064.92 7,739.32 0.85 7,081.22 1.573 43 2 6,811.24 0.65 8,283.40 9,621.78 7,965.16 5,015.00 7,721.34 0.70 7,142.19 1.594 36 2 6,794.00 0.66 8,707.81 9,368.98 9,991.48 4,515.10 8,145.84 0.89 7,285.58 1.923 44 2 6,656.04 0.66 8,787.76 6,298.77 9,126.08 5,015.00 7,306.90 0.90 6,892.72 1.621 37 4 5,978.30 0.67 7,948.54 9,574.82 6,090.05 5,596.83 7,302.56 0.80 6,459.85 1.722 42 2 6,580.85 0.67 6,766.23 8,341.43 7,885.28 7,084.42 7,519.34 0.32 6,922.12 1.13
The bold values are the results obtained in our study below 6,000.00 (initial capital), so they canbe considered as non-desirable results
A. Alonso-Gonzalez et al.

169
deviation and positive (higher than 6,000 m.u.) average final liquidity value of theoptimisation period (2001–2007). The optimal solution is the one obtained in the optimisation period and selected using quality conditions, with a configuration of moving averages corresponding to m = 2, n=44, and r = 2. The quality equation applied also favours the solution in the testing stage with the best linearity among all solutions with final liquidity over 6,000 m.u. However, this optimal solutionunderperforms in this testing phase, with the highest final accumulated liquidity being 8,145.84 compared to 7,297.02 m.u. for the optimal solution. The linearbehaviour of this optimal solution is outstanding, albeit being nearly a straight line. The other solutions offer better accumulated liquidity results (from 7,306.90 to8,145.84 m.u.), as well as linear behaviour. In general, no linear behaviours emergein years 2009 and 2011 in most of the configurations.
Figure 12.3 shows the accumulated liquidity during the entire period of study (2001–2011) for the best six configurations that fulfil the Quality Criteria: lowest relative deviation and average final liquidity value of the optimisation period (2001–2007) positive (higher than 6,000 m.u.). In this case, the optimal solutionyields the second highest final accumulated liquidity, 12,757.39 m.u. The linear behaviour of this optimal solution is excellent, with the only exceptions occurring during the optimisation period in years 2002 and 2005, but behaving linearly in both the optimisation and testing phases of the study. There is only one configura-tion that exceeds the final accumulated liquidity obtained by the optimal solution—in this case 14,141.36 m.u.—and the other solutions present worse accumulatedliquidity results—from 9,819.91–12,564.04 m.u.—as well as linear behaviour inseveral years.
Fig. 12.2 Accumulated liquidity in the testing phase (2008–2011 for the six configurations that fulfil the Quality Criteria equation in the optimisation phase (2001–2007)
12 Optimisation Methodology Based on Genetic Algorithms…

170
12.4 Conclusions
One of the most noteworthy contributions of this study is the design of an optimisa-tion methodology and a quality control method that can be applied to any autotrad-ing robot with a large number of optimisable parameters in terms of number and range. Using the LUA Strategy Debugger module of the Indicore SDK 2.0 software, the optimisation strategy and quality method in question allows successive approxi-mations with genetic algorithms for the resolution of the parameters with lower value ranges. The process is then completed with an exhaustive iteration when the number of remaining solutions and computational resources permits such an approach, using the Quality Criteria equation discussed above to find the optimal solution in the final optimisation stage.
To study the optimisation methodology and quality control proposed, an auto-trading robot based on the divergent signals of the MACD technique applied to the currency pair of EUR/USD was optimised, with an optimisation phase (in-sample) for the period 2001–2008 and a testing phase (out-of-sample) for the period between 2009 and the end of August 2011.
After setting the preconditions and establishing the value of non-optimisable parameters for the optimisation of EUR/USD, the process needed two genetic opti-misations and a final exhaustive stage. In the first genetic optimisation, the equidis-tance parameter delta, or D, was obtained. The second genetic optimisation optimised the parameter representing the minimum margin in the account required to open a new position, or %. Finally, in the exhaustive optimisation, using the solu-tion for the values of % and D, MACD technique parameters were optimised for the periods of the exponential moving average of short, long, and signal line. At this
Fig. 12.3 Accumulated liquidity in the entire study (2001–2011) for the six configurations that fulfil the Quality Criteria equation during the optimisation and testing phases (2001–2011)
A. Alonso-Gonzalez et al.

171
point the Quality Criteria equation was used to find the optimal solution among all the solutions obtained, this optimal solution being the one that corresponds to the configuration with lowest relative deviation RD and an average final liquidity that is higher than the initial capital.
Regarding the optimal solution yielded by this optimisation and quality control method, we not only obtained positive results in the optimisation phase, but also in the testing phase, with the final average liquidity value of the optimal solution higher in the testing phase than in the optimisation phase and reducing the relative deviation parameter. Moreover, the optimal solution obtained for the cross EUR/USD obeys a very linear behaviour, with average partial liquidity values offering a roughly constant growth that imply a linear nature.
These results can be extrapolated to the computation of the ten best solutions obtained in the optimisation and quality control phase and applied to the testing phase, although only six of these fulfil the two Quality Criteria conditions during the optimisation stage. Although it would have been understandable to think that the average final liquidity values should have be higher in the optimisation phase than in the testing phase, and the results of the relative deviation should increase, in fact, the opposite is true, with results improving during the testing phase with respect to the optimisation phase for the first ten solutions.
For the above reasons, and due to the overall analysis of the results, we can con-clude that in terms of the optimisation process and quality control notation, the methodology used for the autotrading robot for the currency pair of EUR/USD is satisfactory.
References
Allen F, Karjalainen R (1999) Using genetic algorithms to find technical trading rules. J Financ Econ 51(2):245–271
Allen H, Hawkings J, Sato S (2001) Electronic trading and its implications for the financial systems. BIS Papers No 7: Electronic Finance. A New Perspect Challeng 2001(7):30–52
Boehmer E (2005) Dimensions of execution quality recent evidence for US equity markets. J Financ Econ 2005(78):553–582
Boehmer E, Jennings R, Wei L (2007) Public disclosure and private decisions: equity market execution quality and order routing. Rev Financ Stud 2007(20):315–358
Chan L, Wonk AWK (2012) Automated trading with genetic algorithm neural network. Risk cybernetics. An application on FX Markets. Finamatrix Journal, Leading & Dedicated Research in Risk Control for Sustainable Returns
Chen JS (2005) Trading strategy generation using genetic algorithms. Asian J Inform Technol 4(4):310–322
Chen JS, Deng SX, Lin PC (2000) Generation of trading strategies using genetic algorithms. In: Proceedings of the fifth joint conference on information sciences
Dempster MAH, Payne TW, Romahi Y, Thompson GWP (2001) Computational learning tech-niques for intraday FX. Trading using popular technical indicators. IEEE Trans Neural Network 12(4):744–754
Doherty CG (2003) Fundamental analysis using genetic programming for classification rule induc-tion. Genetic algorithms and genetic programming at Stanford 2003. Standford Bookstore, 45–51
12 Optimisation Methodology Based on Genetic Algorithms…

172
Drake AE, Marks RE (1998) Genetic algorithms in economics and finance forecasting stock mar-ket prices and foreign exchange. A review. Working paper series of the Australian Graduate School of Management. University of New South Wales, Sydney, Australia
Dunis C, Harris A, Leong S, Nacaskul P (1999) Optimising intraday trading models with genetic algorithms. Neural Network World 9(3):193–223
Ergin NH (2007) Architecting system of systems. Artificial life analysis of financial market behav-ior. Partial fulfillment of the requirements for the degree Doctor of philosophy in systems engineering, Faculty of the Graduate School of the University of Missouri-Rolla, USA
Farnsworth GV, Kelly JA, Othling AS, Pryor RJ (2004) Successful technical trading agents usinggenetic programming. Sandia Report. Sandia National Laboratories, Albuquerque, New Mexico
Fu F, Krishnamurti C, Sequeira J (2003) Stock exchange governance and market quality. J Bank Financ 27(9):1859–1878
Garvey R, Wu F (2009) Intraday time and order execution quality dimensions. J Financ Market 12(2):203–228
Hendershott T, Moulton PC (2010) Automation, speed, and stock market quality: the NYSE’s hybrid. J Financ Market 14(2011):568–604
Hirabayashi A, Aranha C, Iba H (2009) Optimisation of the trading rule in foreign exchange using Genetic algorithm. In: Proceedings of the 11th annual conference on genetic and evolutionary computation GECCO 09
Holland J (1975) Adaptation in natural and artificial systems. An introductory analysis with appli-cations to biology, control and artificial intelligence. University of Michigan Press, Ann Arbor
Hryshko A, Downs T (2003) An implementation of genetic algorithms as a basis for a trading system on the foreign exchange market. The 2003 Congress on Evolutionary Computation 03(3):1695–1701
Kapishnikov A, Borisov A (2001) Technical rules optimisation using intelligent hybrid systems. Institute of Information Technology of Riga Technical University, Latvia
Koskinen J, Airas J, Nummelin T, Pekkala T, Starczewski J (2008) Exploring algorithms for auto-mated FX trading constructing an hybrid model. Seminar on case studies in operations research. Helsinki University of Technology, Finnland
Koza JR (1992) Genetic programming: on the programming of computers by means of natural selection. Bradford Book, The MIT Press, Cambridge/London, MA/England
Lazarus C, Hu H (2001) Using genetic programming to evolve robot behaviours. In: Proceedings of the 3rd British conference on autonomous mobile robotics and autonomous systems, Manchester, UK
Li J, Tsang EPK (1999) Improving technical analysis predictions an application of genetic pro-gramming. American Association for Artificial Intelligence
Lin L, Cao L, Wang J, Zhang C (2004) The Applications of Genetic Algorithms in Stock MarketData Mining Optimisation. Wessex Institute of Technology Press, Faculty of Information Technology, University of Technology, Sydney, Australia
Lohpetch D, Corne D (2009) Discovering effective technical trading rules with genetic program-ming towards robustly outperforming buy-and-hold. World Cong Nat Biol Inspire Comput 1:439–444
Matsui K, Sato H (2011) A comparison of genotype representations to acquire stock trading strat-egy using genetic algorithms. Lect Note Comput Sci 6260(11):56–70
Mitchell M (1995) Genetic algorithms. An overview. Complexity 1(1):31–39Neely CJ, Weller P, Dittmar R (1997) Is technical analysis in the foreign exchange market profit-able. J Financ Quant Anal 32(4):405–26
Nieto MJ (2001) Reflections on the regulatory approach to E-finance. BIS Papers No 7: Electronic Finance. A New Perspect Challenge 2001(7):90–97
Noguer M (2010) Statistical arbitrage and algorithmic trading overview and applications. PhD. Thesis. Departamento de Economía Aplicada Cuantitativa II, Facultad de Ciencias Económicas y Empresariales, UNED
Payo-Molina L, Perez-Gonzalez P (2010) Sistemas Expertos: Trading. Inteligencia en Redes y Comunicaciones, 28–36
A. Alonso-Gonzalez et al.

173
Pappu S (2011) Evolutionary algorithms. Project report. Department of Electronics & Telecommunication Engineering, Sardar Patel Institute of Technology, Munshi Nagar, Mumbai, India
Roberts MC (2002) The value of technical analysis. Departament of Agricultural, Environmental and Development Economics, The Ohio State University, Columbus, OH
Sato S, Hawkings J (2001) Electronic finance: an overview of the issues. BIS Papers No 7: Electronic Finance. A New Perspect Challenge 2001(7):1–12
Subramanian H (2004) Evolutionary algorithms in optimisation of technical rules for automatedstock trading. Partial fulfillment of the requirements for the degree of master of science in engineering. Faculty of the Graduate School of The University of Texas, USA
Subramanian H, Ramamoorthy S, Stone P, Kuipers BJ (2006) Designing safe, profitable automatedstock trading agents using evolutionary algorithms. In: Proceedings of the 8th annual confer-ence on Genetic and evolutionary computation
Weber S, Zysman J (2001) E-finance and the politics of transitions. BIS Papers No 7: Electronic Finance. A New Perspect Challenge 2001(7):26–29
12 Optimisation Methodology Based on Genetic Algorithms…

175M. Peris-Ortiz and J. Álvarez-García (eds.), Action-Based Quality Management: Strategy and Tools for Continuous Improvement, DOI 10.1007/978-3-319-06453-6_13, © Springer International Publishing Switzerland 2014
Abstract Nowadays, businesses have to comply with, or manage, a range of governance frameworks and national and international laws based on factors that include legal requirements, the need for good positioning with respect to their com-petitors and provider recognition, a customer prerequisite for hiring them or to enhance competitiveness vis-à-vis the end buyer.
The ultimate goal of them all is to get the organisation ready to meet threats to it by preventing, identifying, correcting, reducing, and accepting the risk, and decid-ing to put in place compensatory measures which, though they may not reduce the risk of occurrence, do nevertheless mean the organisation can deal with some of the related problems in the event of occurrence.
In this field, information technology is, in most cases, in the regulatory and leg-islative spotlight as it is the core factor in business communications and also tasked with managing organisations’ information.
This chapter puts forward a model for implementing good IT governance based on integration into a single management system of the regulatory and legislative frameworks most commonly used in implementation consultancy and compliance audits for the various standards.
Chapter 13Implementation Methodology of Effective Governance to Ensure the Quality of IT Service
Ignacio Gil-Pechuán, Patrick Pullicino, and M. Pilar Conesa García
I. Gil-Pechuán (*) • M.P.C. GarcíaDepartamento de Organización de Empresas, Universidad Politécnica de Valencia, Camino de Vera, Valencia 46022, Spaine-mail: [email protected]; [email protected]
P. Pullicino Dean Campus Midlesex University Malta, Campus Middlesex University Malta, Block A.Alamein Road, Pembroke PBK 1776, Maltae-mail: [email protected]

176
13.1 Introduction
An increasing number of organisations believe that information and the technology associated with it represent their most important assets. Just as in the case of other kinds of assets in a company, quality, control, security and information require-ments for them will also be crucial. Management needs to implement a suitablesystem of internal control.
Today, no one doubts that information has become one of the main assets of companies and in many cases is their main strategic advantage. Hence, enterprises invest huge amounts of money and time in setting up information systems that pro-vide the greatest possible productivity and quality. This is the reason why computer consultancy and auditing issues are becoming increasingly important both interna-tionally and in individual countries.
At country level, legislation with its own legal framework and personal data pro-tection laws have to be addressed before putting forward a model for good IT gov-ernance. Internationally, we would underline the importance of the International Organisation for Standardisation (ISO) as it is responsible for promoting the devel-opment of international manufacturing, trade and communication standards for all industries. Its main role is to seek standardisation of product and safety standards for businesses and organisations at international level.We would also stress the importance of the Information Systems Audit and
Control Association (ISACA,http://www.isaca.org) since it is a globally recognised leader and provider of knowledge, certifications, a professional community, support and education about information system security and assurance, enterprise gover-nance, IT management and IT-related risks and compliance.
All of this helps companies to comply with the law and position themselves by means of certifications in an increasingly difficult market. It is then when the organ-isation bears full responsibility for controlling the normal development of all these aspects by building or adapting its management and internal control strategy by incorporating an appropriate methodology tailored to its specific needs.
To achieve these objectives, it is important for companies to analyse and design a “target model” toward which they want to evolve their information technology and structure each component within their overall management framework, as today innovation is the only way to ensure sustained success. Hence, continued growth in their IT investments is more than likely and organisations need an appropriate framework and actual support in order to go down this route.
To achieve this goal, a robust model of governance for information systems and technology (IST, hereafter only IT) has to be built which is designed to ensureaccountability for business requirements and thus lead to more efficient and effec-tive operations such as:
• Improving governance of the organisation and IT.• Improving understanding between IT executives and other executives.• Improved decision-making due to more timely and better quality information.• Initiatives for projects aligned with business requirements.• Compliance with other regulatory requirements, such as privacy.
I. Gil-Pechuán et al.

177
• Improving operations using an integrated approach to process security, availabil-ity and integrity.
• Optimised risk management.• More efficient prioritisation of business and IT initiatives.
Finally, it should be noted that any proposal for an IT governance model also needs to proactively bear in mind the ongoing publication of the successive versions of frameworks such as COBIT and ITIL, and standards such as ISO 17799 and2700, since they also contribute significantly to the consolidation and improvementof the IT governance concept.
13.2 IT Governance
The concept of “IT governance” first emerged in the mid-1990s and has sincematured and grown to take in increasing numbers of topics and areas to the point that it has become a discipline in itself. The term was first used by Loh andVenkatraman (1992), and then by Henderson and Venkatraman (1993), to describe the set of mechanisms that provide the IT capabilities required for the optimal oper-ation of business processes.There are multiple definitions of IT governance; thus, for example, Luftman
(1996): “IT governance is the selection and use of relationships such as strategic alliances or joint ventures to obtain key IT competencies.” Subsequently, VanGrembergen (2002) defined it thus: “IT governance is the organisational capacity exercised by the board, executive management and IT management to control theformulation and implementation of IT strategy and in this way ensure the fusion of business and IT.” Somewhat later, Van Grembergen et al. (2004) argued that “IT governance consists of the leadership and organisational structures and processes that ensure that the organisation’s IT sustains and extends the organisation’s strat -egy and objectives.”The IT Governance Institute (ITGI 2003) stresses that IT governance is “the
responsibility of the Board of Directors and executive management. It is an integralpart of enterprise governance and consists of the leadership and organisational structures and processes to ensure that the organisation sustains and extends itsstrategy and objectives.”
Weill and Ross (2004) characterise IT governance as “specifying the decision rights and accountability framework to encourage desirable behaviour in the use of IT.” In this respect, it is worth remembering that Allen (2005) defines governance as “setting clear expectations for the conduct (behaviours and actions) of the entitybeing governed, and directing, controlling, and strongly influencing the entity to achieve these expectations.”
Another definition of IT governance comes from Dahlberg and Kivijarvi (2006), who proposed an integrated IT governance framework that seeks to integrate the structural and process perspectives of IT governance, business alignment, IT opera-tions and performance measurement and delivery of value.
13 Implementation Methodology of Effective Governance…

178
Webb et al. (2006) aver (after analysing more than 12 definitions) that “IT gover-nance is the strategic alignment of IT with the business such that maximum businessvalue is achieved though the development and maintenance of effective IT control and accountability, performance management, and risk management” (Table 13.1).Based on the existing literature, Simonsson and Johnson ( 2006) put forward a
detailed definition: “IT governance is about IT decision-making: the preparation for, making of and implementation of decisions regarding goals, processes, people and technology on a tactical and strategic level”. They therefore work according to three dimensions: Scope, Domain and Decision-Making Process.
A) Domain: denotes what the decisions should consider based on four dimensional units:
a. Goals: strategy-related decisions, IT policies and guidelines, and control objectives.
b. Processes: implementation and management of IT processes. c. People: relational architecture within the organisation, and roles and
responsibilities. d. Technology: the physical things that management decisions consider are part
of actual hardware, software and facilities.
B) Decision-making process: three phases are highlighted:
a. Understanding: before deciding, understand the decision in its entirety. b. Deciding: according to corporate IT principles, and defining the How, the
Who and responsibilities.c. Monitoring: follow-up and monitoring of any decision.
C) Scope:
a. Tactical decisions: detailed and precise low-level management IT-focussed decisions that are carried out quickly.
b. Strategic decisions: top management, low detailed and with a long timeline.
Table 13.1 A comparison of governance frameworks in Webb et al. (2006)
Corporate governance
Strategic information systems planning IT governance
Strategic direction Aligning investment in IS withbusiness goals
Strategic alignment
Exploiting IT for competitiveadvantage
Delivery of business value through IT; exploiting opportunities andmaximising benefits
Performance management
Directing efficient and effective management of IS resources
Performance management; IT resources must be used responsibly
Risk management Risk management; IT related risks to be managed appropriately
Policies and procedures
Developing technology policies and architectures
Control andaccountability
I. Gil-Pechuán et al.
179
The ITGI drew up its own exceptional definition, known as Taking Governance Forward, in which it defines IT governance as “a governance view that ensures that information and related technology support and enable the enterprise strategy and the achievement of enterprise objectives and the functional governance of IT, i.e., ensuring that IT capabilities are provided efficiently and effectively”.
Finally, we should also mention the important contribution to this conceptualisa-tion of IT governance made by ISO 38500, which provides the following formaldefinition of IT governance: “The system by which the current and future use of IT is directed and controlled. Corporate governance of IT involves evaluating anddirecting the use of IT to support the organisation and monitoring this use to achieve plans. It includes the strategy and policies for using IT within an organisation”.
13.3 Differences Between IT Governance and Management
It should be borne in mind that while IT management is more focused on the inter-nal supply of IT and is geared towards the present, IT governance is broader in that it also aims to meet external demands (from customers) and in a future time horizon(Peterson 2003). Thus, management focuses on administering and implementing strategies in daily operations while governance is responsible for setting these strat-egies along with the organisation’s policies and culture.
Furthermore, Hamaker and Hutton (2004) argue that while enterprise gover-nance concerns the overall accountability framework which coordinates all man-agement activities vis-à-vis all stakeholders, corporate governance relates mainly to the board, executives and shareholders. IT governance, meanwhile, focuses on theuse of technology to meet the organisation’s goals set by management. Thus, corpo-rate governance includes aspects of IT governance because without effective IT management, those tasked with corporate responsibilities could not function effec-tively (Fink et al. 2006).
Over recent years, the word “governance” has become widespread and fashion-able. As a result, terms including software project governance, software architec-ture governance, database governance, SOA1 governance, software development governance, and security governance are used. However, although there are aspects of “governance” in all these specific areas, governance, in fact, focuses on sixprinciples, namely accountability, strategy, procurement, performance, compli-ance and the human factor, and three functions, i.e. assessing, managing, and monitoring.
In short, with the appearance of new businesses and new tools for enterprises, IT governance is responsible for aligning the IT plan with the company’s business plan, while an “IT factory” is in charge of managing specific areas with the new services and operations that are brought in (see Fig. 13.1).
1SOA governance is a concept used for activities related to exercising control over services in aservice-oriented architecture (SOA).
13 Implementation Methodology of Effective Governance…

180
13.4 Factors in the Consolidation of the Importance of IT Governance
As we have seen, and as pointed out by Hamaker and Hutton (2004), IT governance is not new but rather a collection of tools and techniques for managing IT that have been validated by the passage of time and from a broader perspective than that afforded them in the 1980s or 1990s.
However, historically, IT governance activities have not received sufficient senior executive support due to the technical nature of some of the issues or lack ofresources (Hamaker and Hutton 2004). This means that in many organisations the implications and scope of IT governance are not well understood.
The historical relationship between organisations and IT has not been satisfactory. It has not found it easy to achieve its objectives, either because the role of IT has lost its value in the organisation or because it has been considered a mere commodity (for example, administrative support functions), as evidenced by the cycles of restructur-ing, reengineering, downsizing, internalisation, backsourcing and offshoring which the IT function has undergone in many organisations. All of them have been carried out with the primary objective of cutting costs, and therefore reflect the failure to achieve an effective relationship between IT and the organisation.IT has to be flexible as organisational alignment is one of the most important
challenges facing companies, and unfortunately, the difficulties in achieving and sustaining strategic alignment have been largely underestimated (Hirschheim and Sabherwal 2001). Although IT investment and infrastructure are necessary, “they are not enough” as the identification of its value and the flexibility required for man-agement will not be created without mutual understanding and a shared agenda between business managers and IT managers (Prahalad and Krishnan 2002).
Fig. 13.1 ICT as support forcompany management (Fernández Sánchez and
Piattini Velthuis 2012)
I. Gil-Pechuán et al.

181
13.5 Definition of the Problem and Components of the Model
All enterprises are required to comply with or manage a number of laws or regula-tions to meet their legal obligations. Alternatively, they choose to do so to positively stand out from their rivals.
From their case studies, De Haes and Van Grembergen (2006) identified different drivers for adopting IT governance; in addition to the need to comply with legisla-tive requirements (for example, Sarbanes-Oxley 2), other important drivers for IT governance were the push to achieve economies of scale after mergers and acquisi-tions and budget pressure to focus on activities that add value to the business.
Hardy (2006) stresses that building a robust model for IT governance designed to ensure accountability for business requirements can also lead to more efficient and effective operations such as:
• Improving governance of the organisation• Improving understanding between IT executives and other executives• Improved decision-making due to more timely and better quality information• Initiatives for projects aligned with business requirements• Compliance with other regulatory requirements such as privacy• Improving operations using an integrated approach to process security, availability
and integrity• Optimised risk management• More efficient prioritisation of business and IT initiatives
Of course the publication of the successive versions of frameworks such as COSO,3 COBIT and ITIL and standards such as ISO 17799 and 27000 have alsobeen instrumental in the consolidation of the IT governance concept in organisa-tions since their progressive adaptation and honing lead to increased awareness of them and thus facilitate their adoption and compliance. Therefore in this chapter we present an implementation model that seeks to integrate the most used frameworks into a single management system.
There are multiple frameworks for IT governance and management. The best known are probably COSO, COBIT, CMMi, UNE-ISO/IEC 27001:2007, ISO/IEC15504:2004, ISO/IEC 15408:2009, ITIL, PMBOK, etc. Some focus on very spe -cific areas, such as ISO/IEC 15408:2009 and PMBOK, while others are very broad,such as COBIT and COSO. However, we can clearly identify five major domains of
2 Sarbanes-Oxley Act of 2002, Pub. L. No. 107–204, 116 Stat. 745 (30 July 2002).3 The Committee of Sponsoring Organizations of the Treadway Commission (COSO) is a joint initiative of five private sector organizations, established in the United States, dedicated to provid-ing thought leadership to executive management and governance entities on critical aspects oforganizational governance, business ethics, internal control, Enterprise risk management, fraud and financial reporting.
13 Implementation Methodology of Effective Governance…

182
IT governance (according to ITGI 2003 and Webb et al. 2006) that we need to consider in our proposal:
1. IT strategic alignment2. Delivery of business value through IT3. Risk management4. IT resource management 5. Performance measurement
The first two would be output or product, while the last three would be IT governance drivers.To examine the structures, processes and relational mechanisms for IT governance
we turn to De Haes and Grembergen (2004), who refer to the various committees and boards, and roles and responsibilities. “Processes” include decision-making, strategic planning, service level agreements, etc. In terms of “mechanisms”, these authors pick out active participation by stakeholders, shared understanding, active conflict resolution, rewards and incentives, cross-functional training, job rotation, etc. As Van Gremberger (2004) points out, since IT governance is an integral part of organisation governance, the Steering Committee appoints a committee to carry outtasks related to IT governance. This committee is called the IT Strategy Committeeand it assists the Steering Committee and ensures that it has the information neces-sary to meet IT governance objectives.“Governance structures” include Internal Control—the COSO Integrated
Framework—a financial reporting control framework that defines the internal con -trol conducted by the steering committee and other managers to provide reasonable confidence about meeting targets for the effectiveness and efficiency of operations, reliability of financial reporting and compliance with laws and regulations.
In addition to the above contributions, we also need to analyse two models devel-oped by the ISACA: COBIT, similar to COSO but focused on IT control, and ValIT,4 which meets organisations’ need to optimise the realisation of value from IT investments and encompasses value governance, portfolio management and invest-ment management (Val IT rounds off COBIT from a financial and business stand -point that helps towards the delivery of value). Val IT focuses on the decision to invest and obtaining benefits while COBIT is focused on implementation, i.e.whether we are doing things correctly and properly (ITGI 2006).Mention should also be made of the ITIL framework, because while COBIT
focuses more on “what is to be done” to achieve good IT governance, ITIL sets outin detail “how it is to be done”. Thus, ITIL is a factor in the model supplementingCOSO and COBIT that puts forward good practices for IT service management.5
4 Val IT is a governance framework, published by IT Governance Institute, that can be used to create business value from IT investments.5Other frameworks are the Common Criteria for Information Technology Security Evaluation(ISO 15408), Guidelines for the Management of IT Security (GMITS, ISO 13335), OperationallyCritical Treat, Asset, and Vulnerability Evaluation (OCTAVE) and the System Security EngineeringCapability Maturity Model (SSE-CMM).
I. Gil-Pechuán et al.

183
There are other models and many standards and the list will undoubtedly con-tinue to grow, though not all of them can be used together as this would create highly complex integration challenges. However, parts of each standard can beadapted and tailored to each organisation. Each of the standards is intertwined with the others in the context of managing good corporate governance and good businessgovernance, which as a whole is called “enterprise governance” (Fig. 13.2).
Good corporate governance seeks to combine the enterprise’s business needs, business strategies and IT objectives, while good business governance focuses on determining how these objectives are met through project initiatives (whether in IT or not) by monitoring and measuring.
Good IT governance encompasses tasks in both areas, ranging from defining business objectives to monitoring performance and achievement of these objectives.
13.6 Implementation of an IT Governance Model
The process of implementing IT governance assists the various levels of the organ-isation with a detailed roadmap that helps to implement IT governance needs. This roadmap presents a project that can be lengthy and will call for strict project man-agement practices which are too extensive to be covered in this chapter.
Good IT governance enables a system in which all stakeholders, including mem-bers of senior management, employees and managers of other departments in the company, have the necessary input into the decision-making process. This prevents misalignment between IT objectives and business objectives.
Fig. 13.2 Correlation of ITgovernance models for good enterprise governance
13 Implementation Methodology of Effective Governance…

184
13.6.1 Where Do We Start?
Identify who the stakeholders are. To start implementing IT governance it is neces-sary to identify the stakeholders who are interested in its implementation and moni-toring, usually the board of directors, executive management, informationtechnology management and any other role identified as appropriate in accordance with individual practices (the laws and regulations governing the business).
Set up a strategy committee. Arrange communication relationships and channels so they facilitate decision-making. Based on best practices in IT governance imple-mentation, this can be achieved by setting up a strategy committee. When doing this, it is important to ask the following questions:
• What organisational structure is there in the organisation?• Which channels provide effective communication in the organisation?• What is the prevailing organisational culture?• Is it a centralised, decentralised or hybrid organisation?• Are there any subsidiaries?• Is the organisation a subsidiary?• Are there any special circumstances? What are they?
The IT strategy committee should be at the highest management level of the organisation and integrated with components that can provide strategic vision, decision-making, experience in information technology issues, and support in allthe organisation’s areas. Likewise, plans have to be made to set up one or moresteering committees and site them at executive managerial levels to lead the imple-mentation of IT governance and continuously report to the strategy committee.
Assign and document responsibilities. Each participant will have their responsibili-ties throughout the implementation of IT governance and its ongoing maintenance.
Determine an implementation plan which chooses a system or framework to support it in line with the organisation’s features. Some of the industry’s existing frame -works and good practices for implementing IT governance are:
• The IT Governance Institute (ITGI) adopts the Control Objectives for Informationand Related Technology (COBIT) and the practices in the processes described inits IT value framework (Val IT).
• The framework proposed by the CISR 6 at the Massachusetts Institute ofTechnology.
• The Information Technology Infrastructure Library (ITIL).
The framework chosen to implement IT governance will have to comply with the laws and regulations that are binding on the organisation as part of its normal course of business. A combination of these frameworks can also be tailored to meet indi-vidual needs.
6CISR—Center for Information Systems Research (MIT): http://cisr.mit.edu/about/our-mission/
I. Gil-Pechuán et al.

185
Hence, based on ITGI and COBIT, we can specifically put forward a plan forimplementing IT governance, which should involve consideration of the following points or domains:
• Establishing a governance framework to provide/deliver value to the entire organisation
• Aligning IT strategy with business objectives• Understanding and managing risks• Analysing current resources and capabilities (and identifying gaps)• Measuring performance (results) (Fig. 13.3)
To increase the chances of success in this implementation, an “IT Governance Action Plan” should also be drawn up which (according to the ITGI) provides for:
• Activities: comprising the actions to be carried out and topics• Outcome measures: directly related to IT governance topics• Best practices: i.e. examples of how IT governance leaders are performing activities• Critical success factors: the essential conditions, skills and attitudes for success-
ful best practices• Performance indicators: providing information about how IT governance is being achieved, for example, response times.
The most important obstacle in carrying out these proposed IT governance actions is that they are often confused with best practice IT management and control frameworks. To avoid this, ISO 38500 has helped clear up this confusion by describ-ing good IT governance as the management system used by senior management, in other words, that “good IT governance is about administering IT resources to satisfy stakeholders who expect a return on their investment”. Those in charge of thisadministration will look to senior management to implement the IT systems and controls required to achieve this ROI.Furthermore, the existing IT management and control frameworks provide mod-
els for managing risk and controlling objectives, which are essential components of
Fig. 13.3 The five domains of IT governance (COBITDiamond)
13 Implementation Methodology of Effective Governance…

186
good IT governance, although under ISO 38500, it will be much more important forthis IT governance to focus on the delivery of value.
Given the limitations present in most organisations, an implementation mecha-nism to weigh up these limiting factors and implementation requirements has to be found. It should be borne in mind that any process improvement initiative (such as the implementation of good IT governance) can cause more harm than good if used improperly.
Hence, the key to implementing good IT governance within the limitations dis-cussed above begins by focussing on what most benefits the organisation and teams, in other words by prioritising the practices which most benefit the company in terms of solving real problems. We can thus highlight the following key criteria for suc-cessful implementation:
• Focus on attacking the problem, not the solution.• Focus on resource downtime.• Base process implementation on technological change, i.e. tap IT to implement
these processes.• Perform this process in several cycles or iterations, where each iteration solves a real
business problem. This will enable continuous improvement in the organisation.• Manage change.
The quintessential model that iteratively supports this cycle for continuous improvement in the implementation of best practices and processes is the Deming Cycle [also called the PDCA (Plan-Do-Check-Act) cycle]. Improving alwaysinvolves changing and the improvement should be defined in terms of business goals and handled in the same way. An improvement process means organised and systematic continuous improvement of the way in which activities are carried out to better meet business objectives (Fig. 13.4).One of the great characters in the improvement processes in the United States
was Dr. Edward W. Deming. Continuous improvement processes began to take offin the 1950s. At the beginning of the 1990s, a number of initiatives emerged toimplement best practices in software development which led to a series of industry models and standards being drawn up and published.
Fig. 13.4 Deming cycle, 1950 (Imai 1886)
I. Gil-Pechuán et al.

187
In the search for competitive advantage, many companies focused on improving their operational processes while forgetting that an organisation’s real advantages come from the union of all its activities and not from advantages obtained in iso-lated activities.At the end of the 1990s, standards and models geared towards business manage -
ment as a whole were updated in line with this new vision: MoProSoft, Bootstrap, theIDEAL model (integrated models for software companies, ISO/IEC TR 15504 valua-tion models for an organisation’s processes, ISO 9000:2000 quality management sys-tems), whose scope is the whole of the undertaking, where it is the connection between activities that is the real advantage and not each of the activities in isolation.The IDEAL software process improvement (SPI) (Software Engineering Institute
1996) model can be used to guide the development of an integrated long-range plan using an SPI programme. The purpose of the model proposed in this chapter is toprovide an adaptation of this general model in its application to the implementation of IT governance, since this model is not restricted solely to software implementation but can also be used for any type of process implementation and is therefore valuable for bringing in good IT governance.
This process implementation and improvement model also focuses on enabling continuous improvement and gradual standardisation, but this time in five phases:
Initiating: this is the phase where the implementation decision is taken, the detailed implementation procedure is chosen and senior management’s commitment and support for implementation is ensured. In this first phase, an IT governance start- up project is to be drawn up consisting of (Van Grembergen and De Haes 2008):
• Setting up the IT Governance Committee (ITGC) which will be responsible forstarting up IT governance in the organisation.
• Training the ITGC. Executives have to be “trained” as they are probably unawareof the importance of good IT governance and knowledge of this organisational culture is not widespread.
DiagnosingIn this phase, each process and/or standard to be implemented is brainstormed to identify the current state of processes and identify their problems. The following measurements are also added:
• Self-assessment of the initial maturity of IT governance, which aims to deter -mine the initial maturity of IT governance in the organisation.The maturity model proposed by the ITGI, which features six possible levels,
is recommended:
– Non-existent (0); the organisation does not know about the principle and isnot aware it needs it.
– Initial/ad hoc (1); the principle is established but processes are disorganised and ad hoc.
– Repeatable but Intuitive (2); the principle is immature and processes follow aregular pattern.
13 Implementation Methodology of Effective Governance…

188
– Defined Process (3); the principle is starting to mature, processes are docu -mented and communicated.
– Managed and Measurable (4); fairly mature principle, processes are moni -tored and measured.
– Optimised (5); optimum principle, processes are based on best practice.
• Drawing up an IT governance improvement plan. The committees examine thecurrent status of their IT governance and the state of maturity they wish to achieve for the year ahead, thus determining the target maturity.
EstablishingIn this phase, a decision is made about where to start, i.e. actions are prioritised. The good practices that help eradicate the problems that have been prioritised should be reviewed and a set of specific actions to address these problems needs to be estab-lished in this iteration of the improvement.
The most important action the governance team should take is to set up a regu-larly updated IT Project Portfolio. This initiative should also be supplemented with the following actions:
• Establish a template for drafting IT projects including all relevant information (objectives, benefits, steps, performance criteria and associated risks) that the governance team requires to establish the order in which they are to be carried out.
• Properly calculate the cost of an IT project, taking into account IT investment and maintenance costs and also the cost of human resources, their training and, in general, the cost of the organisational changes that the project entails.
• Include actions in IT projects to deal with the risks posed by a lack of commit-ment by participants. This means training everyone concerned and thus ensuring their engagement, maximum performance by the IT in place, success of thechange promoted and consequently, an improvement in the service supplied, and also setting up committees and working groups to facilitate the participation, and therefore, the engagement of stakeholders in the design, monitoring and final evaluation of IT-based change processes.
• Regularly publish the objectives of the IT projects to be implemented and develop a procedure to measure whether they have been achieved once the project has been completed.
ActingIn this phase, the tools required to carry out the predefined actions have to be speci-fied. This is where people with more experience in the field should be brought onboard to run the processes in place.However, a perfect process should not be aimed for the first time round as this will be improved in each iteration. It is important to draw up documents in order to sub-sequently learn from the actions carried out.The governance team should devote sufficient resources to maintaining the perfor-mance of IT-based services with a high degree of satisfaction for stakeholders con-nected with the service. This can be helped by the following good practices:
I. Gil-Pechuán et al.

189
• Establish what IT resources (technical and human) the organisation has, as a first step in planning new resources.
• Have a procedure in place for IT procurement including analysing various offers based on strategic objectives, and not only on technical and economic principles.
The governance team should regularly look at user requirements and set up a proce-dure to examine the satisfaction of the various stakeholders connected with theIT-based services in operation.
LearningIn this last phase, problems related to the process or other processes should be com-piled to be addressed in the following improvement iteration. Documents about actions taken and the results of those actions should be referred to. This is the factor that generates continuous learning in the organisation and is the basis for continuous improvement.The governance team should draw up and publish a directory of IT-related policies to provide guidance on how to roll out IT across the organisation. It should also design a procedure to measure whether they become known, understood and respected by the entire organisation. The most essential IT policies at present are:
• A policy providing guidance on the different types of procurement and different types of relationships with providers.
• A policy setting out the expected performance of IT-based organisationalprocesses.
• A policy to promote the widespread use of IT-related professional standards and good practices in the organisation.
The governance team needs to ensure compliance with external legislation andinternal regulations. The following measures are recommended for this purpose:
• Formally assign responsibility for being familiar with IT-related legislation to a person or group and establish when their competence is to be reviewed to ensure IT regulatory compliance in the organisation.
• Draw up and update a reference directory containing IT-related external regula -tions and laws affecting the organisation, and design and publish another direc-tory that includes the internal procedures and regulations implementing the IT policies specified by management.
• Measure how widespread employee knowledge of IT legislation and policies isand run training schemes about compliance with external legislation and internalpolicies and regulations.
• Assign responsibility to a person or group for monitoring regulatory compliance in the organisation and drawing up reports for the governance team which set out the level of compliance with external legislation and internal policies andprocedures.
The governance team should drive IT management based on standards (forexample,ITIL, ISO 20000). The first measures to be taken in this respect should be:
13 Implementation Methodology of Effective Governance…
190
• Formally assign responsibility for being familiar with IT-related standards to a person or group.
• Draw up and update a reference directory containing the IT-related standards applicable to or already applied in the organisation.
Finally, in its analysis of IT-related risks, the governance team should identify fac-tors associated with resistance to change by affected people or groups, and the lack of commitment of those involved. A first step to resolve this issue would be to start up an awareness process which reduces people’s resistance to an IT-based change process (information, training, etc.).
13.7 Conclusions
IT is no longer strategic as it is accessible to all competitors in a given sector. The key to it becoming a strategic asset once more lies in its governance, in manage-ment that minimises operational risks and ensures continuous support for the business.
In addition to the above, as a final conclusion, we might mention that there is a problem in IT management in enterprises, and standards help to solve these prob-lems. However, there are many standards around and not all of them should be used. It is also necessary to know which ones to use and how to integrate those used.
These standards are the foundation for good IT governance which will ensure the benefits of investments in IT are achieved based on proper management of risk, resources and strategic alignment. Implementing good IT governance is only pos-sible if it is backed by a framework of performance standards and regulations to ensure that the IT unit supports the organisation’s business objectives.
Adopting a progressive implementation plan, with a focus on continuous improvement and gradual standardisation, should be the model for implementation that enables relatively quick visibility of the benefits of good IT governance, and better handling of cultural change in the organisation.
The proposed model provides a clear identification of roles by working commit-tees with defined responsibilities in the allocation of resources, a planning/improve-ment cycle for resource optimisation, effective change or new business proposal management, and a model that is aligned at all times with the organisation, and improved service quality, as it proposes measurement and better understanding of the role of IT in delivering organisational value.
The proposal is based on two fundamental constraints at source: the need to deliver value to the business, and to reduce IT-related risks. Appropriate IT gover-nance provides the structures that connect IT processes, IT resources, and informa-tion with the company’s strategies and objectives. It also integrates and institutionalises good (or best) practices for planning and organisation, procurement and implementation, service delivery and support, and monitors IT performance to ensure that the company’s information and related technology support its business
I. Gil-Pechuán et al.

191
objectives. Thus, by means of the proposed model, IT governance leads the com-pany to take full advantage of its information and with it maximise its benefits, capi-talise on its opportunities and gain competitive advantage.
References
Allen J (2005) “Governing for Enterprise Security.” (CMU/SEI-2005-TN-023). Pittsburgh, PA:Software Engineering Institute, Carnegie Mellon University, June 2005. http://www.sei.cmu.edu/library/abstracts/reports/05tn023.cfm
Dahlberg T, Kivijarvi H (2006) An integrated framework for IT governance and the developmentand validation of an assessment instrument. In: Proceedings of the 39th Hawaii internationalconference on system sciences. IEEE Computer Society
De Haes S, Van Grembergen W (2006) An exploratory study into IT governance implementations andits Impacto n Business/IT alignment. Inform Syst Manage 26:123–137, Taylor & Francis Group
De Haes S, Grembergen WV (2004) IT governance structures, processes and relational mechanisms:achieving IT/Business alignment in a major Belgian financial group. Paper presented at the 38thHawaii International Conference on System Sciences, January 5–8, Big Island, HI, USA
Deming WE (1950) Elementary principles of the statistical control of quality. JUSE, JapanFernández Sánchez CM, Piattini Velthuis M (2012) Modelo para el gobierno de las TIC basado enlas normas ISO. AENOR, Madrid
Fink D, Huegle T, Dortschy M (2006) A model of information security governance for E-business.Idea Group
Hamaker S, Hutton A (2004) Principles of IT governance. Inform Syst Control J, 2Hardy G (2006) Using IT governance and COBIT to deliver value with IT and respond to legal,regulatory and compliance challenges. In: Information Security Technical Report. pp 55–61
Henderson JC, Venkatraman N (1993) Strategic alignment: leveraging information technology fortransforming organizations. IBM Syst J 32(1):4–16
Hirschheim R, Sabherwal R (2001) Detours in the path toward strategic information systems align-ment. California Manage Rev, Fall 44(1):87–108
Imai M (1886) Kaizen: the key to Japan’s competitive success. Random House, New York, p 60ISO 38500 (2008) Corporate Governance of Information Technology. http://www.iso.org/iso/pressrelease.htm?refid=Ref1135
ITGI. IT governance executive summary. IT Governance Institute (http://www.itgi.org)Loh L, Venkatraman N (1992) Diffusion of information technology outsourcing: influence sourcesand the Kodak effect. Inform Syst Res 3(4):334–359
Luftman J (1996) Competing in the information age: strategic alignment in practice. OxfordUniversity Press, Oxford
Peterson R (2003) Integration strategies and tactics for information technology governance.Strategies for information technology governance. Idea Group, London, pp 37–80
Prahalad CK, Krishnan MS (2002) The dynamic synchronization of strategy and information tech-nology. MITSloan Manage Rev 43(4):26
Simonsson M, Johnson P (2006) Defining IT governance-A consolidation of literature. In:Proceedings of the 18th Conference on advanced information systems engineering (CAISE)Luxembourg
Software Engineering Institute (1996) Carnegie Mellon University, IDEALSM: a user’s guide forsoftware process improvement
Van Grembergen W (2002) Introduction to the minitrack IT governance and its mechanisms. In:Proceedings of the 35 Hawaii international conference on system science. IEEE Compute Society
Van Grembergen W, De Haes S, Gundentops E (2004) Structures, processes and relationalmechanisms for IT governance. Strategies for information technology governance. Idea Group,London, pp 1–36
13 Implementation Methodology of Effective Governance…

192
Van Gremberger W (2004) Strategies for information technology governance. Idea Group, LondonVan Grembergen W, De Haes S (2008) Implementing information technology governance: models,
practices and cases. IGI Global, Hershey, PAWebb P, Pollard C, Ridley G (2006) Attempting to define IT governance: wisdom or folly. In:Proceedings of the 39th Hawaii international conference on system science. IEEE ComputerSociety
Weill P, Ross JW (2004) IT governance: how top performers manage IT decision rights for superior results. Harvard Business School Press
I. Gil-Pechuán et al.

193
A Absorptive capacity , 15–20 Academic performance , 1, 2, 79, 144 Action-Based Management (ABM) , 13–20 Auditing , 55, 98, 176 Austrian Economics , 14, 20 Automated trading , 162 Autonomous Community of Galicia , 63 Autotrading robot , 157–171
B Barriers , 5, 54, 58–62 Business , 9, 20, 21, 39, 44, 46–48, 50, 70, 71,
100, 120, 127–138, 148, 149, 153, 154, 176–178, 180–187, 190
governance , 183 results , 71, 83–95, 132
C Certifi cation , 3–9, 54, 56, 58, 68, 72, 99,
116–123, 133, 140, 176 bodies , 116
Community regulation , 55 Competence factors , 107 Competence management , 106 Competitiveness , 1–4, 7, 8, 15, 28, 29, 44,
57, 129 Confi rmatory factor analysis (CFA) , 60, 61,
74, 75 Contingency , 93, 94 Continuous improvement , 8–10, 14, 18, 31,
55, 58, 68, 70, 71, 77, 84, 87, 89–91, 94, 116, 186, 187, 189, 190
Control system , 69, 75, 78, 85, 87–88
Corporate governance , 179, 183 Costs , 10, 20, 57, 67–79, 158, 160, 161, 188 Creating opportunities , 21 Critical , 7, 15, 20, 48, 69, 75, 78, 79, 90, 116,
127–138, 181, 182, 185 Currency pair , 158, 160, 164, 166–168,
170, 171 Customer
contact , 14, 21 focus , 7, 10, 19 satisfaction , 4, 5, 7, 8, 10, 19, 28–31, 44, 132
D Descertifi cation , 116–120, 122, 123
pattern , 123 Descriptive analysis , 4, 7, 101, 148 Diagnostic systems , 69 Diffusion , 99, 116–120, 122, 123 Dimensions of the quality of service , 32
E Eco-Management and Audit Scheme (EMAS
III) , 53–63 Effi ciency , 3–5, 14, 16, 19, 54–57, 71, 85,
88, 89, 91, 94, 98, 100, 103, 104, 122, 182
EMAS III. See Eco-Management and Audit Scheme (EMAS III)
Employee motivation , 10, 43–51, 57 Empowerment , 7, 109–111, 128, 131, 138 Enablers , 21–22, 90, 127–138 Enterprise governance , 176, 177, 183 Enterprise IT , 177, 179, 181, 183, 190 Entrepreneurial strategic processes , 20–22
Index
M. Peris-Ortiz and J. Álvarez-García (eds.), Action-Based Quality Management: Strategy and Tools for Continuous Improvement, DOI 10.1007/978-3-319-06453-6,© Springer International Publishing Switzerland 2014

194
Environment , 5, 6, 10, 15, 17–19, 28, 29, 49, 50, 53–60, 62, 98, 99, 102, 105, 106, 116, 160
Environmental analysis , 54, 56 Environmental management , 5, 6, 10, 54–56,
58, 60, 116 Environmental management systems (EMS) ,
6, 54–58, 62, 116 Environmental protection , 98 Ethical behaviour , 98 European Foundation for Quality Management
(EFQM) , 2, 84, 89–95, 99, 111, 130 Evaluation of customer satisfaction , 31 Evolution of management systems , 116, 119 Excellence , 9, 21, 22, 30, 31, 84, 89–91, 94,
130, 132, 133 Expectations , 21, 29–35, 37–39, 44, 62, 84,
85, 89, 90, 93, 94, 98, 105, 144, 177 Experimentation , 19, 21, 22 Exploitation , 15–17, 57 Exploration , 15–16, 20, 22, 69 Exploratory innovation , 20, 22 External knowledge
acquisition , 19 assimilation , 17, 19
F Factor analysis , 4, 8, 33, 35, 60, 74, 75 Factors , 4–6, 8, 9, 15, 16, 20, 21, 28, 29, 32,
33, 35, 36, 38, 46, 47, 56, 60, 70, 74–76, 78, 79, 88, 90, 91, 107, 116, 119, 121, 122, 127–138, 148, 152, 158, 180, 182, 186, 189, 190
Financial performance , 3–10, 54, 68, 79, 98, 129, 134
Financial results , 3, 7–10, 93 Flow diagrams , 49 Foreign Exchange (FOREX) market , 159–162
G Genetic algorithms , 157–171 Genetic optimization , 157–171, 190
H Health Centre , 48–50 Health resort sector , 29 Higher education , 143, 144 Higher Education Institutions (HEI) , 143–154 Higher education mission , 152
High involvement work practices , 97–111 Hotel industry , 1–10
I Implementation , 3–6, 14, 31, 39, 44, 45, 50,
54, 56–58, 60, 62, 63, 71, 83–85, 89–91, 94, 98, 100, 106, 107, 116–123, 127–138, 175–190
motivations , 2, 56–58 Importance of HEI services , 144 Importance-Satisfaction Model , 144 Improvement capacity , 77 Improvement Proposal , 48 Improvement teams , 45 Indicators , 22, 32, 36, 48, 55, 73, 74, 78, 79,
85, 87, 88, 92–94, 99, 134–136, 160, 185
Industrial Company Case , 46–48 Information security , 100, 176 Information systems , 69, 78, 88, 176, 184 Innovation , 13–22, 44, 45, 68, 70, 71, 73,
77–79, 89–91, 93, 94, 98, 103, 107, 116, 176
Innovativeness , 68, 70, 71, 73, 76–79 In-sample , 160, 162, 170 Instrumental , 127–138, 181 Integration of management systems , 67–79 Interactive systems , 69 Internal factors , 122 Internalization , 6, 116–118, 120–122 Internal knowledge creation , 14, 19 ISO 9000 , 2, 7, 68, 84, 97, 98, 133, 187 ISO 9001 , 2–4, 7–9, 44, 72, 97–100, 102–111,
116–122 ISO 9004 , 98 ISO 9901 , 97–111 ISO 10018 , 99, 106–111 ISO 14001 , 54, 55, 57, 58, 116–122 ISO 19011 , 98 ISO/TC 176 , 97, 106 IT consultant , 47 IT decision-making; IT management ,
176–179, 185, 189 IT governance , 176–190 IT initiatives; Perfomance measurement ,
177, 181 IT processes , 178, 190 IT quality , 76 IT resources , 178, 185, 188, 190 IT risk management , 177, 178, 181, 182 IT service , 175–190
Index

195
J Job design , 109–111
K Key results , 84, 90, 92–95
L Leadership factors , 107 Lead times , 46 Least , 21, 45, 48, 49, 87, 88, 123, 129, 134 Literature review , 1–10, 29–33, 117–123,
133, 152
M Management
by processes , 43–51 system , 1–3, 5, 6, 30, 47, 48, 54–56, 58,
67–79, 84–86, 97–111, 115–123, 181, 185, 187
scenario , 111, 117, 118, 122, 123 standard , 97, 106
Managerial innovation , 19 Mean-comparison t- test , 148, 154 Mean scores rating , 148 Measurement of service quality , 31 Measuring consumer expectations , 32 Measuring consumer perceptions , 32 Mediating variables , 6 Mediation , 136 Moderating variables , 6 Motivation , 2, 8, 10, 29, 43–51, 54–57, 59–62,
70, 99, 107–111, 116, 119, 122 Moving Average Convergence Divergence ,
158, 162 Multiple-item scale , 61
N Non-customer latent needs , 19 Non-fi nancial performance , 68, 79
O Operational benefi ts , 3, 7, 62 Operational excellence , 21, 22 Operational performance , 4, 6, 29, 45, 57,
98, 132 Optimisation
methodology , 157–171, 175–190 strategy , 170
Organizational challenges , 180 Organizational learning , 14, 21 Organization leadership , 106 Outcomes , 4, 9, 18, 93, 94, 117, 121, 132, 185 Out-of-sample , 160, 162, 166, 170
P Parameter optimisation , 164 Partial , 129, 134, 158, 171 People satisfaction , 4, 7 Perceived quality , 28, 30–33 Perceptions , 6, 7, 29–35, 37, 38, 49, 58, 62,
63, 91, 138, 143–154 Performance , 1–10, 22, 29, 30, 32, 44, 45,
54–57, 62, 67–79, 94, 98, 100–103, 106, 109–111, 116, 120–122, 127–138, 144–146, 149, 150, 152, 157–171, 177, 178, 180, 182, 183, 185, 188–190
measurement , 70, 73, 177, 182 Portuguese certifi ed companies , 72 Processes
group , 49–50 improvement , 88–89 management , 2, 10, 19, 44, 45, 47,
50, 84–95 mapping , 85–86 methodology , 50 monitoring , 87–88
Professional performance , 189 Profi tability , 2, 3, 10, 53–63, 73, 79, 93, 98
Q Quality
certifi cate , 6, 8, 9 control , 161, 166, 168, 170, 176 cost information , 67–79 costing , 68, 69, 71, 77 costs , 67–79, 85 criteria , 160, 162–171 evaluation , 144 management , 1–10, 16, 30, 44, 58, 62,
67–79, 83–95, 97–111, 128, 130 methodology , 157–171 notation , 162–166 performance , 4, 7–10, 45, 98 services , 78 system , 5, 6, 60, 83, 87, 89, 103, 105
Quality management system (QMS) , 1, 3, 5, 30, 48, 58, 67–79, 97–111, 116, 187
Quality of HEI services , 143–154
Index

196
Quantitative analysis , 101 Quantitative empirical studies , 1–6
R Reliability , 29, 32–36, 38, 60, 61, 74, 91, 92,
135, 148, 162, 182 Responsibility and authority , 103
S Satisfaction of customers , 4, 7, 8, 10, 132 Sectoral management systems , 120, 122 Service
management , 29, 182 quality , 3, 30, 31, 33, 144, 145, 148, 190 sector , 59
SERVQUAL model , 27–38 Spain , 46, 56, 59, 63, 120 Squares , 61, 94, 129, 134, 136 Stakeholders , 2, 4–6, 10, 53–55, 57, 58, 84,
91, 98, 119, 179, 182–185, 188, 189 satisfaction , 5, 10
Standard , 2, 4, 9, 12, 19, 33, 46, 54–58, 60, 61, 69, 76, 77, 79, 85–87, 90, 94, 97–100, 102–107, 111, 116–119, 121–123, 136, 149, 159, 160, 183, 186, 189, 190
Standardization , 4, 54, 85, 86, 116, 123, 133 Strategic information systems , 178 Strategy , 3, 7, 13–15, 19, 20, 22, 29, 44, 60,
84, 90, 100, 102, 117, 145, 159, 160, 166, 170, 176–180, 182, 185
Structural equation model(ing) , 60–61, 68, 73, 129, 134, 135
Student empowerment , 7, 109–111, 128, 131, 138
Student perception , 143–154 Student satisfaction , 149–151 Success , 4, 6, 10, 15, 20, 21, 48, 62, 75, 78,
93, 98, 100, 116, 127–138, 176, 185, 188
Sustainable management , 117, 122
T Taylorian division of work , 45 Teacher profi le , 148 Termas of Chaves , 27–39 Total , 3, 20, 33–35, 44, 56, 59, 92, 93,
105, 130, 133, 134, 136, 144, 147, 164, 168
Total quality management (TQM) , 1–10, 13–22, 84, 91, 127–138
TQM as absorptive capacity antecedent , 18–20
U Uncontested markets , 14 Use of information , 69, 74, 75, 77–78
V Value innovation , 13–22
W Work group , 49
Index