
Socioeconomic, Cultural, and Behavioral Factors Affecting Hispanic Health Outcomes
Upload
independentCategory
view
7download
0
Available online at www.sciencedirect.com
www.elsevier.com/locate/ijproman
International Journal of Project Management 28 (2010) 183–193
Project management deployment: The role of cultural factors
Christophe Bredillet a,b,*, Faysal Yatim a, Philippe Ruiz a
a LSMRC, Univ Lille Nord de France, F-59000 Lille, Franceb ESC Lille, Avenue Willy Brandt – 59777 Euralille, France
Received 27 September 2009; accepted 20 October 2009
Abstract
This paper investigates the role of cultural factors as possible partial explanation of the disparity in terms of project managementdeployment observed between various studied countries. The topic of culture has received increasing attention in the management liter-ature in general during the last decades and in the project management literature in particular during the last few years. The globalizationof businesses and worldwide Governmental/International organizations collaborations drives this interest in the national culture toincrease more and more. Based on Hofstede national culture framework, the study hypothesizes and tests the impact of the cultureand development of the country on the PM deployment. Seventy-four countries are selected to conduct a correlation and regression anal-ysis between Hofstede’s national culture dimensions and the used PM deployment indicator. The results show the relations between var-ious national culture dimensions and development indicator (GDP/Capita) on the project management deployment levels of theconsidered countries.� 2009 Elsevier Ltd and IPMA. All rights reserved.
Keywords: Project management deployment index; Disparity; Cultural factors; Gross domestic product
1. Introduction
The project management (PM) discipline is undergoingimportant growth worldwide and continues its advance-ment, supported by the growing recognition of professionalbodies, industries, governments and academics during thelast few decades (Kloppenborg and Opfer, 2002).
This growth, called PM development can be better per-ceived through the analysis of two different aspects ofgrowth:
– PM advancement, which describes and analyzes the PMtheoretical and practical knowledge.
– PM deployment, which describes and analyses the sizeof the human resources involvement and indicates theacceptance and adoption of the PM discipline by the
0263-7863/$36.00 � 2009 Elsevier Ltd and IPMA. All rights reserved.
doi:10.1016/j.ijproman.2009.10.007
* Corresponding author. Address: ESC Lille, Avenue Willy Brandt –59777 Euralille, France. Tel.: +33 3 20 21 59 72; fax: +33 3 20 21 59 74.
E-mail address: [email protected] (C. Bredillet).
individuals and groups. This aspect is the focus of thispaper.
Hofstede stressed on the relation between the manage-ment (therefore, the project management) theories andpractices and the culture concept: “a management technique
or philosophy that is appropriate in one national culture is
not necessarily appropriate in another” (Hofstede, 1984, p.1). As the management activity is made by people whoare very much influenced by their values and beliefs, nomanagement activity can be “culture-free”. ProjectGLOBE (House et al., 1997), compared about 18,000middle managers from 62 countries. The results show thatthe culture is linked to the behaviour in organizations andto the management differences. Muller and Turner (2004)presented an empirical study that touched the communica-tion management knowledge area (as per the PMIPMBoK� Guide), classified as the most significant impactof all knowledge areas (PMI) on project results (measuredin earned value terms). This study demonstrated the
184 C. Bredillet et al. / International Journal of Project Management 28 (2010) 183–193
influence of Hofstede’s cultural dimensions on the commu-nication preferences between the project owners and pro-ject managers. Archibald (1991) stated that theinternational project management practices and the relatedformalization require significant adjustments in attitudesthat affect the organization and the project teams. The cul-tural factors create barriers to these required changes andneed substantial effort to overcome or mitigate. Newmanand Nollen argued that universalism and dominance ofUS management practices is no longer a matter of fact.“Differences in national cultures call for differences in man-
agement practices” (Newman and Nollen, 1996, p. 1), andcould create serious barriers to the deployment of projectmanagement. Wang and Liu (2007) presented the opposi-tion to full project management deployment from Chinacase by emphasizing on the need for an organization toadopt the PM approach along with the development ofshared cultural values compliant with the country’snational culture. Shore and Cross (2005) explored anddemonstrated the impact of national culture in the manage-ment of large-scale projects.
The literature involving directly the culture concept andproject management deployment is scarce, but the cross-cultural studies addressing the issues of management, busi-ness and international business, globalization, organiza-tions, team behaving, leadership, communication, andother fields indirectly connected to project managementdiscipline do exist abundantly. They provide supportingevidence of the possible impact of the culture on PMdeployment. This is what we propose to address in thispaper. In a given country, can PM deployment be partiallyimpacted by the national culture? and how?
2. Hofstede’s cultural dimensions, GDP/Capita and
hypotheses development
Hofstede (1982) considers that the human behaviour isnot random, but predictable, and individuals carry mentalprogrammes that are observed indirectly through theirbehaviours based on values and culture. A value represents“a broad tendency to prefer certain states of affaires over oth-
ers” (Hofstede, 1982, p. 18) and culture is a “the collective
programming of the mind which distinguishes the members
of one human group from another” (Hofstede, 1982, p. 21).Hofstede cultural framework, supported by his interna-tional study made between 1968 and 1973, suggested fourcultural dimensions: power distance, individualism-collec-tivism, uncertainty avoidance and masculinity–femininity.
Hofstede’s dimensions of value have been criticized fortheir: limited ability to extend the dominant values presentwithin a multi-national organization to represent culturalvalues of a country and limited scope in methodologyand measurement (Chanchani and Theivanathampillai,2002). But these authors recognized that Hofstede’s frame-work has been largely adopted by the business literatureand studies for its simplicity, identification of dominantthemes and understanding of cultural changes. A large
number of comparative studies, where 140 studies havebeen cited by Hofstede, provide strong evidence for thevalidity of Hofstede’s framework (Lim et al., 2004). Thestudy of cultural distance has gained broad interest in inter-national business research (Ricks et al., 1990) and has beenused to explain a wide range of multi-national enterprises(MNEs) strategies and organizational characteristics (Thi-any et al., 2005).
In light of the above, we consider Hofstede’s culturaldimensions are supported enough to study the impact ofthe national culture on the PM deployment object of ourpaper. Furthermore, we have proceeded with a detailedreview of the Culture’s Consequences publication (Hofst-ede, 2001) to investigate Hofstede’s thoughts, reflectionsand observations during his review of 140 other studiesthat he found to be significantly correlated to one or moreof the Hofstede’s national culture dimensions. We summa-rize here after some important assumptions for ourresearch design setup:
– The four national culture dimensions are supposed torepresent independent dimensions (Hofstede, 2001, p.60) with the exception of the Power Distance and Indi-
vidualism dimensions which show high correlationacross the studied countries.
– The correlation pattern among the national culturedimensions depends on the set of countries selected forthe study.
– Hofstede states that “Validation studies in which external
data are correlated with the four dimensions shouldalways take possible inter-correlation between the dimen-
sions into account” (Hofstede, 2001, pp. 60–62).
One other important statement of Hofstede indicatedthat there is an impact of GNP/Capita on the correlationbetween the Power Distance and Individualism dimensions.If one controls the GNP/Capita variable (by separatingwealthy from poor countries), the correlation between thePower Distance and Individualism dimensions becomesinsignificant (Hofstede, 2001, p. 60). Therefore, the GDP/Capita is added as a fifth factor, in addition to the four cul-ture dimensions, to study its impact on the project manage-ment deployment and to control the possible correlationthat may exist between these culture dimensions in ourset of countries. We should note that we have consideredthe GDP/Capita similar to the GNP/Capita in terms ofcompliance with Hofstede’s related statement.
2.1. Power distance dimension (power distance index PDI)
The power distance dimension is defined by Hofstedeand Hofstede (2005, p. 46) as “the extent to which the lesspowerful members of institutions and organizations withina country expect and accept that power is distributedunequally”.
The project management is based on fairly decentralizedstructure favouring high project manager’s authority and
C. Bredillet et al. / International Journal of Project Management 28 (2010) 183–193 185
control over budget and resources (Project ManagementInstitute, 2004, p. 28), with focus on formal and informalcommunication (p. 221) and lesson learned as importantorganizational process assets. It promotes consultativemanagement and roles changes in accordance with the needof the project’s objectives (p. 199). Thus, the project man-agement discipline is expected to be deployed in smallPower distance countries better than in large power dis-tance countries. That is,
Hypothesis H1: The project management deployment isnegatively related to the power distance of a country.
2.2. Individualism versus collectivism dimension
(individualism index IDV)
The individualism/collectivism dimension is defined byHofstede and Hofstede (2005, p. 76) as “individualism per-tains to societies in which the ties between individuals areloose: everyone is expected to look after himself or herselfand his or her immediate family. Collectivism, as it’s oppo-site, pertains to societies in which people from birthonward are integrated into strong, cohesive in-groups,which throughout people’s lifetime continue to protectthem in exchange for unquestioning loyalty”.
The project management relies on the pre-defined rolesand competencies of the project team members (ProjectManagement Institute, 2004, pp. 199–207) and thereforedo not consider the interests of emotional in-groups collec-tivist relationship. Each team member is directly and indi-vidually responsible of the completion of his part of thejob. The projectized organizations have identified careerpaths (Hoffman et al., 2004) and encourage competitionsand challenges between the project teams’ members. Thus,the project management discipline is expected to bedeployed in Individualist countries better than in collectiv-ist countries. That is,
Hypothesis H2: The project management deployment ispositively related to the individualism of a country.
2.3. Masculinity versus femininity dimension (masculinity
index MAS)
Hofstede and Hofstede (2005, p. 120) defined thisdimension as “A society is called masculine when emo-tional gender roles are clearly distinct: men are supposedto be assertive, tough, and focused on material success,whereas women are supposed to be more modest, tender,and concerned with the quality of life. A society is calledfeminine when emotional gender roles overlap: both menand women are supposed to be modest, tender, and con-cerned with quality of life”.
The Project management approach offers a frameworkthat supports managing adequately the human resourcesfactors (Project Management Institute, 2004, p. 213). The
project management can be implemented in adequate envi-ronments that comply with the underlying dimension pole(masculinity or femininity) of the country. The projectmanagement discipline is expected to be deployed indepen-dently of the masculine and feminine dimension of thecountries. That is,
Hypothesis H3: The project management deployment isnot related to the masculinity/femininity of a country.
2.4. Uncertainty avoidance dimension (uncertainty
avoidance index UAI)
The uncertainty avoidance dimension is defined by Hof-stede and Hofstede (2005, p. 167) as “the extent to whichthe members of a culture feel threatened by ambiguousor unknown situations”.
The project management framework offers a structuredorganization in accordance with the project constraints,needs and objectives (Project Management Institute, 2004,p. 28). Within the PM framework, the uncertainty (as anx-iety from unknown risk) is simply addressed with a prudentresponse of allocating general contingency (p. 240) such asreservation of extra budget added to the project budget.Thus, the project management discipline is expected to bedeployed in weak uncertainty avoidance countries betterthan in strong uncertainty avoidance countries. That is,
Hypothesis H4: The project management deployment isnegatively related to the uncertainty avoidance of acountry.
2.5. Growth domestic production per capita (GDP/Capita)
The main objective for the introduction of the GDP/Capita in our analysis is to control the possible correlationsbetween the culture dimensions as we have explainedabove. Furthermore, the GDP/Capita constitutes animportant composite indicator to consider within thisstudy. In fact, additional factors other than the nationalculture dimensions, such as the economical, technological,educational and other national characteristics may alsoaffect the PM deployment of a country.
The project management discipline is expected to bedeployed in High-GDP/Capita countries better than inlow-GDP/Capita countries.
Hypothesis H5: The project management deployment ispositively related to the GDP/Capita.
3. Research design
Fig. 1 summarizes and graphically illustrates our pro-posed hypotheses.
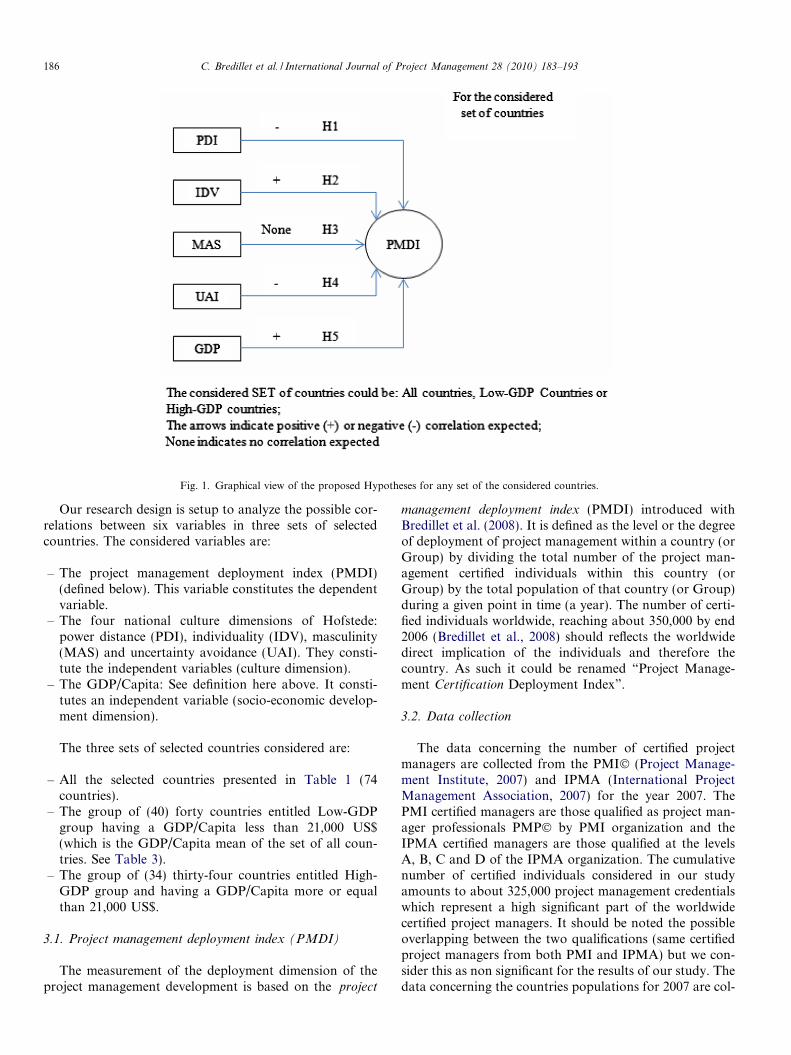
Fig. 1. Graphical view of the proposed Hypotheses for any set of the considered countries.
186 C. Bredillet et al. / International Journal of Project Management 28 (2010) 183–193
Our research design is setup to analyze the possible cor-relations between six variables in three sets of selectedcountries. The considered variables are:
– The project management deployment index (PMDI)(defined below). This variable constitutes the dependentvariable.
– The four national culture dimensions of Hofstede:power distance (PDI), individuality (IDV), masculinity(MAS) and uncertainty avoidance (UAI). They consti-tute the independent variables (culture dimension).
– The GDP/Capita: See definition here above. It consti-tutes an independent variable (socio-economic develop-ment dimension).
The three sets of selected countries considered are:
– All the selected countries presented in Table 1 (74countries).
– The group of (40) forty countries entitled Low-GDPgroup having a GDP/Capita less than 21,000 US$(which is the GDP/Capita mean of the set of all coun-tries. See Table 3).
– The group of (34) thirty-four countries entitled High-GDP group and having a GDP/Capita more or equalthan 21,000 US$.
3.1. Project management deployment index (PMDI)
The measurement of the deployment dimension of theproject management development is based on the project
management deployment index (PMDI) introduced withBredillet et al. (2008). It is defined as the level or the degreeof deployment of project management within a country (orGroup) by dividing the total number of the project man-agement certified individuals within this country (orGroup) by the total population of that country (or Group)during a given point in time (a year). The number of certi-fied individuals worldwide, reaching about 350,000 by end2006 (Bredillet et al., 2008) should reflects the worldwidedirect implication of the individuals and therefore thecountry. As such it could be renamed “Project Manage-ment Certification Deployment Index”.
3.2. Data collection
The data concerning the number of certified projectmanagers are collected from the PMI� (Project Manage-ment Institute, 2007) and IPMA (International ProjectManagement Association, 2007) for the year 2007. ThePMI certified managers are those qualified as project man-ager professionals PMP� by PMI organization and theIPMA certified managers are those qualified at the levelsA, B, C and D of the IPMA organization. The cumulativenumber of certified individuals considered in our studyamounts to about 325,000 project management credentialswhich represent a high significant part of the worldwidecertified project managers. It should be noted the possibleoverlapping between the two qualifications (same certifiedproject managers from both PMI and IPMA) but we con-sider this as non significant for the results of our study. Thedata concerning the countries populations for 2007 are col-
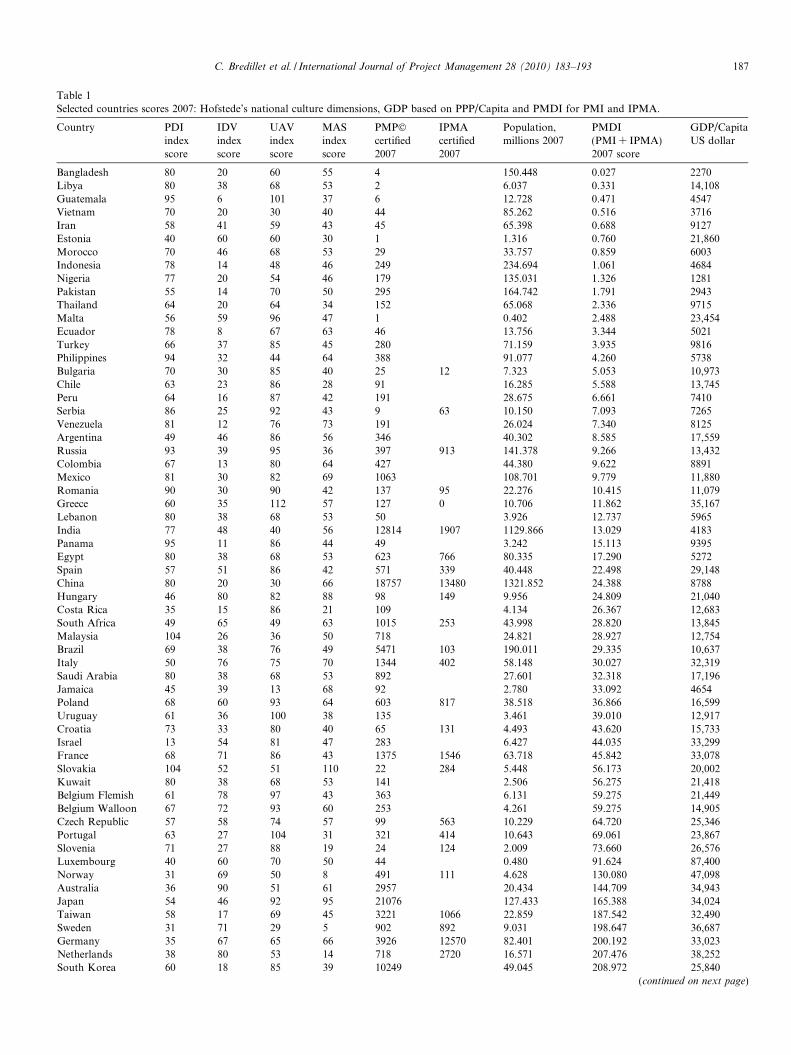
Table 1Selected countries scores 2007: Hofstede’s national culture dimensions, GDP based on PPP/Capita and PMDI for PMI and IPMA.
Country PDIindexscore
IDVindexscore
UAVindexscore
MASindexscore
PMP�certified2007
IPMAcertified2007
Population,millions 2007
PMDI(PMI + IPMA)2007 score
GDP/CapitaUS dollar
Bangladesh 80 20 60 55 4 150.448 0.027 2270Libya 80 38 68 53 2 6.037 0.331 14,108Guatemala 95 6 101 37 6 12.728 0.471 4547Vietnam 70 20 30 40 44 85.262 0.516 3716Iran 58 41 59 43 45 65.398 0.688 9127Estonia 40 60 60 30 1 1.316 0.760 21,860Morocco 70 46 68 53 29 33.757 0.859 6003Indonesia 78 14 48 46 249 234.694 1.061 4684Nigeria 77 20 54 46 179 135.031 1.326 1281Pakistan 55 14 70 50 295 164.742 1.791 2943Thailand 64 20 64 34 152 65.068 2.336 9715Malta 56 59 96 47 1 0.402 2.488 23,454Ecuador 78 8 67 63 46 13.756 3.344 5021Turkey 66 37 85 45 280 71.159 3.935 9816Philippines 94 32 44 64 388 91.077 4.260 5738Bulgaria 70 30 85 40 25 12 7.323 5.053 10,973Chile 63 23 86 28 91 16.285 5.588 13,745Peru 64 16 87 42 191 28.675 6.661 7410Serbia 86 25 92 43 9 63 10.150 7.093 7265Venezuela 81 12 76 73 191 26.024 7.340 8125Argentina 49 46 86 56 346 40.302 8.585 17,559Russia 93 39 95 36 397 913 141.378 9.266 13,432Colombia 67 13 80 64 427 44.380 9.622 8891Mexico 81 30 82 69 1063 108.701 9.779 11,880Romania 90 30 90 42 137 95 22.276 10.415 11,079Greece 60 35 112 57 127 0 10.706 11.862 35,167Lebanon 80 38 68 53 50 3.926 12.737 5965India 77 48 40 56 12814 1907 1129.866 13.029 4183Panama 95 11 86 44 49 3.242 15.113 9395Egypt 80 38 68 53 623 766 80.335 17.290 5272Spain 57 51 86 42 571 339 40.448 22.498 29,148China 80 20 30 66 18757 13480 1321.852 24.388 8788Hungary 46 80 82 88 98 149 9.956 24.809 21,040Costa Rica 35 15 86 21 109 4.134 26.367 12,683South Africa 49 65 49 63 1015 253 43.998 28.820 13,845Malaysia 104 26 36 50 718 24.821 28.927 12,754Brazil 69 38 76 49 5471 103 190.011 29.335 10,637Italy 50 76 75 70 1344 402 58.148 30.027 32,319Saudi Arabia 80 38 68 53 892 27.601 32.318 17,196Jamaica 45 39 13 68 92 2.780 33.092 4654Poland 68 60 93 64 603 817 38.518 36.866 16,599Uruguay 61 36 100 38 135 3.461 39.010 12,917Croatia 73 33 80 40 65 131 4.493 43.620 15,733Israel 13 54 81 47 283 6.427 44.035 33,299France 68 71 86 43 1375 1546 63.718 45.842 33,078Slovakia 104 52 51 110 22 284 5.448 56.173 20,002Kuwait 80 38 68 53 141 2.506 56.275 21,418Belgium Flemish 61 78 97 43 363 6.131 59.275 21,449Belgium Walloon 67 72 93 60 253 4.261 59.275 14,905Czech Republic 57 58 74 57 99 563 10.229 64.720 25,346Portugal 63 27 104 31 321 414 10.643 69.061 23,867Slovenia 71 27 88 19 24 124 2.009 73.660 26,576Luxembourg 40 60 70 50 44 0.480 91.624 87,400Norway 31 69 50 8 491 111 4.628 130.080 47,098Australia 36 90 51 61 2957 20.434 144.709 34,943Japan 54 46 92 95 21076 127.433 165.388 34,024Taiwan 58 17 69 45 3221 1066 22.859 187.542 32,490Sweden 31 71 29 5 902 892 9.031 198.647 36,687Germany 35 67 65 66 3926 12570 82.401 200.192 33,023Netherlands 38 80 53 14 718 2720 16.571 207.476 38,252South Korea 60 18 85 39 10249 49.045 208.972 25,840
(continued on next page)
C. Bredillet et al. / International Journal of Project Management 28 (2010) 183–193 187
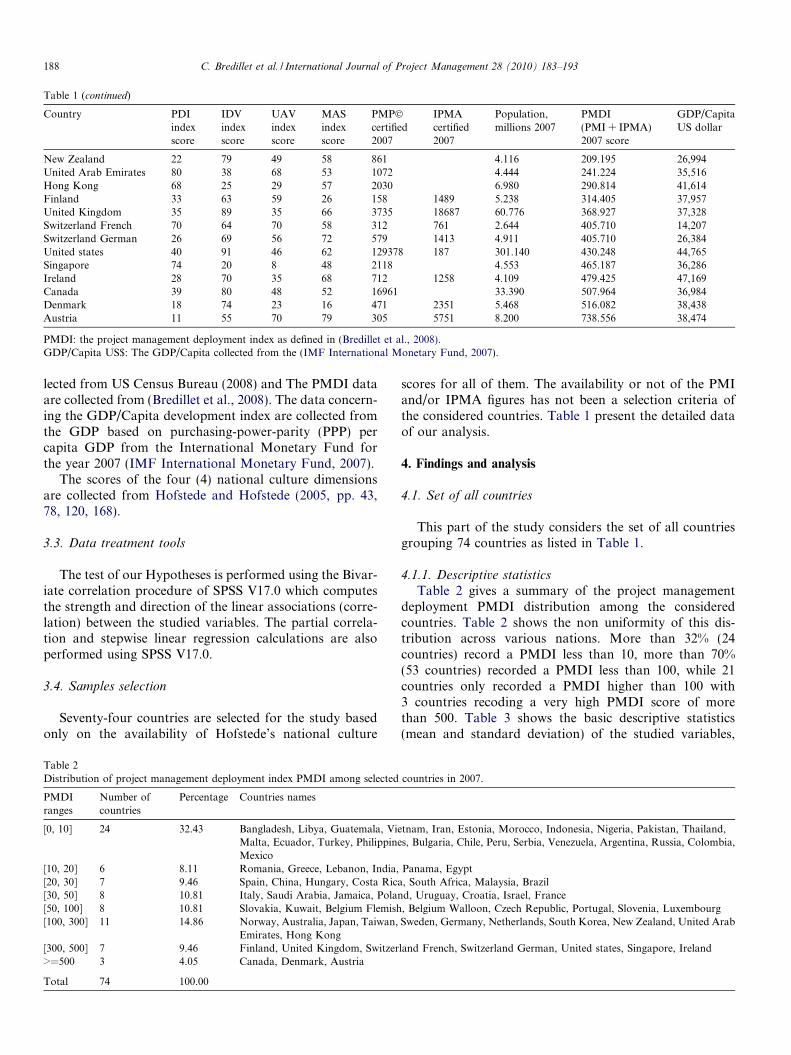
Table 1 (continued)
Country PDIindexscore
IDVindexscore
UAVindexscore
MASindexscore
PMP�certified2007
IPMAcertified2007
Population,millions 2007
PMDI(PMI + IPMA)2007 score
GDP/CapitaUS dollar
New Zealand 22 79 49 58 861 4.116 209.195 26,994United Arab Emirates 80 38 68 53 1072 4.444 241.224 35,516Hong Kong 68 25 29 57 2030 6.980 290.814 41,614Finland 33 63 59 26 158 1489 5.238 314.405 37,957United Kingdom 35 89 35 66 3735 18687 60.776 368.927 37,328Switzerland French 70 64 70 58 312 761 2.644 405.710 14,207Switzerland German 26 69 56 72 579 1413 4.911 405.710 26,384United states 40 91 46 62 129378 187 301.140 430.248 44,765Singapore 74 20 8 48 2118 4.553 465.187 36,286Ireland 28 70 35 68 712 1258 4.109 479.425 47,169Canada 39 80 48 52 16961 33.390 507.964 36,984Denmark 18 74 23 16 471 2351 5.468 516.082 38,438Austria 11 55 70 79 305 5751 8.200 738.556 38,474
PMDI: the project management deployment index as defined in (Bredillet et al., 2008).GDP/Capita US$: The GDP/Capita collected from the (IMF International Monetary Fund, 2007).
188 C. Bredillet et al. / International Journal of Project Management 28 (2010) 183–193
lected from US Census Bureau (2008) and The PMDI dataare collected from (Bredillet et al., 2008). The data concern-ing the GDP/Capita development index are collected fromthe GDP based on purchasing-power-parity (PPP) percapita GDP from the International Monetary Fund forthe year 2007 (IMF International Monetary Fund, 2007).
The scores of the four (4) national culture dimensionsare collected from Hofstede and Hofstede (2005, pp. 43,78, 120, 168).
3.3. Data treatment tools
The test of our Hypotheses is performed using the Bivar-iate correlation procedure of SPSS V17.0 which computesthe strength and direction of the linear associations (corre-lation) between the studied variables. The partial correla-tion and stepwise linear regression calculations are alsoperformed using SPSS V17.0.
3.4. Samples selection
Seventy-four countries are selected for the study basedonly on the availability of Hofstede’s national culture
Table 2Distribution of project management deployment index PMDI among selected
PMDIranges
Number ofcountries
Percentage Countries names
[0, 10] 24 32.43 Bangladesh, Libya, Guatemala, VieMalta, Ecuador, Turkey, PhilippineMexico
[10, 20] 6 8.11 Romania, Greece, Lebanon, India,[20, 30] 7 9.46 Spain, China, Hungary, Costa Rica[30, 50] 8 10.81 Italy, Saudi Arabia, Jamaica, Polan[50, 100] 8 10.81 Slovakia, Kuwait, Belgium Flemish[100, 300] 11 14.86 Norway, Australia, Japan, Taiwan,
Emirates, Hong Kong[300, 500] 7 9.46 Finland, United Kingdom, Switzer>=500 3 4.05 Canada, Denmark, Austria
Total 74 100.00
scores for all of them. The availability or not of the PMIand/or IPMA figures has not been a selection criteria ofthe considered countries. Table 1 present the detailed dataof our analysis.
4. Findings and analysis
4.1. Set of all countries
This part of the study considers the set of all countriesgrouping 74 countries as listed in Table 1.
4.1.1. Descriptive statistics
Table 2 gives a summary of the project managementdeployment PMDI distribution among the consideredcountries. Table 2 shows the non uniformity of this dis-tribution across various nations. More than 32% (24countries) record a PMDI less than 10, more than 70%(53 countries) recorded a PMDI less than 100, while 21countries only recorded a PMDI higher than 100 with3 countries recoding a very high PMDI score of morethan 500. Table 3 shows the basic descriptive statistics(mean and standard deviation) of the studied variables,
countries in 2007.
tnam, Iran, Estonia, Morocco, Indonesia, Nigeria, Pakistan, Thailand,s, Bulgaria, Chile, Peru, Serbia, Venezuela, Argentina, Russia, Colombia,
Panama, Egypt, South Africa, Malaysia, Brazild, Uruguay, Croatia, Israel, France, Belgium Walloon, Czech Republic, Portugal, Slovenia, LuxembourgSweden, Germany, Netherlands, South Korea, New Zealand, United Arab
land French, Switzerland German, United states, Singapore, Ireland
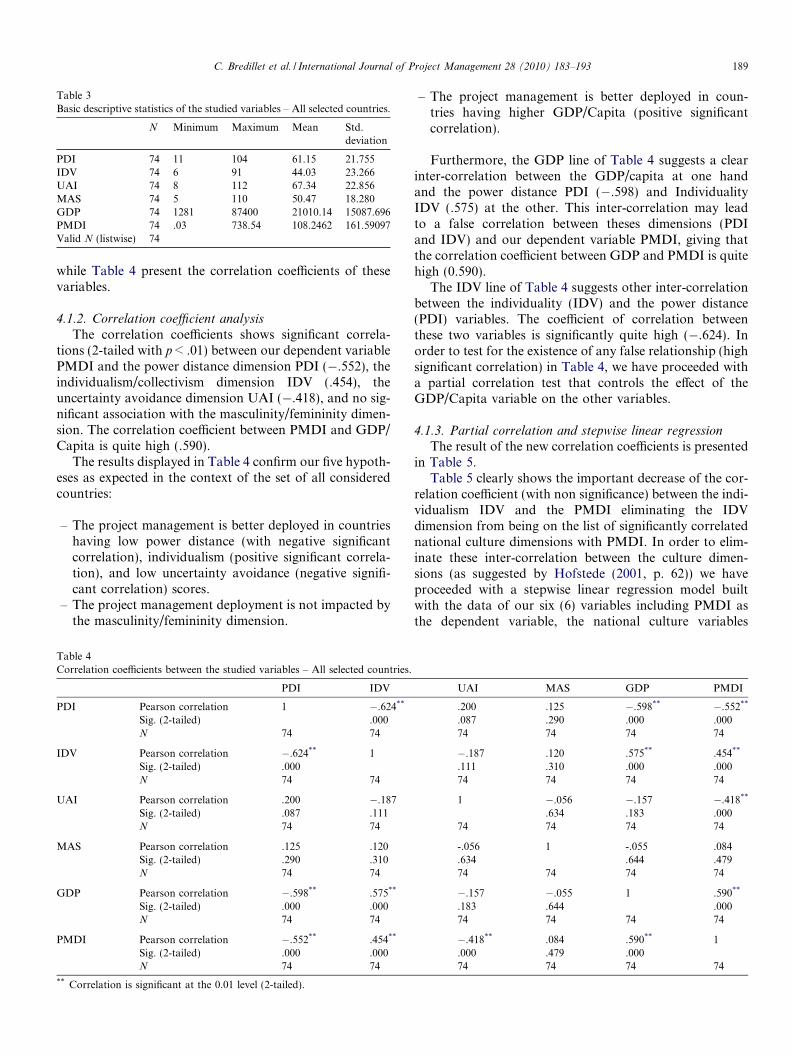
Table 3Basic descriptive statistics of the studied variables – All selected countries.
N Minimum Maximum Mean Std.deviation
PDI 74 11 104 61.15 21.755IDV 74 6 91 44.03 23.266UAI 74 8 112 67.34 22.856MAS 74 5 110 50.47 18.280GDP 74 1281 87400 21010.14 15087.696PMDI 74 .03 738.54 108.2462 161.59097Valid N (listwise) 74
C. Bredillet et al. / International Journal of Project Management 28 (2010) 183–193 189
while Table 4 present the correlation coefficients of thesevariables.
4.1.2. Correlation coefficient analysis
The correlation coefficients shows significant correla-tions (2-tailed with p < .01) between our dependent variablePMDI and the power distance dimension PDI (�.552), theindividualism/collectivism dimension IDV (.454), theuncertainty avoidance dimension UAI (�.418), and no sig-nificant association with the masculinity/femininity dimen-sion. The correlation coefficient between PMDI and GDP/Capita is quite high (.590).
The results displayed in Table 4 confirm our five hypoth-eses as expected in the context of the set of all consideredcountries:
– The project management is better deployed in countrieshaving low power distance (with negative significantcorrelation), individualism (positive significant correla-tion), and low uncertainty avoidance (negative signifi-cant correlation) scores.
– The project management deployment is not impacted bythe masculinity/femininity dimension.
Table 4Correlation coefficients between the studied variables – All selected countries.
PDI IDV
PDI Pearson correlation 1 �.624**
Sig. (2-tailed) .000N 74 74
IDV Pearson correlation �.624** 1Sig. (2-tailed) .000N 74 74
UAI Pearson correlation .200 �.187Sig. (2-tailed) .087 .111N 74 74
MAS Pearson correlation .125 .120Sig. (2-tailed) .290 .310N 74 74
GDP Pearson correlation �.598** .575**
Sig. (2-tailed) .000 .000N 74 74
PMDI Pearson correlation �.552** .454**
Sig. (2-tailed) .000 .000N 74 74
** Correlation is significant at the 0.01 level (2-tailed).
– The project management is better deployed in coun-tries having higher GDP/Capita (positive significantcorrelation).
Furthermore, the GDP line of Table 4 suggests a clearinter-correlation between the GDP/capita at one handand the power distance PDI (�.598) and IndividualityIDV (.575) at the other. This inter-correlation may leadto a false correlation between theses dimensions (PDIand IDV) and our dependent variable PMDI, giving thatthe correlation coefficient between GDP and PMDI is quitehigh (0.590).
The IDV line of Table 4 suggests other inter-correlationbetween the individuality (IDV) and the power distance(PDI) variables. The coefficient of correlation betweenthese two variables is significantly quite high (�.624). Inorder to test for the existence of any false relationship (highsignificant correlation) in Table 4, we have proceeded witha partial correlation test that controls the effect of theGDP/Capita variable on the other variables.
4.1.3. Partial correlation and stepwise linear regressionThe result of the new correlation coefficients is presented
in Table 5.Table 5 clearly shows the important decrease of the cor-
relation coefficient (with non significance) between the indi-vidualism IDV and the PMDI eliminating the IDVdimension from being on the list of significantly correlatednational culture dimensions with PMDI. In order to elim-inate these inter-correlation between the culture dimen-sions (as suggested by Hofstede (2001, p. 62)) we haveproceeded with a stepwise linear regression model builtwith the data of our six (6) variables including PMDI asthe dependent variable, the national culture variables
UAI MAS GDP PMDI
.200 .125 �.598** �.552**
.087 .290 .000 .00074 74 74 74
�.187 .120 .575** .454**
.111 .310 .000 .00074 74 74 74
1 �.056 �.157 �.418**
.634 .183 .00074 74 74 74
-.056 1 -.055 .084.634 .644 .47974 74 74 74
�.157 �.055 1 .590**
.183 .644 .00074 74 74 74
�.418** .084 .590** 1.000 .479 .00074 74 74 74
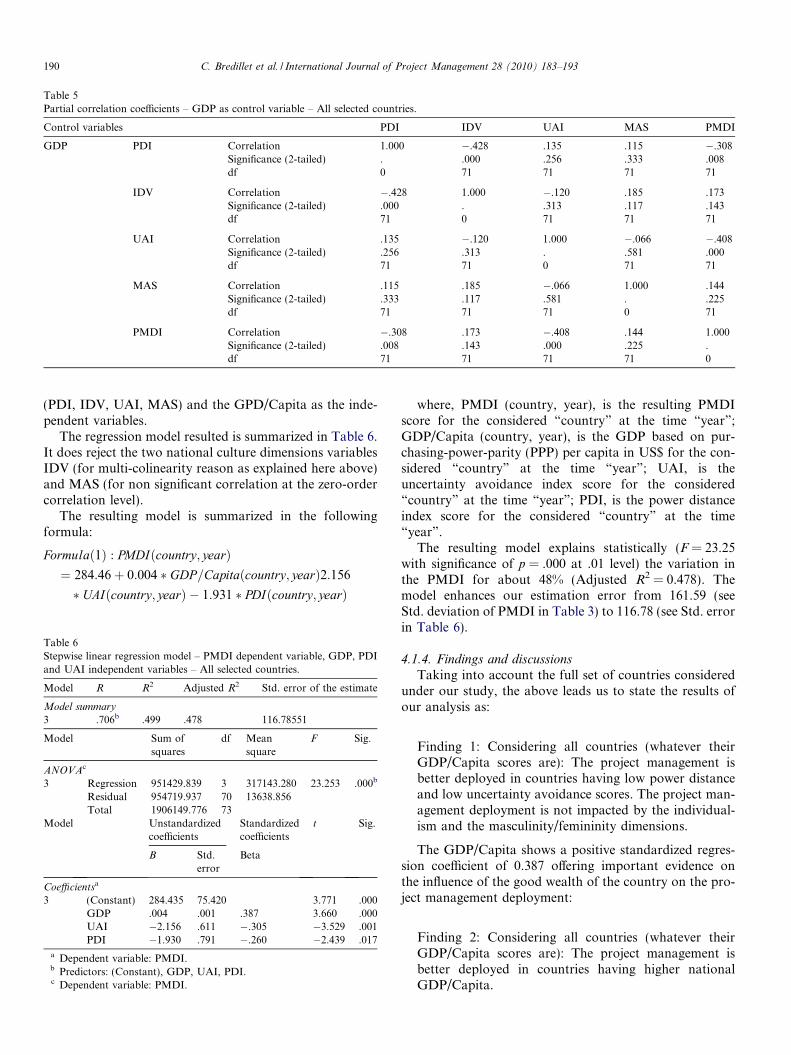
Table 5Partial correlation coefficients – GDP as control variable – All selected countries.
Control variables PDI IDV UAI MAS PMDI
GDP PDI Correlation 1.000 �.428 .135 .115 �.308Significance (2-tailed) . .000 .256 .333 .008df 0 71 71 71 71
IDV Correlation �.428 1.000 �.120 .185 .173Significance (2-tailed) .000 . .313 .117 .143df 71 0 71 71 71
UAI Correlation .135 �.120 1.000 �.066 �.408Significance (2-tailed) .256 .313 . .581 .000df 71 71 0 71 71
MAS Correlation .115 .185 �.066 1.000 .144Significance (2-tailed) .333 .117 .581 . .225df 71 71 71 0 71
PMDI Correlation �.308 .173 �.408 .144 1.000Significance (2-tailed) .008 .143 .000 .225 .df 71 71 71 71 0
190 C. Bredillet et al. / International Journal of Project Management 28 (2010) 183–193
(PDI, IDV, UAI, MAS) and the GPD/Capita as the inde-pendent variables.
The regression model resulted is summarized in Table 6.It does reject the two national culture dimensions variablesIDV (for multi-colinearity reason as explained here above)and MAS (for non significant correlation at the zero-ordercorrelation level).
The resulting model is summarized in the followingformula:
Formulað1Þ : PMDIðcountry; yearÞ¼ 284:46þ 0:004 � GDP=Capitaðcountry; yearÞ2:156
� UAIðcountry; yearÞ � 1:931 � PDIðcountry; yearÞ
Table 6Stepwise linear regression model – PMDI dependent variable, GDP, PDIand UAI independent variables – All selected countries.
Model R R2 Adjusted R2 Std. error of the estimate
Model summary
3 .706b .499 .478 116.78551
Model Sum ofsquares
df Meansquare
F Sig.
ANOVAc
3 Regression 951429.839 3 317143.280 23.253 .000b
Residual 954719.937 70 13638.856Total 1906149.776 73
Model Unstandardizedcoefficients
Standardizedcoefficients
t Sig.
B Std.error
Beta
Coefficientsa
3 (Constant) 284.435 75.420 3.771 .000GDP .004 .001 .387 3.660 .000UAI �2.156 .611 �.305 �3.529 .001PDI �1.930 .791 �.260 �2.439 .017
a Dependent variable: PMDI.b Predictors: (Constant), GDP, UAI, PDI.c Dependent variable: PMDI.
where, PMDI (country, year), is the resulting PMDIscore for the considered “country” at the time “year”;GDP/Capita (country, year), is the GDP based on pur-chasing-power-parity (PPP) per capita in US$ for the con-sidered “country” at the time “year”; UAI, is theuncertainty avoidance index score for the considered“country” at the time “year”; PDI, is the power distanceindex score for the considered “country” at the time“year”.
The resulting model explains statistically (F = 23.25with significance of p = .000 at .01 level) the variation inthe PMDI for about 48% (Adjusted R2 = 0.478). Themodel enhances our estimation error from 161.59 (seeStd. deviation of PMDI in Table 3) to 116.78 (see Std. errorin Table 6).
4.1.4. Findings and discussions
Taking into account the full set of countries consideredunder our study, the above leads us to state the results ofour analysis as:
Finding 1: Considering all countries (whatever theirGDP/Capita scores are): The project management isbetter deployed in countries having low power distanceand low uncertainty avoidance scores. The project man-agement deployment is not impacted by the individual-ism and the masculinity/femininity dimensions.
The GDP/Capita shows a positive standardized regres-sion coefficient of 0.387 offering important evidence onthe influence of the good wealth of the country on the pro-ject management deployment:
Finding 2: Considering all countries (whatever theirGDP/Capita scores are): The project management isbetter deployed in countries having higher nationalGDP/Capita.
C. Bredillet et al. / International Journal of Project Management 28 (2010) 183–193 191
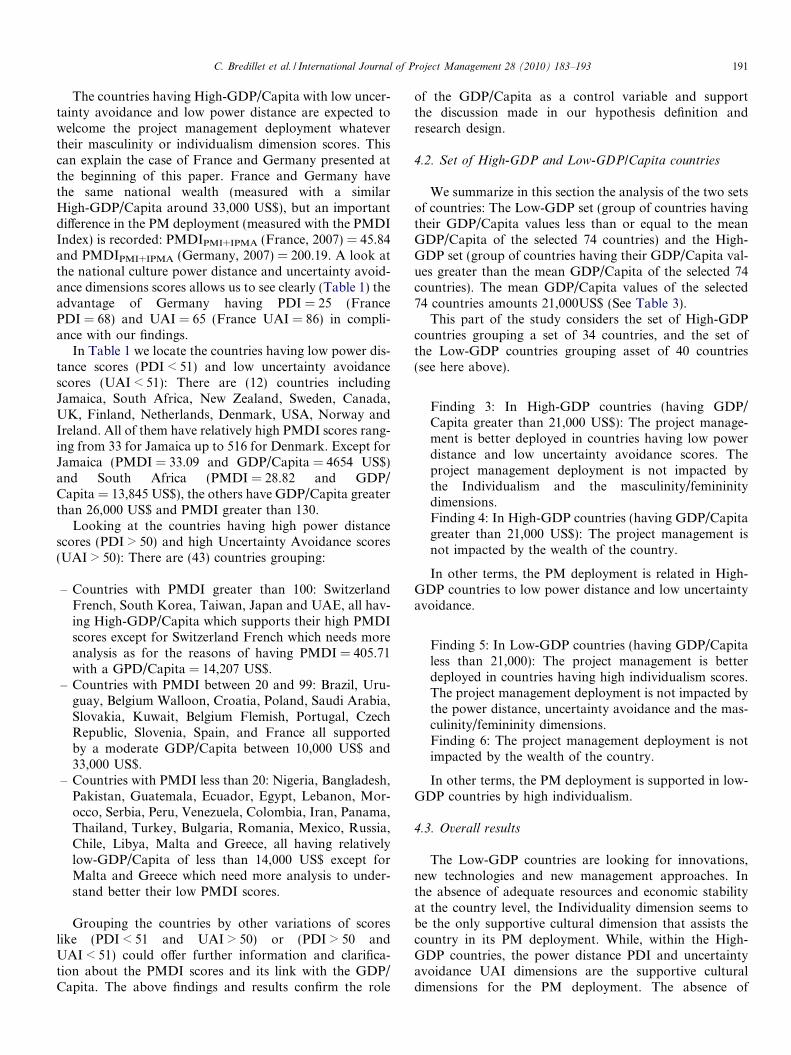
The countries having High-GDP/Capita with low uncer-tainty avoidance and low power distance are expected towelcome the project management deployment whatevertheir masculinity or individualism dimension scores. Thiscan explain the case of France and Germany presented atthe beginning of this paper. France and Germany havethe same national wealth (measured with a similarHigh-GDP/Capita around 33,000 US$), but an importantdifference in the PM deployment (measured with the PMDIIndex) is recorded: PMDIPMI+IPMA (France, 2007) = 45.84and PMDIPMI+IPMA (Germany, 2007) = 200.19. A look atthe national culture power distance and uncertainty avoid-ance dimensions scores allows us to see clearly (Table 1) theadvantage of Germany having PDI = 25 (FrancePDI = 68) and UAI = 65 (France UAI = 86) in compli-ance with our findings.
In Table 1 we locate the countries having low power dis-tance scores (PDI < 51) and low uncertainty avoidancescores (UAI < 51): There are (12) countries includingJamaica, South Africa, New Zealand, Sweden, Canada,UK, Finland, Netherlands, Denmark, USA, Norway andIreland. All of them have relatively high PMDI scores rang-ing from 33 for Jamaica up to 516 for Denmark. Except forJamaica (PMDI = 33.09 and GDP/Capita = 4654 US$)and South Africa (PMDI = 28.82 and GDP/Capita = 13,845 US$), the others have GDP/Capita greaterthan 26,000 US$ and PMDI greater than 130.
Looking at the countries having high power distancescores (PDI > 50) and high Uncertainty Avoidance scores(UAI > 50): There are (43) countries grouping:
– Countries with PMDI greater than 100: SwitzerlandFrench, South Korea, Taiwan, Japan and UAE, all hav-ing High-GDP/Capita which supports their high PMDIscores except for Switzerland French which needs moreanalysis as for the reasons of having PMDI = 405.71with a GPD/Capita = 14,207 US$.
– Countries with PMDI between 20 and 99: Brazil, Uru-guay, Belgium Walloon, Croatia, Poland, Saudi Arabia,Slovakia, Kuwait, Belgium Flemish, Portugal, CzechRepublic, Slovenia, Spain, and France all supportedby a moderate GDP/Capita between 10,000 US$ and33,000 US$.
– Countries with PMDI less than 20: Nigeria, Bangladesh,Pakistan, Guatemala, Ecuador, Egypt, Lebanon, Mor-occo, Serbia, Peru, Venezuela, Colombia, Iran, Panama,Thailand, Turkey, Bulgaria, Romania, Mexico, Russia,Chile, Libya, Malta and Greece, all having relativelylow-GDP/Capita of less than 14,000 US$ except forMalta and Greece which need more analysis to under-stand better their low PMDI scores.
Grouping the countries by other variations of scoreslike (PDI < 51 and UAI > 50) or (PDI > 50 andUAI < 51) could offer further information and clarifica-tion about the PMDI scores and its link with the GDP/Capita. The above findings and results confirm the role
of the GDP/Capita as a control variable and supportthe discussion made in our hypothesis definition andresearch design.
4.2. Set of High-GDP and Low-GDP/Capita countries
We summarize in this section the analysis of the two setsof countries: The Low-GDP set (group of countries havingtheir GDP/Capita values less than or equal to the meanGDP/Capita of the selected 74 countries) and the High-GDP set (group of countries having their GDP/Capita val-ues greater than the mean GDP/Capita of the selected 74countries). The mean GDP/Capita values of the selected74 countries amounts 21,000US$ (See Table 3).
This part of the study considers the set of High-GDPcountries grouping a set of 34 countries, and the set ofthe Low-GDP countries grouping asset of 40 countries(see here above).
Finding 3: In High-GDP countries (having GDP/Capita greater than 21,000 US$): The project manage-ment is better deployed in countries having low powerdistance and low uncertainty avoidance scores. Theproject management deployment is not impacted bythe Individualism and the masculinity/femininitydimensions.Finding 4: In High-GDP countries (having GDP/Capitagreater than 21,000 US$): The project management isnot impacted by the wealth of the country.
In other terms, the PM deployment is related in High-GDP countries to low power distance and low uncertaintyavoidance.
Finding 5: In Low-GDP countries (having GDP/Capitaless than 21,000): The project management is betterdeployed in countries having high individualism scores.The project management deployment is not impacted bythe power distance, uncertainty avoidance and the mas-culinity/femininity dimensions.Finding 6: The project management deployment is notimpacted by the wealth of the country.
In other terms, the PM deployment is supported in low-GDP countries by high individualism.
4.3. Overall results
The Low-GDP countries are looking for innovations,new technologies and new management approaches. Inthe absence of adequate resources and economic stabilityat the country level, the Individuality dimension seems tobe the only supportive cultural dimension that assists thecountry in its PM deployment. While, within the High-GDP countries, the power distance PDI and uncertaintyavoidance UAI dimensions are the supportive culturaldimensions for the PM deployment. The absence of
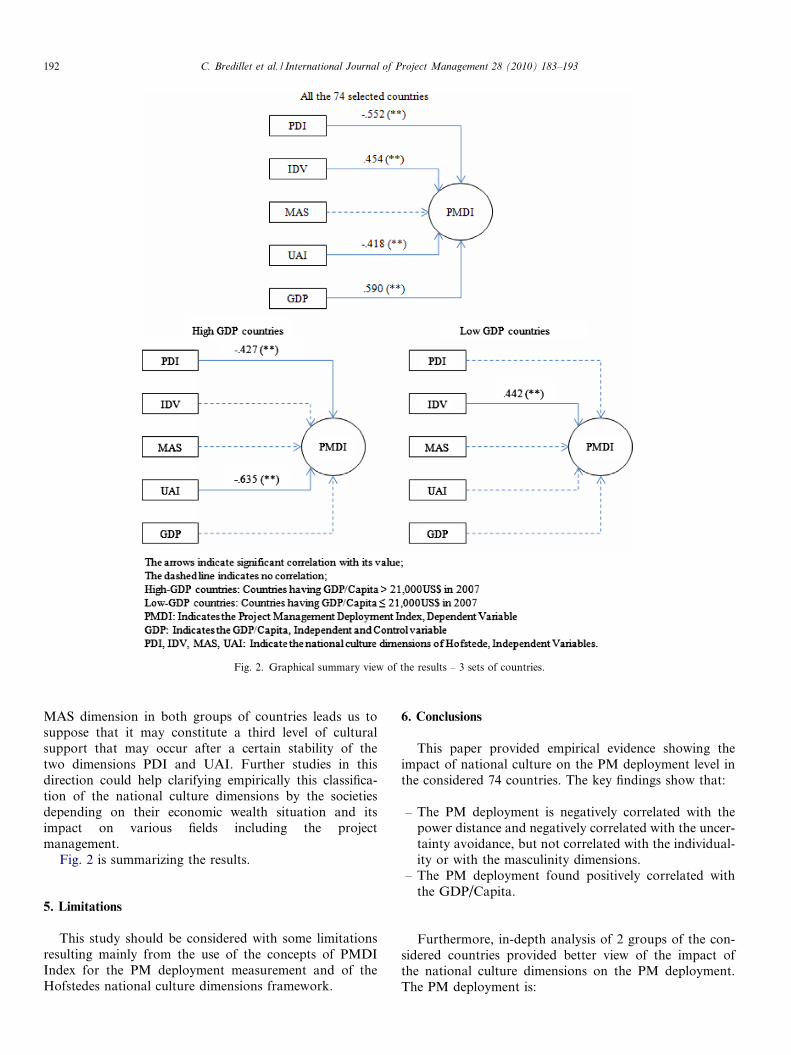
Fig. 2. Graphical summary view of the results – 3 sets of countries.
192 C. Bredillet et al. / International Journal of Project Management 28 (2010) 183–193
MAS dimension in both groups of countries leads us tosuppose that it may constitute a third level of culturalsupport that may occur after a certain stability of thetwo dimensions PDI and UAI. Further studies in thisdirection could help clarifying empirically this classifica-tion of the national culture dimensions by the societiesdepending on their economic wealth situation and itsimpact on various fields including the projectmanagement.
Fig. 2 is summarizing the results.
5. Limitations
This study should be considered with some limitationsresulting mainly from the use of the concepts of PMDIIndex for the PM deployment measurement and of theHofstedes national culture dimensions framework.
6. Conclusions
This paper provided empirical evidence showing theimpact of national culture on the PM deployment level inthe considered 74 countries. The key findings show that:
– The PM deployment is negatively correlated with thepower distance and negatively correlated with the uncer-tainty avoidance, but not correlated with the individual-ity or with the masculinity dimensions.
– The PM deployment found positively correlated withthe GDP/Capita.
Furthermore, in-depth analysis of 2 groups of the con-sidered countries provided better view of the impact ofthe national culture dimensions on the PM deployment.The PM deployment is:
C. Bredillet et al. / International Journal of Project Management 28 (2010) 183–193 193
– In High-GDP countries (Group of countries havingtheir GDP/Capita greater than 21,000 US$): negativelycorrelated to the power distance and negatively corre-lated to the uncertainty avoidance dimensions.
– In Low-GDP countries (Group of countries having theirGDP/Capita less than or equal 21,000 US$): positivelycorrelated to the individualism dimension.
– In both High and Low-GDP countries groups: The con-trol variable GDP/Capita found not to be correlatedwith the PM deployment.
The separation between the High-GDP and Low-GPPcountries is very important as it shows a different culturalreaction to the PM deployment depending on the econom-ical situation of the country.
These findings contradict a general assumption statingthat Low-GDP countries resist to the PM deploymentmore than the High-GDP countries may do for culturalreasons. Our findings provide evidences that national cul-ture in both High and Low-GDP countries impact differ-ently the PM development. Depending on the targetedcountry (region or group), one should take into consider-ation the correct cultural dimension to consider for analy-sis of phenomena related to or involving PM deployment.
The findings of this paper should have consequences forthe researchers, practitioners and policy makers workingon the field of PM development (and specifically PMdeployment) and national culture as they offer new per-spectives of addressing the PM deployment with thenational culture dimensions and the development levelsof the targeted countries. They offer the possibility of ana-lyzing, with cultural perspective, the PM certificationgrowth and impact suggesting perhaps better adaptationto the cultural settings of the considered country or socialgroup.
Other studies developing the construct of PM deploy-ment to capture a more exhaustive view, analyzing andcomparing PM deployment and its relation to performancewithin groups of international organizations in relation totheir cultural settings, as well as the performance of indus-trial sectors in relation to their organizational culture,should be undertaken. Lastly, studying the impact of therecent crisis on PM deployment will be of great interestin the near future.
References
Archibald, R.D., 1991. Overcoming cultural barriers in project manage-ment. PM Network, 27–30.
Bredillet, C., Ruiz, P., Yatim, F., 2008. Investigating the deployment ofproject management a time-distance analysis approach of G8, Euro-pean G6 and Outreach 5 Countries. In: PMI Research Conference,Conference Paper Project Management Institution, Warswav, Poland.
Chanchani, S., Theivanathampillai, P., 2002. Typologies of Culture.Unpublished Work. Shared Services Bureau, Toronto.
Hoffman, E., Boyle, J., Maturo, A., 2004. Project management certifica-tion: best practices and pragmatism. In: PMI Research Conference,Conference Proceedings, London, UK.
Hofstede, G., 1982. Culture’s Consequences, Abridged ed. Sage Publica-tions, Newbury Park, CA.
Hofstede, T., 1984. Cultural dimensions in management and planning.Asia Pacific Journal of Management, 81.
Hofstede, G., 2001. Culture’s Consequences. SAGE Publications Ltd.Hofstede, G., Hofstede, J., 2005. Cultures and Organizations – Software
of the Mind, second ed. McGraw-Hill Education, Europe.House, R.J., Hanges, Paul J., Ruiz, Q., Antonio, S., 1997. Cultural
Influences on Leadership and Organizations: Project GLOBE ed.,Project GLOBE: Report.
IMF International Monetary Fund, 2007. World Economic and FinancialSurveys World Economic Outlook Database. Online Database,<http://www.imf.org/external/pubs/ft/weo/2007/02/weodata/index.aspx>(accessed 23.3.2008).
International Project Management Association, 2007. Certification Year-book 2006. Version 1.00 Edition: IPMA.
Kloppenborg, T.J., Opfer, W.A., 2002. The current state of projectmanagement research: trends, interpretations, and predictions. ProjectManagement Journal.
Lim, K.H., Leung, K., Ling, S.C., Lee, M.K.O., 2004. Is eCommerceboundary-less? effects of individualism-collectivism and uncertaintyavoidance on internet shopping. Journal of International BusinessStudies 35 (6), 545.
Muller, R., Turner, J.R., 2004. Cultural Differences in Project Owner –Project Manager Communication. In: PMI Research Conference, ed.Project Management Institute, Conference Proceedings, London, UK.
Newman, K.L., Nollen, S.D., 1996. Culture and congruence: the fitbetween management practices and national culture. Journal ofInternational Business Studies 27 (4), 753.
Project Management Institute, 2004. A Guide to the Project ManagementBody of Knowledge (PMBOK� Guide). 3rd ed., Project ManagementInstitute, Inc., Pennsylvania.
Project Management Institute, 2007. Credentials Count. ed. Faysal Yatim,Personal Communication Project Management Institute,Pennsylvania.
Ricks, D.A., Toyne, B., Martinez, Z., 1990. Recent developments ininternational management research. Journal of Management 16 (2),219–253.
Shore, B., Cross, B.J., 2005. Exploring the role of national culture in themanagement of large-scale international science projects. InternationalJournal of Project Management 23, 55–64.
Thiany, L., Griffith, D.A., Russel, C.J., 2005. The effect of culturaldistance on entry mode choice, international diversification, andMNE performance. Journal of International Business Studies 36 (3),270.
Wang, X., Liu, L., 2007. Cultural barriers to the use of western projectmanagement in Chinese enterprises: some empirical evidence fromYunnan province. Project Management Journal 38 (3), 61–73.
Copyright © 2022 FDOKUMEN