Chapter 5: Deployment of Rigs
30
Report No. 39 of 2015 35 Chapter 5: Deployment of Rigs The Company deploys rigs (both owned and hired) for drilling operations as per the annual deployment plan and conditions specified in the service level agreements (SLA) signed with Drilling Services group. As on March 2014, the Company owned 67 onland drilling rigs and eight offshore rigs. The chart alongside shows the number of rigs under the Company’s operation during the period from 2010-11 to 2013-14. As can be seen from the chart alongside, the majority of rigs deployed by the Company in onland areas were owned while in offshore the bulk of the requirement was hired. 5.1 Significant deviation from rig deployment plan The year-wise details of exploration and development wells planned in offshore and onland areas in the Rig Deployment Plans (BE and RE) and the actual wells drilled during 2010-14 is given in Annexure II. Comparison of wells planned in the annual RDP against the actual wells drilled revealed that wells planned in RDP (BE) were often not retained in the RDP (RE) and the actual locations drilled were significantly different from both the plans. It can be observed from the Annexure that out of 1,867 wells drilled both in onland and offshore areas during 2010-14, 615 wells (~ one third) were not planned even in the revised RDPs for these years. This rendered the elaborate exercise of planning annually for budgetary and revised estimates ineffective. While accepting the observation of Audit, the Company stated (April 2015) that rig deployment needs to be frequently reviewed and may get changed as per actual conditions i.e. requirement of early Asset oil gain, availability of ready location due to land acquisition and environment constraints etc. Rig was deployed on suitable locations that were ready for drilling at the time of rig release keeping in view the priorities of Assets/Basins. The Company assured that further efforts would be made to minimise changes in plan though it may not be possible to ensure that there was no deviation from RDP while drilling. While reiterating the above, MOPNG stated (August 2015) that as advised by Audit, further efforts would be made to minimize changes in plan by proper planning and coordination among Assets/Basins and Services. While Audit agrees that some amount of deviation and changes from the plan may occur due to the factors brought out by the Company, the frequency and extent of change from plan to actual indicates deficient planning. The assurance of the MOPNG/Management of the Company would be watched in future audit. 0 50 100 2010Ͳ11 2011Ͳ12 2012Ͳ13 2013Ͳ14 68 68 68 67 20 16 13 6 9 9 9 8 27 22 31 31 Chart 5.1 Owned and Hired Rigs Onland Owned Onland Hired Offshore Owned Offshore Hired
-
Upload
khangminh22 -
Category
Documents
-
view
2 -
download
0
Transcript of Chapter 5: Deployment of Rigs

Report No. 39 of 2015
35
Chapter 5: Deployment of Rigs
The Company deploys rigs (both owned and hired) for drilling operations as per the annual deployment plan and conditions specified in the service level agreements (SLA) signed with Drilling Services group. As on March 2014, the Company owned 67 onland drilling rigs and eight offshore rigs. The chart alongside shows the number of rigs under the Company’s operation during the period from 2010-11 to 2013-14. As can be seen from the chart alongside, the majority of rigs deployed by the Company in onland areas were owned while in offshore the bulk of the requirement was hired.
5.1 Significant deviation from rig deployment plan The year-wise details of exploration and development wells planned in offshore and onland areas in the Rig Deployment Plans (BE and RE) and the actual wells drilled during 2010-14 is given in Annexure II. Comparison of wells planned in the annual RDP against the actual wells drilled revealed that wells planned in RDP (BE) were often not retained in the RDP (RE) and the actual locations drilled were significantly different from both the plans. It can be observed from the Annexure that out of 1,867 wells drilled both in onland and offshore areas during 2010-14, 615 wells (~ one third) were not planned even in the revised RDPs for these years.
This rendered the elaborate exercise of planning annually for budgetary and revised estimates ineffective.
While accepting the observation of Audit, the Company stated (April 2015) that rig deployment needs to be frequently reviewed and may get changed as per actual conditions i.e. requirement of early Asset oil gain, availability of ready location due to land acquisition and environment constraints etc. Rig was deployed on suitable locations that were ready for drilling at the time of rig release keeping in view the priorities of Assets/Basins. The Company assured that further efforts would be made to minimise changes in plan though it may not be possible to ensure that there was no deviation from RDP while drilling. While reiterating the above, MOPNG stated (August 2015) that as advised by Audit, further efforts would be made to minimize changes in plan by proper planning and coordination among Assets/Basins and Services.
While Audit agrees that some amount of deviation and changes from the plan may occur due to the factors brought out by the Company, the frequency and extent of change from plan to actual indicates deficient planning. The assurance of the MOPNG/Management of the Company would be watched in future audit.
0
50
100
2010 11 2011 12 2012 13 2013 14
68 68 68 67
20 16 1369 9 9 8
27 2231 31
Chart 5.1 Owned and Hired Rigs
Onland Owned Onland Hired
Offshore Owned Offshore Hired
Report No. 39 of 2015
36
5.1.1 Case study of plan versus actual drilling in shallow water areas
A. Shallow water exploration areas During 2010-14, 100 shallow water exploration locations were drilled against the 146 locations planned in the revised estimates of RDP. There was, thus, a shortfall of 33 per cent in actual drilling vis-à-vis targets. The locations that were drilled were also not as per plan. Of the 100 locations drilled, 26 were as per original RDP, 57 were as per revised RDP and the remaining 17 were the wells that had not been planned at all.
Of the 46 locations that had been planned in the RDP but were not drilled, majority (35) were on account of the following:
In 16 cases, the rig was un-available due to delay in hiring;
In 9 cases, rigs that had been assigned to the location were out of cycle due to delay in repairs; and
In 10 cases, the rigs allocated to the locations were diverted to development wells.
While accepting the observation of Audit, the Company replied (April 2015) that there was a continuous review process by the exploration group which decides the priority of the location to be taken up based on various factors, such as MWP deadlines, re-assessment of sub-surface based on recently drilled wells, etc. in which the new locations were taken up subject to the rig-time availability and some locations were carried forward to next years’ revised estimate (RE). At times, planned wells had to be dropped and unplanned wells drilled in view of the urgent prioritisation by exploration team.
In supplementary reply post Exit Conference (August 2015), the Company stated that in most of the tenders the availability of rigs were less than the tendered quantity and the shortage of rig months due to non-availability of chartered hired rigs leads to re-alignment of rigs between exploratory and development locations. The Company assured that efforts would be made to deploy the rigs as per exploratory/ development plans.
The Company's reply is not acceptable as in the instant case, the locations could not be drilled mainly on account of avoidable factors like delay in hiring, delay in repair of owned rigs and diversion of rigs from exploration to development activities and, thus, the difference between plan and actual drilling of wells was not largely due to re-prioritisation by the exploration group. These factors could have been addressed by the Company by proper planning, co-ordination and efficiency. Besides, out of 17 tenders (including re-tenders) the Company could get tendered number of rigs or more in 11 tenders and, thus, availability of tendered quantity does not appear to be a serious problem. However, the assurance of the Company would be watched in future audit.

Report No. 39 of 2015
37
MOPNG did not offer (August 2015) any comments.
B. Shallow water development areas The Company planned drilling a total 193 wells during 2010-14 as per FYPs in Mumbai High Asset, against which it had planned 152 wells in the Annual Plans. The Company drilled only 127 wells during the same period. The shortfall in drilling in number of wells was mainly due to:
Delay in installation of the new platforms N17, N18 and N20 in 2011-12;
Dropping of drilling in WO-16 due to delay in Mobile Offshore Production Unit (MOPU) in 2013-14;
Drilling of one well in RS-4 platform due to non-availability of rig; and
Dropping of two wells at IT platform as movement of rig was not possible due to laying of pipeline in the area in 2013-14.
As most of the wells drilled were not even as per Revised Estimates plan, such deviations were only indicative of deficient planning. Frequent changes in drilling plans stressed scarce rig resources by way of additional rig movements and cascading effect on drilling operations by way of non-achievement of plan targets.
The Company stated (April 2015) that rig deployment for each rig was deliberated in detail in Asset Joint Operation Review meetings and after approval of Assets only, these plans were being finalised. However, number of actual wells drilled was dependent upon RFD (Ready for Drilling) status of new platforms and priority of Assets for particular platform at the time of drilling. Any change in rig deployment was approved by concerned Asset/Basin manager after due diligence. As per recent EC decision, Bar Chart would be prepared and subsequently approved in SAP system from pool of released locations for rig deployment. Any variance in this regard would require approval of competent authority. The Company stated that it was making all efforts to improve the system. MOPNG added (August 2015) that the assurance of the Company would be noted for compliance.
The action taken would be watched in future audit.
5.2 Rigs remaining out of cycle for extended periods
As per the Service Level Agreement (SLA) signed by the Drilling Services group (service provider) with the Assets/Basins (user) during 2010-14, rig utilisation was to be 95 per cent for owned rigs and 100 per cent for CH rigs. Owned and CH rigs in the Company remained out of cycle11 for prolonged periods leading to a much lower actual rig availability at 87 to 91 per cent vis-à-vis the SLA. Of the total 5,600 rig months available during 2010-14, 679 rig months (478 rig months in onland area and 201 rig months in offshore area) accounting for 12 per cent of the available time, were lost due to the rigs remaining out of cycle.
11 A rig is termed as ‘out of cycle’ when it is not available for drilling due to capital repairs, refurbishment, dry dock, third party inspection for fitness or waiting on weather, bandh and barricade.

Report No. 39 of 2015
38
Table 5.1: Rig out of cycle
Year Area Total rig months
available
Rig months for which rigs remained out of
cycle
Percentage of out of cycle over total
available rig months A B
2010-11 Onland 1,019 118 12 Offshore 404 41 10
2011-12 Onland 1,029 113 11 Offshore 386 45 12
2012-13 Onland 977 135 14 Offshore 440 73 17
2013-14 Onland 887 112 13 Offshore 458 42 9
Total 5,600 679 12
An analysis of the out of cycle period indicates that the primary reason was capital repairs and refurbishment of the rigs as shown in the charts below:
Capital repair and refurbishment of rigs constitute 53 to 75 per cent (offshore rigs: 48-91 per cent and onland rigs: 46-70 per cent) of the total out of cycle period of the rigs. For offshore owned rigs, the time lost in rig being out of cycle was particularly high.
The Company stated (April 2015) that, in offshore areas, some components of rig structure like hull, legs, spud-cans etc. sometimes get damaged during rig moves and their repair requires rig to remain out of operation for longer durations. These types of repairs were normally unexpected and, hence, arranging manpower, material and services required for repairing also needed some time. Charter hired rigs were out of cycle mainly due to accidental repair requirement/statutory obligations necessary for fitness of rig. The Company added that all out efforts were being made to maintain the rig equipment in proper running condition by carrying out timely preventive maintenance but breakdown of equipment was unavoidable, as with any other machine(s). Offshore rigs were working in highly corrosive marine environment. Hence, repairs related to corrosion, like refurbishment, was more in offshore. With regard to onland areas, the Company stated the rigs were out of cycle for want of ready sites (i.e. 10.9 per cent) mainly due to land acquisition, local issues and statutory clearances.
10 1
154
36
Chart 5.2: Offshore Rig months lost
weather
ready site
Capital repairs/refurbishmentOthers
8 3
98331
286
58
Chart 5.3: Onland Rig months lostweather
location
logistics
ready site
Bandh/ barricadeCapital repairs/ refurbishmentOthers

Report No. 39 of 2015
39
MOPNG stated (August 2015) that the Company is planning the dry dock of rigs in a phased manner and proceeding with aggressive manpower recruitment. During Exit Conference (August 2015), the Director (Technical & Field Services) of the Company also stated that once the old departmental rigs were refurbished/ repaired/replaced, the out of cycle percentage would reduce. In the supplementary reply (August 2015) the Company added that charter hire rigs are carrying out planned repairs during the intervening period from de-hiring of the rig to deployment in a new contract. All efforts are made to minimize the out of cycle period for the departmental rigs by taking up only those repair activities which cannot be handled simultaneously during rig operations.
The reply of the Company/ MOPNG needs to be viewed in the following context:
a) The Company’s contention that the repairs were un-expected owing to corrosion in marine environments was not correct. A significant reason for rigs remaining out of cycle was that the rigs were old, major lay-up repairs/ up-gradation of owned rigs had been neglected and equipment replacement policy had not been adhered to. These factors contributed to breakdown of equipment, especially of mud pumps/ draw works as commented in Chapter 6 - Paragraphs 6.1.1, 6.1.3 and 6.3. In addition, the internal monitoring of the Company had cited, inter-alia, inadequate manning of rigs and aged manpower adversely affecting drilling performance. In case of onland rigs, repairs were also the largest contributor to rigs remaining out of cycle.
b) The Company inordinately delayed the formulation of major lay-up repair policy and the policy had not been adhered to. Due to this, departmental rigs were continuously deployed for offshore operation which deteriorated their condition further and led to extended out of cycle periods.Though in the recent past, recruitment efforts had been initiated, the present manpower position was not commensurate with the requirement of skilled manpower.
The adherence to the major layup repairs policy and the impact of efforts to reduce ‘out of cycle’ of own rigs would be watched in future audit.
5.2.1 Financial impact of rigs remaining out of cycle
The rigs remained out of cycle for 12 per cent of the available rig time and, thus, could not be deployed on development and exploration activities. It cost the Company ` 2,375 crore during 2010-14. As per Corporate guidelines, the Company did not allocate this cost to Assets and Basins and charged the same to Profit/Loss of the respective year. Besides, absorbing the cost of rigs remaining out of cycle, the Company lost 679 rig months due to non-availability of the rigs.
Western Offshore area, where the highest number of jack up rigs (22 rigs) were deployed for development and exploratory activities, had charged off ` 517 crore towards expenditure incurred on rigs remaining out of cycle during 2010-14. It was observed that 78 per cent of rig out of cycle cost i.e. ` 403 crore, pertained to owned rigs. The out of cycle cost charged off for the seven owned rigs ranged from ` 21 crore to ` 114 crore. The rigs Sagar Shakti (` 114 crore) and Sagar Jyoti (` 72 crore) accounted for the most significant out of cycle costs in western offshore. It is pertinent to mention that both the rigs were long overdue for
Report No. 39 of 2015
40
lay-up repairs/dry dock. In comparison, loss due to the 15 charter hired rigs remaining out of cycle was lower at ` 114 crore, the per rig cost ranging between ` 1 crore to ` 21 crore.
MOPNG confirmed (August 2015) the facts, though it did not offer any comments. The Company stated in its supplementary reply (August 2015) that taking rigs out of cycle cannot be avoided totally as per the requirements of planned/ emergent repairs.
The reply of the Company needs to be viewed in the context of abnormal out of cycle hours of the owned rigs which could be attributed largely to delay in formulation of major lay-up policy and non-conformation to the major lay-up repair policy/ equipment replacement policy, and ought to have been addressed by the Company.
5.3 Rigs deployed, but remained idle
In addition to rigs remaining out of cycle and the related cost not being allocated to the cost of exploratory and development wells, rigs remained idle for considerable periods even after being deployed for drilling. This idle time of deployed rigs was termed Non Productive Time (NPT) and its cost was treated as an expenditure of the respective Assets and Basins where the rig was deployed (expenditure being capitalised for all Assets and successful drilling efforts in Basins). Idling of rigs leads to lower utilisable rig months and also increases the drilling cost. Minimising NPT was, thus, the cornerstone of efficient rig utilisation and drilling operations.
NPT arising out of rig waiting for weather and day-light was non-controllable. The balance NPT was defined as controllable. The controllable NPT was segregated into ‘operational’ and ‘non-operational’. ‘Operational’ NPT was on account of complications in drilling, such as stuck up/fishing/side tracking, mud loss activity, down-hole tool failure, logging tool failure etc. The ‘non-operational’ NPT of rig was on account of rig waiting for man/materials/log tool, instructions, logistics and repairs. ‘Operational’ NPT can be addressed by better technology and skill in drilling assignments. ‘Non-operational’ NPT also often leads to complications and adds to ‘operational’ NPT. It may, however, be difficult to substantially eliminate such operational NPT, particularly in complicated drilling assignments. ‘Non-operational’ NPT, on the other hand, can be eliminated with better planning and co-ordination within the organisation.
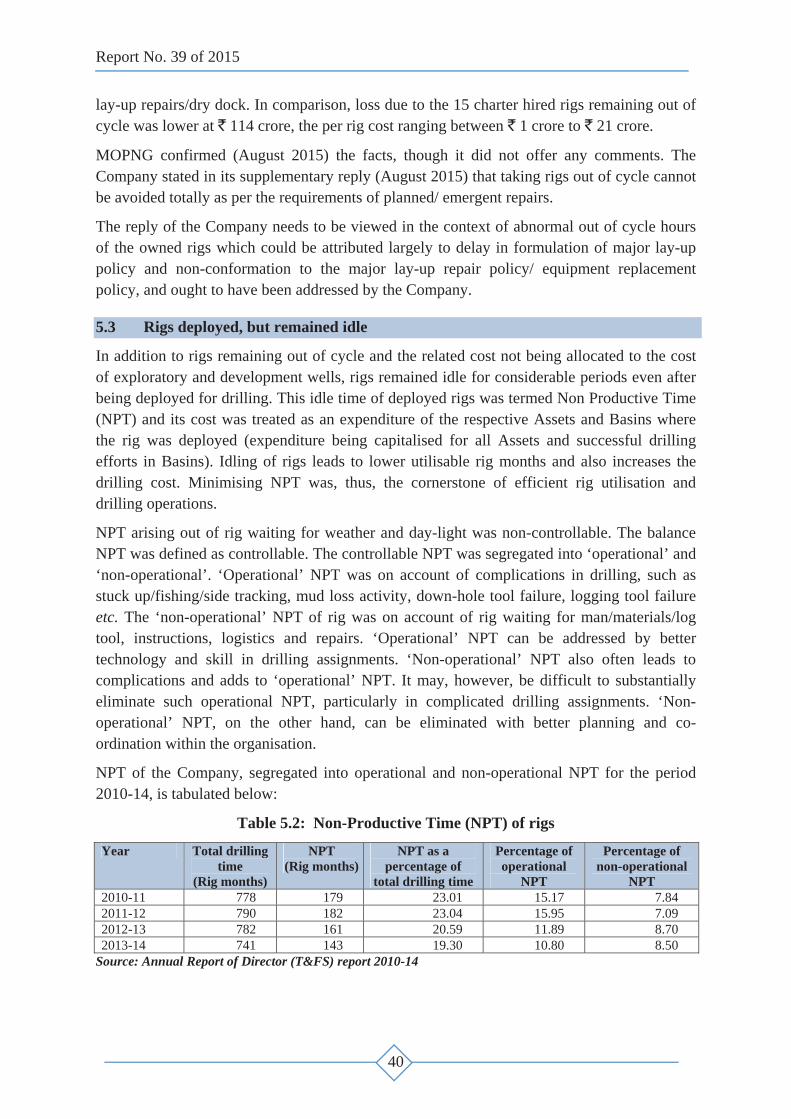
NPT of the Company, segregated into operational and non-operational NPT for the period 2010-14, is tabulated below:
Table 5.2: Non-Productive Time (NPT) of rigs
Year Total drilling time
(Rig months)
NPT (Rig months)
NPT as a percentage of
total drilling time
Percentage of operational
NPT
Percentage of non-operational
NPT 2010-11 778 179 23.01 15.17 7.84 2011-12 790 182 23.04 15.95 7.09 2012-13 782 161 20.59 11.89 8.70 2013-14 741 143 19.30 10.80 8.50
Source: Annual Report of Director (T&FS) report 2010-14

Report No. 39 of 2015
41
As can be seen from the table, NPT of the rigs (both owned and CH rigs) during the period 2010-14 was considerably high ranging between 19 to 23 per cent in comparison to the benchmark of 5 to 12 per cent used by the international consultants, engaged by the Company, to analyse the offshore drilling performance. It was also seen that while the overall NPT was on a decline, the non-operational NPT had steadily increased over this period (2010-14). During 2010-14, controllable NPT of rigs cost the Company ` 6,418 crore (` 3,782 crore in shallow water area, ` 1,748 crore in deep water area and ` 888 crore in onland area).
5.3.1 NPT in offshore areas
In offshore areas, rigs remained idle (NPT) for 26.16 per cent to 28.72 per cent of the time during 2010-14. This was considerably higher than the benchmark of 5 to 12 per cent used by international consultants engaged by the Company to analyze its offshore drilling performance (2009). Considering the efficiency enhancing measures employed by the Company during 2010-14 including advance mud systems, new generation
bits and new technologies, the high level of NPT was a matter of concern for the Company. What was significant was that the non-operational NPT which was entirely controllable by the Company through better planning and co-ordination was on the rise as shown in the adjoining chart.
The high NPT of rigs had been commented in the earlier audit reports of C&AG12. In response, the Company had assured that corrective action would be taken to avoid controllable delays. It was seen that the issue of higher NPT in the Company was discussed at various fora in the Company as well as in MOPNG. However, NPT during 2010-14 remained at a consistent high of 26.16 per cent to 28.72 per cent as against NPT of 22 to 31 per cent during 2007-11.
The Company in reply stated (April 2015) that there were no international standards for NPT and worldwide NPT for complicated wells were usually in the range of 30 per cent. Petrobras, one of the biggest operators, plans for 40 per cent NPT for drilling its deep-water wells. The Company further stated that NPT was dependent on well complications/fishing, waiting/ shutdown and repairs and that efforts were being made by Drilling Services group to contain NPT by induction of advanced technologies, strengthening logistics and shore based facilities and induction of new rigs.
12 Paragraph no. 7.7.3.4 & 7.7.3.5 of Report No. 9 of 2007 on ‘Performance of offshore rigs in shallow water areas of ONGC’, Paragraph No. 8.7.3.4 of Report No. 10 of 2010-11 on Performance Audit of ‘Exploration in Shallow water Blocks of ONGC’ and Paragraph No. 4.2.2 of Report No. 11 of 2013 on Performance Audit of ‘Hydrocarbon Exploration efforts of ONGC’.
9.30%10.64% 10.82%
12.81%
2010 11 2011 12 2012 13 2013 14
Non operational NPT for offshore areasChart 5.4

Report No. 39 of 2015
42
MOPNG in its reply stated (August 2015) that though all wells in offshore area are not deep water, it is prudent to mention that in shallow water wells, down-hole complications happen due to mud loss/ well activity/ stuck up etc. as most of these wells are drilled in depleted reservoir. New technologies are introduced to minimise down-hole complications. As advised by Audit, efforts are being made to contain NPT due to non-operational factors by strengthening logistics and shore base facilities.
During the Exit Conference (August 2015), the Company agreed with the audit view and stated that non-operational NPT is a matter of concern for the Management and assured that it would be addressed.
The Company in supplementary reply (August 2015) stated that to address the non-operational NPT, more vessels are being hired and two more supply bases are being set up nearer to the fields. This would have a positive effect in reducing the NPT due to waiting for logistics and supplies. The aggressive manpower recruitment is in place to address the issue of ageing and shortage of manpower.
The reply of MOPNG/ Company highlights complicated and deep water wells. However, all wells in offshore area were neither deep water nor complicated. Deep water wells in offshore areas accounted for only 13.5 per cent of the total offshore wells. Considering the benchmark NPT of 5 to 12 per cent considered by the consultant appointed by the Company, the 26 to 29 per cent NPT was a matter of concern. Moreover, a significant component of NPT in offshore areas was on account of non-operational factors, logistics, manpower, etc. which though entirely controllable by the Company was steadily on the rise.
Audit acknowledges the corrective action initiated by the Management. The compliance of the above would be watched in future audit.
5.3.1.1 Financial impact of NPT in offshore areas Idling of rigs not only leads to lower rig availability for drilling in the Assets and Basins, but was also associated with a financial cost. To appreciate the financial impact of NPT in offshore areas, the shallow water drilling in Mumbai offshore and drilling in deep water areas were scrutinised.
A. NPT of jack up rigs in Mumbai offshore The financial impact of controllable NPT of jack-up rigs in Mumbai offshore over 2010-14 was ` 3,782 crore along with a loss of 211 rig months. Of this, operational NPT accounted for 60 per cent (financial impact ` 2,268 crore) and non-operational NPT was 40 per cent (financial impact ` 1,514 crore). A significant reason for NPT was repair and refurbishment of owned rigs. A comparison of NPT of owned and CH rigs revealed that owned rigs remained under repair for a significant 24 to 42 per cent of their NPT (and the repair period as a percentage of NPT was on the rise) as against 7 to 9 per cent for CH rigs during the period 2010-14. MOPNG confirmed (August 2015) the facts, though no further comments were offered.
B. NPT of deep water drilling rigs The Company had deployed only CH drilling rigs for drilling deep water wells. During the

Report No. 39 of 2015
43
period from 2010-14, six13 rigs had been deployed by Deep Water group of the Company for its operations in East Coast and West Coast and the controllable NPT had been steadily on the rise from 12.82 per cent in 2010-11 to 27.03 per cent in 2013-14. Of the total controllable NPT of 1,083 rig days (during 2010-14), 51 per cent accounting for 554 days were on account of breakdown of various rig equipment. The balance controllable delays (~41 per cent) were due to well complications. The total extra expenditure to the Company due to controllable NPT, excluding period of rig break-down worked out to ` 1,748 crore during this period. Though the Company did not pay the contractor for the period, the rigs were under break-down (554 rig days), the associated services (e.g., well engineering, well testing services, etc.) had to be paid for, though the same also remained idle. A case in point was the deep water rig GSF 140 hired for drilling five wells over a period of two years against which only two locations could actually be drilled. The planned versus actual days and cost of these two wells was tabulated below:
Table 5.3: Planned and actual days and costs of drilling of wells by Rig GSF 140 Well No. Planned
days Actual days Estimated cost Actual cost
G-18-1 (AA) 201 389.58 US $ 41.15 million US $ 167.98 million KG-DWN-98/2 - KT-2 175 445.6 US $ 109.47 million US $ 201.56 million
A review of the rig operations revealed that the equipment break-down period (rig break-down) during drilling of wells G-18-1 and KT-2 was 115 days (29 per cent of total days utilised) and 90 days (20 per cent of total days utilised) respectively which resulted in loss of 6.83 rig months. Though the contractor had not been paid for the period the rig was under break-down, the Company had to make a payment of US$ 22.32 million approx. on three associated services viz. bundled services, well engineering, well testing services hired for the rig GSF-140, even though no service was delivered as the rig remained idle.
The Company in its reply stated (April 2015) that the sharp increase of NPT from 2010-11 to 2011-12 was due to increase in complications encountered during drilling, attributed mainly to challenges faced in exploratory drilling of deep wells for the first time in Mahanadi Basin and Andaman Basin. This trend continued in following years 2012-13 and 2013-14 when two extreme high pressure high temperature (HPHT) wells were taken up for the first time. As the deep water group ventures into new areas for drilling, it was associated with high risk of drilling surprises and new challenges e.g. HPHT wells, narrow window between pore pressure and fracture pressure gradient, mud loss etc. The Company also stated that complications in deep water drilling and HPHT wells had been a global phenomenon in the oil and gas industry and, therefore, the marginal increase in NPT in past few years needed to be viewed in line with the difficult and challenging task of deep-water drilling. The Company also stated that the performance of rig GSF-140 had not been good in the initial period of contract and, hence, the rig contractor was issued numerous warning letters to improve performance. Accordingly, the contractor mobilized additional equipment and subsea experts which resulted in gradual improvement on rig NPT. The Company also highlighted the fact
13 (1) Discoverer Seven Seas; (2) DDKG-1; (3) Platinum Explorer; (4) M G Hulme Jr.; (5) GSF-140 and (6) GSF Explorer.

Report No. 39 of 2015
44
that the majority of rig NPT was attributed only to repair of subsea 'blow out preventer' (BOP) and as the rig was deployed for drilling HPHT wells, basic well control equipment were needed to be kept in cent per cent working condition for safety of men and material. The Company added that the payments made for associated services were in line with contract provisions.
Reply of the Company that rig breakdown was a primary cause for NPT needs to be viewed in light of the fact that these rigs had been hired by the Company after technical due diligence. It was noticed that high rig breakdown had been seen in two of the six rigs hired, GSF 140 and GSF Explorer (~24 per cent of the rig hours of these two rigs were lost due to breakdown) while in the other four rigs, the break-down component was low at 2.59 to 5.81 per cent. While the Company's response regarding higher complications in deep water wells was appreciated, the steady increase of NPT in deep-water drilling was a matter of concern and needs to be addressed through better technical capacity and efficiency. While the rigs remained idle, the associated services though unutilised continued to be paid, which added to the overhead cost of the wells. The Company may consider incorporating a suitable clause for interruption free operation of the rig through proper maintenance and non-admissibility of payment of associated services in the contract in case rig remained idle due to break-down of rig or other reasons attributable to contractor. Besides, with the high NPT, the Company could not achieve its planned programme in deep water drilling (as against a target of drilling 63 wells, the Company could only drill 48 wells).
MOPNG stated (August 2015) that incorporating a clause for non-admissibility of associated services payment in case of rig equipment break down would not be proper as both the contracts are independent and in line with industry practices. During Exit Conference (August 2015) the Company added that additional stipulations would lead to increased contract value as the contractors would load the bid based on their risk perception. However, the Management assured that the matter would be considered by the Company.
The action taken by the Company to protect its financial interests in future contracts would be watched in audit.
5.3.1.2 Specific cases of idling of rigs (NPT) in offshore areas Over the period 2010-14, 49 offshore rigs had been deployed by the Company. The deployment of a sample of 23 rigs was scrutinised in audit and the results are given below. While the rigs remained idle waiting for ready sites, facilities remained idle for want of deployment of rigs. In Mumbai offshore Asset, the facilities of 21 platforms were ready for drilling (2010-14) but rigs had not been deployed and the platforms remained idle for upto 777 days. The delay in commencement of drilling resulted in idling of facilities and deferment of production valuing ` 4,003 crore (approx.) for oil and ` 1,174 crore (approx.) for gas.
The Company replied (April 2015) that rigs were hired based on workload provided by Basin/Assets and deployed as per their requirement. This highlights the need for better coordination to avoid idling of rigs or facilities.

Report No. 39 of 2015
45
A Idling of rigs due to non-availability of ready platforms A review of rig deployment plan versus actual deployment of drilling units in Mumbai offshore development area during 2010-14 revealed instances of the rig being moved to the platforms (locations) even though the platforms were not ready to take up the drilling activity or the location had not been approved for drilling. This resulted in loss of precious rig months and led to unfruitful expenditure of ` 19.51 crore. The individual instances noticed are as below:
a. The rig, Ran Top Mayer (RTM) waited for readiness of N-20 platform from 01 May 2011 to 15 May 2011. Thereafter, as the platform was still not ready for drilling, the rig was shifted for deployment at an alternate location, RS-17. However, the rig RTM could not be docked at RS-17 as a barge was working near the platform (till 21 May2011) and due to rapidly worsening weather. The rig RTM was finally deployed at exploratory location SB-J. In the process, the rig RTM had idled for 20 days, costing the Company ` 5.54 crore.
b. The rig GD Chitra had to wait at N-14 platform as construction activity was in progress and the top deck of the platform was full of construction material. The rig waited at the platform for 23 days from 29 April 2011 to 21 May 2011, the idling cost amounting to ` 13.97 crore.
In both the cases, idling of the rigs could have been avoided by better planning and co-ordination within the Company. The status of the platform ought to have been confirmed before moving the rig to location which led to idling of precious resources.
The Company stated (April 2015) that rig deployment on new platforms was planned well in advance based on RFD (Ready for Drilling) dates. However, in some cases RFD of platforms get delayed. When this delay was significant, the rig deployment plan was modified so that rig can be moved to alternate locations in order to avoid idling of rigs. However, in some cases RFD of the platforms gets delayed only marginally and was expected to be complete by the time rig was ready for movement. But the platform does not get completed and then the rig may have to wait depending on the priority of the wells on the platform, as informed by the Asset. In such cases, if rigs were deployed at any other platform with lesser gain expectations then it might have resulted in reduction in expected production and revenue and it can affect incremental gain planned by the Assets.
The reply of the Company was not convincing. Idling of rigs for 21- 25 days at a stretch as the platform was not ready, cannot be termed as insignificant considering the high rig hire charges. Besides, idling of the rigs could have been avoided with better co-ordination between the Engineering Services group (responsible for the platforms) and the Drilling Services group (responsible for deploying the rigs) of the Company. It was also noticed in audit that the rigs, RTM and GD Chitra were shifted to un-planned locations after waiting for a considerable period which highlights the inefficiencies in planning for precious rig resources.
MOPNG in its reply stated (August 2015) that as advised by Audit, more efforts would be made in planning and co-ordination within the Company to avoid any idling of rigs.

Report No. 39 of 2015
46
B. Indecision in deployment led to additional expenditure and rig movement The rig, Noble Kenneth Delaney (Noble KD), had been planned to be deployed at platform B-193A to drill five development wells in monsoon, 2012-13. The rig waited at location for sea bed survey from 09-12 April 2012. Subsequently, the rig was moved to well no. NM#4 from 13 April 2012 for work-over operation. On the basis of a message received from Mumbai High Asset, the rig was moved back to platform B-193A on 26 April 2012, without completing the work-over job. The rig was again kept waiting for sea bed survey from 27-29 April 2012 at B-193A platform. As the work-over job had not been completed, another rig, JT Angel had to be deployed to well NM#4 from 12 October 2012.
On account of indecision in rig deployment, the Company incurred additional expenditure of ` 10.61 crore, as shown below:
` 4.70 crore on deployment of rig from 13 April 2012 to 26 April 2012;
` 2.17 crore on rig waiting for sea bed survey;
` 1.20 crore on additional rig move; and
` 2.54 crore on overheads.
The Company in its reply (April 2015) confirmed that Rig Noble KD was planned to be deployed at platform B-193A to drill five development wells in monsoon. However, the platform was not ready by the time the rig was ready to move.
The reply highlights the lack of co-ordination as the Company could have deployed the rig to ready locations idling for want of rigs instead of deploying the rig to work-over jobs.
MOPNG stated (August 2015) that the audit concern is noted to prevent recurrence of such cases in future.
C. Rig idled during monsoon leading to unfruitful expenditure of ` 90.57 crore
The rig Aban Ice had been allocated to well GSS041NAA-1 in January 2011 (the well was spud on 19 January 2011) and was on the well location during the onset of monsoon. Suitable steps for enabling usage of the rig (by suitable anchoring etc.) during the monsoon season was not taken by the Company and the rig idled on location for four and a half months. As per the time balance report, the rig status from 11 May 2011 to 24 September 2011 read “Change rig heading to Monsoon Heading”14 and the drilling status remained at a constant 3,803 metres throughout the entire period indicating that necessary steps for changing the rig heading had not been taken leading to idling of the rig throughout the monsoon season. The drilling was resumed on 25 September 2011 and completed by 21 February 2012 when the rig was finally released from the location. During the monsoon period, as the rig idled, the Company incurred an unfruitful expenditure of ` 90.57 crore.
14 Change of rig heading: Rig Heading is an orientation of drillship/ jack up rig positioned at a location to accommodate the adverse weather conditions such as cyclonic winds and underwater currents. During monsoon, rig heading was changed to ensure smooth operation. This was done so that the disposition of the rig was optimal considering the monsoon specific environmental conditions.

Report No. 39 of 2015
47
Audit also noticed that in another well D-11-A, the Company had taken suitable steps to change the rig heading to monsoon for rig Badrinath deployed on the well. In fact, the job for changing the rig heading had started on 22 April 2011 and the rig commenced further drilling from 09 May 2011. Similar action ought to have been taken in the case of rig Aban Ice thereby avoiding the unfruitful expenditure of ` 90.57 crore. In case of difficulty in continuing drilling at the same location during monsoon, the Company could have temporarily abandoned the well and taken up another monsoon location for drilling and continued drilling on this location post monsoon(as was the practice). Lack of prompt action on the part of the Company led to idling of the rig, loss of precious rig months and unfruitful expenditure.
The Company stated (April 2015) that the decision to change the rig heading was timely and appropriate, but the change of rig heading of Aban Ice got delayed due to non-availability of anchor handling boat at the location. The Company also stated that all efforts would be made in future by providing proper anchor handling boat in time so that such waiting does not occur. The Company also pointed out that its Drilling Services group had already proposed (April 2011) to abandon the well temporarily and plan for re-entry after monsoon which was not done by Geology Operations group of its Western Offshore Basin.
MOPNG also stated (August 2015) that the decision was on time and there was proper coordination. However, the delay was due to non-availability of the anchor handling boat.
The Company in its supplementary reply (August 2015) post Exit Conference added that due to an unusual phenomenon of lack of small window of normal weather during the entire monsoon period, BOP could not be lowered.
The reply of the Company/ MOPNG needs to be viewed in the context of the following:
a) Lack of internal coordination in the Company is indicated. Though a decision had been taken to change the rig heading, it could not be implemented for want of anchor handling boat. The suggestion to abandon the well temporarily was also not implemented leading to idling of the rig and unfruitful expenditure of ` 90.57 crore.
b) In the joint review meeting (July 2011) held by the Director (T&FS) it was categorically stated that the rig waited for two months for favorable weather due to delayed decision leading to wastage of the precious rig inputs and disturbing the committed work programme. It was stressed at the review meeting that such critical decisions should be in time and based on experience.
D Idling of rigs waiting for logistics Logistic Services group was responsible for ensuring timely availability of materials required by the offshore rigs for their drilling activities. The Service Level Agreement entered between the Logistic Services and the Assets and Basins, stipulated all time support by logistics services group to ensure material supply to various rigs deployed for drilling. However, the Company did not have adequate number of Offshore Supply Vessels (OSVs) to supply material to the rigs. The overall availability of OSVs varied between 80 and 88 per cent during the period of audit (2010-14). Non availability of OSVs to supply materials, tools, casings and services led to rigs idling on site waiting for logistics. Over the period

Report No. 39 of 2015
48
2010-14, the cost to the Company for idling of rigs for want of logistics was ` 185.84 crore. It was noticed that the Company had inordinately delayed (three years) the process of acquiring new OSVs and, till date (May 2015), only five out of the 12 contracted OSVs had been delivered (during March 2013 to September 2014) to the Company though all OSVs were due for delivery by December 2011 leading to shortage of OSVs and consequent idling of rigs for want of logistics.
A scrutiny of all the 79 wells drilled in the Western Offshore Basin (during 2010-14) revealed that rigs waited for casing pipes and tow boats for 688.25 hours costing the Company an avoidable expenditure of ` 13.77 crore. It was noticed that Director (T&FS) had observed (July 2011) that wells waiting for casing was unacceptable and proactive action needs to be taken to avoid wait for casings. It was intended (April 2013) to prepare a look ahead for 15 days and include the same in DPR for all offshore drilling (currently this was followed in deep water areas alone) to improve coordination amongst service providers and reduce avoidable down time. On scrutiny of the DPRs it was observed that this concept had not been introduced yet (March 2015).
The Company replied (September 2014) that the stock position of the casings of the required dimension was adequate and the rig had to wait due to limited resources of OSVs, as the material could not be transported in time. The Company (May 2015) also assured that it was committed to reduce rig waiting for want of material and that an all-out effort was being made to improve coordination with Logistics Services group. The Company in its supplementary reply (August 2015) stated that Notification of Award (NOA) has been placed for 20 more vessels which are likely to join by September 2015 which would meet the requirements and two more supply bases are being set up nearer the fields. This would have a positive effect in reducing the NPT due to waiting for logistics and supplies.
Audit acknowledges the corrective action taken by the Management. The effectiveness of the corrective action in bringing down the NPT/ waiting time would be watched in future audit.
5.3.2 NPT of rigs deployed in onland areas Over the period 2010-14, the total NPT of rigs deployed in onland areas ranged between 15.8 and 22.1 per cent. It was noticed that both operational and non-operational NPT was on the
decline over this period, with operational NPT exhibiting a sharper fall. The unfruitful expenditure due to idling of rigs on account of controllable NPT (excluding rig break-down) was ` 888 crore during 2010-14.
The Company stated (March 2015) that NPT was an operational issue and efforts were being made to minimize the loss. Efforts were being made by inducting new technologies, real time
monitoring through SCADA15 system and night supervision for deep exploratory wells, improving planning through 15 days look ahead etc. The Company, however, stressed that it
15 SCADA – Supervisory control and data acquisition.
14.69% 15.26%
9.82% 9.40%
7.43% 6.14%
7.82% 6.40%
0.00%
5.00%
10.00%
15.00%
20.00%
2010 11 2011 12 2012 13 2013 14
Chart 5.5: NPT in onland areas
Operational NPT Non operational NPT

Report No. 39 of 2015
49
would not be possible to completely eliminate NPT and that it was not prudent to consider it as extra expenditure as it was part of drilling operations.
The Company’s contention that NPT was essentially on account of operational factors was not acceptable as onland rigs often idled in waiting for non-operational factors like land acquisition, civil work, environmental clearance, logistics support as well as associated services which could have been entirely eliminated with better planning and coordination as discussed under paragraph 5.3.2.1, 5.3.2.2. While the operational NPT had shown a steady decline, the non-operational NPT remains at a considerable 6.4 per cent of the available rig time and contributes to significant unfruitful expenditure.
Audit scrutinised deployment of 33 onland rigs (out of the 160 onland rigs deployed during 2010-14). Specific instances of idling of onland rigs noticed in the sample studied are indicated below:
5.3.2.1 Idling of onland drilling rigs due to non-availability of ready locations and logistics
In a significant number of the cases scrutinised (39 cases in which 18 rigs were deployed), Audit noticed that the rigs idled due to the following reasons:
Non completion of civil works when the rigs were deployed. In majority of the cases, delay in civil works was on account of delay in tendering for it. In other cases, delay was on account of delay in land acquisition.
Non availability of manpower and logistics (transport fleet, O&M crew).
In all these cases, the rigs were deployed without checking the readiness of the location for taking up drilling activities. The idling of these rigs cost the Company ` 132.25 crore.
Audit noticed that EC had decided (March 2011) that a drilling schedule to be prepared to avoid idling of rigs so that subsequent locations against a rig were readied in time for deployment of rig.
Table 5.4: Drilling schedule for Type I rigs Present Well Next Loc.1 Next Loc.2 Next Loc.3 Next Loc.4 Next Loc.5 Under Drilling
Should be ready
Civil Works in progress
Land Acquisition (LAQ) done
LAQ in progress
Released & Staked
Table 5.5: Drilling schedule for Type II & III rigs Present Well Next Loc.1 Next Loc.2 Next Loc.3 Next Loc.4 Under Drilling
To be ready before hermetical testing at previous well
Tendering for civil works in progress
LAQ in progress
Released & Staked
However, it was noticed that the directives of EC were not adhered to in all the cases reviewed by Audit. Ankleshwar Asset had to deploy rig M-450-1 to work-over operations for a period of 73 days as subsequent locations were not ready (civil works were not complete at the locations). In the process, the Asset incurred an additional expenditure of ` 4.05 crore (the additional cost of deploying drilling rig to work-over site).

Report No. 39 of 2015
50
The specific instances of idling of rig E-760-9 for 459 days over the period (2012-14) are detailed below as a case study:
A. Rig E-760-9 had been deployed to location AT-15 in Cachar Forward Base, Silchar, Assam in December 2011. The production testing of the well could not be completed for want of requisite resources for testing. The rig was, therefore, released (July 2012) to a new location ATDA keeping the well AT-15 incomplete even after an expenditure of ` 33.52 crore. At the new location, the rig was kept idle for 288 days as civil works at location remained incomplete. The decision to transfer the rig to the new location without ascertaining its readiness for drilling led to idling of the rig as well as the expenditure on the incomplete well remaining un-fruitful.
The Company/MOPNG replied (April/August 2015) that as no work centre was able to give any commitment and time line for the resources, it was decided to temporarily suspend the well. At the time of releasing the rig from well AT-15 on 31 July 2012, tender for civil works had not been finalised. As no other location except ATDA was available for taking up drilling operation, the rig was moved to the site. The Company also pointed out that civil works at ATDA was started in January, 2013. The delay in carrying out the works was due to land acquisition problem.
Reply of the Company/MOPNG needs to be viewed in the context of the following:
The requisition for material was sent only in July 2012 after completing the testing for six objects. The rig was released hastily in July 2012 even though the Company was aware that the civil works at the new site had not yet commenced.
The delay in civil works at new site was on account of deficient tender practices on the part of the Company. Besides, right of entry to the site was available with the Company from May 2012 but the Company initiated settlement for land acquisition only in November 2012.
B. The rig E 760-9 was deployed to well AT-16 in Cachar Forward Base, Silchar, Assam in April 2011. The well was spudded in May 2013 and production testing was in progress when the rig was called off to drill another well TKAC urgently. The rig was released in October 2013 (21 October 2013) with the production testing incomplete. The rig, however, could not commence operations at the new site (TKAC) as the site was not ready. The rig waited at site for 171 days and the drilling commenced only on 10 April 2014. Besides, the work at well AT-16 remained incomplete, thus, rendering the expenditure on the well of ` 24.15 crore unfruitful.
The Company/MOPNG replied (April/August 2015) that at the time of releasing the rig, civil works was under progress at TKAC and it was expected that the site would be ready for spudding before 4 December 2013. However, change of foundation from strip to pile, due to less bearing capacity of the soil, led to delay in civil works.
Reply of the Company/MOPNG needs to be viewed in the context that the rig was urgently called off in October 2013, though the site was expected to be ready only by December 2013. Besides, the delay in civil works was on account of delay of six

Report No. 39 of 2015
51
months by the Company in publishing NIT which affected the readiness of site and led to idling of the rig.
Thus, in both cases, rig E 760-9 idled for considerable periods after being urgently shifted to new locations which were not ready for drilling. Not only did the rig remain idle, the work done on previous locations remained incomplete rendering the expenditure on these jobs unfruitful.
5.3.2.2 Onland rigs idled for want of environmental clearance
A. Tripura Asset: Rig E-1400-11 waited at location KHBK in Tripura for over six months (February 2014 to August 2014) as the environment clearance for drilling the site had not been received. The rig had been released for this location on 01 January 2014 and rig building prior to actual drilling was completed on 08 February2014. The drilling, however, could not commence in the absence of environmental clearance which was finally received on 05 August 2014.
Audit observed that location KHBK was at a distance of 1.5 km (approx.) from the boundary from Rowa Wildlife Sanctuary (RWS) and Tripura Government had specifically informed (April 2013) that “the process for delineation of Eco-Sensitive Zone was going on and until it was notified, the restriction of 10 km shall prevail and no clearance at the moment can be considered”. The deployment of the rig to location KHBK in the context of the specific advisory of the Tripura Government, without environmental clearance was imprudent and led to avoidable idling of the rig for 187 days costing the Company ` 16.83 crore.
In reply, the Company/MOPNG stated (April/August 2015) that on completion of testing of well KHBL the rig E-1400-11 was released for KHBK on 01 January 2014 on approval from competent authority and in anticipation/assurance of EC consideration in the Expert Appraisal Committee scheduled on 30 January 2014. On recommendation by the State Government to National Board Wildlife, the consent for operation of the rig at location KHBK was received on 13 July 2014.
The reply of the Company/MOPNG highlights the idling of the rig being deployed in anticipation of environmental clearance which was received six months later. The idling resulted in unfruitful expenditure of ` 16.83 crore.
B. Cauvery Asset: The location MTAM of PEL Block L-II of Cauvery Basin was released on 14 November 2009. Over a year later, the Company applied (20 December 2010) for environmental clearance for the block including this location. Meanwhile, civil works were taken up on the location and completed by February 2012. The rig E-760-16 was deployed on the location in August 2012 for 23 days (27August 2012 to 18 September 2012). However, as environment clearance for the site was not available, drilling could not commence. Subsequently, the rig was diverted to another location.
The environment clearance for the location was received on 21 August 2013. The well was again taken up for drilling and the work was completed in September 2013 (19 September 2013).

Report No. 39 of 2015
52
Audit observed that at the time of initial rig deployment in August 2012, the Company had neither submitted its final report for environment clearance nor had public hearing and consultation process been completed (this was subsequently done during December 2012 to March 2013). Thus, even while deploying the rig in August 2012, the Company was aware of the status of the location and inability to drill the site. This led to idling of the rig for 23 days (idling cost to the Company ` 1.41 crore).
The Company/MOPNG replied (November 2014/August 2015) that in anticipation of getting the environmental clearance in time, rig E-760-16 was released to location MTAM on 26 August 2012, mobilisation and rig building operations were carried out till 17 September 2012. Despite best efforts, as EC for MTAM could not be obtained, to avoid rig-idling, rig E-760-16 was released from MTAM on 18 September 2012.
The reply of the Company/MOPNG was not acceptable since the rig was released in the first place without obtaining environmental clearance. The decision to deploy the rig in anticipation of environmental clearance was imprudent and led to idling of the rig.
5.3.3 Idling of work-over rigs in onland areas As on March 2014, the Company had 56 departmental and 23 hired work-over rigs for deployment in onland areas. The deployment of work-over rigs in two Assets, Assam and Tripura was scrutinised in Audit.
A. Assam Asset: During 2010-14, 13 Departmental work-over rigs were deployed in the Assam Asset. Audit observed that the Departmental rigs remained idle for a considerable period of 580.80 rig days. It was seen that the rigs remained idle waiting for civil works, logistics, manpower, material etc. and the Company incurred extra expenditure of ` 19.96 crore on this account.
The Company, while accepting the audit observation, stated (March 2015) that necessary steps were being taken to minimise the idling of work-over rigs during the operation period. MOPNG reiterated (August 2015) the Company’s reply and further added that shortfall in manpower required for operations, if any, is being addressed appropriately. The corrective action of the Company in minimising the idling of work-over rigs would be watched in future audit.
B. Tripura Asset: The deployment of work-over rigs in Tripura Asset was scrutinised through a specific case study as indicated below:
The Asset had hired a 100 Ton capacity work-over rig (John-100-25) in August 2010 for a period of three years. A review of deployment of the rig over the period 14 March 2011 to 31 May 2013 indicated that the rig had remained idle for 377 days (46.54 per cent of the available time of 810 days) and the contractor was paid ` 6.12 crore at non-operating day rates for this period. A scrutiny of the reasons for the idling indicated that the reasons were controllable by the Company:
The rig had to wait for civil works, logistics, manpower and material for 111 days costing the Company ` 1.80 crore. These were the responsibility of the Tripura Asset as per the terms of the hiring contract.

Report No. 39 of 2015
53
The rig waited for 216 days for activation and observation of the wells which cost the Company ` 3.51 crore. Audit noticed that the wait was due to non-availability of adequate compressors with the Tripura Asset. The Asset had only two compressors and a proposal for installation of well stimulation services had been initiated in 2009 to address the problem. However, this proposal had not fructified and the Asset continued to work with two compressors which contributed to delay in activation of the wells.
The rig also waited for testing, mud/brine preparation, tank cleaning etc. For 50 days costing ` 0.80 crore.
The Company assured (April 2015) the Audit that efforts would be made to minimize waiting of rigs for want of manpower, programme and materials and the activities like wire line jobs, logging, mud-brine preparation, waiting on cement etc. that were essential for completion of work-over jobs and were part of the planned work-over operational activities during which rigs have to remain in non-working state. Considering this, a provision had been incorporated in all contracts for payment to contractor for such situations at non-operating rates which was lower than the normal operating day rates. The Company also stated that work for setting up Well Stimulating Services base at Tripura Asset had been taken up and was in full swing. With this infrastructure it was expected that future activation jobs would consume less time besides monetizing production in shortest possible time. MOPNG reiterated (August 2015) the Company’s reply and further added that shortfall in manpower required for operations, if any, is being addressed appropriately.
The corrective action of the Company in minimising the idling of work-over rigs would be watched in future audit.
5.4 Inefficiencies in operation of rigs Besides idling of rigs, inefficiencies in rig operation had been noticed in both offshore and onland areas. In the sample studied in Audit, the following cases have come to light which are detailed below:
5.4.1 Offshore areas
A. Unfruitful expenditure of ` 1,577.27 crore due to unsafe operations
Departmental deep water drilling rig, Sagar Vijay, was deployed for drilling exploratory location G-4-6 (AF) on 31 March 2008. Production testing on the well commenced on 28 February 2009. During production testing, on 16 April 2009, wire rope of anchor #7 parted. Though this was a safety concern, Drilling Services group of the Company continued production testing and perforated16 the well on 19 April 2009.
Efforts to retrieve and re-lay the anchor commenced on 19 April 2009 without sufficient crew and was not successful. However, the incident was not reported in the Daily Drilling Report
16 Perforation is a process used to establish a flow path between the near reservoir and the wellbore. It normally involves initiating a hole from the wellbore through the casing and any cement sheath into the producing zone.
Report No. 39 of 2015
54
till 20 April 2009. On 22 April 2009, another anchor #8 also parted. Without two anchors (#7 and #8), the rig moved 140 metres from the location. The well had to be immediately closed and the anchors #7 and #8 were re-laid. At this stage, Blow Out Preventer (BOP), an essential safety equipment, had tilted and its retrieval was difficult. The rig was dry-docked on 18 May 2009 without recovering the BOP. By then, the Company had incurred an expenditure of ` 347.03 crore on drilling location G-4-6 (AF).
Subsequently, a relief well had to be drilled by deploying rig M.G. Hulme in order to make the well safe and retrieve the BOP. The relief well took 411 days (October 2011 to November 2012) and an expenditure of ` 1,033.44 crore was incurred. In the meanwhile (2012-13), rig Sagar Vijay drilled three wells without BOP. As it was unsafe to operate without BOP, rig Sagar Vijay drilled these three wells only partially with the upper completion being done during December 2012 to August 2013 by another CH rig, ‘Actinia’ by incurring an extra cost ` 196.80 crore to the Company in comparison to the cost of operation of Sagar Vijay.
Audit noticed that the Company reported (May 2009) the incident to M/s United India Insurance Company Limited (UIIC) and lodged a claim of US$ 22 million (` 132 crore approx). The reinsurers denied (December 2012) the claim stating that the Company’s decision to continue with operations and perforation of the well after the first anchor (#7) parted was not a recognized safe operating practice. The reinsurers also pointed out that the Company had failed to comply with the duty imposed by the insurance policy to exercise due care and diligence and, hence, were not eligible for compensation. Later (February 2013), in finalising the settlement of another insurance claim, the Company also confirmed to the reinsurer that no litigation would be brought in respect of its claim regarding Sagar Vijay. Thus, the Company also agreed not to pursue its insurance claim further on the rig Sagar Vijay.
Audit noticed that the report submitted (July 2013) by an independent agency M/s Novodrill appointed by the Company on this incident, had also concluded that responsibility for the incident lay with the Company. The report pointed out that anchor #7 had not been repaired before the well was perforated and that the well was live when anchor #8 parted while stressing that this was a major aberration and the Company ought not to have allowed this to happen.
The Company stated (April 2015) the following:
(i) After parting of anchor #7, there was no significant change in vessel position, in riser angle. The weather parameters were within operational limits and there was no adverse weather forecast for next one week. Anchor tensions were continuously monitored and the remaining seven anchors had tensions well within permissible limits. Historically on few occasions, operations had been continued on seven anchors.
(ii) During the time of parting of anchor #7, the perforating charges were already in the well as running of completion (production) string was done. Based on above points, it was opined to continue operations on the well G-4-6. This indicated that due care and diligence was exercised prior to taking the decision to continue operations.

Report No. 39 of 2015
55
(iii) The rig Sagar Vijay was deployed to carry out Top Hole drilling of three wells to utilise its services despite non-availability of its BOP stack. These wells were subsequently completed using the charter hire rig Actinia and, thus, the expenditure incurred for these operations cannot be termed unfruitful, as the Company had carried out job as per availability of resources/ constraints.
MOPNG/ the Company in its supplementary reply (August 2015) reiterated the contention that the Company had not adopted any unsafe operation and the report of the internal committee was only a suggestion for improvement.
Reply of MOPNG/the Company needs to be viewed in the context of the following:
(i) The proximate cause for parting of wire ropes (#7 and #8) was due to poor maintenance procedures of the Company and inherent deterioration in the mooring wires as concluded in report of the independent agency, M/s Clyde and Company, appointed by the reinsurers.
(ii) The anchor #7 parted on 16 April 2009 and even after six days i.e. 22 April 2009, it was not re-laid. In the Company’s internal enquiry report, it was emphasized (October 2009) that in case of any anchor failure, the operation should be suspended and re-commenced only after all anchors were in place.
(iii) Subsequent to the incident, an advisory note was issued to Group General Manager (Head Drilling Services) against allowing continuance of critical operations with a broken anchor. Thus, contention of the Company that due diligence had been done in this case was not justified. Compromising the safety of operations by citing historical occasions of operating the rig with seven anchors was not prudent/ safe practice and established the fact that the Company had carried out operations against established and safe procedures.
(iv) Both the independent agencies appointed by the Company and the reinsurers opined that the decision to continue with the planned well perforation, despite failure of one anchor was not a recognised safe operating practice and ought not to have been done.
The Company, thus, incurred an avoidable expenditure of ` 1,577.27 crore (` 347.03 crore on drilling the abandoned well plus ` 1,033.44 crore on relief well and BOP retrieval plus ` 196.80 crore on deployment of another rig for completing the wells drilled by Sagar Vijay) in continuing production testing operations without rectifying the anchor problem which was a serious safety lapse and led to loss of a hydrocarbon bearing well.
B. Operating owned offshore rigs without consent for operation
As per provision 17 of Petroleum and Natural Gas (Safety in Offshore Operations) Rules 2008, an operator of a mobile installation operating in Indian waters before the commencement of these Rules, had to submit an application for consent of operations within a year of commencement of the Rules. The operator failing to submit such application within a period of six months would be liable to penalties under the Oil Industry (Regulation and Development) Act, 1948.
The Company had eight offshore rigs, of which four (50 per cent of the fleet) did not have consent for operations. In case of these four rigs, the requirement for obtaining consent for operations was yet (May 2015) to be fulfilled.

Report No. 39 of 2015
56
The Company stated (April 2015) that in case of the four owned rigs, the ‘fit for purpose certificate’ alone had not been obtained. Other Rules had been adhered to. The Company also informed that efforts for obtaining ‘fit for purpose certificate’ for the four jack up rigs viz. Sagar Gaurav, Sagar Jyoti, Sagar Kiran and Sagar Shakti were being made and the matter was in an advanced stage. MOPNG endorsed (August 2015) the Management’s reply on the expectation of obtaining ‘fit for purpose certificate’ by December 2015.
It is pertinent to note that all the offshore rigs hired by the Company had obtained consent for operation in offshore areas while the Company, being a major National Oil Company, could not complete the process even after seven years of notification of the Rules.
5.4.2 Onland areas
5.4.2.1 Delay in termination of contract
The Company contracted (October 2008) rig Shiv-50 from M/s. Shiv Vani Oil & Gas Exploration Services Limited, New Delhi (contractor) for a period of three years. The rig was deployed in Assam Asset on 30 April 2010 and was continued beyond the contractual period of three years ended i.e. 29 April 2013 on the same terms and conditions for completing the last well.
Audit noticed that the rig had problems in operation. The problems started in March 2013, when the well had been drilled upto a depth of 2602 metres against target of 4,964 metres and crew struck work for ten days, before scheduled expiry of the contractual period. It was decided to continue the contract for completion of the well. Subsequently, a continuous set of problems were encountered - crew strike (May to August 2013), non-availability of high speed diesel (May 2013), non-availability of equipment (May 2013), rig break down (June 2013). Besides, mud services were withdrawn from May 2013. As of April 2015, the well had been drilled only upto a depth of 4,817 metres.
The Company issued the first notice to the contractor citing unsatisfactory performance in August 2013, three months after the Asset had requested ONSG, Vadodara for issue of such notice. In this notice, the Company allowed the contractor 15 days to correct the specified deficiencies and improve performance. Though the contractor did not take requisite measures and the operation remained disturbed, the Company took another two months to issue (October 2013) 30 days' notice to the contractor for termination of contract. The Company finally issued the termination notice on 21 April 2014. The tardy action on the part of the Company in initiating appropriate action against a defaulting contractor led to continuation of the contract arrangement with intermittent interruptions up to November 2013, by which time the contractor had drilled the well upto 4,817 metres. The contractor stopped work thereafter.
Meanwhile, the well remained incomplete even after incurring an expenditure of ` 39.51 crore. It was also noticed that the contractor did not remove the rig from the site, though the Company requested for the same in April 2014. Subsequently, the Company served a legal notice (September 2014) on the contractor for vacating the drill site. The rig was yet (April 2015) to be moved from the site by the contractor.
Report No. 39 of 2015
57
Failure of the Company to initiate timely action against the contractor led to non-achievement of drilling objective for the well and blockage of ` 39.51 crore. Though the Company had not paid the contractor for the period the rig remained idle, no other penalty had been levied in the absence of enabling provisions in the contract.
In reply, the Company stated (March 2015) that from 06 March 2013 to 01 August 2013, several letters/ performance notice were served to the contractor whenever poor performance was noticed. The case for termination of contract was processed by ONSG, Vadodara and termination order was issued after taking approval of EPC. The completion of the well was planned after removal of Rig Shiv-50. However, M/s Shiv Vani had not vacated the site till now (April 2015). MOPNG reiterated (August 2015) the Company’s reply. The Company in its supplementary reply (August 2015) added that a show cause notice has been issued to M/s. Shiva Vani in this regard by Estate Officer under section 4 of Public Premises Act, 1971.
Reply of the Company was not acceptable as there was delay on the part of the Company in terminating the contract. Though the mud services, which was a vital service for drilling the well, was withdrawn from the rig on 20 May 2013, the Company terminated the contract nearly a year later in April 2014.
5.4.2.2 Diversion of Drilling Rigs for production testing Mehsana Asset hired (June 2010) a 100 ton capacity work-over rig exclusively for production testing of exploratory wells. The rig was, however, not utilised for production testing but for other work-over jobs. Meanwhile, the Asset deployed costlier drilling rigs for production testing. This resulted in avoidable additional expenditure of ` 24.57 crore.
In reply, the Company stated (March/ August 2015) that while the costlier rig was used for work-over operations, work-over (lighter) rigs from the Asset were deployed to take up testing operations as per need.
The reply of the Company may be viewed in the context of utilisation of costlier rigs in production testing of 35 exploratory wells during 2010-14 despite hiring of 100 ton work-over rig exclusively for production testing which resulted in avoidable additional expenditure.
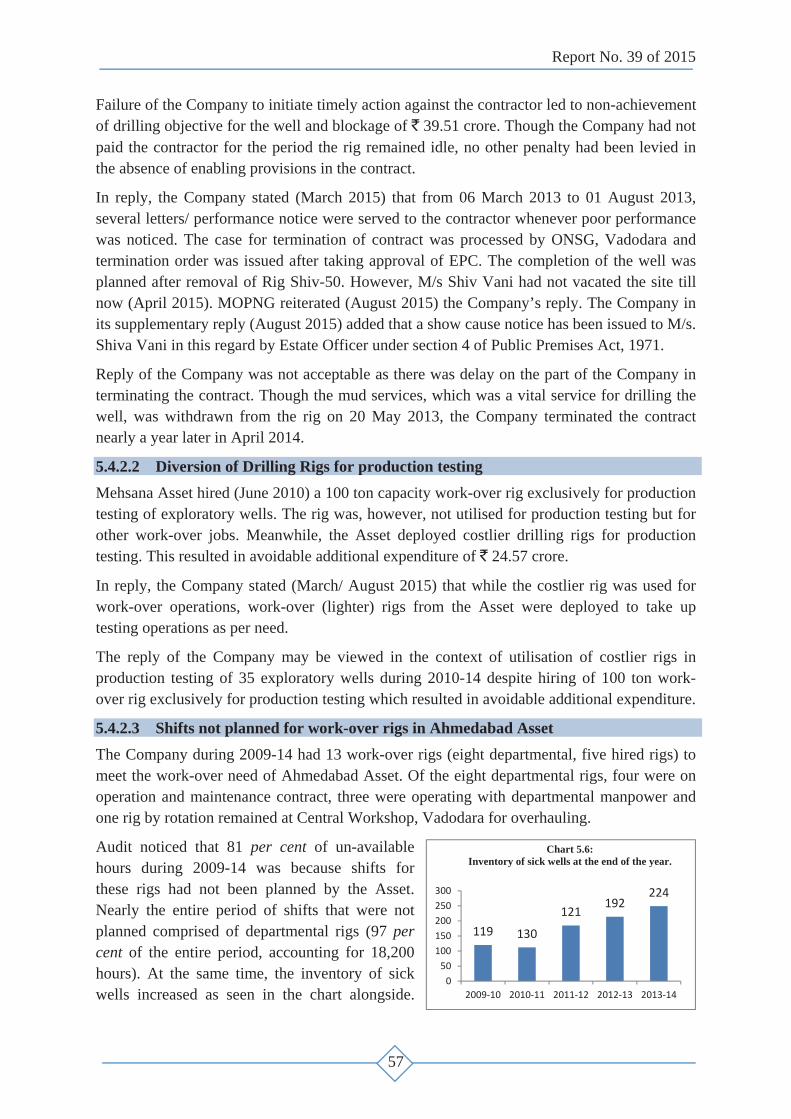
5.4.2.3 Shifts not planned for work-over rigs in Ahmedabad Asset The Company during 2009-14 had 13 work-over rigs (eight departmental, five hired rigs) to meet the work-over need of Ahmedabad Asset. Of the eight departmental rigs, four were on operation and maintenance contract, three were operating with departmental manpower and one rig by rotation remained at Central Workshop, Vadodara for overhauling.
Audit noticed that 81 per cent of un-available hours during 2009-14 was because shifts for these rigs had not been planned by the Asset. Nearly the entire period of shifts that were not planned comprised of departmental rigs (97 per cent of the entire period, accounting for 18,200 hours). At the same time, the inventory of sick wells increased as seen in the chart alongside.
119 130
121192
224
050
100150200250300
2009 10 2010 11 2011 12 2012 13 2013 14
Chart 5.6: Inventory of sick wells at the end of the year.

Report No. 39 of 2015
58
Thus, the departmental work-over rigs remained idle, shifts for deployment of these rigs not having been planned, even as the necessity of work-over jobs increased as seen from the increasing number of sick wells.
The Company stated (April 2015) that due to unavoidable circumstances like delay in replacement of operation and maintenance services, such delays had occurred and that all efforts were being made to avoid/ minimise such delays in future by taking suitable actions. MOPNG in its reply stated (August 2015) that necessary steps are being taken to ensure timely availability of manpower through recruitment/ hiring to avoid situations like shift not planned. The tender of hiring O&M services is now being invited sector-wise so that alternate arrangements can be made from other work centres in the sector (in the event of lack of adequate response to tender).
The assurance of the Company would be watched in future audit.
5.5 Drilling Efficiency
A. Cycle Speed Efficiency of rigs is determined through the cycle speed and commercial speed of the rigs. The total time taken by a rig in a complete cycle17 is called as cycle time in months or rig months. The cycle speed defines the efficiency of operations during the entire cycle of a deployed rig and was calculated as meterage drilled during the rig month deployed.
Performance of drilling operations in terms of cycle speed of rigs deployed by the Company during the four years from 2010-11 to 2013-14 is tabulated below:
Table 5.6: Performance of drilling operations in terms of cycle speed (metres/rig month)
Area
2010-11 2011-12 2012-13 2013-14
Plan Actual % Plan Actual % Plan Actual % Plan Actual %
Offshore
Basins 909 737 81% 988 886 90% 976 873 69% 955 665 70%
Assets 1,408 1,280 91% 1,500 1,331 89% 1,482 1,419 96% 1,486 1,157 78%
Total 1,037 869 84% 1,213 1,048 86% 1,194 1,127 94% 1,194 869 73%
Onshore
Basins 589 521 88% 622 563 91% 599 566 94% 628 559 89%
Assets 833 964 116% 907 961 106% 831 986 119% 852 983 115%
Total 696 736 106% 746 768 103% 723 809 112% 747 800 107% Source: Director (T&FS) Annual Report 2010-11 to 2013-14
From the above table it was evident that in offshore, the Company could not achieve the planned cycle speed for all the years both in Basins and Assets. The main reason for non-achievement of planned cycle speed was poor performance of owned rigs compared to CH rigs. In onland area, the Company could not achieve the planned cycle speed in Basins, though the performance in Assets exceeded the plan. Audit observed that in four onland Assets (three Assets of Western Onshore and Tripura Asset) where the Company had shown better performance than planned, the cycle speed target was kept lower though Assets consistently performed better during the previous years.
17 Comprises rig building, drilling and production testing and rig move.

Report No. 39 of 2015
59
Analysis of the cycle speed achieved by offshore rigs (both owned and CH) during 2010-14, revealed very poor performance of owned rigs. Though the cycle speed of own offshore rigs had improved over the last four years, it could at best reach 50 per cent of the cycle speed of CH rigs.
Audit noticed that the variation in performance of owned and chartered rigs was attributed to large scale attrition of experienced manpower, higher age bracket of the Company crew (45-47 years) and ageing of rigs and equipment. The Executive Committee (EC) of the Company decided (March 2011) that a work centre-wise benchmarking should be carried out which would include comparison among Assets as well as comparison vis-à-vis other oil companies. Institute of Drilling Technology (IDT) - an organisation within the Company, was to set (March 2011) these benchmarks. It was noticed that IDT was yet (May 2015) to benchmark drilling activities for offshore Assets and Basins. In case of onland activities, benchmarks had been set (July 2011) for onland Assets alone (the exercise for Eastern region yet to be completed till May 2015) and benchmarks for onland Basins were yet (May 2015) to be drawn up. Audit noticed that the limited benchmarking done, did not indicate comparisons of time norms with other peer companies.
Audit also observed that the Company did not maintain its own jack-up rigs properly mainly due to absence of specific policies on major lay-up repairs of these rigs and equipment replacement of offshore rigs, which were formulated very late in 2007 and 2008 respectively i.e. after lapse of 25-26 years of commissioning of owned rigs. In its absence, the owned rigs were continuously operated with obsolete equipment/ outdated system affecting the rig efficiency.
The Company in reply stated (April 2015) the following:
(i) The cycle speed considered in FYP / annual plan/ RDP was based on limited data and past experience of the field. Actual drilling days were likely to vary which cannot be accounted for in advance planning. Production testing and activation duration of a well could also vary depending on level of formation pressure depletion. Increasing depletion of producing zones and drilling in lesser known marginal fields had also affected cycle speed. Hence, cycle speed could not be solely treated as an absolute performance indicator.
(ii) The Company was in the process of hiring an international consulting agency to strengthen its benchmark norms while maintaining that the benchmark norms were field specific and resource based and it would not be practical to make comparison with rigs operating in different environment as it would not be “Like to Like” evaluation. The Company also added that recommendations of Original Equipment Manufacturer (OEM) of individual equipment/system on board the jack up rigs and Classification Agency surveyors in periodical surveys were implemented to (a) ensure safety and (b) meet class rule requirements. The efficiency of drilling services group had been affected due to lack of an apt manpower on the rigs. The ongoing recruitment exercise to fill-in the approved posts in drilling discipline at staff level was expected to add 538 employees to the above availability tally of 1131, which would lead to adequate overall manning.

Report No. 39 of 2015
60
The Company in its supplementary reply (August 2015) added that the Company’s rigs being old and not upgraded, all the new technology used in charter hired rigs cannot be used in most of the Company’s rigs. Aggressive recruitments have been initiated since 2008-2010. This being a highly skilled functional area the new inductees have been exposed to field operation one year after induction. During the first year they are provided a structured classroom/ field training. A period of 5-7 years is a reasonable time to develop these skills.
Reply of the Company needs to be viewed in the context that:
(i) The Company fixed target for cycle speed both for owned and charter hired (CH) offshore rigs based on past performance of rigs i.e. average time taken for different category of wells. Efficiency of owned rigs during the period reviewed by audit was in the range of 27 to 49 per cent of that of CH rigs. Even with adoption of efficiency enhancing measures, such as advance mud systems, new generation bits and new technologies, the cycle speed of offshore rigs did not improve noticeably. The Board of Directors of the Company also observed (October 2014) that there were opportunities to improve the drilling efficiency of CH rigs as well.
(ii) The comparison among peers as envisaged by EC would lead to better analysis of weaknesses which had not been taken up.
(iii) The Company also did not recruit drilling manpower commensurate with the retirement/transfer/attrition. While the Company’s action to recruit more employees in drilling discipline was appreciated, pending induction of Q1/Q2 executives and staff (pending induction of 2013-14 and 2014-15 executives and staff), the shortages were met by Q3 executives mostly with age >50 years. Considering the age and qualification profile of such executives, the desired output could not be achieved which affected the drilling efficiency. Even after considering the completion of the recruitment process, lack of skilled manpower would continue to hinder the operational efficiency of rigs in the years to come.
B. Commercial speed
The commercial speed is a measure of meterage drilled against time taken from spudding the well to the hermetical testing18. It is expressed as metre / rig month. In case of onland rigs, Ahmedabad and Agartala Assets alone had planned the commercial speed and the remaining nine Assets did not plan for commercial speed. However, the commercial speed of offshore rigs was not planned. The commercial speed achieved both in offshore and onland rigs during 2010-14 is tabulated below:
Table 5.7: Achievement of commercial speed in offshore and onland areas (metres/rig month)
Area 2010-11 2011-12 2012-13 2013-14 Offshore Basins 1,109 1,134 1,154 978
Assets 1,784 1,696 1,861 1,604 Total 1,282 1,340 1,484 1,246
Onland Basins 756 814 885 908 Assets 1,427 1,401 1,466 1,459 Total 1,079 1,116 1,228 1,233
Source: Director (T&FS) Annual report 2010-11 to 2013-14
18 Hermetical testing refers to the closed cycle pressure testing of casings of wells completed by pumping water at steady rate to detect leakage before handing over the well for production testing.

Report No. 39 of 2015
61
Commercial speed in offshore area during 2013-14, both in Basins and Assets, showed a declining trend compared to previous years. As regards onshore rigs, the overall achievement of commercial speed was on increasing trend during 2010-14 both in Basins and Assets.
The Company/MOPNG stated (April 2015/August 2015) that the actual drilling time varied depending on factors like presence of loss zones, high pressure zones, problematic formations, limitations on well profile due to nearby wells and its effect on actual depth of well etc. Hence, actual drilling days were likely to vary accordingly which could not be accounted for in advance planning. Also that the cycle speed and commercial speed could not be a sole and an absolute performance indicator.
Reply of the Company needs to be viewed in the context that the performance had deteriorated in Offshore Assets and Basins due to non-maintenance of owned rigs, delay in dry docking/major lay-up repairs (commented in the paragraphs 6.1.1 and 6.1.3) and non-improvement in efficiency in spite of deployment of new generation rigs and introduction of new technologies. In the performance contracts entered into between Performance Management and Benchmarking Group and the Drilling Services groups of the Company, the Company itself had adopted the cycle speed and commercial speed as the key performance indicators for measuring operational and drilling efficiency and extent of utilisation of the rigs. Hence, reply of the Company that these parameters cannot be solely treated as an absolute performance indicator was not justified.
C. Deficiencies in Target setting of commercial and cycle speed in Performance contracts
The Performance and Bench Marking Section of the Company enters into Performance Contracts with Assets, Basins and Services setting targets on Key Performance Indicators (KPIs) based on the MOU targets entered into with MOPNG. The KPIs to measure operational and drilling efficiency of Drilling Services group were in terms of cycle speed and Commercial speed. A single cycle speed and commercial speed (applicable for both offshore and onland drilling) was set as the KPI target. The planned cycle/ commercial speed (as per KPI) and the actual cycle speed for onland and offshore areas, segregated by owned and CH rigs, is depicted in the table given below:
Table 5.8: Statement showing target and actual achievement of cycle speed and commercial speed (Meters/Rig Months)
KPIs Types of rigs 2010-11 2011-12 2012-13 2013-14 Target Actual Target Actual Target Actual Target Actual
Cycle speed
Onland Owned 677 803 706 781 674 833 739 802 Onland CH 940 733 1081 757 1075 819 1,080 805 Offshore Owned 677 353 706 303 674 490 739 484 Offshore CH 940 1,057 1,081 1,105 1,075 1,167 1,080 993
Comm-ercial speed
Onland Owned 1,096 1,194 1,055 1,153 1,108 1,286 1,249 1,247 Onland CH 1,331 1,045 1,239 1,064 1,210 1,200 1,425 1,018 Offshore Owned 1,096 738 1,055 5,78 1,108 736 1,249 756 Offshore CH 1,331 1,544 1,239 1,355 1,210 1,503 1,425 1,388

Report No. 39 of 2015
62
In this regard, Audit observed the following:
The cycle speed planned in the Annual Plans and agreed in the performance contracts with the Drilling Services group were different as shown in the chart alongside. The cycle speed planned by the Company in its Annual Plans were consistently higher than the KPI target fixed for the performance of Drilling Services group. Thus, while the Drilling Services group over-achieved their performance target as per Performance Contracts (PCs), the planned cycle speed could not be achieved by the Company (particularly for offshore drilling by owned rigs) as per Annual Plans.
Poor performance of owned offshore rigs had been deliberated time and again in various forums. However, the same was not reflected in the performance of Drilling Services group which had consistently reported ‘outstanding’ performance for the four years under review. The performance contract was a basis for assessing the actual performance and payment of performance related pay. Hence, there was a necessity to properly set the target in the PCs both for own and CH rigs separately for offshore and onland to have desired stretch in the performance.
A single 'target cycle speed' for owned rigs in the performance contract with Drilling Services group was also not conducive to efficiency. The target cycle speed for 2010-11 for owned rigs was 677 against which the Drilling Services group reported a performance of 723. However, the actual performance of offshore departmental rigs was 353 (~half the targeted efficiency). The higher performance of the onland departmental rigs at 803, and their higher weightage on account of their larger number (68 onland rigs as against nine offshore rigs) had shadowed the poor performance of offshore rigs. To monitor the performance of drilling realistically, separate targets would be essential for all four categories – offshore hired, offshore owned, onland hired and onland owned. In the absence of such area specific targets, it was not possible to assess the efficiency of Drilling Services group in operating the rigs.
The Company had kept the cycle and commercial speed of its own rig around 30 per cent lower than CH rigs and had this in-built inefficiency in the targets itself.
During Exit Conference held with the Company in May 2015, the Director Offshore stated that fixing separate targets for owned rigs both offshore and onshore as well as hired rigs would be looked into and incorporated in the Performance Contracts of Drilling Services group in future. The Company in its supplementary reply (August 2015) stated that as suggested by audit separate KPI of cycle speed and commercial speed for Onshore (Owned and Charter hired rigs), Offshore - Shallow Water (Owned and Charter Hired rigs) and Offshore - Deep Water (Owned and Chartered Hired rigs) was created in Performance
1037
1213 1194 1194
940
1081 1075 1080
677 706 674739
600
700
800
900
1000
1100
1200
1300
2010 11 2011 12 2012 13 2013 14
Chart 5.7: Cycle speed offshore Plan vs PC targets
Plan cycle speed
PC Cycle speed hired
PC cycle speed own
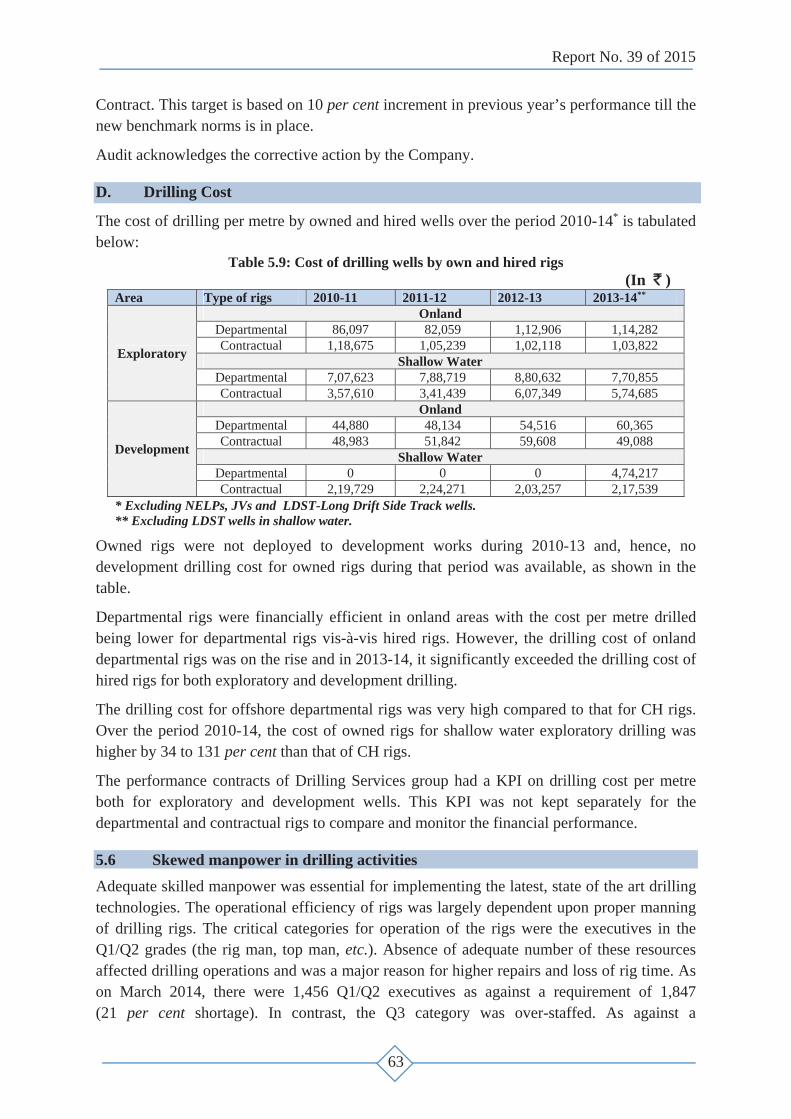
Report No. 39 of 2015
63
Contract. This target is based on 10 per cent increment in previous year’s performance till the new benchmark norms is in place.
Audit acknowledges the corrective action by the Company.
D. Drilling Cost
The cost of drilling per metre by owned and hired wells over the period 2010-14* is tabulated below:
Table 5.9: Cost of drilling wells by own and hired rigs (In ` )
Area Type of rigs 2010-11 2011-12 2012-13 2013-14**
Exploratory
Onland Departmental 86,097 82,059 1,12,906 1,14,282 Contractual 1,18,675 1,05,239 1,02,118 1,03,822
Shallow Water Departmental 7,07,623 7,88,719 8,80,632 7,70,855 Contractual 3,57,610 3,41,439 6,07,349 5,74,685
Development
Onland Departmental 44,880 48,134 54,516 60,365 Contractual 48,983 51,842 59,608 49,088
Shallow Water Departmental 0 0 0 4,74,217 Contractual 2,19,729 2,24,271 2,03,257 2,17,539
* Excluding NELPs, JVs and LDST-Long Drift Side Track wells. ** Excluding LDST wells in shallow water.
Owned rigs were not deployed to development works during 2010-13 and, hence, no development drilling cost for owned rigs during that period was available, as shown in the table.
Departmental rigs were financially efficient in onland areas with the cost per metre drilled being lower for departmental rigs vis-à-vis hired rigs. However, the drilling cost of onland departmental rigs was on the rise and in 2013-14, it significantly exceeded the drilling cost of hired rigs for both exploratory and development drilling.
The drilling cost for offshore departmental rigs was very high compared to that for CH rigs. Over the period 2010-14, the cost of owned rigs for shallow water exploratory drilling was higher by 34 to 131 per cent than that of CH rigs.
The performance contracts of Drilling Services group had a KPI on drilling cost per metre both for exploratory and development wells. This KPI was not kept separately for the departmental and contractual rigs to compare and monitor the financial performance.
5.6 Skewed manpower in drilling activities Adequate skilled manpower was essential for implementing the latest, state of the art drilling technologies. The operational efficiency of rigs was largely dependent upon proper manning of drilling rigs. The critical categories for operation of the rigs were the executives in the Q1/Q2 grades (the rig man, top man, etc.). Absence of adequate number of these resources affected drilling operations and was a major reason for higher repairs and loss of rig time. As on March 2014, there were 1,456 Q1/Q2 executives as against a requirement of 1,847 (21 per cent shortage). In contrast, the Q3 category was over-staffed. As against a

Report No. 39 of 2015
64
requirement of 510, the available manpower was 1,490 (nearly three times the requirement). The skewed manpower availability led to poor operational performance in manning departmental rigs.
In particular, shortage of adequate staff was noticed in operation of two owned floater rigs, Sagar Vijay and Sagar Bhushan. In the absence of adequate manpower, the Company had decided to hire O&M services for efficient manning of these rigs. Tender for hiring O&M services was issued as early as 2007. However, it could not be finalised owing to agitations from staff. Subsequently, four years after cancellation of the earlier tender in 2008, the Company again decided to hire O&M services in September 2012. Delays in processing this tender had been noticed at various stages. The tender was yet (April 2015) to be finalised. Inordinate delay in hiring O&M services affected the drilling operations of both the rigs.
While accepting the audit comment, the Company stated (April 2015) that its crew was continuing drilling operations on both the drillships. Audit, however, noticed that as of April 2015 the rigs were managed with bare minimum crew, affecting rig performance.
MOPNG stated (August 2015) that the O&M contract for rig Sagar Vijay is still under process and the shortage of manpower in floaters is being managed through transferring executives from other region of ONGC. Due to the presence of experienced Q3 executives, the shifts on the rigs are managed with less number of Q1/Q2 executives. Immediate shortages of manpower are bridged by allowing outsourcing in select areas.
The reply needs to be viewed in the context of acknowledgement by the Management in various forums, that the ageing manpower in Q3 level and the unskilled manpower of new recruits are impacting the efficiency of own rigs/ floaters. More importantly, as admitted by the Management, a period of 5-7 years is required to develop the skills required for drilling operations. Thus, the delay in filling the manpower shortages during past years would have a cascading effect on the availability of skilled manpower in the years to come.