Chapter 5 Index Numbers
18
1 Slides Prepared by Slides Prepared by JOHN S. LOUCKS JOHN S. LOUCKS St. Edward’s University St. Edward’s University © 2002 South-Western/Thomson Learning © 2002 South-Western/Thomson Learning
Transcript of Chapter 5 Index Numbers
1 Slide
Slides Prepared bySlides Prepared byJOHN S. LOUCKSJOHN S. LOUCKS
St. Edward’s UniversitySt. Edward’s University
© 2002 South-Western/Thomson Learning© 2002 South-Western/Thomson Learning

2 Slide
Chapter 17Chapter 17 Index Numbers Index Numbers
Price RelativesPrice Relatives Aggregate Price IndexesAggregate Price Indexes Computing an Aggregate Price IndexComputing an Aggregate Price Index from Price Relativesfrom Price Relatives
Some Important Price IndexesSome Important Price Indexes Deflating a Series by Price IndexesDeflating a Series by Price Indexes Price Indexes: Other ConsiderationsPrice Indexes: Other Considerations Quantity IndexesQuantity Indexes

3 Slide
Price RelativesPrice Relatives
Price relatives are helpful in Price relatives are helpful in understanding and interpreting changing understanding and interpreting changing economic and business conditions over economic and business conditions over time.time.

4 Slide
Price RelativesPrice Relatives
A A price relativeprice relative shows how the current shows how the current price per unit for a given item price per unit for a given item compares to a base period price per compares to a base period price per unit for the same item.unit for the same item.
A price relative expresses the unit A price relative expresses the unit price in each period as a percentage of price in each period as a percentage of the unit price in the base period.the unit price in the base period.
A A base periodbase period is a given starting point is a given starting point in time.in time.Price relative in period = Price in period
Base period price ( )t t 100Price relative in period = Price in period Base period price ( )t t 100
5 Slide
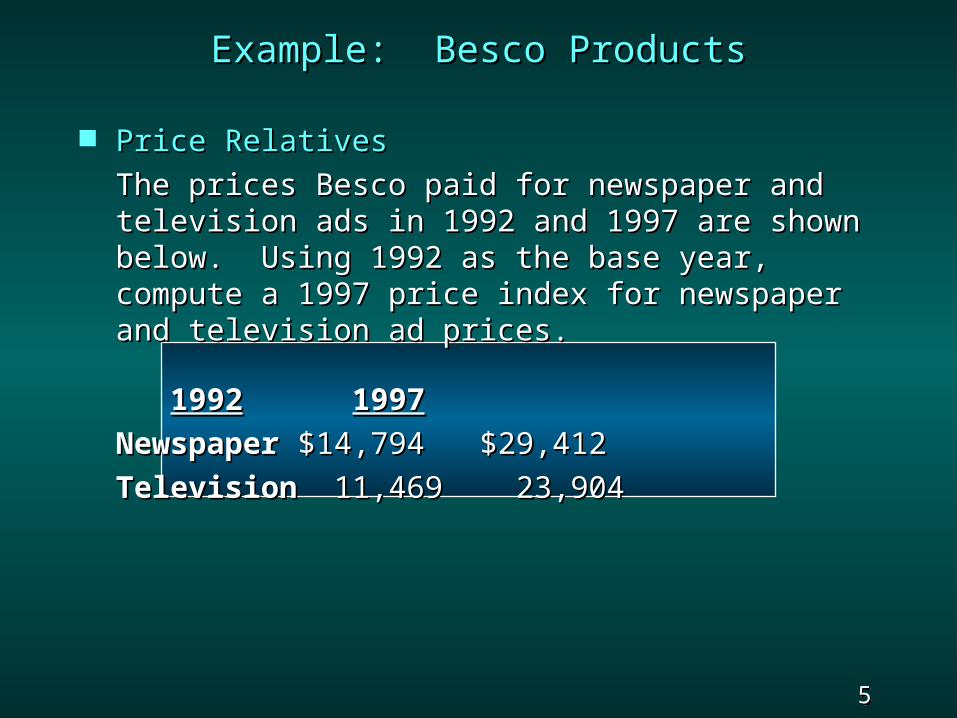
Example: Besco ProductsExample: Besco Products
Price RelativesPrice RelativesThe prices Besco paid for newspaper and The prices Besco paid for newspaper and television ads in 1992 and 1997 are shown television ads in 1992 and 1997 are shown below. Using 1992 as the base year, below. Using 1992 as the base year, compute a 1997 price index for newspaper compute a 1997 price index for newspaper and television ad prices.and television ad prices.
19921992 19971997NewspaperNewspaper $14,794$14,794 $29,412$29,412TelevisionTelevision 11,46911,469 23,90423,904
6 Slide
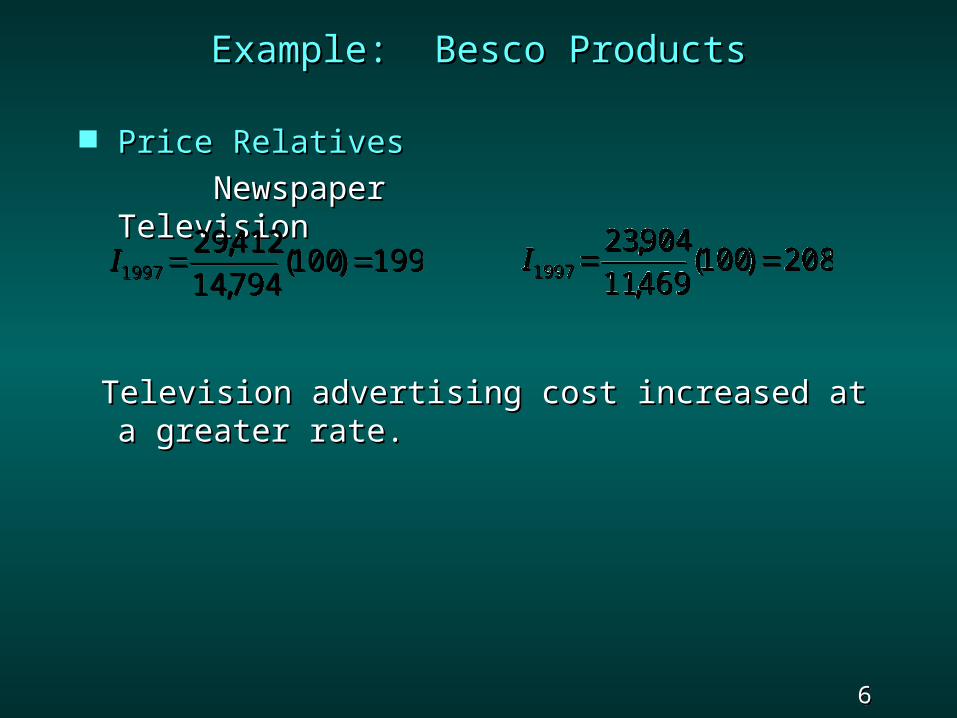
Example: Besco ProductsExample: Besco Products
Price RelativesPrice RelativesNewspaperNewspaper
TelevisionTelevision
Television advertising cost increased at Television advertising cost increased at a greater rate.a greater rate.
199)100(794,14412,29
1997 I
7 Slide
Aggregate Price IndexesAggregate Price Indexes
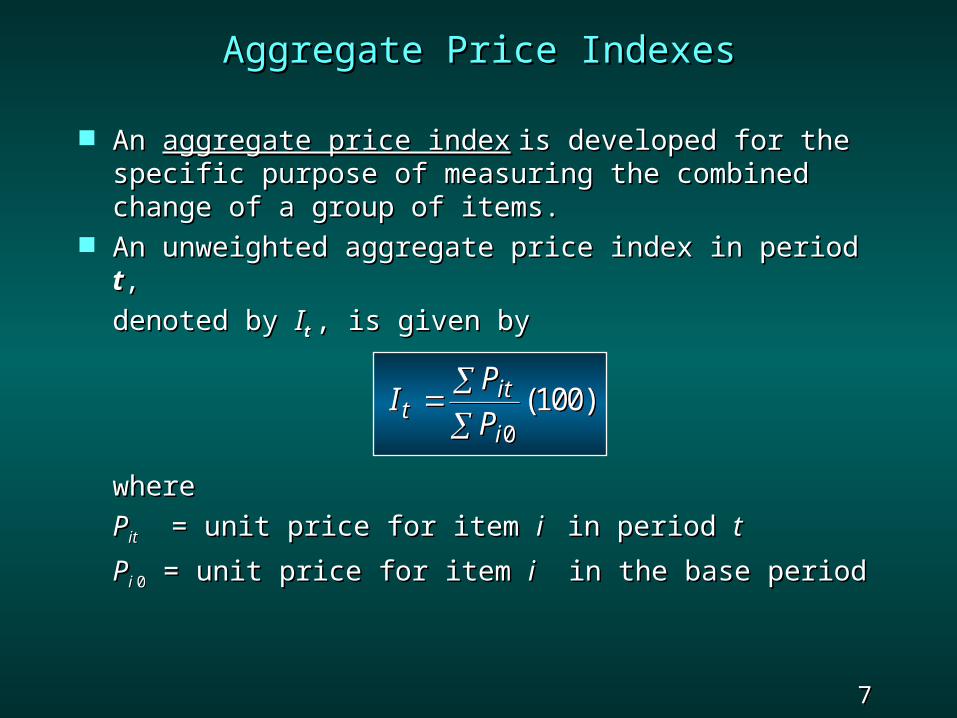
An An aggregate price indexaggregate price index is developed for the is developed for the specific purpose of measuring the combined specific purpose of measuring the combined change of a group of items.change of a group of items.
An unweighted aggregate price index in period An unweighted aggregate price index in period tt,,denoted by denoted by IItt , is given by, is given by
wherewherePPitit = unit price for item = unit price for item i i in period in period ttPPi i 00 = unit price for item = unit price for item ii in the base period in the base period
I PPt
it
i
0100( )I P
Ptit
i
0100( )

8 Slide
With a With a weighted aggregate indexweighted aggregate index each item each item in the group is weighted according to its in the group is weighted according to its importance, which typically is the importance, which typically is the quantity of usage.quantity of usage.
Letting Letting QQii = quantity for item = quantity for item ii, the , the weighted aggregate price index in period weighted aggregate price index in period t t is given by is given by
where the sums are over all items in the where the sums are over all items in the group.group.
I P QP Qt
it i
i i
0100( )I P Q
P Qtit i
i i
0100( )
Aggregate Price IndexesAggregate Price Indexes

9 Slide
Aggregate Price IndexesAggregate Price Indexes
When the fixed quantity weights are When the fixed quantity weights are determined from the base-year usage, determined from the base-year usage, the index is called a the index is called a Laspeyres indexLaspeyres index. .
When the weights are based on period When the weights are based on period tt usage the index is a usage the index is a Paasche indexPaasche index..

10 Slide
Example: City of NewtonExample: City of Newton
Aggregate Price IndexesAggregate Price IndexesData on energy consumption and expenditures by Data on energy consumption and expenditures by sector for the city of Newton are given below. sector for the city of Newton are given below. Construct an aggregate price index for energy Construct an aggregate price index for energy expenditures in 2000 using 1985 as the base expenditures in 2000 using 1985 as the base year.year.
Quantity (BTU) Unit Quantity (BTU) Unit Price ($/BTU)Price ($/BTU)SectorSector 19851985 20002000 19851985 20002000Residential Residential 9,473 9,473 8,804 8,804 $2.12$2.12 $10.92$10.92CommercialCommercial 5,416 5,416 6,015 6,015 1.97 1.97 11.32 11.32IndustrialIndustrial 21,28721,287 17,83217,832 .79 .79 5.13 5.13Transport.Transport. 15,29315,293 20,26220,262 2.32 2.32 6.16 6.16

11 Slide
Unweighted Aggregate Price IndexUnweighted Aggregate Price IndexII2000 2000 = 10.92 + 11.32 + 5.13 + 6.16 = 10.92 + 11.32 + 5.13 + 6.16 (100) (100) = 466= 466 2.12 + 1.97 + .79 + 2.322.12 + 1.97 + .79 + 2.32
Weighted Aggregate Index (Laspeyres Method)Weighted Aggregate Index (Laspeyres Method)II20002000 = 10.92(9473) + . . . + 6.16(15293) = 10.92(9473) + . . . + 6.16(15293) (100) (100) = = 443443 2.12(9473) + . . . + 2.32(15293)2.12(9473) + . . . + 2.32(15293)
Weighted Aggregate Index (Paasche Method)Weighted Aggregate Index (Paasche Method)II20002000 = 10.92(8804) + . . . + 6.16(20262) = 10.92(8804) + . . . + 6.16(20262) (100) (100) = = 415415 2.12(8804) + . . . + 2.32(20262)2.12(8804) + . . . + 2.32(20262)The Paasche value being less than the Laspeyres The Paasche value being less than the Laspeyres indicates usage has increased faster in the indicates usage has increased faster in the lower-priced sectors.lower-priced sectors.
Example: City of NewtonExample: City of Newton

12 Slide
Some Important Price IndexesSome Important Price Indexes
Consumer Price Index (CPI)Consumer Price Index (CPI)• Primary measure of the cost of living in Primary measure of the cost of living in US.US.
• Based on 400 items including food, Based on 400 items including food, housing, clothing, transportation, and housing, clothing, transportation, and medical items.medical items.
• Weighted aggregate price index with fixed Weighted aggregate price index with fixed weights derived from a usage survey.weights derived from a usage survey.
• Published monthly by the US Bureau of Published monthly by the US Bureau of Labor Statistics.Labor Statistics.
• Its base period is 1982-1984 with an index Its base period is 1982-1984 with an index of 100.of 100.

13 Slide
Producer Price Index (PPI)Producer Price Index (PPI)• Measures the monthly changes in prices Measures the monthly changes in prices in primary markets in the US.in primary markets in the US.
• Used as a Used as a leading indicatorleading indicator of the of the future trend of consumer prices and the future trend of consumer prices and the cost of living.cost of living.
• Covers raw, manufactured, and processed Covers raw, manufactured, and processed goods at each level of processing.goods at each level of processing.
• Includes the output of manufacturing, Includes the output of manufacturing, agriculture, forestry, fishing, mining, agriculture, forestry, fishing, mining, gas and electricity, and public gas and electricity, and public utilities.utilities.
• Weighted average of price relatives Weighted average of price relatives using the Laspeyres method.using the Laspeyres method.
Some Important Price IndexesSome Important Price Indexes

14 Slide
Deflating a Series by Price IndexesDeflating a Series by Price Indexes
YearYearTotal Sales ($1000)Total Sales ($1000)CPICPI
1996 1996 8,446 8,446 156.9156.919971997 9,062 9,062 160.5160.5
19981998 9,830 9,830 163.0163.0 1999 1999 10,72410,724 166.6166.6
20002000 11,69011,690 172.6172.6
Example: McNeer CleanersExample: McNeer Cleaners
15 Slide
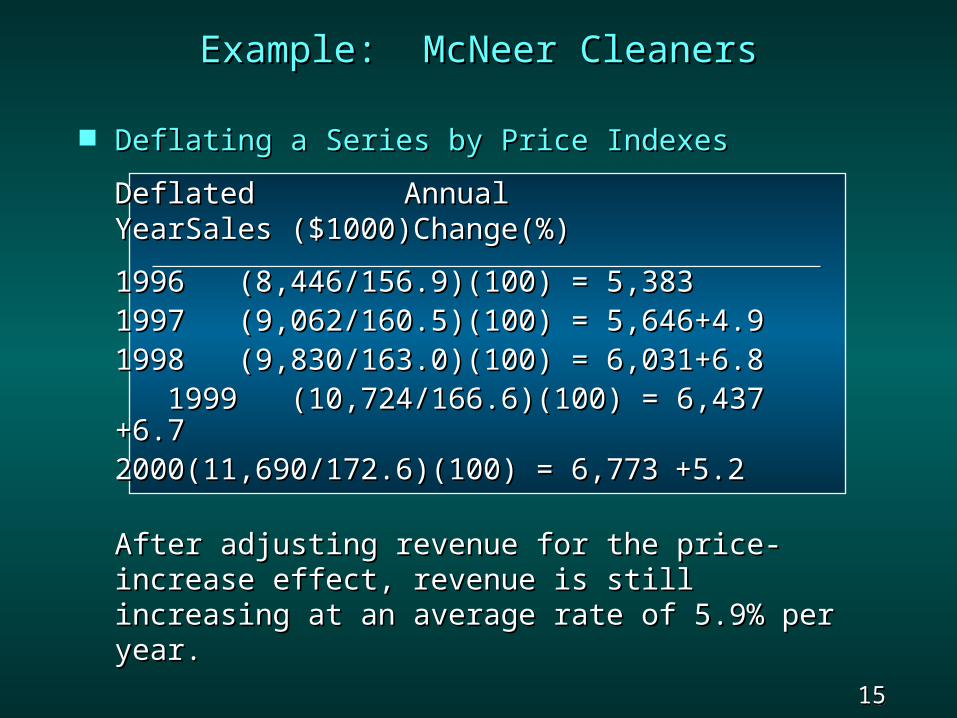
Deflating a Series by Price IndexesDeflating a Series by Price IndexesDeflatedDeflated AnnualAnnualYearYearSales ($1000)Sales ($1000)Change(%)Change(%)19961996 (8,446/156.9)(100) = 5,383 (8,446/156.9)(100) = 5,38319971997 (9,062/160.5)(100) = 5,646 (9,062/160.5)(100) = 5,646+4.9+4.919981998 (9,830/163.0)(100) = 6,031 (9,830/163.0)(100) = 6,031+6.8+6.8 1999 1999 (10,724/166.6)(100) = 6,437(10,724/166.6)(100) = 6,437+6.7+6.720002000(11,690/172.6)(100) = 6,773(11,690/172.6)(100) = 6,773 +5.2+5.2
After adjusting revenue for the price-After adjusting revenue for the price-increase effect, revenue is still increase effect, revenue is still increasing at an average rate of 5.9% per increasing at an average rate of 5.9% per year.year.
Example: McNeer CleanersExample: McNeer Cleaners
16 Slide
Price Indexes: Other Price Indexes: Other ConsiderationsConsiderations
Quality ChangesQuality Changes• A basic assumption of price indexes A basic assumption of price indexes is that the prices are identified for is that the prices are identified for the the samesame items each period. items each period.
• Is a product that has undergone a Is a product that has undergone a major quality change the same product major quality change the same product it was?it was?
• A substantial quality improvement A substantial quality improvement also may cause an increase in the also may cause an increase in the price of a product.price of a product.

17 Slide
Quantity IndexesQuantity Indexes
An index that measures changes in An index that measures changes in quantity levels over time is called a quantity levels over time is called a quantity index.quantity index.
Probably the best known quantity index Probably the best known quantity index is the is the Index of Industrial ProductionIndex of Industrial Production..
A weighted aggregate quantity index is A weighted aggregate quantity index is computed in much the same way as a computed in much the same way as a weighted aggregate price index.weighted aggregate price index.
A weighted aggregate quantity index for A weighted aggregate quantity index for period period tt is given by is given by
I Q wQ wt
it i
i i
0100( )I Q w
Q wtit i
i i
0100( )

18 Slide
End of Chapter 17End of Chapter 17