Chapter 2: Real Numbers - Clarkwork.com
60
Real Numbers Chapter Overview and Pacing Real Numbers Chapter Overview and Pacing PACING (days) Regular Block Basic/ Basic/ Average Advanced Average Advanced Rational Numbers on the Number Line (pp. 68–72) 1 optional 0.5 optional • Graph rational numbers on a number line. • Find absolute values of rational numbers. Adding and Subtracting Rational Numbers (pp. 73–78) 2 optional 1 optional • Add integers and rational numbers. • Subtract integers and rational numbers. Multiplying Rational Numbers (pp. 79–83) 1 optional 0.5 optional • Multiply integers. • Multiply rational numbers. Dividing Rational Numbers (pp. 84–87) 1 optional 0.5 optional • Divide integers. • Divide rational numbers. Statistics: Displaying and Analyzing Data (pp. 88–94) 1 optional 1 optional • Interpret and create line plots and stem-and-leaf plots. • Analyze data using mean, median, and mode. Probability: Simple Probability and Odds (pp. 96–102) 2 optional 1 optional • Find the probability of a simple event. (with 2-6 (with 2.6 • Find the odds of a simple event. Follow-Up) Follow-Up) Follow-Up: Use tables to investigate probability and Pascal’s Triangle. Square Roots and Real Numbers (pp. 103–109) 1 optional 0.5 optional • Find square roots. • Classify and order real numbers. Study Guide and Practice Test (pp. 110–115) 1 3 0.5 1 Standardized Test Practice (pp. 116–117) Chapter Assessment 1 1 0.5 0 TOTAL 11 4 6 1 LESSON OBJECTIVES 66A Chapter 2 Real Numbers Year-long and two-year pacing: pages T20–T21. An electronic version of this chapter is available on StudentWorks TM . This backpack solution CD-ROM allows students instant access to the Student Edition, lesson worksheet pages, and web resources.
-
Upload
khangminh22 -
Category
Documents
-
view
1 -
download
0
Transcript of Chapter 2: Real Numbers - Clarkwork.com

Real NumbersChapter Overview and PacingReal NumbersChapter Overview and Pacing
PACING (days)Regular Block
Basic/ Basic/ Average Advanced Average Advanced
Rational Numbers on the Number Line (pp. 68–72) 1 optional 0.5 optional• Graph rational numbers on a number line.• Find absolute values of rational numbers.
Adding and Subtracting Rational Numbers (pp. 73–78) 2 optional 1 optional• Add integers and rational numbers.• Subtract integers and rational numbers.
Multiplying Rational Numbers (pp. 79–83) 1 optional 0.5 optional• Multiply integers.• Multiply rational numbers.
Dividing Rational Numbers (pp. 84–87) 1 optional 0.5 optional• Divide integers.• Divide rational numbers.
Statistics: Displaying and Analyzing Data (pp. 88–94) 1 optional 1 optional• Interpret and create line plots and stem-and-leaf plots.• Analyze data using mean, median, and mode.
Probability: Simple Probability and Odds (pp. 96–102) 2 optional 1 optional• Find the probability of a simple event. (with 2-6 (with 2.6• Find the odds of a simple event. Follow-Up) Follow-Up)Follow-Up: Use tables to investigate probability and Pascal’s Triangle.
Square Roots and Real Numbers (pp. 103–109) 1 optional 0.5 optional• Find square roots.• Classify and order real numbers.
Study Guide and Practice Test (pp. 110–115) 1 3 0.5 1Standardized Test Practice (pp. 116–117)
Chapter Assessment 1 1 0.5 0
TOTAL 11 4 6 1
LESSON OBJECTIVES
66A Chapter 2 Real Numbers
Year-long and two-year pacing: pages T20–T21.
An electronic version of this chapter is available on StudentWorksTM. This backpack solution CD-ROMallows students instant access to the Student Edition, lesson worksheet pages, and web resources.

*Key to Abbreviations: GCS � Graphing Calculator and Spreadsheet Masters,SC � School-to-Career Masters, SM � Science and Mathematics Lab Manual
Study Guide and Intervention, Skills Practice, Practice, and Parent and Student Study Guide Workbooks are also available in Spanish.
ELL
Chapter 2 Real Numbers 66B
Materials
Stud
y Gu
ide
and
Inte
rven
tion
Prac
tice
(Ski
lls a
nd A
vera
ge)
Read
ing
to L
earn
Mat
hem
atic
s
Enric
hmen
t
Asse
ssm
ent
75–76 77–78 79 80 1–4, 15–16, SM 33–36 11 2-1 2-119–20, 45–46, 55–56, 63–66,
75–76
81–82 83–84 85 86 131 15–16, 19–24, GCS 26 12 2-2 2-239–40, 55–60,65–66, 75–76
87–88 89–90 91 92 15–16, 19–20, SC 3 13 2-3 2-325–28, 39–40,47–50, 65–66,
75–76
93–94 95–96 97 98 131, 133 15–16, 19–20, SC 4 14 2-4 2-4 329–32, 39–40,47–48, 51–54,63–66, 75–76
99–100 101–102 103 104 15–16, 61–62, 15 2-5 2-5 grid paper75–76
105–106 107–108 109 110 132 17–18, 37–38, 16 2-6 2-667–70, 99–100
111–112 113–114 115 116 132 75–76 GCS 25 17 2-7 2-7 grid paper
117–130, 18134–136
Chapter Resource ManagerChapter Resource Manager
Alge
PASS
: Tut
oria
l
Plus
(les
sons
)
5-M
inut
e Ch
eck
Tran
spar
enci
es
Pare
nt a
nd S
tude
nt
Stud
y Gu
ide
Wor
kboo
k
Appl
icat
ions
*
Prer
equi
site
Ski
llsW
orkb
ook
CHAPTER 2 RESOURCE MASTERS
Inte
ract
ive
Chal
kboa
rd
Timesaving Tools
All-In-One Planner and Resource CenterSee pages T5 and T21.
™

66C Chapter 2 Real Numbers
Mathematical Connections and BackgroundMathematical Connections and Background
Rational Numbers on theNumber LineNatural numbers, whole numbers, and integers
can be shown on a number line. Rational numbers,
numbers that can be expressed in the form of where b
does not equal 0, can also be displayed on number lines.Positive numbers are to the right of 0, and negativenumbers are to the left of 0. Number lines can help stu-dents with the concept of absolute value. When a num-ber is graphed on a number line, students can see thedistance that number is from 0. When evaluatingexpressions containing an absolute value, treat theabsolute value bars as a grouping symbol.
Adding and SubtractingRational NumbersNumber lines can be used to add rational num-
bers. Start at the first number in an expression, and thenmove right when adding positive numbers or left whenadding negative numbers. Students soon understandthat if the signs of the numbers are the same, they are toadd the absolute values and the sum has the same signas the addends. If the signs are different, subtract theabsolute values and the sum has the sign of the numberwith the greater absolute value.
The additive inverse of a rational number is itsopposite. When you add a number and its additiveinverse, the sum is 0. To subtract rational numbers,rewrite the expression to add the inverse of the secondnumber. Then use a number line or the rules for addition.
Multiplying Rational NumbersMultiplication is a representation of repeated
addition of the same number. This concept can be usedto arrive at the rules for multiplying rational numbers.Tables of repeated addition of the same number can beused to verify the "rules" for multiplying a positivenumber by either a negative or a positive number. Theproduct of two negative numbers can be explained asthe opposite of the result of a positive times a negative.
a�bPrior KnowledgePrior Knowledge
In previous courses, students learned to per-form the operations of adding, subtracting,multiplying, and dividing with whole num-bers. They also found square roots of wholenumbers. In Chapter 1, students simplifiedexpressions using the order of operations, the Distributive, Commutative, and
Associative Properties.
This Chapter
Future ConnectionsFuture ConnectionsThe rules for adding, subtracting, multiply-ing, dividing, and finding the square root ofrational numbers are essential to simplifyingand solving equations correctly. Creating lineplots and stem-and-leaf plots will help stu-dents better understand data in the future.
Continuity of InstructionContinuity of Instruction
This ChapterThis chapter explores basic operations withrational numbers. The number line is used asa model to develop rules for addition andsubtraction of real numbers. Rules for multi-plying and dividing rational numbers are alsoexplored, as well as finding square roots.Students also create and use the statisticaltools of line plots and stem-and-leaf plots tosolve problems involving the measures ofcentral tendency. Probability and odds of
simple events are also explored.
Chapter 2 Real Numbers 66D
Dividing Rational NumbersMultiplication and division are inverse opera-
tions. Therefore, they share the same rules. If the twonumbers have the same sign, the quotient is positive.If the signs are different, the quotient is negative.
A fraction bar represents division. It is alsoconsidered a grouping symbol. Be sure to simplifythe numerator and denominator separately beforedividing the numerator by the denominator. Onemethod for dividing is to multiply by the reciprocalof the second number.
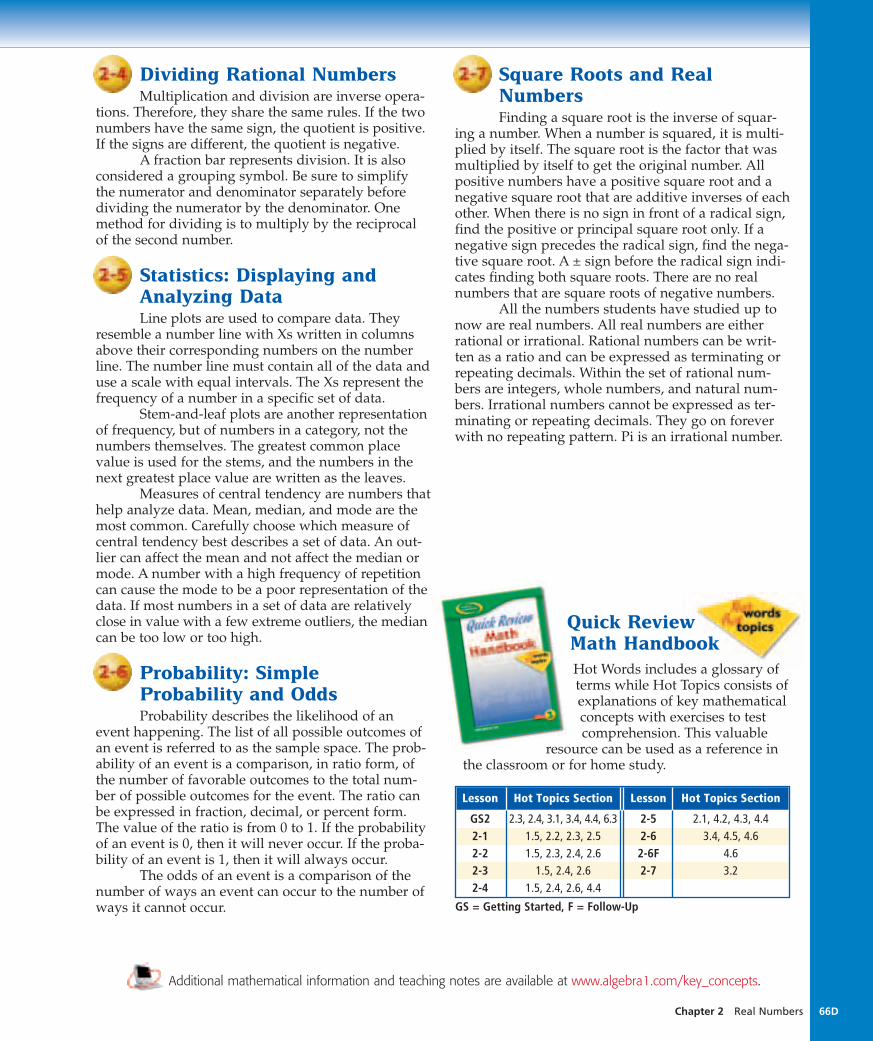
Statistics: Displaying andAnalyzing DataLine plots are used to compare data. They
resemble a number line with Xs written in columnsabove their corresponding numbers on the numberline. The number line must contain all of the data anduse a scale with equal intervals. The Xs represent thefrequency of a number in a specific set of data.
Stem-and-leaf plots are another representationof frequency, but of numbers in a category, not thenumbers themselves. The greatest common placevalue is used for the stems, and the numbers in thenext greatest place value are written as the leaves.
Measures of central tendency are numbers thathelp analyze data. Mean, median, and mode are themost common. Carefully choose which measure ofcentral tendency best describes a set of data. An out-lier can affect the mean and not affect the median ormode. A number with a high frequency of repetitioncan cause the mode to be a poor representation of thedata. If most numbers in a set of data are relativelyclose in value with a few extreme outliers, the mediancan be too low or too high.
Probability: Simple Probability and OddsProbability describes the likelihood of an
event happening. The list of all possible outcomes ofan event is referred to as the sample space. The prob-ability of an event is a comparison, in ratio form, ofthe number of favorable outcomes to the total num-ber of possible outcomes for the event. The ratio canbe expressed in fraction, decimal, or percent form.The value of the ratio is from 0 to 1. If the probabilityof an event is 0, then it will never occur. If the proba-bility of an event is 1, then it will always occur.
The odds of an event is a comparison of thenumber of ways an event can occur to the number ofways it cannot occur.
Square Roots and RealNumbersFinding a square root is the inverse of squar-
ing a number. When a number is squared, it is multi-plied by itself. The square root is the factor that wasmultiplied by itself to get the original number. Allpositive numbers have a positive square root and anegative square root that are additive inverses of eachother. When there is no sign in front of a radical sign,find the positive or principal square root only. If anegative sign precedes the radical sign, find the nega-tive square root. A ± sign before the radical sign indi-cates finding both square roots. There are no realnumbers that are square roots of negative numbers.
All the numbers students have studied up tonow are real numbers. All real numbers are eitherrational or irrational. Rational numbers can be writ-ten as a ratio and can be expressed as terminating orrepeating decimals. Within the set of rational num-bers are integers, whole numbers, and natural num-bers. Irrational numbers cannot be expressed as ter-minating or repeating decimals. They go on foreverwith no repeating pattern. Pi is an irrational number.
Additional mathematical information and teaching notes are available at www.algebra1.com/key_concepts.
Quick Review Math Handbook Hot Words includes a glossary ofterms while Hot Topics consists ofexplanations of key mathematicalconcepts with exercises to testcomprehension. This valuable
resource can be used as a reference inthe classroom or for home study.
Lesson Hot Topics Section Lesson Hot Topics Section
GS2 2.3, 2.4, 3.1, 3.4, 4.4, 6.3 2-5 2.1, 4.2, 4.3, 4.42-1 1.5, 2.2, 2.3, 2.5 2-6 3.4, 4.5, 4.62-2 1.5, 2.3, 2.4, 2.6 2-6F 4.62-3 1.5, 2.4, 2.6 2-7 3.22-4 1.5, 2.4, 2.6, 4.4
GS = Getting Started, F = Follow-Up

66E Chapter 2 Real Numbers
Ongoing Prerequisite Skills, pp. 67, 72, 78,83, 87, 94, 101
Practice Quiz 1, p. 83Practice Quiz 2, p. 101
AlgePASS: Tutorial Plus, Lesson 3www.algebra1.com/self_check_quizwww.algebra1.com/extra_examples
5-Minute Check TransparenciesPrerequisite Skills Workbook, pp. 1–4, 15–28,
31–32, 37–40, 45–54, 57–70, 75–76Quizzes, CRM pp. 131–132Mid-Chapter Test, CRM p. 133Study Guide and Intervention, CRM pp. 75–76, 81–82,
87–88, 93–94, 99–100, 105–106, 111–112
MixedReview
Cumulative Review, CRM p. 134 pp. 72, 78, 83, 87, 94, 101, 109
ErrorAnalysis
Find the Error, TWE pp. 76, 99Unlocking Misconceptions, TWE pp. 70, 91, 97
Find the Error, pp. 76, 98Common Misconceptions, p. 104
StandardizedTest Practice
TWE pp. 116–117Standardized Test Practice, CRM pp. 135–136
Standardized Test Practice CD-ROM
www.algebra1.com/standardized_test
pp. 72, 78, 83, 87, 94, 101, 106,109, 115, 116–117
Open-EndedAssessment
Modeling: TWE pp. 72, 109Speaking: TWE pp. 78, 94Writing: TWE pp. 83, 86, 101Open-Ended Assessment, CRM p. 129
Writing in Math, pp. 72, 78, 82,87, 94, 100, 109
Open Ended, pp. 70, 76, 81, 86,91, 98, 107
Standardized Test, p. 117
ChapterAssessment
Multiple-Choice Tests (Forms 1, 2A, 2B), CRM pp. 117–122
Free-Response Tests (Forms 2C, 2D, 3), CRM pp. 123–128
Vocabulary Test/Review, CRM p. 130
ExamView® Pro (see below)MindJogger Videoquizzes www.algebra1.com/
vocabulary_reviewwww.algebra1.com/chapter_test
Study Guide, pp. 110–114Practice Test, p. 115
and Assessmentand AssessmentA
SSES
SMEN
TIN
TER
VEN
TIO
N
Type Student Edition Teacher Resources Technology/Internet
Key to Abbreviations:TWE = Teacher Wraparound Edition; CRM = Chapter Resource Masters
Algebra Lesson Yearly ProgressPro Skill Lesson(s)
Rational Numbers on the Number Line Absolute Value
2-2 Adding and Subtracting Rational NumbersMultiplying Rational Numbers Multiplying Expressions with VariablesDividing Rational Numbers Dividing Expressions with Variables
2-5 Displaying and Analyzing Data2-6 Simple Probability and Odds
Square Roots Compare Real Numbers
ExamView® ProUse the networkable ExamView® Pro to:• Create multiple versions of tests.• Create modified tests for Inclusion students.• Edit existing questions and add your own questions.• Use built-in state curriculum correlations to create
tests aligned with state standards.• Change English tests to Spanish and vice versa.
For more information on Yearly ProgressPro, see p. 2.
2-1
2-3
2-4
2-7
For more information on Intervention and Assessment, see pp. T8–T11.

A comparisonmap can help students understand the differences in two or more similarconcepts. Show students the samplemap at the right that compares lineplots and stem-and-leaf plots inLesson 2-5.
While studying Chapter 2, havestudents work in small cooperativegroups to design comparison mapsshowing how to add, subtract,multiply, and divide rational numbers.
Graphs
Line plot Stem-and-leaf plot
3 4 5 6 7
XXXXX
XXXXXX
XXX X
XX
Can easily find mode values.
Can easily find greatest,least, and median values.
Stem Leaf3 1 1 4 5 94 0 1 2 6 7 75 4 5 56 87 0 3
Chapter 2 Real Numbers 66F
Reading and Writing in MathematicsReading and Writing in Mathematics
Student Edition
• Foldables Study Organizer, p. 67• Concept Check questions require students to verbalize
and write about what they have learned in the lesson.(pp. 70, 76, 81, 86, 91, 98, 107)
• Reading Mathematics, p. 95 • Writing in Math questions in every lesson, pp. 68, 72,
78, 82, 87, 94, 100, 109• Reading Study Tip, pp. 69, 96, 97, 103• WebQuest, p. 100
Teacher Wraparound Edition
• Foldables Study Organizer, pp. 67, 110• Study Notebook suggestions, pp. 70, 76, 81, 85, 91, 95,
99, 102, 107 • Modeling activities, pp. 72, 109• Speaking activities, pp. 78, 94• Writing activities, pp. 83, 86, 101• Differentiated Instruction, (Verbal/Linguistic), p. 72• Resources, pp. 66, 72, 71, 77, 82, 87, 93, 95,
100, 108, 110ELL
Glencoe Algebra 1 provides numerous opportunities to incorporate reading and writinginto the mathematics classroom.
Additional Resources
• Vocabulary Builder worksheets require students todefine and give examples for key vocabulary terms asthey progress through the chapter. (Chapter 2 ResourceMasters, pp. vii-viii)
• Reading to Learn Mathematics master for each lesson(Chapter 2 Resource Masters, pp. 79, 85, 91, 97, 103,109, 115)
• Vocabulary PuzzleMaker software creates crossword,jumble, and word search puzzles using vocabulary liststhat you can customize.
• Teaching Mathematics with Foldables provides suggestions for promoting cognition and language.
• Reading and Writing in the Mathematics Classroom• WebQuest and Project Resources
For more information on Reading and Writing in Mathematics, see pp. T6–T7.
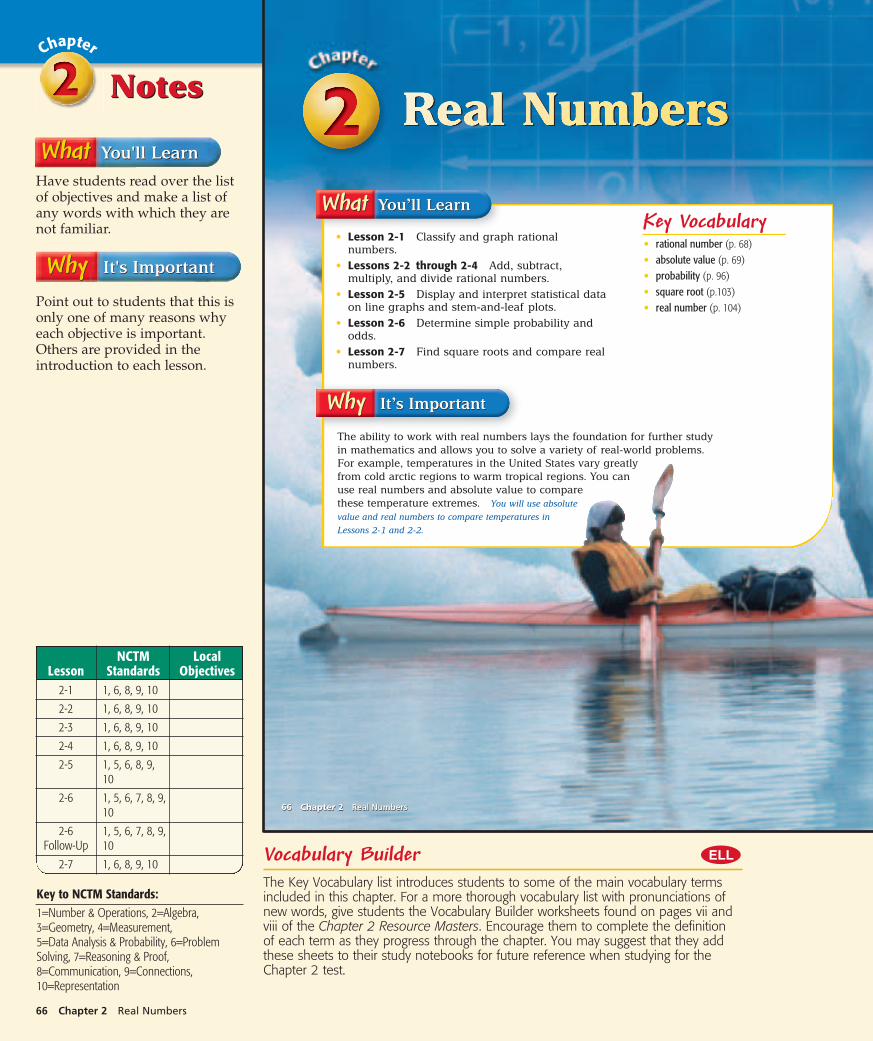
Point out to students that this isonly one of many reasons whyeach objective is important.Others are provided in theintroduction to each lesson.
Have students read over the listof objectives and make a list ofany words with which they arenot familiar.
Real Numbers
• rational number (p. 68)
• absolute value (p. 69)
• probability (p. 96)
• square root (p.103)
• real number (p. 104)
Key Vocabulary
The ability to work with real numbers lays the foundation for further study
in mathematics and allows you to solve a variety of real-world problems.
For example, temperatures in the United States vary greatly
from cold arctic regions to warm tropical regions. You can
use real numbers and absolute value to compare
these temperature extremes. You will use absolute
value and real numbers to compare temperatures in
Lessons 2-1 and 2-2.
• Lesson 2-1 Classify and graph rationalnumbers.
• Lessons 2-2 through 2-4 Add, subtract,multiply, and divide rational numbers.
• Lesson 2-5 Display and interpret statistical dataon line graphs and stem-and-leaf plots.
• Lesson 2-6 Determine simple probability andodds.
• Lesson 2-7 Find square roots and compare realnumbers.
66 Chapter 2 Real Numbers66 Chapter 2 Real Numbers
66 Chapter 2 Real Numbers
NotesNotes
NCTM LocalLesson Standards Objectives
2-1 1, 6, 8, 9, 10
2-2 1, 6, 8, 9, 10
2-3 1, 6, 8, 9, 10
2-4 1, 6, 8, 9, 10
2-5 1, 5, 6, 8, 9, 10
2-6 1, 5, 6, 7, 8, 9,10
2-6 1, 5, 6, 7, 8, 9,Follow-Up 10
2-7 1, 6, 8, 9, 10
Key to NCTM Standards: 1=Number & Operations, 2=Algebra,3=Geometry, 4=Measurement, 5=Data Analysis & Probability, 6=ProblemSolving, 7=Reasoning & Proof,8=Communication, 9=Connections,10=Representation
Vocabulary BuilderThe Key Vocabulary list introduces students to some of the main vocabulary termsincluded in this chapter. For a more thorough vocabulary list with pronunciations ofnew words, give students the Vocabulary Builder worksheets found on pages vii andviii of the Chapter 2 Resource Masters. Encourage them to complete the definition of each term as they progress through the chapter. You may suggest that they addthese sheets to their study notebooks for future reference when studying for theChapter 2 test.
ELL

This section provides a review ofthe basic concepts needed beforebeginning Chapter 2. Pagereferences are included foradditional student help.
Additional review is provided inthe Prerequisite Skills Workbook,pp. 1–4, 15–32, 37–40, 45–70,75–76, 99–100.
Prerequisite Skills in the GettingReady for the Next Lesson sectionat the end of each exercise setreview a skill needed in the nextlesson.
8�16
�; 8;none 18.5
Label
Prerequisite Skills To be successful in this chapter, you’ll need to masterthese skills and be able to apply them in problem-solving situations. Reviewthese skills before beginning Chapter 2.
For Lessons 2-1 through 2-5 Operations with Decimals and Fractions
Perform the indicated operation. (For review, see pages 798 and 799.)
1. 2.2 � 0.16 2.36 2. 13.4 � 4.5 8.9 3. 6.4 � 8.8 56.32 4. 76.5 � 4.25 18
5. �14
� � �23
� �1112� 6. �
12
� � �13
� �16
� 7. �54
� � �130� �
38
� 8. �49
� � �13
� �43
� or 1�13
�
For Lessons 2-1 through 2-5 Evaluate Expressions
Evaluate each expression if a � 2, b � �14
�, x � 7, and y � 0.3. (For review, see Lesson 1-2.)
9. 3a � 2 4 10. 2x � 5 19 11. 8(y � 2.4) 21.6 12. 4(b � 2) 9
13. a � �12
� 1�12
� 14. b � 3 3�14
� 15. xy 2.1 16. y(a � b) 2.4
For Lesson 2-5 Find Mean, Median, and Mode
Find the mean, median, and mode for each set of data. (For review, see pages 818 and 819.)
17. 2, 4, 7, 9, 12, 15 18. 23, 23, 23, 12, 12, 14 19. 7, 19, 2, 7, 4, 9 8; 7; 7
For Lesson 2-7 Square Numbers
Simplify. (For review, see Lesson 1-1.)
20. 112 121 21. 0.92 0.81 22. ��23
��2
�49
� 23. ��45
��2
�12
65�
Chapter 2 Real Numbers 67
Real Numbers Make this Foldable to help you organize your notes. Begin with asheet of grid paper.
Reading and Writing As you read and study the chapter, use the number line to help you solve problems.Write examples and notes under each tab.
Fold Fold Again
Fold the short sidesto meet in the middle.
Fold the top to the bottom.
Cut
Open. Cut along thesecond fold to makefour tabs.
Add a number line and label the tabsas shown.
�2 �1 210
AddingRationalNumbers
SubtractingRationalNumbers
MultiplyingRationalNumbers
DividingRationalNumbers
Chapter 2 Real Numbers 67
For PrerequisiteLesson Skill
2-2 Adding and SubtractingFractions, p. 72
2-3 Multiplying Fractions, p. 78
2-4 Dividing Fractions, p. 83
2-5 Mean, Median, and Mode, p. 87
2-6 Simplifying Fractions, p. 94
2-7 Evaluating Expressions, p. 101
Main Ideas and Note Taking Use this Foldable to promotestudent writing. Note taking is a skill that is based upon listening orreading for main ideas and then recording those ideas for futurereference. Under the tabs of the Foldable, have students takenotes about what they need to know to add, subtract, multiply,and divide rational numbers. Encourage students to apply theseconcepts by writing original addition, subtraction, multiplication,and division sentences using real numbers.
TM
For more informationabout Foldables, seeTeaching Mathematicswith Foldables.

5-Minute CheckTransparency 2-1 Use as a
quiz or a review of Chapter 1.
Mathematical Background notesare available for this lesson on p. 66C.
Building on PriorKnowledge
In previous course material,students learned about fractions,decimals, and negative numbers.In this lesson, they shouldrecognize that rational numbersare a larger set of numberscontaining types of numbers thatstudents already know.
can you use a numberline to show data?
Ask students:
• What does a positive change inriver level mean? The level ofthe river rose.
• What does a negative changein river level mean? The level ofthe river dropped.
• Do you think any of theserivers are flooding? How doyou know? If any of the riverswere flooding, the river level wouldlikely be greatly increasing.
Rational Numbers
Rational NumbersIntegers
Whole Numbers
Natural Numbers
GRAPH RATIONAL NUMBERS A number line can be used to show the sets of , , and . Values greater than 0,or , are listed to the right of 0, and values less than 0, or
, are listed to the left of 0.
Another set of numbers you can display on a number line is the set of rational
numbers. A is any number that can be written in the form �ba
�, where
a and b are integers and b � 0. Some examples of rational numbers are shown below.
�12
� ��32� �
157� �
�15
3� �
��
1141
� �31
�
A rational number can also be expressed as a decimal that terminates, or as adecimal that repeats indefinitely.
0.5 �0.3� 3.4 2.6767… �5 1.2�7� �1.23568994141…
rational number
2 3 4 5 6 7 8 9�9 10�1�2�3�4�8�7�6�5Negative Numbers Positive Numbers
Integers
Natural Numbers
Whole Numbers
negative numberspositive numbers
integerswhole numbersnatural numbers
Vocabulary• natural number
• whole number
• integers
• positive number
• negative number
• rational number
• infinity
• graph
• coordinate
• absolute value
Rational Numbers on the Number Line
68 Chapter 2 Real Numbers
can you use a number
line to show data?
can you use a number
line to show data?
The table shows the percent of change inriver depths for various rivers in Texas over a24-hour period. You can use a number line tograph these values and compare the changesin each river.
River
San Jacinto ..........Sabine ................Neches ...............Navasota .............Little ....................Brazos ................Colorado .............Guadalupe ...........
�0.3�2.0�0.8�0.1
0.0�0.2�0.4�2.2
River Report
ST03PE C07CHT001 A
24-Hour Change (ft)
• Graph rational numbers on a number line.
• Find absolute values of rational numbers.
Later in this chapter, you will be introduced to numbers that are not rational.
TruncateSome calculators have an
option to truncate, or cut
off, a number at a certain
point. For example, 1.2�7�truncated to the tenths
place is 1.2.
Study Tip
Natural Numbers {1, 2, 3, …}
Whole Numbers {0, 1, 2, 3, …}
Integers {…, �2, �1, 0, 1, 2, …}
Rational numbers that can be Numbers
expressed in the form �ba
�,
where a and b are integers
and b � 0
LessonNotes
1 Focus1 Focus
Chapter 2 Resource Masters• Study Guide and Intervention, pp. 75–76• Skills Practice, p. 77• Practice, p. 78• Reading to Learn Mathematics, p. 79• Enrichment, p. 80
Parent and Student Study GuideWorkbook, p. 11
Prerequisite Skills Workbook, pp. 1–4, 15–16, 19–20, 45–46, 55–56,63–66, 75–76
Science and Mathematics Lab Manual, pp. 33–36
5-Minute Check Transparency 2-1Answer Key Transparencies
TechnologyInteractive Chalkboard
Workbook and Reproducible Masters
Resource ManagerResource Manager
Transparencies
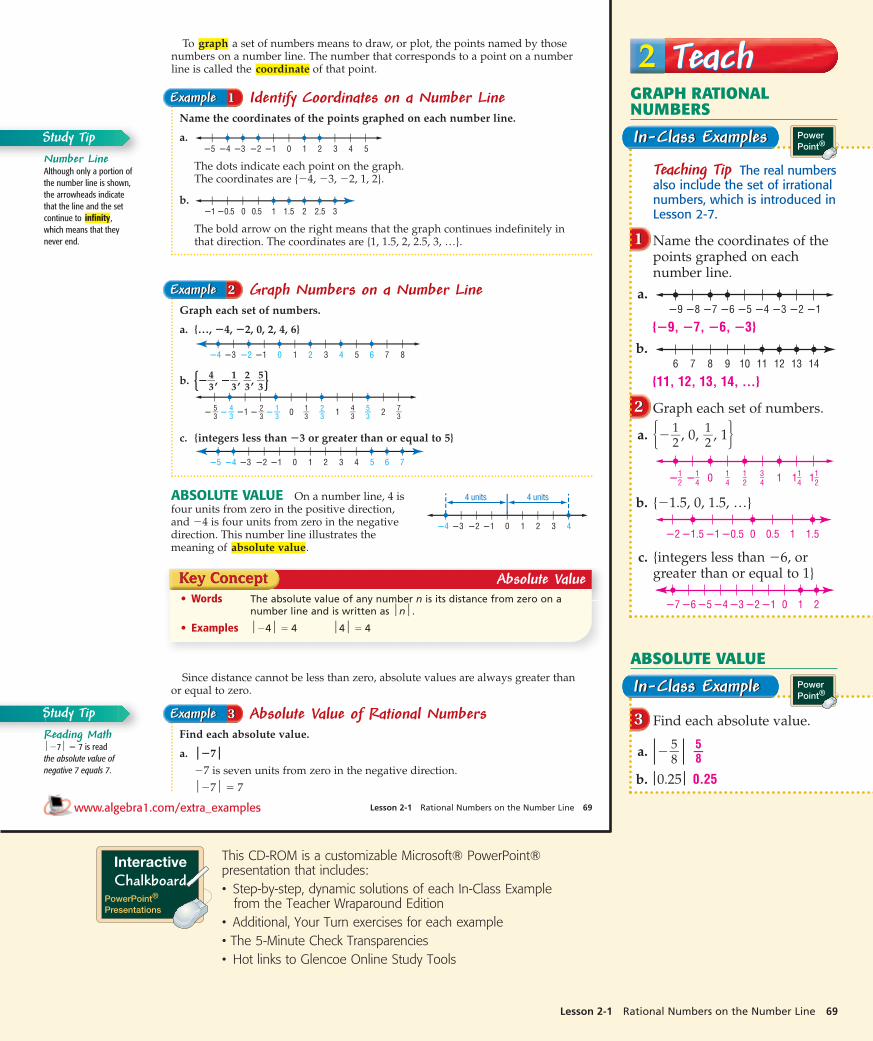
Absolute Value• Words The absolute value of any number n is its distance from zero on a
number line and is written as n.
• Examples �4 � 4 4 � 4
Lesson 2-1 Rational Numbers on the Number Line 69
To a set of numbers means to draw, or plot, the points named by thosenumbers on a number line. The number that corresponds to a point on a numberline is called the of that point.coordinate
graph
Identify Coordinates on a Number LineName the coordinates of the points graphed on each number line.
a.
The dots indicate each point on the graph. The coordinates are {�4, �3, �2, 1, 2}.
b.
The bold arrow on the right means that the graph continues indefinitely in that direction. The coordinates are {1, 1.5, 2, 2.5, 3, …}.
2.5 321.510.50�0.5�1
2 3 4 510�1�2�3�4�5
Example 1Example 1
Graph Numbers on a Number LineGraph each set of numbers.
a. {…, �4, �2, 0, 2, 4, 6}
b. ���43
�, ��13
�, �23
�, �53
��
c. {integers less than �3 or greater than or equal to 5}
2 3 4 5 6 710�1�2�3�4�5
1 20�1�53
53
73�
43
43�
23
23�
13
13
2 3 4 5 6 7 810�1�2�3�4
Example 2Example 2
ABSOLUTE VALUE On a number line, 4 is four units from zero in the positive direction,and �4 is four units from zero in the negativedirection. This number line illustrates themeaning of .absolute value
2 3 410�1�2�3�4
4 units 4 units
Since distance cannot be less than zero, absolute values are always greater than or equal to zero.
Absolute Value of Rational NumbersFind each absolute value.
a. �7�7 is seven units from zero in the negative direction.
�7 � 7
Example 3Example 3
Reading Math�7 � 7 is read
the absolute value of
negative 7 equals 7.
Study Tip
Number LineAlthough only a portion of
the number line is shown,
the arrowheads indicate
that the line and the set
continue to ,
which means that they
never end.
infinity
Study Tip
www.algebra1.com/extra_examples
Lesson 2-1 Rational Numbers on the Number Line 69
2 Teach2 Teach
11
22
In-Class ExamplesIn-Class Examples
33
In-Class ExampleIn-Class Example
GRAPH RATIONALNUMBERS
Teaching Tip The real numbersalso include the set of irrationalnumbers, which is introduced inLesson 2-7.
Name the coordinates of thepoints graphed on eachnumber line.
a.
{�9, �7, �6, �3}
b.
{11, 12, 13, 14, …}
Graph each set of numbers.
a. �� , 0, , 1�
b. {�1.5, 0, 1.5, …}
c. {integers less than �6, orgreater than or equal to 1}
ABSOLUTE VALUE
Find each absolute value.
a. |� |b. |0.25 | 0.25
5�8
5�8
�2�3�4�5�6�7 �1 0 1 2
�0.5�1�1.5�2 0 0.5 1 1.5
�1–4�1–
21–4
1–2
3–40 1–
41–21 1 1
1�2
1�2
11109876 12 13 14
�5�6�7�8�9 �4 �3 �2 �1
PowerPoint®
PowerPoint®
InteractiveChalkboard
PowerPoint®
Presentations
This CD-ROM is a customizable Microsoft® PowerPoint®presentation that includes:• Step-by-step, dynamic solutions of each In-Class Example
from the Teacher Wraparound Edition• Additional, Your Turn exercises for each example• The 5-Minute Check Transparencies• Hot links to Glencoe Online Study Tools

Study NotebookStudy Notebook
3 Practice/Apply3 Practice/Apply
44
In-Class ExampleIn-Class Example
Evaluate |y � 8| � 5 if y � 12. 9
Teaching Tip After presentingExample 4, give students theexpression |2 � x| � 7 toevaluate for x � 5. �4 Pointout that while absolute valueswill always be positive,expressions involving absolutevalue may be negative.
Have students—• add the definitions/examples of
the vocabulary terms to theirVocabulary Builder worksheets forChapter 2.
• include the descriptions of the setsof natural numbers, wholenumbers, integers, and rationalnumbers.
• include any other item(s) that theyfind helpful in mastering the skillsin this lesson.
b. �79
��79
� is seven-ninths unit from zero in the positive direction.
�79
� � �79
�
70 Chapter 2 Real Numbers
Concept Check1–3. See pp.117A–117B.
Guided Practice
Application
You can also evaluate expressions involving absolute value. The absolute valuebars serve as grouping symbols.
Expressions with Absolute ValueEvaluate 15 � x � 4 if x � 8.15 � x � 4 � 15 � 8 � 4 Replace x with 8.
� 15 � 12 8 � 4 � 12
� 15 � 12 12 � 12
� 3 Simplify.
Example 4Example 4
1. Tell whether the statement is sometimes, always, or never true. An integer is a rational number.
2. Explain the meaning of absolute value.
3. OPEN ENDED Give an example where absolute values are used in a real-lifesituation.
Name the coordinates of the points graphed on each number line.4. {�2, 1, 2, 5}
5. �..., ��121�, ��
92
�, ��72
�, ��52
�, ��32
��
Graph each set of numbers. 6–9. See pp. 117A–117B.6. {�4, �2, 1, 5, 7} 7. {�2.8, �1.5, 0.2, 3.4} 8. ���
12
�, 0, �14
�, �25
�, �53
��9. {integers less than or equal to �4}
Find each absolute value.10. �2 2 11. 18 18 12. 2.5 2.5 13. ��
56
� �56
�
Evaluate each expression if x � 18, y � 4, and z � �0.76.14. 57 � x � 34 5 15. 19 � 21 � y 36 16. z � 0.26 0.50
17. NUMBER THEORY Copy the Venn diagram at the right. Label the remaining sets of numbers.
Then place the numbers �3, �13, 0, 53, �23
�, ��15
�,
0.33, 40, 2.98, �49.98, and ��52
� in the mostspecific categories. See pp. 117A–117B.
Whole Numbers
4 �2
�1.25
12
�112 �
102 �
92 �
82 �
72 �
62 �
52 �
42 �
32 �
22 �
12
2 3 4 5 610�1�2�3�4GUIDED PRACTICE KEYExercises Examples
4, 5 16–9 2
10–13 314–16 4
70 Chapter 2 Real Numbers
About the Exercises…Organization by Objective• Graph Rational Numbers:
18–33, 42, 58• Absolute Value: 34–41,
43–57, 59
Odd/Even AssignmentsExercises 18–41 and 45–56 arestructured so that studentspractice the same conceptswhether they are assignedodd or even problems.
Assignment GuideBasic: 19–41 odd, 42–44,45–57 odd, 60–77
Average: 19–41 odd, 42–44,45–57 odd, 60–77
Advanced: 18–40 even, 46–56even, 57–69 (optional: 70–77)
Absolute Value Many students associate absolute value withopposites. While it is true that the absolute value of n is the opposite ofn if n is negative, this definition fails if n is positive or zero. Therefore, itis important for students to think of the absolute value of a number asthe distance between that number and zero on a number line.
Unlocking Misconceptions
PowerPoint®

Study Guide and InterventionRational Numbers on the Number Line
NAME ______________________________________________ DATE ____________ PERIOD _____
2-12-1
Less
on
2-1
Graph Rational Numbers The figure at the right is part of a number line. A number line can be used to show the sets of natural numbers, whole numbers, and integers. Positive numbers, are located to the right of 0,and negative numbers are located to the left of 0.
Another set of numbers that you can display on a number line is the set of rational numbers. A rational number can
be written as , where a and b are integers and b � 0. Some
examples of rational numbers are , , , and .12��3
�7��8
�3�5
1�4
a�b
10�1�2�3�4 2 3
Natural Numbers
Positive NumbersNegative Numbers
4
Whole Numbers
Integers
Name the coordinates of thepoints graphed on each number line.
a.
The dots indicate each point on the graph.The coordinates are {�3, �1, 1, 3, 5}
b.
The bold arrow to the right means the graphcontinues indefinitely in that direction. Thecoordinates are {2, 2.5, 3, 3.5, 4, 4.5, 5, …}.
32.521.51 3.5 4 4.5 5
10�1�2�3 2 3 4 5
Graph each set ofnumbers.
a. {…, �3, �2, �1, 0, 1, 2}
b. �� , 0, , �12–
31–30�1–
3�2–3
4–3
5–3 2
2�3
1�3
1�3
10�1�2�3�4 2 3 4
Example 1Example 1 Example 2Example 2
ExercisesExercises
Name the coordinates of the points graphed on each number line.
1. 2.
{�2, 0, 2, 4, 6} {1, 3, 5, 7, …}3. 4.
�� , 0, , , , 1� ��3, � , , 2, 3�Graph each set of numbers.
5. {�3, �1, 1, 3} 6. {�5, �2, 1, 2} 7. {integers less than 0}
8. {…, �2, �1, 0, 1} 9. ��2 , �1 , � , � 10. {…, �4, �2, 0, 2, …}
�3�4�5�6 �2 �1 0 1 2�21–2�3 �2�11–
2�1 �1–2 0 1–
2 1�3�4 �2 �1 0 1 2 3 4
1�2
1�2
1�2
1�2
�3�4 �2 �1 0 1 2 3 4�3�4�5 �2 �1 0 1 2 3�3�4 �2 �1 0 1 2 3 4
1�3
1�2
3�4
1�2
1�4
1�4
�3�4 �2 �1 0 1 2 3 4�1–4�1–
2 0 1–4
1–2
3–4 1 5–
43–2
0�1 1 2 3 4 5 6 70�1�2 1 2 3 4 5 6
Study Guide and Intervention, p. 75 (shown) and p. 76
Name the coordinates of the points graphed on each number line.
1. 2.
�…, � , � , � , �1, � � {2.4, 2.8, 3.2, 3.6, 4, …}
Graph each set of numbers.
3. �…, � , � , �1, � , � � 4. {integers less than �4 or greater than 2}
Find each absolute value.
5. �11 11 6. 100 100 7. �0.35 0.35 8. � Evaluate each expression if a � 4, b � , c � , x � 14, y � 2.4, and z � �3.
9. 41 � 16 � z 22 10. 3a � 20 � 15 17 11. 2x � 4 � 6 26 12. 2.5 � 3.8 � y 1.1
13. �b � � � � 14. � b � 15. c � 1 � 16. �c �
ASTRONOMY For Exercises 17–19, use the following information.
The absolute magnitude of a star is how bright the star would appear from a standard distance of 10 parsecs, or 32.6 light years.The lower the number, the greater the magnitude, or brightness,of the star. The table gives the magnitudes of several stars.
17. Use a number line to order the magnitudes from least to greatest.
18. Which of the stars are the brightest and the least bright?brightest: Rigel; least bright: Altair
19. Write the absolute value of the magnitude of each star2.3, 7.2, 0.5, 4.7, 0.7, 0.3, 8.1, 1.4
Source: www.astro.wisc.edu
20. CLIMATE The table shows the mean wind speeds in miles per hour at DaytonaBeach, Florida. Source: National Climatic Data Center
Graph the wind speeds on a number line. Which month has the greatest mean wind speed?March
7.1 7.4 7.9 8.3 8.7 9.1� 2� 2
9.7 10.1
7 7.5 8 8.5 9 9.5 10 10.5
Jan Feb Mar Apr May June July Aug Sep Oct Nov Dec
9.0 9.7 10.1 9.7 9.0 7.9 7.4 7.1 8.3 9.1 8.7 8.5
�6�7�8
�8.1 �7.2 �4.7 �0.3 2.31.40.5 0.7
�9 �5 �4 �3 �2 �1 0 1 2 3
Star Magnitude
Altair 2.3
Betelgeuse �7.2
Castor 0.5
Deneb �4.7
Pollux 0.7
Regulus �0.3
Rigel �8.1
Sirius 1.4
3�4
1�6
1�3
7�10
3�4
1�3
2�5
2�15
3�10
1�5
3�2
3�5
28�53
28�53
�6 �5 �4 �3 �2 �1 0 1 2 3 4�7–5 �6–
5 �1 �3–5�4–
5 �2–5 �1–
51–5
2–5
3–50
3�5
4�5
6�5
7�5
3�4
5�4
3�2
7�4
0 0.4 0.8 1.2 1.6 2 2.4 2.8 3.2 3.6 4�7–4 �3–
2 �5–4 �1 �3–
4 �1–2 �1–
41–4
1–2
3–40
Practice (Average)
Rational Numbers on the Number Line
NAME ______________________________________________ DATE ____________ PERIOD _____
2-12-1Skills Practice, p. 77 and Practice, p. 78 (shown)
Reading to Learn MathematicsRational Numbers on the Number Line
NAME ______________________________________________ DATE ____________ PERIOD _____
2-12-1
Less
on
2-1
Pre-Activity How can you use a number line to show data?
Read the introduction to Lesson 2-1 at the top of page 68 in your textbook.
In the table, what does the number �0.2 tell you?
The level of the Brazos River increased by 0.2 foot in 24 hours.
Reading the Lesson
1. Refer to the number line on page 68 in your textbook. Write true or false for each of thefollowing statements.
a. All whole numbers are integers. true
b. All natural numbers are integers. true
c. All whole numbers are natural numbers. false
d. All natural numbers are whole numbers. true
e. All whole numbers are positive numbers. false
2. Use the words denominator, fraction, and numerator to complete the following sentence.
You know that a number is a rational number if it can be written as a
that has a and that are integers, where the denominator is not equal to zero.
3. Explain why , 0.6�, and 15 are rational numbers.
Each number is in or can be written in the form , where a and b are
integers and b � 0. 0.6� can be written as , and 15 can be written as .
Helping You Remember
4. Connecting a mathematical concept to something in your everyday life is one way ofremembering. Describe a situation or setting in your life that reminds you of absolutevalue.
Sample answer: The distance from each goal line to the 50-yard line is 50yards.
15�1
2�3
a�b
�3�7
denominatornumeratorfraction
Reading to Learn Mathematics, p. 79
Intersection and UnionThe intersection of two sets is the set of elements that are in both sets.The intersection of sets A and B is written A � B. The union of two setsis the set of elements in either A, B, or both. The union is written A � B.
In the drawings below, suppose A is the set of points inside the circleand B is the set of points inside the square. Then, the shaded areasshow the intersection in the first drawing and the union in the seconddrawing.
Write A � B and A � B for each of the following.
1. A � {p, q, r, s, t} A � B � {q, r, s}B � {q, r, s} A � B � {p, q, r, s, t }
Intersection A � B
A B
Union A � B
A B
Enrichment
NAME ______________________________________________ DATE ____________ PERIOD _____
2-12-1Enrichment, p. 80
Lesson 2-1 Rational Numbers on the Number Line 71
Practice and ApplyPractice and Apply
Name the coordinates of the points graphed on each number line.18. 19.
20. 21.
22. 23.
Graph each set of numbers. 24–33. See pp. 117A–117B.
24. {�4, �2, �1, 1, 3} 25. {0, 2, 5, 6, 9}
26. {�5, �4, �3, �2, …} 27. {…, �2, 0, 2, 4, 6}
28. {�8.4, �7.2, �6.0, �4.8} 29. {�2.4, �1.6, �0.8, 0, …}
30. �…, ��23
�, ��13
�, 0, �13
�, �23
�, …� 31. ��3�25
�, �2�15
�, �1�45
�, ��45
�, 1�32. {integers less than �7 or greater than �1}
33. {integers greater than �5 and less than 9}
Find each absolute value.34. �38 38 35. 10 10 36. 97 97 37. �61 61
38. 3.9 3.9 39. �6.8 6.8 40. ��2536� �
25
36� 41. �
3850� �
38
50�
POPULATION For Exercises 42–44, refer to the table below. 42. See pp. 117A–
42. Use a number line to order the percents of change from least to greatest.
43. Which population had the greatest percent increase or decrease? Explain.
44. Which population had the least percent increase or decrease? Explain.
Evaluate each expression if a � 6, b � �23
�, c � �54
�, x � 12, y � 3.2, and z � �5.
45. 48 � x � 5 55 46. 25 � 17 � x 54 47. 17 � a � 23 34
48. 43 � 4a � 51 70 49. z � 13 � 4 14 50. 28 � 13 � z 20
51. 6.5 � 8.4 � y 1.3 52. 7.4 � y � 2.6 8 53. �16
� � b � �172� �
14
�
54. �b � �12
�� � ��56
� �13
� 55. c � 1 � �25
� �12
30� 56. �c � �2 � �
12
��
57. CRITICAL THINKING Find all values for x if x � �x. 0
2115
25
35
45
85
95
75
6510�1�2 �
53 �
43 �
23
23�
13
13
1.2 1.4 1.61.00.80.60.40.202 3 4 5 610�1�2
�1 0�2�3�4�5�6�7�82 3 410�1�2�3�4
43. Philadelphia, PA;Sample answer: It hadthe greatest absolutevalue.44. Wayne, MI;Sample answer: It hadthe least absolutevalue.
56. �145� or 3�
34
�
Population of Various Counties, 1990–1999
County Percent Change County Percent Change
Kings, NY �1.4 Wayne, MI �0.2
Los Angeles, CA 5.3 Philadelphia, PA �10.6
Cuyahoga, OH �2.9 Suffolk, NY 4.7
Santa Clara, CA 10.0 Alameda, CA 8.5
Cook, IL 1.7 New York, NY 4.3
Source: The World Almanac
DemographerA demographer analyzesthe size, nature, andmovement of humanpopulations. Manydemographers specialize in one area such as health,housing, or education.
Online ResearchFor information about a career as ademographer, visitwww.algebra1.com/careers
117B.
{�4, �2, 0, 2, 4} {�7, �6, �5, �3, �2}
{2, 3, 4, 5, 6, …} {…, 0, 0.2, 0.4, 0.6, 0.8}
��2, ��53
�, �1, �23
�, 1� ��15
�, �45
�, �75
�, �85
�, 2�Extra Practice See page 823.
Extra Practice See page 823.
For SeeExercises Examples
18–23 1
24–33 2
34–41 3
42–44, 2, 358, 59
45–56 4
www.algebra1.com/self_check_quiz
Lesson 2-1 Rational Numbers on the Number Line 71
ELL

Open-Ended AssessmentModeling Use masking tape tocreate a large number line on thefloor in front of the classroom.Write sets of numbers on theboard and have students standon the line to “graph” the points.Also write absolute value state-ments on the board and havestudents step the “distance”equivalent to the absolute valueon the number line.
Getting Ready for Lesson 2-2PREREQUISITE SKILL Studentswill learn about adding andsubtracting rational numbers inLesson 2-2. They will apply therules of adding and subtractingintegers to computations withfractions. Use Exercises 70–77 to determine your students’familiarity with the addition andsubtraction of fractions.
Answers
58.
59. Bismark, ND 11; Caribou, ME 5;Chicago, IL 4; Fairbanks, AK 9;International Falls, MN 13;Kansas City, MO 7; Sacramento,CA 34; Shreveport, LA 33
60. Sample answer: You can plot thedata on a number line to visualizeits relationship. Answers shouldinclude the following.• Determine the least and
greatest values of the data, anduse those as the endpoints ofthe line.
• Find the absolute value of eachnumber.
66.
Time
Volume
�10 0 10 20 30
Maintain Your SkillsMaintain Your Skills
WEATHER For Exercises 58 and 59, use the table at the right. 58. Draw a number line and graph
the set of numbers that representsthe low temperatures for thesecities. 58–59. See margin.
59. Write the absolute value of the low temperature for each city.
60. Answer thequestion that was posed at thebeginning of the lesson. See margin.How can you use a number line to show data?Include the following in your answer:
• an explanation of how to choose the range for a number line, and
• an explanation of how to tell which river had the greatest increase or decrease.
61. Which number is a natural number? D�2.5 5 � 5 �3 � 5 �8 � 2
62. Which sentence is not true? CAll natural numbers are whole numbers.
Natural numbers are positive numbers.
Every whole number is a natural number.
Zero is neither positive nor negative.D
C
B
A
DCBA
WRITING IN MATHSource: The World Almanac
Same Day Low Temperatures
for Certain U.S. Cities
Bismarck, NDCaribou, MEChicago, ILFairbanks, AKInternational Falls, MNKansas City, MOSacramento, CAShreveport, LA
Low Temperature (°F)City
�11�5�4�9
�137
3433
72 Chapter 2 Real Numbers
SALES For Exercises 63–65, refer to the graph. (Lesson 1-9)
63. In which month did Mr. Michaels have thegreatest sales? December
64. Between which twoconsecutive months did the greatest change in salesoccur? Nov. and Dec.
65. In which months were salesequal? Feb., July, Oct.
66. ENTERTAINMENT Juanita has the volume on her stereo turned up. When hertelephone rings, she turns the volume down. After she gets off the phone, shereturns the volume to its previous level. Sketch a reasonable graph to show thevolume of Juanita’s stereo during this time. (Lesson 1-8) See margin.
Simplify each expression. (Lesson 1-6)
67. 8x � 2y � x 9x � 2y 68. 7(5a � 3b) � 4a 69. 4[1 � 4(5x � 2y)]31a � 21b 4 � 80x � 32y
PREREQUISITE SKILL Find each sum or difference.(To review addition and subtraction of fractions, see pages 798 and 799.)
70. �38
� � �18
� �12
� 71. �172� � �
132� �
13
� 72. �170� � �
15
� �190� 73. �
38
� � �23
�
74. �56
� � �12
� �43
� or 1�13
� 75. �34
� � �13
� �152� 76. �
195� � �
12
� �110� 77. �
79
� � �178� �
178�
73. �22
54� or 1�
214�
Car Sales, Sean Michaels
J F M A M J J A S O N D
Nu
mb
er o
f C
ars
Month
02
4
6
8
10
12
Mixed Review
Getting Ready forthe Next Lesson
StandardizedTest Practice
72 Chapter 2 Real Numbers
4 Assess4 Assess
Verbal/Linguistic Have students look up the word absolute in adictionary and find meanings that relate to the mathematical meaning.Also have them read the definitions of terms beginning with absolute,such as absolute ceiling, absolute humidity, or absolute pitch. Havestudents read aloud the definitions they found and invite students todefine in their own words the mathematical meaning of absolute valuebased on any insights they have gained from the dictionary definitions.
Differentiated Instruction ELL

5-Minute CheckTransparency 2-2 Use as a
quiz or a review of Lesson 2-1.
Mathematical Background notesare available for this lesson on p. 66C.
Building on PriorKnowledge
Apply what students knowalready from previous coursesby demonstrating adding andsubtracting positive integers on a number line. In this lesson,students will extend thisunderstanding to add andsubtract all rational numbers.
can a number line beused to show a football
team’s progress?Ask students:
• How is a football field similarto a number line? Football fieldshave yard markers that tell the dis-tance from the goal line, which aresimilar to the tic marks on a numberline that tell the distance to zero.
• How are the yard markers on afootball field different from themarks on a number line? Theyard markers on a football field in-crease in number until the 50-yardline, and then they decrease untilthey reach the opposite goal.
ADD RATIONAL NUMBERS The number line above illustrates how to addintegers on a number line. You can use a number line to add any rational numbers.
Adding and SubtractingRational Numbers
Lesson 2-2 Adding and Subtracting Rational Numbers 73
Vocabulary• opposites
• additive inverses
can a number line be used to
show a football team’s progress?
can a number line be used to
show a football team’s progress?
Use a Number Line to Add Rational NumbersUse a number line to find each sum.a. �3 � (�4)
Step 1 Draw an arrow from 0 to �3.
Step 2 Then draw a second arrow 4 units to the left to represent adding �4.
Step 3 The second arrow ends at the sum �7. So, �3 � (�4) � �7.
b. 2.5 � (�3.5)
Step 1 Draw an arrow from 0 to 2.5.
Step 2 Then draw a second arrow 3.5 units to the left.
Step 3 The second arrow ends at the sum �1. So, 2.5 � (�3.5) � �1.
1 2 3 40�1�2�4 �3
�3.5
�2.52.5 � (�3.5) � �1
2 3 4 5 6 7 8 9�9 10�1�2�3�4�8�7�6�5
�4 �3(�3) � (�4) � �7
Example 1Example 1
• Add integers and rational numbers.
• Subtract integers and rational numbers.
In one series of plays during Super Bowl XXXV, the New York Giants received a five-yard penalty before completing a 13-yard pass.
The number line shows the yards gained during this series of plays. The totalyards gained was 8 yards.
5 04 0 4 0
�13 yards
�5 yards
2 3 4 5 6 7 8 9�9 10�1�2�3�4�8�7�6�5
Lesson x-x Lesson Title 73
Chapter 2 Resource Masters• Study Guide and Intervention, pp. 81–82• Skills Practice, p. 83• Practice, p. 84• Reading to Learn Mathematics, p. 85• Enrichment, p. 86• Assessment, p. 131
Graphing Calculator and Spreadsheet Masters, p. 26
Parent and Student Study GuideWorkbook, p. 12
Prerequisite Skills Workbook, pp. 15–16, 19–24, 39–40, 55–60, 65–66,75–76
5-Minute Check Transparency 2-2Answer Key Transparencies
TechnologyInteractive ChalkboardMultimedia Applications
Workbook and Reproducible Masters
Resource ManagerResource Manager
Transparencies
LessonNotes
1 Focus1 Focus

11
22
In-Class ExamplesIn-Class ExamplesADD RATIONAL NUMBERS
Teaching Tip Tell students thatwhen using a number line to addrational numbers, they shouldalways start at zero. If the firstnumber in the expression ispositive, then move to the right.If it is negative, move to the left.Then, if the second number ispositive, move to the right and ifit is negative, move to the left.The sum is indicated by whereverthey end up on the number line.
Use a number line to findeach sum.
a. 8 � (�5) 3
b. �1 � (�4) �5
Find each sum.
a. 6 � (�14) �8
b. � � �� � �5�7
2�7
3�7
10�1�2�3�4�5�6 2
�4 �1
10 2 3 4 5 6 7 8
�8
�5
Addition of Rational Numbers• To add rational numbers with the same sign, add their absolute values. The sum
has the same sign as the addends.
• To add rational numbers with different signs, subtract the lesser absolute valuefrom the greater absolute value. The sum has the same sign as the number withthe greater absolute value.
The examples above suggest the following rules for adding rational numbers.
74 Chapter 2 Real Numbers
Add Rational NumbersFind each sum.
a. �11 � (�7)
�11 � (�7) � �(�11 � �7)
� �(11 � 7)
� �18
b. �176� � ���
38
���176� � ���
38
�� � �176� � ���
166�� The LCD is 16. Replace ��
38
� with ��166�.
� � ��176� � ��
166�� Subtract the absolute values.
� � ��176� � �
166��
� �116�
Since the number with the greaterabsolute value is �
176�, the sum is positive.
Both numbers are negative,so the sum is negative.
Example 2Example 2
SUBTRACT RATIONAL NUMBERS Every positive rational number can bepaired with a negative rational number. These pairs are called . opposites
1 2 3 4 50�1�2�4�5 �3
The opposite of�4 is 4.
The opposite of5 is �5.
A number and its opposite are of each other. When you add twoopposites, the sum is always 0.
additive inverses
Same Signs Different Signs� � � � � � � �
3 � 5 � 8
3 and 5 arepositive, so thesum is positive.
�3 � (�5) � �8
�3 and �5 arenegative, so thesum is negative.
3 � (�5) � �2
Since �5 has thegreater absolutevalue, the sum isnegative.
�3 � 5 � 2
Since 5 has thegreater absolutevalue, the sumis positive.
You can use absolute value to add rational numbers.
Additive InverseSince 0 � 0 � 0, zero is
its own additive inverse.
Study Tip
← ← ←← ← ← ←←
74 Chapter 2 Real Numbers
2 Teach2 TeachPowerPoint®

Subtraction of Rational Numbers• Words To subtract a rational number, add its additive inverse.
• Symbols For any numbers a and b, a � b � a � (�b).
• Examples 8 � 15 � 8 � (�15) or �7�7.6 � 12.3 � �7.6 � (�12.3) or �19.9
Additive Inverse Property• Words The sum of a number and its additive inverse is 0.
• Symbols For every number a, a � (�a) � 0.
• Examples 2 � (�2) � 0 �4.25 � 4.25 � 0 �13
� � ���13
�� � 0
Lesson 2-2 Adding and Subtracting Rational Numbers 75
Additive inverses can be used when you subtract rational numbers.
Subtraction Addition
9 � 4 � 5 9 � (�4) � 5
This example suggests that subtracting a number is equivalent to adding its inverse.
StockbrokerStockbrokers performvarious duties, includingbuying or selling stocks,bonds, mutual funds, orother financial products for an investor.
Online ResearchFor information about a career as a stockbroker, visit:www.algebra1.com/careers
Subtract Rational Numbers to Solve a ProblemSTOCKS During a five-day period, a telecommunications company’s stockprice went from $17.82 to $15.36 per share. Find the change in the price of the stock.
Explore The stock price began at $17.82 and ended at $15.36. You need todetermine the change in price for the week.
Plan Subtract to find the change in price.
ending price minus beginning price
15.36 � 17.82
Solve 15.36 � 17.82 � 15.36 � (�17.82) To subtract 17.82, add its inverse.
� �(�17.82 � 15.36) Subtract the absolute values.
� �(17.82 � 15.36) The absolute value of �17.82 is
� �2.46greater, so the result is negative.
The price of the stock changed by �$2.46.
Examine The problem asks for the change in a stock’s price from the beginning ofa week to the end. Since the change was negative, the price dropped.This makes sense since the ending price is less than the beginning price.
���
Example 3Example 3
← ←←←
same result
additive inverses
www.algebra1.com/extra_examples
Lesson 2-2 Adding and Subtracting Rational Numbers 75
33
In-Class ExampleIn-Class Example
SUBTRACT RATIONALNUMBERS
Teaching Tip Explain that apositive change in priceindicates that the price of thestock rose. A negative change inprice indicates that the price ofthe stock fell.
STOCKS In the past year, apublishing company’s stockwent from $52.08 per share to$70.87 per share. Find thechange in the price of thestock. The price of the stockchanged by $18.79.
Visual/Spatial Students may find the rules for adding and subtractingrational numbers confusing, especially when determining which sign thesum or difference will have. Have students check their answers byadding or subtracting with a number line until they are comfortable withaddition or subtraction without the number line.
Differentiated Instruction
PowerPoint®

3 Practice/Apply3 Practice/Apply
Study NotebookStudy NotebookHave students—• add the definitions/examples of
the vocabulary terms to theirVocabulary Builder worksheets forChapter 2.
• include worked-out examples ofadding and subtracting rationalnumbers.
• include any other item(s) that theyfind helpful in mastering the skillsin this lesson.
FIND THE ERRORRemind students
to review the rules foradding and subtracting rationalnumbers when solving this prob-lem. Remember, when addingrational numbers with differentsigns, you must subtract the lesserabsolute value from the greaterabsolute value. Did both Gabriellaand Nick follow this rule?
1. OPEN ENDED Write a subtraction expression using rational numbers that has
a difference of ��25
�.
2. Describe how to subtract real numbers.
3. FIND THE ERROR Gabriella and Nick are subtracting fractions.
Who is correct? Explain your reasoning.
Find each sum.4. �15 � (�12) �27 5. �24 � (�45) �69 6. 38.7 � (�52.6) �13.97. �4.62 � (�12.81)�17.438. �
47
� � ���12
�� �114� 9. ��
152� � �
185� �
670�
Find each difference.10. 18 � 23 �5 11. 12.7 � (�18.4) 31.1 12. (�3.86) � 1.75 �5.6113. �32.25 � (�42.5) 10.25 14. ��
29
� � �130� ��
49
70� 15. ���
170�� � ���
1121� � �
16
30�
16. WEATHER The highest recorded temperature in the United States was in Death Valley, California,while the lowest temperature was recorded at Prospect Creek, Alaska. What is the differencebetween these two temperatures?214°
14012010080
6040
200
�20�40
�60�80
14012010080
6040
200
�20�40
�60�80
Record Low�80˚
Record High134˚
Nick
�–�9
4�� – �–�
3
2�� = �–�
9
4�� – �–�
6
9��
= �–�9
4�� + �–�
6
9��
= –��6
9� + �
9
4��
= –�1
9
0�
Gabr ie l la
� – �9
4�� – � – �
3
2�� = � – �
9
4�� – � – �
6
9��
= � – �9
4�� + � �
6
9��
= � �6
9� – �
9
4��
= �9
2�
Sample answer: �15
� � �35
�
76 Chapter 2 Real Numbers
Concept Check
2. Sample answer: To subtract a real number, add its opposite.3. Gabriella; subtracting ��
69
� is the
same as adding �69
�.
Guided Practice
Application
GUIDED PRACTICE KEYExercises Examples
4–9 1, 210–16 3
Practice and ApplyPractice and Applyindicates increased difficulty★
Find each sum.17. �8 � 13 5 18. �11 � 19 8 19. 41 � (�63) �2220. 80 � (�102) �22 21. �77 � (�46) �123 22. �92 � (�64) �15623. �1.6 � (�3.8) �5.4 24. �32.4 � (�4.5) �36.9 25. �38.9 � 24.2 �14.726. �7.007 � 4.8 �2.207 27. 43.2 � (�57.9) �14.7 28. 38.7 � (�61.1) �22.4
29. �67
� � �23
� �32
21� or 1�
12
11� 30. �
138� � �
167� �
15032
� 31. ��141� � �
35
� �15
35�
32. ��25
� � �1270� �
290� 33. ��
145� � ���
196�� ��
12
94
90
� 34. ��14
60� � ���
12
30��
35. Find the sum of 4�18
� and �1�12
�. 2�58
� 36. Find the sum of 1�15
70� and �3�
12
75�. �2�
15
70�★★34. ��
2210� or �1�
210�
Extra Practice See page 823.
Extra Practice See page 823.
For SeeExercises Examples
17–38 1, 2
39–62 3
76 Chapter 2 Real Numbers
About the Exercises…Organization by Objective• Add Rational Numbers:
17–38• Subtract Rational
Numbers: 39–56
Odd/Even AssignmentsExercises 17–56 are structuredso that students practice thesame concepts whether theyare assigned odd or evenproblems.
Assignment GuideBasic: 17–33 odd, 37–53 odd,57–59, 63–82
Average: 17–55 odd, 57–59,63–82
Advanced: 18–56 even, 60–76(optional: 77–82)

Study Guide and InterventionAdding and Subtracting Rational Numbers
NAME ______________________________________________ DATE ____________ PERIOD _____
2-22-2
Less
on
2-2
Add Rational Numbers
Adding Rational Numbers, Add the numbers. If both are positive, the sum is positive; if both are negative, Same Sign the sum is negative.
Adding Rational Numbers,Subtract the number with the lesser absolute value from the number with the
Different Signsgreater absolute value. The sign of the sum is the same as the sign of the numberwith the greater absolute value.
Use a number line tofind the sum �2 � (�3).
Step 1 Draw an arrow from 0 to �2.Step 2 From the tip of the first arrow, draw
a second arrow 3 units to the left torepresent adding �3.
Step 3 The second arrow ends at the sum�5. So �2 � (�3) � �5.
10�1�2�3�4�5�6�7�8�9 2 3
�3 �2
Find each sum.
a. �8 � 5�8 � 5 � �(�8 � 5)
� �(8 � 5)� �3
b. � �� �� �� � � � �� �
� �� � � �� �� � ��
1�4
2�4
3�4
2�4
3�4
2�4
3�4
1�2
3�4
1�2
3�4
Example 1Example 1 Example 2Example 2
ExercisesExercises
Find each sum.
1. 12 � 24 36 2. �6 � 14 8 3. �12 � (�15) �27
4. �21.5 � 34.2 12.7 5. 8.2 � (�3.5) 4.7 6. 23.5 � (�15.2) 8.3
7. 90 � (�105) �15 8. 108 � (�62) 46 9. �84 � (�90) �174
10. � or 1 11. � 12. � �
13. � � �� � � 14. � � 15. � � �� � �
16. � � �� � 17. �1.6 � (�1.8) 18. �0.008 � (�0.25)
� or �1�3.4 �0.25813
�30
43�30
5�6
3�5
19�20
10�20
18�40
24�55
7�11
1�5
11�12
1�4
2�3
7�45
3�5
4�9
135�238
6�17
3�14
1�21
22�21
1�3
5�7
Study Guide and Intervention, p. 81 (shown) and p. 82
Find each sum.
1. �82 � 14 �68 2. �33 � 47 14 3. �17 � (�39) �56
4. 8 � (�11) �3 5. �1.7 � 3.2 1.5 6. �13.3 � (�0.9) �14.2
7. �51.8 � 29.7 �22.1 8. 7.34 � (�9.06) �1.72 9. � or 1
10. � � 11. � � �� � 12. � �� �� or �1 �
Find each difference.
13. 65 � 93 �28 14. �42 � (�17) �25 15. 13 � (�19) 32
16. �8 � 43 �51 17. 82.8 � (�12.4) 95.2 18. 1.27 � 2.34 �1.07
19. �9.26 � 12.05 �21.31 20. �18.1 � (�4.7) �13.4 21. � � �
22. � 23. � � �� � 24. � �� �� or �2
FINANCE For Exercises 25–27, use the following information.
The table shows activity in Ben’s checking account. The balance before the activity was$200.00. Deposits are added to an account and checks are subtracted.
Number Date Transaction Amount Balance
5/2 deposit 52.50 252.50
101 5/10 check to Castle Music 25.50 ?
102 6/1 check to Comp U Save 235.40 ?
25. What is the account balance after writing check number 101? $227.00
26. What is the account balance after writing check number 102? �$8.40
27. Realizing that he has just written a check for more than is in the account, Benimmediately deposits $425. What will this make his new account balance? $416.60
28. CHEMISTRY The melting points of krypton, radon, and sulfur in degrees Celsius are�156.6, �61.8, and 112.8, respectively. What is the difference in melting points betweenradon and krypton and between sulfur and krypton? 94.8C and 269.4C
23�24
1�14
29�14
1�2
5�6
1�8
3�7
5�2
5�6
4�3
13�15
2�3
1�5
7�24
7�20
27�20
1�15
2�3
3�8
3�5
3�4
2�3
3�5
7�18
25�18
5�6
5�9
Practice (Average)
Adding and Subtracting Rational Numbers
NAME ______________________________________________ DATE ____________ PERIOD _____
2-22-2Skills Practice, p. 83 and Practice, p. 84 (shown)
Reading to Learn MathematicsAdding and Subtracting Rational Numbers
NAME ______________________________________________ DATE ____________ PERIOD _____
2-22-2
Less
on
2-2
Pre-Activity How can a number line be used to show a football team’s progress?
Read the introduction to Lesson 2-2 at the top of page 73 in your textbook.
Use positive or negative to complete the following sentences.
The five-yard penalty is shown by the number �5.
The 13-yard pass is shown by the number 13.
Reading the Lesson
1. To add two rational numbers, you can use a number line. Each number will berepresented by an arrow.
a. Where on the number line does the arrow for the first number begin? at 0
b. Arrows for negative numbers will point to the (left/right). Arrows for
positive numbers will point to the (left/right).
2. Two students added the same pair of rational numbers. Both students got the correctsum. One student used a number line. The other student used absolute value. Then theycompared their work.
a. How do the arrows show which number has the greater absolute value?
The number with the greater absolute value matches the longer arrow.
b. If the longer arrow points to the left, then the sum is (positive/negative). If the longer arrow points to the right, then the sum is
(positive/negative).
3. If two numbers are additive inverses, what must be true about their absolute values?
The absolute values of the two numbers are equal.
4. Write each subtraction problem as an addition problem.
a. 12 � 4 12 � (�4) b. �15 � 7 �15 � (�7)
c. 0 � 9 0 � (�9) d. �20 � 34 �20 � (�34)
Helping You Remember
5. Explain why knowing the rules for adding rational numbers can help you to subtractrational numbers.
Sample answer: Since subtraction is the same as adding the opposite,you can change every subtraction problem to an addition problem. Thenyou can use the rules for adding rational numbers to get the final answer.
positive
negative
rightleft
positivenegative
Reading to Learn Mathematics, p. 85
Rounding FractionsRounding fractions is more difficult than rounding whole numbers or
decimals. For example, think about how you would round inches to
the nearest quarter-inch. Through estimation, you might realize that
is less than . But, is it closer to or to ?
Here are two ways to round fractions. Example 1 uses only thefractions; Example 2 uses decimals.
1�4
1�2
1�2
4�9
4�9
Enrichment
NAME ______________________________________________ DATE ____________ PERIOD _____
2-22-2
Subtract the fraction twice. Use the twonearest quarters.
� � � �
Compare the differences.
�
Th ll diff h hi h
7�36
1�18
7�36
1�4
4�9
1�18
4�9
1�2
Change the fraction and the two nearestquarters to decimals.
� 0.44�, � 0.5, � 0.25
Find the decimal halfway between the twonearest quarters.
(0.5 � 0.25) � 0.3751�2
1�4
1�2
4�9
Example 1Example 1 Example 2Example 2
Enrichment, p. 86
Lesson 2-2 Adding and Subtracting Rational Numbers 77
57. �2, �6, �4, �459. Under; yes, it isbetter than par 72.
63. Sometimes; theequation is false forpositive values of x,but true for all othervalues of x.
GolfIn the United States, there are more than16,000 golf courses played by 26 millionpeople each year.
Source: Encarta Online
37. GAMES Sarah was playing a computer trivia game. Her scores for round onewere �100, �200, �500, �300, �400, and �500. What was her total score at theend of round one? 400 points
38. FOOTBALL The Northland Vikings’ offense began a drive from their 20-yardline. They gained 6 yards on the first down, lost 8 yards on the second down,then gained 3 yards on third down. What yard line were they on at fourthdown? 21-yard line
Find each difference.39. �19 � 8 �27 40. 16 � (�23) 39 41. 9 � (�24) 3342. 12 � 34 �22 43. 22 � 41 �19 44. �9 � (�33) 2445. �58 � (�42) �16 46. 79.3 � (�14.1) 93.4 47. 1.34 � (�0.458) 1.79848. �9.16 � 10.17 �19.33 49. 67.1 � (�38.2) 105.3 50. 72.5 � (�81.3) 153.8
51. ��16
� � �23
� ��56
� 52. �12
� � �45
� ��130� 53. ��
78
� � ���136�� ��
11
16�
54. ��112� � ���
34
�� �23
� 55. 2�14
� � 6�13
� 56. 5�130� � 1�
3510�
��41
92� or �4�
112� �2
925� or 3�
12
75�
GOLF For Exercises 57–59, use the following information.In golf, scores are based on par. Par 72 means that a golfer should hit the ball 72times to complete 18 holes of golf. A score of 67, or 5 under par, is written as �5. A score of 3 over par is written as �3. At the Masters Tournament (par 72) in April,2001, Tiger Woods shot 70, 66, 68, and 68 during four rounds of golf.
57. Use integers to write his score for each round as over or under par.
58. Add the integers to find his overall score. �16 59. Was his score under or over par? Would you want to have his score? Explain.
Online Research Data Update Find the most recent winner of theMasters Tournament. What integer represents the winner’s score for eachround as over or under par? What integer represents the winner’s overallscore? Visit www.algebra1.com/data_update to learn more.
STOCKS For Exercises 60–62, refer to the table that shows the weekly closingvalues of the stock market for an eight-week period.
60. Find the change in value from week 1 to week 8. 1466.1561. Which week had the greatest change from the previous week? week 762. Which week had the least change from the previous week? week 8
63. CRITICAL THINKING Tell whether the equation x � x � 0 is always,sometimes, or never true. Explain.
1
End ofWeek
2
3
4
9791.09
ClosingValue
10,126.94
10,579.85
10,810.05
5
End ofWeek
6
7
8
10,951.24
ClosingValue
10,821.31
11,301.74
11,257.24
Weekly Dow Jones Industrial Average(April – May 2000)
Source: The Wall Street Journal
★★
www.algebra1.com/self_check_quiz
Lesson 2-2 Adding and Subtracting Rational Numbers 77
ELL

Open-Ended AssessmentSpeaking Have a studentvolunteer write an expressioninvolving the addition or sub-traction of rational numbers onthe chalkboard or overheadprojector. Have other studentsexplain the steps involved inperforming the operation. Askthe volunteer to record the stepsas they are explained.
Getting Ready for Lesson 2-3PREREQUISITE SKILL Studentswill learn about multiplyingrational numbers in Lesson 2-3.This includes applying specialrules to products involvingfractions. Use Exercises 77–82 todetermine your students’familiarity with themultiplication of fractions.
Assessment OptionsQuiz (Lessons 2-1 and 2-2) isavailable on p. 131 of the Chapter 2Resource Masters.
Answer
64. Sample answer: If a team gainsyards, move right on the numberline. If a team loses yards, moveleft on the number line. Answersshould include the following.• Move right or left, depending on
whether the Giants gained orlost yards on each play. Whereyou end will tell you how manyyards the Giants lost or gained.
• Instead of using a number line,you can use the rules for addingand subtracting rationalnumbers.
78 Chapter 2 Real Numbers
Maintain Your SkillsMaintain Your Skills
Evaluate each expression if x � 4.8, y � �7.4, and z � 10. (Lesson 2-1)
67. 12.2 � 8 � x 15.4 68. y � 9.4 � 3 13.8 69. 24.2 � 18.3 � z 15.9
For Exercises 70 and 71, refer tothe graph. (Lesson 1-9)
70. If you wanted to make a circlegraph of the data, whatadditional category would youhave to include so that thecircle graph would not bemisleading?
71. Construct a circle graph thatdisplays the data accurately.See pp. 117A–117B.
Find the solution sets for eachinequality if the replacement sets are a � {2, 3, 4, 5, 6}, b � {0.3, 0.4, 0.5, 0.6, 0.7}, and
c � ��14
�, �12
�, �34
�, 1, 1�14
��. (Lesson 1-3)
72. b � 1.3 1.8 {0.5, 0.6, 0.7}
73. 3a � 5 7 {5, 6}
74. c � �12
� � 2�14
� ��14
�, �12
�, �34
�, 1, 1�14
��Write an algebraic expression for each verbal phrase. (Lesson 1-1)
75. eight less than the square of q 76. 37 less than 2 times a number kq2 � 8 2k � 37
PREREQUISITE SKILL Find each product.(To review multiplication of fractions, see pages 800 and 801.)
77. �12
� � �23
� �13
� 78. �14
� � �25
� �110� 79. �
34
� � �56
� �58
�
80. 4 � �35
� 2�25
� 81. 8 � �58
� 5 82. �79
� � 12 9�13
�
64. Answer the question that was posed at the beginning ofthe lesson. See margin.
How can a number line be used to show a football team’s progress?Include the following in your answer:
• an explanation of how you could use a number line to determine the yardsgained or lost by the Giants on their next three plays, and
• a description of how to determine the total yards gained or lost without usinga number line.
65. What is the value of n in �57 � n � �144? C�201 �87 87 201
66. Which expression is equivalent to 5 � (�8)? B(�5) � 8 8 � 5 8 � 5 5 � 8DCBA
DCBA
WRITING IN MATH
Mixed Review
70. Sample answer: a category labeled“other” representing8%
Getting Ready forthe Next Lesson
Most drink the cereal milkWhat adults do with the milk in the bowlafter the cereal is eaten:
USA TODAY Snapshots®
By Cindy Hall and Sam Ward, USA TODAY
Source: Gallup Organization for Wheat Foods Council
Drink it
67%
Leave it
25%
StandardizedTest Practice
78 Chapter 2 Real Numbers
4 Assess4 Assess
Online Lesson Plans
USA TODAY Education’s Online site offers resources andinteractive features connected to each day’s newspaper.Experience TODAY, USA TODAY’s daily lesson plan, isavailable on the site and delivered daily to subscribers.This plan provides instruction for integrating USA TODAYgraphics and key editorial features into your mathematicsclassroom. Log on to www.education.usatoday.com.
5-Minute CheckTransparency 2-3 Use as a
quiz or a review of Lesson 2-2.
Mathematical Background notesare available for this lesson on p. 66C.
do consumers usemultiplication of
rational numbers?Ask students:
• What is the total value of thecoupons used in thistransaction? $4
• What are two ways that youcould find the total value ofthe coupons? You can add theamounts of the coupons, or sincethe amount is the same for all fourcoupons, you can multiply theamount of one coupon by 4.
• Why might multiplying theamount of one coupon by 4 beeasier than adding all thevalues? Multiplying involvesfewer numbers.
do consumers use multiplication
of rational numbers?
do consumers use multiplication
of rational numbers?
Lesson 2-3 Multiplying Rational Numbers 79
Multiplication of Integers• Words The product of two numbers having the same sign is positive.
The product of two numbers having different signs is negative.
• Examples (�12)(�7) � 84 same signs → positive product
15(�8) � �120 different signs → negative product
Multiply IntegersFind each product.a. 4(�5)
4(�5) � �20 different signs → negative product
b. (�12)(�14)(�12)(�14) � 168 same signs → positive product
Example 1Example 1
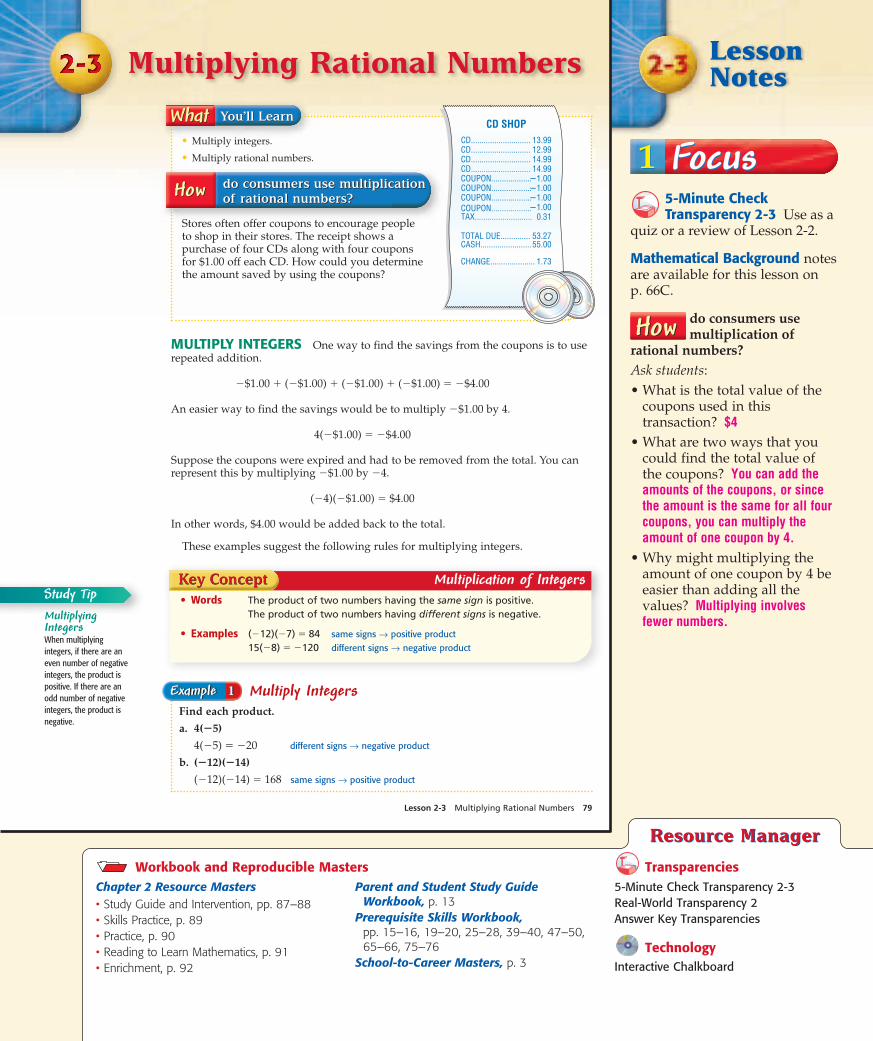
MULTIPLY INTEGERS One way to find the savings from the coupons is to userepeated addition.
�$1.00 � (�$1.00) � (�$1.00) � (�$1.00) � �$4.00
An easier way to find the savings would be to multiply �$1.00 by 4.
4(�$1.00) � �$4.00
Suppose the coupons were expired and had to be removed from the total. You canrepresent this by multiplying �$1.00 by �4.
(�4)(�$1.00) � $4.00
In other words, $4.00 would be added back to the total.
These examples suggest the following rules for multiplying integers.
• Multiply integers.
• Multiply rational numbers.
Multiplying Rational Numbers
MultiplyingIntegersWhen multiplying
integers, if there are an
even number of negative
integers, the product is
positive. If there are an
odd number of negative
integers, the product is
negative.
Study Tip
Stores often offer coupons to encourage people to shop in their stores. The receipt shows a purchase of four CDs along with four coupons for $1.00 off each CD. How could you determine the amount saved by using the coupons?
CD............................CD............................CD............................CD............................COUPON...................COUPON...................COUPON...................COUPON...................TAX...........................
TOTAL DUE..............CASH........................
CHANGE.....................
13.9912.9914.9914.99
�1.00�1.00�1.00�1.00
0.31
53.2755.00
1.73
CD SHOP
Lesson x-x Lesson Title 79
Chapter 2 Resource Masters• Study Guide and Intervention, pp. 87–88• Skills Practice, p. 89• Practice, p. 90• Reading to Learn Mathematics, p. 91• Enrichment, p. 92
Parent and Student Study GuideWorkbook, p. 13
Prerequisite Skills Workbook, pp. 15–16, 19–20, 25–28, 39–40, 47–50,65–66, 75–76
School-to-Career Masters, p. 3
5-Minute Check Transparency 2-3Real-World Transparency 2Answer Key Transparencies
TechnologyInteractive Chalkboard
Workbook and Reproducible Masters
Resource ManagerResource Manager
Transparencies
LessonNotes
1 Focus1 Focus

33
44
55
In-Class ExamplesIn-Class Examples
11
22
In-Class ExamplesIn-Class ExamplesMULTIPLY INTEGERS
Reading Tip Remind studentsto look carefully at the signs ofboth numbers before decidingon the sign of the product.
Find each product.
a. (�8)(�6) 48
b. (10)(�11) �110
Teaching Tip The same multi-plication rules apply whether ornot variables are involved in themultiplication.
Simplify the expression 13x � (�6)(4x). �11x
MULTIPLY RATIONALNUMBERS
Find �� ��� �.STOCKS The value of acompany’s stock dropped by$1.25 per share. By whatamount did the total value ofthe company’s stock changeif the company has issued500,000 shares of stock?�$625,000
Evaluate �� �x3 if
x � �� �. 3�56
1�2
3�7
1�2
3�4
2�3
You can simplify expressions by applying the rules of multiplication.
80 Chapter 2 Real Numbers
Simplify ExpressionsSimplify the expression 4(�3y) � 15y.4(�3y) � 15y � 4(�3)y � 15y Associative Property (�)
� �12y � 15y Substitution
� (�12 � 15)y Distributive Property
� �27y Simplify.
Example 2Example 2
MULTIPLY RATIONAL NUMBERS Multiplying rational numbers is similarto multiplying integers.
Evaluate ExpressionsEvaluate n2 ���
58
�� if n � ��25
�.
n2���58
�� � ���25
��2
���58
�� Substitution
� ��245�����
58
�� ���25
��2 � ���25
�����25
�� or �245�
� ��22000
� or ��110� different signs → negative product
Example 5Example 5
Multiply Rational NumbersFind ���
34
�� ��38
��.���
34
����38
�� � ��392� different signs → negative product
Example 3Example 3
Multiply Rational Numbers to Solve a ProblemBASEBALL Fenway Park, homeof the Boston Red Sox, is theoldest ball park in professionalbaseball. It has a seating capacityof about 34,000. Determine theapproximate total ticket sales for asold-out game.To find the approximate total ticketsales, multiply the number oftickets sold by the average price.
34,000 � 24.05 � 817,770
same signs → positive product
The total ticket sales for a sold-outgame are about $817,770.
Example 4Example 4
You can evaluate expressions that contain rational numbers.
• Updated data
• More activities on writing equationswww.algebra1.com/usa_today
Log on for:Log on for:
Source: Team Marketing Report
By Scott Boeck and Marcy E. Mullins, USA TODAY
The average 1999 major league ticket was up 10% to$14.91. The price was up 72.6% since 1991 vs. an 18.7%rise in the Consumer Price Index. Most, least expensiveteams:
Baseball ticket inflation
1 – Only Montreal, Oakland andTampa Bay cut prices for 1999
Boston
(+16.6%)
$24.05
N.Y. Yankees
(+13.8%)
$23.33
Texas
(+20.9%)
$19.93
CO
ST
LIE
ST
Minnesota
(+2.9%)
$8.46
Montreal1
(-6%)
$9.38
Cincinnati
(+16%)
$9.71
CH
EA
PE
ST
USA TODAY Snapshots®
80 Chapter 2 Real Numbers
2 Teach2 TeachPowerPoint®
PowerPoint®
Online Lesson Plans
USA TODAY Education’s Online site offers resources andinteractive features connected to each day’s newspaper.Experience TODAY, USA TODAY’s daily lesson plan, isavailable on the site and delivered daily to subscribers.This plan provides instruction for integrating USA TODAYgraphics and key editorial features into your mathematicsclassroom. Log on to www.education.usatoday.com.

Lesson 2-3 Multiplying Rational Numbers 81
Multiplicative Property of �1• Words The product of any number and �1 is its additive inverse.
• Symbols For any number a, �1(a) � a(�1) � �a.
• Examples (�1)(4) � (4)(�1) � �4 (�1)(�2.3) � (�2.3)(�1) � 2.3
1. List the conditions under which the product ab is negative. Give examples tosupport your answer. 1–3. See margin
2. OPEN ENDED Describe a real-life situation in which you would multiply apositive rational number by a negative rational number. Write a correspondingmultiplication expression.
3. Explain why the product of two negative numbers is positive.
Find each product.4. (�6)(3) �18 5. (5)(�8) �40 6. (4.5)(2.3) 10.35
7. (�8.7)(�10.4) 90.48 8. ��53
�����27
�� ��12
01� 9. ���
49
����175�� ��
12385
�
Simplify each expression.10. 5s(�6t) �30st 11. 6x(�7y) � (�15xy) �57xy
Evaluate each expression if m � ��23
�, n � �12
�, and p � �3�34
�.
12. 6m �4 13. np ��185� or �1�
78
� 14. n2(m � 2) �13
�
15. NATURE The average worker honeybee makes about �112� teaspoon of honey in
its lifetime. How much honey do 675 honeybees make? 56�14
� t
Concept Check
Guided Practice
Application
GUIDED PRACTICE KEYExercises Examples
4–9 1, 310, 11 212–14 5
15 4
In Lesson 1-4, you learned about the Multiplicative Identity Property, which statesthat any number multiplied by 1 is equal to the number. Another importantproperty is the Multiplicative Property of �1.
Practice and ApplyPractice and Applyindicates increased difficulty★
Find each product.16. 5(18) 90 17. 8(22) 176 18. �12(15) �18019. �24(8) �192 20. �47(�29) 1363 21. �81(�48) 3888
22. ��45
����38
�� �130� 23. ��
152����
49
�� �257� 24. ���
35
����56
�� ��12
�
25. ���25
����67
�� ��1325� 26. ��3�
15
����7�12
�� 24 27. ��1�45
����2�12
�� 4�12
�
28. 7.2(0.2) 1.44 29. 6.5(0.13) 0.845 30. (�5.8)(2.3) �13.34
31. (�0.075)(6.4) �0.48 32. �35
�(�5)(�2) 6 33. �121�(�11)(�4) 8
Simplify each expression.34. 6(�2x) � 14x �26x 35. 5(�4n) � 25n �45n 36. 5(2x � x) 5x37. �7(3d � d) �28d 38. �2a(�3c) � (�6y)(6r) 39. 7m(�3n) � 3s(�4t)
6ac �36ry �21mn �12st
★★Extra Practice See page 823.
Extra Practice See page 823.
For SeeExercises Examples
16–33 1, 3
34–39 2
40, 41 4
42–49 5
50–54 4
www.algebra1.com/extra_examples
Lesson 2-3 Multiplying Rational Numbers 81
3 Practice/Apply3 Practice/Apply
Study NotebookStudy NotebookHave students—• record the rules for multiplying
integers, and the MultiplicativeProperty of �1.
• include any other item(s) that theyfind helpful in mastering the skillsin this lesson.
About the Exercises…Organization by Objective• Multiply Integers: 16–21,
34–39• Multiply Rational
Numbers: 22–33, 41–51
Odd/Even AssignmentsExercises 16–39 and 42–49 arestructured so that studentspractice the same conceptswhether they are assignedodd or even problems.
Assignment GuideBasic: 17–31 odd, 35–39 odd,40, 41, 43–47 odd, 51, 55–76
Average: 17–39 odd, 40, 41,43–51 odd, 55–76
Advanced: 16–38 even, 42–52even, 53–68 (optional: 69–76)
All: Practice Quiz 1 (1–10)
Answers
1. ab will be negative if one factor isnegative and the other is positive.Let a � �2 and b � 3: �2(3) � �6. Let a � 2 and b � �3: 2(�3) � �6.
2. Sample answer: Calculating a$2.00 monthly banking fee for theentire year: 12 � (�$2) � �$24.
3. Since multiplication is repeatedaddition, multiplying a negativenumber by another negativenumber is the same as addingrepeatedly in the opposite, orpositive direction.
Logical Students may need help understanding why the product of twonumbers with the same sign is positive, especially when both arenegative. Start by explaining that 3(�4) means 3 groups of �4 or �4 � (�4) � (�4), which is �12. Write 3(�4) � �12 on the board.Now explain that �3(�4) means the opposite of 3 groups of �4, orthe opposite of �12, which is 12.
Differentiated Instruction

Study Guide and InterventionMultiplying Rational Numbers
NAME ______________________________________________ DATE ____________ PERIOD _____
2-32-3
Less
on
2-3
Multiply Integers You can use the rules below when multiplying integers and rationalnumbers.
Multiplying Numbers with the Same Sign The product of two numbers having the same sign is positive.
Multiplying Numbers with Different Signs The product of two numbers having different signs is negative.
Find each product.
a. �7(6)The signs are different, so the product isnegative.�7(6) � �42
b. �18(�10)The signs are the same, so the product ispositive.�18(�10) � 180
Simplify the expression(�2x)5y.
(�2x)5y � (�2)(5)x � y Commutative Property (�)
� (�2 � 5)xy Associative Property
� �10xy Simplify.
Example 1Example 1 Example 2Example 2
ExercisesExercises
Find each product.
1. 11(4) 2. �5(�3) 3. (�24)(�2)
44 15 48
4. (60)(�3) 5. (�2)(�3)(�4) 6. 8(�15)
�180 �24 �120
7. �15(3) 8. (12)(�10) 9. (�22)(�3)(2)
�45 �120 132
10. (5)(�5)(0)(4) 11. (�15)(45) 12. (�12)(�23)
0 �675 276
Simplify each expression.
13. 4(�2x) � 8x 14. 6(�2n ) � 10n 15. 6(3y � y)
�16x �22n 12y
16. �3(3d � 2d) 17. �2x(2) � 2x(3y) 18. 4m(�2n) � 2d(�4e)
�15d �4x � 6xy �8mn � 8de
19. �5(2x � x) � 3(�xy) 20. (2)(�4x � 2x) 21. (�3)(�8n � 6m)
�15x � 3xy �4x 24n � 18m
Study Guide and Intervention, p. 87 (shown) and p. 88
Find each product.
1. 42(7) 294 2. �28(�17) 476 3. 15(�34) �510
4. �� �� � � 5. �� ��� � 6. � �� �7. ��3 ��2 � � or �8 8. ��2 ���1 � or 3 9. �1 ���1 � � or �1
10. (1.5)(8.8) 13.2 11. (6.8)(�1.3) �8.84 12. (�0.2)(2.8) �0.56
13. (�3.6)(�0.55) 1.98 14. 6.3(�0.7) �4.41 15. (�4)(9) �24
Simplify each expression.
16. 5(�3a) � 18a 3a 17. �8(4c) � 12c �20c 18. �9(2g � g) �9g
19. 7(2b � 4b) 20. �4x(2y) � (�3b)(�2d) 21. �5p(�3q) � (4m)(�6n)
�14b �8xy � 6bd 15pq � (�24mn)
Evaluate each expression if a � � , b � , c � �3.4, and d � 0.7.
22. b2�� � � 23. 4ab � or �2 24. 5a2(�b) � or �2
25. �6d2 �2.94 26. cd � 3 �5.38 27. c2(�5d) �40.46
28. RECIPES A recipe for buttermilk biscuits calls for 3 cups of flour. How many cups of
flour do you need for the recipe? 1 c
COMPUTERS For Exercises 29 and 30, use the following information.
Leeza is downloading a file from a Web site at 47.3 kilobytes per second.
29. How many kilobytes of the file will be downloaded after one minute? 2838 kilobytes
30. How many kilobytes will be downloaded after 4.5 minutes? 12,771 kilobytes
CONSERVATION For Exercises 31 and 32, use the following information.
A county commission has set aside 640 acres of land for a wildlife preserve.
31. Suppose of the preserve is marshland. How many acres of the preserve are
marshland? 256 acres
32. If the forested area of the preserve is 1.5 times larger than the marshland, how manyacres of the preserve are forested? 384 acres
2�5
2�3
1�2
1�3
2�5
12�5
2�5
12�5
3�8
2�3
3�4
4�5
2�3
1�2
3�2
1�5
1�4
1�9
28�9
1�6
2�3
1�8
65�8
1�2
1�4
9�14
5�7
9�10
2�3
5�6
4�5
21�32
7�8
3�4
Practice (Average)
Multiplying Rational Numbers
NAME ______________________________________________ DATE ____________ PERIOD _____
2-32-3Skills Practice, p. 89 and Practice, p. 90 (shown)
Reading to Learn MathematicsMultiplying Rational Numbers
NAME ______________________________________________ DATE ____________ PERIOD _____
2-32-3
Pre-Activity How do consumers use multiplication of rational numbers?
Read the introduction to Lesson 2-3 at the top of page 79 in your textbook.
• How is the amount of the coupon shown on the sales slip? �1.00• Besides the amount, how is the number representing the coupon different
from the other numbers on the sales slip?
It is negative.
Reading the Lesson
1. Complete: If two numbers have different signs, the one number is positive and the other
number is .
2. Complete the table.
Multiplication Are the signs of the numbers the same Is the product positive or negative?Example or different?
a. (�4)(9) different negative
b. (�2)(�13) the same positive
c. 5(�8) different negative
d. 6(3) the same positive
3. Explain what the term “additive inverse” means to you. Then give an example.
The product of any number and �1 is its additive inverse; � � (�1) � .
Helping You Remember
4. Describe how you know that the product of �3 and �5 is positive. Then describe howyou know that the product of 3 and �5 is negative.
Sample answer: The signs are the same; the signs are different.
2�3
2�3
negative
Reading to Learn Mathematics, p. 91
Compound InterestIn most banks, interest on savings accounts is compounded at set timeperiods such as three or six months. At the end of each period, thebank adds the interest earned to the account. During the next period,the bank pays interest on all the money in the bank, including interest.In this way, the account earns interest on interest.
Suppose Ms. Tanner has $1000 in an account that is compoundedquarterly at 5%. Find the balance after the first two quarters.
Use I � prt to find the interest earned in the first quarter if p � 1000 and r � 5%. Why is t equal to ?
First quarter: I � 1000 � 0.05 �
I � 12.50
The interest, $12.50, earned in the first quarter is added to $1000.The principal becomes $1012.50.
Second quarter: I � 1012.50 � 0.05 �
I 12 65625
1�4
1�4
1�4
Enrichment
NAME ______________________________________________ DATE ____________ PERIOD _____
2-32-3Enrichment, p. 92
82 Chapter 2 Real Numbers
Civics The Marine Corps WarMemorial in Washington,D.C., is dedicated to allMarines who havedefended the United Statessince 1775. It is the mostfamous memorial that iscentered around the flag.
Source: The United States
National Park Service
STOCK PRICES For Exercises 40 and 41, usethe table that lists the closing prices of acompany’s stock over a one-week period.40. What was the change in price of 35 shares
of this stock from day 2 to day 3? �$7041. If you bought 100 shares of this stock on
day 1 and sold half of them on day 4,how much money did you gain or lose on those shares? �$134.50
Evaluate each expression if a � �2.7, b � 3.9, c � 4.5, and d � �0.2.42. �5c2 �101.25 43. �2b2 �30.4244. �4ab 42.12 45. �5cd 4.546. ad � 8 �7.46 47. ab � 3 �13.5348. d2(b � 2a) 0.372 49. b2(d � 3c) �208.377
50. CIVICS In a United States flag, the
length of the union is �25
� of the fly, and
the width is �173� of the hoist. If the fly is
6 feet, how long is the union?
51. COMPUTERS The price of a computer dropped $34.95 each month for 7 months. If the starting price was $1450, what was the price after 7 months? $1205.35
52. BALLOONING The temperature drops about 2°F for every rise of 530 feet inaltitude. Per Lindstrand achieved the altitude record of 64,997 feet in a hot-airballoon over Laredo, Texas, on June 6, 1988. About how many degrees differencewas there between the ground temperature and the air temperature at that altitude? Source: The Guinness Book of Records about �245°F
ECOLOGY For Exercises 53 and 54, use the following information.Americans use about 2.5 million plastic bottles every hour.Source: www.savethewater.com
53. About how many plastic bottles are used in one day? 60 million54. About how many bottles are used in one week? 420 million
55. CRITICAL THINKING An even number of negative numbers is multiplied.What is the sign of the product? Explain your reasoning.
56. Answer the question that was posed at the beginning of
the lesson. See margin.
How do consumers use multiplication of rational numbers?Include the following in your answer:
• an explanation of why the amount of a coupon is expressed as a negativevalue, and
• an explanation of how you could use multiplication to find your totaldiscount if you bought 3 CDs for $13.99 each and there was a discount of$1.50 on each CD.
WRITING IN MATH
2�25
� ft
fly
hoist
union
★
Closing StockPrice ($)
Day Price
1 64.38
2 63.66
3 61.66
4 61.69
5 62.34
55. Positive; theproduct of twonegative numbers ispositive and all evennumbers can bedivided into groups of two.
★
82 Chapter 2 Real Numbers
ELL

Open-Ended AssessmentWriting Have students write anexplanation of why the productof two negative numbers ispositive.
Getting Ready for Lesson 2-4PREREQUISITE SKILL Studentswill learn about dividing rationalnumbers in Lesson 2-4. UseExercises 69–76 to determineyour students’ familiarity withthe division of fractions, whichare part of the set of rationalnumbers.
Assessment OptionsPractice Quiz 1 The quizprovides students with a briefreview of the concepts and skillsin Lessons 2-1 through 2-3. Lessonnumbers are given to the right ofthe exercises or instruction linesso students can review conceptsnot yet mastered.
Answers
56. Sample answer: Multiplying letsconsumers calculate quickly thetotal of several similar items.Answers should include thefollowing.• Coupons are negative values
because adding a negativenumber is the same assubtracting a positive number.
• Multiply 13.99 and �1.50 bythree, then add the products.
63.
64.
65.21�1 0 2
313�
4321�2 �1 0
5 64321�4 �3�2 �1 0
StandardizedTest Practice
Lesson 2-3 Multiplying Rational Numbers 83
Maintain Your SkillsMaintain Your Skills
Practice Quiz 1Practice Quiz 1
1. Name the set of points graphed on the number line. (Lesson 2-1) {�4,�1, 1, 6}
2. Evaluate 32 � x � 8 if x � 15. (Lesson 2-1) 9
Find each sum or difference. (Lesson 2-2)
3. �15 � 7 �8 4. 27 � (�12) 39 5. �6.05 � (�2.1) �8.15 6. ��34
� � ���25
�� ��270�
Find each product. (Lesson 2-3)
7. �9(�12) 108 8. (3.8)(�4.1) �15.58
9. Simplify (�8x)(�2y) � (�3y)(z). (Lesson 2-3) 16xy � 3yz
10. Evaluate mn � 5 if m � 2.5 and n � �3.2. (Lesson 2-3) �3
2 3 4 5 610�1�2�3�4
Lessons 2-1 through 2-3
57. Which expression can be simplified as �8xy? B2y � 4x �2x(4y) (�4)2xy �4x(�2y)
58. Find the value of m if m � �2ab, a � �4, and b � 6. B8 48 12 �48DCBA
DCBA
Amountof Air
in Balloon
Time
Amountof Air
in Balloon
Time
Amountof Air
in Balloon
Time
Mixed Review
Getting Ready forthe Next Lesson
Find each sum or difference. (Lesson 2-2)
59. �6.5 � (�5.6) 60. �45
� � ���34
�� �210� 61. 42 � (�14) 56 62. �14.2 � 6.7
�12.1 �20.9Graph each set of numbers on a number line. (Lesson 2-1) 63–65. See margin.63. {…, �3, �1, 1, 3, 5} 64. {�2.5, �1.5, 0.5, 4.5} 65. {�1, ��
13
�, �23
�, 2}
66. Identify the graph below that best represents the following situation. Brandon has a deflated balloon. He slowly fills the balloon up with air. Without tying the balloon, he lets it go. (Lesson 1-8) ca. b. c.
Write a counterexample for each statement. (Lesson 1-7)
67. If 2x � 4 6, then x 5. x � 5 68. If a 3, then a 3. a � �4
PREREQUISITE SKILL Find each quotient.(To review division of fractions, see pages 800 and 801.)
69. �58
� � 2 �156� 70. �
23
� � 4 �16
� 71. 5 � �34
� 6�23
� 72. 1 � �25
� 2�12
�
73. �12
� � �38
� 1�13
� 74. �79
� � �56
� �11
45� 75. �
45
� � �65
� �23
� 76. �78
� � �23
� 1�156�
67–68. Sample answers are given.
www.algebra1.com/self_check_quiz
Lesson 2-3 Multiplying Rational Numbers 83
4 Assess4 Assess

5-Minute CheckTransparency 2-4 Use as a
quiz or review of Lesson 2-3.
Mathematical Background notesare available for this lesson on p. 66D.
can you use thedivision of rational
numbers to describe data?Ask students:
• What is another word for meanas it is used in this problem?average
• How do you find the averageor mean of a set of numbers?Add the numbers and then dividethe sum by the number of dataitems in the set.
• If you add the numbers in theChange column in the table,will the sum be positive ornegative? negative
Division of Integers
DIVIDE INTEGERS Since multiplication and division are inverse operations,the rule for finding the sign of the quotient of two numbers is similar to the rule forfinding the sign of a product of two numbers.
Dividing Rational Numbers
84 Chapter 2 Real Numbers
Simplify Before DividingSimplify ��3
7(��
1(2�
�5)
8)� .
��3
7(��
1(2�
�5)
8)� � �
7��3(
(��
45))
� Simplify the numerator first.
� �7 �
1(2�5)� Multiply.
� �122� or 6 same signs → positive quotient
Divide IntegersFind each quotient.a. �77 � 11 b. �
��
531
�
�77 � 11 � �7 negative quotient ���
531
� � �51 � (�3) Divide.
� 17 positive quotient
Example 1Example 1
Example 2Example 2
TEACHING TIPAdditional practice forfinding the mean is provided on pages 818and 819.
When simplifying fractions, recall that the fraction bar is a grouping symbol.
can you use division of rational numbers to describe data?can you use division of rational numbers to describe data?
• Divide integers.
• Divide rational numbers.
Each year, many sea turtles are stranded on the Texas Gulf Coast. The number of sea turtles stranded from 1997 to 2000 and the changes in number from the previous years are shown in the table. The following expression can be used to find the meanchange per year of the number of stranded turtles.
mean �(�127) � 54 � (�65)���
3
Stranded Sea TurtlesTexas Gulf Coast
YearNumber of
ChangeTurtles
1997 523
1998 396 �127
1999 450 �54
2000 385 �65
Source: www.ridleyturtles.org
• Words The quotient of two numbers having the same sign is positive. The quotient of two numbers having different signs is negative.
• Examples (�60) � (�5) � 12 same signs → positive quotient32 � (�8) � �4 different signs → negative quotient
LessonNotes
1 Focus1 Focus
Chapter 2 Resource Masters• Study Guide and Intervention, pp. 93–94• Skills Practice, p. 95• Practice, p. 96• Reading to Learn Mathematics, p. 97• Enrichment, p. 98• Assessment, pp. 131, 133
Parent and Student Study GuideWorkbook, p. 14
Prerequisite Skills Workbook, pp. 15–16, 19–20, 29–32, 39–40, 47–48,51–54, 63–66, 75–76
School-to-Career Masters, p. 4
5-Minute Check Transparency 2-4Answer Key Transparencies
TechnologyAlgePASS: Tutorial Plus, Lesson 3Interactive Chalkboard
Workbook and Reproducible Masters
Resource ManagerResource Manager
Transparencies

Lesson 2-4 Dividing Rational Numbers 85
DIVIDE RATIONAL NUMBERS The rules for dividing positive and negativeintegers also apply to division with rational numbers. Remember that to divide byany nonzero number, multiply by the reciprocal of that number.
Divide Rational NumbersFind each quotient.a. 245.66 � (�14.2)
245.66 � (�14.2) � �17.3 Use a calculator.different signs → negative quotient
b. ��25
� � �14
�
��25
� � �14
� � ��25
� � �41
� Multiply by �41
�, the reciprocal of �14
�.
� ��85
� or �1�35
� different signs → negative quotient
Example 3Example 3
Divide Rational Numbers to Solve a ProblemARCHITECTURE The Pentagon in Washington, D.C., has an outside perimeter of 4608 feet. Find the length of each outside wall.To find the length of each wall, divide theperimeter by the number of sides.
4608 � 5 � 921.6 same signs → positive quotient
The length of each outside wall is 921.6 feet. The Pentagon
Evaluate Algebraic ExpressionsEvaluate �
acb2� if a � �7.8, b � 5.2, and c � �3. Round to the nearest hundredth.
�acb2� � �
(�(7�.8
3)()52.2)
� Replace a with �7.8, b with 5.2, and c with �3.
� ��4
90.56� Find the numerator and denominator separately.
� �4.51 Use a calculator. different signs → negative quotient
Example 6Example 6
Example 4Example 4
ArchitectureThe Pentagon is one of the world’s largest officebuildings. It contains 131 stairways, 19 escalators,13 elevators, 284 restrooms,and 691 drinking fountains.
Source: www.infoplease.com
Simplify Algebraic ExpressionsSimplify �24 �
36a
�.
�24 �
36a
� � (24 � 6a) � 3 The fraction bar indicates division.
� (24 � 6a)��13
�� Multiply by �13
�, the reciprocal of 3.
� 24��13
�� � 6a��13
�� Distributive Property
� 8 � 2a Simplify.
Example 5Example 5
You can use the Distributive Property to simplify fractional expressions.
www.algebra1.com/extra_examples
Lesson 2-4 Dividing Rational Numbers 85
2 Teach2 Teach
11
22
In-Class ExamplesIn-Class Examples
33
44
55
66
In-Class ExamplesIn-Class Examples
Kinesthetic Use index cards to write each component of a divisionexpression as an equation. Have students model the division and thenrearrange the cards to make a multiplication sentence, setting the �card aside.
→ �60��5�??��5��60
Differentiated Instruction
3 Practice/Apply3 Practice/Apply
Study NotebookStudy Notebook
DIVIDE INTEGERS
Find each quotient.
a. �60 � (�5) 12
b. �6
Simplify . �2
DIVIDE RATIONALNUMBERS
Find each quotient.
a. �112.23 � 8.7 �12.9
b. � � �� � or 1
BASEBALL The perimeter ofa square baseball diamond is360 feet. Find the length ofone side of the diamond. 90 ft
Teaching Tip You may alsowant to show Example 5 as thedifference of two fractions withthe same denominator.
� � � 8 � 2a
Simplify . �3b � 5
Evaluate if w � 2,
x � �9.1 and y � 4. �1.1375
Have students—• record the rules for dividing
integers.• include any other item(s) that they
find helpful in mastering the skillsin this lesson.
wx�y2
�39b � 65��
13
6a�3
24�3
24 � 6a��3
1�8
9�8
1�3
3�8
2(1 � 5)��17 � (�13)
�108�
18
PowerPoint®
PowerPoint®
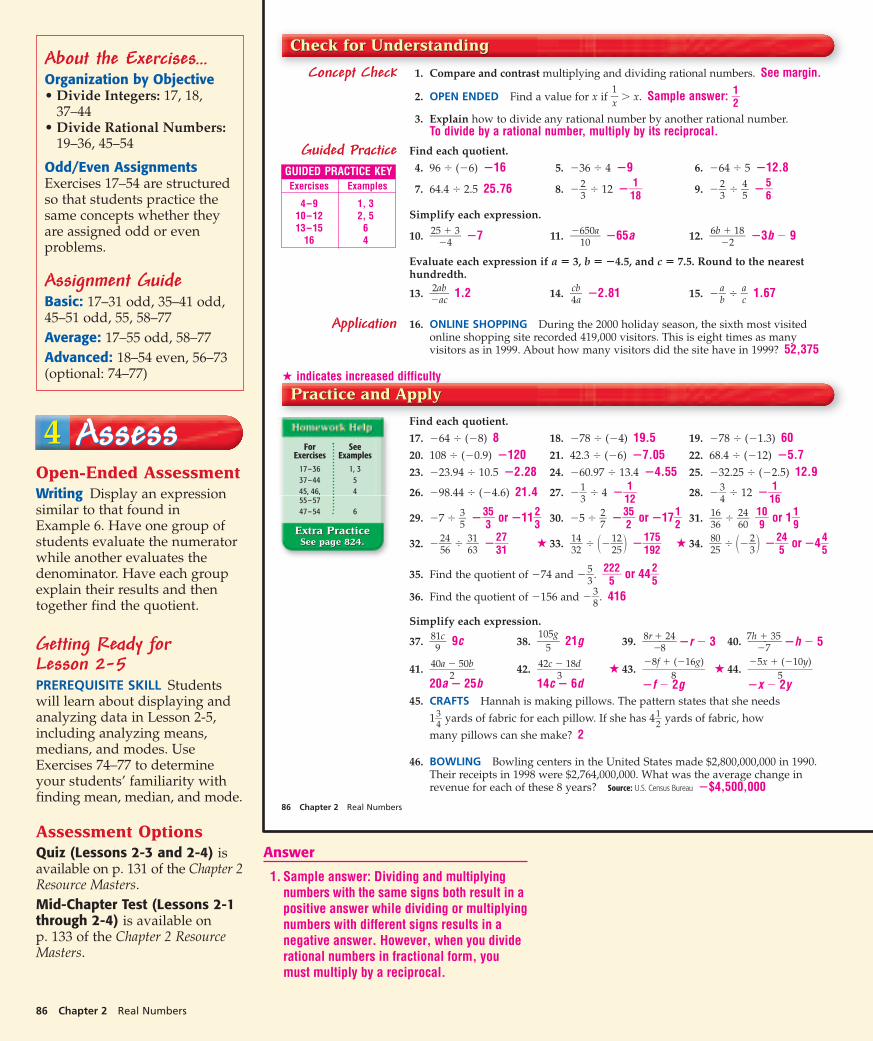
86 Chapter 2 Real Numbers
GUIDED PRACTICE KEYExercises Examples
4–9 1, 310–12 2, 513–15 6
16 4
Practice and ApplyPractice and Applyindicates increased difficulty★
1. Compare and contrast multiplying and dividing rational numbers. See margin.
2. OPEN ENDED Find a value for x if �1
x� x. Sample answer: �
12
�
3. Explain how to divide any rational number by another rational number.To divide by a rational number, multiply by its reciprocal.
Find each quotient.4. 96 � (�6) �16 5. �36 � 4 �9 6. �64 � 5 �12.8
7. 64.4 � 2.5 25.76 8. ��23
� � 12 ��118� 9. ��
23
� � �45
� ��56
�
Simplify each expression.
10. �25
��4
3� �7 11. �
�61500a
� �65a 12. �6b
��
218
� �3b � 9
Evaluate each expression if a � 3, b � �4.5, and c � 7.5. Round to the nearesthundredth.
13. ��2a
abc
� 1.2 14. �4cba� �2.81 15. ��
ba
� � �ac
� 1.67
16. ONLINE SHOPPING During the 2000 holiday season, the sixth most visitedonline shopping site recorded 419,000 visitors. This is eight times as manyvisitors as in 1999. About how many visitors did the site have in 1999? 52,375
Find each quotient.17. �64 � (�8) 8 18. �78 � (�4) 19.5 19. �78 � (�1.3) 6020. 108 � (�0.9) �120 21. 42.3 � (�6) �7.05 22. 68.4 � (�12) �5.723. �23.94 � 10.5 �2.28 24. �60.97 � 13.4 �4.55 25. �32.25 � (�2.5) 12.9
26. �98.44 � (�4.6) 21.4 27. ��13
� � 4 ��112� 28. ��
34
� � 12 ��116�
29. �7 � �35
� ��335� or �11�
23
� 30. �5 � �27
� ��325� or �17�
12
� 31. �13
66� � �
26
40� �
190� or 1�
19
�
32. ��2546� � �
3613� ��
23
71� ★ 33. �
1342� � ���
12
25�� ��
1179
52
� ★ 34. �8205� � ���
23
�� ��254� or �4�
45
�
35. Find the quotient of �74 and ��53
�. �22
52
� or 44�25
�
36. Find the quotient of �156 and ��38
�. 416
Simplify each expression.
37. �891c� 9c 38. �
10
5
5g� 21g 39. �
8r��
824
� 40. �7h
��
735
�
41. �40a �
250b
� 42. �42c �
318d
� ★ 43. ��8f �
8
(�16g)� ★ 44. �
�5x �
5
(�10y)�
20a � 25b 14c � 6d �f � 2g �x � 2y45. CRAFTS Hannah is making pillows. The pattern states that she needs
1�34
� yards of fabric for each pillow. If she has 4�12
� yards of fabric, how
many pillows can she make? 2
46. BOWLING Bowling centers in the United States made $2,800,000,000 in 1990.Their receipts in 1998 were $2,764,000,000. What was the average change inrevenue for each of these 8 years? Source: U.S. Census Bureau �$4,500,000
Concept Check
Guided Practice
Application
�r � 3 �h � 5
Extra Practice See page 824.
Extra Practice See page 824.
For SeeExercises Examples
17–36 1, 3
37–44 5
45, 46, 455–57
47–54 6
86 Chapter 2 Real Numbers
About the Exercises…Organization by Objective• Divide Integers: 17, 18,
37–44• Divide Rational Numbers:
19–36, 45–54
Odd/Even AssignmentsExercises 17–54 are structuredso that students practice thesame concepts whether theyare assigned odd or evenproblems.
Assignment GuideBasic: 17–31 odd, 35–41 odd,45–51 odd, 55, 58–77
Average: 17–55 odd, 58–77
Advanced: 18–54 even, 56–73(optional: 74–77)
4 Assess4 AssessOpen-Ended AssessmentWriting Display an expressionsimilar to that found in Example 6. Have one group ofstudents evaluate the numeratorwhile another evaluates thedenominator. Have each groupexplain their results and thentogether find the quotient.
Getting Ready for Lesson 2-5PREREQUISITE SKILL Studentswill learn about displaying andanalyzing data in Lesson 2-5,including analyzing means,medians, and modes. UseExercises 74–77 to determineyour students’ familiarity withfinding mean, median, and mode.
Assessment OptionsQuiz (Lessons 2-3 and 2-4) isavailable on p. 131 of the Chapter 2Resource Masters.
Mid-Chapter Test (Lessons 2-1through 2-4) is available on p. 133 of the Chapter 2 ResourceMasters.
Answer
1. Sample answer: Dividing and multiplyingnumbers with the same signs both result in apositive answer while dividing or multiplyingnumbers with different signs results in anegative answer. However, when you dividerational numbers in fractional form, youmust multiply by a reciprocal.

Study Guide and InterventionDividing Rational Numbers
NAME ______________________________________________ DATE ____________ PERIOD _____
2-42-4
Less
on
2-4
Divide Integers The rules for finding the sign of a quotient are similar to the rules forfinding the sign of a product.
Dividing Two Numbers with the Same Sign The quotient of two numbers having the same sign is positive.
Dividing Two Numbers with Different Signs The quotient of two numbers having different signs is negative.
Find each quotient.
a. �88 � (�4)�88 � (�4) � 22 same signs → positive quotient
b.
� �8 different signs → negative quotient�64�8
�64�8
Simplify .
� .
�
�
� �8
32��4
32���3 � (�1)
�4(�8)���3 � (�1)
�4(�10 � 2)��
�3 � (�1)
�4(�10 � 2)��
�3 � (�1)Example 1Example 1 Example 2Example 2
ExercisesExercises
Find each quotient.
1. �80 � (�10) 2. �32 � 16 3. 80 � 5
8 �2 16
4. 18 � (�3) 5. �12 � (�3) 6. 8 � (�2)
�6 4 �4
7. �15 � (�3) 8. 121 � (�11) 9. �24 � 1.5
5 �11 �16
10. 0 � (�8) 11. �125 � (�25) 12. �104 � 4
0 5 �26
Simplify.
13. 14. 15.
2 60 �2
16. 17. 18.
�4 �8 2
4(�12 � 4)��
�2(8)�4(�8 � (�4))��
�3 � (�3)�12(2 � (�3))��
�4 � 1
�6(�6 � 2)���10 � (�2)
5(�10 � (�2))��
�2 � 1�2 � (�4)��(�2) � (�1)
Study Guide and Intervention, p. 93 (shown) and p. 94
Find each quotient.
1. 75 � (�15) �5 2. �323 � (�17) 19 3. �88 � 16 �5.5
4. 65.7 � (�9) �7.3 5. �36.08 � 8 �4.51 6. �40.05 � (�2.5) 16.02
7. �9 � 8. � � �� � 9. � �� ��15 �
290� or 2 �
Simplify each expression.
10. �12p 11. 5 � x 12. �t � (�4)
13. 14. 15.
�3x � (�2y) 2k � 3h �c � (�4d)
Evaluate each expression if p � �6, q � 4.5, r � 3.6, and s � �5.2. Round to thenearest hundredth.
16. �2.7 17. �4.16 18. ps � qr 1.93
19. rs � pq 0.69 20. �2.92 21. �0.36
22. EXERCISE Ashley walks 2 miles around a lake three times a week. If Ashley walks
around the lake in hour, what is her rate of speed? (Hint: Use the formula r � ,
where r is rate, d is distance, and t is time.) 3 mi/h
23. PUBLICATION A production assistant must divide a page of text into two columns. If
the page is 6 inches wide, how wide will each column be? 3 in.
ROLLER COASTERS For Exercises 24 and 25, use the following information.
The formula for acceleration is a � , where a is acceleration, f is final speed, s is starting speed, and t is time.
24. The Hypersonic XLC roller coaster in Virginia goes from zero to 80 miles per hour in 1.8 seconds. What is its acceleration in miles per hour per second to the nearest tenth?Source: www.thrillride.com about 44.4 mi/h per second
25. What is the acceleration in feet per second per second? (Hint: Convert miles to feet andhours to seconds, then apply the formula for acceleration. 1 mile � 5280 feet)about 65.2 ft/s per second
f � s�t
3�8
3�4
1�3
d�t
3�4
1�2
r � s�q
p � q�r
rs�q
qr�p
�4c � (�16d)��4
8k �12h��4
18x � 12y��
�6
3t � 12�
�325 � 5x�5
168p��14
12�49
2�9
49�54
14�63
3�8
5�6
3�5
Practice (Average)
Dividing Rational Numbers
NAME ______________________________________________ DATE ____________ PERIOD _____
2-42-4Skills Practice, p. 95 and Practice, p. 96 (shown)
Reading to Learn MathematicsDividing Rational Numbers
NAME ______________________________________________ DATE ____________ PERIOD _____
2-42-4
Less
on
2-4
Pre-Activity How can you use division of rational numbers to describe data?
Read the introduction to Lesson 2-4 at the top of page 84 in your textbook.
• What is meant by the term mean?
the sum of a set of data items divided by the number of data items.
• In the expression , will the numerator be positive or negative?negative
Reading the Lesson
1. Explain what the term inverse operations means to you.
Sample answer: Inverse operations are operations that undo one another.
2. Write negative or positive to describe the quotient. Explain your answer.
Expression Negative or Positive? Explanation
a. negative The signs of the two numbers are different.
b. positive The signs of the two numbers are the same.
c. positive After multiplying, the signs of the numbersbeing divided are the same.
Helping You Remember
3. Explain how knowing the rules for multiplying rational numbers can help you rememberthe rules for dividing rational numbers.
Sample answer: Both rules state that the answer (product formultiplication, quotient for division) is positive if the signs are the sameand negative if the signs are different.
(�5.6)(�2.4)��
1.92
�78��13
35��7
(�127) � 54 � (�65)���3
Reading to Learn Mathematics, p. 97
Other Kinds of MeansThere are many different types of means besides the arithmeticmean. A mean for a set of numbers has these two properties:
a. It typifies or represents the set.b. It is not less than the least number and it is not greater than the
greatest number.
Here are the formulas for the arithmetic mean and three other means.
Enrichment
NAME ______________________________________________ DATE ____________ PERIOD _____
2-42-4
Arithmetic Mean
Add the numbers in the set. Then dividethe sum by n, the number of elements inthe set.
Harmonic Mean
Divide the number of elements in the set bythe sum of the reciprocals of the numbers.
Geometric Mean
Multiply all the numbers in the set. Thenfind the nth root of their product.
n�x1 � x2� � x3 ��… � xn�
Quadratic Mean
Add the squares of the numbers. Dividetheir sum by the number in the set.
x1 � x2 � x3 � … � xn���n
Enrichment, p. 98
Maintain Your SkillsMaintain Your Skills
Lesson 2-4 Dividing Rational Numbers 87
Evaluate each expression if m � �8, n � 6.5, p � 3.2, and q � �5.4. Round to the nearest hundredth.47. �
mpn� �16.25 48. �
nmp� �2.6 49. mq � np 2.08 50. pq � mn 0.33
51. �n
m� p� �1.21 52. �
m �
qp
� 0.89 ★ 53. ��m
n�
�2n
q� 1.76 ★ 54. �
�
pq�
�
3
mq
� 1.45
55. BUSINESS The president of a small business is looking at her profit/lossstatement for the past year. The loss in income for the last year was $23,985. On average, what was the loss per month last year? $1998.75
JEWELRY For Exercises 56 and 57, use the following information.The gold content of jewelry is given in karats. For example, 24-karat gold is pure
gold, and 18-karat gold is �1284� or 0.75 gold. 56. �
152�; �
172�
56. What fraction of 10-karat gold is pure gold? What fraction is not gold?
57. If a piece of jewelry is �23
� gold, how would you describe it using karats?
58. CRITICAL THINKING What is the least positive integer that is divisible by allwhole numbers from 1 to 9? 2520
59. Answer the question that was posed at the beginning ofthe lesson. See margin.
How can you use division of rational numbers to describe data?Include the following in your answer:
• an explanation of how you could use the mean of a set of data to describechanges in the data over time, and
• reasons why you think the change from year to year is not consistent.
60. If the rod is cut as shown, how many inches long will each piece be? D
0.625 in. 1.875 in.
5.2 in. 7.5 in.
61. If �137� � x, then what is the value of 6x � 1? B
32 33 35 44DCBA
DC
BA
6.25 ft
WRITING IN MATH
Find each product. (Lesson 2-3)
62. �4(11) �44 63. �2.5(�1.2) 3 64. �14
�(�5) �1�14
� 65. 1.6(0.3) 0.48
Find each difference. (Lesson 2-2)
66. 8 � (�6) 14 67. 15 � 21 �6 68. �7.5 � 4.8 �12.3 69. ��58
� � ���16
�� ��1214�
70. Name the property illustrated by 2(1.2 � 3.8) � 2 � 5. Subs.
Simplify each expression. If not possible, write simplified. (Lesson 1-5)
71. 8b � 12(b � 2) 72. 6(5a � 3b � 2b) 73. 3(x � 2y) � 2y20b � 24 30a � 6b 3x � 4y
PREREQUISITE SKILL Find the mean, median, and mode for each set of data. (To review mean, median, and mode, see pages 818 and 819.)
74. 40, 34, 40, 28, 38 36; 38; 40 75. 3, 9, 0, 2, 11, 8, 14, 3 6.25; 5.5; 376. 1.2, 1.7, 1.9, 1.8, 1.2, 1.0, 1.5 77. 79, 84, 81, 84, 75, 73, 80, 78
Mixed Review
Getting Ready forthe Next Lesson
1.5; 1.5; 1.2 79.25; 79.5; 84
JewelryThe discovery of gold atSutter’s Mill early in 1848brought more than 40,000prospectors to Californiawithin two years.
Source: www.infoplease.com
16-karat gold
www.algebra1.com/self_check_quiz
StandardizedTest Practice
Lesson 2-4 Dividing Rational Numbers 87
ELL
Answer
59. Sample answer: You use division to findthe mean of a set of data. Answers shouldinclude the following.• You could track the mean number of
turtles stranded each year and note ifthe value increases or decreases.
• Weather or pollution could affect theturtles.

5-Minute CheckTransparency 2-5 Use as a
quiz or review of Lesson 2-4.
Mathematical Background notesare available for this lesson on p. 66D. This lesson coversunivariate data, which means datadepending on only one randomvariable.
Building on PriorKnowledge
In Chapter 1, students learnedhow graphs can be used to visual-ize data. In this lesson, studentswill learn about other types ofgraphs for visualizing data.
are line plots andaverages used to makedecisions?
Ask students:
• What was the most popularboys’ name in all five decades?How can you tell? The mostpopular boys’ name in all fivedecades was Michael because it isin the first column for all fivedecades.
• Were any girls’ names aspopular as Michael? How canyou tell? No, because no girl’sname appears twice in any of thefive columns.
CREATE LINE PLOTS AND STEM-AND-LEAF PLOTS In some cases,data can be presented using a . Most line plots have a number line labeledwith a scale to include all the data. Then an � is placed above a data point each timeit occurs to represent the of the data.frequency
line plot
Vocabulary• line plot
• frequency
• stem-and-leaf plot
• back-to-back
stem-and-leaf plot
• measures of central
tendency
Statistics: Displaying andAnalyzing Data
88 Chapter 2 Real Numbers
are line plots and averages used to make decisions?are line plots and averages used to make decisions?
Create a Line PlotDraw a line plot for the data.
�2 4 3 2 6 10 7 4 �2 0 10 8 7 10 7 4 �1 9 �1 3
Step 1 The values of the data range from �2 to 10, so construct a number linecontaining those points.
Step 2 Then place an � above a number each time it occurs.
0 1�2 �1 2 3 4 5 6 7 8 9 10
���
���
���
��
��
� � � � � ��
0 1�2 �1 2 3 4 5 6 7 8 9 10
Example 1Example 1
How many people do you know with the same first name? Some names aremore popular than others. The table below lists the top five most popularnames for boys and girls born in each decade from 1950 to 1999.
To help determine which names appear most frequently, these data could bedisplayed graphically.
Top Five First Names of America
Michael James Robert John DavidDeborah Mary Linda Patricia Susan
Michael John David James RobertLisa Deborah Mary Karen Michelle
Michael Christopher Jason David JamesJennifer Michelle Amy Melissa Kimberly
Michael Christopher Matthew Joshua DavidJessica Jennifer Ashley Sarah Amanda
Michael Christopher Matthew Joshua NicholasAshley Jessica Sarah Brittany Emily
1950-59
1960-69
1970-79
1980-89
1990-99
BoysGirls
Source: The World Almanac
• Interpret and create line plots and stem-and-leaf plots.
• Analyze data using mean, median, and mode.
LessonNotes
1 Focus1 Focus
Chapter 2 Resource Masters• Study Guide and Intervention, pp. 99–100• Skills Practice, p. 101• Practice, p. 102• Reading to Learn Mathematics, p. 103• Enrichment, p. 104
Parent and Student Study GuideWorkbook, p. 15
Prerequisite Skills Workbook, pp. 15–16, 61–62, 75–76
5-Minute Check Transparency 2-5Answer Key Transparencies
TechnologyInteractive Chalkboard
Workbook and Reproducible Masters
Resource ManagerResource Manager
Transparencies

Lesson 2-5 Statistics: Displaying and Analyzing Data 89
Another way to organize and display data is by using a . In a stem-and-leaf plot, the greatest common place value is used for the stems. Thenumbers in the next greatest place value are used to form the leaves. In Example 2, the greatest place value is tens. Thus, 32 miles per hour would have a stem of 3 and aleaf of 2. A complete stem-and-leaf plot for the data in Example 2 is shown below.
stem-and-leaf plot
Use a Line Plot to Solve a ProblemANIMALS The speeds (mph) of 20 of the fastest land animals are listed below.
45 70 43 45 32 42 40 40 35 5040 35 61 48 35 32 50 36 50 40Source: The World Almanac
a. Make a line plot of the data.The lowest value is 30, and the highest value is 70, so use a scale that includesthose values. Place an � above each value for each occurrence.
b. Which speed occurs most frequently?Looking at the line plot, we can easily see that 40 miles per hour occurs mostfrequently.
�� ���
��
�
��
� ��
�
� � ���
�
403530 65 7060555045
Example 2Example 2
Create a Stem-and-Leaf PlotUse the data below to make a stem-and-leaf plot.
108 104 86 82 80 72 70 62 64 68 84 64 98 96 98103 87 65 83 79 97 96 112 62 80 62 83 76 66 97
The greatest common place value is tens, so the digits in the tens place are the stems.
Example 3Example 3
AnimalsWhereas the cheetah is the fastest land animal, the fastest marine animal is the sailfish. It is capableof swimming 68 miles perhour.
Source: The Top 10 of Everything
Stem-and-LeafPlotsA key is included on
stem-and-leaf plots to
indicate what the stems
and leaves represent
when read.
Study Tip
Line plots are a convenient way to organize data for comparison.
A can be used to compare two related sets of data.
back-to-back stem-and-leaf plot
Stem Leaf
6 2 2 2 4 4 5 6 8
7 0 2 6 9
8 0 0 2 3 3 4 6 7
9 6 6 7 7 8 8
10 3 4 8
11 2 103 � 103
Stem Leaf
3 2 2 5 5 5 6
4 0 0 0 0 2 3 5 5 8
5 0 0 0
6 1
7 0 32 � 32
key
←
www.algebra1.com/extra_examples
Lesson 2-5 Statistics: Displaying and Analyzing Data 89
2 Teach2 Teach
11
22
In-Class ExamplesIn-Class Examples
CREATE LINE PLOTS ANDSTEM-AND-LEAF PLOTS
Reading Tip Explain that thefrequency of the data is howmany times a given number oc-curs. For example, in Example 1,the number 4 occurs 3 times, soits frequency is 3.
Draw a line plot for the data.11 �2 10 �2 7 2 7 4 9 06 9 7 2 0 4 10 7 6 9
TRAFFIC The highway patroldid a radar survey of thespeeds of cars along a stretchof highway for 1 minute. Thespeeds (in miles per hour) ofthe 20 cars that passed arelisted below.72 70 72 74 68 69 7072 74 75 79 75 74 7270 64 69 66 68 67
a. Make a line plot of the data.
b. Which speed occurs mostfrequently? 72 mph
7674 80787270686664
� ����� � ����� � �
� ��
��
�
64 10820�2
� � � � �� � �� � � � �� �
��
��
�
PowerPoint®

33
44
In-Class ExamplesIn-Class Examples
Use the data below to make astem-and-leaf plot.
85 115 126 92 104 10778 131 114 92 85 116
100 121 123 131 88 9799 116 79 90 110 129
108 93 84 75 70 132
WEATHER Monique wants tocompare the monthly averagehigh temperatures of Dallasand Atlanta before she decidesto which city she wants tomove. The table shows themonthly average high temp-eratures (°F) for both cities.
a. Make a stem-and-leaf plot tocompare the data.
b. What is the differencebetween the highest averagetemperatures in each city? 7F
c. Which city has higheraverage temperatures? Dallashas a greater number of averagehigh temperatures above 80F.
Dallas | Stem | Atlanta9 7 4 | 5 | 0 4 5
8 6 | 6 | 3 48 7 | 7 | 2 2 57 3 | 8 | 1 5 7 8
5 5 1 | 9 |8 |6 � 68 7 |2 � 72
Monthly AverageHigh Temperature
Dallas Atlanta
54 59 68 77 50 55 64 72 83 91 95 95 75 85 88 87 87 78 66 57 81 72 63 54
Stem | Leaf7 | 0 5 8 98 | 4 5 5 89 | 0 2 2 3 7 9
10 | 0 4 7 811 | 0 4 5 6 612 | 1 3 6 913 | 1 1 2 11|5 � 115
ANALYZE DATA When analyzing data, it is helpful to have one number thatdescribes the set of data. Numbers known as areoften used to describe sets of data because they represent a centralized, or middle,value. Three of the most commonly used measures of central tendency are the mean,median, and mode.
When you use a measure of central tendency to describe a set of data, it isimportant that the measure you use best represents all of the data.
• Extremely high or low values can affect the mean, while not affecting the median or mode.
• A value with a high frequency can cause the mode to be misleading.
• Data that is clustered with a few values separate from the cluster can cause the median to be too low or too high.
measures of central tendency
90 Chapter 2 Real Numbers
Back-to-Back Stem-and-Leaf PlotMrs. Evans wants to compare recent test scores from her two algebra classes. The table shows the scores for both classes.a. Make a stem-and-leaf plot to
compare the data.To compare the data, we can use a back-to-back stem-and-leaf plot. Since the data represent similar measurements, the plot will share a common stem.
Class 1 Stem Class 2
8 8 7 6 2
9 9 9 8 7 6 4 2 7 5 5 6 6 8 8
9 9 7 6 6 5 3 2 8 0 0 3 3 5 5 6 6 7 8 8 9
8 4 3 3 3 0 9 2 2 5 5 6
76 � 67 10 0 62 � 62
b. What is the difference between the highest score in each class?100 � 98 or 2 points
c. Which class scored higher overall on the test?Looking at the scores of 80 and above, we see that class 2 has a greater numberof scores at or above 80 than class 1.
Class 1
8398908293
7976858786
9386796893
7994897874
7268778967
Class 28686898580
9588959692
88100788076
7883766292
8575838775
Algebra Test Scores
Example 4Example 4
Analyze DataWhich measure of central tendency best represents the data?Determine the mean, median, and mode.
The mean is about 0.88. Add the data and divide by 15.
The median is 0.82. The middle value is 0.82.
The mode is 0.82. The most frequent value is 0.82.
Either the median or the mode best represent the set of data since both measuresare located in the center of the majority of the data. In this instance, the mean istoo high.
Example 5Example 5
Stem Leaf
7 7 8 9
8 2 2 2 2 2 3 4 4 6
9
10 8
11 6 8 79 � 0.79
Look BackTo review finding mean,
median, and mode,
see pages 818 and 819.
Study Tip
90 Chapter 2 Real Numbers
Visual/Spatial Analyzing data in a graphical form such as a line plot orstem-and-leaf plot may be more intuitive for some students than findingthe mean, median, and mode. Suggest that students compare theirresults when finding mean, median, and mode to the way the datalooks in either of the plots. Do the measures of central tendency makesense when compared to the plots?
Differentiated Instruction
PowerPoint®

Lesson 2-5 Statistics: Displaying and Analyzing Data 91
Determine the Best Measure of Central TendencyPRESIDENTS The numbers below show the ages of the U.S. Presidents since1900 at the time they were inaugurated. Which measure of central tendency best represents the data?
42 51 56 55 51 54 51 60 6243 55 56 61 52 69 64 46 54
The mean is about 54.6. Add the data and divide by 18.
The median is 54.5. The middle value is 54.5.
The mode is 51. The most frequent value is 51.
The mean or the median can be used to best represent the data. The mode for the data is too low.
Example 6Example 6
GUIDED PRACTICE KEYExercises Examples
4, 5 1, 26, 7, 9, 10, 5, 6
12, 138, 11 3, 4
1. Explain why it is useful to find the mean, median, and mode of a set of data.
2. Mitchell says that a line plot and a line graph are the same thing. Show that he is incorrect. See pp. 117A–117B.
3. OPEN ENDED Write a set of data for which the median is a betterrepresentation than the mean. Sample answer: 13, 14, 14, 28
4. Use the data to make a line plot. See pp. 117A–117B.22 19 14 15 14 21 19 16 22 19 10 15 19 14 19
For Exercises 5–7, use the list that shows the number of hours students in Mr. Ricardo’s class spent online last week.
7 4 7 11 3 1 5 10 10 0 9 4 0 14 13 411 3 1 12 0 9 13 14 7 6 10 5 12 0 6 5
5. Make a line plot of the data. See pp. 117A–117B.6. Which value occurs most frequently? 07. Does the mean, median, or mode best represent the data? Explain. See pp. 117A–8. Use the data to make a stem-and-leaf plot. See pp. 117A–117B.
68 66 68 88 76 71 88 93 86 64 73 80 81 72 68
For Exercises 9 and 10, use the data in the stem-and-leaf plot.9. What is the difference between the least
and greatest values? 3.610. Which measure of central tendency best
describes the data? Explain.Median; most of the data clusters higher, near the median.
BUILDINGS For Exercises 11–13, use the data below that represents the numberof stories in the 25 tallest buildings in the world.
88 88 110 88 80 69 102 78 70 54 80 8583 100 60 90 77 55 73 55 56 61 75 64 105
11. Make a stem-and-leaf plot of the data. See pp. 117A–117B.12. Which value occurs most frequently? 8813. Does the mode best describe the set of data? Explain.
Concept Check
Guided Practice
1. They describe thedata as a whole.
Stem Leaf
9 3 5 5
10 2 2 5 8
11 5 8 8 9 9 9
12 0 1 7 8 9 93 � 9.3
Application
13. The mode is notthe best measure as itis higher than most ofthe values.
117B.
Lesson 2-5 Statistics: Displaying and Analyzing Data 91
55
66
In-Class ExamplesIn-Class Examples
3 Practice/Apply3 Practice/Apply
Study NotebookStudy Notebook
ANALYZE DATA
Which measure of centraltendency best represents the data?
The mean is about 5.5.The median is 4.8.The mode is 4.4.Either the median or the modebest represent the data. Themean is too high.
POLITICS The number ofelectoral votes for the 12 mostpopulous states in the 2000Presidential election are listedbelow. Which measure ofcentral tendency bestrepresents the data?
21 22 18 23 15 2514 32 13 33 13 54
The mean is about 23.6.The median is 21.5.The mode is 13.Either the mean or median canbe used to represent the data.The mode is too low.
Have students—• add the definitions/examples of
the vocabulary terms to theirVocabulary Builder worksheets forChapter 2.
• create examples of a line plot anda stem-and-leaf plot, along withthe data used to create the plots.They can even use the same set ofdata to create both plots.
• include any other item(s) that theyfind helpful in mastering the skillsin this lesson.
Stem | Leaf4 | 1 1 2 4 4 4 5 85 | 06 | 2 5 77 | 3 98 | 1 62 � 6.2
Mean and Median Mean and median are two mathematical terms thatare often confused. Remind students that the mean is the arithmeticaverage of a set of data and the median is the number that is in themiddle of the set of data. The mean and median can be very similar ifthe values in the data set are evenly spread between the lowest andhighest value. But a few very high or very low values in a data set cancause the mean and median to have significantly different values.
Unlocking Misconceptions
PowerPoint®

Answers
14.
15. See below right.16.
20.
21. Stem | Leaf1 | 8 82 | 2 3 6 6 6 8 93 | 0 1 1 2 3 44 | 7
1 |8 � 18
Stem | Leaf5 | 8 96 | 0 3 5 6 97 | 0 1 1 2 3
5 |8 � 5.8
�����������
��������
����������
�����
�����
��
� ��
1 3 5 7 9
{
� � ��
���� ��
� ��
���
�
36 38 40 42 44 46 48 50 52 54
Practice and ApplyPractice and Apply
C02-044CInfographic to come
92 Chapter 2 Real Numbers
Use each set of data to make a line plot. 14–15. See margin.14. 43 36 48 52 41 54 45 48 49 52 35 44 53 46 38 41 53
15. 1.0 �1.5 1.5 2.0 �1.5 2.1 �2.0 2.4 1.5 �1.42.5 1.4 �1.2 1.3 1.0 2.2 2.3 �1.2 �1.5 2.1
BASKETBALL For Exercises 16–19, use the table that shows the seeds, or rank, of the NCAA men’s basketball Final Four from 1991 to 2001.16. Make a line plot of the data. See margin.17. How many of the teams in the Final Four
were not number 1 seeds? 2318. How many teams were seeded higher than
third? (Hint: Higher seeds have lesser numerical value.) 29
19. Which measure of central tendency best describes the data? Explain. Sample answer: Median; most of the data are near 2.
Use each set of data to make a stem-and-leaf plot. 20–21. See margin.20. 6.5 6.3 6.9 7.1 7.3 5.9 6.0 7.0 7.2 6.6 7.1 5.8
21. 31 30 28 26 22 34 26 31 47 32 18 33 26 23 18 29
WEATHER For Exercises 22–24, use the list of the highest recorded temperatures in each of the 50 states.
Source: The World Almanac
22. Make a stem-and-leaf plot of the data. See pp. 117A–117B.23. Which temperature occurs most frequently? 11824. Does the mode best represent the data? Explain.
25. RESEARCH Use the Internet or another source to find the total number of eachCD sold over the past six months to reach number one. Which measure ofcentral tendency best describes the average number of top selling CDs sold?Explain. See students’ work.
GEOLOGY For Exercises 26 and 27, refer to thestem-and-leaf plot that shows the magnitudes ofearthquakes occurring in 2000 that measured atleast 5.0 on the Richter scale.
26. What was the most frequent magnitude of theseearthquakes? 7.5
27. Which measure of central tendency bestdescribes this set of data? Explain.Mean or median; both are centrally located and the mode is too high.
112 100 128 120 134 118 106 110 109 112
100 118 117 116 118 121 114 114 105 109
107 112 114 115 118 117 118 125 106 110
122 108 110 121 113 120 119 111 104 111
120 113 120 117 105 110 118 112 114 114
No; the mode is higher than most of the data.
Stem Leaf
5 1 2 2 3 4 8 8 9 9
6 1 1 2 3 4 5 6 7 7 8
7 0 1 1 2 2 3 5 5 5 6 8 8
8 0 0 2 51 � 5.1
Source: National Geophysical Data Center
19911992199319941995199619971998199920002001
Year Seeds11111111111
12112112151
24122413182
36234543483
Source: www.espn.com
Extra Practice See page 824.
Extra Practice See page 824.
For SeeExercises Examples
14–18 1, 2
20–22, 28, 3, 429, 32, 33,
35, 36
19, 23–27, 5, 630, 31,34, 37
92 Chapter 2 Real Numbers
About the Exercises…Organization by Objective• Create Line Plots and
Stem–and–Leaf Plots:14–16, 20–22, 28, 32, 35
• Analyze Data: 17–19, 23–25,27, 29–31, 33–34, 36–37,39–41
Odd/Even AssignmentsExercises 14–15 and 20–21 arestructured so that studentspractice the same conceptswhether they are assignedodd or even problems.
Alert! Exercise 25 involvesresearch on the Internet orother reference materials.
Assignment GuideBasic: 15–19, 21–27, 38, 42–64
Average: 15, 21, 25–34, 38–64
Advanced: 14, 20, 35–56(optional: 57–64)
15.
�2 �1 0 1 2
���
���
��
����
���
�����
3

Study Guide and InterventionStatistics: Displaying and Analyzing Data
NAME ______________________________________________ DATE ____________ PERIOD _____
2-52-5
Less
on
2-5
Create Line Plots and Stem-and-Leaf Plots One way to display data graphicallyis with a line plot. A line plot is a number line labeled with a scale that includes all thedata and �s placed above a data point each time it occurs in the data list. The �s representthe frequency of the data. A stem-and-leaf plot can also be used to organize data. Thegreatest common place value is called the stem, and the numbers in the next greatest placevalue form the leaves.
Draw a line plot for the data.�3 3 4 7 9 10 �2 3
6 4 3 9 �1 �2 4 2
Step 1 The value of the data ranges from�3 to 10, so construct a number linecontaining those points.
Step 2 Then place an � above the numbereach time it occurs.
76543210�1�2�3
� � � � � � � � �� � �
� ��
�
8 9 10
76543210�1�2�3 8 9 10
Use the data below tocreate a stem-and-leaf plot.62 74 89 102 92 65 68 98 78 6578 80 83 93 87 89 104 109 104 68 97 68 64 98 93 90 102 104
The greatest common place value is tens, sothe digits in the tens place are the stems.Thus 62 would have a stem of 6 and 104would have a stem of ten. The stem-and-leafplot is shown below.Stem | Leaf
6 | 2 4 5 5 8 8 87 | 4 8 88 | 0 3 7 9 99 | 0 2 3 3 7 8 8
10 | 2 2 4 4 4 9 62 � 62
Example 1Example 1 Example 2Example 2
ExercisesExercises
Use the table at the right for Exercises 1–3.
1. Make a line plot representing the weights of the wrestlers shown in the table at the right.
2. How many wrestlers weigh over 140 lb? 7
3. What is the greatest weight? 190 lb
Use each set of data to make a stem-and-leaf plot.
4. 32 45 41 29 30 30 31 34 38 5. 102 104 99 109 108 112 115 120 36 32 34 41 40 42 41 29 30 112 114 98 94 96 101 100 102
Stem | Leaf9 | 4 6 8 9
10 | 0 1 2 2 4 8 911 | 2 2 4 512 | 0 9 |4 � 94
Stem | Leaf2 | 9 93 | 0 0 0 1 2 2 4 4 6 84 | 0 1 1 1 2 5 2 |9 � 29
200190180170160150140130120110100
� � � �� �
�
� � �� �
� ��
Weights of Junior Varsity Wrestlers (pounds)
170 160 135 135 160 122 188 154108 135 140 122 103 190 154
Study Guide and Intervention, p. 99 (shown) and p. 100
Use each set of data to make a line plot.
1. 72 47 62 78 49 67 80 2. �2 �1.3 1.5 0.1 �1.7 0.4 1.554 47 72 55 62 47 54 1 �1.3 �2 �2.9 0.1 1.3 1.262 80 47 78 72 46 �2.6 1.2 0.2 �1.3 �2.6
HEALTH For Exercises 3 and 4, use the list that shows the grams of saturated fat in a serving of a variety of grains such as bread, cereal, crackers, and pasta.
3. Make a line plot of the data.
4. Which measure of central tendency best describes the data? Explain. The mode andmedian, both 0.4. The mean is too high because of the value 2.8.
Use each set of data to make a stem-and-leaf plot.
5. 41 53 22 50 41 27 36 57 20 31 6. 4.1 7.3 6.9 5.7 4.8 7.3 5.628 52 41 33 28 27 41 52 22 30 6.0 4.4 7.5 4.6 7.9 5.1 7.7
EMPL0YMENT For Exercises 7–10, use the lists that show survey results ofstudents’ time spent on the Internet and on the telephone for a month.
7. Make a stem-and-leaf plot to compare the data.
8. Which value appears most frequently in each set of data? Internet: 42; telephone: 8
9. Is the mode the best measure to compare the data?Explain. No; it is too high for the Internetand too low for the telephone.
10. Overall, did students spend more time on the Internet or the telephone? telephone
Internet | Stem | Telephone
8 7 6 4 | 0 | 4 8 89 8 4 | 1 |
9 8 2 0 | 2 | 4 6 85 | 3 | 5 6
2 2 | 4 | 0 1 3 81 | 5 | 2 3 8
51 � 51 26 � 26
Internet Telephone
42 19 28 8 35 42 20 18 36 52 40 28 43 24 8 53
51 4 7 29 14 22 6 41 26 48 35 58 8 4
Stem | Leaf
4 | 1 4 6 85 | 1 6 76 | 0 97 | 3 3 5 7 9 77 � 7.7
Stem | Leaf
2 | 0 2 2 7 7 8 83 | 0 1 3 64 | 1 1 1 15 | 0 2 2 3 7 33 � 33
0 0.5 1 1.5 2 2.5 3
���
����
��
� � ����
0.3 1.2 0.1 0.3 0.40.4 0.5 0.1 0.4 0.40.1 1.2 2.8 1.3 1.5
�3 �2.5 �2 �1.5 �1 �0.5 0 0.5 1 1.5
� ��
��
� ���
� ��
� ��
����
45 50 55 60 65 70 75 80
�����
� ���
���
� ����
���
Practice (Average)
Statistics: Displaying and Analyzing Data
NAME ______________________________________________ DATE ____________ PERIOD _____
2-52-5Skills Practice, p. 101 and Practice, p. 102 (shown)
Reading to Learn MathematicsStatistics: Displaying and Analyzing Data
NAME ______________________________________________ DATE ____________ PERIOD _____
2-52-5
Less
on
2-5
Pre-Activity How are line plots and averages used to make decisions?
Read the introduction to Lesson 2-5 at the top of page 88 in your textbook.
• What was the number one name for boys in all five decades? Michael• Look at the decade in which you were born. Is your name or the names of
any of the other students in your class in the top five for that decade?
See students’ work.
Reading the Lesson
1. Use the line plot shown below to answer the questions.
a. What are the data points for the line plot?�6, �5, �4, �3, �2, �1, 0, 1, 2, 3, 4, 5, 6, 7
b. What do the three �’s above the 6 represent?6 occurs in the data set 3 times.
2. Explain what is meant by the frequency of a data number.how many times the data number occurs
3. Use the stem-and-leaf plot shown at the right.
a. How is the number 758 represented on the plot? 758
b. Explain how you know there are 23 numbers in thedata.
There are 23 leaves.
Helping You Remember
4. Describe how you would explain the process of finding the median and mode from astem-and-leaf plot to a friend who missed Lesson 2-5.
Sample answer: To find the median, count the number of leaves, thenfind the number in the middle. To find the mode, identify the leaf thatoccurs most frequently and use the stem and key to identify the datanumber.
Stem | Leaf
72 | 0 1 1 2 573 | 2 2 2 7 9 974 | 1 3 375 | 6 6 8 976 | 0 1 8 8 8 742 � 742
76543210�1�2�3�4�5�6
� � � � � � � � � � � � � �� � � � � � � �
� ��
��
��
Reading to Learn Mathematics, p. 103
Runs Created In The 1978 Bill James Baseball Abstract, the author introduced the “runs created” formula.
R � where for each player h � number of hits
w � number of walks,
t � number of total bases,
b � number of at-bats, and
R � approximate number of runs a team scores due to this player’s actions
1. As of June 29, 2001, Roberto Alomar of the Cleveland Indians and Seattle Marinersplayer Ichiro Suzuki were tied with the highest American League batting average at.351. Find the number of runs created by each player using the data below.
h w t b Runs Created
62
(h + w)t�(b + w)
Enrichment
NAME ______________________________________________ DATE ____________ PERIOD _____
2-52-5Enrichment, p. 104
Lesson 2-5 Statistics: Displaying and Analyzing Data 93
C02-045CInfographic to come
OLYMPICS For Exercises 28–31, use the information in the table that shows thenumber of medals won by the top ten countries during the 2000 SummerOlympics in Sydney, Australia.
28. Make a line plot showing the number of gold medals won by the countries. See pp. 117A–117B.
29. How many countries won fewer than 25 gold medals? 730. What was the median number of gold medals won by a country? 13.531. Is the median the best measure to describe this set of data? Explain.
Sample answer: Yes; most of the data are near the median.CARS For Exercises 32–34, use the list of the fuel economy of various vehicles inmiles per gallon.
Source: United States Environmental Protection Agency
32. Make a stem-and-leaf plot of the data. See pp. 117A–117B.33. How many of the vehicles get more than 25 miles per gallon? 2234. Which measure of central tendency would you use to describe the fuel economy
of the vehicles? Explain your reasoning. Sample answer: Mean; the median istoo high, and the modes are either too high or too low.
EDUCATION For Exercises 35–37, use the table that shows the top ten publiclibraries in the United States by population served.
35. Make a stem-and-leaf plot to show the number of library branches. See pp. 117A–36. Which interval has the most values? 30–3937. What is the mode of the data? no mode
38. CRITICAL THINKING Construct a set of twelve numbers with a mean of 7, a median of 6, and a mode of 8. Sample answer: 4, 4, 4, 5, 5, 5, 7, 8, 8, 8, 8, 18
Top Libraries
8430855262
5934773767
25 28 29 30 24 28 29 31 34 30
33 47 34 43 33 36 37 29 30 30
29 26 29 22 23 19 18 20 23 21
20 20 19 16 18 21 20 19 28 20
Sydney Olympics Total Medals by Country
United StatesRussiaChinaAustraliaGermanyFranceItalyCubaBritainKorea
Country Total97885958563835292828
Source: www.espn.com
Gold403228161313141111
8
Silver242816251714
8111010
Bronze33281517261113
77
10
EducationIn 1848, the Boston PublicLibrary became the firstpublic library to allowusers to borrow books and materials.
Source: The Boston Public Library
117B.
www.algebra1.com/self_check_quiz
Lesson 2-5 Statistics: Displaying and Analyzing Data 93
ELL

Open-Ended AssessmentSpeaking Draw several lineplots and stem-and-leaf plots onthe chalkboard. Make sure thatsome of your plots have skeweddata. Ask students to commenton how they think the data inthe plots will affect the measuresof central tendency.
Getting Ready for Lesson 2-6PREREQUISITE SKILL Studentswill learn about simple proba-bility and odds in Lesson 2-6.Probability and odds are oftenexpressed as fractions in simplestform. Use Exercises 57–64 todetermine your students’ famil-iarity with simplifying fractions.
Teaching Tip You may want toteach box-and-whisker plots afterthis lesson. These can be found inLesson 13-5.
Answer
42. Sample answer: They can be usedin marketing or sales to sell themost products to a specific group.Answers should include thefollowing.• a line plot showing the number
of males with the names fromthe beginning of the lesson
• By finding out the most popularnames you can use the popularnames on more of your items.
Maintain Your SkillsMaintain Your Skills
SALARIES For Exercises 39–41, refer to the bar graph that shows the median income ofmales and females based on education levels.39. What are the differences between men’s and
women’s salaries at each level of education?
40. What do these graphs say about the differencebetween salaries and education levels?
41. Why do you think that salaries are usuallyrepresented by the median rather than themean?
42. Answer the question thatwas posed at the beginning of the lesson.
How are line plots and averages used tomake decisions? See margin.Include the following in your answer:
• a line plot to show how many male students in your class have the mostpopular names for the decade in which they were born, and
• a convincing argument that explains how you would use this information tosell personalized T-shirts.
For Exercises 43 and 44, refer to the line plot.43. What is the average wingspan
for these types of butterflies? C7.6 in. 7.9 in.
8.2 in. 9.1 in.
44. Which sentence is not true? CThe difference between the greatest and least wingspan is 3.5 inches.
Most of the wingspans are in the 7.5 inch to 8.5 inch interval.
Most of the wingspans are greater than 8 inches.
The mode of the data is 7.5 inches.D
C
B
A
DC
BA
� ���
���
� �
�
87.57 10.5 11109.598.5
Wingspan (in.) of Ten Largest Butterflies
WRITING IN MATH
MaleFemale
Source: USA TODAY
Education(25 or older)
Doctoral degree$81,687
$60,079
Bachelor’ s degree$60,201
$41,747
Some college$39,221
$27,757
High school graduate$33,184
$23,061
94 Chapter 2 Real Numbers
39. High school:$10,123; College: $11,464; Bachelor’sDegree: $18,454;Doctoral Degree:$21,60840. Sample answer:The higher the education, the higherthe income.41. Sample answer:Because the range insalaries is often verygreat with extremevalues on both thehigh end and low end.
Mixed Review
Getting Ready forthe Next Lesson
Find each quotient. (Lesson 2-4)
45. 56 � (�14) �4 46. �72 � (�12) 6 47. �40.5 � 3 �13.5 48. 102 � 6.8 15
Simplify each expression. (Lesson 2-3)
49. �2(6x) � 5x �17x 50. 3x(�7y) � 4x(5y) �41xy 51. 5(3t � 2t) � 2(4t) �3t
52. Write an algebraic expression to represent the amount of money in Kara’ssavings account if she has d dollars and adds x dollars per week for 12 weeks.(Lesson 1-1) d � 12x
Evaluate each expression if x � 5, y � 16, and z � 9. (Lesson 1-2)
53. y � 3x 1 54. xz � 3 15 55. 2x � x � (y � 4) 9 56. �x2
2�y
z� �
12
�
PREREQUISITE SKILL Write each fraction in simplest form.(To review simplifying fractions, see pages 798 and 799.)
57. �1128� �
23
� 58. �5640� �
190� 59. �
2310� �
170� 60. �
44
28� �
78
�
61. �3624� �
12
� 62. �2582� �
173� 63. �
1366� �
49
� 64. �89
40� �
11
45�
StandardizedTest Practice
94 Chapter 2 Real Numbers
4 Assess4 Assess

ReadingMathematics
Getting StartedGetting Started
TeachTeach
AssessAssess
Study NotebookStudy Notebook
Reading Mathematics Interpreting Statistics 95
The word statistics is associated with the collection, analysis, interpretation, andpresentation of numerical data. Sometimes, when presenting data, notes and unit indicators are included to help you interpret the data.
Suppose you need to find the number of students enrolled in the 9th grade in 1997.The following steps can be used to determine this information.
Step 1 Locate the number in the table. The number that corresponds to 1997 and9th grade is 3819.
Step 2 Determine the unit indicator. The unit indicator is thousands.
Step 3 If the unit indicator is not 1 unit, multiply to find the data value. In thiscase, multiply 3819 by 1000.
Step 4 State the data value. The number of students enrolled in the 9th grade in1997 was 3,819,000.
Reading to Learn Use the information in the table to answer each question. 1–2. See margin.1. Describe the data.
2. What information is given by the footnote?
3. How current is the data? 19994. What is the unit indicator? thousands5. How many acres of state parks and recreation areas
does New York have? 1,016,000 acres6. Which of the states shown had the greatest number of
visitors? How many people visited that state’s parksand recreation areas in 1999?California; 76,736,000 visitors
Interpreting Statistics
Public Elementary and Secondary School Enrollment, 1994–1998[(in thousands) 44,111 represents 44,111,000.]As of fall year, Kindergarten includes nursery schools.
Grade 1994 1995 1996 1997 1998, prel.
Pupils enrolled . . . . . . . . . . . . . 44,111 44,840 45,611 46,127 46,535
Kindergarten and grades 1 to 8 . 31,898 32,341 32,764 33,073 33,344Kindergarten . . . . . . . . . . . . . . 4047 4173 4202 4198 4171First . . . . . . . . . . . . . . . . . . . . . 3593 3671 3770 3755 3727Second . . . . . . . . . . . . . . . . . . 3440 3507 3600 3689 3682Third . . . . . . . . . . . . . . . . . . . . 3439 3445 3524 3597 3696Fourth . . . . . . . . . . . . . . . . . . . 3426 3431 3454 3507 3592Fifth . . . . . . . . . . . . . . . . . . . . . 3372 3438 3453 3458 3520Sixth . . . . . . . . . . . . . . . . . . . . 3381 3395 3494 3492 3497Seventh . . . . . . . . . . . . . . . . . 3404 3422 3464 3520 3530Eighth . . . . . . . . . . . . . . . . . . . 3302 3356 3403 3415 3480Unclassified1 . . . . . . . . . . . . . . 494 502 401 442 460
Grades 9 to 12 . . . . . . . . . . . . . . 12,213 12,500 12,847 13,054 13,191Ninth . . . . . . . . . . . . . . . . . . . . 3604 3704 3801 3819 3856Tenth . . . . . . . . . . . . . . . . . . . . 3131 3237 3323 3376 3382Eleventh . . . . . . . . . . . . . . . . . 2748 2826 2930 2972 3018Twelfth . . . . . . . . . . . . . . . . . . 2488 2487 2586 2673 2724Unclassified1 . . . . . . . . . . . . . 242 245 206 214 211
1 Includes ungraded and special education.
Source: U.S. Census Bureau
Headnotes giveinformationabout the tableas a whole.
Footnotes giveinformationabout specificitems within thetable.
If the numericaldata are too large,unit indicators areused to savespace.
State Parks and Recreation Areas for Selected States, 1999
StateAcreage Visitors
(1000) (1000)1
United States 12,916 766,842
Alaska 3291 3855
California 1376 76,736
Florida 513 14,645
Indiana 178 18,652
New York 1016 61,960
North Carolina 158 13,269
Oregon 94 38,752
South Carolina 82 9563
Texas 628 21,446
Source: U.S. Census Bureau 1 Includes overnight visitors.
Sources referencethe origin of thedata. Today, a lotof data is foundon the Internet.
Reading Mathematics Interpreting Statistics 95
Answers
1. Sample answer: The data show theacreage and number of visitors inthousands for selected state parks andrecreation areas in 1999.
2. Sample answer: The footnote indicatesthat the number of visitors includesthose staying overnight.
English LanguageLearners may benefit fromwriting key concepts from thisactivity in their Study Notebooksin their native language and thenin English.
ELL
Ask students if they have everused abbreviations when writing.What are some of the abbrevi-ations that students use often?Why do they use them? How dothey indicate to others what theabbreviations mean? How do theylearn the meaning of abbrevi-ations when they read them?
Reading Graphs Many peoplemake important decisions in theirlives based on how they analyzethe statistics involved. In order toproperly analyze statistics, youhave to understand what thestatistics mean. This is especiallytrue when statistics are presentedin graphical or tabular form.
Make sure students understandwhy unit indicators are used. Aswell as saving space, they alsoclarify a table. On the board,rewrite some of the data withoutthe unit indicator so students cansee how all the extra zeroes makethe table more difficult to read.
Ask students to summarize whatthey have learned about interpretingstatistics.

5-Minute CheckTransparency 2-6 Use as a
quiz or a review of Lesson 2-5.
Mathematical Background notesare available for this lesson on p. 66D.
is probability importantin sports?
Ask students:
• Who is more likely to make afree throw, a player who makes75% of her shots, or one whomakes 50% of her shots? theone who makes 75%
• If you are a coach, which playerwould you rather have makinga potentially game-tying shot?the player with the higher freethrow average
• Why do you think probabilityis important in sports?Probability can help a coach decidewhich player or players to usewhen making a shot is important.
Vocabulary• probability
• simple event
• sample space
• equally likely
• odds
Probability: Simple Probabilityand Odds
96 Chapter 2 Real Numbers
Reading MathP(a) is read the
probability of a.
Study Tip
A basketball player is at the free throw line. Her team is down by one point. If she makes an average of 75%of her free throws, what is the probability that she willtie the game with her first shot?
Probability
• Find the probability of a simple event.
• Find the odds of a simple event.
PROBABILITY One way to describe the likelihood of an event occurring is withprobability. The of a , like a coin landing heads up when itis tossed, is a ratio of the number of favorable outcomes for the event to the totalnumber of possible outcomes of the event. The probability of an event can beexpressed as a fraction, a decimal, or a percent.
Suppose you wanted to find the probability of rolling a 4 on a die. When you roll a die, there are six possible outcomes, 1, 2, 3, 4, 5, or 6. This list of all possibleoutcomes is called the . Of these outcomes, only one, a 4, is favorable.
So, the probability of rolling a 4 is �16
�, 0.16�, or about 16.7%.
sample space
simple eventprobability
Find Probabilities of Simple Eventsa. Find the probability of rolling an even number on a die.
There are six possible outcomes. Three of the outcomes are favorable. That is, three of the six outcomes are even numbers.
3 even numbers
Sample space: 1, 2, 3, 4, 5, 6 �36
�
6 total possible outcomes
So, P(even number) � �36
� or �12
�.
b. A bowl contains 5 red chips, 7 blue chips, 6 yellow chips, and 10 green chips. One chip is randomly drawn. Find P(blue).There are 7 blue chips and 28 total chips.
P(blue chip) � �278�
� �14
� or 0.25 Simplify.
The probability of selecting a blue chip is �14
� or 25%.
← number of favorable outcomes← number of possible outcomes
Example 1Example 1
is probability important in sports?is probability important in sports?
The probability of an event a can be expressed as
P(a) � .number of favorable outcomes�����total number of possible outcomes
←
LessonNotes
1 Focus1 Focus
Chapter 2 Resource Masters• Study Guide and Intervention, pp. 105–106• Skills Practice, p. 107• Practice, p. 108• Reading to Learn Mathematics, p. 109• Enrichment, p. 110• Assessment, p. 132
Parent and Student Study GuideWorkbook, p. 16
Prerequisite Skills Workbook, pp. 17–18, 37–38, 67–70, 99–100
5-Minute Check Transparency 2-6Answer Key Transparencies
TechnologyInteractive Chalkboard
Workbook and Reproducible Masters
Resource ManagerResource Manager
Transparencies

PROBABILITY
Lesson 2-6 Probability: Simple Probability and Odds 97
Reading MathInclusive means that the
end values are included.
Study Tip
OddsOdds are usually written
in the form number of
successes : number of
failures.
Study Tip
c. A bowl contains 5 red chips, 7 blue chips, 6 yellow chips, and 10 green chips.One chip is randomly drawn. Find P(red or yellow).There are 5 ways to pick a red chip and 6 ways to pick a yellow chip. So thereare 5 � 6 or 11 ways to pick a red or a yellow chip.
P(red or yellow) � �2181�
� 0.39 Divide.
The probability of selecting a red chip or a yellow chip is �2181� or about 39%.
d. A bowl contains 5 red chips, 7 blue chips, 6 yellow chips, and 10 green chips.One chip is randomly drawn. Find P(not green).There are 5 � 7 � 6 or 18 chips that are not green.
P(not green) � �1288�
� 0.64 Divide.
The probability of selecting a chip that is not green is �194� or about 64%.
← number of favorable outcomes← number of possible outcomes
← number of favorable outcomes← number of possible outcomes
OddsThe odds of an event occurring is the ratio that compares the number of ways anevent can occur (successes) to the number of ways it cannot occur (failures).
Notice that the probability that an event will occur is somewhere between 0 and 1inclusive. If the probability of an event is 0, that means that it is impossible for theevent to occur. A probability equal to 1 means that the event is certain to occur.
When there are n outcomes and the probability of each one is �n1�, we say that the
outcomes are . For example, when you roll a die, the 6 possible
outcomes are equally likely because each outcome has a probability of �16
�.
ODDS Another way to express the chance of an event occurring is with .odds
0 116
impossibleto occur
equally likelyto occur
certain tooccur
equally likely
Odds of an EventFind the odds of rolling a number less than 3.There are 6 possible outcomes, 2 are successes and 4 are failures.
2 numbers less than 3
Sample space: 1, 2, 3, 4, 5, 6 �24
� or �12
�
4 numbers not less than 3
So, the odds of rolling a number less than three are �12
� or 1:2.
Example 2Example 2
←
www.algebra1.com/extra_examples
Lesson 2-6 Probability: Simple Probability and Odds 97
2 Teach2 Teach
Some studentsconfuse thenumbers on adie with theprobability of
rolling a particular number.Once they see that the proba-
bility of rolling 6 is , they are
more likely to think, forexample, that the probability
of rolling 5 is . Consider
using dice with symbols onthe sides rather than numbersto teach probability.
1�5
1�6
New
11
In-Class ExampleIn-Class Example
a. Find the probability ofrolling a number greater than two on a die. or
b. A class contains 6 studentswith black hair, 8 withbrown hair, 4 with blondehair, and 2 with red hair. Find P(black). or 0.3
c. A class contains 6 studentswith black hair, 8 withbrown hair, 4 with blondehair, and 2 with red hair.Find P(red or brown).
or 0.5
d. A class contains 6 studentswith black hair, 8 withbrown hair, 4 with blondehair, and 2 with red hair.Find P(not blonde).
or 0.84�5
1�2
3�10
2�3
4�6
Odds and Probability Odds and probability are very often confusedand the terms are mistakenly used interchangeably in the media. Onecharacteristic to remember is that a probability will never be greater thanone but odds can be greater than one. Remind students to readproblems and label their answers very carefully when working with oddsand probability.
Unlocking Misconceptions
PowerPoint®

33
44
22
In-Class ExamplesIn-Class ExamplesODDS
Teaching Tip To point out thedifference between probabilityand odds, lead students tounderstand why the probabilityof rolling a number less than
three is , while the odds of
rolling a number less than three
is .
Find the odds of rolling anumber greater than two.
or 2:1
A card is selected at randomfrom a standard deck of 52 cards. What are the oddsagainst selecting a 2 or a 3?
TRAVEL Melvin is waiting toboard a flight to Washington,D.C. According to the airline,the flight he is waiting for ison time 80% of the times itflies. What are the odds thatthe plane will be on time? 4:1
Answer
1. Sample answers: impossible event:a number greater than 6; certainevent: a number from 1 to 6;equally likely event: even number
11�2
2�1
1�2
1�3
98 Chapter 2 Real Numbers
Application
1. OPEN ENDED Give an example of an impossible event, a certain event, and anequally likely event when a die is rolled. See margin.
2. Describe how to find the odds of an event occurring if the probability that the
event will occur is �35
�.
3. FIND THE ERROR Mark and Doug are finding the probability of picking a redcard from a standard deck of cards.
Who is correct? Explain your reasoning. Doug; Mark determined the odds infavor of picking a red card.
A card is selected at random from a standard deck of cards. Determine eachprobability.4. P(5) �
113� 5. P(red 10) �
216�
6. P(odd number) �143� 7. P(queen of hearts or jack of diamonds)
Find the odds of each outcome if the spinner is spun once.8. multiple of 3 3:79. even number less than 8 3:7
10. odd number or blue 7:311. red or yellow 6:4
NUMBER THEORY One of the factors of 48 is chosen at random.12. What is the probability that the chosen factor is not a multiple of 4? �
25
�
13. What is the probability that the number chosen has 4 and 6 as two of its factors?
�130�
910 1 2
3
4567
8
Odds Against an EventA card is selected at random from a standard deck of 52 cards. What are theodds against selecting a 3?There are four 3s in a deck of cards, and there are 52 � 4 or 48 cards that are not a 3.
odds against a 3 � �448�
The odds against selecting a 3 from a deck of cards are 12:1.
← number of ways to not pick a 3
Probability and OddsWEATHER A weather forecast states that the probability of rain the next day is40%. What are the odds that it will rain?The probability that it will rain is 40%, so the probability that it will not rain is 60%.
odds of rain � 40:60 or 2:3
The odds that it will rain tomorrow are 2:3.
Example 3Example 3
Example 4Example 4
In this text, a standard
deck of cards always
indicates 52 cards
in 4 suits of 13 cards each.
Study Tip
GUIDED PRACTICE KEYExercises Examples
4–7, 112, 138–11 2, 3
Concept Check
2. The probability is �35
�,which means there are3 favorable outcomesand 5 � 3 or 2 unfavorable outcomes.Thus, the odds are3:2.
Guided Practice
The odds against an event occurring are the odds that the event will not occur.
Doug
P(red card) = �2
5
6
2� or �
2
1�
Mark
P(red card) = �2
2
6
6� or �
1
1�
�216�
98 Chapter 2 Real Numbers
Interpersonal Give groups of students marbles or colored cubes. Askthem to model probabilities and then odds. Have students take turns inthe group modeling probabilities and odds until all group membersunderstand both concepts and the difference between them.
Differentiated Instruction
PowerPoint®

Practice and ApplyPractice and Apply
Lesson 2-6 Probability: Simple Probability and Odds 99
One coin is randomly selected from a jar containing 70 nickels, 100 dimes, 80 quarters, and 50 1-dollar coins. Find each probability.14. P(quarter) �
145� ≈ 27% 15. P(dime) �
13
� ≈ 33%16. P(nickel or dollar) �
25
� � 40% 17. P(quarter or nickel) �12
� � 50%18. P(value less than $1.00) �
56
� ≈ 83% 19. P(value greater than $0.10) �13
30� ≈ 43%
20. P(value at least $0.25) �1330� ≈ 43% 21. P(value at most $1.00) 1 � 100%
Two dice are rolled, and their sum is recorded. Find each probability.22. P(sum less than 7) �
152� ≈ 42% 23. P(sum less than 8) �
172� ≈ 58%
24. P(sum is greater than 12) 0 � 0% 25. P(sum is greater than 1) 1 � 100%26. P(sum is between 5 and 10) �
59
� ≈ 56% 27. P(sum is between 2 and 9) �23
56� ≈ 69%
One of the polygons is chosen at random. Find each probability.
28. P(triangle) �12
� � 50% 29. P(pentagon) �16
� ≈ 17%30. P(not a triangle) �
12
� � 50% 31. P(not a quadrilateral) �23
� ≈ 67%32. P(more than three sides) �
12
� � 50% 33. P(more than one right angle) �12
� � 50%
34. If a person’s birthday is in April, what is the probability that it is the 29th?
35. If a person’s birthday is in July, what is the probability that it is after the 16th?
�1351� ≈ 48%
Find the odds of each outcome if a computer randomly picks a letter in the nameThe United States of America.
36. the letter a 3:21 or 1:7 37. the letter t 4:20 or 1:538. a vowel 11:13 39. a consonant 13:1140. an uppercase letter 4:20 or 1:5 41. a lowercase vowel 9:15 or 3:5
STAMP COLLECTING Lanette collects stamps from different countries. She has 12 from Mexico, 5 from Canada, 3 from France, 8 from Great Britain, 1 from Russia, and 3 from Germany. Find the odds of each of the following if she accidentally loses one stamp.42. the stamp is from Canada 5:2743. the stamp is from Mexico 12:20 or 3:544. the stamp is not from France 29:345. the stamp is not from a North American country 15:1746. the stamp is from Germany or Russia 4:28 or 1:747. the stamp is from Canada or Great Britain 13:19
48. If the probability that an event will occur is �37
�, what are the odds that it will occur? 3:4
49. If the probability that an event will occur is �23
�, what are the odds against it occurring? 1:2
Stamp Collecting Stamp collecting can be avery inexpensive hobby.Most stamp collectors startby saving stamps fromletters, packages, andpostcards.
Source: United States Postal
Service
34. �310� ≈ 3%
Extra Practice See page 824.
Extra Practice See page 824.
For SeeExercises Examples
14–35, 51, 154, 56
36–47, 2, 352, 53, 55
48, 49 4
www.algebra1.com/self_check_quiz
Lesson 2-6 Probability: Simple Probability and Odds 99
3 Practice/Apply3 Practice/Apply
Study NotebookStudy NotebookHave students—• add the definitions/examples of
the vocabulary terms to theirVocabulary Builder worksheets forChapter 2.
• add a description comparing andcontrasting probability and odds.
• include any other item(s) that theyfind helpful in mastering the skillsin this lesson.
FIND THE ERRORTo solve this
problem, studentsmust be able to differentiatebetween probability and odds.Remind students that forprobability to equal 1, or 100%,the event must always occur. Areall the cards in a standard deck ofcards red?
About the Exercises…Organization by Objective• Probability: 14–35, 51, 54,
57• Odds: 36–50, 52, 53, 55, 56,
58
Odd/Even AssignmentsExercises 14–49 are structuredso that students practice thesame concepts whether theyare assigned odd or evenproblems.
Assignment GuideBasic: 15–49 odd, 51–53, 59–82
Average: 15–49 odd, 51–56,59–82
Advanced: 14–50 even, 54–74(optional: 75–82)
All: Practice Quiz 2 (1–10)
Shawntay Moore Jupiter Community H.S., Jupiter, FL
“I have my students count the number of jelly beans in a package or cup andthen find the probability and odds of choosing a specific color. I also havestudents collect the data and represent their findings through charts andgraphs."
Teacher to TeacherTeacher to Teacher

Study Guide and InterventionProbability: Simple Probability and Odds
NAME ______________________________________________ DATE ____________ PERIOD _____
2-62-6
Less
on
2-6
Probability The probability of a simple event is a ratio that tells how likely it is thatthe event will take place. It is the ratio of the number of favorable outcomes of the event tothe number of possible outcomes of the event. You can express the probability either as afraction, as a decimal, or as a percent.
Probability of a Simple Event For an event a, P(a) � .number of favorable outcomes����number of possible outcomes
Mr. Babcock chooses 5 out of 25 students in his algebra classat random for a special project. What isthe probability of being chosen?
P(being chosen) �
The probability of being chosen is or .1�5
5�25
number of students chosen����total number of students
A bowl contains 3 pears,4 bananas, and 2 apples. If you take apiece of fruit at random, what is theprobability that it is not a banana?
There are 3 � 4 � 2 or 9 pieces of fruit.There are 3 � 2 or 5 pieces of fruit that arenot bananas.
P(not banana) �
�
The probability of not choosing a banana is .5�9
5�9
number of other pieces of fruit����total number of pieces of fruit
Example 1Example 1 Example 2Example 2
ExercisesExercises
A card is selected at random from a standard deck of 52 cards. Determine eachprobability.
1. P(10) 2. P(red 2) 3. P(king or queen)
4. P(black card) 5. P(ace of spades) 6. P(spade)
Two dice are rolled and their sum is recorded. Find each probability.
7. P(sum is 1) 0 8. P(sum is 6) 9. P(sum is less than 4)
10. P(sum is greater than 11) 11. P(sum is less than 15) 12. P(sum is greater than 8)
1
A bowl contains 4 red chips, 3 blue chips, and 8 green chips. You choose one chipat random. Find each probability.
13. P(not a red chip) 14. P(red or blue chip) 15. P(not a green chip)
A number is selected at random from the list {1, 2, 3, …, 10}. Find each probability.
16. P(even number) 17. P(multiple of 3) 18. P(less than 4)
19. A computer randomly chooses a letter from the word COMPUTER. Find the probabilitythat the letter is a vowel. 3
�8
3�10
3�10
1�2
7�15
7�15
11�15
5�18
1�36
1�12
5�36
1�4
1�52
1�2
2�13
1�26
1�13
Study Guide and Intervention, p. 105 (shown) and p. 106
One chip is randomly selected from a jar containing 13 blue chips, 8 yellow chips,15 brown chips, and 6 green chips. Find each probability.
1. P(brown) � 36% 2. P(green) � 14%
3. P(blue or yellow) � 50% 4. P(not yellow) � 81%
A card is selected at random from a standard deck of 52 cards. Find eachprobability.
5. P(heart) � 25% 6. P(black card) � 50%
7. P(jack) � 8% 8. P(red jack) � 4%
Two dice are rolled and their sum is recorded. Find each probability.
9. P(sum less than 6) � 28% 10. P(sum less than 2) 0 � 0%
11. P(sum greater than 10) � 8% 12. P(sum greater than 9) � 17%
Find the odds of each outcome if a computer randomly picks a letter in the nameThe Badlands of North Dakota.
13. the letter d 3 : 21 or 1 : 7 14. the letter a 4 : 20 or 1 : 5
15. the letter h 2 : 22 or 1 :11 16. a consonant 16 : 8 or 2 :1
CLASS PROJECTS For Exercises 17–20, use the following information.
Students in a biology class can choose a semester project from the following list: animalbehavior (4), cellular processes (2), ecology (6), health (7), and physiology (3). Find each ofthe odds if a student selects a topic at random.
17. the topic is ecology 6 :16 or 3 : 8
18. the topic is animal behavior 4 :18 or 2 : 9
19. the topic is not cellular processes 20 : 2 or 10 : 1
20. the topic is not health 15 : 7
SCHOOL ISSUES For Exercises 21 and 22, use the following information.
A news team surveyed students in grades 9–12 on whether to change the time school begins. One student will be selected atrandom to be interviewed on the evening news. The table gives the results.
21. What is the probability the student selected will be in the
9th grade? � 32%
22. What are the odds the student selected wants no change? 16:34 or 8: 17
8�25
Grade 9 10 11 12
No change 6 2 5 3
Hour later 10 7 9 8
1�6
1�12
5�18
1�26
1�13
1�2
1�4
17�21
1�2
1�7
5�14
Practice (Average)
Probability: Simple Probability and Odds
NAME ______________________________________________ DATE ____________ PERIOD _____
2-62-6Skills Practice, p. 107 and Practice, p. 108 (shown)
Reading to Learn MathematicsProbability: Simple Probability and Odds
NAME ______________________________________________ DATE ____________ PERIOD _____
2-62-6
Pre-Activity Why is probability important in sports?
Read the introduction to Lesson 2-6 at the top of page 96 in your textbook.
Look up the definition of the word probability in a dictionary. Rewrite thedefinition in your own words.
Sample answer: the likelihood of something happening
Reading the Lesson
1. Write whether each statement is true or false. If false, replace the underlined word ornumber to make a true statement.
a. Probability can be written as a fraction, a decimal, or a percent. true
b. The sample space of flipping one coin is heads or tails. true
c. The probability of an impossible event is 1. false; 0
d. The odds against an event occurring are the odds that the event will occur.false; will not
2. Explain why the probability of an event cannot be greater than 1 while the odds of anevent can be greater than 1.
Sample answer: To find the probability of an event, you compare a part ofthe sample space to the whole sample space. When you find the odds ofan event, you compare the number of favorable outcomes to the numberof unfavorable outcomes. In some situations, there may be morefavorable than unfavorable outcomes.
Helping You Remember
3. Probabilities are usually written as fractions, decimals, or percents. Odds are usuallywritten with a colon (for example, 1:3). How can the spelling of the word colon helpremember this?
Sample answer: The word colon has the letter “o” as its only vowel, andthe word odds also has the letter “o” as its only vowel.
Reading to Learn Mathematics, p. 109
Geometric ProbabilityIf a dart, thrown at random, hits the triangular board shown at the right, what is the probability that it will hit the shaded region? Thiscan be determined by comparing the area of the shaded region to thearea of the entire board. This ratio indicates what fraction of the tosses should hit in the shaded region.
�
� or
In general, if S is a subregion of some region R, then the probability, P(S), that a point,chosen at random, belongs to subregion S is given by the following:
P(S) �
Find the probability that a point chosen at random belongs to the shaded
area of subregion S���area or region R
1�2
12�24
�12
�(4)(6)��12
�(8)(6)
area of shaded region���area of triangular board
6
44
Enrichment
NAME ______________________________________________ DATE ____________ PERIOD _____
2-62-6Enrichment, p. 110
100 Chapter 2 Real Numbers
You can use real-world
data to find the
probability that a person
will live to be 100. Visit
www.algebra1.com/webquest to continue
work on your WebQuest
project.
50. CONTESTS Every Tuesday, Mike’s Submarine Shop has a business carddrawing for a free lunch. Four coworkers from InvoAccounting put theirbusiness cards in the bowl for the drawing. If there are 80 cards in the bowl,what are the odds that one of the coworkers will win a free lunch? 1:19
GAMES For Exercises 51–53, use the following information.A game piece is randomly placed on the board shown at the right by blindfoldedplayers.
51. What is the probability that a game piece is placed on a shaded region? �1
490� � 47.5%
52. What are the odds against placing a game piece on a shaded region? 21:19
53. What are the odds that a game piece will be placed within the green rectangle?7:13
BASEBALL For Exercises 54–56, use the following information.The stem-and-leaf plot shows the number of home runs hit by the top major league baseball players in the 2000 season. Source: www.espn.com
Stem Leaf3 0 0 0 0 1 1 1 1 1 1 1 2 2 2 3
3 4 4 4 5 5 5 6 6 6 7 7 8 8 9
4 0 1 1 1 1 2 2 3 3 3 4 4 7 7 9
5 0 30 � 30
54. What is the probability that one of these players picked at random hit more than 35 home runs? �1
223� ≈ 52%
55. What are the odds that a randomly selected player hit fewer than 45 home runs? 42:4 or 21:2
56. If a player batted 439 times and hit 38 home runs, what is the probability that the next time the player bats he will hit a home run? �
43389
� ≈ 9%
CONTESTS For Exercises 57 and 58, use the following information.A fast-food restaurant is holding a contest in which the grand prize is a new sports car. Each customer is given a game card with their order. The contest rules state that the odds of winning the grand prize are 1:1,000,000.
57. For any randomly-selected game card, what is the probability that it is thewinning game card for the grand prize? �
1,0010,001�
58. Do your odds of winning the grand prize increase significantly if you haveseveral game cards? Explain. See margin.
59. CRITICAL THINKING Three coins are tossed, and a tail appears on at least one of them. What is the probability that at least one head appears? �6
7� ≈ 86%
60. Answer the question that was posed at the beginning of the lesson. See pp. 117A–117B.
Why is probability important in sports?Include the following in your answer:
• examples of two sports in which probability is used and an explanation of each sport’s importance, and
• examples of methods other than probability used to show chance.
WRITING IN MATH
40 cm
100 cm
25 cm
35 cm
25 cm
100 Chapter 2 Real Numbers
ELL

Open-Ended AssessmentWriting Have students write ashort essay comparing andcontrasting probability and odds.Have students use examples intheir comparisons.
Getting Ready for Lesson 2-7PREREQUISITE SKILL Studentswill learn about square roots andreal numbers in Lesson 2-7.Finding square roots is theopposite of squaring a number.Use Exercises 75–82 to determineyour students’ familiarity withsquaring rational numbers.
Assessment OptionsPractice Quiz 2 The quizprovides students with a briefreview of the concepts and skillsin Lessons 2-4 through 2-6. Lessonnumbers are given to the right ofthe exercises or instruction linesso students can review conceptsnot yet mastered.
Quiz (Lessons 2-5 and 2-6) isavailable on p. 132 of the Chapter 2Resource Masters.
Answers
58. No; even with 100 game cards theodds of winning are only 100:999,901. It would require severalhundred thousand cards tosignificantly increase the odds ofwinning.
63. Stem | Leaf5 | 8.36 | 4.3 5.1 5.5 6.7 7.0
| 8.7 9.37 | 0.0 2.8 3.2 5.8 7.4 7.4
5 |8.3 � 58.3
StandardizedTest Practice
Lesson 2-6 Probability: Simple Probability and Odds 101
Getting Ready forthe Next Lesson
Practice Quiz 2Practice Quiz 2
Find each quotient. (Lesson 2-4)
1. �136 � (�8) 17 2. 15 � ���38
�� �40 3. (�46.8) � 4 �11.7
Simplify each expression. (Lesson 2-4)
4. �3a
3� 9� a � 3 5. �
4x �4
32� x � 8 6. �
15n�
�5
20� �3n � 4
7. State the scale you would use to make a line plot for the following data. Then draw the line plot. (Lesson 2-5) See margin.1.9 1.1 3.2 5.0 4.3 2.7 2.5 1.1 1.4 1.8 1.8 1.6
4.3 2.9 1.4 1.7 3.6 2.9 1.9 0.4 1.3 0.9 0.7 1.9
Determine each probability if two dice are rolled. (Lesson 2-6)
8. P(sum of 10) �112� 9. P(sum 6) �
1138� 10. P(sum � 10) �
56
�
Lessons 2-4 through 2-6
Maintain Your SkillsMaintain Your Skills
63. WEATHER The following data represents the average daily temperature inFahrenheit for Sacramento, California, for two weeks during the month of May.Organize the data using a stem-and-leaf plot. (Lesson 2-5) See margin.58.3 64.3 66.7 65.1 68.7 67.0 69.3
70.0 72.8 77.4 77.4 73.2 75.8 65.5
Evaluate each expression if a � ��13
�, b � �25
�, and c � �12
�. (Lesson 2-4)
64. b � c �45
� 65. 2a � b ��53
� or �1�23
� 66. �acb� ��
145�
Find each sum. (Lesson 2-2)
67. 4.3 � (�8.2)�3.9 68. �12.2 � 7.8 �4.4 69. ��14
� � ���38
�� ��58
� 70. �172� � ���
56
�� ��14
�
Find each absolute value. (Lesson 2-1)
71. 4.25 4.25 72. �8.4 8.4 73. ��23
� �23
� 74. �16
� �16
�
PREREQUISITE SKILL Evaluate each expression.(To review evaluating expressions, see Lesson 1-2.)
75. 62 36 76. 172 289 77. (�8)2 64 78. (�11.5)2 132.25
79. 1.62 2.56 80. ��152��
2�12454
� 81. ���49
��2
�18
61� 82. ���
1165��
2�22
52
65
�
61. If the probability that an event will occur is �1225� , what are the odds that the
event will not occur? B12:13 13:12 13:25 25:12
62. What is the probability that a number chosen at random from the domain {�6, �5, �4, �3, �2, �1, 0, 1, 2, 3, 4, 5, 6, 7, 8} will satisfy the inequality 3x � 2 � 17? D
20% 27% 73% 80%DCBA
DCBA
Mixed Review
Lesson 2-6 Probability: Simple Probability and Odds 101
4 Assess4 Assess
Answer
7. Sample answer: scale 0–5.0
0 1 2 3 4 5
� � � ��
���
���
��
�� � ��
� ���
��

Study NotebookStudy Notebook
AlgebraActivity
Getting StartedGetting Started
TeachTeach
AssessAssess
A Follow-Up of Lesson 2-6
102 Chapter 2 Real Numbers
A Follow-Up of Lesson 2-6
Collect the Data• If a family has one child, you know that the child is either a boy or a girl. You can
make a simple table to show this type of family.
You can see that there are 2 possibilities for a one-child family.
• If a family has two children, the table below shows the possibilities for twochildren, including the order of birth. For example, BG means that a boy is bornfirst and a girl second.
There are 4 possibilities for the two-child family: BB, BG, GB, or GG.
Analyze the Data1. Copy and complete the table that shows the
possibilities for a three-child family.
2. Make your own table to show the possibilities for a four-child family. See pp. 117A–117B.
3. List the total number of possibilities for a one-child, two-child, three-child, and four-child family. How many possibilities do you think there are for a five-child family? a six-child family? Describe the pattern of the numbers you listed.
4. Find the probability that a three-child family has 2 boys and 1 girl. �38
�
5. Find the probability that a four-child family has 2 boys and 2 girls.�166� or �3
8�
Make a Conjecture6. Blaise Pascal was a French mathematician who lived in the 1600s. He is known
for this triangle of numbers, called Pascal’s triangle, although the pattern wasknown by other mathematicians before Pascal’s time.
1 Row 0
1 1 Row 1
1 2 1 Row 2
1 3 3 1 Row 3
1 4 6 4 1 Row 4
Explain how Pascal’s triangle relates to the possibilities for the make-up offamilies. (Hint: The first row indicates that there is 1 way to have 0 children.)
7. Use Pascal’s triangle to find the probability that a four-child family has 1 boy.
Investigating Probability and Pascal’s Triangle
3 boys 2 boys, 1 boy, 3 girls1 girl 2 girls
BBB BBG BGG GGGBGB GBGGBB GGB
2 boys, 0 girls 1 boy, 1 girl 0 boys, 2 girls
BB BG GG
GB
1 boy 1 girl
B G
3. 2, 4, 8, 16; 32; 64;The pattern representspowers of 2.
See margin.use Row 4; �
146� or �1
4�
102 Chapter 2 Real Numbers
Objective Investigate the use ofPascal’s triangle for predictingprobabilities.
Explain to students that this activ-ity is not so much about findingprobability as they learned inLesson 2-6, as it is about countingpossible outcomes. To translatethese outcomes into probabilities,you must read the table carefully.Each column in the table showsthe total number of outcomes forthe given situation. So, to find theprobability that a 2-child familywill have one boy and one girl,look at how many possible out-comes there are in this column: 2.There are four total possibleoutcomes, so the probability is
or .
In Exercise 7, students shouldcorrectly extend the pattern inPascal’s triangle. A given numberin the table is the sum of the twonumbers above and to the leftand right. If a given number hasonly one number above it, thenumber is 1.
You may wish to have studentssummarize this activity and whatthey learned from it.
Answer
6. Sample answer: Each number ineach row shows the number ofways to have boys and girls for agiven number of children.
1�2
2�4
Teaching Algebra withManipulatives• p. 49 (student recording sheet)
Resource ManagerResource Manager
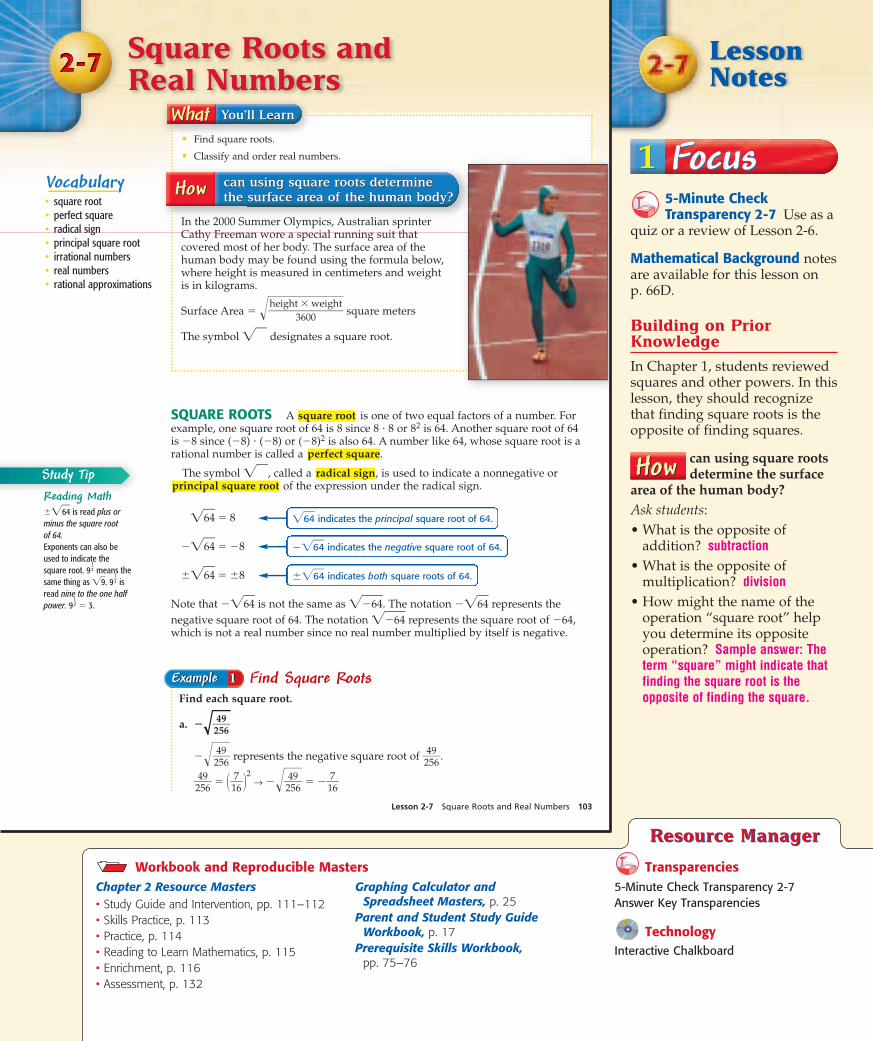
5-Minute CheckTransparency 2-7 Use as a
quiz or a review of Lesson 2-6.
Mathematical Background notesare available for this lesson on p. 66D.
Building on PriorKnowledge
In Chapter 1, students reviewedsquares and other powers. In thislesson, they should recognizethat finding square roots is theopposite of finding squares.
can using square rootsdetermine the surface
area of the human body?Ask students:
• What is the opposite ofaddition? subtraction
• What is the opposite ofmultiplication? division
• How might the name of theoperation “square root” helpyou determine its oppositeoperation? Sample answer: Theterm “square” might indicate thatfinding the square root is theopposite of finding the square.
SQUARE ROOTS A is one of two equal factors of a number. Forexample, one square root of 64 is 8 since 8 � 8 or 82 is 64. Another square root of 64 is �8 since (�8) � (�8) or (�8)2 is also 64. A number like 64, whose square root is arational number is called a .
The symbol �30�, called a , is used to indicate a nonnegative orof the expression under the radical sign.
�64� � 8
��64� � �8
�64� � 8
Note that ��64� is not the same as ��64�. The notation ��64� represents the
negative square root of 64. The notation ��64� represents the square root of �64,which is not a real number since no real number multiplied by itself is negative.
principal square rootradical sign
perfect square
square root
Square Roots and Real Numbers
Lesson 2-7 Square Roots and Real Numbers 103
Vocabulary• square root
• perfect square
• radical sign
• principal square root
• irrational numbers
• real numbers
• rational approximations
can using square roots determine
the surface area of the human body?
can using square roots determine
the surface area of the human body?
Find Square RootsFind each square root.
a. ���24596
�����
24596
� represents the negative square root of �24596
�.
�24596
� � ��176��
2→ ���
24596
� � ��176�
Example 1Example 1
• Find square roots.
• Classify and order real numbers.
In the 2000 Summer Olympics, Australian sprinter Cathy Freeman wore a special running suit that covered most of her body. The surface area of the human body may be found using the formula below, where height is measured in centimeters and weight is in kilograms.
Surface Area � ��height
3
�
600
weight� square meters
The symbol �30� designates a square root.
�64� indicates the principal square root of 64.
�64� indicates both square roots of 64.
��64� indicates the negative square root of 64.
Reading Math �64� is read plus or
minus the square root
of 64.
Exponents can also be
used to indicate the
square root. 9�12
�means the
same thing as �9�. 9�12
�is
read nine to the one half
power. 9�12
�� 3.
Study Tip
Lesson x-x Lesson Title 103
Chapter 2 Resource Masters• Study Guide and Intervention, pp. 111–112• Skills Practice, p. 113• Practice, p. 114• Reading to Learn Mathematics, p. 115• Enrichment, p. 116• Assessment, p. 132
Graphing Calculator and Spreadsheet Masters, p. 25
Parent and Student Study GuideWorkbook, p. 17
Prerequisite Skills Workbook, pp. 75–76
5-Minute Check Transparency 2-7Answer Key Transparencies
TechnologyInteractive Chalkboard
Workbook and Reproducible Masters
Resource ManagerResource Manager
Transparencies
LessonNotes
1 Focus1 Focus

22
In-Class ExampleIn-Class Example
11
In-Class ExampleIn-Class ExampleSQUARE ROOTS
Find each square root.
a. � �
b. �0.0144� 0.12
CLASSIFY AND ORDERNUMBERS
Name the set or sets ofnumbers to which each realnumber belongs.
a. �17�Because 17� � 4.1231056…,which is neither a repeating norterminating decimal, this numberis irrational.
b.
Because 1 and 6 are integers and1 � 6 � 0.1666… is a repeatingdecimal, the number is a rationalnumber.
c. �169�Because 169� � 13, thisnumber is a natural number, awhole number, an integer, and arational number.
d. �327This number is an integer and arational number.
1�6
4�3
16�9
Real Numbers
b. �0.81� �0.81� represents the positive and negative square roots of 0.81.
0.81 � 0.92 and 0.81 � (�0.9)2
�0.81� � 0.9
104 Chapter 2 Real Numbers
Classify Real NumbersName the set or sets of numbers to which each real number belongs.
a. �252�
Because 5 and 22 are integers and 5 � 22 � 0.2272727…, which is a repeatingdecimal, this number is a rational number.
b. 121�Because �121� � 11, this number is a natural number, a whole number, aninteger, and a rational number.
c. 56�Because �56� � 7.48331477…, which is not a repeating or terminating decimal,this number is irrational.
d. ��346�
Because ��346� � �9, this number is an integer and a rational number.
Example 2Example 2
The set of real numbers consists of the set of rational numbers andthe set of irrational numbers. Irrational
NumbersRational Numbers
Real Numbers
Integers
NaturalNumbers
WholeNumbers
CommonMisconceptionPay close attention to the
placement of a negative
sign when working with
square roots. ��121�is undefined for real
numbers since no real
number multiplied by
itself can result in a
negative product.
Study Tip
CLASSIFY AND ORDER NUMBERS Recall that rational numbers arenumbers that can be expressed as terminating or repeating decimals, or in the form
�ba
�, where a and b are integers and b � 0.
As you have seen, the square roots of perfect squares are rational numbers.
However, numbers such as �3� and �24� are the square roots of numbers that arenot perfect squares. Numbers like these cannot be expressed as a terminating orrepeating decimal.
�3� � 1.73205080…
�24� � 4.89897948…
Numbers that cannot be expressed as terminating or repeating decimals, or in
the form �ba
�, where a and b are integers and b � 0, are called .
Irrational numbers and rational numbers together form the set of .real numbersirrational numbers
104 Chapter 2 Real Numbers
2 Teach2 TeachPowerPoint®
PowerPoint®

Lesson 2-7 Square Roots and Real Numbers 105
In Lesson 2-1 you graphed rational numbers on a number line. However, therational numbers alone do not complete the number line. By including irrationalnumbers, the number line is complete. This is illustrated by the
which states that each point on the number line corresponds to exactly one real number.
Recall that inequalities like x � 7 are open sentences. To solve the inequality,determine what replacement values for x make the sentence true. This can be shown by the solution set {all real numbers less than 7}. Not only does this set
include integers like 5 and �2, but it also includes rational numbers like �38
� and
��1123� and irrational numbers like �40� and �.
PropertyCompleteness
Graph Real NumbersGraph each solution set.a. x � �2
The heavy arrow indicates that all numbers to the right of �2 are included inthe graph. The circle at �2 indicates �2 is not included in the graph.
b. a 4.5
The heavy arrow indicates that all points to the left of 4.5 are included in thegraph. The dot at 4.5 indicates that 4.5 is included in the graph.
�5 �3 �2 �1 0 1 2 3 4 5�4 6
�3 �1�2 876543210
Example 3Example 3
To express irrational numbers as decimals, you need to use a rationalapproximation. A of an irrational number is a rationalnumber that is close to, but not equal to, the value of the irrational number. For
example, a rational approximation of �2� is 1.41 when rounded to the nearesthundredth.
rational approximation
Compare Real NumbersReplace each with �, �, or � to make each sentence true.
a. 19� 3.8�
Find two perfect squares closest to �19� and write an inequality.
16 � 19 � 25 19 is between 16 and 25.
�16� � �19� � �25� Find the square root of each number.
4 � �19� � 5 �19� is between 4 and 5.
Since �19� is between 4 and 5, it must be greater than 3.8�.
So, �19� 3.8�.
b. 7.2� 52�You can use a calculator to find an approximation for �52�.
�52� � 7.211102551…
7.2� � 7.222…
Therefore, 7.2� �52�.
Example 4Example 4
www.algebra1.com/extra_examples
Lesson 2-7 Square Roots and Real Numbers 105
33
44
In-Class ExamplesIn-Class Examples
Graph each solution set.
a. y � 8
b. z �5
Replace each ● with �, , or � to make each sentencetrue.
a. 14 ● �196�The numbers are equal, so 14 � 196�.
b. �48� ● 6.9�48� � 6.9282032… so 48� � 6.9�
�7 �6 �5 �4 �3 �2 �1 0 1
2 31 4 5 6 7 8 9
PowerPoint®

55
66
In-Class ExamplesIn-Class Examples
Write , �6�, 2.4�, and in
order from least to greatest.
, , 2.4�, 6�
For what value of x is
�x� � 1 � true? C
A �5B 0
C
D 5
Answer
2. Rational numbers are numbersthat when written as decimalsterminate or repeat. Irrationalnumbers do not terminate nor dothey repeat.
1�5
1��x�
61�25
12�5
61�25
12�5
You can use rational approximations to test the validity of some algebraicstatements involving real numbers.
106 Chapter 2 Real Numbers
Order Real NumbersWrite 2.6�3�, �7�, �
83
�, ��5230
� in order from least to greatest.Write each number as a decimal.
2.6�3� � 2.6363636… or about 2.636.
��7� � �2.64575131… or about �2.646.
�83
� � 2.66666666… or about 2.667.
��5230
� � �2.65
�2.65 � �2.646 � 2.636 � 2.667
The numbers arranged in order from least to greatest are ��5230
�, ��7�, 2.6�3�, �83
�.
Example 5Example 5
Rational ApproximationMultiple-Choice Test Item
Read the Test ItemThe expression �x� x is an open sentence, and the set of choices
��12
�, 0, �2, 3� is the replacement set.
Solve the Test ItemReplace x in �x� x with each given value.
x � �12
� x � 0
? ��
12
� ? �
12
� Use a calculator.? �0� ?
0
1.41 0.71 0.5 � True False; is not a real number.
x � �2 x � 3
? ��2� ?
�2? �3� ?
3 Use a calculator.
False; and ��2� are not 0.58 1.73 3 False
real numbers.
The inequality is true for x � �12
�, so the correct answer is A.
1���2�
1��3�
1���2�
DC
1��0�
1��0�
1�
��1
2�
BA
1��x�
1��x�
Example 6Example 6
Test-Taking TipYou could stop when youfind that A is a solution.But testing the othervalues is a good check.
You can write a set of real numbers in order from greatest to least or from least togreatest. To do so, find a decimal approximation for each number in the set andcompare.
For what value of x is �x� x true?
�12
� 0 �2 3DCBA
1��x�
StandardizedTest Practice
106 Chapter 2 Real Numbers
EstimatingSquare RootsYou can useperfect squaresto estimate
square roots that are irrational.
To determine where �27� lieson a number line, askstudents between which twoperfect squares 27 lies. Since 25 � 27 � 36,
�25� � �27� � �36� or
5 � �27� � 6. Also, since 27 iscloser to 25 than 36, you know
that �27� is closer to 5 than 6.
In fact, �27� is about 5.2.Estimating square rootsmentally can help studentsmaster problems like Example5 more easily.
New
Example 6 Advise students to examine the answer choicesbefore substituting them into the inequality. Choice B can be
eliminated because 0 � �0�, making an undefined term.
Since C is negative and the square root of a negative number is undefined for the realnumber set, it can be eliminated. Therefore, the only choices remaining to evaluate are A and D.
1��x�
PowerPoint®
StandardizedTest Practice

Lesson 2-7 Square Roots and Real Numbers 107
1. Tell whether the square root of any real number is always, sometimes or neverpositive. Explain your answer.
2. OPEN ENDED Describe the difference between rational numbers and irrationalnumbers. Give examples of both. See margin.
3. Explain why you cannot evaluate ��25� using real numbers. There is no realnumber that can be multiplied by itself to result in a negative product.
Find each square root. If necessary, round to the nearest hundredth.
4. ��25� �5 5. �1.44� 1.2 6. ��1469� ��
47
� 7. �32� 5.66
Name the set or sets of numbers to which each real number belongs.
8. ��64� 9. �83
� rationals 10. �28� irrationals 11. �576�
Graph each solution set. 12–13. See margin.12. x � �3.5 13. x �7
Replace each with �, �, or � to make each sentence true.14. 0.3 �
13
� � 15. �29
� 0.2� � 16. �16
� �6� �
Write each set of numbers in order from least to greatest.
17. �18
�, ��18
�, 0.1�5�, �15 �15, �18
�, 0.1�5�, ��18
�� 18. �30�, 5�49
�, 13,
19. For what value of a is ��a� � � true? C
�13
� �4 2 1DCBA
1��a�
�
130��, 5�
49
�,
30�, 13
1��30�
naturals,wholes, integers,rationals
integers, rationals
Concept Check1. Sometimes; thesquare root of a num-ber can be negative,such as 16� � 4 and �16� � �4.
Guided Practice
GUIDED PRACTICE KEYExercises Examples
4–7 18–11 212, 13 314–16 417, 18 5
19 6
Practice and ApplyPractice and Applyindicates increased difficulty★
Find each square root. If necessary, round to the nearest hundredth.20. �49� 7 21. �81� 9 22. �5.29� 2.3
23. �6.25� 2.5 24. ��78� �8.83 25. ��94� �9.70
26. ��3861� ��
23
� 27. ��110906
� ��57
� 28. ��194� 0.80
29. ��2452� 0.77 30. �820� �28.64 31. �513� �22.65
Name the set or sets of numbers to which each real number belongs.32. ��22� 33. �
366� 34. �
13
�
35. ��152� 36. ��
8220� 37. ��46�
38. �10.24� 39. ��1594
� 40. ��34
�
41. �20.25� 42. �138� 43. �2.4025�
44. ��3658
� 45. �161� 46. �5.5696�
47. ��7482� 48. ��9.16� 49. �★
32–49. See pp. 117A–117B.
Extra Practice See page 825.
Extra Practice See page 825.
For SeeExercises Examples
20–31, 150, 51
32–49 2
52–57 3
58–63 4
64–69 5
StandardizedTest Practice
www.algebra1.com/self_check_quiz
Lesson 2-7 Square Roots and Real Numbers 107
3 Practice/Apply3 Practice/Apply
Study NotebookStudy NotebookHave students—• complete the definitions/examples
for the remaining terms on theirVocabulary Builder worksheets forChapter 2.
• copy the concept summary forReal Numbers, along with anexplanation of how to find bothsquare roots of a number.
• include any other item(s) that theyfind helpful in mastering the skillsin this lesson.
About the Exercises…Organization by Objective• Square Roots: 20–31, 50• Classify and Order
Numbers: 32–49, 52–69
Odd/Even AssignmentsExercises 20–69 are structuredso that students practice thesame concepts whether theyare assigned odd or evenproblems.
Assignment GuideBasic: 21–47 odd, 51–55 odd,59, 61, 65–69 odd, 73, 77–88
Average: 21–69 odd, 70–73,77–88
Advanced: 20–68 even, 73–88
Answers
12.
13.�8 �7 �6 �5 �4 �3 �2 �1 0 1
�6 �5 �4 �3 �2
Intrapersonal This is the last lesson of this chapter. The chaptercontains numerous concepts which may have been unfamiliar tostudents. Encourage each student to use their Foldables and thevocabulary list on p. 110 of the student edition to pinpoint any concepts with which students still feel unsure.
Differentiated Instruction

Study Guide and InterventionSquare Roots and Real Numbers
NAME ______________________________________________ DATE ____________ PERIOD _____
2-72-7
Less
on
2-7
Square Roots A square root is one of two equal factors of a number. For example, thesquare roots of 36 are 6 and �6, since 6 � 6 or 62 is 36 and (�6)(�6) or (�6)2 is also 36. Arational number like 36, whose square root is a rational number, is called a perfectsquare.The symbol �� is a radical sign. It indicates the nonnegative, or principal, square root of the number under the radical sign. So �36� � 6 and ��36� � �6. The symbol �36�represents both square roots.
Find �� .
�� represents the negative square root of .
� � �2→ �� � �
5�7
25�49
5�7
25�49
25�49
25�49
25�49 Find �0.16�.
�0.16� represents the positive andnegative square roots of 0.16.0.16 � 0.42 and 0.16 � (�0.4)2
�0.16� � 0.4
Example 1Example 1 Example 2Example 2
ExercisesExercises
Find each square root.
1. �64� 8 2. ��81� �9 3. �16.81� 4.1
4. �100� �10 5. �� � 6. ��121� �11
7. � � 8. �� � 9. � �
10. ��3600� �60 11. ��6.25� �2.5 12. �0.000�4� �0.02
13. � 14. �� � 15. �1.21� �1.16�7
36�49
6�7
144�196
11�10
121�100
5�4
25�16
5�12
25�144
2�5
4�25
Study Guide and Intervention, p. 111 (shown) and p. 112
Find each square root. If necessary, round to the nearest hundredth.
1. �324� 2. ��62� 3. �25� 4. ��84�
18 �7.87 �5 �9.17
5. � 6. �� 7. ��0.081� 8. �3.06�
� �0.76 �0.28 �1.75
Name the set or sets of numbers to which each real number belongs.
9. �93� 10. ��0.062�5� 11. 12. �
irrational rational rational integer, rational
Graph each solution set.
13. x � �0.5 14. x �3.5
Replace each ● with �, �, or � to make each sentence true.
15. 0.9�3� ● �0.93� � 16. 8.1�7� ● �66� � 17. ● �
Write each set of numbers in order from least to greatest.
18. �0.03�, , 0.1�7� 19. � , ��8�, � 20. ��8.5�, � , �2
0.1�7�, 0.03�, �8�, � ,� � , �2 , �8.5�
21. SIGHTSEEING The distance you can see to the horizon is given by the formula d � �1.5h�, where d is the distance in miles and h is the height in feet above the horizon line. Mt. Whitney is the highest point in the contiguous 48 states. Its elevation is 14,494 feet. The lowest elevation, at �282 feet, is located near Badwater, California.With a clear enough sky and no obstructions, could you see from the top of Mt. Whitneyto Badwater if the distance between them is 135 miles? Explain. Yes; you can seeabout 149 miles from the top of Mt. Whitney to an elevation of �282 feet.
22. SEISMIC WAVES A tsunami is a seismic wave caused by an earthquake on the oceanfloor. You can use the formula s � 3.1�d�, where s is the speed in meters per second and d is the depth of the ocean in meters, to determine the speed of a tsunami. If anearthquake occurs at a depth of 200 meters, what is the speed of the tsunami generatedby the earthquake? about 43.8 m/s
19�20
35��2
7��8
84�30
2��8
19�20
�35��2
�7��8
84�30
�2��8
�5��6
5�6
�2 �1�4 �3 0 1 2 3 4�2 �1�4 �3 0 1 2 3 4
144�3
8�7
2�17
7�12
4�289
Practice (Average)
Square Roots and Real Numbers
NAME ______________________________________________ DATE ____________ PERIOD _____
2-72-7Skills Practice, p. 113 and Practice, p. 114 (shown)
Reading to Learn MathematicsSquare Roots and Real Numbers
NAME ______________________________________________ DATE ____________ PERIOD _____
2-72-7
Pre-Activity How can using square roots determine the surface area of thehuman body?
Read the introduction to Lesson 2-7 at the top of page 103 in your textbook.
The expression �3600� is read, “the square root of 3600.” How would youread the expression �64�?
the square root of 64
Reading the Lesson
Complete each statement below.
1. The symbol �� is called a and is used to indicate anonnegative or principal square root of the expression under the symbol.
2. A of an irrational number is a rational number that is closeto, but not equal to, the value of the irrational number.
3. The positive square root of a number is called the squareroot of the number.
4. A number whose positive square root is a rational number is a .
5. Write each of the following as a mathematical expression that uses the �� symbol.
a. the positive square root of 1600 1600�b. the negative square root of 729 �729�c. the principal square root of 3025 3025�
6. The irrational numbers and rational numbers together form the set of numbers.
Helping You Remember
7. Use a dictionary to look up several words that begin with “ir-”. What does the prefix “ir-”mean? How can this help you remember the meaning of the word irrational?
Sample answer: The prefix “ir-” means not. So an irrational number is anumber that is not a rational number.
real
perfect square
principal
rational approximation
radical sign
Reading to Learn Mathematics, p. 115
Scale DrawingsThe map at the left below shows building lots for sale. The scale ratiois 1:2400. At the right below is the floor plan for a two-bedroomapartment. The length of the living room is 6 m. On the plan theliving room is 6 cm long.
Closet
Closet
Closet
Closet
Kitchen
BedroomBedroom Bath
Dining Area
Living Room
Lot 3
Lot 2
Lot 1
Suns
hine
Lak
e
Sylv
an R
oad
Enrichment
NAME ______________________________________________ DATE ____________ PERIOD _____
2-72-7Enrichment, p. 116
50. PHYSICAL SCIENCE The time it takes for a falling object to travel a certain
distance d is given by the equation t � ��1d6�, where t is in seconds and d is in
feet. If Krista dropped a ball from a window 28 feet above the ground, how longwould it take for the ball to reach the ground? 1.32 s
51. LAW ENFORCEMENT Police can use the formula s � �24d� to estimate thespeed s of a car in miles per hour by measuring the distance d in feet a car skidson a dry road. On his way to work, Jerome skidded trying to stop for a red lightand was involved in a minor accident. He told the police officer that he wasdriving within the speed limit of 35 miles per hour. The police officer measured
his skid marks and found them to be 43�34
� feet long. Should the officer giveJerome a ticket for speeding? Explain.No; Jerome was traveling at about 32.4 mph.
Graph each solution set. 52–57. See margin.52. x �12 53. x � 8 54. x �10.2
55. x � �0.25 56. x � �2 57. x � �36�
Replace each with �, �, or � to make each sentence true.58. 5.7�2� �5� � 59. 2.6�3� �8� �
60. �17
� � 61. �23
� �
62. � 63. �12
� �
Write each set of numbers in order from least to greatest.
64. �0.42�, 0.6�3�, 0.6�3�, 0.42�, �34�
� 65. �0.06�, 0.2�4�, 0.2�4�, 0.06�, �129�
�
66. �1.4�6�, 0.2, �2�, ��16
� 67. �4.8�3�, 0.4, �8�, ��38
�
68. ��65�, �6�25
�, ��27� 69. �122�, 7�49
�, �200�
TOURISM For Exercises 70–72, use the following information.The formula to determine the distance d in milesthat an object can be seen on a clear day on the
surface of a body of water is d � 1.4�h�, where h isthe height in feet of the viewer’s eyes above thesurface of the water.
70. A charter plane is used to fly tourists on a sightseeing trip along the coast ofNorth Carolina. If the plane flies at an altitude of 1500 feet, how far can thetourists see? about 54.2 mi
71. Dillan and Marissa are parasailing while on vacation. Marissa is 135 feet abovethe ocean while Dillan is 85 feet above the ocean. How much farther can Marissasee than Dillan? about 3.4 mi
72. The observation deck of a lighthouse stands 120 feet above the ocean surface.Can the lighthouse keeper see a boat that is 17 miles from the lighthouse?Explain. No; the lighthouse keeper can only see about 15.3 mi.
73. CRITICAL THINKING Determine when the following statements are all true forreal numbers q and r. They are true if q and r are positive and q � r.a. q2 r2 b. �
1q
� � �1r
� c. �q� �r� d. �1
��r�
1��q�
d
h
�9��12
�4��
3
�2��
2★�31�
�31
1��31�
2��3�
1��7�
★★
108 Chapter 2 Real Numbers
66. �1.4�6�, ��16
�, 0.2,
2�67. �4.8�3�, ��
38
�, 0.4,
8�68. �65�, �6�
25
�,
�27�69. 7�
49
�, 122�,
200�
TourismBuilt in 1758, the SambroIsland Lighthouse at Halifax Harbor is the oldestoperational lighthouse in North America.
Source: Canadian Coast Guard
★
108 Chapter 2 Real Numbers
ELL

Open-Ended AssessmentModeling Arrange 16 squaretiles into a 4-by-4 grid and show
how the side length models �16�.Now give students other squarenumbers of tiles and have themmodel the square root.
Assessment OptionsQuiz (Lesson 2-7) is available onp. 132 of the Chapter 2 ResourceMasters.
Answers
52.
53.
54.
55.
56.
57.
77. Sample answer: By using theformula Surface Area ������,
you need to use square roots tocalculate the quantity. Answersshould include the following.• You must multiply height by
weight first. Divide that productby 3600. Then determine thesquare root of that result.
• Sample answers: exposure toradiation or chemicals; heatloss; scuba suits
• Sample answers: determiningheight, distance
height � weight��3600
�8 �6 �4 �2 0 2 4 6 8
�5 �4 �3 �2 �1 0 1 2 3 4
0�2 �1
�10 �9
91 2 3 4 5 6 7 8
�6�14 �13�12�11�10 �9 �8 �7
Maintain Your SkillsMaintain Your Skills
Lesson 2-7 Square Roots and Real Numbers 109
GEOMETRY For Exercises 74–76, use the table.
74. Copy and complete the table. Determine the length of each side of each squaredescribed. Then determine the perimeter of each square.
75. Describe the relationship between the lengths of the sides and the area.
76. Write an expression you can use to find the perimeter of a square whose area isa units2.
77. Answer the question that was posed at the beginning ofthe lesson. See margin.
How can using square roots determine the surface area of the human body?Include the following in your answer:
• an explanation of the order of operations that must be followed to calculatethe surface area of the human body,
• a description of other situations in which you might need to calculate thesurface area of the human body, and
• examples of real-world situations involving square roots.
78. Which point on the number line is closest
to ��7�? B
R ST U
79. Which of the following is a true statement? B
��63
� �36
� ��36
� ��63
� ��36
� � ��63
� �63
� � �36
�DCBA
DC
BA�4 0�1�3 �2
R S T U
WRITING IN MATH
4a�
75. The length of theside is the square rootof the area.
Squares
Area (units2) Side Length Perimeter
1 1 44 2 89 3 12
16 4 1625 5 20
Find the odds of each outcome if a card is randomly selected from a standarddeck of cards. (Lesson 2-6)
80. red 4 1:25 81. even number 5:882. against a face card 10:3 83. against an ace 12:1
84. AUTO RACING Jeff Gordon’s finishing places in the 2000 season races arelisted below. Which measure of central tendency best represents the data?Explain. (Lesson 2-5) Sample answer: Mean; the median and mode are too low.34 10 28 9 8 8 25 4 1 11 14 10 32 14 8 1 4
10 5 3 33 23 36 23 4 1 6 9 5 39 4 2 7 7
Simplify each expression. (Lesson 2-3) 88. �7xy � 14xz85. 4(�7) � 3(11) �61 86. 3(�4) � 2(�7) �2687. 1.2(4x � 5y) � 0.2(�1.5x � 8y) 88. �4x(y � 2z) � x(6z � 3y)
5.1x � 7.6y
Mixed Review
StandardizedTest Practice
Lesson 2-7 Square Roots and Real Numbers 109
4 Assess4 Assess

Study Guide and Review
110 Chapter 2 Real Numbers
Vocabulary and Concept CheckVocabulary and Concept Check
State whether each sentence is true or false. If false, replace the underlinedterm or number to make a true sentence.1. The absolute value of �26 is 26. true2. Terminating decimals are rational numbers. true3. The principal square root of 144 is 12. true
4. ��576� is an irrational number. false; rational number5. 225 is a perfect square. true6. �3.1 is an integer. false; sample answer: �37. 0.666 is a repeating decimal. false; sample answer: 0.6� or 0.666…8. The product of two numbers with different signs is negative. true
Rational Numbers on the Number LineConcept Summary
• A set of numbers can be graphed on a number line by drawing points.
• To evaluate expressions with absolute value, treat the absolute valuesymbols as grouping symbols.
Graph {…, �5, �4, �3}.
The bold arrow means that the graph continues indefinitely in that direction.
Exercises Graph each set of numbers. See Example 2 on page 69. 9–11. See margin.
9. {5, 3, �1, �3} 10. ��1�12
�, ��12
�, �12
�, 1�12
�, …�11. {integers less than �4 and greater than or equal to 2}
Evaluate each expression if x � �4, y � 8, and z � �9. See Example 4 on page 70.
12. 32 � y � 32713. 3x�7 5 14. 4 � z 13 15. 46 � yx 14
10�1�2�3�4�5�6�7
See pages68–72.
2-12-1
ExampleExample
absolute value (p. 69)
additive inverses (p. 74)
back-to-back stem-and-leaf plot (p. 89)
Completeness Property (p. 105)
coordinate (p. 69)
equally likely (p. 97)
frequency (p. 88)
graph (p. 69)
infinity (p. 68)
integers (p. 68)
irrational number (p. 104)
line plot (p. 88)
measures of central tendency (p. 90)
natural number (p. 68)
negative number (p.68)
odds (p. 97)
opposites (p. 74)
perfect square (p. 103)
positive number (p. 68)
principal square root (p. 103)
probability (p. 96)
radical sign (p. 103)
rational approximation (p. 105)
rational number (p. 68)
real number (p. 104)
sample space (p. 96)
simple event (p. 96)
square root (p. 103)
stem-and-leaf plot (p. 89)
whole number (p. 68)
www.algebra1.com/vocabulary_review
110 Chapter 2 Real Numbers
Have students review their Foldables to be sure they haveincluded notes on every lesson in this chapter.Encourage students to refer to their Foldables while completingthe Study Guide and Review and to use them in preparing for theChapter Test.
TM
For more informationabout Foldables, seeTeaching Mathematicswith Foldables.
Lesson-by-LessonReviewLesson-by-LessonReview
Vocabulary and Concept CheckVocabulary and Concept Check
• This alphabetical list ofvocabulary terms in Chapter 2includes a page reference whereeach term was introduced.
• Assessment A vocabularytest/review for Chapter 2 isavailable on p. 130 of theChapter 2 Resource Masters.
For each lesson,
• the main ideas aresummarized,
• additional examples reviewconcepts, and
• practice exercises are provided.
The Vocabulary PuzzleMakersoftware improves students’ mathematicsvocabulary using four puzzle formats—crossword, scramble, word search using aword list, and word search using clues.Students can work on a computer screenor from a printed handout.
Vocabulary PuzzleMaker
ELL
MindJogger Videoquizzesprovide an alternative review of conceptspresented in this chapter. Students workin teams in a game show format to gainpoints for correct answers. The questionsare presented in three rounds.
Round 1 Concepts (5 questions)Round 2 Skills (4 questions)Round 3 Problem Solving (4 questions)
MindJogger Videoquizzes
ELL

Study Guide and Review
Answers
9.
10.
11.�3 �2 �1�6 �5 �4 0 1 2 3
�3 �2 �1 0 1 2 3 4 5 6
�4 �3�2 �1 0 1 2 3 4 5 6
Chapter 2 Study Guide and Review 111
Adding and Subtracting Rational NumbersConcept Summary
• To add rational numbers with the same sign, add their absolute values. The sum has the same sign as the addends.
• To add rational numbers with different signs, subtract the lesser absolutevalue from the greater absolute value. The sum has the same sign as thenumber with the greater absolute value.
• To subtract a rational number, add its additive inverse.
1 Find �4 � (�3). 2 Find 12 � 18.�4 � (�3) 12 � 18 To subtract 18,
� �(�4 � �3) Both numbers are � 12 � (�18)add its inverse.
� �(4 � 3)negative, so the
� �(�18 � 12) The absolute value
� �7
sum is negative.
� �(18 � 12)of 18 is greater, so
� �6
the result is negative.
Exercises Find each sum or difference. See Examples 1–3 on pages 73–75.
16. 4 � (�4) 0 17. 2 � (�7) �5 18. �0.8 � (�1.2) �2
19. �3.9 � 2.5 �1.4 20. ��14
� � ���18
�� � �38
� 21. �56
� � ���13
�� �12
�
22. �2 � 10 �12 23. 9 � (�7) 16 24. 1.25 � 0.18 1.07
25. �7.7 � (�5.2) �2.5 26. �92
� � ���12
�� 5 27. ��18
� � ���23
�� �12
34�
Chapter 2 Study Guide and ReviewChapter 2 Study Guide and Review
ExamplesExamples
See pages73–78.
2-22-2
Multiplying Rational NumbersConcept Summary
• The product of two numbers having the same sign is positive.
• The product of two numbers having different signs is negative.
Multiply ��2�17
���3�23
��.
��2�17
���3�23
��� ��
715� � �
131� Write as improper fractions.
� ��
755� or �7�
67
� Simplify.
Exercises Find each product. See Examples 1 and 3 on pages 79 and 80.
28. (�11)(9) �99 29. 12(�3) �36 30. �8.2(4.5) �36.9
31. �2.4(�3.6) 8.64 32. �34
� � �172� �
176� 33. ���
13
�����190�� �
130�
Simplify each expression. See Example 2 on page 80.
34. 8(�3x) � 12x �12x 35. �5(�2n) � 9n n 36. �4(6a) � (�3)(�7a) �45a
See pages79–83.
2-32-3
ExampleExample
Chapter 2 Study Guide and Review 111

Study Guide and Review
112 Chapter 2 Real Numbers
Dividing Rational NumbersConcept Summary
• The quotient of two positive numbers is positive.
• The quotient of two negative numbers is positive.
• The quotient of a positive number and a negative number is negative.
Simplify ���23�(4)
3�.
���23�(4)
3� � �
��2
1�2
3� Simplify the numerator.
� ���
152
� Simplify the denominator.
� 2�25
� same signs → positive quotient
Exercises Find each quotient. See Examples 1–3 on pages 84 and 85.
37. ��
654� �9 38. ��
784� �9.25 39. 21.8 � (�2) �10.9
40. �7.8 � (�6) 1.3 41. �15 � ��34
�� �20 42. �22
14� � �
13
� �281� or 2�
58
�
Simplify each expression. See Example 5 on page 85.
43. �14 �
�728x� �2 � 4x 44. �
�5 �5
25x� �1 � 5x 45. �
�4x �
4
24y� �x � 6y
Evaluate each expression if x � �4, y � 2.4, and z � 3. See Example 6 on page 85.
46. xz � 2y �16.8 47. �2��2
zy�� �3.2 48. �
2x4� z� � 3y 4.45
See pages84–87.
2-42-4
Chapter 2 Study Guide and ReviewChapter 2 Study Guide and Review
Statistics: Displaying and Analyzing DataConcept Summary
• A set of numerical data can be displayed in a line plot or stem-and-leaf plot.
• A measure of central tendency represents a centralized value of a set of data.Examine each measure of central tendency to choose the one mostrepresentative of the data.
1 Draw a line plot for the data.2 8 6 4 5 9 13 12 5 2 5 5 2
The value of the data ranges from 2 to 13. Construct a number line containing thosepoints. Then place an � above a number each time it occurs.
3 41 2 5 6 7 8 9 10 11 12 13 14
����
��� � �� ���
ExampleExample
See pages88–94.
2-52-5
ExamplesExamples
112 Chapter 2 Real Numbers

Study Guide and Review
Chapter 2 Study Guide and Review 113
Chapter 2 Study Guide and ReviewChapter 2 Study Guide and Review
See pages96–101.
2-62-6
2 SCHOOL Melinda’s scores on the 25-point quizzes in her English class are 20, 21, 12, 21, 22, 22, 22, 21, 20, 20, and 21. Which measure of central tendency best represents her grade?
mean: 20.2 Add the data and divide by 11.
median: 21 The middle value is 21.
mode: 21 The most frequent value is 21.
The median and mode are both representative of the data. The mean is less thanmost of the data.
Exercises
49. Draw a line plot for the data. Then make a stem-and-leaf plot.See Examples 1–3 on pages 88 and 89. See margin.
28 17 16 18 19 21 26 15
19 19 16 14 21 12 26 17
30 17 13 18 14 22 20 12
19 19 15 12 15 21 15 17
50. BUSINESS Of the 42 employees at Pirate Printing, four make $6.50 an hour,sixteen make $6.75 an hour, six make $6.85 an hour, thirteen make $7.25 an hour,and three make $8.85 an hour. Which measure best describes the average wage?Explain. See Examples 5 and 6 on pages 90 and 91. See margin.
51. HOCKEY Professional hockey uses a pointsystem based on wins, losses and ties, todetermine teams’ rank. The stem-and-leaf plotshows the number of points earned by each ofthe 30 teams in the National Hockey Leagueduring the 2000–2001 season. Which measure of central tendency best describes the averagenumber of points earned? Explain.See Example 5 on page 90. Sample answer: Median;it is closest in value to most of the data.
Stem Leaf
11 1 1 8
10 0 3 6 9
9 0 0 0 2 3 5 6 6 8
8 0 8 8
7 0 1 1 2 3
6 0 6 6 8
5 2 9 111 � 111
ExamplesExamples
Probability: Simple Probability and OddsConcept Summary
• The probability of an event a can be expressed as
P(a) � .
• The odds of an event can be expressed as the ratio of the number ofsuccessful outcomes to the number of unsuccessful outcomes.
1 Find the probability of randomly choosing the letter I in the word MISSISSIPPI.
P(letter I) � �141�
← number of favorable outcomes
� 0.36← number of possible outcomes
The probability of choosing an I is �141� or about 36%.
number of favorable outcomes����total number of possible outcomes
Chapter 2 Study Guide and Review 113
Answers
49.
50. Sample answer: Mean; themedian and mode are too low.
Stem | Leaf1 | 2 2 2 3 4 4 5 5 5 5 6 6
| 7 7 7 7 8 8 9 9 9 9 92 | 0 1 1 1 2 6 6 83 | 0
1 |2 � 12
��
�
�
���
���
��
��
���
��
����
���
� ��
� �
5 10 15 20 25 30
�
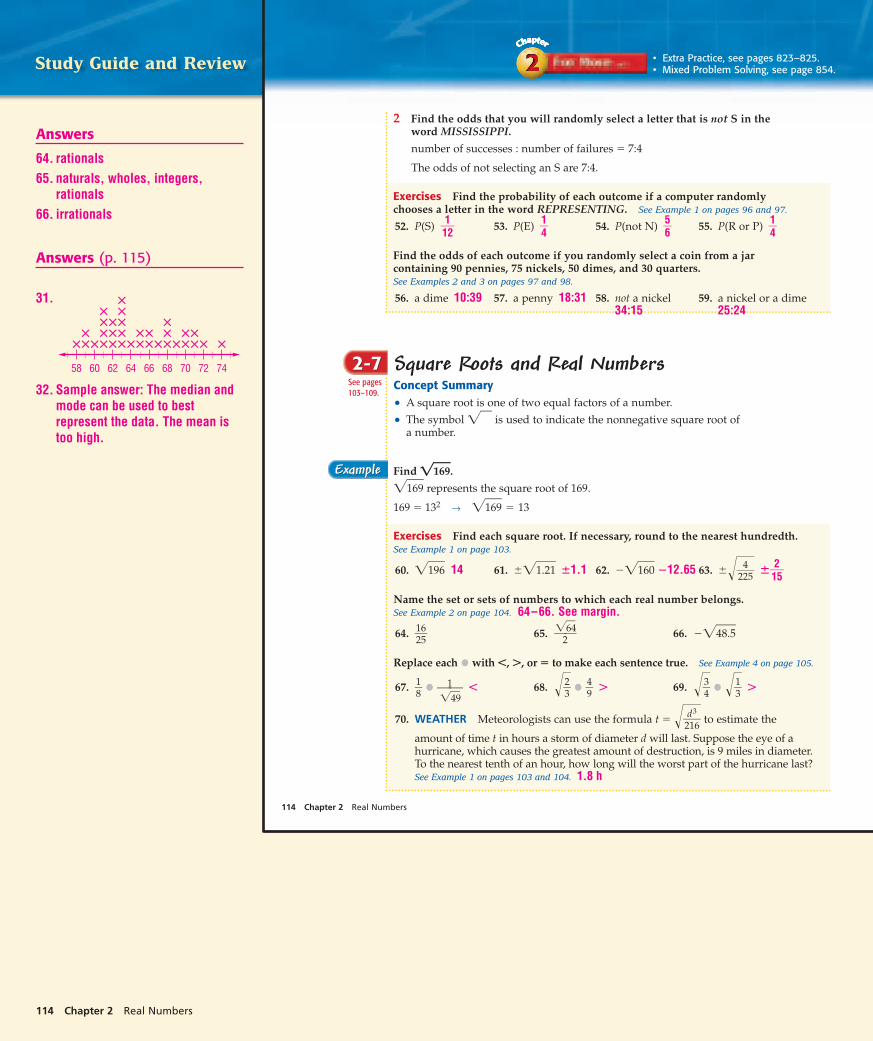
Study Guide and Review
Answers
64. rationals65. naturals, wholes, integers,
rationals66. irrationals
Answers (p. 115)
31.
32. Sample answer: The median andmode can be used to bestrepresent the data. The mean istoo high.
���
�����
���
�����
���
��
��� ��
����� �
58 60 62 64 66 68 70 72 74
114 Chapter 2 Real Numbers
See pages103–109.
2-72-7
ExampleExample
2 Find the odds that you will randomly select a letter that is not S in theword MISSISSIPPI.number of successes : number of failures � 7:4
The odds of not selecting an S are 7:4.
Exercises Find the probability of each outcome if a computer randomlychooses a letter in the word REPRESENTING. See Example 1 on pages 96 and 97.
52. P(S) �112� 53. P(E) �
14
� 54. P(not N) �56
� 55. P(R or P) �14
�
Find the odds of each outcome if you randomly select a coin from a jarcontaining 90 pennies, 75 nickels, 50 dimes, and 30 quarters.See Examples 2 and 3 on pages 97 and 98.
56. a dime 10:39 57. a penny 18:31 58. not a nickel 59. a nickel or a dime34:15 25:24
Square Roots and Real NumbersConcept Summary
• A square root is one of two equal factors of a number.
• The symbol �00� is used to indicate the nonnegative square root of a number.
Find 169�.
�169� represents the square root of 169.
169 � 132 → �169� � 13
Exercises Find each square root. If necessary, round to the nearest hundredth.See Example 1 on page 103.
60. �196� 14 61. �1.21� �1.1 62. ��160� �12.65 63. ��2
425� ��
125�
Name the set or sets of numbers to which each real number belongs.See Example 2 on page 104. 64–66. See margin.
64. �1265� 65. �
�264�� 66. ��48.5�
Replace each with �, �, or � to make each sentence true. See Example 4 on page 105.
67. �18
� ��
1
49�� � 68. ��
23
� �49
� � 69. ��34
� ��13
� �
70. WEATHER Meteorologists can use the formula t � ��2d1
3
6� to estimate the
amount of time t in hours a storm of diameter d will last. Suppose the eye of ahurricane, which causes the greatest amount of destruction, is 9 miles in diameter. To the nearest tenth of an hour, how long will the worst part of the hurricane last?See Example 1 on pages 103 and 104. 1.8 h
• Extra Practice, see pages 823–825.• Mixed Problem Solving, see page 854.
114 Chapter 2 Real Numbers

Practice Test
Chapter 2 Practice Test 115
Skills and ApplicationsSkills and Applications
Evaluate each expression.4. �x � 38 if x � �2 �40 5. 34 � x � 21 if x � �7 20 6. �12 � x � 8 if x � 1.5 �5.5
Find each sum or difference.7. �19 � 12 �7 8. �21 � (�34) 13 9. 16.4 � (�23.7) �7.3
10. 6.32 � (�7.41) 13.73 11. ��176� � �
38
� ��116� 12. ��
172� � ���
59
�� ��316�
Find each quotient or product.13. �5(19) �95 14. �56 � (�7) 8 15. 96 � (�0.8) �120
16. (�7.8)(5.6) �43.68 17. ��18
� � �5 �410� 18. ��
1352� � �
34
� ��58
�
Simplify each expression. 21. 28mn � 12cd19. 5(�3x) � 12x �27x 20. 7(6h � h) 35h 21. �4m(�7n) � (3d)(�4c)
22. �346k� 9k 23. �
9a��
327
� �3a � 9 24. �70x
�
�
5
30y� �14x � 6y
Find each square root. If necessary, round to the nearest hundredth.25. ��64� �8 26. �3.61� 1.9 27. ��
1861� ��
49
�
Replace each with �, �, or � to make each sentence true.
28. �13
� � 29. ��12
� �181� � 30. �0.56� �
�2
3�� �
STATISTICS For Exercises 31 and 32, use the following information. 31–32. See margin.The height, in inches, of the students in a health class are 65, 63, 68, 66, 72,61, 62, 63, 59, 58, 61, 74, 65, 63, 71, 60, 62, 63, 71, 70, 59, 66, 61, 62, 68, 69, 64,63, 70, 61, 68, and 67.
31. Make a line plot of the data.
32. Which measure of central tendency best describes the data? Explain.
33. STANDARDIZED TEST PRACTICE During a 20-song sequence on a radiostation, 8 soft-rock, 7 hard-rock, and 5 rap songs are played at random. Assumethat all of the songs are the same length. What is the probability that when youturn on the radio, a hard-rock song will be playing? B
�14
� �270� �
25
� �1230� �
170�EDCBA
��1
3��
Vocabulary and ConceptsVocabulary and Concepts
Choose the correct term to complete each sentence.1. The ( , square) of a number is its distance from zero on a number line.
2. A number that can be written as a fraction where the numerator anddenominator are integers and the denominator does not equal zero is a(repeating, ) number.
3. The list of all possible outcomes is called the (simple event, ).sample spacerational
absolute value
www.algebra1.com/chapter_test
Chapter 2 Test Practice 115
Introduction Where will you use integers in the world outside youralgebra classroom? Are integers common or does the outside world moreoften use fractions or decimals?Ask Students Golf is an example of a game that uses integers in itsscoring. Have students investigate the game of golf and how it is scored.Then have them report on how integers are used to keep score in a golftournament. How do the integers indicate which player is the winner?
Portfolio Suggestion
Assessment OptionsVocabulary Test A vocabularytest/review for Chapter 2 can befound on p. 130 of the Chapter 2Resource Masters.
Chapter Tests There are sixChapter 2 Tests and an Open-Ended Assessment task availablein the Chapter 2 Resource Masters.
Open-Ended AssessmentPerformance tasks for Chapter 2can be found on p. 129 of theChapter 2 Resource Masters. Asample scoring rubric for thesetasks appears on p. A28.
ExamView® Pro Use the networkable ExamView® Pro to:
• Create multiple versionsof tests.
• Create modified tests forInclusion students.
• Edit existing questions andadd your own questions.
• Use built-in state curriculum correlations to create testsaligned with state standards.
• Change English tests toSpanish and vice versa.
Chapter 2 TestsForm Type Level Pages
1 MC basic 117–118
2A MC average 119–120
2B MC average 121–122
2C FR average 123–124
2D FR average 125–126
3 FR advanced 127–128
MC = multiple-choice questionsFR = free-response questions

StandardizedTest Practice
Standardized Test PracticeStudent Record Sheet (Use with pages 116–117 of the Student Edition.)
Select the best answer from the choices given and fill in the corresponding oval.
Solve the problem and write your answer in the blank.
For Questions 11, 12, 15, 16, 18, and 19, also enter your answer by writing eachnumber or symbol in a box. Then fill in the corresponding oval for that number or symbol.
11 12 15
11 (grid in)
12 (grid in)
13
14
16 18 19
0 0 0
.. ./ /
.
99 9 987654321
87654321
87654321
87654321
0 0 0
.. ./ /
.
99 9 987654321
87654321
87654321
87654321
0 0 0
.. ./ /
.
99 9 987654321
87654321
87654321
87654321
0 0 0
.. ./ /
.
99 9 987654321
87654321
87654321
87654321
0 0 0
.. ./ /
.
99 9 987654321
87654321
87654321
87654321
0 0 0
.. ./ /
.
99 9 987654321
87654321
87654321
87654321
DCBADCBADCBA
DCBADCBADCBA
DCBADCBADCBA
NAME DATE PERIOD
22
An
swer
s
Part 2 Short Response/Grid InPart 2 Short Response/Grid In
Part 3 Extended ResponsePart 3 Extended Response
Part 1 Multiple ChoicePart 1 Multiple Choice
Record your answers for Questions 20–21 on the back of this paper.
15 (grid in)
16 (grid in)
17
18 (grid in)
(grid in)
10
19
Standardized Test PracticeStudent Recording Sheet, p. A1
Additional PracticeSee pp. 135–136 in the Chapter 2Resource Masters for additionalstandardized test practice.
Teaching Tip Exercises 10–14 areall short answer questions. However,only Exercises 11 and 12 mightappear as grid-in questions.
Record your answers on the answer sheetprovided by your teacher or on a sheet ofpaper.
1. Darryl works 9 days at the State Fair and earns$518.40. If he works 8 hours each day, what ishis hourly pay? (Prerequisite Skill) B
$6.48 $7.20
$30.50 $57.60
2. The graph below shows how many toy trainsare assembled at a factory at the end of 10-minute intervals. What is the bestprediction for the number of productsassembled per hour? (Prerequisite Skill) C
80
100
120
130
3. Which graph shows the integers greater than�2 and less than or equal to 3? (Lesson 2-1) C
4. Which number is the greatest? (Lesson 2-1) D
�4 4
7 �9
5. What is �3.8 � 4.7? (Lesson 2-2) A
0.9 �0.9
8.5 �8.5
6. Simplify 3(�2m) � 7m. (Lesson 2-3) D
�12m �m
�2m �13m
7. Which statement about the stem-and-leaf plotis not true? (Lesson 2-5) D
The greatest value is 74.
The mode is 42.
Seven of the values are greater than 50.
The least value is 38.
8. There are 4 boxes. If you choose a box atrandom, what are the odds that you willchoose the one box with a prize? (Lesson 2-6) A
1:3 1:4
3:1 3:4
9. Which point on the number line is closest
to �10�? (Lesson 2-7) B
point P point Q
point R point SDC
BA
2 3 4 510�1�2�3�4�5
S P Q R
DC
BA
D
C
B
A
DC
BA
DC
BA
DC
BA
2 3 4 510�1�2�3�4�5D
2 3 4 510�1�2�3�4�5C
2 3 4 510�1�2�3�4�5B
2 3 4 510�1�2�3�4�5A
D
C
B
Toy Train Production
20
0
40
60
80N
um
ber
Pro
du
ced
100
120
Minutes10 20 30 40 50
A
DC
BA
Part 1 Multiple Choice
116 Chapter 2 Real Numbers
Stem Leaf
3 1 1 5 6 8 8
4 2 2 2 4
5 0 0
6 0 3 7 8 9 9
7 4 74 � 74
Test-Taking TipQuestion 1If you don’t know how to solve a problem, eliminate theanswer choices you know are incorrect and then guessfrom the remaining choices. Even eliminating only oneanswer choice greatly increases your chance of guessingthe correct answer.
116 Chapter 2 Real Numbers
These two pages contain practicequestions in the various formatsthat can be found on the mostfrequently given standardizedtests.
A practice answer sheet for thesetwo pages can be found on p. A1of the Chapter 2 Resource Masters.
ExamView® Pro Special banks of standardized test questions similar to those on the SAT,ACT, TIMSS 8, NAEP 8, and Algebra 1End-of-Course tests can be found onthis CD-ROM.

Evaluating ExtendedResponse QuestionsExtended Response questions are graded by using a multilevelrubric that guides you inassessing a student’s knowledgeof a particular concept.
Goal: Identify what is wrongwith a stem-and-leaf plot, andcompare cellular phone serviceplans.
Sample Scoring Rubric: Thefollowing rubric is a samplescoring device. You may wish toadd more detail to this sample tomeet your individual scoringneeds.
Answers
20a. C � x � my20b. Plan B is the least expensive.
It costs $27.95 for 150 minutes.Plan A costs $50.95 and Plan Ccosts $31.99.
21a. Without a key, you cannotdetermine what the values are.
21b. If the key is 3 |2 � 3.2, then thedata are ten times as great asthey would be if the key is 3 |2 � 0.32.
Chapter 2 Standardized Test Practice 117
Record your answers on the answer sheetprovided by your teacher or on a sheet ofpaper.
10. Ethan needs to wrap a label around a jar ofhomemade jelly so thatthere is no overlap. Find the length of the label.(Prerequisite Skill) 25.13 cm
11. Evaluate �4 � 1
52��
13 � 2
�. (Lesson 1-2) 1/3
12. Find the solution of 4m � 3 � 9 if the replacement set is {0, 2, 3, 5}.(Lesson 1-3) 3
13. Write an algebraic expression for 2p plus threetimes the difference of m and n. (Lesson 1-6)3(m � n) � 2p
14. State the hypothesis in the statement If 3x � 3 � 24, then x � 7. (Lesson 1-7)3x � 3 � 24
15. A survey of 1756 students at ProspectHigh School was taken, and the results areshown in the circle graph. About howmany students drink water with dinner?(Lesson 1-8) 632
16. Augustus was the first emperor of Rome.He was born in the year 62 B.C. and died in14 A.D. How old was Augustus when hedied? (Lesson 2-2) 76
17. The population of Ohio in 1990 was10,847,115. It rose to 11,353,140 in 2000.What was the average change in populationfor each of the 10 years? (Lesson 2-4)Source: U.S. Census Bureau about 50,603
18. Two dice are rolled, and their difference isrecorded. Find the probability of rolling adifference of less than 2. (Lesson 2-6)
4/9 or 0.44
19. Find ��12255
� to the nearest hundredth.
(Lesson 2-7) 0.45
Record your answers on a sheet of paper.Show your work.
20. Mia has created the chart below to comparethe three cellular phone plans she isconsidering. (Lessons 2-2 and 2-3)
a. Write an algebraic expression that Mia can use to figure the monthly cost of each plan. Use C for the total monthlycost, m for the cost per minute, x for themonthly fee, and y for the minutes usedper month. a–b. See margin.
b. If Mia uses 150 minutes of calls eachmonth, which plan will be leastexpensive? Explain.
21. The stem-and-leaf plot lists the annual profitfor seven small businesses. (Lesson 2-5)a–b. See margin.
a. Explain how the absence of a key couldlead to misinterpreting the data.
b. How do the keys below affect how thedata should be interpreted?
32 � 3.2 32 � 0.32
�
8 cm
Part 2 Short Response/Grid In
Part 3 Extended Response
Stem Leaf
3 2 9
4 1 1 3 5
5 0
Plan Monthly Fee Cost /Minute
A $5.95 $0.30
B $12.95 $0.10
C $19.99 $0.08
Preparing for Standardized TestsFor test-taking strategies and more practice, see pages 867–884.
Juice12%
Soft Drink16%
Sports Drink6%
Milk30%
Water36%
What Do You Drink With Dinner?
www.algebra1.com/standardized_test
Chapter 2 Standardized Test Practice 117
Score Criteria4 A correct solution that is supported
by well-developed, accurateexplanations
3 A generally correct solution, butmay contain minor flaws inreasoning or computation
2 A partially correct interpretationand/or solution to the problem
1 A correct solution with nosupporting evidence or explanation
0 An incorrect solution indicating nomathematical understanding of the concept or task, or no solution is given

Pages 70–72, Lesson 2-1
1. always
2. Sample answer: Absolute value is how far from zero anumber is.
3. Sample answer: Describing directions such as northversus south, or left versus right.
6.
7.
8.
9.
17.
24.
25.
26.
27.
28.
29.
30.
31.
32.
33.
42.
Page 78, Lesson 2-2
71.
Pages 91–93, Lesson 2-5
2. Sample answer:
Line Plot:
Line Graph:
4.
5.
7. The mean and the median both represent the dataaccurately as they are fairly central.
8. Stem | Leaf6 | 4 6 8 8 87 | 1 2 3 68 | 0 1 6 8 89 | 3
64 � 64
����
���
��
��
��
��
��
��
����
��
���
��
��
0 2 4 6 8 10 12 14
� ���
��
� �����
���
10 12 14 16 18 20 22 24
2
3
1
0
4
5
6
7
321 5 74 6
��
� ���
��
�
1 2 3 4 5
Other8%
Leave It25%
Drink It67%
Cereal Milk
�4 2 40�2�6�8�10 8 106
�4 2 40�2�6 8 106
�4 10�3 �2�5�6�7�8�9 �1
2 31�3�4 �2 �1 0
1 20�1 23� 1
3 113 12
323
13�
�1 0�2�3�7 �6 �5 �4
�6�7�8�9 �5 �4 �3 �2
1 2 3 4 5 60�2 �1
�2�7 �6 �5 �4 �3
1 2 3 4 5 6 7 8 9 100�1
�4 1 2 3 40�3 �2�5 �1
Rational Numbers
Integers
WholeNumbers
0 40
�1.25
0.33 2.98�49.98
53�13
�3�24 1
5�
23
12
52
�
�4 10�3 �2�5�6�7�8�9 �1
10�1 � 12
14
25
53
�4 4321�3 �2 �1 0
�4 1 2 3 4 5 6 7 80�3�2�5 �1
117A Chapter 2 Additional Answers
Addit
ion
al
An
swers
for
Ch
apte
r 2
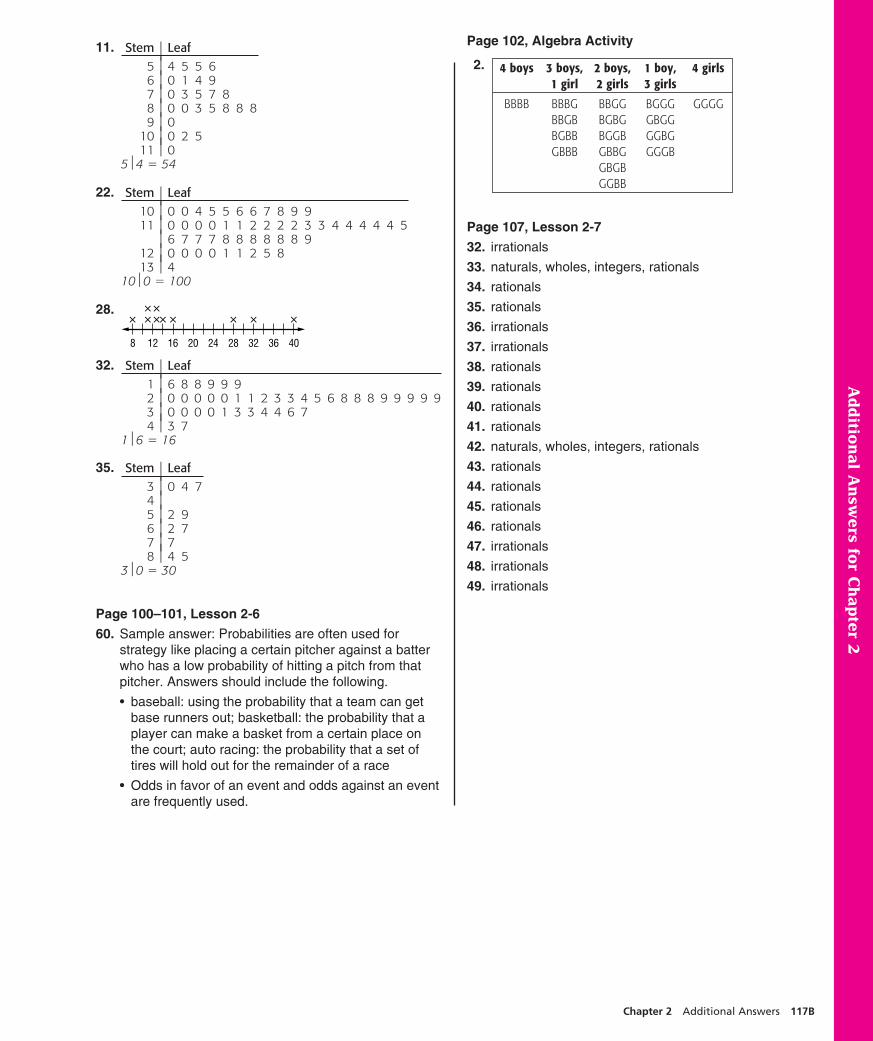
11.
22.
28.
32.
35.
Page 100–101, Lesson 2-6
60. Sample answer: Probabilities are often used forstrategy like placing a certain pitcher against a batterwho has a low probability of hitting a pitch from thatpitcher. Answers should include the following.
• baseball: using the probability that a team can getbase runners out; basketball: the probability that aplayer can make a basket from a certain place onthe court; auto racing: the probability that a set oftires will hold out for the remainder of a race
• Odds in favor of an event and odds against an eventare frequently used.
Page 102, Algebra Activity
2.
Page 107, Lesson 2-7
32. irrationals
33. naturals, wholes, integers, rationals
34. rationals
35. rationals
36. irrationals
37. irrationals
38. rationals
39. rationals
40. rationals
41. rationals
42. naturals, wholes, integers, rationals
43. rationals
44. rationals
45. rationals
46. rationals
47. irrationals
48. irrationals
49. irrationals
4 boys 3 boys, 2 boys, 1 boy, 4 girls1 girl 2 girls 3 girls
BBBB BBBG BBGG BGGG GGGGBBGB BGBG GBGGBGBB BGGB GGBGGBBB GBBG GGGB
GBGBGGBB
Stem | Leaf3 | 0 4 74 |5 | 2 96 | 2 77 | 78 | 4 5
30 � 30
Stem | Leaf1 | 6 8 8 9 9 92 | 0 0 0 0 0 1 1 2 3 3 4 5 6 8 8 8 9 9 9 9 93 | 0 0 0 0 1 3 3 4 4 6 74 | 3 7
16 � 16
� ��
��
� � � � �
8 12 16 20 24 28 32 36 40
Stem | Leaf10 | 0 0 4 5 5 6 6 7 8 9 911 | 0 0 0 0 1 1 2 2 2 2 3 3 4 4 4 4 4 5
| 6 7 7 7 8 8 8 8 8 8 912 | 0 0 0 0 1 1 2 5 813 | 4
100 � 100
Stem | Leaf5 | 4 5 5 66 | 0 1 4 97 | 0 3 5 7 88 | 0 0 3 5 8 8 89 | 0
10 | 0 2 511 | 0
54 � 54
Chapter 2 Additional Answers 117B
Additio
nal A
nsw
ers fo
r Ch
apte
r 2