
CREATION AND DEPLOYMENT OF THE NEREUS ...
181
MIT-Y-03-002 C2 CREATION AND DEPLOYMENT OF THE NEREUS AUTONOMOUS UNDERWATER CHEMICAL ANALYZER AND KEMONAUT, AN ODYSSEY CLASS SUBMARINE Richard Canulli MITSG 03-32TH ~ ~ 0 ~ ~ ~ ~
-
Upload
khangminh22 -
Category
Documents
-
view
1 -
download
0
Transcript of CREATION AND DEPLOYMENT OF THE NEREUS ...
MIT-Y-03-002 C2
CREATION AND DEPLOYMENT OF THE NEREUSAUTONOMOUS UNDERWATER CHEMICAL ANALYZER AND
KEMONAUT, AN ODYSSEY CLASS SUBMARINE
Richard Canulli
MITSG 03-32TH
~ ~ 0 ~
~ ~ ~

CREATION AND DEPLOYMENT OF THE NEREUSAUTONOMOUS UNDERWATER CHEMICAL ANALYZER AND
KEMONAUT, AN ODYSSEY CLASS SUBMARINE
Richard Camilli
MITSG 03-32TH
Sea Grant College ProgramMassachusetts Institute of TechnologyCambridge, Massachusetts 02139
+SF Grant No.: EAR-0330272

Creation and Deployment of the NEREUSAutonomous Underwater Chemical Analyzer and
Kemonaut, an Odyssey Class Submarine
by
Richard Camilli
B,A,, Biology �996!Cheyney University
M.S,, Civil and Environmental Engineering �000!Massachusetts Institute of Technology
Submitted to the Department of Civil and Environmental EngineeringIn Partial Fulfillment of the Requirements for the Degree of
Doctor of Philosophy in Civil and Environmental Engineering
at the
Massachusetts Institute of Technology
June 2003
2003 Massachusetts Institute of TechnologyAll rights reserved
Signature of AuthorDepartment of Civil and Environmental Engineering
November, 2002
Certified byHarold F. Hemond
Professor of Civil and Environmental EngineeringThesis Supervisor
Accepted byOral Buyukozturk
Chairman, Departmental Committee on Graduate Studies

Creation and Deployment of the NEREUS Autonomous UnderwaterChemical Analyzer and Kemonaut, an Odyssey Class Submarine
by
Richard Camilli
Submitted to the Department of Civil and Environmental Engineeringon March 27, 2003 in partial fulfillment of the requirements for
the Doctor of Philosophy in Civil and Environmental Engineering
ABSTAIN CT:
NEREUS is a compact self-contained low-power submersible membrane-inlet massspectrometer, designed to measure dissolved volatile gasses in the water column. It iscapable of intelligent data collection, analysis and state-based mission control whileoperating as a stand-alone instrument or onboard the Kemonaut autonomous underwatervehicle AUV!. Kemonaut is an Odyssey class AUV with increased payload carryingcapacity and dynamic stability, and is intended for &eshwater and coastal marineapplications to depths of 300 meters. The NEREUS-Kemonaut system characteristicsallow for greatly improved dissolved gas data collection rates, accuracy and mappingresolution over presently available technologies, Applications particularly well suited forthe NEREUS-Kemonaut system include identification and mapping of pollution sourcessuch as chemical spills, investigation of enigmatic freshwater and marine ecosystems,assessment of subsurface natural resources and estimation of marine-related greenhousegas cycling.


A gift is pure when it is given from the heart to the right person at the right timeand at the right place, and when we expect nothing in return,
The Bhagavad Gita
To my mother TMs is kind of hefty, so I maCk a special rcfrigcrator magnet to go with it. Scc section 2 2.i!


TABLE OF CONTENTS
Chapter 1 INTRODUCTION.1.1 Autonomous machines.1.2 Autonomous underwater vehicles.1.3 Mass spectrometry .1.4 Autonomous In-situ mass spectrometry1.5 Applications .1.6 System performance.��................,............�......,......,.�...,...,....
Chapter 2 MECHANICAL AND ELECTRONIC HARDWARE.2.1 Vacuum system.
2.1.1 Vacuum envelope.........�,...............,...............�.............�...2.1.2 Inlet apparatus.....�................................�,.............�,..........2.1.3 Ion pump
2.2 Analyzer.2.2.1 Analyzer magnet2.2.2 Cycloid analyzer
2.3 Electronic Control
2.3.1 Embedded computer2.3.2 Communication,.2.3.3 Data acquisition and instrument control2.3.4 Mass Selector.2.3.5 Emission regulator .2.3.6 Electrometer ........,..................,.............�,.............,..........
2.4 Power system2.5 Component housings, frame, and mounting apparatus.
2.5.1 Frame
2.5.2 Mounting plate,2.5.3 Instrument cover2.5.4 Attachment disk2.5.5 Electronics housings .2.5.6 Hardhat protector
2.6 Instrument startup and sphere sealing..Chapter 3 SOFTWARE .....................................,.................................
3.1 Embedded Code ..........,...............................��....�.......,.....,.......3.1.1 Embedded display and user interface .............,...................3.1.2 Instrument Control.
3.1.3 Calibration.............................�,...........,...�..........,.�.........3.1.4 Operational modes .3.1.5 Signal Averaging3.1.6 Data handling.....3.1.7 Data storage. �..
3.2 Supervisory control.3.2.1 Communications protocol.
3.3 Remote Graphical User interface...,...............�...............,..........
.�16
.17
.... 1 9
.�. 20
24
....26
27
�.,28
28
,,29
32
..�34
,... 35
....37
...,41
42
....43
...44
...47
....49
....60
...,62
.....63
.....64
.....65
.....66
.....67
.....68
.....70
.....73
73
.....74
, 76
.....77
80
81
82
82
.....83
...�84
.....86

3.3,1 Main window .,3.3.2 Command initialization,.....3.3,3 Data parsing.�,3.3.4 Data visualization..3.3.5 Data storage and retrieval, ..... �,.......,........ �........�........,
3.4 Quantitative peak evaluation...Chapter 4 AUTONOMOUS UNDERWATER VEHICLE DESIGN
4.1 Odyssey II design overview4.2 Odyssey III design4.3 Kemonaut development
4.3.1 Design and construction..4.3.2 Control and navigation,4.3.3 Assembly �4.3.4 Stability and ballasting........ �,...... �,.......�,......�...... �...
Chapter 5 NEREUS BENCH TESTING.5.1 Dissolved gas gradient sampling .5.2 Computerized operation and noise analysis.5.3 Instrument sensitivity.5.4 Ion fragmentation5.5 Temperature associated peak height variation.
5.5.1 Temperature dependent detection limits5.6 Variability in ion pump efficiency.....,....................�.........,........5.7 Instrument response time. �.......�........�.........�,.........,..........,....5.8 Submerged testing.
Chapter 6 DEPLOYMENT AND SEA TRIALS6.1 Tethered deployments.6.2 Towed deployment..6.3 AUV deployment
Chapter 7 CONCLUSIONS AND FUTURE WORK7.1 Toward routine operation.7.2 System optimization..7.3 Sensor integration and real-tiine data interpretation.7.4 Future prototypes ....
REFERENCESNEREUS CIRCUIT DIAGRAM,NEREUS EMBEDDED CODE .....THETIS SPECTRAL VIEWER CODE .NEREUS DATA INTERPRETER CODE,
�87
.....88
.�.. 89
.....90
.....93
94
...97
..98... 101
... 101
... 103
... 109
... 109
.�... 112
. 115
118
... 120
,. 124
... 125
... 126
128
... 130
... 132
. 137
. 139
139
... 150
.. 157
... 167
,. 168
... 169
... 170
... 171
... 173
... 181
.. 183
203
... 253

TABLE OF FIGURES
19
24
....27
�29Figure 2-3: Membrane compression and sagging resulting from hydrostatic pressure .... 30
39
.41
. 46
55
56Figure 2-19: Power spectral density of electrometer with and without compensator....... 57Figure 2-20: Cross correlation of electrometer noise with and without compensation .... 58Figure 2-21: Power spectrum density comparison of NEREUS and Hemond-Teledyne
electrometers.......,..........59
63Figure 2-23: NEREUS instrument kame................,................,.......................,................ 64Figure 2-24: Mounting plate placement of analyzer, detector and ion pump assemblies. 65Figure 2-25: Composite instrument cover ........................... �........................................ 66
68
69
78Figure 3-2: Valid command string example85Figure 3-3: Thetis Spectral Viewer login window...., .........,...... 87
Figure 3-4; Thetis Spectral Viewer main window....,................................ 88Figure 3-5: Thetis GUI command radio button fields and tool bar .......,.........,..... 89Figure 3-6: Thetis GUI status bar ......,.......,.......,..................................,........... 89
91
92
93
94
98Figure 4-2: Odyssey IId Xanthos AUV ....................,...........................,.......,...... 100Figure 4-3: MIT Sea Grant Odyssey III Caribou AUV............,.......,.......,.......... 101
Figure 1-1: Rendering of the Kemonaut AUVFigure 1-2;NEREUS instrument pictured beside laboratory microscopeFigure 2-1: The NEREUS instrument with upper glass hemisphere removed .....Figure 2-2: Vacuum Envelope cutaway view....,......,....,...
Figure 2-4: Sample inlet apparatusFigure 2-5: Ion pump, cycloid and vacuum envelope assembly.Figure 2-6: Machined ion pump housing..Figure 2-7: Asymmetrically shaped analyzer magnetFigure 2-8: Ion trajectory of cycloidal mass analyzer ...Figure 2-9: NEREUS cycloid tube constructed from a modified CEC 21-620 ....Figure 2-10: Conflat flange with dual BNC feed throughFigure 2-11: Scan controller detailFigure 2-12: Software controlled emission regulator on/off relay.....Figure 2-13: Teledyne parametric op-amp electrometer design by Hemond .....Figure 2-14: Optimal feedback resistor value..Figure 2-15: NEREUS electrometer circuit,Figure 2-16: Electrometer sensitivity vs. sampling frequencyFigure 2-17: NEREUS electrometer .........,.....Figure 2-18: Electrometer shielding and mounting
Figure 2-22: Layout of NEREUS components within pressure sphere
Figure 2-26; Embedded computer with memory card.Figure 2-27: The NEREUS instrument, sealed within its pressure housing....,Figure 3-1: Remote calibration GUI for NEREUS instrument
Figure 3-7: Thetis GUI histogram field with red temporal windowFigure 3 8. Thetis GUI spectrum field......,....,..... �,.........Figure 3-9: Thetis Spectral Viewer main window with data table visible...Figure 3-10: NEREUS Peak Interpreter GUIFigure 4-1: Odyssey I vehicle courtesy of MIT Sea Grant!
.... 3 1
...33
....34
...36
,. 37
....48
....50
51
..53
....54

Figure 4-4:Glass pressure sphere placement within the Keinonaut AUV ��...........�..... 104Figure 4-5: Cut-away view of Kemonaut, exposing upper floatation foam and lift harness
.�,..... 107Figure 4-6: Exploded diagram of Kemonaut vehicle components �....... �......... 108Figure 4-7: Positioning of the NEREUS instrument within the Kemonaut forward
payload bay.... ........ 1 I 0Figure 4-8: Partially assembled Kemonaut, showing the NEREUS instrument and
composite girder "" -""" ....".....",..............�,....... 111Figure 4-9: Structural integrity test of fully laden Kemonaut vehicle... 111Figure 4-10: Kemonaut ballasting in Upper Mystic Lake,,...............,..... 113Figure 5-1: NEREUS setup using Keithley electrometer and 10-turn potentiometer .... 115Figure 5-2: First NEREUS scan completed on January 8, 2002, showing ambient air
spectrum containing water, nitrogen, oxygen, and argon peaks.................�........., 116Figure 5-3: NEREUS ambient air spectrum using on board electrometer with 10' D
feedback resistor, ...,.......................,.............�...........�.......... 117Figure 5-4: Measurements of dissolved gases in a synthesized gradient using Mishawum
Lake water.... . 119Figure 5-5; Conceptual diagram of NEREUS control and data acquisition design........ 121Figure 5-6: Ambient air spectruin, performed using computer control and data acquisition
at mass step interval = 0.1 M/Z. This spectrum reveals the presence of nitrogen,oxygen, argon, water vapor, and carbon dioxide....................,...................,.. 122
Figure 5-7: Comparison of typical noise characteristics of the NEREUS instrument whenoperated using differing signal averaging regimes...............,..... 123
Figure 5-8: RMS noise versus time required for completion of a high resolution, 1385data point, scan using a 100MHz embedded computer �....,.............�,...... 123
Figure 5-9: A high-resolution spectrum of ambient air detailing nitrogen gas and anapparent ' N-' N isotopic peak..�,....... �...........,............,............,.............,.......... 124
Figure 5-10: 'Qon peak height of dissolved gases in atmospheric equilibrium as a functionof temperature.�,...............,...........�...........,...........�.............,.......................,..... 127
Figure 5-11: Model of NEREUS ion peak height sensitivity as a function of temperature.Data points are normalized to NEREUS spectrum data from filtered water at 22'C,
.�... 128Figure 5-12: NEREUS ion signal variability, recorded while submerged in a flume.Spectrum scans executed using a peak jumping algorithm.........,............,... 131
Figure 5-13: Calculated overall NEREUS time to steady state measurement for variousgases .. ........ .. ..... 1 34
Figure 5-14: NEREUS time response to carbon dioxide ...........,.... 135Figure 5-15: Time response of Hemond backpack portable mass spectrometer to nitrogen
gas .. ...,.... .... ..,..................... 1 36Figure 5-16: NEREUS time response to benzene....................�............,..........��... 137Figure 6-1: Tethered NEREUS configuration with Hydrolab ...,................ 140Figure 6-2: NEREUS spectrum Rom at 2 meters depth in the Halls Brook Holding Area
,...... .... .,.............,..........,................ 1 4 IFigure 6-3: NEREUS depth profile of ion peaks in the Halls Brook Holding Area....... 142Figure 6-4: Hydrolab depth profile of dissolved oxygen, salinity and temperature in the
Halls Brook Holding Area ....,.....,...................................................�.... 142
10

Figure 6-5: Location of tethered NEREUS deployment in Boston Harbor ...........�......, 143Figure 6-6: Microscopic comparison of a new membrane left!, and after heat forming
Figure 6-22;Nautical Chart of Boston Harbor showing GIB placement and overall area of159
160
162Figure 6-25: 3-dimensional GIB hydrophone track log of Kemonaut dive missions.... 163Figure 6-26: A typical NEREUS spectrum that was recorded while onboard the
Kemonaut AUV, showing dissolved nitrogen, oxygen and argon......,.........,......... 165Figure 6-27: NEREUS record of dissolved gas ion signal during Kemonaut deployinentin Boston Harbor. 165
....23
....40
...43
47.........60
.........61
62..;...... 75
......... 77
......... 85
...... 118
,..... 125
11
and deployment to 12 meters depth right! .Figure 6-7: Boston Harbor spectrum at 1.5 meters depth,Figure 6-8: Boston Harbor spectrum at 3 meters depth.Figure 6-9: Boston Harbor spectrum at 4.5 meters depth......Figure 6-10: Boston Harbor spectrum at 6 meters depth �......., .............Figure 6-11: Boston Harbor spectrum at 7.5 meters depth ...Figure 6-12: Boston Harbor spectrum at 9 meters depth.Figure 6-13: Boston Harbor spectrum at 10.5 meters depth,Figure 6-14: Boston Harbor spectrum at 12 meters depthFigure 6-15: Depth profile of Boston HarborFigure 6-16: Oxygen signal correlation of NEREUS and Hydrolab data from Boston
Harbor
Figure 6-17: 3-D map of towed NEREUS deployments in Upper Mystic Lake ..�......Figure 6-18; Oxygen signal correlation of NEREUS and Hydrolab data from Upper
Mystic Lake, Dec. 13.�....Figure 6-19: Oxygen signal correlation of NEREUS and Hydrolab data &om Upper
Mystic Lake, Dec. 15Figure 6-20: Chemical profile of Upper Mystic Lake, December 15, 2002 .......�........Figure 6-21: The Kemonaut AUV prior to deployment in Boston Harbor..............,.....
operation .
Figure 6-23: Kemonaut pressure transducer record �... �,.......,.........,................Figure 6-24:2-D GIB hydrophone surface track log of Kemonaut dive missions
Table 1-1: Comparison of submersible mass spectrometer specifications,...Table 2-1: Cycloid pin out,Table 2-2: Waterproof cable pin assignments ...........,......,........ �.......�....Table 2-3: Cycloid electric field potentialsTable 2-4: Power system wiring harness connectorTable 2-5: Current requirements and fuse ratings of electronic circuits....,...Table 2-6: 10 base-T power connector wiring.........,.....,....Table 3-1: Embedded computer BIOS settingsTable 3-2 Parallel port registers and functionsTable 3-3 Command string functional elements and values ..Table 5-1: Approximate scan input potentials.Table 5-2: Ion 6agmentation ratios ............,.......,........,.........�........�.......
144
145
145
146
146
147
147
148
148
149
153
154
156
157

Equation 2-1: Fundamental thermal noise of feedback resistor . �,, ...50Equation 3-1: Mass calibration equation,, �, . �,....,, �. 79Equation 3-2: Peak-finding algorithm ....................�........�,...........�............,..........,...... 95Equation 5-1: Membrane permeability as a function of temperature,..........................,. 127Equation 5-2: Inlet gas flux as a function of membrane geometry, permeability, and gas
concentration. ... 129Equation 5-3: Fick's second law of diffusion.....,.................,............,..........�,.... 133Equation 5-4: Analyte gas influx,.......,.......,..........�...........,............�.............,......... 133Equation 5-5: Membrane response time lag .......,..................,.........,.. 133
12

13

16 century painting of Alexander The Great descending in a glass diving bell
14

Chapter 1
INTRODUCTION
The aquatic environment is interwoven throughout the history of mankind, serving asa transportation conduit as well as a source of sustenance, religion, wealth, beauty anddeath. Approximately 37/0 of the world's population lives within 100 km of an ocean [1],yet humanity's understanding of the hydrosphere has remained extremely limited. Atpresent, our understanding of the dark side of the moon exceeds what is known about thebottom of the Eath's oceans. Like the surface of the moon, the submarine environment isinhospitable to humans, requiring technological devices for exploration, and since ancienttimes mankind has sought to observe the submarine environment in-situ. Writings asearly as Aristotle's Physika Problemata chronicle the use of submergence systems that,"enable the divers to respire equally well by letting down a cauldron; for this does not fillwith water, but retains the air, for it is forced down straight into the water; since, if itinclines at all from an upright position, the water flows in" [2]. Many legends alsosurround Alexander The Great's use of a diving bell [3], known as the Colimpha, duringhis siege of Tyre to observe demolition divers removing underwater obstacles from theharbor. The advantages of in-situ observation have persisted through modern times,leading to the use of manned submersibles such as the Trieste, Archimede, Alvin, andNR1 for scientific survey of the deep [4]. Although extremely useful, the danger andoperational costs associated with these manned submersibles [5] have prompted thedevelopment of smaller robotic survey platforms, including buoyed sensors, drifters,remotely operated vehicles ROVs!, and autonomous underwater vehicles AUVs!.AUVs, which are the newest of these technologies, are doubtlessly the most challengingof the unmanned systems to develop because of their reliance on embedded expertsystems for navigation control and operations decision-making, but they also appear tohold the greatest promise.
15
1.1 Autonomous machines
Water clocks, arguably. the first autonomous machines, have existed since at least the
reign of Amenhotep I in Ancient Egypt, some 3500 years ago. Over the millennia
technological advancement has expanded the domain autonomous machines to include
the steam engine built by Hero of Alexandria in 100 AD and the mechanical automata of
General de Gennes, Jacques de Vaucanson and Henri Maliardet in the 17 through 19'"centuries [6], but it was not until the latter half of the 19 century that the fundamental
value of closed-loop feedback in control systems was recognized [7]. Shortly thereafter,the advent of long-range weapons systems and telephone switching electronics initiatedthe rapid development of highly accurate inertial guidance systems for warships andaircraft. By WWII control and guidance systems had advanced to the point of allowingunmanned weapons such as the Vengeance I buzz bomb, an early form of cruise missile,
to be used against Britain, a technological accomplishment that cost the lives of
thousands of people. Ironically, the M9 gun director and SCR-584 radar system, a thenradically advanced type of semi-autonomous anti-aircraft weapon capable of automatictarget tracking and firing, was used to fend off the buzz bombs, downing 57'/0 of themissiles that they engaged [7].
During this same wartime period less sinister autonomous systems were under
development in England by an American neurological researcher, W. Grey Walter. Hiscreations, a light and impact-sensitive mobile robot named Machina specularrix and alater, more advanced, mobile robot further equipped with memory and sound sensitivity,Machina docilis, were used to deinonstrate that machines could exhibit traits of
spontaneity, autonomy, Pavlovian conditioning, and self-regulation, While studying thesemachines, Walter identified several emergent behaviors that were sufficientlysophisticated to be described in anthropomorphized terms such as "speculative mode","learning", "reflex" and "&ee will" [8, 9]. In the decades since Walter's work a great
deal of research has been dedicated to developing autonomous agents which rely onembedded intelligence to operate within complex natural environments in order to fulfill
predetermined mission objectives. The resulting multitude of highly specialized systemsincludes, among others, walking robots such as Genghis [10], space probes such as the
16

DSl [11], and autonomous unmanned submersibles including the MIT Odyssey ClassAUVs [12].
1.2 Autonomous underwater vehicles
Although AUV use for oceanographic research complements the strengths of mannedsubmersibles and tethered robotic vehicles, the challenges and benefits of AUVoperations are fundamentally different from those of existing platforms [13!. As a result,AUV technologies are evolving in a mche where they will serve as a low-cost mechanismfor "spatio-temporal sampling; using multiple vehicles in combination for mapping outrapidly evolving phenomen[a]; and transiting long distances to a site for makingobservations as a part of a first response team at the sight of interest" [14]. Unlike otherunmanned platforms such as moorings, tow fish, and remotely operated vehicles, anAUV does not require a tether, thus allowing a spatial survey to be conducted faster,follow bathymetry better and operate in high sea states; translating into increased datacollection per unit time or cost, especially when a priori knowledge of the survey area islimited. Presently, there are several dozen types of AUVs in operation around the world,ranging in size f'rom the diminutive 37 kg 1.6 meter long REMUS vehicle [15], to themassive 12 meter long ISE Theseus with its one-ton cargo capacity [16]. In recent yearsseveral AUV designs have transitioned f'rom the experimental stages into commerciallyavailable vehicles, including the Kongsberg Hugin 3000 and the MIT allied BluefinOdyssey III.
The Odyssey Class AUVs, originally developed at MIT Sea Grant, are relativelysmall, easily deployable, low component cost survey platforms that have been used innumerous missions throughout the world [13]. These vehicles make use of low-cost, massproduced, hollow glass spheres to house vehicle electronics, sensors and power systemsin a dry, one-atmosphere environment. This maximizes buoyancy efficiency and permitsthe use of a free flooding vehicle fairing, thus minimizing vehicle displacement.However, the minimization of vehicle displacement makes the tradeoff between range i.e. power storage! and payload capacity a critical design consideration [17].
There is a need for in-situ chemical sensors for AUVs. The creation of such sensorspresents significant challenges, particularly for smaller vehicles like the Odyssey class
17

designs. Issues such as size, power consumption, and instrument signal stability have,until recently, excluded the use of highly capable analytical instruments such as massspectrometers and gas chromatographs on these platforms. Thus, AUV generatedchemical data has usually been limited to a select few parameters using ion-sensitiveelectrodes, mainly: dissolved oxygen, salinity, ORP, pH, nitrate, phosphate and ammonia.However, as Bales and Levine aptly state, "To achieve widespread acceptance within theoceanographic community, AUVs must also deliver, as a minimum, data of coinparablequality to that collected today. Sensing and measurement systems designed fordeployment &om the surface e.g. on a sampling rosette or tow-body! do not always meetthe size and power limits imposed by AUVs" [18]. In general, ion-sensitive electrodes donot meet this stringent standard.
This research focuses on an emerging role of mass spectrometry for submerged,autonomous, in-situ operation. Specifically, we detail the development and deploymentof the Kemonaut AUV and the NEREUS autonomous submersible mass spectrometer.The Kemonaut is a small, shallow water, AUV capable of operating to depths of 300meters. It possesses a unique forward payload bay for carrying scientific instrumentation,such as NEREUS. The NEREUS instrument provides a means for rapid and i~-situquantification of many gases which have, until now, required offsite analysis, AlthoughNEREUS is designed for operation aboard the Kemonaut AUV Figure 1-1!, it can alsobe used within a Bluefin Odyssey III AUV as well as a host of other platforms.Operation of the NEREUS instrument onboard an autonomous underwater vehicleenhances the advantages ofin-situ analysis of dissolved volatile chemicals by increasingthe range and overall accessibility of data collection areas.

Figure 1-1: Rendering of the Kemouaut AUV
1.3 Mass spectrometry
The principles of mass spectrometric analysis are well understood. Ion repulsion andattraction, a central phenomenon governing mass spectrometry, was observed nearly 150years ago by J. Plucker in his investigations of magnetically induced light patterndeformations within a glow tube. In 1897 J.J. Thomson demonstrated that cathode rayscauld be deflected by electrostatic and magnetic fields [19], followed in 1898 by W.Wein's discovery that a type of ray emitted during electrical discharge at low pressure,known at that time as a Goldenstein ray, was actually a positively charged ion beam andcould also be deflected by a magnetic field [20]. This phenomenon was later elucidatedwith Thomson's investigations of the parabolic trajectories of hydrocarbons and otherpolyatomic ions in his book, Rays of Positive Electricity and Their Application toChemical Analyses [21]; thus establishing that ions could be separated based on theirmass to charge ratio when accelerated through a magnetic field. From this work came themass spectrograph, a predecessor of the mass spectrometer, which relies on a
photographic plate to record the presence of ion beams. However, the variable ionsensitivity of this early iiistrument's photographic plate prohibited precise quantificationof ion intensity. For this reason, Thomson modified his parabola mass spectrographthrough replacement of the photographic plate with a Faraday cup and electroscope. Byvarying the magnetic field strength and measuring the resultant ion current, he thereby
19

created the first mass spectrometer and produced a mass spectrum that quantitativelydescribed the relative abundances of individual gases present in a mixture [22]. The termsmass spectrometer and mass spectrograph would be later coined by F.W. Aston in 1920[20].
In subsequent years mass spectrometers have evolved to aHow for precise massdeterminations, measurement of relative ion abundances, and electron impact studies.This has lead to mass spectrometric analysis becoming a standard procedure in a widerange of investigations outside chemistry and physics, including among others, industrialprocess control, clinical diagnoses, isotope fractionation, radioactive half-lifedeterminations, and environmental monitoring. In 1942 Consolidated EngineeringCorporation built the world's first commercially available mass spectrometer for theAtlantic Refining Corporation [20]. As new applications have emerged, specializedinstruments have been developed to better suit particular constraints, resulting in highlyinnovative component variations such as ion source, mass selector, and detector.Technological advancements, particularly in the areas of integrated circuitry andmaterials science such as magnetic materials! have permitted the developinent of morecompact mass spectrometers. This, in turn, has enabled mass spectrometers for in-situinvestigations ranging from terrestrial battlefields [23], to Jupiter's atmosphere [24].These "field portable" instruments were reduced in size and ruggedized to be transportedby spacecraft [25], aircraft [26], and large land vehicles [27, 28] . More recently, ageneration of miniaturized mass spectrometers have been developed which aresuflciently compact and lightweight to be carried by a person to a measurement site [23,29-31].
'I.4 Autonomous In-situ mass spectrometry
Mass spectrometers are well suited for autonomous in-situ analysis of dissolved gasesin a water col~ because a mass spectrometer can quickly detect multiple dissolvedchemicals at low concentrations, and can work without exhaust or consumable reagents.By implementing automated control and data processing such as calibration andfragment peak separation! sample components can be quickly identified and quantified inthe presence of mixtures. In contrast, conventional environmental chemical analysis
20

such as gas chromatography or wet chemistry involves collecting and transportingsamples to a laboratory for off-site analysis, resulting in sampling and measurement thatis generally labor intensive and time-consuming. Additionally, error often arises becauseof chemical and physical changes occurring to the sample during transport such asdegassing and biological or photochemical degradation. Although in-situ devices such asdissolved oxygen probes avoid the drawbacks encountered with off-site analysis, they arecommonly limited to detecting one or a few gas species [32], with separate sensorsrequired for each specie and sensitivities of typically about 1 ppm. Continuous samphngtechniques, such as the Weiss equilibrator, are generally limited to shipboard use withmodest sampling depths, and have equilibration times that vaiy with gas species andrange &om minutes to hours [33, 34]. The resulting data sparseness often leads totemporal aliasing translating into spatial aliasing when sampling from a movingplatform!, which can mask important chemical and biological features in an aquaticenvironment.
Various approaches have been undertaken to address the design constraints ofsubmersible mass spectrometer operation. Instruments such as the TUHH submersiblemembrane introduction gas chromatograph � mass spectrometer GCMS! use acommercially available EM640 field portable GCMS housed within a cylindrical metalpressure vessel [35!. This system, which uses a hollow fiber analyte introduction system,displaces approximately 400 kg and draws several hundred watts, requiring that itfunction aboard a remotely operated vehicle ROY! which is powered and controlled viaa tether &om a surface ship.
Recently AUVs have been developed with reliability, payload carrying capacity, andmission endurance adequate for deployment of a mass spectrometer. Nevertheless, massspectrometer operation aboard an AUV still introduces several critical instrument payloaddesign constraints, including manditory autonomous operation, small size, andexceptionally low power consumption [14]. Instruments such as the University of SouthFlorida Center for Ocean Technology's COT! quadrupole and ion trap massspectrometers [36] utilize off-the-shelf but repackaged Leybold Inficon Transpector andVarian Saturn 2000 analyzers, respectively. Both use a membrane inlet system designedfor operation aboard an AUV. The COT quadrupole instrument has been deployed aboard
21.
the 6.4 meter 1,4 ton displacement ARCS AUV [37], but both systems consume power at
high rates in excess of 100 watts!, have delicate membrane inlet systems that limit depth
of operation to 30 meters and sampling rates no greater than 12 samples per hour for their
operating time of a few hours,
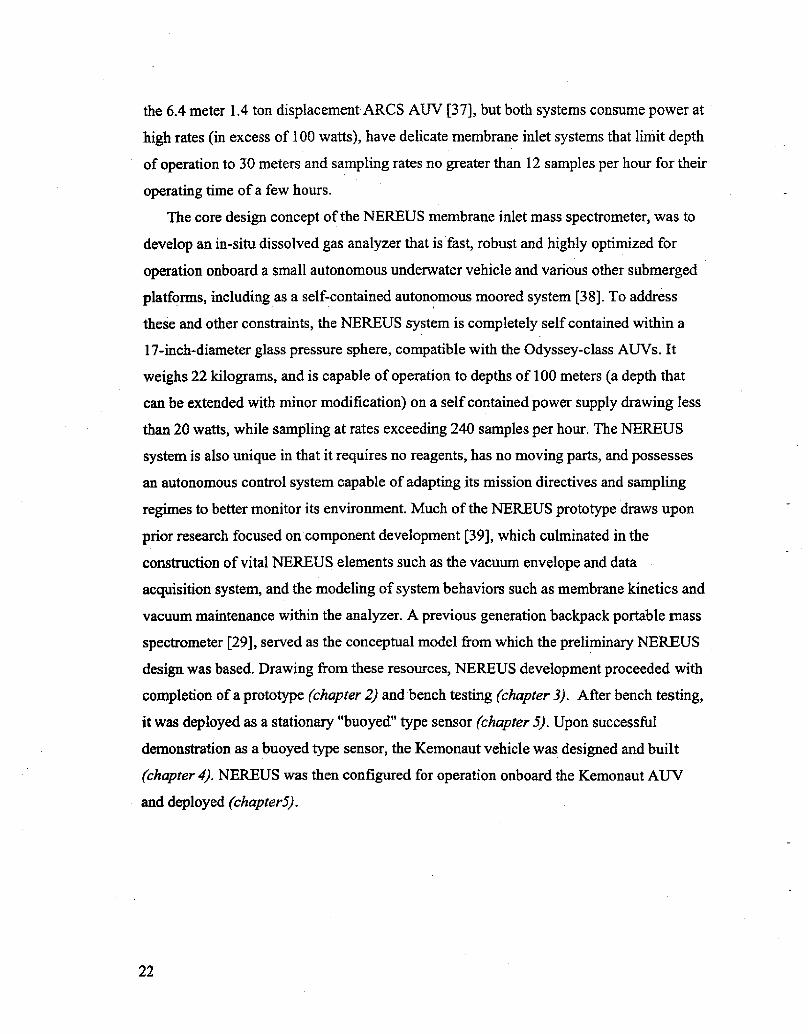
The core design concept of the NEREUS membrane inlet mass spectrometer, was to
develop an in-situ dissolved gas analyzer that is fast, robust and highly optimized for
operation onboard a small autonomous underwater vehicle and various other submerged
platforms, including as a self-contained autonomous moored system [38]. To address
these and other constraints, the NEREUS system is completely self contained within a
17-inch-diaineter glass pressure sphere, compatible with the Odyssey-class AUVs. It
weighs 22 kilograms, and is capable of operation to depths of 100 meters a depth that
can be extended with minor modification! on a self contained power supply drawing less
than 20 watts, while sampling at rates exceeding 240 samples per hour. The NEREUS
system is also unique in that it requires no reagents, has no moving parts, and possesses
an autonomous control system capable of adapting its mission directives and sampling
regimes to better monitor its environment. Much of the NEREUS prototype draws upon
prior research focused on component development [39], which culminated in the
construction of vital NEREUS elements such as the vacuum envelope and data
acquisition system, and the modehng of system behaviors such as membrane kinetics and
vacuum maintenance within the analyzer. A previous generation backpack portable mass
spectrometer [29], served as the conceptual model from which the preliminary NEREUS
design was based, Drawing from these resources, NEREUS development proceeded with
completion of a prototype chapter 2! and bench testing chapter 3!. After bench testing,
it was deployed as a stationary "buoyed" type sensor chapter 5!. Upon successful
demonstration as a buoyed type sensor, the Kemonaut vehicle was designed and built
chapter 4!. NEREUS was then configured for operation onboard the Kemonaut AUV
and deployed chapter5!.
22
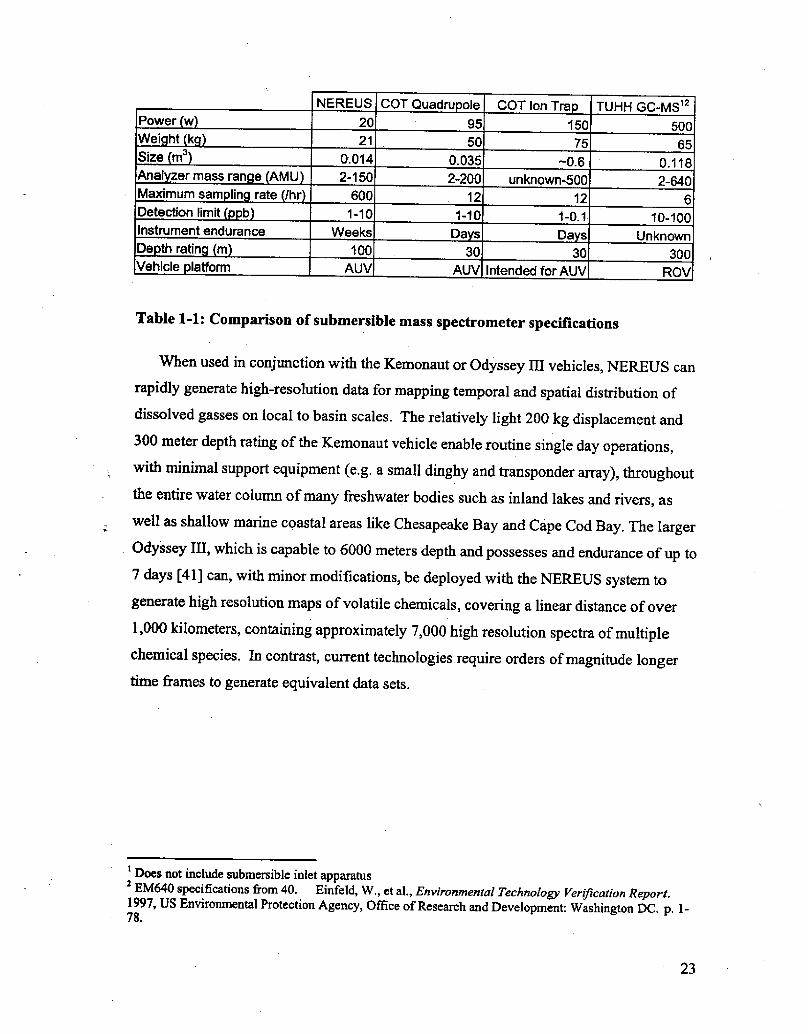
COT lon Tra TUHH GC-MS"NEREUS COT Quadru ole
20 95 150 500Power w
Wei ht k 7521 65Size m' 0.014 0.035 -0.6 0.11B
2-150 2-200Anat zer mass ran e AMU unknown-500 2-640600Maximum sam lin rate /hr
Detection limit b1212
1-10 1-10 10-100WeeksInstrument endurance
De thratin mDa s Da s Unknown
100 30 30 300Vehicle latform AUV RQVAUV Intended for AUV
Table 1-1: Comparison of submersible mass spectrometer specifications
' Does not include submersible inlet apparatusEM640 specifications from 40, Einfetd, W., et al., Environmental Technology Verificarion ReporI,
l 997, US Environmental Protection Agency, Office of Research and Development; Washington DC p. l-78.
23
When used in conjunction with the Kemonaut or Odyssey III vehicles, NEREUS canrapidly generate high-resolution data for mapping temporal and spatial distribution ofdissolved gasses on local to basin scales. The relatively light 200 kg displacement and300 meter depth rating of the Kemonaut vehicle enable routine single day operations,with minimal support equipment e,g. a small dinghy and transponder array!, throughoutthe entire water column of many freshwater bodies such as inland lakes and rivers, aswell as shallow marine coastal areas like Chesapeake Bay and Cape Cod Bay. The largerOdyssey III, which is capable to 6000 meters depth and possesses and endurance of up to7 days [41] can, with minor modifications, be deployed with the NEREUS system togenerate high resolution maps of volatile chemicals, covering a linear distance of over1,000 kilometers, containing approximately 7,000 high resolution spectra of multiplechemical species. In contrast, current technologies. require orders of magnitude longertime &ames to generate equivalent data sets.
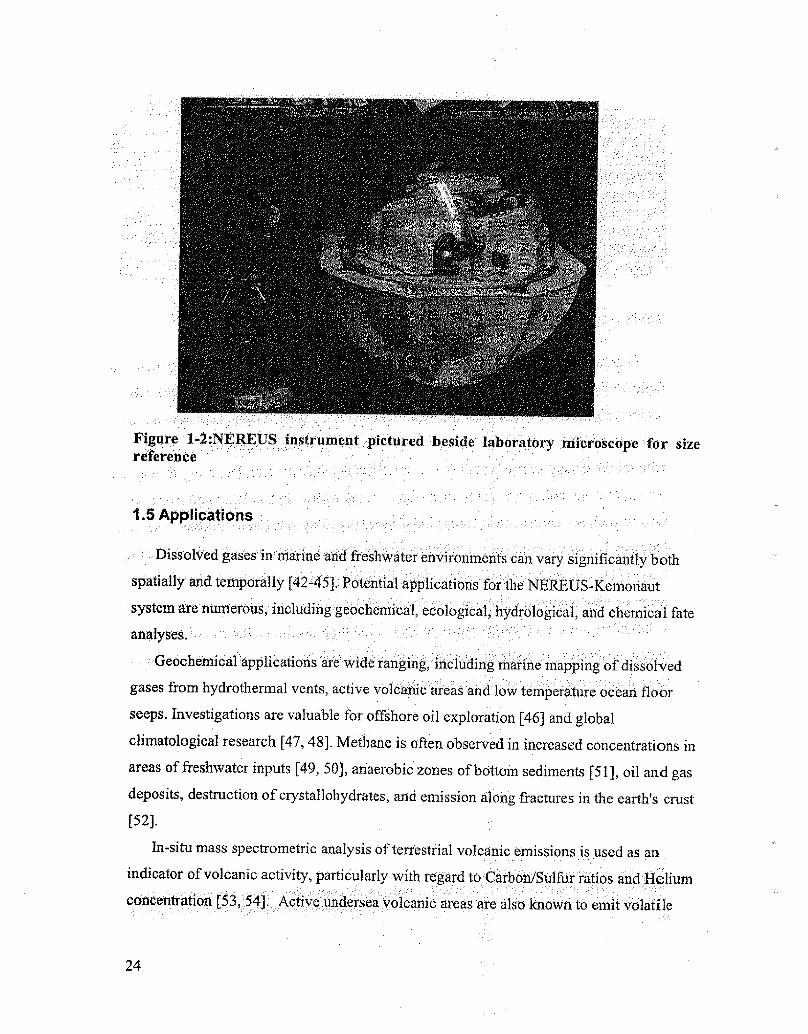
Figure 1-2:NEREUS instrument pictured beside laboratory microscope for sizereference
1.5 AppIIcalions
Dissolved gases in marine and freshwater environments can vary significantly bothspatially and temporally [42-45j, Potential applications for the NEREUS-Kemonaut
system are numerous, including geochemical, ecological, hydrological, and chemical fateanalyses.
Geochemical applications are wide ranging� including marine mapping of dissolvedgases &om hydrothermal vents, active volcanic areas and low temperature ocean floorseeps. Investigations are valuable for offshore oil exploration [46j and global
climatological research [47, 48j. Methane is often observed in increased concentrations in
areas of freshwater inputs [49, 50j, anaerobic zones of bottom sediments [S 1 j, oil and gasdeposits, destruction of crystallohydrates, and emission along fractures in the earth's crust[52j.
In-situ mass spectrometric analysis of terrestrial volcanic ermssions is used as an
indicator of volcanic activity, particularly with regard to Carboru'Sulfur ratios and Helium
concentration [53, 54j. Active undersea volcanic areas are also known to emit volatile

chemicals into the water column [55-58], Thus, analysis of gases dissolved in marinewaters may be useful for predicting undersea eruption events. For example, Kick'emJe'nny, aii undersea volcano just north of the island of Grenada last erupted in Decemberof 2001, Micro-beam survey of the volcano has revealed a massive horseshoe shapedfault scar which most likely resulted Rom a major slope failure of an earlier cone,
suggests that the volcano may be unstable and a future hazard for the region [59], Surveyof dissolved chemicals such as SOq, CO~, and He in waters overlaying the cone crater,which lies about 190 meters below the sea surface, may be useful in predicting theactivity of the volcano. Advanced warning of impending eruptions are particularlyimportant in volcanic regions such as this to allow adequate time for evacuation of nearbyislands to prevent large scale loss of life [60, 61].
Deep-sea hydrothermal vents have also been subjects of increased interest for globalclimatological and biological research. For example, sources such as anhydrite chimneysof the North Fiji Basin have been shown to emit gases in concentrations exceeding 14,5parts per thousand of carbon dioxide, 49 ppm of methane, and approximately 937 ppb ofhelium [62].' In some cases, the reduced gases from these vents are known to give rise toentire chemosynthetic ecosysteins [63, 64] which oxidize methane or sulfide to produceenergy. Detection of gases at these concentrations is possible with the NERUSinstrument.
Hydrologic research often utilizes dissolved gas data to determine source and age ofwaters. NEREUS is a potentially convenient tool for studying mixing of waters inmarine and fresh water bodies. Concentrations of oxygen, nitrogen, carbon dioxide, andmethane can provide valuable clues as to origins and inflow rates of ground and surfacewaters into lakes, rivers, and coastal areas [65, 66]. The ability of the NEREUS systemto identify and quantify the distribution of these biogenic gases in a water column is alsousef'ul for many aspects of ecological research. High spatial and temporal resolution datais valuable for monitoring phenomena such as algal blooms, seasonal stratification &
turnover, productivity, and eutrophication [43]. In addition, the NEREUS system couldbe used to unobtrusively monitor water quality, especially urban runoff shipping lanes,and point sources of pollution such as sewage outfalls [18].
For consistency, concentrations are expressed as a mass fraction
25

Mapping of marine oil spills for impact assessment and cleanup is yet another
potential NEREUS application. Oil spill surveillance relies almost exclusively on remotesensing such as infrared, ultraviolet, and radar imaging from satellites and planes [67,68]. These approaches are only suitable for detecting surface slicks, and are unable to
detect dissolved petroleum fractions at depth. Oil spill assessment based on surface slick
as well as sub-surface data is important when DNAPL or water-soluble &actions are
present and when wave induced mixing is a factor, For instance, approximately 77 /0 ofthe 825,000 gallons of petroleum from the North Cape oil spill was dispersed into thewater column [69], Estimates of this spill's size, based upon oil-slick area,
underestimated the magnitude of the disaster, thus contributing to an ill-prepared cleanupresponse. Although NEREUS would be unable to detect many of the heavier
hydrocarbons with low volatility or mass to charge ratios greater than 150, such as poly-aromatic hydrocarbons in an occurrence such as this, NEREUS sensitivity models predictdetect limits of many petroleum fractions, including benzene, toluene, butane, andmethane in concentrations down to the tens of parts-per-billion level. Furthermore, thepetroleum "fingerprinting" may be possible based on the relative distribution of these
hydrocarbon constituents [70].
1.6 System performance
Freshwater and marine deployments have been conducted with the NEREUS
instrument and the Kemonaut AUV. Tethered and towed operations of the NEREUSinstrument have established the ability to map dissolved volatile chemical species in thewater column. Sea trials of the Kemonaut AUV demonstrated the unique ability of thisOdyssey class AUV to carry the NEREUS instrument as payload. Analysis of vehicledesign and performance indicates that the Kemonaut-NEREUS combination is well
suited for scientific survey of dissolved gases in &eshwater and marine environments to
depths of 100 meters. NEREUS data collected during these operations confirm the abilityof the instrument to efficiently collect meaningful chemical data in a variety of platformconfigurations.
26

Chapter 2
MECHANICAL AND ELECTRONIC
HARDWARE
The NEREUS instrument is fully self-contained within a 17" Benthos glass pressuresphere Figure 2-1!. This housing was chosen based on its compatibility with Odysseyclass AUVs and its ability to withstand the high compressive loads experienced at
abystnal depths. Design and construction of the prototype for operation onboard the
AUV, while within the pressure sphere, required careful analysis and optimization.
Foremost among design concerns were: instrument miniaturization, response time
minimization, chemical sensitivity maximization, power consumption minimization to
Figure 2-1: The NEREUS instrument with upper glass hemisphere removed
27

Mapping of marine oil spills for impact assessment and cleanup is yet another
potential NEREUS application. Oil spill surveillance relies almost exclusively on remote
' sensing such as infrared, ultraviolet, and radar imaging from satellites and planes [67,68]. These approaches are only suitable for detecting surface slicks, and are unable to
detect dissolved petroleum fractions at depth. Oil spill assessment based on surface slick
as well as sub-surface data is important when DNAPL or water-soluble fractions are
present and when wave induced mixing is a factor, For instance, approximately 77'10 ofthe 825,000 gallons of petroleum &om the North Cape oil spill was dispersed into thewater column [69]. Estimates of this spill's size, based upon oil-slick area,
underestimated the magnitude of the disaster, thus contributing to an ill-prepared cleanupresponse. Although NEREUS would be unable to detect many of the heavier
hydrocarbons with low volatility or mass to charge ratios greater than 150, such as poly-aromatic hydrocarbons in an occurrence such as this, NEREUS sensitivity models predictdetect limits of many petroleum fractions, including benzene, toluene, butane, and
methane in concentrations down to the tens of parts-per-billion level. Furthermore, the
petroleum "fingerprinting" may be possible based on the relative distribution of these
hydrocarbon constituents [70].
1.6 System performance
Freshwater and marine deployments have been conducted with the NEREUS
instrument and the Kemonaut AUV. Tethered and towed operations of the NEREUS
instrument have established the ability to map dissolved volatile chemical species in thewater column. Sea trials of the Kemonaut AUV demonstrated the unique ability of this
Odyssey class AUV to carry the NEREUS instrument as payload. Analysis of vehicledesign and performance indicates that the Kemonaut-NEREUS combination is well
suited for scientific survey of dissolved gases in &eshwater and marine environments to
depths of 100 meters. NEREUS data collected during these operations confirm the abilityof the instrument to efficiently collect meaningful chemical data in a variety of platformconfigurations.
26

less than 25 watts, ultra-high vacuum maintenance within the vacuum system,
autonomous operation and data interpretation, resistance to vibration, impact, and roll-
over. NEREUS can be ostensibly divided into five component ~.oups: vacuum system,analyzer, electronic hardware, software, and mounting apparatus,
2.1 Vacuum system
Two paramount challenges to submerged deployment of marine sensors are to survive
the hydrostatic pressures encountered at depth and the corrosive effects of seawater. In
addition to those considerations, in-situ mass spectrometer design presents the uniquerequirements of ultra-high vacuum and magnetic field maintenance. Therefore, thevacuum system, which consists of the membrane inlet apparatus, inlet tube, vacuum
envelope, and ion pump were fabricated using ¹304 stainless steel. Although stainlesssteel is generally more porous to gases than other metals such as aluminum, 304 stainless
was chosen for constructing the sample inlet apparatus, sphere penetration, inlet line, andvacuum envelope, based on weldability, low magnetic permeability, chemical inertness,and mechanical strength. Like the pressure sphere, the sa.mple inlet apparatus, whichserves as the interface between NEREUS' high vacuum analyzer and its aquatic
environment, is required to withstand ambient hydrostatic pressure. In addition toexternal pressure considerations, the inlet system must also allow for adequatepermeation of analyte gases into the vacuum chamber while maintaining an internalvacuum of no greater than 10 Torr;
2.1.1 Vacuum envelope
The vacuum envelope is roughly the size of the soft drink can Figure 2-2! and wasdesigned to be small enough to fit within the pressure sphere, yet permit satisfactoryconductance of excess gases into the ion pump [39]. Volume minimization also serves to
decrease the overall vacuum system's internal volume, thereby minimizing pump downrequirements and increasing conductance, thus decreasing the residence time of analytegases in the region of the cycloid. The cycloid maintains a high vacuum seal with the
vacuum envelope by way of eight bolts that firmly compresses a 2.112" diameter PTFE
0-ring between the 3 3/8" diameter envelope flange and the cycloid flange.
28

Figure 2-2: Vacuum Envelope cutaway view
2.1.2 Inlet apparatus
Preferential selectivity of dissolved gases over water and water vapor is accomplishedby means of a thin semi-permeable membrane that is passively exposed to the watercolumn, thereby allowing analyte gases to diffuse into the vacuum system. Themembrane inlet is positioned outside the pressure sphere and connected to the analyzerwith a small diameter approximately 2mm! flexible stainless steel inlet tube. The inlet
tube traverses the lower hemisphere through a .6 inch diameter penetration point and 1.5"diameter mounting flat. Although differing in dimension and backing plate material, thisinlet design is similar to the membrane inlet described by Hoch and Kok to permitcontinuous sampling of gases from photosynthetic organisms, that utilizes a thin
polyethylene sheet which is held in place over a porous plate by a threaded annular crew
29
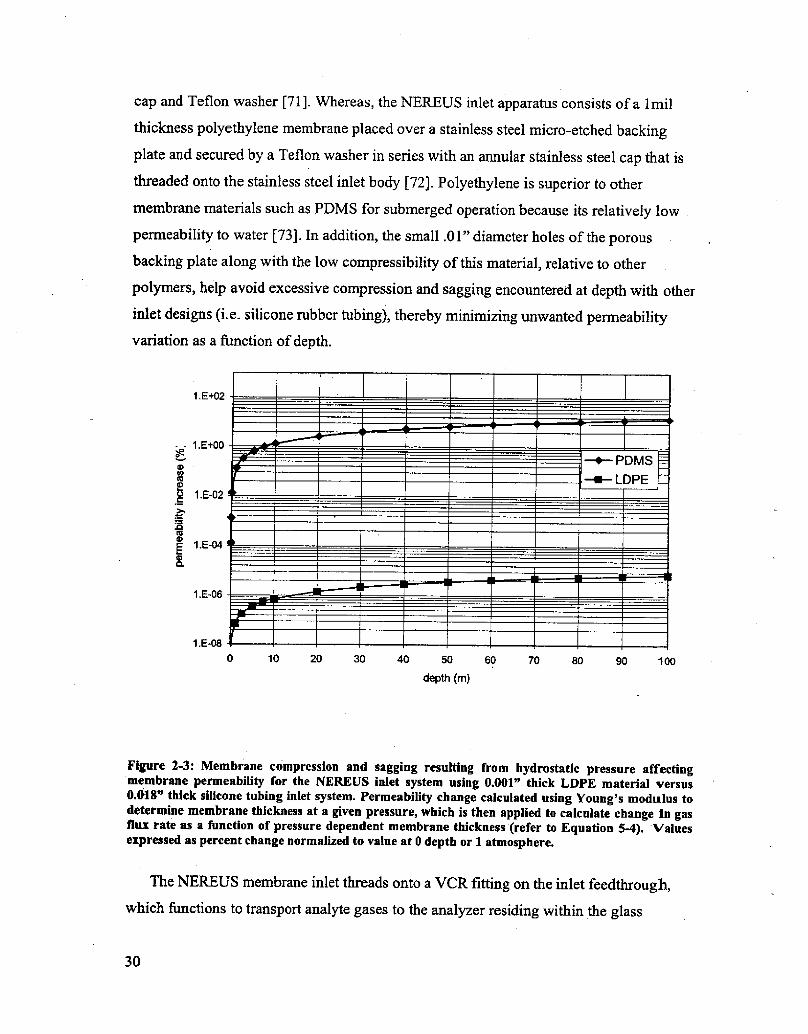
cap and TeQon washer [71]. Whereas, the NEREUS inlet apparatus consists of a 1mil
thickness polyethylene membrane placed over a stainless steel micro-etched backingplate and secured by a Teflon washer in series with an annular stainless steel cap that is
threaded onto the stainless steel inlet body [72]. Polyethylene is superior to other
membrane materials such as PDMS for submerged operation because its relatively low
permeability to water [73]. In addition, the small .01" diameter holes of the porous
backing plate along with the low compressibility of this material, relative to other
polymers, help avoid excessive compression and sagging encountered at depth with other
inlet designs i.e. sihcone rubber tubing!, thereby minimizing unwanted permeability
variation as a function of depth.
1. E+02
- - 1.E+00
g E o 1,E021.E-04
Cl 1.E-06
1.E-08 0 10 20 30 40 50 60 70 80 90 100depth m!
Figure 2-3: Membrane compression and sagging resulting from hydrostatic pressure affectingmembrane permeabmty for the NEREUS inlet system using 0.001" thick LDPE material versus0.018" thick silicone tubing inlet system. Permeability change calculated using Young's modtslus todetermine membrane thickness at a given pressure, svhich is then applied to calculate change in gasflux rate as a function of pressure dependent membrane thickness refer to Equation 5-4!. V'aluesexpressed as percent change normalized to value at 0 depth or 1 atmosphere.
The NEREUS membrane inlet threads onto a VCR fitting on the inlet feedthrough,which functions to transport analyte gases to the analyzer residing within the glass
30

pressure sphere, while preventing water from entering the glass pressure sphere. The
feedthrough traverscs the lower hemisphere wall using an integrated 1 V~ inch diameter
flange with a recessed rubber 0-ring that contacts a ground glass flat surrounding a 0,6inch diameter feed-through hole on the lower hemisphere's external surface, providing a
water-tight seal Figure 2-4!. The feedthrough is secured onto the pressure sphere using arubber washer, to prevent damage to the glass, in series with a 3" stainless steel washer,followed by a stainless steel backing nut.
Figure 2-4: Sample inlet apparatus
Portions of inlet tubing residing on the interior of the pressure sphere are constructed
of thin walled corrugated tubing because these sections are only required to v ithstand
approximately one atmosphere of pressure, but must be flexible to accommodate partialdisassembly of the instrument during maintenance procedures. A flexible corrugated inletline is connected to the internal junction of the inlet tube penetration to carry sampleperineant to a '/~ inch diameter manifold, located at the rear of the instrument. This
manifold bifurcates and attaches to two parallel high vacuum bellows valves model SS-
BNV51!, linking to separate, bent rigid, lines that terminate at a quick-flange type fittingand at the vacuum envelope inlet. These parallel lines allow, respectively, the vacuum
system to be rough pumped down to a point at which the ion pump can begin useful
31

operation, and the vacuum envelope and ion pump to be sealed off from the inlet duringstorage. All vacuum system connections use VCR type couplings,
The inlet apparatus is the most likely component to fail under high hydrostaticpressure. This is due to the fact that the inlet membrane resides outside of the pressure
sphere and is exposed to ambient water pressure while inaintaining a near-perfect vacuumon its internal surface. Possible failure modes include backing plate collapse caused byexcessive hydrostatic pressure, membrane rupture caused by excessive hydrostatic
pressure, as well as excessive water vapor influx across an intact membrane due to a
thermally or chemically induced increase in membrane permeability. In addition to the
problems associated with a catastrophic failure of the inlet, significant water vapor inputcan cause a reduction in signal response through the collision of water molecules with
analyte ions. Based on calculations previous calculations [39], inlet membrane and
backing plate strength was determined to allow for an absolute maximum deploymentdepth of approximately 100 meters, with the backing plate being the limiting factor.Destructive pressure testing of the inlet system design has shown the inlet to successfullywithstand pressures greater than 100 psi, corresponding to a water depth of
approximately 75 meters [72]. To date the NEREUS system has been successfullydeployed to a depth of 25 meters,
2.1.3 lon pump
The vacuum system must first be rough-pumped down to a pressure of no greater than10 Torr before the instrument's onboard ion pinnp can be used to create and maintain
free molecular low conditions within the vacuuin system [39]. This 8 Vs diode type ionpump is bolted directly to the vacuum envelope at a 2 '/~ inch conflat flange fittinglocated near the center of the vacuum envelope to maximize conductance of excess gas
away &om the cycloid. The ion pump is powered by a high gain DC-DC converter which
accepts the +12 volt input from the battery and generates +3000 volts at its output. When
operating at under normal gas loads at steady state conditions, the ion pump typically
draw less than 200 pA, or 0.6 watts. The ion pump and power supply, combined, requireless than 2 watts of power.
32

Figure 2-5: Ion pump with un-machined housing!, cycloid and vacuum envelopeassembly
Owing to the ion pump's weightiness, the pump housing has been radically machinedto help reduce overall instrument weight to a point of neutral buoyancy. This entailedmachining away the pump housing's mild steel sidewalls to a total cross sectional area of
2 in, thereby still permitting sufficient return path for the ion pump's magnetic fluxdensity of 1,270 Gauss. Additionally, concave lenticular surfaces were machined into the
external faces of the pump housing. These surfaces were produced by machining a seriesof concentric circles of parabolically decreasing depth as a function of distance from the
center, intended to accommodate the increasing magnetic flux density developed inrelation to distance from the center, The resulting housing weighs 2.8 kg, a 33 loreduction from its initial weight of 4.2 kg, yet maintains a flux density of 1,270 Gaussacross its interior.
33

Figure 2-6: Machined ion pump housing
2.2 Analyzer
The analyzer component group, which is mostly contained within the vacuum
envelope, includes the ion source, cycloidal mass selector, Faraday cup detector, and
elecrometer. A permanent magnet, which is positioned outside of the vacuum envelope
provides a homogenous B-field for the cycloid. During operation, sample gases first
diffuse from the water column in across the membrane inlet, and then migrate through the
inlet tube, toward the vacuum envelope. The limited volume of the inlet system,
particularly within the vacuum envelope, has the added advantage of short residence
time. Once gas molecules enter the vacuum envelope, they are ionized and then
accelerated through the mass selector, finally impacting the Faraday cup detector.
Electric field for the cycloid is produced by a high voltage operational amplifier
which supplies a variable potential to accelerator plates within the analyzer. Total
instrument power consumption is kept below 20 watts, in part through a high frequency,
34
duty cycle modulated, emission regulator [38], To further reduce power consumption, a
permanent magnet is used to generate the required B field across the analyzer region.
2.2.1 Analyzer magnet
The analyzer magnet is of an asymmetric U-shaped geometry with an air gap of 1
inch and pole piece diameters of 3.5 inches. The pole pieces and yoke are constructed of
low carbon steel to allow for maximum magnetic permeability, while the coercive force
of the magnet is generated by two cylindrical NdFeB magnetic members, each residing
between a pole pieces and the yoke. Pole pieces are shaped to minimize Ginging effects
within the air gap region, whereas the yoke is shaped asymmetrically to minimize space
requirements and mass. The analyzer magnet of the Hemond backpack instrument served
as an initial benchmark for the NEREUS magnet, with a weight goal of less than 11 kg
and a flux density of at least 3,500 Gauss for the NEREUS analyzer magnet.
Preliminary magnet designs were prepared using SoldWorks CAD software for shape
optimization [39] based on the maximum magnetic permeability B ! of low carbon
steel and a minimum calculated cross sectional area of 3.85 in . This type of steel was
chosen because of its higher B~ relative to standard mild steel. The yoke and pole
pieces of the magnet body were then machined &om this metal, using a venerable
Monarch lathe and Bridgeport end mills at the Parsons Lab machine shop. The magnet's
two cylindrical NdFeB elements were constructed by Group Arnold at low cost by virtue
of pie shaped magnets that have been compressed and sintered together into a cylinder.
These cylindrical magnets are nickel plated to protect the brittle magnetic material from
cracking and to minimize exposure to damaging hydrogen gas. Once initial machining
and fabrication was complete, four bolt holes were drilled and tapped into the rear of the
magnet body to secure the yoke pieces together. Then, using extreme care, the magnetic
elements with their pole pieces were positioned on the yoke and are held securely in
place using only the magnetic field itself. It is worthwhile noting that serious dangers are
posed to fingers and hands by metal objects such as wrenches, which can be caughtwithin the magnet's field and rapidly accelerated to high velocities.
35

Flux measurements of this initial design revealed a flux density of 4,200 Gauss. To
further decrease space requirements and weight, the magnet was carefttlly disassembled
and a subsequent machining of thc magnet yoke was undertaken to aggressively trim
away areas of low magnetic flux. Areas of reduction were selected presuming curved
lines of magnetic flux through the magnetic return circuit and that cross sectional area
requirements directly above the magnetic elements range from zero at the distal end of
the body, to maximum at the proximal end. Therefore, the external intersections of the
magnet body where the bolts are attached! were rounded using a 1.125 in radius of
curvature and a 16' bevel was machined on one of the side surfaces the surface facing
the electrometer and ion pump when fully assembled! and on the surfaces directly above
and below the magnetic elements. The resulting magnet weighs approximately 8 kg and
generates a flux density of 4,270 Gauss across the air gap, along its central axis.
Figure 2-7: Asymmetrically shaped analyzer magnet
36
2.2.2 Cycloid analyzer
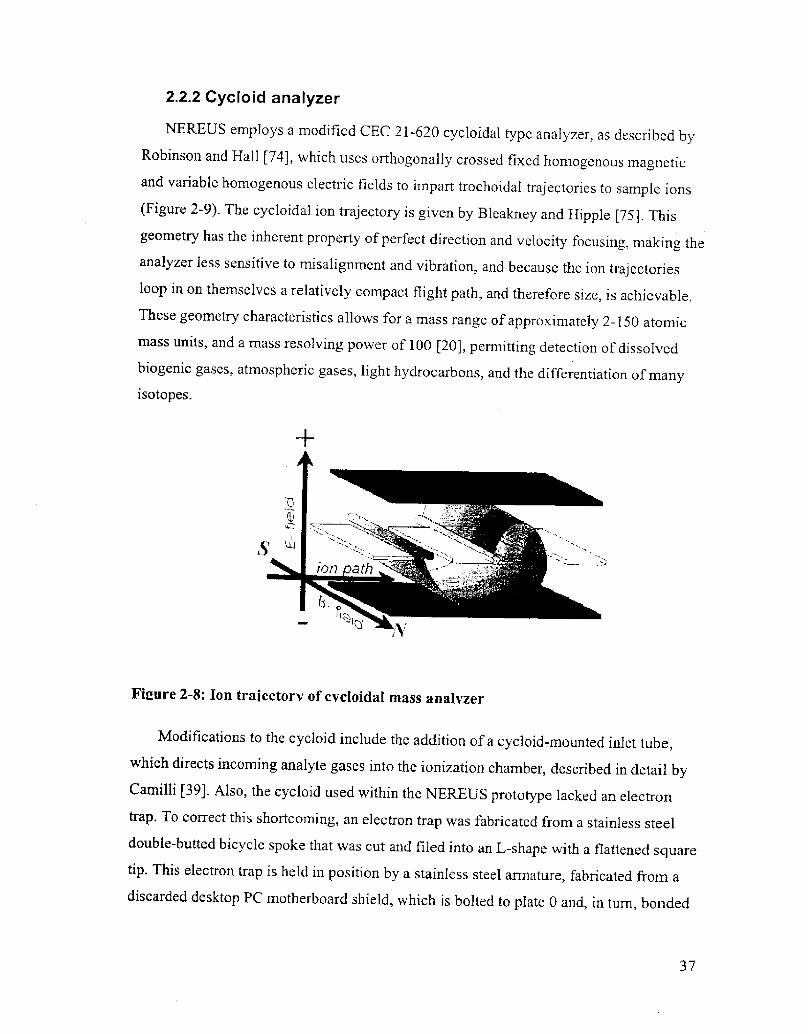
NEREUS employs a modified CEC 21-620 cycloidal type analyzer, as described byRobinson and Hall [74j, which uses orthogonally crossed fixed homogenous magneticand variable homogenous electric fields to impart trochoidal trajectories to sample ions Figure 2-9!. The cycloidal ion trajectory is given by Bleakney and Hippie [75j. Thisgeometry has the inherent property of perfect direction and velocity focusing, making theanalyzer less sensitive to misalignment and vibration, and because the ion trajectoriesloop in on themselves a relatively compact flight path, and therefore size, is achievable,These geometry characteristics allows for a mass range of approximately 2-150 atomicmass units, and a mass resolving power of 100 I20j, permitting detection of dissolvedbiogenic gases, atmospheric gases, light hydrocarbons, and the differentiation of manyisotopes.
Figure 2-8: lon trajectory of cycloidal mass analyzer
Modifications to the cycloid include the addition of a cycloid-mounted inlet tube,which directs incoming analyte gases into the ionization chamber, described in detail byCamilli [39j. Also, the cycloid used within the NEREUS prototype lacked an electrontrap. To correct this shortcoming, an electron trap was fabricated from a stainless steeldouble-butted bicycle spoke that was cut and filed into an L-shape with a flattened squaretip. This electron trap is held in position by a stainless steel armature, fabricated from adiscarded desktop PC motherboard shield, which is bolted to plate 0 and, in turn, bonded
37

to the electron trap with non-conductive epoxy. In addition, an aluminuin shim has been
inserted between the cycloid's mounting arch and plate 0, thereby providing an offset to
properly align the cycloid within the vacuum envelope, The shim measures 0.865" x
0.105" x 0.275" with two 0.15" diameter holes drilled with a 0.6" spacing to
accommodate two cycloid mounting screws. The relatively close tolerances of the cycloid
within the vacuum envelope necessitate that the cycloid be aligned to within 1 millimeter
of its required position to prevent short-circuiting of the electric field plates to the walls
of the vacuuin envelope.
Samples are first ionized by the ion source housed within the ionizing chamber
portion of the cycloid, located immediately in front of the ion pump inlet. These ions are
produced using a heated tungsten filament to thermionically emit electrons that are then
accelerated by a 70volt potential, causing these electrons to impact and ionize analyte
molecules that have entered the ionization chamber, An electron trap located to the
exterior of the ionizing chamber collects &ee electrons and negatively charged ions.
Positively charged ions are then repelled out from the ionizing chamber by a repeller
plate held at a positive potential relative to the ion chainber! and accelerated into the
cycloid mass selector by the injector, which carries a positive charge smaller than that of
the repeller. Once within the mass selector region of the cycloid, the analyte ions are
acted upon by the fixed magnetic field developed by the analyzer magnet and orthogonalelectric field created by five electric plates, causing the ions to assume curved trajectories
toward one of two Faraday cup detectors. By varying the potential of the electric field in
unison with the repeller and injector potentials, ion beams of varying m/z can be made to
come into focus on one of the two Faraday cups. Ions with mass-to-charge ratios m/z! of
12 or less can be made to assume trajectories in the direction of the 180' sector Faraday
cup, while ions with m/z of 12 or more can be focused on the cycloidal path Faraday cup.All control signals are sent to the cycloid through its Amphenol type 17 pin connector
which is secured to the 3 1/8" flange opening of the vacuum envelope. Connection pinsand functions are listed in Table 2-1: Cycloid pin out.

Figure 2-9: NEREUS cycloid tube constructed from a modified CKC 21-620
39

cloid in Function Mass selector
Filament
ShielcUground
Plate heater
Plate heater
Plate 0/ ground
Electron trap
Plate 2
Plate heater omitted!
Plate heater omitted!
Filament heater
Plate 5
Plate 1
Plate 3
Injector
Repeller
Filament
Plate 4
A
B 142
N
Q
R 10
40
Table 2-1: Cycloid pin out
The ion beams generate an ion current which is detected by the Faraday cup and sent
to the electrorneter via one of the two BNC type feed-through ports located on the
vacuum envelope's 2 /i inch conflat flange Figure 2-10!. The conflat flange contains
two machined recesses that prevent the Faraday cup pickups &om contacting the conflat
flange and producing a short circuit. Ion current is sent from the Faraday cup pickups tocurved music box-like tines that extend perpendicularly from the internal feed throughrods. These contacts are constructed from the same lightweight stainless steel material as
the electron trap mounting bracket and are tin soldered to the feed through rods. Usingthese feedthrough contacts, the electrometer senses this ion current and transforms it to an
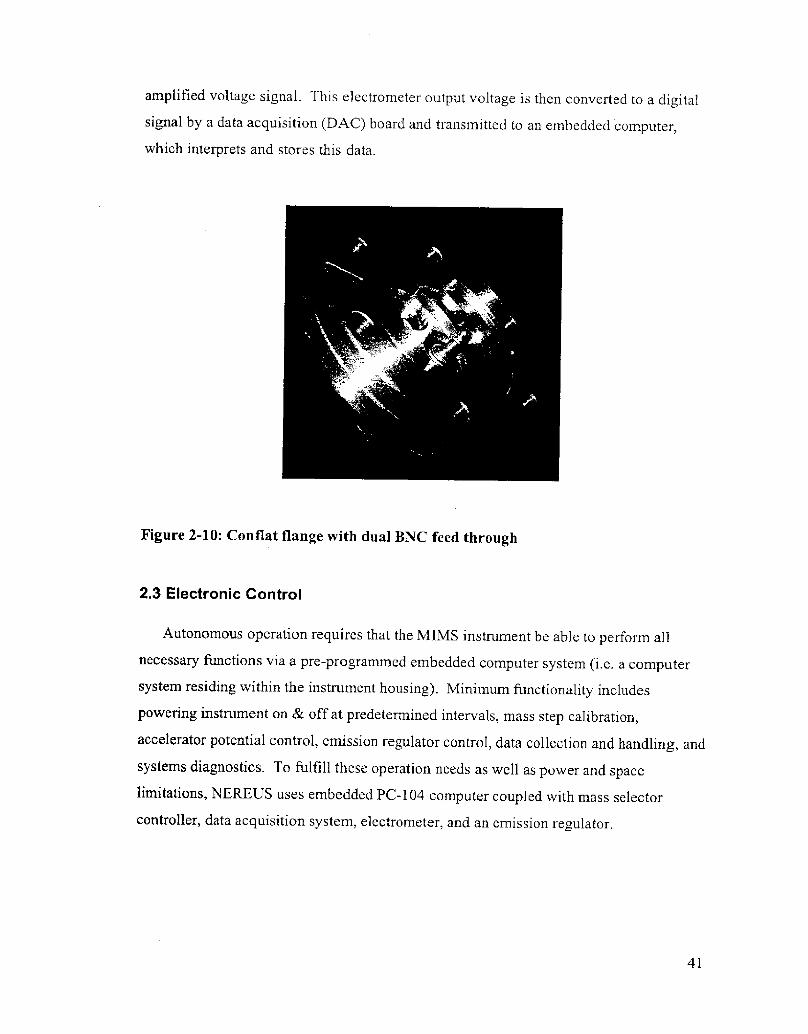
amplified voltage signal, This electrometer output voltage is then converted to a digitalsignal by a data acquisition DAC! board and transmitted to an embedded computer,which interprets and stores this data.
Figure 2-10: Conflat flange with dual BXC feed through
2.3 Electronic Control
Autonomous operation requires that the MIMS instrument be able to perform all
necessary functions via a pre-programmed embedded computer system i.e. a computersystem residing within the instrument housing!. Minimum functionality includes
powering instrument on & off at predetermined intervals, mass step calibration,
accelerator potential control, emission regulator control, data collection and handling, andsystems diagnostics. To fulfill these operation needs as well as power and spacelimitations, NEREUS uses embedded PC-104 computer coupled with mass selectorcontroller, data acquisition system, electrometer, and an emission regulator,
41

2.3.1 Embedded computer
Although higher clock frequency Pentiurn type systems offer the highest
performance, it comes at an energy use premium. Given the power constraint of
approximately 5 watts for the computer and DAQ board, an Ampro 386 SX core moduleoperating at 25MHz was initially utilized in combination with an Ampro VFP-II VGAflat panel controller. The IDE bus of the 386SX module does not permit use of a
flashable solid-state PC card! disk for non-volatile memory storage, therefore, the 1 MBEEPROM was partitioned allowing it to function as a hard drive. After successful short-
term deployments, the core module was replaced with a 486DX module operating at 100MHz; thereby permitting use of a removable solid-state flash disk and thus extendingavailable mission time. In addition to the increased storage space, the faster clock speedand onboard math co-processor of the substituted core module accelerates command line
execution, resulting in an increased sampling speed of up to approximately 1500 samplesper second while adhering to a power budget of less than 5 watts.
Each data point requires information concerning scan voltage, m/z, and time,
imposing a memory requirement of up to a maximum of 248 data bits per sample. Toaddress the data storage needs, NEREUS uses a conunercially available 128MB SanDiskCompact Flash disk commonly used in digital cameras!, which has the advantages ofextremely small form factor, low power consumption, high tolerance to vibration, impact,and pressure fluctuation, low cost, and modular data transfer from the NEREUS
computer to a laptop i.e. by physically exchanging cards!, Presently the embedded
computer uses this solid-state disk as a bootable disk, which contains the operatingsystem and instrument code compiled as an executable file. The operating system andinstrument code together require approximately 500KB, allowing the remaining 127MBto be reserved for data storage, Because NEREUS employs signal averaging, memoryrequirements are decreased to less than 2 MB per hour of operation, thus permitting atleast 2 'li days worth of data storage when the instrument is in continuous operation,
2.3.2 Communication
In addition to onboard data storage, the embedded computer is capable ofcommunicating to send data or receive commands from either of two RS232 serial ports

DB-9m ulse cable in color Function
Black GND
%hite Power
TXD
Green
Orange RTS
Blue CTS
Purple
Yellow
DSR
CD
DTRBrown
Table 2-2: Waterproof cable pin assignments
2.3.3 Data acquisition and instrument controi
The controller/data acquisition system, or DAQ board, is a revised version of thecircuit previously described by Camilli I 39], which functions as a compact �2cm x 9
. cm!, low power �.5 watt!, 16-bit resolution controller and sensor. It is compatible withcomputers using 8X86 through Pentium microprocessors, interfacing via a printer portconforming to a PS-2/bi-directional protocol IEEE1284!. The IEEE 1284 standardpermits a maximum data width of 8-bits; consequently, the DAQ board makes use of arnultiplexor array, which allows for a "two pass" 16-bit transfer of both controller and
43
operating either a null modem to AUV control computers or a half handshake protocol toa radio transceiver via a tethered surface float. The radio transceiver receives power fromthe internal NEREUS power system, with a total power requirement of approximately150 mW, and operates using a 418 MHz FM frequency with an effective broadcast rangeof approximately 150 meters when the companion laptop transceiver is within clear line-of-sight and broadcasts to shorter distances when obstructions are present.Communications with either radio transmitter or standard wired serial link requiretransmission at 9,600 bits per second through a 50 ft. long 9-pin Impulse MIL-9-MPwaterproof marine cable pin arrangement is described in Table 2-2.
sensor data. The DAQ board relies on an Analog Devices 7884 ADC to send commands
to the mass selector and an Analog Devices 569 DAC to quantify electrometer voltage;both converters possess sample-and-hold capabilities, permitting simultaneous operationof the sensor and controller.
This generation DAQ design incorporates several improvements over the previous
generation described by Camilli [39]. Included is an optional � 5V input offset circuit for
electrometer input jumper selected!, thereby enabling use of the full � 5V to+5V scale of
the AD7884 analog-to-digital converter, Additionally, all 5 status register bits of theparallel port have been made available for possible use as indicators of instrument states
such as excessive internal pressure, ion pump failure, fail-safe activation, and low batterycondition. Bit 3 of the control line operates a relay controlling the emission regulator's
on/off state, thus permitting a coinputer selectable low power sleep mode. Additionally,digital-to-analog output is now routed to an on-board isolation operational amplifier,which uses the scan board's "floating" power supply to generate scan board input
voltages, Finally, the new DAQ design makes use of Analog Devices' BQ and AN line of
integrated circuits, which offer improved noise characteristics over AQ models.
Error correction algorithms have been incorporated into the DAQ board execution
code to increase accuracy. The controller correction is simply a computed 4mV offset,while the sensor correction is a slope-offset algorithm designed to accommodate a 2's
complement architecture, To further decrease sampling error, a signal-averaging regimehas been included into the sensor code. Previous DAQ board performance testingdemonstrated capabilities of sense and control functions with sample speed independent16-bit accuracy, and operational speed dependent on the command line execution rate of
its host computer [39].
2.3.4 Mass Sefector
Electrical potential is delivered to the repeller, injector, and accelerator plates by anisolated high-gain circuit. This circuit is adapted Rom the Hemond scan board [29]; a
design that is, in turn, based on a CEC controller developed in the early 195Gs [74] whichrelies upon vacuum tubes common to that era.

The NEREUS scan control input voltage, generated by the embedded computer andDAQ, is relayed via an onboard BurrBrown model 124 isolation operational amplifier.The output of the iso opamp is routed to the negative input of a heat-sinked operationalamplifier Apex model PA88! acting as an inverting amplifier. This high voltage opampprovides a gain of approximately � 60 X relative to the input scan control voltage. It isnecessary to isolate this high voltage circuit so that the repeller, injector, and acceleratorplates can make use of a "floating" ground reference, thereby allowing accelerator plates¹1, ¹3, and ¹5 focus! to develop substantially negative potentials without requiring adedicated negative power supply.
The operational amplifier makes use of a "floating ground" power supply created bya %15 volt DC-DC converter PICO model 12GR150!, with the +15 volt outputtransformed into+300 volts by a second set of three serially connected 100 volt DC-DCconveiters PICO model 12A100!. The +300 volt output is then routed through a 1000
ohm resistor to limit current, A 10pF accumulator capacitor is shunted to the common
terminal of the circuit to stabilize the 300 volt output, while two 150 volt zener diodes inseries protect the circuit from reverse polarity damage. Finally, the +300 volt and � 15volt supplies are routed to the supply pins of the PA88.
The output of the PA88 is connected to a resistor ladder, which acts as a voltagedivider for the accelerator plates, These plates are arranged so that the even numbered
plates � and 4! develop respectively increasing positive potential, and the odd lumberedplates �,3, and 5! develop increasing negative potential, respectively. Plate 0, which alsoserves as the cycloid mounting spar is held at ground potential relative to the negativeelectrode of the battery pack and vacuum envelope. Resistor ladder arrangement isdetailed in Figure 2-11.
The scan board was initially unable to generate the requisite plate voltages forfocusing ions with m/z less than 17. Major revisions to a second resistor ladder operatingin parallel with the accelerator plate ladder to source voltage to the injector and repellerplates, were made to reduce the overall current demand placed on the PASS opamp and100 volt DC-DC converters. It is likely that this scanning limit is a result of increasedplate voltage needed to match the 20% increase in field strength of the scan magnet overprevious magnet designs. To accomplish current reduction and thereby enable higher

plate voltages without requiring increased power, variable voltage to the injector and
repeller plates is provided by way of two parallel 100K 0 1 watt potentiometers
connected to the PA88 output and shunted to the common terminal via a 100K Q resistor
tail. Through this modification the overall resistance of the circuit was increased from
45.8K 0 to 55K Q, resulting in a 20'/0 decrease in power demand and thereby extending
the scan range to m/z of less than 12. AAer completing these modifications, accelerator
plate voltages were tuned to maximize ion peak height while maintaining baseline
linearity. Greatest performance was achieved by tuning the potentiometers to produce the
voltages described in Table 2-3, where all potentials are referenced to the vacuum
envelope, and a voltage of -1.174 volts is applied at the input of the scan controller.
100k PLATE 4
PLATE 2
PLATE 0S VACUUMENVELOPE
PLATE 1
PLATE 3
PLATE 5
FOCUS!
Figure 2-11: Scan controller detail
46

cloid E-field C cloid inEd e connect in Potential volts
Repeller
Injector
Plate 0
Plate 1
Plate 2
Plate 3
Plate 4
Plate 5
10 34.5
24.36
0,0
-11.16
11.20
-22.12
22.09
-36.02
Table 2-3i Cycloid electric field potentials
2.3.5 Emission regulator
Ionization of sample analyte is accoinplished by means of electron impact, wherein
47
electricity is supplied to the filament from an electronic circuit, causing electrons to beejected &om the heated tungsten filament. This process accounts for the majority of theinstrument's power consumption; therefore, to improve energy efficiency over that of asimple resistive element regulator, the NEREUS ionization circuit, developed by Heniond[38], relies upon a TL494 integrated circuit, operating as a square wave generator to drivetwo field effect power transistors, which are connected in a push pull arrangement. Thecurrent driven through these transistors is then rectified and sent to a DC-DC converter,where its voltage is decreased from 12 to approximately 2 volts and current increased toapproximately 3 Amperes before acting upon the filament. By varying the duty cycle ofthis square wave instead of circuit resistance, losses are minimized. Regulation of thesquare wave duty cycle is maintained through a negative feedback loop that senses
electron trap current and adjusts the duty cycle to match potentiometer specified current.Electric current is delivered to the filament via two 12 gauge wires which are
affixed to square pads on the circuit board. Typically, the emission regulator draws 9watts of power while operating at 8 kHz. A Simpson micro ammeter that electricallyconnects the electron trap to the emission regulator's sensory circuitry, and is physically

mounted directly above the emission regulator, can be used to visually monitor trap
current developed by the ionization chamber. Trap current is typically around 7 Ij,A
during instrument operation. Power and sensory lines including trap current and on/off
control logic! are input to the emission regulator trough a DB-25 connector. Size of the
emission regulator was reduced to a NEREUS compatible footprint through the use of
miniaturized components such as DC-DC converters and ceramic capacitors and the
circuit being etched onto a double-sided board measuring 3,5" x 3.5". Care was taken in
circuit board layout to place high noise components such as switching power transistors
and converters into areas away from sensory components and to minimize trace lengths.
The einission regulator is switched on and off via software, using the computer's
parallel port control bit-3 line to direct a bipolar transistor which drives a reed type relay
switch connecting the TIA94 on/off line to ground. In this way, the computer can turn off
the emission regulator during periods of inactivity, decreasing power consumption from
approximately 18 to 9 watts, This control circuit is integral to the DAQ circuitry and, due
to its position above the ion pump housing and analyzer magnet, requires B-fieldshielding for satisfactory relay actuation, +5 V 4 FFCTRL 3
Figure 2-12: Software controlled emission regulator on/off relay
2.3.6 Electrometer
The extremely low ion currents. generated by the Faraday cup requires that theelectrometer produce a large gain while keeping noise at minimal levels, Given the 16 bit
resolution and � 5 to +5 volt input signal range of the DAQ's analog to digital converter,the electrometer should be able to amplify the smallest ion current of interest to at least
153 p. volts, However, the need for high gain requires the use of a feedback resistor
valued greater than 10 ohms, which dominates all other electrometer voltage noisesources. Additionally, the response time of the electrometer is determined by the resistor-capacitor time constant of the feedback resistor and the. stray capacitance across theresistor. This time constant determines the maximum bandwidth of the electrometer and,consequently, can be the limiting factor for overall instrument sampling speed i.e. whenmultiple mass peaks are required in a spectral scan!. Therefore, adequate instrumentperformance requires an optimization of the electrometer's amplification, noise tolerance,and bandwidth parameters,
Initially, an electrometer previously developed for the Hemond mass spectrometer Hemond 1991! was tested for use on the NEREUS system. This circuit uses a circuit
based on a Teledyne 1702 operational amplifier connected as a current-to-voltageconverter, followed by a unity gain inverting buffer Figure 2-13!. The 1702 op-ampgenerates an extremely low bias current, which is achieved with a parametric input stage.The low noise characteristics of this electrometer permit quantization of ion current
signals as small as 10 ' amps. However a 10 "0 feedback resistor and 2pF ofcapacitance, yield a response time of approximately one half second, makingelectrometer time response a major limiting factor because successive scans across the
spectral range are required. For example, if 1,000 mass steps including molecular ionsand &agments! are needed to accurately represent mass peaks across a single spectruxn,and measurement of ion current at each mass step requires 0.5 second, the time needed to
complete the scan exceeds 8 minutes. Therefore, a new electrometer was developed thatpossesses the same low noise characteristics as the Hemond design, while increasing itseffective bandwidth.
49

10
FARAOAY CtNPUT
OUTPUT
+18-18
Figure 2-13: Teledyne parametric op-amp eiectrometer design by Hemond
For design purposes, minimum required signal amplification can be calculated
assuming a 153 @volt minimum DAQ detectable voltage �0 volts of dynamic range/16bits!. Given an assumed minimum detectable ion current of 10 ' amperes, overallelectrometer gain must be at least 1.53x10 where 1 ampere = 1 volt/ampere!. Based onthis gain value, an appropriate feedback resistor can be calculated. Feedback resistor
selection is limited because large value resistors are produced in only limited sizes.Presuming that the Johnson noise of the feedback resistor will be the dominant noise
source, a noise value for the feedback resistor can be easily computed as a function of
temperature the NEREUS instrument package is not intended to operate in. water bodies
that exceed 300'K! and frequency; where i is current in amps, K is the Boltzmann
constant of 1.38x10 Joules/ Kelvin, T is temperature in Kelvin, B is bandwidth in
Hertz, and R is resistance in ohms.
e' =4KTBR
Equation 2-1: Fundamental thermal noise of feedback resistor
Using Ohm's law to compute the output signal voltage for a given resistive value, theoutput signal given a 10 Ampere input! can then be compared against its output
thermal noise voltage to find a signal-to-noise ratio. For example, a 10 Q resistor10
produces a voltage signal of 100 IjV, but generates Johnson noise of equal value S/N=l!
50

when bandwidth is 60.4 Hz and temperature is 300 Kelvin; while a stray capacitance of
lpF in parallel with 10' Q yields a time constant of 100Hz. In this case the circuit would
be frequency limited by the Johnson noise. Assuming that a signal-to-noise ratio of atleast 1 is required for detection of the ion current, a maximum temperature of 300 Kelvin,a minimum ion current of 10 Amperes, and a stray capacitance of at least 2pF exists in-l 4
parallel with the feedback resistor, a feedback resistor value with optimum signal-to-noise and frequency characteristics can be found. Figure 2-14 graphically illustrates howcircuits with feedback resistor values of less than approximately 5 x10 are frequencylimited by Johnson noise and circuits with feedback resistors greater than 1.5 x10' and
1.00E+09 1.00&10 1.00Etl21.00E+11
ReSiStiVe vailua Oh1TS!
Figure 2-14: Optimal feedback resistor value as a function of RC time constant and S/N,assuming a minimum input signal of 10 Amperes, temperature of 300K, and Johnsonnoise dominating.
51
capacitance of at least 2 pF are frequency limited by their RC time constant.
N
0>10
CTILL
~ S/N=i~ S/N=2
C=2pF~ � C=3pF

Having identified a feedback resistor of approximately 10' Q as optimal, a glass type
1.GS x10' 0 Victoreen resistor was chosen, based on cost and availability. Then, usingthese calculations, the active components of the electrometer were selected. Beginning
with the electrometer input, a National Semiconductor LMC6001 field effect operational
amplifier was chosen for use as the first stage gain. The LMC 6001 was selected because
of its low input current noise characteristics �.13fA/Hz" !, aiid because its field-effect
architecture minimizes input leakage. Like the previous electrometer design, the
LMC6001 is arranged as an inverting amplifier, with its negative input connected to the
Faraday cup lead. This arrangement amplifies the 10 ' amperes to � 105 pV at the outputof the LMC6001.
Previous calculations and experimentation [39j indicated that the NEREUS
instrument requires a dynamic range of approximately 2000 to properly quantify
dissolved chemicals of interest at common ambient environmental concentrations i.e.
&om 10 parts per billion to 2G parts per million!. Therefore, to provide adequate
amplification to make full use of the 10 volt digital-to-analog converter range, the output
of the LMC6001 is connected to the input of a second stage amplifier which amplifies the
input with a gain of -50. This second stage employs a Linear Technology LTC1151
operational amplifier configured as an inverting amplifier! that can convert and amplify
a 200mV input to a 10 volt output. The LMC6001 advertises zero drift and an input offset
of 5p.V, minimizing baseline clipping and drift. Finally, the output is routed through a
resistor capacitor series low pass filter with its � 3dB roll-off centered at 150 Hz. The
150Hz value was choseii so that signal attenuation would be minimized in the frequency
region of interest <50 Hz!. A schematic of the circuit is shown in Figure 2-15.

FARADAY CUPINPUT
OUTPUT
Figure 2-15: NEREUS eiectrometer circuit
An overall expected noise budget as a function of bandwidth was determined for the
... electrometer, using the noise figures for the feedback resistor, the various other resistors,and for the active components which are listed in the data sheets of the LMC6001 and
. LTC1151. Based on this noise budget, a minimum ion detectable current as a function of
- bandwidth can be calculated, assiuning S/N=l and T= 300'K Figure 2-16!.To minimize size, the circuit was constructed on an etched single plane PC-board,
using 1/8 watt resistors, DIP packages for the LTCI 151 the LMC6001 Figure 2-17!. TheVictoreen feedback resistor was connected to the input of the LMC6001 using an "airwiring" technique, This approach takes advantages of the insulative and low straycapacitive properties of air to minimize the effects of stray electronic noise, whichalthough small, still permeates the etched board material.
53

A battery power supply consisting of two 9 volt alkaline batteries in series with a
center tap, providing +9 volts, in parallel with four center tapped 1.5 volt AA alkaline
batteries providing +3 volts to the LMC6001 supplies to the op-amps and voltage
reference.
1.00E-14
H. vJEX< IL
S M
1.00E-15 0 5 10 15 20 25 30 35 40 45Frequency Hz!
Figure 2-16: Theoretical electrometer sensitivity vs. sampling frequency assumingcircuit is not limited by feedback resistor RC time constant!
To match the � 5 to +5 range of the DAQ, the 0 to 10 volt output of, the LTC1151
output was offset using an Analog Devices REF195 +5 [change] volt precision voltage
reference that is connected to the output of the LTC1151 via second LTC1151 operating
as a unity gain inverter. This voltage regulator addition, however, generated electronic
interference in excess of the resolution gain attained by centering the output range about
zero. Therefore, this offset circuit was re-designed using a high precision AD588BQ
voltage reference that resides on the DAQ board, thus preventing voltage reference
induced load fluctuations from significantly decreasing the electrometer's signal to noise
ratio.
A 3.7 cm length of coaxial cable is used in parallel with the Victoreen resistor as a
low value - 3 pF! capacitor. This length of cable is necessary to provide feedback
54

amplifier frequency compensation, thereby avoiding stability problems resulting in a rail-
to-rail oscillation at 26Hz higher harmonics also! on the electrometer's output. Throughtrial and error, a minimum capacitive value was found that prevented the oscillation. The
exact cause of this instability is still unclear, but is most likely due to the extremely high
gain of the Victoreen resistor in combination with stray effects near the LMC6001 leads.
The resulting overall gain and response time of the elcctrometer suggest that the coaxial
capacitor may also function as a resistive element to the extent that it decreases the
feedback effective resitance possibly a factor of 5 or more!.
Figure 2-17: NEREUS electrometer
In addition to careful circuit design, several other steps were taken to minimize the
effects of external noise sources, A battery pack, sourcing +3 and +9 volts to the
electrometer was built to minimize 60Hz interference, which was encountered even when
using high-quality regulated AC power supplies. A second line of defense against
external noise was to place the electrometer in a Faraday cage and position it as close to
the Faraday cup as possible, To accomplish this, the electrometer was mounted inside a
small rectangular aluminum BUD box, and positioned so that the vacuum envelope feed-
through actually penetrates the aluminum box, allowing the Faraday cup output to
connect directly to the input of the electrometer's LMC6001 op-amp. Finally, the vacuum
55

envelope and electrorneter box were connected to the battery pack's common lead, to
make the electrometer resistant to damage from electrostatic discharge Figure 2-18!.
Figure 2-18: Klectrometer shielding and mounting
A Hewlett Packard digital storage oscilloscope was used to collect data to analyze the
response characteristics of this electrometer design. Analysis consisted of sampling a
time series of approximately 32 seconds duration, at 1,000 samples per second, resultingin a 32,768 point data series. These data series were then saved to disk and converted to
Matlab readable data files. The time series data sets then were transformed into frequency
spectra. Once the frequency spectrum was obtained, this data was then analyzed for
power spectral density. Based on time series data taken with the scope probe shorted to
ground, the probe introduces approximately 1.19mV, of error to the measurement. To
estimate the noise inherent to the electrometer circuit, its input was tied to ground. Two
separate time series taken with the input grounded, indicated that the electrometer
generates from 3.42mV, to 8.36mV, of noise. No significant correlation is evident
between scope probe noise and electrorneter noise. However, the electrometer appears to
be particularly sensitive to low frequency mechanical vibrations. Initial spectral analysis
56

of the electrometer with its input connected to the Faraday cup revealed the 26Hz rail-to-rail oscillation as well as higher harmonics!. After the oscillatory response was
attenuated with a properly trimmed coaxial cable acting as a capacitive compensator!,the electrometer in coinbination with the Faraday cup generated approximately
9.13rnV of noise Figure 2-19!. Based on cross correlation analysis, the oscillationproblem appears to either have been eliminated, or its magnitude attenuated tosomewhere below the noise floor of the electrometer Figure 2-20!, Close inspection ofthe power spectral analysis for the compensated electrometer reveals a 60Hz peak with amagnitude approximately an order of magnitude above baseline. This peak is likely tohave been caused by external power lines and fluorescent lights in the laboratory roomwhere the measurements were made. Other higher frequency peaks, between 400 and 500Hz, are well in excess of the critical threshold of the output's low-pass filter, suggestingthat these frequencies are likely to have been generated and/or experienced subsequent tothe electrometer output.
10
10
'f0
10
I,10 ICompensated,'
eiectro eter
10 0 50 100 150 200 250 300 350 400 450 500Frequency Hz!
Figure 2-19: Power spectral density of electrometer with and without coaxialcapacitive compensator
57
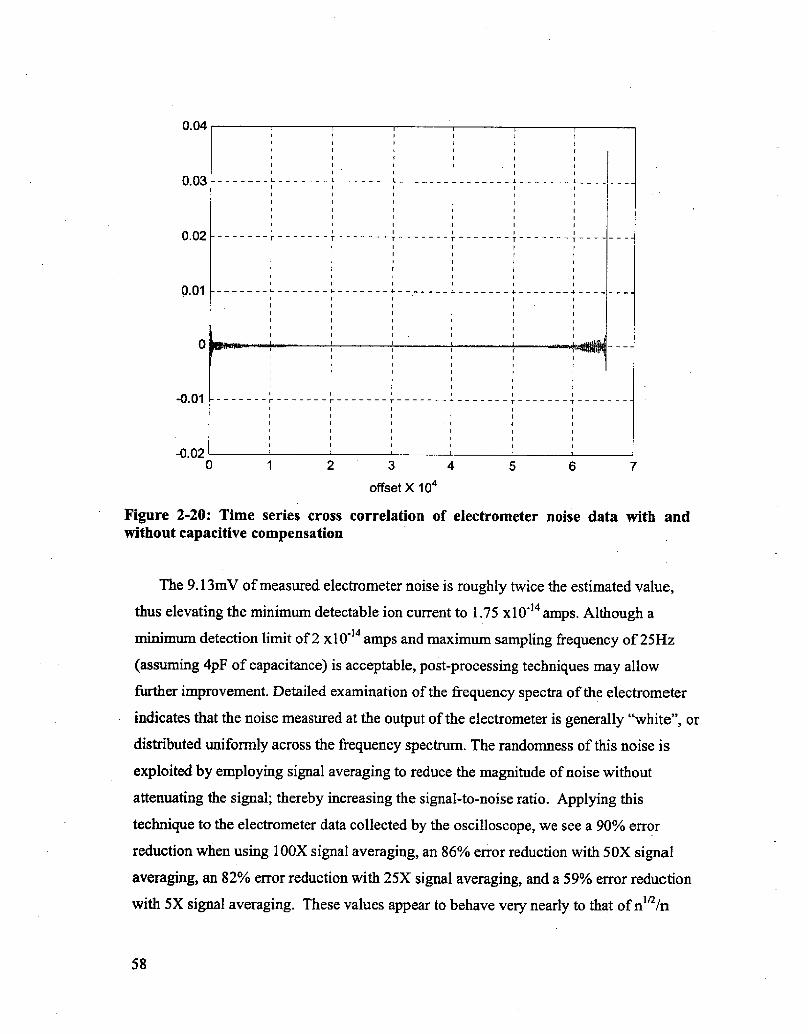
0,03
0.02
0.01
-0.020 1 2 3 4
offset X 10
Figure 2-20: Time series cross correlation of electrometer noise data with andwithout capacitive compensation
The 9.13mV of measured electrometer noise is roughly twice the estimated value,
thus elevating the minimum detectable ion current to 1.75 x10 ' amps. Although a
minimum detection limit of 2 x10 ' amps and maximum sampling &equency of 25Hz
assuming 4pF of capacitance! is acceptable, post-processing techniques may allow
further improvement. Detailed examination of the frequency spectra of the electrometer
indicates that the noise measured at the output of the electrometer is generally "white", or
distributed uniformly across the frequency spectrum. The randomness of this noise is
exploited by employing signal averaging to reduce the magnitude of noise without
attenuating the signal; thereby increasing the signal-to-noise ratio. Applying this
technique to the electrometer data collected by the oscilloscope, we see a 90% error
reduction when using 100X signal averaging, an 86% error reduction with 50X signal
averaging, an 82% error reduction with 25X signal averaging, and a 59% error reduction
with 5X signal averaging. These values appear to behave very nearly to that of n' /n
58

statistics, corroborating the hypothesis of noise randomness. If a 10X signal averagingroutine were to be implemented, a 68'/o noise reduction could be expected. The analog-to-digital converter of the DAQ system is capable of conversion rates in excess of150,000 samples per second, allowing for many samples in quick succession.Consequently, if the electrometer bandwidth is 25 Hz, the DAQ can be made to dosuccessive conversions, with a Ims temporal spacing, after an initial time delay of 25ms to allow electrometer output settling!. This would have an overall effect of decreasingthe bandwidth to less than 25Hz, but increasing the ion current sensitivity.
In comparison to the Teledyne electrometer, the NEREUS electrometer appears to beless affected by electromagnetic disturbances below 60 Hz Figure 2-21!. Given that theNEREUS electroineter is designed to be used only within a frequency band up toapproximately 25 Hz, and incorporates a post-amplification low pass filter intended toattenuate frequencies above 50Hz, this electrometer in fact possesses lower noisecharacteristics than the Hemond design, yet requires a shorter response time, Theseperformance advantages are most likely due to the two-stage amplification process andthe extremely low bias current of the 6001 op-amp.
10
10
10
10
10
10150 200 250 300 350 400 450 500
Figure 2-21: Power spectrum density comparison of NERKVS and Hemond-Teledyne electrometers.
59

2.4 Power system
NEREUS operates using a +12 Volt DC power supply, Electrical power can be
Pin numbeunction
Computer/DAQEmission regulatorScan controller
Ion pumpMain
No connect
1,52,63,74 8
9, 1011, 12
Table 2-4: Power system wiring harness connector
Fuse ratings and approximate current draw for individual component groups duringoperation are specified in Table 2-5. Return paths for each of the previously mentionedelectronic components are individually routed to a short length of 12 gauge "commonbus" wire which connects to the negative battery terminals and pin 2 of the Impulsecable.
60
supplied to the instrument either from its two internal 12 volt 7 ampere-hour sealed lead-
acid batteries. connected in parallel! or via its external 9-pin Impulse cable commonreturn at pin 1 and+12 volts at pin 2!. The cable uses a shared power bus with the
batteries, permitting the internal batteries to be recharged when power is supplied to theinstrument by way of the cable connection, The 12 volt power bus supplies power to 4electrical component groups: the ion pump, scan controller, enussion regulator, anddigital circuitry. These components are connected to the+12 volt terminal by way of afused main toggle switch that then branches to individually fused toggle switches foreach of the four component groups, The five toggle switches are positioned immediatelyforward of the scan magnet on the frame's composite mounting plate, and electrical wires
to the switches are routed through a wiring harness with a square 12 pin Amphenolconnector. This connector can be detached to permit easier access to components housed
within the lower hemisphere. Connector pin arrangement is detailed in Table 2-4.

Switch Fuse rating Amperes! Current draw Amperes!Main
Embedded computer & DAQEmission regulatorScan controller
Ion Pump
1.7
0.5
0,7
0.2
0.3
Table 2-5: Current requirements and fuse ratings of electronic circuits
212 volt converter and the � 5 volt regulator are capable of generating power in excess of
the digital circuitry's respective %50mA and 20mA requirement, but were chosen based
on their higher efficiency over other types of inverters and regulators e.g. zenier diode,band gap, etc.!. Outputs from these converters, the regulator, and a common return pathare routed to the embedded computer and DAQ system on a braided five-wire powerharness and connector that bifurcates into two 10 base-T Ethernet jacks mounted to theinstrument kame's composite plate. Wiring at the Ethernet jacks is described in Table2-6.
61
The embedded computer and DAQ rely on a series of dedicated DC-DC converters
and voltage regulators to supply necessary positive and negative voltages. A DC-DCconverter Power One model DFA6U12S5! transforms the battery's unregulated+12volts into+5 volt regulated output of up to 6 watts; the embedded 386 computer andDAQ require typically require a total of 900mA during operation. A parallel second DC-DC converter Power One model DFC10U24D12! uses the unregulated +12 volts to
generate regulated 212 volts at 24 watts. A voltage regulator Film Microelectronics
model FM905S7! is connected in series to the � 12 volt output of this DC-DC converter to
generate a regulated � 5 volt source capable of sourcing up to 7.5 watts at peak. Both the
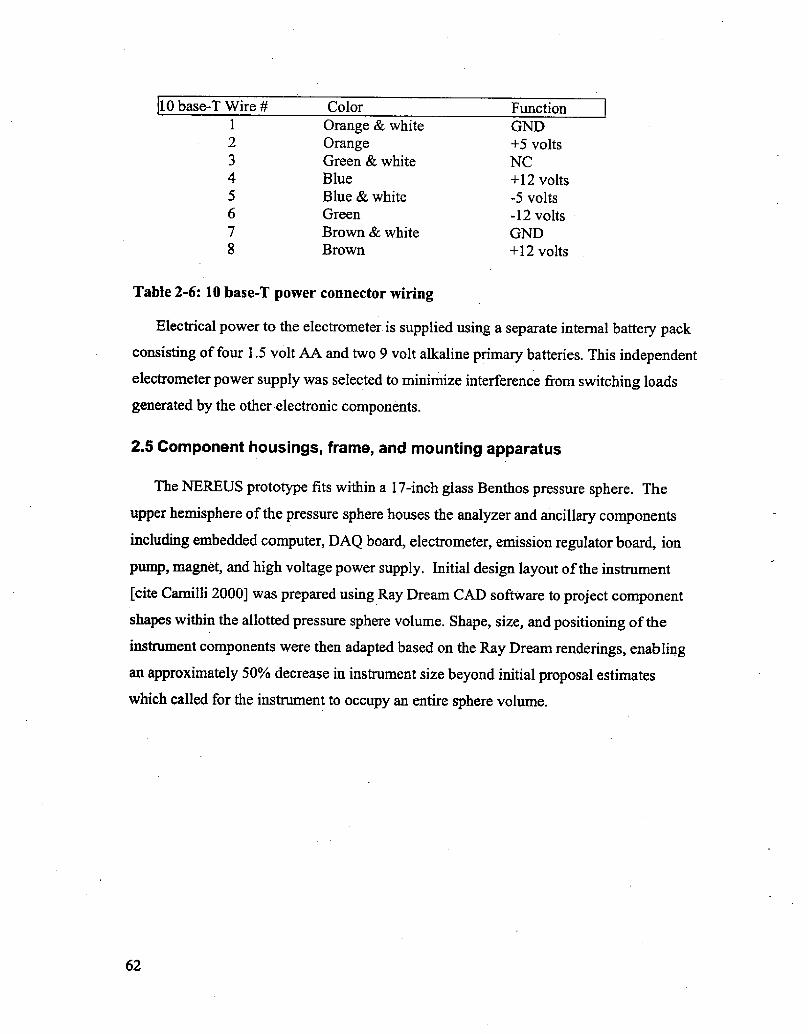
Color10 base-T Wire ¹ Function
Orange & whiteOrangeGreen & white
Blue
Blue & white
Green
Brown & white
Brown
GND
+5 volts
NC
+12 volts
-5 volts
-12 volts
GND
+12 volts
2.5 Component housings, frame, and mounting apparatus
The NEREUS prototype fits within a 17-inch glass Benthos pressure sphere. The
upper hemisphere of the pressure sphere houses the analyzer and ancillary components
including embedded computer, DAQ board, electrometer, emission regulator board, ion
pump, magnet, and high voltage power supply. Initial design layout of the instrument
I cite Camilli 2000] was prepared using Ray Dream CAD software to project component
shapes within the allotted pressure sphere volume. Shape, size, and positioning of the
instrument components were then adapted based on the Ray Dream renderings, enabling
an approximately 50% decrease in instrument size beyond initial proposal estimates
which called for the instrument to occupy an entire sphere volume.
Table 2-6: 10 base-I power connector wiring
Electrical power to the electrometer is supplied using a separate internal battery pack
consisting of four 1,5 volt AA and two 9 volt alkaline primary batteries. This independent
electrometer power supply was selected to mirumize interference &om switching loads
generated by the other electronic components.
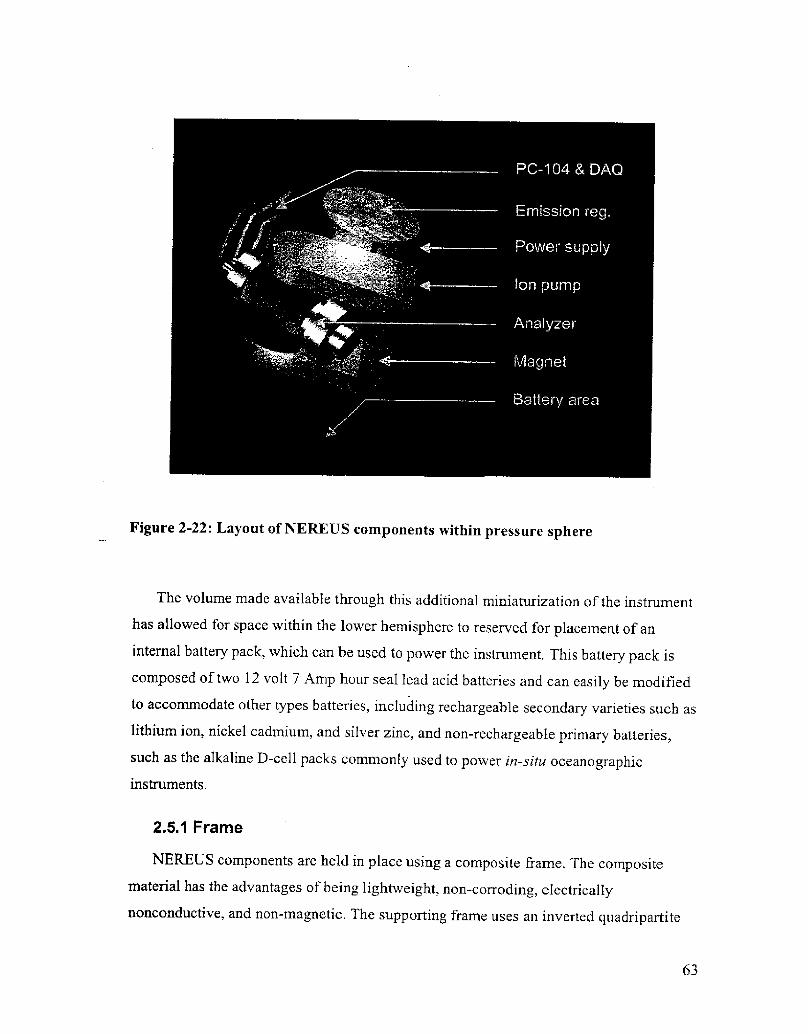
Figure 2-22: Layout of NEREVS components within pressure sphere
The volume made available through this additional miniaturization of the instrument
has allowed for space within the lower hemisphere to reserved for placement of aninternal battery pack, which can be used to power the instrument. This battery pack iscomposed of two 12 volt 7 Amp hour seal lead acid batteries and can easily be modifiedto accommodate other types batteries, including rechargeable secondary varieties such as
lithium ion, nickel cadmium, and silver zinc, and non-rechargeable primary batteries,such as the alkaline D-cell packs commonly used to power in-situ oceanographicinstruments.
2.5.1 Frame
NEREUS components are held in place using a composite frame, The compositematerial has the advantages of being lightweight, non-corroding, electricallynonconductive, and non-magnetic. The supporting frame uses an inverted quadripartite
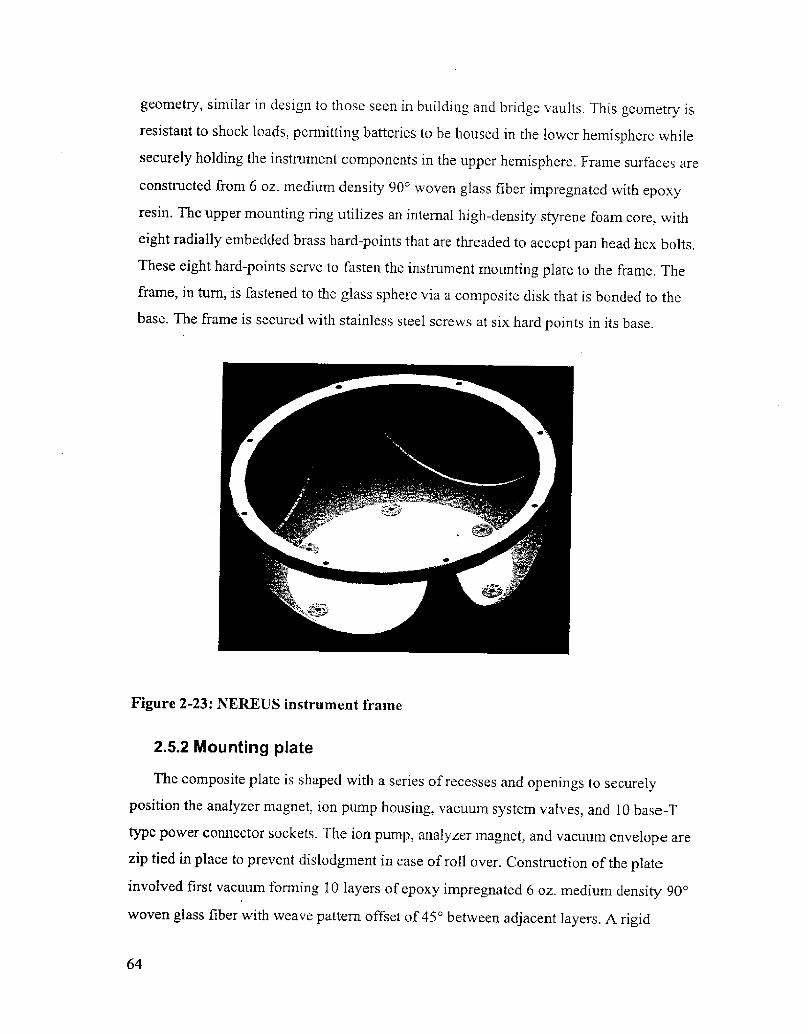
geometry, similar in design to those seen in building and bridge vaults. This geometry isresistant to shock loads, permitting batteries to be housed in the lower hemisphere while
securely holding the instrument components in the upper hemisphere. Frame surfaces are
constructed from 6 oz. medium density 90' woven glass fiber impregnated with epoxy
resin. The upper mounting ring utilizes an internal high-density styrene foam core, witheight radially embedded brass hard-points that are threaded to accept pan head hex bolts,These eight hard-points serve to fasten the instrument mounting plate to the frame. Theframe, in turn, is fastened to the glass sphere via a composite disk that is bonded to the
base. The frame is secured with stainless steel screws at six hard points in its base.
Figure 2-23: NEREUS instrument frame
2.5.2 Mounting plate
The composite plate is shaped with a series of recesses and openings to securelyposition the analyzer magnet, ion pump housing, vacuum system valves, and 10 base-Ttype power connector sockets. The ion pump, analyzer magnet, and vacuum envelope arezip tied in place to prevent dislodgment in case of roll over. Construction of the plateinvolved first vacuum forming 10 layers of epoxy impregnated 6 oz. medium density 90'woven glass fiber with weave pattern offset of 45' between adjacent layers. A rigid
64

polyurethane cast was then made of the analyzer magnet-vacuum system assembly,which, in turn, was used to produce a male mold. The male mold's perimeter was thentraced onto the composite plate and the internal area then cut away from the plate. Next,the male mold was placed within the cutaway region and an additional 5 layers of similarepoxy impregnated glass fiber with 4S' offset was hot vacuum formed onto the existing10 layers. Hot vacuum forming was accomplished by placing the composite plate withina Reynolds oven roasting bag commonly used to roast turkeys!. The bag was then sealedand connected to a vacuum pump to evacuate gas voids from the composite while it curedwithin a drying oven set to 85' C. Finally an epoxy top and bottom coat was applied tothe composite plate, and holes were drilled to accominodate the zip ties, thru-bolts,vacuum valves, and power connectors.
Figure 2-24: Mounting plate placement of analyzer, detector and ion pump assemblies
2.5.3 Instrument cover
To further secure the analyzer components and prevent electrical short circuiting ofthe ion pump's high voltage power supply, a specially shaped composite cover fits overthe ion pump, power supply, analyzer magnet, vacuum envelope, and electrometer, This
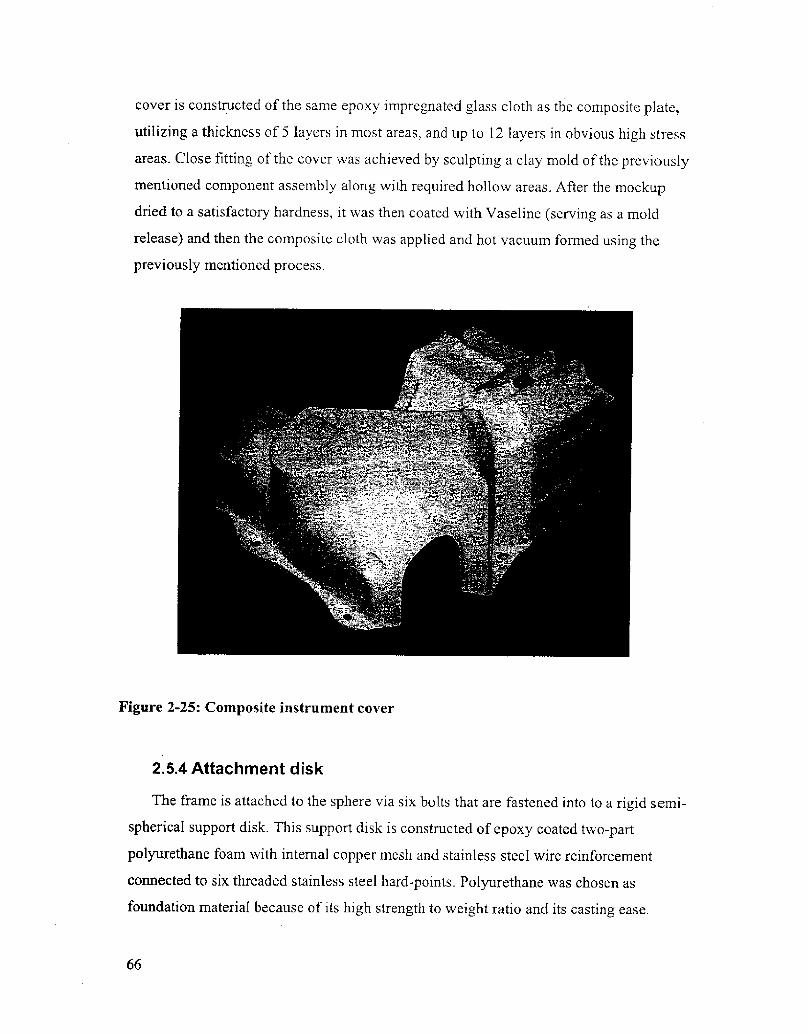
cover is constructed of the same epoxy impregnated glass cloth as the composite plate,
utilizing a thickness of 5 layers in most areas, and up to 12 layers in obvious high stress
areas. Close fitting of the cover was achieved by sculpting a clay mold of the previously
mentioned component assembly along with required hollow areas. After the mockup
dried to a satisfactory hardness, it was then coated with Vaseline serving as a mold
release! and then the composite cloth was applied and hot vacuum formed using the
previously mentioned process.
Figure 2-25: Composite instrument cover
2.5.4 Attachment disk
The frame is attached to the sphere via six bolts that are fastened into to a rigid semi-
spherical support disk. This support disk is constructed of epoxy coated two-part
polyurethane foam with internal copper mesh and stainless steel wire reinforcement
connected to six threaded stainless steel hard-points. Polyurethane was chosen as
foundation material because of its high strength to weight ratio and its casting ease.
66
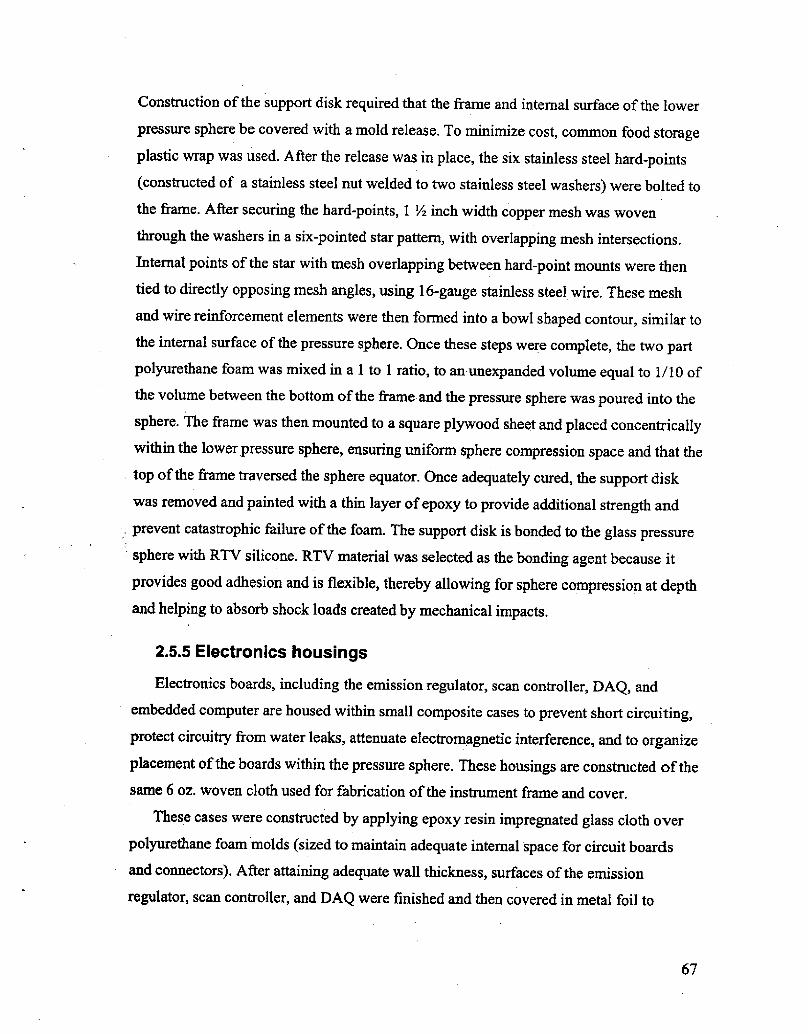
Construction of the support disk required that the frame and internal surface of the lower
pressure sphere be covered with a mold release, To minimize cost, common food storageplastic wrap was used. After the release was in place, the six stainless steel hard-points constructed of a stainless steel nut welded to two stainless steel washers! were bolted to
the frame. After securing the hard-points, 1 /2 inch width copper mesh was woven
through the washers in a six-pointed star pattern, with overlapping mesh intersections.
Internal points of the star with mesh overlapping between hard-point mounts were then
tied to directly opposing mesh angles, using 16-gauge stainless steel wire. These mesh
and wire reinforcement elements were then formed into a bowl shaped contour, similar to
the internal surface of the pressure sphere. Once these steps were complete, the two partpolyurethane foam was mixed in a 1 to 1 ratio, to an unexpanded volume equal to 1/10 ofthe volume between the bottom of the Same and the pressure sphere was poured into thesphere. The frame was then mounted to a square plywood sheet and placed concentrica11ywithin the lower pressure sphere, ensuring uniform sphere compression space and that the
. top of the frame traversed the sphere equator. Once adequately cured, the support disk
was removed and painted with a thin layer of epoxy to provide additional strength and. prevent catastrophic failure of the foam. The support disk is bonded to the glass pressuresphere with RTV silicone. RTV material was selected as the bonding agent because itprovides good adhesion and is flexible, thereby allowing for sphere compression at depthand helping to absorb shock loads created by mechanical impacts.
2.5.5 Electronics housings
Electronics boards, including the emission regulator, scan controller, DAQ, andembedded computer are housed within small composite cases to prevent short circuiting,protect circuitry from water leaks, attenuate electromagnetic interference, and to organizeplacement of the boards within the pressure sphere. These housings are constructed of thesame 6 oz. woven cloth used for fabrication of the instrument frame and cover.
These cases were constructed by applying epoxy resin impregnated glass cloth overpolyurethane foam molds sized to maintain adequate internal space for circuit boards
and connectors!. After attaining adequate wall thickness, surfaces of the emission
regulator, scan controller, and DAQ were finished and then covered in metal foil to
67

minimize electromagnetic interference. To minimize adverse magnetic field permeation
affects on an internal reed relay, the DAQ case also utilizes two .045" thickness mild
steel plates in the area directly beneath the relay.
Housings are bolted together using stainless steel screws and nuts. Electronics
housings containing the PC-104 computer, DAQ system, emission regulator, and scan
controller are fastened to the external surface of the instrument cover using Velcro strips.Although unconventional, Velcro was chosen over other fasteners based on its lightweight, magnetic inertness, and immunity to vibration.
Figure 2-26: Embedded computer with memory card
2.5.6 Hardhat protector
A high-density polyethylene "hardhat" protector is used to protect the NEREUS
instrument from impacts during transport and tethered deployment. The lower
hemisphere of the hard hat has been modified by two separate circular holes that permitthe inlet system to protrude and allow access to the sphere's vacuum port. A series of
square cutouts have also been made to the upper hemisphere of the hardhat, which permit
viewing of the ion pump and electron trap current gauges while the instrument is covered.
68

Approximate overall neutral buoyancy is achieved for the instrument and hardhat
assembly through the use of a rigid polyurethane foam spider that has been cast into the
ribs of the upper hemisphere hardhat, along with a second polyurethane foam disk that isattached to the top of the hardhat, The placements of these floatation pieces were chosento maximize the separation between the system's centers of gravity and buoyancy,allowing the instrument to remain upright when deployed on a tether. The hardhat is
fastened closed using four eyebolts. A 'A" diameter rope harness is then threaded throughthe bolt eye holes and tied to the tether,
Figure 2-27: The NEREUS instrument, shown sealed within its pressure housingprior to deployment
69
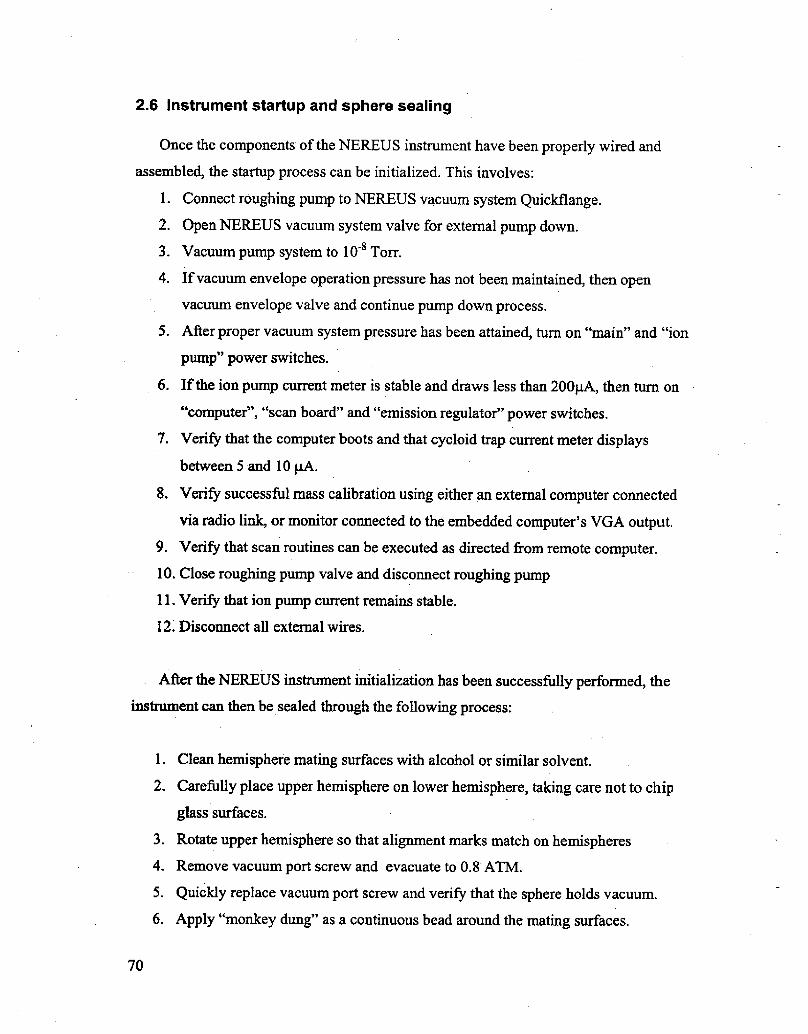
2.6 !nstrument startup and sphere sealing
Once the components of the NEREUS instrument have been properly wired and
assembled, the startup process can be initialized. This involves:
1. Connect roughing pump to NEREUS vacuum system Quickflange.
2. Open NEREUS vacuum system valve for external pump down.
3. Vacuum pump system to 10 Torr,
4, If vacuum envelope operation pressure has not been maintained, then open
vacuum envelope valve and continue pump down process,
5. After proper vacuum system pressure has been attained, turn on "main" and "ion
pump" power switches.
6. If the ion pump current meter is stable and draws less than 200@A, then turn on
"computer", "scan board" and "emission regulator" power switches.
7. Verify that the computer boots and that cycloid trap current meter displays
between 5 and 10 pA.
S. Verify successful mass calibration using either an external computer connected
via radio link, or monitor connected to the embedded computer's VGA output.
9. Verify that scan routines can be executed as directed &om remote computer.
10. Close roughing pump valve and disconnect roughing pump
11. Verify that ion pump current remains stable.
12. Disconnect all external wires.
After the NEREUS instrument initialization has been successfully performed, the
instrument can then be sealed through the following process:
1. Clean hemisphere mating surfaces with alcohol or similar solvent.
2. Carefully place upper hemisphere on lower hemisphere, taking care not to chip
glass surfaces.
3. Rotate upper hemisphere so that alignment marks match on hemispheres
4. Remove vacuum port screw and evacuate to 0.8 ATM.
5. Quickly replace vacuum port screw and verify that the sphere holds vacuum.
6. Apply "monkey dung" as a continuous bead around the mating surfaces.
70

7. Firmly press and smooth monkey dung to glass surface.
S. Remove monkey dung backing tape,
9. Wrap wide plastic electrical type tape around. the equatorial region three times,beginning slightly below the equator, then transitioning to slightly above theequator on the second turn, and completing the third wrap on the hemisphere.
10. Secure two metal band hose type! clamps around the sphere. Position clamps in alongitudinal arrangement, intersecting each other to form an "X" at the top andbottom poles of the sphere.
11. Place sphere in Kemonaut AUV, or protective polyethylene hardhat.
12. Attach dummy plug to MII,-9 cable if external radio transceiver is not being used e.g. during AUV deployments!.
71

72
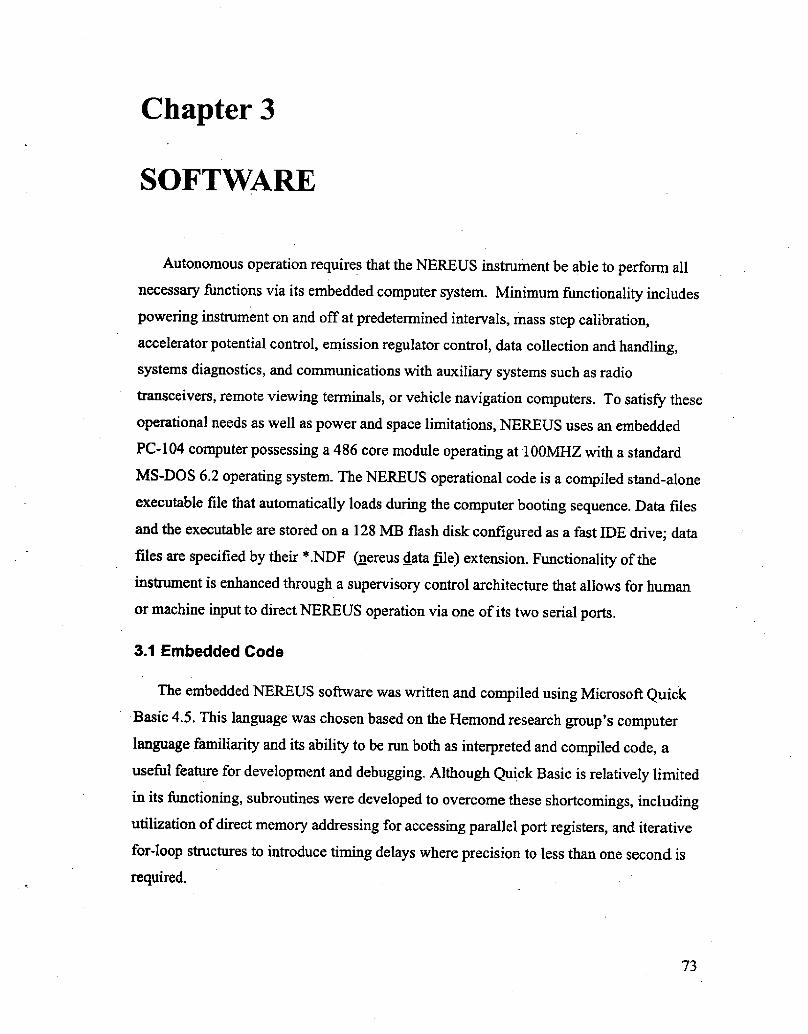
Chapter 3
SOFTWARE
Autonomous operation requires that the NEREUS instrument be able to perform allnecessary functions via its embedded computer system. Minimum functionality includespowering instrument on and off at predetermined intervals, mass step calibration,accelerator potential control, emission regulator control, data collection and handling,systems diagnostics, and communications with auxiliary systems such as radio
transceivers, remote viewing terminals, or vehicle navigation computers. To satisfy theseoperational needs as well as power and space limitations, NEREUS uses an embedded
PC-104 computer possessing a 486 core module operating at 100MHZ with a standard
MS-DOS 6.2 operating system. The NEREUS operational code is a compiled stand-aloneexecutable file that automatically loads during the computer booting sequence. Data filesand the executable are stored on a 128 MB flash disk configured as a fast IDE drive; datafiles are specified by their *.NDF nereus data file! extension. Functionality of theinstrument is enhanced through a supervisory control architecture that allows for human
or machine input to direct NEREUS operation via one of its two serial ports.
3.1 Embedded Code
The embedded NEREUS software was written and compiled using Microsoft QuickBasic 4.5. This language was chosen based on the Hemond research group's computer
language familiarity and its ability to be run both as interpreted and compiled code, auseful feature for development and debugging. Although Quick Basic is relatively limitedin its functioning, subroutines were developed to overcome these shortcomings, includingutilization of direct memory addressing for accessing parallel port registers, and iterativefor-loop structures to introduce timing delays where precision to less than one second is
required.
73

3.1.1 Embedded display and user interface
A display is of minimal value because the embedded computer system is intended for
unmanned operation of the NEREUS instrument while it is sealed within its protective
housing and submerged, Therefore, only a rudimentary display was developed, and is
intended to function exclusively for computer file management and bench top
troubleshooting. This display generates a text based VGA output and can be connected to
a standard CRT monitor via a VGA jack located in the aft of the PC-104 housing. ASCII
text is output to the display in a columnar format consisting of: mass scan voltage,
apparent M/Z, ion signal and time.
The embedded computer accepts an AT type keyboard, which can be used to access
the BIOS as well as files within the operating system, Pressing the FS key during the
booting sequence circumvents execution of the autoexec.bat and embedded code files,
thereby permitting file access from a DOS prompt. Alteration to extended BIOS options
is accomplished by pressing CTRL-ALT-ESC during the boot sequence, which causes a
configurable POST screen to be displayed, whereupon various BIOS settings can be
modified using the keyboard. Table 3-1 describes the proper extended BIOS settings for
NEREUS' embedded coinputer. In addition to the flash disk, the core module's floppy
interface can be connected to a floppy drive for data transfer when the upper pressurehousing is removed.
74
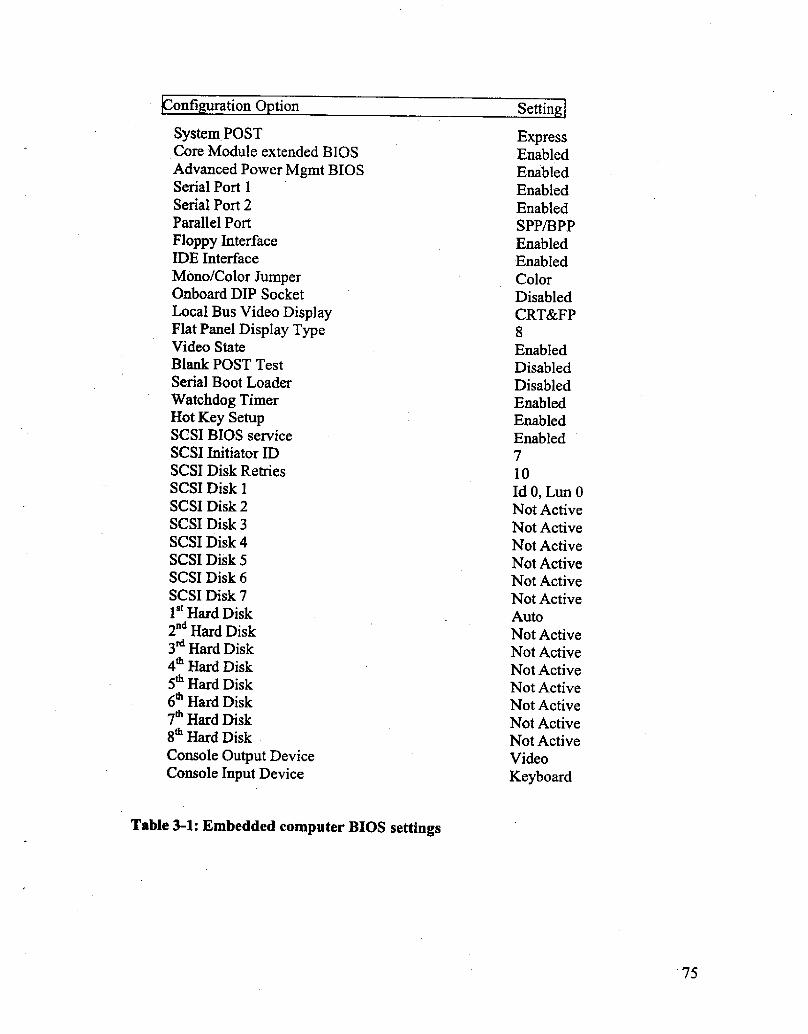
onfi uration 0 tion Settin
75
System POSTCore Module extended BIOSAdvanced Power Mgmt BIOSSerial Port 1
Serial Port 2
Parallel Port
Floppy InterfaceIDE Interface
Mono/Color JumperOnboard DIP Socket
Local Bus Video DisplayFlat Panel Display TypeVideo State
Blank POST Test
Serial Boot Loader
Watchdog TimerHot Key SetupSCSI BIOS service
SCSI Initiator ID
SCSI Disk Retries
SCSI Disk 1
SCSI Disk 2
SCSI Disk 3
SCSI Disk 4
SCSI Disk 5
SCSI Disk 6
SCSI Disk 71" Hard Disk2' Hard Disk3 Hard Disk
4 Hard Disk
5 Hard Disk
6 Hard Disk
7 Hard Disk
8 Hard Disk
Console Output DeviceConsole Input Device
Table 3-1: Embedded computer BIOS settings
ExpressEnabled
Enabled
Enabled
Enabled
SPP/BPP
Enabled
Enabled
Color
Disabled
CRT& FP8
Enabled
Disabled
Disabled
Enabled
Enabled
Enabled
7 10Id 0, Lun0Not Active
Not Active
Not Active
Not Active
Not Active
Not Active
Auto
Not Active
Not Active
Not Active
Not Active
Not Active
Not Active
Not Active
Video
Keyboard
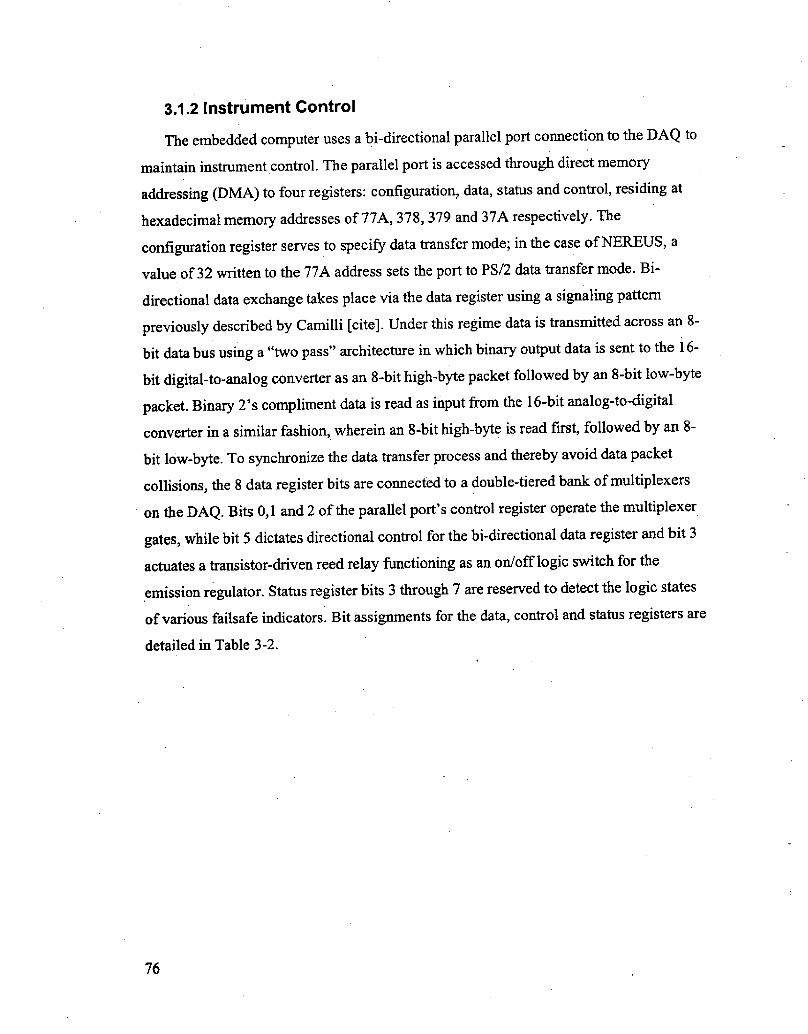
3.1.2 tnstrument Control
The embedded computer uses a bi-directional parallel port connection to the DAQ to
maintain instrument control. The parallel port is accessed through direct memory
addressing DMA! to four registers: configuration, data, status and control, residing athexadecimal memory addresses of 77A, 378, 379 and 37A respectively. Theconfiguration register serves to specify data transfer mode; in the case of NEREUS, avalue of 32 written to the 77A address sets the port to PS/2 data transfer mode. Bi-
directional data exchange takes place via the data register using a signahng patternpreviously described by Camilli [cite]. Under this regime data is transmitted across an 8-bit data bus using a "two pass" architecture in which binary output data is sent to the 16-bit digital-to-analog converter as an 8-bit high-byte packet followed by an 8-bit low-bytepacket. Binary 2's compliment data is read as input from the 16-bit analog-to-digitalconverter in a similar fashion, wherein an 8-bit high-byte is read first, followed by an 8-
bit low-byte. To synchronize the data transfer process and thereby avoid data packetcollisions, the 8 data register bits are connected to a double-tiered bank of rnultiplexerson the DAQ. Bits 0,1 and 2 of the parallel port's control register operate the multiplexergates, while bit 5 dictates directional control for the bi-directional data register and bit 3actuates a transistor-driven reed relay functioning as an on/off logic switch for the
emission regulator. Status register bits 3 through 7 are reserved to detect the logic statesof various failsafe indicators. Bit assignments for the data, control and status registers are
detailed in Table 3-2.
76
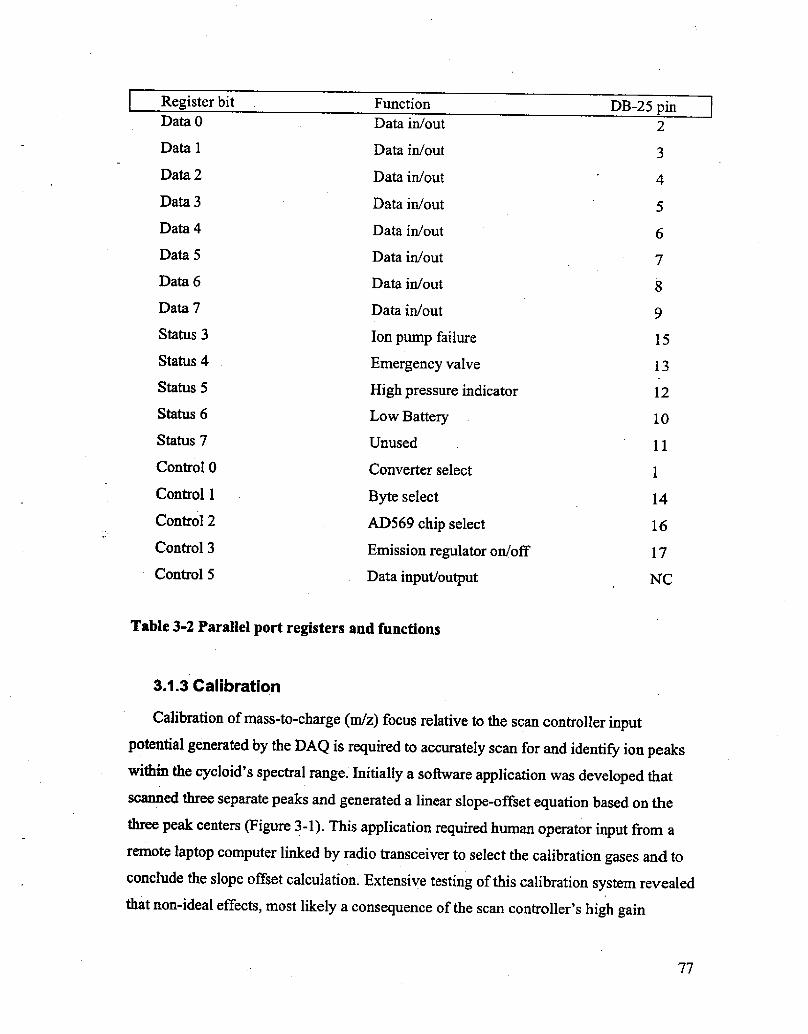
Register bit Function DB-25 pin
15
13
12
10
14
16
17
NC
Table 3-2 Parallel port registers and functions
3.1.3 Calibration
Calibration of mass-to-charge m/z! focus relative to the scan controller inputpotential generated by the DAQ is required to accurately scan for and identify ion peakswithin the cycloid's spectral range. Initially a software application was developed thatscanned three separate peaks and generated a linear slope-offset equation based on ðree peak centers Figure 3-1!. This application required human operator input from aremote laptop computer linked by radio transceiver to select the calibration gases and toconclude %e slope offset calculation. Extensive testing of this calibration system revealedthat non-ideal effects, most likely a consequence of the scan controller's high gain
77
Data 0
Data 1
Data 2
Data 3
Data 4
Data 5
Data 6
Data 7
Status 3
Status 4
Status 5
Status 6
Status 7
Control 0
Control 1
Control 2
Control 3
Control 5
Data in/out
Data in/out
Data in/out
Data in/out
Data in/out
Data in/out
Data in/out
Data in/out
Ion pump failure
Emergency valve
High pressure indicator
Low Battery
Unused
Converter select
Byte select
AD569 chip select
Emission regulator on/off
Data input/output
circuitry, causing the cycloid's electric field potentials to correspond non-linearly with
scan controller input. Additional analyses indicated that this non-linearity did not affect
the monotonicity of the relationship but did introduce a degree of distortion large enough
to preclude accurate tuning of ion peaks with an m/z in excess of 30 AMU. Moreover,
radio transmission interference occasionally would produce transmission errors that
caused the embedded computer to generate cycloid plate voltages considerably different
from their intended values. Although this error could be overcome either by redundant
command transmission, or through post processing of signals for error correction, both
methods could only be implemented with substantial time penalties. Therefore, an
alternate system of calibration was developed.
1 Li 'x
O
[~gee,',9~3,
" Nitrogen
I�
0
44- =
Oxygen Ik
'"
Figure 3-1: Remote calibration GUI for NEREUS instrument
78

To overcome the drawbacks of the first generation calibration system, all functions
requiring communication with an external agent, human or computer, were eliminated in
favor of a completely autonomous system. In addition, an algorithm was developed thatiteratively compares the residuals of likely variable values to produce a least-squares-fitexponential equation. This second-generation calibration systein also makes use of an
error checking procedure, which was developed to verify that newly generated calibration
variables are within acceptable error margins. Failing a successful calibration, the
instrument undertakes a limited number of retries before discontinuing the process andreverting back to the most recent valid variables stored in memory.
Calibration is initiated at each computer boot-up and at hourly intervals thereafter.
The calibration routine involves scanning for three peaks at mass-to-charge ratios of 16,
20 and 40. These peaks were selected based on their presumed universal expression under
all marine environmental conditions, expecting that an oxygen peak at m/z =16 will
persist either as an atomic fragment of water or as doubly charged molecular oxygen.Similarly, persistent peaks appear at m/z = 40 and 20 as a result of singly and doublycharged argon. Other peaks occurring at m/z = 17, 18 and 28 water &agment, water and
nitrogen! are also universally present, but can generate ion current intensities that exceed
the. full scale of the detector and in doing so obscure the peak's exact center. Signalsaturation is problematic because precise center determination is crucial for generatingthe two calibration variables i.e. slope coefficient and m/z exponent! with precisions
resolved to at least four significant digits in order to maintain sufficient focus accuracy inthe high m/z range of the spectrum. To ensure accuracy, the calibration curve's RMS
error is verified to be less than 10 mV before the new variables are stored in memory.
Once the calibration process is complete, the variables are used to generate appropriatescan controller input voltages by raising the desired m/z to the power of the exponentvariable n! and then multiplying the result with the slope variable m!, yielding theproper scan controller input voltage,
Scan Voltage = m M/Z!"
Equation 3-1: Mass calibration equation
79
The compiled code relies on a 24-hour clock using a dual precision floating pointvalue for task scheduling. Therefore, to prevent the instrument from generating an errorwhen the most recent calibration occurred before midnight and a calibration is scheduled
for after midnight, a time checking algorithm was developed which accounts for this
offset and adjusts scheduling accordingly,
3.1.4 Operational rhodes
A suite of embedded behaviors allows the NEREUS instrument to respond to inputfrom various external agents and environmental conditions. These behaviors minimize
the power and time required to gather relevant data at an appropriate resolution bycontrolling the sleep/wake state, type of scan undertaken, and amount of signal averagingthat is performed. Execution times vary from seconds to tens of minutes, depending onthe scan mode and signal averaging combination that is executed.
A total of six scan modes are available to the instrument, four of which are spectralsweeps ranging from either 12 to 48 or 12 to 150 with step intervals of 0.5 or 0.1 AMU.
The remaining two scan modes make use of a peak jumping strategy, which allows the
instrument to rapidly monitor 15 peaks by evaluating only the peaks regions and therebyomitting m/z spectral regions of minimal interest.
Caadient tracking, one of the peak jumping modes, permits the instrument to adjustthe time interval between successive scans according to absolute value of amplitudechanges in the m/z peaks that are being monitored. This behavior relies on an algorithmthat compares the peak heights of the most recent scan with the corresponding peaks ofthe previous scan. If any of the peaks have changed amplitude by 100'lo or greater, theinstrument immediately commences a new scan. If the maximum amplitude change isgreater than 40 lo and less than 100'lo, the scan interval is decreased by a factor equal to
the peak height change, multiplied by the scan interval, If the largest peak height changeis between 30'lo and 40'lo, the scan interval remains unchanged. If the greatest peakheight change is less than 30'lo and the scan interval is less than three minutes, the scaninterval is increased by a quantity of seconds equal to 2 divided by the peak heightchange, up to a total delay interval of 3 minutes. When the delay interval is greater than30 seconds, the instrument immediately cycles into a standby mode, using the computer
80

to turn off the emission regulator for a duration ten seconds less than the delay interval.
The emission regulator is then powered up ten seconds before the standby interval ends to
allow sufficient time for electron beam stabilization,
3.1.5 Signal Averaging
While in operation the instrument can assume seven different signal-averagingintervals, two of which involve variable signal averaging. The five fixed signal-averagingroutines are SGO, 1G00, 2000, 5000 and 10000X, thereby decreasing statistical error to
4.5%, 3.2%, 2.2%, 1.4% aiid 1.0% respectively. The variable signal averaging conducts
repeated sampling until the absolute value of the integrated electrometer voltage relative
to baseline exceeds either 50 volts or 100 volts, and to avoid baseline clipping, relies on abaseline determination which is set equal to 75 mV less than the ion current sensed at m/z
= 11.5 AMV. This dependeiicy on the number of samples averaged to the integratedvoltage causes the same relative magnitude of statistical error to be generated for each
data point i.e. signal to noise ratio!; thus avoiding excessive sampling of large signals, orunder sampling of smaller signals. To minimize the time required for calibration, a
process requiring at least 300 data points, a limited 25X signal averaging routine is used yielding a statistical error of 20%! because just relative maxima are needed.
The signal averaging process entails that the appropriate mass first be tuned, and then
a 20-millisecond delay be instantiated to allow sufficient time for the electrometer outputto stabilize. After this delay period has ended, the DAQ's analog-to-digital converter
repeatedly samples the electrometer output in uninterrupted succession until the signa1averaging parameters have been satisfied. Execution of each sample cycle requiresapproximately 30 microseconds, resulting in respective times of 3S, 50, 80, 170 and 320
milliseconds for the 500, 1000, 2000, 5000 and 10000X signal averaging routines. Timerequirements for the variable signal averaging regimes cannot be predicted with completecertainty in advance of their execution because sampling times are a function of the
magnitude of the electrometer output voltage and various noise sources, causing higher.electrometer output signals to require less sampling time and smaller signals to demand
longer signal averaging. In addition to the signal averaging time requirements, fiuther
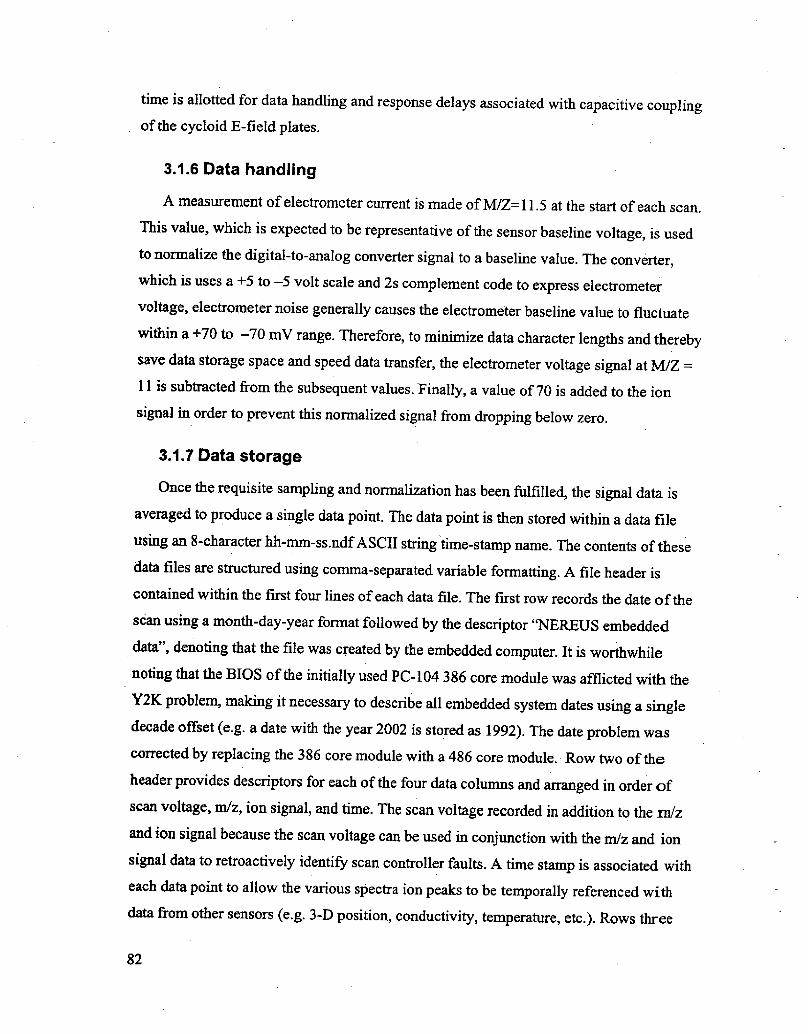
time is allotted for data handling and response delays associated with capacitive couplingof the cycloid E-field plates.
3.1.6 Data handling
A measurement of electrometer current is made of M/Z=11.5 at the start of each scan.
This value, which is expected to be representative of the sensor baseline voltage, is usedto normalize the digital-to-analog converter signal to a baseline value. The converter,which is uses a +5 to � 5 volt scale and 2s complement code to express electrometervoltage, electrometer noise generally causes the electrometer baseline value to fluctuatewithin a+70 to � 70 mV range. Therefore, to minimize data character lengths and therebysave data storage space and speed data transfer, the electrometer voltage signal at M/Z =11 is subtracted from the subsequent values. Finally, a value of 70 is added to the ionsignal in order to prevent this normalized signal from dropping below zero.
3.1.7 Data storage
Once the requisite sainpling and normalization has been fulfilled, the signal data isaveraged to produce a single data point. The data point is then stored within a data fileusing an 8-character hh-mm-ss.ndf ASCII string time-stamp name. The contents of thesedata files are structured using comma-separated variable formatting. A file header iscontained within the first four lines of each data file. The first row records the date of the
scan using a month-day-year format followed by the descriptor "NEREUS embeddeddata", denoting that the file was created by the embedded computer. It is worthwhilenoting that the BIOS of the initially used PC-104 386 core module was afflicted with the
Y2K problem, making it necessary to describe all embedded system dates using a singledecade offset e.g. a date with the year 2002 is stored as 1992!. The date problem wascorrected by replacing the 386 core module with a 486 core module. Row two of the
header provides descriptors for each of the four data columns and arranged in order ofscan voltage, m/z, ion signal, and time. The scan voltage recorded in addition to the m'zand ion signal because the scan voltage can be used in conjunction with the m/z and ionsignal data to retroactively identify scan controller faults. A time stamp is associated witheach data point to allow the various spectra ion peaks to be temporally referenced withdata &om other sensors e.g. 3-D position, conductivity, temperature, etc.!. Rows three
82
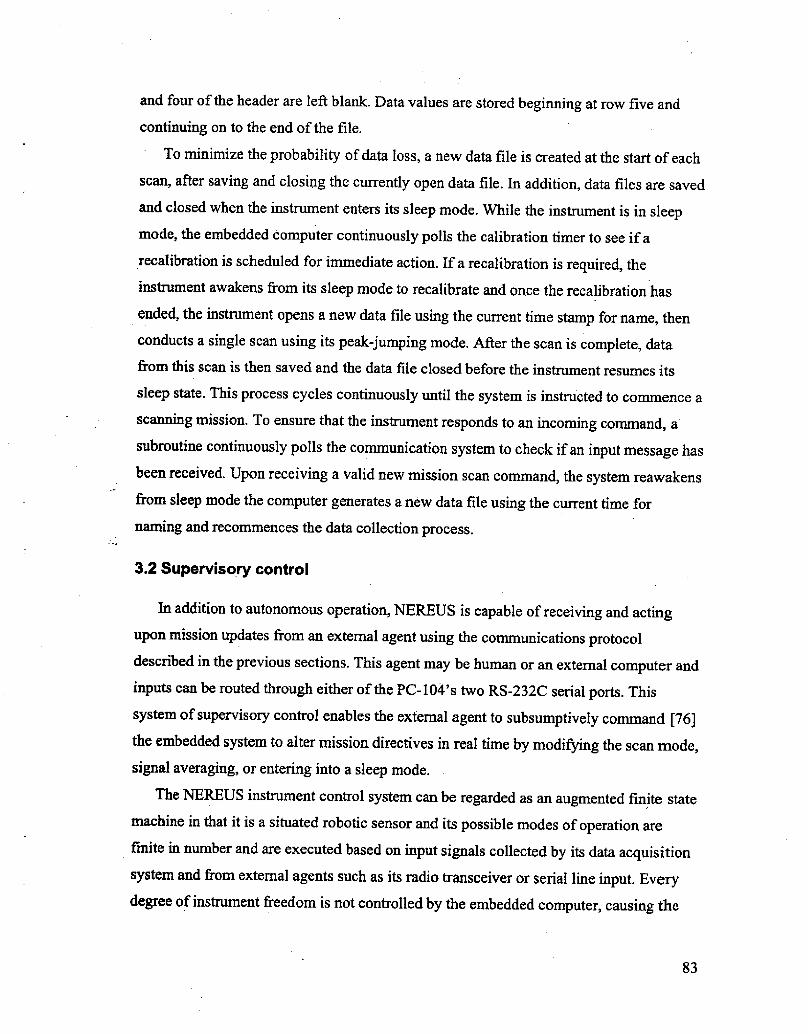
and four of the header are left blank. Data values are stored beginning at row five andcontinuing on to the end of the file.
To minimize the probability of data loss, a new data file is created at the start of each
scan, after saving and closing the currently open data file. In addition, data files are saved
and closed when the instrument enters its sleep mode, While the instrument is in sleepmode, the embedded computer continuously polls the calibration timer to see if a
recalibration is scheduled for immediate action. If a recalibration is required, theinstrument awakens from its sleep mode to recalibrate and once the recalibration has
ended, the instrument opens a new data file using the current time stamp for name, thenconducts a single scan using its peak-jumping mode. After the scan is complete, datafrom this scan is then saved and the data file closed before the instrument resumes its
sleep state. This process cycles continuously until the system is instructed to commence a
scanning mission. To ensure that the instrument responds to an incoming command, asubroutine continuously polls the communication system to check if an input message hasbeen received. Upon receiving a valid new mission scan command, the system reawakensfrom sleep mode the computer generates a new data file using the current time fornaming and recommences the data collection process.
3.2 Supervisory control
In addition to autonomous operation, NEREUS is capable of receiving and actingupon mission updates from an external agent usiiig the communications protocoldescribed in the previous sections. This agent may be human or an external computer andinputs can be routed through either of the PC-104's two RS-232C serial ports. This
system of supervisory control enables the external agent to subsumptively command [76]the embedded system to alter mission directives in real time by modifying the scan mode,signal averaging, or entering into a sleep mode.
The NEREUS instrument control system can be regarded as an augmented finite statemachine in that it is a situated robotic sensor and its possible modes of operation are
fmite in number and are executed based on input signals collected by its data acquisitionsystem and f'rom external agents such as its radio transceiver or serial line input. Everydegree of instrument freedom is not controlled by the embedded computer, causing the
83

control system to function as a non-holonomic system [77]; therefore, a robust
communications system was developed to prevent the embedded control system from
entering into an indeterminate state,
3.2.1 Communications protocol
To reduce instruction set length, thereby minimizing transmission time requirements
and increasing the likelihood of successful message transmission, commands are sent to
the embedded control system as an encoded two letter and one numeral ASCII string Table 3-3!. The string consists of a scan mode letter, followed by a signal average letter,then by a single digit number. Each letter uniquely specifies an option and a
corresponding integer value. The purpose of the numeric third character is to prevent the
instrument &om entering into an indeterminate state as a result of an erroneous command.
This encoded character is used to prevent the control system from entering a
indeterminate state by providing a validation that the two alphabetic characters are
accurate using an abbreviated version of a cyclical redundancy check, which is generated
by multiplying the associated values of the two variables, followed by a modulo 7
division of the product Figure 3-2 provides an example of a valid command message
string!. When a command is received by the embedded system, correct framing of thecharacter positions is accomplished using a range of A through 6 for the first character, T
through Z for the second position, and a value of 0 through 7 for the third positioncharacter. The most recently received command satisfying this criterion undergoes thepreviously described modulo 7 computation and the resulting value is then comparedwith the third position numeric character of the encoded command, If the values are
identical, the message is determined valid and a confirination response is sent to theremote system, followed by execution of the command.
84
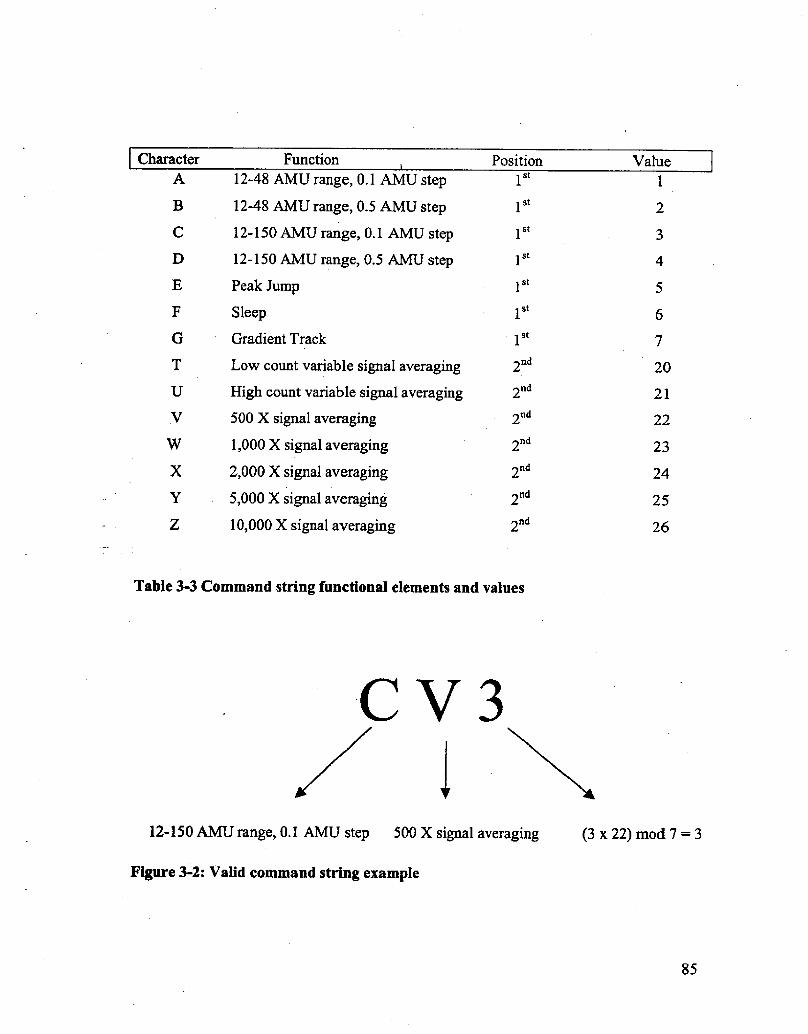
PositionFunction ValueCharacter
12-48 AMU range, 0,1 AMU step
12-48 AMU range, 0.5 AMU step
12-150 AMU range, 0.1 AMU step
12-150 AMU range, 0.5 AMU step
Peak Jump
1stD
1st
Sleep
1stGradient Track
Low count variable signal averaging 2ttd 20
2ndHigh count variable signal averaging
500 X sigil averaging
1,000 X signal averaging
2,000 X signal averaging
5,000 X signal averaging
10,000 X signal averaging
21U
2ttd 22V
2nd 23
2 tld24
2ttd25
2ttd 26Z
CV3
� x 22! mod 7 = 312-150 AMU range, 0.1 AMU step 500 X signal averaging
Figure 3-2: Valid command string example
85
Table 3-3 Command string functional elements and values

Messages transmitted out &om the embedded computer are ASCII strings of variable
length and can be of two types: data, or text, Therefore, each message class uses a uniqueset of start and stop characters. Data messages are composed of a "$" character start bit,
followed by a string representation of the comma separated scan controller input voltage,mass-to-charge ratio, and electrometer voltage data values, followed by a "k" stop
character. Text messages make use of a "¹" start character, followed by the text stringmessage, and concluded with a "." stop character. Data messages are sent to the
external agent to enable real time data analysis and redundant data storage. To avoid
transmission time associated delays, particularly when using the 9600 bit per second
radio transceiver, only 0,5 m/z interval data is sent. Text messages inform the external
agent of instrument condition states, These text messages include information regardingstates of calibration, emission regulator, mission changing, sleep mode, and time until
next scan sequence, and excessive peak height warnings.
3.3 Remote Graphical User interface
A remote graphical user interface GUI! has been developed to enable a human user
to monitor the instrument performance, modify instrument execution procedures and
interpret chemical data in real time. This capability can significantly enhance the
scientific discovery process by minimizing time delays common to iterative sampling andthereby reveal data relationships while still in the field I 78, 79], The GUI was written
and compiled into an executable file using the Microsoft Visual Basic 6.0 language, andit is designed to operate with a 32 bit Windows based PC operating systems such as
Microsoft Windows 95, 98, 2000 and XP. The software relies on a RS232 serial port toasynchronously communicate with the embedded NEREUS computer.
The GUI, named Thetis Spectral Viewer consists of two windows, a pop-up windowthat appears at startup time, and a main window. The pop-up window Figure 3-3!
provides the computer user with information about the software and presents two fields
for the user to enter his or her login name and password. The login name and passwordwere written into this software to prevent commands from being accidentally sent to the
NEREUS instrument or unauthorized operation of the instrument. The pop-up window is
86

withdrawn and main window is presented once the user has successfully logged in. A
series of communication startup procedures are initiated when the user logs in, including,identification of available serial ports, designation of port to be used and designation ofbit transfer rate.
Figure 3-3: Thetis Spectral Viewer login window
3.3.1 Main window
The main window consists of several independently functioning graphical elements.Across the top of the window is a standard upper tool bar. Directly below this is a row of'
checkboxes to allow up to eight gas peaks to be simultaneously monitored and threecommunication command buttons. Below the checkboxes arc two sets of radio buttons
for selecting signal averaging and scan type, and to their right is a histogram. Below thehistogram is a slider bar. To the left of the histogram and below the radio buttons is a
spectrum display. At the bottom of the window is a status bar indicating communication
87
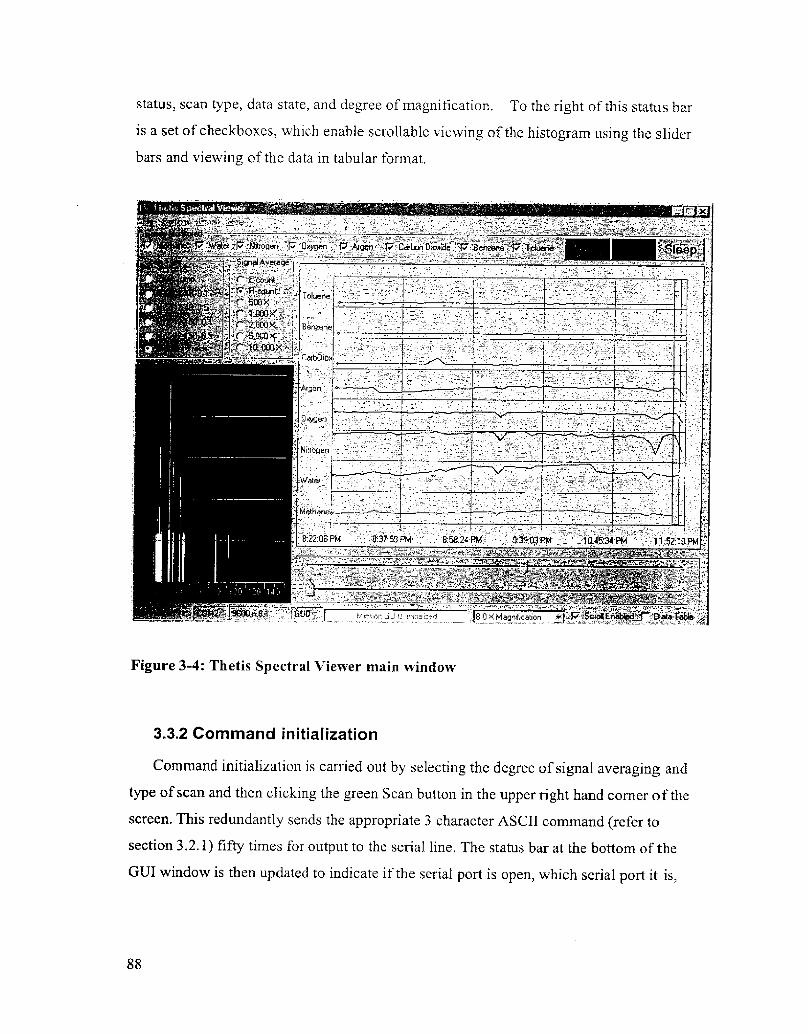
status, scan type, data state, and degree of magnification, To the right of this status bar
is a set of checkboxes, which enable scrol.lable viewing of the histogram using the slider
bars and viewing of the data in tabular format.
Figure 3-4: Thetis Spectral Vie>ver main window
3.3.2 Command initialization
Command initialization is carried out by selecting the degree of signal averaging and
type of scan and then clicking the green Scan button in the upper right hand corner of the
screen. This redundantly sends the appropriate 3 character ASCII command refer to
section 3.2.1! fifty times for output to the serial line. The status bar at the bottom of the
GUI window is then updated to indicate if the serial port is open, which serial port it is,
88


subroutine collects all subsequent characters into an input string until it encounters a stopcharacter of @ if the header character was ¹! or & if the header character was $!, If thecharacter is ¹ and a matching @ character is found, then the string is considered tocontain a valid text message and the string is trimmed of its start and stop characters
before appearing in the central text box within the status bar at the bottom of the window.
If a $ header character and matching & stop character is identified, then the internal
cd'aeter string is considered to be a NEREUS data string. If a second start character is
encountered before a matching stop character, the input string characters are cleared and
a new string is started. If the text message received &om NEREUS is "Awaiting newmission", the GUI automatically replies by sending the latest command that was selected.
When a NEREUS data string is found, the data string undergoes a secondary parsingand confirmation process before being stored as valid data and being incorporated intothe data display. This secondary parsing is executed by trimming the start and stopcharacters from the string and then dividing the string into 4 discrete strings scanvoltage, mass/charge, ion signal, time stamp! based on comma separators within thestring. The 4 strings are then checked to confirm that each is within its respective valid
range and that these strings are not identical to the previous data string received i.e.redundant data!. If aH of these parameters are satisfied, the data strings are consideredvalid and stored in the data matrix.
3.3.4 Oata visualization
The GUI visually presents the gathered data to the user in the forms of a histogram, aspectrum and an optional data table. The histogram, which is located on the right side ofthe window, describes peak data as a function of time, wherein the time domain is
expressed along the X-axis and the ion signal intensity is conveyed along the Y-axis. Thehistogram field is divided evenly into a number of horizontal rows equaling the totalnumber of gases selected in the "Gases Monitored" checkbox field and are labeled
according to the gas ion being monitored in that particular row, Vertical scaling of eachrow is derived 6om the maximum peak height of all monitored ion peaks in the datarange. Temporal scaling is determined by the tab positions on the slider bar when the
"scroll enabled" checkbox is selected. If this checkbox is not selected, the histogram only
90
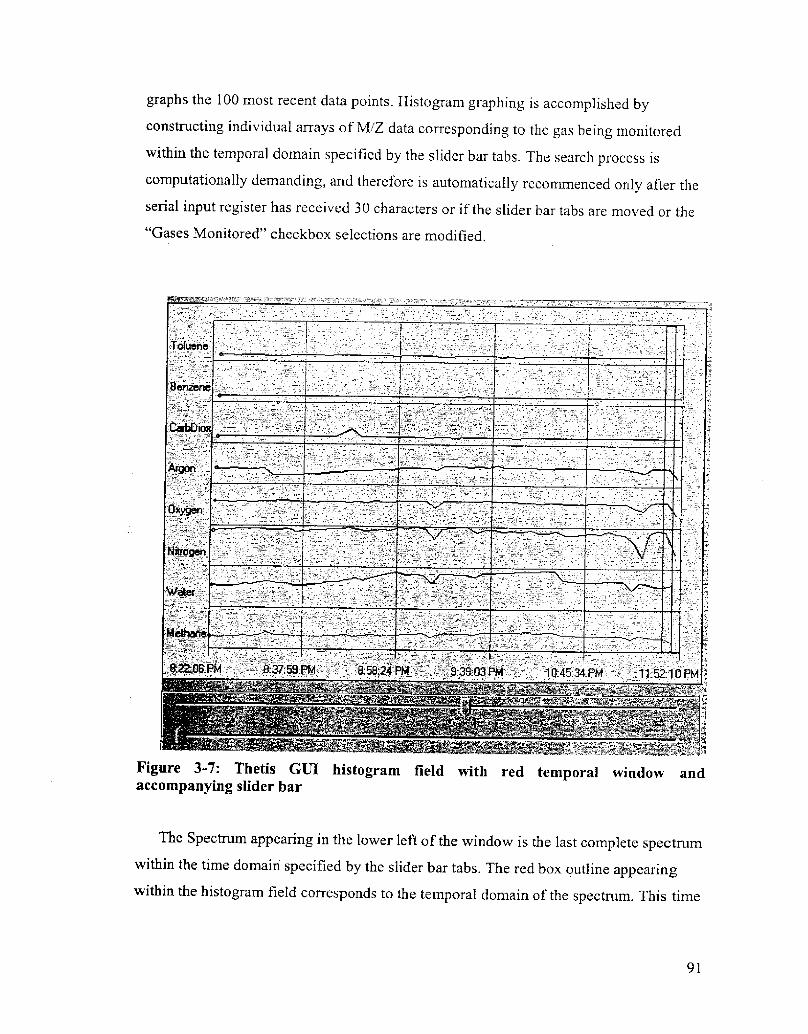
graphs the 100 most recent data points. Histogram graphing is accomplished byconstructing individual arrays of M/Z data corresponding to the gas being monitoredwithin the temporal domain specified by the slider bar tabs, The search process is
computationally demanding, and therefore is automatically recommenced only after theserial input register has received 30 characters or if the slider bar tabs are inoved or the
"Gases Monitored" checkbox selections are modified.
Pigure 3-7: Thetis GUI histogram field with red temporal window andaccompanying slider bar
The Spectrum appearing in the lower left of the window is the last complete spectrumwithin the time domain specified by the slider bar tabs. The red box outline appearingwithin the histogram field corresponds to the temporal domain of the spectrum. This time
91
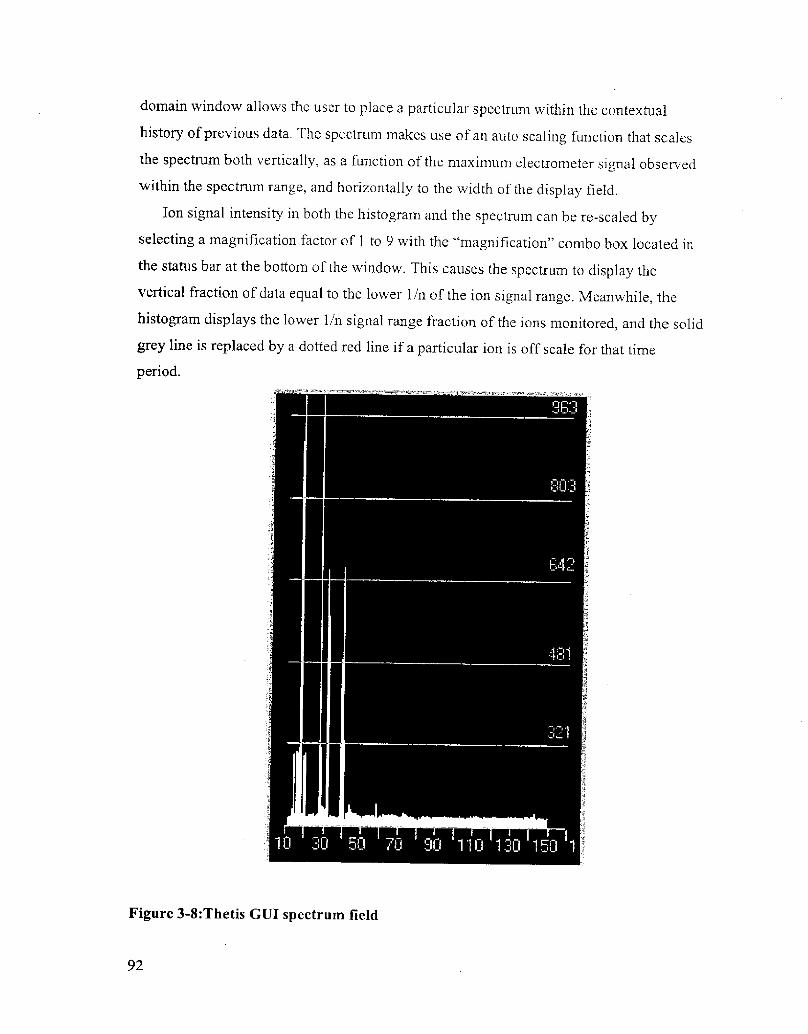
domain window allows the user to place a particular spectrum within the contextual
history of previous data. The spectrum makes use of an auto scaling function that scalesthe spectrum both vertically, as a function of the maximum clectrometer signal observedwithin the spectrum range, and horizontally to the width of the display field.
ion signal intensity in both the histogram and the spectrum can be re-scaled byselecting a magnification factor of 1 to 9 with the "magnification" combo box located in
the status bar at the bottom of the window. This causes the spectrum to display thevertical fraction of data equal to the lower 1/n of the ion signal range. Meanwhile, thehistogram displays the lower 1/n signal range fraction of the ions monitored, and the solidgrey line is replaced by a dotted red line if a particular ion is off scale for that timeperiod.
Figure 3-8:Thetis GUI spectrum field
92
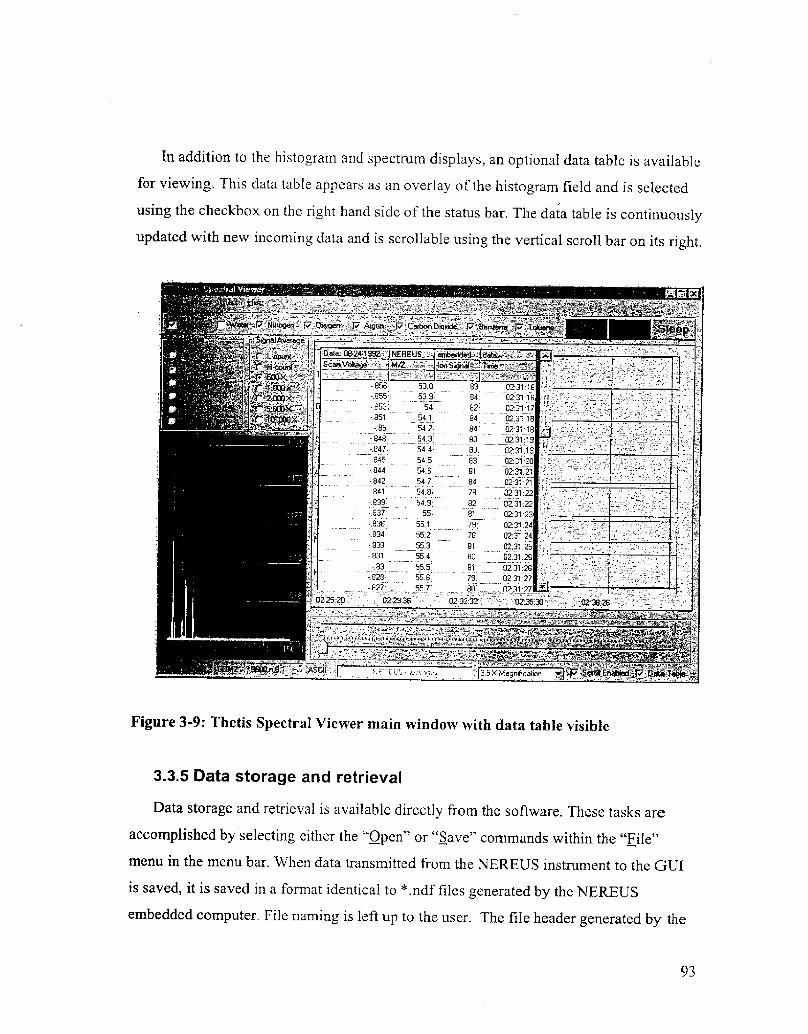
In addition to the histogram and spectrum displays, an optional data table is availablc
for viewing. This data table appears as an overlay of the histogram field and is selected
using the checkbox on the right hand side of the status bar, The data table is continuouslyupdated with new incoming data and is scrollable using the vertical scroll bar on its right.
X
<lv Niiioge'0-,' rv gal»~'::..+v:Ager'-'~j~.Qwbon Di @dc, 'fv»gwine'tv:,T~g 'agip. '- =-»4SIgn4i4iI4er494 .:
"Hil ~,-": -"I'Bete: 08 241992, »"' NEHBU619» '~
1-856-.855»853..851. 85
53.853 9
54
8384828454.1
54 2.543
8480848
947
Figure 3-9: Thetis Spectral Viewer main window with data table visible
3.3»5 Oata storage and retrieval
Data storage and retrieval is available directly from the software, These tasks are
accoinplished by selecting either the "Open" or "Save" commands within the "File"
tnenu in the menu bar. When data transmitted from the NEREUS instrument to the GUI
is saved, it is saved in a format identical to *.ndf files generated by the NFREUS
embedded computer. File naming is left up to the user. The file header generated by the
93
- 845»844.842841
-.839.837.. 836..834833831- 83
-.828-A>7
022620'
54 4 8354 5 8354. 6 8154 7 84548 7854.9: 82
55. 81551 7955.2 7855.3 81554 8055.5 8155 6 7955 7'
29 36 02 32.32
02:31 1602'31 1602 31 1702;31 1802 31 180?'31:1902:31.190231 2002: 31. 2102: 31.2102:31 2202:31:2202:31 230231 2402:31 2402; 31. 2502:31.260231:2602. 31. 2707.31 77
' OZ35
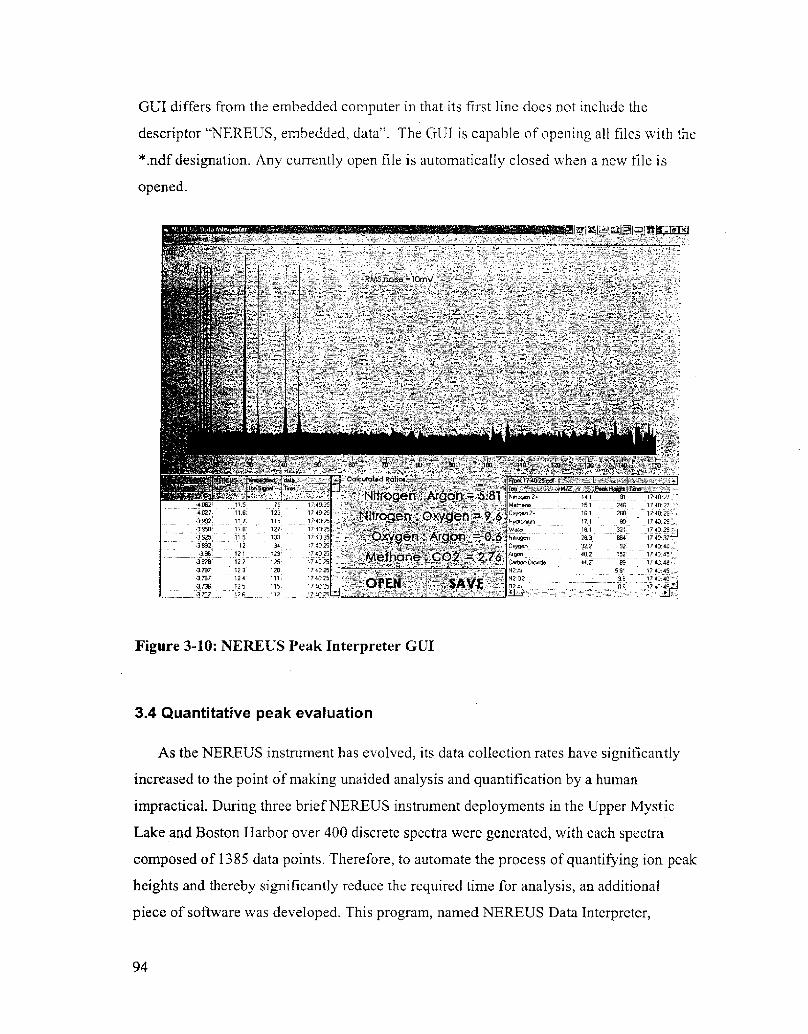
GUI differs from the embedded computer in that its first line does not include the
descriptor "NEREUS, embedded, data". The OUI is capable of opening all files with the
*.ndf designation. Any currently open file is automatically closed when a new file is
opened.
I~INIW~QJPII}:}I 5~67 ~
M "16} LWW ".'" I'~ »w'4"'.,'-I ~~~4 -; 7~.-,+-;*".3 '6»446 6'ddl . ' ' 1~076» ~ -7»64 -kd ~~LLtd2~" tdi};,:.:,4i;,:%~. "-:;." -8}:2, " ';. 7}V:-"-'@�::�» 60 ..":*;.,.-76} '7 .;QLL QSI' ~'.~'61}3@@;.�~ +~�'I3}t}7 +%4Q»"+W: 7565.... L ~d, 4. � I�~, ~ ' t 6 L, 14 66 1L@IL 4 .d»'
Figure 3-IG: NEREUS Peak Interpreter GUI
3.4 Quantitative peak evaluation
As the NEREUS instrument has evolved, its data collection rates have significantly
increased to the point of making unaided analysis and quantification by a human
impractical. During three brief NEREUS instrument deployinents in the Upper Mystic
Lake and Boston Harbor over 400 discrete spectra were generated, with each spectra
composed of 1385 data points. Therefore, to automate the process of quantifying ion peak
heights and thereby significantly reduce the required time for analysis, an additional
piece of software was developed. This program, named NEREUS Data Interpreter,
94
< 0624 027-3 992
-3 525
396:
3 7973 767
3 7QI7
11 511611 711611 912
121122'!23124'12.5126
75123115127133134'I 291251201111151I7
1 472517 402517 492517 402517 dt}25 *-17 402517402517 40 2517402517402517 4172517 4625
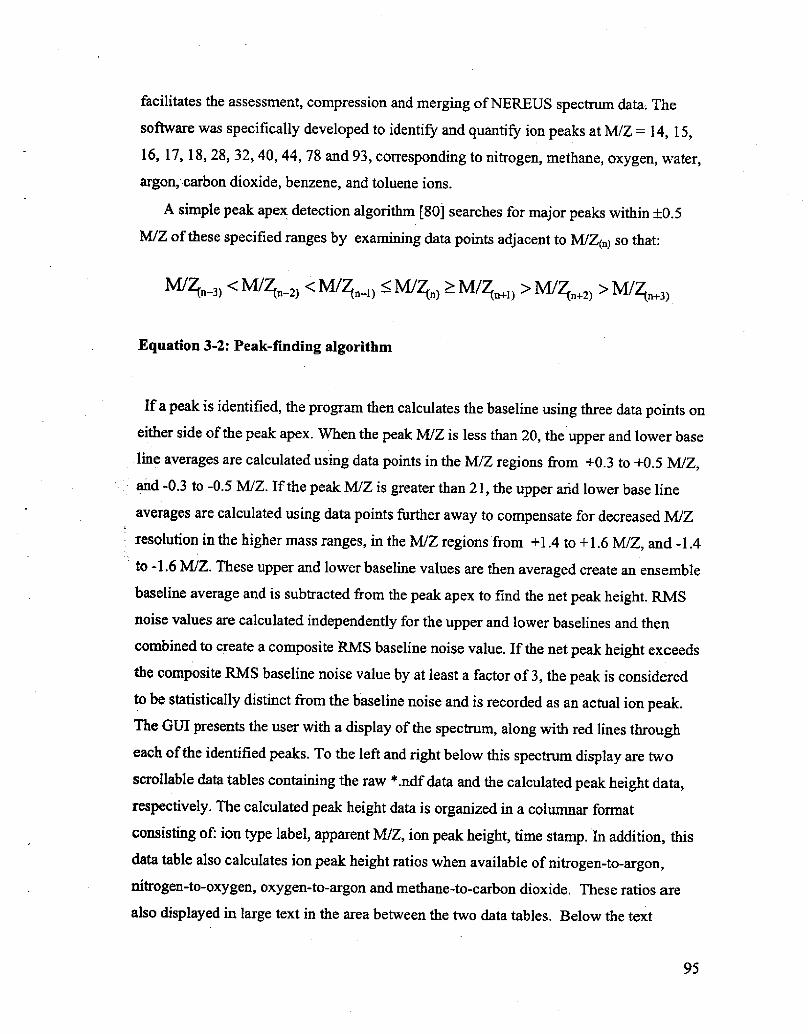
facilitates the assessment, compression and merging of NEREUS spectrum data, The
sofbvare was specifically developed to identify and quantify ion peaks at M/Z = 14, 15,
16, 17, 18, 28, 32, 40, 44, 78 and 93, corresponding to nitrogen, methane, oxygen, water,
argon, carbon dioxide, benzene, and toluene ions.
A simple peak apex detection algorithm [80] searches for major peaks within+0.5
M/Z of these specified ranges by examining data points adjacent to M/Z<�~ so that:
M/2 » < M/Z,�» < M/Z,�~! < M/g ! + M/g ~! ! M/2' » ! M/Q
Equation 3-2: Peak-finding algorithm
If a peak is identified, the program then calculates the baseline using three data points oneither side of the peak apex. When the peak M/Z is less than 20, the upper and lower baseline averages are calculated using data points in the M/Z regions &om +0.3 to +0.5 M/Z,and -0.3 to -0.5 M/Z. If the peak M/Z is greater than 21, the upper and lower base line
averages are calculated using data points further away to compensate for decreased M/Z
resolution in the higher mass ranges, in the M/Z regions from +1.4 to +1.6 M/Z, and -1.4
to -1.6 M/Z. These upper and lower baseline values are then averaged create an ensemble
baseline average and is subtracted &om the peak apex to find the net peak height, RMSnoise values are calculated independently for the upper and lower baselines and then
combined to create a composite RMS baseline noise value. If the net peak height exceedsthe composite RMS baseline noise value by at least a factor of 3, the peak is consideredto be statistically distinct &om the baseline noise and is recorded as an actual ion peak.The GUI presents the user with a display of the spectrum, along with red lines througheach of the identified peaks. To the left and right below this spectrum display are twoscrollable data tables containing the raw ~.ndf data and the calculated peak height data,respectively. The calculated peak height data is organized in a columnar format
consisting of: ion type label, apparent M/Z, ion peak height, time stamp. In addition, thisdata table also calculates ion peak height ratios when available of nitrogen-to-argon,nitrogen-to-oxygen, oxygen-to-argon and methane-to-carbon dioxide. These ratios are
also displayed in large text in the area between the two data tables. Below the text
95
display of the calculated ratios are two command buttons, "OPEN" and "SAVE". The
"OPEN" button allows the user to browse and select stored *.ndf files, and the "SAVE"
command saves the calculated peak heights and ratios to a *.npi NEREUS Peak
Interpreted! file. If a new file name is not specified, the GUI will automatically save the*.npi file with the name of *.ndf file that was used to generate the peak height data. All*.npi files are stored in a columnar format of comma separated variables, similar to the
~.ndf files and include a file header specifying the *.ndf file that was used to generate thedata.
96
Chapter 4
AUTONOMOUS UNDERWATER
VEHICLE DESIGN
The NEREUS instrument is designed to function aboard an Odyssey Class
autonomous underwater vehicle, having been originally proposed as payload within an
Sea Grant Odyssey II or Blueflin Robotics Odyssey III type vehicle. Both the Odyssey II
and III are derived &om. the Odyssey I predecessor which was developed by the MIT Sea
Grant AUV Laboratory and first underwent field trials off of New England in 1992. The
Odyssey concept focuses on AUV s that are small enough to be easily deployed and are of
low component cost. A key factor among these design parameters is the use of low-cost
mass produced glass flotation spheres, which commonly function as floats to full ocean
depth of 6,000 meters. These glass spheres house vehicle electronics, sensors and power
systems in a dry one-atmosphere environment, permitting the use of a &ee flooding
vehicle hull, thereby minimizing vehicle volume and displacement requirements, The
Odyssey I vehicle design which made use of 3 glass pressure spheres and a &ee flooding
Qberglass hull displaced 195 kg, with an overall length of 2.1 meters and maximum
diameter of 0.59 meters [81].
97

Figure 4-1: Odyssey I vehic1e courtesy of MIT Sea Grant!
4.1 Odyssey II design overview
In 1994 the Odyssey II generation began deployments in the Beaufort Sea to exploremechanics of Arctic sea ice. Like the Odyssey I, this second generation does not requireany special handling equipment for launch and recovery, and to function at full ocean
depth using spherical glass instrument housings, Unlike the highly experimental OdysseyI, the Odyssey II is a smaller displacement vehicle, which utilizes a molded double hull
design composed of high-density polyethylene, allowing for inexpensive mass productionas well as increased impact resistance [17]. Other significant differences are decreased
vehicle displacement, the core vehicle displacing approximately 120 kg and an increased
emphasis on modularity, permitting the Odyssey II vehicle reconfiguration according tomission requirements such as substitution of sensor payloads and rapid updating mission
profile libraries stored in the vehicles navigation computer. These design elements assist
in optimization for simultaneous use of multiple vehicles, leading to an overall increase
in synoptic coverage efficiency, energy management and robustness to component failure
[82]. Over the past decade, this design philosophy has proven both functional and robust,
resulting in several hundred successful dives and the Odyssey IIb, IIc and IId subclasses,
These subclasses, which were developed to satisfy specific mission goals, retain the saine
hull design and external dimensions of the Odyssey II, at an overall length of 2.2 meters
and 0.58 meters diameter. The first of these adaptations, the Odyssey IIb configuration,
was equipped with updated navigation control systems that relied upon a simplified
distributed intelligence working across RS232 serial communication lines coupled to
onboard sensors and actuators. The IIb design was first deployed in a month-long
experiment in June of 1996 to study the dynamics of &ontal mixing in the Haro Strait
near Vancouver Island, in which five vehicles were arrayed with various water quality
sensors, side-scan sonar, and acoustic Doppler current profilers [83]. Following the
successful Hara Strait experiments, the IIb design was auginented with various types of
cameras and deployed in numerous expeditions, Among others, missions to New Zealand
in search of giant squid in the Kaikoura Trench and to the Labrador Sea to study
thermohaline cycling of ocean waters [13]. In the first half of 2000 two Odyssey IIb
vehicles, named Xanthos and Borealis, were again updated with new navigation control
and sensor systems and dubbed IIc. Navigation control updates included replacing the
onboard Motorola 68040 based computer with a new PC-104 based main vehicle
computer MVC!, a high precision long-baseline navigation system using Kalman
filtering, a fluxgate inertial navigation sensor system, GPS synchronized microsecond
timing, and acoustic telemetry, During the Generic Oceanographic Array Technology
experiment GOATS 2000! the Xanthos IIc vehicle was equipped with an 8-element
sonar array mounted in a "swordfish" configuration on the vehicle's nose, along with a
Roxann bottom classification echo sounder, while the Borealis IIc vehicle carried a sub-
bottom profiler [84]. Collectively, these modifications sought to permit closed loop
navigation control and multi-vehicle operations in which the AUVs worked together to
achieve a common survey mission to transect a pre-specified area and measure the
99

acoustic field produced by the insonified targets and accurately navigate by acoustic
means [84].
Following these experiments, the Borialis vehicle was cannibalized for spare parts
and the remaining Xanthos vehicle was reconfigured by the AUV Laboratory in June of
2001 for Archaeological video survey work in the Mediterranean Sca [85]. This new
survey configuration came to be known as the Odyssey IId, and contained all of the core
vehicle components included in the IIc configuration as well as a ROS Navigator Video
camera positioned just forward of the vehicle thruster along with a downward lookingillumination source in the nose of the vehicle cite SG website!. The Odyssey IId Xanthos
was updated again by MIT Sea Grant in 2002 with a WHOI micro modem, an alkaline
primary battery replacing the silver-zinc secondary battery power supply, and installation
of a navigation software named Mission Oriented Operating System MOOS! [86, 87].
HOPE Quter Fainn
Cont
uster
.",:: '-' Camera Illumination Source
Figure 4-2: Odyssey IId Xanthos AUV
100
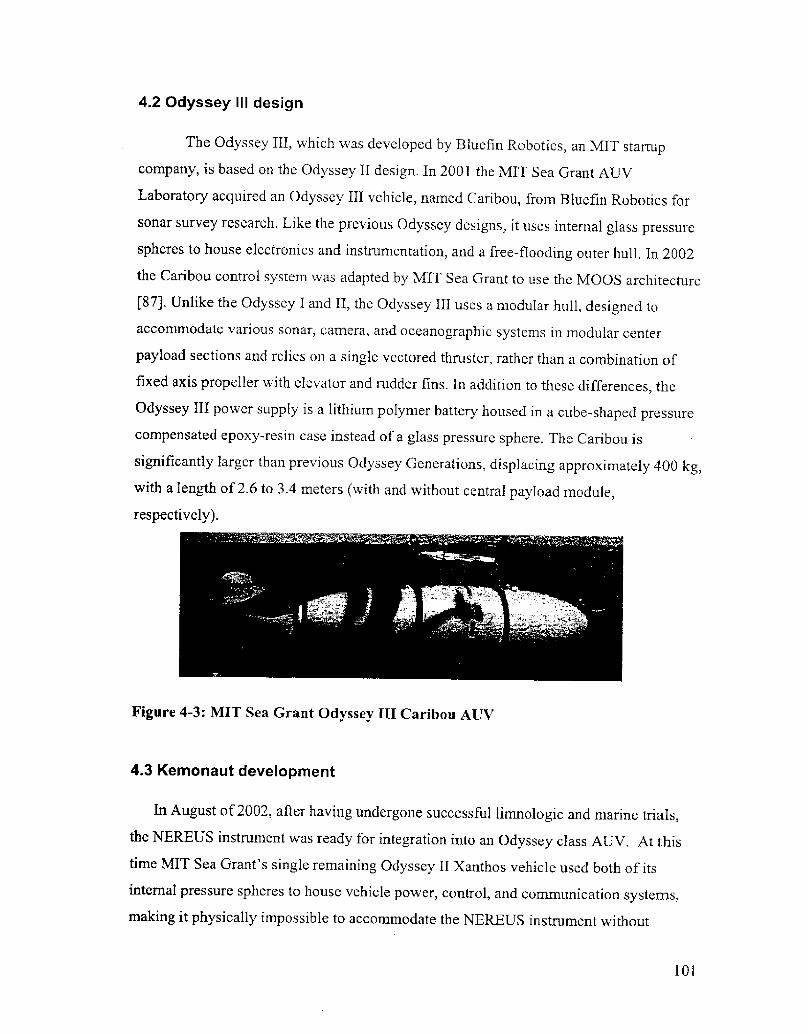
4.2 Odyssey III design
The Odyssey III, which was developed by Bluefin Robotics, an MIT startupcompany, is based on the Odyssey II design. In 2001 the MIT Sea Grant AUV
Laboratory acquired an Odyssey III vehicle, named Caribou, from Bluefin Robotics for
sonar survey research. Like the previous Odyssey designs, it uses internal glass pressurespheres to house electronics and instrumentation, and a free-flooding outer hull. In 2002the Caribou control system was adapted by MIT Sea Grant to use thc MOOS architecture
[87], Unlike the Odyssey I and II, the Odyssey III uses a modular hull, designed toaccommodate various sonar, camera, and oceanographic systems in modular center
payload sections and relics on a single vectored thruster, rather than a combination of
fixed axis propeller with elevator and rudder fins. In addition to these differences, theOdyssey III power supply is a lithiuin polymer battery housed in a cube-shaped pressurecompensated epoxy-resin case instead of a glass pressure sphere. The Caribou is
significantly larger than previous Odyssey Generations, displacing approximately 400 kg,with a length of 2.6 to 3,4 meters with and without central payload module,respectively!.
Figure 4-3: MIT Sea Grant Odyssey III Caribou AUV
4.3 Kemonaut development
In August of 2002, after having undergone successful limnologic and marine trials,the NEREUS instrument was ready for integration into an Odyssey class AUV. At this
time MIT Sea Grant's single remaining Odyssey II Xanthos vehicle used both of its
internal pressure spheres to house vehicle power, control, and communication systems,making it physically impossible to accommodate the NEREUS instrument without
101

consolidation of the components into a single sphere. The process of Xanthos sphereconsolidation was estimated to take several months, at a cost of several thousand dollars,
and was not entirely clear to work satisfactorily, On the other hand, NEREUS
deployment aboard MIT Sea Grant's Caribou vehicle was also impractical due to aninsufficient understanding of vehicle dynamics using a center payload section with the
vectored thruster and MOOS architecture, and because a center payload section was
unavailable for NEREUS, Purchase of a payload section from Bluefin Robotics was
estimated to cost several tens of thousands of dollars, with an estimated completion timeof a few months, again making deployment aboard the Caribou vehicle out of the
question.
After lengthy analysis it was decided that a new type of Odyssey vehicle could be
built specifically for NEREUS missions at an economic and time cost lower than that of
the Caribou center section or the Xanthos reconfiguration. Design of this new vehicle,
named Kemonaut, began in late October 2002 with the goal of producing an operationalvehicle before winter weather delayed NEREUS deployment until the following spring.
To speed the development process, it was determined that the Kemonaut design shoulduse an external hull, tail cone, control and power system spheres identical to the OdysseyIId [84]. However, because the Kemonaut vehicle required space for three glass pressurespheres two for standard Odyssey IId power and control and one for the NEREUS
instrument! while retaining the same external dimensions of an Odyssey II hull, a numberof new design factors had to be addressed, including:
increased vehicle displacement
decreased hull stiffness
decreased volume for core vehicle components
decreased volume for floatation foam
unknown vehicle center of buoyancy, center of mass, and dynamics
unknown navigation and communication system interference from the NEREUSinstrument
To further speed the design process, Kemonaut design plans were developed on acomputer using Solid Works CAD sofbvare, allowing analysis work to be undertaken
102

before vehicle components were built and thereby minimizing the excessive time and
economic costs of iterative physical fabrication and construction cycles.
4.3.1 Design and construction
The design process began by first obtaining an Odyssey II outer hull fairing From
MIT Sea Grant's AUV Laboratory. The fairing's diameter was then measured at 30
centimeter transect intervals along its longitudinal axis. These dimensions were then
used to loft a computer model of the external hull shape, which served as relative
boundary volume for vehicle components. Three 17" diameter spheres were then
described within this internal volume, yielding a residual volume for all other vehicle
components. To further increase clearance between the 3 spheres, as well as overall
vehicle stability lowering the vehicle center of mass! the glass pressure spheres were
asymmetrically positioned relative to the vehicle centerline Figure 4-4!. In this
arrangement the heaviest sphere containing the vehicle battery supply was located in the
lower central position, the NEREUS sphere was located in the forward position, and the
vehicle control sphere was positioned in the aft. This arrangement provided several
benefits, including:
Additional volume in the upper section of the hull is made available for floatation
foam, ~er improving stability characteristics.
Spacing between the vehicle's navigation and communication systems and the
NEREUS instrument is increased, thereby minimizing electro-magnetic
interference between vehicle and. NEREUS systems.
Distance between the two vehicle spheres and the tail cone is minimized, thereby
minimizing required cable length.
NEREUS sampling occurs before water is perturbed by the vehicle's motion.
Despite the advantages of this arrangement, the layout revealed that large sections of
the Odyssey II structural inner fairing would need to be removed in order to
accommodate the third NEREUS sphere, dramatically compromising the strength of the
inner hull. Furthermore, the additional 48 kg NEREUS sphere would require greater hull
strength than a standard twin sphere Odyssey II layout.
103

Figure 4-4iGlass pressure sphere placement within the Kemonaut AUV
To prevent hogging or more severe structural failure leading to possible pressuresphere damage during launch and recovery, an additional hull girder was essential for
improved hull rigidity. However, the third sphere and an additional girder significantlyreduce available volume for floatation foam, meanwhile requiring supplementarybuoyancy to offset the increased displacement produced by these new components.
Similar strength and mass constraints had previously been confronted duringdevelopment of the NEREUS instrument, leading to the usc of composite laminates andfoams in its structural elements. These materials functioned v ell in that they: reducedcomponent weight by approximately 80/o, endured high shock loads without failure
during instrument deployments. In addition, these materials are electrically andmagnetically non-conductive a consideration when using fluxgate sensors!, are generallyimmune to corrosive sea v ater, and can be fabricated into coinplex shapes relativelyquickly and at low cost. Based on the positive results met by the composite NEREUScomponents, a computer design of a composite longitudinal girder was developed to
fulfill the structural requirements of the Kemonaut vehicle. The contours of this
surfboard-shaped component allow it to occupy the normally empty four-inch gap,running the length of the hull, between the upper and lower Odyssey II inner fairings. Tofurther reduce the vehicle's floatation foam requirement, this girder design utilizes
marine structural foam p = 288 kg/m ! sheathed in a carbon fiber cloth p = 1,570
kg/m'!. The structural foam itself possesses flexural strength rise parallel to beamthickness! of 4.8 MPa, while the autoclave cured carbon material possesses a tensilestrength of 448 MPa. Because the NEREUS instrument is intended to operate to depths of
104

approximately 100 in, the structural foam was chosen as a compromise between the highbuoyancy but depth limited low-density foams and the enormous depth capability of lessbuoyant syntactic foam. The carbon fiber is an autoclave cured bi-directional �'/90 ! 33msi 2x2 twill, layered to 1.5 mm thickness, which is impregnated with an epoxy bindingmatrix, providing a measure of armor plating for the foam as well as a large proportion ofthe girder's rigidity.
Construction entailed creation of a plywood template to pattern the contours onto thecarbon cloth and structural foam. These materials were then cut to shape using a high-speed spiral saw. After trimming, the upper and lower carbon fiber sections were bonded
to the central foam section and vacuum cured using a small rotary pump and simplevacuum bag constructed of trash bin liners. Autoclave curing of the carbon/foamstructure was not attempted, as it would have been deleterious to the strength of the foam,External sides of the foam piece were also sheathed in carbon cloth, but were bonded
using an epoxy containing glass microfibers to decrease brittleness and thereby minimizethe likelihood of delamination. Curing was accomplished using the previously mentioned
. vacuum bag technique. Cutouts for vehicle components were then made to the girderafter curing was completed, The resulting composite structure has a mass of
approximately 9 kg and is calculated to withstand depths to 300 meters withoutsignificant compression taking place and, due to the density of the foam, providesapproximately 16kg of floatation.
AAer fabricating the girder, the lower inner hull fairing was modified to accept thethird NEREUS sphere by excising two sphere cradles from a surplus Odyssey II innerhull and repositioning these further apart within a second Oddysey II inner hull that wastrimmed to accept the transferred cradles. The third, central, sphere cradle wasconstructed of a non-ribbed polyethylene Benthos "hardhat", Accurate positioning of thesphere cradles was necessary because of the limited clearance between the spheres.Therefore, to insure proper spacing, glass hemispheres were placed in the cradles andaligned using the composite girder before the sphere cradles were riveted into place withstainless steel pop rivets.
A double-point lifling harness was designed instead of the single-point system thatOdyssey II vehicles use for multiple reasons. First, adequate clearance was not available
105

for a single central lift point because of the location of the center sphere. Second, two
relatively wide-spaced lift points would cause the vehicle's center of mass to reside
between the two points, allowing the vehicle to be lifted without the vehicle experiencingthe uncontrolled seesawing common to the single-point harness. Third, by distributing theloading between two attachment points, failure was less likely to occur. After finalizing acomputer design, the lift frame was fabricated of I/8"x 1" cross section annealed 0316
stainless steel bar stock and 1" diameter stainless steel eyebolts.
Placements of those components residing outside of the spheres were decided based
on orientation requirements for proper operation and computer generated clearance
estimates, As such, the sonar altimeter was positioned vertically between the forward and
middle sphere on the vehicle's starboard side and a cutaway was made in the underside of
the lower hull to expose the altimeter's acoustic head. To help equalize weight
distribution, placement of the depth sensor mirrored the sonar altimeter along the centralaxis, residing on the portside between the forward and middle sphere, Careful
consideration led to vertical placement of the GPS Intelligent Buoy GIB! transponder in
the nose of the vehicle, permitting the transponder head to sit proud of the hull for clearer
signal transmission. The battery housing supplying power to the strobe beacon was
placed immediately forward and starboard of the tail cone assembly in another attempt to
aid balance by offsetting the asymmetric girder cutaway required for the tail cone
assembly. The strobe light beacon, GPS antenna, and radio antenna were mounted
immediately aft of the lift harness' rear eyebolt on top of a 3.5 inch diameter cylindrical
long-base-line LBL! transducer that had been permanently affixed to the upper
hemisphere of the Xanthos control sphere.
A modular three-piece floatation system was designed to mount within the upper half
of the vehicle between the middle sphere and outer hull to increase vehicle payload
carrying capacity and further improve stability. Six pieces of 3 A" thickness pressure
resistant marine foam identical to material used in the composite girder! were cut to
track the hull shape using dimensions derived from clearance estimates between the outer
hull fairing, lift harness, and pressure spheres. The four forward-most pieces were then
bonded together and coated with an epoxy to improve durability, whereas the remaining
two foam pieces were coated with epoxy and cured separately. The large 4-piece section
106
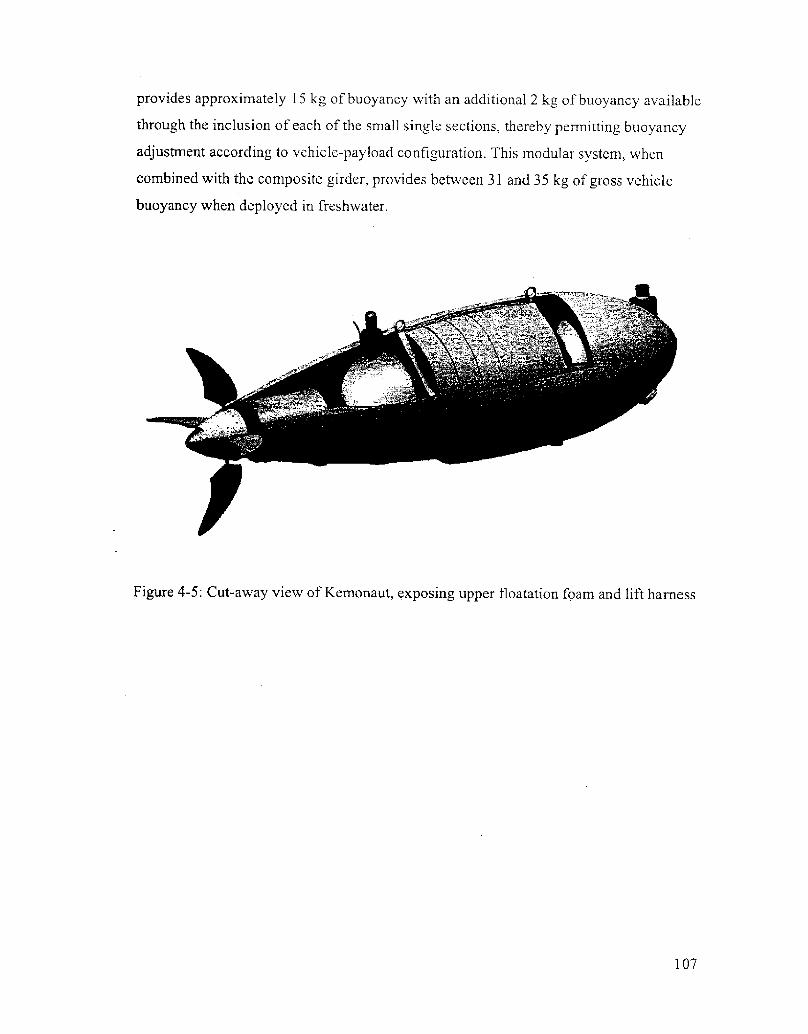
provides approximately 1S kg of buoyancy with an additional 2 kg of buoyancy available
through the inclusion of each of the small single sections, thereby permitting buoyancy
adjustment according to vehicle-payload configuration. This modular system, when
combined with the composite girder, provides between 31 and 35 kg of gross vehicle
buoyancy when deployed in freshwater.
Figure 4-5: Cut-away view of Kemonaut, exposing upper floatation foam and lift harness
107

~ Upper outer hull
Lift harness
Floatation foam
Beacon battery housing
Upper inner hull
Composite girder
Strobe beacon
Vehicle control sphere
Vehicle power sphere
NEREUS instrument sphere
GiB transponder
Pressure transducer
Sonar Altimeter
Lower inner hull
Tail cone assembly
Lead weight
Lower outer hull
NEREUS inlet guard
Figure 4-6: Exploded diagram of Kemonaut vehicle components
108
4.3.2 Control and navigation
Vehicle control was made possible using the Odyssey IId Xanthos tail cone assembly
and control sphere, Both components are powered using the central battery sphere which
houses a battery pack capable of generating 800 watt-hours of energy. The tail cone
assembly includes a propulsion unit powered by a 100 watt Pittman ELCOM series 5100
brushless thruster enclosed within a cylindrical metal Benthos pressure housing in
concert with an elevator and rudder subassembly composed of two oil compensated
Pittman 3100 actuators individually directed by JR Kerr motor controllers using Hall
effect feedback sensors [88].
Navigation is carried out through a simple open-loop system, using a global
positioning system and CrossBow AHRS altitude, heading and reference system
composed of a 3-axis accelerometer and magnetometer! contained within the control
sphere, along with a Data Sonics PSA-916 sonar altimeter and Paroscientific Digiquartz
pressure sensor[88]. Data from these sensors are supplied to the main vehicle computer
MVC!, a 300 MHz PC-104 stack, which uses MIT Sea Grant's Mission Oriented
Operating System MOOS! and is located within the aft control sphere. A FreeWave
spread spectrum radio modem housed in the aft sphere supplies communication between
the MVC and base station. This basic configuration allows the vehicle to obtain position
fixes and mission updates by way of the radio Cansmitter and onboard GPS when the
vehicle is surfaced. While submerged, the MVC executes mission directives using dead
reckoning estnnates via the AHRS, altimeter and pressure transducer. The MVC
automatically logs time stamped MOOS data during both surface and submerged
operation, permitting post-mission analysis of vehicle operations and mme synchronized
integration of vehicle track log data with NEREUS chemical data.
4.3.3 Assembly
After fabrication was complete, the new 3-sphere inner structural hull was fastened to
the outer hull using stainless steel screws. The tail cone assembly was then fitted to the
external hull, using a laser to align the thruster axis with the vehicle centerline, and held
in place with radially bored stainless steel screws. Next the sonar altimeter and pressure
transducer were mounted in the lower hull with hose clamps banding their housings to
109
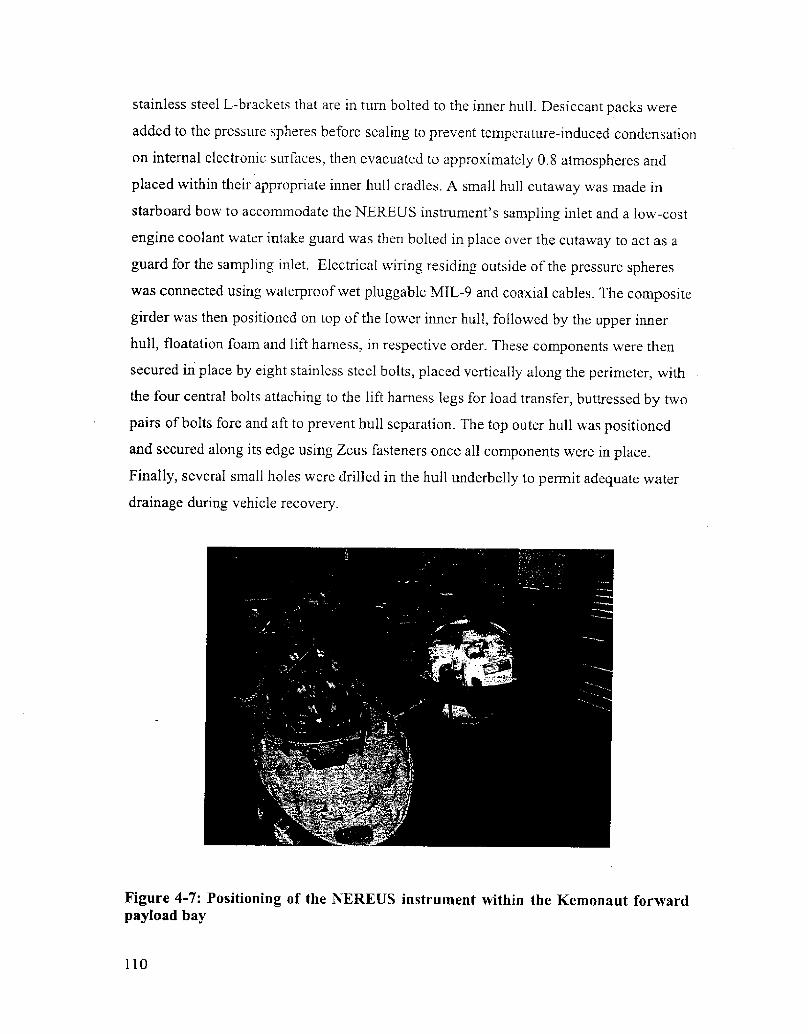
stainless steel L-brackets that are in turn bolted to the inner hull. Desiccant packs were
added to the pressure spheres before sealing to prevent temperature-induced condensation
on internal electronic surfaces, then evacuated to approximately 0.8 atmospheres and
placed within their appropriate inner hull cradles. A small hull cutaway was made in
starboard bow to accommodate the NEREUS instrument's sampling inlet and a low-cost
engine coolant water intake guard was then bolted in place over the cutaway to act as a
guard for the sampling inlet. Electrical wiring residing outside of the pressure spheres
was connected using waterproof wet pluggable MIL-9 and coaxial cables. The composite
girder was then positioned on top of the lower inner hull, followed by the upper inner
hull, floatation foam and lift harness, in respective order. These components were then
secured in place by eight stainless steel bolts, placed vertically along the perimeter, with
the fotu central bolts attaching to the lift harness legs for load transfer, buttressed by two
pairs of bolts fore and aft to prevent hull separation. The top outer hull was positioned
and secured along its edge using Zeus fasteners once all components were in place.
Finally, several small holes were drilled in the hull tutderbelly to permit adequate water
drainage during vehicle recovery.
Figure 4-7: Positioning of the NEREUS instrument within the Kemonaut forwardpayload bay
110

Figure 4-8: Partially assembled Kemouaut, showing the NKRKUS instrument andcomposite girder
Figure 4-9: Structural integrity test of fully laden Kemonaut vehicle
111

4.3.4 Stability and ballasting
Prediction of Kemonaut's displacement and ballasting requirements were made prior
to construction using computer-generated models of the assembled vehicle, The overall
vehicle was calculated to have a mass of nearly 185 kg and displace some 0.196 m'
volume, thus yielding a net buoyancy of about 15 kg in freshwater by assigning
appropriate material density characteristics to individual Kemonaut components.
Modeling and calculations also indicated that proper trim could be achieved by placing
1G kg of lead weight in the aft portion of inner hull immediately in front of the tail cone
assembly, along with approximately 4 kg of lead below the forward sphere. Thus,
producing a net 1 kg positive buoyancy in freshwater with a center of mass located
approximately 6 cm below the center of buoyancy.
Initial ballasting was carried out on December 10, 2002 in the Upper Mystic Lake
aAer the vehicle had been assembled. At this time the lake surface had frozen to a
thickness of several centimeters, requiring that a hole be made in the ice for ballasting.Using the Mystic Boat Club's facilities, the vehicle was lowered by electric hoist into the
water to observe static buoyancy. Lead weight was then added iteratively until the vehicle
established approximately 1 kg positive buoyancy and relatively neutral trim. A total of
15.4 kg of lead weight was added to the vehicle, with 8.8 kg two 10 lb lead dive
weights! placed immediately forward of the tail cone, 4.4 kg one 1G lb dive weight!
between the forward and middle inner hull cradles, and two 0.9kg � lb dive weights! on
the port and starboard beam each. Based on this ballasting, the vehicle was calculated to
need between 3.6 and 5.4 kg of additional ballast weigh for marine deployment.
Kemonaut was ballast tested prior to marine deployment in Boston Harbor from a
two-ton electric hoist. Based on results from earlier &eshwater ballasting, an additional
3.8 kg of weight was pre-fitted to the vehicle while undergoing assembly in the lab. This
additional weight was distributed in two equally weighted 1.8 kg bags of lead shot. The
first bag was zip-tie wrapped to the 10 lb dive weight in the nose of the vehicle, and the
second weight was wired tightly to the external aft surface of the vehicle, directly below
the two 10 lb dive weights, using 4 corrosive links. These corrosive links cause the
ballast weight to be jettisoned after a period of 12 hours, thereby improving the prospects
of successful recovery in the event of a vehicle system failure. Although theoretically
112

buoyant for seawater, the vehicle proved to be correctly ballasted without any additional
weight. Salinity tests confirmed the harbor water to be slightly brackish at 26-28 parts perthousand, thus helping to account for the density disparity. A small -300 cc piece offloatation foam was added inside the bow of the vehicle to achieve neutral trim.
Figure 4-10: Kemonaut ballasting in Upper Mystic Lake
113

114
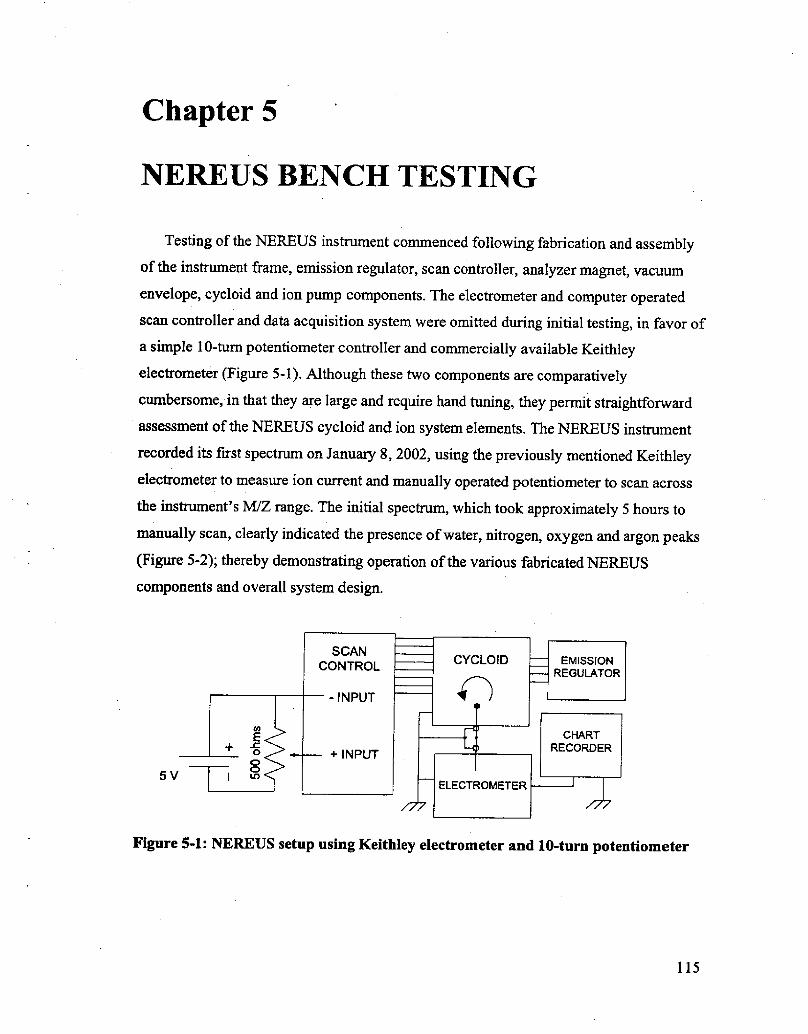
Chapter 5
NEREUS BENCH TESTING
Testing of the NEREUS instrument commenced following fabrication and assemblyof the instrument frame, emission regulator, scan controller, analyzer magnet, vacuum
envelope, cycloid and ion pump components, The electrometer and computer operated
scan controller and data acquisition system were omitted during initial testing, in favor of
a simple 10-turn potentiometer controller and commercially available Keithley
electrometer Figure 5-1!, Although these two components are comparatively
cumbersome, in that they are large and require hand tuning, they permit straightforward
assessment of the NEREUS cycloid and ion system elements. The NEREUS instrument
recorded its first spectrum on January 8, 2002, using the previously mentioned Keithleyelectrometer to measure ion current and manually operated potentiometer to scan across
the instrument's M/Z range. The initial spectrum, which took approximately 5 hours to
manually scan, clearly indicated the presence of water, nitrogen, oxygen and argon peaks Figure 5-2!; thereby demonstrating operation of the various fabricated NEREUS
components and overall system design.
5V
Figure S-I: NEREUS setup using Keithley electrorneter and l0-turn potentiometer
115

0.31
0.11
0.01 3.50 3.25 3.00 2.75 2.50 2.25 2.00 1.75 1.50 1.25 1.00Scan voltage volts!
Figure 5-2: First NEREUS scan completed on January 8, 2002, showing ambient airspectrum containing water, nitrogen, oxygen, and argon peaks.
Scans were carried out by varying the potentiometer output from � 3.5 to 0 volts,
developing cycloid plate electrical field potentials to focus ion beams ranging from 12 to
150 M/Z. Table 5-1! Repeated scanning revealed that capacitive coupling of the Faradaycup caused cycloid plate voltage tuning to produce a baseline transient in the ion signal
output. The 180' Faraday cup detector, which extends to the conflat flange pick-ups in
parallel to the cycloid Faraday cup, was shorted to the vacuum envelope, effectivelycreating ground plane shield to decrease this response delay. Following this
modification, the Keithley electrometer was also replaced with an electrometer and shield
designed specifically for the NEREUS instrument see section 2.3.6!. This Faraday cupand electrometer assembly greatly reduced the required scan time as well as noise, while
generating adequate amplification to permit signal output to be routed to a paper chartrecorder Figure 5-3!, Chart recordings indicated that the electrometer, which used a 10'
116

Q feedback resistor, yielded approximately 35 mV of noise while generating maximum
peak heights in the range of 100-200 mV, suggesting that the electrorneter's coaxial
compensator attenuated its overall gain by approximately a factor of 10. Therefore, to
more closely match the+SV dynamic range of the data acquisition system and to improve
signal-to-noise characteristics, the 10' 0 feedback resistor was replaced with a 10" 0feedback resistor, This modification generated an amplification increase of approximately10X, while slightly improving overall signal-to-noise characteristics and maintaining anelectrorneter response time of less than 30 ms.
Figure 5-3: NKRKUS ambient air spectrum using on board electrometer with 10 0feedback resistor
117

rn/z scan Vm/z scan V rn/z scan Vrn/z scan V m/z scan VM/z scan V
Table 5-1: Approximate scan input potentials negative voltage! required to focus agiven M/Z. Cycloidal scanning below M/Z=11 is not possible because of physical ionfocus limitations but out-of-range scan voltages have been included to illustrate thenon-linear relationship between M/Z focus and scan voltage.
5.1 Dissolved gas gradient sampling
AAer successfully demonstrating the ability to generate spectra from air and water
samples, a laboratory-synthesized gradient was created to test the instrument's capability
to accurately quantify dissolved gas concentrations. This simulated spatial gradient was
created by serially diluting an anoxic water sample previously collected in a BOD bottle
from the bottom of Mishewam Lake located in the Aberjona River watershed, north of
Boston, Ma.!. Analysis was performed by first exposing the membrane inlet to the
undiluted anoxic sample, followed by six serial dilutions with aerated mini-Q filtered
118
1 47.042 23.6'I
3 15.78
4 1'1.85
5 9A9
6 792
7 679
8 5,95
9 5.29
10 4.76
11 4.33
12 3.97
13 367
14 3.41
15 3.18
16 2.98
17 2.81
18 265
19 251
20 2.39
21 2.281
22 2.17
23 2.08
24 1.99
25 1.91
26 1.84
27 1.77
28 1,71
29 1,65
30 1.60
31 1.54
32 1.50
33 1.45
34 1.41
35 1.37
36 1.33
37 1.29
38 1.26
39 1.23
40 1.20
41 1.17
42 1.14
43 1.11
44 1.09
45 1.06
46 1.04
47 1.02
48 1.00
49 0.98
50 0.96
51 0,94
52 G.92
. 53 0.90
54 0.89
55 0.87
56 0.86
57 0.84
58 0.831
59 0,81
60 0,80
61 0,79
62 0.77
63 0,76
64 075
65 0,74
66 0,731
67 0.72
68 G,70
69 0,69
70 0,68
71 0.67
72 0.67
73 0.661
74 0.65
75 0,64
76 0.63
77 0.62
78 0.61
79 0 611
80 0,60
81 0.59
82 0.58
83 0.58
84 0.57
85 0.56
86 0.56
87 0.55
88 0.54
89 0.54
90 0.53
91 0.531
92 0.52
93 0.52
94 05$
95 0.50
96 0.50
97 0.49
98 OA9
99 0.48
100 0.48
101 0A7
102 OA7
103 0.46
104 0.46
105 0.46
106 OA5
107 0,45
108 0,44
109 0.44
110 0.44
111 GA3
112 0.43
113 G.42
114 0,42
115 0.421
116 OA1
117 OA1
118 0,41
119 0.40
120 OAO
121 0.40
122 0.39
123 0.39
124 0.39
125 0,38
126 0.3
127 0.381
128 0,37
129 0,37
130 0.372
131 0.37
132 0.36
133 03
134 0.361
135 0.35
136 0.35
137 0.35
138 0.351
139 0.34
140 0.34
141 0.344
142 0.341
143 0.33
144 0.33
145 0.3
146 0.332
147 0.330
148 0,327
149 0.32
150 0.323

water to yield progressively decreasing anoxic water mixtures of: 96%, 84%, 68%, 41%,
24%, 10% and 2%, The resulting data clearly show simultaneous measurement of
multiple gas species at useful and representative environmental concentrations Figure
5-4!. The comparatively linear relationship of gas concentration to mixing ratio and
correspondence of slope trends at ion peaks of M/Z = 15, 32, and 44 with expected
tendencies of methane, oxygen, and carbon dioxide suggest that the NEREUS instrument
sensitivity is stable and ion current increases monotonically and fairly linearly with
respect to concentration. Although actual gas concentration was not established through
independent gas analyses or meastuement with known gas standards, the simulated
surface water was near atmospheric equilibrium, allowing for estimation of dissolved
nitrogen, oxygen, argon, and carbon dioxide concentrations at the various mixing ratios.
10
20
I 40
~ -" 50X0
C 60~O
70
90
100
0 250100 150
gas concentration as measured in mV20050
Figure 5-4: Measurements of dissolved gases in a synthesized gradient usingMishawum Lake water.
119
5.2 Computerized operation and noise analysis
Following testing using the chart recorder and potentiometer, the data acquisition
system and computer were integrated into the instrument. The digital-to-analog converter
connection to the scan controller required an intermediate isolation amplifier to permit
the cycloid's center electric field plate to maintain a "floating" ground potential. Based
on electrometer performance calculations and results from manually executed scan rate
tests, the embedded computer's execution code was adjusted to employ a 30 ms wait
period to ensure adequate time for the electrometer stabilization. Digital ground returnpaths of the embedded PC-104 computer and DAQ circuitry were isolated from analogelectronic ground paths to prevent high speed switching pulses &om affecting analogcircuit stability, particularly analog-to-digital conversion, Finally, seven differing signal-averaging routines were included as a part of the computerized data collection system inan effort to increase spectrum signal-to-noise ratio.
120

t.aptop computer
Figure 5-5: Conceptual diagram of NEREUS control and data acquisition design

Spectra generated by this computerized control and data collection system exhibited
several characteristic improvements over manually generated data, including:
flatter basehne, substantially higher signal-to-noise ratio, better peak shape resolution in
higher m/z ranges, and the ability to rapidly tune to a precise m/z value Figure 5-6!.
2650
2150
5'E
1650C C5CO
0 1150
650
150 10 20 30 40 50 60 70 80 90 100 110 120 130 140 150HI/z
Figure 5-6: Ambient air spectrum, performed using computer control and dataacquisition at niass step interval = 0.1 M/Z. This spectrum reveals the presence ofnitrogen, oxygen, argon, water vapor, and carbon dioxide.
The signal averaging techniques used by the embedded computer can be broadly groupedinto two categories: fixed and variable number signal averaging. Fixed number signalaveraging is capable of reducing RMS noise by as much as a factor of 20, but this comes
at the expense of instrument speed. The tradeoff of speed versus time requirement isillustrated in Figure 5-8 wherein a 10X increase in sample population generally results ina 3X decrease in RMS noise, closely following the electroineter model predictions for
noise. Variable signal averaging was developed in an attempt to decrease instrument
sampling time requirements by varying the number of sampling cycles according tointegrated signal, thereby generating uniform signal-to-noise ratio throughout the entirescan range and avoiding over-sampling see section 3.1.5!.
122

300
280
240
220
EI 200O
180
160
120
100100 105 110 115 120 125 130 135 140 145 150
Figure 5-7: Comparison of typical noise characteristics of the NEREUS instrumentwhen operated using differing signal averaging regimes
Figure 5-$: RMS noise versus time required for completion of a high resolution,1385 data point, scan using a 100MHz embedded computer.
123
5451
48
4542
39
y 36E 33
30
27O2 24
21I 18
15
12
9 6 30
00:00,0 00:45.0 01:30.0 02:15.0 03:00.0 03:45.0 04:30.0 05:15.0 06:00.0 06:45.0
Time mm:ss!

These various signal averaging routines enable the NEREUS instrument to exchangescan speed for appropriate levels of accuracy. Based on the results shown in Figure 5-8, a500X signal averaging routine residing in the knee of the S/N vs. time curve! appears tobe most suitable for quick, moderate resolution, spectrum examinations in that it
efficiently minimizes both the required instrument scan time and signal noise. Thevariable signal averaging routines are most likely to be advantageous in situations whereextremely high scanning speed is needed, whereas high count signal averaging can beuseful for high-precision analyses such as ' N/' N, ' 0/' 0 isotopic determinations Figure 5-9!,
100
90
80
70
a 60
c 50
40
30
20
10
0
27.5 28.5 30.528 29.5 30
5.3 Instrument sensitivity
Based on earlier calculationsl 39], the analyzer requires a minimum gas influx rate ofapproximately of approximately 10' gas molecules per second, to generate a detectable
124
Figure 5-9: A high-resolution spectrum of ambient air, taken usin~ 10,000X signalaveraging, detailing nitrogen gas at M/Z = 28 and an apparent N- 'N isotopic peakat M/Z=29.
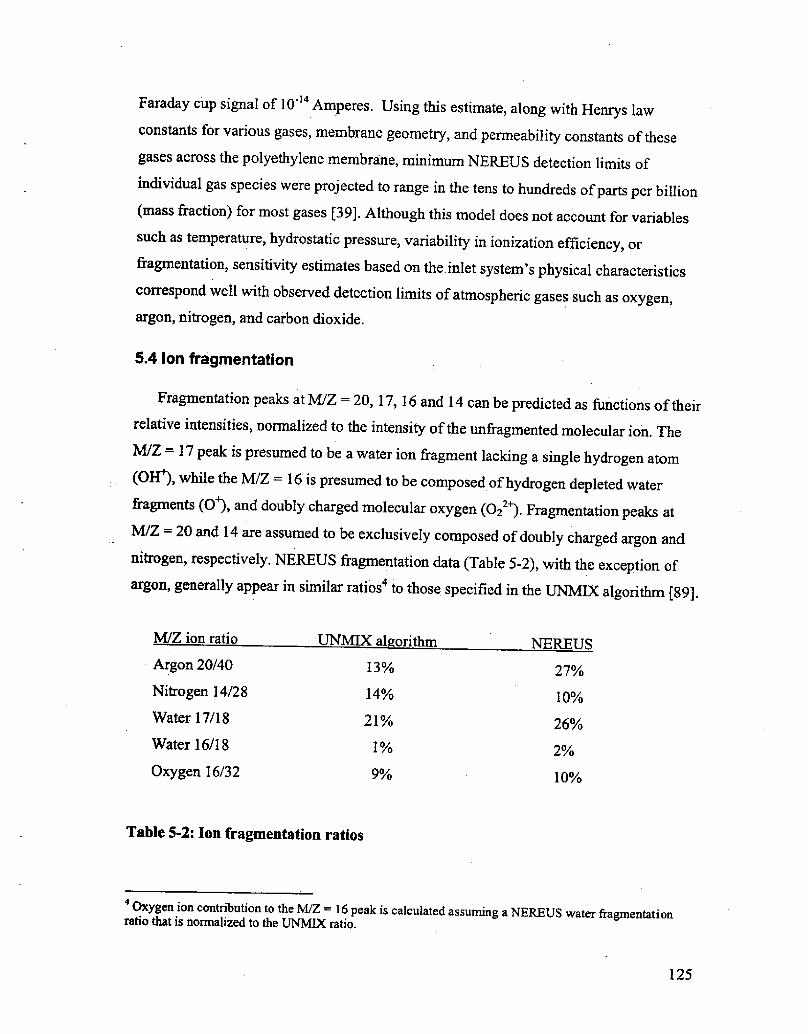
Faraday cup signal of 10 ' Amperes. Using this estimate, along with Henrys lawconstants for various gases, membrane geometry, and permeability constants of thesegases across the polyethylene membrane, minimum NEREUS detection limits of
individual gas species were projected to range in the tens to hundreds of parts per billion mass &action! for most gases [39]. Although this model does not account for variablessuch as temperature, hydrostatic pressure, variability in ionization efficiency, orfragmentation, sensitivity estimates based on the. inlet system's physical characteristicscorrespond well with observed detection limits of atmospheric gases such as oxygen,argon, nitrogen, and carbon dioxide.
M/Z = 17 peak is presumed to be a water ion fragment lacking a single hydrogen atoin Okf!, while the M/Z = 16 is presumed to be composed of hydrogen depleted water&agments �'!, and doubly charged molecular oxygen �2 !. Fragmentation peaks atM/Z = 20 and 14 are assumed to be exclusively composed of doubly charged argon andnitrogen, respectively. NEREUS fragmentation data Table 5-2!, with the exception ofargon, generally appear in similar ratios to those specified in the UNMIX algorithm [89].
M/Z ion ratio UNMIX al orithm NEREUS
Argon 20/40
Nitrogen 14/28
13'/o 27'/0
14'/0 10'/0
21'/0Water 17/18
Water 16/18
Oxygen 16/32
26e/0
1 0/o 2'/0
9'/0 100/0
Table 5-2: Ion fragmentation ratios
Oxygen ion contribution to the M/Z = 16 peak is calculated assuming a NEREUS water fragmentationratio that is normalized to the UNMIX ratio.
125
5.4 ion fragmentation
Fragmentation peaks at M/Z = 20, 17, 16 and 14 can be predicted as functions of theirrelative intensities, normalized to the intensity of the unfragmented molecular ion. The
5.5 Temperature associated peak height variation
Tests were conducted to determine the effects of membrane temperature on
instrument sensitivity. Prior modeling of inlet membrane kinetics suggested thatdecreasing membrane temperature would cause a simultaneous decrease in membrane
permeability,-resulting in an overall decrease in instrument sensitivity. Testing wascarried out by conducting sequential scans while the instrument's membrane inlet was
submerged in a beaker of filtered water. The water was first chilled to approximately 1 Cand air bubbles were flushed from the surface of the membrane before scanningcommenced. Scans were then conducted in direct succession while the water warmed and
the water's temperature was recorded. The peak height data was then time correlated
with temperature measurements to produce a temperature-ion peak data series for water,nitrogen, oxygen and argon ions. With the exception of argon, data from all gases within
the temperature range of 5 to 22 'C reveal a generally exponential relationship between
ion sensitivity and membrane temperature. Data taken at temperatures below 5 'C appear
to diverge from the exponential trend and appear to plateau to a constant value. The cause
of this low temperature trend is unclear, and maybe due to any number of mechanisms,including: 1! the membrane material undergoing a discontinuous change in its
permeability, 2! membrane material being at a greater temperature than the sample water,or other analyte influx mechanisms donunating such as: 3! degassing from internalvacuuin system surfaces, 4! decreased ion pump pumping efficiency, or 5! vacuumsystem leaks.
A near exact correlation is visible between the slopes of M/Z = 17 and 18, signifyingthat M/Z = 17 is an ion fragment OH ! of water vapor, In contrast, the ion peaks at M/Z= 16 exhibit a slope more closely following that of M/Z = 32, suggesting that the M/Z =16 peaks are predominantly composed of doubly charged oxygen gas �2 '!, nothydrogen depleted water ion fragments �'!. Peak heights at M/Z = 40 appear to exhibit atrend of increasing amplitude as a function of increasing temperature, which is the
inverse of all other M/Z peaks. This irregularity is likely caused by decreased ionpumping efficiency at lower temperatures and may be further intensified due to the fact
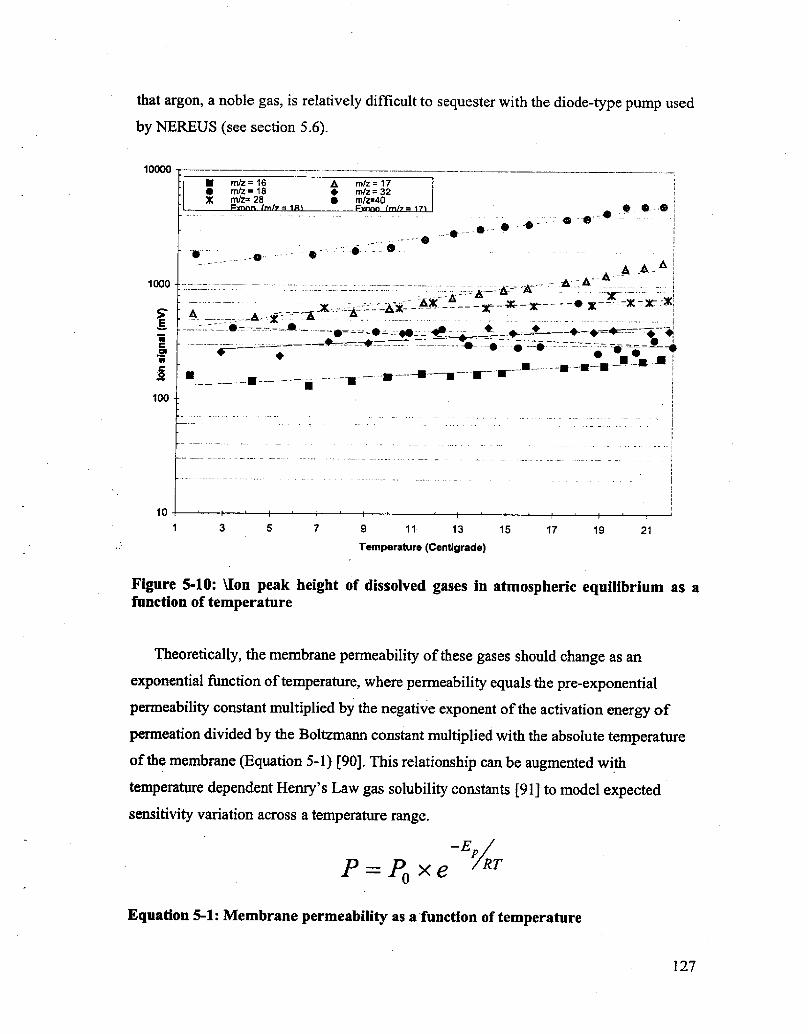
that argon, a noble gas, is relatively difficult to sequester with the diode-type pump used
by NEREUS see section 5.6!.
10000
1000
lOC CINc 0
10 17 9 11 13 15 17 19 213 5
Temperature Cerltlgrede!
Figure 5-10: Uon peak height of dissolved gases in atmospheric equilibrium as afunction of temperature
Theoretically, the membrane perineability of these gases should change as an
exponential function of temperature, where permeability equals the pre-exponential
permeability constant multiplied by the negative exponent of the activation energy of
permeation divided by the Boltzmann constant multiplied with the absolute temperature
of the membrane Equation 5-1! [90]. This relationship can be augmented with
temperature dependent Henry's Law gas solubility constants [91] to model expected
sensitivity variation across a temperature range.
Equation 5-1: Membrane permeability as a function of temperature
127

10000.0
1000.0
100.0
10.0 1 2 3 4 5 6 7 8 9 10 11 12 13 'f4 16 16 17 'f8 19 20 21Temperature centigrade!
Figure 5-11: Model of NEREUS ion peak height sensitivity as a function oftemperature i.e. with respect to membrane energy of activation and Henry's Lawsolubilities in freshwater!. Data points are normalized to NEREUS spectrum datafrom filtered water at 22'C.
Model data derived using these parameters for water vapor, nitrogen and oxygendemonstrate exponential trends similar to measured data trends Figure 5-11!, Although,model calculations suggest a more precipitous decrease in permeability as themembrane's temperature decreases than the experimental data, the slope ratios of thesegases i.e. model slope ratios compared with measured slope ratios! exhibit a closerdegree of congruence.
5.5.1 Temperature dependent detection limits
The temperature dependent permeability parameters may also be coupled topreviously modeled expected instrument detection limits [39j to yield dissolved gasdetection limits of the instrument at varying temperatures. This model, which takes into
128
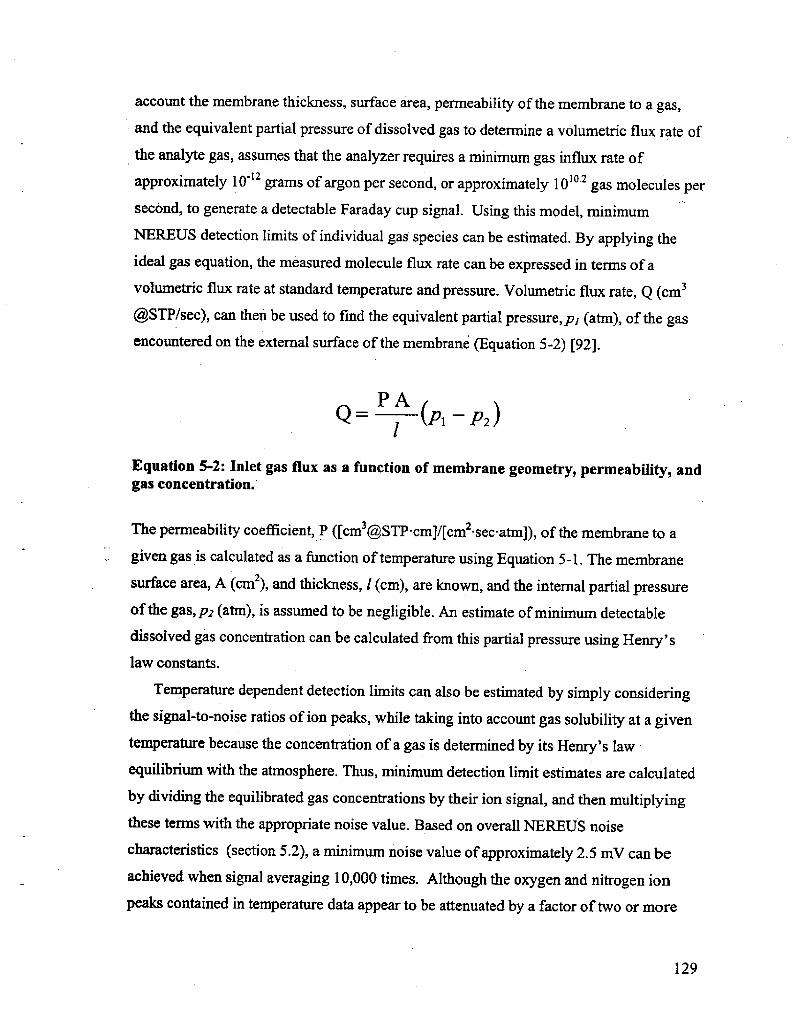
account the membrane thickness, surface area, permeability of the membrane to a gas,and the equivalent partial pressure of dissolved gas to determine a volumetric flux rate of
the analyte gas, assumes that the analyzer requires a minimum gas influx rate of
approximately 10 ' grams of argon per second, or approximately 10' ' gas molecules persecond, to generate a detectable Faraday cup signal. Using this model, minimum
NEREUS detection limits of individual gas species can be estimated. By applying theideal gas equation, the measured molecule flux rate can be expressed in terms of a
volumetric flux rate at standard temperature and pressure. Volumetric flux rate, Q cm'
.STP/sec!, can then be used to find the equivalent partial pressure, pj atm!, of the gasencountered on the external surface of the membrane Equation 5-2! [92].
Equation 5-2: Inlet gas flux as a function of membrane geometry, permeability, andgas concentration.
The permeability coefficient, P [cm @STP em]/[cm sec atmj!, of the membrane to agiven gas is calculated as a function of temperature using Equation 5-1, The membrane
surface area, A cm'!, and thickness, l cm!, are known, and the internal partial pressureof the gas, pz atm!, is assumed to be negligible. An estimate of minimum detectable
dissolved gas concentration can be calculated from this partial pressure using Henry' slaw constants.
Temperature dependent detection limits can also be estimated by simply consideringthe signal-to-noise ratios of ion peaks, while taking into account gas solubility at a giventemperature because the conception of a gas is determined by its Henry's law
equilibrium with the atmosphere. Thus, minimum detection limit estimates are calculated
by dividing the equilibrated gas concentrations by their ion signal, and then multiplyingthese terms with the appropriate noise value. Based on overall NEREUS noise
characteristics section 5.2!, a minimum noise value of approximately 2.5 mV can be
achieved when signal averaging 10,000 times. Although the oxygen and mtrogen ionpeaks contained in temperature data appear to be attenuated by a factor of two or more
129

dissolved oxygen and nitrogen peaks at room temperature are typically in the vicinity of1000 and 2000 mV, respectively!, order of magnitude estimates from this data indicate
that the NEREUS instrument is capable of detecting dissolved oxygen and nitrogen inconcentrations as low as 0.1 to 0.01 p,l/l.
5.6 Variable ion pump efficiency
During bench testing of the NEREUS instrument it became apparent that the pumpingefficiency was variable. Occasionally, sharp increases in ion pump current demand wereobserved, along with a simultaneous heightening of ion peaks at M/Z = 28, 32 and 40,suggesting that bursts of sequestered gases &om the pump's walls were being reemitted,According to the Varian product literature,
When an ion pump is new or has been regenerated, for example bybaking, the surface layer of the cathode is clean and the gas re-emission
from it is negligible. In this condition, the ion pump is called'unsaturated' and the pumping effect is due both to the gettering effect as
well as to ion implantation and diffusion. As the number of gasmo1ecules implanted into the cathode increases, the re-emission due to
the ion bombardment increases, As a consequence, the net pumpingspeed decreases until an equilibrium condition between ion implantation
and gas re-emission is reached. In this condition, the ion pump is'saturated' and the net pumping speed due only to the gettering action of
the material sputtered from the cathode! is about half the pumping speedof the unsaturated pump... The main characteristic of noble gases is that
they do not react with any other element. Therefore, the film producedby the sputtering of cathode material does not provide getter pumpingfor helium and argon. Moreover, since these gases do not tend to diffuse
into the cathode, the pumping effect due to the ion implantation is notpermanent. Nevertheless, all the ion pump elements have some capacity
to remove these gases, Noble gases are pumped by being buried by
titanium. Noble gas ions can be neutralized and scattered from the
130

cathode without losing their energy. These neutral atoms maintain
enough energy to implant or stick on the anode and on the pump wallswhere they will be buried by sputtered titanium and thus permanentlypumped. In the Diode configuration, the neutralization and back
scattering probability is very small, thus the pumping speed for noble
gases is only a small percentage of the nitrogen pumping speed.Moreover, when operating at a relatively high argon partial pressure i.e., higher than 10 mbar!, sudden bursts of pressure due to the re-emission of temporarily implanted argon in the cathode is observed.
After this occurs, a Diode pump is not able to pump more argon until itssource is stopped. This phenomenon is known as 'argon instability'. [93]
This explanation is consistent with the observed sporadic increases in argon ion peakheight, and may also account for the similar behavior encountered with oxygen andnitrogen ion peaks. It is hypothesized that a sudden re-emission burst of argon from thepump may trigger an avalanche of other gases from internal pump surfaces. The scenariois especially likely if the ion pump has been used for an extended period without havingundergone regenerative baking-out, thus allowing the gas load buried within the pumpwalls to build up.
14005'C
1200
g 1000C 0
800C 0
6000
0 0O gQ
2008 C 0lO 0 0
12 17 22 27 32 37 42 47 52 57 62 67 72 77 82 87 92
Figure 5-12: NEREUS ion signal variability, recorded while submerged in a Aume,based on 9 consecutive spectrum scans executed using a peak jumping algorithm.
131

Data from 9 consecutive scans within a 7 minute period during submerged testing
section 5.8! of the instrument in a laboratory flume filled with stationary water revealed
greatest peak height variability among M/Z = 28, followed by 32 and 40. Although the
instrument was submerged in water, peak height variability at M/Z = 18 and 17 was
considerably less than 16, and orders of magnitude below that of M/Z = 28, 32 and 40,
suggesting that the deviation was unlikely to have been caused be vacuum system leaks
or variable ionization, Furthermore, there was no appreciable variability in peak heights
at regions near M/Z = 12, 15, 78 and 91, indicating that electrometer drift was not
significant. At the time of this test the ion pump had operated for more than 100 hours
without bake out, while conducting NEREUS air spectrum analyses. After experiencing
similar degassing events during the first tethered NEREUS deployment, this ion pump
was replaced prior to its second tethered deployment and recorded comparatively
negligible argon and nitrogen signal variation during that deployment.
Based on the observed instrument behavior and ion pump literature, it appears that
periodic high-temperature bake out of the ion pump aids not only in extending pump life,
but also minimizes background noble gas enrichment and facilitates stabilization of
instrument sensitivity. NEREUS ion pump rejuvenation has been successfully completed
on several occasions by removing the ion pump housing and heating the pump body to a
temperature of approximately 125-150 'C. Once the ion pump body has reached its
prescribed temperature, the pump-down inlet valve and vacuum envelope valves are
opened and the system is evacuated using an oil diffusion pump in series with a roughing
pump, Suitable results have been achieved when this pump down is performed for a
period of at least 12 hours. This process requires that the ion pump's high voltage power
supply be turned off, and care must be taken not to scorch the instrument's composite
frame, nor to surpass the nearby analyzer magnet's Curie temperature.
5.T instrument response time
Several factors affect NEREUS response time, including electrometer response time,
vacuum system conductance, membrane diffusivity, and diffusivity of gases across the
unstirred water boundary layer residing outside of the membrane. However, prior
132
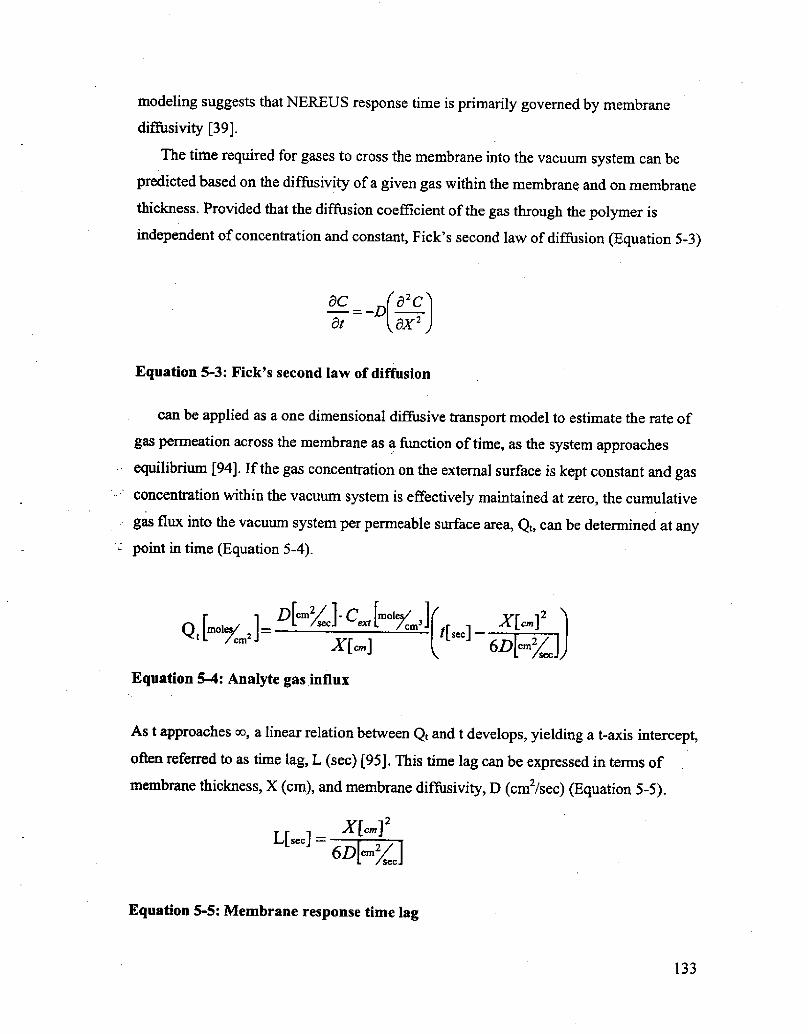
modeling suggests that NEREUS response time is primarily governed by membranediffusivity [39].
The time required for gases to cross the membrane into the vacuum system can bepredicted based on the diffusivity of a given gas within the membrane and on membrane
thickness. Provided that the diffusion coefficient of the gas through the polymer isindependent of concentration and constant, Fick's second law of diffusion Equation 5-3!
BC O'C
ar aX'
Equation 5-3: Fick's second law of diffusion
can be applied as a one dimensional diffusive transport model to estimate the rate of
gas permeation across the membrane as a function of time, as the system approaches
equilibrium 194]. If the gas concentration on the external surface is kept constant and gasconcentration within the vacuum system is effective1y maintained at zero, the cumulative
gas flux into the vacuum system per permeable surface area, Q�can be determined at anypoint in time Equation 5-4!.
Equation 5-4: Analyte gas influx
As t approaches oo, a linear relation between Q, and t develops, yielding a t-axis intercept,
often referred to as time lag, L sec! [95]. This time lag can be expressed in terms of
membrane thickness, X cm!, and inembrane diffusivity, D cm /sec! Equation 5-5!.
L[ ] XI-]
Equation 5-5: Membrane response time lag
133
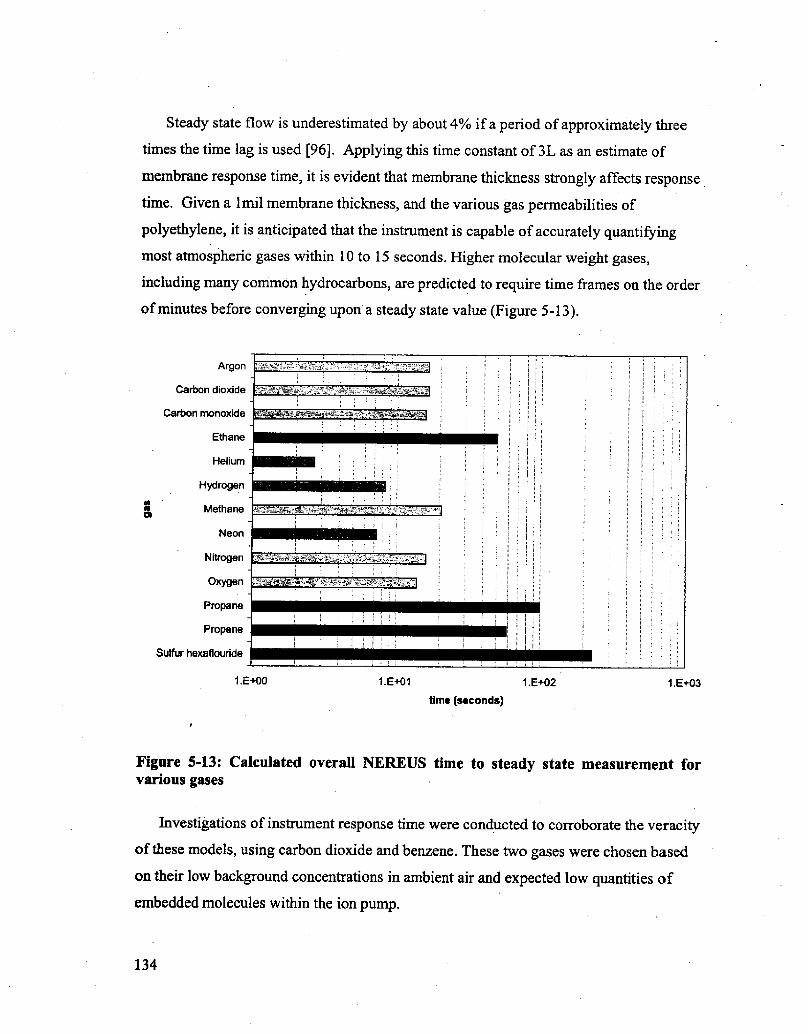
Steady state flow is underestimated by about 4% if a period of approximately three
times the time lag is used [96], Applying this time constant of 3L as an estimate of
membrane response time, it is evident that membrane thickness strongly affects response
time. Given a 1mil membrane thickness, and the various gas permeabilities of
polyethylene, it is anticipated that the instrument is capable of accurately quantifying
most atmospheric gases within 10 to 15 seconds. Higher molecular weight gases,
including many common hydrocarbons, are predicted to require time frames on the order
of minutes before converging upon a steady state value Figure 5-13!.
Argon
Carbon dioxide
Carbon monoxide
Ethane
Helium
Hydrogen
Methane
Neon
Nitrogen
Oxygen
Propane
Propane
Sulfur hexaflouride
1.E+031.E+021.E+011.E+00
time seconds!
Figure 5-13: Calculated overall NEREUS time to steady state measurement forvarious gases
Investigations of instrument response time were conducted to corroborate the veracity
of these models, using carbon dioxide and benzene. These two gases were chosen based
on their low background concentrations in ambient air and expected low quantities of
embedded molecules within the ion pump.
134
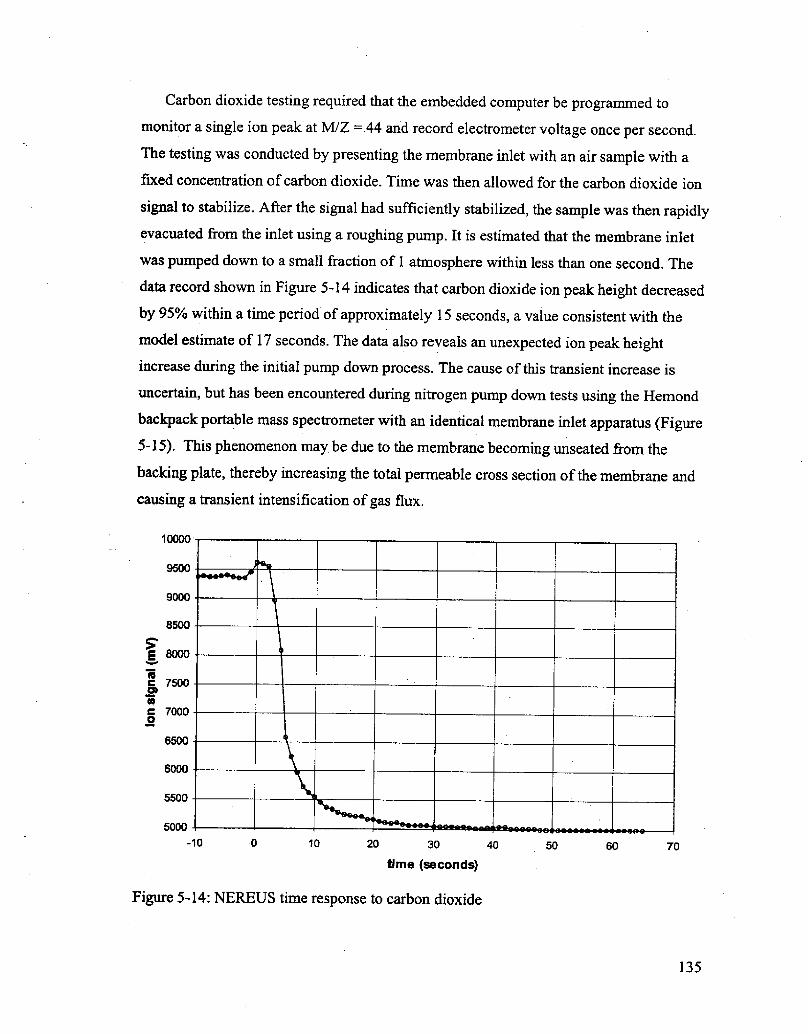
Carbon dioxide testing required that the embedded computer be programmed to
monitor a single ion peak at M/Z = 44 and record electrorneter voltage once per second.The testing was conducted by presenting the membrane inlet with an air sample with afixed concentration of carbon dioxide. Time was then allowed for the carbon dioxide ion
signal to stabilize. After the signal had sufficiently stabilized, the sample was then rapidlyevacuated from the inlet using a roughing pump. It is estimated that the membrane inlet
was pumped down to a small fraction of 1 atmosphere within less than one second. The
data record shown in Figure 5-14 indicates that carbon dioxide ion peak height decreasedby 95% within a time period of approximately 15 seconds, a value consistent with the
model estimate of 17 seconds. The data also reveals an unexpected ion peak heightincrease during the initial pump down process, The cause of this transient increase is
uncertain, but has been encountered during nitrogen pump down tests using the Hemond
backpack portable mass spectrometer with an identical membrane inlet apparatus Figure5-15!, This phenomenon may be due to the membrane becoming unseated Rom the
backing plate, thereby increasing the total permeable cross section of the membrane and
causing a transient intensification of gas flux.
9500
9000
8500
g eoOO
7500
c 7000
0 55005000 -10
70605010 20 30 40
t/me secands!
Figure 5-14: NEREUS time response to carbon dioxide
135

400
350
300
~ 250
E r 200r-' 150
100 0 10 20 30 40 50 60 70 ' 80 90 100 110time seconds!
Figure 5-15: Time response of Hemond backpack portable mass spectrometer tonitrogen gas
Although a specific model has not been developed for NEREUS time response to
benzene, tests were conducted to assess the overall instrument behavior when monitoring
higher molecular weight hydrocarbons. Investigations were carried out by exposing theinlet to a near-instantaneous pulse of toluene rich air and then, monitoring the subsequentdecrease in the M/Z = 78 ion signal. The resulting curve show in Figure S-16 indicates
that the instrument's overall time response to benzene, assuming a 95% reduction to
baseline standard, is on the order of 3 minutes. This value is somewhat faster than model
estimates of the lower molecular weight hydrocarbons such as propane, propene and
ethane. It remains unclear if this comparatively short response time of the NEREUS
instrument to benzene is generally shared with other hydrocarbons, or if it is due to a
preferential membrane permeability of aromatic hydrocarbons over aliphatic
hydrocarbons.
136

6900
5'E 7900YlC CO
e 0 6900
5900 0:00 0:05 0:10 0:15 0:20 0:25 0:30 0;35 0:40 0:45 0:50 0:55 1:00 'i;05 1:10Time h:mm!
Figure 5-16: NEREUS time response to benzene
5.8 Submerged testing
NEREUS underwent submerged trial operation in a laboratory flume prior todeployment. This trial verified that the glass pressure sphere housing could be properlysealed so that its interior remained dry, that the instrument was approximately neutrallybuoyant and maintained a more or less upright position when submerged. Rollover testsalso confirmed that the instrument could withstand rapid overturning without damage,Scanning operations were carried out during these tests without any noticeable problems,
137

138
Chapter 6
DEPLOYMENT AND SEA TRIALS
Following bench testing of the NEREUS instrument has underwent a number of
deployments as a buoyed sensor, towed sensor, and aboard an AUV. Beginning in August2002, the NEREUS instrument was deployed as a tethered buoy sensor in Halls Brook
and Boston Harbor. The instrument was then deployed in the Upper Mystic Lake as a
towed body, followed by an AUV deployment in Boston Harbor during December of2002.
6.1 Tethered deployments
Tethered deployments connnenced on August 20, 2002 at the Halls Brook Holding
Area HBHA!, a small body of contaminated water located approximately 30 km north ofBoston, Massachusetts. This water body, also known as Lake Mishawum, contains highconcentrations several types of volatile organic carbons VOCs! including: benzene,
diphenyl sulfone, ortho-hydroxybiphenyl, higher hydroxybiphenyls, and alkylatedbenzenes and are thought to originate from contaminated groundwater inflow to the
hypolimnion [97], In-situ monitoring of VOCs is desirable because substances such as
benzene are known to rapidly undergo biodegradation when mixed with the metalimnetic
and epilimninetic waters [98].
A vertical profile consisting of six spectra from 12 to 48 AMU was completed duringthis trial deployment. Each of these scans utilized 500X signal averaging. The
deployment was executed by lowering the instrument with a Hydrolab sonde and anattached depressor weight from a rope through the water column to depths of: 0.5, 1, 1,5,2, 2.5 and 2.7 meters. NEREUS ion peaks were displayed in real time via the radio
transceivers and a shore-based laptop computer. Data from the Hydrolab sonde was
stored and viewed via a cable connection to its Surveyor 4 logger at the surface.
139

Figure 6-1: Tethered NEREUS configuration with Hydrolab
Data collected during from this deployment reveal the presence of carbon dioxide and
methane in the surface water, and concentration increasing with depth, while oxygen
concentrations exhibited an inverse trend, decreasing as a function of increased depth.
Baseline clipping caused by high C ion fragment peaks at M/Z=12 precludes direct
measurement of the ion peak height above baseline the embedded code normalized the
baseline to M/Z=12 values during this deployment!. Some ion peak tops such as methane,
oxygen and argon at M/Z= 1S, 32 and 40 respectively! were completely concealed by
the elevated baseline, while carbon dioxide and nitrogen ion peaks at M/Z=44 and 28,
140
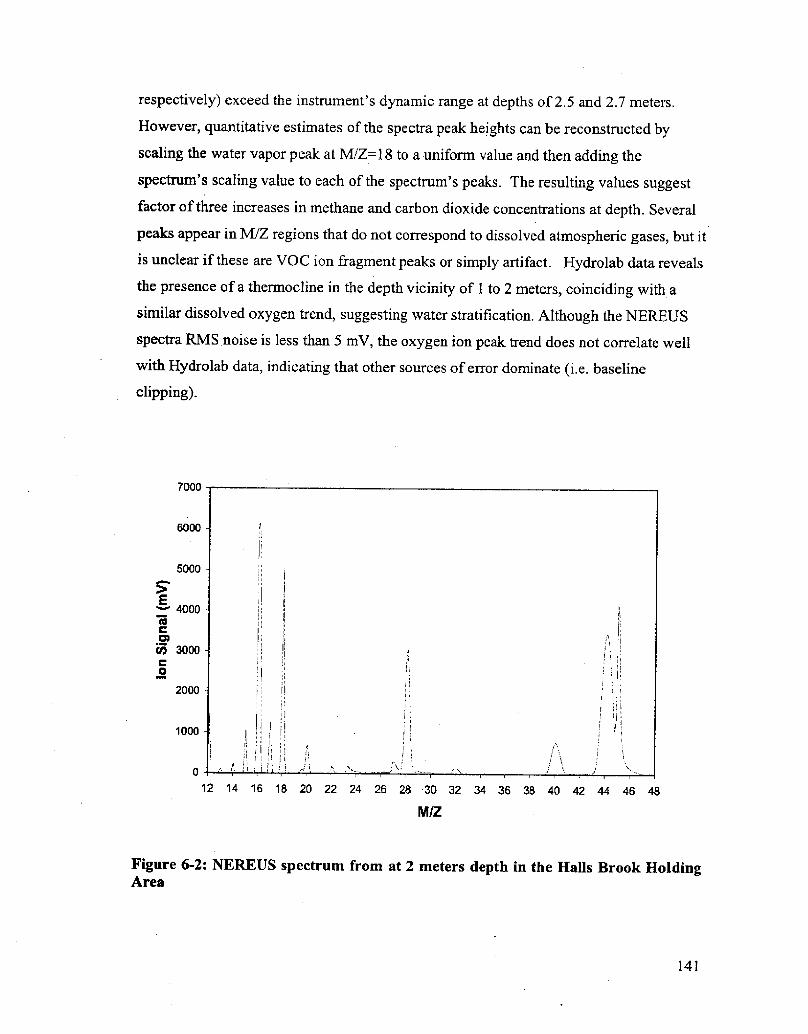
respectively! exceed the instrument's dynamic range at depths of 2.S and 2.7 meters.
However, quantitative estimates of the spectra peak heights can be reconstructed by
scaling the water vapor peak at M/Z=18 to a uniform value and then adding the
spectrum's scaling value to each of the spectrum's peaks. The resulting values suggest
factor of three increases in methane and carbon dioxide concentrations at depth. Several
peaks appear in M/Z regions that do not correspond to dissolved atmospheric gases, but it
is unclear if these are VOC ion fragment peaks or simply artifact. Hydrolab data revealsthe presence of a thermocline in the depth vicinity of 1 to 2 meters, coinciding with a
similar dissolved oxygen trend, suggesting water stratification, Although the NEREUS
spectra RMS noise is less than S mV, the oxygen ion peak trend does not correlate well
with Hydrolab data, indicating that other sources of error dominate i.e. baseline
clipping!.
7000
6000
5000
~ 4000E
CO 3000
0 2000
1000
0
12 14 16 18 20 22 24 26 28 30 32 34 36 38 40 42 44 46 48
Figure 6-2: NEREUS spectrum from at 2 meters depth in the Halls Brook HoldingArea
141

0.5
~ 1.5
K
CI 2
2,5
800070005000 60001000 2000 3000 4000
ion signai IV!
Figure 6-3: NEREUS depth profile of ion peaks in the Halls Brook Holding Area
0.5
E
C15K OCl 2.5 3 0
3025201510
Figure 6-4: Hydrolab depth profile of dissolved oxygen, salinity and temperature inthe Hails Brook Holding Area
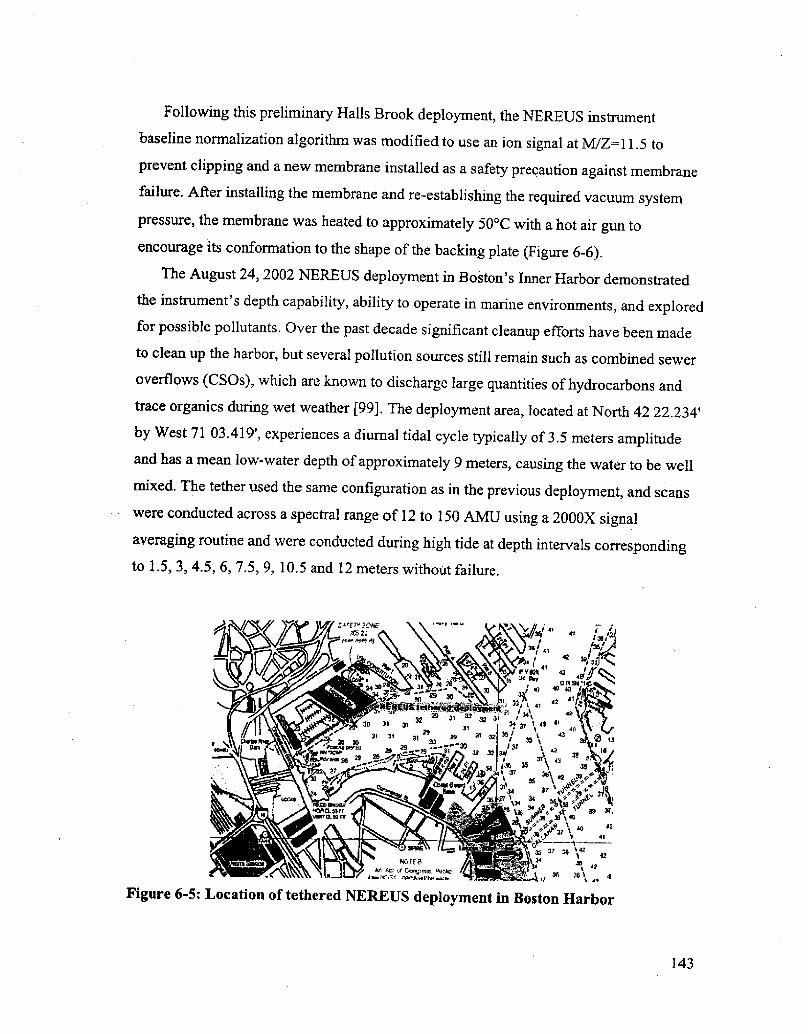
Following this preliminary Halls Brook deployment, the NEREUS instrument
baseline normalization algorithm was modified to use an ion signal at M/Z=11.5 toprevent clipping and a new membrane installed as a safety precaution against membranefailure, After installing the membrane and re-establishing the required vacuum systempressure, the membrane was heated to approximately 50'C with a hot air gun toencourage its conformation to the shape of the backing plate Figure 6-6!.
The August 24, 2002 NEREUS deployment in Boston's Inner Harbor demonstratedthe instrument's depth capability, ability to operate in marine environments, and exploredfor possible pollutants. Over the past decade significant cleanup efforts have been madeto clean up the harbor, but several pollution sources still remain such as combined sewer
overflows CSOs!, which are known to discharge 1arge quantities of hydrocarbons andtrace organics during wet weather I 99], The deployment area, located at North 42 22.234'
by %est 71 03,419', experiences a diurnal tidal cycle typically of 3.5 meters amplitudeand has a mean low-water depth of approximately 9 meters, causing the water to be wellmixed. The tether used the same configuratiori as in the previous deployment, and scanswere conducted across a spectral range of 12 to 150 AMU using a 2000X signalaveraging routine and were conducted during high tide at depth intervals correspondingto 1,5, 3, 4.5, 6, 7.5, 9, 10.5 and 12 meters without failure. ««}
}}Ran4}} }}} }«f.
}} lP
3b}$7 } P+ h
P 3} 92 }Jd ~ 2
36 3I} }«
Figure 6-5: Location of tethered NEREUS deployment in Boston Harbor
143

Figure 6-6: Microscopic comparison of a new membrane left!, and after heatforming and deployment to 12 meters depth right!
The eight spectra generated during this deployment possess similar ion peak
signatures and amplitudes, which is suggestive of a well-mixed body of water. All
contain noise of approximately 2.5 mV RMS, and have peak amplitudes that are
attenuated by around 'l~, compared with laboratory generated data. Factors contributing to
attenuation may include diminished permeable cross section due to increased membrane
adherence to the backing plate!, and to a lesser extent, decreased gas solubility inseawater, as well as decreased membrane permeability because of lower water
temperature. Typically stable ion peaks such as water vapor, nitrogen, and argon exhibit
trends of decreasing amplitude with increasing depth, with an ensemble average variation
of 30/o, Models of membrane permeability as a function of temperature suggest that the
observed water temperature variation of 2.3 'C should affect an 18 ' variation in these
ion peaks. The remaining variation is thought to be due to pressure effects on the
membrane, particularly through increased pressure causing the membrane to sag andcome into greater contact with the conically shaped holes of the backing plate, therebydecreasing the rnernbrane's total permeable surface area. Permeation may also be effected
by molecular-scale decreases in polymer permeability as a result of pressure increases
I 100], but it is unlikely that these molecular effects come to dominate until much greaterdepth.
144
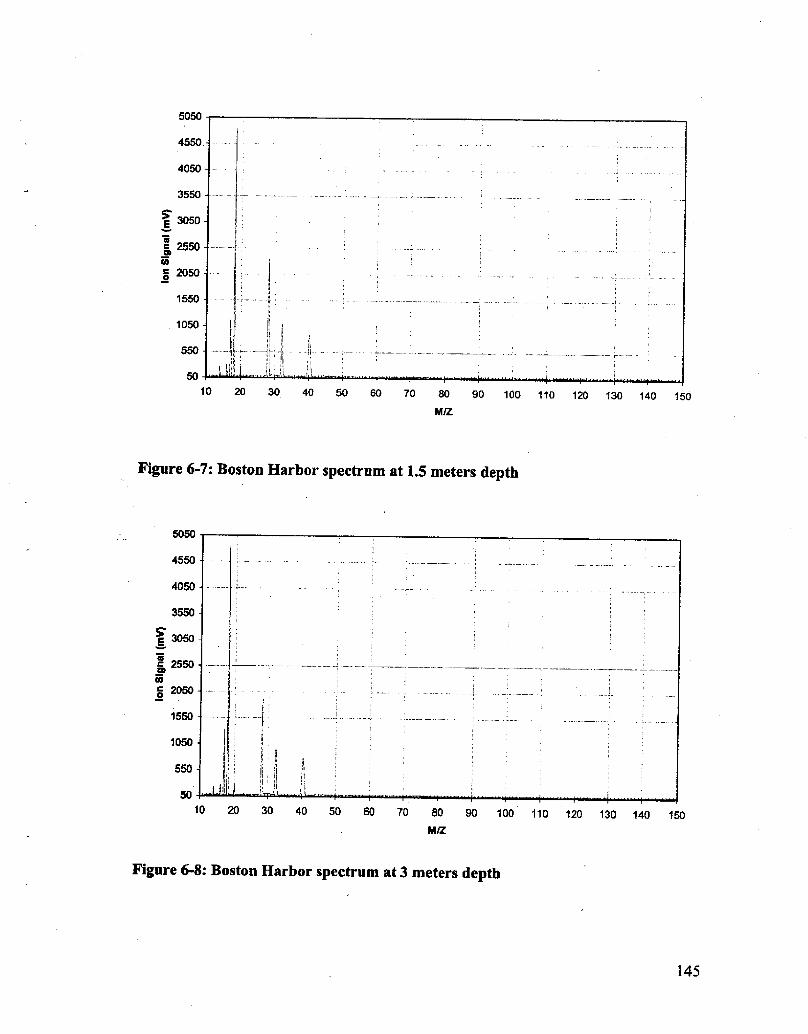
5050
4550
3550
3050
c 2550
CO 2050
1050
10 20 30 40 50 60 70 80 90 100 110 120 130 140 150
Figure 6-7: Boston Harbor spectrum at 1.5 meters depth
4550
4050
g 3050
e 2550
N g 20501550
1050
50 10 20 30 40 50 60 70 80 90 100 110 120 130 140 150MIZ
Figure 6-8: Boston Harbor spectrum at 3 meters depth
145

4550
4050
3050
2550
g 2050
1550
1050
50 10 20 30 40 50 60 70 80 90 100 110 120 130 140 150M/Z
Figure 6-9: Boston Harbor spectrum at 4.5 meters depth
4050
3550
6 3050
c 2550PJS 2050
1050
50 1020 30 40 50 60 70 80 90 100 110 120 130 140 150
Figure 6-10: Boston Harbor spectrum at 6 meters depth
146

4550
4050
~p 3050a 2550COS 2050
1550
5010 20 30 40 50 60 70 80 90 100 110 120 130 140 150
Figure 6-11: Boston Harbor spectrum at 7.5 meters depth
3050
c 2550EAI 2050
1550
10 20 30 40 50 60 70 80 90 100 110 120 130 140 150IN%
Figure 6-12: Boston Harbor spectrum at 9 meters depth
147

4550
3550
E 3050
c 2550
i 2050
1550
'1050
10 20 30 40' 50 60 70 80 90 100 110 120 130 f40 150
Figure 6-13: Boston Harbor spectrum at 10.5 meters depth
4550
4050
3550
p 3050
c 2550COm 2050
1550
1050
5010 20 30 40 50 60 70 80 90 100 1 1 0 120 130 140 150
Figure 6-14: Boston Harbor spectrum at 12 meters depth
148

Methane, carbon dioxide and oxygen ion peak data exhibit obvious trends in the 3 to
4.5 meter depth range and then again at 12 meters depth, Given a mean high-water depthof 13 meters and the Harbor's soft mud bottom, the increase in these gases at 12 meters is
apt to be the result of the instrument being near or partially buried within the uppermostportions of anoxic sediments. Simultaneous decrease in oxygen signals recorded at this
depth by both the Hydrolab and NEREUS support an anoxic bottom sediment hypothesis.The causation of the methane and carbon dioxide ion signal increase in the upper depthrange of 3 to 5 meters is less clear because they do not coincide with proportionaldecreases in oxygen or any observable deviation in salinity or temperature. A plausibleexplanation may be that this region of the water column contains effluent from nearby
ship bilges and holding tanks or drainage culverts lining the Hoosac seawall these
drainage culverts lie at approximately 3 meters depth during high tide!, but more
investigation is needed to clarify the origin of this chemical feature,
1.5
4.5
X 66
7.5
10.5
12 1.010000.010.0 100.0 1000.0
Figure 6-15: 9epth profile of Boston Harbor .
149

1200.0
1100.0
~1000.0
c ~gooo
800.0
II 700.0
600.0
z 500.0
400.0 5.0 5.2 5,4 5.6 5.8 6.0 6.2 6.4 6.6 6.8 7,0HydroLab dissolved oxygen mg/l!
Figure 6-16: Oxygen signal correlation of NEREUS and Hydrolab data from BostonHarbor
NEREUS oxygen ion peak data at M/Z=32 exhibit a high degree of correlation with
Hydrolab dissolved oxygen data, matching all trend slopes and yielding a statistical R
value of 0.93. The minimum NEREUS detection limit for oxygen is estimated to be
approximately 4.62 mg/1, by applying a linear least squares line fit to this data and
assuming a characteristic noise of 2.5 mV and a signal-to noise ratio of 3, This detection
limit is roughly an order of magnitude higher than bench top estimates. However, given
the overall peak height attenuation to approximately 1/5 of full scale, the instrument
detection limits can be decreased to less than 1 mg/1 by simply increasing electrometer
gain or permitting more analyte influx i,e. allowing greater permeable membrane surface
area!.
6.2 Towed deployment
After successfully completing buoyed deployment, the NEREUS instrument
underwent towed deployment in the Upper Mystic Lake on December 13 and 15, 2002.
The objectives of these deployments were to ascertain instrument performance when used
150
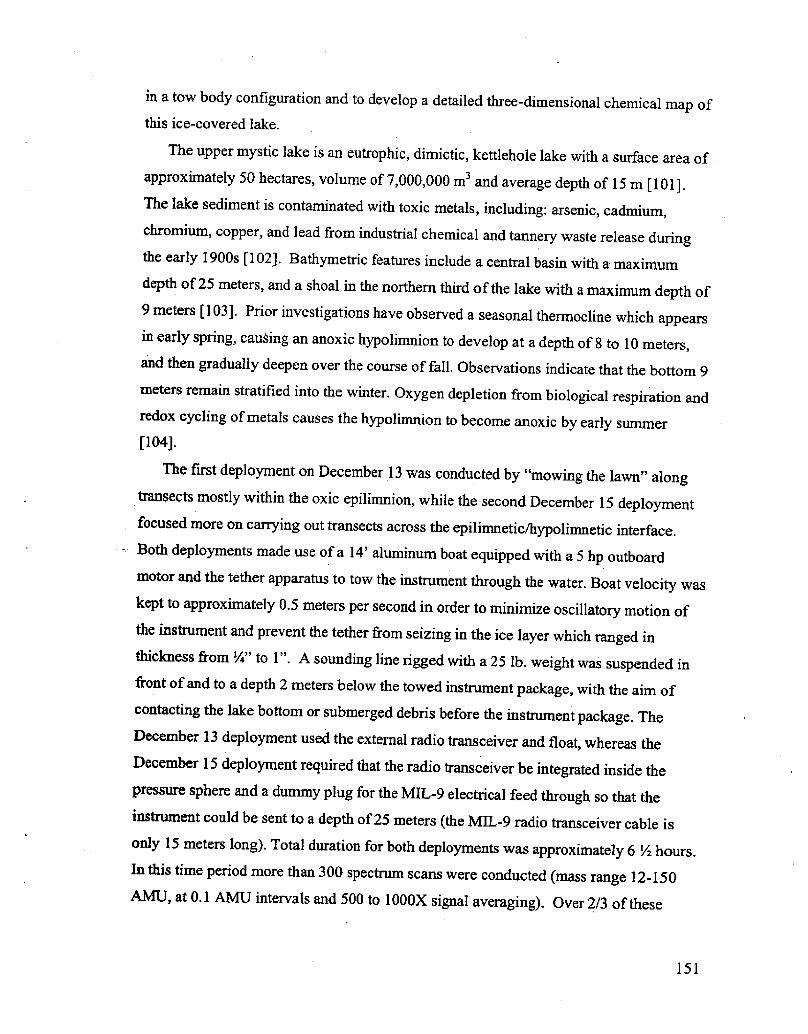
in a tow body configuration and to develop a detailed three-dimensional chemical map ofthis ice-covered lake.
The upper mystic lake is an eutrophic, dimictic, kettlehole lake with a surface area ofapproximately 50 hectares, volume of 7,000,000 in and average depth of 15 m [101].The lake sediment is contaminated with toxic metals, including: arsenic, cadmium,chromium, copper, and lead from industrial chemical and tannery waste release duringthe early 1900s [102]. Bathymetric features include a central basin with a maximumdepth of 25 meters, and a shoal in the northern third of the lake with a maximum depth of9 meters [103]. Prior investigations have observed a seasonal thermocline which appearsin early spring, causing an anoxic hypolirnnion to develop at a depth of 8 to 10 meters,and then gradually deepen over the course of fall. Observations indicate that the bottom 9meters remain stratified into the winter. Oxygen depletion from biological respiration andredox cycling of metals causes the hypolimnion to become anoxic by early summer[104].
The first deployment on December 13 was conducted by "mowing the lawn" alongtransects mostly within the oxic epilimnion, while the second December 15 deploymentfocused more on carrying out transects across the epilimnetic/hypolimnetic interface.Both deployments made use of a 14' aluminum boat equipped with a 5 hp outboardmotor and the tether apparatus to tow the instrument through the water. Boat velocity waskept to approximately 0.5 meters per second in order to minimize oscillatory motion ofthe instrument and prevent the tether &om seizing in the ice layer which ranged inthickness 6.om '/4" to 1", A sounding line rigged with a 25 lb, weight was suspended in&ont of and to a depth 2 meters below the towed instrument package, with the aim ofcontacting the lake bottom or submerged debris before the instrument package. TheDecember 13 deployment used the external radio transceiver and f1oat, whereas theDecember 15 deployment required that the radio transceiver be inte~ted inside thepressure sphere and a dummy plug for the MIL-9 electrical feed through so that theinstrument could be sent to a depth of 25 meters the MIL-9 radio transceiver cable isonly 15 meters long!, Total duration for both deployments was approximately 6 'l~ hours.In this time period more than 300 spectrum scans were conducted mass range 12-150AMU, at 0.1 AMU intervals and 500 to 1000X signal averaging!. Over 2/3 of these
151
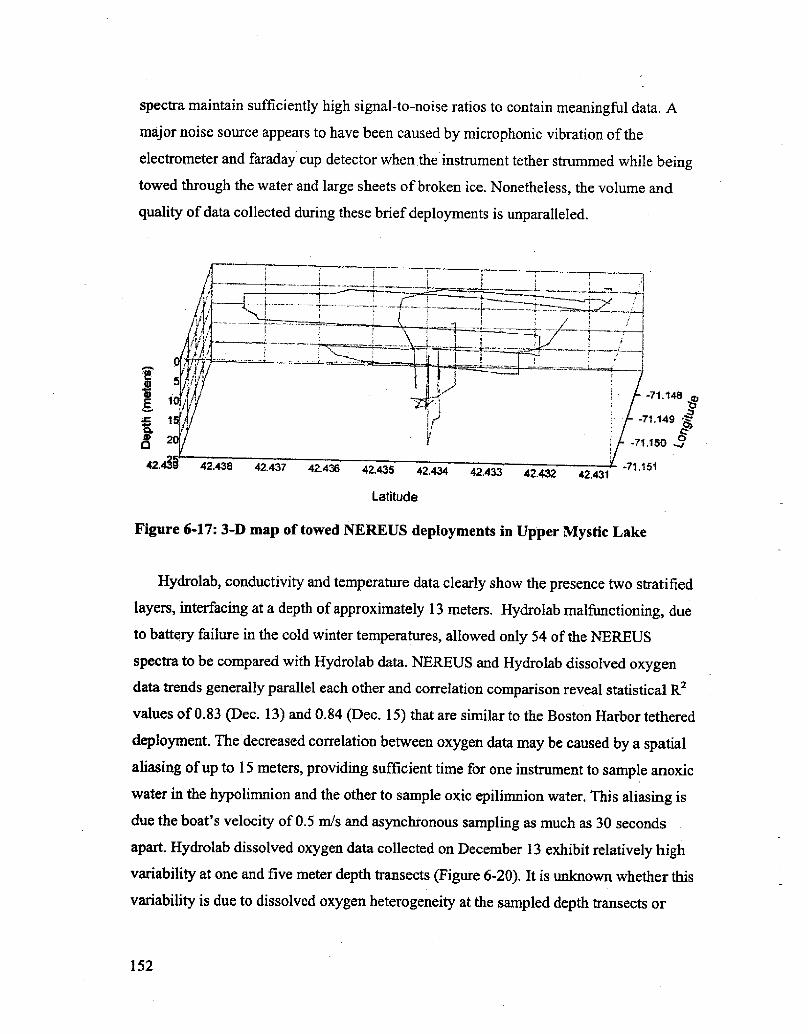
spectra maintain sufficiently high signal-to-noise ratios to contain meaningful data. A
major noise source appears to have been caused by microphonic vibration of the
electrometer and faraday cup detector when the instrument tether strummed while beingtowed through the water and large sheets of broken ice, Nonetheless, the volume and
quality of data collected during these brief deployments is unparalleled.
-71. 148
73.149
,$59 ~
71,15142.432 42,431
42.
LatitUde
Figure 6-17: 3-D map of towed NEREUS deployments in Upper Mystic Lake
152
Hydrolab, conductivity and temperature data clearly show the presence two stratified
layers, interfacing at a depth of approxiinately 13 meters. Hydrolab malfunctionin, dueto battery failure in the cold winter temperatures, allowed only 54 of the NEREUS
spectra to be compared with Hydrolab data. NEREUS and Hydrolab dissolved oxygen2data trends generally parallel each other and correlation comparison reveal statistical R
values of 0.83 Dec. 13! and 0.84 Dec. 15! that are similar to the Boston Harbor tethered
deployment. The decreased correlation between oxygen data may be caused by a spatialaliasing of up to 15 meters, providing sufficient time for one instrument to sample anoxicwater in the hypolimnion and the other to sample oxic epilimnion water. This aliasing isdue the boat's velocity of 0.5 m/s and asynchronous sampling as much as 30 seconds
apart. Hydrolab dissolved oxygen data collected on December 13 exhibit relatively high
variability at one and five meter depth transects Figure 6-20!. It is unknown whether this
variability is due to dissolved oxygen heterogeneity at the sampled depth transects or
Hydrolab sensor drift. However, it is worthwhile noting that Hydrolab dissolved oxygenvariability within the epilimnion is less pronounced within the December 15 data Figure6-21!. Regression based extrapolation of December 13 data indicates that the NEREUS
minimum detection limit for oxygen is in the range of 3 mg/1; while December 15 datasuggests a detection limit of 0 mg/1 when ion sign@ is below 75 mV,
Carbon dioxide peaks are clearly identified throughout the entire water column, andincrease significantly as a function of depth below the thermocline Figure 6-20, Figure6-21!. Although a methane signal at M/Z=15 is absent in the epilimnion, peaks begin toemerge at the thermocline and demonstrate an increasing trend with depth, similar to thatof carbon dioxide, In contrast, NEREUS determinations of oxygen concentration remainrelatively stable within the epilimnion, and decrease substantially within the
hypolimnion. These chemical features are consistent with biologically induced anoxiaand methanogenesis within the hypolimnion.
300
5'E
200
o 0cv 150
5 100I Il/
X 101412
Hydrolab dissoNed oxygen nag/I!
Fignre 6-18: Oxygen signal correlation of NKRKUS and Hydrolab data from UpperMystic Lake, Dec. 13
153
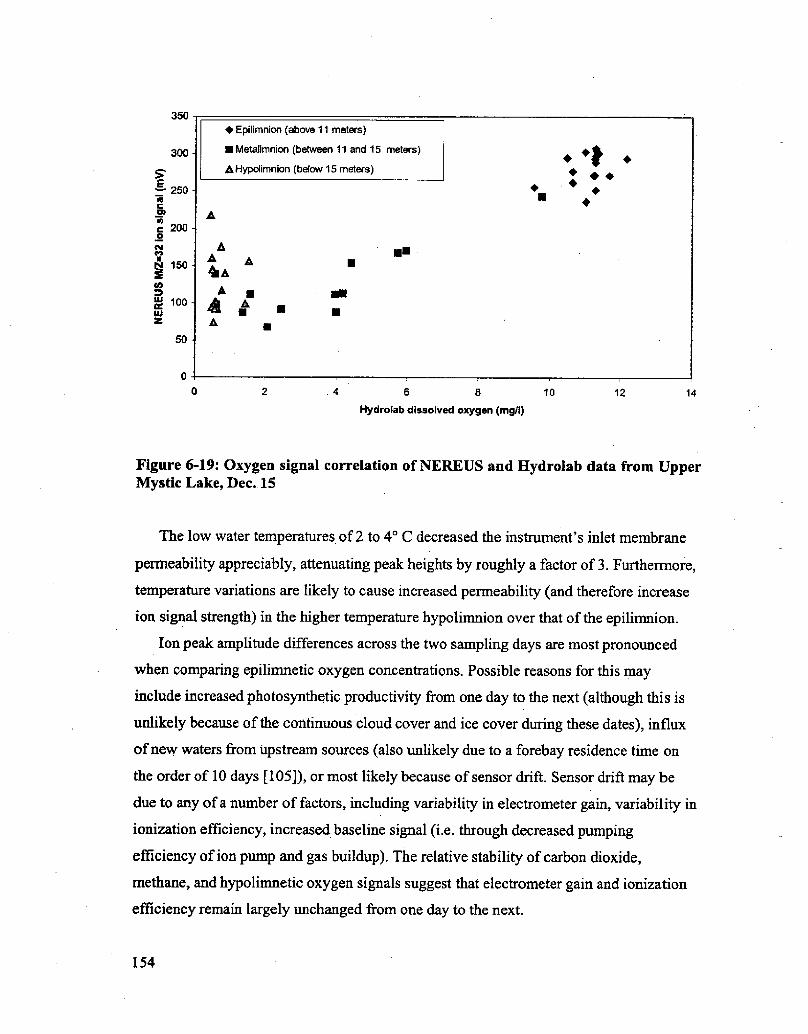
350
300
5'
~ 250C
c 2000cv
g 150
g 100l% ? 1214
Hydrolsb dissolved oxygen rngll!
Figure 6-19: Oxygen signal correlation of NEREUS and Hydrolab data from UpperMystic Lake, Dec. 15
The low water temperatures of 2 to 4' C decreased the instrument's inlet membrane
permeability appreciably, attenuating peak heights by roughly a factor of 3. Furthermore,
temperature variations are likely to cause increased permeability and therefore increase
ion signal strength! in the higher temperature hypolimnion over that of the epilimnion.
Ion peak amplitude differences across the two sampling days are most pronounced
when comparing epilimnetic oxygen concentrations. Possible reasons for this may
include increased photosynthetic productivity from one day to the next although this is
unlikely because of the continuous cloud cover and ice cover during these dates!, influx
of new waters from upstream sources also unlikely due to a forebay residence time on
the order of 10 days [105]!, or most likely because of sensor drift. Sensor drift may be
due to any of a number of factors, including variability in electrometer gain, variability in
ionization efficiency, increased baseline signal i.e. through decreased pumping
efficiency of ion pump and gas buildup!, The relative stability of carbon dioxide,
methane, and hypolimnetic oxygen signals suggest that electrometer gain and ionization
efficiency remain largely unchanged from one day to the next,
154

CLII
CO+Is
c
I
4I
CL
CII5IO
O
CL
E O f56 OI
IO
XIO
Nl
R ILlK
Figure 6-20I Chemical profile of Upper Mystic Lake, December 13, 2002
1/5

Figure 6-21: Chemical profile of Upper Mystic Lake, December 15, 2002
156

6.3 AUV deployment
On December 19 2002 the Kemonaut vehicle and NEREUS payload underwent sea
trials in Boston Harbor demonstrating the cargo carrying capacity, maneuverability, and
overall seaworthiness of the Kemonaut design as well as the abi1ity of the NEREUS
instrument to collect meaningful chemical data while operating onboard a moving AUV
platform. A relatively confined region of Boston's Inner Harbor near to the Charles River
Locks was selected for operations because of'its unobstructed flat bathymetry, relatively
low frequency of boat traffic during the winter months compared to other regions of the
harbor!, and absence of underground tunnels or electrical cables thereby avoiding
potential electromagnetic interference to the vehicle navigation system,
Figure 6-22: The Kemonaut AUV prior to deployment in Boston Harbor
157

Operations began with the deployment of four GIB buoys with attached hydrophones
around the perimeter of the test area, These buoys were positioned in more or less a
rectangular pattern to maximize the triangulation distance while minimizing propagation
path obstructions and interference with shipping traffic, Buoy rodes were anchored in
place using a 5 kg weight attached to 2 meters of 3/8" steel chain to prevent drift in the
channel's +1 kt current and 3.5 meter tidal cycle.
Boston Harbor's Pier 4 served as the operations base station for radio communication
with Kemonaut and crew aboard a skiff that served as an intercept boat. Operations base
station was setup in the cargo bed of a Ryder truck, parked at the end of the pier to
provide a clear view westward out over the Harbor.
Kemonaut was ballast tested for marine deployment from a two-ton electric hoist
once GIB transponders were in position and functioning. Based on results from earlier
&eshwater ballasting, an additional 3.8 kg of weight had been fitted to the vehicle while
undergoing assembly in the lab, This additional weight was distributed in two equally
weighted 1.8 kg bags of lead shot, The first bag was zip-tie wrapped to the internal 10 lb
dive weight in the nose of the vehicle, and the second weight was wired tightly to the
external aft surface of the vehicle, directly below the two 10 lb dive weights, using 4
corrosive links. These corrosive links cause the ballast weight to be jettisoned after a
period of 12 hours, thereby improving the prospects of successful recovery in the event of
a vehicle system failure. Although theoretically buoyant for seawater, the vehicle proved
to be correctly ballasted without any additional weight. Salinity tests confirmed the
harbor water to be slightly brackish at 26-28 parts per thousand, thus helping to account
for the density disparity. A small -300 cc piece of floatation foam was added inside the
bow of the vehicle to achieve neutral trim.
Kemonaut and NEREUS clock synchronization and systems checks were performed
subsequent to ballasting. After satisfying all checks, the AUV was released from its lift
hoist and towed into position using a 16 ft skiff equipped with a 35 hp outboard engine.
Once in position, mission commands were relayed to Kemonaut from the base station
using the spread spectrum radio modem and operations commenced once the vehicle was
in position.
158

II 41
4241
OftIV
I '2M/
39 3~g~
40 R5M
40 40
4140
43
4238
37'
364 42
A,~i 39 i 37 36 ~<~ �8
36 38
l~ qP 37 4038 41c>
3/34
'l 4242
38 4236 i
4236
37
Two initial sin face missions were conducted to verify proper vehicle tracking withthe GIB hydrophone array, while maintaining visual contact. Following the two surfaceruns, Kemonaut performed a total of 6 submerged missions, ranging in duration from 2 to
6 minutes and reaching a maximum depth of 6.3 meters. Each dive mission was
conducted as level, straight line, run for a specified time duration with the aim of
reducing mission complexity and keeping altitude and heading reference systein AHRS!error from critically affecting the navigation system. The navigation systein was set toabort its mission if the vehicle's sonar altimeter sensed a distance of less than 3 ineters
from the bottom to prevent the vehicle from colliding with the harbor bottom, The
intercept boat tracked the submerged AUV using GIB hydrophone position fixes of thevehicle relayed verbally over VHF radio from the base station. After each dive the
intercept boat was sent to visually inspect Kemonaut for obvious signs of damage and toprevent other nearby vessels from colliding with the somewhat concealed AUV. In
159
Figure 6-23:nautical Chart of Boston Harbor showing GIB placement and overallarea of operation
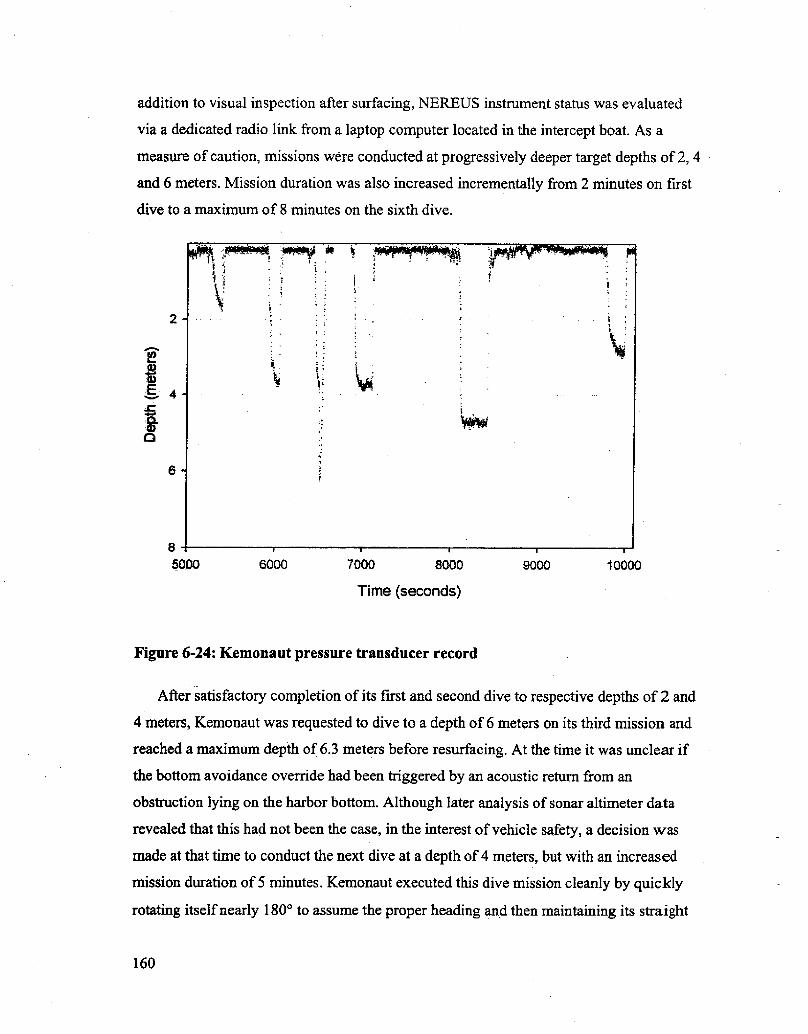
addition to visual inspection after surfacing, NEREUS instrument status was evaluated
via a dedicated radio link from a laptop computer located in the intercept boat. As a
measure of caution, missions were conducted at progressively deeper target depths of 2, 4
and 6 meters. Mission duration was also increased incrementaHy from 2 minutes on first
dive to a maximum of 8 minutes on the sixth dive.
4
K 4l
Ci 6000Time seconds!
Figure 6-24: Kemonaut pressure transducer record
After satisfactory completion of its first and second dive to respective depths of 2 and
4 meters, Kemonaut was requested to dive to a depth of 6 meters on its third mission and
reached a maximum depth of 6.3 meters before resurfacing. At the time it was unclear if
the bottom avoidance override had been triggered by an acoustic return &om an
obstruction lying on the harbor bottom. Although later analysis of sonar altimeter data
revealed that this had not been the case, in the interest of vehicle safety, a decision was
made at that time to conduct the next dive at a depth of 4 meters, but with an increased
mission duration of 5 minutes, Kemonaut executed this dive mission cleanly by quickly
rotating itself nearly 180' to assume the proper heading and then maintaining its straight
160
course for the remainder of the mission, logging some 400 meters in distance. The fifthdive mission was setup to better ascertain the repeatability of the vehicle's navigation andcontrol system by retracing this fourth dive, Consequently, Kemonaut was towed back tothe vicinity of its previous starting position and instructed to dive to a depth of 5 metersfor a duration of six minutes using the same heading as dive 4. Again, Kemonautperformed capably, following to within 1 meter of its previous track line for a distance ofover 200 meters. The sixth and final dive mission was intended to further test the AUV'sability to maintain a straight and level track line and to allow the NEREUS instrumentadequate time to collect multiple chemical spectra while at depth. Mission duration wasspecified for 8 minutes and a shallow depth of 3 meters was chosen in order to minimizethe chances of bottom collision. The desired heading was increased in a similar attempt toprevent the AUV from being run aground on the ruins near the harbor channel's southernsea wall and Coast Guard piers. Despite these efforts, Kemonaut was forced to abort thedive mission approximately 4 minutes into the run because the human operator assignedheading had inadvertently directed the vehicle to swim in a northwesterly track, passingunderneath the USS Cassin Young and a barge before swimming into a shallow dry dockarea, causing the bottom avoidance override procedure to trigger, thus forcing the vehicleto surface.
Based on recorded MOOS pressure sensor data, Kemonaut has demonstrated a dive
rate capability of up to 0.18m/s, and is able to maintain a prescribed depth to within +0.3meters Figure 7!. Despite uncertainties caused by variability in near-surface acousticsignal propagation, GIB hydrophone tracking revealed that Kemonaut was able tomaintain a high degree of lateral accuracy Figure 6-25, Figure 6-26!. The extent ofKemonaut's dynamic control is evident when comparing the GIB track logs from divemissions four and five, particularly in light of the fact that these dives were performedwhile in the presence of a current with a flow rate exceeding 1.5 kts.
161
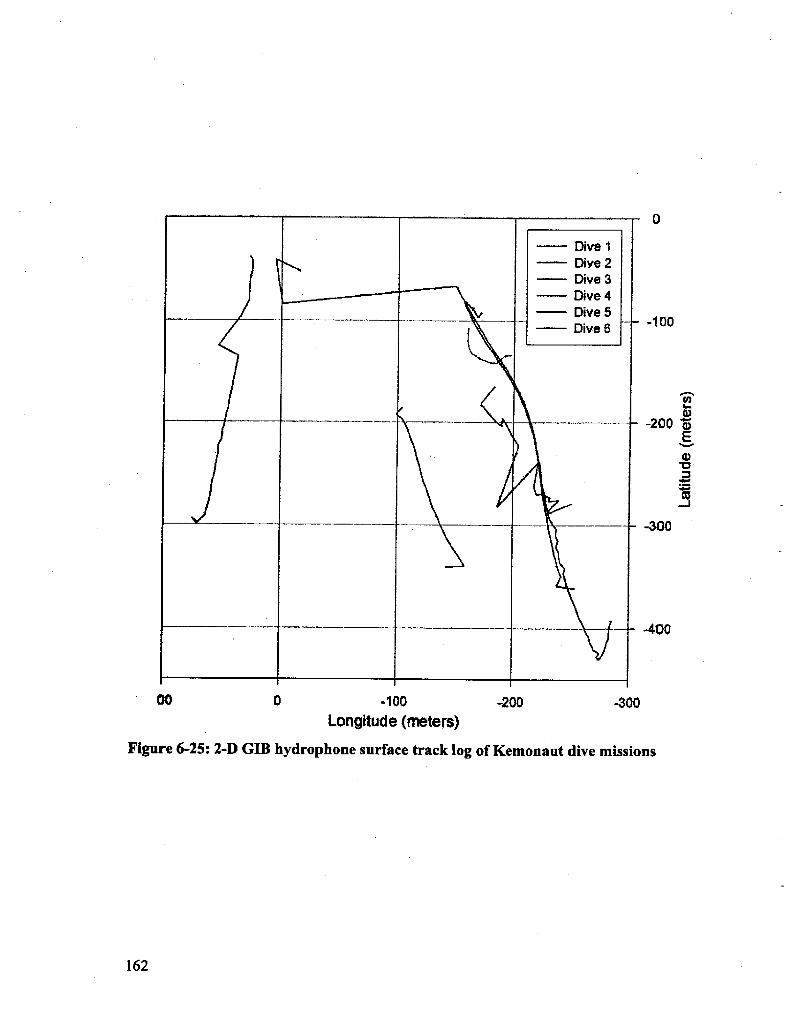
-300
-400
-100
Longitude rreters}-200
l62
Figure 6-25: 2-D GIB hydrophone surface track log of Kemouaut dive missions
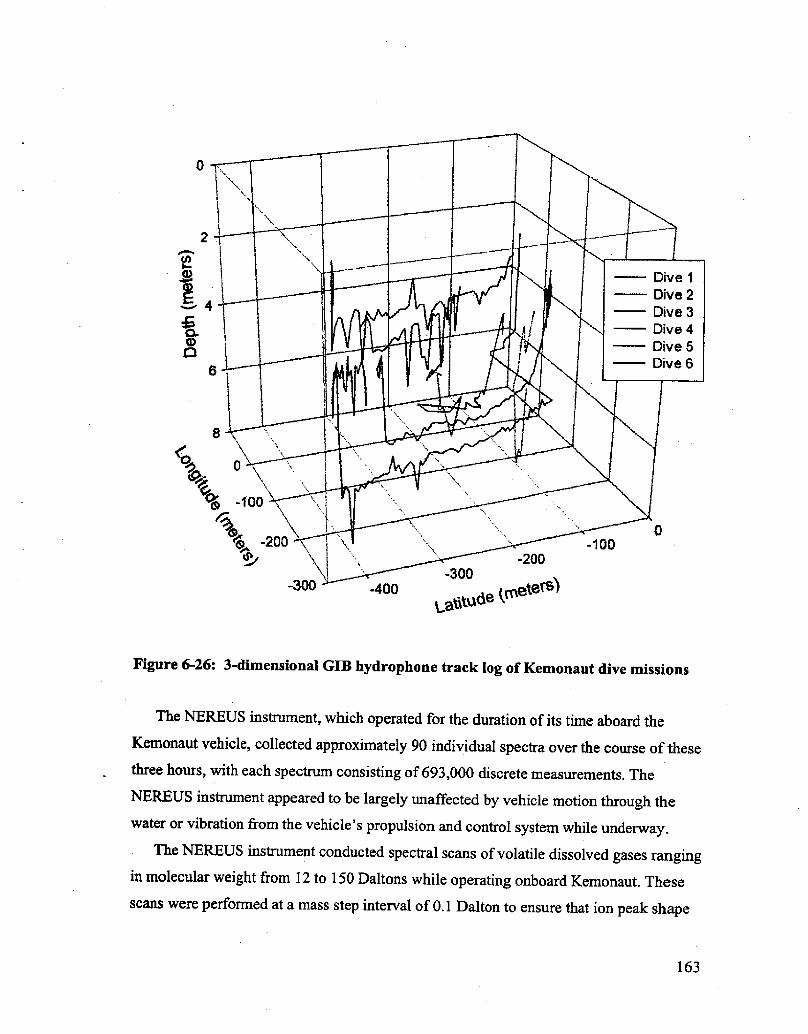
ia<~<zde ~e<
Figure 6-26: 3-dimensional GIB h dry rophone track log of Kem t demonant dive missions
The NEREUS instru'nstrument, which operated for the d
K emonaut vehicle
nstru, ' or e uration of its time aboard th
, collected approximately 90 ' d' 'de
three hours, with each s
in ivi uals ectraov rp e the course of these
s, wi eac spectrum consisting of 693 00"
NEREU
o, 00 discrete measurements. The
US instrument appeared to be lar el una o ion ou tho e arge y unaffected by vehicle motion throu thwater or vibration from the veh 1 ' ' n oe ve ic e's propulsion and control
The NERE s
n o system while underway.US instrument conducted s spectral scans of volatile dissolved ases rati '
in molecular weight from 12 to 150 Da'sso ve gases ratiging
a p ' g onboard Kemonaut. Thesealtons while o eratin o
ans were pe armed atd at a mass step interval of 0,1 Daltoa ton to ensure that ion peak shape
163

could be clearly resolved. Signal averaging was kept to 500 samples per data point iii aneffort to minimize the amount of time required for a complete spectral scan while stillmaintaimng an adequate S/N ratio, Automated radio communications between the
instrument and its remote computer terminal used for monitoring the instrument! werescheduled to occur during the electrometer stabilization period before the instrument took
a measurement to further decrease time requirements. NEREUS was able to complete an
entire scan once every 98 seconds using these techniques. Although spectral scans can beconducted much faster by further limiting the ma.ss-to-charge range, mass step intervaland signal averaging, this mode was chosen so that high molecular weight hydrocarbonscould be clearly identified in the event of being encountered by the AUV.
Post-deployment analysis of NEREUS data revealed the presence of dissolved
atmospheric gases, principally nitrogen, oxygen, and argon Figure 6-27!. Due to the cold
temperatures encountered on this day an air temperature of -5 to -1' C and a water
temperature of 2 to 4' C! the instrument's inlet membrane permeability was significantly
decreased, causing all spectra to exhibit attenuated peak heights, Nevertheless, relative
ratios of these gases remained consistent with previous NEREUS data collected during
buoyed deployment in this area of Boston Harbor. RMS noise was typically about 5 mV,but exhibited sudden dramatic increases, to hundreds of millivolts, appearing to coincidewhen the intercept boat occasionally bumped into the AUV while it was being tawed.
NEREUS spectrum data was processed upon completion of the six dive missions to
quantify ion peaks and then merged with MOOS track log data by way of time stampsynchronization. The resulting data shows a noticeable variability in dissolved gasconcentration near the water's surface Figure 6-28!. This anomaly is likely to be the
result of air bubble entrainment lrom breaking waves generated by the +20kt windblowing that day. Further analysis of the data did not reveal the presence of anyhydrocarbon fractions or xenobiotic molecules.
164
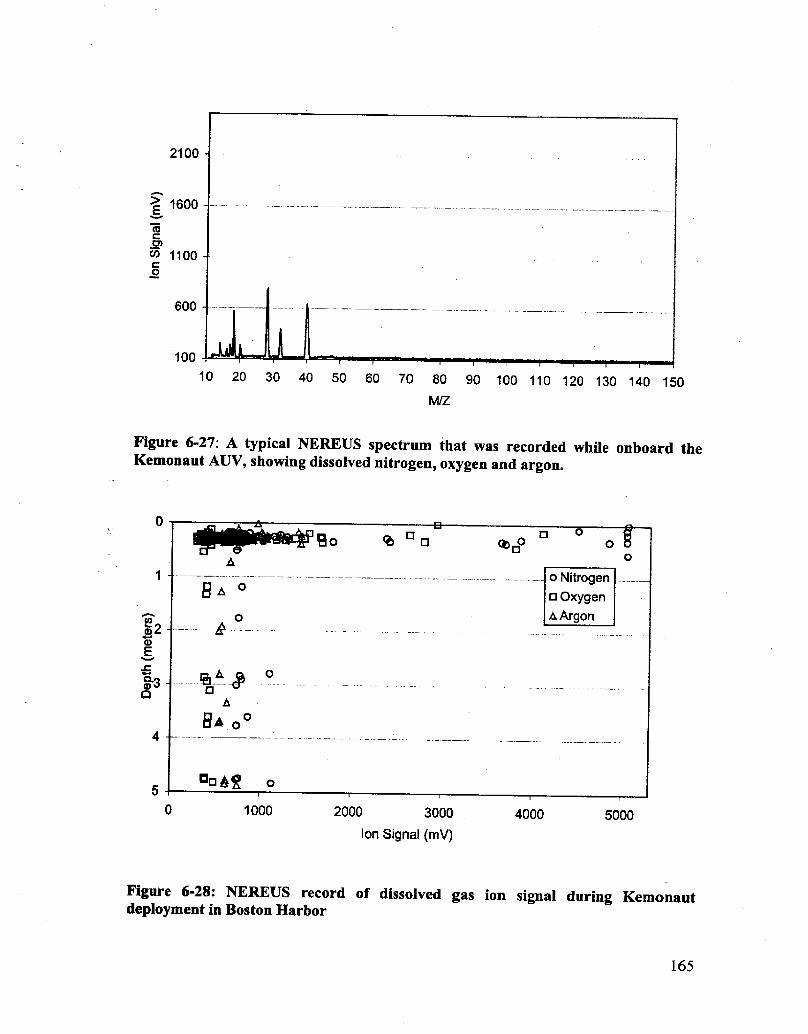
2100
E 1600
1100
O
600
Figure 6-27: A typical NEREUS spectrum that was recorded while onboard theKemonaut AUV, showing dissolved nitrogen, oxygen and argon.
2000 3000
ion Signal mV!
1000 4000 5000
Figure 6-28: NEREUS record of dissolved gas ion signal during Kemonautdeployment in Boston Harbor
165
tPE
K3D
100 10 20 30 40 50 60 70 80 90 100 110 120 130 140 150M/2

166

Chapter 7
CONCLUSIONS AND FUTURE WORK
Several capabilities of the NEREUS mass spectrometer and Kemonaut AUV were
demonstrated through bench testing and deployments. These deployments rigorouslytested the system's ability to not only survive in real-world environinents but to collect
meaningful data while operating in harsh environments such as an ice-covered lake, or abusy marine port. NEREUS met or exceeded all of the original design goals, including:size, power, weight, response time, depth capability, sensitivity, endurance andreliability. The Kemonaut vehicle has proven to be a small, easily deployable, low cost,yet robust platform with adequate stability and cargo carrying capacity to deploy theNEREUS instrument. Thus far, all tests and operations have been successfully completedwithout instrument or vehicle failure. Moreover, large quantities of scientifically valuabledata were collected during these initial deployments. At present, the instrument andvehicle system is well suited for scientific assessment of dissolved gases in shallow,&eshwater and coastal marine environments. Further research and development maygreatly extend system usefulness by virtue of increased depth limit, greater detectorsensitivity, elevated scan speed, multiple sensor integration, increased vehicle enduranceand closed-loop navigation. It is worthwhile noting that the NEREUS instrument wasconstructed with a materials cost of approximately $5,000, and $3,000 for the Kemonaut
vehicle. These budgetary constraints required that all hardware components be completedwith just a single design and build iteration. Nearly all NEREUS components werefabricated by hand and, in several cases, component parts were fashioned &om discardedmaterials found around the MIT campus. Kemonaut development was similarlychallenging because it required in-house fabrication and was completed, &om concept tovehicle deployment, in just six weeks. Despite these budgetary and time constraints, theKemonaut-NEREUS system is a technologically advanced environmental data collection
tool that offers new and unique capabilities for understanding the subsurface aquaticenvironment.
167
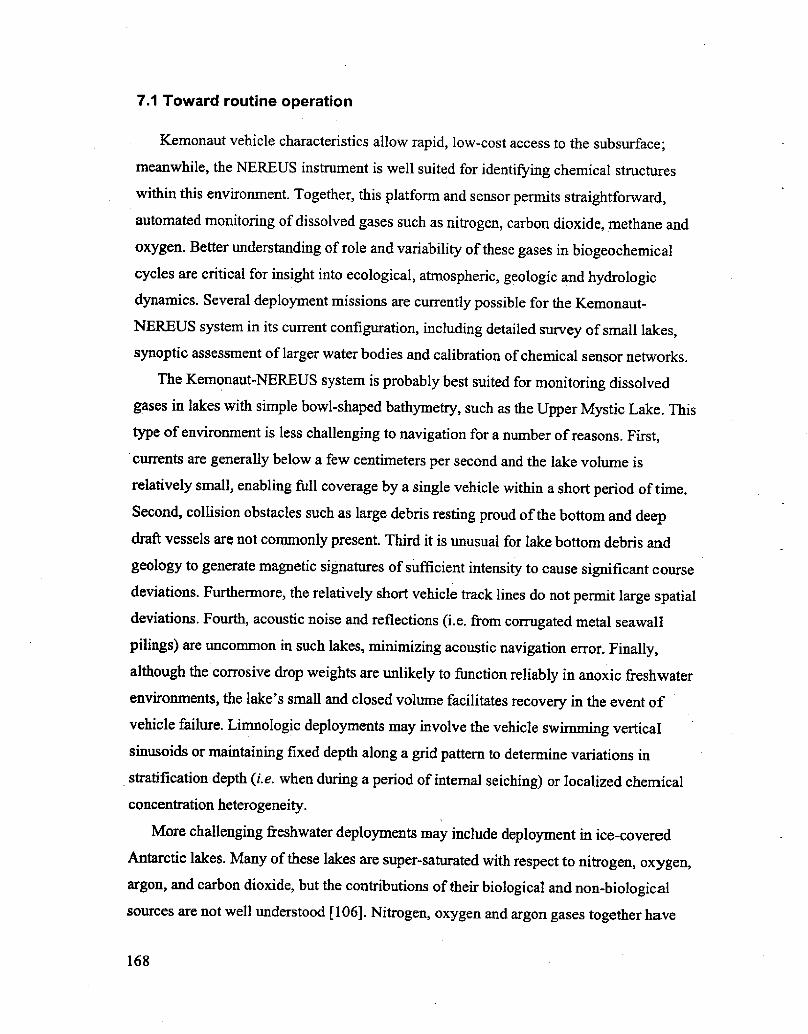
7.1 Toward routine operation
Kemonaut vehicle characteristics allow rapid, low-cost access to the subsurface;
meanwhile, the NEREUS instrument is well suited for identifying chemical structures
within this environment. Together, this platform and sensor permits straightforward,automated monitoring of dissolved gases such as nitrogen, carbon dioxide, methane and
oxygen. Better understanding of role and variability of these gases in biogeochemical
cycles are critical for insight into ecological, atmospheric, geologic and hydrologicdynamics. Several deployment missions are currently possible for the Kemonaut-
NEREUS system in its current configuration, including detailed survey of small lakes,
synoptic assessment of larger water bodies and calibration of chemical sensor networks.
The Kemonaut-NEREUS system is probably best suited for monitoring dissolved
gases in lakes with simple bowl-shaped bathymetry, such as the Upper Mystic Lake. Thistype of environment is less challenging to navigation for a number of reasons. First,
currents are generally below a few centimeters per second and the lake volume is
relatively small, enabling full coverage by a single vehicle within a short period of time,Second, collision obstacles such as large debris resting proud of the bottom and deepdraft vessels are not commonly present. Third it is unusual for lake bottom debris and
geology to generate magnetic signatures of sufficient intensity to cause significant coursedeviations. Furthermore, the relatively short vehicle track lines do not permit large spatialdeviations. Fourth, acoustic noise and reflections i.e, from corrugated metal seawall
pilings! are uncommon in such lakes, minimizing acoustic navigation error. Finally,although the corrosive drop weights are unlikely to function reliably in anoxic freshwater
environments, the lake's small and closed volume facilitates recovery in the event ofvehicle failure. Limnologic deployments may involve the vehicle swimming verticalsinusoids or maintaining fixed depth along a grid pattern to determine variations in
stratification depth i.e. when during a period of internal seiching! or localized chemical
concentration heterogeneity.
More challenging &eshwater deployments may include deployment in ice-covered
Antarctic lakes. Many of these lakes are super-saturated with respect to nitrogen, oxygen,argon, and carbon dioxide, but the contributions of their biological and non-biologicalsources are not well understood I 106]. Nitrogen, oxygen and argon gases together have
168

been used to determined the fraction of gas produced by biology compared to freezingand also determine the nature of the freezing process [107]. However, research indicatesthat significant variability in gas concentrations occur throughout the water column andsampling is limited by the time required to drill multiple boreholes in ice up to 5 metersthick as well as the abilities of scuba divers to collect subsurface samples [108].NEREUS deployments in the Upper Mystic Lake has demonstrated its ability to operatewithin a frozen lake, and subsequent Boston Harbor deployment established that the
instrument and AUV both operate satisfactorily in water temperatures less than 5 C.Thus, the Kemonaut-NEREUS system should be able to withstand the harsh Antarcticenvironment, and if equipped with a LBL navigation system may prove valuable notonly in increasing the data collection rate, but also by eliminating the need for scubadivers to perform dangerous sample collection work below the thick ice cover.
Yet another type of near-term deployment can be monitoring of coastal marine areasfor pollution &om sewage or hydrocarbon spills. The instrument package couldpotentially be used in areas such as Boston Harbor, where recent cleanup efforts havelead to the creation of a new offshore outfall and the closing of sewage outfalls within theharbor [109]. The instrument and vehicle could easily identify areas of decreased oxygenand increased methane and carbon dioxide, which may help in identifying remainingpollution sources to the Harbor. This type of mission would only require simple straight-line surveys and therefore could be conducted using Kemonaut's existing navigationsystem.
7.2 System optirnizatlon
Although the instrument and vehicle met or exceeded their design goals, a few areasof potential improvement were identified, both in the instrument and vehicle, followingthe deployment tests. Each improvement is easily achieved with simple modifications tohardware components or algorithms. Improvements to NEREUS may include a modifiedinlet system, designed without recesses that trap gas bubbles within the inlet housing anda membrane mounting apparatus that permits easy membrane replacement and increasedoperational depth, The cycloid tube possesses a 180' sector analyzer and Faraday cup forM/Z = 1 to 12 scanning. This secondary analyzer, which is necessary for measuring
169

hydrogen gas and helium, can be utilized if a second electrometer and switching circuitry
is incorporated. Redesign of the circuit to incorporate an "auto-zeroing" or "chopper-
stabilized" operational amplifier [110] in its first gain stage may further increase
electrometer signal-to-noise ratio by limiting electrometer bandwidth to a narrow range
around 30Hz [1 1 1 j. The dual electrometer configuration should also include a system for
scalable electrometer gain permitting greater dynamic ion peak measurement range! and
additional vibration isolation to damp vehicle or tow body vibration!. Tow body
vibration can also be decreased by enclosing the NEREUS instrument within a
streamlined protective fairing and by using a short shock line e.g. bungee cord!
connected between the towline and the instrument to decouple surface craft motion and
towline strumming from the instrument. Signal-to-noise characteristics of NEREUS data
may benefit from additional post-processing techniques such as median filtering when the
system is exposed to excessive vibration or impacts. A median filter for electrometer data
can potentially help reduce noise by automatically rejecting sample outliers and thereby
preventing large oscillatory signals from influencing data values i.e. averaging only a
subset of sample measurements that are centered about the median!. Both the NEREUS
instrument and Kemonaut AUV can benefit from high energy-density storage batteries
such as rechargeable lithium polymer or lithium ion batteries. Further advance of
navigation and signal processing software will improve accuracy and expand system
capabilities. This may include the development of a closed loop navigation system
augmented with navigation sensors such as a long base line LBL! array, an active
hydrophone and GIB transponder onboard the vehicle, a Doppler velocity log DVL!, or
a high-precision spread-spectrum acoustic network such as the EXACT system, Finally,
incorporation of an acoustic telemetry system will allow both Kemonaut and NEREUS to
communicate with external agents while submerged, permitting its use as a nexus of
chemical data, linking nearby fixed arrays such as sensor buoys that may be distributed
throughout a body of water.
7.3 Sensor integration and reai-time data interpretation
In-situ submerged deployment presents the challenges of monitoring large spatial
volumes and highly dynamic environmental states when a priori knowledge is limited.
170
These factors, when combined with the limited communication bandwidth available to a
maneuvering underwater platform, require that autonomous decision and control
processes be employed. The NEREUS system uses an autonomous architecture to both
control the instrument and interpret data in real time. However, data generated by other
sensors such as temperatLue, depth, height above bottom, salinity and various chemicalparameters! remain external to the NEREUS decision control process. Instrument-platform control and data collection can be greatly enhanced through sensor integrationand real-time data assimilation, thereby improving state-based decision processes andreal-time forecasting of environmental conditions [79, 112]. For example, uniformtemporal or spatial chemical sampling may be inefficient if a chemical feature is
localized or intermittent. If a uniform coarse sampling strategy is used, the phenomenonmay become aliased or be overlooked completely. Then again, a fine-scale samplingstrategy may over sample, leading to monitoring inefficiency.
Currently, the NEREUS instrument uses an embedded type of expert systemintelligence that allows the instrimMnt to identify individual ion peaks and vary itssampling interval in real-time, according to the rate of change of ion signatures. Its
capability to intelligently monitor multiple chemicals may be broadened throughintegration of other sensors onboard the Kernonaut AUV or with a distributed array ofsensors using acoustic or radio telemetry. Such in-situ data distribution is advantageousbecause it cooperatively permits rapid, automated procedures such as in-situ calibration,data assimilation, forecasting, state-based monitoring, and chemotactic navigation Camilli and Heinond 2002!. Several sensor networks, including the LEO 15 [113] siteoff New Jersey's coast, and the proposed Neptune array [114] in the Pacific Ocean canpotentially use the Kemonaut-NEREUS system to rapidly measure multiple ions acrosswide spatial domains, providing synoptic coverage of large-scale transient chemicalphenomena, and to supplement data collected by other moored, drifting, ship-borne andairborne instruments.
7.4 Future prototypes
As new materials and technologies become available, more capable prototypes can bederived &om the Kemonaut-NEREUS system's design. It is difficult to accurately predict
171

what types of innovations are ahead, but these future generations of autonomous
submersible mass spectrometers and AUVs may include many of the promising
technologies that are just now emerging. These may include new power systems such as
fuel cells, which enable month-long, multi-&ousand kilometer mission durations [115,
116]. Other AUV advances may include advanced vehicle control systems that permit
vehicle hovering, and precise navigation even in energetic environments such as surf
zones [117, 118]. Control system evolution may also permit more flexible missions
through feature-based concurrent mapping, which incorporate environmental
measurements in navigation estimation to improve navigational performance in
unmapped environments [119]. These adaptive control systems may assimilate chemical
data in real-time from an onboard mass spectrometer, making possible chemotactic
navigation. In addition to higher-level instrument behaviors, future submersible mass
spectrometers will be much smaller due to high-energy product rare-earth magnets and
metals with increased B-field permeability [30]. Micro electro-mechanical systems
MEMS! will, undoubtedly, also cause overall sensor size to shrink considerably,
reducing the vacuum requirements and thereby also decreasing the instrument's power
requirement. It is conceivable that advances in MEMS and integrated circuit technologies
will soon lead to the development of sub-centimeter-scale ion path length analyzers
operating at pressures of a few Torr, permitting the use of much smaller, lower cost
AUVs, At some point these mass spectrometers should diminish in size, power, and cost
to a point that they can be carried as payload on miniature autonomous vehicles which
ran be simultaneously deployed as a self-configuring distributed network by a single
person to cover an entire volume, Such systems will revolutionize the way we observe
the aquatic environment, enabling an in-situ presence to explore and understand chemical
processes at appropriate spatial and temporal frequencies.
172

REFERENCES
Cohen, J.E., et al., Estimates of coastal populations. Science, 1997. 278�341!: p.1211-1212.
Aristotle, The Complete Works of Aristotle the Revised Oxford Translation, inProblems Physika Problemata!, J. Barnes, Editor. 1984, Princeton University:Princeton. p. 1514,Edgerton, H.E., Diving Deep on the Bathyscaphe, in MIT Institute Archives andSpecial Collections: Edgerton Collections. 1988: Cambridge.Ballard, R.D., The History of Woods Hole's Deep Submergence Program, in 50Years of Ocean Discovery, O,S.B.N.R. Council, Editor. 2000, National AcademyPress: Washington, D.C. p, 67-84.Fricke, J,R., Down to the Sea in Robots, in Technology Review. 1994. p. 46-55.Brooks, R.A., I lesh and Machines How Robots Will Change Us. 2002, NewYork: Pantheon. 260.
Mindell, D.A., Between Human and Machine I'eedback, Control, and Computingbefore Cybernetics. 2002, Baltimore: Johns Hopkins, 439.Walter, W.G., An Imitation of Life. Scientific American, 1950. 182�!; p. 42-45.Walter, W.G., A Machine that Learns. Scientific American, 1953. 185�!: p. 60-63.
Brooks, R.A., A Robot that Walks; Emergent Behaviors from a Carefully EvolvedNetwork. 1989, Massachusetts Institute of Technology Artificial IntelligenceLaboratory; Cambridge. p, 12.Bernard, D., et al. Spacecraft autonomy flight experience: The DSI Remote AgentExperiment. in Proceedings of the AIAA Conference 1999. 1999.Bellingham', J.G., et al. Performance Characteristics of the Odyssey AUV. in 8thInternational Symposium on Unmanned Untethered Submersible Technology.1993. Portsmouth NH.: Autonomous Undersea Systems Institute.Bellingham, J.G., New oceanographic uses of Autonomous Underwater Vehicles.Marine Technology Society Journal, 1997. 31�!; p. 34-47,Singh, H., D. Yoerger, and A. Bradley. Issues in AUV Design and Deployment forOceanographic Research. in Proceedings of the I 997 IEEZ InternationalConference on Robotics and Automation, 1997. Albuquerque: IEEE.Purcell, M., et al. New Capabilities of the REMUS Autonomous UnderwaterVehicle. in Oceans 2000. 2000, Providence, Ri.Butler, B. and M.R. Black. The Theseus A UV, Two Successful Missions. inProceedings of the Tenth International Symposium on Unmanned UntetheredSubmersible Technology. 1997. Lee, New Hampshire.Bellingham, J.G., et al. A Second Generation Survey A UV. in Proceedings of theIEEE Symposium on Autonomous Underwater VehicleTechnology A UV '94!.1994. Cambridge, Ma.; IEEE.Bales, J.W. and E.R. Levine. Sensors for Oceanographic Applications ofAutonomous Underwater Vehicles. in AUVS-94. 1994. Arlington: Association forUnmanned Vehicle Systems,
173

19.
20.
21.
23.
24.
25.
26.
27.
28.
29.
30.
31.
32.
33.
34.
35.
36.
Thomson, J,J., Cathode Rays. The London, Edinburgh, and Dublin PhilosophicalMagazine, 1897. 44: p. 293,Kiser, R.W,, Introduction to Mass Spectrometry and its Applications. 1965,Englewood Cliffs, Nj: Prentice-Hall. 356.Thomson, J,J,, Rays of positive electricity and their application to chemicalanalyses. 1913, London: Longmans, Green and Co. 132.Thomson, J.J., Multiply-charged Atoms. The London, Edinburgh, and DublinPhilosophical Magazine, 1912. 24�!; p, 668-672.Syage, J.A., et al., Field-portable, high-speed GC/TOFMS, Journal of theAmerican Society for Mass Spectrometry, 2001. 12�!: p. 648-655.Niemann, H.B., et al., The Galileo probe mass spectrometer: Composition of'Jupiter's atmosphere. Science, 1996. 272�263!; p. 846-849.Palmer, P,T. and T.F. Limero, Mass spectrometry in the US space program: Past,present, and future. Journal of the American Society for Mass Spectrometry,2001. 12�!: p, 656-675.Neuman, J.A., et al., Fast-response airborne in situ measurements of HNO3during the Texas 2000 Air Quality Study. Journal of Geophysical Research-Atmospheres, 2002. 107 D20!: p. art. no,-4436.Richardson, L.B., Thesis: A field-usable membrane-probe mass spectrometer, inDeptartment of Civil Engineering. 1988, Massachusetts Institute of Technology;Cambridge. p. 62.Baykut, G, and J. Franzen, Mobile Mass-Spectrometry � a Decade of FieldApplications. Trac-Trends in Analytical Chemistry, 1994. 13�!: p. 267-275.Hemond, H.F., A Backpack-Portable Mass-Spectrometer for Measurement ofVolatile Compounds in the Environment. Review of Scientific Instruments, 1991,62�!: p. 1420-1425.Sinha, M.P. and A,D. Tomassian, Development of a Miniaturized, LightweightMagnetic-Sector for a Field-Portable Mass Spectrograph, Review of ScientificInstruments, 1991, 62�1!: p. 2618-2620,Sinha, M.P. and G. Gutnikov, Development of a Miniaturized Gas-Chromatograph Mass- Spectrometer with a Microbore Capillary Column and anArray Detector. Analytical Chemistry, 1991. 63�8!: p, 2012-2016.Takahashi, T., C. Wunsch, and e. al., Applications in Analytical Chemistry toOceanic Carbon Cycle Studies. Oceanographic Measurements; Technologies forChemical Measurements, 1993, Washington D,C.: National Academy Press. 85.Johnson, J.E., Evaluation of a seawater equilibrator for shipboard analysis ofdissolved oceanic trace gases. Analytica Chimica Acta, 1999. 395�-2!: p. 119-132.
Park, S., Surface Seawater Sampling Device During ¹vigation. Ocean Research,1995. 17�!: p. 59-63.Matz, G., W. Schroder, and G. Kibelka, Submersible Membrane Introduction-Gaschromatograph - Mass Spectrometer. unpublished, Technische UniversitatHamburg-Harb urg.Short, R.T., et al., Underwater mass spectrometers for in situ chemical analysis ofthe hydrosphere. Journal of the American Society for Mass Spectrometry, 2001,12�!: p. 676-682.
174

Hemond, H.F. and R, Camilli. Underwater Mass Spectrometers: Some CriticalEngineering Issues. in Third 8'orkshop on Harsh-Environment MassSpectrometry. 2002. Pasadena, Ca.Camilli, R., Thesis: The Development of Components for an In-situ MassSpectrometer, in Department of Civil and Environmental Engineering. 2000,Massachusetts Institute of Technology: Cambridge. p. 102.Einfeld, W�et al., Environmental Technology Verification Report. 1997, USEnvironmental Protection Agency, Office of Research and Development:Washington DC. p. 1-78.Poel, L.v.d., Product Sur vey on Commercial A UVs, in Hydro International. 2002.p. 37-39.Conrad, R. and W. Seiler, Methane and Hydrogen in Seawater Atlantic-Ocean!,Deep-Sea Research Part a-Oceanographic Research Papers, 1988. 35�2!: p.1903-1917,
Schmidt, U. and R, Conrad, Hydrogen, Carbon-Monoxide, and MethaneDynamics in Lake Constance. Limnology and Oceanography, 1993. 38�!: p.1214-1226.
Scranton, M.I., P. Donaghay, and J.M. Sieburth, Nocturnal MethaneAccumulation in the Pycnocline of an Anoxic Estuarine Basin. Limnology andOceanography, 1995. 40�!: p. 666-672.Tilbrook, B.D. and D.M. Karl, Methane Sources, Distributions and SinksPomCalifornia Coastal 8'aters to the Oligotrophic North Pacific Gyre. MarineChemistry, 1995. 49 l!: p. 51-64.Brekke, T,, O. Lonne, and S.E. Ohm, Light hydrocarbon gases in shallowsediments in the northern North Sea. Marine Geology, 1997. 137�-2!: p. 81-108,Deangelis, M.A. and M.I. Scranton, Fate of Methane in the Hudson River andEstuary. Global Biogeochemical Cycles, 1993. 7�!: p. 509-523.Chen, G.T. and F.J. Millero, Gradual Increase of Oceanic Co2. Nature, 1979.277�693!: p. 205-206.Whiticar, M.J., Diagenetic relationships of methanogenesis, nutrients, acousticturbidi ty, pockmarks andPeshwater seepages in Eckernforde Bay. MarineGeology, 2002. 182�-2!: p. 29-53.Scranton, M.I, and K. McShane, Methane Fluxes in the Southern North-Sea - theRole of European Rivers. Continental Shelf Research, 1991. 11�!: p. 37-52.Frenzel, P., B. Thebrath, and R. Conrad, Oxidation of Methane in the OxicSurface-Layer of a Deep Lake Sediment Lake Constance!. Ferns MicrobiologyEcology, 1990. 73�!: p. 149-158.Dafher, E., A. Obzhirov, and O. Vereshzhagina, Distribution of methane in watersof the Okhotsk and western Bering Seas, and the area of the Kuril Islands.Hydrobiologia, 1998. 362: p. 93-101.Diaz, J.A., C,F. Giese, and W.R. Gentry, Mass spectrometryfor in-situ volcanicgas monitoring. Trac-Trends in Analytical Chemistry, 2002. 21 8!: p. 498-514.
38.
39.
40.
41.
43.
44.
45
47.
48.
49.
50.
51.
52.
53.
175
37. Kibelka, G., et al., Underwater Mass Spectrometry for Detection of VOCs andDissolved Gases. unpublished, Center for Ocean Technology
Applied Microsystems Ltd.

54.
55.
56.
57.
58.
59.
60.
61.
62.
63.
64,
65.
66.
67.
68.
69.
70.
71.
Sutton, A,J, et al., Implications for eruptive processes as indicated by sulfu rdioxide emissions from Ki1auea Volcano, Hawai'i, 1979-1997. Journal ofVolcanology and Geothermal Research, 2001. 108�-4!: p. 283-302.Tsunogai, U., et al., Peculiar Features of Suiyo Seamount Hydrothermal Fluids,Izu- Bonin Arc � DifferencesPom Subaerial Volcanism. Earth and PlanetaryScience Letters, 1994. 126�!: p. 289-301.Lilley, M.D,, M,A, Deangelis, and L.I. Gordon, Ch4, H-2, Co and N2o inSubmarine Hydrothermal Vent Waters. Nature, 1982. 300�887!: p. 48-50.Kodera, M,, G. Igarashi, and M. Ozima, Noble-Gases in Hydrothermal Plumes ofLoihi Seamount. Earth and Planetary Science Letters, 1988. 87�!: p. 266-272.Gamo, T., et al,, Methane Anomalies in Seawater above the Loihi SubmarineSummit Area, Hawaii. Geochimica Et Cosmochimica Acta, 1987. 51�0!: p.2857-2864.
Sigurdsson, H., Kick'em Jenny, R. Camilli, Editor. 2002, personal communication.Robertson, R., et al., The explosive eruption of Soujiere Hills Volcano,Montserrat, West Indies, 17 September, 1996. Geophysical Research Letters,1998. 25�8!: p. 3429-3432.Robertson, R.E.A., An Assessment of the RiskPom Future Eruptions af theSoufriere Volcano of St-Vincent, West-Indies. Natural Hazards, 1995. 11�!: p.163-191.
Ishibashi, J,I., et al., Helium and Carbon Geochemistry of Hydrothermal Fluidsfrom the North Fjii Basin Spreading Ridge Southwest Pacific!. Earth andPlanetary Science Letters, 1994. 128�-4!: p, 183-197.Karl, D.M., C.O. Wirsen, and H,W. Jannasch, Beep-Sea Primary Production atthe Galapagos Hydrothermal Vents. Science, 1980. 207�437!: p. 1345-1347.Alper, J,, Oases in the oceanic desert. ASM American Society for MicrobiologyNews, 1990. 56�0!: p. 536-538.Tsunogai, U., et al., Fresh water seepage and pore water recycling on theseafloor: Sagami Trough subduction zone, Japan. Earth and Planetary ScienceLetters, 1996. 138�-4!: p. 157-168.Bussmann, I. and E. Suess, Groundwater seepage in Eckernforde Bay WesternBaltic Sea!: Effect on methane and salinity distribution of the water column.Continental Shelf Research, 1998, 18�4-15!: p. 1795-1806.Fingas, M. and C, Brown, Remote sensing of oil spills. Sea Technology, 1997,38 9!: p. 37-&.Fingas, M, and C. Brown, A review of the status of advanced technologies for thedetection of oil in and with ice. Spill Science & Technology Bulletin, 2000. 6�-6!: p. 295-302.Lehr, W., J. Gait, and e. al. Tracking the North Cape Oil Spill. in Proceedings ofthe 19th Arctic and Marine Oilspill Program. 1996. Calgary.Wang, Z.D,, et al,, Characterization and source identification of hydrocarbons inwater samples using multiple analytical techniques. Journal of ChromatographyA, 2002. 971�-2!: p. 173-184,Hoch, J. and B. Kok, A Mass Spectrometer Inlet System for Sampling GasesDissolved in Liquid Phases, Archives of Biochemistry and Biophysics, 1963. 101:p. 160-170.
176

Allen, G., Final Report: Mass Spectrometers. 1996, Massachusetts Institute ofTechnology: Unpublished; Cambridge.Maden, A. and M. Hayward, Sheet Materials for Use as Membranes in MembraneIntroduction Mass Spectrometry Analytical Chemistry, 1996. 68: p. 1805-1811.Robinson, C,F, and L.G. Hall, Review of Scientific Instrumentation, 1956. 27: p,504.
Bleakney, W. and J.A, Hippie, A New Mass Spectrometer with ImprovedFocusing Properties. Physical Review, 1938. 53. p. 521-528.
73.
74.
75
Robot. 1985, Massachusetts Institute of Technology: Cambridge. p. 1-25.Russell, S. and P. Norvig, Artificial Intelligence a Modern Approach. 1995,Upper Saddle River, Nj.: Prentice Hall. 932.Carver, S,J., et al., Evaluating field-based GIS for environmentalcharacterization, modeling and decision suppor t. International Journal ofHeographical Information Systems, 1995. 9�!: p, 475-486.Vivoni, E.R. and R, Carnilli, Real-time Streaming of Environmental Field Data.Computers and Geosciences, 2002. 29�!: p. 457-468.Gates, S.C. and J. Becker, Laboratory Automation using the IBMPC. 1989,Englewood Cliffs Nj.: Prentice Hall. 322.Bellingham, J.G., et al. A small long range vehicle for deep ocean exploration. inProceedings International Onshore and Polar Engineering Conference. 1992,San Francisco.
Curtin, T.B., et al., Autonomous Ocean Sampling Networks. Oceanography, 1993.6�!: p. 86-94,Schmidt, H., et al. Real-Time Frontal Mapping with A UVs in a CoastalEnvironment. in Oceans 96 MTSlIEEE. 1996. Ft, Lauderdale, Florida.Manley, J. and J. Rieffel, GOATS 2000 September 25-October 12, 2000 A UVOperations Report. 2000, MIT Sea Grant. p. 13.Chryssostomides, C., MIT Reports to the President, Sea Grant College Program.2001, Massachusetts Institute of Technology.Newman, P,, Thisis the MOOS, in htt:lloceanai,rnit.edul newmanlMOOSl.2000, MIT Sea Grant.
Manley, J., A UV Sea Trials March 6 - 15, 2002 Key 8'est, Florida OperationsReport. 2002, MIT Sea Grant AUV Laboratory: Cambridge. p. 15.Damus, R., S, Desset, and J. Morash, Xanthos vehicle control system, R. Camilli,Editor. 2002.
Doherty, R.E., An Algorithm for Mixture Component Determination For Use InMembrane Inlet Mass Specrometry, in Civil Engineering. 1987, MassachusettsInstitute of Technology: Cambridge. p. 272.Brandrup, J., E.H. Immergut, and E.A. Grulke, eds, Polymer Handbook. 4th ed.1999, Wiley-Interscience: New York.Weiss, R.F., The solubility of nitrogen, oxygen and argon in water and seawater.Deep-Sea Research, 1970. 17: p. 721-725.Comyn, J., Polymer Permeability. 1985, New York: Elsevier Applied Science.Varian, Ion Pumps- vacuum productsPom Varian. 2001.Allen, G., Comprehensive Polymer Science, 1989, New York: Pergamon,
77
78
79
80
81
83
84
85
86
88.
89.
91.
92.
93.
94.
177
76. Brooks, R.A., A.I. Memo 864: A Robust Layered Control System For a Mobile

95.
96.
97.
98.
99.
100.
101.
102.
103.
104.
105.
106.
107.
108.
109.
110.
111.
Crank, J., The Mathematics of Diffusion, 1975, Oxford University Press: NewYork.
Jenkins, R., P. Nelson, and e. al., eds, Transactions of the Faraday Society, 1970.Wick, L. Y, and P.M. Gschwend, By-products of a former phenol manufacturingsite in a small lake adjacent to a Superfund site in the Abej rona watershed.Environmental Health Perspectives, 1998. 106: p. 1069-1074.Wick, L.Y., et al., Fate of benzene in a Stratified Lake receiving contaminatedgroundwater discharges from a Superfund site. Environmental Science &Technology, 2000. 34�0!: p. 4354-4362.Eganhouse, R,P. and P.M. Sherblom, Anthropogenic organic contaminants in theeffl uent of a combined sewer overflow: impact on Boston Harbor. MarineEnvironmental Research, 2001. 51�!: p. 51-74.Futo, I. and H. Degn, Effect of Sample Pressure on Membrane Inlet Mass-Spectrometry. Analytica Chimica Acta, 1994. 294�!: p. 177-184.Senn, D,B,, Thesis: Coupled Arsenic, Iron, and Nitrogen cycling in Arsenic-Contaminated Upper Mystic Lake, in Department of Civil and EnvironmentalEngineering, 2001, Massachusetts Institute of Technology: Cambridge MA. p,284,
Sphethoff, H.M and H.F. Hemond, History of toxic metal discharge to surfacewaters of the Aberj ona iWatershed. Environmental Science & Technology, 1996.30�!: p. 121-128,Fricker, P,D., Thesis: The Effect of Stratification and Bathymetry on InternalSeiche Dynamics, in Department of Civil and Environmental Engineering. 2000,Massachusetts Institute of Technology: Cambridge MA, p, 174.Senn, D,B, and H.F. Hernond, Nitrate controls on iron and arsenic in an urbanlake. Science, 2002, 296�577!: p. 2373-2376.Andradottir, H., Thesis: Circulation and Mixing in the Upper Forebay of theMystic Lake System, iWinchester, Massachusetts, in Civil and EnvironmentalEngineering. 1997, Massachusetts Institute of Technology: Cambridge, p. 109.Andersen, D.T., C.P. McKay, and R. Wharton, Dissolved gases in perennially ice-covered lakes of the McMurdo Dry Valleys, Antarctica. Antarctic Science, 1998.10�!: p. 124-133.Craig, H., R.A. Wharton, and C.P. McKay, Oxygen Supersaturation in Ice-Covered Antarctic Lakes � Biological Versus Physical Contributions. Science,1992. 255�042!: p. 318-321.McKay, C.P., personal communication on sampling methods inPozen Antarcticlakes, R, Camilli, Editor. 2002.Signell, R.P., H.L. Jenter, and A,F. Blumberg, Predicting the physical effects ofrelocating Boston's sewage outfall. Estuarine Coastal and Shelf Science, 2000.50�!: p. 59-71,Horowitz, P. and W. Hill, The Art of Electronics. 2nd ed. 1989, New York.Cambridge University Press. 1125.Landhal, C,E. and R.G. Merryman, Modifications to CEC 21-620 MassSpectrometer for Increased Sensitivity. 1960, Los Alamos Scientific Laboratoryof the University of California: Los Alamos NM. p. 1-20.
178

112. Camilli, R. and H.F. Hemond. Multisensor Data Integration and AdaptiveSampling Strategies for an Autonomous Underwater Mass Spectrometer. in Third8'orkshop on Harsh-Environment Mass Spectrometry. 2002. Pasadena, Ca.
113. Laursen, A.E. and S.P. Seitzinger, The role of denitrification in nitrogen removaland carbon mineralization in Mid-Atlantic Bight sediments. Continental ShelfResearch, 2002. 22 9!: p, 1397-1416.
114. Delaney, J.R, and A.D. Chave, NEPTUNE: A fiber-optic 'telescope'to innerspace. Oceanus, 2000, 42�!: p. 10-11,
115. Aoki, T. and T. Shimura, Fuel Cell for Long-Range AUV. Sea Technology, 1997.38 8!: p. 69-73.
116. Rudd, E,J, and D.W. Gibbons, High energy density aluminum/oxygen cell. Journalof Power Sources, 1994. 47: p. 329-340.
117. Curico, J.A,, F.S. Hover, and J.G, Bellingham, CETUS; Design of a ProductionAUV. Sea Technology, 1998, 39�2!: p. 10-17,
118. Hillenbrand, C., UUV Science 4 Technology Trends. Sea Technology, 1997.38�2!: p. 10-15.
119. Smith, C.M., et al. Feature-based concurrent mapping and localization forautonomous underwater vehicles, in Proceedings of IEEE Oceans. 1997.
179