Morphologic characteristics of benign and malignant adrenocortical tumors
Upload
independentCategory
view
0download
0
Profiling follicle stimulating hormone-induced gene expression changes in
normal and malignant human ovarian surface epithelial cells
Shuk-Mei Ho1,2, Kin-Mang Lau1,4, Samuel Chi-ho Mok3 and Viqar Syed*,1
1Department of Surgery, University of Massachusetts Medical School, Worcester, MA, USA; 2Department of Cell Biology andPhysiology, University of Massachusetts Medical School, Worcester, MA, USA; 3Laboratory of Gynecologic Oncology, Departmentof Obstetrics, Gynecology and Reproductive Biology, Brigham and Women’s Hospital, Harvard Medical School, Boston, MA, USA
Epidemiological data have implicated the pituitarygonadotropin follicle stimulating hormone (FSH) as botha risk factor for and a protective agent against epithelialovarian cancer. Yet, little is known about how thishormone could play such opposing roles in ovariancarcinogenesis. Complementary DNA microarrays con-taining 2400 named genes were used to examine FSH-induced gene expression changes in ovarian cancer (OC)and immortalized normal human ovarian surface epithelial(HOSE) cell lines. Two-way t-statistics analyses of arraydata identified two distinct sets of FSH-regulated genes inHOSE and in established OC cell lines established frompatients (OVCA cell lines). Among the HOSE cell lines,FSH increased expression of 57% of the 312 genes anddownregulated 43%. In contrast, FSH diminished expres-sion of 92% of the 177 genes in the OVCA cell lines. Allbut 18 of the genes affected by FSH in HOSE cell lineswere different from those altered in OVCA cell lines.Among the 18 overlapping genes, nine genes exhibited thesame direction of change following FSH challenge, whilethe other nine showed discordance in response betweenHOSE and OVCA cell lines. The FSH-induced differ-ential expression of seven out of nine genes was confirmedby real-time RT–PCR. Gene-specific antisense oligonu-leotides (ODNs) were used to inhibit the expression ofgenes encoding GTPase activating protein (rap1GAP),neogenin, and restin in HOSE and OVCA cells. AntisenseODNs to neogenin and restin, but not an antisense ODNto rap1GAP, were effective in inhibiting OVCA cellgrowth, diminishing proliferating cell nuclear antigenexpression, and increasing caspase 3 activities. Further-more, the ODN to rap1GAP was further shown to beineffective in altering migration properties of OVCA celllines. HOSE cell proliferation was not affected bytreatment with any of the antisense ODNs. In summary,gene profiling data reveal for the first time that FSH mayexert different biological actions on OVCA cells than onHOSE cells, by differential regulation of a set of putative
oncogenes/tumor suppressors. Specifically, neogenin andrestin were found to exhibit proproliferation/survivalaction on OC cells.Oncogene (2003) 22, 4243–4256. doi:10.1038/sj.onc.1206437
Keywords: cDNA microarray; hormonal carcino-genesis; gene expression; GTPase activating protein(rap1GAP); neogenin; restin
Introduction
In the United States, ovarian cancer (OC) is the secondmost common cancer of the female reproductive systemand the leading cause of death from gynecologicneoplasms (Holschneider and Berek, 2000). Each year,an estimated 23 100 US women are diagnosed with OC,and 14 000 die from the disease (Holschneider andBerek, 2000). Most ovarian tumors arise from thehuman ovarian surface epithelium (HOSE), which is asimple squamous-to-cuboidal mesothelium covering theovary (Gillett et al., 1999), or from invaginations of thislining into the superficial ovarian cortex to form corticalinclusion cysts (Feeley and Wells, 2001). During eachmenstrual cycle, the HOSE is ruptured at the site ofovulation and subsequently repaired via cell prolifera-tion. The latter process is believed to be regulated bymultiple reproductive hormones including gonadotro-pins (Auersperg et al., 2001).
The pathogenesis of ovarian carcinoma remainsunclear. Higher levels of gonadotropins after meno-pause are associated with an increased incidence ofOC in perimenopausal and postmenopausal women(Hamilton, 1992; Godwin et al., 1993; Heizisouer et al.,1995; Konishi et al., 1999; Rao and Slotman, 1999;Shushan et al., 1996; Zheng et al., 2000). Increasedoccurrence of OC has also been reported in womenusing gonadotropin-based fertility drugs (Whittemoreet al., 1992; Shushan et al., 1996; Risch, 1998).Conversely, women who take acetaminophen as apain-relief medicine have been found to have lowerbasal levels of gonadotropins and reduced OC risk(Cramer et al., 1998). Clinical trials using LHRHagonist to suppress endogenous gonadotropins pro-duced conflicting results, with some studies reporting no
Received 26 September 2002; revised 24 January 2003; accepted 29January 2003
*Correspondence: Viqar Syed, Department of Surgery, University ofMassachusetts Medical School, 364 Plantation Street, 5th floor,Worcester, MA 01605, USA;E-mail: [email protected] address: Department of Anatomical and Cellular Pathology,Prince of Wales Hospital, Shatin, New Territories, Hong Kong, China
Oncogene (2003) 22, 4243–4256& 2003 Nature Publishing Group All rights reserved 0950-9232/03 $25.00
www.nature.com/onc
relevant beneficial effects (Erickson et al., 1994; Emonset al., 1996) and others suggesting increased long-termsurvival in individual patients cotreated with tamoxifen(Hofstra et al., 1999). Furthermore, patients with OC,when compared to cancer-free patients, were found tohave elevated levels of gonadotropins and ovarianhormones in their peritoneal fluid (Halperin et al.,1999). Receptors for follicle-stimulating hormone (FSH)were detected in some OC/HOSE cell lines (Zheng et al.,1996; Mandai et al., 1997; Parrott et al., 2001; Syed et al.,2001) but were absent from others (Ala-Fossi et al.,1999). Treatment of normal and malignant HOSE cellswith gonadotropins, particularly FSH, demonstratedefficacy in stimulating cell proliferation in some cell lines(Zheng et al., 2000; Syed et al., 2001) but was eithernoneffective (Ala-Fossi et al., 1999) or inhibitory(Ivarsson et al., 2001) for other cell lines. Takentogether, the aforementioned findings generally supportthe hypothesis that elevated gonadotropin levels, viaenhancement of cell proliferation in the HOSE cellpopulation, favor accumulation of genetic errors andneoplastic transformation (Konishi et al., 1999; Holsch-neider and Berek, 2000; Feeley and Wells, 2001).Nevertheless, a portion of the literature argues againstan association between high gonadotropin levels andincreased OC risk.
In the present study, the gene expressions of two typesof cell lines were compared to gain insight into theprocess of neoplastic transformation and the role ofFSH: (1) normal immortalized HOSE cell lines thatexhibited uniform epithelial-like morphology, wereimmunopositive for cytokeratins K7, K8, K18, andK19, immunonegative for vimentin, expressed no CA-125, and were nontumorigenic in nude mice (Taso et al.,1995) and (2) OVCA cell lines derived from patientswith late-stage serous ovarian adenocarcinomas (Bastet al., 1981).
Although several studies have demonstrated theutility of microarray technology in identifying novelmolecular markers for OC (Schummer et al., 1999;Wang et al., 1999; Ismail et al., 2000; Ono et al., 2000;Hough et al., 2001; Shridhar et al., 2001; Welsh et al.,2001), this methodology has not been exploited inunraveling the role of hormones in ovarian carcinogen-esis. We here employed a cDNA microarray containing2400 named genes to profile gene expression changesinduced by FSH in HOSE and OC cell lines in an effortto ascertain differential responses between normal andmalignant HOSE cells to hormone stimulation. Resultsfrom this study have provided new insights into the roleof FSH in ovarian carcinogenesis.
Results
Identification of genes whose expression was altered in allHOSE and OVCA cell lines following FSH treatment
Gene expression profiles in the three HOSE cell linesbefore hormone treatment were compared to thoseobserved in the same lines after 5 days of FSH treatment
with individual microarray analyses. Similarly, micro-array analyses were conducted to profile gene expressionchanges in the OVCA cell lines following FSHtreatment. In this study, each cell line was microarrayedthree times using three different mRNA samples. Geneexpression levels in untreated cultures were plottedagainst those found in FSH-treated cell cultures asscatterplots (data not shown), and the Pearson correla-tion coefficient r for each comparison was calculated:r¼ 0.69 for HOSE 642, r¼ 0.68 for HOSE 6–8, r¼ 0.63for HOSE 12–12, r¼ 0.71 for OVCA 420, r¼ 0.74 forOVCA 429, and r¼ 0.53 for OVCA 432. These valuesindicated that the majority of the 2400 genes showed no
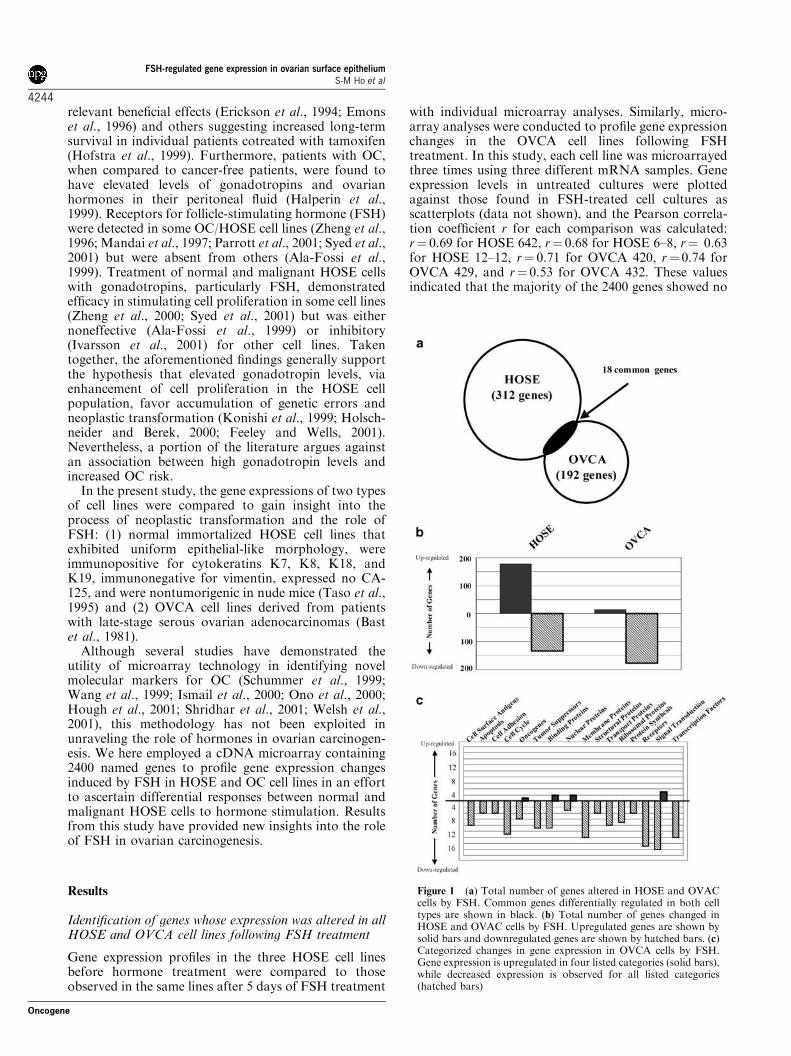
Figure 1 (a) Total number of genes altered in HOSE and OVACcells by FSH. Common genes differentially regulated in both celltypes are shown in black. (b) Total number of genes changed inHOSE and OVAC cells by FSH. Upregulated genes are shown bysolid bars and downregulated genes are shown by hatched bars. (c)Categorized changes in gene expression in OVCA cells by FSH.Gene expression is upregulated in four listed categories (solid bars),while decreased expression is observed for all listed categories(hatched bars)
FSH-regulated gene expression in ovarian surface epitheliumS-M Ho et al
4244
Oncogene

change in their levels of expression following FSHtreatment. However, the sets of genes whose expressionwas altered in all three HOSE cell lines or in all threeOVCA cell lines were identified by t-statistics analyses(Callow et al., 2000). The probability, P-value, for eachgene was also calculated to determine whether differ-ential expression of a gene was due to FSH or torandom or systematic variations. Genes with anabsolute t-score above 2.0 and a P-value below 0.05were considered differentially expressed with statisticalsignificance in HOSE or in OVCA cell lines under theinfluence of FSH.
A total of 312 genes were differentially expressed in allthree immortalized HOSE cell lines after FSH treat-ment, and 192 genes were identified as having beenchanged in all three OVCA cell lines after FSH exposure(Figure 1a). Interestingly, between these two sets ofgenes, only 18 were found in both sets, that is, exhibitedaltered expression in all six cell lines (normal immorta-lized and malignant) following FSH treatment.
Among the 312 genes whose expression changedfollowing FSH treatment of HOSE cell lines, 177 (57%)genes were upregulated, and 135 (43%) genes weredownregulated (Figure 1b). In marked contrast, of the192 genes whose expression was affected by FSH inOVCA cell lines (Figure 1b), only 15 (8%) wereupregulated and 177 (92%) were downregulated. Thegenes that were differentially regulated by FSH in thethree OVCA cell lines could be categorized into 16groups (Figure 1c). They included genes encoding cellsurface antigens, oncogenes, tumor suppressors, bindingproteins, membrane proteins, structural proteins, trans-port proteins, ribosomal proteins, receptors and tran-scription factors, as well as genes involved in apoptosis,
cell adhesion, cell cycle, protein synthesis, and signaltransduction (Figure 1c).
Among the 18 genes whose expression was changedby FSH in all six cell lines, nine genes were found to beregulated in the same manner by the hormone in bothHOSE and OVCA cells, with six genes showingenhanced expression and three exhibiting reducedexpression after FSH treatment (Table 1). Nevertheless,the remaining nine genes showed discordance in FSH-regulated expression between HOSE and OVCA celllines. In almost all cases, FSH stimulated gene expres-sion in HOSE cell lines but caused reduced geneexpression in OVCA cells. The fold-decrease or fold-increase as well as the t- and P -values for these 18 genesare listed in Table 1.
Comparison of gene expression between HOSE andOVCA cell cultures and confirmation of opposite directionof regulation by FSH in normal and malignant cell lines
Our microarray experiments identified a total of ninegenes whose expression was upregulated by FSH inHOSE cell lines but downregulated by the hormone inOVCA cell lines. This set of genes was selected forfurther post hoc analyses by quantitative real-time RT–PCR to (1) determine whether they are differentiallyexpressed between the normal and malignant cell lines,and (2) confirm the discordance in regulation by FSH.The nine genes were those encoding GTPase activat-ing protein (rap1GAP), neogenin, restin, heat shockfactor-2, protein phosphatase inhibitor-2, N-methyl-d-aspartate (NMDA) receptor 2A, ATP-dependent RNAhelicase, carcinoembryonic antigen, and PLSTIRE forserine/threonin protein. Based on whether these genes
Table 1 Differential regulation of FSH-induced genes in normal and malignant ovarian surface epithelial cells
HOSE OVCA
Accession # Gene name Fold t-value-n N-FSH-p Fold t-vlaue-c C-FSH-p
M29540 Carcinoembryonic antigen mRNA (CEA) 3.244716 23.87134 0.009078 0.685282 �35.4734 0.039546U90277 N-methyl-d-aspartate receptor 2A subunit precursor 2.084552 12.57861 0.033058 0.727395 �46.4704 0.035336M65217 Heat shock factor-2 (HSF2) 1.968372 16.23115 0.029065 0.716839 �735.446 0.002384X64838 mRNA for restin 1.889393 11.84889 0.041609 0.7655 �119.786 0.016903U72391 Neogenin 1.866551 33.35391 0.01645 0.623439 �642.155 0.002055X78873 mRNA for inhibitor 2 gene 1.819762 14.46826 0.037478 0.709252 �65.2142 0.024452X66365 mRNA PLSTIRE for serine/threonine protein kinase 1.783692 127.1692 0.004943 0.583924 �23.6557 0.044172M64788 GTPase activating protein (rap1GAP) 1.501961 32.06109 0.028443 0.645275 �26.0102 0.04672AB001636 mRNA for ATP-dependent RNA helicase #46 1.39381 259.7478 0.004817 0.586826 �29.401 0.036687
AF026548 Branched chain alpha-ketoacid dehydrogenase kinase precursor 0.770407 �91.6624 0.022189 0.862499 �169.876 0.020122D38496 mRNA for LZTR-1 0.734898 �57.7585 0.029768 0.639535 �50.1594 0.025552AJ000519 mRNA for ubiquitin-conjugating enzyme UbcH7 0.684834 �28.1945 0.04826 0.663968 �491.969 0.002997U65928 Jun activation domain binding protein 0.624973 �24.6122 0.046704 0.542119 �20.7551 0.045539D56495 mRNA for Reg-related sequence derived peptide-2 0.50544 �501.03 0.002006 0.778689 �433.344 0.005133D79205 mRNA for ribosomal protein L39 0.438198 �387.784 0.002279 0.410904 �173.726 0.004815
Y14736 mRNA for immunoglobulin kappa light chain 6.677026 2.144288 0.036619 1.790089 13.1657 0.042087M23725 M2-type pyruvate kinase 6.479164 3.546475 0.023901 3.595391 3.591517 0.046309X06256 mRNA for fibronectin receptor alpha subunit 2.428838 8.182007 0.037962 1.355123 36.57792 0.03455
This table shows the effect of FSH on gene expression in normal (n) HOSE and malignant (c) OVCA cells. FSH-induced fold increases or decreasesof HOSE and OVCA cells are shown in columns 3 and 6, respectively. t values of FSH-treated normal cells (n) and cancer cells (c) are shown incolumns 4 and 7, respectively. P values of FSH-treated normal cells (n) and cancer cells (c) are shown in columns 5 and 8, respectively
FSH-regulated gene expression in ovarian surface epitheliumS-M Ho et al
4245
Oncogene

are overexpressed, underexpressed, or equally expressedbetween HOSE and OVCA cell lines, we have groupedthem into three groups for data presentation.
Genes encoding GTPase activating protein (rap1GAP),heat shock factor-2, and protein phosphatase inhibitor-2were underexpressed in OVCA cell lines compared toHOSE cell lines, and their regulation by FSH exhibiteddiscordance between HOSE and OVCA cell lines
Real-time RT–PCR demonstrated lower levels ofexpression of genes encoding rap1GAP, heat shockfactor-2, and protein phosphatase inhibitor-2 in OVCAcell lines compared to immortalized normal HOSE celllines (Figure 2). Marked increases in rap1GAP, heatshock factor-2, and protein phosphatase inhibitor-2gene expression were observed in the three HOSE celllines exposed to FSH, while gene expression wasreduced in all OVCA cell lines by FSH, henceconfirming the pattern of gene expression detected bymicroarray analyses. The effects of FSH on theexpression of these three genes were hormone-specific; treatment of HOSE or OVCA cells with thePKA inhibitor H89 abolished the FSH-induced changesin all cases. Exposure of cell lines to PKA inhibitoralone caused no effect on cell proliferation (results notshown).
Genes encoding neogenin and restin were overexpressed inOVCA cell lines compared to HOSE cell lines, and theirregulation by FSH exhibited discordance between HOSEand OVCA cell lines
Post hoc analyses by quantitative real-time RT–PCRdemonstrated higher levels of expression of genesencoding neogenin and restin in OVCA cell linescompared to HOSE cell lines (Figure 3). Significantelevations in neogenin and restin gene expression wereobserved in the three HOSE cell lines exposed to FSH,
Figure 2 Real-time RT–PCR analysis of rap1GAP, heat shockfactor-2, and protein phosphatase inhibitor-2 mRNAs in normalimmortalized HOSE cell lines (HOSE 642, HOSE 6-8, and HOSE 12-12) and OC cell lines (OVCA 420, OVCA 429, and OVCA 432). Cellswere treated as described in Material and methods, with FSH (10�8
m)in the absence (black bar) or presence of PKA inhibitor, H89 (10�5
m,diagonal hatched bar). The control cells were treated with vehicle(open bar). To amplify rap1GAP, the primers used were TGGACT-CAGAGGGAACAAGC (forward) and TGTAGCAGACATGCC-CAGAG (reverse). To amplify heat shock factor-2, the primers usedwere GACCCAGATCTCCTGGTTGA (forward) and CAA-GAAGTCGAAAGGCGGTA (reverse) and for phosphatase inhibi-tor-2 they were ATCTTGGCGACGTATCATCC (forward) andTACTTTGGCTCCAAGCCTTC (reverse). The intensity of PCRproduct was normalized to the intensity of GAPDH and shown inthe figure. The data are shown as a mean of two experiments withtriplicate samples and are represented as mean7s.e.m. Statisticallysignificant FSH-induced decreases/increases in gene expression,compared to non-FSH-treated cells, are indicated by *Po0.05. Astatistically significant (Po0.05) difference between untreated normalHOSE cells and untreated OVCA cells is indicated by T. C, control;FSH, follicle stimulating hormone; FSH+B, follicle-stimulatinghormone+blocker of PKA
"
FSH-regulated gene expression in ovarian surface epitheliumS-M Ho et al
4246
Oncogene

while expressions of both genes were reduced in OVCAcell lines by FSH exposure (Figure 3). The real-timeRT–PCR findings confirmed the pattern of geneexpression detected by microarray analyses. The effectsof FSH on HOSE and OVCA cell lines were specific;cotreatment of cell cultures with H89 abolished the
FSH-induced alteration in gene expression (Figure 3).PKA inhibitor alone exerted no effect on cell prolifera-tion in these cell lines (results not shown).
Genes encoding NMDA receptor 2A and ATP-dependentATP helicase were expressed at comparable levels inHOSE and OVCA cell lines, and their regulation by FSHshowed discordance between HOSE and OVCA cell lines
No significant differences were found in basal expressionlevels of NMDA receptor 2 (Figure 4), ATP-dependent
Figure 3 Real-time RT–PCR analysis of neogenin and restinmRNAs in normal immortalized HOSE cell lines (HOSE642, HOSE 6-8, and HOSE 12-12) and OC cell lines (OVCA 420,OVCA 429, and OVCA 432). Cells were treated with FSH(10�8
m) in the absence (black bar) or presence of PKA inhibitorH89 (10�5
m, diagonal hatched bar). The control cells were treatedvehicle (open bar). To amplify neogenin, the primers used wereAAACCAACATCCCAGCAAAC (forward) and AGTCA-CATCCTTGGGTGGAG (reverse), and for restin the forwardprimer was TGCTGGACACAGAGGACAAG and the reverseprimer was TGCATTTGTTTGCTTGGTGT. The intensity ofPCR product was normalized to the intensity of GAPDH andshown in the figure. The data are shown as a mean of twoexperiments with triplicate samples and are represented asmean7s.e.m. Statistically significant FSH-induced decreases/in-creases in gene expression, compared to non-FSH-treated cells, areindicated by *Po0.05. A statistically significant (Po 0.05)difference between untreated normal HOSE cells and untreatedOVCA cells is indicated by T. C, control; FSH, follicle-stimulatinghormone; FSH+B, follicle-stimulating hormone+blockerof PKA
Figure 4 Real-time RT–PCR analysis of N-methyl-d-aspartatereceptor-2 and ATP-dependent RNA helicase mRNAs in normalimmortalized HOSE cell lines (HOSE 642, HOSE 6–8, and HOSE12-12) and OC cell lines (OVCA 420, OVCA 429, and OVCA 432).Cells were treated with FSH (10�8
m) in the absence (black bar)or presence of PKA inhibitor H89 (10�5
m, diagonal hatched bar).The control cells were treated vehicle (open bar). The primersfor amplification of N-methyl-d-aspartate receptor-2 wereGGTCTGGAGGACAGCAAGAG (forward) and GGACAG-TACGATGCCGTTGA (reverse), and for ATP-dependent RNAhelicase the primers were GTCTTCAGCTCCCTGTTTGG (for-ward) and ACTCATTGCAGCCACTCTCC (reverse). The inten-sity of PCR product was normalized to the intensity of GAPDHand shown in the figure. The data are shown as a mean of twoexperiments with triplicate samples and are represented as mean7s.e.m. Statistically significant FSH-induced decreases/increases ingene expression, compared to non-FSH-treated cells, are indicatedby *Po0.05. Differences between untreated normal HOSE cellsand untreated OVCA cells that are not statistically significant aredenoted by NS. C, control; FSH, follicle-stimulating hormone;FSH+B, follicle-stimulating hormone+blocker of PKA
FSH-regulated gene expression in ovarian surface epitheliumS-M Ho et al
4247
Oncogene

RNA helicase (Figure 4), carcinoembryonic antigen (notshown), and PLSTIRE for serine/threonin protein (notshown) mRNAs between normal immortalized HOSEand OVCA cells. Messenger RNA expression levels ofNMDA receptor 2A (Figure 4) and ATP-dependentRNA helicase (Figure 4) were elevated in HOSE celllines following FSH treatment, whereas significantdecreases in their expression were observed inOVCA cell lines following FSH exposure (Figure 4).The PKA inhibitor H89 blocked the FSH-inducedalterations in NMDA receptor-2 and ATP-dependentRNA helicase gene expression in both HOSE andOVCA cell lines.
However, we were unable to demonstrate differentialexpression of carcinoembryonic antigen or PLSTIREfor serine/threonin protein gene expression after treat-ment of HOSE or OVCA cells with FSH or FSH plusH89 (data not shown). Therefore, the differentialexpression detected by the microarray analyses for thesetwo genes might represent false-positive results ofmicroarray analyses.
Antisense ODN-mediated downregulation of neogenin andrestin mRNA levels are associated with reduced cellgrowth in OVCA cell lines, but not in HOSE cell lines
HOSE and OVCA cell lines were exposed to gene-specific sense and antisense ODNs for neogenin, restin,and rap1GAP. Transcription of all three genes wasdownregulated in a dose-dependent manner in HOSEand OVCA cell lines exposed to their respectiveantisense ODNs (Figure 5a, b), while exposure of celllines to the corresponding sense+antisense ODNmixtures produced no effects. In parallel, OVCA celllines treated with antisense ODNs for neogenin orrestin, but not for rap1GAP, exhibited a marked dose-dependent reduction in cell growth as measured bydirect cell counts, MTS assay (Figure 5d), and PCNAmRNA expression (Figure 6a), when compared to cellcultures either not exposed to ODNs or to a combina-tion of sense+antisense ODNs. In contrast to responsesobserved in OVCA cell lines, exposure of HOSE celllines to antisense and combined sense+antisense ODNsof neogenin, restin, and rap1GAP caused no reductionin cell growth (Figure 5c). In order to provide evidence
that the decreased numbers of cells in antisense-treatedOVCA cell lines were because of induction of apoptosis,caspase 3 activity was measured (Figure 6b). Treatmentof OVCA cell lines with antisense ODNs of restin orneogenin resulted in significant, dose-dependent in-creases in caspase 3 activity; no effects were producedby treatment with sense+antisense ODNs (Figure 6b).Treatment of OVCA cell cultures with antisense orsense+antisense ODNs of rap1GAP induced nochanges in either cell number (Figure 6a) or caspase 3activity in OVCA cell lines (data not shown).
Since antisense ODNs to rap1GAP produced noreduction in cell number in OVCA cell cultures, weperformed a Matrigel Invasion Assay to test whether itmight affect cell migration properties in these cell lines.OVCA cell lines treated with antisense ODNs ofrap1GAP showed no discernable differences in theirmigration efficiencies through Matrigel.
Discussion
In the present study, we used cDNA expression arrayanalysis to identify FSH-regulated genes in threeimmortalized normal HOSE cell lines and in threeOVCA cell lines. One major challenge facing cDNAmicroarray studies is the appropriate use of algorithmsin analysing results. Many studies used two- or three-fold up- or downregulation as arbitrary cutoffs toidentify genes of interest (Lee et al., 1999, 2001; Caoet al., 2001). The major drawback of this approach isthat genes that exhibited changes of less than 200–300%would not be recognized as differentially expressed. Theapproach presents a bias towards genes with higherdegrees of differential expression and will miss genesthat show consistent but smaller degrees of changes.Other published studies used pairwise comparisons offold changes to set cutoffs (Lee et al., 1999, 2001; Caoet al., 2001). This statistical method provides somestatistic power but has limitations related to its inabilityto take into consideration variations among thereplicates. The t-statistics used in this study is a morerobust algorithm that takes into consideration indivi-dual variations of the repeats (Callow et al., 2000).
Figure 5 Effect of antisense ODNs of neogenin, restin, and rap1GAP on growth and mRNA expression of HOSE and OVCA cells. CulturedHOSE and OVCA cells treated with LipofectAMINE PLUS alone (control), sense and antisense ODNs (5mm sense+5mm antisense), or differentconcentrations of ODNs (1.25, 2.5 and 5 mm) for 48 h. (a) Dose-dependent effect of neogenin, restin, and rap1GAP antisense treatment on HOSEcells expression of neogenin, restin, and rap1GAP mRNA. LipofectAMINE PLUS alone (control), sense and antisense ODNs (5mm sense+5mmantisense), or different concentrations of ODNs (1.25, 2.5, and 5 mm). (b) Dose-dependent effect of neogenin, restin, and rap1GAP antisensetreatment on OVCA cells expression of neogenin, restin, and rap1GAP mRNA. LipofectAMINE PLUS alone (control), sense and antisense ODNs(5mm sense+5mm antisense), or different concentrations of ODNs (1.25, 2.5, and 5mm). (c) Cell growth was quantified by MTS assay. Sequence-specific, dose-dependent effect of neogenin, restin, and rap1GAP antisense treatment on HOSE (HOSE 642, HOSE 6-8, and HOSE 12-12) cellgrowth. Control (LipofectAMINE PLUS alone), sense and antisense ODNs (5 mm sense+5mm antisense), or different concentrations of ODNs(1.25, 2.5, and 5 mm). Results represent mean7s.e.m. of triplicate samples, expressed as a percentage of cells treated with LipofectAMINE PLUSalone. (d) Sequence-specific, dose-dependent effect of neogenin, restin, and rap1GAP antisense treatment on OVCA (OVCA 420, OVCA 429, andOVCA 432) cell growth. Control (LipofectAMINE PLUS alone), sense and antisense ODNs (5mm sense+5mm antisense), or differentconcentrations of ODNs (1.25, 2.5, and 5 mm). Statistically significant decreases in gene expression/cell growth compared to that seen in control cellsare indicated by *Po0.05. Results represent mean7s.e.m. of triplicate samples, expressed as a percentage of cells treated with LipofectAMINEPLUS alone
"
FSH-regulated gene expression in ovarian surface epitheliumS-M Ho et al
4248
Oncogene

FSH-regulated gene expression in ovarian surface epitheliumS-M Ho et al
4249
Oncogene

Using this approach, we were able to identify con-fidently gene expression changes smaller than onefold.
The principal finding of this investigation was that thegonadotropin apparently regulated one set of genes(total¼ 312) in the HOSE cell lines and an almostentirely different set of genes (total¼ 192) in the OVCAcell lines. It is also worth mentioning that only 18 geneswere common to both gene sets. These findings stronglysuggest that FSH exerts very different biological effectson normal HOSE cells than it does on OC cells. Amongthe 312 genes affected by FSH in the three HOSE celllines, nearly half were upregulated and the other halfdownregulated. In sharp contrast, FSH caused down-regulation of about 92% of the 194 genes affected by thehormone in the OVCA cell lines. Furthermore, it was ofinterest that most of the genes reported to be affected byFSH in our study have never been identified as FSH-
regulated genes in the past. Between the two sets, only18 genes were commonly affected by FSH in all six(three HOSE and three OVCA) cell lines, and they fellinto two categories. The first category contains ninegenes whose expression was up- or downregulated byFSH in the same direction between HOSE and OVCAcell lines. We believe these genes are normally underFSH regulation and may have less relevance to ovariancarcinogenesis. In contrast, the other category of genes,whose expression exhibited the opposite direction ofchange, dependent on whether the cell type beingchallenged by FSH was normal or malignant, may havehigh significance to ovarian carcinogenesis. For thisreason, we have focused our post hoc analyses only onthe second category of genes in an attempt todemonstrate definitively the discordance in FSH regula-tion between normal and malignant HOSE cell lines.
Figure 6 Expression of cell proliferation marker PCNA and apoptosis marker caspase 3 in OVCA cell lines. (a) Dose-dependent effectof neogenin, restin, and rap1GAP antisense treatment on OVCA cells PCNA mRNA expression. The primers for amplification ofPCNA were GGCGTGAACCTCACCAGTAT (forward) and TCTCCCATATCCGCAATTTT (reverse). LipofectAMINE PLUSalone (control), sense and antisense ODNs (5mm sense+5mm antisense), or different concentrations of ODNs (1.25, 2.5, and 5mm). (b)Dose-dependent effect of neogenin and restin antisense treatment on OVCA cells caspase 3 activities. Enzyme activities of cell lysatestoward tetrapeptide caspase substrate DEVD-pNA in OVCA (OVCA 420, OVCA 429, and OVCA 432) are shown in the figure. Thecaspase activity is expressed as fold to untreated controls and is represented as the means of two experiments performed in triplicate.Error bars represent the mean7s.e.m. LipofectAMINE PLUS alone (control), sense and antisense ODNs (5mm sense+5mmantisense), or different concentrations of ODNs (1.25, 2.5, and 5 mm). Statistically significant changes in gene expression/caspaseactivity compared to that seen in control cells are indicated by *Po0.05
FSH-regulated gene expression in ovarian surface epitheliumS-M Ho et al
4250
Oncogene
One of the nine genes upregulated by FSH in HOSEcells but downregulated by the hormone in OVCA cellsis rap1GAP, a purported tumor suppressor gene(Tsukamoto et al., 1999). It is a member of the RASfamily of small GTPase and is mapped to chromosomalregion 1p36.1–35. rap1GAP has been shown to beactivated by cAMP and phosphataselipase C pathwaysand is likely to be associated with adhesion, cellulargrowth, and/or differentiation (Altschuler et al., 1995;Vossler et al., 1997; Tsukamoto et al., 1999). Wedemonstrated a loss of expression of this putative tumorsuppressor in OVCA cells when compared to HOSEcells. These results are in accordance with the premisethat rap1Gap is a tumor suppressor in OC cells.Furthermore, the reduction of rap1GAP mRNA ex-pression in OVCA cell lines exposed to FSH agrees withthe hypothesis that FSH is a risk factor for OC.Intriguingly, we found marked upregulation of rap1-GAP expression in HOSE cell lines following FSHexposure. Since rap1GAP is required for the adherenceand spreading of cells (Wani et al., 1997), it is logical tospeculate that after ovulation, the normal ovariansurface epithelium rapidly initiates the wound-healingprocess, which may involve FSH-induced upregulationof rap1GAP. The fact that antisense ODN againstrap1GAP has no effect on the growth of HOSE orOVCA cells agrees with the known function ofrap1GAP: that this molecule controls cell motility andfocal adhesions rather than cell proliferation (Itoh et al.,1999). However, since antisense ODN to rap1GAPshowed no effect on OVCA cell migration throughMatrigel, it remains to be determined whether thisputative tumor suppressor gene may have effects otherthan regulation of cell proliferation and migration inthese OC cell lines. We have preliminary data to showthat rap1GAP may affect invasiveness of SKOV3, amore aggressive OC cell line.
Another gene that is underexpressed in OVCA cellswhen compared to HOSE cells is heat shock factor-2. Itsexpression is stimulated by FSH in HOSE cells butinhibited in OVCA cells. It has been shown thatexposure of cells to stresses such as heat shock andoxidative injuries causes an imbalance in proteinmetabolism, to which the cells respond by co-expressinga family of heat shock factors (HSF1, HSF2, HSF3, andHSF4). Unlike other HSFs, HSF-2 is not activated inresponse to heat or most other forms of cellular stresses(Marimoto et al., 1994) but is activated when theubiquitin–proteasome pathway is inhibited (Mathewet al., 1998). The downstream effect of HSF-2 is theinduction of an array of heat shock genes that protectthe integrity of the protein synthesis, folding, assembly,and degradation machinery (Marimoto et al., 1994).Members of the heat shock protein family have beenimplicated in cancer (Fuqua et al., 1994; Conroy andLatchman, 1996). The FSH-induced upregulation ofheat shock factor-2 in normal HOSE cells may again berelated to the wound-healing process after ovulation.However, in contrast, heat shock factor-2 expression isdiminished in OVCA cells and further downregulated byFSH exposure. Reduction in its expression would
undoubtedly diminish the potential for OVCA cells tomaintain protein fidelity during environmental orphysiological stress. Further reduction in its expressionby FSH likely exacerbates the adverse situation.Together, these may form an epigenetic basis of tumorprogression.
Similar to rap1GAP and heat shock factor-2, proteinphosphatase inhibitor-2 is underexpressed in OVCA celllines compared to HOSE cell lines. FSH stimulated itsexpression in HOSE cells but inhibited expression inOVCA cells. Many physiological processes in mamma-lian cells are controlled by reversible protein phosphor-ylation, which is maintained by a rapid and preciseregulation of the activities of various kinases andphosphatases (Oliver and Shenolikar, 1998). The activa-tion of kinases is coordinated within the cell by theinhibition of phosphatases via phosphatase inhibitors(Oliver and Shenolikar, 1998). In vitro studies suggestedthat inhibitor-2 inhibits protein phosphatase activityand promotes a rapid and effective refolding of protein,yielding an active enzyme (Oliver and Shenolikar, 1998).In normal HOSE cells, FSH serves as a potentstimulator of inhibitor-2, which may be required duringovulation or postovulation HOSE cell function. On theother hand, a strong link between protein phosphataseinhibitor-2 and tumorigenesis and/or viral transforma-tion of cells has been suggested (Cohen, 1989; Wera andHemmings, 1994). In undifferentiated leukemias, phos-phatase inhibitor-2 has been demonstrated to inhibitprotein phosphatase–2 and accounts for enhancedgrowth of leukemic cells (Li et al., 1996). In our study,OVCA cell lines appeared to express lower levels ofphosphatase inhibitor-2, which was further diminishedby FSH. Thus, OVCA cells may have higher growthpotentials that could be further enhanced by FSH-mediated downregulation of protein phosphatase in-hibitor-2.
NMDA receptor belongs to the family of ionotropicglutamate receptors. The NMDA receptor activationoccurs when either glutamate (Glu) or NMDA andglycine (Gly) bind to the receptor molecule. A channelwithin the receptor complex enables molecules to crossthe cell membrane and is blocked by magnesium (Mg).When Mg is removed from the channel and the receptoris activated, calcium (Ca2+) and sodium (Na+) ionsenter the cell and potassium ions (K+) leave. Thisreceptor mediates alterations in intracellular calciumlevels and thereby regulates a variety of signalingpathways, ranging from localized acute effects onreceptor channel activities to long-term effects on genetranscription. A study has also established a linkbetween downregulation of the NMDA receptor andneoplasm of the brain (Markert et al., 2001). In ourstudy, no significant differences in basal expressionlevels of the NMDA receptor mRNA expression wereobserved among the various HOSE and OVCA celllines. However, the nonmalignant and malignant celllines exhibited opposite responses to FSH with regard toNMDA receptor expression, which was upregulated inHOSE cells and downregulated in OVCA cells. Theprecise biological significance of the differential response
FSH-regulated gene expression in ovarian surface epitheliumS-M Ho et al
4251
Oncogene

is unclear. Wang et al. (2000) suggest that upregulationof NMDA receptors in neurons may increase apoptosis.It remains to be ascertained whether FSH-inducedreduction in NMDA receptor expression in OVCA cellsmay affect cell survival by altering recognition toapoptotic-inducing signals.
RNA helicases are present in all organisms, and over100 such proteins are reported in sequence database.They can unwind short duplex RNAs in an ATP-dependent manner (Schmid and Linder, 1992; Fuller-Pace, 1994; Venema et al., 1997). ATP-dependenthelicases are implicated in pre-mRNA splicing, riboso-mal biogensis, RNA export from the nucleus, transla-tion initiation, and mRNA decay (Fuller-Pace, 1994;Venema et al., 1997). In the process of ribosomalbiogenesis, RNA helicases play a crucial role both instructural rearrangements and as directional forcesduring the process, contributing significantly to theefficiency, accuracy, and fidelity of cellular processes.The present study revealed no differences in ATP-dependent RNA helicase expression between normalHOSE and OVCA cells; however, FSH reduced theexpression of ATP-dependent RNA helicase in OVCAcells and enhanced expression of this gene in HOSEcells. The biological significance of this difference in theprocess of ovarian carcinogenesis remains to be resolvedby future studies.
Lastly, two genes, restin and neogenin, were found tobe overexpressed in OVCA cells when compared toHOSE cells. Again, expression of these two genes isupregulated in HOSE cells and downregulated in OVCAcells following FSH treatment. Neogenin is mapped tochromosome 15 in the band 15q22.3–q23 and encodes a1461-amino-acid protein with 50% amino-acid identityto the human tumor suppressor molecule deleted incolon cancer (DCC) (Vielmetter et al., 1994; Meyerhardtet al., 1997). Neogenin is believed to be involved in tissuegrowth regulation, cell–cell recognition, cellular transi-tion from proliferation to terminal differentiation, andcell migration (Vielmetter et al., 1994). Althoughneogenin expression has been detected in many adulttissues, there is no information about the status ofneogenin expression in the human ovary. Neogenin ispresent in tissues where active growth takes place, andoverexpression of neogenin has been observed in a widevariety of human cancers such as breast, pancreas,brain, cervix, colon, and rectum (Vielmetter et al., 1994;Meyerhardt et al., 1997). Our finding that neogenin isupregulated in OVCA cells is in agreement with otherstudies suggesting that it plays a role in cell proliferation(Vielmetter et al., 1994; Meyerhardt et al., 1997).However, we here report for the first time that down-regulation of neogenin expression by an antisense ODNstrategy induces dramatic apoptosis in OVCA cellculture, suggesting that neogenin protein is necessaryfor the survival of OC cells. Collectively, our datademonstrate that normal HOSE does not requireneogenin for proliferation/survival but that OC cellsdo. This functional dichotomy of neogenin betweennormal and malignant HOSE cells could be a result ofchanges brought about during neoplastic transforma-
tion of normal HOSE cells to malignant OVCA cells. Innormal HOSE cells it appears that neogenin hasfunctions other than cell proliferation/survival, sinceits expression is upregulated by FSH. Neogenin mayserve as a tumor promoter in cancer cells by increasingcell proliferation/survival but, interestingly, its expres-sion is downregulated by FSH. The later observationsupports a part of epidemiological data implicating FSHas a protective agent against ovarian cancer.
Restin, a 160-kDa protein possessing features char-acteristic of intermediate filament protein, is mapped tochromosomal region 12q24.31–q24.33 (Hilliker et al.,1994). It facilitates the microtubule-dependent transportof endosomal vesicles (Poerre et al., 1992; Rickard andKreis, 1996). It has also been localized to prometaphasekinetochores and appears to play a role in correctspindle assembly and normal chromosomal segregation(Dujardin et al., 1998). It is overexpressed in malignantcells of Hodgkin’s disease and large-cell lymphoma(Bilbe et al., 1992; Hilliker et al., 1994), consistent withour finding of higher expression of restin in OVCA cellscompared to normal HOSE cells. FSH induces upregu-lation of restin in HOSE cells, which may disrupt spindleassembly and chromosomal segregation, leading togenetic instability. In this regard, the hormone maypromote neoplastic transformation of normal ovarianepithelial cells. Moreover, as shown in the present study,restin is overexpressed in OVCA cells as compared withHOSE cells. The ramification of restin overexpression inOVCA cells is currently unknown, but our results clearlyshow that it promotes cell proliferation/survival in amanner similar to neogenin. Ironically, FSH has beenshown to downregulate restin expression specifically inOVCA cells. If this scenario holds true for OCs, it wouldsupport a protective role of FSH by downregulating cellgrowth-promoting factors in ovarian noeplasms. Inshort, similar to neogenin, restin appears to play adifferent role in normal HOSE cells than it does incancerous OVCA cells. Likewise, its upregulation byFSH in HOSE cells and inhibition by the hormone inOVCA may explain some of the controversial claims inthe literature that FSH both promotes and protectsagainst ovarian carcinogenesis.
One of the most interesting findings of this study isthat FSH downregulates about 92% of the genes inOVCA cells and either upregulates or downregulatesabout 50% of the genes in HOSE cells. (The completegene list is available at http://users.umassmed.edu/Shuk-mei.ho.) The precise mechanism by which FSH regulatesan almost completely different set of genes followingcellular transformation is unclear. However, severalscenarios have been proposed. FSH binds to specific G-protein-coupled receptor and stimulates adenylate cy-clase to produce cAMP. The activation of cAMPprotein kinase PKA results in phosphorylation ofcertain transcription factors, which bind to cAMPresponsive elements (CRE) to induce or repress theexpression of FSH-responsive genes (Mukherjee et al.,1998). These cAMP responsive factors, cAMP bindingprotein (CREB), and CRE-modulatory protein(CREM) can act as cAMP-regulated stimulators or
FSH-regulated gene expression in ovarian surface epitheliumS-M Ho et al
4252
Oncogene

repressors of gene transcription. Inducible cAMP earlyrepressor (ICER, a member of the CREM family) is apowerful repressor of cAMP-mediated transactivation(Sassone-Corsi, 1998). Aberrant expression of CREBand/or ICER may explain why FSH would regulatecompletely different sets of genes in a negative mannerin cancer cells.
Although the present study identified FSH-regulatedgenes in HOSE or OVCA cell lines, and a specific PKAinhibitor was shown to block the expression of identifiedgenes, it remains possible that some of these genes areregulated by FSH only indirectly. This possibilitysprings from the fact that gene profiling was conductedafter cell cultures were treated for 5 days with FSH.During this relatively long period of treatment, manysecondary events could have occurred, making it likelythat a number of differentially expressed genes may bethe results of downstream effects of the hormonaltreatment.
Finally, it is of significance that we here report FSH-induced downregulation of a plethora of genes that arevital for cell functions, such as those that are involved inRNA metabolism, regulation of intracellular calciumsignaling, synthesis, phosphorylation, folding and de-gradation of proteins, protection against harmfulphysiological stresses, and recognition of apoptoticsignals, as well as those exhibiting tumor suppressor oroncogenic functions. To our knowledge, none of thegenes for which we found downregulation by FSH havebeen previously reported in normal or malignant humanovarian epithelial cells, and no information is availableregarding their regulation by FSH. Microarray hasproven to be an effective tool for the discovery of newgenes regulated by a specific hormone and for discoveryof new genes involved in carcinogenesis and tumorprogression. Hence, findings from this study are the firstto corroborate FSH as an important regulator of OVCAcell functions and suggest that FSH may be a modulatorfor ovarian cancer progression, since the hormone‘switches’ its regulation to a new set of genes notnormally under its influence in normal HOSE cells.
Materials and methods
Cell cultures and cell lines
The origin and culture conditions of HOSE and OVCA celllines have been previously described (Lau et al., 1999; Rauh-Adelmann et al., 2000; Syed et al., 2001; Syed et al., 2002). Inshort, three HOSE cell lines, HOSE 642, HOSE 6-8, andHOSE 12-12, were derived from normal ovaries obtained fromwomen with noncancer gynecologic indications, specifically, a46-year-old normal individual, a 48-year-old patient withovarian inclusion cyst in one of the ovaries, and a 39-year-oldpatient with ovarian stromal hyperplasia, respectively. Primarycultures were established from surface scrapings of thesenormal ovaries and immortalized with human papillomavirusE6 and E7 (Tsao et al., 1995). The immortalized cell linesexhibited uniform epithelial-like morphology; immunopositiv-ity for cytokeratins K7, K8, K18, and K19, and immunone-gativity for vimentin. The immortalized HOSE cell lines wereshown to be nontumorigenic in nude mice and expressed no
CA-125 (Taso et al., 1995). OVCA 420, OVCA 429, andOVCA 432 were established cell lines derived from patientswith late-stage serous ovarian adenocarcinomas, as describedby Bast et al. (1981). These cell lines were cultured at 371C in ahumidified atmosphere of 5% CO2/95% air in a 1 : 1 mixtureof medium 199/MCDB 105 (Sigma, St Louis, MO, USA)supplemented with 10% heat-inactivated fetal bovine serum(FBS; Sigma), penicillin (100U/ml; Sigma), and streptomycin(100 mg/ml; Sigma).
Hormone treatment of HOSE and OVCA cell lines
Cell lines cultured in medium 199/MCDB 105 were harvestedwhen 80% confluent and washed in phosphate-buffered saline(PBS), then 2 x10⁵ cells were seeded per T-25 flask (Falcon,Becton Dickinson Labware, Bedford, MA, USA culturearea¼ 25 cm2) and allowed to attach for 24 h. After 48 h, later,medium was replaced with medium 199/MCDB 105 containingcharcoal-stripped FBS supplemented with 10�6
m FSH (Cal-biochem, San Diego, CA, USA) (treated) or aqueous salinevehicle (untreated). Cell cultures were subsequently treateddaily for 5 days with and without the hormone. The treatmenttime was chosen based on our previous study (Syed et al.,2001), in which maximum proliferation of HOSE and OVCAcells was achieved after 5 days treatment of cells with FSH. Atthe end of the treatment period, cells were harvested fromFSH-treated and untreated cultures for total RNA isolation.RNA preparations from this set of cultures were used forcDNA microarray analyses.
For post hoc real-time RT–PCR analyses, a separate set ofcultures was exposed to 10�8
m FSH in the presence or absenceof a protein kinase A (PKA) inhibitor. A dose of 10�8
m of thehormone was chosen because it fell at the midpoint of thedose-response curves previously reported for FSH-induced cellproliferation for these cell lines (Syed et al., 2001). The proteinkinase A selective inhibitor H-89 (N-[2-((p-bromocinnaml)a-mino)ethyl]-5-isoquinolinesulfonamide), HCl (Calbiochem),with an inhibition constant of 0.048 mm, was added at a finalconcentration of 10�5 M to half of the cultures 30 min beforetreatment with 10�8
m FSH. We have previously demonstratedthat H-89 at this concentration effectively blocked the actionof FSH and LH in HOSE/OVCA cells (Syed et al., 2001). After5 days of daily treatment with FSH with or without H-89, cellswere collected and total RNA was extracted. This experimentwas repeated twice.
RNA isolation and microarray experiments
Total RNA was isolated from FSH-treated and untreatedcultures using the TRI reagent (Sigma) according to themanufacturer’s protocol. RNA integrity was validated accord-ing to previously described protocols (Syed et al., 2001, 2002).The MICROMAXt Tyramide Signal Amplification (TSA)labeling and detection kit (NEN, Life Science Products, Inc.,Boston, MA, USA) was used according to the protocolprovided by the manufacturer. The TSA labeling protocol waschosen because it is a posthybridization amplification systemthat the permits detection of differential transcript expressionin samples with relatively small amounts of total RNA. Briefly,4 mg of total RNA from the untreated and FSH-treated HOSE/OVCA cell lines was subjected to cDNA synthesis usingbiotinylated and fluorescein (FL)-labeled nucleotides, respec-tively. Equal quantities of two cDNA probes were mixed andhybridized on a cDNAs microarray slide in a Corningmicroarray hybridization chamber (Corning Inc., Corning,NY, USA) at 651C overnight. The hybridized slides werewashed under stringent conditions. The FL-labeled probes on
FSH-regulated gene expression in ovarian surface epitheliumS-M Ho et al
4253
Oncogene

the slide were recognized by an anti-FL antibody that wasconjugated to horseradish peroxidase (HRP). The enzymecatalyzed the deposition of cyanine 3 (Cy3)-labeled tyramideon the labeled cDNA. After the inactivation of residual HRPfrom the first reaction, streptavidin-linked HRP was used todeposit Cyanine 5 (Cy5) tyramide to the biotin-labeled cDNAprobe on the slide. The slides were washed extensively and air-dried. The hybridized microarray slides were scanned using aScanArrayt confocal laser scanner (GSI Lumonics, Inc.,Watertown, CA, USA) at 10 mm pixel resolution for Cy3 andCy5 signal detection. ImaGene analysis software (BioDiscov-ery, Inc., Los Angeles, CA, USA) was used to quantify Cy3and Cy5 signals on each spot. For each spot, the averageintensity of all pixels within intensity values falling in the rangeof 50–95% of maximal intensity was calculated (the ‘signalintensity’). The ‘background signal’ was calculated from theaverage intensity of pixels within 5–15% of maximal intensityin the background ring immediately outside the spot of intereston the cDNA microarray. The ‘corrected signal intensity’ foreach spot is calculated as the ‘signal intensity’ minus the‘background signal’. The complete list of the 2400 genes thatwere spotted as cDNAs on the MICROMAX microarrayt canbe found at http://www.nen.com/products/gene-list5.txt.
Identification of differentially expressed genes using t-statistics
Before data from the same slide or from different slides couldbe compared, it was necessary to normalize the data (i.e.,remove or adjust for intrinsic and extrinsic variations) (Yanget al., 2000). For within-slide normalization, the global mediannormalization method was used in this study. It assumes thatthe red and green intensities are related by a constant factor,that is, R¼ kG, and the center of the distribution of log ratiosis shifted to zero: thus
log 2R=G ! log 2R=G � c ¼ log 2R=ðkGÞ
For normalization of a particular gene set, we used the medianof the intensity log ratios M as the location parameterc¼ log 2k. After within-slide normalization, all normalizedlog ratios were centered around zero. In order to compareexpression levels across different slides, we applied the samenormalization principles used for within-slide normalization.In this study, we chose to use all genes for normalizationinstead of using the microarray housekeeping gene pool fornormalization because, as elaborated by Yang et al. (2000),this approach offers the most stability in terms of estimatingspace- and intensity-dependent trends in the log ratios.
Differentially expressed FSH-regulated genes were thenidentified by computing two-sample Welch t-statistics aspreviously described (Callow et al., 2000). Briefly, the normal-ized DNA microarray data of gene expression profiles foruntreated (n1¼ 3) and FSH-treated HOSE/OVCA cells (n2¼ 3)were presented as a matrix in which columns correspond to n1
and n2 and rows correspond to 2400 genes (cDNA spots on theMICROMAXt microarray slide). Null hypothesis Hj of equalmean expression of untreated and FSH-treated HOSE/OVCAcells for gene j (j¼ 1, 2, 3,y, 2400) was tested. For gene j, thet-value was calculated as follows:
tj ¼w1j � w2jffiffiffiffiffiffiffiffiffiffiffiffiffiffiffiffiffiffiffiffiffiffiffiffiffiffiffiffiffiffi
s21j=n1 þ s2
2j=n2
q
where w1j and w2j denote the mean expression of gene j inuntreated (n1) and FSH-treated (n2) HOSE/OVCA cells lines,respectively. The s2
1j and s22j denote the variances of gene j in
untreated and FSH-treated HOSE/OVCA cell lines, respec-
tively. The t-value for each gene was calculated; a largeabsolute t-value suggests that the corresponding gene showspotentially significant differences in expression levels betweenthe untreated cell lines and the FSH-treated cell lines. Evidenceagainst the null hypothesis (the P-value) for each gene was alsoobtained. Genes with an absolute t-value>2 and a P-valueo0.05 were recognized as genes whose expression wassignificantly altered by FSH in all three cell lines of the group(HOSE or OVCA).
Post hoc analyses using real-time RT–PCR quantification ofmRNA expression levels
After DNase I treatment, 1mg of total RNA preparationobtained from a HOSE or OVCA cell line, treated with FSHor untreated, was used to generate the cDNA. To quantify anddemonstrate the integrity of the isolated RNA, real-time RT–PCR analysis of glyceraldehyde-3-phosphate dehydrogenase(GAPDH) was carried out using mRNA-specific primers. TheSYBER Green-iCycler (BioRad, Hercules, CA, USA) detec-tion system was used to assess, via real-time RNA-PCR, theamount of targeted transcript present in each sample. Briefly,2ml of cDNA derived from reverse transcription of a RNAsample was amplified in triplicate in a 25 ml reaction mixturecontaining 12.5ml of 2� SYBER Green Master Mix and10 pmol of each primer. Each PCR reaction was optimized toensure that a single PCR product of the appropriate size (50–200 bp) was amplified and that no products corresponding togenomic DNA amplification or primer–dimer pairs werepresent. The following PCR cycling conditions were performedfor the generation of all amplimers: 10min at 951C, 50 cyclesfor 951C for 1 min, 601C for 1min, and 721C for 1min. PCRsfor all templates were performed in triplicate in a 96-well plateformat, along with positive and negative controls as well as acalibrator sample. The data shown are averages of twoseparate experiments with triplicate real-time RNA–PCRperformed on each sample and are represented as means7s.e.m.s.
Transfection of HOSE/OVCA cells with gene-specific antisenseoligonucleotides (ODNs)
Phosphothioate-modified antisense oligonucleotides (ODNs)for rap1GAP, neogenin, and restin were designed to havecomplementary binding to the translation start sites of thetargeted mRNAs (antisense and sense ODNs for each mRNAfrom MWG Biotech, High Point, NC, USA). The sequenceand the modified bases were as follows: rap1GAP antisenseODN is 50-G*C*A*TCTTCT CAATCAT*C*T *C-30 andsense ODN is 50-G*A*G*ATGATTGAGA*T*G*C-30, neo-genin antisense ODN is 50-G*C*C*ATCTCTTCCCCG*A*-G*A-30 and sense ODN is 50-T*C*T* CGG GGA AGAGAT* G*G*C-30, and restin antisense ODN is 50-G*G*C*TTT AGC ATA CTC A*T*T*T-30 and sense ODN is 50-A*A*A* TGA GTA TGC TAA A*G*C*C-30. LyophilizedODNs were reconstituted in sterile distilled water and stored at�201C. The uptake of phosphothioate ODNs by cells wasfacilitated using LipofectAMINE PLUS (Life Technologies,Inc, Rockville, MD, USA). Approximately, 60–80% confluentcells were transfected with antisense or sense ODNs (1.25, 2.5,and 5mm) in serum-free medium for 3 h at 371C, incubatedwith complete medium for 24 h, and treatment was repeatedonce before termination of cultures for RNA extraction. Foreach ODN, triplicate cultures were transfected for each of thethree doses. Cell proliferation was measured either bycytometer counting or by spectrophotometry. In some cases,the cells were harvested by scraping, washed with PBS, pelleted
FSH-regulated gene expression in ovarian surface epitheliumS-M Ho et al
4254
Oncogene

and counted using a hemocytometer. In other cases, prolifera-tion was measured by using Promega’s Cell Titer Aqueousassay, in which viable cells convert MTS tetrazolium into aformazan–colored product. After the incubation period, 400 mlof the MTS/MPS/medium solution was added to each well andplates were incubated for 4 h in a humidified atmosphere. Todetermine the cell number in each well at the end of theincubation period, the amount of formazan formed wasmeasured as absorbance at 490 nm in a spectrophotometer.Assays were performed in triplicate to generate mean valuesfor control and each treatment group. Cell number, asmeasured by the rate of formazan formation in control wellswith untreated cells, was considered to be 100%. Data pointsin all figures are group mean values 7standard deviationsfrom three separate experiments.
Semiquantitative reverse transcription (RT)–PCR
Relative expression levels of rap1GAP, neogenin, restin, andproliferating cell nuclear antigen (PCNA) transcripts weredetermined by RT–PCR 48 h after the second transfection ofODNs. The data shown are means of triplicate cultures foreach ODN at the three concentrations and are represented asmeans7s.e.m.s.
Caspase activity assay
After ODN treatment, the detached cells were harvested bycentrifugation at 400 g for 10 min at room temperature,washed once with PBS, and the cell pellets were held on ice.The adherent cells were washed twice with PBS, scraped off in50ml of ice-cold lysis buffer included in the caspase assay kits(Clontech Laboratories, Palo Alto, CA, USA), and pooledwith the detached cells. The cell lysates were microcentrifugedat maximum speed for 3min at 41C to precipitate cellulardebris. Supernatants were transferred to new tubes. A volumeof 50ml of the supernatant was added to each well. After 50 ml2� reaction buffer/DTT Mix and 5 ml of 1 mm caspasesubstrate (DEVD-pNA; 50 mm final concentration) were added
to each reaction, the mixture was incubated at 371C for 1 h.Absorbance was recorded on a plate reader at 405 nm. The netincrease of absorbance was indicative of enzyme activity.
Cell invasion assay
Clontech Biocoatt Matrigelt Invasion chambers were used toassess the invasive property of OVCA cells in vitro. Matrigelchambers were rehydrated at 371C for 2 h. Control cells orantisense rap1GAP ODN-treated OVCA cells (2.5� 104 cells,OVCA 420, OVCA 429, and OVCA 432) as described abovewere cultured in Matrigel Invasion Chambers for 22 h inhumidified atmosphere at 371C. Serum was used as thechemoattractant. We used ovarian cancer cell line SKOV3 asa positive control. After 22 h, noninvading cells were removedfrom the upper surface of the membrane by scrubbing. Thecells on the lower surface of the membrane were fixed for 2 minin 100% methanol and stained in 1% toluidine blue in 1%sodium borate for 2min. Excess stain was removed by rinsingthe insert with water. Membrane was removed from the insertand placed on a microscopic slide on which a small drop ofimmersion oil had been placed. The cover slip was placed onthe slide and cells were counted. Percent invasion wasdetermined by dividing the mean number of antisense-treatedcells invading through Matrigel insert membrane by the meannumber of control cells migrating through control Matrigelinsert membrane multiplied by 100. The assay was run intriplicate.
Acknowledgements
We thank the editorial staff of Brigham and Women’sHospital, Harvard Medical School, Boston, for editorial help.This study was supported by NIH Grants CA091250 (to V.Syed) and CA94221 (to S-M Ho) and an Army OvarianCancer Research Program Grant DAMD17-99-1-9563 (to S-M Ho).
References
Ala-Fossi, SL, Grenman S, Zhang FP, Blaue, M, Punnonen Rand Maenpaa J. (1999). Anticancer Res., 19, 4289–4295.
Altschuler DL, Peterson SN, Ostrowski MC and Lapetina EG.(1995). J. Biol. Chem., 270, 10373–10376.
Auersperg N, Wong AS, Choi KC, Kang SK and Leung PC.(2001). Endocr. Rev., 22, 255–288.
Bast RC Jr, Feene, M, Lazarus H, Nadler LM, Colvin RB andKnapp RC. (1981). J. Clin. Invest., 68, 1331–1337.
Bilbe G, Delabie J, Bruggen J, Richener H, Asselbergs FA,Cerletti N, Sorg C, Odink K. Tarcsay L, Wiesendanger Wet al. (1992). EMBO J., 11, 2103–2113.
Callow ME, Callow JA, Ista LK, Coleman SE, Nolasco ACand Lopez GP. (2000). Appl. Environ. Microbiol., 66, 3249–3254.
Cao SX, Dhahbi JM, Mote PL and Spindler SR. (2001). Proc.Natl. Acad. Sci., 98, 10630–10635.
Cohen P. (1989). Annu. Rev. Biochem., 58, 453–508.Conroy SE and Latchman DS. (1996). Br. J. Cancer, 74, 717–
721.Cramer DW, Liberman RF, Hornstein MD, McShane P,
Powers D, Li EY and Barbieri R. (1998). Fertil. Steril., 70,
371–373.Dujardin D, Wacke, UJ, Moreau A, Schroer TA, Rickard JE
and DeMey JR. (1998). J. Cell. Biol., 141, 849–862.
Emons G, Ortmann O, Teichert HM, Fassl H, Lohrs U,Kullander S, Kauppila A, Ayalon D, Schally A andOberheuser F. (1996). Cancer, 78, 1452–1460.
Erickson GF, Li D, Sadrkhanloo R, Liu XJ, Shimasaki S andLing N. (1994). Endocrinology, 134, 1365–1372.
Feeley KM and Wells M. (2001). Histopathology, 38,87–95.
Fuller-Pace FV. (1994). Trends Cell Biol., 4, 271–274.Fuqua SA, Oesterreich S, Hilsenbeck SG, Von Hoff DD,
Eckardt J and Osborne CK. (1994). Breast Cancer Res.Treat., 32, 67–71.
Gillett WR, Mitchell A and Hurst PR. (1999). Hum. Reprod.,6, 645–650.
Godwin AK, Testa JR and Hamilton TC. (1993). Cancer, 71,
530–536.Halperin R, Hadas E, Langer R, Bukovsky I and Schneider D.
(1999). Int. J. Gynecol. Cancer, 9, 502–507.Hamilton TC. (1992). Curr. Probl. Cancer, 16, 1–57.Heizisouer KJ, Alberg A, Gordan GB, Longcope C, Bush TL,
Hoffman SC and Comstock GW. (1995). JAMA, 274, 1926–1930.
Hilliker C, Delabie J, Speleman F, Bilbe G, Bruggen J, VanLeuven F and Van den Berghe H. (1994). Cytogenet. CellGenet., 65, 172–176.
FSH-regulated gene expression in ovarian surface epitheliumS-M Ho et al
4255
Oncogene

Hofstra LS, Mourits MJ, de Vries EG, Mulder NH andWillemse PH. (1999). Anticancer Res., 19, 3627–3630.
Holschneider CH and Berek JS. (2000). Semin. Surg. Oncol.,19, 3–10.
Hough CD, Cho KR, Zonderman AB, Schwartz DR andMorin PJ. (2001). Cancer Res., 61, 3869–3876.
Ismail RS, Baldwin RL, Fang J, Browning D, Karlan BY,Gasson JC and Chang DD. (2000). Cancer Res., 60, 6744–6749.
Itoh K, Yoshioka K, Akedo H, Uehata M, Ishizaki T andNarumiya S. (1999). Nat. Med., 5, 221–225.
Ivarsson K, Sundfeldt K, Brannstrom M, Hellberg P andJanson PO. (2001). Hum. Reprod., 16, 18–23.
Konishi I, Kuroda H and Manda M. (1999). Oncology, 57, 45–48.
Lau KM, Mok SC and Ho SM (1999). Proc. Natl. Acad. Sci.USA, 96, 5722–5727.
Lee CK, Klopp RG, Weindruch R and Prolla TA. (1999).Science, 285, 1390–1393.
Lee HM, Greeley Jr GH and Englander EW. (2001). Mech.Ageing Dev., 122, 355–371.
Li M, Makkinje A and Damuni Z. (1996). J. Biol. Chem., 271,
11059–11062.Mandai M, Konishi I, Kuroda H, Fukumoto M, Komatsu T,
Yamamoto S, Nanbu K, Rao CV and Mori T. (1997). Eur.J. Cancer, 33, 1501–1507.
Marimoto RI, Tissieres A and Georgopoulos C. (1994.) TheBiology of Heat Shock Proteins and Molecular Chaperones.Cold Spring Harbor Laboratory Press: Cold Spring Harbor,NY.
Markert JM, Fuller CM, Gillespie GY, Bubien JK, McLeanLA, Hong RL, Lee K, Gullans SR, Mapstone TB and BenosDJ. (2001). Physiol. Genomics, 5, 21–33.
Mathew A, Mathur SK and Morimoto RI. (1998). Mol. Cell.Biol., 18, 5091–5098.
Meyerhardt JA, Look AT, Bigner SH and Fearon ER. (1997).Oncogene, 14, 1129–1136.
Mukherjee A, Urban J, Sassone-Corsi P and Mayo KE.(1998). Mol. Endocrinol. Endocrinol., 12, 785–800.
Oliver CJ and Shenolikar S. (1998). Front. Biosci., 3, 961–962.Ono K, Tanaka T, Tsunoda T, Kitahara O, Kihara C,
Okamoto A, Ochiai K, Takagi T and Nakamura Y. (2000).Cancer Res., 60, 5007–5011.
Parrott JA, Doraiswamy V, Kim G, Mosher R and SkinnerMK. (2001). Mol. Cell Endocrinol., 172, 213–222.
Poerre P, Scheel J, Rickard JE and Kreis TE. (1992). Cell, 70,887–900.
Rao BR and Slotman BJ. (1999). Endocr. Rev., 12, 14–26.Rauh-Adelmann C, Lau KM, Sabeti N, Long JP, Mok SC and
Ho SM. (2000). Mol. Carcin., 28, 236–246.
Rickard JE and Kreis TE (1996). Trends Cell Biol., 6, 178–183.Risch HA. (1998). J. Natl. Cancer Inst., 90, 1774–1786.Sassone-Corsi P. (1998). Int. J. Biochem. Cell Biol., 30, 27–38.Schmid SR and Linder P. (1992). Mol. Microbiol., 6, 283–292.Schummer M, Ng WV, Bumgarner RE, Nelson PS, Schummer
B, Bednarsk, DW, Hassell L, Baldwin RL. Karlan BY andHood L. (1999). Gene 238, 375–385.
Shridhar V, Lee J, Pandita A, Iturria S, Avula R, Staub J,Morrissey M, Calhoun E, Sen A, Kalli K, Keeney G, RocheP, Cliby W, Lu K, Schmandt R, Mills GB, Bast Jr RC,James CD, Couch FJ, Hartmann LC, Lillie J and Smith DI.(2001). Cancer Res., 61, 5895–5904.
Shushan A, Paltiel O, Iscovich J, Elchalal U, Peretz T andSchenker JG. (1996). Fertil. Steril., 65, 13–18.
Syed V, Ulinski G, Mok SC and Ho SM. (2002). J. Natl.Cancer Inst., 94, 617–629.
Syed V, Ulinski G, Mok SC, Yiu GK and Ho SM. (2001).Cancer Res., 61, 6768–6776.
Tsao SW, Mok SC, Fey E, Fletcher J, Muto MG, Knapp RCand Berkowitz RS. (1995). Exp. Cell. Res., 218, 499–507.
Tsukamoto N, Hattori M, Yang H, Bos JL and Minato N.(1999). J. Biol. Chem., 274, 18463–18469.
Venema J, Bousquet-Antonelli C, Gelugne JP, Caizergues-Ferrer M and Tollervey D. (1997). Mol. Cell. Biol., 17, 3398–3407.
Vielmetter J, Kayyem JF, Roman JM and Dreyer WJ. (1994).J. Cell. Biol., 127, 2009–2020.
Vossler MR, Yao H, York RD, Pan MG, Rim CS and StorkPJ. (1997). Cell, 89, 73–82.
Wang C, Kaufman JA, Sanchez-Ross MG and Johnson KM.(2000). J. Pharmacol. Exp. Ther., 294, 287–295.
Wang K, Gan L, Jeffery E, Gayle M, Gown AM, Skelly M,Nelson PS, Ng WV, Schummer M, Hood L and Mulligan J.(1999). Gene, 229, 101–108.
Wani MA, Denko NC and Stambrook PJ. (1997). Som. Cell.Mol. Genet., 23, 123–133.
Welsh JB, Zarrinkar PP, Sapinoso LM, Kern SG, Behling CA,Monk BJ, Lockhart DJ, Burger RA and Hampton GM.(2001). Proc. Natl. Acad. Sci. USA, 98, 1176–1181.
Wera S and Hemmings BA. (1994). Biochem. J., 311, 17–29.Whittemore AS, Harris R and Itnyre J. (1992. Am. J.
Epidemiol., 136, 1184–1203.Yang YH, Dudoit S, Luu P, Lin DM, Peng V, Ngai J and
Speed TP. (2000). Nucleic Acids Res., 30, e15.Zheng W, Lu, JJ, Luo F, Zheng Y, Feng Yj, Felix JC,
Lauchlan SC and Pike MC. (2000). Gynecol. Oncol., 76, 80–88.
Zheng W, Magid MS, Kramer EE and Chen YT. (1996). Am.J. Pathol., 148, 47–53.
FSH-regulated gene expression in ovarian surface epitheliumS-M Ho et al
4256
Oncogene
Copyright © 2022 FDOKUMEN