Electronic cigarette power affects count concentration and ...

Predictors of antral follicle count during the reproductiveyears
J.Kline1,2,3,7, A.Kinney4, A.Kelly5, M.L.Reuss6 and B.Levin3
1Epidemiology of Developmental Brain Disorders Department, New York State Psychiatric Institute, New York, NY 10032,2Gertrude H. Sergievsky Center and 3Mailman School of Public Health, Columbia University, 4Research Foundation for Mental
Hygiene, New York State Psychiatric Institute, New York, NY and Graduate School of Arts and Sciences, Columbia University,5Department of Obstetrics and Gynecology, Columbia University, New York, NY 10032 and 6Southwest Women’s Sonography,
Albuquerque, NM 87109, USA
7To whom correspondence should be addressed at: Psychiatric Institute, Epidemiology, 722 West 168th Street, Room 1607,
New York, NY 10032. E-mail: [email protected]
BACKGROUND: We sought to identify indicators of antral follicle count which would be serviceable to cliniciansseeking to estimate the number of ovarian follicles without relying on sonographic counts. METHODS: We exam-ined the relations of chronological age and four potential indicators of ovarian age—ovarian volume, FSH, dimericinhibin B and estradiol—to antral follicle count in 176 recently pregnant women. We identified the regressionmodels which best predict low antral follicle count (#10 follicles). RESULTS: Chronological age, ovarian volume,FSH and inhibin B were each significantly associated with antral follicle count. Fifty-three (30.1%) women had#10 antral follicles. In the total sample, at the cutpoint corresponding to 80% sensitivity, the positive predictivevalue for a regression model with all four variables was 60%. All regression models performed less well in women<35 years (13.9% with low count) than in women $35 years (52.0% with low count). In older women, the positivepredictive value for the model with all four variables was 79%, compared with 60% for a model with chronologi-cal age alone. CONCLUSIONS: Our models provide a basis for advising women aged $35 years who are eithertrying to conceive or wish to learn whether they may postpone childbearing.
Key words: age/epidemiology/FSH/inhibin B/ovarian follicles
Introduction
Many women defer childbearing to the later years, raising
their risk of adverse pregnancy outcomes associated with
ovarian ageing. In particular, rates of fecundity (the physio-
logical capacity to have a live birth) and fertility (the number
of actual live births) begin to decline rapidly when women
reach the mid–late 30s (Howe et al., 1985; Menken et al.,
1986). While social and medical factors (e.g. contraception,
voluntary sterility, coital frequency) influence these rates,
some of the decline is biologically determined. Data suggest
that follicular and ovarian, rather than uterine, factors are the
primary determinants of decreasing fecundability (the physio-
logical capacity to conceive) during a woman’s 30s and 40s.
For example, although implantation and clinical pregnancy
rates for women receiving donor ova do not decline until
about age 50 years (CDC, 2000; Toner et al., 2002), preg-
nancy rates for women attempting assisted reproduction with
their own ova start to decline when they are in their mid-30s
(CDC, 2000).
Studies of autopsy and surgical specimens show that the
germ cell population, which is largest during fetal develop-
ment (,7 £ 106), decreases approximately exponentially
with chronological age (Block, 1952; Baker, 1963;
Thomford et al., 1987; Faddy et al., 1992; Leidy et al.,
1998; Westhoff et al., 2000). A similar decline is evident
for antral follicles, the small fraction (,0.5%) of the total
pool that develops and enlarges during each menstrual
cycle. Sonographic studies confirm that antral follicle count
declines with chronological age in women of reproductive
age (Reuss et al., 1996; Scheffer et al., 1999; Broekmans
et al., 2004; Kline et al., 2004). Moreover, a detectable
decline in follicle count may precede detectable changes in
hormone levels (Scheffer et al., 1999; Kline et al., 2004). It
is reasonable to infer that the decline in fecundity with
chronological age reflects, at least in part, the diminishing
supply of oocytes. Among infertile women, indicators of the
size of the oocyte pool supplement chronological age as
predictors of the response to assisted reproductive technol-
ogies. While findings are not entirely consistent (Bukman
and Heineman, 2001; Bancsi et al., 2003), antral folli-
cle count, ovarian volume and pretreatment levels of FSH
and inhibin B have each been associated with ovarian
response to hormonal stimulation and clinical pregnancy
rates.
Human Reproduction Vol.20, No.8 pp. 2179–2189, 2005 doi:10.1093/humrep/dei048
Advance Access publication April 28, 2005
q The Author 2005. Published by Oxford University Press on behalf of the European Society of Human Reproduction and Embryology. All rights reserved.For Permissions, please email: [email protected]
2179
by guest on January 11, 2015http://hum
rep.oxfordjournals.org/D
ownloaded from

In this paper we assume that antral follicle count is the
best indicator of the size of the underlying follicle pool.
Obtaining high quality data is, however, labour intense.
While follicles can be counted with moderate to high
reliability in research settings (Scheffer et al., 2002; Kline
et al., 2004), similar results are less likely in clinical practice
(Hansen et al., 2003), at least until specialized (potentially
automated) three-dimensional applications are developed and
widely available. We therefore sought to identify indicators
other than antral follicle count which would be serviceable
to clinicians seeking to estimate the size of the underlying
follicle pool.
We draw on data from a sample of recently pregnant
women to extend observations on the natural history of ovar-
ian ageing. First, we describe the relations between chrono-
logical age and several potential indicators of ovarian age:
the number of antral follicles, the diameter of the largest fol-
licle, the surface area of the follicles, ovarian volume, and
levels of FSH, inhibin B and estradiol (E2). We also describe
associations between indicators. Next, from among the indi-
cators that can be easily obtained (age, ovarian volume and
levels of FSH, inhibin B and E2) we identify the combination
that best predicts antral follicle count. We also consider the
utility of inhibin B level since, in clinical practice, measure-
ment of this hormone is less common than measurement of
FSH and E2.
Materials and methods
Participants
Selection criteria and the protocol for this study are described in
detail elsewhere (Kline et al., 2004). The sample derives from a
study designed to test the hypothesis that the association between
advancing chronological age and trisomic pregnancy reflects an
association between the size of the oocyte pool and trisomy, with
risk higher in women with fewer oocytes. The data did not support
the hypothesis.
The protocol
Briefly, from September 1998 to April 2001, we identified women
aged $18 years with singleton prefetal losses (developmental age
,9 weeks) whose products of conception were submitted to the
Pathology Department of a hospital in New York State. We asked
for permission to karyotype the abortus. If a woman’s loss was suc-
cessfully karyotyped, we asked her to complete a short telephone
interview to determine her eligibility. Eligible women who con-
sented to the protocol completed a more extensive telephone inter-
view and made two visits to the study hospital during the first week
of their second or later menstrual cycle, the first on day 1–4 for a
blood sample and the second on day 5–7 for transvaginal
sonography.
To obtain valid ovarian age measures, we required: no pituitary
disorder or hormonal disorder related to ovarian function, no
oophorectomy, no hormonal medication, no pregnancy at the time
of ultrasound, no breastfeeding or breastfeeding no more than once
per day during the menstrual cycle preceding the study assessments.
We required that any diagnosis be current, the report of the diagnos-
tic work-up informative and the clinical symptoms and treatment
consistent with the diagnosis. The study reproductive endocrinolo-
gist (A.C.K.) reviewed the interview data to determine whether or
not a potential participant currently had a condition associated with
altered hormone levels.
Women with spontaneous abortions
Of the 244 women with karyotyped losses, 127 (52%) completed
the protocol (Table I). The principal reasons for not completing the
protocol were: refusal (23%) and ineligibility (25%), primarily due
to use of hormonal contraceptives or pregnancy soon after the index
loss. Six women were excluded because of hormonal conditions and
another six were excluded due to use of fertility drugs, although
only two had experienced conception delay .1 year prior to the
study pregnancy.
Women who completed the protocol were on average older than
women who did not. The age difference arose chiefly because
younger women were more likely to begin hormonal contraception
immediately after their loss. Among the 205 women who completed
the eligibility interview, adjusting for age, the odds of completing
the protocol did not differ with education, parity or number of prior
induced abortions; completion rates were significantly higher for
women with one or more prior spontaneous abortions than for
women with no prior losses (74 versus 56%).
Table I. Number of women identified/selected, declining the study orineligible, or completing the protocol
Prefetalloss
Livebirth
Identified/selected 435 219Tissue culture set up 269 NAKaryotyped 244 NAMoved or not located 1 7Declined eligibility interview 36 56Eligible, declined study or lost during follow-up 19 11Ineligiblea 61 80
Hormonal contraceptiveb 25 38Pregnantc 18 12Breastfeeding 3 23Oophorectomy 1 3Other condition affecting ovaries or hormonesd 6 2Fertility medication 6 0Other hormonal medicatione 1 1Otherf 1 1
Completed protocol 127 65Analytical exclusions
Repeat entranceg 4 0Only one informative ovary 6 6
Analytical sample 117 59
aIncludes 14 women (two with prefetal losses, 12 with live births) who pro-vided information on their eligibility status but declined the eligibilityinterview.bSixty-one women were taking oral contraceptives; two live birth controlshad intrauterine devices that included a hormonal component. Two live birthcontrols were also breastfeeding.cOne live birth control was also breastfeeding.dFive women (four with prefetal losses, one live birth control) had beendiagnosed with polycystic ovary disease, two women (one with a prefetalloss, one live birth control) with hyperprolactaemia, and one woman with aprefetal loss had been diagnosed with anovulation.eOne woman with a prefetal loss was taking oral contraceptives to regulateher periods (oligomenorrhoea, possible polycystic ovary disease). One livebirth control was taking progesterone ‘for a possible cyst’.fOne woman with a prefetal loss did not complete the protocol within 8months of her spontaneous abortion. One live birth control had had a pre-vious trisomic conception.gTo maintain the independence of observations, the analysis excludes repeatstudy entrances of four women.
J.Kline et al.
2180
by guest on January 11, 2015http://hum
rep.oxfordjournals.org/D
ownloaded from

Women with live births
For each woman with a trisomic loss who completed the study, we
selected an age-matched control with a chromosomally and anatomi-
cally normal live birth $1800 g, no pregnancy loss since the index
pregnancy and no known trisomic pregnancy. They were selected
from the hospital delivery log of women who delivered during the
7–13 months preceding the date of selection. Live birth controls
were matched to trisomy cases for projected age (^6 months) at the
sonography visit. If a selected control was ineligible for the study or
refused to participate, we replaced her. The protocol for women
with live births was identical to the protocol for women with prefe-
tal losses.
In total, we selected 219 women with live births, 65 of whom
(30%) completed the protocol (Table I). The principal reasons for
not completing the protocol were refusal (31%) and ineligibility
(37%), primarily due to use of hormonal contraceptives or breast-
feeding. Two women were excluded because of hormonal
conditions.
Women who completed the protocol tended to be older, though
not significantly so, than women who did not. Among the 144
women who completed the eligibility interview, the odds of com-
pleting the protocol did not differ with educational attainment,
parity, number of prior induced abortions or number of prior spon-
taneous abortions.
Analytical sample
Analyses exclude repeat study entrances of four women (all with
pregnancy losses) to maintain the independence of observations.
They also exclude 12 women: eight women for whom we were able
to scan only one ovary—even though, based on history and transab-
dominal scans, each woman was known to have two ovaries—and
four women who had conditions—three a cyst and one an endome-
trioma—which might have obscured the follicle count. Thus the
analytical sample includes 176 women with both ovaries scanned
and unobstructed.
Characteristics of the sample (Table II)
Among the 176 women, 117 had an index pregnancy ending in
spontaneous abortion and 59 an index pregnancy ending in live
birth. Average age at ultrasound was 34 years (range 22–48). The
majority were white and had completed high school. Ninety-five per
cent completed the blood and sonography protocols after the second
or third menstrual period following the index loss or, for women
with live births, the introductory letter.
Indicators of ovarian age
Antral follicles
We used four transducers over the course of the study: the first two,
Acuson EXP 128, operated at a frequency of 7 MHz; the second
two, Acuson Sequoia (8–10 MHz) were usually used at 10 MHz.
The sonography technician scanned each ovary in transverse and
longitudinal views at a subjectively constant velocity, repeating
scans, as needed, until she obtained an optimal scan.
We videotaped the sonography scan. The scans were counted in
four randomized batches. The randomization procedure was
unknown to the sonographer.
The sonographer (M.L.R.) identified the optimal scan, converted
it to a digitized format and exported it to Matrox Inspector
(Matrox Electronic Systems Ltd, Dorval, Quebec, Canada 2005),
an interactive imaging software. We used the software to: (i) follow
each sonolucency interpreted as a follicle through the scan, frame
by frame, to identify its maximum diameter; and (ii) measure
the maximum diameter of each follicle in the vertical plane by cali-
brating measurements to the centimetre scale generated by the ultra-
sound machine. Diameters ranged from 1.2 to 24.1 mm, with 99.3%
of follicles ,12 mm in diameter.
To assess the reliability of the counting procedure, we counted
again the follicles in 40 ovaries (Kline et al., 2004). The intra-class
correlation coefficient was 0.92. Analyses use the second count
for the 20 women whose scans were counted twice. Counts ranged
from 2 to 70 (median ¼ 15, mean ¼ 18.7, SD ¼ 12.8). The mean
difference between counts in the left and right ovaries was
0.2 (SD ¼ 5.4, range ¼ 2 15 to 28); the correlation between them
was 0.70 (P , 0.0001).
We also examined associations with three alternative measures:
(i) diameter of the largest follicle, because some data suggest that
advancing age is associated with earlier emergence of the dominant
follicle (Klein et al., 1996a, 2000); (ii) the sum of the antral follicle
surface areas, to examine whether surface area is more closely
related to inhibin B level than to follicle count; (iii) total ovarian
volume, as a possible indicator, easily obtained, of the number of
antral follicles. We assumed that antral follicles are spherical, esti-
mating the surface area of each by 4pr 2, where r is the radius. We
assumed that each ovary is ellipsoidal, estimating the volume of
each by D1 £ D2 £ D3 £ p/6, where D1, D2 and D3 are the three
dimensions of the ovary. For the sum of the surface areas, the mean
difference between left and right ovaries was 255.1 mm2
(SD ¼ 511.2, range 21710.6 to 1315.2); the correlation between
them was 0.40 (P , 0.0001). For ovarian volume, the mean
Table II. Selected characteristics of women who completed the study
No. of women 176Outcome of the index pregnancy
Spontaneous abortiona 117Live birth 59
Age at ultrasound, mean (SD) 34.0 (5.4)No. of live births, mean (SD) 1.3 (1.1)No. of spontaneous abortionsb, mean (SD) 1.2 (1.1)No. of induced abortions, mean (SD) 0.2 (0.5)Percentage distributionsEducation (%)#high school 19.3Some college 29.5College graduate 31.3Postgraduate degree 19.9
Ethnicity (%)White, non-Hispanic 94.3
Menstrual period preceding study protocol (%)Period 2 74.4Period 3c 20.5Period 4–7 5.1
Day of blood samplingDay 1 9.1Day 2 31.3Day 3 33.0Day 4 26.7
Day of sonographyDay 5 33.5Day 6 32.4Day 7 34.1
aKaryotypes of the abortus: trisomy (n ¼ 52), other chromosomally abnormal(n ¼ 22), confirmed chromosomally normal (n ¼ 21), unconfirmed chromo-somally normal female (n ¼ 22). We classify as ‘unconfirmed chromoso-mally normally female’ those losses in which the karyotype was 46,XX andconfirmatory DNA analysis was either not possible because of inadequatespecimens (n ¼ 17) or DNA analysis indicated inadvertent karyotyping ofmaternal cells (n ¼ 5).bExcludes one woman with unknown number of spontaneous abortions.cIncludes two women where the menstrual period preceding the studyprotocol may have been either period 2 or period 3.
Predictors of antral follicle count
2181
by guest on January 11, 2015http://hum
rep.oxfordjournals.org/D
ownloaded from
difference between left and right ovaries was 20.8 cm3 (SD ¼ 4.5,
range ¼ 2 16.8 to 16.1); the correlation between them was 0.25
(P ¼ 0.25).
Serum hormone levels
Blood samples were processed in a refrigerated centrifuge and, after
separation, sera were frozen at 2258C at the study hospital; they
were shipped to New York City and stored at 2208C. FSH and E2
were measured by solid-phase chemiluminescent enzyme immuno-
assays (Diagnostic Products Co. Los Angeles, CA) (Immulite);
dimeric inhibin B was measured by radioimmunoassay (Oxford Bio-
Innovation Ltd, Upper Heyford, Oxfordshire, England). For FSH,
sensitivity (the minimum detection limit) was 0.1 mIU/ml; intra- and
inter-assay coefficients of variation (CV) were 9.3 and 10.5%
respectively. For inhibin B, sensitivity was 20 pg/ml; intra- and
inter-assay CV were 5.1 and 6.2%, respectively. For E2, sensitivity
was 20 pg/ml; intra- and inter-assay CV were 1.9 and 5%
respectively.
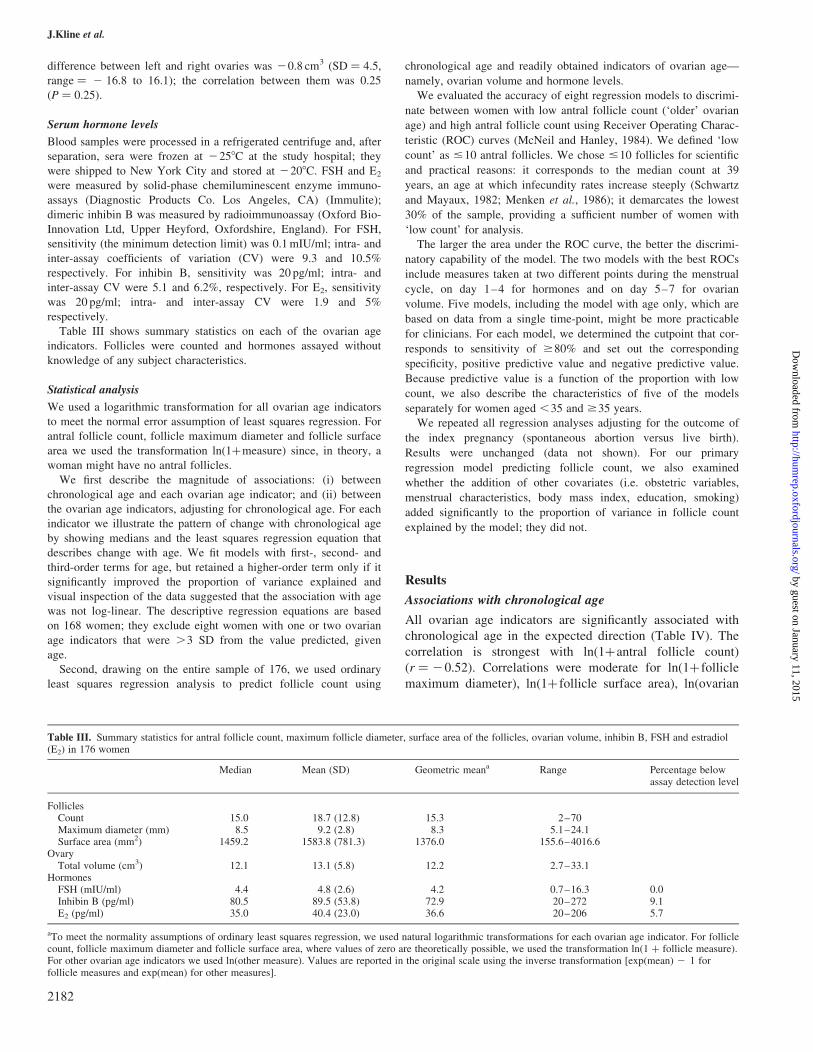
Table III shows summary statistics on each of the ovarian age
indicators. Follicles were counted and hormones assayed without
knowledge of any subject characteristics.
Statistical analysis
We used a logarithmic transformation for all ovarian age indicators
to meet the normal error assumption of least squares regression. For
antral follicle count, follicle maximum diameter and follicle surface
area we used the transformation ln(1þmeasure) since, in theory, a
woman might have no antral follicles.
We first describe the magnitude of associations: (i) between
chronological age and each ovarian age indicator; and (ii) between
the ovarian age indicators, adjusting for chronological age. For each
indicator we illustrate the pattern of change with chronological age
by showing medians and the least squares regression equation that
describes change with age. We fit models with first-, second- and
third-order terms for age, but retained a higher-order term only if it
significantly improved the proportion of variance explained and
visual inspection of the data suggested that the association with age
was not log-linear. The descriptive regression equations are based
on 168 women; they exclude eight women with one or two ovarian
age indicators that were .3 SD from the value predicted, given
age.
Second, drawing on the entire sample of 176, we used ordinary
least squares regression analysis to predict follicle count using
chronological age and readily obtained indicators of ovarian age—
namely, ovarian volume and hormone levels.
We evaluated the accuracy of eight regression models to discrimi-
nate between women with low antral follicle count (‘older’ ovarian
age) and high antral follicle count using Receiver Operating Charac-
teristic (ROC) curves (McNeil and Hanley, 1984). We defined ‘low
count’ as #10 antral follicles. We chose #10 follicles for scientific
and practical reasons: it corresponds to the median count at 39
years, an age at which infecundity rates increase steeply (Schwartz
and Mayaux, 1982; Menken et al., 1986); it demarcates the lowest
30% of the sample, providing a sufficient number of women with
‘low count’ for analysis.
The larger the area under the ROC curve, the better the discrimi-
natory capability of the model. The two models with the best ROCs
include measures taken at two different points during the menstrual
cycle, on day 1–4 for hormones and on day 5–7 for ovarian
volume. Five models, including the model with age only, which are
based on data from a single time-point, might be more practicable
for clinicians. For each model, we determined the cutpoint that cor-
responds to sensitivity of $80% and set out the corresponding
specificity, positive predictive value and negative predictive value.
Because predictive value is a function of the proportion with low
count, we also describe the characteristics of five of the models
separately for women aged ,35 and $35 years.
We repeated all regression analyses adjusting for the outcome of
the index pregnancy (spontaneous abortion versus live birth).
Results were unchanged (data not shown). For our primary
regression model predicting follicle count, we also examined
whether the addition of other covariates (i.e. obstetric variables,
menstrual characteristics, body mass index, education, smoking)
added significantly to the proportion of variance in follicle count
explained by the model; they did not.
Results
Associations with chronological age
All ovarian age indicators are significantly associated with
chronological age in the expected direction (Table IV). The
correlation is strongest with ln(1þantral follicle count)
(r ¼ 20.52). Correlations were moderate for ln(1þ follicle
maximum diameter), ln(1þ follicle surface area), ln(ovarian
Table III. Summary statistics for antral follicle count, maximum follicle diameter, surface area of the follicles, ovarian volume, inhibin B, FSH and estradiol(E2) in 176 women
Median Mean (SD) Geometric meana Range Percentage belowassay detection level
FolliclesCount 15.0 18.7 (12.8) 15.3 2–70Maximum diameter (mm) 8.5 9.2 (2.8) 8.3 5.1–24.1Surface area (mm2) 1459.2 1583.8 (781.3) 1376.0 155.6–4016.6
OvaryTotal volume (cm3) 12.1 13.1 (5.8) 12.2 2.7–33.1
HormonesFSH (mIU/ml) 4.4 4.8 (2.6) 4.2 0.7–16.3 0.0Inhibin B (pg/ml) 80.5 89.5 (53.8) 72.9 20–272 9.1E2 (pg/ml) 35.0 40.4 (23.0) 36.6 20–206 5.7
aTo meet the normality assumptions of ordinary least squares regression, we used natural logarithmic transformations for each ovarian age indicator. For folliclecount, follicle maximum diameter and follicle surface area, where values of zero are theoretically possible, we used the transformation ln(1 þ follicle measure).For other ovarian age indicators we used ln(other measure). Values are reported in the original scale using the inverse transformation [exp(mean) 2 1 forfollicle measures and exp(mean) for other measures].
J.Kline et al.
2182
by guest on January 11, 2015http://hum
rep.oxfordjournals.org/D
ownloaded from

volume) and ln(FSH), ranging from 20.26 to 0.35. Corre-
lations were weak for ln(inhibin B) and ln(E2).
Figure 1 illustrates the shape of the relations between
chronological age and each of the ovarian age indicators. For
antral follicle count, we illustrate two models—one with only
a linear term for age and one with both linear and quadratic
age terms. The quadratic age term improved the R2 of the
regression model by 1.6% (P ¼ 0.053). Follicle surface area
and ovarian volume decrease approximately exponentially
with age. Maximum follicle diameter and E2 increase
approximately exponentially with age. For FSH, the model
includes a quadratic term; levels begin to rise steeply around
age 40 years. The pattern of results for inhibin B suggests
that levels are either constant or increasing until the late 30s
and low after age 40 years; the curve drawn here does not fit
the data well.
Follicle surface area is a function of the number of fol-
licles and their size. We used least squares regression to
examine whether age was associated with follicle surface
area independently of its association with follicle count.
Without adjustment for follicle count, age accounts for
17.0% of the variance in ln(1 þ follicle surface area); with
adjustment, the corresponding proportion is 0.2% (P ¼ 0.33).
Age-adjusted correlations between ovarian age indicators(Table IV)
Ln(1þantral follicle count) is most strongly related to
Ln(1þ follicle surface area) (r ¼ 0.76) and significantly
associated with ovarian volume (r ¼ 0.48), Ln(FSH)
(r ¼ 20.34) and Ln(inhibin B) (r ¼ 0.24). Among
the remaining measures, the pattern of associations is, for
the most part, consistent with expectation. For example,
Ln(1þ follicle surface area) is positively associated with
Ln(inhibin B) (r ¼ 0.34) and with Ln(1 þ follicle maximum
diameter) (r ¼ 0.47). Ln(FSH) is inversely related to Ln(E2)
(r ¼ 20.23).
Ln(FSH) is not correlated with Ln(inhibin B) (r ¼ 20.03).
Because inhibin B levels were lower on day 1
(median ¼ 33.0 pg/ml, n ¼ 16) than on days 2–4
(median ¼ 86.5 pg/ml, n ¼ 160), we repeated the analysis,
limiting the sample to women with blood samples taken on
days 2–4. Ln(FSH) and Ln(inhibin B) are weakly correlated
(r ¼ 20.15, P ¼ 0.053). The correlations between inhibin B
and other ovarian indicators are similar to those in the entire
sample.
Predicting antral follicle count (Table V)
Using only age and four readily available measures (ovarian
volume, FSH, inhibin B, E2), we sought the regression model
which best predicts Ln(1þantral follicle count). Only E2 is
not independently and significantly related to follicle count
(R2 ¼ 0.005, adjusting for chronological age, P ¼ 0.28).
Thus, we did not consider E2 further in the regression ana-
lyses.
The model which includes, in addition to age, ovarian
volume, FSH and inhibin B explains 49.6% of the variance
in follicle count (Table V, model A). Omitting inhibin B
from the model decreases the proportion of variance
explained to 48.3% (model B). The standardized b values
indicate that the magnitude of change, per SD unit increase,
is about the same for age and Ln(1 þ ovarian volume) (stan-
dardized b ¼ 20.33 and 0.35 respectively, model A), lower
for Ln(FSH) (standardized b ¼ 20.23) and lower still for
Ln(inhibin B) (standardized b ¼ 0.12).
Receiver operating characteristics
Fifty-three (30.1%) women had #10 antral follicles. We
assessed the performance of all models to distinguish women
with #10 follicles from women with .10 (Table VI). The
areas under all ROC curves are good, especially for models
A (age, ovarian volume, FSH, inhibin B) and B (age, ovarian
volume, FSH). For comparison, we show the model which
includes only a linear term for age; the addition of a quadra-
tic term for age did not improve the ROC curve. Using the
cutpoint which produces a sensitivity of 80%, models A
and B increase the positive predictive value to 58–60%,
Table IV. Correlations between chronological age and ovarian age indicatorsa with adjustment for chronological age in 176 women
Age(years)
Adjusted for chronological age
Folliclecount
Follicle maximumdiameter
Folliclesurface area
Total ovarianvolume
FSH(mIU/ml)
Inhibin B(pg/ml)
E2
(pg/ml)
Follicle count 20.52{ 1.00 20.06 0.76{ 0.48{ 20.34{ 0.24† 0.08Follicle maximum diameter 0.26§ 1.00 0.47{ 0.37{ 0.14 0.21** 0.06Follicle surface area 20.34{ 1.00 0.67{ 20.29§ 0.34{ 0.14Total ovarian volume 20.26§ 1.00 20.23† 0.24† 0.18*FSH (mIU/ml) 0.35{ 1.00 20.03 20.23†Inhibin B (pg/ml) 2 0.16* 1.00 0.06E2 (pg/ml) 0.18* 1.00
aTo meet the normality assumptions of ordinary least squares regression, we used natural logarithmic transformations for each ovarian age indicator. For folliclecount, follicle maximum diameter and follicle surface area, where values of zero are theoretically possible, we used the transformation ln(1þ indicator). Forovarian volume and hormones, we used ln(indicator).
*P , 0.05.
**P , 0.01.†P , 0.005.§P , 0.0005.{P , 0.0001.
Predictors of antral follicle count
2183
by guest on January 11, 2015http://hum
rep.oxfordjournals.org/D
ownloaded from

Figure 1. Chronological age and indicators of ovarian age: Medians and fitted regression equations. Medians are based on 176 women. Theregression equations are based on 168 women; they exclude eight women with one or two ovarian age indicators that were .3 SD from thatpredicted, given age.
Age (years) 22 23 24 25 26 27 28 29 30 31 32 33 34 35 36 37 38 39 40 41 42 43 44–48n 2 3 2 5 1 11 4 11 19 14 10 12 7 10 10 15 9 5 4 9 7 2 4
J.Kline et al.
2184
by guest on January 11, 2015http://hum
rep.oxfordjournals.org/D
ownloaded from

compared with 42% for a model which includes only age. Of
the three models which include age plus a single ovarian age
indicator, at the cutpoint corresponding to a sensitivity of
80%, the positive predictive value is highest (55%) for the
model with ovarian volume.
We evaluated the performance of five models in younger
(,35 years) and older ($35 years) women separately (Table
VII). We chose the two models with the best performance
overall (models A and B), the model based on results from a
blood test only (model D), the model based on measurement
of the ovary only (model E) and the model based simply
on age (model H). At the cutpoint which corresponds to
a sensitivity of $80%, all models perform better among
older women than among younger women. For example,
Table V. Regression models predicting antral follicle count using chronological age and three ovarian age indicators in 176 women
Model b SE Standardized b P R2
(A) Age, volume, FSH, inhibin B 0.496Intercept 1.702 0.308Age230a 20.038 0.007 20.329 ,0.0001Ln(ovarian volume) 20.487 0.083 0.350 ,0.0001Ln(FSH) 20.301 0.079 20.228 0.0002Ln(inhibin B) 0.109 0.052 0.120 0.0360
(B) Age, volume, FSH 0.483Intercept 2.070 0.257Age230 20.040 0.007 20.342 ,0.0001Ln(ovarian volume) 20.529 0.081 0.379 ,0.0001Ln(FSH) 20.297 0.079 20.225 0.0002
(C) Age, volume, inhibin B 0.453Intercept 1.139 0.281Age230 20.046 0.007 20.396 ,0.0001Ln(ovarian volume) 0.559 0.084 0.401 ,0.0001Ln(inhibin B) 0.105 0.054 0.115 0.0520
(D) Age, FSH, inhibin B 0.394Intercept 2.776 0.271Age230 20.044 0.007 20.378 ,0.0001Ln(FSH) 20.406 0.084 20.307 ,0.0001Ln(inhibin B) 0.181 0.055 0.199 0.0012
(E) Age, volume 0.441Intercept 1.499 0.215Age230 20.047 0.007 20.408 ,0.0001Ln(ovarian volume) 20.598 0.082 0.429 ,0.0001
(F) Age, FSH 0.356Intercept 3.582 0.123Age230 20.047 0.008 20.408 ,0.0001Ln(FSH) 20.415 0.086 20.314 ,0.0001
(G) Age, inhibin B 0.312Intercept 2.201 0.260Age230 20.056 0.007 20.485 ,0.0001Ln(inhibin B) 0.190 0.058 0.208 0.0013
(H) Age 0.269Intercept 3.033 0.050Age230 20.060 0.008 20.529 ,0.0001
aWe centered the age variable by subtracting 30 from each woman’s age in years at ultrasound.
Table VI. Summary data on selected regression modelsa
Model Area under theROC curve
Regression equationcutpoint which yields80% sensitivity
Corresponding to sensitivity of 80%
Specificity Positive predictivevalueb
Negativepredictive valueb
(A) Age, ovarian volume, FSH, inhibin B 0.86 #14.85 0.77 0.60 0.90(B) Age, ovarian volume, FSH 0.85 #14.30 0.76 0.58 0.89(C) Age, ovarian volume, inhibin B 0.83 #15.85 0.68 0.52 0.89(D) Age, FSH, inhibin B 0.84 #15.35 0.72 0.57 0.90(E) Age, ovarian volume 0.82 #14.95 0.73 0.55 0.89(F) Age, FSH 0.82 #15.35 0.66 0.51 0.89(G) Age, inhibin B 0.80 #15.87 0.63 0.48 0.89(H) Age 0.77 #17.10 0.51 0.42 0.86
a(i) Each model’s ability to discriminate between women with low (#10 follicles) and high (.10 follicles) antral follicle count [the area under the receiveroperating characteristic (ROC) curve]; (ii) specificity and predictive values at the regression equation cutpoint yielding 80% sensitivity.bIn the sample, 30.1% (53/176) of women had #10 antral follicles.
Predictors of antral follicle count
2185
by guest on January 11, 2015http://hum
rep.oxfordjournals.org/D
ownloaded from

using model A, among older women, at 80% sensitivity,
specificity is 0.77, positive predictive value 0.79 and negative
predictive value 0.78. The analogous values in younger
women are specificity 0.39, positive predictive value 0.17
and negative predictive value 0.92. The disparities arise from
the fact that predictive values are sensitive to the proportion
of women with low antral count (13.9% in the 101 young
women, 52.0% in the 75 older women). In both age strata,
use of the best model (model B for young women, model A
for older women) increases the ability to identify women
with low antral count by ,50%. For example, among older
women, without information other than age we correctly
identify 52% of women with low antral count; using model
A we correctly identify 79%.
Discussion
Our study adds to a small body of evidence on antral follicle
count among women of presumed fecundability (Reuss et al.,
1996; Schipper et al., 1998) or demonstrated fertility (Erdem
et al., 2002; Scheffer et al., 2003).
The strengths of the study are several. First, all participants
were of demonstrated fecundability and 71% had at least one
live birth, avoiding the potential biases of assisted repro-
duction samples. Second, all ovarian age indicators were
assessed without knowledge of maternal characteristics, elim-
inating the possibility of bias. Third, reliability was excellent:
the procedure for counting antral follicles was repeatable;
the intra- and inter-assay CV for the hormone assays were
high. Fourth, ovaries were imaged on day 5–7 rather than, as
in previous studies, during the early follicular phase, maxi-
mizing the ability to detect developing follicles. (Earlier,
follicles are often too small to see; later, the emerging domi-
nant follicle may obscure smaller follicles.)
Three aspects of the study design are of possible concern.
First, the sample over-represents women with spontaneous
abortions. We do not believe this feature limits generalizability
since spontaneous abortion is unrelated to these ovarian age
indicators (Kline et al., 2004) and all results persisted when
analyses were adjusted for the index pregnancy. Moreover,
as noted above, nearly all women had at least one previous
live birth. Second, because all women had conceived
recently (0.3–2.5 years prior to the study sonogram, mean
0.9 years), at older ages (the late 30s and 40s) our sample
may over-represent women of high fecundability. This
over-representation may alter the patterns of change
observed at older ages. Third, we measured hormones and
counted follicles at different times during the follicular
phase, an approach which may limit the clinical utility of
regression equations which draw on measures from two
different days.
In our sample, as expected, ln(1þantral follicle count)
showed the strongest association with chronological age
(r ¼ 20.52). Age was modestly associated with ln(FSH)
(r ¼ 0.35), ln(1þ follicle maximum diameter) (r ¼ 0.26)
and ln(ovarian volume) (r ¼ 20.26). Age was statistically
significantly associated with ln(E2) (r ¼ 0.18) and ln(inhibin
B) (r ¼ 2 0.16), although both correlations were small. The
association of age with follicle surface area was entirely
explained by follicle count.
For comparison, we consider the two largest of the afore-
mentioned studies. Scheffer et al. (2003), in the Netherlands,
recruited 162 regularly menstruating volunteers, 25–46 years;
they obtained ovarian age measures on day 1–4 of the cycle.
Erdem et al. (2002), in Turkey, drew on a sample of 108 men-
struating women, 35–50 years, with minor gynaecological
problems; all measures were made on day 3 of the cycle. The
two studies differ from ours in several respects. First, both
obtained follicular and ovarian measures on a single day
during the early follicular phase. The range of follicle sizes in
both studies was small to moderate (2–10 mm in the Nether-
lands, ,10 mm in Turkey), whereas we counted all follicles
(of which 96% were 2–10 mm). The difference in follicle
size is likely a function of the timing of the measures. Second,
Table VII. Summary data on the performance of five regression models in younger (,35 years) and older ($35 years) womena
Model Area underthe ROC curve
Regression equation cutpointwhich yields 80% sensitivity
Corresponding to sensitivity of 80%
Specificity Positivepredictive value
Negativepredictive value
Women ,35 yearsb
(A) Age, ovarian volume, FSH, inhibin B 0.75 #22.05 0.39 0.17 0.92(B) Age, ovarian volume, FSH 0.77 #20.05 0.48 0.21 0.95(D) Age, FSH, inhibin B 0.64 #20.55 0.42 0.18 0.93(E) Age, ovarian volume 0.74 #21.30 0.43 0.18 0.93(H) Age 0.51 #22.30 0.25 0.14 0.88
Women $35 yearsc
(A) Age, ovarian volume, FSH, inhibin B 0.85 #11.55 0.77 0.79 0.78(B) Age, ovarian volume, FSH 0.82 #11.55 0.69 0.74 0.76(D) Age, FSH, inhibin B 0.85 #12.80 0.66 0.71 0.77(E) Age, ovarian volume 0.77 #11.93 0.57 0.65 0.69(H) Age 0.72 #12.40 0.42 0.60 0.68
a(i)Each model’s ability to discriminate between women with low (#10 follicles) and high (.10 follicles) antral follicle count [the area under the receiveroperating characteristic (ROC) curve]; (ii) specificity and predictive values at the regression equation cutpoint yielding 80% sensitivity.bAmong women ,35 years, 13.9% (14/101) had #10 antral follicles.cAmong women $35 years, 52.0% (39/75) had #10 antral follicles.
J.Kline et al.
2186
by guest on January 11, 2015http://hum
rep.oxfordjournals.org/D
ownloaded from

in both studies, follicular and ovarian measures were taken
during the scan, leaving open the potential for bias related to
awareness of the woman’s age. Data from the Netherlands
(Scheffer et al., 2002), however, show both high inter-obser-
ver agreement for counts obtained during a scan and high
intra-observer agreement between real-time counts and sub-
sequent counts from stored scans. Third, both studies analysed
ovarian age indicators without logarithmic transformation.
Average follicle count (our computations from published
data) is ,3.3 per woman in the Turkish sample, about nine
in the Netherlands sample and 18.7 in our sample. The differ-
ences most likely reflect the higher proportions of older
women and the earlier time-period of scanning in the two
previous studies, when a smaller proportion of developing
follicles are large enough to detect by sonography.
Observations in the Netherlands sample are roughly com-
patible with ours—chronological age is more strongly associ-
ated with follicle count than with FSH, inhibin B, E2 or with
measures of the ovary or follicles (Scheffer et al., 2003). As
in our data, chronological age is modestly associated with
ovarian volume and FSH, but the correlation of age with E2
is stronger. The higher proportion of women aged .40 years
in the Netherlands sample probably accounts for the some-
what higher correlations of chronological age with follicle
count and E2.
In the Turkish sample (Erdem et al., 2002), chronological
age is more strongly associated with FSH than with follicle
count, ovarian volume or E2. Moreover, the association with
E2 is inverse, rather than positive as in our study and the
Netherlands study. This pattern of results probably reflects
the age distribution of the sample. The inverse correlation of
age with E2 was confined to women aged 45–50 years,
suggesting that many, though menstruating, were close to
their final menstrual periods.
There is little doubt that antral follicle count declines
monotonically with age, but various models describe the
shape. In our sample, the association of chronological age
with ln(1þantral follicle count) is well fitted by either of two
models—a simple exponential model (R2 ¼ 0.30) or a model
which includes both linear and quadratic terms (R2 ¼ 0.32).
While the quadratic age term is marginally statistically sig-
nificant, it accounts for only 1.6% of the variance in count,
leaving uncertain which model most fairly represents the
data. The latter equation suggests that follicle count declines
more steeply after about age 27 years than before. One intui-
tively appealing feature of the equation is the suggestion of a
natural upper limit to antral follicle count. Our models con-
trast with those fitted by Scheffer and colleagues, who also
fitted two models—a biphasic model in which ln(count)
decreases more steeply beginning at age 38 years than before
(Scheffer et al., 1999) and a linear model relating age to
count until age 46 years (Broekmans et al., 2004). (It is
beyond the scope of this paper to combine the evidence from
these studies with autopsy and hysterectomy data to model
the relation of age to antral follicle count.)
Age explained only a small proportion of the variance in
ovarian volume and FSH in our sample. Nevertheless, our
data are consistent with previous observations. Data from a
large series of women enrolled in a cancer screening project
show that average ovarian volume declines between ages 25
and 91 years (Pavlik et al., 2000). Like previous studies
(Reyes et al., 1977; Metcalf and Livesey, 1985; Lee et al.,
1988; Lenton et al., 1988; Cramer et al., 1994; Broekmans
et al., 1998), our data indicate that FSH levels increase
beginning around age 40 years.
With respect to inhibin B, our data indicate that the associ-
ation with age is not monotonic; rather, inhibin B levels are
constant or increasing until about age 40 years and then
decrease. These results are compatible with two studies
which show that inhibin B levels are lower in older regularly
cycling women than in younger women (Klein et al., 1996b;
Welt et al., 1999); at later ages (i.e. 39–52 years in one
cross-sectional study), levels appear to decline linearly with
age (Danforth et al., 1998).
In our sample, adjusting for age, ln(inhibin B) is modestly
correlated with ln(1þ follicle count) (r ¼ 0.24) and slightly
more strongly correlated with ln(1þ follicle surface area)
(r ¼ 0.34), results consistent with those from the Netherlands
sample (Scheffer et al., 2003). Taken together, the two
studies suggest that inhibin B measured on day 1–4 is not a
good indicator of the number of developing follicles. Since
inhibin B is produced by the developing cohort of antral fol-
licles (Groome et al., 1996; Burger, 2000), measurements
later in the follicular phase may more accurately reflect the
size and quality of the developing cohort.
Our data show only a weak positive relation between age
and E2. This result joins an already inconsistent body of evi-
dence, among menstruating women, showing a positive
association (Welt et al., 1999; Scheffer et al., 2003), no
association (Klein et al., 1996b) or an inverse association
(Erdem et al., 2002). This inconsistency is probably
explained by methodological disparities.
Clinical application
From among the easily obtained indicators—age, ovarian
volume and levels of FSH, inhibin B and E2—we identified
the combination that best predicts ln(1þantral follicle count).
Other informative hormones might also be easy to obtain and
useful. For example, two recent studies—one in presumably
fecund women (de Vet et al., 2002) and the other in infertile
women (van Rooij et al., 2002)—suggest that anti-Mullerian
hormone levels may be a useful predictor of antral follicle
count.
Of the five indicators examined, only E2 was not signifi-
cantly related to ln(1þ follicle count). The regression model
which included age, ovarian volume, FSH and inhibin B
explained 49.6% of the variance in count. Age and ovarian
volume were the strongest predictors, followed by FSH.
The association between ovarian volume and count is not
surprising, since the ovary enlarges to accommodate the
developing follicles. Inhibin B, though significantly associ-
ated with count, was responsible for only a small proportion
of its variance. Removing this term from the equation
decreased the proportion of variance explained only trivially,
to 48.3%.
Predictors of antral follicle count
2187
by guest on January 11, 2015http://hum
rep.oxfordjournals.org/D
ownloaded from

To predict which women have #10 antral follicles, models
that include ovarian age indicators as well as chronological
age improve markedly on the model that includes chronologi-
cal age alone. Two models—A (chronological age, ovarian
volume, FSH and inhibin B) and B (chronological age, ovar-
ian volume and FSH)—are virtually indistinguishable in their
ability to discriminate between women with low and high
count. For the clinician, these models have the disadvantage
that they require measures of both ovarian volume and hor-
mones. Moreover, our regression equation derives from ovar-
ian and hormone data which were collected on two different
days of the cycle. Model D, which includes only chronologi-
cal age and hormone levels, performs nearly as well as
models A and B.
All models performed less well in younger (,35 years)
women than in older ($35 years) women, as expected given
the prevalence (13.9%) of low antral follicle count among
younger women. For a presumably fecund young woman
who wants to defer childbearing, our models do not improve
upon knowledge of her age alone for predicting whether or
not she will encounter problems when she later tries to con-
ceive. For an older woman who wants to know how long she
can postpone childbearing or who is trying to conceive and
wants to know whether to expect difficulties, our models
improve upon prediction based on chronological age alone.
In our sample, in which 52% of older women had low count,
the best model has a positive predictive value of 79%, a
marked improvement over the positive predictive value
(60%) of the model based only on chronological age. Thus,
our models help to identify women who might benefit from
expedited evaluation (for example, actually counting fol-
licles).
Three caveats are in order. First, our predictive regression
equations, which derive from a single sample, need replica-
tion to determine validity. Second, strictly speaking our
equations apply to women of demonstrated (or presumed)
fecundability; it remains to test whether or not they are useful
to women seeking treatment for infertility. Third, an under-
lying assumption for this work is that antral follicle count
predicts fecundability. While it is generally thought that low
count is associated with low fecundability, data are limited to
women seeking care for infertility and their response to
assisted reproduction treatment. These data do not readily
translate into predictions about conception for women of
known or presumed fecundability, nor are they generalizable.
It remains to test this assumption in samples not selected for
difficulty conceiving.
Finally, one aspect of the analytical approach merits elab-
oration. Although we defined low count as #10 antral fol-
licles, the choice was not guided by empirical evidence; the
biologically relevant cutpoint may be lower. In our sample,
antral follicle count of 10 corresponds to the median at age
39 years—when the risk of infecundity is $20% (Menken
et al., 1986) and the proportion of women taking .1 year to
conceive may be on the order of 50% (Schwartz and
Mayaux, 1982). If our equations are valid, they will improve
the prediction of time to conception in older women beyond
that provided by chronological age alone.
Acknowledgements
We acknowledge our co-investigators Drs Dorothy Warburton andMichel Ferin who collaborated in the design and implementation ofthe study. We thank Dr Grace Jorgensen who welcomed and facili-tated this study; we thank her and her colleagues for their help inproviding access to their patients. We acknowledge Maria Bautista,Jennifer Cassin, Terry Fox, the late Kris Keough, and Donna Westwho facilitated our work at the study hospital; Rebecca Russell andJeannie Small-Fish who obtained the sonography scans. We thankMegan Meldrum who carried out the fieldwork of the study andRenee Davenport who assisted in data processing and checking.This research would not be possible without the help of the womenwho participated in it to further understanding of the causes ofreproductive loss. This work was supported by a grant from theNational Institutes on Aging (R01 AG 15386).
References
Baker TG (1963) A quantitative and cytological study of germ cells inhuman ovaries. Proc R Soc Lond B Biol Sci 158,417–433.
Bancsi LF, Broekmans FJ, Mol BW, Habbema JD and te Velde ER (2003)Performance of basal follicle-stimulating hormone in the prediction ofpoor ovarian response and failure to become pregnant after in vitro fertili-zation: a meta-analysis. Fertil Steril 79,1091–1100.
Block E (1952) Quantitative morphological investigations of the follicularsystem in women: variations at different ages. Acta Anat 14,108–123.
Broekmans FJ, Scheffer GJ, Bancsi LF, Dorland M, Blankenstein MA and teVelde ER (1998) Ovarian reserve tests in infertility practice and normalfertile women. Maturitas 30,205–214.
Broekmans FJ, Faddy MJ, Scheffer G and Te Velde ER (2004) Antral fol-licle counts are related to age at natural fertility loss and age at meno-pause. Menopause 11,607–614.
Bukman A and Heineman MJ (2001) Ovarian reserve testing and the use ofprognostic models in patients with subfertility. Hum Reprod Update7,581–590.
Burger HG (2000) Inhibin and reproductive aging. Exp Gerontol 35,33–39.
CDC (Centers for Disease Control) (2000) Assisted Reproductive Technol-ogy Success Rates,2000.
Cramer DW, Barbieri RL, Xu H and Reichardt JK (1994) Determinants ofbasal follicle-stimulating hormone levels in premenopausal women. J ClinEndocrinol Metab 79,1105–1109.
Danforth DR, Arbogast LK, Mroueh J, Kim MH, Kennard EA, Seifer DBand Friedman CI (1998) Dimeric inhibin: a direct marker of ovarian aging.Fertil Steril 70,119–123.
de Vet A, Laven JS, de Jong FH, Themmen AP and Fauser BC (2002) Anti-mullerian hormone serum levels: a putative marker for ovarian aging. Fer-til Steril 77,357–362.
Erdem A, Erdem M, Biberoglu K, Hayit O, Arslan M and Gursoy R (2002)Age-related changes in ovarian volume, antral follicle counts and basalFSH in women with normal reproductive health. J Reprod Med47,835–839.
Faddy MJ, Gosden RG, Gougeon A, Richardson SJ and Nelson JF (1992)Accelerated disappearance of ovarian follicles in mid-life: implications forforecasting menopause. Hum Reprod 7,1342–1346.
Groome NP, Illingworth PJ, O’Brien M, Pai R, Rodger FE, Mather JP andMcNeilly AS (1996) Measurement of dimeric inhibin B throughout thehuman menstrual cycle. J Clin Endocrinol Metab 81,1401–1405.
Hansen KR, Morris JL, Thyer AC and Soules MR (2003) Reproductiveaging and variability in the ovarian antral follicle count: application in theclinical setting. Fertil Steril 80,577–583.
Howe G, Westhoff C, Vessey M and Yeates D (1985) Effects of age, ciga-rette smoking, and other factors on fertility: findings in a large prospectivestudy. Br Med J (Clin Res Ed) 290,1697–1700.
Klein NA, Battaglia DE, Miller PB, Branigan EF, Giudice LC and SoulesMR (1996a) Ovarian follicular development and the follicular fluid hor-mones and growth factors in normal women of advanced reproductive age.J Clin Endocrinol Metab 81,1946–1951.
Klein NA, Illingworth PJ, Groome NP, McNeilly AS, Battaglia DE andSoules MR (1996b) Decreased inhibin B secretion is associated with themonotropic FSH rise in older, ovulatory women: a study of serum and fol-licular fluid levels of dimeric inhibin A and B in spontaneous menstrualcycles. J Clin Endocrinol Metab 81,2742–2745.
J.Kline et al.
2188
by guest on January 11, 2015http://hum
rep.oxfordjournals.org/D
ownloaded from

Klein NA, Battaglia DE, Woodruff TK, Padmanabhan V, Giudice LC,Bremner WJ and Soules MR (2000) Ovarian follicular concentrations ofactivin, follistatin, inhibin, insulin-like growth factor I (IGF-I), IGF-II,IGF-binding protein-2 (IGFBP-2), IGFBP-3, and vascular endothelialgrowth factor in spontaneous menstrual cycles of normal women ofadvanced reproductive age. J Clin Endocrinol Metab 85,4520–4525.
Kline J, Kinney A, Reuss ML, Kelly A, Levin B, Ferin M and Warburton D(2004) Trisomic pregnancy and the oocyte pool. Hum Reprod19,1633–1643.
Lee SJ, Lenton EA, Sexton L and Cooke ID (1988) The effect of age on thecyclical patterns of plasma LH, FSH, oestradiol and progesterone inwomen with regular menstrual cycles. Hum Reprod 3,851–855.
Leidy LE, Godfrey LR and Sutherland MR (1998) Is follicular atresiabiphasic? Fertil Steril 70,851–859.
Lenton EA, Sexton L, Lee S and Cooke ID (1988) Progressive changes inLH and FSH and LH: FSH ratio in women throughout reproductive life.Maturitas 10,35–43.
Matrox Electronic Systems Ltd (2005) Matrox Inspector. Available athttp://www.matrox.com/imaging (Accessed March 15, 2005).
McNeil BJ and Hanley JA (1984) Statistical approaches to the analysis ofreceiver operating characteristic (ROC) curves. Med Decis Making4,137–150.
Menken J, Trussell J and Larsen U (1986) Age and infertility. Science233,1389–1394.
Metcalf MG and Livesey JH (1985) Gonadotrophin excretion in fertilewomen: effect of age and the onset of the menopausal transition. J Endo-crinol 105,357–362.
Pavlik EJ, DePriest PD, Gallion HH, Ueland FR, Reedy MB, Kryscio RJ andvan Nagell JR Jr (2000) Ovarian volume related to age. Gynecol Oncol77,410–412.
Reuss ML, Kline J, Santos R, Levin B and Timor–Tritsch I (1996) Age andthe ovarian follicle pool assessed with transvaginal ultrasonography. Am JObstet Gynecol 174,624–627.
Reyes FI, Winter JS and Faiman C (1977) Pituitary–ovarian relationshipspreceding the menopause. I. A cross-sectional study of serum follicle-stimulating hormone, luteinizing hormone, prolactin, estradiol, and pro-gesterone levels. Am J Obstet Gynecol 129,557–564.
Scheffer GJ, Broekmans FJ, Dorland M, Habbema JD, Looman CW and teVelde ER (1999) Antral follicle counts by transvaginal ultrasonographyare related to age in women with proven natural fertility. Fertil Steril72,845–851.
Scheffer GJ, Broekmans FJ, Bancsi LF, Habbema JD, Looman CW and teVelde ER (2002) Quantitative transvaginal two- and three-dimensionalsonography of the ovaries: reproducibility of antral follicle counts. Ultra-sound Obstet Gynecol 20,270–275.
Scheffer GJ, Broekmans FJ, Looman CW, Blankenstein M, Fauser BC,teJong FH and teVelde ER (2003) The number of antral follicles in normalwomen with proven fertility is the best reflection of reproductive age.Hum Reprod 18,700–706.
Schipper I, de Jong FH and Fauser BC (1998) Lack of correlation betweenmaximum early follicular phase serum follicle stimulating hormone con-centrations and menstrual cycle characteristics in women under the age of35 years. Hum Reprod 13,1442–1448.
Schwartz D and Mayaux MJ (1982) Female fecundity as a function of age:results of artificial insemination in 2193 nulliparous women with azoosper-mic husbands. Federation CECOS. New Engl J Med 306,404–406.
Thomford PJ, Jelovsek FR and Mattison DR (1987) Effect of oocyte numberand rate of atresia on the age of menopause. Reprod Toxicol 1,41–51.
Toner JP, Grainger DA and Frazier LM (2002) Clinical outcomes amongrecipients of donated eggs: an analysis of the U.S. national experience,1996–1998. Fertil Steril 78,1038–1045.
van Rooij IA, Broekmans FJ, te Velde ER, Fauser BC, Bancsi LF, de JongFH and Themmen AP (2002) Serum anti-Mullerian hormone levels: anovel measure of ovarian reserve. Hum Reprod 17,3065–3071.
Welt CK, McNicholl DJ, Taylor AE and Hall JE (1999) Female reproductiveaging is marked by decreased secretion of dimeric inhibin. J Clin Endocri-nol Metab 84,105–111.
Westhoff C, Murphy P and Heller D (2000) Predictors of ovarian folliclenumber. Fertil Steril 74,624–628.
Submitted on February 14, 2005; resubmitted on March 22, 2005; acceptedon April 1, 2005
Predictors of antral follicle count
2189
by guest on January 11, 2015http://hum
rep.oxfordjournals.org/D
ownloaded from
Copyright © 2022 FDOKUMEN