DAT Count, 2000-2007 - American Dental Education ...
15
American Dental Education Association Applicants and First-Time Enrollees, 2000-2009 Source: American Dental Education Association, U.S. Dental School Applicants and Enrollees, 2008 and 2009 Entering Classes 0 2,000 4,000 6,000 8,000 10,000 12,000 14,000 16,000 2000 2001 2002 2003 2004 2005 2006 2007 2008 2009 Number of Applicants or First-Year Enrollees Year Applicants First-Time Enrollees
-
Upload
khangminh22 -
Category
Documents
-
view
5 -
download
0
Transcript of DAT Count, 2000-2007 - American Dental Education ...

American Dental Education Association
Applicants and First-Time Enrollees, 2000-2009
Source: American Dental Education Association, U.S. Dental School Applicants and Enrollees,
2008 and 2009 Entering Classes
0
2,000
4,000
6,000
8,000
10,000
12,000
14,000
16,000
2000 2001 2002 2003 2004 2005 2006 2007 2008 2009
Nu
mb
er
of
Ap
pli
can
ts o
r F
irst-
Year
En
roll
ees
Year
Applicants
First-Time Enrollees

American Dental Education Association
Applicant/First-Year Enrollee Ratio, 2000-2009
0
0.5
1
1.5
2
2.5
3
3.5
2000 2001 2002 2003 2004 2005 2006 2007 2008 2009
Rati
o
Year
Source: American Dental Education Association, U.S. Dental School Applicants and Enrollees,
2008 and 2009 Entering Classes

American Dental Education Association
U.S. Dental School Applicants and First-Year
Enrollment Trends 1980 - 2009
0
3,000
6,000
9,000
12,000
15,000
18,000
19
80
19
81
19
82
19
83
19
84
19
85
19
86
19
87
19
88
19
89
19
90
19
91
19
92
19
93
19
94
19
95
19
96
19
97
19
98
19
99
20
00
20
01
20
02
20
03
20
04
20
05
20
06
20
07
20
08
20
09
Nu
mb
er
Year
Applicants First-Time Enrollees
Source: American Dental Education Association, U.S. Dental School Applicants and Enrollees, 2008 and 2009
Entering Classes

American Dental Education Association
Total First-Year Enrollees, 2000-2009
3,000
3,500
4,000
4,500
5,000
5,500
2000 2001 2002 2003 2004 2005 2006 2007 2008 2009
Nu
mb
er
of
Fir
st-
Year
En
roll
ees
Year
Source: American Dental Education Association, U.S. Dental School Applicants and Enrollees,
2008 and 2009 Entering Classes

American Dental Education Association
Grade Point Averages of Dental School
Applicants, 2000-2009
3.23.18 3.19 3.2
3.25 3.24
3.283.3
3.333.35
3.08 3.07 3.07 3.07
3.13 3.12
3.16
3.23.22 3.23
2.90
2.95
3.00
3.05
3.10
3.15
3.20
3.25
3.30
3.35
3.40
2000 2001 2002 2003 2004 2005 2006 2007 2008 2009
GP
A S
co
re (M
ea
n)
Year
GPA Total GPA Science
Source: American Dental Education Association, U.S. Dental School Applicants and Enrollees, 2008 and 2009
Entering Classes and historic

American Dental Education Association
Grade Point Averages of Dental School
Enrollees, 2000-2009
3.353.41 3.42 3.42 3.44
3.49 3.5 3.5 3.52 3.55
3.253.32 3.32 3.32 3.35
3.41 3.42 3.5 3.463.47
2.00
2.25
2.50
2.75
3.00
3.25
3.50
3.75
2000 2001 2002 2003 2004 2005 2006 2007 2008 2009
GP
A S
co
re (M
ea
n)
Year
GPA Total GPA Science
Source: American Dental Education Association, U.S. Dental School Applicants and Enrollees,
2008 and 2009 Entering Classes

American Dental Education Association
DAT Count, 2000-2009
0
2000
4000
6000
8000
10000
12000
2000 2001 2002 2003 2004 2005 2006 2007 2008 2009
DA
T C
ou
nt
Year
Source: American Dental Education Association, U.S. Dental School Applicants and Enrollees,
2008 and 2009 Entering Classes
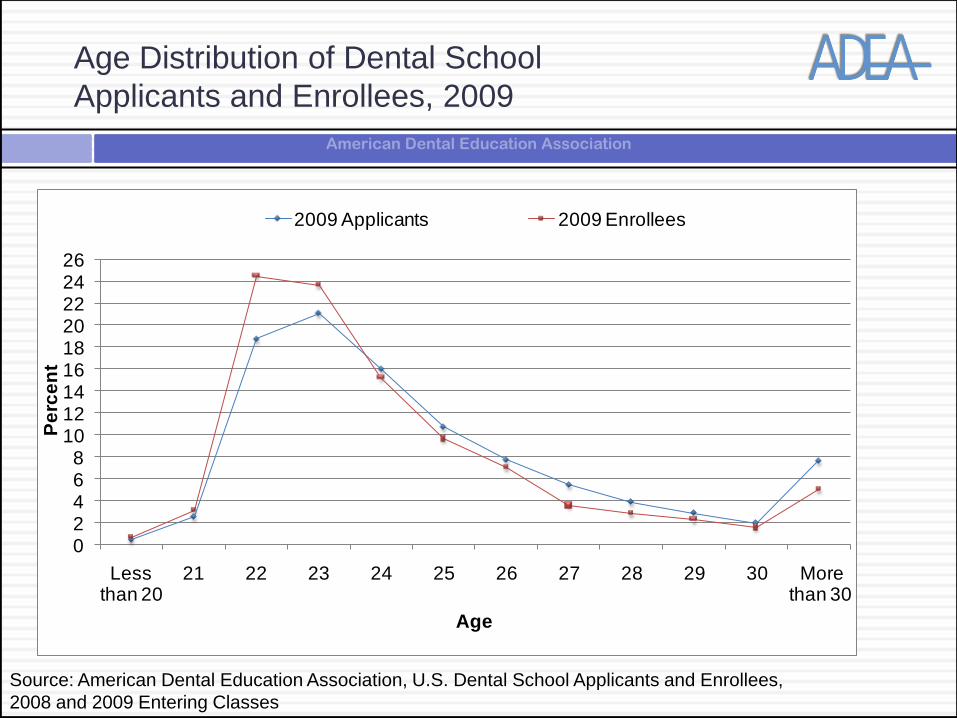
American Dental Education Association
Age Distribution of Dental School
Applicants and Enrollees, 2009
02468
101214161820222426
Less than 20
21 22 23 24 25 26 27 28 29 30 More than 30
Pe
rce
nt
Age
2009 Applicants 2009 Enrollees
Source: American Dental Education Association, U.S. Dental School Applicants and Enrollees,
2008 and 2009 Entering Classes

American Dental Education Association
Predental Majors of Applicants and
Enrollees, 2009
Predental Major % of Applicants % of Enrollees Enrollment
Rate
Language, Humanities, Fine Arts 4.1 4.3 41.9
Social Sciences 10.2 9.7 37.5
Biological Science 53.4 54.1 40.2
Chemistry/Physical Science 16.4 16.7 40.4
Math/ Computer Science 1.3 1.4 43.4
Engineering 2.9 3.3 44.6
Education 0.3 0.3 36.8
Business 3.7 3.7 39.1
Pre-dentistry 3.2 3.0 36.9
Other Major 3.9 3.1 31.6
No Major/ Missing 0.5 0.4 29.0
Total 100.0 100.0 39.6
Source: American Dental Education Association, Applicant Analysis Survey 2008-09, Using NCES BPS major field
coding system

American Dental Education Association
Percent of Applicants and Enrollees by Range of
Grade Point Averages, 2009
Source: American Dental Education Association, U.S. Dental School Applicants and Enrollees, 2008 and 2009
Entering Classes
GPA Scores < 2.50 2.50 – 2.74 2.75 – 2.99 3.0 – 3.24 3.25 – 3.49 3.5 – 3.74 3.75+
Applicants
Science GPA 6.9% 7.7% 14.2% 20.4% 20.7% 17.0% 13.4%
Total GPA 3.2% 3.9% 7.5% 21.6% 20.6% 27.5% 15.7%
Enrollees
Science GPA 0.4% 2.0% 6.9% 16.8% 23.5% 26.0% 24.2%
Total GPA 0.1% 0.5% 2.3% 12.6% 18.4% 37.6% 28.4%
American Dental Education Association
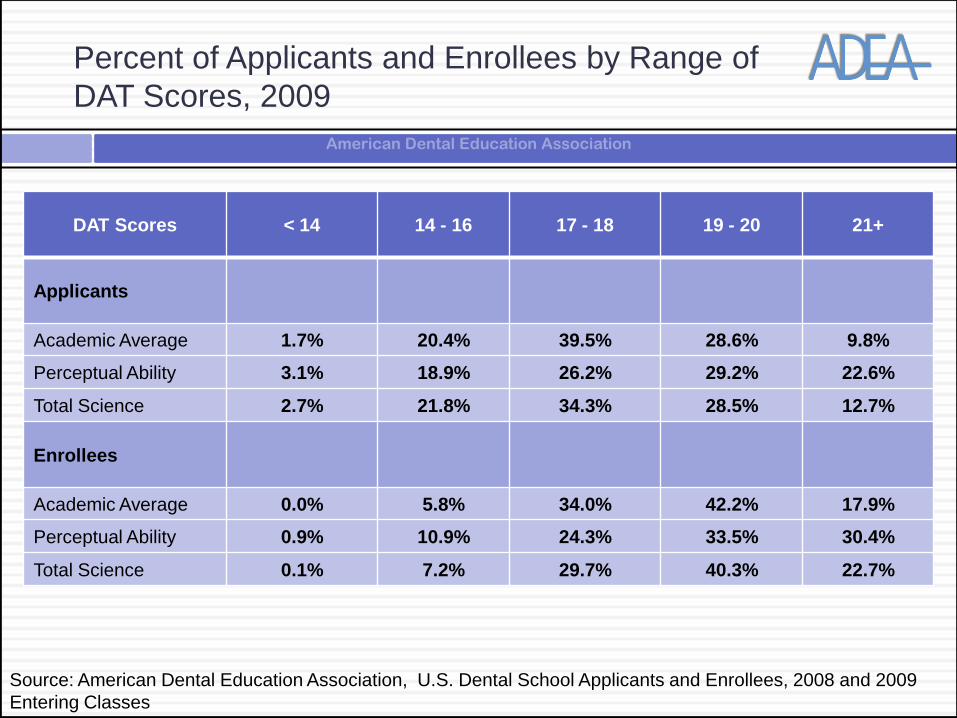
Percent of Applicants and Enrollees by Range of
DAT Scores, 2009
Source: American Dental Education Association, U.S. Dental School Applicants and Enrollees, 2008 and 2009
Entering Classes
DAT Scores < 14 14 - 16 17 - 18 19 - 20 21+
Applicants
Academic Average 1.7% 20.4% 39.5% 28.6% 9.8%
Perceptual Ability 3.1% 18.9% 26.2% 29.2% 22.6%
Total Science 2.7% 21.8% 34.3% 28.5% 12.7%
Enrollees
Academic Average 0.0% 5.8% 34.0% 42.2% 17.9%
Perceptual Ability 0.9% 10.9% 24.3% 33.5% 30.4%
Total Science 0.1% 7.2% 29.7% 40.3% 22.7%

American Dental Education Association
Percent of Applicants Enrolled in
Dental School, 2000-2009
0
10
20
30
40
50
60
2000 2001 2002 2003 2004 2005 2006 2007 2008 2009
54.557.6 58
55.4
47.2
42.5
37
33.6
39.4 39.6
Perc
en
t E
nro
lled
Year
Source: American Dental Education Association, U.S. Dental School Applicants and Enrollees,
2008 and 2009 Entering Classes

American Dental Education Association
Percent of Applicants from Various Geographical
Areas Enrolled in Dental School, 2009
33
37
39
39
41
42
46
0 5 10 15 20 25 30 35 40 45 50
Southeastern
Southwestern
Mid-Atlantic
Central
Far West
Northwestern
New England
Number
Ge
og
rap
hic
al A
rea
Source: American Dental Education Association, U.S. Dental School Applicants and Enrollees,
2008 and 2009 Entering Classes

American Dental Education Association
Geographical Source of Dental
School Enrollees, 2009
New England4%
Mid-Atlantic16%
Southeast21%
Central19%
Southwest11%
Northwest8%
Far West21%
Source: American Dental Education Association, U.S. Dental School Applicants and Enrollees,
2008 and 2009 Entering Classes. The graphs reflect U.S. regions only.

American Dental Education Association
Geographic Distribution of Applicants
and Enrollees, 2009
325
1710
2637
2010
1218
771
2144
150
663
881791
453325
887
0
500
1000
1500
2000
2500
3000
New England Mid-Atlantic Southeast Central Southwest Northwest Far West
Nu
mb
er
Geographical Area
Applicants Enrollees
Source: American Dental Education Association, U.S. Dental School Applicants and Enrollees,
2008 and 2009 Entering Classes