Production and turnover of N 2 fixing nodules in relation to foliage development in periodically...
15
Foresk;dogy Management Forest EcologyandManagement 73 (1995) 59-73 ELSEVIER Production and turnover of N2 fixing nodules in relation to foliage development in periodically pruned Erythrina poeppigianu (Leguminosae) trees Pekka Nygren”,“, Carlos Rarnirezb “Forestry Field Station, Universi@ of Helsinki, FIN-35500 Korkeakoski, Finland bEEFBM and CIPROC, Faculty of Agronomy, University of Costa Rica, San Pedro, Costa Rica Accepted 8 November1994 Abstract Many multi-purpose leguminous trees are managed by means of periodic prunings. A study on the dynamics of Nz fixing nodules in five sources of the neotropical agroforestry tree species Erythr~rrapoeppigiuna (Walpers) O.F. Cook was carried out in order to gain an understanding of the interaction between foliage development and nodulation between the prunings. The standing crop of active N2 fixing and senescent nodules was sampled monthly by soil cores during a pruning interval of 23 weeks, and nodule production and turnover were estimated on the basis of changes in the standing crops and the decomposition rate applying the compartment-flow model approach. Environmental factors remained stable during the study period. The pruning caused complete mortality of the nodules, and about a half of them decomposed within 2 weeks. New living nodules were observed at 10 weeks after pruning (WAP), and the highest standing crop of active nodules at 14 WAP (variation between sources 106-288 g per tree). The differences were statistically significant. The turnover rate was low before 14 WAP, but subsequently increased in connection with the initiation of leaf shedding. The turnover was compensated by the production of new nodules. The active nodule to foliage biomass ratio was highest at 14 WAP, 0.092-0.269, and decreased to about one-third of this towards the end of the pruning interval because of foliage growth. Pruning residues contributed 67%. foliage litterfall between prunings 24% and nodule turnover 9% of the potential N supply of 137-238 g per tree by E. poeppigiuna to the soil during the study period, with minor variation between sources in percentages. Keywords: Agroforestry; Bra&hizobium; Compartment-flow model; Genotype; Multi-purpose trees; Nodulation 1. Introduction Management of many multi-purpose woody leg- umes includes periodic pruning, e.g. for coppice timber (Harrington and Fownes, 1993)) fuelwood (Tejwani, 1987)) forage (Catchpoole and Blair, 1990) or green manure (Duguma et al., 1988; Beer et al., 1990; Erd- * Corresponding author: Tel. (358)-31-33 55 204;Fax. (358)-31- 33 55 555; Internet. [email protected]. mann et al., 1993). In general, leguminous trees tolerate such repeated prunings well (Russo and Budowski, 1986; Catchpoole and Blair, 1990) although variation between species does exist (Duguma et al., 1988). The regrowth after pruning seems to rely on the stem starch reserves (Erdmann et al., 1993), and there is a clear shift of growth allocation towards foliage production immediately after pruning (Duguma et al., 1988; Catchpoole and Blair, 1990). After a few months, how- ever, the biomass allocation of coppices no longer dif- 0378-l 127/95/$09.500 1995 Elsevier Science B.V. All rights reserved SSDIO378-1127(94)03505-9
-
Upload
independent -
Category
Documents
-
view
9 -
download
0
Transcript of Production and turnover of N 2 fixing nodules in relation to foliage development in periodically...

Foresk;dogy
Management Forest Ecology and Management 73 (1995) 59-73 ELSEVIER
Production and turnover of N2 fixing nodules in relation to foliage development in periodically pruned Erythrina poeppigianu
(Leguminosae) trees
Pekka Nygren”,“, Carlos Rarnirezb “Forestry Field Station, Universi@ of Helsinki, FIN-35500 Korkeakoski, Finland
bEEFBM and CIPROC, Faculty of Agronomy, University of Costa Rica, San Pedro, Costa Rica
Accepted 8 November 1994
Abstract
Many multi-purpose leguminous trees are managed by means of periodic prunings. A study on the dynamics of Nz fixing nodules in five sources of the neotropical agroforestry tree species Erythr~rrapoeppigiuna (Walpers) O.F. Cook was carried out in order to gain an understanding of the interaction between foliage development and nodulation between the prunings. The standing crop of active N2 fixing and senescent nodules was sampled monthly by soil cores during a pruning interval of 23 weeks, and nodule production and turnover were estimated on the basis of changes in the standing crops and the decomposition rate applying the compartment-flow model approach. Environmental factors remained stable during the study period. The pruning caused complete mortality of the nodules, and about a half of them decomposed within 2 weeks. New living nodules were observed at 10 weeks after pruning (WAP), and the highest standing crop of active nodules at 14 WAP (variation between sources 106-288 g per tree). The differences were statistically significant. The turnover rate was low before 14 WAP, but subsequently increased in connection with the initiation of leaf shedding. The turnover was compensated by the production of new nodules. The active nodule to foliage biomass ratio was highest at 14 WAP, 0.092-0.269, and decreased to about one-third of this towards the end of the pruning interval because of foliage growth. Pruning residues contributed 67%. foliage litterfall between prunings 24% and nodule turnover 9% of the potential N supply of 137-238 g per tree by E. poeppigiuna to the soil during the study period, with minor variation between sources in percentages.
Keywords: Agroforestry; Bra&hizobium; Compartment-flow model; Genotype; Multi-purpose trees; Nodulation
1. Introduction
Management of many multi-purpose woody leg- umes includes periodic pruning, e.g. for coppice timber (Harrington and Fownes, 1993)) fuelwood (Tejwani, 1987)) forage (Catchpoole and Blair, 1990) or green manure (Duguma et al., 1988; Beer et al., 1990; Erd-
* Corresponding author: Tel. (358)-31-33 55 204;Fax. (358)-31- 33 55 555; Internet. [email protected].
mann et al., 1993). In general, leguminous trees tolerate such repeated prunings well (Russo and Budowski, 1986; Catchpoole and Blair, 1990) although variation between species does exist (Duguma et al., 1988). The regrowth after pruning seems to rely on the stem starch reserves (Erdmann et al., 1993), and there is a clear shift of growth allocation towards foliage production immediately after pruning (Duguma et al., 1988; Catchpoole and Blair, 1990). After a few months, how- ever, the biomass allocation of coppices no longer dif-
0378-l 127/95/$09.50 0 1995 Elsevier Science B.V. All rights reserved SSDIO378-1127(94)03505-9

60 P. Nygren, C. Ramirez / Forest Ecology and Management 73 (I 995) 59-73
fers from that of trees propagated by seed (Harrington and Fownes, 1993).
Complete turnover of the N2 fixing nodules has been observed after the pruning of nodulated leguminous trees (Russo, 1984; Nygren and Ramfrez, 1993). The nodules are strong carbon sinks in N2 fixing legumes (Ryle et al., 1985; Vance and Heichel, 199 1)) and the nodulation following pruning is likely to be affected by the rate of foliage development during resprouting. However, a strong correlation exists between leaf N concentration and photosynthetic capacity (Field, 1991) and nodulation, or N supply, may affect the foliage gas exchange and development between prun- ings. In the agroforestry context, the phenology of N, fixing nodufes may play an important role in the nitro- gen dynamics of these systems (Ramfrez, 1993). Accurate estimates of the nodule production and turn- over of N2 fixing multi-purpose woody legumes man- aged with periodic prunings are thus of double interest: to understand the resprouting, biomass allocation and C and N dynamics of the tree itself, and to understand the N dynamics of the whole production system.
The N, fixing nodules appear to have very high turn- over and decomposition rates (Paul and Clark, 1989). Thus, the estimation of nodule production and turnover as the difference in the standing crop of nodules between two subsequent samplings, which implicitly assumes that no decomposition occurs during this period, may cause underestimations, as has been shown for the fine roots of forest trees (Gholz et al., 1986; Santantonio and Grace, 1987; Publicover and Vogt, 1993). A promising alternative is the compartment- flow model approach, which permits dynamic estima- tion of nodule production and turnover rate if the standing crop of living and dead nodules in two sub- sequent samplings and the nodule decomposition rate between the samplings are known (cf. Santantonio and Grace, 1987; Publicover and Vogt, 1993).
Erythrina poeppigiana (Walpers) O.F. Cook (Leg- uminosae: Phaseoleae) is a tree species widely used in agroforestry systems in tropical America, traditionally for shading coffee, cacao or cattle (Budowski, 1983)) and more recently for green manuring in alley cropping (Kass et al., 1989; Nygren and Jimtnez, 1993) and as a protein supplement for dairy cattle (Romero et al., 1993). Erythrina poeppigiana nodulates well with Bradyrhizobium spp. and is one of the most efficient N2 fixers among the widely used agroforestry tree spe-
ties (Dommergues, 1987). The phenology of the nod- ules in unpruned E. poeppigiana is inffuenced by environmental factors, especially soil humidity (Esca- lante et al., 1984). However, we did not observe any dependence of the development of standing crop (!I nodules on soil moisture and temperature in two peri odically pruned clones of E. poeppigiana C lYygren and Ramfrez, 1993).
In this paper we report the results of a field study on the production and turnover of N2 fixing nodules in relation to foliage development in four clones and ir half-sib family of E. poeppigiana during a 5 month pruning cycle. The production and turnover estimates were based on the compartment-flow model approach and we discuss the advantages and drawbacks oi’ {his approach applied to the study of nodule dynamics. Based on the field data we discuss the interaction between foliage and nodule developmenl in periodi- cally pruned woody legumes.
2. Material and methods
2.1. Study site
The study was carried out at the experimental farm of the Centro Agronomico Tropical de Investigacmn y Ensehanza (CATIE) , situated in Turrialba, Costa Rica (9”53’N, 83”39’W, 600 m above sea level). The cli- mate is humid tropical with an average temperature of 22.3”C, annual precipitation of 2600 mm and annual potential evapotranspiration (class A pan) of 1150 mm. There is a slightly drier season from February through April, but evapotranspiration exceeds precip- itation only in March (Fassbender, 1987). The soils are Typic Humitropept. The chemical soil characteris- tics of the study site are presented in Table 1; the site is acidic. with a relatively high aluminium concentra- tion.
The experiment, established in March 1991 with a spacing of 4 m X 4 m (625 trees ha- ’ )) consisted of 30 trees. The root systems of the trees were separated by a plastic barrier down to a depth of I m and the ground was kept bare by monthly manual weeding to facilitate root and nodule sampling. The tree material included four clones selected by the Nitrogen Fixing Tree Project of CATIE (2660,2662,2687 and 2693)) and a half-sib family (243 1 of Latin American Forest

Table 1
P. Nygren, C. Ramirez / Forest Ecology and Management 73 (1995) 59-73 61
Chemical characteristics of the O-25 cm soil layer at the study site. Values are means f SD (n = 6)
P” (“20)
OM” (mg g-‘)
N P K Ca Mg Exch. Al (mg g-‘) (mg I-‘) (meq 1-l) (meq 1-l) (meq I-‘) acidityb (meq 1-l)
(meq 1-l)
4.8 43.5 f 8.2 1.9*0.3 11.3f4.0 2.8 * 0.8 25.6*5.0 9.2 * 2.5 8.9 + 2.1 1.3*3.1
“Organic matter. “Al and other exchangeable acidity components.
Seed Bank, CATIE). The clones were planted using IS-m-long, previously rooted cuttings, and the half- sib family using greenhouse-grown 4-month-old seedlings. Six trees from each source of propagation (hereafter termed source) were planted in a completely randomised design. The clones were selected according to their foliage biomass production in the clonal eval- uation experiment of CATIE (Perez Castellon, 1990) : the best (2660, 3.03 kg per tree in 6 months), third (2687,2.33 kg per tree), sixth (2662,1.5 1 kg per tree) and eighth, the poorest (2693, 0.72 kg per tree). The half-sib family 243 1 was initially included in the exper- iment in order to compare the characteristics of root development in trees propagated by cuttings or by seeds.
Weather data were recorded every 10 min using an automatic weather station (Delta-T Devices Ltd., Cam- bridge, UK) established at the experimental site. A soil temperature probe was placed at a depth of 10 cm, 1 m from a tree stem. The gravimetric soil moisture at 10 cm depth was determined weekly as the mean of five samples dried for 24 h at 105°C.
The trees were pruned completely and pollarded to 1.5 m on 12 December 1991, on 12 June 1992 and on 19 November 1992. These pruning intervals are used in Costa Rican coffee plantations (Russo and Budowski, 1986) and alley cropping experiments of CATIE (Kass et al., 1989; Nygren and Jimenez, 1993).
2.2. Nodule sampling
The standing crop of nodules was sampled about 2 weeks before and after the second pruning, and there- after monthly until the third pruning, by removing 20 soil cores with a 7.5 cm diameter auger down to 15 cm depth at random points inside the root enclosure of each tree. No nodules of E. poeppigiana were found below 12 cm in an earlier study at CATIE (Lindblad and
Russo, 1986). Clone 2662 was sampled weekly between 2 and 6 weeks after pruning (WAP) in order to obtain more exact data. Damage to a transport root might have caused senescence of the fine roots and nodules supported by it. Thus, if the penetration resis- tance of the auger gave reason to suspect the existence of a coarse root in the randomised sampling point, the core was taken from a point close to the side of it. Minor loss of fine roots was unavoidable, but the fine roots are likely to recover rapidly after a small distur- bance.
The soil cores from each tree were pooled separately and washed on a 2 mm sieve. The nodule material passing through the sieve, mainly pieces of epidermis and cortex of disintegrated nodules, was considered to form part of the soil organic matter. Nodules were clas- sified by colour and texture as living or dead. The turgid living nodules were split to check for activity; red nod- ules, containing leghaemoglobin, were classified as active whereas others, green or white, as senescent. All dead nodule material, whole mushy and discoloured nodules as well as the pieces of partially disintegrated nodules caught by the sieve, was pooled as the dead nodule mass. The nodule samples were then dried for 24 h at 105°C and ashed for 6 h at 650°C (cf. Bbhm, 1979). Ash-free nodule dry mass was used in this study. Nodule mass per tree by nodule class (active, senescent or dead) was calculated by multiplying the sample mass by the ratio of the volume of the O-15 cm soil layer within a root enclosure (0.15 m X 4 m X 4 m = 2.4 m’) to sample volume (20~(0.375 dm)’ X 1.5 dm= 13.25 dm3).
The litterbag technique (Roberts et al., 1993) was applied to estimate the nodule decomposition rate. Nodules of E.poeppigiana were collected from another experiment with the species at CATIE. The nodules were washed on a 2 mm sieve, and all living and intact dead nodules captured by the sieve were air-dried for

62 P. Nygren, C. Ramt’rezIForest Ecology and Management 73 (1995) 5%73
1 week at ambient temperature (about 24°C). Thirty subsamples, each of 2 g, were separated. Ten subsam- ples were dried and ashed as described above to deter- mine the ash-free mass and 20 samples were enclosed in nylon mesh bags of 0.5 mm together with soil from the experimental site. The bags were buried to a depth of 7 cm on the experimental site. Ten bags were removed 7 days after insertion and another sample of IO bags after 14 days. The material in the bags was washed, dried and ashed as described above to deter- mine the sample mass.
2.3. Foliage development and littelfall
Leaf biomass (24 h at 105°C) and leaf area were determined at the time of nodule sampling by means of the relationship between the branch cross-sectional area below the first leaf or bifurcation and the leaf biomass or area supported by the branch, applying equations presented by Nygren et al. (1993). This relationship varies according to the developmental stage of the branch. The equations presented for young branches were applied in the first measurement (7 WAP) and the equations for fully lignified main branches in the other measurements ( 11 WAP onwards).
To determine litterfall, all the leaf litter of E. poep- pigiana inside the plastic barrier around each tree was collected weekly. The biomass of green twigs and woody branches at the pruning times was determined by weighing all the pruned material for each tree sep- arately, and drying subsamples for 24 h at 105°C to determine the moisture content of the pruning residues. Leaf samples were taken at the time of pruning, and the total nitrogen content of the leaves was determined by the micro-Kjeldahl method (Mtiller, 196 1) . Samples were taken of fully senescent, yellow leaves just before shedding in order to determine the N content of litter- fall.
2.4. Estimation of nodule production and turnover
The weekly data after pruning of clone 2662 indi- cated that the nodules classified as senescent because of a lack of leghaemoglobin activity died in less than 1 week. Since the sampling was carried out monthly, it would have been difficult to detect reliably the changes in such an unstable nodule class. Thus, the senescent and dead nodules were pooled together and will be
Production
l--- [Active nod&xl
[~~~pk:er~ce
Senescent nodules!
----r-~ -~
i ikcomposition
Soii organic matter
Fig. 1. Schematic presentation of the compartment-flow model: the boxes are the compartments, or standing crops of different nodule classes, and the arrows indicate the three flows, or processes. included. If the standing crops of nodule classes and the rate-of one process, decomposition, are known, then the rates of the remaining two processes can be estimated.
referred to as senescent in the following analysis, and throughout the paper.
The nodule production, senescence and decomposi- tion between the samplings was determined by apply- ing the compartment-flow model approach (Santantonio and Grace, 1987). In our application, the model consisted of two compartments or state varia- bles-standing crop of active and senescent nodules- and three fluxes or processes: production, senescence and decomposition. There is a flow of nodules from one group to another (Fig. 1) ; new active nodules are formed in the production process following rhiaobiai infection of the legume host, and the senescent nodules are formed from the active ones in the process of senes- cence. The senescent nodules pass to the soil organic matter through the process of decomposition. It is not necessary to know the factors regulating the processes of the model.
The change in the standing crops of nodules can bc determined from the successive samplings, and the decomposition rate can be determined independently. The instantaneous process rates of production and senescence are unknown, but if we assume constant process rates between two successive samplings, then the total production (Pi) and senescence (5,) of the nodules during the time interval i between the sam- plings can be estimated by solving a system of differ- ence equations. The assumption allows the process rates to vary from one sampling interval to another.
Let m and SM denote the standing crop of active and senescent nodules, respectively. The change in standing crop of active nodules equals production minus senescence during the interval i

P. Nygren. C. Ramirez/ Forest Ecology and Management 73 (1995) 59-73 63
AAMi = Pi - Si (1)
The change in standing crop of senescent nodules equals senescence minus decomposition (Oi)
ASMi=Si-Di (2)
If decomposition follows a negative exponential decay function, then the standing crop of senescent nodules remaining at the end of the interval i (SM,) is
SM,=SM,exp( -kXt,) (3)
where SM, is the initial standing crop of senescent nodules, ti the length of time interval i, and k the decay coefficient. It can be shown (Santantonio and Grace, 1987) that, in accordance with this assumption, Eq. (2) can be written as a differential equation
dSh4 -=s;-kxSM
dt
where si is the constant senescence rate during interval i. Eq. (4) can be integrated and Si solved
(5)
k(SM,-SM,exp( -kXti)) s; =
1-exp( -kxtJ (6)
The total senescence during the interval i can be solved by integrating the constant senescence rate over the interval
s,=t,Xk(SM,-SM,exp( -kXt,)) I 1 -exp( -kxtJ
(7)
Now total decomposition and production during the interval i can be calculated
Dj=SMO-SM,+Si (8)
P;=AM,-AMO+Si (9)
where subscripts 0 and t refer to the standing crop at the beginning and end of interval i, respectively.
2, i.-++-. ----
-4 0 4 a 12 16 20 24
32 T
22 1 : i___c- __-+
-4 0 4 a 12 I6 20 24
Weeks alter pruning
Fig. 2. Development of soil temperature and moisture during the study period. Pruning was carried out on 12 June 1992.
3. Results
3.1. Environmental conditions
At the beginning of the pruning cycle rather high soil temperature together with low soil moisture was observed (Fig. 2). Later on during the cycle the values were more constant, notably from 12 WAP onwards. A slight decrease in soil moisture was observed at the end of the cycle, after 20 WAP.
Total precipitation during the study period was 1280 mm (from June through November 1992), which is about half of the annual precipitation. The daytime mean temperature was 23.6”C (maximum 29.8’C) and nighttime mean temperature 2O.O”C (minimum 15.2”C). The average daytime humidity was 80.5%, and the nights generally had saturating humidity. The values were typical for Turrialba. No long-term data on soil temperature and moisture are available for CATIE’s farm, but as the rainfall, temperature and air humidity conditions were rather typical, the same may hold true for the soil temperature and moisture values.
3.2. Development of the standing crop of nodules between prunings
The temporal variation of the average standing crop of active and senescent nodules over the 23 weeks

64 P. Nygren. C. Ramirez/ Forest Ecology and Management 73 (1995159-73
i 24
4 0 4 8 12 16 20 24
Weeks after pruning
---..- 245, -.-- 2660 - 2662 ---*--~- 2681 --- 2693
Fig. 3. Development of the average standing crop of active (top) and senescent (bottom) nodules in four clones and a half-sib family (2431) of Erythrina poeppigiana during a pruning cycle of 23
weeks. The pruning was carried out on 12 June 1992. Statistically significant differences (Duncan’s MRT at 5%) between tree sources were obtained in samplings marked with arrows.
0-i -2 0 2 4 6 8 10 12 14
CQYS Fig. 4. Development of average nodule mass in the litter bags used
for the determination of the nodule decomposition rate. Error bars indicate one standard deviation in each sampling.
pruning cycle is presented in Fig. 3. The within-clone coefficient of variation was typically 30-50% for active nodules, and close to 100% for the more unstable senes- cent nodules. Pruning caused a very rapid decline in the standing crop of active nodules and a sharp increase in the standing crop of senescent nodules, especially in
clones 2660 and 2662. The standing crop of senescent nodules at 2 WAP was equal to the standing crop of active nodules before pruning only in clones 2660 and 2693, indicating that in the other sources the nodules had died more rapidly after pruning and some material had already been disintegrated.
No living nodules were found at 6 WAP. At 10 WAP some active nodules were observed, but the number of senescent nodules was negligible. A very rapid increase in the standing crop of active nodules was observed after 10 WAP, and at 14 WAP it was greater than the standing crop observed before the initial pruning, and remained higher until the next pruning. The standing
:?4Il ?GfVl 7667 268.’ ?6((
?4.31 7660 2662 768/ 2693
:rce 5o:,,w
L 1 1 1 0 ‘, /i I ‘6 1” ':o 14 '14 ia n ‘18 - 17
Fig. 5. Total production (top), senescence (middle) and decompo- sition (bottom) of nodules between subsequent samplings of their
standing crop in four clones and a half-sib family (2431) of Ev- thrina poeppigkna. The intervals are in weeks after pmningThe pruning was carried out on 12 June 1992.

P. Nygren. C. Ramirez / Forest Ecology and Management 73 (1995) 59-73 65
Table 2
Total production, senescence and decomposition of the nodules in five sources of Evthrina poeppigiana from 6 to 22 weeks after
pruning, estimated according to the compartment-flow model
Tree
source
Production Senescence
(gperti=)
Decomposition
2431 291 163 144
2660 855 641 512
2662 468 265 243
2687 163 94 74
2693 298 176 139
crop of senescent nodules remained low except in clone 2662 at 18 WAP and clone 2660 at 18 and 22 WAP. The standing crop of active nodules remained lowest in clone 2687 throughout the study period. There was a decline in the standing crop of active nodules in 243 1, 2687 and 2693 at the end of the pruning cycle, but an increase in clones 2660 and 2662 (Fig. 3). From 10 WAP onwards the differences in the standing crops of active nodules between sources were statistically sig- nificant (Duncan’s multiple range test (MRT) at 5%).
The highest observed standing crop of active nodules corresponds to 180 kg, 15 1 kg, 139 kg, 13 1 kg and 66 kg ha- ’ in 243 1,2693,2660,2662 and 2687, respec- tively. These figures are about the same order as the standing crop of 107-145 kg ha-’ observed by Russo (1984) in a Costa Rican coffee plantation with 280 trees ha- ’ , but about the same leaf biomass production per hectare as in our experiment.
Changes in the nodule mass of the litter bags used for the determination of decomposition rate are pre- sented in Fig. 4. The decomposition rate was quite high; about half of the nodule mass disappeared within 2 weeks. The decay coefficient, k, of Eq. (3)) determined analytically from the data, was 0.053. This means that 23% of the initial standing crop of senescent nodules would be present at the end of the sampling interval of 28 days. The value of k was cross-checked with the weekly data about the standing crop of senescent nod- ules in clone 2662. No active nodules were observed at 18 days after pruning (DAP), thus in that phase no increase in the standing crop of senescent nodules occurred as a result of the senescence of active nodules. The value of k was solved analytically for the period between 18 and 39 DAP (standing crop of senescent nodules 25.4 g and 8.8 g per tree, respectively), giving
0.050. The value of k determined from the litter bags was used in the compartment-flow model calculations.
3.3. Estimation of production and turnover
The estimates computed with Eqs. (7)-( 9) for total production, senescence and decomposition between subsequent samplings of the standing crop of nodules are presented in Fig. 5. The amount of nodules decom- posed during the different time intervals was quite high, as could be expected on the basis of the rapid disap- pearance of senescent nodules after pruning.
The highest production values were observed in all the sources from 10 to 18 WAP. The model resulted in negative production estimates for family 2431 for the first period, 14-18 WAP and 18-22 WAP, and for clone 2693 at 18-22 WAP. In every case negative estimates were obtained for several of the six trees sampled. All these estimates were associated with a period of strong decline in the standing crop of active nodules, but only slight changes in the standing crop of senescent nodules (Fig. 3). The high estimates for production, senescence and decomposition of clone 2660 at 14-18 WAP were associated with a slight decline in the standing crop of active nodules and simultaneous rapid increase in the standing crop of senescent nodules. The other high production estimates, notably at l@-14 WAP in 2431 and 2662, were associated with low changes in the standing crop of senescent nodules and subsequently with quite low senescence estimates.
The nodule production pattern was roughly the same in all sources: low to zero initial production increased gradually and culminated at 14-18 WAP (2660 and 2693) or 10-14 WAP (other sources) and declined towards the end of the pruning cycle (Fig. 5).
Table 3
Total production and senescence (g per tree) of the nodules in five sources of Eq*thrina poeppigiana from 6 to 22 weeks after pruning, estimated according to the positive (production) and negative (senescence) changes in standing crop of active nodules
Tree
source
Production Senescence
2431 286 159
2660 248 27
2662 215 19
2681 104 34
2693 242 138
66 P. Nygren. C. Ramirez / Forest Ecology and Management 73 (1995) 59-73
The nodule production pattern was roughly the same in all sources: low to zero initial production increased gradually and culminated at 14-18 WAP (2660 and 2693) or 10-14 WAP (other sources) and declined towards the end of the pruning cycle (Fig. 5).
The total amount of nodule production, senescence and decomposition from 6 to 22 WAP is presented in Table 2, computed as the sum of the monthly values of these variables (Fig. 5). This period corresponds to the production of new nodules after pruning. The total pro- duction was highest in 2660 and 2662. These two clones also had the highest total senescence and decom- position values, indicating rapid nodule dynamics. The total values were lowest in 2687.
The total production and senescence estimated as the sum of positive and negative changes, respectively, in the standing crop of active nodules (Fig. 3)) omitting the decomposition of senescent nodules, are presented in Table 3. This method has been applied e.g. by Esca- lante et al. ( 1984). It appears that the total nodule senescence estimated by the compartment-flow model was higher than the negative changes in the standing crop of active nodules, and that the production estimate
was higher than the positive changes in all sources except in 243 1.
3.4. Nodule biomass to leaf biomass ratio
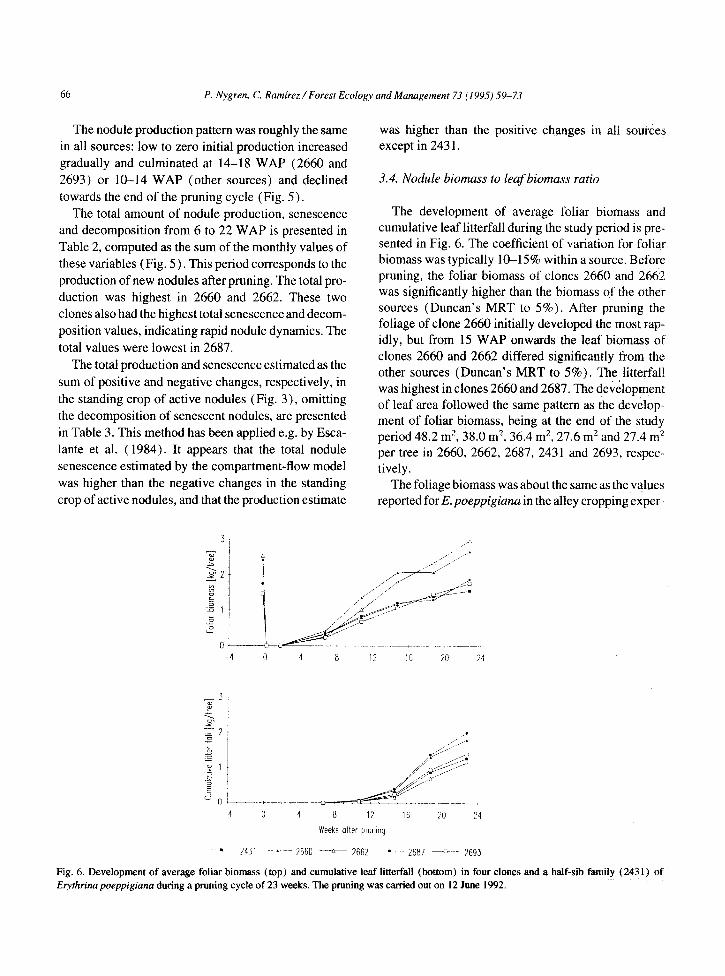
The development of average folk biomass and cumulative leaf litterfah during the study period is pre- sented in Fig. 6. The coefficient of variation for foliar biomass was typically lO--1.5% within a source. Before pruning, the folk biomass of clones 2660 and 2662 was significantly higher than the biomass of the other sources (Duncan’s MRT to 5%). After pruning the foliage of clone 2660 initially developed the most rap- idly, but from 15 WAP onwards the leaf biomass of clones 2660 and 2662 differed significantly from the other sources (Duncan’s MRT to 5%). The litterfall was highest in clones 2660 and 2687. The development of leaf area followed the same pattern as the develop- ment of folk biomass, being at the end of the study period 48.2 m’, 38.0 m2, 36.4 m’, 27.6 m2 and 27.4 m? per tree in 2660, 2662, 2687, 2431 and 2693, respec- tively.
The foliage biomass was about the same as the values reported for E. poeppigianu in the alley cropping exper-
a 12 16 20 ?4
Weeks after prunmg
---.-- 2131 -~ 1 ~~ 166" --i- 2662 -.- Zfj", --ii-- 2693
Fig. 6. Development of average folk biomass (top) and cumulative leaf litterfall (bottom) in four clones and a half-sib family (2431) of
Elythrina poeppigiana during a pruning cycle of 23 weeks. The pruning was carried out on 12 June 1992.
P. Nygren, C. Ramkez / Forest Ecology and Management 73 (1995) 59-73
-.- 2431
-A- 2660
- 2662
-‘- 2687
----ct- 2693
4 8 12 16 20 24 4 8 12 16 20 24
Weeks after pruning Weeks after pruning
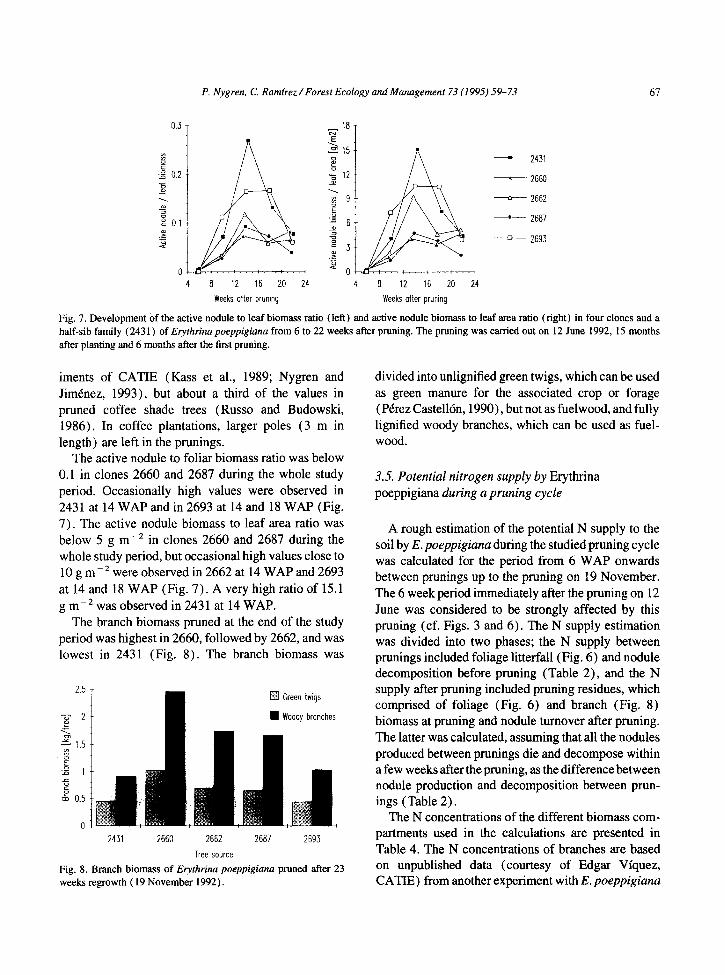
Fig. 7. Development of the active nodule to leaf biomass ratio (left) and active nodule biomass to leaf area ratio (right) in four clones and a half-sib family (2431) of Elyrhtino poeppigiuna from 6 to 22 weeks after pruning. The pruning was carried out on 12 June 1992, 15 months after planting and 6 months after the first pruning.
iments of CATIE (Kass et al., 1989; Nygren and divided into unlignified green twigs, which can be used Jimenez, 1993), but about a third of the values in as green manure for the associated crop or forage pruned coffee shade trees (Russo and Budowski, (Perez Castellbn, 1990)) but not as fuelwood, and fully 1986). In coffee plantations, larger poles (3 m in lignified woody branches, which can be used as fuel- length) are left in the prunings. wood.
The active nodule to foliar biomass ratio was below 0.1 in clones 2660 and 2687 during the whole study period. Occasionally high values were observed in 2431 at 14 WAP and in 2693 at 14 and 18 WAP (Fig. 7). The active nodule biomass to leaf area ratio was below 5 g m-* in clones 2660 and 2687 during the whole study period, but occasional high values close to 10 g m-* were observed in 2662 at 14 WAP and 2693 at 14 and 18 WAP (Fig. 7). A very high ratio of 15.1 g m-* was observed in 2431 at 14 WAP.
3.5. Potential nitrogen supply by Erythrina poeppigiana during a pruning cycle
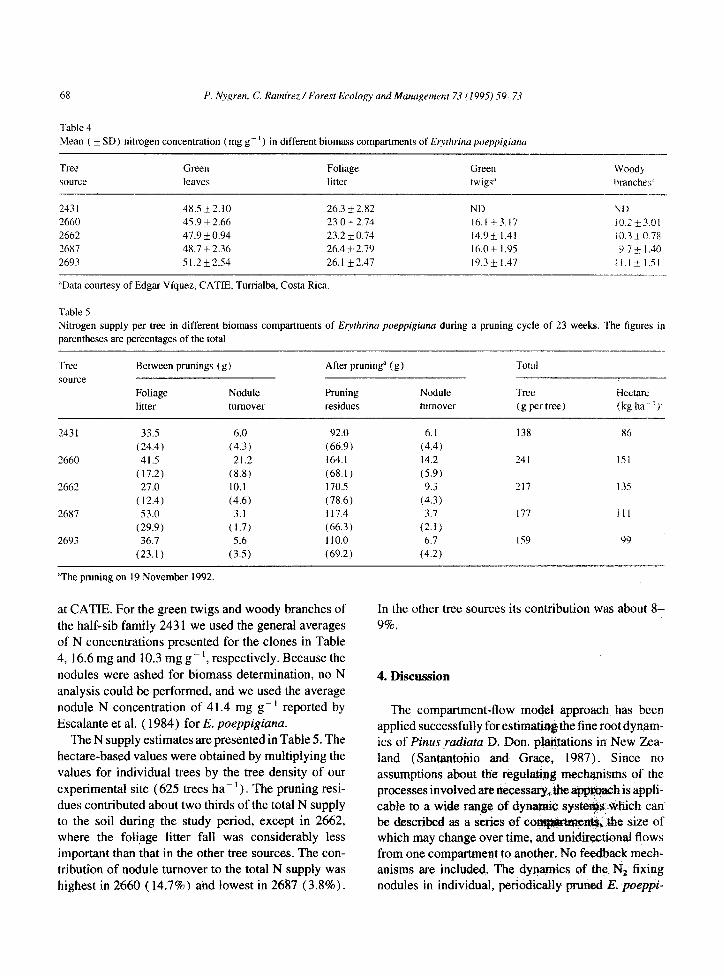
The branch biomass pruned at the end of the study period was highest in 2660, followed by 2662, and was lowest in 2431 (Fig. 8). The branch biomass was
A rough estimation of the potential N supply to the soil by E. poeppigiana during the studied pruning cycle was calculated for the period from 6 WAP onwards between prunings up to the pruning on 19 November. The 6 week period immediately after the pruning on 12 June was considered to be strongly affected by this pruning (cf. Figs. 3 and 6). The N supply estimation was divided into two phases; the N supply between prunings included foliage litterfall (Fig. 6) and nodule decomposition before pruning (Table 2), and the N supply after pruning included pruning residues, which comprised of foliage (Fig. 6) and branch (Fig. 8) biomass at pruning and nodule turnover after pruning. The latter was calculated, assuming that all the nodules produced between prunings die and decompose within a few weeks after the pruning, as the difference between nodule production and decomposition between prun- ings (Table 2).
2.5 q Green twigs
7 2 n Woody branches
r_
f 1.5
2 .z 1 5 6
65 0.5
0
2431 2660 2662
Tree source
2687 2693
Fig. 8. Branch biomass of Erythrina poeppigiana pruned after 23 weeks regrowth ( 19 November 1992).
The N concentrations of the different biomass com- partments used in the calculations are presented in Table 4. The N concentrations of branches are based on unpublished data (courtesy of Edgar Viquez, CATIE) from another experiment with E. poeppigiana
68 P. Nygren, C. Ramirez / Forest Ecology and Management 73 (I 995) 59-73
Table 4 Mean ( *SD) nitrogen concentration (mg g- ’ ) in different biomas compartments of Er?/thrinu poeppigianu
-
Tree
source
Green
leaves
Foliage
litter Green twigs’
Woody branches”
---.
243 1 48.5+2.10 26.3 + 2.82 2660 45.9 * 2.66 23.0 + 2.74
2662 47.9 * 0.94 23.2 * 0.74 2687 48.7 f 2.36 26.4k2.79 2693 51.2+2.54 26.1 * 2.47
“Data courtesy of Edgar Viquez, CATIE, Turrialba, Costa Rica.
ND ND 16.1-t3.17 iGf.~.!)l
14.9F 1.41 10.3_+0.78 16.0 + 1.95 ii.7 c I .40 19.3 + 1.47 I I.1 t I..51
---.-
Table 5 Nitrogen supply per tree in different biomass compartments of Etythrina poeppigiana during a pruning cycle of 23 weeks. The figures in parentheses are percentages of the total
Tree
source
Between prunings (g)
Foliage Nodule
litter turnover
After pruning” (g ) Total
Pruning Nodule Tree Hectare residues turnover k per tree) (kg ha--If
243 I 33.5 6.0 92.0 6.1 138 86
( 24.4 ) (4.3) (66.9) (4.4) 2660 41.5 21.2 164.1 14.2 241 151
( 17.2) (8.8) (68.1) (5.9) 2662 27.0 10.1 170.5 9.3 217 135
(12.4) (4.6) (78.6) (4.3) 2687 53.0 3.1 117.4 3.7 177 Ill
(29.9) (1.7) (66.3) (2.1) 2693 36.7 5.6 110.0 6.7 159 99
(23.1) (3.5) (69.2) (4.2)
“The pruning on 19 November 1992.
at CATIE. For the green twigs and woody branches of the half-sib family 243 1 we used the general averages of N concentrations presented for the clones in Table 4, 16.6 mg and 10.3 mg g-‘, respectively. Because the nodules were ashed for biomass determination, no N analysis could be performed, and we used the average nodule N concentration of 41.4 mg g- ’ reported by Escalante et al. ( 1984) for E. poeppigiuna.
The N supply estimates are presented in Table 5. The hectare-based values were obtained by multiplying the values for individual trees by the tree density of our experimental site (625 trees ha- ’ ) . The pruning resi- dues contributed about two thirds of the total N supply to the soil during the study period, except in 2662, where the folipge litter fall was considerably less important than that in the other tree sources. The con- tribution of nodule turnover to the total N supply was highest in 2660 ( 14.7%) and lowest in 2487 (3.8%).
In the other tree sources its contribution was about 8- 9%.
4. Discussion
The compartment-flow model approach has been applied successfully for e&mat&g the fine root dynam- ics of Pinus ~radiata D. Don. plqtations in New Zea- land (Santantonio and Grace, 1987). Since no assumptions about the regulatig mechanisms of the processes involved are r&~ssary, the app~~h is appli- cable to a wide range of dynamic syste&:which can be described as a series of co I@,, the size of which may change over time, and unidirectional flows from one compartment to another. No feedback mech- anisms are included. The dynamics of the N2 fixing nodules in individual, periodically pruned E. peppi-

P. Nygren, C. Ramirez / Forest Ecology and Management 73 (1995) 59-73 69
giuna trees comply with these requirements. In the case of fine roots, the compartment-flow approach produces more accurate production estimates than estimations based on changes in standing crop only, if the errors in standing crop of dead fine roots are not extreme (Pub- licover and Vogt, 1993).
Owing to the model structure (Eqs. (7)-( 9) ), good estimates of the changes in the standing crop of senes- cent nodules and the decomposition rate are crucial for the accuracy of all estimates computed with the model; a biased estimate of the amount of senescence is math- ematically transferred to the other estimates, while an error in the determination of the standing crop of active nodules only affects the production estimate. Publi- cover and Vogt ( 1993) have indicated that the loss of fine roots during sample processing causes an under- estimation of production, while misclassification of dead fine roots as living produces overestimations of production. The loss and misclassification of nodules are improbable errors, since the nodules are much easier to detect than fine roots and the classification of nodules is relatively easy.
Owing to the rather low standard deviation in the decaying nodule mass in the litter bags (Fig. 4) the value of the decay coefficient, k, was also quite accu- rately estimated. This was also evidenced by the cross- checking with the weekly data on the disappearance of senescent nodules in clone 2662. The soil moisture and temperature varied only slightly during the study period, and it was therefore not necessary to correct the value of the decay coefficient with environmental fac- tors.
The estimates of monthly production, senescence and decomposition, computed with Eqs. (7)-( 9)) were mostly in agreement with the observed changes in the standing crop of active and senescent modules, taking into account the rather high decomposition rate of nod- ules. These estimates were considerably higher than the production and senescence estimates based on the pos- itive and negative changes in the standing crop of active nodules (cf. Tables 2 and 3)) as predicted in the sim- ulation study of Publicover and Vogt ( 1993). How- ever, the compartment-flow model produced unexpected estimates of nodule production in the case of negative values for 243 1 and 2693. Also the produc- tion, senescence and decomposition values for clone 2660 were rather high. In the case of 2662 and 2687
the estimates were consistent with the measured stand- ing crops throughout the study period.
Two probable reasons for the negative production estimates have been indicated: random sampling error (Publicover and Vogt, 1993) and too low decay coef- ficient (Santantonio and Grace, 1987), while the sam- pling interval is not important, unless the senescence and decomposition rates are very high (Publicover and Vogt, 1993). In the light of the within-source coeffi- cient of variation, the standing crop of active nodules was a more accurately measured variable than the standing crop of senescent nodules. Root nodules have been reported to occur in groups in E. poeppigiana (Russo, 1984; Escalante et al., 1984), as well as in other legumes (Paul and Clark, 1989)) and such nodule clustering may have caused sampling error in the stand- ing crop of senescent nodules. The spatial sampling error in the standing crop of active nodules probably was not so high.
Some nodules may have also disappeared due to herbivory by soil macro fauna and not just as a result of microbial decomposition. Herbivory is probably most severe in the N rich, recently senesced nodules, and may have also directly affected the standing crop of active nodules. Furthermore, even the microbial decomposition rate was rather high, and the nodules passed rapidly through the senescent phase. Conse- quently, the senescent nodule class may have been quite unstable in time, and more frequent sampling would have been necessary. Publicover and Vogt ( 1993) have shown that the accuracy of production estimates of compartment flow models is reduced when the turnover and decomposition rates increase relative to the sam- pling interval. The sampling errors in time and space are likely to have been averaged out in the estimates of total values for the whole study period (cf. Publicover and Vogt, 1993)) while the omittance of herbivory may have caused systematic underestimation of both pro- duction and turnover.
The direct testing of any method for estimating below-ground biomass dynamics of field grown plants is extremely difficult, if not impossible, because of the sampling problems. Most of the proposed estimation techniques ignore the decomposition of dead material (Bohm, 1979; Persson, 1990). The compartment-flow model overcomes this problem and has been shown to be the most accurate method in a simulation study (Publicover and Vogt, 1993). Based on our results and

70 P. Nygren. C. Ramirezl Forest Ecology and Management 73 (199.5) 59-73
theoretical considerations discussed above, we suggest that nodule production, senescence and decomposition can be estimated using the compartment-flow model approach, but that a more frequent sampling of the standing crop of nodules should be carried out, perhaps on a weekly basis even, owing to the relatively short duration of the nodules in the senescent nodule com- partment. The importance of herbivory in nodule turn- over also seems to require further study.
In spite of the limitations of the estimated values, it can be concluded that a significant flow of organic carbon and nitrogen occurs through the nodules of E. poeppigiana during vegetative growth; a sizable frac- tion of the active nodules senesced, and the senescent nodules decomposed within a rather short time interval. Because the active nodule mass remained somewhat high during the vegetative cycle, a replenishment of nodules that undergo senescence and decay has to be envisioned, otherwise a sharp decrease in the active nodule biomass would have occurred. In the following paragraphs, we make an attempt to explain the mech- anisms possibly involved in regulating the flow of car-
bon through the root nodules, mainly based on the development of the standing crop of nodules, foliage and soil microclimate during the course of the study.
Immediately after pruning the interruption of car- bohydrate Aow to the nodules was the obvious reason for rapid nodule senescence; the recovery of the pruned trees is likely to rely initially on the internal reserves of non-structural carbohydrates (Erdmann et al., 1993), these being directed to the production of new leaves. The nodule senescence was almost complete already at 2 WAP, except in 2660, which may indicate that this clone has a larger pool of non-structural car- bohydrates than the others. Owing to the loss of N as result of pruning, the N requirements of the regrowing foliage are high, and nodule production is initiated immediately after the foliage is large enough to main- tain the carbon sink formed by the nodules. Initiation of new nodules was observed between 6 and 10 WAP. The rather low soil N and high soil P concentrations of the study site both favour nodule formation (Paul and Clark, 1989).
During the regrowth after pruning, the causes of the observed nodule turnover are less obvious. Soil tem- perature as well soil moisture were rather stable during the study period. The fact that these environmental factors were not playing a dominant role in this process
is further supported by our findings in an earlier study with clones 2660 and 2693: the standing crop of active nodules was stable over a relatively dry, warm period, and the highest nodule mass was recorded during the driest part of the study period (Nygren and Ramirez. 1993).
In the earlier study we found that the maximum standing crop of active nodules occurred before the shedding of the leaves first appeared during the regrowth (Nygren and Ramirez, 1993). This phenom- enon was also observed during the course of this work; the first important leaf fall occurred between 15 and 19 WAP, in connection with a high nodule senescence in all sources, except for 2693. This suggests a functional balance between the foliage and nodules. Because the standing crop of active nodules remained rather high, production of new nodules obviously co-occurred with the senescence, but the active nodule to leaf biomass ratio decreased towards the end of the pruning cycle.
The decrease in the active nodule to leaf biomass ratio suggests a shift in carbohydrate allocation and proportionally less photosynthates are dedicated to the nodules, unlike the annual fodder legume Lupinus albus L. in which a fairly constant proportion of pho- tosynthates was assigned to the nodules (Pate.et al.. 1980). The decrease in nodulation apparently had no detrimental effect on the growth of the trees, because the growth of all sources during this phase was luxu- riant. The growth of stem and branches may alter the need for carbon and nitrogen assimilating organs within the tree, because the formation of woody tissbe is an important carbon sink in trees, but the wood N concen- tration is relatively low.
The potential N supply from E. poeppigiana in nod- ule turnover, foliage litter and pruning residues appeared to be quite high. Most of the N was supplied in pruning residues, and only a minor proportion in nodule turnover. The potential N supply per hectare during a pruning cycle (Table S), is enough to fulfil the N fertilisation requirements of a maize crop at our study site, about 100 kg ha- ’ (North Carolina State University, 1974). The N supply estimate for nodule turnover (Table 5) was considerably lower than the estimate of 57-66 kg ha-’ yeu- ’ for unpruned E. poeppigiana in a Venezuelan cacao plantation (Esca- lante et al., 1984). Further, the latter estimate is prob- ably an underestimation, because nodule turnover was calculated as the sum of negative changes between ten

P. Nygren, C. Ramirez / Forest Ecology and Management 73 (1995) 59-73 71
subsequent samplings of the standing crop of nodules (cf. Publicover and Vogt, 1993).
In the agroforestry context, this study raises impor- tant questions about the effects of nodule dynamics in periodically pruned trees on the N economy of the whole system. First, the fate of the nodule N after senes- cence is unknown. In the case of annual legumes it has been postulated that, after defoliation of the legume host, the nodule N is released to the soil, but during foliage growth this N is rapidly reabsorbed by the fine roots of the legume itself (Sprent, 1983). If the same is true in the case of perennial woody legumes, only the nodule senescence after pruning might cause a net N release from nodules into the soil. This potential N release is likely to be utilised efficiently by the com- panion crop because nodules are already incorporated in the soil, and less N losses occur compared with leaf mulches left on the ground (Lathwell, 1990).
Another important concern of pruning to the N econ- omy of an agroforestry system is that, because of the relatively slow recovery of nodules, the regrowth of the E. poeppigiuna canopy must rely on the soil N pool during the first weeks after pruning. This may cause competition for N with some agricultural crops; Esco- bar Mdnera et al. (1994) found evidence about the competition for N between E. poeppigiana and com- mon beans (Phaseolus vulgaris L.) in an alley crop- ping experiment, while Haggar and Beer (1993) did not observe competition between E. poeppigiana and maize (Zea muys L.) during the 2 months following sowing, or during the phase of very low nodulation of E. poeppigiana observed in this study. In the later phases of the maize crop the competition is likely to be for solar radiation (Nygren and Jimenez, 1993). The high N supply in pruning residues probably compen- sates for the negative effects of pruning on the N econ- omy of an agroforestry system, at least in the long run (Haggar et al., 1993), but quantification of the different effects requires further study.
5. Conclusions
Pruning caused complete turnover of N2 fixing nod- ules in E. poeppigiuna. Development of the new nod- ules started a few weeks after the initiation of foliage development, suggesting that immediately after prun- ing the non-structural carbohydrate reserves of the pole
are used for foliage development. The nodule to foliage biomass ratio peaked in quite an early phase of the pruning interval, which may be caused by the high N requirements of the rapidly growing foliage. Later on during the pruning cycle the proportional allometry between leaves and nodules shifted in favour of the leaves, although the nodule production continued dur- ing the whole cycle.
The nodules of E. poeppigiuna appeared to be short- lived, and important nodule turnover occurred during the pruning interval of 23 weeks. The nodule devel- opment pattern was the same in the five sources studied, but significant differences in the nodule biomass pro- duced were observed. The sources with the highest leaf biomass (2660 and 2662) also nodulated most actively. The compartment-flow model appeared to be a promising approach in the estimation of production, senescence and decomposition of N2 fixing nodules. Its behaviour was theoretically predictable, but applica- tion details need more development and testing.
In the light of this data on nodule production and turnover during a pruning interval, the pruning of woody legumes used in agroforestry systems is likely to have important effects on the N economy of the whole system. However, quantification of the effects requires further study. Taking into account the highly dynamic nature of N, fixing nodules of leguminous trees managed with periodic prunings, the stochastic N balance calculations of an agroforestry system are of little value in understanding the role of the trees in its N economy, but dynamic models describing the N and C fluxes within and between the system components are required.
Acknowledgements
We are grateful to the Nitrogen Fixing Tree Project of CATIE for providing us with the experimental site and tree material, Manuel Brenes for his dedicated field work and Prof. Pertti Hari and Dr. Eero Nikimuaa for their useful comments on the manuscript. John Derome reviewed the English of the manuscript. The study was financed by a scholarship horn the Academy of Finland to P.N. and the support of the EC Project No TS2/0172 (Institute of Botany, University of Marburg, Germany) to C.R.
72 P. Nygren. C. Ramirez / Forest Ecology and Management 73 (1995) 59-73
References
Beer, J., Bonnemann, A., Chavez, W., Fassbender, H.W., Imbach, A.C. and Mattel, I., 1990. Modelling agroforestry systems of cacao (Theobroma cacao) with laurel (Cordia alliodora) or
poro (Erythrina poeppigiana) in Costa Rica. V. Productivity indices, organic material models and sustainability over ten years. Agrofor. Syst., 12: 229-249.
Bohm, W., 1979. Methods of Studying Root Systems. Springer, Berlin, Germany, 188 pp.
Budowski, G., 1983. An attempt to quantify some current agrofores- try practices in Costa Rica. In: P.A. Huxley (Editor), Plant Research and Agroforestty. ICRAF, Nairobi, Kenya, pp. 43-62.
Catchpoole, D.W. and Blair, G., 1990. Forage tree legumes. 1. Pro- ductivity and N economy of Leucaena, Gliricidia, Calliandra and Sesbaniaand tree/green panic mixtures. Aust. J. Agric. Res., 41: 521-530.
Dommergues, Y.R., 1987. The role of biological nitrogen fixation in agrofomstry. In: H.A. Stepplerand P.K.R. Nair (Editors), Agro- forestry, A Decade of Development, ICRAF, Nairobi, Kenya, pp. 245-27 1.
Duguma, B., Kang, B.T. and Okali, D.U.U., 1988. Effect of pruning intensities of three woody leguminous species grown in alley cropping with maize and cowpea on an alfisol. Agrofor. Syst., 6: 19-35.
Erdmann, T.K., Nair, P.K.R. and Kang, B.T., 1993. Effect of cutting frequency and cutting height on reserve carbohydrates in Gliri-
cidia sepium (Jacq.) Walp. For. Ecol. Manage., 57: 45-60. Escalante, G., Herrera, R. and Aranguren, J., 1984. Fijaci6nde nitr6-
geno en &boles de sombra (Elythrina poeppigiuna) en cacaota- les de1 norte de Venezuela. Pesq. Agropec. Bras., 19 (edicao especial) : 223-230.
Escobar Mtinera, M., Ramirez, C. and Kass, D., 1994. Nitr6geno en un cultivo de callejones de por6 (Eryrhrinapueppigiana) y mad- ero negro (Gliricidia sepium) con frijol comuu (Phuseolus md-
garis). In: H.D. Thurston, M. Smith, G. Abawi and S. Kear (Editors), Tapado, Los Sistemas de Siembra con Cobertura. CII- FAD, Ithaca, NY, pp. 140-156.
Fassbender, H.W., 1987. Modelos edafol6gicos de sistemas agro- forestales. CATIE Tunialba, Costa Rica, 475 pp.
Field, C., 1991. Ecological scaling of carbon gain to stress and resource availability. In: H.A. Mooney, W.E. Winner and E.J. Pell (Editors), Response of Plants to Multiple Stresses. Aca- demic Press, San Diego, CA, pp. 35-65.
Gholz, H.L., Hendry, L.C. and Cropper, Jr., W.P., 1986. Organic matter dynamics of fine roots in plantations of slash pine (Pinus elliottii) in north Florida. Can. J. For. Res., 16: 529-538.
Haggar, J.P. and Beer, J.W., 1993. Effect on maize growth of the interaction between increased nitrogen availability and compe- tition with trees in alley cropping. Agrofor. Syst., 21: 239-249.
Haggar, J.P., Tanner, E.V.J., Beer, J.W. and Kass, D.C.L., 1993. Nitrogen dynamics of tropical agroforestry and annual cropping systems. Soil Biol. Biochem., 25: 1363-1378.
Harrington, R.A. and Fownes, J.H., 1993. Allometry and growth of planted versus coppice stands of four fast-growing tropical tme species. For. Ecol. Manage., 56: 31.5-327.
Kass, D.L., Barmutes, A., Bermudez, W., Campos, W., Jirnenez, M. and Sanchez, J.F., 1989. Rest&ados de seis altos de invest&&% de cultivo en callejones (alley cropping) en La Montaha, Tur- rialba. El Chasqui, 19: 5-24.
Lathwell, D., 1990. Legume green manures. Trap. Soils Bull. No. 90-01, Soil Management Collaborative Research Support Pro- gram, Raleigh, NC, 30 pp.
Lindblad, P. and Russo, R.. 1986. C,H,-reduction by Erythrmapoep- pigiana in a Costa Rican coffee plantation. Agrofor. Syst.. 4: 33- 37.
Mtiller, L., 1961. Un aparato micro-Kjeldahl simple para antiisis rutinarios rapidos de materia vegetal. Turrialba, I 1: 17-2.5.
North Carolina State University, 1974. Agronomic-economic research on tropical soils: annual report for 1974. Soii Science Department, North Carolina State University, Raleigh.
Nygren, P. and Jim&tez, J.M., 1993. Radiation regime and nitrogen supply in modelled alley cropping systems of Epthrina po$-
pigiuna with sequential maize-bean cultivation. Agmfor. Syst.. 21: 271-285.
Nygren, P. and RamIrez, C.. 1993. Phenology of Nz fixing nodules in pruned clones of E@winapoeppigiana. In: S.B. Westley and M.H. Powell (Editors), Erythriraa in the New and Old Worlds. Nitrogen Fixing Tree Research Reports, Spec. Jss.. 1993: 297- 305.
Nygren, P.. Rebottaro. S. and Chavarrta, R., 1993. Application of pipe model theory to non-destructive estimation of leaf biomass and leaf area of pruned agroforestry trees. Agrofor. Syst., 23: 6% 77.
Pate, J.S., Layzell, D.B. and Atkins, C.A., 1980. Transport exchange of carbon, nitrogen and water in context of whole plant growth and functioning-case history of anodulated annual legume. Ber. Dtsch. Bot. Ges. Bd., 93: 243-255.
Paul, E.A. and Clark, F.E., 1989. SoiI Microbiology and Biochem- istry. Academic Press, San Diego, CA, 273 pp.
Perez Caste&%, E.E., 1990. Evaluacicin de1 ensayo clonal de Ecv- rhrina spp. en San Juan Sur, Turrialba, CostaRica. M.Sc. Thesis, CATIE, Turrialba, Costa Rica, 111 pp.
Persson. H.. 1990. Methods of studying root dynamics in relation to nutrient cycling. In: A.F. Harrison, P. lneson and 0.W.. Heal (Editors), Nutrient Cycling in Terrestrial Ecosystems: Field Methods, Application and Interpretation. Elsevier Applied Sci- ence, London, UK, pp. 198-217.
Publicover, D.A. and Vogt, K.A., 1993. A comparison of methods for estimating forest fine root production with respect to sources of error. Can. J. For. Res., 23: 1179-l 186.
Ramfrez, C., 1993. Agrofomstry: a mechanistic approach. In: D. Buxton. R. Shibles, R-A. For&erg, B.L. Blad, K.H. Asay, G.M. Paulsen and R.F. Wilson (Editors), International Crop Science I. Crop Science Society of America, Madison, WI, pp. 43-48.
Roberts, M.J., Long, S.P., Tieszen, L.L. and Beadle. C.L., 1‘993. Measurement of plant biomass and net primary production of herbaceous vegetation. In: D.O. Hall, J.M.O. Scnrlock, H.R. Bol- h?u-Nordenkampf, R.C. Leegoodand S.P. Long (Editors). Pho- tosynthesis and Production in aChangingEnvironment: A Field and Laboratory Manual. Chapman and Hall, London, pp. l-2 1.
Romero, F., Abarca, S., Corado, L., Tobon, J., Kass, M. and Pezo, D., 1993. Production de leche de vacas en pastoreo suplemen-

P. Nygren, C. Ramirez / Forest Ecology and Management 73 (1995) 59-73 73
tadas con por6 (Evfhrina poeppigiana) en el tr6pico hlimedo de Costa Rica. In: S.B. Westley and M.H. Powell (Editors), Evthrinn in the New and Old Worlds. Nitrogen Fixing Tree Research Reports, Spec. Iss., 1993: 223-230.
Russo, R.O., 1984. Studies on Elythrina poeppigiana (Walpers) O.F. Cook, a versatile tree in Costa Rican farms. Ph.D. Thesis, Southeastern University, New Orleans, Louisiana, USA.
Russo, R.O. and Budowski, G., 1986. Effect of pollarding frequency on biomass of Eqvhrina poeppigiana as a coffee shade tree. Agrofor. Syst., 4: 145-162.
Ryle, G.J.A., Powell, C.E. and Gordon, A.J., 1985. Defoliation in white clover: regrowth, photosynthesis and N2 fixation. Ann. Bot., 56: 9-18.
Santantonio, D. and Grace, J.C., 1987. Estimating fine-root produc- tion and turnover from biomass and decomposition data: a com- partment-flow model. Can. J. For. Res., 17: 900-908.
Sprent, J.I., 1983. AgriculturaJ and horticultural systems: Implica- tions for forestry. In: J.C. Gordon and C.T. Wheeler (Editors), Biological Nitrogen Fixation in Forest Ecosystems: Foundations and Applications. Martinus Nijhoff/Dr. W. Junk, The Hague, the Netherlands, pp. 213-232.
Tejwani, K.G., 1987. Agroforestry practices and research in India. In: H.L. Gholz (Editor), Agroforestry: Realities, Possibilities and Potentials. Martinus Nijhoff, Dordrecht, the Netherlands, pp. 109-136.
Vance, C.P. and Heichel, G.H., 1991. Carbon in N, fixation: limita- tion and exquisite adaptation. Annu. Rev. Plant Physiol. Mol. Biol.. 42: 373-392.

![Early identification and phenetic analysis of eight species of subtribe Cassiineae [Leguminosae : Caesalpinioidae] found in Tripura in relation to their seedling morphology.](https://static.fdokumen.com/doc/165x107/6322bbe8050768990e0ffde2/early-identification-and-phenetic-analysis-of-eight-species-of-subtribe-cassiineae.jpg)