
Using multi-date high spectral resolution data to assess the physiological status of macroscopically...
19
This article appeared in a journal published by Elsevier. The attached copy is furnished to the author for internal non-commercial research and education use, including for instruction at the authors institution and sharing with colleagues. Other uses, including reproduction and distribution, or selling or licensing copies, or posting to personal, institutional or third party websites are prohibited. In most cases authors are permitted to post their version of the article (e.g. in Word or Tex form) to their personal website or institutional repository. Authors requiring further information regarding Elsevier’s archiving and manuscript policies are encouraged to visit: http://www.elsevier.com/authorsrights
Transcript of Using multi-date high spectral resolution data to assess the physiological status of macroscopically...

This article appeared in a journal published by Elsevier. The attachedcopy is furnished to the author for internal non-commercial researchand education use, including for instruction at the authors institution
and sharing with colleagues.
Other uses, including reproduction and distribution, or selling orlicensing copies, or posting to personal, institutional or third party
websites are prohibited.
In most cases authors are permitted to post their version of thearticle (e.g. in Word or Tex form) to their personal website orinstitutional repository. Authors requiring further information
regarding Elsevier’s archiving and manuscript policies areencouraged to visit:
http://www.elsevier.com/authorsrights

Author's personal copy
International Journal of Applied Earth Observation and Geoinformation 27 (2014) 169–186
Contents lists available at ScienceDirect
International Journal of Applied Earth Observation andGeoinformation
jo ur nal home page: www.elsev ier .com/ locate / jag
Using multi-date high spectral resolution data to assess thephysiological status of macroscopically undamaged foliage on aregional scale
Veronika Kopackováa,c,∗, Jan Misureca,c, Zuzana Lhotákováb, Filip Oulehlea,Jana Albrechtováb
a Czech Geological Survey, Klárov 3, Prague 1, 118 21, Czech Republicb Charles University in Prague, Faculty of Science, Department of Experimental Plant Biology, Vinicná 5, Prague 2, 128 44, Czech Republicc Charles University in Prague, Faculty of Science, Department of Applied Geoinformatics and Cartography, Albertov 6, Prague 2, 128 43, Czech Republic
a r t i c l e i n f o
Article history:Received 12 June 2013Accepted 18 September 2013
Keywords:Foliar biochemistryForest monitoringImage spectroscopyChlorophyllCarotenoidsTree stress
a b s t r a c t
Forests play an important role in regulation of the global climate; moreover, they provide human beingswith a whole range of ecosystem services. Forest health and ecosystem functioning have been influencedby anthropogenic activities and their consequences, such as air pollution, surface mining, heavy metalcontamination, and other biotic and abiotic stress factors, which had an especially serious effect on centralEurope. Many aspects of the physiological state of trees are more or less related to the concentrations oftwo main groups of leaf photosynthetic pigments: chlorophylls and carotenoids. Therefore, their contentscan be used as non-specific indicators of the actual tree physiological status, stress and the pre-visible treedamage. Variations in leaf biochemical composition affect foliar optical properties and can be assessedremotely using high spectral resolution data (hyperspectral data). These data were successfully used inearlier studies to detect vegetation stress and damage. However, only a few approaches have dealt withthe use of hyperspectral remote sensing to assess vegetation physiological status on a regional scale.Moreover, little or no research has been done on assessing vegetation health while utilizing multi-datehyperspectral images.
In this study, the method for assessing forest health conditions using optical indices retrieved fromhyperspectral data was applied to the two temporal HyMap date sets acquired in 07/2009 and 08/2010to detect stress for the Norway spruce forests in Sokolov, NW Bohemia, a region affected by long-termextensive mining. The classification results were validated by ground truth data (total chlorophyll – Cab,carotenoids – Car and carotenoid to chlorophyll ratio – Car/Cab) and were associated with the geochemicalconditions of the forest stands. Both biochemical analysis of the sampled foliage and classification of2009 and 2010 hyperspectral image identified the same sites affected by vegetation stress. In addition tohigher Car/Cab, which enabled detection of the stressed trees using hyperspectral image data, these sitesshowed critically low pH and lower values for the macronutrient parameters in both organic horizonsand, in addition, both sites exhibit critically low base cation to aluminum ratios (Bc/Al) for lower organicand top mineral (0–20 cm) soil horizons.
The results of this study demonstrate (i) the potential application of hyperspectral remote sensing asa rapid method of identifying tree stress prior to symptom expression, and (ii) the added value of multi-temporal approaches for hyperspectral data and its further potential for monitoring forest ecosystems.
© 2013 Elsevier B.V. All rights reserved.
Abbreviations: AAS, atomic absorption spectrometry; ANOVA, analysis of variance; AOT, aerosol optical thickness; BRDF, bi-directional reflectance distribution function;Cab, total chlorophylls content; Car, total carotenoids content; Car/Cab, carotenoids to chlorophylls ratio; D718/D704, ratio of the 1st derivatives of refletance at 718 and 704 nm;DMF, dimethylforamide; expSIPI, exponentially transformed SIPI index; GPS, global positioning system; HCRF, hemispherical-conical reflectance factor; HS, hyperspectral;IMU, inertial measurement unit; IS, imaging spectroscopy; K–S, Kolmogorov–Smirnov test; MLC, maximum likelihood classification; MNF, minimum noise fraction; NDVI,normalized difference vegetation index; REP, red-edge position; SIPI, structure insensitive pigment index; TEA, total exchangeable acidity; WV, water vapor.
∗ Corresponding author at: Czech Geological Survey, Klárov 3, Prague 1, 118 21, Czech Republic. Tel.: +420 257089481; fax: +420 257531376.E-mail address: [email protected] (V. Kopacková).
0303-2434/$ – see front matter © 2013 Elsevier B.V. All rights reserved.http://dx.doi.org/10.1016/j.jag.2013.09.009

Author's personal copy
170 V. Kopacková et al. / International Journal of Applied Earth Observation and Geoinformation 27 (2014) 169–186
1. Introduction
Forests play an important role in regulation of the global cli-mate via the global carbon cycle, evapotranspiration, and earthsurface albedo (Bonan, 2008; Jackson et al., 2008). Moreover,forests provide humans with a whole range of ecosystem ser-vices including provision of food and forest products, regulationof the hydrological cycle, protection of soil resources, etc. Foresthealth and ecosystem functioning have recently been influencedby anthropogenic activities and their consequences, such as air pol-lution, surface mining, heavy metal contamination (Aznar et al.,2009), and other biotic and abiotic stress factors such as pestinvasions and soil acidification (Sebesta et al., 2011), which hadan especially high effect on central Europe. Therefore, large-scalemonitoring of forest health and its methodologies are in the fore-front of interest for scientists as well as forest managers.
Many aspects of the physiological state of trees are more orless connected with the concentrations of two main groups ofleaf photosynthetic pigments: chlorophylls and carotenoids (Ustinet al., 2009). Vegetation with a high concentration of chlorophyllis considered to be healthy, as the chlorophyll content is linkedto greater light-use efficiency, photosynthetic activity and carbondioxide uptake (Blackburn, 2007; Kramer, 1981; Wu et al., 2008).Chlorophyll generally decreases under stress and during senes-cence (Blackburn, 2007). Carotenoids play the main role in theprocess of incident light absorption, transportation of energy to thereaction center of the photosystems, and heat dissipation of energyin case of high irradiation (Demmig-Adams and Adams, 1996).Combination of the influences of chlorophylls and carotenoids isthus connected with light-use efficiency (Landsberg et al., 1997).However, higher carotenoid to chlorophyll ratios indicate vege-tation stress and senescence (Demmig-Adams and Adams, 1996;Young and Britton, 1990).
Therefore, the content of biochemical compounds such as pho-tosynthetic pigments can be used as non-specific indicators ofthe actual tree physiological status, stress and the pre-visible treedamage. Moreover, the contents of photosynthetic pigments areclosely related to photosynthetic performance and can serve asnon-specific stress indicators in a very early stage, when the needlesdo not yet show any microscopic or macroscopic damage symp-toms (Lepedus et al., 2005; Soukupova et al., 2000; Tzvetkova andHadjiivanova, 2006). When dealing with photosynthetic pigmentsas vegetation stress indicators, seasonal dynamics in pigmentcontents in evergreen conifers must be taken into account. Changesin pigment levels reflect the normal physiological responses in theplant as well as the responses to environmental stress (Gamon andSurfus, 1999; Gitelson et al., 2001, 2002; Grisham et al., 2010).The chlorophyll content in needles increases in the spring (fromMay/June) and during the summer (July–September) and thenremains relatively constant until October, when it again decreasesduring the frost hardening process (Oquist and Huner, 2003). Someof the carotenoids (e.g., lutein, �-carotene) exhibit stable contentsduring the seasons in contrast to several groups of xanthopylls (e.g.,antheraxanthin, zeaxanthin; Yatsko et al., 2011), which increasesignificantly during the winter and serve as effective protection ofthe photosynthetic apparatus under conditions of high irradianceand low temperature during the winter and spring (Maslova et al.,2009). The total carotenoid to total chlorophyll ratio decreases inparallel with the chlorophyll increase in the spring (Martz et al.,2007).
Conventional laboratory analyses of leaf biochemical param-eters can be very precise, although they have a number ofdisadvantages (e.g., limited number of samples, high labor and costdemands). It has been demonstrated that variations in leaf bio-chemical composition affect foliar optical properties (Carter andKnapp, 2001; Clevers and Kooistra, 2012; Kokaly et al., 2009; Schlerf
et al., 2010; Sims and Gamon, 2002; Ustin et al., 2009; Zhang et al.,2012). The spectral reflectance characteristics of plant canopiesare influenced by the chemical composition, internal leaf struc-ture and spatial distribution of the leaves (Asner, 1998; Ollinger,2011; Zwiggelaar, 1998). Leaf pigments are well positioned toabsorb incident light and can be assessed with spectral reflectance.The more important absorption pigments and their characteristicabsorption wavelengths/wavebands were reviewed by Zwiggelaar(1998).
Modern remote sensing has become a novel tool not onlyfor detecting target materials but also for monitoring dynamicprocesses and physical-property induced changes. The use of mul-tispectral imagery has been demonstrated to effectively map thedistribution of ecosystem types and vegetation systems (Everittet al., 2002; Gould, 2000; Knorn et al., 2009; Lamb and Brown,2001; Vogelmann et al., 2012); however, the low spectral resolu-tion of multispectral imagery is a major limitation. On the otherhand, imagery with higher spectral resolution (e.g., hyperspec-tral) provides sufficient spectral resolution to describe diagnosticabsorption signatures and allows sufficiently detailed species dis-crimination and biochemical differentiation (Aspinall, 2002; Feretand Asner, 2013; Kokaly et al., 2009; Lass and Prather, 2004; Majekeet al., 2008; Odagawa and Okada, 2009; Underwood et al., 2003;Ustin et al., 2004; Zhao et al., 2013).
Data with very high spectral resolution – also referred to asimaging spectroscopy (IS) data, which is also known in the remotesensing community as hyperspectral data – has been successfullyused in earlier studies to detect vegetation stress and damage(Campbell et al., 2004, 2007; Hamzeh et al., 2013; Hernandez-Clemente et al., 2011; Pu et al., 2008; Rathod et al., 2013; Romeret al., 2012; Sanches et al., 2013a; van der Meer et al., 2002; vander Werff et al., 2008). In the forestry context, most publishedprecedents used IS data as a basis for identification of stress-sensitive wavelengths (e.g., Ahern, 1988, Masaitis et al., 2013;Sanches et al., 2013a), for development of stress-sensitive vegeta-tion indices (e.g., Carter and Miller, 1994; Carter and Knapp, 2001;de Jong et al., 2012; Lausch et al., 2013) and for integrating stress-sensitive indices in more complex models (e.g., Fassnacht et al.,2012; Pontius et al., 2008; Shafri et al., 2012; Zarco-Tejada et al.,2004; Zhao et al., 2013).
In contrast, only a few approaches (Asner and Martin, 2009;Kampe et al., 2010) have dealt with the use of hyperspectral remotesensing (image spectroscopy) to assess the physiological status ofvegetation on a regional scale, the term “regional” is understoodto mean related or limited to a particular region, area or part, asof a country or the body. Moreover, little or no research has beendone on assessing vegetation health utilizing multi-date hyper-spectral image data, as a time-series of hyperspectral data andreliable methods to extract change/stress information for remotelysensed data analysis are still lacking. We recently proposed a newmethod for assessing forest health condition via normalizationand further statistical integration of optical indices retrieved fromHS image data (Misurec et al., 2012). To assess subtle changesin the physiological status of macroscopically undamaged foliageof Norway spruce, this method integrated the following HyMapderived parameters: quantitative retrieval of chlorophyll concen-trations (Cab); Red-Edge Position (REP) (Curran et al., 1995) – theinflection point of the spectral curve in the red-edge region, whichis shifted to shorter wavelengths under vegetation stress (e.g., thepresence of heavy metals in the soil) (Chang and Collins, 1983;Clevers et al., 2002; Curran et al., 1995; Horler et al., 1983; Choet al., 2012; Rock et al., 1988; Sanches et al., 2013b); and the Struc-ture Insensitive Pigment Index (SIPI) (Penuelas et al., 1995) whichis sensitive to the ratio of bulk carotenoids to chlorophyll. Thismethod is easily applicable and, after further testing and confirmingits general applicability, it has a potential to be adopted for other

Author's personal copy
V. Kopacková et al. / International Journal of Applied Earth Observation and Geoinformation 27 (2014) 169–186 171
coniferous species or as a monitoring tool if using multi-temporalHS data.
Two temporal HS image data sets (HyMap 2009 and 2010 imagedata) were processed in order to answer whether the suggestedmethod (Misurec et al., 2012) would be valid if using other temporalHS image data and sensitive enough to detect changes between twosubsequent growing seasons. To justify this point, the followingissues needed to be studied:
- What are variations in biochemical parameters between two sub-sequent growing seasons of a Norway spruce forest? Accordingly,the foliar pigment content from the samples collected in twosubsequent growing seasons 2009 (28–29 July) and 2010 (2–3September) were compared and statistically assessed.
- Whether the detected stress can be linked with or explainedby the geochemical conditions of the forest soils? To answerthis question vegetation stress has been assessed within theselected Norway spruce sites while putting together informationon the forest stand’s geochemical conditions, foliar biochemistry(pigment contents) and the temporal differences detected by clas-sifying the two HS image datasets acquired one year apart.
2. Materials and methods
2.1. Test site
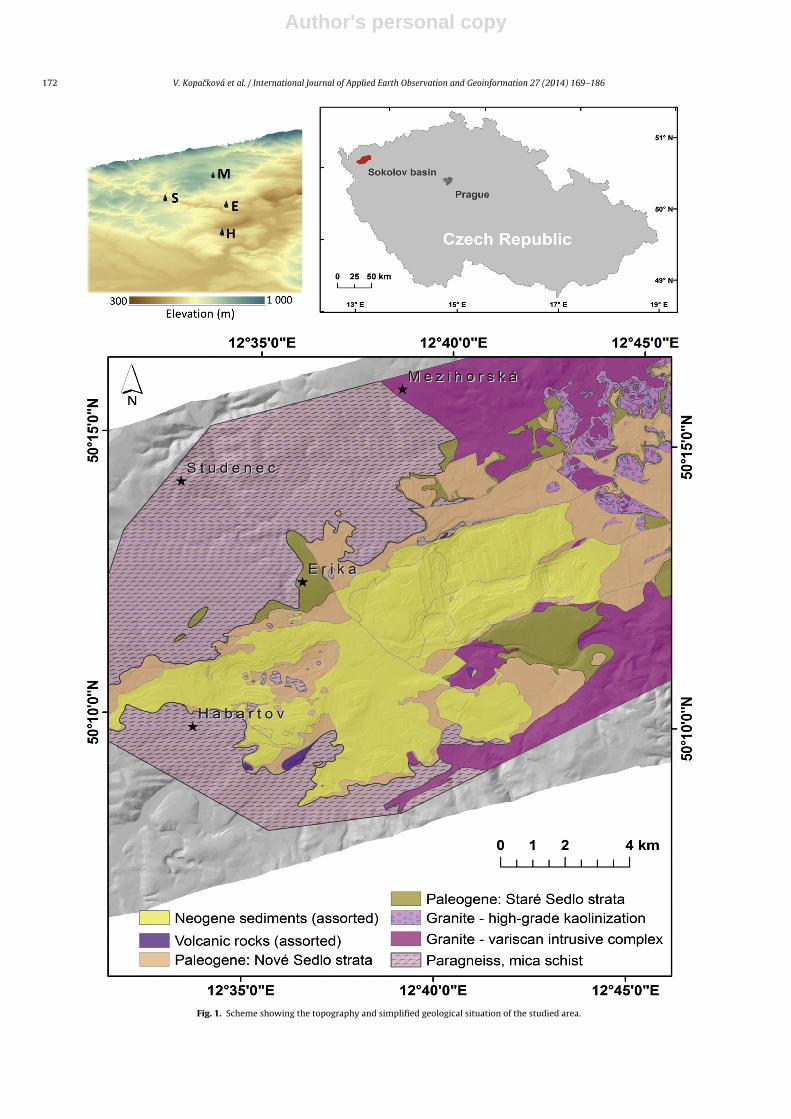
The study was performed in the Sokolov basin in the Westernpart of the Czech Republic, in a region affected by long-term exten-sive lignite mining (Fig. 1). Due to the mining activities and coalburning power plants that were built in the immediate vicinity ofthe mined area, this region is one of the most contaminated areasof the Czech Republic where high abundances of trace elementshave been detected (Suchara et al., 2011). The average altitude ofthe study region is about 470 m. Because the basin is surroundedby the Krusné Hory Mountains, precipitation is above the averagefor the Czech Republic and the local climate in the region is sub-ject to more extreme weather, characterized by colder and wetterconditions. According to the data of the meteorological station sit-uated nearby (Karlovy Vary, 606 m a.s.l.), long-term (1962–2006)annual temperature and precipitation were 6.7 ◦C and 589 mm,respectively.
The Sokolov basin in the Czech Republic is composed of rocks ofOligocene to Miocene age and is 8–9 km wide and up to 36 km long,with a total area of about 200 km2. The basement of the SokolovBasin is formed of Variscan and pre-Variscan metamorphic com-plexes of the Eger, Erzgebirge, Slavkov Forest, Thuring-VogtlandCrystalline Units, and granitoids of the Karlovy Vary Pluton (Fig. 1).The basal late Eocene Staré-Sedlo-Formation is formed of well-sorted fluvial sandstones and conglomerates and is overlain by avolcano-sedimentary complex up to 350 m thick, which containsthree lignite seams (Rojík, 2004). The brown coal (lignite) contains5 to 8% sulfur (S), and belongs among coal seams enriched in As(Yudovich and Ketris, 2005) and other heavy metals, such as Cd, Ni,Cu, Zn, Pb (Bouska and Pesek, 1999). Due to the presence of S in thecoal, the lignite mines both still active and abandoned, are largelyaffected by acid mine drainage (AMD) (Kopackova et al., 2012).
The selected forest stands surround the lignite open pit mines inSokolov, but have not been directly affected by the mining activities.However, the soil in all of the stands exhibits low pH, additionally Aland As were identified as toxic elements with high bio-availability.Norway spruce was selected as it represents the predominant forestspecies in this region; in addition, spruce needles were confirmed tobe well-suited for detection of contamination (Suchara et al., 2011).We selected four research sites dominated by mature Norwayspruce forests of similar age (Table 1); this was important criterion
as the stand age is the most important factor for defoliation. Thestands were located at a maximum distance of 12 km from theactive lignite open-pit mines (Fig. 1 and Table 1). Another selectioncriterion was varying background lithology and the selected sitesare underlayed by granites, mica schists and sandstones (Fig. 1 andTable 1). Detailed field investigations preceded the main field cam-paign. None of the selected sites exhibited any severe symptoms ofmacroscopic damage and they were all classified as damage class 1with total crown defoliation not exceeding 25% and average needleretention of 8–10 needle age classes. In addition, trace element andheavy metal gradients were studied in situ using a portable Innov-xAlpha RFA spectrometer to ensure that the selected sampling treescover the whole gradient ranges found at the sites.
2.2. Field data
2.2.1. Foliar samplingIn 2009 Norway spruce needle samples were obtained in the
week when the HyMap flight campaign (27 July 2009) was per-formed under unchanged weather conditions (27–30 July). In 2010due to the heavy rain the needles from the same trees were sam-ples approximately 2 weeks after the HyMap data acquisition (21August 2010). At each of the 4 test sites, 10–15 representative treeswere selected in clearly definable groups of five (Erika: 2 groups (E1,E2), Habartov: 3 groups (H1, H2, H3), Mezihorská: 3 groups (M1, M2,M3) and Studenec: 2 groups (S1, S2)). Sample branches were takenfrom the sun-exposed (sunlit) and transitive portion of the canopyby tree climbers, the needles age classes were identified, and rep-resentative samples of the 1st and 3rd year needles were collected.Each set then contained 200 samples (50 trees × 2 positions in thecrown × 2 age classes (1st and 3rd year needles) (Fig. 2). The sam-ples were placed in plastic Eppendorf vials in a portable freezer (at0◦ C), and transported within 2 h to a nearby laboratory for furtherprocessing. The dry matter of the needles was acquired after dryingin an oven for 48 h at 80 ◦C.
Photosynthetic pigments (e.g., chlorophyll a, b and totalcarotenoids) were extracted in dimethylforamide (DMF) for 7 daysat 4 ◦C under dark conditions, following the procedure outlined byPorra et al. (1989). The amounts of photosynthetic pigments weredetermined spectrophotometrically, using equations published byWelburn (1994). The pigment concentrations were then expressedas weight of pigment per gram of needle dry matter (mg/g).
2.2.2. Soil samplingIn each forest stand, five representative sampling pits were cho-
sen to collect soil samples. Material was collected from four soilhorizons (two organic and two mineral). The sampled horizonshave the following characteristics: horizon 1 – organic horizon(Ol + Of); horizon 2 – organic horizon (Oa); horizon 3 – mineralsoil 0–10 cm, mixed with humus, usually darkened (A0–10); hori-zon 4 – mineral soil 10–20 cm (A10–20). The total depth of mineralsoil (20 cm) was chosen to reflect the majority of tree root distribu-tion. The collected material was dried in the air prior to sieving.Exchangeable cations and selected trace elements were deter-mined in all four horizons. Exchangeable cations (Ca, Mg, K) andAl were analyzed in 0.1 M BaCl2-extracts by the AAS method. Tomeasure selected trace elements (Cu, Zn, As, Hg), samples weresieved (<5 mm for Ol, Of and Oa; and <2 mm for mineral soil) andhomogenized using a portable Innov-x Alpha RFA spectrometer.Furthermore, for the first two horizons, the pH, total exchangeableacidity (TEA) and total C and N were measured. Taking in accountthe character of the parent lithologies together with the fact thattotal C was analyzed only for two organic horizons, in our case thetotal C can be entirely related with organic carbon (Corg). Soil pHwas determined in distilled water and in 1 M KCl. To measure TEABaCl2-extracts were titrated by 0.025 M NaOH to pH = 7.8. Total C
Author's personal copy
172 V. Kopacková et al. / International Journal of Applied Earth Observation and Geoinformation 27 (2014) 169–186
Fig. 1. Scheme showing the topography and simplified geological situation of the studied area.

Author's personal copy
V. Kopacková et al. / International Journal of Applied Earth Observation and Geoinformation 27 (2014) 169–186 173
Table 1Norway spruce test sites.
Site Latitude (N) Longitude (E) Elevation (ma.s.l.)
Forest age(years)
Distance from theopen-pit mines (km)
Area (ha) Geological unit
Erika 50◦12′25′ ′ 12◦36′17′ ′ 495 40–60 6.4 0.77 Staré Sedlo sandstonesHabartov 50◦09′48′ ′ 12◦33′28′ ′ 477 40–60 11.2 1.84 paragneiss, mica shistMezihorská 50◦15′50′ ′ 12◦38′17′ ′ 678 60–80 5.8 0.75 GraniteStudenec 50◦14′09′ ′ 12◦33′00′ ′ 722 40–60 8.5 0.46 paragneiss, mica shist
and N were determined simultaneously using a Carlo-Erba Fisons1108 analyzer.
Cation exchange capacity (CEC) was calculated as the sum ofexchangeable base cations (Bc = Ca + Mg + K + Na) and TEA. Base sat-uration (BS) was determined as the fraction of CEC associated withBC.
2.3. Aerial HS image datasets
The hyperspectral image data was acquired in 2009 (27 July)and in 2010 (21 August) during the HyEUROPE 2009 and 2010flight campaigns using the HyMap (HyVista Corp., Australia) air-borne imaging spectrometer. The HyMap sensor records imagedata in 126 narrow spectral bands (with full-width half maxi-mum ca. 15 nm) covering the entire spectral interval between450 and 2500 nm. The resulting ground pixel resolution of theimage datasets was 5 m. In order to successfully pre-process thehyperspectral data, supportive calibration and validation groundcampaigns were organized simultaneously with the HyMap dataacquisition in 2009 and 2010. Appropriate targets (featureless usedfor calibration while those exhibiting absorption features wereused for validation) with different values of surface reflectancewere chosen, covering a range of reflectivity from ca. 0% up
to 70%. The selected targets meet the following conditions: (i)spatial homogeneity for a minimum area of 5 × 5 image pixelsand (ii) natural or artificial nearly Lambertian ground surfaces. Anumber of measurements covering the reference surface in a gridscheme were performed by means of an ASD FieldSpec-3 spectro-radiometer to properly calibrate as well as validate the image dataand to enable: (i) atmospheric correction of the airborne hyperspec-tral images and (ii) retrieving at surface reflectance values for thefurther verification. The hemispherical-conical reflectance factor(HCRF) (Schaepman-Strub et al., 2006) was measured for each ref-erence target. Raw spectroradiometric data were transformed intothe HCRF using the calibrated white spectralon panel. In addition,Microtops II Sunphotometer (Solar Light Comp., USA) measure-ments were taken approximately every 30 s during the HyMap dataacquisition. Data acquired by the Sunphotometer was used for esti-mation of the actual atmospheric conditions (AOT – aerosol opticalthickness; WV – water vapor content).
2.3.1. Image data preprocessingThe 2009 and 2010 HyMap multiple flight line data were
atmospherically corrected using software (SW) package ATCOR-4 version 5.0 (Richter, 2009). This SW is based on MODTRANradiative transfer model (Adler-Golden et al., 1999) and enables
Fig. 2. Foliage sampling scheme.

Author's personal copy
174 V. Kopacková et al. / International Journal of Applied Earth Observation and Geoinformation 27 (2014) 169–186
atmospheric correction of the aerial hyperspectral images. Theaerosol optical thickness (AOT) estimated by the Sunphotometermeasurements was used as an input parameter for the model. Theknown reflectances of the featureless reference targets (vicariouscalibration targets, see the attached KML layer) as well as watervapor (WV) estimation were utilized for fine-tuning of the model,as facilitated by ATCOR-4. The remaining reference targets, whichwere spectrally variable exhibiting absorption features across theVNIR-SWIR region (e.g., grass, soil, clays), were used for validation.
The orientation and geometry of the HyMap strips followed theSW-NE orientation of the lignite basin. However, this setting rep-resented an optimal solution from the economic point of view; onthe other hand, this setting (relative solar azimuth at the acquisi-tion hour was about 73◦) caused that the data suffered from strongcross track illumination and BRDF effects (Verrelst et al., 2008).Therefore, in addition to the atmospheric correction, the 2009 and2010 reflectance data had to be further processed to minimize theseeffects employing semi-empirical nadir normalization using thekernel-based Ross-Li model (Schaaf et al., 2002) for all the flightlines. The surface was divided into four land cover classes using acombined approach of Spectral Angle Mapping (SAM) and radio-metric discrimination. The land cover classes of interest were: (i)forest vegetation; (ii) bright green vegetation; (iii) soil and (iv)bright clay/sand/gravel. Based on this surface stratification, thesemi-empirical Ross-Li model was parameterized and inverted togain nadir-BRDF adjusted reflectance values.
Direct ortho-georectification was performed using the PARGEsoftware package (Schläpfer, 1998). Data from the on-board Iner-tial measurement unit/GPS (IMU/GPS) unit and digital elevationmodel (DEM) with ground resolution of 10 m were used as the inputparameters for the ortho-georectification. Misalignment anglesbetween the IMU/GPS unit and the HyMap sensor were determinedspecifically for the Sokolov site. Finally, the hyperspectral imagedata were georeferenced to the UTM 33N (WGS-84) coordinatesystem.
2.4. Hyperspectral data processing: vegetation healthclassification and change detection
The processing workflow for both image datasets followed themethod described by Misurec et al. (2012). A general descrip-tion is given in this section. Initially, the extent of the Norwayspruce forests was defined by employing a hierarchical classifica-tion approach combining thresholding of the normalized differencevegetation index (NDVI) and the maximum likelihood classifica-tion (MLC), which was applied to the first five components, and theresults from the MNF transformation of the HyMap data. A commonmask was computed as an intersection of the 2009 and 2010 forestmasks to ensure that the areas where the trees were cut down areexcluded and the following processing was conducted exclusivelyfor the Norway spruce forests.
The empirical approach was employed to estimate canopychlorophyll content (Cab) using the 2009 and 2010 ground truthand HyMap data. However, due to the relatively low spatialresolution of HyMap data (5 m) it was not possible to distin-guish individual tree crowns within the HyMap image data andconsequently to associate the ground truth data value with cor-responding pixels. This issue needed to be resolved prior to theempirical modeling. Therefore 10 tree groups based on the 50 sam-pled trees were defined as the least circumscribed rectangle definedby a cluster of trees (ROI). Then the average ground truth value (theaverage laboratory chlorophyll content calculated for each groupof 5 trees) could be directly compared with the average pixel valuefalling within the defined group (ROI).
To ensure the proper definition of training and validationdatasets the data variability within each group and spatial
variability within each site were further assessed and both thetraining (6 groups, each group was an average of 5 sampled trees)and validation (4 groups, each group was an average of 5 sam-pled trees) datasets were defined in a way to cover the wholedynamic range of the sampled trees (Misurec et al., 2012). Thedefinition of the validation and training datasets remain the samefor the 2009 and 2010 data. For the empirical modeling of chloro-phyll content (Cab) the same method was applied to 2009 and2010 reflectance data, based on the ratio of the transformed (firstderivation) image reflectance at 718 and 708 nm (D718/D708). Therelationship between the predicted and measured values for boththe training and validation data sets was described by the linearregression model and coefficient of determination (training: R2
and validation: Rv2, respectively) and the root mean square errors(RMSE) were determined (Table 4).
In addition, to assess the vegetation health status, two selectedindicators of vegetation health (REP: Eq. (1) and SIPI: Eq. (2)) werecalculated from the HS 2009 and 2010 image datasets.
REP = 700 + 40
(((R675 + R776)/2) − R704
R747 − R704
)(1)
SIPI = R805 − R455
R805 − R675(2)
The SIPI values exhibited a relative low dynamic range. Thiscould be explained as a relatively small dynamic range of Car/Cab, aparameter which SIPI is correlating with, characterized the studiedone-species trees (Fig. 6). Therefore its exponential transformation(expSIPI) was used in further analysis.
The Cab, Rep and expSIPI were further statistically classified.These three parameters differ from dynamic ranges and physicalunits; additionally they are dynamic and change during a seasonin accordance to the phonological stage as well as the weatherand hydrometeorological conditions. As multi-date HS data wereanalyzed and compared in this study, they needed to be normal-ized before being compared together. Therefore, the values of theselected indices were transformed into standardized z-scores. Thistransformation allows classification of a population upon distancesto a population mean in units of the standard deviation, as a resultno specific threshold values are required to define the classes. Afterthis transformation, Cab, REP and expSIPI were mutually compa-rable and independent of their physical dimensions (units) andfurther classified into five classes defined by the threshold valuesgiven in Table 5.
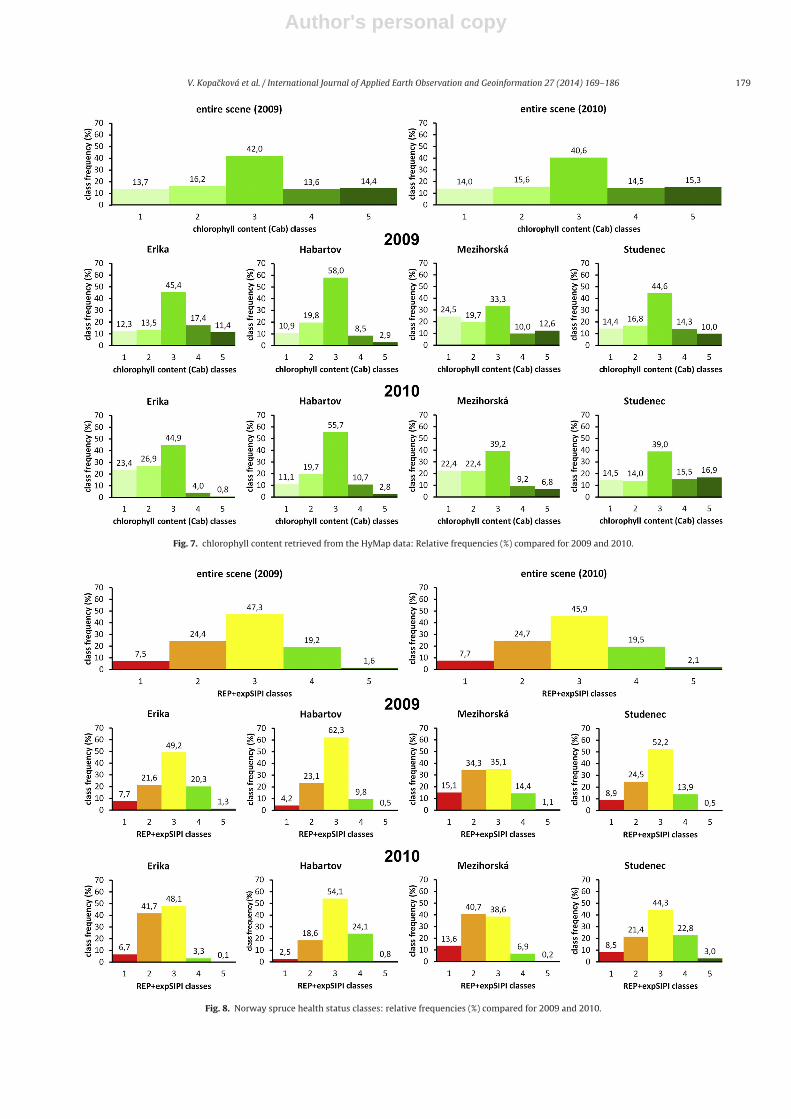
Two products were created using the obtained normalized z-score values: the map of chlorophyll content (histograms in Fig. 7)and a raster combining the information from REP and expSIPI.Both were summarized and then linearly reclassified into 5 classes(Eq. (3)), however expSIPI needed to be classified in the reverseorder prior to the summarization, as the higher values reflecthigher carotenoid-to-chlorophyll contents and thus worse vege-tation health (Figs. 8 and 9).
Rs{R1; R2}Rs(1...n){R1CL(1...n); R2CL(1...n)}
Rs(1...n) = Round
[(R1CL(1...n) + R2CL(1...n)) · CLmax(Rs)
CLmax(R1) + CLmax(R2)
] (3)
where Rs represents a forest health raster, R1 is REP, R2 is expSIPI,CL(1. . .n) is a class number of a classified raster and CLmax is a ceilingclass value of a corresponding classified raster.
For both products a relative classification was used based onthe histogram dynamic ranges, averages and standard deviations.Consequently, no hard threshold values were required. The onlycondition to be fulfilled was normal distribution of all the data clas-sified (entire scene) (Figs. 7 and 8). In both maps, Class 1 indicates
Author's personal copy
V. Kopacková et al. / International Journal of Applied Earth Observation and Geoinformation 27 (2014) 169–186 175
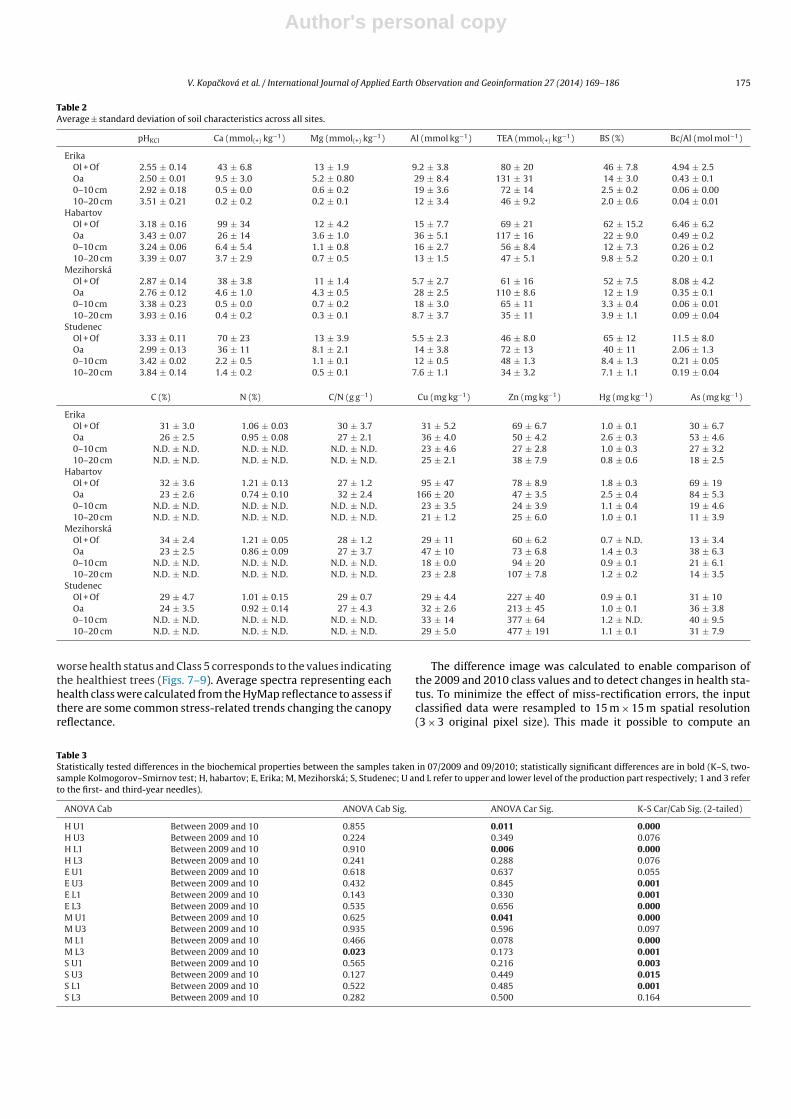
Table 2Average ± standard deviation of soil characteristics across all sites.
pHKCl Ca (mmol(+) kg−1) Mg (mmol(+) kg−1) Al (mmol kg−1) TEA (mmol(+) kg−1) BS (%) Bc/Al (mol mol−1)
ErikaOl + Of 2.55 ± 0.14 43 ± 6.8 13 ± 1.9 9.2 ± 3.8 80 ± 20 46 ± 7.8 4.94 ± 2.5Oa 2.50 ± 0.01 9.5 ± 3.0 5.2 ± 0.80 29 ± 8.4 131 ± 31 14 ± 3.0 0.43 ± 0.10–10 cm 2.92 ± 0.18 0.5 ± 0.0 0.6 ± 0.2 19 ± 3.6 72 ± 14 2.5 ± 0.2 0.06 ± 0.0010–20 cm 3.51 ± 0.21 0.2 ± 0.2 0.2 ± 0.1 12 ± 3.4 46 ± 9.2 2.0 ± 0.6 0.04 ± 0.01
HabartovOl + Of 3.18 ± 0.16 99 ± 34 12 ± 4.2 15 ± 7.7 69 ± 21 62 ± 15.2 6.46 ± 6.2Oa 3.43 ± 0.07 26 ± 14 3.6 ± 1.0 36 ± 5.1 117 ± 16 22 ± 9.0 0.49 ± 0.20–10 cm 3.24 ± 0.06 6.4 ± 5.4 1.1 ± 0.8 16 ± 2.7 56 ± 8.4 12 ± 7.3 0.26 ± 0.210–20 cm 3.39 ± 0.07 3.7 ± 2.9 0.7 ± 0.5 13 ± 1.5 47 ± 5.1 9.8 ± 5.2 0.20 ± 0.1
MezihorskáOl + Of 2.87 ± 0.14 38 ± 3.8 11 ± 1.4 5.7 ± 2.7 61 ± 16 52 ± 7.5 8.08 ± 4.2Oa 2.76 ± 0.12 4.6 ± 1.0 4.3 ± 0.5 28 ± 2.5 110 ± 8.6 12 ± 1.9 0.35 ± 0.10–10 cm 3.38 ± 0.23 0.5 ± 0.0 0.7 ± 0.2 18 ± 3.0 65 ± 11 3.3 ± 0.4 0.06 ± 0.0110–20 cm 3.93 ± 0.16 0.4 ± 0.2 0.3 ± 0.1 8.7 ± 3.7 35 ± 11 3.9 ± 1.1 0.09 ± 0.04
StudenecOl + Of 3.33 ± 0.11 70 ± 23 13 ± 3.9 5.5 ± 2.3 46 ± 8.0 65 ± 12 11.5 ± 8.0Oa 2.99 ± 0.13 36 ± 11 8.1 ± 2.1 14 ± 3.8 72 ± 13 40 ± 11 2.06 ± 1.30–10 cm 3.42 ± 0.02 2.2 ± 0.5 1.1 ± 0.1 12 ± 0.5 48 ± 1.3 8.4 ± 1.3 0.21 ± 0.0510–20 cm 3.84 ± 0.14 1.4 ± 0.2 0.5 ± 0.1 7.6 ± 1.1 34 ± 3.2 7.1 ± 1.1 0.19 ± 0.04
C (%) N (%) C/N (g g−1) Cu (mg kg−1) Zn (mg kg−1) Hg (mg kg−1) As (mg kg−1)
ErikaOl + Of 31 ± 3.0 1.06 ± 0.03 30 ± 3.7 31 ± 5.2 69 ± 6.7 1.0 ± 0.1 30 ± 6.7Oa 26 ± 2.5 0.95 ± 0.08 27 ± 2.1 36 ± 4.0 50 ± 4.2 2.6 ± 0.3 53 ± 4.60–10 cm N.D. ± N.D. N.D. ± N.D. N.D. ± N.D. 23 ± 4.6 27 ± 2.8 1.0 ± 0.3 27 ± 3.210–20 cm N.D. ± N.D. N.D. ± N.D. N.D. ± N.D. 25 ± 2.1 38 ± 7.9 0.8 ± 0.6 18 ± 2.5
HabartovOl + Of 32 ± 3.6 1.21 ± 0.13 27 ± 1.2 95 ± 47 78 ± 8.9 1.8 ± 0.3 69 ± 19Oa 23 ± 2.6 0.74 ± 0.10 32 ± 2.4 166 ± 20 47 ± 3.5 2.5 ± 0.4 84 ± 5.30–10 cm N.D. ± N.D. N.D. ± N.D. N.D. ± N.D. 23 ± 3.5 24 ± 3.9 1.1 ± 0.4 19 ± 4.610–20 cm N.D. ± N.D. N.D. ± N.D. N.D. ± N.D. 21 ± 1.2 25 ± 6.0 1.0 ± 0.1 11 ± 3.9
MezihorskáOl + Of 34 ± 2.4 1.21 ± 0.05 28 ± 1.2 29 ± 11 60 ± 6.2 0.7 ± N.D. 13 ± 3.4Oa 23 ± 2.5 0.86 ± 0.09 27 ± 3.7 47 ± 10 73 ± 6.8 1.4 ± 0.3 38 ± 6.30–10 cm N.D. ± N.D. N.D. ± N.D. N.D. ± N.D. 18 ± 0.0 94 ± 20 0.9 ± 0.1 21 ± 6.110–20 cm N.D. ± N.D. N.D. ± N.D. N.D. ± N.D. 23 ± 2.8 107 ± 7.8 1.2 ± 0.2 14 ± 3.5
StudenecOl + Of 29 ± 4.7 1.01 ± 0.15 29 ± 0.7 29 ± 4.4 227 ± 40 0.9 ± 0.1 31 ± 10Oa 24 ± 3.5 0.92 ± 0.14 27 ± 4.3 32 ± 2.6 213 ± 45 1.0 ± 0.1 36 ± 3.80–10 cm N.D. ± N.D. N.D. ± N.D. N.D. ± N.D. 33 ± 14 377 ± 64 1.2 ± N.D. 40 ± 9.510–20 cm N.D. ± N.D. N.D. ± N.D. N.D. ± N.D. 29 ± 5.0 477 ± 191 1.1 ± 0.1 31 ± 7.9
worse health status and Class 5 corresponds to the values indicatingthe healthiest trees (Figs. 7–9). Average spectra representing eachhealth class were calculated from the HyMap reflectance to assess ifthere are some common stress-related trends changing the canopyreflectance.
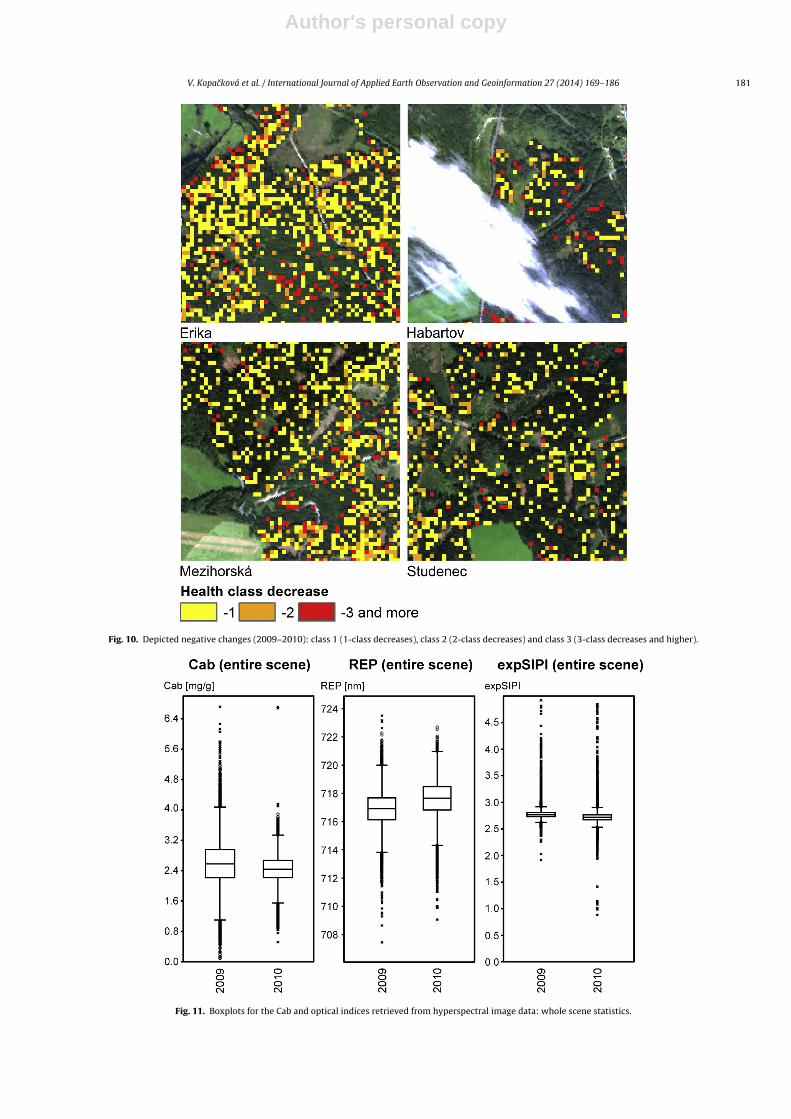
The difference image was calculated to enable comparison ofthe 2009 and 2010 class values and to detect changes in health sta-tus. To minimize the effect of miss-rectification errors, the inputclassified data were resampled to 15 m × 15 m spatial resolution(3 × 3 original pixel size). This made it possible to compute an
Table 3Statistically tested differences in the biochemical properties between the samples taken in 07/2009 and 09/2010; statistically significant differences are in bold (K–S, two-sample Kolmogorov–Smirnov test; H, habartov; E, Erika; M, Mezihorská; S, Studenec; U and L refer to upper and lower level of the production part respectively; 1 and 3 referto the first- and third-year needles).
ANOVA Cab ANOVA Cab Sig. ANOVA Car Sig. K-S Car/Cab Sig. (2-tailed)
H U1 Between 2009 and 10 0.855 0.011 0.000H U3 Between 2009 and 10 0.224 0.349 0.076H L1 Between 2009 and 10 0.910 0.006 0.000H L3 Between 2009 and 10 0.241 0.288 0.076E U1 Between 2009 and 10 0.618 0.637 0.055E U3 Between 2009 and 10 0.432 0.845 0.001E L1 Between 2009 and 10 0.143 0.330 0.001E L3 Between 2009 and 10 0.535 0.656 0.000M U1 Between 2009 and 10 0.625 0.041 0.000M U3 Between 2009 and 10 0.935 0.596 0.097M L1 Between 2009 and 10 0.466 0.078 0.000M L3 Between 2009 and 10 0.023 0.173 0.001S U1 Between 2009 and 10 0.565 0.216 0.003S U3 Between 2009 and 10 0.127 0.449 0.015S L1 Between 2009 and 10 0.522 0.485 0.001S L3 Between 2009 and 10 0.282 0.500 0.164

Author's personal copy
176 V. Kopacková et al. / International Journal of Applied Earth Observation and Geoinformation 27 (2014) 169–186
Table 4Chlorophyll content estimation: regression models (measured vs. predicted).
Chlorophyll content estimation model (linear regression)
2009 2010
R2 (training) 0.9131 0.5340RMSE (mg/g) 0.2055 0.2174Rv2 (validation) 0.9370 0.7305
image showing the class change. Fig. 10 depicts negative changesin the following manner: class 1 (1-class decreases), class 2 (2-classdecreases) and class 3 (3-class decreases and higher).
3. Results
3.1. Site soil characteristics
The soil chemistry at all the sites was characterized by lowexchangeable pH in both organic (Ol + Of, Oh) and mineral soils(A0–10, A10–20) (Fig. 3). However, the mineral soil chemistryreflected the composition of the parent material. Erika, the mostacidic site, is underlain by sandstone and quartzite characterized byextremely low base cation contents. As a consequence, the lowestbase saturation (2–2.5%) and Bc/Al ratio (0.04–0.06) were measuredin the top mineral soil (0–20 cm). Slightly higher pH in the organichorizons (Fig. 3) and higher BS were measured at Mezihorská. Thissite is underlain by granite with a low content of base cationsand low weathering rate. A higher concentration of base cations,compared to Erika, is reflected in slightly higher BS in the min-eral soil (3.3–3.9%). Both sites, Erika and Mezihorská, had highertotal exchangeable acidity compared to Habartov and Studenec.The latter two sites, Habartov and Studenec, are both underlain bymore easily weathed mica schist which is, however, low in basecations. Both sites were characterized by higher exchangeable pHin both the organic and mineral soils, with significantly higher BS inthe mineral soil (Fig. 3) compared to Erika and Mezihorská. Higherconcentration of base cations led to more favorable Bc/Al ratios(0.19–0.26) (Fig. 3) which were, however, still below the criticalthreshold of 1 (Cronan and Grigal, 1995). Regarding the content oftrace metals (Table 2), two toxic elements, Al and As, were detectedas mobile in the studied soils.
3.2. Biochemical characteristics
As the Norway spruce needle samples were collected from twodifferent years, statistics were employed to test whether thereare statistically significant differences in the biochemical prop-erties of the samples taken in 07/2009 and 09/2010. First theShapiro–Wilk test (Shapiro and Wilk, 1965) was employed totest the normal distribution. For Car and Cab, the normally dis-tributed parameters, analysis of variance (ANOVA) was used to testwhether there are statistically significant differences. For Car/Cab,as this parameter was not normally distributed, the two-sampleKolmogorov–Smirnov (K–S) non-parametric test was employed(Table 3). The increasing trend with increasing needle age in foliarphotosynthetic pigment contents was observed which is in accor-dance with the previously published results (Albrechtova et al.,2008; Homolova et al., 2013). The Cab and Car contents did notexhibit significant deviations between the 2009 and 2010 seasons(Table 3) but, in general, the chlorophyll content was higher andthe carotenoid content lower in July 2009. Assessing differencesamong the sites, the lowest Cab and Car values are characteristicfor the Mezihorská site (Figs. 4 and 5). This site also exhibits thelargest changes between the 2009 and 2010 chlorophyll (positionL3) and carotenoid contents (position U1) (Table 3). Erika exhibitshigher carotenoid contents and higher variability in both pigmentcontents. Additionally, the trees at Erika exhibit statistically signif-icant changes between the 2009 and 2010 current-year needles atboth positions (U1 and L1, Table 3). Except for these cases, thereare no significant changes in the photosynthetic pigment contentsat the studied sites.
Larger differences can be observed in the Car/Cab ratios (Fig. 6and Table 3). Clearly, higher values characterize the samples takenin 09/2010. In most of the cases, the Car/Cab ratios significantlydiffer for the 2009 and 2010 samples (Table 3), where the largestdifferences were exhibited by the current-year needles (L1 and U1).Erika exhibits the highest Car/Cab for both years followed by theMezihorská site, which has higher Car/Cab values mainly for 2010.Moreover, the Erika site had the smallest variations in its gradientsamong all the positions and years sampled. In 07/2009, the higherCar/Cab values are characteristic for the older needles (L3, U3) butthe trend was the opposite in 09/2010, where the current year nee-dles (U1, U1) have higher Car/Cab values than the older once (U3,L3).
Fig. 3. Average soil characteristics and standard deviations of exchangeable pH (a), base saturation (b), exchangeable aluminum (c) and Bc/Al ratio (d) across sites.

Author's personal copy
V. Kopacková et al. / International Journal of Applied Earth Observation and Geoinformation 27 (2014) 169–186 177
Table 5Threshold values used for image classifications.
Threshold values
Indicator (year) � � −1.0� −0.5� +0.5� +1.0�
Cab (2009) 2.5996 0.6126 1.9871 2.2934 2.9059 3.2122Cab (2010) 2.4394 0.3944 2.0450 2.2422 2.6366 2.8338REP (2009) 716.8650 1.2242 715.6409 716.2530 717.4772 718.0893REP (2010) 717.5770 1.2673 716.3097 716.9434 718.2107 718.8443expSIPI (2009) 2.7668 0.0967 2.6701 2.7185 2.8152 2.8635expSIPI (2010) 2.7137 0.1200 2.5937 2.6532 2.7738 2.8338
Fig. 4. Cab foliage content for 07/2009 and 09/2010 – means and standard deviations are displayed per each site (U and L refer to upper and lower level of the productionpart respectively while 1 and 3refer to the first- (1) and third-year (3) needles. AVG 2009: overall average for 2009, AVG 2010: overall average for 2010.
Fig. 5. Car foliage content for 07/2009 and 09/2010 – means and standard deviations are displayed per each site (U and L refer to upper and lower level of the productionpart respectively while 1 and 3refer to the first- (1) and third-year (3) needles. AVG 2009: overall average for 2009, AVG 2010: overall average for 2010.

Author's personal copy
178 V. Kopacková et al. / International Journal of Applied Earth Observation and Geoinformation 27 (2014) 169–186
Fig. 6. Car/Cab ratio – means and standard deviations are displayed per each site (U and L refer to upper and lower level of the production part respectively. 1 and 3refer tothe first- (1) and third-year (3) needles. AVG 2009: overall average for 2009, AVG 2010: overall average for 2010.
3.3. Vegetation health: site differences between HyMap 2009 and2010 classifications
The chlorophyll content estimation achieved higher accuracyusing the 2009 datasets (Table 4). This can be explained by thelonger period between the HS data acquisition and the tree samp-ling in 2010, as unfavorable weather conditions (heavy rains)developed immediately after the acquisition day and the trees weresampled approximately two weeks after the HS image data wereacquired.
To detect tree-health related changes, both the chlorophyll con-tent (Fig. 7) and the vegetation health class histograms (Fig. 8) canbe compared and the class frequencies and asymmetries calculatedcan be studied for each site.
Comparing the HyMap indices statistics for the entire 2009 and2010 scenes there were no significant differences (Fig. 11). How-ever, if each site is assessed separately, Erika is the site with thelargest decreases in Cab content, followed by the Mezihorská site(Figs. 7, 8 and 12). These trends can be easily depicted on the basis ofthe classified maps (Fig. 9), as health classes 1 and 2 were more pop-ulated for Erika and Mezihorská in 2010 than in 2009. In addition,these two sites exhibit frequent negative changes in their healthstatus (Fig. 10). On the other hand, Studenec is the most stable siteof all, as the 2009 and 2010 histograms of the chlorophyll contentand heath class status (Figs. 7 and 8) look almost the same. In termsof the negative changes (decreases in health class) in health statusfor the Studenec site, mainly class 1, indicating smallest changes intree health, is present and sparsely distributed (Fig. 10). The Habar-tov site was partially covered by clouds in 2010 (Fig. 9), However,similarly as the Studenec site, the cloudless parts available for theanalysis exhibit very similar histograms of the chlorophyll contentand health classes for 2009 and 2010 (Figs. 7 and 8) and sparsehealth change patterns (Fig. 10).
Studying the HyMap reflectance average spectra representingeach health class (Fig. 13) some common stress-related trendschanging the canopy reflectance could be defined. While comparingrepresentative spectra of the healthiest class 5 to the most stressedclass 1 reflectance was found to be increasing with the degree ofstress in the visible (VIS: between 500 and 690 nm), near infrared
(NIR: 800–1200 nm) and short wave infrared (SWIR: between 1500and 1800 nm and between 1900 and 2450 nm) regions. A coherentshift in the position of the red-edge toward shorter wavelengthswith increasing stress was detected (Table 6), additionally dif-ferences in water absorption features centered around 985 and1178 nm can be observed (Fig. 13).
4. Discussion
All the sites are located in the vicinity of the Sokolov basin, anarea with historically high emissions of acidifying compounds (SO2,NOx). Unfavorable low Bc/Al ratios across all the sites might beconnected to the high deposition of S and N in the past and sub-sequently to the anthropogenic acidification of forest soils in thisregion (Kram et al., 1997; Oulehle et al., 2006). Soil acidificationpromotes leaching of base cations and mobilization of aluminum(Kram et al., 2009). Thus, anthropogenic acidic deposition, spruceforest plantations and naturally acidic parent bedrock promotedacidification of forest soils across the investigated sites. The C/Nratios in organic horizons were similar at all the sites, ranging from27 to 32 in the Oa horizon. Based on the close relationship between
Table 6Statistics on Cab and optical indices retrieved from hyperspectral image data: cal-culated for each health class.
Cab Rep ExpSIPI
� � � � � �
2009Class 1 1.60 0.46 714.86 1.03 2.96 0.23Class 2 2.15 0.34 715.96 0.74 2.80 0.10Class 3 2.65 0.31 717.04 0.58 2.75 0.05Class 4 3.25 0.46 718.24 0.78 2.71 0.05Class 5 3.55 0.53 718.91 0.68 2.63 0.05
2010Class 1 1.87 0.24 716.49 0.91 2.88 0.16Class 2 2.16 0.18 716.94 0.69 2.74 0.06Class 3 2.45 0.08 717.63 0.61 2.69 0.06Class 4 2.76 0.26 718.86 0.86 2.63 0.08Class 5 2.99 0.27 719.55 0.59 2.53 0.06
Author's personal copy
V. Kopacková et al. / International Journal of Applied Earth Observation and Geoinformation 27 (2014) 169–186 179
Fig. 7. chlorophyll content retrieved from the HyMap data: Relative frequencies (%) compared for 2009 and 2010.
Fig. 8. Norway spruce health status classes: relative frequencies (%) compared for 2009 and 2010.

Author's personal copy
180 V. Kopacková et al. / International Journal of Applied Earth Observation and Geoinformation 27 (2014) 169–186
Fig. 9. Studied sites – HyMap true color combination showing the actual situation of the site (A) 2009 and (B) 2010. Statistical classification of the Norway spruce healthstatus (C) classification of 2009 data, (D) classification of 2010 data; color scale 1 through 5 – health status classes; 1 – the worst and 5 – the best result.
the C/N ratio in the forest floor and N leaching in catchments acrossthe Czech Republic (Oulehle et al., 2008) relatively low N leachingis expected as the C/N ratio of the organic soil is above the criti-cal threshold of approx. 25. In general, soils with the lowest basecation nutrient availability and low Bc/Al ratios are found at Erikaand Mezihorská, where the soils are underlain by the most acidicbedrocks (sandstone/quartzite and granite, respectively).
In contrast to the pigment contents alone (Figs. 4 and 5), Car/Cabvalues (Fig. 6) exhibit more dynamic changes during the growingseason, and are positively correlated in the majority of cases withthe intensity of photosynthetically active radiation and negativelyare correlated with the temperature (Kirchgessner et al., 2003). Thesignificant increase in the average Car/Cab values between the 2009and 2010 seasons may reflect the season-specific weather condi-tions or canopy microclimate. The carotenoids in needles play adual role: on the one hand they are important for light-harvesting,but on the other hand they protect the pigment–protein com-plexes from photodamage (Demmig-Adams, 1998). The average
monthly temperature and monthly sum of sunlight hours dur-ing the months of the sampling were higher in 2009 than in2010 (16.2 ◦C and 180 sunlight hours; 15.0 ◦C and 140 sunlighthours respectively, data from the closest meteorological station atKarlovy Vary, www.chmi.cz). Thus it appears that the lower tem-perature in August 2010 could be the predominant factor causingthe higher Car/Cab ratio in the 2010 season. However, the increasein the Car/Cab ratio mainly due to chlorophyll degradation may alsoindicate the onset of leaf senescence in deciduous trees (Garcia-Plazaola and Becerril, 2001). The difference in timing of needlesampling was about six weeks, the end of July and beginning ofSeptember, when there is still a full operational vegetation seasonand only minimal changes in chlorophyll contents are expectedfor mature coniferous foliage (Kirchgessner et al., 2003; Silkinaand Vinokurova, 2009; Thomas et al., 2009). The shift in the 2010sampling may not fully explain the dramatic changes in chloro-phyll contents that occurred during the 2010 season, as the mainchlorophyll content drop before winter hardening usually occurs
Author's personal copy
V. Kopacková et al. / International Journal of Applied Earth Observation and Geoinformation 27 (2014) 169–186 181
Fig. 10. Depicted negative changes (2009–2010): class 1 (1-class decreases), class 2 (2-class decreases) and class 3 (3-class decreases and higher).
Fig. 11. Boxplots for the Cab and optical indices retrieved from hyperspectral image data: whole scene statistics.

Author's personal copy
182 V. Kopacková et al. / International Journal of Applied Earth Observation and Geoinformation 27 (2014) 169–186
Fig. 12. Boxplots for the Cab and optical indices retrieved from hyperspectral image data: calculate for each site.
in October, even in higher northern latitudes (Oquist and Huner,2003). However, based on the available data, we cannot reject eitherscenario.
The opposite effect of needle age on Car/Cab in two stud-ied seasons may be explained by the different response speedof first-year and older needles to the environmental conditions,particularly irradiance, as shown by Kirchgessner et al. (2003),who observed the fast-type response (<20 days) in changes in the
chlorophyll a to b ratio in last year’s needles in comparison withthe slow-type change (>30 days) in the current-year needles ofNorway spruce. The total carotenoid pool in coniferous needlesis represented by several chemical species, including, e.g., luteinand �-carotene, rather stabile pigments during the growing sea-son (Yatsko et al., 2011) and a dynamic pool of xanthophyll cyclecarotenoids (Kirchgessner et al., 2003; Yatsko et al., 2011). Thus,the adjustment of carotenoid composition may be more relevant
Fig. 13. Average spectra representing each health class calculated from the HyMap reflectance (the water absorption bands around 1400 nm and 1940 nm were interpolated,therefor they are omitted from further interpretation).
veronika.kopackova
Zvýraznění

Author's personal copy
V. Kopacková et al. / International Journal of Applied Earth Observation and Geoinformation 27 (2014) 169–186 183
parameter than the size of total carotenoid pool (Demmig-Adams,1998).
The foliar laboratory results show that the chlorophyll content(Car) should not be the only indicator considered when assessingforest health. Additionally, nor can the absolute carotenoidcontents (Car) alone reflect the differences among the studied sites.On the other hand, the Car/Cab ratio allowed site sorting by com-parison with the mean values for all the sites, as is shown in Fig. 6and was consistent for all the sites in both years in the follow-ing order (sorted from least to most healthy): Erika, Mezihorská,Habartov and Studenec. The same sorting was depicted using theHyMap 2009 and 2010 classification products, while the differencesamong the sites are considered the best in the map of the healthstatus (Fig. 9). This map combines the two indices – REP (sensi-tive to vegetation stress) and index SIPI (sensitivity to the ratio ofbulk carotenoids to chlorophyll) – and also supports the idea that,in addition to the chlorophyll content, it is important to comparethe chlorophyll to carotenoid content when assessing forest health.The differences among the sites are more pronounced in 2010. Theincreased Car/Cab of the first-year needles (U1, L1) (Fig. 6) sam-pled at the beginning of September 2010 may have enabled betterdetection of forest health status using the 2010 HS dataset. Theseneedles contribute the most to the total foliage area (Porté et al.,2000; Weiskittel et al., 2006), the area that can be sensed from thesky.
To summarize the results, both biochemical analysis as well ashyperspectral image data classification, which is based on a statisti-cal integration of the normalized optical indices REP and SIPI, havebeen shown to reflect the soil chemistry. This is in accordance withother studies, in which vegetation-stress based spectral variationswere associated with changes in pigment contents and in red-edgepositions (Masaitis et al., 2013; Rathod et al., 2013; Sanches et al.,2013a; Zhang et al., 2012; Zinnert et al., 2013). Considering thephotosynthetic pigments, in this particular study the stress wasexpressed by the increased carotenoid and decreased chlorophyllcontents. Then, it was more suitable to use the parameter which issensitive to changes in ratios between these two pigments ratherthan assessing the content of each pigment alone. Considering thered-edge position, the trees studied displayed a coherent shift toshorter wavelengths with increasing stress (Fig. 13 and Table 6)which is in accordance with the results achieved by Sanches et al.(2013a) and Rathod et al. (2013).
Additional health-status related changes were detected in theVIS-NIR-SWIR region (Fig. 13). In general the VIS region of the elec-tromagnetic spectrum are dominated by the spectral responses ofphotosynthetic pigments, the NIR region reflects structural prop-erty and the water content dominates in the SWIR region. Theincrease of reflectance in VIS is a consequence of plant senescenceand chlorophyll degradation which leads to increased reflectancewithin red wavelengths (chlorophyll absorption). As a result, spec-tral response in the VIS region becomes dominated by carotenoidsthat absorb blue light and reflect green and red light (Carter andKnapp, 2001; Sanches et al., 2013a).
In the SWIR region, increasing reflectance with a higher degreeof stress can be explained by decreasing needle water content.When the plant’s water content is reduced, the 400–2500 nmreflectance usually increases, mainly between 1300 and 2500 nmdue to reduced water consumption by plants as a reaction to thestress (Carter, 1991; de Jong et al., 2012). The decreasing absorptiondepth of the water absorptions centered around 985 and 1178 nm(Fig. 13) can be explained in the same way. More problematic is howto explain the changes in the VNIR reflectance, which, for the stud-ied canopies, also increased with increasing stress. The increasein NIR reflectance can be explained by the fact that changes inNIR reflectance are rather variable depending on the plant’s stageof senescence and type of stress. During the first stages of leaf
senescence, an increase in NIR reflectance is typical as a result of therupture of cell walls which causes an increase in the air-wall inter-face area, which then decreases as cell walls deteriorate (Knipling,1970). A similar effect was observed by Sanches et al. (2013a) onbrachiaria plants growing in soil contaminated with diesel.
Although the results of this study demonstrate the future poten-tial application of hyperspectral remote sensing as a rapid methodof identifying tree stress prior to symptom expression, some ques-tions and uncertainties still remain. The atmospheric correction isa crucial point of any multi-temporal image analysis. Although avicarious atmospheric correction was employed for both HS imagedatasets succesfully (Bachmann et al., 2011), the effect of the atmo-sphere on the classification results, although minimized, still couldnot be completely eliminated.
The spatial resolution of the HyMap images did not allow a directcomparison between the sampling tree-tops and correspondingpixel values. Instead, the authors were able to compare the tree-groups/clusters with corresponding pixel AOI’s. This clusteringdecreased the number of training and validation samples avail-able for the chlorophyll empirical modeling. On the other hand,the authors believe that it helped to minimize errors resultingfrom false identifications between sampled tree-tops and corre-sponding pixels; in addition the values were more representativeas being an average of 5 sampled trees. In general, tree samp-ling as well as biochemical analysis require significant man-powerand even resources, moreover, the optimal time window open forthese activities is, due to the rapid pigment dynamics of vegetationsenesce, always short. Therefore, a number of the trees sampledin this study corresponded with the maximum of the availableresources.
Moreover, working with the available data, it was not possible toreally distinguish a seasonal effect from what is a between-yearseffect. This may be answered more precisely in the near future,when EnMap or PRISMA hyperspectral satellites will be in oper-ation. The synoptic and systematic collecting of continuous highspectral dimensional data will enable the vegetation physiologicalchanges and related ecological processes to be studied in a widerspatial extent and on a whole temporal scale. Besides the analy-sis itself, this will bring new insights in photosynthetic pigmentdynamics and related processes, as it will be possible to study widerspatial gradients and higher temporal variability of these param-eters much more easily. Consequently, it will also be possible tooptimize sampling upon existing gradients to ensure that a wholedynamic range is covered. This will be beneficial especially if astatistical approach, as this one presented here, is applied.
5. Conclusions
In this study, the recently proposed method for assessing for-est health conditions using optical indices retrieved from HS data(Misurec et al., 2012) was applied to the two temporal HyMap datesets acquired in 07/2009 and 08/2010 for detecting stress in Norwayspruce forests on a regional scale. The classification results werevalidated by ground truth data (foliar biochemistry: Cab, Car andCar/Cab) and were associated with the geochemical conditions ofthe forest stands (pH, macronutrient parameters, base saturation,exchangeable aluminum, Bc/Al ratio). The method proved suitableas the HyMap classification results were in accordance with thestatistical assessment of the biochemical properties of the sampledtrees as well as with the geochemical properties of the forest sites.It is apparent that, in both years, differences detected by biochemi-cal and hyperspectral methods remained consistent among sprucestands and only mild changes in the physiological condition of thestands under study were detected. This finding supports the validityof the previously presented model.
veronika.kopackova
Zvýraznění
veronika.kopackova
Zvýraznění
veronika.kopackova
Zvýraznění
Author's personal copy
184 V. Kopacková et al. / International Journal of Applied Earth Observation and Geoinformation 27 (2014) 169–186
Reflectance spectra for each Norway spruce health class werecalculated from the HyMap image data sets and stress-relatedtrends changing canopy reflectance were identified. Besides aREP coherent shift to shorter wavelengths with increasing stress,the stress related changes in the canopy’s spectral property aredetectable in the VIS/NIR regions as well as in the SWIR. Changes inVIS/NIR reflectance can be explained by chlorophyll degradation onone site and carotenoid content increases on the other site, whereaschanges in SWIR document falling water consumption as a reactionto the stress.
The results of this study demonstrate: (i) the potential appli-cation of hyperspectral remote sensing as a rapid method ofidentifying tree stress prior to symptom expression and (ii) theadded value of multitemporal approaches for hyperspectral dataand its further potential for monitoring forest ecosystems. Thesedistance methods could be the most cost-effective long-term toolavailable for forest management in the future, when the space-bornHS missions (e.g., EnMap or PRISMA) will be in operation.
Acknowledgements
The present research is being undertaken mainly within theframework of a grant No. 205/09/1989 (HypSo: grant funded bythe Czech Science Foundation). Additionally, the research was alsosupported by grants No. 244242 (EO-MINERS: FP7 grant fundedby the EC) and No. LM2010007 (CzeCOS). Many thanks are due toDr. Petr Rojík (Sokolovská uhelná a.s.) for his substantial assistancewith the field campaign. The colleagues from DLR are thanked forthe atmospheric correction of the HyMap 2010 data set.
Appendix A. Supplementary data
Supplementary data associated with this article can be found, inthe online version, at http://dx.doi.org/10.1016/j.jag.2013.09.009.These data include Google maps of the most important areasdescribed in this article.
References
Weiskittel, A.R., Maguire, D.A., Garber, S.M., Kanaskie, A., 2006. Influence of Swissneedle cast on foliage age-class structure and vertical foliage distribution inDouglas-fir plantations in north coastal Oregon. Canadian Journal of ForestResearch 36, 1497–1508.
Adler-Golden, S.M., Matthew, M.W., Bernstein, L.S., Levine, R.Y., Berk, A., Richtsmeier,S.C., Acharya, P.K., Anderson, G.P., Felde, G., Gardner, J., Hoke, M., Jeong, L.S.,Pukall, B., Ratkowski, A., Burke, H.H., 1999. Atmospheric correction for short-wave spectral imagery based on MODTRAN4. Imaging Spectrometry V 3753,61–69.
Ahern, F.J., 1988. The effects of Bark Beetle stress on the foliar spectral reflectanceof lodgepole pine. International Journal of Remote Sensing 9 (9), 1451–1468.
Albrechtova, J., Seidl, Z., Aitkenhead-Peterson, J., Lhotakova, Z., Rock, B.N., Alexander,J.E., Malenovsky, Z., McDowell, W.H., 2008. Spectral analysis of coniferous foliageand possible links to soil chemistry: are spectral chlorophyll indices related toforest floor dissolved organic C and N? Science of the Total Environmen 404(2–3), 424–432.
Asner, G.P., 1998. Biophysical and biochemical sources of variability in canopyreflectance. Remote Sensing of Environment 64 (3), 234–253.
Asner, G.P., Martin, R.E., 2009. Airborne spectranomics: mapping canopy chemi-cal and taxonomic diversity in tropical forests. Frontiers in Ecology and theEnvironment 7 (5), 269–276.
Aspinall, R.J., 2002. Use of logistic regression for validation of maps of the spatialdistribution of vegetation species derived from high spatial resolution hyper-spectral remotely sensed data. Ecological Modelling 157 (2–3), 301–312.
Aznar, J.C., Richer-Lafleche, M., Begin, C., Begin, Y., 2009. Lead exclusion and coppertranslocation in Black spruce needles. Water, Air, & Soil Pollution 203 (1–4),139–145.
Bachmann, M., Richter, R., Holzwarth, S., Weide, S., Fischer, C., Ehrler, C., 2011. Qual-ity Report on HyMap 2009 Sokolov data. In: Internal report of the EO-MINERSproject, DLR., pp. 1–25.
Blackburn, G.A., 2007. Hyperspectral remote sensing of plant pigments. Journal ofExperimental Botany 58 (4), 855–867.
Bonan, G.B., 2008. Forests and climate change: forcings, feedbacks, and the climatebenefits of forests. Science 320 (5882), 1444–1449.
Bouska, V., Pesek, J., 1999. Quality parameters of lignite of the North Bohemian Basinin the Czech Republic in comparison with the world average lignite. Interna-tional Journal of Coal Geology 40 (2–3), 211–235.
Campbell, P.K.E., Middleton, E.M., McMurtrey, J.E., Corp, L.A., Chappelle, E.W., 2007.Assessment of vegetation stress using reflectance or fluorescence measure-ments. Journal of Environmental Quality 36 (3), 832–845.
Campbell, P.K.E., Rock, B.N., Martin, M.E., Neefus, C.D., Irons, J.R., Middleton, E.M.,Albrechtova, J., 2004. Detection of initial damage in Norway spruce canopiesusing hyperspectral airborne data. International Journal of Remote Sensing 25(24), 5557–5583.
Carter, G.A., 1991. Primary and secondary effects of water-content on the spectralreflectance of leaves. American Journal of Botany 78 (7), 916–924.
Carter, G.A., Knapp, A.K., 2001. Leaf optical properties in higher plants: Linking spec-tral characteristics to stress and chlorophyll concentration. American Journal ofBotany 88 (4), 677–684.
Carter, G.A., Miller, R.L., 1994. Early detection of plant stress by digital imagingwithin narrow stress-sensitive wavebands. Remote Sensing of Environment 50(3), 295–302.
Chang, S.H., Collins, W., 1983. Confirmation of the airborne biogeophysical min-eral exploration technique using laboratory methods. Economic Geology 78 (4),723–736.
Cho, M.A., Debba, P., Mutanga, O., Dudeni-Tlhone, N., Magadla, T., Khuluse, S.A.,2012. Potential utility of the spectral red-edge region of SumbandilaSat imageryfor assessing indigenous forest structure and health. International Journal ofApplied Earth Observation and Geoinformation 16, 85–93.
Clevers, J.G.P.W., De Jong, S.M., Epema, G.F., Van der Meer, F.D., Bakker, W.H., Skid-more, A.K., Scholte, K.H., 2002. Derivation of the red edge index using theMERIS standard band setting. International Journal of Remote Sensing 23 (16),3169–3184.
Clevers, J.G.P.W., Kooistra, L., 2012. Using hyperspectral remote sensing data forretrieving canopy chlorophyll and nitrogen content. IEEE Journal of SelectedTopics in Applied Earth Observations and Remote Sensing 5 (2), 574–583.
Cronan, C.S., Grigal, D.F., 1995. Use of calcium aluminum ratios as indicators of stressin forest ecosystems. Journal of Environmental Quality 24 (2), 209–226.
Curran, P.J., Windham, W.R., Gholz, H.L., 1995. ‘Exploring the relationship betweenreflectance red edge and chlorophyll concentration in Slash Pine Leaves. TreePhysiology 15 (3), 203–206.
de Jong, S.M., Addink, E.A., Hoogenboom, P., Nijland, W., 2012. The spectral responseof Buxus sempervirens to different types of environmental stress – A laboratoryexperiment. Isprs Journal of Photogrammetry and Remote Sensing 74, 56–65,http://dx.doi.org/10.1016/j.isprsjprs.2012.08.005.
Demmig-Adams, B., 1998. Survey of thermal energy dissipation and pigment com-position in sun and shade leaves. Plant and Cell Physiology 39 (5), 474–482.
Demmig-Adams, B., Adams, W.W., 1996. The role of xanthophyll cycle carotenoidsin the protection of photosynthesis. Trends in Plant Science 1 (1), 21–26.
Everitt, J.H., Yang, C., Escobar, D.E., Lonard, R.I., Davis, M.R., 2002. Reflectance char-acteristics and remote sensing of a riparian zone in south Texas. SouthwesternNaturalist 47 (3), 433–439.
Feret, J.B., Asner, G.P., 2013. Tree species discrimination in tropical forests usingairborne imaging spectroscopy. IEEE Transactions on Geoscience and RemoteSensing 51 (1), 73–84.
Fassnacht, F.E., Latifi, H., Koch, B., 2012. An angular vegetation index for imagingspectroscopy data-Preliminary results on forest damage detection in the Bavar-ian National Park, Germany. International Journal of Applied Earth Observationand Geoinformation 19, 308–321, http://dx.doi.org/10.1016/j.jag.2012.05.018.
Gamon, J.A., Surfus, J.S., 1999. Assessing leaf pigment content and activity with areflectometer. New Phytologist 143 (1), 105–117.
Garcia-Plazaola, J., Becerril, J.M., 2001. Seasonal changes in photosynthetic pigmentsand antioxidants in beech (Fagus sylvatica) in a Mediterranean climate: impli-cations for tree decline diagnosis. Australian Journal of Plant Physiology 28 (3),225–232.
Gitelson, A.A., Merzlyak, M.N., Chivkunova, O.B., 2001. Optical properties and non-destructive estimation of anthocyanin content in plant leaves. Photochemistryand Photobiology 74 (1), 38–45.
Gitelson, A.A., Zur, Y., Chivkunova, O.B., Merzlyak, M.N., 2002. Assessing carotenoidcontent in plant leaves with reflectance spectroscopy. Photochemistry and Pho-tobiology 75 (3), 272–281.
Gould, W., 2000. Remote sensing of vegetation, plant species richness, and regionalbiodiversity hotspots. Ecological Applications 10 (6), 1861–1870.
Grisham, M.P., Johnson, R.M., Zimba, P.V., 2010. Detecting Sugarcane yellow leafvirus infection in asymptomatic leaves with hyperspectral remote sensingand associated leaf pigment changes. Journal of Virological Methods 167 (2),140–145.
Hamzeh, S., Naseri, A.A., AlaviPanah, S.K., Mojaradi, B., Bartholomeus, H.M., Clevers,J.G.P.W., Behzad, M., 2013. Estimating salinity stress in sugarcane fields withspaceborne hyperspectral vegetation indices. International Journal of AppliedEarth Observation and Geoinformation 21, 282–290.
Hernandez-Clemente, R., Navarro-Cerrillo, R.M., Suarez, L., Morales, F., Zarco-Tejada,P.J., 2011. Assessing structural effects on PRI for stress detection in coniferforests. Remote Sensing of Environment 115 (9), 2360–2375.
Homolova, L., Lukes, P., Malenovsky, Z., Lhotakova, Z., Kaplan, V., Hanus, J., 2013.Measurement methods and variability assessment of the Norway spruce totalleaf area: implications for remote sensing. Trees-structure and Function 27 (1),111–121.
Horler, D.N.H., Dockray, M., Barber, J., 1983. The red edge of plant leaf reflectance.International Journal of Remote Sensing 4 (2), 273–288.
Author's personal copy
V. Kopacková et al. / International Journal of Applied Earth Observation and Geoinformation 27 (2014) 169–186 185
Jackson, R.B., Randerson, J.T., Canadell, J.G., Anderson, R.G., Avissar, R., Baldocchi,D.D., Bonan, G.B., Caldeira, K., Diffenbaugh, N.S., Field, C.B., Hungate, B.A., Job-bagy, E.G., Kueppers, L.M., Nosetto, M.D., Pataki, D.E., 2008. Protecting climatewith forests. Environmental Research Letters 3 (4), 044006.
Kampe, T.U., Asner, G.P., Green, R.O., Eastwood, M., Johnson, B.R., Kuester, M.,2010. Advances in airborne remote sensing of ecosystem processes andproperties—toward high-quality measurement on a global scale. RemoteSensing and Modeling of Ecosystems For Sustainability Vii 7809, 78090J.
Kirchgessner, H.D., Reichert, K., Hauff, K., Steinbrecher, R., Schnitzler, J.P., Pfundel,E.E., 2003. Light and temperature, but not UV radiation, affect chlorophylls andcarotenoids in Norway spruce needles (Picea abies (L.) Karst.). Plant Cell andEnvironment 26 (7), 1169–1179.
Knipling, E.B., 1970. Physical and physiological basis for the reflectance of visibleand near IR radiation from vegetation. Remote Sensing of Environment 1 (3),155–159.
Knorn, J., Rabe, A., Radeloff, V.C., Kuemmerle, T., Kozak, J., Hostert, P., 2009. Landcover mapping of large areas using chain classification of neighboring Landsatsatellite images. Remote Sensing of Environment 113 (5), 957–964.
Kokaly, R.F., Asner, G.P., Ollinger, S.V., Martin, M.E., Wessman, C.A., 2009. Charac-terizing canopy biochemistry from imaging spectroscopy and its application toecosystem studies. Remote Sensing of Environment 113, S78–S91.
Kopackova, V., Chevrel, S., Bourguignon, A., Rojik, P., 2012. Application of highaltitude and ground-based spectroradiometry to mapping hazardous low-pHmaterial derived from the Sokolov open-pit mine. Journal of Maps 8 (3),220–230.
Kram, P., Hruska, J., Driscoll, C.T., Johnson, C.E., Oulehle, F., 2009. Long-term changesin aluminum fractions of drainage waters in two forest catchments with con-trasting lithology. Journal of Inorganic Biochemistry 103 (11), 1465–1472.
Kram, P., Hruska, J., Wenner, B.S., Driscoll, C.T., Johnson, C.E., 1997. The biogeochem-istry of basic cations in two forest catchments with contrasting lithology in theCzech Republic. Biogeochemistry 37 (2), 173–202.
Kramer, P.J., 1981. Carbon-dioxide concentration, photosynthesis, and dry-matterproduction. Bioscience 31 (1), 29–33.
Lamb, D.W., Brown, R.B., 2001. Remote-sensing and mapping of weeds in crops.Journal of Agricultural Engineering Research 78 (2), 117–125.
Landsberg, J., Prince, S., Jarvis, P., McMurtrie, R., Luxmoore, R., Medlyn, B., 1997.Energy conversion and use in forests: an analysis of forest production in termsof radiation utilisation efficiency (e). In: Shimoda, H., Gholz, H.L., Nakane, K.(Eds.), Forestry Sciences. Springer, Netherlands, pp. 273–298.
Lass, L.W., Prather, T.S., 2004. Detecting the locations of Brazilian pepper treesin the everglades with a hyperspectral sensor. Weed Technology 18 (2),437–442.
Lausch, A., Pause, M., Merbach, I., Zacharias, S., Doktor, D., Volk, M., Seppelt, R., 2013.A new multiscale approach for monitoring vegetation using remote sensing-based indicators in laboratory, field, and landscape. Environmental Monitoringand Assessment 185 (2), 1215–1235.
Lepedus, H., Viljevac, M., Cesar, V., Ljubesic, N., 2005. Functioning of the photo-synthetic apparatus under low and high light conditions in chlorotic spruceneedles as evaluated by in vivo chlorophyll fluorescence. Russian Journal of PlantPhysiology 52 (2), 165–170.
Majeke, B., van Aardt, J.A.N., Cho, M.A., 2008. Imaging spectroscopy of foliar bio-chemistry in forestry environments. Southern Forests 70 (3), 275–285.
Martz, F., Sutinen, M.L., Derome, K., Wingsle, G., Julkunen-Tiitto, R., Turunen, M.,2007. Effects of ultraviolet (UV) exclusion on the seasonal concentration of pho-tosynthetic and UV-screening pigments in Scots pine needles. Global ChangeBiology 13 (1), 252–265.
Masaitis, G., Mozgeris, G., Augustaitis, A., 2013. Spectral reflectance properties ofhealthy and stressed coniferous trees. Iforest-biogeosciences and Forestry 6,30–36.
Maslova, T.G., Mamushina, N.S., Sherstneva, O.A., Bubolo, L.S., Zubkova, E.K., 2009.Seasonal Structural and Functional Changes in the Photosynthetic Apparatus ofEvergreen Conifers. Russian Journal of Plant Physiology 56 (5), 607–615.
Misurec, J., Kopackova, V., Lhotakova, Z., Hanus, J., Weyermann, J., Entcheva-Campbell, P., Albrechtova, J., 2012. Utilization of hyperspectral image opticalindices to assess the Norway spruce forest health status. Journal of AppliedRemote Sensing 6, 063545.
Odagawa, S., Okada, K., 2009. Tree Species Discrimination Using ContinuumRemoved Airborne Hyperspectral Data. In: 2009 First Workshop On Hyper-spectral Image and Signal Processing: Evolution In Remote Sensing. IEEE, pp.243–246.
Ollinger, S.V., 2011. Sources of variability in canopy reflectance and the convergentproperties of plants. New Phytologist 189 (2), 375–394.
Oquist, G., Huner, N.P.A., 2003. Photosynthesis of overwintering evergreen plants.Annual Review of Plant Biology 54, 329–355.
Oulehle, F., Hofmeister, J., Cudlin, P., Hruska, J., 2006. The effect of reduced atmo-spheric deposition on soil and soil solution chemistry at a site subjected tolong-term acidification, Nacetin, Czech Republic. Science of the Total Environ-ment 370 (2–3), 532–544.
Oulehle, F., McDowell, W.H., Aitkenhead-Peterson, J.A., Kram, P., Hruska, J., Navratil,T., Buzek, F., Fottova, D., 2008. Long-term trends in stream nitrate concentra-tions and losses across watersheds undergoing recovery from acidification inthe Czech Republic. Ecosystems 11 (3), 410–425.
Penuelas, J., Baret, F., Filella, I., 1995. Semiempirical indexes to assess carotenoidschlorophyll-a ratio from leaf spectral reflectance. Photosynthetica 31 (2),221–230.
Pontius, J., Martin, M., Plourde, L., Hallett, R., 2008. Ash decline assessment in emer-ald ash borer-infested regions: A test of tree-level, hyperspectral technologies.Remote Sensing of Environment 112 (5), 2665–2676.
Porra, R.J., Thompson, W.A., Kriedemann, P.E., 1989. Determination of accurateextinction coefficients and simultaneous-equations for assaying chlorophyll-a and chlorophyll-b extracted with 4 different solvents—verification of theconcentration of chlorophyll standards by atomic-absorption spectroscopy.Biochimica et Biophysica Acta 975 (3), 384–394.
Porté, A., Bosc, A., Champion, I., Loustau, D., 2000. Estimating the foliage area ofMaritime pine (Pinus pinaster Ait.) branches and crowns with application tomodelling the foliage area distribution in the crown. Annals of Forest Science57, 73–86.
Pu, R.L., Kelly, M., Anderson, G.L., Gong, P., 2008. Using CASI hyperspectral imageryto detect mortality and vegetation stress associated with a new hardwood forestdisease. Photogrammetric Engineering and Remote Sensing 74 (1), 65–75.
Rathod, P.H., Rossiter, D.G., Noomen, M.F., van der Meer, F.D., 2013. Proximal spectralsensing to monitor phytoremediation of metal-contaminated soils. Interna-tional Journal of Phytoremediation 15 (5), 405–426.
Richter, R., 2009. Atmospheric/topographic correction for airborne imagery. DLR-German Aerospace Centre, Wessling, Germany.
Rock, B.N., Hoshizaki, T., Miller, J.R., 1988. Comparison of insitu and airborne spectralmeasurements of the blue shift associated with forest decline. Remote Sensingof Environment 24 (1), 109–127.
Rojík, P., 2004. New stratigraphic subdivision of the Tertiary in the Sokolov Basinin Northwestern Bohemia. Journal of the Czech Geological Society 49 (3–4),173–185.
Romer, C., Wahabzada, M., Ballvora, A., Pinto, F., Rossini, M., Panigada, C., Behmann,J., Leon, J., Thurau, C., Bauckhage, C., Kersting, K., Rascher, U., Plumer, L., 2012.Early drought stress detection in cereals: simplex volume maximisation forhyperspectral image analysis. Functional Plant Biology 39 (10–11), 878–890.
Sanches, I.D., Souza Filho, C.R., Magalhaes, L.A., Quiterio, G.C.M., Alves, M.N., Oliveira,W.J., 2013a. Assessing the impact of hydrocarbon leakages on vegetation usingreflectance spectroscopy. ISPRS Journal of Photogrammetry and Remote Sensing78, 85–101.
Sanches, I.D., Souza Filho, C.R., Magalhaes, L.A., Quiterio, G.C.M., Alves, M.N., Oliveira,W.J., 2013b. ‘Unravelling remote sensing signatures of plants contaminated withgasoline and diesel: An approach using the red edge spectral feature. Environ-mental Pollution 174, 16–27.
Schaaf, C.B., Gao, F., Strahler, A.H., Lucht, W., Li, X.W., Tsang, T., Strugnell, N.C., Zhang,X.Y., Jin, Y.F., Muller, J.P., Lewis, P., Barnsley, M., Hobson, P., Disney, M., Roberts,G., Dunderdale, M., Doll, C., d‘Entremont, R.P., Hu, B.X., Liang, S.L., Privette, J.L.,Roy, D., 2002. First operational BRDF, albedo nadir reflectance products fromMODIS. Remote Sensing of Environment 83 (1–2), 135–148.
Schaepman-Strub, G., Schaepman, M.E., Painter, T.H., Dangel, S., Martonchik, J.V.,2006. Reflectance quantities in optical remote sensing-definitions and case stud-ies. Remote Sensing of Environment 103 (1), 27–42.
Schläpfer, D., 1998. Parametric Geocoding, PARGE Using Guide, Version 2.3. ReSeApplications Schlдpfer & Remote Sensing Laboratories University of Zurich.
Schlerf, M., Atzberger, C., Hill, J., Buddenbaum, H., Werner, W., Schueler, G., 2010.Retrieval of chlorophyll and nitrogen in Norway spruce (Picea abies L. Karst.)using imaging spectroscopy. International Journal of Applied Earth Observationand Geoinformation 12 (1), 17–26.
Sebesta, J., Samonil, P., Lacina, J., Oulehle, F., Houska, J., Bucek, A., 2011. Acidificationof primeval forests in the Ukraine Carpathians: vegetation and soil changes oversix decades. Forest Ecology and Management 262 (7), 1265–1279.
Shafri, H.Z.M., Hamdan, N., Anuar, M.I., 2012. Detection of stressed oil palms froman airborne sensor using optimized spectral indices. International Journal ofRemote Sensing 33 (14), 4293–4311.
Shapiro, S.S., Wilk, M.B., 1965. An analysis of variance test for normality (completeSamples). Biometrika 52, 591.
Silkina, O.V., Vinokurova, R.I., 2009. Seasonal dynamics of chlorophyll and microele-ment content in developing conifer needles of Abies sibirica and Picea abies.Russian Journal of Plant Physiology 56 (6), 780–786.
Sims, D.A., Gamon, J.A., 2002. Relationships between leaf pigment content and spec-tral reflectance across a wide range of species, leaf structures and developmentalstages. Remote Sensing of Environment 81 (2–3), 337–354.
Soukupova, J., Cvikrova, M., Albrechtova, J., Rock, B.N., Eder, J., 2000. Histochemicaland biochemical approaches to the study of phenolic compounds and per-oxidases in needles of Norway spruce (Picea abies). New Phytologist 146 (3),403–414.
Suchara, I., Sucharova, J., Hola, M., Reimann, C., Boyd, R., Filzmoser, P., Englmaier, P.,2011. The performance of moss, grass, and 1- and 2-year old spruce needles asbioindicators of contamination: A comparative study at the scale of the CzechRepublic. Science of the Total Environmen 409 (11), 2281–2297.
Thomas, V., McCaughey, J.H., Treitz, P., Finch, D.A., Noland, T., Rich, L., 2009. Spa-tial modelling of photosynthesis for a boreal mixedwood forest by integratingmicrometeorological, lidar and hyperspectral remote sensing data. Agriculturaland Forest Meteorology 149 (3–4), 639–654.
Tzvetkova, N., Hadjiivanova, C., 2006. Chemical composition and biochemicalchanges in needles of Scots pine (Pinus sylvestris L.) stands at different stagesof decline in Bulgaria. Trees-structure and Function 20 (4), 405–409.
Underwood, E., Ustin, S., DiPietro, D., 2003. Mapping nonnative plants using hyper-spectral imagery. Remote Sensing of Environment 86 (2), 150–161.
Ustin, S.L., Gitelson, A.A., Jacquemoud, S., Schaepman, M., Asner, G.P., Gamon, J.A.,Zarco-Tejada, P., 2009. Retrieval of foliar information about plant pigment

Author's personal copy
186 V. Kopacková et al. / International Journal of Applied Earth Observation and Geoinformation 27 (2014) 169–186
systems from high resolution spectroscopy. Remote Sensing of Environment113, S67–S77.
Ustin, S.L., Roberts, D.A., Gamon, J.A., Asner, G.P., Green, R.O., 2004. Using imagingspectroscopy to study ecosystem processes and properties. Bioscience 54 (6),523–534.
van der Meer, F., van Dijk, P., van der Werff, H., Yang, H., 2002. Remote sensing andpetroleum seepage: a review and case study. Terra Nova 14 (1), 1–17.
van der Werff, H., van der Meijde, M., Jansma, F., van der Meer, F., Groothuis, G.J.,2008. A spatial-spectral approach for visualization of vegetation stress resultingfrom pipeline leakage. Sensors 8 (6), 3733–3743.
Verrelst, J., Schaepman, M.E., Koetz, B., Kneubuhler, M., 2008. Angular sensitivityanalysis of vegetation indices derived from CHRIS/PROBA data. Remote Sensingof Environment 112 (5), 2341–2353.
Vogelmann, J.E., Xian, G., Homer, C., Tolk, B., 2012. Monitoring gradual ecosystemchange using Landsat time series analyses: case studies in selected forest andrangeland ecosystems. Remote Sensing of Environment 122, 92–105.
Welburn, A., 1994. The spectral determination of chlorophyll-a and chlorophyll-b,as well as total carotenoids, using various solvents with spectrophotometers ofdifferent resolution. Journal of Plant Physiology 144 (3), 307–313.
Wu, C.Y., Niu, Z., Tang, Q., Huang, W.J., 2008. Estimating chlorophyll content fromhyperspectral vegetation indices: modeling and validation. Agricultural and For-est Meteorology 148 (8–9), 1230–1241.
Yatsko, Y.N., Dymova, O.V., Golovko, T.K., 2011. Violaxanthin cycle pigment de-epoxidation and thermal dissipation of light energy in three boreal species ofevergreen conifer plants. Russian Journal of Plant Physiology 58 (1), 169–173.
Young, A.J., Britton, G., 1990. Carotenoids and stress. In: Alscher, R.G., Cumming,J.R. (Eds.), Stress responses in plants: adaptation and acclimation mechanism.Wiley-Liss, New York, USA, pp. 87–112.
Yudovich, Y.E., Ketris, M.P., 2005. Arsenic in coal: a review. International Journal ofCoal Geology 61 (3–4), 141–196.
Zarco-Tejada, P.J., Miller, J.R., Morales, A., Berjon, A., Aguera, J., 2004. Hyperspectralindices and model simulation for chlorophyll estimation in open-canopy treecrops. Remote Sensing of Environment 90 (4), 463–476.
Zhang, C., Liu, Y., Kovacs, J.M., Flores-Verdugo, F., de Santiago, F.F., Chen, K., 2012.Spectral response to varying levels of leaf pigments collected from a degradedmangrove forest. Journal of Applied Remote Sensing 6, 063501.
Zhao, K.G., Valle, D., Popescu, S., Zhang, X.S., Mallick, B., 2013. Hyperspectral remotesensing of plant biochemistry using Bayesian model averaging with variable andband selection. Remote Sensing of Environment 132, 102–119.
Zinnert, J.C., Via, S.M., Young, D.R., 2013. Distinguishing natural from anthropogenicstress in plants: physiology, fluorescence and hyperspectral reflectance. Plantand Soil 366 (1–2), 133–141.
Zwiggelaar, R., 1998. A review of spectral properties of plants and their potential usefor crop/weed discrimination in row-crops. Crop Protection 17 (3), 189–206.