Proceedings of the WMO/UNESCO Sub-Forum on Science ...
189
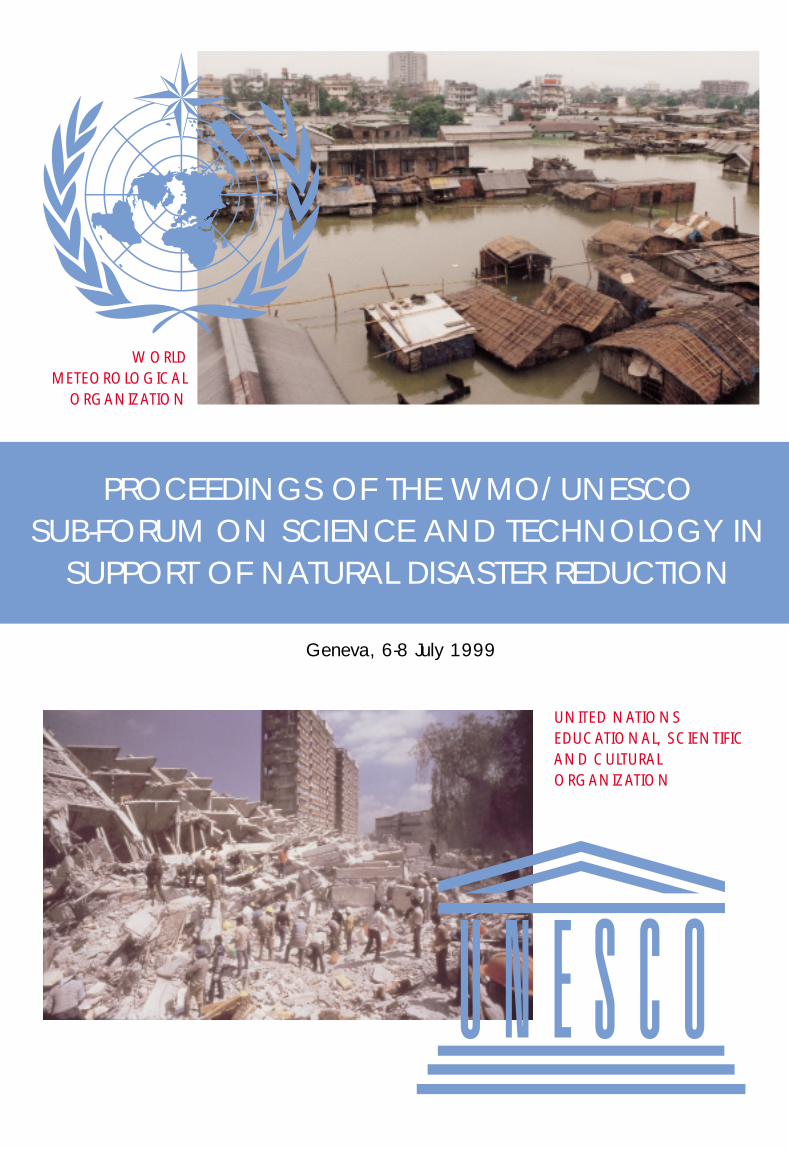
PROCEEDINGS OF THE WMO/UNESCO SUB-FORUM ON SCIENCE AND TECHNOLOGY IN SUPPORT OF NATURAL DISASTER REDUCTION Geneva, 6-8 July 1999 UNITED NATIONS EDUCATIONAL, SCIENTIFIC AND CULTURAL ORGANIZATION WORLD METEOROLOGICAL ORGANIZATION
-
Upload
khangminh22 -
Category
Documents
-
view
3 -
download
0
Transcript of Proceedings of the WMO/UNESCO Sub-Forum on Science ...
PROCEEDINGS OF THE WMO/UNESCO SUB-FORUM ON SCIENCE AND TECHNOLOGY IN
SUPPORT OF NATURAL DISASTER REDUCTION
Geneva, 6-8 July 1999
UNITED NATIONS EDUCATIONAL, SCIENTIFIC AND CULTURAL ORGANIZATION
WORLD METEOROLOGICAL
ORGANIZATION
PRO
CEE
DIN
GS
OF
THE
WM
O/U
NES
CO
SU
B-FO
RUM
ON
SC
IEN
CE
AN
D T
ECH
NO
LOG
Y IN
SU
PPO
RT O
F N
ATU
RAL
DIS
AST
ER R
EDU
CTI
ON
WMO

Cover: Floods (Haque/Bangladesh) and earthquakes (IDNDR) are a few of thenatural disasters that strike communities and countries worldwide withdevastating consequences. The International Decade for Natural DisasterReduction has made great strides in mitigating the impacts of these disasters.
© 1999, World Meteorological Organization
ISBN 92-63-10914-1
NOTE
The designations employed and the presentation of material in this publicationdo not imply the expression of any opinion whatsoever on the part of theSecretariat of the World Meteorological Organization concerning the legal statusof any country, territory, city or area, or of its authorities, or concerning thedelimitation of its frontiers or boundaries.
TABLE OF CONTENTS
FOREWORD . . . . . . . . . . . . . . . . . . . . . . . . . . . . . . . . . . . . . . . . . . . . . . . . . . . . . . . . . ix
INTRODUCTION . . . . . . . . . . . . . . . . . . . . . . . . . . . . . . . . . . . . . . . . . . . . . . . . . . . . . . xi
STATEMENT . . . . . . . . . . . . . . . . . . . . . . . . . . . . . . . . . . . . . . . . . . . . . . . . . . . . . . . . . . xiii
EXTRATROPICAL STORMS OF THE DECADE — A BRIEF REVIEW . . . . . . . . . . . . 1By William Appleby and Karen Sutherland
Abstract . . . . . . . . . . . . . . . . . . . . . . . . . . . . . . . . . . . . . . . . . . . . . . . . . . . . . . . . . . . . . 11. Introduction . . . . . . . . . . . . . . . . . . . . . . . . . . . . . . . . . . . . . . . . . . . . . . . . . . . . 12. Extratropical winter storms . . . . . . . . . . . . . . . . . . . . . . . . . . . . . . . . . . . . . . . . 22.1 The stormy Atlantic — 1990 . . . . . . . . . . . . . . . . . . . . . . . . . . . . . . . . . . . . . . . 22.2 The storm of the century — 1993 . . . . . . . . . . . . . . . . . . . . . . . . . . . . . . . . . . . 22.3 California winter storms — 1995 . . . . . . . . . . . . . . . . . . . . . . . . . . . . . . . . . . . 32.4 Ice storm ’98 . . . . . . . . . . . . . . . . . . . . . . . . . . . . . . . . . . . . . . . . . . . . . . . . . . . . 43. Summer extratropical storms . . . . . . . . . . . . . . . . . . . . . . . . . . . . . . . . . . . . . . . 43.1 The great flood — 1993 . . . . . . . . . . . . . . . . . . . . . . . . . . . . . . . . . . . . . . . . . . . 53.2 Palm Sunday tornado outbreak, 1994 and the midwest tornado
outbreak — 1999 . . . . . . . . . . . . . . . . . . . . . . . . . . . . . . . . . . . . . . . . . . . . . . 63.3 Saguenay river flooding — 1996 . . . . . . . . . . . . . . . . . . . . . . . . . . . . . . . . . . . . 73.4 Yangtze river floods — 1998 . . . . . . . . . . . . . . . . . . . . . . . . . . . . . . . . . . . . . . . 83.5 The Sydney hailstorm — April 14, 1999 . . . . . . . . . . . . . . . . . . . . . . . . . . . . . . 94. Conclusion . . . . . . . . . . . . . . . . . . . . . . . . . . . . . . . . . . . . . . . . . . . . . . . . . . . . . 9References . . . . . . . . . . . . . . . . . . . . . . . . . . . . . . . . . . . . . . . . . . . . . . . . . . . . . . . . . . . . 10
SEVERE LOCAL STORMS . . . . . . . . . . . . . . . . . . . . . . . . . . . . . . . . . . . . . . . . . . . . . . . . 12By Harold E. Brooks and Steven J. Weiss;
Abstract . . . . . . . . . . . . . . . . . . . . . . . . . . . . . . . . . . . . . . . . . . . . . . . . . . . . . . . . . . . . . 121. Introduction . . . . . . . . . . . . . . . . . . . . . . . . . . . . . . . . . . . . . . . . . . . . . . . . . . . . 122. Nature of threats . . . . . . . . . . . . . . . . . . . . . . . . . . . . . . . . . . . . . . . . . . . . . . . . 122.1 Tornadoes . . . . . . . . . . . . . . . . . . . . . . . . . . . . . . . . . . . . . . . . . . . . . . . . . . . . . . 122.2 Hail . . . . . . . . . . . . . . . . . . . . . . . . . . . . . . . . . . . . . . . . . . . . . . . . . . . . . . . . . . . 172.3 Damaging convective wind gusts . . . . . . . . . . . . . . . . . . . . . . . . . . . . . . . . . . . 172.4 Flash floods . . . . . . . . . . . . . . . . . . . . . . . . . . . . . . . . . . . . . . . . . . . . . . . . . . . . 183. Forecasting severe local storms . . . . . . . . . . . . . . . . . . . . . . . . . . . . . . . . . . . . . 203.1 Prediction of tornadoes . . . . . . . . . . . . . . . . . . . . . . . . . . . . . . . . . . . . . . . . . . . 213.2 Hailstone development . . . . . . . . . . . . . . . . . . . . . . . . . . . . . . . . . . . . . . . . . . . 223.3 Damaging convective wind gusts . . . . . . . . . . . . . . . . . . . . . . . . . . . . . . . . . . . 224. Possible relationships to El Niño/Southern Oscillation (ENSO) . . . . . . . . . . . . 255. Concluding thoughts . . . . . . . . . . . . . . . . . . . . . . . . . . . . . . . . . . . . . . . . . . . . . 25Acknowledgements . . . . . . . . . . . . . . . . . . . . . . . . . . . . . . . . . . . . . . . . . . . . . . . . . . . . 26References . . . . . . . . . . . . . . . . . . . . . . . . . . . . . . . . . . . . . . . . . . . . . . . . . . . . . . . . . . . 26
DROUGHT MONITORING AND PREDICTION FOR DISASTER PREPAREDNESS . . . . . 32By L.A.Ogallo
Abstract . . . . . . . . . . . . . . . . . . . . . . . . . . . . . . . . . . . . . . . . . . . . . . . . . . . . . . . . . . . . . 321. Drought definitions . . . . . . . . . . . . . . . . . . . . . . . . . . . . . . . . . . . . . . . . . . . . . . 322. Recurrence of droughts and the associated socioeconomic impacts of
droughts . . . . . . . . . . . . . . . . . . . . . . . . . . . . . . . . . . . . . . . . . . . . . . . . . . . . . . . 333. Drought monitoring and prediction . . . . . . . . . . . . . . . . . . . . . . . . . . . . . . . . . 344. Sectorial demands and challenges of drought monitoring/prediction
science and technology in the next century . . . . . . . . . . . . . . . . . . . . . . . . . . . 345. References . . . . . . . . . . . . . . . . . . . . . . . . . . . . . . . . . . . . . . . . . . . . . . . . . . . . . . 34
iii
METEOROLOGY AS AN AID IN FIGHTING AND PREVENTING FOREST FIRES . . . . . 36By Bernard Sol
Abstract . . . . . . . . . . . . . . . . . . . . . . . . . . . . . . . . . . . . . . . . . . . . . . . . . . . . . . . . . . . . . 361. Introduction . . . . . . . . . . . . . . . . . . . . . . . . . . . . . . . . . . . . . . . . . . . . . . . . . . . . 362. Spreading of the fires . . . . . . . . . . . . . . . . . . . . . . . . . . . . . . . . . . . . . . . . . . . . . 362.1 Layers of plant cover . . . . . . . . . . . . . . . . . . . . . . . . . . . . . . . . . . . . . . . . . . . . . 362.2 Processes governing the spread of a surface fire . . . . . . . . . . . . . . . . . . . . . . . . 373. Assessing the risk . . . . . . . . . . . . . . . . . . . . . . . . . . . . . . . . . . . . . . . . . . . . . . . . 373.1 Time-scale considerations . . . . . . . . . . . . . . . . . . . . . . . . . . . . . . . . . . . . . . . . . 373.1.1 The “climatic” time-scale . . . . . . . . . . . . . . . . . . . . . . . . . . . . . . . . . . . . . . . . . . 373.1.2 The short and medium scale . . . . . . . . . . . . . . . . . . . . . . . . . . . . . . . . . . . . . . . 383.1.3 The nowcasting scale . . . . . . . . . . . . . . . . . . . . . . . . . . . . . . . . . . . . . . . . . . . . . 383.2 Overall risk/meteorologically assessed risk . . . . . . . . . . . . . . . . . . . . . . . . . . . . 383.3 Condition of plant cover . . . . . . . . . . . . . . . . . . . . . . . . . . . . . . . . . . . . . . . . . . 384. Meteorological assessment of fire risk . . . . . . . . . . . . . . . . . . . . . . . . . . . . . . . . 384.1 The conventional approach: Meteorological indices of fire risk . . . . . . . . . . . . 394.1.1 Parameters required . . . . . . . . . . . . . . . . . . . . . . . . . . . . . . . . . . . . . . . . . . . . . . 394.1.2 Location and density of meteorological measurements . . . . . . . . . . . . . . . . . . 394.1.3 Choice of method . . . . . . . . . . . . . . . . . . . . . . . . . . . . . . . . . . . . . . . . . . . . . . . 404.2 The mixed approach: Plant cover measurements and weather forecasts . . . . . 404.3 The remote sensing approach . . . . . . . . . . . . . . . . . . . . . . . . . . . . . . . . . . . . . . 404.3.1 Forested areas . . . . . . . . . . . . . . . . . . . . . . . . . . . . . . . . . . . . . . . . . . . . . . . . . . . 404.3.2 Prairies and savanna . . . . . . . . . . . . . . . . . . . . . . . . . . . . . . . . . . . . . . . . . . . . . 414.3.3. Meteorological assessment of fire risk . . . . . . . . . . . . . . . . . . . . . . . . . . . . . . . . 415. Fires started by lightning . . . . . . . . . . . . . . . . . . . . . . . . . . . . . . . . . . . . . . . . . . 416. Meteorological assistance . . . . . . . . . . . . . . . . . . . . . . . . . . . . . . . . . . . . . . . . . 416.1 Cooperation among services . . . . . . . . . . . . . . . . . . . . . . . . . . . . . . . . . . . . . . . 416.2 Prevention . . . . . . . . . . . . . . . . . . . . . . . . . . . . . . . . . . . . . . . . . . . . . . . . . . . . . 427. Conclusion . . . . . . . . . . . . . . . . . . . . . . . . . . . . . . . . . . . . . . . . . . . . . . . . . . . . . 42References . . . . . . . . . . . . . . . . . . . . . . . . . . . . . . . . . . . . . . . . . . . . . . . . . . . . . . . . . . . 42
IMPACTS OF EXTREME AND PERSISTENT TEMPERATURES — COLD WAVES AND HEAT WAVES . . . . . . . . . . . . . . . . . . . . . . . . . . . . . . . . . . . . . . . . . . . . . . . . . . . . . 43By G. Jendritzky
1. Introduction . . . . . . . . . . . . . . . . . . . . . . . . . . . . . . . . . . . . . . . . . . . . . . . . . . . . 432. Extreme temperature events . . . . . . . . . . . . . . . . . . . . . . . . . . . . . . . . . . . . . . . 432.1 Cold waves . . . . . . . . . . . . . . . . . . . . . . . . . . . . . . . . . . . . . . . . . . . . . . . . . . . . . 432.1.1 Overview . . . . . . . . . . . . . . . . . . . . . . . . . . . . . . . . . . . . . . . . . . . . . . . . . . . . . . 432.1.2 The 1998 ice storm in Canada and the United States . . . . . . . . . . . . . . . . . . . . 452.2 Heatwaves . . . . . . . . . . . . . . . . . . . . . . . . . . . . . . . . . . . . . . . . . . . . . . . . . . . . . 472.2.1 Overview . . . . . . . . . . . . . . . . . . . . . . . . . . . . . . . . . . . . . . . . . . . . . . . . . . . . . . 472.2.2 The 1995 heat wave in Chicago . . . . . . . . . . . . . . . . . . . . . . . . . . . . . . . . . . . . 493. The meteorological and climatological context . . . . . . . . . . . . . . . . . . . . . . . . 504. Vulnerability . . . . . . . . . . . . . . . . . . . . . . . . . . . . . . . . . . . . . . . . . . . . . . . . . . . 515. The watch/warning concept . . . . . . . . . . . . . . . . . . . . . . . . . . . . . . . . . . . . . . . 51References . . . . . . . . . . . . . . . . . . . . . . . . . . . . . . . . . . . . . . . . . . . . . . . . . . . . . . . . . . . 52
DUST AND SAND STORMS — CHARACTERISTICS, VULNERABILITY, AWARENESS AND PREPAREDNESS . . . . . . . . . . . . . . . . . . . . . . . . . . . . . . . . . . . . . . . . 54By A.A. Hassan
Abstract . . . . . . . . . . . . . . . . . . . . . . . . . . . . . . . . . . . . . . . . . . . . . . . . . . . . . . . . . . . . . 541. Introduction . . . . . . . . . . . . . . . . . . . . . . . . . . . . . . . . . . . . . . . . . . . . . . . . . . . . 542. Definitions . . . . . . . . . . . . . . . . . . . . . . . . . . . . . . . . . . . . . . . . . . . . . . . . . . . . . 543. General characteristics of dust storms . . . . . . . . . . . . . . . . . . . . . . . . . . . . . . . . 543.1 Annual Frequency . . . . . . . . . . . . . . . . . . . . . . . . . . . . . . . . . . . . . . . . . . . . . . . 543.2 Daily Variation . . . . . . . . . . . . . . . . . . . . . . . . . . . . . . . . . . . . . . . . . . . . . . . . . . 55
iv
TABLE OF CONTENTS
3.3 The relation to weather elements . . . . . . . . . . . . . . . . . . . . . . . . . . . . . . . . . . . 553.3.1 Temperature . . . . . . . . . . . . . . . . . . . . . . . . . . . . . . . . . . . . . . . . . . . . . . . . . . . . 553.3.2 Humidity . . . . . . . . . . . . . . . . . . . . . . . . . . . . . . . . . . . . . . . . . . . . . . . . . . . . . . 553.3.3 Wind . . . . . . . . . . . . . . . . . . . . . . . . . . . . . . . . . . . . . . . . . . . . . . . . . . . . . . . . . . 564. The mechanism of dust lifting . . . . . . . . . . . . . . . . . . . . . . . . . . . . . . . . . . . . . 565. Types of sandstorms . . . . . . . . . . . . . . . . . . . . . . . . . . . . . . . . . . . . . . . . . . . . . . 565.1 Föhn wind type . . . . . . . . . . . . . . . . . . . . . . . . . . . . . . . . . . . . . . . . . . . . . . . . . 565.2 Cold front type . . . . . . . . . . . . . . . . . . . . . . . . . . . . . . . . . . . . . . . . . . . . . . . . . 575.3 Thunderstorm type . . . . . . . . . . . . . . . . . . . . . . . . . . . . . . . . . . . . . . . . . . . . . . 575.4 Desert depression type . . . . . . . . . . . . . . . . . . . . . . . . . . . . . . . . . . . . . . . . . . . . 576. Analysis of individual dust storms . . . . . . . . . . . . . . . . . . . . . . . . . . . . . . . . . . 586.1 6 April 1981 (Vertical motion calculated by omega equation) . . . . . . . . . . . . . 586.2 22 March 1984, 17-18 January 1985, 20 April 1986 and 1 April 1987
(Vertical motion calculated by continuity equation) . . . . . . . . . . . . . . . . . . . . 617. Relationship with the El Niño . . . . . . . . . . . . . . . . . . . . . . . . . . . . . . . . . . . . . . 618. Hazards of dust storms . . . . . . . . . . . . . . . . . . . . . . . . . . . . . . . . . . . . . . . . . . . . 62References . . . . . . . . . . . . . . . . . . . . . . . . . . . . . . . . . . . . . . . . . . . . . . . . . . . . . . . . . . . 63Appendix I . . . . . . . . . . . . . . . . . . . . . . . . . . . . . . . . . . . . . . . . . . . . . . . . . . . . . . . . . . . 71Appendix II . . . . . . . . . . . . . . . . . . . . . . . . . . . . . . . . . . . . . . . . . . . . . . . . . . . . . . . . . . 72Appendix III . . . . . . . . . . . . . . . . . . . . . . . . . . . . . . . . . . . . . . . . . . . . . . . . . . . . . . . . . . 73
MITIGATING THE EFFECTS OF EARTHQUAKES: PROBLEMS, PROGRESS AND FUTURE TRENDS . . . . . . . . . . . . . . . . . . . . . . . . . . . . . . . . . . . . . . . . . . . . . . . . . . 74By Alan G. Green
Abstract . . . . . . . . . . . . . . . . . . . . . . . . . . . . . . . . . . . . . . . . . . . . . . . . . . . . . . . . . . . . . 741. Introduction . . . . . . . . . . . . . . . . . . . . . . . . . . . . . . . . . . . . . . . . . . . . . . . . . . . . 742. Construction practices and ground conditions make a difference . . . . . . . . . . 753. Earthquake prediction . . . . . . . . . . . . . . . . . . . . . . . . . . . . . . . . . . . . . . . . . . . . 764. Earthquake forecasting: Hazard and risk assessment . . . . . . . . . . . . . . . . . . . . 775. Early warning systems . . . . . . . . . . . . . . . . . . . . . . . . . . . . . . . . . . . . . . . . . . . . 786. Earthquake mitigation and preparedness . . . . . . . . . . . . . . . . . . . . . . . . . . . . . 796.1 Earthquake and megacities activities . . . . . . . . . . . . . . . . . . . . . . . . . . . . . . . . . 80Acknowledgements . . . . . . . . . . . . . . . . . . . . . . . . . . . . . . . . . . . . . . . . . . . . . . . . . . . . 82References . . . . . . . . . . . . . . . . . . . . . . . . . . . . . . . . . . . . . . . . . . . . . . . . . . . . . . . . . . . 82
EARTHQUAKE VULNERABILITY . . . . . . . . . . . . . . . . . . . . . . . . . . . . . . . . . . . . . . . . . . 83By Walter W. Hays
Abstract . . . . . . . . . . . . . . . . . . . . . . . . . . . . . . . . . . . . . . . . . . . . . . . . . . . . . . . . . . . . . 831. Introduction . . . . . . . . . . . . . . . . . . . . . . . . . . . . . . . . . . . . . . . . . . . . . . . . . . . . 832. What makes a community vulnerable to earthquakes . . . . . . . . . . . . . . . . . . . 843. What do the surprises throughout the world indicate . . . . . . . . . . . . . . . . . . . 854. Why is seismic zonation — a policy tool for integrated risk assessment
and risk management — urgently needed and a hope for the future: . . . . . . . 865. What are the gaps in knowledge . . . . . . . . . . . . . . . . . . . . . . . . . . . . . . . . . . . . 876. What are the principal options for reducing community vulnerability . . . . . . 877. Conclusions . . . . . . . . . . . . . . . . . . . . . . . . . . . . . . . . . . . . . . . . . . . . . . . . . . . . 88Reference . . . . . . . . . . . . . . . . . . . . . . . . . . . . . . . . . . . . . . . . . . . . . . . . . . . . . . . . . . . . 88
SUCCESSES AND FAILURES IN FIGHTING LANDSLIDES: SOME EXPERIENCES FROM ITALY AND ELSEWHERE . . . . . . . . . . . . . . . . . . . . . . . . . . . . . . . . . . . . . . . . . . . 89By Paolo Canuti, Nicola Casagli and Filippo Catani
Abstract . . . . . . . . . . . . . . . . . . . . . . . . . . . . . . . . . . . . . . . . . . . . . . . . . . . . . . . . . . . . . 891. Introduction . . . . . . . . . . . . . . . . . . . . . . . . . . . . . . . . . . . . . . . . . . . . . . . . . . . . 892. Prediction . . . . . . . . . . . . . . . . . . . . . . . . . . . . . . . . . . . . . . . . . . . . . . . . . . . . . . 912.1 The Emilia Romagna region: A database of 32 000 landslides for
prediction purposes . . . . . . . . . . . . . . . . . . . . . . . . . . . . . . . . . . . . . . . . . . . . . . 93
TABLE OF CONTENTS
v

3. Prevention . . . . . . . . . . . . . . . . . . . . . . . . . . . . . . . . . . . . . . . . . . . . . . . . . . . . . 973.1 The San Miniato landslides in Florence: how successful prevention can be
combined with a town planning transformation . . . . . . . . . . . . . . . . . . . . . . . 983.2 The 1988 Sarno event: a disaster caused by the lack of preventive measures . 994. Emergency planning . . . . . . . . . . . . . . . . . . . . . . . . . . . . . . . . . . . . . . . . . . . . . 1014.1 La Josefina landslide dam: An example of successful emergency management 1034.2 The Vaiont slide: An example of poor management leading to a catastrophe . 1045. Conclusions . . . . . . . . . . . . . . . . . . . . . . . . . . . . . . . . . . . . . . . . . . . . . . . . . . . . 106Acknowledgements . . . . . . . . . . . . . . . . . . . . . . . . . . . . . . . . . . . . . . . . . . . . . . . . . . . . 107References . . . . . . . . . . . . . . . . . . . . . . . . . . . . . . . . . . . . . . . . . . . . . . . . . . . . . . . . . . . 108
SNOW AVALANCHES . . . . . . . . . . . . . . . . . . . . . . . . . . . . . . . . . . . . . . . . 111By Paul M.B. Föhn and Walter J. Ammann
Abstract . . . . . . . . . . . . . . . . . . . . . . . . . . . . . . . . . . . . . . . . . . . . . . . . . . . . . . . . . . . . . 1111. Introduction . . . . . . . . . . . . . . . . . . . . . . . . . . . . . . . . . . . . . . . . . . . . . . . . . . . . 1112. Avalanche hazard and damage scenarios . . . . . . . . . . . . . . . . . . . . . . . . . . . . . 1113. Avalanche protection measures . . . . . . . . . . . . . . . . . . . . . . . . . . . . . . . . . . . . . 1123.1 General overview . . . . . . . . . . . . . . . . . . . . . . . . . . . . . . . . . . . . . . . . . . . . . . . . 1123.2 Avalanche forecasting . . . . . . . . . . . . . . . . . . . . . . . . . . . . . . . . . . . . . . . . . . . . 1123.2 Avalanche hazard mapping . . . . . . . . . . . . . . . . . . . . . . . . . . . . . . . . . . . . . . . . 1153.3 Construction measures . . . . . . . . . . . . . . . . . . . . . . . . . . . . . . . . . . . . . . . . . . . 1153.5 Mountain forests . . . . . . . . . . . . . . . . . . . . . . . . . . . . . . . . . . . . . . . . . . . . . . . . 1174. Avalanche risk assessment and management . . . . . . . . . . . . . . . . . . . . . . . . . . 1175. Research needs . . . . . . . . . . . . . . . . . . . . . . . . . . . . . . . . . . . . . . . . . . . . . . . . . . 1175.1 Physics and mechanics of snow . . . . . . . . . . . . . . . . . . . . . . . . . . . . . . . . . . . . 1175.2 Avalanche forecasting . . . . . . . . . . . . . . . . . . . . . . . . . . . . . . . . . . . . . . . . . . . . 1175.3 Avalanche hazard mapping . . . . . . . . . . . . . . . . . . . . . . . . . . . . . . . . . . . . . . . . 1185.4 Technical measures and risk management . . . . . . . . . . . . . . . . . . . . . . . . . . . . 118References . . . . . . . . . . . . . . . . . . . . . . . . . . . . . . . . . . . . . . . . . . . . . . . . . . . . . . . . . . . 118
MITIGATING THE EFFECTS OF TSUNAMIS: WHERE DO WE GO FROM HERE ? . . . 121By Charles S. McCreery
Abstract . . . . . . . . . . . . . . . . . . . . . . . . . . . . . . . . . . . . . . . . . . . . . . . . . . . . . . . . . . . . . 121Tsunami phenomenon . . . . . . . . . . . . . . . . . . . . . . . . . . . . . . . . . . . . . . . . . . . . . . . . . 121Tsunami hazard . . . . . . . . . . . . . . . . . . . . . . . . . . . . . . . . . . . . . . . . . . . . . . . . . . . . . . . 123Tsunami mitigation . . . . . . . . . . . . . . . . . . . . . . . . . . . . . . . . . . . . . . . . . . . . . . . . . . . . 124Hazard assessment . . . . . . . . . . . . . . . . . . . . . . . . . . . . . . . . . . . . . . . . . . . . . . . . . . . . . 124Warning systems . . . . . . . . . . . . . . . . . . . . . . . . . . . . . . . . . . . . . . . . . . . . . . . . . . . . . . 126Preparedness . . . . . . . . . . . . . . . . . . . . . . . . . . . . . . . . . . . . . . . . . . . . . . . . . . . . . . . . . 128Research . . . . . . . . . . . . . . . . . . . . . . . . . . . . . . . . . . . . . . . . . . . . . . . . . . . . . . . . . . . . . 129Conclusion . . . . . . . . . . . . . . . . . . . . . . . . . . . . . . . . . . . . . . . . . . . . . . . . . . . . . . . . . . . 129
STORM SURGES IN THE MARGINAL SEAS OF THE NORTH INDIAN OCEAN . . . . . 130By T.S. Murty
Abstract . . . . . . . . . . . . . . . . . . . . . . . . . . . . . . . . . . . . . . . . . . . . . . . . . . . . . . . . . . . . . 1301. Introduction . . . . . . . . . . . . . . . . . . . . . . . . . . . . . . . . . . . . . . . . . . . . . . . . . . . . 1302. Ocean wave spectrum . . . . . . . . . . . . . . . . . . . . . . . . . . . . . . . . . . . . . . . . . . . . 1313. Storm surge . . . . . . . . . . . . . . . . . . . . . . . . . . . . . . . . . . . . . . . . . . . . . . . . . . . . 1314. Tides . . . . . . . . . . . . . . . . . . . . . . . . . . . . . . . . . . . . . . . . . . . . . . . . . . . . . . . . . . 1365. Influence of greenhouse effect and El Niño events . . . . . . . . . . . . . . . . . . . . . . 1386. Summary . . . . . . . . . . . . . . . . . . . . . . . . . . . . . . . . . . . . . . . . . . . . . . . . . . . . . . 138References . . . . . . . . . . . . . . . . . . . . . . . . . . . . . . . . . . . . . . . . . . . . . . . . . . . . . . . . . . . 138
TABLE OF CONTENTS
vi
EARLY WARNING FOR THE 1991 ERUPTIONS OF PINATUBO VOLCANO — A SUCCESS STORY — . . . . . . . . . . . . . . . . . . . . . . . . . . . . . . . . . . . . . . . . 140By Raymundo S. Punongbayan and Christopher G. Newhall
Abstract . . . . . . . . . . . . . . . . . . . . . . . . . . . . . . . . . . . . . . . . . . . . . . . . . . . . . . . . . . . . . 1401. Introduction . . . . . . . . . . . . . . . . . . . . . . . . . . . . . . . . . . . . . . . . . . . . . . . . . . . . 1402. Volcanic risk mitigation efforts before the 1990s . . . . . . . . . . . . . . . . . . . . . . . 1413. Chronology of Pinatubo’s activities and scientific responses . . . . . . . . . . . . . . 1423.1 July–August 1990 . . . . . . . . . . . . . . . . . . . . . . . . . . . . . . . . . . . . . . . . . . . . . . . . 1423.2 April 1991 . . . . . . . . . . . . . . . . . . . . . . . . . . . . . . . . . . . . . . . . . . . . . . . . . . . . . . 1423.3 May 1991 . . . . . . . . . . . . . . . . . . . . . . . . . . . . . . . . . . . . . . . . . . . . . . . . . . . . . . 1443.4 1–11 June . . . . . . . . . . . . . . . . . . . . . . . . . . . . . . . . . . . . . . . . . . . . . . . . . . . . . 1463.5 12–15 June . . . . . . . . . . . . . . . . . . . . . . . . . . . . . . . . . . . . . . . . . . . . . . . . . . . . . 1473.6 16 June – 4 December 1991 . . . . . . . . . . . . . . . . . . . . . . . . . . . . . . . . . . . . . . . . 1474. Public response to the Pinatubo warnings . . . . . . . . . . . . . . . . . . . . . . . . . . . . 1485. Insights and lessons from the experience . . . . . . . . . . . . . . . . . . . . . . . . . . . . . 148References . . . . . . . . . . . . . . . . . . . . . . . . . . . . . . . . . . . . . . . . . . . . . . . . . . . . . . . . . . . 149
REDUCING THE IMPACTS OF TROPICAL CYCLONES DURING THE IDNDR . . . . . . . 150By Greg J. Holland
Abstract . . . . . . . . . . . . . . . . . . . . . . . . . . . . . . . . . . . . . . . . . . . . . . . . . . . . . . . . . . . . . 1501. Introduction . . . . . . . . . . . . . . . . . . . . . . . . . . . . . . . . . . . . . . . . . . . . . . . . . . . . 1502. Tropical cyclone impacts . . . . . . . . . . . . . . . . . . . . . . . . . . . . . . . . . . . . . . . . . . 1503. The WMO/CAS-ICSU collaboration on tropical cyclones as a priority mission
under the IDNDR . . . . . . . . . . . . . . . . . . . . . . . . . . . . . . . . . . . . . . . . . . . . . . . . 1513.1 The international workshop on tropical cyclones series . . . . . . . . . . . . . . . . . . 1513.2 The Beijing symposium on tropical cyclones as natural disasters . . . . . . . . . . 1523.3 Tropical cyclones and climate change . . . . . . . . . . . . . . . . . . . . . . . . . . . . . . . . 1534. Major IDNDR-related research initiatives . . . . . . . . . . . . . . . . . . . . . . . . . . . . . 1544.1 Tropical cyclone motion . . . . . . . . . . . . . . . . . . . . . . . . . . . . . . . . . . . . . . . . . . 1544.2 The Aerosonde robotic aircraft . . . . . . . . . . . . . . . . . . . . . . . . . . . . . . . . . . . . . 1565. Analysis and forecasting of tropical cyclones during the IDNDR . . . . . . . . . . . 1576. Reducing societal impacts due to tropical cyclone landfall . . . . . . . . . . . . . . . 1576.1 The Australian tropical cyclone coastal impacts project (TCCIP) . . . . . . . . . . . 1586.2 The US weather research program — Hurricanes at landfall program (HAL) . . 1596.3 The world weather research program — Tropical cyclone landfall initiative . . 1607. The next decade . . . . . . . . . . . . . . . . . . . . . . . . . . . . . . . . . . . . . . . . . . . . . . . . . 161References . . . . . . . . . . . . . . . . . . . . . . . . . . . . . . . . . . . . . . . . . . . . . . . . . . . . . . . . . . . 162
REVIEW OF SCIENCE, TECHNOLOGY AND POLICY FOR RIVER AND COASTAL FLOODING . . . . . . . . . . . . . . . . . . . . . . . . . . . . . . . . . . . . . . . . . . . . . . . . . . 164By Tauhidul Anwar Khan and Stephen Brichieri-Colombi
Abstract . . . . . . . . . . . . . . . . . . . . . . . . . . . . . . . . . . . . . . . . . . . . . . . . . . . . . . . . . . . . . 1641. Flooding as a natural hazard . . . . . . . . . . . . . . . . . . . . . . . . . . . . . . . . . . . . . . . 1642. Vulnerability . . . . . . . . . . . . . . . . . . . . . . . . . . . . . . . . . . . . . . . . . . . . . . . . . . . 1653. Hazard . . . . . . . . . . . . . . . . . . . . . . . . . . . . . . . . . . . . . . . . . . . . . . . . . . . . . . . . 1654. Trends and climate change . . . . . . . . . . . . . . . . . . . . . . . . . . . . . . . . . . . . . . . . 1665. Protective measures . . . . . . . . . . . . . . . . . . . . . . . . . . . . . . . . . . . . . . . . . . . . . . 1676. Risk assessment . . . . . . . . . . . . . . . . . . . . . . . . . . . . . . . . . . . . . . . . . . . . . . . . . 1687. Warning capacities . . . . . . . . . . . . . . . . . . . . . . . . . . . . . . . . . . . . . . . . . . . . . . . 1698 Basin-wide water resources and land management . . . . . . . . . . . . . . . . . . . . . . 1709. Research and capacity building . . . . . . . . . . . . . . . . . . . . . . . . . . . . . . . . . . . . . 17210. Options for flood management and control . . . . . . . . . . . . . . . . . . . . . . . . . . . 172References . . . . . . . . . . . . . . . . . . . . . . . . . . . . . . . . . . . . . . . . . . . . . . . . . . . . . . . . . . . 173
TABLE OF CONTENTS
vii
FOREWORD
The International Decade for Natural Disaster Reduction (IDNDR) is about tocome to a close, but it really represents a beginning that has brought togethervery different groups that have, up to now, played parallel but separate roles inmitigating and preventing natural disasters. During the decade, the role of scienceand technology clearly assumed their place as important components for the nextphase in our ability to assess risk and vulnerability; provide preparedness andprevention including early warning; and in enhancing awareness and educatingthe public. Over 99 per cent of all natural disasters are a result of hazards occur-ring in the earth's fluid and solid environment. The programmes of UNESCO andWMO address the relevant science for these environment sectors that include theearth’s geosphere, atmosphere, and hydrosphere (rivers and oceans). BothUNESCO and WMO have provided strong support as part of the framework part-ners under the IDNDR in planning and implementation of science andtechnology programmes for natural disaster reduction as a part of needed capac-ities for sustainable development. As a part of this partnership, UNESCO andWMO jointly convened a Sub-Forum on the Science and Technology Support toNatural Disaster Reduction as a part of the overall IDNDR Programme Forum. TheSub-Forum presentations and resulting discussions, as reflected in an agreed state-ment by the participants, are provided in this special report as a contribution ofthe two agencies in the closing of the Decade. On behalf of the Member States ofUNESCO and Members of WMO, we would like to express our appreciation to themany participants in the Sub-Forum and especially to the panelists and scientiststhat contributed long hours to the excellent presentations. We particularly wouldlike to thank the three panel chairs, Dr John Rodda, Dr Richard Hallgren, andDr Soren Malling for their efforts in guiding the preparation and approval of theSub-Forum statement. Finally, We wish to thank and acknowledge the excellentwork of Dr Wolfgang Eder and Dr John Zillman in convening the Sub-Forum.
Director-General Secretary-General
UNESCO WMO
ix
INTRODUCTION
Increasing evidence continues to show that the world is increasingly being threat-ened by natural disasters that have long-term negative social, economic andenvironmental consequences on vulnerable societies worldwide. Most of thesedisasters are a result of natural hazards from phenomena either of meteorological,hydrological, oceanographic, or geophysical origin or are events that are stronglyinfluenced in terms of development, intensity and impact from these samephenomena. The global intergovernmental cooperation in the understandingthese natural hazards as well as the application of the relevant sciences, includingearly warning, to reduce impacts of these natural disasters rests largely within theprogrammes of UNESCO and WMO.
Both of these UN Specialized Agencies have been major framework partnersof the IDNDR and have provided significant scientific and technological supportfor use in natural disaster reduction. The Science sector of UNESCO, including itsIntergovernmental Oceanographic Commission (IOC), has provided a globalframework for most all of the research and application of the geophysics includ-ing vulcanology, seismology, and other terrestrial and earth-related sciences. Inaddition, the IOC serves as a major International focus for ocean research andapplications including the management of the Tsunami Warning System for thePacific Ocean. The WMO has long served as the UN organization responsible foratmospheric science and its applications primarily in terms of weather andclimate. The World Weather Watch, including its programmes of Tropical CycloneWarning and Public Weather Services provide the majority of information anddata used by all countries of the world in providing early warning capability.Similarly, the data from these activities also serve as a basis for the understandingof climate both in terms of global changes and in seasonal and inter-annual fluc-tuations that often are manifested in phenomena such as El Niño and La Niña.UNESCO and WMO jointly share the responsibility for Hydrological Scienceswithin the UN framework. UNESCO continues to pursue the understanding of thebasic science aspects through activities such as the International HydrologicalProgramme (IHP) and WMO has responsibilities related to applications and oper-ations through its Hydrology and Water Resources Programme.
Both UNESCO and WMO, in addition to their normal programmes, haveimplemented special IDNDR scientific activities and projects throughout theIDNDR decade. It is both the normal programmes and these special projects thatmotivated both agencies to jointly convene a special Sub-Forum on Science andTechnology in Support of Natural Disaster Reduction as part of an overallProgramme Forum closing event of the IDNDR.
The Sub-Forum on Science and Technology in Support of Natural DisasterReduction (Geneva, July 6–9, 1999) was jointly organized by WMO and UNESCO.It formed a major component of the 1999 IDNDR Programme Forum“Partnerships for a Safer World in the 21st Century”, a keynote event of theconcluding phase of the International Decade for Natural Disaster Reduction.
The Sub-forum’s objectives were to review the current state of science andtechnology in support of natural disaster reduction, to identify needs for addi-tional research and capacity building efforts and to consider ways to furtherenhance science and technology support for global natural disaster reductionefforts during the 21st century.
Under the guidance of co-convenors Dr J. W. Zillman and Dr F.W. Eder,participants in the Sub-Forum addressed a broad range of meteorological, hydro-logical and geophysical hazards, focussing on the contributions of science andtechnology to mitigation of their impacts and on promising scientific and tech-nological developments which may further contribute to this objective in futureyears. Presentations by invited experts were followed by panel discussionsfocussing on three key aspects of disaster prevention and reduction —Vulnerability and Preparedness; Warning Capacities; and Preparedness andEducation. The meeting concluded with the endorsement by participants of a
xi
formal Sub-Forum Statement, which reflects the results and conclusions fromtheir deliberations.
The specific presentations related to phenomena of meteorological, hydro-logical or geophysical origin or directly contributing to the development,movement, and intensity of the disaster-causing hazards. The lectures includedthe following topics: tropical cyclones, extratropical storms; severe convectivestorms and tornadoes; drought; extreme temperatures; dust and sand storms;forest and bush fires; floods; avalanches; landslides; seismic risk and earthquakes;tsunami and coastal storm surges; and volcanoes.
The presentations emphasized the need for expanding scientific knowledgeand technological capacity to improve warning capability, preparedness and tomitigate the impacts of natural hazards in vulnerable regions around the globe.This theme was central to the panel discussions where participants reviewed thespecific contributions that science and technology can make in the broader disas-ter reduction process through:
• The assessment of vulnerability and enhancement of community awareness of thenature of the risk;
• The operation of integrated warning systems; and• Preparedness and education programs.
The Statement summarizes the major conclusions from the Sub-Forum,emphasizing that science and technology have already contributed to reducinginjury and loss of life as well as economic damage losses from natural hazards andgreater reductions are possible in the future. The Statement points out that anoutstanding achievement of the IDNDR has been to increase cooperation betweenthe natural and social science communities, resulting in enhanced application ofscience and technology to reducing the societal impacts from natural disasters.The statement also expresses concern regarding the substantial gap that still existsbetween the disaster reduction capabilities of developed and developing coun-tries, drawing attention to the need to continue efforts to develop scientific andtechnological capacities, early warning systems and public awareness and educa-tion in all regions exposed to natural hazards.
The lectures and panel discussions of the Sub-Forum provided significantelements used within the overall IDNDR Programme Forum and resulted in keyinformation presented and discussed at the substantive Economic and SocialCouncil (ECOSOC) session of 1999 regarding successor arrangements for theInternational Decade for Natural Disaster Reduction.
INTRODUCTION
STATEMENT FROM THE WMO/UNESCO SUB-FORUM ONSCIENCE AND TECHNOLOGY IN SUPPORT OF NATURALDISASTER REDUCTION(Geneva, 6-8 July 1999)
One of the outstanding achievements of the International Decade for NaturalDisaster Reduction (IDNDR) has been its major contribution to increased interac-tion and cooperation between the natural and social science communitiesworking in disaster reduction and thence to enhanced application of science andtechnology to reducing the large and growing social and economic cost of naturaldisasters around the world.
Though science and technology have already contributed much to savinghuman life and reducing property loss and environmental damage from mostforms of natural hazard of meteorological, hydrological, oceanographic andgeological origin, their potential contribution over the next decade is evengreater. But only if they are systematically and wisely applied within the broadersocial context of an integrated approach to natural disaster reduction which is theprincipal legacy and proudest achievement of the IDNDR.
In order to assist the global community to build most effectively on thefoundation provided by the IDNDR, the World Meteorological Organization(WMO) and the United Nations Educational, Scientific and Cultural Organization(UNESCO), as the two principal United Nations agencies concerned with thescientific and technological aspects of disaster reduction, convened a “Sub-Forumon Science and Technology in Support of Natural Disaster Reduction” as a specialcontribution to the 1999 IDNDR Programme Forum “Partnerships for a SaferWorld in the 21st Century”.
The Sub-Forum reviewed the various ways in which science and technologycontribute to the disaster reduction process through, the:
• Assessment of vulnerability and enhancement of community awareness of thenature of the risk;
• Operation of integrated warning systems; and• Preparedness and education programs.
In its review, the Sub-Forum took stock of recent progress and futureprospects in each of these three aspects of the application of science and tech-nology to reduction of the impacts of tropical cyclones, extratropical storms,storm surges, severe local storms and tornadoes, sand and dust storms, drought,extreme and persistent temperatures, fire weather, floods, landslides, avalanches,volcanoes, earthquakes and tsunamis. A synopsis of this review is contained in theAnnex to this statement.
The participants in the Sub-Forum, who came from both the natural andsocial sciences and with both research and operational backgrounds in develop-ing and developed countries were concerned that more could have been achievedduring the IDNDR decade if the channels of communication and mutual trustthat have now been achieved could have been established earlier. They were alsoconcerned at the substantial gap that still exists between the disaster reductioncapabilities of the developed and developing countries. They believe, however,that the achievements of the past decade have provided a sound foundation onwhich to build an effective global strategy for natural disaster reduction in the21st century.
Many of the most significant achievements in natural disaster reduction duringthe 1990s were largely a result of science and technology. Accuracy and timelinessof early warnings for many natural hazards have been improved. The ability toprovide forecast time and location of landfall of tropical cyclones has beenimproved by 24 hours so that the accuracy of the 24-hour forecast in 1990 hasbeen increased in 1999 to 48 hours in advance. The warning time for tornadoes
MAJOR ACHIEVEMENTS
xiii
in 1990 was around 8 or 9 minutes and this has nearly doubled to over17 minutes by the end of the decade. In the past decade, information and under-standing on specific natural hazards such as earthquakes and cyclones has, alongwith increased confidence of design engineers and insurance companies, permit-ted improvements in building codes and standards in many parts of the world. Arelated achievement has been the significant increase of available maps of risk formany countries based on scientific studies and analyses of the climatology ofnatural hazards.
Perhaps the most visible achievement in the 1990s has been the creation ofnew disaster management bodies at all levels of government that now includescientists and engineers involved in the study and prediction of natural hazards.One of the major meteorological concerns of the 1990s had to do with the longertime scales associated with seasonal to interannual climate variability and human-induced change. While the capacity to forecast these changes is still limited, theimplications for natural disaster reduction are extremely significant with just avery small improvement in forecast skills likely to lead to major benefits forcommunities and national economies.
Another notable achievement of the decade has been the ability, by meansof satellites, to detect, track and assess the intensity of tropical cyclones and majorstorm systems. It is almost a certainty that all tropical cyclones can now bedetected at or before their development as a natural hazard.
Significant improvements have been made during the decade in the globalobservation system of the World Weather Watch (WWW) and the IntegratedGlobal Ocean Services System (IGOSS). For example, the polar and geostationarysatellite systems have been enhanced and the experimental buoy network in thetropical Pacific Ocean has been made operational providing essential observationsfor early detection of intense El Niño and subsequent La Niña phenomena. Thisachievement permitted prediction of drought and above-normal precipitationseveral months in advance in Eastern Africa, and prediction of heavy rain inCalifornia in the United States. These predictions also led to special preparednessactions resulting in significant loss reduction in the ensuing flooding.
Overall, the achievements in scientific understanding and its applicationduring the 1990s have provided significant increases in evacuation times, betterbuilding standards, and improved risk assessment.
The Sub-Forum agreed that vulnerability assessment and reduction should forman integral part of the follow-up to the IDNDR. This should be achieved throughuse of advances in engineering, as well as in the natural, social and humansciences.
Awareness raising on all types of natural disasters forms an essential elementin early warning systems, particularly where warning periods are short. It encom-passes the affected population as well as the political authorities concerned.Therefore, education and training of communities at large, the involvement ofmedia and continuous interaction between scientists, sociologists, technologistsand decision makers and governmental authorities are indispensable vehicles foreffective implementation. The partnership of scientific and technical practition-ers with those working in social and humanitarian fields is essential notably inurban areas, involving the local population as well as tourists.
In developed countries, it has been clearly demonstrated in recent years that thevulnerability of communities to natural hazards can be greatly reduced by the use ofmodern building standards in conjunction with risk zoning based on scientific andtechnical knowledge of the various hazards and their impact on the built environment.Indeed it is through such standards and risk zoning that much of the scientific andtechnical knowledge of the various hazard mitigation is applied in the community. Inthe building and construction areas these standards are being developed by theInternational Standards Organization (ISO). These standards have the potential togreatly reduce community vulnerability to a number of major hazards in the long-termbut this will require that the development of these new international standards be givenhigher priority than the revision and upgrading of their individual national standards.
VULNERABILITY ANDAWARENESS
STATEMENT
xiv
A related, but separate need, is the development of cost-efficient means ofreducing the vulnerability of existing buildings and infrastructure and the financ-ing of activities. This is required to address the reduction of vulnerability in theshort- to medium-term. A high level of technical skills will be required to deter-mine economic means of reducing the vulnerability, as well as a high-level ofscientific and engineering expertise for the innovative methods of risk financingneeded to securitize the investment in reducing the vulnerability.
Early warnings are an extremely important link in the series of steps that need tobe followed to reduce the social and economic impact of natural hazards.Warnings of a natural hazard such as a flood delivered in a timely and clearmanner to individuals or communities adequately prepared to take action reducesthe impact of the hazard.
All sectors must be involved in the warning process and serve populationneeds, environment and other national resources. Effective early warnings requireunrestricted access to data that is freely available for exchange and they mustemanate from a single officially designated authority.
Advances in science and technology during the past decade have demon-strated the improved warning capability for many natural hazards in many partsof the world. For example, warnings of drought have been issued several monthsin advance which proved of great value for alleviating the impacts of the droughtand the likely resulting decrease in food supplies. The forecast accuracy of tracksof tropical cyclones has shown significant improvement and average forecast leadtimes for tornadoes and flash floods have been substantially increased with theconcomitant reduction in loss of life.
Provided adequate assistance is available, many opportunities now exist, inthe coming decade, to transfer these warning capabilities to areas affected bynatural hazards especially in developing countries.
The warning process is underpinned internationally by the World WeatherWatch and IGOSS, the Tsunami Warning System and associated research particu-larly the World Weather Research Program. At the national level this processincludes local and regional observational systems such as coordinated hydrologi-cal networks and radar, data processing capability and most importantly itdepends on well-trained meteorologists to prepare forecasts and warnings andinteract with media and emergency management officials.
A wide range of activities and bodies is encompassed in the terms “preparedness”and “education”. They extend from the grass roots to the governmental level andinvolve individuals, families and communities at one end, and universities,ministries and government as a whole at the other. They take in classes, seminars,schools, links of various sorts such as between the forecasters and the audiencefor their forecasts; and they include research, not only into forecasting, but alsointo the delivery and dissemination of forecasts and warnings and the responses,perception and reactions to them.
Developed and some developing countries have extended their preparednessand the meteorological, hydrological and other geoscience products supporting itinto new areas in the course of the IDNDR decade. A closer dialogue has beenforged between the scientific community and stakeholders in various areas ofendeavour, such as agriculture, health and transport, and good progress has beenmade in the dialogue with social scientists, but this area still needs more atten-tion. Catering for preparedness of the disadvantaged and disabled has also notprogressed to the desired extent and greater use of plain and meaningful languageis seen as highly advantageous in the better communication of forecasts andwarnings. Indeed the language of preparedness measures and forecasts determinethe way these messages are accepted. In many cases the use of a dialect couldimprove effectiveness and credibility. Confirmation of such messages is also animportant consideration. Using mobile phones and pagers to propagate thesemessages and means other than radio and television have distinct benefits.Education and training applied in the direction of those scientists building the
PREPAREDNESS ANDEDUCATION
INTEGRATED WARNINGSYSTEMS
xv
STATEMENT
preparedness measures as well as those they are designed for. Indian experience ofworkshops between forecasters and people using their forecasts pointed to thevalue of such exchanges. However, there are differences when carrying themessage to adults as opposed to children.
There are advantages attached to the education of schoolchildren in disasterpreparedness – their parents benefit as well and this has been made evident duringthe IDNDR. Developing countries trying to build their preparedness face enor-mous costs and also the much greater costs of reconstruction in the wake of adisaster.
The Sub-Forum recognized that, as a result of demographic pressures and concen-tration and other factors, our societies are becoming more and more vulnerableand that our protective systems are not necessarily adapted to cope. Furthermore,considering that a disaster strategy which puts emphasis solely on relief andresponse is short-sighted and not cost-effective, the participants agreed on theneed for greater emphasis on prevention across the whole continium of hazardsfaced by humanity.
The Sub-Forum recalled that the 1994 Yokohoma World Conference onNatural Disaster Reduction called for a construction of a “Culture of Prevention”which should be based on improved short-term and long-term monitoring mech-anisms. Mitigation, preparedness and prevention measures must be proactiverather than reactive; they must provide the correct treatment while there is stilltime. Prevention must be rooted ultimately in culture and education which findsits expression in our everyday social behaviour. Hence, the threat of potentiallyirreversible events includes an ethical dimension which should be reflected intraining, organization and motivation of communities at risk.
Capacity building and education at all levels have an important role to playin the development of a culture of prevention by ensuring a two-way flow ofinformation between decision makers and communities at risk.
The Sub-Forum emphasized the need for capacity-building in vulnerabilityand risk assessment, early warning of both short-lived natural disasters and long-term hazards associated with environmental change, improved preparedness,adaptation, mitigation of their adverse effects and the integration of disastermanagement into overall national socio-economic development planning.
The participants agreed that a focussed ongoing coordination structure isneeded within the UN system in order to strengthen further the already closecooperation among intergovernmental and non-governmental scientific andtechnical bodies committed to natural disaster reduction. Such a mechanism isnecessary to foster and sustain the vital international and national effort on theapplication of the natural and social sciences and technology in support ofnatural disaster reduction, particularly through the implementation of the rele-vant programmes of UNESCO and WMO.
FUTURE ACTIONS
STATEMENT
xvi
EXTRATROPICAL STORMS OF THE DECADE - A BRIEF REVIEW
By William Appleby and Karen SutherlandEnvironment Canada, Atmospheric Environment
Large-scale, mid-latitude storms are responsible for a variety of extreme weather.They are the main cause of blizzards, freezing rain and heavy snowfall in winterand can cause intense rainfall, hailstorms, or spawn tornado families in summer.The 1990s have seen an increase in the cost of natural disasters resulting fromextratropical storm activity, both in terms of financial costs and human lives,despite improvements in risk forecasting. The following are examples of large-scale disasters caused by extratropical weather events. The 1998 flooding of theYangtze River in China claimed 3 700 lives as excessive rainfall inundated the areafor 60 days. The floods dislocated 223 million people and cost US $30 billion indamages, making it the most costly disaster of 1998. The Ice Storm that hit theEastern provinces of Canada and Northern parts of the New England States of theUnited States of America in January 1998 coated every exposed surface with alayer of ice about 70 mm thick. This ice storm was the worst to hit Canada inrecent history. Prolonged freezing rain brought down millions of trees, over athousand hydro towers and more than 100 000 km of power lines. The stormclaimed at least 25 lives and nearly 3 million people went without electricity orheat and about 100 000 people took refuge in shelters. The resulting damages costclose to US $2 billion. While El Niño and other phenomena may intensifyweather conditions, the greater problem may be that more people are living invulnerable areas and take insufficient precautions, despite great advancements inpublic safety warnings. In the past decade, there have been more natural disastersthat have caused at least US $1 billion in damages than in any previous decade.In the past year alone, the world’s economy has suffered over an estimated US $89billion in losses from natural disasters, which have claimed over 32 000 lives. Theimpacts from many storms would have been much greater had they not been sowell forecast. Using computer models, many storms can be predicted well aheadof time, helping to mitigate their impacts. Rescue and relief operations witnessedaround the world have been impressive and have contributed greatly to reducingthe effects of severe storms.
From fall through to winter and well into spring, extratropical storms dominatethe weather outside of the tropics. Although mid-latitude cyclones can be presentat any time of the year, they are most severe in the winter. They move generallyfrom west to east across the oceans and continents.
The extratropical storm’s centre is an area of low atmospheric pressure withwinds going counter-clockwise in the Northern Hemisphere and clockwise southof the equator. The winds pull cold air from polar regions toward the equator andbring warm air toward the poles. The clash of warm and cold air leads towidespread precipitation. An extratropical storm has a narrow region called a“dry slot” spiralling into the storm’s low pressure centre from the north. Thisintrusion of dry air is within a cold air mass astride warm moist air on the storm’seast and south sides. The temperature difference between the two air massesintensifies the storm. A cold front marks the leading edge of the advancing coldair on the storm’s western side, while the warm front leads the warm air’s movenorth along and into the storm’s eastern side. Thunderstorms can develop alongor ahead of the cold front but do not surround the system’s centre as in a tropicalcyclone.
Large-scale extratropical storms are responsible for a variety of summer andwinter weather. In winter, they are the major cause of blizzards, freezing rain andheavy snowfall. In summer, they can cause intense rainfall activity over wide-spread areas, spawn tornado families and produce numerous hailstorms. Theimpact of an extratropical storm can be from either a series of events causing
1.INTRODUCTION
ABSTRACT
1
cumulative effects due to a change in atmospheric circulation or from one singleevent.
This paper is a review of a sampling of severe extratropical storms thatoccurred in various parts of the globe in the 1990s. It demonstrates both theimpacts of a single event and the cumulative effects of these storms.
Various types of severe winter weather are the direct result of conditions associ-ated with each portion of a mature, mid-latitude cyclone. The strong winds andcold air behind the cold front produce severe wind-chill. Blowing snow and highwind-chill factors are the main components for blizzard conditions. Heavy precip-itation over widespread areas, in the form of snow, sleet and/or freezing rain, isfound along and north of a warm front to the east of a low pressure cell. Thestorms can move at up to 80 km/h in the developing stages or can stall in themature stages, often depositing large amounts of precipitation in their wake.
During January and February of 1990, the North Atlantic bred a number of veryintense storm systems that struck northern Europe with hurricane-force winds.These winter storms favoured a track across the northern and central Europe, incontrast to the usual branch pattern over the Mediterranean Sea and the NorthSea. Storms penetrated well into Europe in the absence of any blocking anticy-clone. The first major storm was actually traced back to a frontal system thatcrossed the United States of America from 18 to 21 January. The storm ultimatelydeepened to 948 mb over the North Sea, just east of England, on 25 January.Winds of up to 200 km/h lashed Britain, paralysing all transportation and knock-ing out power and phone services to hundreds of thousands of households andoffices. Winds downed trees, blew roofs off buildings, and knocked over trucks,causing an epic traffic jam during the London evening rush hour. At least 45deaths in Britain were blamed on the storm, with an early damage estimate placedat US $1.33 billion. The storm winds also caused destruction elsewhere in Europe,with a total of 93 deaths.
Only four days later, on 29 January, a second storm struck southwesternEngland, toppling trees and causing landslides and floods. A third major stormstruck on 3 and 4 February leaving a trail of destruction over much of northernEurope. The latter was one of France’s worst storms in recent decades; high windskilled 23 people and injured dozens more. The windstorm lashed Germany on themorning of 4 February, killing 7 and injuring more than 50. It uprooted thou-sands of trees and tore off hundreds of roofs.
The last of the major storms to strike Europe hit on 26 and 27 February.Winds of up to 160 km/h struck the Welsh coast, and winds nearly as strongassaulted the continent. In Austria, winds damaged 4 million m3 of trees, nearlya quarter of the annual timber harvest. In Germany, the tree damage reached 64million m3, more than twice the average annual number of trees normally cut-down. A total of 63 fatalities occurred across Europe. In addition, at least 25 forestworkers died in accidents during the clean-up effort.
The winter storm that hit the East coast of the United States of America onMarch 13, 1993 was termed the “Storm of the Century” by the media. Heavysnow and strong winds covered a very wide area, breaking dozens of monthlysnowfall and daily minimum temperature records from the Gulf Coast to NewEngland.
The storm experienced an explosive drop in central pressure, from 1000 mbon the morning of 12 March in the western Gulf to 960 mb over Chesapeake Bayon the evening of 13 March. As the storm swept over the Gulf Coast, it lashedFlorida with a 2.7 m storm surge, similar to a hurricane, and 176 km per hourwinds. The following day Richmond and Norfolk, Virginia, and Washington, D.C.all reported record low pressures of 951 mb.
The effects were felt from Cuba to Canada, with a total death toll of 243. Inaddition, 3 million people were left without power and thousands more wereisolated by record snowfall. The storm caused US $1.6 billion in insured property
2.2THE “STORM OF THE
CENTURY” — 1993
2.1 THE STORMY ATLANTIC - 1990
2.EXTRATROPICAL WINTER
STORMS
WMO/UNESCO SUB-FORUM ON NATURAL DISASTER REDUCTION
2
damage and, at the time, was the most costly non-tropical storm on record andthe fourth costliest U.S. catastrophe.
It was the first time a single snowstorm closed each major airport on the EastCoast of the U.S.A. Cities from Boston to Washington received 18 to 30 cm ofsnow. Not far inland, snow depths exceeded 30 cm from Alabama through theAppalachians and Piedmont to Canada. Mountainous areas of Maryland, WestVirginia and North Carolina reported over 100 cm of snow, while locations withthe lake effect exceeded 60 to 90 cm. Syracuse’s 109 cm was the greatest singledaily snowfall since records began in 1902. Snow fell as far south as the Floridapanhandle. Birmingham, Alabama set records for 24 hour snowfall (33 cm),single storm snowfall, monthly snowfall, and snow depth!
The bitter cold that followed the storm, broke or tied at least 68 low-temper-ature records on Sunday, March 14 and another 72 on Monday. The Sunday lowtemperature of –6°C at Mobile, Alabama not only broke the daily record by 13°Cbut also set the March record.
The impacts from the storm would have been much greater had it struckduring the week and not been so well forecast. The National Weather Service fore-casters, using computer models, predicted this storm of historic magnitude at leasttwo days in advance. On 11 March the National Meteorological Center mapshowed the location of the storm 48 hours ahead.
During January and March of 1995, much of California was struck by extremelyheavy precipitation from frequent Pacific storms, causing extensive propertydamage and loss of life. Estimates show that over US $3 billion in damages and27 lives were claimed by widespread river flooding and mud slides. The AmericanRed Cross estimates that over 10,000 homes were damaged or destroyed. InJanuary alone, over 762 mm of rain fell on parts of northern and centralCalifornia.
A much stronger than normal Pacific jet stream was displaced well south ofits normal position during much of the winter and early spring of 1995. Thisfunnelled moisture and major storm systems directly into California. The jet coreand the average storm track were displaced 15 to 20° south of the normal loca-tions during January. During the winter of 1995, the state was struck repeatedlyby very strong systems loaded with Pacific moisture.
Numerous studies have noted that a moderate-to-strong El Niño event, suchas occurred the winter of 1995, usually results in a stronger than normal Pacificsubtropical jet stream and a very active storm track along its path. This, in turn,creates above normal precipitation in areas along the path of major stormsystems. During the winter of 1995, this storm track was the major influence insteering the strong storm systems in California.
The January storms resulted in 42 California counties being declared federaldisaster areas. By late March, all 58 counties in California qualified for federaldisaster assistance. Pacific Gas and Electrical reported electrical outages for 1.4million customers during January and 1.2 million during March. Thunderstorms,sometimes severe, accompanied many of the storm systems. In both months,flooding on many of the smaller streams was caused by very heavy precipitationduring short time intervals, with amounts that sometimes exceeded 100 year 24hour event records. Then, flooding on larger rivers resulted as they were fed byoverflowing tributaries. The Salinas River at Chular reached a peak flow nearlydouble the previous record set in 1983. The Russian River swelled to almost 5 mabove the flood stage. All-time high-water marks were set in many parts ofSouthern California.
The January storms affected northern California more severely while theMarch storms were concentrated more on central California. However, bothmonths showed much above normal precipitation over most of the state. Sincemost of the storms occurred within relatively cool, unstable air masses, much ofthe precipitation above 1 525 m in elevation fell and accumulated as snow. Thissomewhat lessened the immediate impact of the storms in terms of flooding. Thewater content of the snow pack exceeded 150 per cent of normal for the
2.3CALIFORNIA WINTER
STORMS — 1995
EXTRATROPICAL STORMS OF THE DECADE — A BRIEF REVIEW
3
Sacramento Basin and Sierra Nevada mountains by the end of March. Some loca-tions reported snow depths exceeding 12 m by late March.
One of the obvious impacts of unusually heavy precipitation was on agricul-ture. The inability to either harvest or plant severely affected many crops.Thousands of acres of Monterey County farmland were flooded. Over 3 000people, mostly farm workers, had to be evacuated from the town of Pajaro, whichwas entirely flooded due to a levee break.
Ice storms are common to the eastern provinces of Canada and the eastern statesof the United States. Approximately 15 occur each year and last from a few hoursto more than a day. Usually these systems fade away or are followed by a warmingtrend that melts the ice and alleviates any cause for concern.
The Ice Storm of January 1998 was the worst to ever hit Canada and theUnited States, due to the amount of ice accumulation, the duration of thestorm and the population affected. Areas affected were eastern Ontario,southern Quebec, southern New Brunswick, upstate New York, northern NewEngland, and some parts of Nova Scotia. The water equivalent of the freezingrain and ice pellets exceeded 100 mm in many areas, more than twice theyearly average.
Freezing rain coated every exposed surface with such a thick layer of ice thattree branches snapped off, trees fell down, hydro wires and towers were destroyedand all types of transportation and travel were seriously affected. The stormclaimed at least 25 lives and severely inconvenienced millions. At the height ofthe storm, nearly 3.5 million people were without electricity or heat. Thousandshad to take refuge in shelters. Falling temperatures and additional snowfallcontinued to hamper relief efforts after the storm. A week after the storm ended,nearly a million people were still without light or heat. The estimated costs relat-ing to the ice storm were close to US $1.4 billion.
A northeast outflow of air, with temperatures below 0°C, from a high pres-sure area over Hudson Bay and northern Quebec, pushed southward to lie northof Lake Ontario by 5 January. At the same time, a weak southerly flow of warm airwas being pushed into southern Ontario and southern Quebec.
This weather pattern set up the freezing rain, as warm air was forced to rise gentlyover denser cold air. Rain falling from the warm air mass cooled to below the freezingpoint as it passed through the cold air below. Super-cooled raindrops froze on contactwith any cold surface in the cold air mass and ice began to accumulate.
Environment Canada played an important role in a wide range of federal supportefforts related to the ice storm. Throughout the crisis, Environment Canada was able toprovide Canadians with accurate and timely weather warnings and information on a24-hour basis. The department also provided utilities, municipalities, provincialauthorities, other federal departments and emergency response officials with extensivespecialized weather support, as well as advice and assessments on a broad range ofenvironmental issues related to storm damage. Meteorologists and climate expertshandled over 1 000 media calls and visits to the department’s national web siteincreased by 50 per cent to over 300 000 hits a day.
1.5 million households were without power and 100 000 people took refugein shelters. Trees and power lines were falling and roads were blocked, whichmaking travelling conditions hazardous. More than 22 deaths were directly attrib-uted to the Ice Storm. As people were reluctant to vacate their homes, many werestricken with hypothermia.
Various types of severe summer weather are the direct result of conditionsassociated with each portion of a mature, mid-latitude cyclone. In summer,flooding is the major threat from extratropical storm activity. The stormsproduce both widespread, heavy precipitation ahead of a warm front andintense, localised rainfall (from thunderstorm activity) in front of, on the leadingedge, of a cold front. Another major threat is posed by thunderstorm activity. Ifsevere enough, it can produce multiple hailstorms and families of tornadoesdispersed over a large area.
3.SUMMER EXTRATROPICAL
STORMS
2.4ICE STORM ’98
WMO/UNESCO SUB-FORUM ON NATURAL DISASTER REDUCTION
4
The great flood of 1993 in the United States surpassed all floods experienced inliving memory in terms of precipitation amounts, record river stages, the extentof the flooding, persons displaced, crop and property damage and flood duration.
During the spring of 1993, the record and near-record precipitation, on soilsaturated from the previous seasonal precipitation, resulted in flooding alongmany major river systems in the Midwest, including the Mississippi and Missouriand their tributaries.
Prior to these excessive rains, however, the region was ripe for flooding as aresult of above normal precipitation that was persistently observed through mostof the region beginning in July 1992, generating waterlogged ground and highstream flows and reservoir levels. There had been excessive winter snow pack inthe Rocky Mountains, saturated soil conditions in the Midwest and critical run-offconditions. As a result, long-term moisture surpluses occurred across a largeportion of the east-central Great Plains and the middle Mississippi Valley. For somelocations, rainfall totals amounted to an extra year’s worth of rain over 14 months.
By March 1993 the soil remained soaked and rivers remained high, despiteslightly dry conditions. United States National Weather Service hydrologists inMinneapolis alerted residents of the upper Mississippi Valley to the saturatedground on 3 March, 1993. By the end of March, the National Weather Servicereleased a warning that widespread, serious flooding could occur in the Northeastif an extended period of warm weather was accompanied by significant rainfall.The entire eastern half of the United States faced an above average flood risk.
From April to June, the upper Mississippi Valley received an average of410 mm of rainfall, making these three months the wettest period since recordsbegan in 1895. The average precipitation for the period is 280 mm. Wet fieldsdelayed or prevented spring planting. Streams and rivers began to fill. With theground unable to absorb more rain, the water flowed southward down theMississippi toward the Gulf Mexico.
Heavy rain fell from 19 June to 21 June, concentrating on southwesternWisconsin, southern Minnesota, southeastern South Dakota, and Iowa. Seriousflooding began on the tributaries of the upper Mississippi, as well as the river itself.
An estimated 1 100 levees or floodwall failures occurred during the summerof 1993 — 70 per cent of the total number of levees along the affected rivers. Thefirst failure came on 20 June, when, despite efforts to reinforce the levee with sand-bags, the Black River broke through, flooding approximately 100 homes in BlackRiver Fall, Wisconsin. Residents and volunteers from around the world had shov-elled more than 417 million kg of fill into 26 million sandbags by the end of thesummer. Despite their efforts, flood waters washed over an estimated 4 millionhectares in the Mississippi River Basin, destroying or seriously damaging morethan 40 000 buildings. The flood killed at least 47 people.
The flood water moved down the Mississippi from St. Paul, joined by waterfrom tributaries in southern Minnesota, Wisconsin, Iowa, and northern Illinois.Similar waves of flood water were also flowing southward on the Des Moines andMissouri rivers, heading for the Mississippi.
Flooding was aggravated when a heavy rain fell from 25 June through to 27June on Iowa, Missouri, and southern Illinois, adding to the water already movingdown the Mississippi and other rivers. During late June and July, 305 to 457 mmof rain fell across the central part of the country. By mid-July, the US NationalWeather Service announced that 100 rivers were over their banks, with 14 at theirhighest level ever recorded.
At the beginning of the summer of 1993, the mean position of an unusuallystrong jet stream was dipped southward over the northern portion of theMississippi basin, oriented south-west to north-east between the persistent low-pressure trough to the north-west and an unusually strong Bermuda High oversouth-eastern United States. The clockwise winds around this high-pressure areapumped humid air from the Gulf of Mexico northward along the MississippiValley. The high pressure also helped block an eastern movement of thunderstormclusters from the Midwest. The unusually large contrast between low and highpressure helped to create stronger southerly winds, which brought in moisture-
3.1 THE GREAT FLOOD - 1993
EXTRATROPICAL STORMS OF THE DECADE — A BRIEF REVIEW
5

laden air causing record-breaking rains. The boundary between cool air and warmair remained over the upper Mississippi Valley. Warm, humid air flowed over thecool, dry air, which helped to create thunderstorms. The influence of the seasurface temperature anomaly in the tropical Pacific associated with the ElNiño/Southern Oscillation (ENSO) phenomenon was also a contributing factor.
The combination of these circumstances resulted in the worst flooding inover a century in the northern Mississippi basin. Record flooding occurred atnearly 500 forecast points in a nine state region and, in some cases, surpassed oldrecord stages by nearly 2 m. The duration of the flood was overwhelming, by1 September 1993, some towns had experienced 153 consecutive days offlooding. The flooded region finally began drying out in early August when theupper-air pattern changed, bringing unseasonably cool and dry weather to theMidwest.
The expected return period for an event of this magnitude was calculatedfrom precipitation probabilities. For most sites in the midwestern United States,the recurrence interval was in the 500 to 1 000 plus year range. The presence ofsuch extremely long return periods dramatically indicates the extraordinarynature of the event.
The duration and magnitude of the flood strongly support the premise thatthis event was a significant climate variation. It is quite possible that one or moreclimate-driving forces, such as the El Niño/Southern Oscillation (ENSO) phenom-enon, significantly contributed to climate variation.
Severe thunderstorms spawned 27 tornadoes in the southeastern United States onPalm Sunday 27 March 1994. The deadliest storms occurred in Alabama, Georgiaand the Carolinas. This was the deadliest tornado outbreak since May 1985,killing 42 people and injuring more than 350. With 59 tornadoes, including twotornadoes measuring F4 on the Fujita Scale, March was an above average monthfor the United States and total damages were estimated at US $217 million.
On that morning, a cold front curved from Ohio through central Tennesseeto a low-pressure centre along the Texas coast. The front moved into northernGeorgia and Alabama, then stalled while the low pressure moved along the frontinto central Alabama. Southerly winds exceeded 48 km/h ahead of the front,where temperatures rose above 21°C (including a record 28°C in Atlanta). In wide-spread heavy rain behind the front, temperatures were only in the 10-20°C range.Just a thousand metres above the ground, 97-113 km/h south-to-southwest windsbrought in Gulf air. Higher up, west-to-southwest winds exceeded 160 km/h. Thewarm, moist Gulf inflow and the unusually strong winds favoured destructivetornadoes. Strong winds aloft steered the severe thunderstorms northeast, alongand ahead of the cold front.
The most powerful and deadly tornado, an F4, touched down south ofRagland in northeastern Alabama, just before 11 a.m. The tornado destroyedhouses and threw cars across the state highways. High winds shattered thewindows of a church and ripped off its roof causing a brick wall to collapse, killing20 people and injuring another 92. The tornado headed northeast to the Georgialine just before noon, having caused US $50 million in damage. Meanwhile, an F2tornado south of Guntersville, Alabama injured 20 people and damaged over 100houses, and an F3 tornado east of Oak Grove grew to over 800 m wide and injured20 people.
That afternoon, the mayhem reached Georgia. A tornado picked up a mobilehome and carried it 23 m, killing the elderly couple inside. Over Floyd County,the sky turned green-black by 1 p.m. Within ten minutes, severe thunderstormshurled hailstones up to 10 cm in diameter with continuous lightning near CaveSprings. The thunderstorms shortly spawned an F4 tornado that travelled almost80 km, killing 3 people and injuring 20. The tornado grew to over 1.6 km wide,destroying nearly 40 chicken houses and killing more than half a million chick-ens. Hundreds of thousands of trees were levelled, with 18–24 m pines uprooted.
An F3 tornado touched down northwest of Dawsonville, Georgia later thatafternoon and travelled over 70 km, killing 3 people and injuring 45. This tornado
3.2PALM SUNDAY TORNADO
OUTBREAK, 1994 AND THEMIDWEST TORNADO
OUTBREAK, 1999
WMO/UNESCO SUB-FORUM ON NATURAL DISASTER REDUCTION
6
also killed more than half a million chickens and downed hundreds of thousandsof trees. It grew up to 2.4 km wide in White County. Damage was estimated at US$17 million.
At Dahlonega, an F3 tornado tracked 37 km, killing 3 people and injuring 15as it reached 1.2 km in width and caused US $3 million in damages. The skies ofRome were tainted a green-black colour as well. In five minutes, thunderstormswhipped gusts up to 140 km/h. Another F3 tornado then touched down south ofAdairsville, at 3 p.m., and travelled 64 km, killing 9 and injuring 7. Among the US$12 million in damages were more than 300 000 chickens. The tornado was2.4 km wide in hilly Pickens County. In Hill City, it tossed a mobile home over90m, killing all six of the family inside. The tornado was still 1.2 km wide as itclimbed a plateau toward nearby Burnt and Sassafras.
An F3 tornado northeast of Clarksville, Georgia crossed into South Carolina,injuring 35 people. Up to 1.6 km wide, it descended a 150 m cliff to the base ofTallulah Falls. Some of the debris blown into the gorge was from as far asPiedmont, Alabama, more than 225 km away.
An F2 tornado north of Helena, Alabama at 5.30 p.m. injured 53 peoplebefore lifting near Meadow Brook, prefacing another round of violent storms. AnF2 tornado touched down northwest of Cedartown, Georgia at 7 p.m. and trav-elled 34 km, injuring 30 people and causing US $7 million in damages. Thetornado flattened trees on the Booze Mountain on its way to Lindale, a suburb ofRome where residents had already seen the green-black skies and continuouslightning about five minutes before. The skies roared as the tornado passed over-head while paralleled by a weaker twister about 800 m away.
The outbreak of significant tornadoes across the southeast United States onPalm Sunday was not as synoptically evident as many of the outbreak cases in thepast. The outbreak occurred without the presence of a well defined surface lowcentre or a prominent short wave trough. Nevertheless, what did evolve into afavourable configuration for the formation of supercells and strong tornadoeswere the warm sector air mass characteristics, particularly the wind fields.
A more recent tornado outbreak occurred across the midwestern UnitedStates earlier this year. Powerful storm systems pushed across Oklahoma, Kansasand Texas on the evening of 3 May 1999, spawning 76 tornadoes, obliteratingtowns and killing 44 people while injuring 900 others. About 4 180 homes andbusinesses were destroyed or heavily damaged. The tornadoes knocked out powerto thousands of people.
One unusually large and powerful F5 tornado formed just outside Oklahomacity, killing 38 people and injuring hundreds as it moved north and east withwinds topping 418 km/h, cutting a path over 800 m wide. The storm carved a30 km gash through the area demolishing about 2 000 homes. About 240 kmnorth, a tornado spawned by the same storm system tossed mobile homes,damaged houses and killed at least five people while injuring over 80 others inWichita, Kansas.
At least 6 tornadic storms developed over a 5-hour period on the Mondayevening, mainly in central and north-east Oklahoma. Cars were tossed acrosshighways and crushed. Houses were smashed into piles of splintered timbers andbrick. The ground was scoured bare in places and stripped of trees. The estimateddamage was in the hundreds of millions of US dollars. Several tornadoes may havebeen 1.6 km wide with winds up to 420km/h, measuring an F4 on the Fujita scale.
Eleven counties in Oklahoma and one in Kansas were declared federaldisaster areas. five people were still missing in rural Oklahoma two days followingthe devastating tornado outbreak. A cold rain fell as residents began to pickthrough the wreckage of their homes and bulldozers were brought in to clearaway debris.
Another type of flooding event, the flash flood, was exemplified by the SaguenayRiver flooding in 1996. One July weekend, torrential rains gave rise to one of theworse flooding events in Canadian history. The floods left at least 10 people dead,1 350 homes destroyed, while 16 000 people had to be evacuated from their
3.3 SAGUENAY RIVER
FLOODING — 1996
EXTRATROPICAL STORMS OF THE DECADE — A BRIEF REVIEW
7
houses. Material losses were estimated at almost US $545 million, making this oneof Canada’s most costly natural disasters.
The morning of 19 July 1996, a low pressure system located over southernOntario was on the verge of rapid and intense development. In the following 24hours, the system intensified as a fall-like low pressure system as it movedtowards the Quebec — New Brunswick border before slowing down andbecoming almost stationary over the mouth of the St. Lawrence River. Thelargest zone of accumulation occurred just south of the Jonquière-Chicoutimi-La Baie area of the Saguenay Valley, where in excess of 200 mm of rain fell, mostwithin a 36 hour period. Rainfall amounts were also impressive in Saguenay-LacSaint-Jean and Parc-des-Laurentides areas on the northern shore of the Saint-Lawrence River, west of Sept-Iles. Over these areas, the topography and windcirculation generated from the storm produced locally higher rainfall amountsdue to lifting. The decline of the low pressure system over eastern Quebecallowed the precipitation area linked with this system to persist over the mostaffected areas.
The Saguenay floods caused extensive erosion along some major riverreaches resulting in major channel widening and bank erosion, breaching of damsand dykes and damage to bridges and roads.
Many precipitation records were established during this weekend. For manysites across the province of Quebec, the total rainfall amounts from the stormexceeded the amounts that normally fall during the month of July. The 18 July to21 July 1996 torrential rains were the most extreme, in intensity and area, for theprovince of Quebec in over a century.
The summer flooding of 1998 in China killed 4 150 people as heavy rainsinundated the Yangtze River Valley for more than 60 days. The floods affected223 million people (1/5th of the population of China), inundated 25 millionhectares of cropland and cost US $30 billion in damages, making it the mostcostly disaster of 1998 and causing the worst flooding in over 44 years. Theflooding caused severe damage to critical facilities such as health clinics, schools,water supplies and other infrastructure such as roads, bridges, and irrigationsystems, as well as industrial facilities. During June and July, locations near theYangtze River reported over 750 mm of rain, with isolated amounts greater than1 270 mm.
The cause of the disaster was excessive rainfall (which according to Chinesemeteorologists was ascribed to the worldwide El Niño phenomenon followed byLa Niña); the melting of lasting and deep snow accumulated in Qinghai — theTibet plateau in southwest China; a weak Asian monsoon; unusual sub-tropicalhigh pressure systems on the west Pacific Ocean; and a decrease in the number oftyphoons.
Though heavy summer rains are common in southern China, the YangtzeRiver Basin has lost 85 per cent of its forest cover from logging and agriculture inrecent years, leaving many steep hillsides bare and causing rainfall to run quicklyinto the river rather than being absorbed. This has led to more devastating land-slides and floods. The heavy damming of the river has greatly increased the speedand severity of the resulting run-off. At the same time, growing population pres-sures have led many to settle on vulnerable flood plains and hillsides, nowincreasingly inhabited. The frequency of floods has increased from once everytwenty years in earlier centuries to nine out of ten years.
Given the magnitude of the disaster, which was unprecedented over the lastfew decades, the rescue and relief operations mounted by the ChineseGovernment at all levels were impressive. The massive mobilisation of farmersand villagers by the police and army reduced the suffering and loss of humanlives. The Government provided emergency relief efficiently and effectively.
China ’s advanced prevention policy, based on timely predictions,forecasting, and early warnings, greatly contributed to mitigating the outcome ofthe flood. The State Council of China has recognized the role of human activitiesin worsening ‘natural’ disasters. It has banned logging in the upper Yangtze
3.4YANGTZE RIVER FLOODS — 1998
WMO/UNESCO SUB-FORUM ON NATURAL DISASTER REDUCTION
8
watershed, prohibited additional land reclamation projects in the river’s floodplain and has earmarked US $2 billion to reforest the watershed.
A severe thunderstorm, which struck the eastern suburbs of Sydney, Australia on14 April, 1999 caused extensive damage estimated at US $1 billion, making itpossibly Australia’s most costly natural disaster. The storm’s damage surpassedthat of the Newcastle earthquake of 1989 and Tropical Cyclone Tracy of 1974 inDarwin. The storm tore across the city overnight, damaging thousands of homesand cars, cutting power supplies and phone lines and briefly grounding planes.Plummeting chunks of ice damaged roofs, battered cars, and knocked out trafficlights. Up to 15 000 homes lost power. Lightning sparked at least 25 electricalfires. Dozens of people were treated for cuts from broken glass and other injuries.Others were injured the following day as they tried to make repairs.
The storm was highly unusual in meteorological terms. Not only did itproduce hailstones up to 9 cm in diameter, but it occurred at a time of year whensevere thunderstorms are normally rare. The storm took a highly unusual track,moving from land to sea, back to land, and finally out to sea, lasting a total of 51/2hours.
A thunderstorm began to form about 115 km to the south-southwest ofSydney in the late afternoon. The storm subsequently developed into a supercell,a rare but unusually severe type of thunderstorm whose structure, behaviour,intensity and longevity is quite different to ordinary thunderstorms. By about6 p.m., the storm moved up the New South Wales coastline with the western edgeproducing substantial amounts of hail in the Wollongong area. The storm thenmoved out to sea but continued to track north-northeast, parallel to the coast,before crossing inland again near Helensburgh. As the storm neared Sydney, itsplit into 2 sections. The weaker of the two cells moved out towards the sea andthe stronger cell moved on towards the city centre. Lightning, thunder and rainwas reported around the inner city areas of Sydney. The storm continued on todevastate Sydney’s eastern suburbs. The storm eventually moved out to sea andhad dissipated by 10 p.m.
The storm was triggered by a relatively warm autumn day that saw tempera-tures peaking at 26.2°C, about 2°C above normal. As the warm air rose, it carriedlarge amounts of moisture high into the atmosphere where it met cold air, causingthe vapour to suddenly freeze.
No public severe weather warning was issued for the Sydney hailstorm. TheAustralian Weather Bureau had been expecting a storm that would probablyproduce small hailstones but when it failed to occur by 3.30 p.m., they down-graded the probability of it hitting the city at all. Forecasters expected that theupper winds would steer any thunderstorms from the south of Sydney to thenorth-east and out to sea. They never envisaged that any thunderstorms thatmight occur would produce such severe weather. The storm had been drifting outto sea but caught the Australian Weather Bureau by surprise when it suddenly cutinland.
All units of the State Emergency Service were sent out to assess the disastersituation and to start the necessary repairs. Several days into the storm clean-up,a windstorm hit the area, bringing rain and 100 km/h plus winds that damagedsome of the emergency repairs.
The 1990s have seen an increase in the cost of natural disasters resulting fromextratropical storm activity, both in terms of financial costs and human lives,despite improvements in risk forecasting. While El Niño and other phenomenamay intensify weather conditions, the greater problem may be that more peopleare living in vulnerable areas and take insufficient precautions despite greatadvancements in public safety warnings. In the past decade, there have beenmore natural disasters that have caused at least US $1 billion in damages than inany previous decade. In the past year alone, the world’s economy has registeredover an estimated US $89 billion in losses from natural disasters, while claimingover 32 000 lives.
4.CONCLUSION
3.5THE SYDNEY HAILSTORM —
14 APRIL 1999
EXTRATROPICAL STORMS OF THE DECADE — A BRIEF REVIEW
9
The impacts from many storms would have been much greater had they notbeen so well forecast. Using computer models, many storms can be predicted wellahead of time, helping to mitigate the impacts. The accuracy in forecasting hasimproved significantly over the years. There is now the potential to predictstorms well ahead of time, helping to mitigate the impacts. The quality of a 48-hour forecast in 1999 has surpassed that of the 36-hour forecast in 1990. As well,today’s meteorologists are now issuing 120-hour forecasts with the same accuracyas the 96-hour forecasts from the beginning of the decade.
Rescue and relief operations launched around the world have been impres-sive and greatly contributed to reducing the effects of severe storms.
Abramovitz, J.N., Dunn, S. November 11, 1998: Record year for weather-relateddisasters, Worldwatch Institute.<http://www.worldwatch.org/alerts/981127.html>
Brooks, G.R., Lawrence, D.E.: Geomorphic effects and impacts from July 1996: Severeflooding in the saguenay area, Quebec, Natural Resources Canada.<http://sts.gsc.nrcan.gc.ca/page1/geoh/saguenay/saguenay.htm>
Bureau of Meteorology, 1999: Report by the director of meteorology on the bureau ofmeteorology’s forecasting and warning performance for the Sydney hailstorm of 14April 1999. Melbourne, Australia: Commonwealth of Australia.
Crowther, H.G.: Tornadoes. Weatherwise February/March 1995. pp. 43-51.Discovery Channel Online. April 15, 1999: Hailstorm Batters Sydney, Discovery
Channel Online.<http://www.discovery.com/news/earthalert/990412/index/hail_index.html>
Environment Canada. July 31, 1998: Quebec’s torrential rains July 18 to 21, 1996,Environment Canada. <http://www.qc.ec.gc.ca/atmos/saguenay/indexe.html>
Environment Canada. April 16, 1999: Ice Storm ’98, Environment Canada.<http://www1.tor.ec.gc.ca/nwsd/OtherPub/ice_storm/index_e.cfm>
Environmental Adaptation Research Group, Environment Canada and TheInstitute for Environmental Studies, University of Toronto. 1997: Coping withnatural hazards in Canada: scientific, government and insurance industry perspec-tives. The Round Table on Environmental Risk, Natural Hazards and theInsurance Industry. Toronto, Canada.
Gaddy, S.G. April 21, 1995: The Palm Sunday tornado outbreak of 27 March 1994,Penn State. <http://www.ems.psu.edu/~diercks/gaddy.html>.
Hales, John E. and Michael D. Vescio. 1996: The March 1994 tornado outbreak inthe Southeast U.S.: The Forecast Process from an SPC Perspective. San Francisco,California: 18th AMS Conference on Severe Local Storms.
Le Comte, D.: …and around the world. Weatherwise, February 1991. pp. 13-15.Le Comte, D. : Highlights around the world. Weatherwise, February/March 1993. pp.
14-17.Le Comte, D.: Highlights in the United States. Weatherwise, February/March 1994.
pp.12-17.Le Comte, D.: Going to extremes: 1995 was wild and woolly for the United States.
Weatherwise, February/March 1995. pp. 14-17Le Comte, D.: 1996 Weather highlights around the world. Weatherwise,
February/March 1997. pp. 25-27.Le Comte, D.: Weather around the world. Weatherwise, March/April 1999. pp. 29-
33.Lott, N., Sittel, M. 1995: A California cloudburst, National Oceanic and
Atmospheric Administration. <http://www.ncdc.noaa.gov>.Macey, R. 1999, April 15: Hailstorm’s sudden blast takes bureau by surprise. The
Sydney Morning Herald.United Nations Disaster Assessment and Coordination Team (UNDAC)/UN Inter-
Agency Mission, 1998: 1998 Floods in the People’s Republic of China. WorldHealth Institute. Geneva, Switzerland.
Williams, J.: The great flood. Weatherwise February/March 1994. pp. 18-22.
REFERENCES
WMO/UNESCO SUB-FORUM ON NATURAL DISASTER REDUCTION
10

World Meteorological Organization, 1995: The Global Climate System review:Climate System Monitoring June 1991–November 1993. Geneva: WorldMeteorological Organization.
EXTRATROPICAL STORMS OF THE DECADE — A BRIEF REVIEW
11
SEVERE LOCAL STORMS
By Harold E. Brooks; NOAA/National Severe Storms Laboratory andSteven J. Weiss; NOAA/Storm Prediction Center
Severe weather associated with thunderstorms (tornadoes, hail, high winds, andflash floods) is reviewed with emphasis on the processes that are responsible. Thebasis for forecasting severe thunderstorms is reviewed. The parts of the world thatare most vulnerable to various kinds of severe weather and the nature of thethreats are described. The current state of the climatology of severe thunder-storms and problems and importance of improving climatological informationare described. The lack of high-quality climatological information makes it verydifficult to determine differences in event occurrence during different periods ofthe El Niño-Southern Oscillation (ENSO) in most of the world and almost impos-sible to detect changes associated with global climate change. It is argued,however, that the threats from severe thunderstorms are generally underesti-mated in many parts of the world.
In general, the effects of severe local storms are concentrated in a smallnumber of events. Death tolls and damage in “average” years are typically smallerthan the totals from individual events in other years. As a result, maintainingpublic awareness and preparedness activities is difficult since the threat of rare,extremely damaging events, is small at any individual location and time.
Severe weather associated with thunderstorms affects almost all of the planet andrepresents a significant threat to life and property in many locations. The defini-tion of what is considered “severe” depends on operational forecastingconsiderations that vary from country to country but, typically, includesphenomena such as tornadoes, large hail (usually of diameter at least approxi-mately 2 cm), strong convective wind gusts (usually approximately 90 km hr-1 ormore), and extremely heavy precipitation associated with flash floods (frequently50 mm hr-1 at a single location). Criteria associated with heavy precipitation varyfrom country to country and, in some nations, even within regions. In the USA,for instance, flash flooding is not considered a severe thunderstorm event, and inCanada the objective definition of heavy precipitation is different in differentregions.
Increasing population and increased dependence of society on complexinfrastructure have led to an increased exposure and threat from severe localstorms. This increased exposure has been counterbalanced by an increasingawareness of the threats and improved scientific understanding and technologythat allows for better anticipation of the threats. These opposing forces makechanges in the actual effects difficult to ascertain, especially in developing coun-tries.
In this paper, we will briefly describe the nature of the various threats andareas of vulnerability and efforts to prepare for and forecast them. Because thegreatest efforts to measure the occurrence of severe weather and forecast it have,historically, occurred in North America and particularly in the USA, the greatestfocus will be on that geographic region. However, where possible, some indicationof the threats in other areas will be given (e.g., Figure 1).
Tornadoes have been observed on every continent except Antarctica althoughthey are most common in North America, particularly the Great Plains of the USA(Fujita, 1972, 1973; and see Altinger de Schwarzkopf and Rosso, 1982; Peterson,1992; Dessens and Snow, 1989; Zixiu et al., 1993; Dotzek et al., 1998; Hanstrum etal. 1998 for details of many individual countries.) Maps of events and threatsranging from worldwide (Figures 2 and 3) to continental (Figure 4) and for indi-vidual countries or regions (Figures 5-8) have been produced. Increased efforts tocollect information about tornadoes in North America have led to an increase in
2.NATURE OF THREATS
2.1TORNADOES
1.INTRODUCTION
ABSTRACT
12
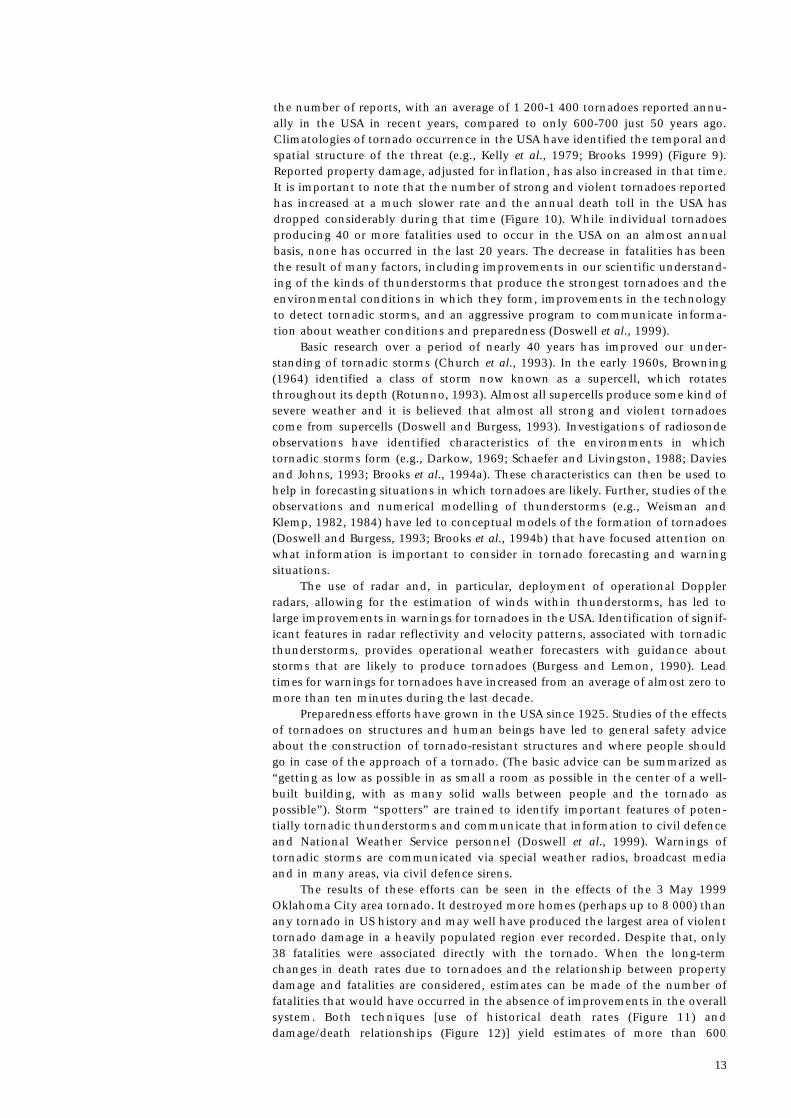
the number of reports, with an average of 1 200-1 400 tornadoes reported annu-ally in the USA in recent years, compared to only 600-700 just 50 years ago.Climatologies of tornado occurrence in the USA have identified the temporal andspatial structure of the threat (e.g., Kelly et al., 1979; Brooks 1999) (Figure 9).Reported property damage, adjusted for inflation, has also increased in that time.It is important to note that the number of strong and violent tornadoes reportedhas increased at a much slower rate and the annual death toll in the USA hasdropped considerably during that time (Figure 10). While individual tornadoesproducing 40 or more fatalities used to occur in the USA on an almost annualbasis, none has occurred in the last 20 years. The decrease in fatalities has beenthe result of many factors, including improvements in our scientific understand-ing of the kinds of thunderstorms that produce the strongest tornadoes and theenvironmental conditions in which they form, improvements in the technologyto detect tornadic storms, and an aggressive program to communicate informa-tion about weather conditions and preparedness (Doswell et al., 1999).
Basic research over a period of nearly 40 years has improved our under-standing of tornadic storms (Church et al., 1993). In the early 1960s, Browning(1964) identified a class of storm now known as a supercell, which rotatesthroughout its depth (Rotunno, 1993). Almost all supercells produce some kind ofsevere weather and it is believed that almost all strong and violent tornadoescome from supercells (Doswell and Burgess, 1993). Investigations of radiosondeobservations have identified characteristics of the environments in whichtornadic storms form (e.g., Darkow, 1969; Schaefer and Livingston, 1988; Daviesand Johns, 1993; Brooks et al., 1994a). These characteristics can then be used tohelp in forecasting situations in which tornadoes are likely. Further, studies of theobservations and numerical modelling of thunderstorms (e.g., Weisman andKlemp, 1982, 1984) have led to conceptual models of the formation of tornadoes(Doswell and Burgess, 1993; Brooks et al., 1994b) that have focused attention onwhat information is important to consider in tornado forecasting and warningsituations.
The use of radar and, in particular, deployment of operational Dopplerradars, allowing for the estimation of winds within thunderstorms, has led tolarge improvements in warnings for tornadoes in the USA. Identification of signif-icant features in radar reflectivity and velocity patterns, associated with tornadicthunderstorms, provides operational weather forecasters with guidance aboutstorms that are likely to produce tornadoes (Burgess and Lemon, 1990). Leadtimes for warnings for tornadoes have increased from an average of almost zero tomore than ten minutes during the last decade.
Preparedness efforts have grown in the USA since 1925. Studies of the effectsof tornadoes on structures and human beings have led to general safety adviceabout the construction of tornado-resistant structures and where people shouldgo in case of the approach of a tornado. (The basic advice can be summarized as“getting as low as possible in as small a room as possible in the center of a well-built building, with as many solid walls between people and the tornado aspossible”). Storm “spotters” are trained to identify important features of poten-tially tornadic thunderstorms and communicate that information to civil defenceand National Weather Service personnel (Doswell et al., 1999). Warnings oftornadic storms are communicated via special weather radios, broadcast mediaand in many areas, via civil defence sirens.
The results of these efforts can be seen in the effects of the 3 May 1999Oklahoma City area tornado. It destroyed more homes (perhaps up to 8 000) thanany tornado in US history and may well have produced the largest area of violenttornado damage in a heavily populated region ever recorded. Despite that, only38 fatalities were associated directly with the tornado. When the long-termchanges in death rates due to tornadoes and the relationship between propertydamage and fatalities are considered, estimates can be made of the number offatalities that would have occurred in the absence of improvements in the overallsystem. Both techniques [use of historical death rates (Figure 11) anddamage/death relationships (Figure 12)] yield estimates of more than 600
13
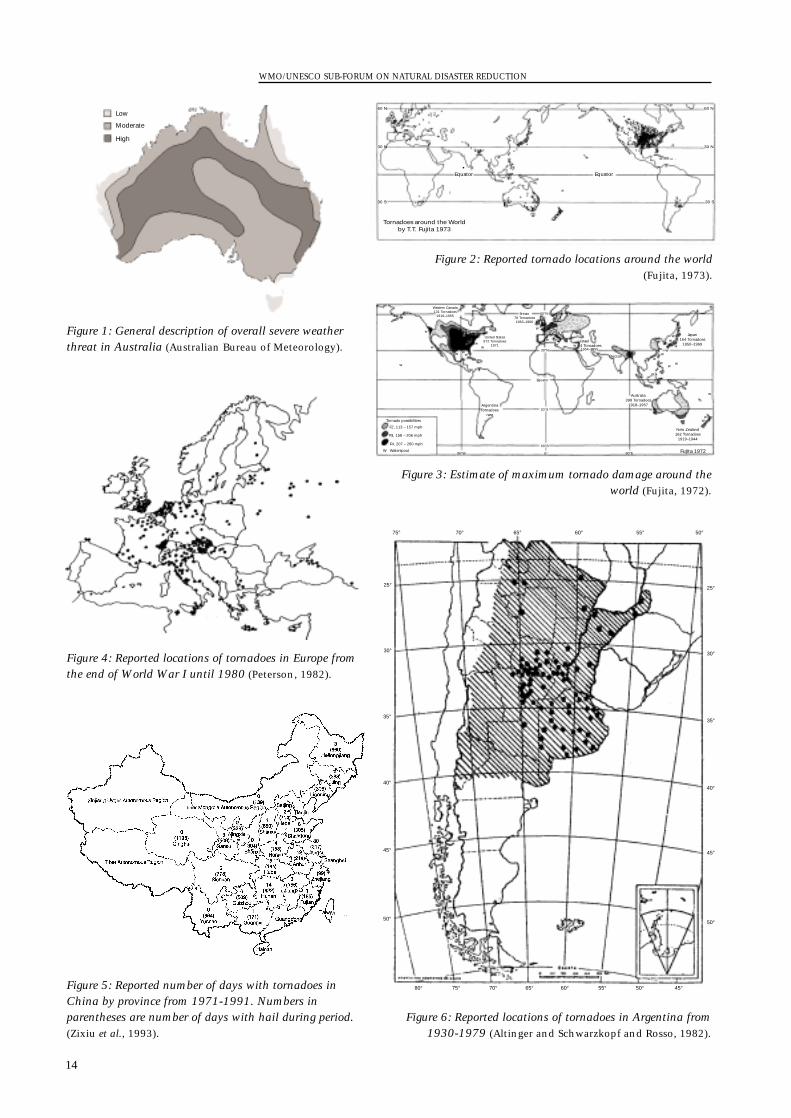
WMO/UNESCO SUB-FORUM ON NATURAL DISASTER REDUCTION
14
Low
Moderate
High
Figure 1: General description of overall severe weatherthreat in Australia (Australian Bureau of Meteorology).
60 N60 N
30 N
30 S30 S
30 N
EquatorEquator
Tornadoes around the Worldby T.T. Fujita 1973
Figure 2: Reported tornado locations around the world (Fujita, 1973).
Tornado possibilities
F2, 113 – 157 mph
F3, 158 – 206 mph
F4, 207 – 260 mph
W Waterspout90°W 0° 90°E
60°S
30°S
30°N
60°N
Equator
Argentinatornadoes
rare
Fujita 1972
New Zealand162 Tornadoes
1919–1944
ww
w
ww
www
wwww
w
w
w
ww
w
www
w
w
w
w
ww
w
ww
w
Japan164 Tornadoes
1950–1969
Australia398 Tornadoes
1918–1957
Deccon
4 TornadoesIsrael
1954–1955
Britain78 Tornadoes1963–1966
United States872 Tornadoes
1971
Western Canada131 Tornadoes
1916–1955
Figure 3: Estimate of maximum tornado damage around theworld (Fujita, 1972).
Figure 4: Reported locations of tornadoes in Europe fromthe end of World War I until 1980 (Peterson, 1982).
Figure 5: Reported number of days with tornadoes inChina by province from 1971-1991. Numbers inparentheses are number of days with hail during period.(Zixiu et al., 1993).
75°80°
70° 65° 55° 50°
50°
40°
35°
30°
25°
75°
45°
45°
50°
40°
35°
30°
25°
45°
60°
70° 65° 55° 50°60°
Figure 6: Reported locations of tornadoes in Argentina from1930-1979 (Altinger and Schwarzkopf and Rosso, 1982).
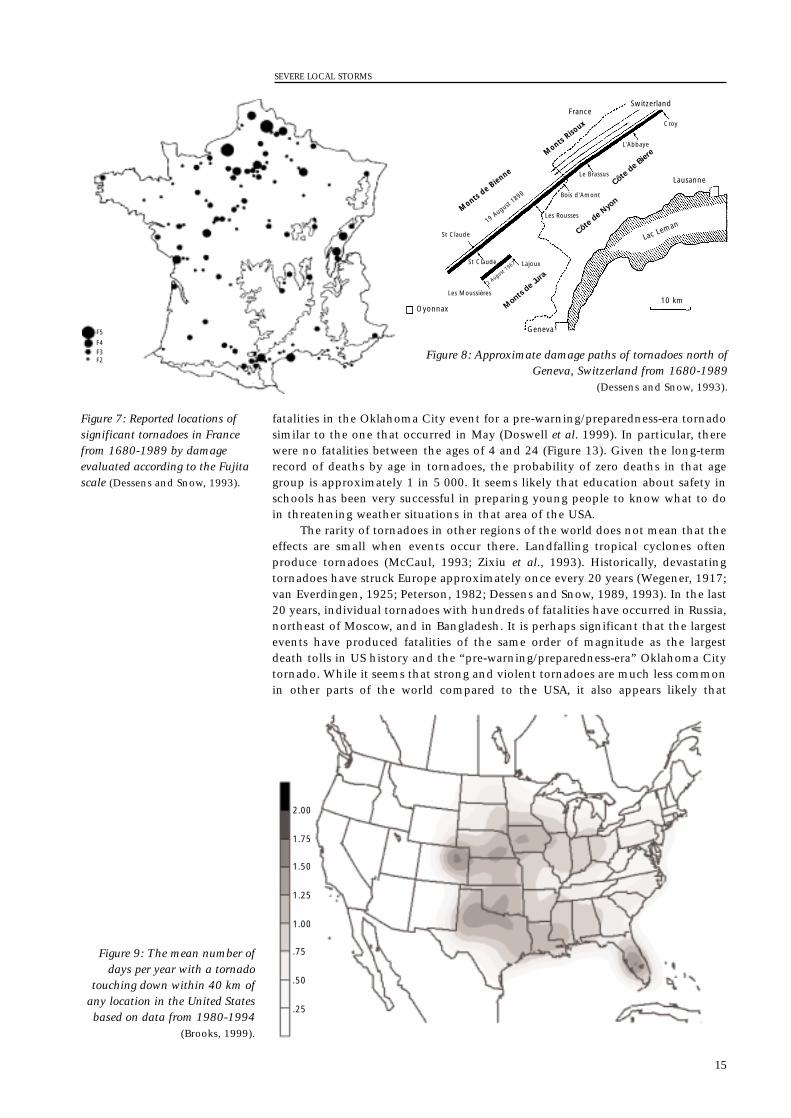
fatalities in the Oklahoma City event for a pre-warning/preparedness-era tornadosimilar to the one that occurred in May (Doswell et al. 1999). In particular, therewere no fatalities between the ages of 4 and 24 (Figure 13). Given the long-termrecord of deaths by age in tornadoes, the probability of zero deaths in that agegroup is approximately 1 in 5 000. It seems likely that education about safety inschools has been very successful in preparing young people to know what to doin threatening weather situations in that area of the USA.
The rarity of tornadoes in other regions of the world does not mean that theeffects are small when events occur there. Landfalling tropical cyclones oftenproduce tornadoes (McCaul, 1993; Zixiu et al., 1993). Historically, devastatingtornadoes have struck Europe approximately once every 20 years (Wegener, 1917;van Everdingen, 1925; Peterson, 1982; Dessens and Snow, 1989, 1993). In the last20 years, individual tornadoes with hundreds of fatalities have occurred in Russia,northeast of Moscow, and in Bangladesh. It is perhaps significant that the largestevents have produced fatalities of the same order of magnitude as the largestdeath tolls in US history and the “pre-warning/preparedness-era” Oklahoma Citytornado. While it seems that strong and violent tornadoes are much less commonin other parts of the world compared to the USA, it also appears likely that
SEVERE LOCAL STORMS
15
Figure 7: Reported locations ofsignificant tornadoes in Francefrom 1680-1989 by damageevaluated according to the Fujitascale (Dessens and Snow, 1993).
Figure 8: Approximate damage paths of tornadoes north ofGeneva, Switzerland from 1680-1989
(Dessens and Snow, 1993).
Figure 9: The mean number ofdays per year with a tornado
touching down within 40 km ofany location in the United Statesbased on data from 1980-1994
(Brooks, 1999).
FranceSwitzerland
Lausanne
10 km
Geneva
Monts
de Jura
Côte d
e Nyo
n
Côte d
e Bier
e
Oyonnax
Les Moussières
LajouxSt Claude
St Claude
19 August 1890
2 August 1967
Monts de Bienne
Monts Riso
ux
Les Rousses
Bois d’Amont
Le Brassus
L’Abbaye
Croy
Lac Leman
F5
F4F3F2
2.00
1.75
1.50
1.25
1.00
.75
.50
.25
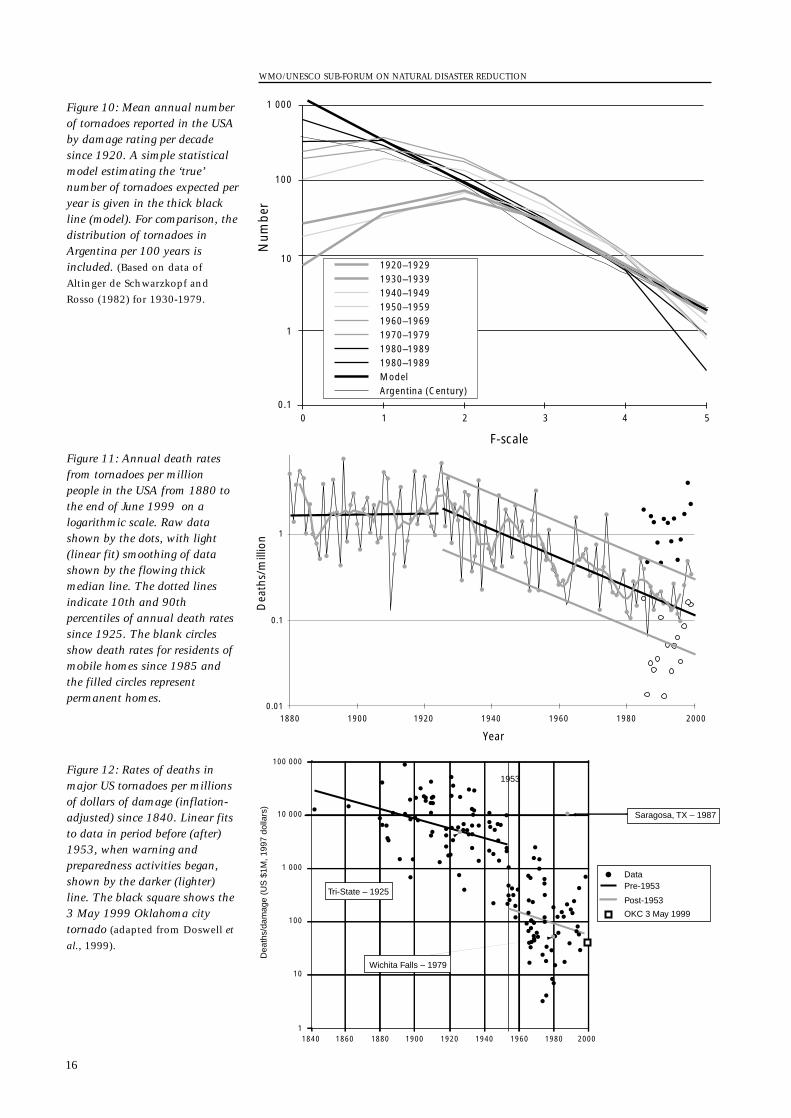
WMO/UNESCO SUB-FORUM ON NATURAL DISASTER REDUCTION
16
1 000
100
10
1
0.11 2 3 4 50
1920–19291930–19391940–1949
1960–1969
1980–19891970–1979
1980–1989ModelArgentina (Century)
1950–1959
Num
ber
F-scale
Figure 10: Mean annual numberof tornadoes reported in the USAby damage rating per decadesince 1920. A simple statisticalmodel estimating the ‘true’number of tornadoes expected peryear is given in the thick blackline (model). For comparison, thedistribution of tornadoes inArgentina per 100 years isincluded. (Based on data of
Altinger de Schwarzkopf and
Rosso (1982) for 1930-1979.
1
0.1
0.0119001880 1920 1940 1960 1980 2000
Year
Dea
ths/
mill
ion
Figure 11: Annual death ratesfrom tornadoes per millionpeople in the USA from 1880 tothe end of June 1999 on alogarithmic scale. Raw datashown by the dots, with light(linear fit) smoothing of datashown by the flowing thickmedian line. The dotted linesindicate 10th and 90thpercentiles of annual death ratessince 1925. The blank circlesshow death rates for residents ofmobile homes since 1985 andthe filled circles representpermanent homes.
10 000
1 000
100
100 000
118601840 1880 1900 1920 1940 1960 1980 2000
10
Tri-State – 1925
Wichita Falls – 1979
Dea
ths/
dam
age
(US
$1M
, 199
7 do
llars
)
1953
Saragosa, TX – 1987
DataPre-1953
Post-1953
OKC 3 May 1999
Figure 12: Rates of deaths inmajor US tornadoes per millionsof dollars of damage (inflation-adjusted) since 1840. Linear fitsto data in period before (after)1953, when warning andpreparedness activities began,shown by the darker (lighter)line. The black square shows the3 May 1999 Oklahoma citytornado (adapted from Doswell et
al., 1999).
tornadoes are vastly underreported in the rest of the world. The prime evidencefor this is that the majority of reported tornadoes in many parts of the world arefatality-producing events or are especially newsworthy (such as the 1998 tornadoin Umtata, South Africa, while the South African President was visiting the town).This situation is similar to that in the USA in the mid-19th century when onlyapproximately 25 tornadoes per year were reported. In some parts of Europe, suchas Finland (J. Tettinen, personal communication), tornadoes were almost neverreported until the last few years, when increased public attention has led toincreased reporting.
The exact definition of the nature of severe hail is troublesome. For some agri-cultural interests during certain periods of the year, even 1 cm diameter hail maybe devastating. For urban areas, it may take much larger hail, say 4 cm in diame-ter, to cause problems. The distribution of regions prone to these levels of threatis very different. The smaller limit occurs in much of the temperate world duringthe warm season (Figure 14). Larger hail is typically limited to the central part ofNorth America (Kelly et al., 1985) and regions near major mountain ranges in therest of the world (e.g., the Himalayas and Alps [Houze et al., 1993]). It has beensuggested that extremely large hail is much more likely in supercell thunder-storms than in “ordinary” thunderstorms (Rasmussen and Blanchard, 1998). Thisis consistent with the observed distribution of tornadoes, presumably associatedwith supercells, in the central part of the USA. The lack of a relationship whenhail of any size is considered has been pointed out for China by Zixiu et al. (1993).They show that the frequency of hail is maximized in the high plateau regions ofwestern China (Figure 15), while tornadoes are more common in the eastern partof the country, particularly in the Yangtze River valley (Figure 5). The highplateaus and other regions downwind of mountains may produce large hailbecause of the steep tropospheric lapse rates that develop as air comes over moun-tains.
Unfortunately, observations of hail have not been consistent through theyears. In the USA, the number of reports of severe hail (approximately 2 cm orlarger) has increased by an order of magnitude in the past 30 years. Most of theincrease has been in the smaller end of the severe range. As a result, attempts todevelop a climatology based on the reports face significant challenges.Researchers are faced with the dilemma of having small sample sizes or an non-homogeneous record (Figure 16, Brooks, 1999). Efforts to use insurance losses arecomplicated by the issue of what causes the losses (agricultural vs. urban interests)and the temporal non-homogeneity of the insured base. Nevertheless, in the last15 years, extremely large losses (greater than US $500 million) have been associ-ated with hailstorms in areas such as Munich in Germany, and Denver (Colorado)and the Dallas-Fort Worth region (Texas) in the USA.
Strong winds associated with thunderstorms are a common feature. Little hasbeen done to document their climatological occurrence (Figure 17) until recentyears (e.g., Kelly et al., 1985, Johns and Hirt, 1987, Brooks, 1999) although theyare almost certainly the most common severe weather event. Damaging straight-line thunderstorm wind gusts are usually associated with cold air outflow as thedowndraft reaches the ground. Fujita and Byers (1977) were the first to use theterm downburst to describe very strong wind gusts produced by thunderstorms.Factors that influence the generation of damaging wind gusts at the surfaceinclude: negative buoyancy enhanced by evaporative cooling within unsaturatedair, precipitation loading within the downdraft, and downward transfer of hori-zontal momentum by the downdraft (e.g., Kamburova and Ludlam, 1966). Again,aspects of these processes are dependent on stormscale microphysics includingdrop size distribution and liquid water content per unit volume, which cannot bedetermined from standard observing systems.
Strong winds can occur in a variety of situations (for reviews, see Doswell,1994 and Wakimoto, 1998). They can be associated with small, short-lived down-drafts and even when they are relatively weak (say less than 25 m s-1), they can be
2.3 DAMAGING CONVECTIVE
WIND GUSTS
2.2HAIL
SEVERE LOCAL STORMS
17
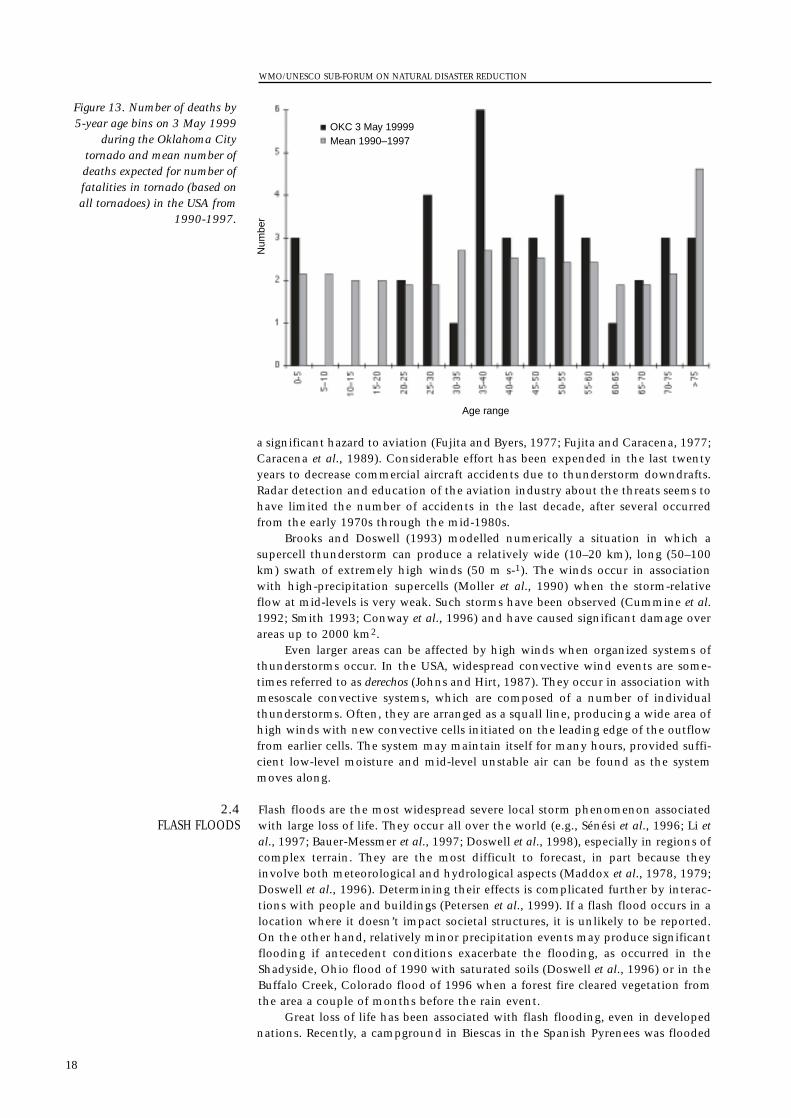
a significant hazard to aviation (Fujita and Byers, 1977; Fujita and Caracena, 1977;Caracena et al., 1989). Considerable effort has been expended in the last twentyyears to decrease commercial aircraft accidents due to thunderstorm downdrafts.Radar detection and education of the aviation industry about the threats seems tohave limited the number of accidents in the last decade, after several occurredfrom the early 1970s through the mid-1980s.
Brooks and Doswell (1993) modelled numerically a situation in which asupercell thunderstorm can produce a relatively wide (10–20 km), long (50–100km) swath of extremely high winds (50 m s-1). The winds occur in associationwith high-precipitation supercells (Moller et al., 1990) when the storm-relativeflow at mid-levels is very weak. Such storms have been observed (Cummine et al.1992; Smith 1993; Conway et al., 1996) and have caused significant damage overareas up to 2000 km2.
Even larger areas can be affected by high winds when organized systems ofthunderstorms occur. In the USA, widespread convective wind events are some-times referred to as derechos (Johns and Hirt, 1987). They occur in association withmesoscale convective systems, which are composed of a number of individualthunderstorms. Often, they are arranged as a squall line, producing a wide area ofhigh winds with new convective cells initiated on the leading edge of the outflowfrom earlier cells. The system may maintain itself for many hours, provided suffi-cient low-level moisture and mid-level unstable air can be found as the systemmoves along.
Flash floods are the most widespread severe local storm phenomenon associatedwith large loss of life. They occur all over the world (e.g., Sénési et al., 1996; Li etal., 1997; Bauer-Messmer et al., 1997; Doswell et al., 1998), especially in regions ofcomplex terrain. They are the most difficult to forecast, in part because theyinvolve both meteorological and hydrological aspects (Maddox et al., 1978, 1979;Doswell et al., 1996). Determining their effects is complicated further by interac-tions with people and buildings (Petersen et al., 1999). If a flash flood occurs in alocation where it doesn’t impact societal structures, it is unlikely to be reported.On the other hand, relatively minor precipitation events may produce significantflooding if antecedent conditions exacerbate the flooding, as occurred in theShadyside, Ohio flood of 1990 with saturated soils (Doswell et al., 1996) or in theBuffalo Creek, Colorado flood of 1996 when a forest fire cleared vegetation fromthe area a couple of months before the rain event.
Great loss of life has been associated with flash flooding, even in developednations. Recently, a campground in Biescas in the Spanish Pyrenees was flooded
2.4FLASH FLOODS
WMO/UNESCO SUB-FORUM ON NATURAL DISASTER REDUCTION
18
OKC 3 May 19999Mean 1990–1997
Num
ber
Age range
Figure 13. Number of deaths by5-year age bins on 3 May 1999
during the Oklahoma Citytornado and mean number ofdeaths expected for number offatalities in tornado (based onall tornadoes) in the USA from
1990-1997.
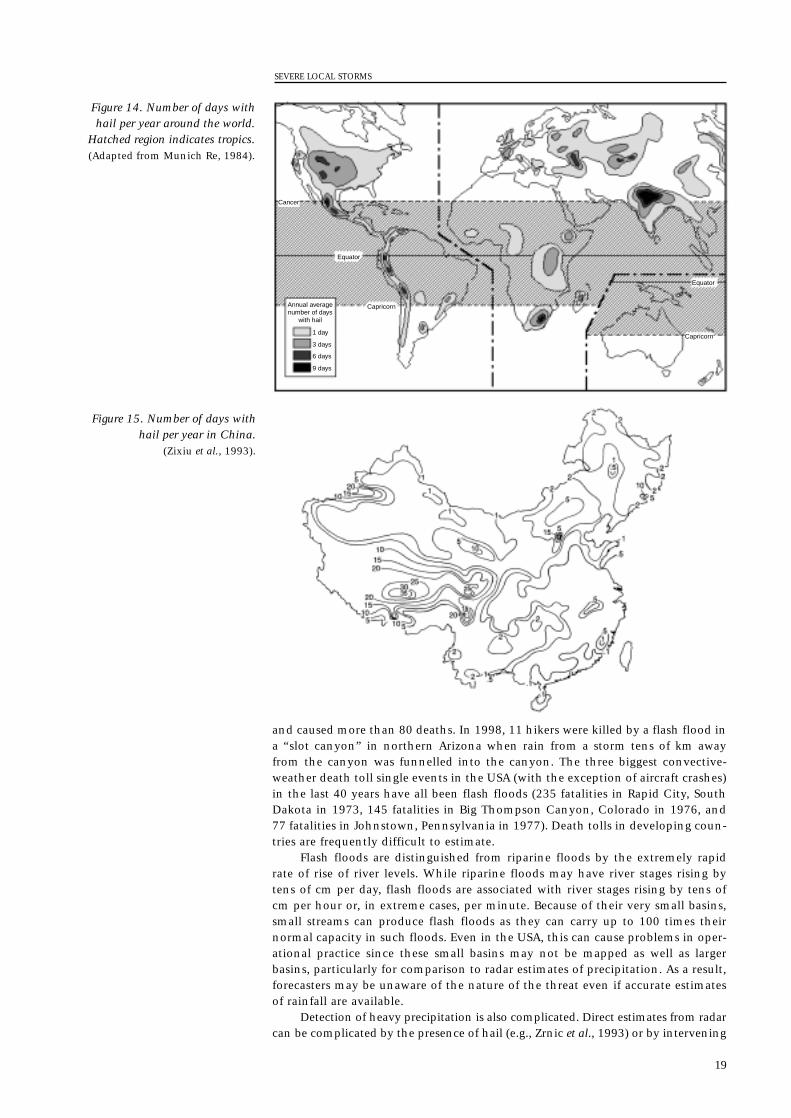
and caused more than 80 deaths. In 1998, 11 hikers were killed by a flash flood ina “slot canyon” in northern Arizona when rain from a storm tens of km awayfrom the canyon was funnelled into the canyon. The three biggest convective-weather death toll single events in the USA (with the exception of aircraft crashes)in the last 40 years have all been flash floods (235 fatalities in Rapid City, SouthDakota in 1973, 145 fatalities in Big Thompson Canyon, Colorado in 1976, and77 fatalities in Johnstown, Pennsylvania in 1977). Death tolls in developing coun-tries are frequently difficult to estimate.
Flash floods are distinguished from riparine floods by the extremely rapidrate of rise of river levels. While riparine floods may have river stages rising bytens of cm per day, flash floods are associated with river stages rising by tens ofcm per hour or, in extreme cases, per minute. Because of their very small basins,small streams can produce flash floods as they can carry up to 100 times theirnormal capacity in such floods. Even in the USA, this can cause problems in oper-ational practice since these small basins may not be mapped as well as largerbasins, particularly for comparison to radar estimates of precipitation. As a result,forecasters may be unaware of the nature of the threat even if accurate estimatesof rainfall are available.
Detection of heavy precipitation is also complicated. Direct estimates from radarcan be complicated by the presence of hail (e.g., Zrnic et al., 1993) or by intervening
SEVERE LOCAL STORMS
19
Equator
Equator
Capricorn
Capricorn
Cancer
Annual average number of days
with hail
1 day
3 days
6 days
9 days
Figure 14. Number of days withhail per year around the world.
Hatched region indicates tropics.(Adapted from Munich Re, 1984).
Figure 15. Number of days withhail per year in China.
(Zixiu et al., 1993).
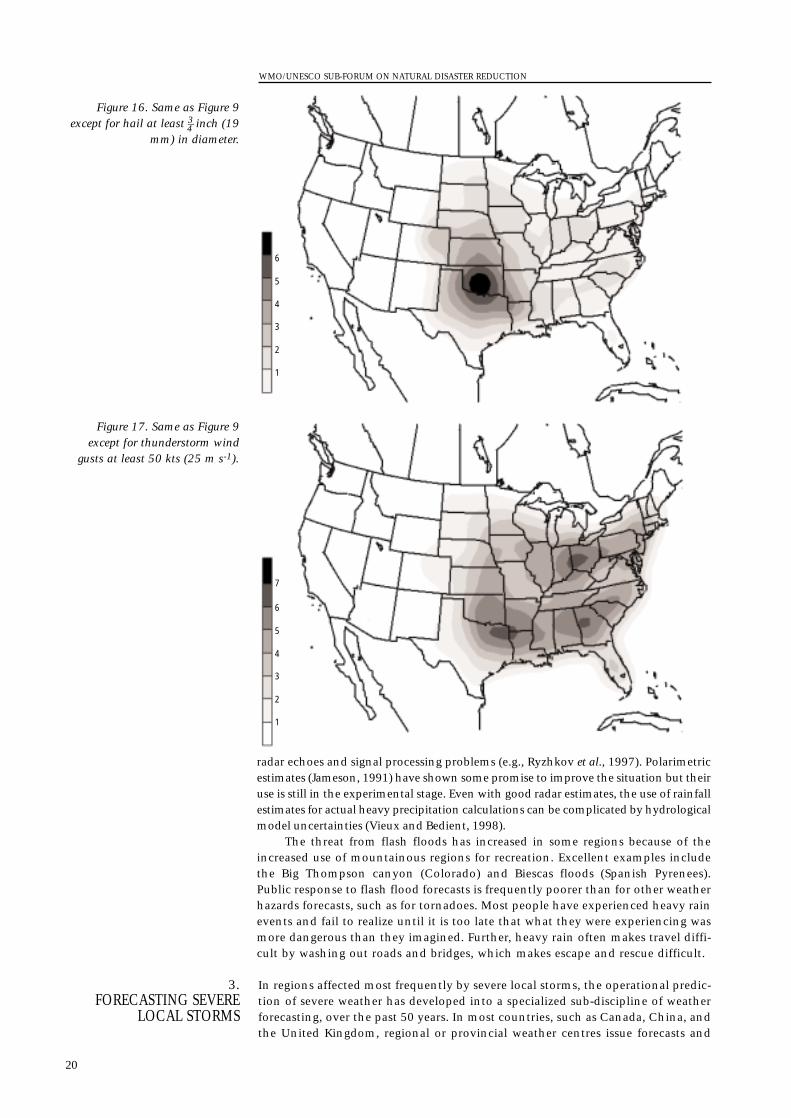
radar echoes and signal processing problems (e.g., Ryzhkov et al., 1997). Polarimetricestimates (Jameson, 1991) have shown some promise to improve the situation but theiruse is still in the experimental stage. Even with good radar estimates, the use of rainfallestimates for actual heavy precipitation calculations can be complicated by hydrologicalmodel uncertainties (Vieux and Bedient, 1998).
The threat from flash floods has increased in some regions because of theincreased use of mountainous regions for recreation. Excellent examples includethe Big Thompson canyon (Colorado) and Biescas floods (Spanish Pyrenees).Public response to flash flood forecasts is frequently poorer than for other weatherhazards forecasts, such as for tornadoes. Most people have experienced heavy rainevents and fail to realize until it is too late that what they were experiencing wasmore dangerous than they imagined. Further, heavy rain often makes travel diffi-cult by washing out roads and bridges, which makes escape and rescue difficult.
In regions affected most frequently by severe local storms, the operational predic-tion of severe weather has developed into a specialized sub-discipline of weatherforecasting, over the past 50 years. In most countries, such as Canada, China, andthe United Kingdom, regional or provincial weather centres issue forecasts and
3. FORECASTING SEVERE
LOCAL STORMS
WMO/UNESCO SUB-FORUM ON NATURAL DISASTER REDUCTION
20
Figure 16. Same as Figure 9except for hail at least 3–4 inch (19
mm) in diameter.
Figure 17. Same as Figure 9except for thunderstorm wind
gusts at least 50 kts (25 m s-1).
1
2
3
4
5
6
1
2
3
4
5
6
7
warnings for all severe local storms within their geographic area of responsibility.In the USA, however, responsibility for the prediction of most severe local storms(tornadoes, large hail, damaging convective wind gusts) has, since the early1950s, been centralized at a single national center of expertise (now called theStorm Prediction Center). The actual detection and subsequent issuance of short-term warnings for individual severe local storms is handled by local WeatherForecast Offices (WFO) whose areas of responsibility typically cover relativelysmall parts of one or more states. For flash flood events in the USA, the WFOsissue watches and warnings, aided by guidance from two national centres (theHydrometeorological Prediction Center and the Storm Prediction Center).
The concept known as “ready-set-go” has been applied to the forecast andwarning program in the USA. This is based on sociological studies that have deter-mined that most people will not go to a place of safety at the first mention of anapproaching severe local storm but will, instead, seek additional information toconfirm the existence of a hazardous weather threat. Thus, a series of forecastproducts are communicated to emergency preparedness managers and the publicstarting with outlooks for possible severe storms covering relatively large areas,that are issued 1–2 days ahead of time. If the severe local storm threat increasesand storms are likely to develop over more confined regions, severe thunderstormor tornado watches are issued with temporal/spatial characteristics of approxi-mately 6 hr/40 000 km2. When a severe local storm is indicated by radar orreported by storm spotters, a warning is issued with approximate temporal/spatialcharacteristics of 1 hr/one county.
In its simplest terms, the prediction of severe local storms must first beginwith the determination of thunderstorm potential. In general, this requires threeingredients: 1) sufficient moisture in the lower and/or middle troposphere; 2)lapse rates that are steep enough to result in substantial Convective AvailablePotential Energy (CAPE); and 3) sufficient lifting of the parcel for it to reach theLevel of Free Convection (LFC) so it can become positively buoyant with respectto the ambient environment. The upward motion needed to release the instabil-ity is typically mesoscale in character (Doswell, 1987), and most often involveslow-level convergence along air mass discontinuities such as fronts, drylines,convective outflow boundaries, sea- and lake-breeze fronts and narrow zones ofdifferential heating associated with edges of cloud shields. Once it is determinedthat thunderstorms are possible, the forecaster can then examine the probabilityof severe thunderstorm development. Typically, the forecasting process involvesaspects of climatology, synoptic/mesoscale pattern recognition and meteorologi-cal parameter assessment. The first two components are closely linked, sincepattern recognition procedures need to be periodically updated as the apparentclimatology of severe local storms is subject to changes. The final process (param-eter assessment) is probably changing the most rapidly as advances in technology(e.g., observing systems and computer workstations) and scientific understandingof severe storms and their interaction with the synoptic environment result innew ways to examine convective potential.
The organization and intensity of deep convection is largely determined bytwo factors: 1) instability or buoyancy; and 2) vertical wind shear. Given thatincreasing amounts of these two general ingredients are expected to be present,the likelihood of severe local storms increases. However, since the different typesof severe local storms appear to result from variations in both synoptic/mesoscaleenvironments and different stormscale physical processes, the prediction processmust eventually examine a variety of environmental characteristics in order toassess the most likely type(s) of severe weather that may occur.
Since the most significant tornadoes are almost always associated with supercellthunderstorms, the operational prediction of tornadoes at this time is largely anexercise in forecasting the likelihood of supercell formation (Johns and Doswell,1992, Doswell et al., 1993, Moller et al., 1994). In the 1970s, early studies of torna-does using a prototype Doppler radar indicated that most supercells producedtornadoes. However, experience gained with a much large database from a nation
3.1PREDICTION OF TORNADOES
SEVERE LOCAL STORMS
21
wide network of Doppler radars in the USA over the last decade strongly suggeststhat only a small percentage of supercell thunderstorms (less than 20 per cent) areassociated actually with tornadoes. Thus, an additional task in tornado forecast-ing involves assessing the probability of tornadic supercell occurrence as opposedto non-tornadic supercell occurrence.
Theoretical (Lilly, 1982; Davies-Jones, 1984), numerical modelling (Weismanand Klemp, 1982, 1984; Brooks et al., 1993, 1994), and observational studies (e.g.,Davies-Jones et al., 1990, Johns et al., 1993) have demonstrated the relationshipof various measures of vertical wind shear, such as mean shear in the lowest 4-6km AGL, and storm-relative helicity (a measure of streamwise helicity that can beingested into the updraft of a thunderstorm), to assess the potential for supercelldevelopment. While low-level shear is related to mid-level storm rotation (meso-cyclone aloft), it has been suggested that the character of the storm-relativemid-level winds is linked to baroclinic processes associated with low-level rotationin supercell thunderstorms (Brooks et al., 1994). Thus, once it has been deter-mined that supercells may form, forecasters typically examine the strength of thestorm-relative mid-level winds, either directly (Mead, 1997, Thompson, 1998) orindirectly using the shear term of Weisman and Klemp‘s Bulk Richardson Number(Stensrud et al., 1997), to obtain information on the potential for tornadic super-cells to develop.
Tornadoes can also develop in association with non-supercell thunderstorms,although these tornadoes are typically weak and do not last very long. This classof tornadoes is thought to develop when horizontal shear lines become coinci-dent with convective updrafts, and the horizontal vorticity along the shear line istilted and stretched vertically (e.g., Brady and Szoke, 1988, Wakimoto and Wilson,1989). These tornadoes typically occur in weakly sheared environments alonglow-level boundaries associated with sea breeze fronts, convective outflows, andterrain-induced convergence lines. Reliable forecast techniques for non-supercelltornadoes have not been established at this time.
The physics of hail development is quite complex, involving a variety of factorsthat relate to updraft strength, storm-scale wind structures and circulation, cloudmicrophysics and environmental effects on hailstones as they fall toward theground. Many of the details needed to quantify these processes occur on scalesthat are not observed, which contributes to the difficulty in making accurate hailforecasts. Of the factors mentioned, simple measures of updraft strength andenvironmental effects related to the depth and mean temperature of the meltinglayer between the hailstones freezing level and the ground have been typicallyapplied to hail size algorithms through the years (e.g., Fawbush and Miller, 1953,Foster and Bates, 1956, Prosser and Foster, 1966). The magnitude of the potentialbuoyancy (CAPE) has been used to infer updraft strength, while the height of the0°C wet-bulb temperature has been related to the likelihood of large hail reachingthe ground (Miller, 1972). Since non-hydrostatic pressure perturbations havebeen shown to have a notable effect on updraft strength in supercells (Brooks andWilhelmson, 1993; McCaul and Weisman, 1996), it is not surprising that thesetechniques have proven to be ineffective in reliably predicting hailstone size(Doswell et al., 1982). More recent hail size algorithms have been proposed (e.g.,Moore and Pino, 1990), but additional research is needed to test the validity ofthese techniques using large data samples thoroughly.
It has been observed that strong convective wind gusts can be generated in differ-ent types of synoptic environments. Environments characterized by weak forcingfor upward vertical motion typically display weak wind shear, but it is not uncom-mon for thunderstorms in these environments to produce strong wind gusts. Inmost cases, the vertical thermodynamic structure is critical in providing clues thatidentify the wind gust potential in weakly sheared environments. Small-scaledownbursts called microbursts can be produced where the low-levels are very dry(such as in the arid regions of western USA or northwest China), as well as inregions characterized by very moist low-level conditions (such as in the southeast
3.3DAMAGING CONVECTIVE
WIND GUSTS
3.2HAILSTONE DEVELOPMENT
WMO/UNESCO SUB-FORUM ON NATURAL DISASTER REDUCTION
22
USA). In most instances, the convection embedded in weak shear is of a “pulse”nature and lasts for only short periods of time, making forecast and warning oper-ations very challenging. The dry microburst is associated with a deep, dryadiabatic surface-based mixed layer with moisture confined to a layer in themiddle-levels (e.g., Wakimoto, 1985). Conversely, the wet microburst tends todevelop within a deep surface-based moist layer that contains some dry air aloft,such that the theta-e lapse rate between the surface and middle levels exceeds20°C (Atkins and Wakimoto, 1991). In most instances microbursts affect onlysmall areas for a short period of time but, on a few occasions, they have beenknown to produce extremely strong wind gusts in excess of 50 m s-1.
When the vertical shear becomes stronger (on the order of 15–20 m/s in thelowest 6 km) the prediction of damaging wind gusts becomes somewhat morecomplex since the synoptic pattern and the thermodynamic and kinematicprofiles become increasingly important. Observational studies based on radarreflectivity have documented the relationship between bow-shaped convectiveelements called bow echoes (Fujita, 1978; Przybylinski, 1995) and the occurrenceof damaging wind gusts. Bow echoes may occur as isolated thunderstorm cells, orcomprise elements of extensive squall lines. When a larger-scale bow echo or aseries of bow echoes produce a succession of downbursts over a widespreadregion, this is termed a derecho (Johns and Hirt, 1987).
Derechos can occur at all times of the year in the USA. They were first studiedextensively during the warm season when it was determined that they were asso-ciated with specific synoptic environments characterized by extreme instabilitynear east-west oriented surface fronts along the southern edge of stronger westerlywinds aloft with unidirectional flow above the boundary layer (e.g., Johns et al.,1990). In these scenarios, bow echoes travel rapidly eastward along the surfaceboundary, occasionally propagating a short distance into the warm sector. Thesouthward extent of bow echo development is usually limited by a capping inver-sion, so that extensive meridionally oriented squall lines do not form. Morerecently, derechos have been found to also occur during cooler parts of the year inassociation with energetic baroclinic waves. In these cases, squall lines tend toform along or ahead of the cold front with a series of bow echoes embeddedwithin the line. Potential buoyancy is usually much less in these situations butthe winds aloft are quite strong and the overall pattern bears a resemblance tomore classic tornado outbreak patterns (e.g, Barnes and Newton, 1986).
Although the climatology and synoptic patterns associated with derechos arereasonably well-known (Johns and Hirt, 1987; Duke and Rogash, 1992; Johns1993), details of meteorological parameters essential for widespread bow echodevelopment are not well established. Weisman (1993) has conducted cloudmodelling experiments that suggest that bow echos form in environments withlarge instability where the vertical shear is strongest in the lowest 2–3 km.However, a recent observational study by Evans (1998) examining proximitysoundings associated with more than 70 bow echoes shows a very wide range ofbuoyancy and shear combinations can support bow echo development, suggest-ing additional complexity in the prediction of these hazardous convectivesystems.
The forecasting of flash floods involves not only the determination of heavyprecipitation falling over the same area, but must also consider hydrologic influ-ences such as topography and land types, as well as antecedent precipitation thataffects soil moisture conditions. Thus, the forecaster must be very familiar withterrain features such as canyons and details of river and small stream basins thatcan enhance the chances of flash floods even during short periods of heavy rain-fall rates.
The primary meteorological considerations require examination of processesthat result in heavy rainfall rates that are sustained over one area during a givenperiod of time. Chappell (1986) notes that this tends to occur most frequentlywhen quasi-stationary mesoscale convective systems develop and individualstorm cells within the MCS track repeatedly over the same area. The ingredients
3.4FLASH FLOODS
SEVERE LOCAL STORMS
23
needed to produce moist, deep convection in flash flood situations are similar tothose needed for other types of severe storms (e.g., large quantities of moisture,instability, and a lifting mechanism to release the instability), but a key differenceoften involves special characteristics of the vertical wind profile over a region thatresults in slow-moving convective cells and/or a quasi-stationary MCS. MCSmovement can be thought of as the sum of advective and propagational compo-nents, where advection is proportional to the mean wind through a deeptropospheric layer and propagation is associated with the development of newupdrafts where the low level moist inflow is maximized (Corfidi et al., 1996).When the advective and propagational components are in near balance, a quasi-stationary MCS is likely to develop. Of course, other factors such as precipitationefficiency of the convective cells play a role in the magnitude of the rainfall rate(e.g., Fankhauser, 1988), but the complexity of this process makes it quite difficultto apply in operational forecasting. Numerical guidance often provides little helpon the appropriate scale and convective schemes used in such models are sensi-tive to small changes in their parameters (Spencer and Stensrud, 1998).
A particularly difficult forecast problem occurs when combinations of severestorm effects occur almost simultaneously, such as when tornadoes and flashflooding occur in the same area (e.g, Maddox and Dietrich, 1981, Schwartz et al.,1990). This places tremendous pressure on the local forecasters charged with fore-cast and warning responsibility and on emergency managers responsible forpreparedness efforts. In these types of situations, it is not uncommon for stormsto produce hail and tornadoes early in their life cycle, then result in flash floodproducing rains shortly thereafter when the primary meteorological focus maystill be on tornadoes.
The use of an ingredients-based methodology in the forecasting of severelocal storms has allowed forecasters to apply scientific findings in a rational andorderly manner. It encourages the understanding of physical processes that can beused to link larger-scale parameters that can be observed to storm-scale processesthat result in convectively generated weather hazards. [For more detailed infor-mation the reader is encouraged to consult comprehensive review articles onsevere local storm forecasting by Maddox et al. (1979) Funk (1991), Johns andDoswell (1992), Doswell et al. (1993), and Doswell et al. (1996).] Although thesebasic principles were first intended to be used with observational data, they canalso be applied to numerical weather prediction model output in order to extendthe time range of useful forecasts of severe storms. However, it then becomesimportant to know the strengths and weaknesses of operational models regardingtheir ability to predict parameters important to the forecast process (Cortinas andStensrud, 1995; Weiss, 1996). Mesoscale models are now routinely run in manynational weather services around the world and this has resulted in improvedpredictions of synoptic patterns and meteorological features such as low level jetsin the 1–2 day forecast period. However, as the resolution of operational modelshas increased into the 20–40 km range, we have seen slow improvements in themodels ability to accurately forecast the 4-D evolution of thermodynamic profiles,especially water vapour, which is a key component in the forecasting of convec-tion (e.g, Emanuel et al., 1995, Weiss et al., 1998). This not only reflects thedifficulties in properly incorporating physical processes of increased complexity(such as the parameterization of convection) but also is a result of model resolu-tion increasing much faster than the resolution of most observational datasources, so that it is becoming increasingly difficult to both calibrate and validatemesoscale models.
Accordingly, we have seen substantial improvements in the forecasting ofsevere local storms, especially in the detection/warning phase (e.g., Bieringer andRay, 1996). In the USA the deployment of Doppler radars and automated radaranalysis techniques have allowed forecasters to interrogate potentially severethunderstorms in ways never before possible (see the June 1998 special issue ofWeather and Forecasting). Coupled with real-time information from storm spotters,the radar data has given forecasters the ability literally to see the end result on thestormscale of a myriad of atmospheric processes and scale interactions, many of
WMO/UNESCO SUB-FORUM ON NATURAL DISASTER REDUCTION
24
which we do not fully understand. And although our ability to predict the potential for severe storm development up to 2 days in advance has steadilyimproved over the last decade, limitations in our scientific understanding ofprocesses affecting convective initiation and evolution remain apparent.
Unfortunately, the large changes in the reporting database of severe weather makeit impossible to determine any influence of the phase of ENSO on the numberand severity of most events, particularly in mid-latitudes. Heavy precipitationleading to flash floods in tropical environments is the one exception, where thelarge-scale changes in the general circulation lead to the enhancement of heavyprecipitation, particularly in mountainous terrain of coastal areas of SouthAmerica when the upward branch of the Southern Oscillation is in the easternPacific. Heavy precipitation along the California coast of the USA also increasesin El Niño winters, leading to flooding and landslides there. Although connec-tions between severe weather occurrence, particularly tornadoes, in specificregions of the USA have been hypothesized, the small sample size and largetemporal changes in overall reporting patterns render those relationships statisti-cally insignificant or, at best, marginally significant.
It seems clear that organized systems for documenting the occurrence of severeweather are lacking in many parts of the world. The large changes in numbers ofreports in recent years make it difficult to determine the true nature of the threat,particularly for non-tornadic severe weather; this is also also applied to the USAin spite of its having one of the most complete systems. This situation also meansthat it is effectively impossible to determine changes in severe weather occurrencethat might be associated with climatic signals, such as ENSO or global climatechange. It is possible that an estimate of the current climatological likelihood ofsevere weather could be made by the use of meteorological covariates (Brown andMurphy, 1996), where the climatology of well-observed parameters (such as infor-mation from radiosonde observations) associated with the occurrence of variouskinds of severe weather is created, with the strength of the relationship betweenthe observed covariate and the meteorological event of interest becoming thelimiting factor in the estimates of the meteorological event. Conceptually, itshould be possible to make estimates of various potential covariates from the rela-tively high-quality North American database and then apply the covariates to therest of the world.
Despite imperfect information about the occurrence of severe local storms,the effects of these storms on human populations and societies can be estimated.In developed nations, particularly in North America, rates of fatalities associatedwith severe local storms have dropped from the level they reached earlier in thecentury. The declining death rates are associated with improved forecasting anddetection of events, improved awareness in the general public and improvedcommunication of meteorological and safety information. Reported propertydamage has been increasing, although much of this is due to the increased prop-erty value. However, increasing populations and recreational activities invulnerable regions, such as mountainous terrain prone to flash flooding, makeseven developed countries exposed to the possibility of disasters with significantloss of life.
Public awareness of severe local storms has been increasing around theworld, particularly in developed nations, as a result of improved communication,especially television. It is likely that our understanding of the distribution ofthreats will improve greatly in the near future. Technological and scientificadvances over the last few decades have led to decreases in fatalities from severelocal storms in North America. Transfer of those advances to other parts of theworld could lead to similar decreases in other parts of the world which are alsovulnerable to severe local storms. Even though North America may have the great-est threat from severe local storms, the experience there indicates that the greatestloss of life in tornadoes, for example, occurs in regions where tornadoes are rela-
5.CONCLUDING
THOUGHTS
4.POSSIBLE RELATIONSHIPS
TO EL NIÑO/SOUTHERNOSCILLATION (ENSO)
SEVERE LOCAL STORMS
25
tively rare. Thus, governmental and societal institutions need to be prepared torespond to rare events in order to avoid catastrophic loss of life.
We thank Dr James Kimpel, Director of the National Severe Storms Laboratory,and Dr Joseph Schaefer, Director of the Storm Prediction Center, for their assis-tance, and Ms Jenni Tettinen of the Finnish Meteorological Institute forinformation on tornado reports in Finland.
Altinger de Schwarzkopf, M. L., and L. C. Rosso, 1982: Severe storms and torna-does in Argentina. Preprints, 12th Conf. Severe Local Storms (San Antonio,Texas), American Meteorological Society, pp. 59-62.
Atkins, N. T., and R. M. Wakimoto, 1991: Wet microburst activity over the south-eastern United States: Implications for forecasting. Weather Forecasting, 6, pp.470-482.
Barnes, S. L., and C. W. Newton, 1982: Thunderstorms in the synoptic setting.Thunderstorms: A Social, Scientific and Technological Documentary. Vol. 2:Thunderstorm Morphology and Dynamics. E. Kessler, Ed., NOAA/EnvironmentalResearch Laboratories, pp. 109-173.
Bauer-Messmer, B., J. A. Smith, M. L. Baeck, and W Zhao, 1997: Heavy rainfall:Contrasting two concurrent Great Plains thunderstorms. Weather Forecasting,12, pp. 785–798.
Bieringer, P., and P. S. Ray, 1996: A comparison of tornado warning lead timeswith and without NEXRAD Doppler radar. Weather Forecasting, 11, pp. 47-52.
Brady, R.H., and E.J. Szoke, 1988: The landspout — A common type of northeastColorado tornado. Preprints, 15th Conf. Severe Local Storms (Baltimore,Maryland), American Meteorological Society, pp. 312-315.
Brooks, H. E., 1999: Severe weather climatological probabilities.<http://www.nssl.noaa.gov/~brooks/threatanim.html>
Brooks, H. E. and R. B. Wilhelmson, 1993: Helicity and updraft intensity innumerically modelled supercells. Journal of Atmospheric Science, 50, pp. 1824-1833.
Brooks, H. E. and C.A. Doswell III, 1993: Extreme winds in high-precipitationsupercells. Preprints, 17th Conf. Severe Local Storms (St. Louis, Missouri),American Meteorological Society, pp. 173-177.
Brooks, H. E., C.A. Doswell III and R. Davies-Jones, 1993: Environmental helicityand the maintenance and evolution of low-level mesocyclones. The Tornado:Its Structure, Dynamics, Prediction and Hazards (Geophys. Monogr. 79), C.Church, Ed., Amer. Geophys. Union, pp. 97-104.
Brooks, H. E., C.A. Doswell III and J. Cooper, 1994a: On the environments oftornadic and non-tornadic mesocyclones. Weather Forecasting, 10, pp. 606-618.
Brooks, H. E., C.A. Doswell III and R. B. Wilhelmson, 1994b: On the role of mid-tropospheric winds in the evolution and maintenance of low-levelmesocyclones. Monthly Weather Review, 122, pp. 126-136.
Brown, B. G. and A. H. Murphy, 1996: Verification of aircraft icing forecasts: theuse of standard measures and meteorological covariates. Preprints, 13th Conf.on Probability and Statistics in the Atmospheric Sciences (San Francisco,California), American Meteorological Society, pp. 251-252.
Browning, K.A, 1964: Airflow and precipitation trajectories within severe localstorms which travel to the right of the winds. Journal of Atmospheric Sciences,21, pp. 634-639.
Burgess, D. W., and L. R. Lemon, 1990: Severe thunderstorm detection by radar.Radar in Meteorology, D. Atlas, Ed., American Meteorological Society, Boston,MA, pp. 619-647.
Caracena, F., R.L. Holle, and C.A. Doswell III, 1989: Microbursts: A Handbook forVisual Identification. Superintendent of Documents, U.S. Government PrintingOffice, Washington, D.C. 20402, 35 pp.
Chappell, C.F., 1986: Quasi-stationary convective events. Mesoscale Meteorologyand Forecasting (P.S. Ray, Ed.), American Meteorological Society, pp. 289-310.
REFERENCES
ACKNOWLEDGMENTS
WMO/UNESCO SUB-FORUM ON NATURAL DISASTER REDUCTION
26
Church, C., D. W. Burgess, R. Davies-Jones, and C.A. Doswell III (Eds.) 1993: TheTornado: Its Structure, Dynamics, Prediction and Hazards (Geophys. Monogr. 79),Amer. Geophys. Union, 637 pp.
Conway, J. W., K. Hondl, and H. E. Brooks, 1996: The Lahoma ok supercell: Astudy of non-tornadic vs tornadic mesocyclones. Preprints, 18th Conf. onSevere Local Storms (San Francisco, California) American MeteorologicalSociety, pp. 52-56.
Corfidi, S.F., J.H. Merritt and J.M Fritsch, 1996: Predicting the movement ofmesoscale convective complexes. Weather Forecasting, 11, pp. 41-46.
Cortinas, J. V. Jr., and D. J. Stensrud, 1995: The importance of understandingmesoscale model parameterization schemes for weather forecasting. WeatherForecasting, 10, pp. 716-740.
Cummine, J., P. McCarthy, and M. Leduc, 1992: Blowdown over northwesternOntario. Preprints, 4th Workshop on Operational Meteorology (Whistler,British Columbia, Canada), Atmos. Environ. Service/Canadian Meteor. andOceanogr. Soc., pp. 311-317.
Darkow, G.L., 1969: An analysis of over sixty tornado proximity soundings.Preprints, 6th Conf. Severe Local Storms (Chicago, Illinois), AmericanMeteorological Society, pp. 218-221.
Davies, J. M., and R.H. Johns, 1993: Some wind and instability parameters associ-ated with strong and violent tornadoes. 1. Wind shear and helicity. TheTornado: Its Structure, Dynamics, Prediction and Hazards (Geophys. Monogr. 79),C. Church, Ed., Amer. Geophys. Union, pp. 573-582.
Davies-Jones, R., 1984: Streamwise vorticity: The origin of updraft rotation insupercell storms. Journal of Atmospheric Sciences, 41, pp. 2991-3006.
Davies-Jones, R., D. Burgess, and M. Foster, 1990: Test of helicity as a tornado fore-cast parameter. Preprints, 16th Conf. on Severe Local Storms (Kananaskis Park,Alberta, Canada), American Meteorological Society, pp. 588-592.
Davies-Jones, R. and H. E. Brooks, 1993: Mesocyclogenesis from a theoreticalperspective. The Tornado: Its Structure, Dynamics, Prediction and Hazards(Geophys. Monogr. 79), C. Church, Ed., Amer. Geophys. Union, pp. 105-114.
Dessens, J., and J. T. Snow, 1989: Tornadoes in France. Weather Forecasting, 4, pp.110-132.
Dessens, J., and J. T. Snow, 1993: Comparative description of tornadoes in Franceand the United States. The Tornado: Its Structure, Dynamics, Prediction andHazards (Geophys. Monogr. 79), C. Church, Ed., Amer. Geophys. Union, pp.427-434.
Doswell, C. A. III, 1987: The distinction between large-scale and mesoscale contri-bution to severe convection: A case study example. Weather Forecasting, 2, pp.3-16
Doswell, C. A. III, 1994: Extreme convective windstorms: Current understandingand research. Report of the Proceedings (1994) of the U.S.-Spain Workshop onNatural Hazards (Barcelona, Spain, 8-11 June 1993), J. Corominas and K.P.Georgakakos, Eds., 44-55. [Available from the Iowa Institute of HydraulicResearch, University of Iowa, Iowa City, Iowa 52242 USA]
Doswell, C. A. III, J. T. Schaefer, D. W. McCann, T. W. Schlatter, and H. B. Wobus,1982: Thermodynamic analysis procedures at the National Severe Storms Forecast Center. Preprints, 9th Conf. on Weather Forecasting and Analysis (Seattle, Washington), American Meteorological Society, pp. 304-309.
Doswell, C. A. III, and D. W. Burgess, 1993: Tornadoes and tornadic storms: Areview of conceptual models. The Tornado: Its Structure, Dynamics, Prediction andHazards (Geophys. Monogr. 79), C. Church, Ed., Amer. Geophys. Union, pp.161-172.
Doswell, C. A. III, S.J. Weiss and R.H. Johns, 1993: Tornado forecasting: A review.The Tornado: Its Structure, Dynamics, Prediction and Hazards (Geophys. Monogr.79), C. Church, Ed., Amer. Geophys. Union, pp. 557-571.
Doswell, C. A. III, H. E. Brooks, and R. A. Maddox, 1996: Flash-flood forecasting:An ingredients-based methodology. Weather Forecasting, 11, pp. 360-381.
SEVERE LOCAL STORMS
27
Doswell, C. A. III, C. Ramis, R. Romero, and S. Alonso, 1998: A diagnostic studyof three heavy precipitation episodes in the western Mediterranean region.Weather Forecasting, 13, pp. 102–124.
Doswell, C. A. III, A. R. Moller, and H. E. Brooks, 1999: Storm spotting and publicawareness since the first tornado forecasts of 1948. Weather Forecasting, 14, pp.544-557.
Dotzek, N., R. Hannesen, K. D. Beheng, and R. E. Peterson, 1998: Tornadoes inGermany, Austria, and Switzerland. Preprints, 19th Conf. on Severe LocalStorms (Minneapolis, Minnesota), American Meteorological Society, pp. 93-96.
Duke, J. W., and J. A. Rogash, 1992: Multiscale review of the development andearly evolution of the 9 April 1991 derecho. Weather Forecasting, 7, pp. 623-635.
Emanuel, K., D. Raymond, A. Betts, L. Bosart, C. Bretherton, K. Droegemeier, B.Farrell, J. M. Fritsch, R. Houze, M. LeMone, D. Lilly, R. Rotunno, M. Shapiro, R.Smith, and A. Thorpe, 1995: Report of the first prospectus development teamon the U. S. Weather Research Program to NOAA and the NSF. Bulletin of theAmerican Meteorological Society, 76, pp. 1194-1208.
Evans, J. S., 1998: An examination of observed shear profiles associated with long-lived bow echoes. Preprints, 19th Conf. on Severe Local Storms (Minneapolis,Minnesota), American Meteorological Society, pp. 30-33.
Fankhauser, J.C., 1988: Estimates of thunderstorm precipitation efficiency fromfield measurements in CCOPE. Monthly Weather Review, 116, pp. 663-684.
Fawbush, E. J., and R. C. Miller, 1953: A method for forecasting hailstone size atthe earth’s surface. Bulletin of the American Meteorological Society, 34, pp. 235-244.
Foster, D. S., and F. C. Bates, 1956: A hail size forecasting technique. Bulletin of theAmerican Meteorological Society, 35, pp. 135-140.
Fujita, T.T., 1972: Estimate of maximum wind speeds of tornadoes in southernmostRockies. SMRP Res. Paper No. 105, University Of Chicago.
Fujita, T.T., 1973: Tornadoes around the world. Weatherwise, 26, pp. 56-62, 78-83.Fujita, T.T., 1978: Manual of downburst identification for project NIMROD. Satellite
and Mesometeorology Res. Paper No. 156, Dept. of Geophys. Sci., Univ. ofChicago, 104 pp.
Fujita, T.T., and H.R. Byers, 1977: Spearhead echo and downburst in the crash ofan airliner. Monthly Weather Review, 105, pp. 129-146.
Fujita, T.T., and F. Caracena, 1977: An analysis of three weather-related aircraftaccidents. Bulletin of the American Meteorological Society, 58, pp. 1164-1181.
Funk, T. W., 1991: Forecasting techniques utilized by the forecast branch of theNational Meteorological Center during a major convective rainfall event.Weather Forecasting, 6, pp. 548-564.
Hanstrum, B. N., G. A. Mills, and A. Watson, 1998: Australian cool season torna-does. Part I: Synoptic climatology. Preprints, 19th Conf. on Severe Local Storms(Minneapolis, Minnesota), American Meteorological Society, pp. 97-100.
Houze, R. A., Jr., W. Schmid, R. G. Fovell, and H.-H. Schiesser, 1993: Hailstorms inSwitzerland: Left movers, right movers, and false hooks. Monthly WeatherReview, 121, 3345-3370.
Jameson, A.R., 1991: A comparison of microwave techniques for measuring rain-fall. Journal of Applied Meteorology, 30, pp. 32-54.
Johns, R.H., 1993: Meteorological conditions associated with bow echo develop-ment in convective storms. Weather Forecasting, 8, pp. 294-299.
Johns, R.H., and W.D. Hirt, 1987: Derechos: Widespread convectively inducedwindstorms. Weather Forecasting, 2, pp. 32-49.
Johns, R.H., K. W. Howard, and R. A. Maddox, 1990: Conditions associated withlong-lived derechoes–An examination of the large-scale environment.Preprints, 16th Conf. on Severe Local Storms (Kananaskis Park, Alberta,Canada), American Meteorological Society, pp. 408-412.
Johns, R.H., and C.A. Doswell III, 1992: Severe local storms forecasting. WeatherForecasting, 7, pp. 588-612.
Johns, R.H., J. M. Davies, and P. W. Leftwich, 1993: Some wind and instabilityparameters associated with strong and violent tornadoes. 2. Variations in the
WMO/UNESCO SUB-FORUM ON NATURAL DISASTER REDUCTION
28
combinations of wind and instability parameters. The Tornado: Its Structure,Dynamics, Prediction and Hazards (Geophys. Monogr. 79), C. Church, Ed., Amer.Geophys. Union, pp. 583-590.
Kamburova, P.L., and F.H. Ludlam, 1966: Rainfall evaporation in thunderstormdowndraughts. Quarterly Journal of the Royal Meteorological Society, 92, pp. 510-518.
Kelly, D.L., J.T. Schaefer, R.P. McNulty, C.A. Doswell III and R.F. Abbey, Jr., 1979:An augmented tornado climatology. Monthly Weather Review, 106, pp. 1172-1183.
Kelly, D.L., J.T. Schaefer, and C.A. Doswell III, 1985: The climatology of non-tornadic severe thunderstorm events in the United States. Monthly WeatherReview, 113, pp. 1997-2014.
Li, J., Y.-L. Chen, and W.-C. Lee, 1997: Analysis of a heavy rainfall event duringTAMEX. Monthly Weather Review, 125, pp. 1060–1082.
Lilly, D. K., 1982: The development and maintenance of rotation in convectivestorms. Intense Atmospheric Vortices. L. Bengtsson and J. Lighthill, Eds.,Springer-Verlag, pp. 149-160.
Maddox, R.A., L.R. Hoxit, C.F. Chappell, and F. Caracena, 1978: Comparison ofmeteorological aspects of the Big Thompson and Rapid City flash floods.Monthly Weather Review, 106, pp. 375-389.
Maddox, R.A., C.F. Chappell and L.R. Hoxit, 1979: Synoptic and meso-alphaaspects of flash flood events. Bulletin of the American Meteorological Society, 60,pp. 115-123.
Maddox, R.A., and W. Dietrich, 1981: Synoptic conditions associated with thesimultaneous occurrence of significant thunderstorms and flash floods.Preprints, 4th Conf. on Hydrometeorology (Reno, Nevada), AmericanMeteorological Society, pp. 181-187.
McCaul, E. W., Jr., 1993: Observations and simulations of hurricane-spawnedtornadic storms. The Tornado: Its Structure, Dynamics, Prediction and Hazards(Geophys. Monogr. 79), C. Church, Ed., Amer. Geophys. Union, pp. 119-142.
McCaul, E. W., Jr. and M. L. Weisman, 1996: Simulations of shallow supercellstorms in landfalling hurricane environments. Monthly Weather Review, 124,pp. 408-429.
Mead, C. M., 1997: The discrimination between tornadic and nontornadic super-cell environments: A forecasting challenge in the southern United States.Weather Forecasting, 12, pp. 379–387.
Miller, R. C., 1972: Notes on Analysis and Severe-Storm Forecasting Procedures of theAir Force Global Weather Central. Tech. Report 200 (REV), Air Weather Service(MAC), United States Air Force.
Moller, A.R., C.A. Doswell III, and R. Przybylinski, 1990: High-precipitation super-cells: A conceptual model and documentation. Preprints, 16th Conf. on SevereLocal Storms (Kananaskis Park, Alberta, Canada), American MeteorologicalSociety, pp. 52-57.
Moller, A.R., C.A. Doswell III, M. P. Foster, and G. R. Woodall, 1994: The opera-tional recognition of supercell thunderstorm environments and stormstructure. Weather Forecasting, 9, pp. 327-347.
Moore, J. T., and J. P. Pino, 1990: An interactive method for estimating maximumhailstone size from forecast soundings. Weather Forecasting, 5, pp. 508-525.
Munich Re, 1984: Hailstorm. Münchener Rückversicherungs-Gesellschaft,Munich, Germany, 56 pp.
Petersen, W. A., L. D. Carey, S. A. Rutledge, J. C. Knievel, R. H. Johnson, N. J.Doesken, T. B. McKee, T. Vonder Haar, and J. F. Weaver, 1999: Mesoscale andradar observations of the Fort Collins flash flood of 28 July 1997. Bulletin of theAmerican Meteorological Society, 80, pp. 191–216.
Peterson, R. E., 1982: Tornadic activity in Europe: The last half-century. Preprints,12th Conf. Severe Local Storms (San Antonio, Texas), American MeteorologicalSociety, pp. 63-66.
SEVERE LOCAL STORMS
29
Prosser, N. E., and D. S. Foster, 1966: Upper air sounding analysis by use of an elec-tronic computer. Journal of Applied Meteorology, 5, pp. 296-300.
Przybylinski, R. W., 1995: The bow echo: Observations, numerical simulations,and severe weather detection methods. Weather Forecasting, 10, pp. 203-218.
Rasmussen, E. N., and D. O. Blanchard, 1998: A baseline climatology of sounding-derived supercell and tornado forecast parameters. Weather Forecasting, 13, pp.1148–1164.
Ryzhkov, A., D. S. Zrnic, and D. Atlas, 1997: Polarimetrically runed R(Z) relationsand comparison of radar rainfall methods. Journal of Applied Meteorology, 36,pp. 340–349.
Rotunno, R., 1993: Supercell thunderstorm modelling and theory. The Tornado: ItsStructure, Dynamics, Prediction and Hazards (Geophys. Monogr. 79), C. Church,Ed., Amer. Geophys. Union, pp. 57-73.
Schaefer, J.T., and R.L. Livingston, 1988: The typical structure of tornado proxim-ity soundings. Journal of Geophysical Research, 93, pp. 5351-5364.
Schwartz, B.E., C.F. Chappell, W.E. Togstead, and X.-P. Zhong, 1990: TheMinneapolis flash flood: Meteorological analysis and operational response.Weather Forecasting, 5, pp. 3-21.
Sénési, S., P. Bougeault, J.-L. Chèze, P. Cosentino, and R.-M. Thepenier, 1996: TheVaison-La-Romaine flash flood: Mesoscale analysis and predictability issues.Weather Forecasting, 11, pp. 417-442.
Smith, B. E., 1993: The Concordia, Kansas downburst of 8 July 1992: A casestudy of an unusually long-lived windstorm. Preprints, 17th Conf. SevereLocal Storms (St. Louis, Missouri), American Meteorological Society, pp. 588-592.
Spencer, P. L., and D. J. Stensrud, 1998: Simulating flash flood events: Importanceof the subgrid representation of convection. Monthly Weather Review, 126, pp.2884–2912.
Stensrud, D. J., J. V. Cortinas Jr., and H. E. Brooks, 1997: Discriminating betweentornadic and nontornadic thunderstorms using mesoscale model output.Weather Forecasting, 12, pp. 613-632.
Thompson, R. L., 1998: Eta model storm-relative winds associated with tornadicand nontornadic supercells. Weather Forecasting, 13, pp. 125–137.
van Everdingen, E., 1925: The cyclone-like whirlwinds of August 10, 1925. Proc.,Royal Acad. of Amsterdam Section of the Sci., 25, pp. 871-889.
Vieux, B. E., and P. B. Bedient, 1998: Estimation of rainfall for flood predictionfrom WSR-88D reflectivity: A case study, 17–18 October 1994. WeatherForecasting, 13, pp. 407–415
Wakimoto, R.M., 1985: Forecasting dry microburst activity over the high plains.Monthly Weather Review, 113, pp. 1131-1143.
Wakimoto, R.M., 1998: Convectively driven high wind events. Preprints, 19thConf. on Severe Local Storms (Minneapolis, Minnesota), AmericanMeteorological Society, 435.
Wakimoto, R.M., and J.W. Wilson, 1989: Non-supercell tornadoes. MonthlyWeather Review, 117, pp. 1113-1140.
Wegener, A., 1917: Wind- und Wasserhosen in Europa. Friedr. Vieweg und Sohn,Braunschweig, 301 pp. (In German)
Weisman, M.L., 1993: The genesis of severe, long-lived bow echoes. Journal ofAtmospheric Science, 50, pp. 645-670.
Weisman, M.L., and J.B. Klemp, 1982: The dependence of numerically simulatedconvective storms on vertical wind shear and buoyancy. Monthly WeatherReview, 110, pp. 504-520.
Weisman, M.L., and J.B. Klemp, 1984: The structure and classification of numer-ically simulated convective storms in directionally varying wind shears.Monthly Weather Review, 112, pp. 2479-2498.
Weiss, S. J., 1996: Operational evaluation of the mesoeta model for the predictionof severe local storms. Preprints, 18th Conf. on Severe Local Storms (SanFrancisco, California), American Meteorological Society, pp. 367-371.
WMO/UNESCO SUB-FORUM ON NATURAL DISASTER REDUCTION
30

Weiss, S. J., G. S. Manikin, and K. E. Mitchell, 1998: Eta model forecasts of low-level moisture return from the Gulf of Mexico during the cool season. Preprints,19th Conf. on Severe Local Storms (Minneapolis, Minnesota), AmericanMeteorological Society, pp. 673-676.
Zixiu, X., W. Pengyun, and L. Xuefang, 1993: Tornadoes of China. The Tornado:Its Structure, Dynamics, Prediction and Hazards (Geophys. Monogr. 79), C.Church, Ed., Amer. Geophys. Union, pp. 435-444.
Zrnic, D.S., V.N. Bringi, N. Balakrishnan, K. Aydin, V. Chandrasekar, and J. Hubert,1993: Polarimetric measurements in a severe hailstorm. Monthly WeatherReview, 121, pp. 2223-2238.
SEVERE LOCAL STORMS
31
DROUGHT MONITORING AND PREDICTION FOR DISASTER PREPAREDNESS
By L.A.Ogallo; Department of Meteorology, University of Nairobi
The overall theme of the forum is to address the roles of science and technologyin natural disaster reduction. This review will be devoted to drought earlywarning and preparedness. The review will highlight, among others, what wemust know in order to reduce the impacts of droughts; the current state, achieve-ments and limitations of science and technology; and a way forward into the nextcentury. The first part addresses the various definitions that have been used forthe term drought. The devastating socio-economic impacts of droughts are high-lighted in the second section, with special reference to Africa where drought hasbeen associated with many socio-economic miseries. Section 2 also highlights thepotential use of drought monitoring and prediction products in early warningand reduction of the negative drought impacts.
Recent drought monitoring and prediction efforts are addressed in sectionthree, with special reference to the use of El Niño and the Southern Oscillation(ENSO). Section 3 further highlights the need to take full advantage of any exist-ing information regarding the climatology of past droughts. This requires policiesthat will ensure optimum utilization of any positive water stress including theavailability of adequate water resources during the normal and wet rainfall yearsin planning for the drought years.
Specific success stories regarding the use of ENSO indicators in droughtmonitoring and prediction over some parts of the tropics are also presented insection 3, with special reference to the recent worldwide regional climate outlookfora. The last part of this review is, however, devoted to the limitations of currentdrought monitoring and prediction science and technology. Enhanced sectoraldemands and challenges of drought monitoring/prediction science andtechnology in drought early warning and disaster preparedness during the nextcentury are also addressed in the last part of the review.
Drought is quite different from many other natural disasters, as unlike manyothers that have immediate impacts such as flash floods, drought creeps veryslowly and the impacts are cumulative. Yet the impacts are sometimes moredevastating (Table 1). It is, moreover, sometimes very difficult to accuratelydetect the onset of droughts, and some relief efforts often wait for the first victimsbefore initiating relief emergencies. In general terms, drought may be consideredas the situation where water demand for any particular system use significantlyexceeds water supply from the traditional water sources for the system. Due tosignificant differences in the levels of water requirements by the different wateruse systems, various definitions have been presented for the term drought. Thesedefinitions range across hydrological, agricultural, meteorological and manyother sectoral water uses (Ogallo, 1993). Precipitation is the major factor thatoften determines water availability from most natural sources of water, includingwater that may be available from underground aquifers, rivers, lakes, etc.Meteorological drought is, therefore, often presented simply as the situationwhen precipitation received at any location is significantly below the normalexpectation for that specific location. Various measures of central tendency havebeen used to quantify the normal precipitation expectation at specific locations.These have included arithmetic mean, quartile / tercile / decile / percentile limits,among many other measures.
Too much and too little precipitation (floods and droughts) are often associ-ated with various socio-economic disasters. Some of these impacts are highlightedin the second part of this review.
1.DROUGHT DEFINITIONS
ABSTRACT
32
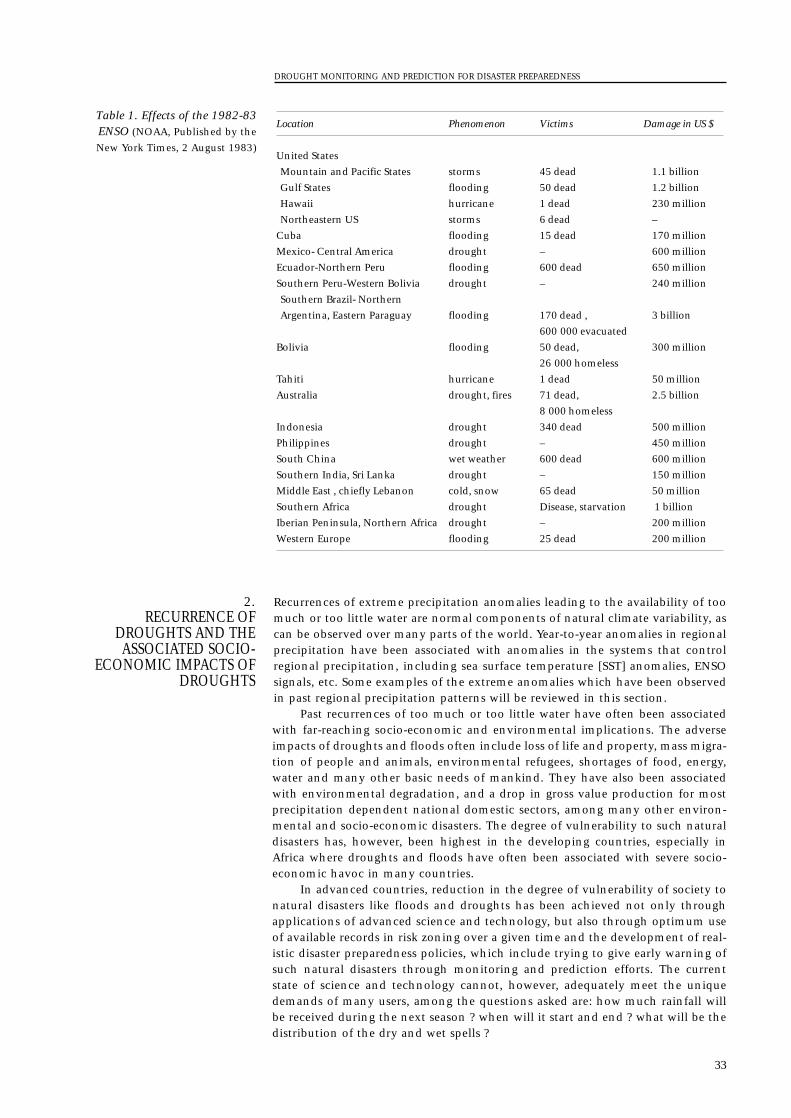
Recurrences of extreme precipitation anomalies leading to the availability of toomuch or too little water are normal components of natural climate variability, ascan be observed over many parts of the world. Year-to-year anomalies in regionalprecipitation have been associated with anomalies in the systems that controlregional precipitation, including sea surface temperature [SST] anomalies, ENSOsignals, etc. Some examples of the extreme anomalies which have been observedin past regional precipitation patterns will be reviewed in this section.
Past recurrences of too much or too little water have often been associatedwith far-reaching socio-economic and environmental implications. The adverseimpacts of droughts and floods often include loss of life and property, mass migra-tion of people and animals, environmental refugees, shortages of food, energy,water and many other basic needs of mankind. They have also been associatedwith environmental degradation, and a drop in gross value production for mostprecipitation dependent national domestic sectors, among many other environ-mental and socio-economic disasters. The degree of vulnerability to such naturaldisasters has, however, been highest in the developing countries, especially inAfrica where droughts and floods have often been associated with severe socio-economic havoc in many countries.
In advanced countries, reduction in the degree of vulnerability of society tonatural disasters like floods and droughts has been achieved not only throughapplications of advanced science and technology, but also through optimum useof available records in risk zoning over a given time and the development of real-istic disaster preparedness policies, which include trying to give early warning ofsuch natural disasters through monitoring and prediction efforts. The currentstate of science and technology cannot, however, adequately meet the uniquedemands of many users, among the questions asked are: how much rainfall willbe received during the next season ? when will it start and end ? what will be thedistribution of the dry and wet spells ?
2.RECURRENCE OF
DROUGHTS AND THEASSOCIATED SOCIO-
ECONOMIC IMPACTS OFDROUGHTS
Location Phenomenon Victims Damage in US $
United States
Mountain and Pacific States storms 45 dead 1.1 billion
Gulf States flooding 50 dead 1.2 billion
Hawaii hurricane 1 dead 230 million
Northeastern US storms 6 dead –
Cuba flooding 15 dead 170 million
Mexico- Central America drought – 600 million
Ecuador-Northern Peru flooding 600 dead 650 million
Southern Peru-Western Bolivia drought – 240 million
Southern Brazil- Northern
Argentina, Eastern Paraguay flooding 170 dead , 3 billion
600 000 evacuated
Bolivia flooding 50 dead, 300 million
26 000 homeless
Tahiti hurricane 1 dead 50 million
Australia drought, fires 71 dead, 2.5 billion
8 000 homeless
Indonesia drought 340 dead 500 million
Philippines drought – 450 million
South China wet weather 600 dead 600 million
Southern India, Sri Lanka drought – 150 million
Middle East , chiefly Lebanon cold, snow 65 dead 50 million
Southern Africa drought Disease, starvation 1 billion
Iberian Peninsula, Northern Africa drought – 200 million
Western Europe flooding 25 dead 200 million
Table 1. Effects of the 1982-83ENSO (NOAA, Published by the
New York Times, 2 August 1983)
DROUGHT MONITORING AND PREDICTION FOR DISASTER PREPAREDNESS
33
Historical records are crucial in the zoning of drought risks and the general assess-ment of the vulnerability of any precipitation dependent socio-economic activityto various levels of drought stress. Such records are also needed in order to studythe complex linkages between water stress and specific socio-economic activities.Furthermore, historical records can provide information about past droughts andhow previous generations coped with them. Important lessons could be learntfrom such coping strategies. It should also be noted that past data are fundamen-tal in the development of sound disaster preparedness policies. Several databasesare now available, these include re-analysis data, proxy climate data, dataobtained from special research programmes (e.g., TOGA in 1985-94) and remotesensing data. The importance of real-time/ near real-time monitoring of thedrought conditions will also be highlighted in this section, including initiativesby WWW, GCOS, GOOS, GTOS, etc.
Past records have shown that droughts are recurrent in all parts of the world.The drought impacts, however, vary significantly in both space and time. In someyears, new drought stress records have been set. The most unique drought has,however, been observed over Sahel Africa where a significant decrease in rainfalltrends has been observed at many locations since the late 1960s. The region hasstrong SST and ENSO variability signals. Linkages between ENSO and droughtshave been subjects of many recent studies. Many such studies have also examinedthe existence of any significant changes in the traditional space-time patterns ofthe extreme precipitation events like droughts and floods (IPCC, 1995).
As has been highlighted in the previous sections, drought creeps in slowlyand the impacts are generally cumulative. Therefore, the best approach to droughtdisaster preparedness would be through monitoring and early warning of anyimpending drought conditions. This would require timely availability of accurateand high-quality drought products. The last part of the review will address thecurrent state of drought monitoring and prediction science and technology, withspecial reference to the recent use of ENSO and SST-related predictors over partsof global tropics. Some success stories regarding drought early warning will alsobe included in the review based on the recent worldwide climate outlook forawhich have been organized by WMO/CLIPS, IRI, NOAA/OGP, national/regionalclimate centres, together with many other partners.
With the economic challenges of the next century, including globalization,together with the rapid growth in global population levels, increased number ofhuman settlements and expensive investments and structures would be expectedin areas that are more vulnerable to natural disasters. The level of environmentaldegradation is also expected to increase, together with the demands for basicneeds like food, water, settlement, energy, etc. This will require enhanced andintegrated applications of climate information and prediction services. Key chal-lenges to drought early warning in the next century will be highlighted in thefinal part of this review, including the required levels operational of seasonalclimate prediction science and technology. Such challenges include data relatedproblems, the capacity of the developing countries (hardware, software, andskilled multidisciplinary human resources) to monitor, process data/informationand timely predict/early warning of the impending disasters, research to under-stand the complex linkages between water stress and various precipitationdependent socio-economic sectors, transfer of appropriate technology, enhancedseasonal prediction capacity including the ability to downscale prediction prod-ucts to sectoral application levels, the education of the public and sectoral usersabout early warning information and products, networking and timely exchangeof information/products, closer interface between producers of climate predictionproducts and the specific sectoral users, realistic and integrated disaster prepared-ness policies, availability of resources, etc.
IPCC, 1995: Climate Change 1995 - The Science of Climate Change. Contribution ofWorking Group 1 to the Second Assessment Report of the Intergovernmental Panel onClimate Change. Cambridge University Press.
REFERENCES
4.SECTORAL DEMANDSAND CHALLENGES OF
DROUGHT MONITORING/PREDICTION SCIENCE
AND TECHNOLOGY INTHE NEXT CENTURY
3.DROUGHT MONITORING
AND PREDICTION
WMO/UNESCO SUB-FORUM ON NATURAL DISASTER REDUCTION
34

Ogallo L.A., 1993: Climate variations, drought and desertification (Second Edition).WMO No. 653, World Meteorological Organization, Geneva, Switzerland. pp.45.
DROUGHT MONITORING AND PREDICTION FOR DISASTER PREPAREDNESS
35
METEOROLOGY AS AN AID IN FIGHTING AND PREVENTING FOREST FIRES
By Bernard Sol; Météo-France, Bureau Etudes et Développement, Direction interrégionale sud-est
Techniques already exist for estimating the meteorological risk of forest fire. Thesetake the form of indices based on measurements and forecasts of meteorologicalparameters and, for certain types of vegetation, on remote sensing. Provision ofsuch information to forest fire agencies requires only modest technical efforts bymeteorological services, where effective and reliable meteorological observationnetworks exist. Close cooperation between meteorological services and agenciesestablished to prevent and fight fire is the key to effective fire prevention andresponse.
No region of the world is unaffected by forest fires. Forests were catching fire evenbefore humans appeared on the scene and nature took its time in restoring theplant cover. These fires were mainly caused by lightning and must have affectedenormous areas. Nowadays, however, most fires are started by human activities,though lightning is still the primary cause in some regions. Fire is, for example,one of the techniques used to promote the growth of crops or pastures. Undercontrolled conditions, it can also be used in forest management though, sadly, itis sometimes used for other purposes.
Reducing the overall number of forest fire outbreaks is a non-meteorologicalchallenge and is, consequently, beyond the scope of the present discussion. Thispresentation focuses, instead, on techniques for determining the risk of a firespreading. The paper begins with an overview of the theory relating to the spreadof forest fires. This is followed by a description of the physical phenomenainvolved, in order to distinguish clearly between the various methods that applyto different types of plant cover and climate. Finally, operational techniques arediscussed which can help meteorological services to establish effective coopera-tion with fire prevention and fire fighting agencies.
The following three components are needed if a fire is to spread (Trabaud, 1989):
• Fuel (plant cover), which must be sufficiently dry;• Oxygen (supplied by the wind), to promote combustion;• A local heat source (lightning, match, etc.), to act as a catalyst.
Generally speaking, plant cover can be divided into a number of layers based onthe height of the plants concerned:
• A litter layer made up of dead plant debris at ground level;• A herbaceous layer comprising herbaceous plants whose state depends on climatic
conditions since their roots draw water only from the surface layer. Such plantsare green during wet periods and when in active growth but dry out where theystand after reaching maturity and during dry periods;
• A shrub layer composed of plants which contain a greater amount of inflamma-ble material and do not dry out completely. They can grow to a height of a fewmetres;
• An arboreal layer made up of trees.In some regions (e.g. large forests), a layer of humus (i.e. decomposed plant
material lying under the litter layer) must also be taken into account as it can bean important vector in the spread of fires. The physical processes governing thespread of ground fires are peculiar to such fires. These spread slowly, give off littlesmoke, are very difficult to extinguish and often follow surface fires.
2.1LAYERS OF PLANT COVER
2.SPREADING OF FIRES
1.INTRODUCTION
ABSTRACT
36
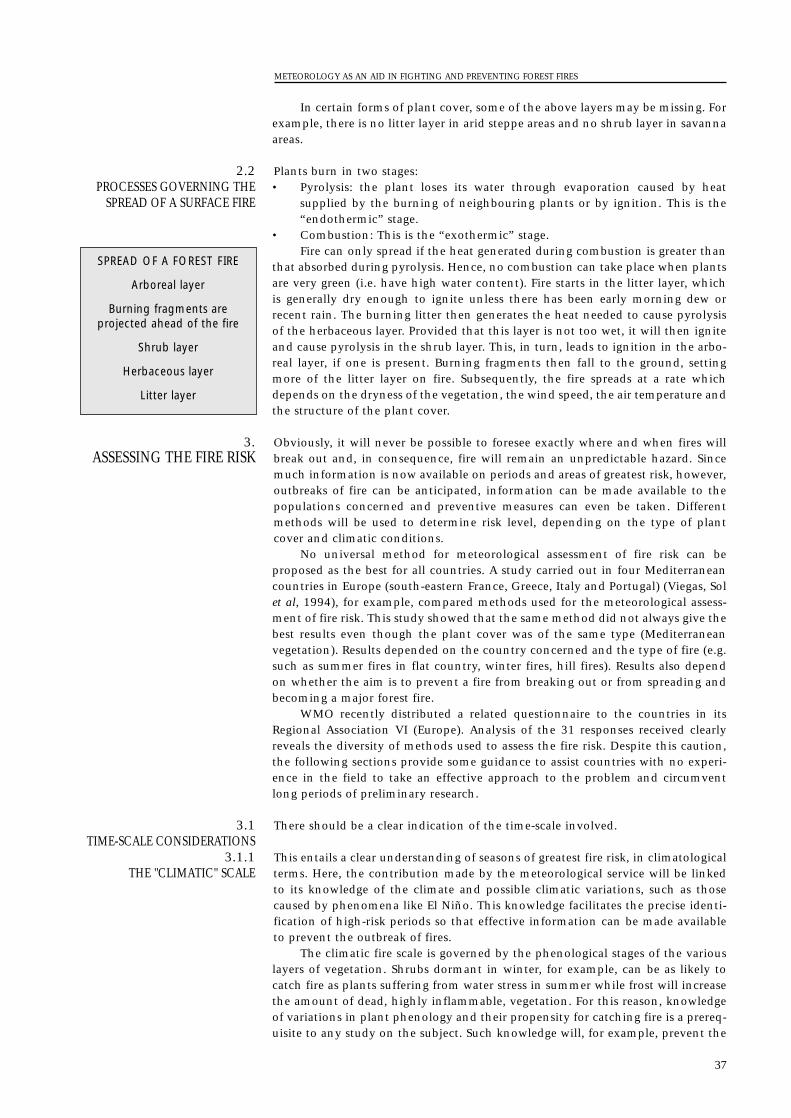
In certain forms of plant cover, some of the above layers may be missing. Forexample, there is no litter layer in arid steppe areas and no shrub layer in savannaareas.
Plants burn in two stages:• Pyrolysis: the plant loses its water through evaporation caused by heat
supplied by the burning of neighbouring plants or by ignition. This is the“endothermic” stage.
• Combustion: This is the “exothermic” stage.Fire can only spread if the heat generated during combustion is greater than
that absorbed during pyrolysis. Hence, no combustion can take place when plantsare very green (i.e. have high water content). Fire starts in the litter layer, whichis generally dry enough to ignite unless there has been early morning dew orrecent rain. The burning litter then generates the heat needed to cause pyrolysisof the herbaceous layer. Provided that this layer is not too wet, it will then igniteand cause pyrolysis in the shrub layer. This, in turn, leads to ignition in the arbo-real layer, if one is present. Burning fragments then fall to the ground, settingmore of the litter layer on fire. Subsequently, the fire spreads at a rate whichdepends on the dryness of the vegetation, the wind speed, the air temperature andthe structure of the plant cover.
Obviously, it will never be possible to foresee exactly where and when fires willbreak out and, in consequence, fire will remain an unpredictable hazard. Sincemuch information is now available on periods and areas of greatest risk, however,outbreaks of fire can be anticipated, information can be made available to thepopulations concerned and preventive measures can even be taken. Differentmethods will be used to determine risk level, depending on the type of plantcover and climatic conditions.
No universal method for meteorological assessment of fire risk can beproposed as the best for all countries. A study carried out in four Mediterraneancountries in Europe (south-eastern France, Greece, Italy and Portugal) (Viegas, Solet al, 1994), for example, compared methods used for the meteorological assess-ment of fire risk. This study showed that the same method did not always give thebest results even though the plant cover was of the same type (Mediterraneanvegetation). Results depended on the country concerned and the type of fire (e.g.such as summer fires in flat country, winter fires, hill fires). Results also dependon whether the aim is to prevent a fire from breaking out or from spreading andbecoming a major forest fire.
WMO recently distributed a related questionnaire to the countries in itsRegional Association VI (Europe). Analysis of the 31 responses received clearlyreveals the diversity of methods used to assess the fire risk. Despite this caution,the following sections provide some guidance to assist countries with no experi-ence in the field to take an effective approach to the problem and circumventlong periods of preliminary research.
There should be a clear indication of the time-scale involved.
This entails a clear understanding of seasons of greatest fire risk, in climatologicalterms. Here, the contribution made by the meteorological service will be linkedto its knowledge of the climate and possible climatic variations, such as thosecaused by phenomena like El Niño. This knowledge facilitates the precise identi-fication of high-risk periods so that effective information can be made availableto prevent the outbreak of fires.
The climatic fire scale is governed by the phenological stages of the variouslayers of vegetation. Shrubs dormant in winter, for example, can be as likely tocatch fire as plants suffering from water stress in summer while frost will increasethe amount of dead, highly inflammable, vegetation. For this reason, knowledgeof variations in plant phenology and their propensity for catching fire is a prereq-uisite to any study on the subject. Such knowledge will, for example, prevent the
3.1TIME-SCALE CONSIDERATIONS
3.1.1THE "CLIMATIC" SCALE
3. ASSESSING THE FIRE RISK
2.2PROCESSES GOVERNING THE
SPREAD OF A SURFACE FIRE
METEOROLOGY AS AN AID IN FIGHTING AND PREVENTING FOREST FIRES
37
SPREAD OF A FOREST FIRE
Arboreal layer
Burning fragments areprojected ahead of the fire
Shrub layer
Herbaceous layer
Litter layer
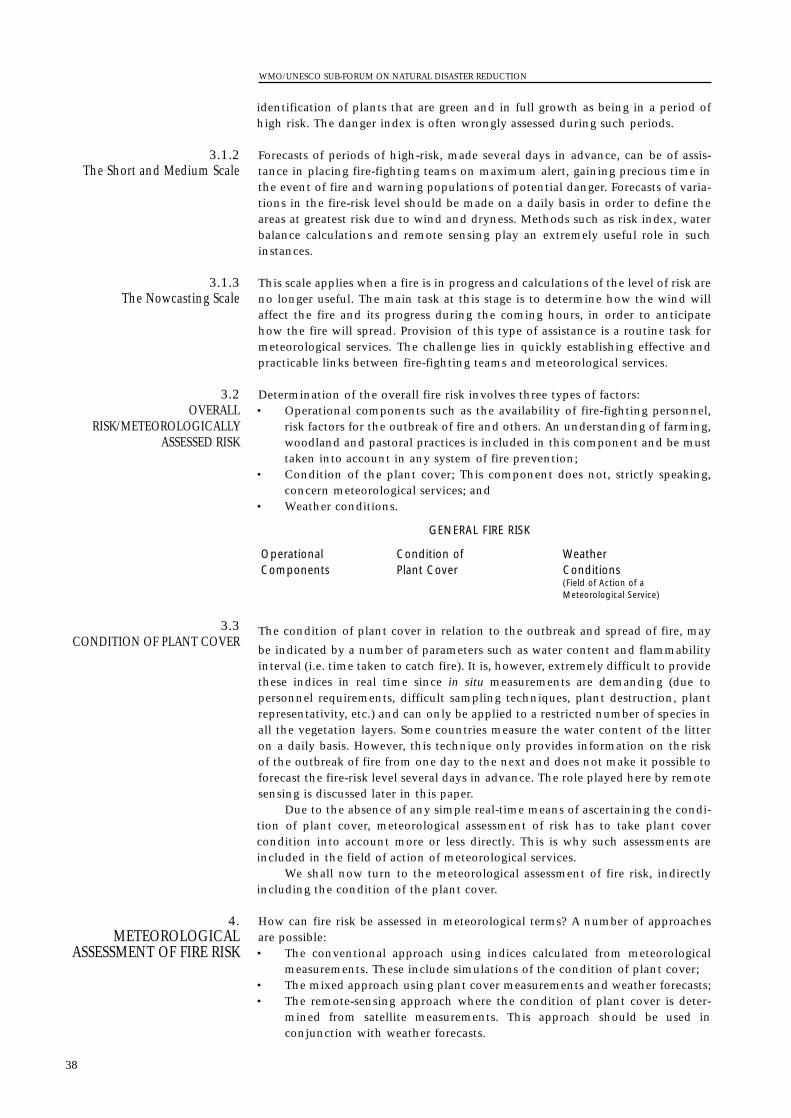
identification of plants that are green and in full growth as being in a period ofhigh risk. The danger index is often wrongly assessed during such periods.
Forecasts of periods of high-risk, made several days in advance, can be of assis-tance in placing fire-fighting teams on maximum alert, gaining precious time inthe event of fire and warning populations of potential danger. Forecasts of varia-tions in the fire-risk level should be made on a daily basis in order to define theareas at greatest risk due to wind and dryness. Methods such as risk index, waterbalance calculations and remote sensing play an extremely useful role in suchinstances.
This scale applies when a fire is in progress and calculations of the level of risk areno longer useful. The main task at this stage is to determine how the wind willaffect the fire and its progress during the coming hours, in order to anticipatehow the fire will spread. Provision of this type of assistance is a routine task formeteorological services. The challenge lies in quickly establishing effective andpracticable links between fire-fighting teams and meteorological services.
Determination of the overall fire risk involves three types of factors:• Operational components such as the availability of fire-fighting personnel,
risk factors for the outbreak of fire and others. An understanding of farming,woodland and pastoral practices is included in this component and be musttaken into account in any system of fire prevention;
• Condition of the plant cover; This component does not, strictly speaking,concern meteorological services; and
• Weather conditions.
The condition of plant cover in relation to the outbreak and spread of fire, may
be indicated by a number of parameters such as water content and flammabilityinterval (i.e. time taken to catch fire). It is, however, extremely difficult to providethese indices in real time since in situ measurements are demanding (due topersonnel requirements, difficult sampling techniques, plant destruction, plantrepresentativity, etc.) and can only be applied to a restricted number of species inall the vegetation layers. Some countries measure the water content of the litteron a daily basis. However, this technique only provides information on the riskof the outbreak of fire from one day to the next and does not make it possible toforecast the fire-risk level several days in advance. The role played here by remotesensing is discussed later in this paper.
Due to the absence of any simple real-time means of ascertaining the condi-tion of plant cover, meteorological assessment of risk has to take plant covercondition into account more or less directly. This is why such assessments areincluded in the field of action of meteorological services.
We shall now turn to the meteorological assessment of fire risk, indirectlyincluding the condition of the plant cover.
How can fire risk be assessed in meteorological terms? A number of approachesare possible:• The conventional approach using indices calculated from meteorological
measurements. These include simulations of the condition of plant cover;• The mixed approach using plant cover measurements and weather forecasts;• The remote-sensing approach where the condition of plant cover is deter-
mined from satellite measurements. This approach should be used inconjunction with weather forecasts.
4.METEOROLOGICAL
ASSESSMENT OF FIRE RISK
3.3CONDITION OF PLANT COVER
GENERAL FIRE RISK
Operational Condition of WeatherComponents Plant Cover Conditions
(Field of Action of a Meteorological Service)
3.2OVERALL
RISK/METEOROLOGICALLYASSESSED RISK
3.1.3 The Nowcasting Scale
3.1.2The Short and Medium Scale
WMO/UNESCO SUB-FORUM ON NATURAL DISASTER REDUCTION
38
It is important to note that the meaning of fire-risk indices has to be prop-erly understood (i.e. do they imply risk of outbreak, risk of spread or both?).
Numerous methods have been proposed for determining fire risk levels frommeteorological measurements alone. In the study cited earlier, for example,Viegas and Sol identified over a dozen methods used in the Mediterranean regionof Europe alone.
All methods require virtually the same meteorological parameters:• wind forecast;• air temperature and humidity forecast;• cloud cover forecast or, for some methods, radiation forecast;• measurements of rainfall (accumulated over 24 hours), wind, temperature
and sometimes humidity (at least minimum and maximum).The simplest of these methods only require wind, temperature and humidity
forecasts. Another method combines the wind-speed forecast with the waterbalance derived from measurements of precipitation and mean temperature. Stillothers require information on the number of days that have elapsed since theprevious significant rainfall.
The observed parameters (rainfall, temperature, etc) are used to monitor soilmoisture reservoirs (or Sub-Indices) which represent the amount of water avail-able to the plant cover. The Canadian method (Van Wagner, 1987) uses threeSub-Indices for this purpose; one of very low inertia which relates to the watercontent in the litter and small, dead plants (important for the outbreak of fire)and two others known as the Dryness Index and the Humus Index, which relateto upper layers (important for the spread of fire). While these reservoirs (or sub-indices) are clearly less useful than measurements taken directly from the plantcover, they can be calculated from simple meteorological parameters. Generallyspeaking, the simplest methods – those based on the temperature and humidityof the litter cover and on wind speed – are used to calculate the risk of outbreaksof fire while methods that investigate the reservoirs are used to predict the spreadof fire.
It is important to note that reliable and continuous measurements ofmeteorological parameters, taken every day throughout the year, are absolutelyessential to the calculation of sub-indices. Any interruption in observations willbreak the calculation chain. Gaps in the information are, however, acceptableduring some periods of the year such as the rainy season or the early part of thefire-risk season when reservoirs are saturated with water. The availability of real-time measurements will sometimes determine which method is to be used. Ifhumidity measurements and forecasts are not available, for example, a methodwill have to be selected that does not rely on these measurements.
Meteorological measurements used in the calculation of sub-indices representingthe condition of the plant cover need not necessarily be taken in woodland oramong the plant cover under direct threat. Measurements taken nearby will serveperfectly well, even those from an airport site. It is essential, however, that thesame meteorological stations be used each time so that the climatology of theIndices can be determined, Indices can be calibrated against fires and subsequentcomparisons of risk levels can be undertaken on a daily or annual basis. In addi-tion, measurements taken in woodland do not provide a good assessment of thewind, which is an essential component in the spread of fires.
The density of the observational network will depend on the variability ofweather conditions in the area concerned. It will be greatest in the case of rainfallmeasurements. In south-eastern France, which is a very mountainous area, stationdensity, for example, averages one every 500 km2. The fine-tuning of forecasts inspatial terms is determined by network density. Expansion of the measurementnetwork to improve assessment of fire risk will teach meteorologists to recognizeand thus to forecast mesoscale phenomena.
4.1.2Location and Density of
Meteorological Measurements
4.1THE CONVENTIONAL
APPROACH:METEOROLOGICAL INDICES
OF FIRE RISK4.1.1
Parameters Required
METEOROLOGY AS AN AID IN FIGHTING AND PREVENTING FOREST FIRES
39
As explained earlier, the choice of method will depend on which meteorologicalcomponents are available and there is no need to create a new method to suiteach country. It is suggested, however, that the Canadian method, the Fire-Weather Index (Van Wagner, 1987), be tried first. Even though it was developedin Canadian forests, this method gave the most consistent results inMediterranean plant cover (garrigue, maquis, broad-leaf and coniferous forest)during the comparative study mentioned earlier. Its only disadvantage is that itrequires humidity measurements and forecasts and computer facilities.
This approach requires considerable infrastructure (Valette, 1994). Samples oflitter or living plants are collected by forestry staff who then weigh and kiln them.Only then can these samples be used, in combination with meteorological meas-urements and weather forecasts, for the meteorological assessment of fire-risk.The quality of the sub-indices indicating the condition of the plant cover is neces-sarily of the same order as the accuracy and representativity of the samples.
The results obtained from the mixed approach are only valid for one day.Thus, its capability for advance warning is very limited. For this reason, we do notrecommend this approach if a reliable network of meteorological measurementsis available.
Many articles in the scientific literature outline the virtues of remote sensing forthe prevention or forecasting of forest fires (Deshayes et al, 1998). This approachuses easily repeatable measurements for direct assessment of the condition of theplant cover. Satellite images provide information on a much smaller scale thanmeteorological or forestry measuring station networks. In addition, the cost ofsuch images is insignificant so long as forecasters restrict themselves to imageswith a resolution in the order of 1km2, quite sufficient for the purpose at hand.Furthermore, satellites pass overhead frequently enough to take pictures at inter-vals that meet operational needs.
Current satellites make the Normalized Differential Vegetation Index (NDVI)and the surface temperature available for determining the water balance of plantcover. In theory, stress in the plant cover can be determined by the combinationof these two products. The author, however, takes the somewhat more cautiousview that any attempt to make generalizations covering all plant species shouldbe avoided.
Programmes currently in operation in Europe make use of remote sensing output.Satellites, however, largely see the upper surface of forest areas while the lowerlayers are the main vectors of fire and determine the ferocity of the blaze.Tracking temporal variations in the stress in plant cover during the main fire-riskseason is currently more difficult by remote sensing than it is by using drynesssub-indices determined from meteorological observations. In the Mediterraneanzone, for example, remote sensing clearly shows differences between the end ofthe spring growth period (i.e. the beginning of the fire season) and the period ofmaximum water stress (i.e. later summer, before the onset of the heavy autumnalrains). Fluctuations from one week to the next or during the period just before therainy season are, however, difficult to track. On the other hand, remote sensingprovides improved insight into the spatial distribution of the risk since the gridinterval is well below that of any meteorological network. The task then is toincorporate remote sensing images in a Geographical Information System whichalso makes it possible to combine information on plant cover with operationalcomponents, relief, fire outbreaks and other data.
The latest satellite products, such as those from active on-board sensors thatcan penetrate masking cloud and the various vegetation layers, may shortly offera new operational approach and related research is under way.
Remote sensing provides a clear indication of the onset of the fire-risk season forareas in which the herbaceous layer is the predominant plant cover (i.e. savanna),through a rapid and quite perceptible change in the vegetation index. In this case,
4.3.2Prairies and Savanna
4.3.1Forested Areas
4.3THE REMOTE-SENSING
APPROACH
4.2THE MIXED APPROACH: PLANT
COVER MEASUREMENTS ANDWEATHER FORECASTS
4.1.3Choice of Method
WMO/UNESCO SUB-FORUM ON NATURAL DISASTER REDUCTION
40
remote sensing data are more informative than any sub-index or soil moisturereservoir. The fire-risk season is thus clearly marked and it is possible to monitorthe gradual geographical spread of areas likely to catch fire. In consequence, fireprevention campaigns can be targeted more accurately in both space and time.Furthermore, related indices, such as the Fire Outbreak Index associated with thewind forecast, can be safely applied to areas where the goal is, for example, toburn off grass. It is important to note here that remote sensing has been used forsome time for agricultural activities such as monitoring crop growth and fore-casting harvest dates.
Even though remote sensing gives an improved indication of the water stress ofplant cover, it must still be used in conjunction with weather forecasts to provideadequate warning to services responsible for fire fighting, fire prevention andinforming the public. Traditional meteorological risk indices, familiar to the fire-fighting services of some countries, comprise a combination of meteorologicalforecasts and plant cover sub-indices. The goal now is to add the NormalizedDifferential Vegetation Index (NDVI), surface temperature, and any other param-eters detected by remote sensing to these indices.
Fire-fighting services should be informed, in real time, of lightning strikesobserved during periods when fires are likely (i.e. in terms of the meteorologicalfire-risk indices). Fire may break out some hours after a strike (after smoulderingin the humus layer) even if the thunderstorm is not a dry one.
The parts of the world in which fires are started by lighting would do well toinstall networks for the detection of lightning strikes to ground, if such facilitiesare not already in place. Such detection networks would make it possible todispatch fire-fighting teams to affected locations. A lightning strike detectionnetwork of this kind also has many other meteorological applications.
As previously discussed, meteorological methods for forecasting fire-risk alreadyexist, though some research may be required to adapt them to the meteorologicaland plant conditions prevailing in each country and to the measurementnetworks available. Like any other meteorological product, however, such fore-casts are only useful when applied within an operational framework. Thefollowing sections address this aspect.
A very close relationship and a high-level of trust must be established between themeteorological service and the agencies responsible for fire prevention and firefighting. Meteorological services should work in cooperation with the forestryservice when undertaking studies to determine the best method for determiningfire-risk level. They should, as a minimum, obtain available fire statistics in orderto gain insight into the problems facing the country such as the causes of fires,fire and vegetation types, phenological stages and seasons. They should, more-over, also ascertain whether fires are linked to climatic incidents such as El Niñoevents.
Having acquired knowledge of wind and rainfall patterns, meteorologistswould then be in a position to upgrade observation networks in the area and toprovide input for the calculation of indices. In some instances, the observationnetwork can be upgraded by the forestry service itself. In other countries, theforestry service may choose to determine the fire-risk level using conventionalmeteorological forecasting parameters. Regardless of which approach is chosen,the essential point is that there should be complete cooperation with meteoro-logical and fire-fighting services exchanging information whenever necessary.Meteorological assistance may even include making a forecaster available for theduration of a fire to provide direct assistance to the fire-fighting service. This formof assistance, which has been practiced in France for 20 years, generates a highlevel of mutual understanding, inspires an essential climate of trust and is also ahighly economical way of operating for all services concerned (Sol, 1994).Moreover, it should not be forgotten that fire-risk forecasting only just falls within
6.1COOPERATION AMONG
SERVICES
6.METEOROLOGICAL
ASSISTANCE
5.FIRES STARTED BY
LIGHTNING
4.3.3Meteorological Assessment of
Fire Risk
METEOROLOGY AS AN AID IN FIGHTING AND PREVENTING FOREST FIRES
41

(and may even be beyond!) the scope of meteorological services. This provides afurther reason why the agencies concerned, whether they are meteorological,forestry or fire-fighting services, must work in cooperation, as they have much tolearn from one another.
The best means of prevention generally entail keeping people informed, espe-cially those who start fires for agricultural or pastoral purposes or who use thecountryside for recreational activities.
Such information should be transmitted in two forms:• Ongoing background information that educates the public about fire hazards. In
this context, the information provided by the meteorological service is primarilyclimatic;
• More detailed information during high-risk periods. Such information should beconveyed by the most appropriate media to warn concerned population groups ofthe abnormally high levels of risk. In the meteorological context, such informa-tion concerns the short- and medium-term.
Meteorological services are most involved with the second element above.
In conclusion, meteorological services should cooperate fully and openly with theservices responsible for preventing and fighting forest fires. Even where the mete-orological network is not very well-developed, easily applicable methods exist forforecasting periods of highest fire risk. Utilizing these methods, a system ofpreventive measures can be established to improve the means of coping withfires. In addition, information provided by the media during periods of high firerisk will reduce the number of outbreaks. A small number of accurate forecasts ofhigh fire-risk levels are virtually all that is required to gain the level of trustdiscussed in this paper. These forecasts should be provided a few days in advanceand, with recent improvements in the quality of medium-term forecasts, such aservice is now within our capabilities.
World Meteorological Organization: Météorologie et incendies de forêts. Report ofthe Technical Meeting held by WMO in Rabat, Morocco, 25–30 November1991.
Deshayes M., Chuviecco E., Cocero D., Karteris M., Koustsias N., Stach N.: Evaluation ofdifferent NOAA-AVHRR derived indices for fuel moisture content estimation: interest forshort-term fire risk assessment. Proceedings of the III International Conference onForest Fire Research – Luso-Coimbra, Portugal, Vol I, pp 1149-1167.
Reis R.M.M., 1998: Scales for the assessment of forest fire danger. Proceedings of the3rd International Conference on Forest Fire Research – Luso-Coimbra,Portugal, Vol I, pp 1235-1243.
Sol B., 1993: Weather forecasts for forest fires: the economic impact. Proceedings ofthe 2nd International Conference on Forest Fire Research – Coimbra, Portugal,Vol I, A07, pp 131-137.
Trabaud L., 1989: Les feux de forêts – mécanismes, comportement et environ-nement. France Sélection. 278 pages.
Valette J.-C., Sol B., Moro C., 1994: Flammability parameters and soil water reserveto improve the forecast of the meteorological forest fire danger index. Proceedings ofthe 2nd International Conference on Forest Fire Research – Coimbra, Portugal,Vol II, pp 611–624.
Van Wagner C.E., 1987: Development and structure of the Canadian Forest FireWeather Index System. Agric.Can., Can. For. Serv., Ottawa ON For. Tech. Rep. 35.
Viegas D.X., Sol B., Bovio G., Nosenzo A. and Ferreira A., 1994: Comparative studyof various methods of fire danger evaluation in southern Europe. Proceedings of the2nd International Conference on Forest Fire Research – Coimbra, Portugal, VolII, C05, pp 571 – 590.
REFERENCES
7.CONCLUSION
6.1PREVENTION
WMO/UNESCO SUB-FORUM ON NATURAL DISASTER REDUCTION
42
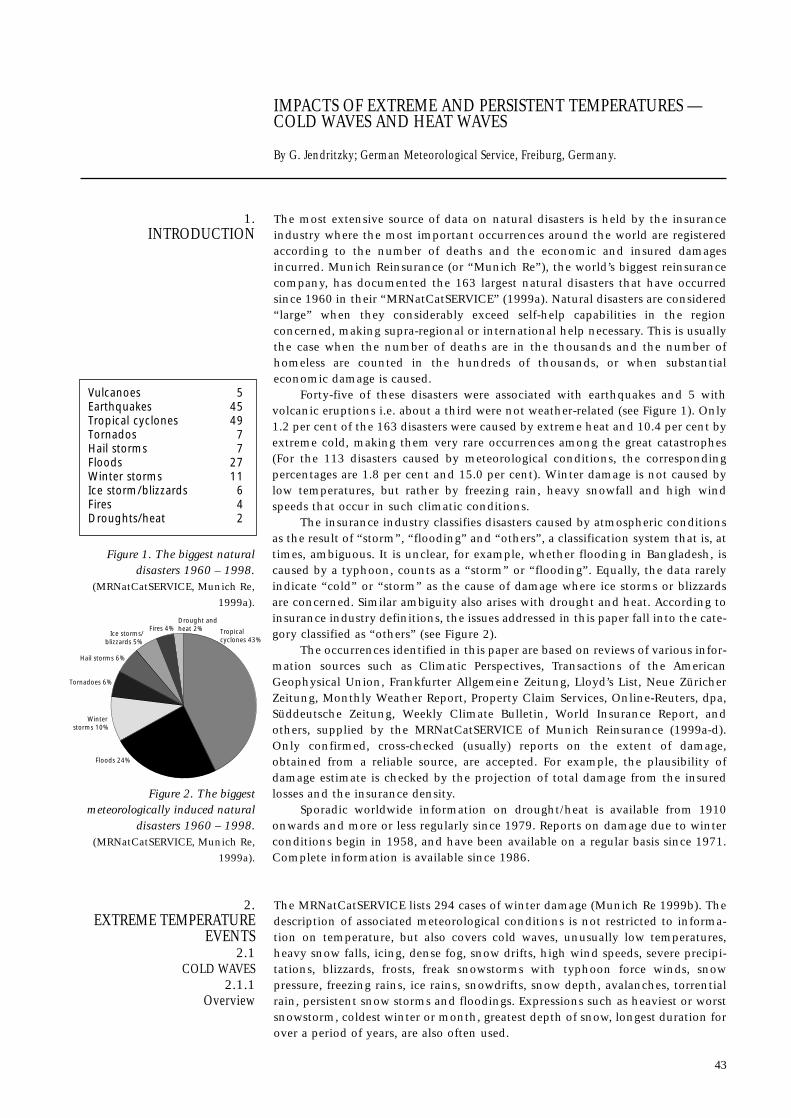
IMPACTS OF EXTREME AND PERSISTENT TEMPERATURES — COLD WAVES AND HEAT WAVES
By G. Jendritzky; German Meteorological Service, Freiburg, Germany.
The most extensive source of data on natural disasters is held by the insuranceindustry where the most important occurrences around the world are registeredaccording to the number of deaths and the economic and insured damagesincurred. Munich Reinsurance (or “Munich Re”), the world’s biggest reinsurancecompany, has documented the 163 largest natural disasters that have occurredsince 1960 in their “MRNatCatSERVICE” (1999a). Natural disasters are considered“large” when they considerably exceed self-help capabilities in the regionconcerned, making supra-regional or international help necessary. This is usuallythe case when the number of deaths are in the thousands and the number ofhomeless are counted in the hundreds of thousands, or when substantialeconomic damage is caused.
Forty-five of these disasters were associated with earthquakes and 5 withvolcanic eruptions i.e. about a third were not weather-related (see Figure 1). Only1.2 per cent of the 163 disasters were caused by extreme heat and 10.4 per cent byextreme cold, making them very rare occurrences among the great catastrophes(For the 113 disasters caused by meteorological conditions, the correspondingpercentages are 1.8 per cent and 15.0 per cent). Winter damage is not caused bylow temperatures, but rather by freezing rain, heavy snowfall and high windspeeds that occur in such climatic conditions.
The insurance industry classifies disasters caused by atmospheric conditionsas the result of “storm”, “flooding” and “others”, a classification system that is, attimes, ambiguous. It is unclear, for example, whether flooding in Bangladesh, iscaused by a typhoon, counts as a “storm” or “flooding”. Equally, the data rarelyindicate “cold” or “storm” as the cause of damage where ice storms or blizzardsare concerned. Similar ambiguity also arises with drought and heat. According toinsurance industry definitions, the issues addressed in this paper fall into the cate-gory classified as “others” (see Figure 2).
The occurrences identified in this paper are based on reviews of various infor-mation sources such as Climatic Perspectives, Transactions of the AmericanGeophysical Union, Frankfurter Allgemeine Zeitung, Lloyd’s List, Neue ZüricherZeitung, Monthly Weather Report, Property Claim Services, Online-Reuters, dpa,Süddeutsche Zeitung, Weekly Climate Bulletin, World Insurance Report, andothers, supplied by the MRNatCatSERVICE of Munich Reinsurance (1999a-d).Only confirmed, cross-checked (usually) reports on the extent of damage,obtained from a reliable source, are accepted. For example, the plausibility ofdamage estimate is checked by the projection of total damage from the insuredlosses and the insurance density.
Sporadic worldwide information on drought/heat is available from 1910onwards and more or less regularly since 1979. Reports on damage due to winterconditions begin in 1958, and have been available on a regular basis since 1971.Complete information is available since 1986.
The MRNatCatSERVICE lists 294 cases of winter damage (Munich Re 1999b). Thedescription of associated meteorological conditions is not restricted to informa-tion on temperature, but also covers cold waves, unusually low temperatures,heavy snow falls, icing, dense fog, snow drifts, high wind speeds, severe precipi-tations, blizzards, frosts, freak snowstorms with typhoon force winds, snowpressure, freezing rains, ice rains, snowdrifts, snow depth, avalanches, torrentialrain, persistent snow storms and floodings. Expressions such as heaviest or worstsnowstorm, coldest winter or month, greatest depth of snow, longest duration forover a period of years, are also often used.
2.EXTREME TEMPERATURE
EVENTS2.1
COLD WAVES2.1.1
Overview
1.INTRODUCTION
43
Hail storms 6%
Drought and heat 2%
Tornadoes 6%
Ice storms/blizzards 5%
Fires 4% Tropical cyclones 43%
Winter storms 10%
Floods 24%
Figure 1. The biggest naturaldisasters 1960 – 1998.
(MRNatCatSERVICE, Munich Re,
1999a).
Vulcanoes 5Earthquakes 45Tropical cyclones 49Tornados 7Hail storms 7Floods 27Winter storms 11Ice storm/blizzards 6Fires 4Droughts/heat 2
Figure 2. The biggestmeteorologically induced natural
disasters 1960 – 1998.(MRNatCatSERVICE, Munich Re,
1999a).
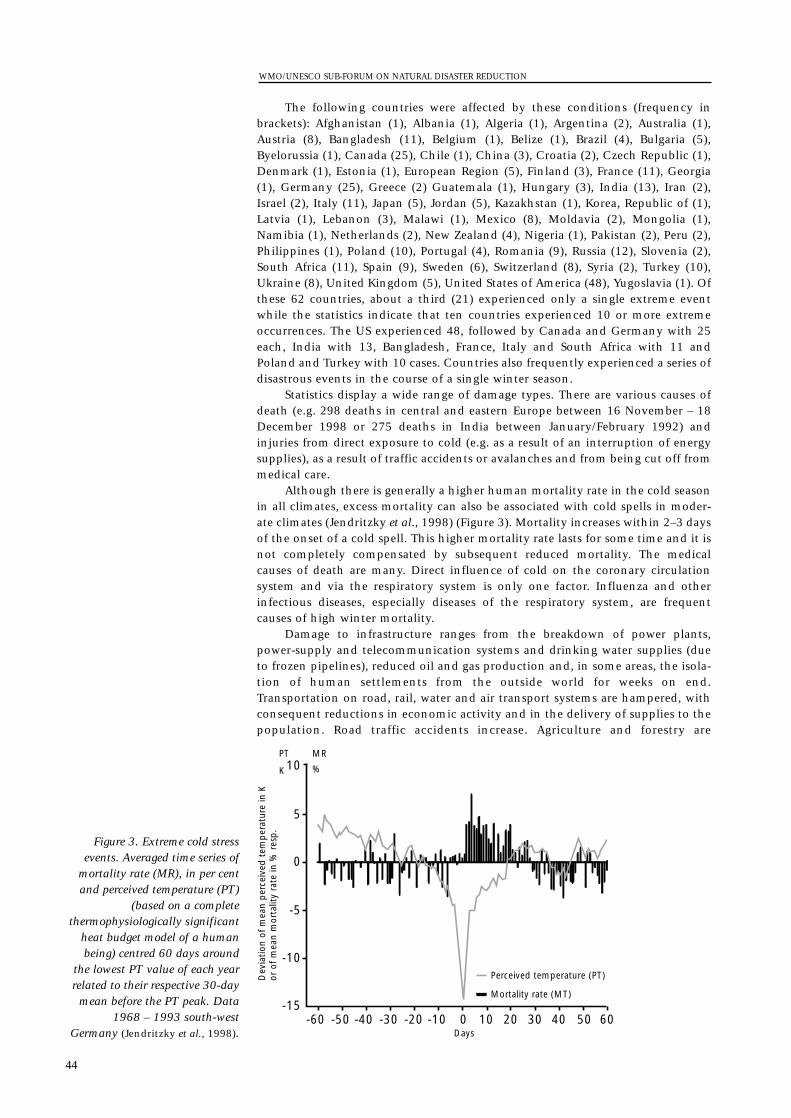
The following countries were affected by these conditions (frequency inbrackets): Afghanistan (1), Albania (1), Algeria (1), Argentina (2), Australia (1),Austria (8), Bangladesh (11), Belgium (1), Belize (1), Brazil (4), Bulgaria (5),Byelorussia (1), Canada (25), Chile (1), China (3), Croatia (2), Czech Republic (1),Denmark (1), Estonia (1), European Region (5), Finland (3), France (11), Georgia(1), Germany (25), Greece (2) Guatemala (1), Hungary (3), India (13), Iran (2),Israel (2), Italy (11), Japan (5), Jordan (5), Kazakhstan (1), Korea, Republic of (1),Latvia (1), Lebanon (3), Malawi (1), Mexico (8), Moldavia (2), Mongolia (1),Namibia (1), Netherlands (2), New Zealand (4), Nigeria (1), Pakistan (2), Peru (2),Philippines (1), Poland (10), Portugal (4), Romania (9), Russia (12), Slovenia (2),South Africa (11), Spain (9), Sweden (6), Switzerland (8), Syria (2), Turkey (10),Ukraine (8), United Kingdom (5), United States of America (48), Yugoslavia (1). Ofthese 62 countries, about a third (21) experienced only a single extreme eventwhile the statistics indicate that ten countries experienced 10 or more extremeoccurrences. The US experienced 48, followed by Canada and Germany with 25each, India with 13, Bangladesh, France, Italy and South Africa with 11 andPoland and Turkey with 10 cases. Countries also frequently experienced a series ofdisastrous events in the course of a single winter season.
Statistics display a wide range of damage types. There are various causes ofdeath (e.g. 298 deaths in central and eastern Europe between 16 November – 18December 1998 or 275 deaths in India between January/February 1992) andinjuries from direct exposure to cold (e.g. as a result of an interruption of energysupplies), as a result of traffic accidents or avalanches and from being cut off frommedical care.
Although there is generally a higher human mortality rate in the cold seasonin all climates, excess mortality can also be associated with cold spells in moder-ate climates (Jendritzky et al., 1998) (Figure 3). Mortality increases within 2–3 daysof the onset of a cold spell. This higher mortality rate lasts for some time and it isnot completely compensated by subsequent reduced mortality. The medicalcauses of death are many. Direct influence of cold on the coronary circulationsystem and via the respiratory system is only one factor. Influenza and otherinfectious diseases, especially diseases of the respiratory system, are frequentcauses of high winter mortality.
Damage to infrastructure ranges from the breakdown of power plants,power-supply and telecommunication systems and drinking water supplies (dueto frozen pipelines), reduced oil and gas production and, in some areas, the isola-tion of human settlements from the outside world for weeks on end.Transportation on road, rail, water and air transport systems are hampered, withconsequent reductions in economic activity and in the delivery of supplies to thepopulation. Road traffic accidents increase. Agriculture and forestry are
WMO/UNESCO SUB-FORUM ON NATURAL DISASTER REDUCTION
44
10
-10
-15
5
-5
0
-60 -50 -40 -30 -20 -10 0 10 20 30 40 50 60
Perceived temperature (PT)
Mortality rate (MT)
Days
MRPT
K %
Dev
iatio
n of
mea
n p
erce
ived
tem
per
atur
e in
Kor
of m
ean
mor
talit
y ra
te in
% r
esp
.
Figure 3. Extreme cold stressevents. Averaged time series of
mortality rate (MR), in per centand perceived temperature (PT)
(based on a completethermophysiologically significant
heat budget model of a humanbeing) centred 60 days around
the lowest PT value of each yearrelated to their respective 30-daymean before the PT peak. Data
1968 – 1993 south-westGermany (Jendritzky et al., 1998).
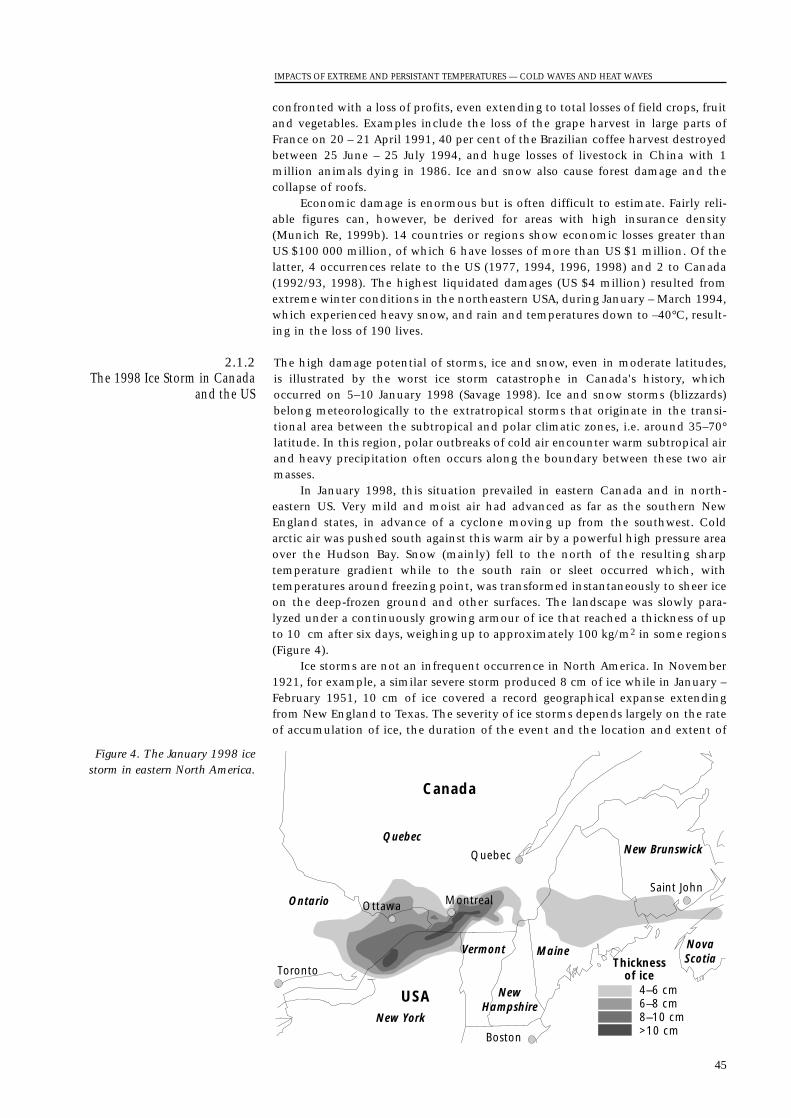
confronted with a loss of profits, even extending to total losses of field crops, fruitand vegetables. Examples include the loss of the grape harvest in large parts ofFrance on 20 – 21 April 1991, 40 per cent of the Brazilian coffee harvest destroyedbetween 25 June – 25 July 1994, and huge losses of livestock in China with 1million animals dying in 1986. Ice and snow also cause forest damage and thecollapse of roofs.
Economic damage is enormous but is often difficult to estimate. Fairly reli-able figures can, however, be derived for areas with high insurance density(Munich Re, 1999b). 14 countries or regions show economic losses greater thanUS $100 000 million, of which 6 have losses of more than US $1 million. Of thelatter, 4 occurrences relate to the US (1977, 1994, 1996, 1998) and 2 to Canada(1992/93, 1998). The highest liquidated damages (US $4 million) resulted fromextreme winter conditions in the northeastern USA, during January – March 1994,which experienced heavy snow, and rain and temperatures down to –40°C, result-ing in the loss of 190 lives.
The high damage potential of storms, ice and snow, even in moderate latitudes,is illustrated by the worst ice storm catastrophe in Canada's history, whichoccurred on 5–10 January 1998 (Savage 1998). Ice and snow storms (blizzards)belong meteorologically to the extratropical storms that originate in the transi-tional area between the subtropical and polar climatic zones, i.e. around 35–70°latitude. In this region, polar outbreaks of cold air encounter warm subtropical airand heavy precipitation often occurs along the boundary between these two airmasses.
In January 1998, this situation prevailed in eastern Canada and in north-eastern US. Very mild and moist air had advanced as far as the southern NewEngland states, in advance of a cyclone moving up from the southwest. Coldarctic air was pushed south against this warm air by a powerful high pressure areaover the Hudson Bay. Snow (mainly) fell to the north of the resulting sharptemperature gradient while to the south rain or sleet occurred which, withtemperatures around freezing point, was transformed instantaneously to sheer iceon the deep-frozen ground and other surfaces. The landscape was slowly para-lyzed under a continuously growing armour of ice that reached a thickness of upto 10 cm after six days, weighing up to approximately 100 kg/m2 in some regions(Figure 4).
Ice storms are not an infrequent occurrence in North America. In November1921, for example, a similar severe storm produced 8 cm of ice while in January –February 1951, 10 cm of ice covered a record geographical expanse extendingfrom New England to Texas. The severity of ice storms depends largely on the rateof accumulation of ice, the duration of the event and the location and extent of
2.1.2The 1998 Ice Storm in Canada
and the US
IMPACTS OF EXTREME AND PERSISTANT TEMPERATURES — COLD WAVES AND HEAT WAVES
45
Canada
Quebec
Quebec
Toronto
Ontario Ottawa Montreal
USANew York
Vermont Maine
NewHampshire
Boston
New Brunswick
Saint John
NovaScotiaThickness
of ice4–6 cm6–8 cm8–10 cm>10 cm
Figure 4. The January 1998 icestorm in eastern North America.
the area affected. Between January 5–10, 1998, the total water equivalent ofprecipitation exceeded 85 mm in Ottawa, 73 mm in Kingston, 108 mm inCornwall and 100 mm in Montreal (Savage 1998). Most of the precipitation fellas freezing rain and ice pellets with some snow. A representative temperatureduring the period was –10°C.
The extent of the area affected by this ice storm was enormous. At the peakof the storm, however, the area of freezing precipitation extended from Muskokaand Kitchener in Ontario through eastern Ontario, western Quebec and theEastern Townships to the Fundy coasts of New Brunswick and Nova Scotia. In theUS, icing coated northern New York and parts of New England. The area affectedby freezing rain, therefore, extended for about 2 000 km in an east-west directionand 400 km in a north-south direction, a total area of approximately 800 000km2, while an armour of ice more than 4 cm thick covered a region of almost100 000 km2.
The reason that this occurrence turned into a catastrophe was, firstly, itsunusually long duration of around a week*. The number of hours of freezing rainand drizzle was in excess of 80, nearly double the normal annual total. Secondly,the thickness of the ice layer and its enormous expanse, covering one of thelargest populated and urbanized areas of North America, left more than fourmillion people freezing in the dark for hours or days.
The following statistics provide an insight into the impact of the storm(Munich Re, 1999c, Savage 1998):Deaths: 23 (Canada: 16, USA: 7);Injured: several (!!);Evacuated: 100 000.More than 4 million people without electricity and heating (On 22 January 1998,800 000 people were still without electricity in Canada).120 000 km of power and communication lines destroyed (including 130 majortransmission towers each worth US $100 000.and about 30 000 wooden utility poles costing US $3 000 each). The damage wasso severe in eastern Ontario and southern Quebec that major rebuilding of theelectrical grid had to be undertaken.Houses damaged by fire, broken pipes, destroyed roofs; many cars damaged; 2 oilrefineries, copper and aluminium plants, factories, businesses and shops affected(business interruptions, loss of income).Highways, roads, bridges closed; roads and bridges damaged; railroads blocked,signalling systems frozen, train services suspended; air traffic affected; subwaysystems disrupted; airlines and railways discouraged travel into the area.Water treatment plants affected; drinking water supply failure. Residents wereurged to boil water for 24 to 48 hours.Major losses to forests, hundreds of thousands or even millions of trees downedor severely damaged; losses to livestock and dairy farms, milk processing plantsclosed. Many Quebec maple syrup producers (who account for 70 per cent of theworld supply) were ruined with much of their sugar bush permanently destroyed.14 000 troops, including 2 300 reservists, deployed to help with clean up, evacu-ation and security.612 000 single damage claims were filed with insurance companies. The mostfrequent claims were for:
Food which had gone bad, in refrigerators without electricity supply (Insuredup to US $1000 in many household policies);Burst water pipes caused by freezing due to the failure of heating systems;Roof damage due to ice pressure and fallen trees;Procurement of electric generators to prevent potential damage; Additional living costs such as for hotel accommodation;
Canada: US $1 500 million USA: US $1 000 million
Canada: US $950 million USA: US $200 million
Insured goods:
Total economic damage:
Insurance claims lodged
Resources mobility:
Forestry and Agricultural losses:
Miscellaneous:
Infrastructure:
Damage:
Power breakdowns:
WMO/UNESCO SUB-FORUM ON NATURAL DISASTER REDUCTION
46
* Though it did not rain continuously throughout this period
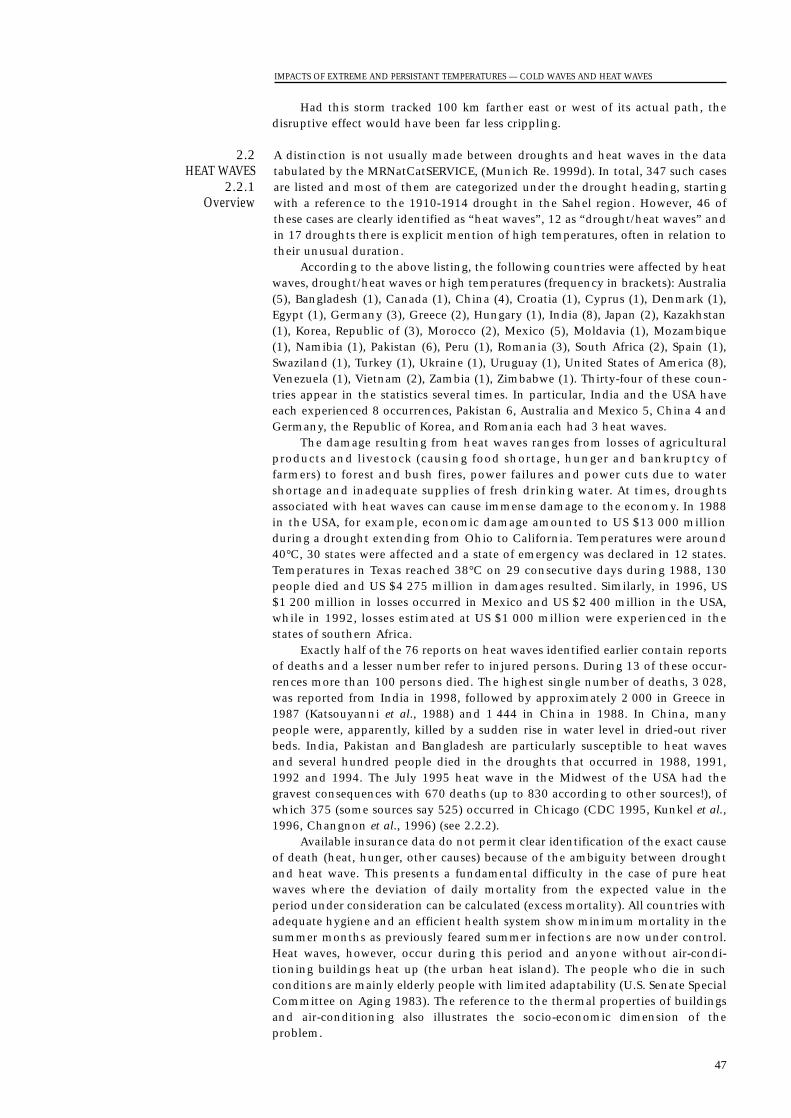
Had this storm tracked 100 km farther east or west of its actual path, thedisruptive effect would have been far less crippling.
A distinction is not usually made between droughts and heat waves in the datatabulated by the MRNatCatSERVICE, (Munich Re. 1999d). In total, 347 such casesare listed and most of them are categorized under the drought heading, startingwith a reference to the 1910-1914 drought in the Sahel region. However, 46 ofthese cases are clearly identified as “heat waves”, 12 as “drought/heat waves” andin 17 droughts there is explicit mention of high temperatures, often in relation totheir unusual duration.
According to the above listing, the following countries were affected by heatwaves, drought/heat waves or high temperatures (frequency in brackets): Australia(5), Bangladesh (1), Canada (1), China (4), Croatia (1), Cyprus (1), Denmark (1),Egypt (1), Germany (3), Greece (2), Hungary (1), India (8), Japan (2), Kazakhstan(1), Korea, Republic of (3), Morocco (2), Mexico (5), Moldavia (1), Mozambique(1), Namibia (1), Pakistan (6), Peru (1), Romania (3), South Africa (2), Spain (1),Swaziland (1), Turkey (1), Ukraine (1), Uruguay (1), United States of America (8),Venezuela (1), Vietnam (2), Zambia (1), Zimbabwe (1). Thirty-four of these coun-tries appear in the statistics several times. In particular, India and the USA haveeach experienced 8 occurrences, Pakistan 6, Australia and Mexico 5, China 4 andGermany, the Republic of Korea, and Romania each had 3 heat waves.
The damage resulting from heat waves ranges from losses of agriculturalproducts and livestock (causing food shortage, hunger and bankruptcy offarmers) to forest and bush fires, power failures and power cuts due to watershortage and inadequate supplies of fresh drinking water. At times, droughtsassociated with heat waves can cause immense damage to the economy. In 1988in the USA, for example, economic damage amounted to US $13 000 millionduring a drought extending from Ohio to California. Temperatures were around40°C, 30 states were affected and a state of emergency was declared in 12 states.Temperatures in Texas reached 38°C on 29 consecutive days during 1988, 130people died and US $4 275 million in damages resulted. Similarly, in 1996, US$1 200 million in losses occurred in Mexico and US $2 400 million in the USA,while in 1992, losses estimated at US $1 000 million were experienced in thestates of southern Africa.
Exactly half of the 76 reports on heat waves identified earlier contain reportsof deaths and a lesser number refer to injured persons. During 13 of these occur-rences more than 100 persons died. The highest single number of deaths, 3 028,was reported from India in 1998, followed by approximately 2 000 in Greece in1987 (Katsouyanni et al., 1988) and 1 444 in China in 1988. In China, manypeople were, apparently, killed by a sudden rise in water level in dried-out riverbeds. India, Pakistan and Bangladesh are particularly susceptible to heat wavesand several hundred people died in the droughts that occurred in 1988, 1991,1992 and 1994. The July 1995 heat wave in the Midwest of the USA had thegravest consequences with 670 deaths (up to 830 according to other sources!), ofwhich 375 (some sources say 525) occurred in Chicago (CDC 1995, Kunkel et al.,1996, Changnon et al., 1996) (see 2.2.2).
Available insurance data do not permit clear identification of the exact causeof death (heat, hunger, other causes) because of the ambiguity between droughtand heat wave. This presents a fundamental difficulty in the case of pure heatwaves where the deviation of daily mortality from the expected value in theperiod under consideration can be calculated (excess mortality). All countries withadequate hygiene and an efficient health system show minimum mortality in thesummer months as previously feared summer infections are now under control.Heat waves, however, occur during this period and anyone without air-condi-tioning buildings heat up (the urban heat island). The people who die in suchconditions are mainly elderly people with limited adaptability (U.S. Senate SpecialCommittee on Aging 1983). The reference to the thermal properties of buildingsand air-conditioning also illustrates the socio-economic dimension of theproblem.
2.2HEAT WAVES
2.2.1Overview
IMPACTS OF EXTREME AND PERSISTANT TEMPERATURES — COLD WAVES AND HEAT WAVES
47
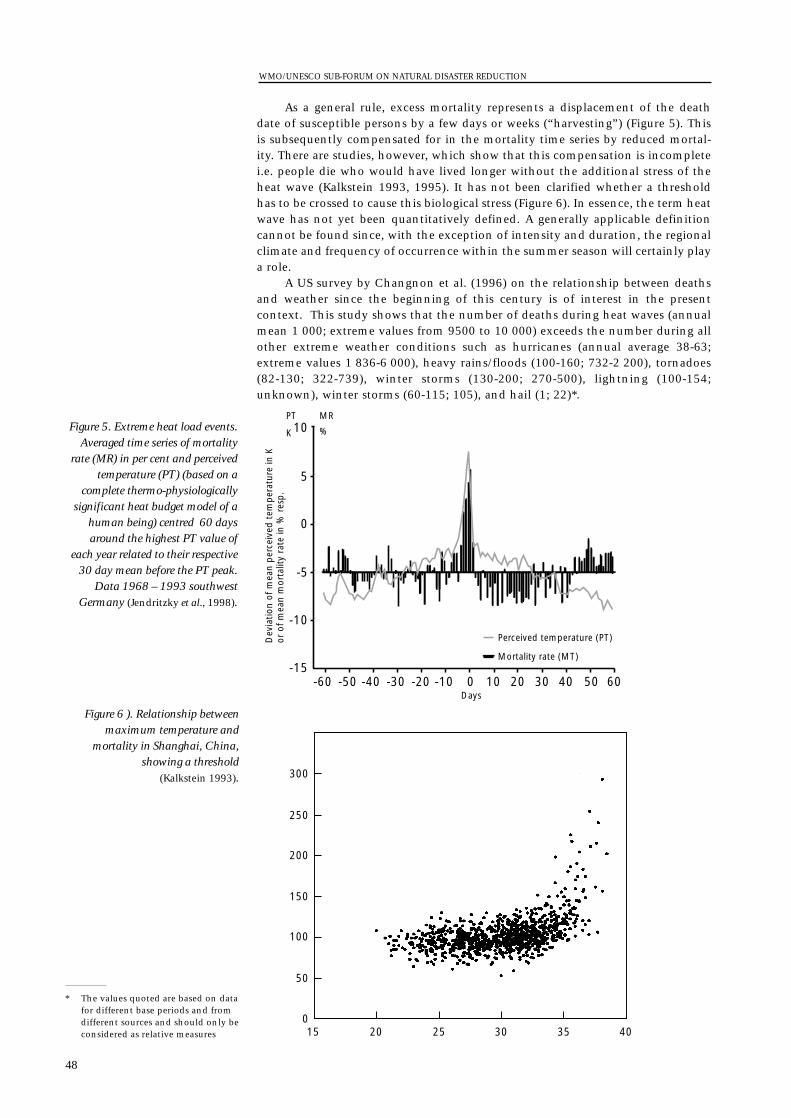
As a general rule, excess mortality represents a displacement of the deathdate of susceptible persons by a few days or weeks (“harvesting”) (Figure 5). Thisis subsequently compensated for in the mortality time series by reduced mortal-ity. There are studies, however, which show that this compensation is incompletei.e. people die who would have lived longer without the additional stress of theheat wave (Kalkstein 1993, 1995). It has not been clarified whether a thresholdhas to be crossed to cause this biological stress (Figure 6). In essence, the term heatwave has not yet been quantitatively defined. A generally applicable definitioncannot be found since, with the exception of intensity and duration, the regionalclimate and frequency of occurrence within the summer season will certainly playa role.
A US survey by Changnon et al. (1996) on the relationship between deathsand weather since the beginning of this century is of interest in the presentcontext. This study shows that the number of deaths during heat waves (annualmean 1 000; extreme values from 9500 to 10 000) exceeds the number during allother extreme weather conditions such as hurricanes (annual average 38-63;extreme values 1 836-6 000), heavy rains/floods (100-160; 732-2 200), tornadoes(82-130; 322-739), winter storms (130-200; 270-500), lightning (100-154;unknown), winter storms (60-115; 105), and hail (1; 22)*.
WMO/UNESCO SUB-FORUM ON NATURAL DISASTER REDUCTION
48
10
-10
-15
5
-5
0
-60 -50 -40 -30 -20 -10 0 10 20 30 40 50 60
Perceived temperature (PT)
Mortality rate (MT)
Days
MRPT
K %
Dev
iatio
n of
mea
n p
erce
ived
tem
per
atur
e in
Kor
of m
ean
mor
talit
y ra
te in
% r
esp
.
0
50
100
150
200
250
300
15 20 25 30 35 40
Figure 5. Extreme heat load events.Averaged time series of mortality
rate (MR) in per cent and perceivedtemperature (PT) (based on a
complete thermo-physiologicallysignificant heat budget model of a
human being) centred 60 daysaround the highest PT value of
each year related to their respective30 day mean before the PT peak.
Data 1968 – 1993 southwestGermany (Jendritzky et al., 1998).
Figure 6 ). Relationship betweenmaximum temperature and
mortality in Shanghai, China,showing a threshold
(Kalkstein 1993).
* The values quoted are based on datafor different base periods and fromdifferent sources and should only beconsidered as relative measures
A severe 5-day heat wave hit the central United States in July 1995, extendingfrom 11–17 July (for details see Changnon et al. 1996 and Livezey and Tinker1996). Apparent temperatures* exceeded 40°C during daytime and, probably evenmore serious, nocturnal temperatures in urban areas remained above 30°C. Theurban heat island was insignificant during the daytime but substantial at night(Figure 7). This severe heat wave caused 830 deaths, with 87 per cent occurring inthe Midwest including 525 in Chicago alone. Deaths commenced one or two daysafter the heat wave, with most occurring in the 4-day period between 13–16 July.Seventy three per cent of those who died from heat-related causes were personsaged 65 or older (Whitman 1995). Most deaths occurred in homes without airconditioning or where the residents did not operate air conditioning or fansbecause they were unable to afford them.
Some confusion exists regarding the precise number of deaths. Firstly, thereis no general definition of a death due to heat. Heat stroke is clear as a cause ofdeath, but affected individuals also often suffer from other health problems. Thus,questions arise as to whether heat is the primary cause of death or only acontributing factor? An additional problem is caused by the 1 to 2 day delay inreporting deaths, due to overloaded medical examiners. A study of excess deathsduring heat waves, probably the best measure of heat-related deaths, suggests thatactual heat-related deaths are generally underestimated by a factor of ten (Avery1988) !
The 1995 heat wave also caused many other types of impacts. Energy usageincreased enormously, reaching an all-time record high. 40 000 people wereaffected by a massive power failure during periods of peak stress. Energy use ledto an increase in electricity bills, a problem for low-income families. Hospitals inthe Chicago area became overloaded and the number of ambulances wascompletely insufficient to handle the crisis as thousands were taken to localhospitals. Highways and railroads were damaged and companies reported thatproductivity was greatly reduced. About 850 dairy cows died, milk productiondeclined and major flocks of poultry were killed.
An assessment of the reasons for the severity of the heat-wave (Changnon etal. 1996) revealed that many factors were to blame:
• An inadequate local heat wave warning system, though the National WeatherService issued accurate short- and medium-range forecasts;
• The urban heat island;• The inability of many people to properly ventilate their residences, due to fear of
crime or a lack or resources for fans or air conditioning;• Power failures; and
• Inadequate ambulance service and hospital facilities. These contributing factors indicate a lack of preparedness at various levels.
The social and demographic factors (i.e. increased population in urban areas, agenerally older population, reduced home/apartment ventilation for fear of crime,ignorance, high electricity bills, changing ethnicity) would indicate increasedlikelihood of heat deaths in large urban areas (Changnon et al., 1996).
2.2.2 The 1995 Heat Wave in
Chicago
IMPACTS OF EXTREME AND PERSISTANT TEMPERATURES — COLD WAVES AND HEAT WAVES
49
* An index based on air temperatureand relative humidity, whichreflects the heat dissipation of ahuman body (Steadman, 1979)
Rural Suburban
ParkCommercial
District
Urban
Cliff PlateauPeak
∆Tu-r
Air
tem
pera
ture
Figure 7. The urban heat islandeffect on night-time minimum
temperatures.
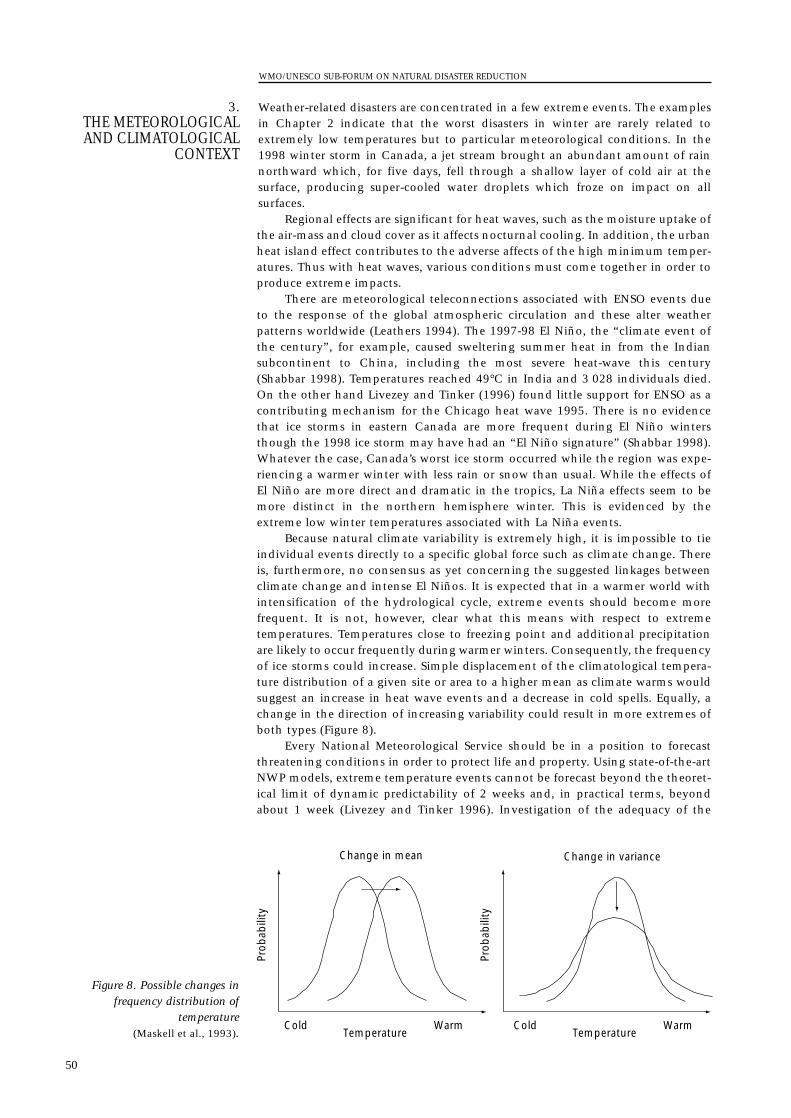
Weather-related disasters are concentrated in a few extreme events. The examplesin Chapter 2 indicate that the worst disasters in winter are rarely related toextremely low temperatures but to particular meteorological conditions. In the1998 winter storm in Canada, a jet stream brought an abundant amount of rainnorthward which, for five days, fell through a shallow layer of cold air at thesurface, producing super-cooled water droplets which froze on impact on allsurfaces.
Regional effects are significant for heat waves, such as the moisture uptake ofthe air-mass and cloud cover as it affects nocturnal cooling. In addition, the urbanheat island effect contributes to the adverse affects of the high minimum temper-atures. Thus with heat waves, various conditions must come together in order toproduce extreme impacts.
There are meteorological teleconnections associated with ENSO events dueto the response of the global atmospheric circulation and these alter weatherpatterns worldwide (Leathers 1994). The 1997-98 El Niño, the “climate event ofthe century”, for example, caused sweltering summer heat in from the Indiansubcontinent to China, including the most severe heat-wave this century(Shabbar 1998). Temperatures reached 49°C in India and 3 028 individuals died.On the other hand Livezey and Tinker (1996) found little support for ENSO as acontributing mechanism for the Chicago heat wave 1995. There is no evidencethat ice storms in eastern Canada are more frequent during El Niño wintersthough the 1998 ice storm may have had an “El Niño signature” (Shabbar 1998).Whatever the case, Canada’s worst ice storm occurred while the region was expe-riencing a warmer winter with less rain or snow than usual. While the effects ofEl Niño are more direct and dramatic in the tropics, La Niña effects seem to bemore distinct in the northern hemisphere winter. This is evidenced by theextreme low winter temperatures associated with La Niña events.
Because natural climate variability is extremely high, it is impossible to tieindividual events directly to a specific global force such as climate change. Thereis, furthermore, no consensus as yet concerning the suggested linkages betweenclimate change and intense El Niños. It is expected that in a warmer world withintensification of the hydrological cycle, extreme events should become morefrequent. It is not, however, clear what this means with respect to extremetemperatures. Temperatures close to freezing point and additional precipitationare likely to occur frequently during warmer winters. Consequently, the frequencyof ice storms could increase. Simple displacement of the climatological tempera-ture distribution of a given site or area to a higher mean as climate warms wouldsuggest an increase in heat wave events and a decrease in cold spells. Equally, achange in the direction of increasing variability could result in more extremes ofboth types (Figure 8).
Every National Meteorological Service should be in a position to forecastthreatening conditions in order to protect life and property. Using state-of-the-artNWP models, extreme temperature events cannot be forecast beyond the theoret-ical limit of dynamic predictability of 2 weeks and, in practical terms, beyondabout 1 week (Livezey and Tinker 1996). Investigation of the adequacy of the
3.THE METEOROLOGICALAND CLIMATOLOGICAL
CONTEXT
WMO/UNESCO SUB-FORUM ON NATURAL DISASTER REDUCTION
50
Change in varianceChange in mean
ColdTemperature
WarmColdTemperature
Warm
Prob
abili
ty
Prob
abili
ty
Figure 8. Possible changes infrequency distribution of
temperature (Maskell et al., 1993).
1995 Chicago heat wave forecast clearly showed that the forecasting was accurateand its onset was recognized several days in advance (Changnon et al., 1996).
The MRNatCatSERVICE statistics on extreme weather events, referenced insections 2.1.1 and 2.2.1, certainly contain errors, particularly during the earlieryears of record. This database, nevertheless, permits some general conclusions tobe drawn. Countries at different stages of development are represented in thestatistics. While developed, newly industrialized and developing countries are allaffected by cold wave or heat wave events, some higher risk areas can be identi-fied. These include the middle latitudes of North America, central and southernEurope, South-East Asia from Pakistan to India and Bangladesh to China, thesouthern region of Africa and, mainly in summer, Australia. For a variety ofreasons, vulnerability differs from country to country.
Modern industrial societies usually show a high sensitivity to disastersbecause they depend strongly on undisturbed, ongoing access to a well-developedinfrastructure, particularly transportation and electricity. More and more peoplelive in expanding urban areas with high settlement density where values are oftenconcentrated in high risk locations. Intensive forms of agriculture and livestockfarming are carried out. Emergency preparedness is usually underdeveloped dueto lack of awareness, particularly in moderate climates, and most people do notunderstand the danger presented by different weather conditions (Changnon etal., 1996).
People in less developed countries are also increasingly concentrated inrapidly growing urban agglomerations or megacities. Their vulnerability is, to agreater extent, determined by the lack of financial resources, inadequate infra-structure, accelerating deterioration of natural resources and wars. Whileeconomic losses and insured losses are usually much higher in developed coun-tries, data frequently indicate a greater number of deaths in the less developedregions.
Cooperative action involving all levels of government, private companies(e.g. insurance industry) and non-profit institutions, and associations and thenatural and technological community is necessary in order to reduce loss of lifeand damage to property caused by the impact of natural disasters. As mitigationis understood as the cornerstone of emergency management, a good example hasbeen set in North America by the US Federal Emergency Management Agency(FEMA) and Emergency Preparedness Canada (EPC). These agencies have devel-oped mitigation strategies “to protect the nation's critical infrastructure from alltypes of hazards through a comprehensive, risk-based, emergency managementprogram of mitigation, preparedness, response and recovery” (FEMA). The aim isto bring about a safer and more disaster-resistant country.
Although short- and medium-range weather forecasting has, in general, improvedsignificantly in recent years, the results are better at the macro- and meso-scalesthan at the micro-scale. For heat waves, however, the superimposed micro-scaleurban heat island effects are more significant than the regional pattern (Riebsameet al., 1991), taking into account local socio-economic and demographic factors.This illustrates that meteorological assessments must be tailored to the specificproblem being addressed (e.g. adequate criteria have to be established for warn-ings). Similar guidance applies to monitoring of the preceding weather situationin order to alert responsible agencies and the public, well in advance, that condi-tions are favourable for the development of an extreme event.
An accurate and adequate meteorological forecast by the National MeteorologicalService (NMS) is a prerequisite for providing warnings. In addition, the interfacebetween the NMS and the emergency response decision maker (e.g. in the healthdepartment) must be formally established, in advance. Clear definition ofresponsibilities is necessary to ensure criteria are met, to establish the progression fromwatch through warning to emergency, and to alert all affected agencies and the publicon the basis of a prepared plan. The heat watch/warning system, first established inPhiladelphia (Kalkstein 1995) and presently being implemented in some other large
5.THE WATCH/WARNING
CONCEPT
4.VULNERABILITY
IMPACTS OF EXTREME AND PERSISTANT TEMPERATURES — COLD WAVES AND HEAT WAVES
51
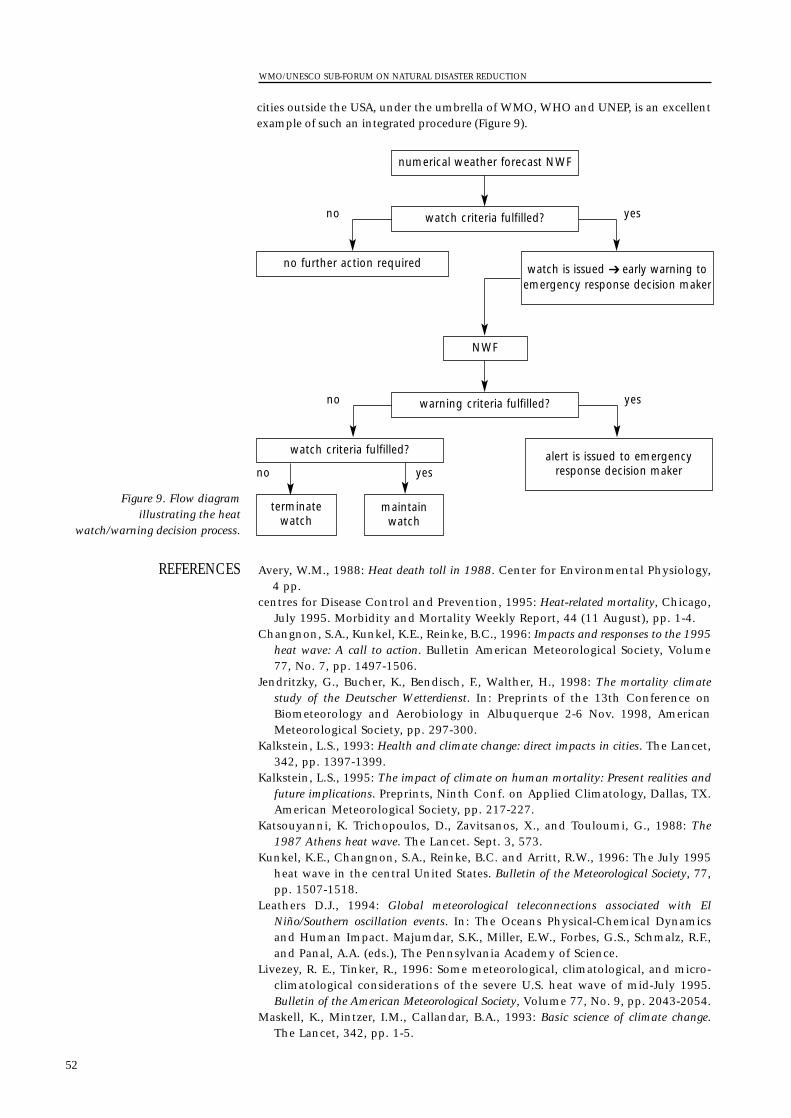
cities outside the USA, under the umbrella of WMO, WHO and UNEP, is an excellentexample of such an integrated procedure (Figure 9).
Avery, W.M., 1988: Heat death toll in 1988. Center for Environmental Physiology,4 pp.
centres for Disease Control and Prevention, 1995: Heat-related mortality, Chicago,July 1995. Morbidity and Mortality Weekly Report, 44 (11 August), pp. 1-4.
Changnon, S.A., Kunkel, K.E., Reinke, B.C., 1996: Impacts and responses to the 1995heat wave: A call to action. Bulletin American Meteorological Society, Volume77, No. 7, pp. 1497-1506.
Jendritzky, G., Bucher, K., Bendisch, F., Walther, H., 1998: The mortality climatestudy of the Deutscher Wetterdienst. In: Preprints of the 13th Conference onBiometeorology and Aerobiology in Albuquerque 2-6 Nov. 1998, AmericanMeteorological Society, pp. 297-300.
Kalkstein, L.S., 1993: Health and climate change: direct impacts in cities. The Lancet,342, pp. 1397-1399.
Kalkstein, L.S., 1995: The impact of climate on human mortality: Present realities andfuture implications. Preprints, Ninth Conf. on Applied Climatology, Dallas, TX.American Meteorological Society, pp. 217-227.
Katsouyanni, K. Trichopoulos, D., Zavitsanos, X., and Touloumi, G., 1988: The1987 Athens heat wave. The Lancet. Sept. 3, 573.
Kunkel, K.E., Changnon, S.A., Reinke, B.C. and Arritt, R.W., 1996: The July 1995heat wave in the central United States. Bulletin of the Meteorological Society, 77,pp. 1507-1518.
Leathers D.J., 1994: Global meteorological teleconnections associated with ElNiño/Southern oscillation events. In: The Oceans Physical-Chemical Dynamicsand Human Impact. Majumdar, S.K., Miller, E.W., Forbes, G.S., Schmalz, R.F.,and Panal, A.A. (eds.), The Pennsylvania Academy of Science.
Livezey, R. E., Tinker, R., 1996: Some meteorological, climatological, and micro-climatological considerations of the severe U.S. heat wave of mid-July 1995.Bulletin of the American Meteorological Society, Volume 77, No. 9, pp. 2043-2054.
Maskell, K., Mintzer, I.M., Callandar, B.A., 1993: Basic science of climate change.The Lancet, 342, pp. 1-5.
REFERENCES
WMO/UNESCO SUB-FORUM ON NATURAL DISASTER REDUCTION
52
numerical weather forecast NWF
watch criteria fulfilled? alert is issued to emergencyresponse decision maker
NWF
terminatewatch
maintain watch
no further action required watch is issued early warning toemergency response decision maker
watch criteria fulfilled?no
no
yes
yes
no yeswarning criteria fulfilled?
Figure 9. Flow diagramillustrating the heat
watch/warning decision process.
Munich Re, 1999a: Some of the largest natural disasters since 1960.MRNatCatSERVICE (A. Wirtz, pers. comm.) Munich Reinsurance Company,Munich, Germany.
Munich Re, 1999b: Cold waves and winter damage. MRNatCatSERVICE (A. Wirtz,pers. comm.) Munich Reinsurance Company, Munich, Germany.
Munich Re, 1999c: Topics: natural disasters 1998. Annual Review (in German)Munich Reinsurance Company, Munich, Germany.
Munich Re, 1999d: Droughts and heat waves. MRNatCatSERVICE (A. Wirtz, pers.comm.) Munich Reinsurance Company, Munich, Germany.
Riebsame, W.E., Changnon, S.A. and Karl, T.R., 1991: Drought and natural resourcesmanagement in the United States: impacts and implications of the 1987-1989Drought. Westview Press, 174 pp.
Savage, S., 1998: The worst ice storms in Canadian history ? Environment Canada.<http://www.tor.ec.gc.ca/events/icestorms98/icestorm 98_the_worst_e.html>.
Schabbar, A., 1998: Is there a link to El Niño? Environment Canada.<http://www.tor.ec.gc.ca/events/icestorms98/icestorms 98_elnino_link_e.html>.
Steadman, R.G., 1979: The assessment of sultriness. Part I: A temperature-humid-ity index based on human physiology and clothing science. Journal of AppliedMeteorology, 18, pp. 861-873.
U.S. Senate Special Committee on Aging, 1983: Heat stress and older Americans:Problems and solutions. U.S. Government Printing Office, Washington, D.C., 14pp.
Whitman, S., 1995: Mortality and the mid-July heat wave in Chicago. ChicagoDepartment of Public Health, 32 pp.
IMPACTS OF EXTREME AND PERSISTANT TEMPERATURES — COLD WAVES AND HEAT WAVES
53
DUST AND SAND STORMS — CHARACTERISTICS, VULNERABILITY, AWARENESS AND PREPAREDNESS
By A.A. Hassan; Meteorological authority, Cairo, Egypt
This paper provides a review and analysis of dust storm phenomena in many parts of theworld. The study investigates their types, general characteristics, hazards, preparednessand their relation to atmospheric elements. A suggested mechanism of dust stormformation is discussed as well as a detailed study of dust storms of desert depression type,including some case studies. The results show the importance of descending motion fortrue dust storms and that the transverse indirect circulation may play an important rolein these phenomena. The relationship between dust storms over China and thesuppression of the Walker cell, as a result of El Niño events, is also discussed.
Among different weather phenomena which occur in sub-tropical areas, a sandstorm is certainly the most unpleasant one for the population in the area, mosthazardous for the health, transport and navigation, most widely known and, atthe same time, the most mysterious for meteorologists in terms of its generalcharacteristics, causes and development. Many countries suffer from thesephenomena, such as the prairie regions of the United States of America, Mexico,northwest India, North Africa, the Middle East, Argentina and Australia.However, to date, no comprehensive study of sand and dust storms has beencarried out for many of these regions and most of the present studies are eitherdescriptive or statistical. Usually, this phenomenon has a local name: Chili inTunisia, Ghibli in Libya, Samum in Sardinia, Levech in Spain, Sirocco in Italy,Andhi in India, Haboob in Sudan and Khamsin in Egypt.
Terminology for the occurrence of dust and sand within the atmosphere is, as yet,not completely established. Although the unit particles composing sand and dustare similar and belong to the same order of matter as dry opaque particles, theirbehaviour in windy conditions is different. Dust consists of smaller and lighterparticles than sand. Once raised from the ground, dust particles are, owing totheir lightness, liable to become subject to upward or other irregular currents inthe air where they remain in suspension until such time as air movement moder-ates. Dust travels in clouds, often at height, and is liable to dispersal over greatdistance. Certain local unidirectional winds are especially effective in this disper-sal, such as the Harmattan that carries dust south into Nigeria and the west coastof northern Africa. On particular occasions, dust has been recorded streakingacross Europe from the Sahara as far north as Sweden. We may ignore the distinc-tion between sand and dust, as the terms “sand storm” and “dust storm” arefrequently used indiscriminately in the literature, and use the name "dust storm"for any rapidly moving air which contains large amounts of dry opaque particlesand reduces visibility to less than 1 000 meters. However, we exclude “sanddevils” which are small whirlwinds that appear with a weak general wind whiletrue dust storms are associated with high wind velocities. Frequently, sand isdriven along the ground by a strong wind without being lifted into the higher airlayers; this may be called “sand drift”. The most impressive phenomenon associ-ated with the transport of dust and sand is the occasional occurrence of a “dustwall” which rises from the ground to considerable altitude and has a well-definedoutline (Haboob in Sudan).
Dust storms are markedly seasonal in their occurrence. In most of the regions, theannual distribution of dust storms shows that such storms are more prevalent inspring. In some areas, however, such as North Africa and the southern prairiestates of the USA, the time of greatest frequency is late winter and early springwhile in Australia and southern Iraq dust storms most commonly occur duringlate spring and summer (Figure 1).
3.GENERAL
CHARACTERISTICS OFDUST STORMS
3.1ANNUAL FREQUENCY
2.DEFINITIONS
1.INTRODUCTION
ABSTRACT
54

Although dust storms are not completely absent at night, they occur mainlyduring daylight hours (Figure 2).
The relation between dust storms and temperature conditions is not very close.117 cases of dust storms occurring over Cairo during the period 1968–1990 havebeen studied. 50 per cent of these cases were accompanied by temperatures from+2 to +13°C above normal. In 30 per cent of these cases, the temperature was 2 to10°C below normal. The rest of the cases were within 2°C of the normal. Most ofthe cold dust storms occurred in winter.
Dust storms are generally associated with relatively dry air. A close relationshipwas found between the temperature and the relative humidity of storms. Thecases with above normal temperature had a very low minimum relative humiditywhich was less than 5 per cent in some cases and never exceeded 30 per cent. Onthe other hand, the relative humidity in cold storms ranged between 20 per centand 50 per cent.
3.3.2Humidity
3.3THE RELATION TO WEATHER
ELEMENTS3.3.1
Temperature
3.2DAILY VARIATION
DUST AND SAND STORMS — CHARACTERISTICS, VULNERABILITY, AWARENESS AND PREPAREDNESS
55
10
9
8
7
6
5
4
3
2
1
J F M A M J J A S O N D
Sand storms
Desert depressions
Freq
uenc
y
Months
30
28
26
24
22
20
18
16
14
12
10
3 4 5 6 7 8 9 10 11 12 13 14 15 16 17 18 GMT
Mersa-Matrouh
Salloum (31°33'N, 25°11'E)
Cairo (29°52'N, 31°20'E)
(31°20'N, 27°13'E)
Knot
sMonths
Figure 1. The mean frequency of sandstorms and desertdepressions in Egypt (1956–1957) (After El-Saggagh; 1970).
Figure 2. Diurnal variation of mean surface wind during thedays when desert depressions exist at three stations in Egypt(1954–1957) (After El Sabbagh; 1971)).
20
15
–15
10
–10
5
–5
0
10 20 30 40 50 60 70 80
Tem
pera
ture
dev
iatio
n fo
r the
nor
mal
5
5
5
5
5
5 5
5
5 5
4 4
4
4
4
4
44
4
4
4
4
44
4
4
44
4
4
4
4
4
43
3
3 3
33
3 3
3
33
3
33
33
3
3
3
3 3 33
2
2
22 2
22
22
22
22
2
2
A
99
6
6
C
C
C
C
C
C C
CC
CC
BB
B1
1
1 11
1
Minimum relative humidity percentage
Figure 3. Scattergram forduststorms over Cairo for 117cases (1968–1990) the plotted
numbers (1, 2, ... A, B, C)indicate months of duststormoccurence (Jan, Feb, ... Dec).
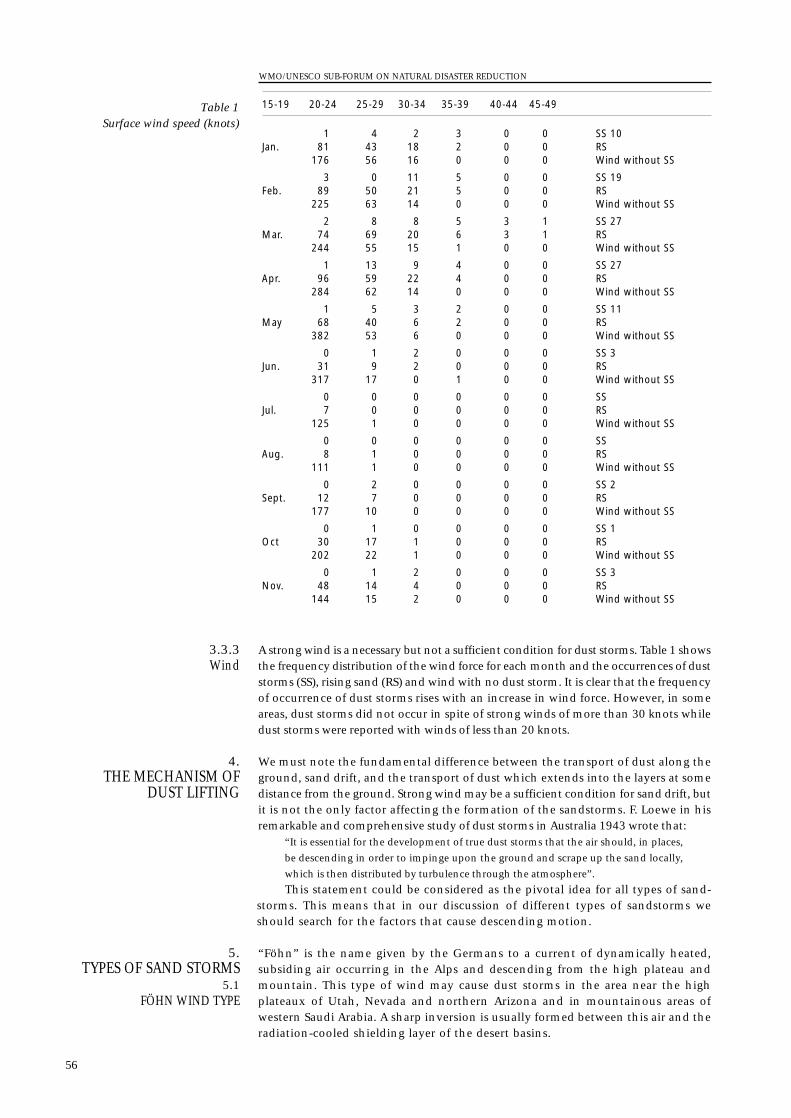
A strong wind is a necessary but not a sufficient condition for dust storms. Table 1 showsthe frequency distribution of the wind force for each month and the occurrences of duststorms (SS), rising sand (RS) and wind with no dust storm. It is clear that the frequencyof occurrence of dust storms rises with an increase in wind force. However, in someareas, dust storms did not occur in spite of strong winds of more than 30 knots whiledust storms were reported with winds of less than 20 knots.
We must note the fundamental difference between the transport of dust along theground, sand drift, and the transport of dust which extends into the layers at somedistance from the ground. Strong wind may be a sufficient condition for sand drift, butit is not the only factor affecting the formation of the sandstorms. F. Loewe in hisremarkable and comprehensive study of dust storms in Australia 1943 wrote that:
“It is essential for the development of true dust storms that the air should, in places,
be descending in order to impinge upon the ground and scrape up the sand locally,
which is then distributed by turbulence through the atmosphere”.
This statement could be considered as the pivotal idea for all types of sand-storms. This means that in our discussion of different types of sandstorms weshould search for the factors that cause descending motion.
“Föhn” is the name given by the Germans to a current of dynamically heated,subsiding air occurring in the Alps and descending from the high plateau andmountain. This type of wind may cause dust storms in the area near the highplateaux of Utah, Nevada and northern Arizona and in mountainous areas ofwestern Saudi Arabia. A sharp inversion is usually formed between this air and theradiation-cooled shielding layer of the desert basins.
5.TYPES OF SAND STORMS
5.1FÖHN WIND TYPE
4.THE MECHANISM OF
DUST LIFTING
3.3.3Wind
WMO/UNESCO SUB-FORUM ON NATURAL DISASTER REDUCTION
56
15-19 20-24 25-29 30-34 35-39 40-44 45-49
1 4 2 3 0 0 SS 10Jan. 81 43 18 2 0 0 RS
176 56 16 0 0 0 Wind without SS
3 0 11 5 0 0 SS 19Feb. 89 50 21 5 0 0 RS
225 63 14 0 0 0 Wind without SS
2 8 8 5 3 1 SS 27Mar. 74 69 20 6 3 1 RS
244 55 15 1 0 0 Wind without SS
1 13 9 4 0 0 SS 27Apr. 96 59 22 4 0 0 RS
284 62 14 0 0 0 Wind without SS
1 5 3 2 0 0 SS 11May 68 40 6 2 0 0 RS
382 53 6 0 0 0 Wind without SS
0 1 2 0 0 0 SS 3Jun. 31 9 2 0 0 0 RS
317 17 0 1 0 0 Wind without SS
0 0 0 0 0 0 SS Jul. 7 0 0 0 0 0 RS
125 1 0 0 0 0 Wind without SS
0 0 0 0 0 0 SSAug. 8 1 0 0 0 0 RS
111 1 0 0 0 0 Wind without SS
0 2 0 0 0 0 SS 2Sept. 12 7 0 0 0 0 RS
177 10 0 0 0 0 Wind without SS
0 1 0 0 0 0 SS 1Oct 30 17 1 0 0 0 RS
202 22 1 0 0 0 Wind without SS
0 1 2 0 0 0 SS 3Nov. 48 14 4 0 0 0 RS
144 15 2 0 0 0 Wind without SS
Table 1Surface wind speed (knots)
It must not be inferred that every Föhn wind produces a dust storm. Themajority of them do not produce more than local dust, either because the dustsupply is limited or because the wind strikes the ground only in certain well-exposed places because it is prevented from doing so elsewhere by the shieldinglayer of cold air. In addition, the Föhn current may be too stable or the wind maynot be strong enough to carry dust in any appreciable quantity.
Belt dust storms, which accompany cold fronts, are common in many areas suchas the Middle East, the USA and Australia. The width of such dust storms is in theorder of 20 – 40 km and their length, which extends along the cold front, may beof order of few hundred km. As a well-marked cold front moves, the nose of thefront establishes itself and turbulence increases with increasing instability andvertical wind shear. This type of dust storm is not a dry one and is sometimesaccompanied by a marked increase in relative humidity and a fall in temperature.
Under favourable conditions, the dust raised by a cold front over NorthAfrica may advance south up to 5 N of the equator, following the clockwise circu-lation of the great desert anticyclone, and may spread over a wide area causing thewell-known “Harmattan haze” in central and west Africa.
Dust storms of this type are associated with the development of thundery activ-ity, the downdrafts from which may create turbulent squalls which, ondescending steeply to the ground, raise dust causing localized dust storms. Thedust raised by the squalls is carried away from the storm edges, resulting in duststorms far from, and mainly ahead of, the thunderstorm cell. Haboob, is a well-known dust storm phenomena in Sudan which is associated with thunderstormsor Cumulonimbus clouds. Haboob may occur at any time of the year, but mainlybetween May to September.
In spring, perhaps the most important synoptic feature over the great Africandesert is the marked tendency for genesis of desert depressions on either synopticor slightly sub-synoptic scales. Such depressions generally take a preferred east-ward track near the North African coast, over the desert or over the southernMediterranean. These regions, particularly in spring, are associated with bound-ary layer baroclinicity as a result of the pronounced contrast in surfacetemperature between sea and desert air. Moreover, these depressions are associ-ated, in most cases, with strong, hot, dry, and dust laden southerly andsoutheasterly surface winds blowing in front of them. These winds frequentlycause intense temperature and humidity anomalies as well as rising dust andsevere dust storms in all of the North African countries.
The existence of a strong phase of the subtropical jet stream and its preva-lence over the Sahara for the greater part of the year was considered in somestudies that emphasized the role of the jet stream in the formation, evolution andpropagation of these Sahara cyclones (El Tantawy, 1968). All of the cases studied,however, were found to be associated with a jet maximum in the upper tropo-sphere. Detailed, quantitative, dynamic and energetic studies have beenundertaken for particular cases of a Sahara cyclone (Hassan, 1974, Youssef, 1987).It was found that this type of relatively short wave length sub-synoptic phenom-enon, which takes place over a low latitude area of specific configuration (acoastal desert area), can have a free oscillation wave with a period of the order of24 hours. The diurnal variation in such an area may play an important role inmagnifying the amplitude of such a disturbance, due to the effect of resonance(Appendix 1). In such a small active disturbance, the rapid change of mass is amore significant dominating factor than the wind change (Appendix 2). On thebasis of the work of Peterssen and Smebye (1971), the cyclogenetic mechanism isvery close to type B. This type B mechanism can be summarized as follows:
1. The initial synoptic conditions are a disturbance in the upper troposphere accom-panied by an increase of baroclinicity.
2. Kinetic energy is imported into the cyclone domain mainly from the jet streamregion.
5.4DESERT DEPRESSION TYPE
5.3THUNDERSTORM TYPE
5.2COLD FRONT TYPE
DUST AND SAND STORMS — CHARACTERISTICS, VULNERABILITY, AWARENESS AND PREPAREDNESS
57
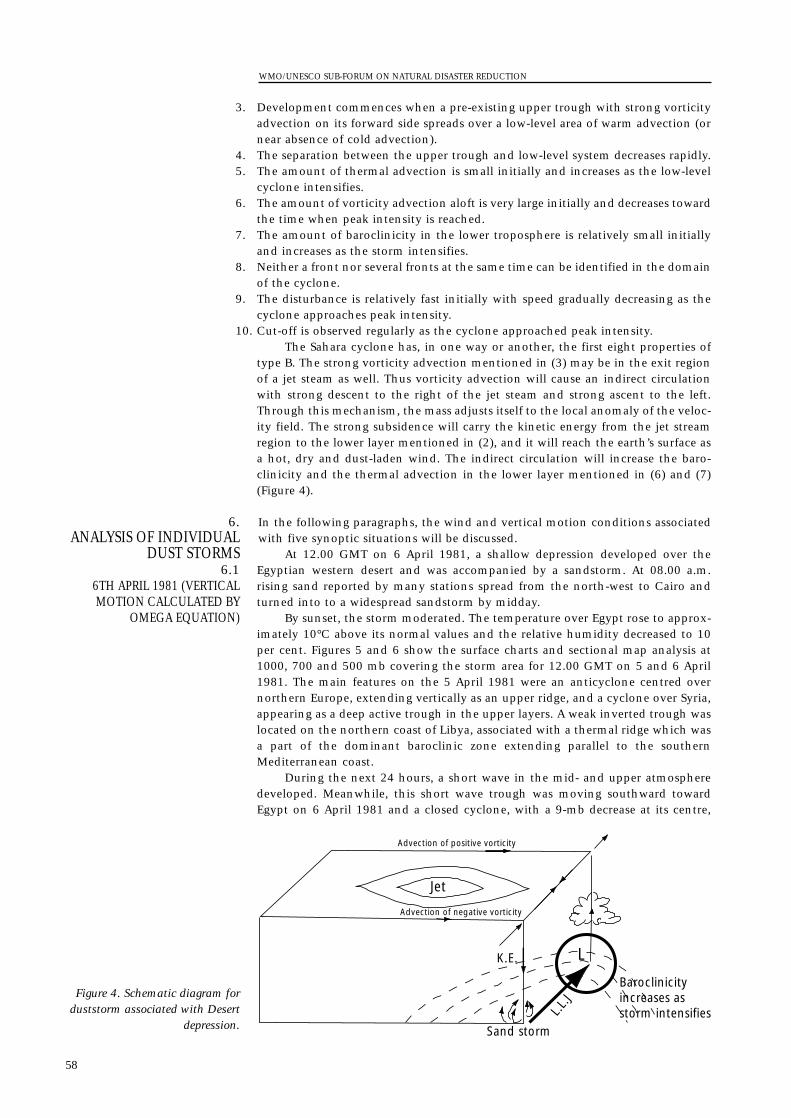
3. Development commences when a pre-existing upper trough with strong vorticityadvection on its forward side spreads over a low-level area of warm advection (ornear absence of cold advection).
4. The separation between the upper trough and low-level system decreases rapidly.5. The amount of thermal advection is small initially and increases as the low-level
cyclone intensifies.6. The amount of vorticity advection aloft is very large initially and decreases toward
the time when peak intensity is reached.7. The amount of baroclinicity in the lower troposphere is relatively small initially
and increases as the storm intensifies.8. Neither a front nor several fronts at the same time can be identified in the domain
of the cyclone.9. The disturbance is relatively fast initially with speed gradually decreasing as the
cyclone approaches peak intensity.10. Cut-off is observed regularly as the cyclone approached peak intensity.
The Sahara cyclone has, in one way or another, the first eight properties oftype B. The strong vorticity advection mentioned in (3) may be in the exit regionof a jet steam as well. Thus vorticity advection will cause an indirect circulationwith strong descent to the right of the jet steam and strong ascent to the left.Through this mechanism, the mass adjusts itself to the local anomaly of the veloc-ity field. The strong subsidence will carry the kinetic energy from the jet streamregion to the lower layer mentioned in (2), and it will reach the earth’s surface asa hot, dry and dust-laden wind. The indirect circulation will increase the baro-clinicity and the thermal advection in the lower layer mentioned in (6) and (7)(Figure 4).
In the following paragraphs, the wind and vertical motion conditions associatedwith five synoptic situations will be discussed.
At 12.00 GMT on 6 April 1981, a shallow depression developed over theEgyptian western desert and was accompanied by a sandstorm. At 08.00 a.m.rising sand reported by many stations spread from the north-west to Cairo andturned into to a widespread sandstorm by midday.
By sunset, the storm moderated. The temperature over Egypt rose to approx-imately 10°C above its normal values and the relative humidity decreased to 10per cent. Figures 5 and 6 show the surface charts and sectional map analysis at1000, 700 and 500 mb covering the storm area for 12.00 GMT on 5 and 6 April1981. The main features on the 5 April 1981 were an anticyclone centred overnorthern Europe, extending vertically as an upper ridge, and a cyclone over Syria,appearing as a deep active trough in the upper layers. A weak inverted trough waslocated on the northern coast of Libya, associated with a thermal ridge which wasa part of the dominant baroclinic zone extending parallel to the southernMediterranean coast.
During the next 24 hours, a short wave in the mid- and upper atmospheredeveloped. Meanwhile, this short wave trough was moving southward towardEgypt on 6 April 1981 and a closed cyclone, with a 9-mb decrease at its centre,
6. ANALYSIS OF INDIVIDUAL
DUST STORMS6.1
6TH APRIL 1981 (VERTICALMOTION CALCULATED BY
OMEGA EQUATION)
WMO/UNESCO SUB-FORUM ON NATURAL DISASTER REDUCTION
58
L
Baroclinicityincreases as storm intensifies
Sand storm
K.E.
L.L.J
Advection of negative vorticity
Advection of positive vorticity
Jet
Figure 4. Schematic diagram forduststorm associated with Desert
depression.
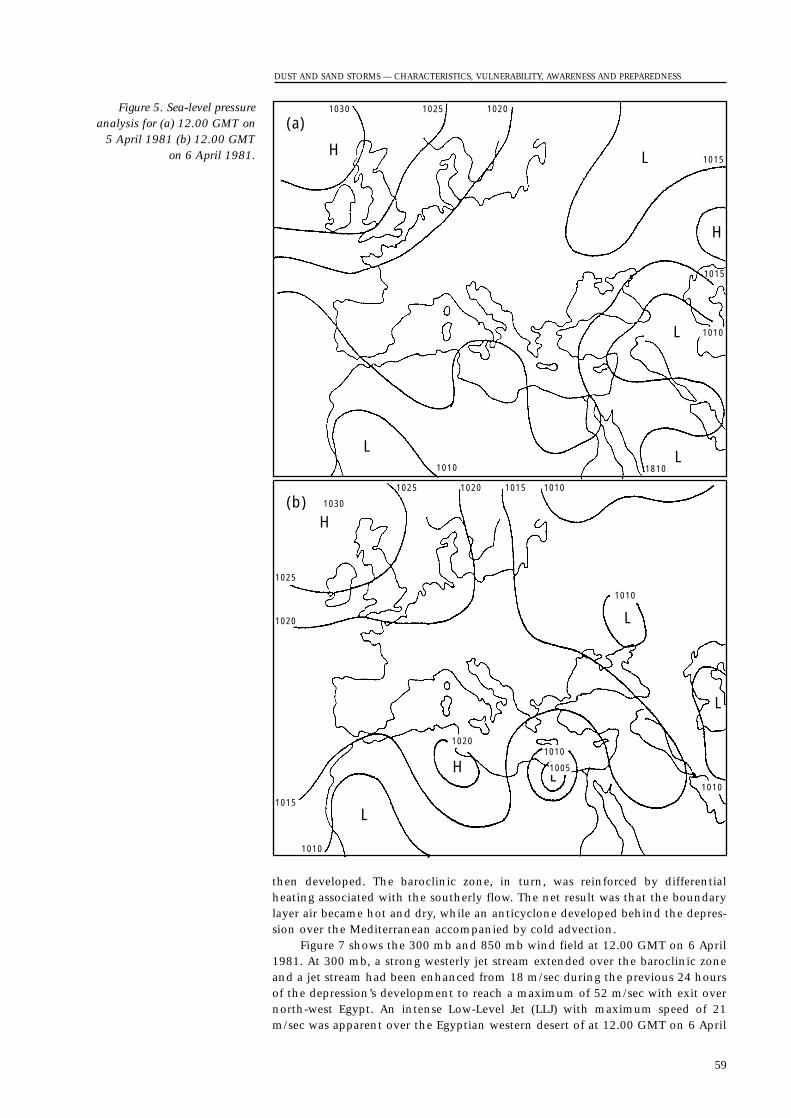
then developed. The baroclinic zone, in turn, was reinforced by differentialheating associated with the southerly flow. The net result was that the boundarylayer air became hot and dry, while an anticyclone developed behind the depres-sion over the Mediterranean accompanied by cold advection.
Figure 7 shows the 300 mb and 850 mb wind field at 12.00 GMT on 6 April1981. At 300 mb, a strong westerly jet stream extended over the baroclinic zoneand a jet stream had been enhanced from 18 m/sec during the previous 24 hoursof the depression’s development to reach a maximum of 52 m/sec with exit overnorth-west Egypt. An intense Low-Level Jet (LLJ) with maximum speed of 21m/sec was apparent over the Egyptian western desert of at 12.00 GMT on 6 April
DUST AND SAND STORMS — CHARACTERISTICS, VULNERABILITY, AWARENESS AND PREPAREDNESS
59
H
H
H
L
L
L
L
L
L
H
L
L
1030 1025 1020
1015
1015
1010
18101010
1030
1025 1020 1015 1010
1010
10101020
1010
1015
1020
1025
1005
1010
(a)
(b)
Figure 5. Sea-level pressureanalysis for (a) 12.00 GMT on
5 April 1981 (b) 12.00 GMTon 6 April 1981.
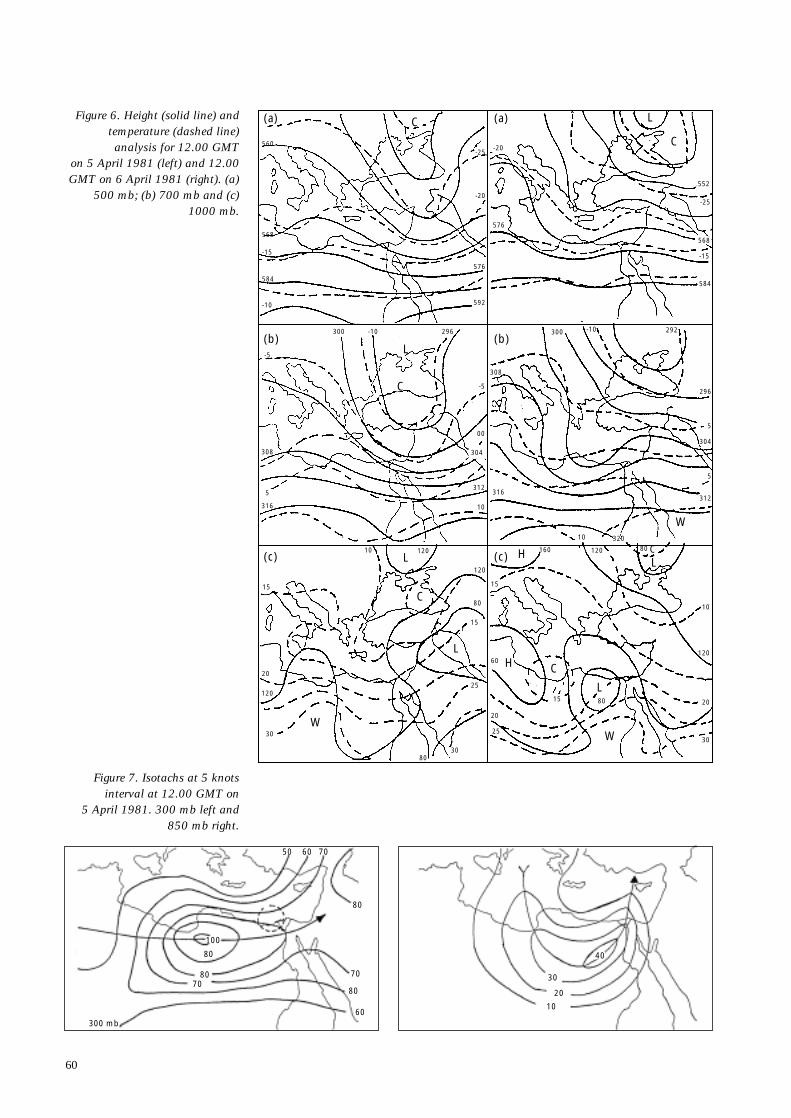
60
(a)
(b)
(c) (c)
(b)
(a)
560
568
584
296300
308
312
304
316
10 120
120
80
80
15
25
25
15
15
80
30
20
10
10 320
312
304
5
5
296
308
300 -10 292
584
568
576
552
-15
-25
316
80
120
160 120
20
60
30
30
20
15
120
592
576
-15
-5
-5
00
5
-20
-25-20
-10
-10
C
C
L
L
LH
H
W
L
C
LC
C
L
W
C
W
10
Figure 6. Height (solid line) andtemperature (dashed line)analysis for 12.00 GMT
on 5 April 1981 (left) and 12.00GMT on 6 April 1981 (right). (a)
500 mb; (b) 700 mb and (c)1000 mb.
7080
80
100
300 mb60
80
80
50 60 70
70
10
20
30
40
Figure 7. Isotachs at 5 knotsinterval at 12.00 GMT on
5 April 1981. 300 mb left and850 mb right.
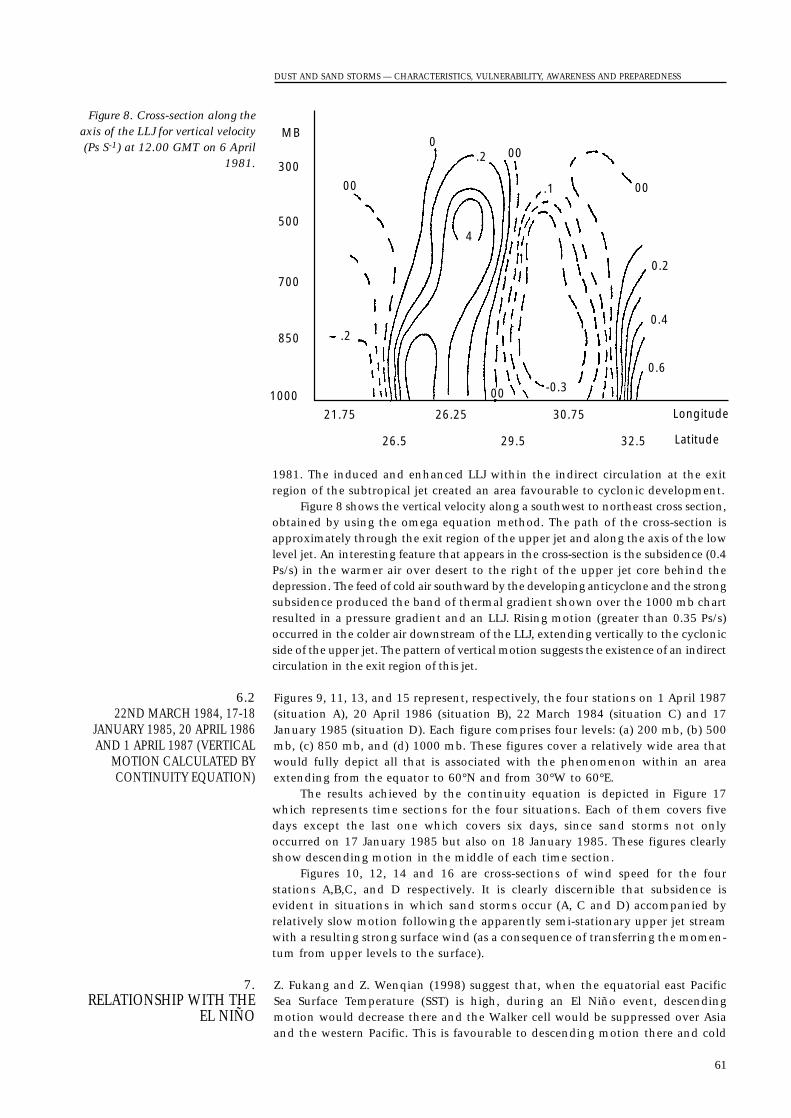
1981. The induced and enhanced LLJ within the indirect circulation at the exitregion of the subtropical jet created an area favourable to cyclonic development.
Figure 8 shows the vertical velocity along a southwest to northeast cross section,obtained by using the omega equation method. The path of the cross-section isapproximately through the exit region of the upper jet and along the axis of the lowlevel jet. An interesting feature that appears in the cross-section is the subsidence (0.4Ps/s) in the warmer air over desert to the right of the upper jet core behind thedepression. The feed of cold air southward by the developing anticyclone and the strongsubsidence produced the band of thermal gradient shown over the 1000 mb chartresulted in a pressure gradient and an LLJ. Rising motion (greater than 0.35 Ps/s)occurred in the colder air downstream of the LLJ, extending vertically to the cyclonicside of the upper jet. The pattern of vertical motion suggests the existence of an indirectcirculation in the exit region of this jet.
Figures 9, 11, 13, and 15 represent, respectively, the four stations on 1 April 1987(situation A), 20 April 1986 (situation B), 22 March 1984 (situation C) and 17January 1985 (situation D). Each figure comprises four levels: (a) 200 mb, (b) 500mb, (c) 850 mb, and (d) 1000 mb. These figures cover a relatively wide area thatwould fully depict all that is associated with the phenomenon within an areaextending from the equator to 60°N and from 30°W to 60°E.
The results achieved by the continuity equation is depicted in Figure 17which represents time sections for the four situations. Each of them covers fivedays except the last one which covers six days, since sand storms not onlyoccurred on 17 January 1985 but also on 18 January 1985. These figures clearlyshow descending motion in the middle of each time section.
Figures 10, 12, 14 and 16 are cross-sections of wind speed for the fourstations A,B,C, and D respectively. It is clearly discernible that subsidence isevident in situations in which sand storms occur (A, C and D) accompanied byrelatively slow motion following the apparently semi-stationary upper jet streamwith a resulting strong surface wind (as a consequence of transferring the momen-tum from upper levels to the surface).
Z. Fukang and Z. Wenqian (1998) suggest that, when the equatorial east PacificSea Surface Temperature (SST) is high, during an El Niño event, descendingmotion would decrease there and the Walker cell would be suppressed over Asiaand the western Pacific. This is favourable to descending motion there and cold
7. RELATIONSHIP WITH THE
EL NIÑO
6.222ND MARCH 1984, 17-18
JANUARY 1985, 20 APRIL 1986AND 1 APRIL 1987 (VERTICAL
MOTION CALCULATED BYCONTINUITY EQUATION)
DUST AND SAND STORMS — CHARACTERISTICS, VULNERABILITY, AWARENESS AND PREPAREDNESS
61
MB
300
500
700
850
1000
21.75 26.25 30.75 Longitude
Latitude32.529.526.5
00
00
00
0.2
0.4
0.6
00
0.2
-0.3
4
.2
.1
Figure 8. Cross-section along theaxis of the LLJ for vertical velocity(Ps S-1) at 12.00 GMT on 6 April
1981.
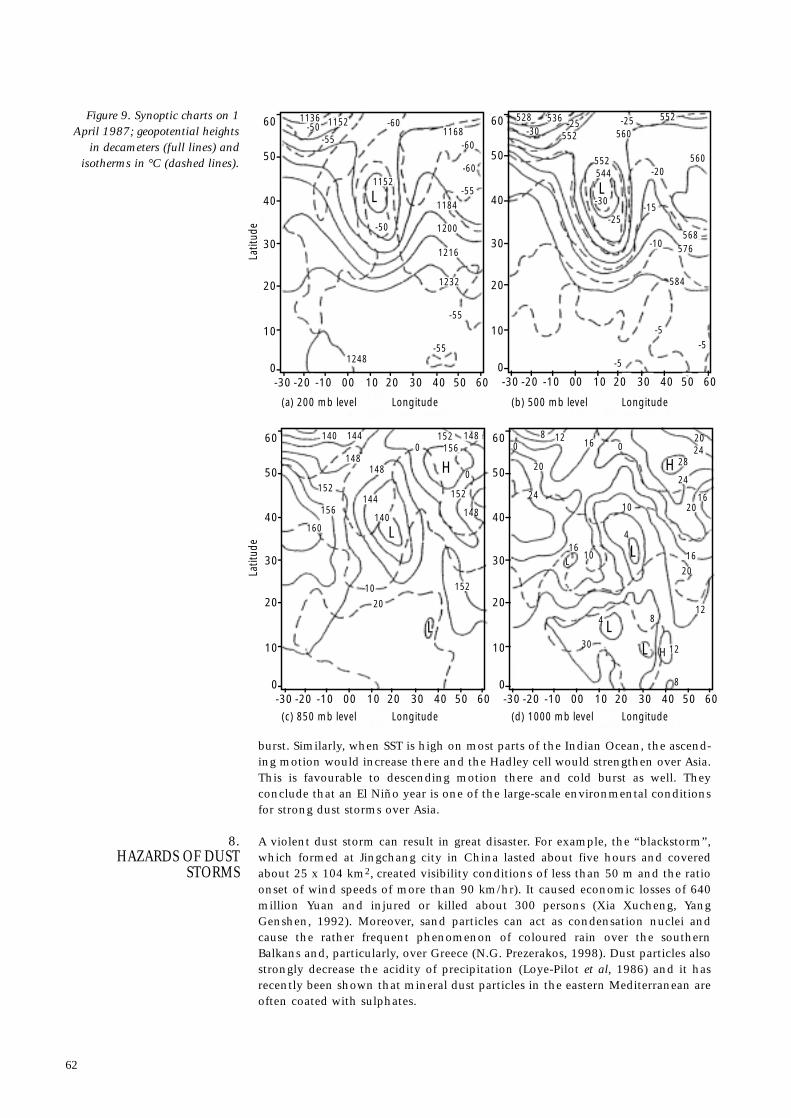
burst. Similarly, when SST is high on most parts of the Indian Ocean, the ascend-ing motion would increase there and the Hadley cell would strengthen over Asia.This is favourable to descending motion there and cold burst as well. Theyconclude that an El Niño year is one of the large-scale environmental conditionsfor strong dust storms over Asia.
A violent dust storm can result in great disaster. For example, the “blackstorm”,which formed at Jingchang city in China lasted about five hours and coveredabout 25 x 104 km2, created visibility conditions of less than 50 m and the ratioonset of wind speeds of more than 90 km/hr). It caused economic losses of 640million Yuan and injured or killed about 300 persons (Xia Xucheng, YangGenshen, 1992). Moreover, sand particles can act as condensation nuclei andcause the rather frequent phenomenon of coloured rain over the southernBalkans and, particularly, over Greece (N.G. Prezerakos, 1998). Dust particles alsostrongly decrease the acidity of precipitation (Loye-Pilot et al, 1986) and it hasrecently been shown that mineral dust particles in the eastern Mediterranean areoften coated with sulphates.
8.HAZARDS OF DUST
STORMS
62
60
50
40
30
20
10
0-30 -20 -10 00 10 20 30 40 50 60
60
50
40
30
20
10
0-30 -20 -10 00 10 20 30 40 50 60
60
50
40
30
20
10
0-30 -20 -10 00 10 20 30 40 50 60
60
50
40
30
20
10
0-30 -20 -10 00 10 20 30 40 50 60
1136
144
144
148
148
148
148
152
152
152
152
156
156
160
1168
1152
1184
1200
1216
528
568
536
1232
1152 -60
-60-30
-25 -25
-25
-5-5
-5
-20
-15
-10
-30
552
552
552 560
584
576
544
560
-60
-55
-55
-55
-50
-55-50
L
L
L
H H
H
L
LL
L
L
1248
140
140
0
0
0 08 12
12
12
16
16
1616
20
20
20
20
10
10
30
2824
24
24
20
10
8
8
4
4
Longitude
Latit
ude
Latit
ude
Longitude(a) 200 mb level (b) 500 mb level
Longitude Longitude(c) 850 mb level (d) 1000 mb level
Figure 9. Synoptic charts on 1April 1987; geopotential heights
in decameters (full lines) andisotherms in °C (dashed lines).
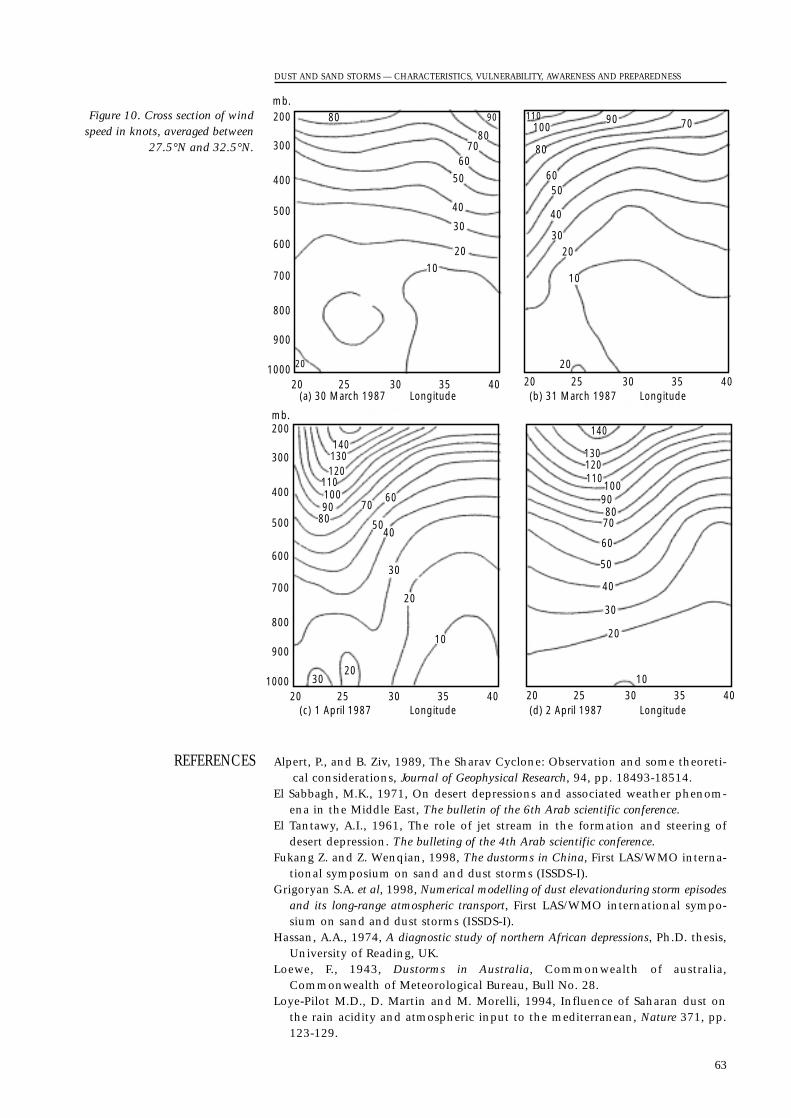
Alpert, P., and B. Ziv, 1989, The Sharav Cyclone: Observation and some theoreti-cal considerations, Journal of Geophysical Research, 94, pp. 18493-18514.
El Sabbagh, M.K., 1971, On desert depressions and associated weather phenom-ena in the Middle East, The bulletin of the 6th Arab scientific conference.
El Tantawy, A.I., 1961, The role of jet stream in the formation and steering ofdesert depression. The bulleting of the 4th Arab scientific conference.
Fukang Z. and Z. Wenqian, 1998, The dustorms in China, First LAS/WMO interna-tional symposium on sand and dust storms (ISSDS-I).
Grigoryan S.A. et al, 1998, Numerical modelling of dust elevationduring storm episodesand its long-range atmospheric transport, First LAS/WMO international sympo-sium on sand and dust storms (ISSDS-I).
Hassan, A.A., 1974, A diagnostic study of northern African depressions, Ph.D. thesis,University of Reading, UK.
Loewe, F., 1943, Dustorms in Australia, Commonwealth of australia,Commonwealth of Meteorological Bureau, Bull No. 28.
Loye-Pilot M.D., D. Martin and M. Morelli, 1994, Influence of Saharan dust onthe rain acidity and atmospheric input to the mediterranean, Nature 371, pp.123-129.
REFERENCES
DUST AND SAND STORMS — CHARACTERISTICS, VULNERABILITY, AWARENESS AND PREPAREDNESS
63
mb.200
300
400
500
600
700
800
900
100020 25 30 35 40
mb.200
300
400
500
600
700
800
900
100020 25 30 35 40 20 25 30 35 40
20 25 30 35 40
30
30
30
40
40
50
50
60
60
70
7080 809090100100110 110
120 120130 130140
140
20
20
2010
10
1010
20
90 90100
110
3030
4040
5050
6060
70
7080
80
80
20
20
20
Longitude Longitude(a) 30 March 1987 (b) 31 March 1987
Longitude Longitude(c) 1 April 1987 (d) 2 April 1987
Figure 10. Cross section of windspeed in knots, averaged between
27.5°N and 32.5°N.
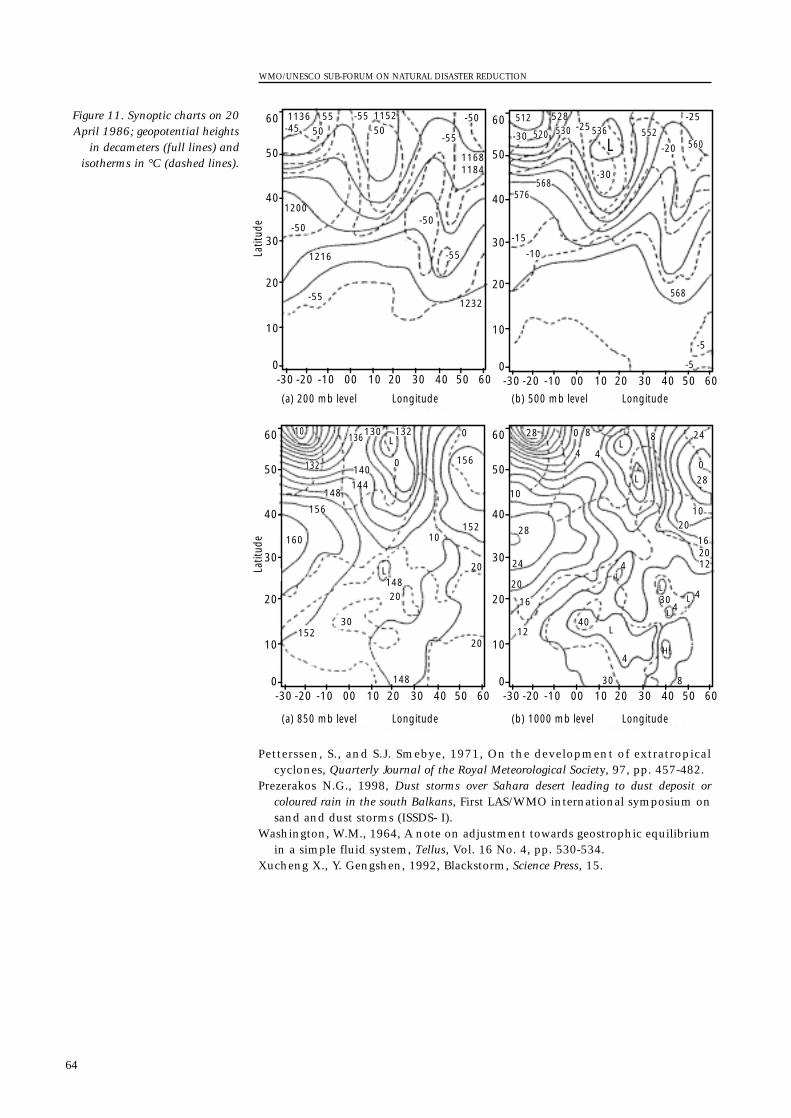
Petterssen, S., and S.J. Smebye, 1971, On the development of extratropicalcyclones, Quarterly Journal of the Royal Meteorological Society, 97, pp. 457-482.
Prezerakos N.G., 1998, Dust storms over Sahara desert leading to dust deposit orcoloured rain in the south Balkans, First LAS/WMO international symposium onsand and dust storms (ISSDS- I).
Washington, W.M., 1964, A note on adjustment towards geostrophic equilibriumin a simple fluid system, Tellus, Vol. 16 No. 4, pp. 530-534.
Xucheng X., Y. Gengshen, 1992, Blackstorm, Science Press, 15.
WMO/UNESCO SUB-FORUM ON NATURAL DISASTER REDUCTION
64
60
50
40
30
20
10
0-30 -20 -10 00 10 20 30 40 50 60
60
50
40
30
20
10
0-30 -20 -10 00 10 20 30 40 50 60
60
50
40
30
20
10
0-30 -20 -10 00 10 20 30 40 50 60
1136 1152
11681184
1232
1216
1200
-4555 -50
-50-50
-55
-55
130 13210136
132
-55
-30
60
50
40
30
20
10
0-30 -20 -10 00 10 20 30 40 50 60
-25
-30
-25
-20
-15
-10
-5
-5
528
-5550 50
Latit
ude
Latit
ude
Longitude Longitude(a) 200 mb level (b) 500 mb level
Longitude Longitude(a) 850 mb level (b) 1000 mb level
512
520 530
568
568
536560
552
576
L
L0
0
10
20
20
8
4
4012
16
20
24
28
30
30 4
1220
20
28
28 24
10
16
4
4
20
30
156
152
152
148
148
140
144148
156
160
L
L
H
LL
L
L
0
0
4 4
88L
L10
Figure 11. Synoptic charts on 20April 1986; geopotential heights
in decameters (full lines) andisotherms in °C (dashed lines).
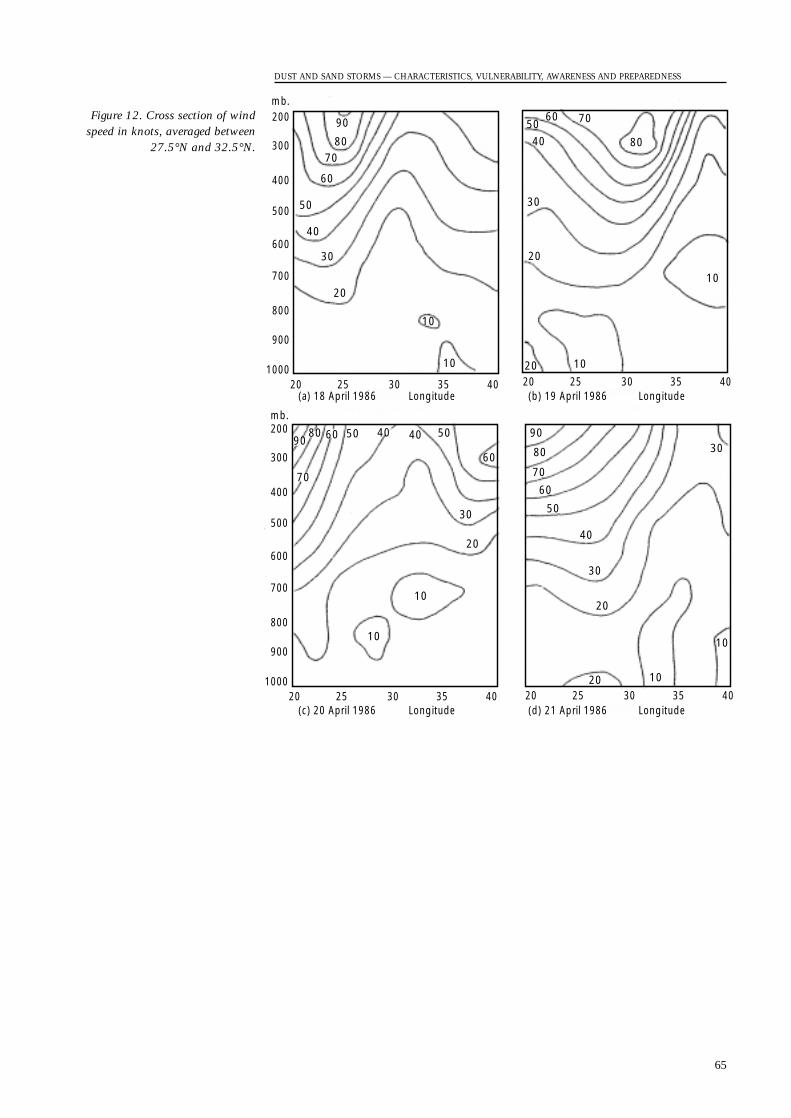
DUST AND SAND STORMS — CHARACTERISTICS, VULNERABILITY, AWARENESS AND PREPAREDNESS
65
mb.200
300
400
500
600
700
800
900
100020 25 30 35 40
mb.200
300
400
500
600
700
800
900
100020 25 30 35 40 20 25 30 35 40
20 25 30 35 40Longitude Longitude(a) 18 April 1986 (b) 19 April 1986
Longitude Longitude(c) 20 April 1986 (d) 21 April 1986
90
9090
80
80
80
8070
70 70
70
60
60
60
60
60
50
50
50
50
50
40
40
40
40
40
30
30
30
30
30
20
20
20
20
20
20
10
10
10
10
10
10
10
10
Figure 12. Cross section of windspeed in knots, averaged between
27.5°N and 32.5°N.
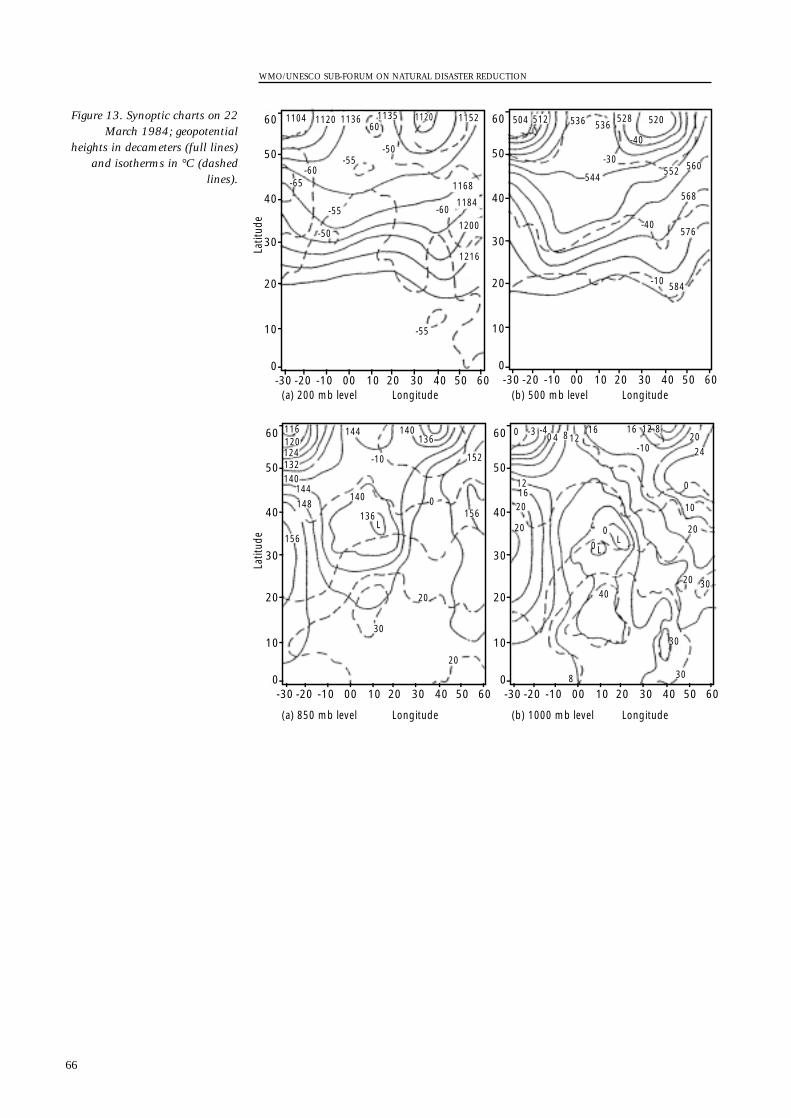
WMO/UNESCO SUB-FORUM ON NATURAL DISASTER REDUCTION
66
60
50
40
30
20
10
0-30 -20 -10 00 10 20 30 40 50 60
60
50
40
30
20
10
0-30 -20 -10 00 10 20 30 40 50 60
60
50
40
30
20
10
0-30 -20 -10 00 10 20 30 40 50 60
60
50
40
30
20
10
0-30 -20 -10 00 10 20 30 40 50 60
1104 1120 1136
1168
1184
1200
1216
1135 1152112060
-50
-50
-60
-60-65
-55
-55
-55
Latit
ude
Latit
ude
Longitude Longitude(a) 200 mb level (b) 500 mb level
Longitude Longitude(a) 850 mb level (b) 1000 mb level
504 512 536 536528 520
-40
-30
-40
-10
544552 560
568
576
584
116120124132
136
140
140
136
-10
140
144
144
148
152
156
156
0
20
20
30
L
8
884
30
30
3020
2024
20
10
0
40
1212
121620
20
1616
-10
0
0
0
-3 -40
LL
Figure 13. Synoptic charts on 22March 1984; geopotential
heights in decameters (full lines)and isotherms in °C (dashed
lines).
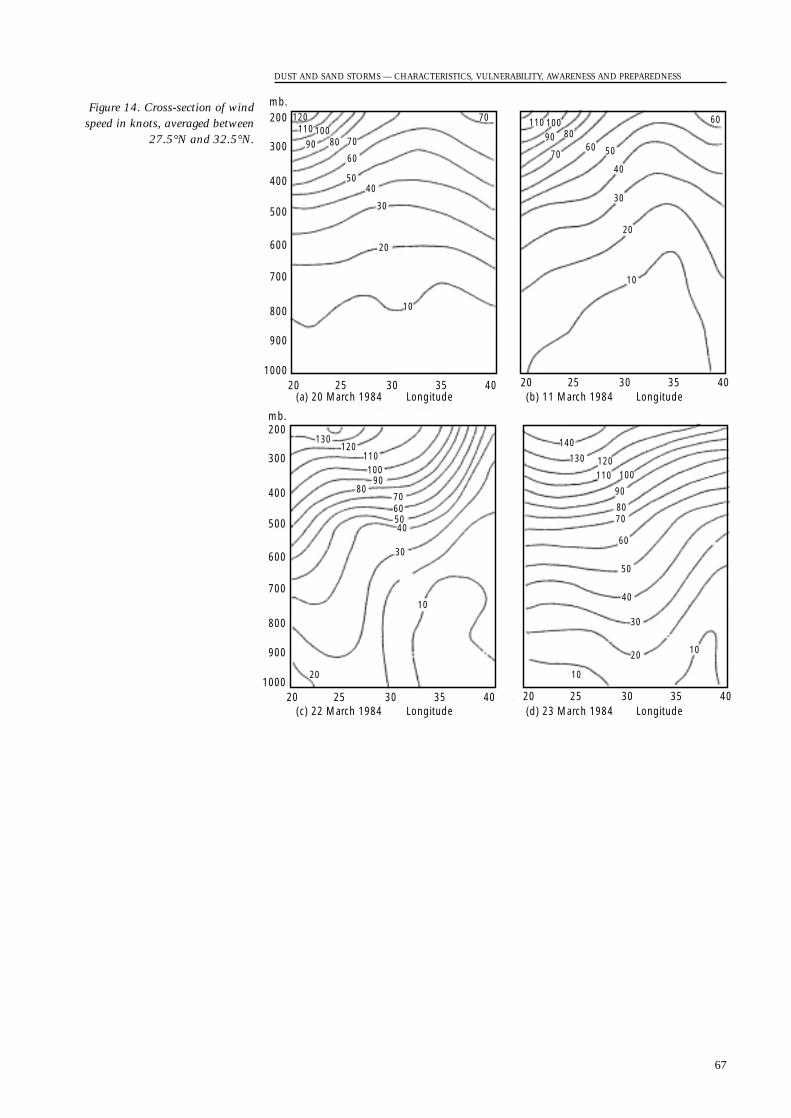
DUST AND SAND STORMS — CHARACTERISTICS, VULNERABILITY, AWARENESS AND PREPAREDNESS
67
mb.200
300
400
500
600
700
800
900
100020 25 30 35 40
mb.200
300
400
500
600
700
800
900
100020 25 30 35 40 20 25 30 35 40
20 25 30 35 40Longitude Longitude(a) 20 March 1984 (b) 11 March 1984
Longitude Longitude(c) 22 March 1984 (d) 23 March 1984
120
130120
110100
9080
70605040
30
20
10
130
140
120110 100
90
8070
60
50
40
30
20 10
10
11010090 80 70
70 110 10090 80
7060
60
50
40
30
20
10
60
5040
30
20
10
Figure 14. Cross-section of windspeed in knots, averaged between
27.5°N and 32.5°N.
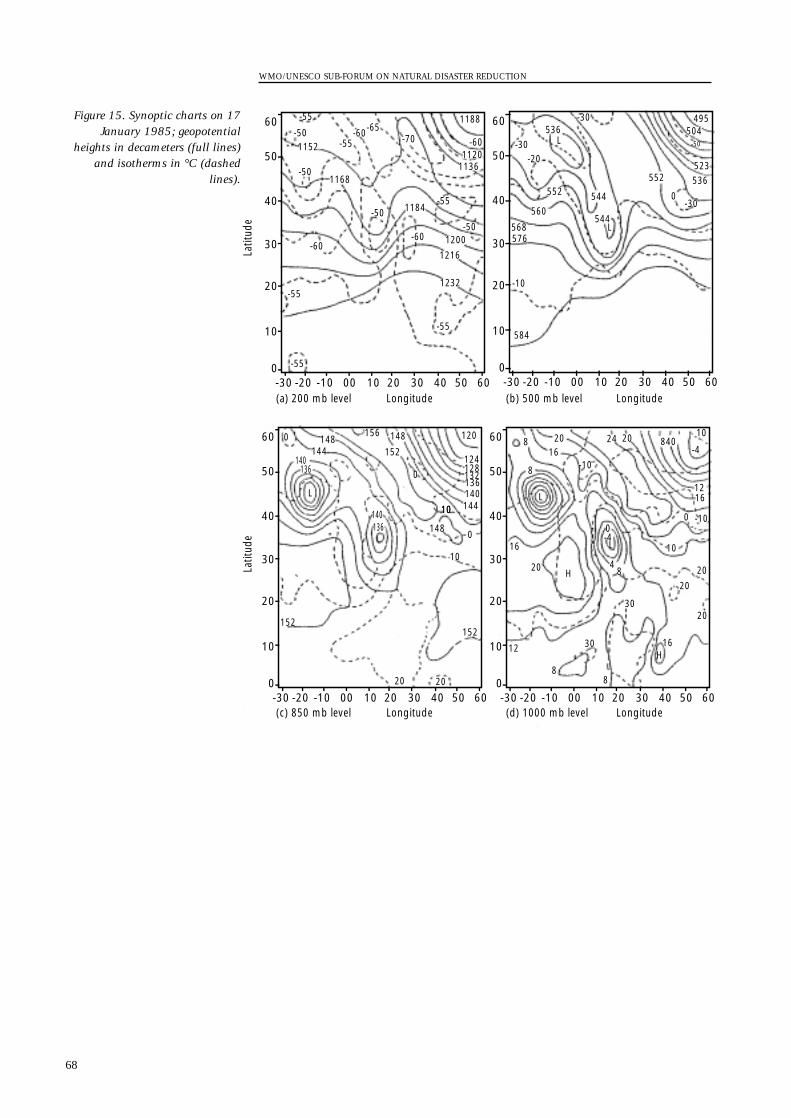
WMO/UNESCO SUB-FORUM ON NATURAL DISASTER REDUCTION
68
60
50
40
30
20
10
0-30 -20 -10 00 10 20 30 40 50 60
60
50
40
30
20
10
0-30 -20 -10 00 10 20 30 40 50 60
60
50
40
30
20
10
0-30 -20 -10 00 10 20 30 40 50 60
60
50
40
30
20
10
0-30 -20 -10 00 10 20 30 40 50 60
Longitude
Latit
ude
Latit
ude
Longitude(a) 200 mb level (b) 500 mb level
Longitude Longitude(c) 850 mb level (d) 1000 mb level
-55
-55
-55
-55
-55584
576568
536
560
552 544
552
495504
523536
544
-10
-20-30
-30
-30
-50
-55
-65-60
-60
-60
-60
-70-50
-50
-50-50
11521120
1136
1184
1200
1216
1232
1168
1188
L
L
0
10
10
1216
16
20
20
20
20
20
152152
20
30
30
20
2016
-10
-10
16
12
24-4
-4
8408
8
L
0
H
H
0
L
8
84
8
10
136
136
140
140
L
0144
148 148156
152
0
120
124128132136140144
1480
1010
Figure 15. Synoptic charts on 17January 1985; geopotential
heights in decameters (full lines)and isotherms in °C (dashed
lines).
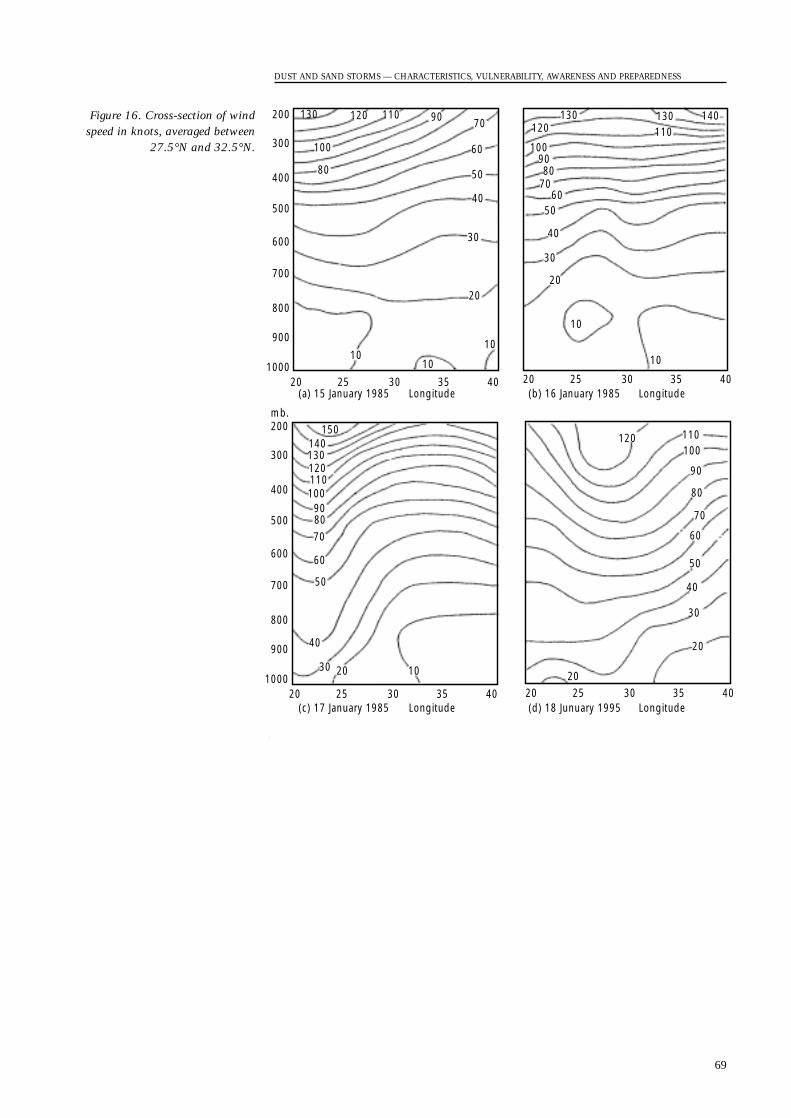
DUST AND SAND STORMS — CHARACTERISTICS, VULNERABILITY, AWARENESS AND PREPAREDNESS
69
200
300
400
500
600
700
800
900
100020 25 30 35 40
mb.200
300
400
500
600
700
800
900
100020 25 30 35 40 20 25 30 35 40
20 25 30 35 40Longitude Longitude(a) 15 January 1985 (b) 16 January 1985
Longitude Longitude(c) 17 January 1985 (d) 18 Junuary 1995
130 120 110
100 100
90
80
70
60
50
40
30
20
1010
10
130120 110
130 140
9080
7060
50
40
30
20
10
10
100120 110
90
80
70
60
50
40
30
20
100
120
150140130
110
908070
60
50
40
30 20 10 20
Figure 16. Cross-section of windspeed in knots, averaged between
27.5°N and 32.5°N.
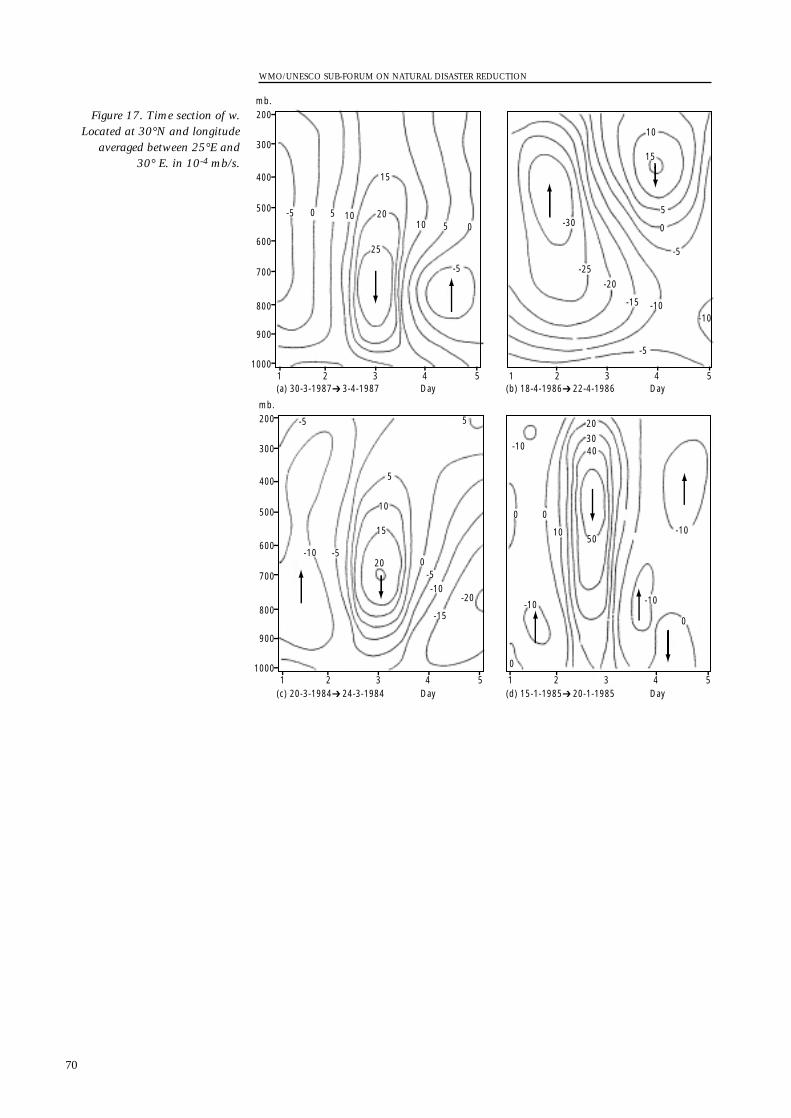
WMO/UNESCO SUB-FORUM ON NATURAL DISASTER REDUCTION
70
mb.200
300
400
500
600
700
800
900
10001 2 3 4 5
mb.200
300
400
500
600
700
800
900
10001 2 3 4 5 1 2 3 4 5
1 2 3 4 5
-5
-5
-5
-5
-5
-5
-5
00
0
0 0
0
0
05
5
5
5
51010
10
10
-10
-10
-10
-10
-10
-10
-10
-10
-15
-15
-20
-20
-25
-30
10
15
15
15
20
20
3040
50
20
25
Day(a) 30-3-1987 3-4-1987 Day(b) 18-4-1986 22-4-1986
Day(c) 20-3-1984 24-3-1984 Day(d) 15-1-1985 20-1-1985
Figure 17. Time section of w.Located at 30°N and longitude
averaged between 25°E and30° E. in 10-4 mb/s.

APPENDIX I
The statement of equation of motion in the form ma = net force, for unit massand frictionless motion is
(I.1)
Where f is the natural frequency of the system (f is coriolis parameter forinitial oscilation)
Ao Sin wt is the driving force with frequency w.The general solution for 1.1
(I.2)
The first term in (1) is the free oscilation.
The period of the free oscillation =
The second term represents a forced oscillation with constant amplitude andwith the same period as the external force.
The resonance phenomenon itself is represented by the result that amplitudebecomes infinitely large at f = w. At latitude 30 the inertial oscilation has a period=
The equation of motion for oscilation with damping
where is the damping force.
The general solution for oscilation with damping
where B is the phase angle
t and B
C W
f –W=
2 2
u = Uo e Sin t f – cAo Sin wt – B
f – w C w
(C )o
t2 2 2
2 2 2 2 2
14
4
+
+( )
( ) +
α
C
dudt
d u
dtC
dudt
f u Ao Sin wt2
22+ + =
22 30
24TTSinΩ
= hr.
2TTf
u Uo Sin ft
Ao Sin wt
f w= +
2 2–
d u
dtf u Ao Sin wt
2
22+ =
FUNDAMENTAL ASPECTSOF RESONANCE
71
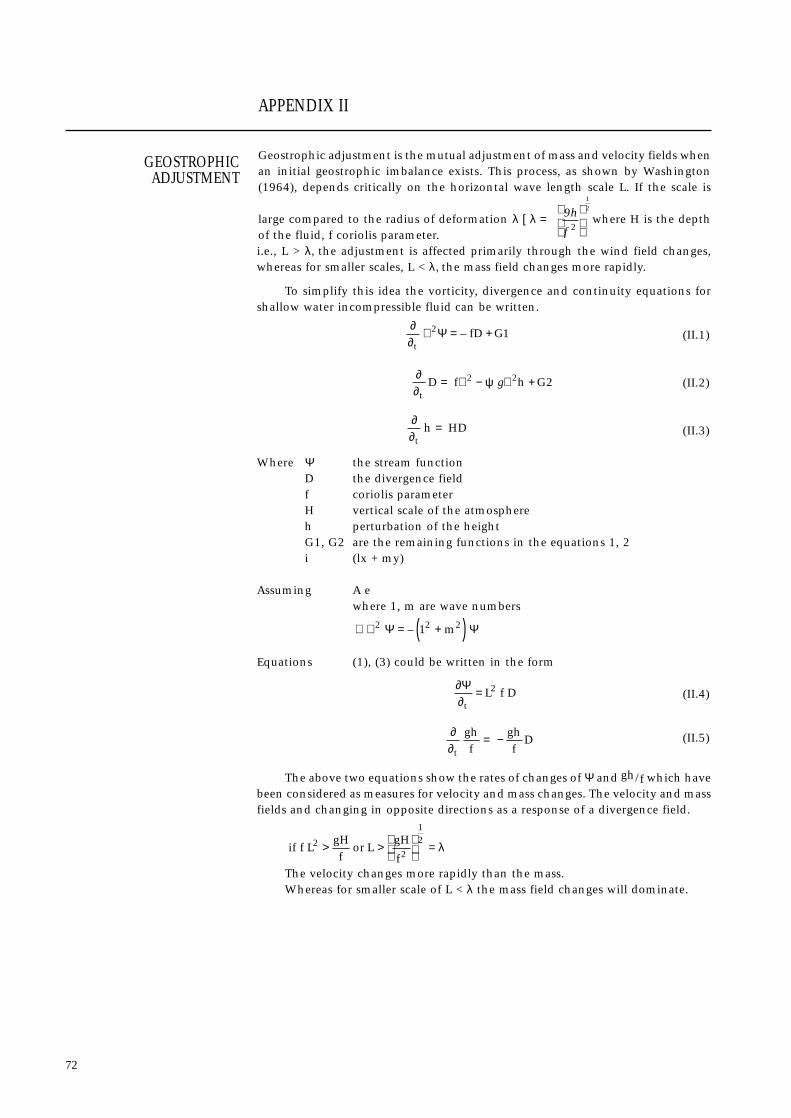
APPENDIX II
Geostrophic adjustment is the mutual adjustment of mass and velocity fields whenan initial geostrophic imbalance exists. This process, as shown by Washington(1964), depends critically on the horizontal wave length scale L. If the scale is
large compared to the radius of deformation λ [ λ = where H is the depthof the fluid, f coriolis parameter.i.e., L > λ, the adjustment is affected primarily through the wind field changes,whereas for smaller scales, L < λ, the mass field changes more rapidly.
To simplify this idea the vorticity, divergence and continuity equations forshallow water incompressible fluid can be written.
(II.1)
(II.2)
(II.3)
Where Ψ the stream functionD the divergence fieldf coriolis parameterH vertical scale of the atmosphereh perturbation of the heightG1, G2 are the remaining functions in the equations 1, 2i (lx + my)
Assuming A ewhere 1, m are wave numbers
Equations (1), (3) could be written in the form
(II.4)
(II.5)
The above two equations show the rates of changes of Ψ and gh/f which havebeen considered as measures for velocity and mass changes. The velocity and massfields and changing in opposite directions as a response of a divergence field.
The velocity changes more rapidly than the mass.Whereas for smaller scale of L < λ the mass field changes will dominate.
if f LgHf
or LgH
f2
2
12
> >
= λ
∂∂t
ghf
ghf
D= −
∂∂Ψ
tL f D= 2
∴ ∇ = +( )2 2 21Ψ Ψ– m
∂∂t
h HD=
∂∂
ψt
D f h G= ∇ − ∇ +2 2 2g
∂∂t
fD G∇ = +2 1Ψ –
9h
f 2
12
GEOSTROPHICADJUSTMENT
72
APPENDIX III
A dust storm usually arrives suddenly in the form of all advancing wall of dustand debris which may be miles long and several thousand feet high. They strikewith little warning, making driving conditions hazardous. Blinding, choking dustcan quickly reduce visibility, causing accidents that may involve chain collisions,creating massive pile-ups. Dust storms usually last only a few minutes, but theactions a motorist takes during the storm may be the most important of his or herlife.
• If dense dust is observed blowing across or approaching a roadway, pull yourvehicle off the pavement as far as possible, stop, turn off lights, set the emer-gency brake, take your foot off of the brake pedal to be sure the tail lights arenot illuminated.
• Don’t enter the dust storm area if you can avoid it.• If you can’t pull off the roadway, proceed at a speed suitable for visibility,
turn on the lights and sound the horn occasionally. Use the painted centerline to help guide you. Look for a safe place to pull off the road.
• Never stop on the travelled portion of the road.
In the past, motorists driving in dust storms have pulled off the roadway, leavinglights on. Vehicles approaching from the rear and using the advance car’s lightsas a guide have inadvertently left the road and in some instances collided withthe parked vehicle. Make sure all of your lights are off when you park off the road.
During threatening weather listen to commercial radio or television or NOAAWeather Radio for Dust Storm Warnings. A dust storm (or sand storm) warningmeans: Visibility of 1/2 mile or less due to blowing dust or sand, and wind speedsof 30 miles an hour or more.
NOAA/PA 82002
HEED WARNINGS
LIGHTS OUT!
DUST STORM SAFETY TIPS
MOTORISTS BEWARE!
73
MITIGATING THE EFFECTS OF EARTHQUAKES: PROBLEMS, PROGRESS AND FUTURE TRENDS
By Alan G. Green; Institute of Geophysics, Zürich
Over the past few decades, seismologists have made enormous progress in under-standing the physical processes that govern the occurrence of earthquakes. Forexample, we now know that most earth tremors are generated by stresses thataccumulate along the boundaries between the giant tectonic plates that consti-tute the Earth's outermost rigid layer. Seismologists have estimated the sense ofground displacement to be expected in many seismically active regions, and expe-rience has shown that damage caused by direct shaking of the ground can beaugmented markedly by such secondary effects as fires, landslides and tsunamis.Moreover, the number of fatalities and level of damage created by an earthquakeare not only dependent on the size and location of the event, but they are alsoaffected significantly by the quality of the buildings and the local ground condi-tions.
Nevertheless, one of the major goals of seismology, that of short-term (daysto weeks) earthquake prediction, remains as elusive as ever. Although some seis-mologists claim that earthquakes may be predictable in the not-too-distant future,others suggest that their occurrence is essentially random and that research intoearthquake prediction may be futile. By comparison, trustworthy earthquakehazard and risk assessments based on time scales of tens to hundreds of years arerealizable. In many regions, these assessments are benefiting from the results ofglobal projects aimed at:
(i) compiling dependable earthquake statistics, (ii) ascertaining the present state of stress and strain rate,
(iii) mapping the distribution of active faults, (iv) determining the rate of seismicity in the distant past, and(v) estimating the expected level of ground-shaking by means of computer model-
ling. Furthermore, fast inexpensive computer technologies are allowing earlywarning and early-damage assessment strategies to be developed, such that disas-ter response personnel can be either forewarned of damaging waves approachingor informed where the most intense ground-shaking has occurred.
As the International Decade of Natural Disaster Reduction (IDNDR) comes toan end, it is appropriate to consider how mitigation and preparedness measuresfor the natural disasters that will inevitably affect our planet may be betterpromoted and implemented. One approach is to concentrate our efforts on thelarge urban centres of the developing world, where the effects of natural disasterscan be devastating to the people, their economy, their culture, and their environ-ment. Several programs aimed at improving capacities for natural disastermitigation and preparedness in the megacities of the developing world arecurrently underway.
Earthquakes are amongst the most damaging natural phenomena to affect theEarth. Since the beginning of this century, more than two million people havelost their lives as a direct or indirect consequence of violent shaking of theground. Two of the three most costly natural disasters to strike our planet since1980 were the Northridge (California) and Kobe (Japan) earthquakes. Economiclosses due to the Northridge event exceeded $30 billion and those due to the Kobeexceeded $100 billion. Although these were only moderate magnitude earth-quakes (Northridge: 6.8; Kobe: 6.9), they generated ground accelerations overlarge areas that approached or exceeded that of the Earth’s gravitational field.These events were not the so-called "Big Ones”, which will eventually strikeCalifornia and Japan. The Big Ones are likely to have magnitudes greater than 8,resulting in the release of thirty times more energy than either the Northridge orKobe earthquakes. Based on recent experiences, losses due to the Big Ones in
1.INTRODUCTION
ABSTRACT
74
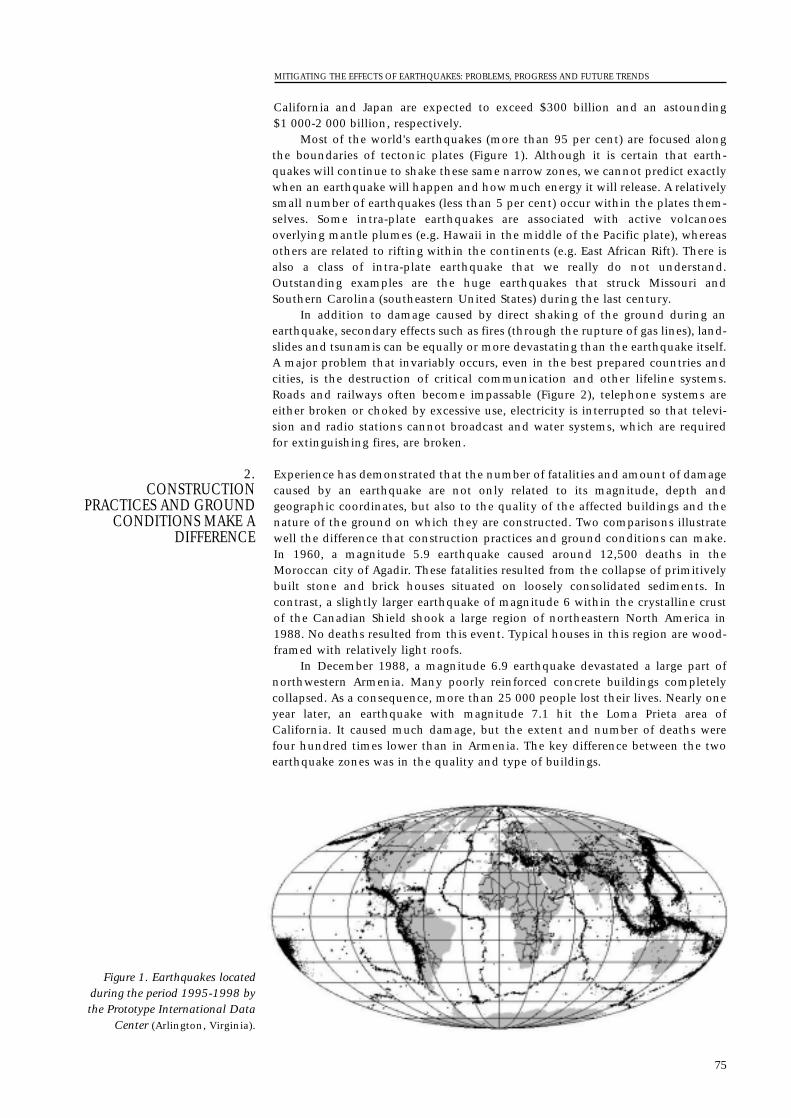
California and Japan are expected to exceed $300 billion and an astounding$1 000-2 000 billion, respectively.
Most of the world's earthquakes (more than 95 per cent) are focused alongthe boundaries of tectonic plates (Figure 1). Although it is certain that earth-quakes will continue to shake these same narrow zones, we cannot predict exactlywhen an earthquake will happen and how much energy it will release. A relativelysmall number of earthquakes (less than 5 per cent) occur within the plates them-selves. Some intra-plate earthquakes are associated with active volcanoesoverlying mantle plumes (e.g. Hawaii in the middle of the Pacific plate), whereasothers are related to rifting within the continents (e.g. East African Rift). There isalso a class of intra-plate earthquake that we really do not understand.Outstanding examples are the huge earthquakes that struck Missouri andSouthern Carolina (southeastern United States) during the last century.
In addition to damage caused by direct shaking of the ground during anearthquake, secondary effects such as fires (through the rupture of gas lines), land-slides and tsunamis can be equally or more devastating than the earthquake itself.A major problem that invariably occurs, even in the best prepared countries andcities, is the destruction of critical communication and other lifeline systems.Roads and railways often become impassable (Figure 2), telephone systems areeither broken or choked by excessive use, electricity is interrupted so that televi-sion and radio stations cannot broadcast and water systems, which are requiredfor extinguishing fires, are broken.
Experience has demonstrated that the number of fatalities and amount of damagecaused by an earthquake are not only related to its magnitude, depth andgeographic coordinates, but also to the quality of the affected buildings and thenature of the ground on which they are constructed. Two comparisons illustratewell the difference that construction practices and ground conditions can make.In 1960, a magnitude 5.9 earthquake caused around 12,500 deaths in theMoroccan city of Agadir. These fatalities resulted from the collapse of primitivelybuilt stone and brick houses situated on loosely consolidated sediments. Incontrast, a slightly larger earthquake of magnitude 6 within the crystalline crustof the Canadian Shield shook a large region of northeastern North America in1988. No deaths resulted from this event. Typical houses in this region are wood-framed with relatively light roofs.
In December 1988, a magnitude 6.9 earthquake devastated a large part ofnorthwestern Armenia. Many poorly reinforced concrete buildings completelycollapsed. As a consequence, more than 25 000 people lost their lives. Nearly oneyear later, an earthquake with magnitude 7.1 hit the Loma Prieta area ofCalifornia. It caused much damage, but the extent and number of deaths werefour hundred times lower than in Armenia. The key difference between the twoearthquake zones was in the quality and type of buildings.
2.CONSTRUCTION
PRACTICES AND GROUNDCONDITIONS MAKE A
DIFFERENCE
MITIGATING THE EFFECTS OF EARTHQUAKES: PROBLEMS, PROGRESS AND FUTURE TRENDS
75
Figure 1. Earthquakes locatedduring the period 1995-1998 bythe Prototype International Data
Center (Arlington, Virginia).
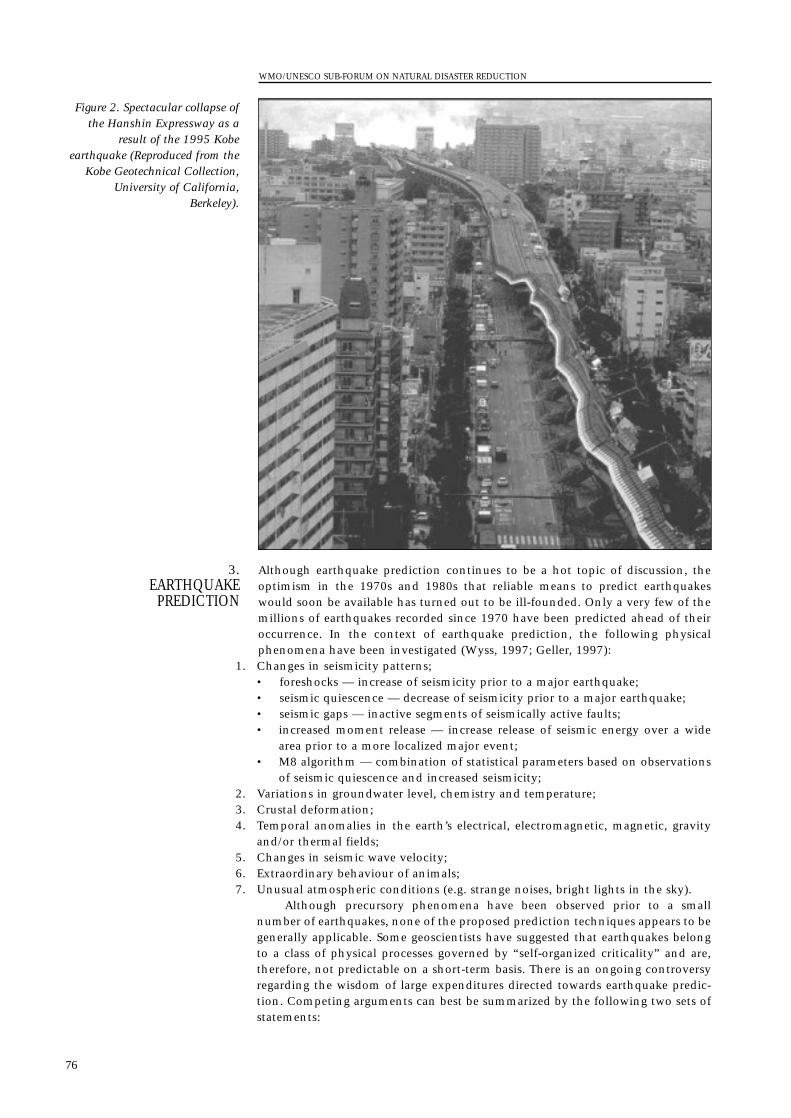
Although earthquake prediction continues to be a hot topic of discussion, theoptimism in the 1970s and 1980s that reliable means to predict earthquakeswould soon be available has turned out to be ill-founded. Only a very few of themillions of earthquakes recorded since 1970 have been predicted ahead of theiroccurrence. In the context of earthquake prediction, the following physicalphenomena have been investigated (Wyss, 1997; Geller, 1997):
1. Changes in seismicity patterns;• foreshocks — increase of seismicity prior to a major earthquake;• seismic quiescence — decrease of seismicity prior to a major earthquake;• seismic gaps — inactive segments of seismically active faults;• increased moment release — increase release of seismic energy over a wide
area prior to a more localized major event;• M8 algorithm — combination of statistical parameters based on observations
of seismic quiescence and increased seismicity;2. Variations in groundwater level, chemistry and temperature;3. Crustal deformation;4. Temporal anomalies in the earth’s electrical, electromagnetic, magnetic, gravity
and/or thermal fields;5. Changes in seismic wave velocity;6. Extraordinary behaviour of animals;7. Unusual atmospheric conditions (e.g. strange noises, bright lights in the sky).
Although precursory phenomena have been observed prior to a smallnumber of earthquakes, none of the proposed prediction techniques appears to begenerally applicable. Some geoscientists have suggested that earthquakes belongto a class of physical processes governed by “self-organized criticality” and are,therefore, not predictable on a short-term basis. There is an ongoing controversyregarding the wisdom of large expenditures directed towards earthquake predic-tion. Competing arguments can best be summarized by the following two sets ofstatements:
3.EARTHQUAKE
PREDICTION
WMO/UNESCO SUB-FORUM ON NATURAL DISASTER REDUCTION
76
Figure 2. Spectacular collapse ofthe Hanshin Expressway as a
result of the 1995 Kobeearthquake (Reproduced from the
Kobe Geotechnical Collection,University of California,
Berkeley).
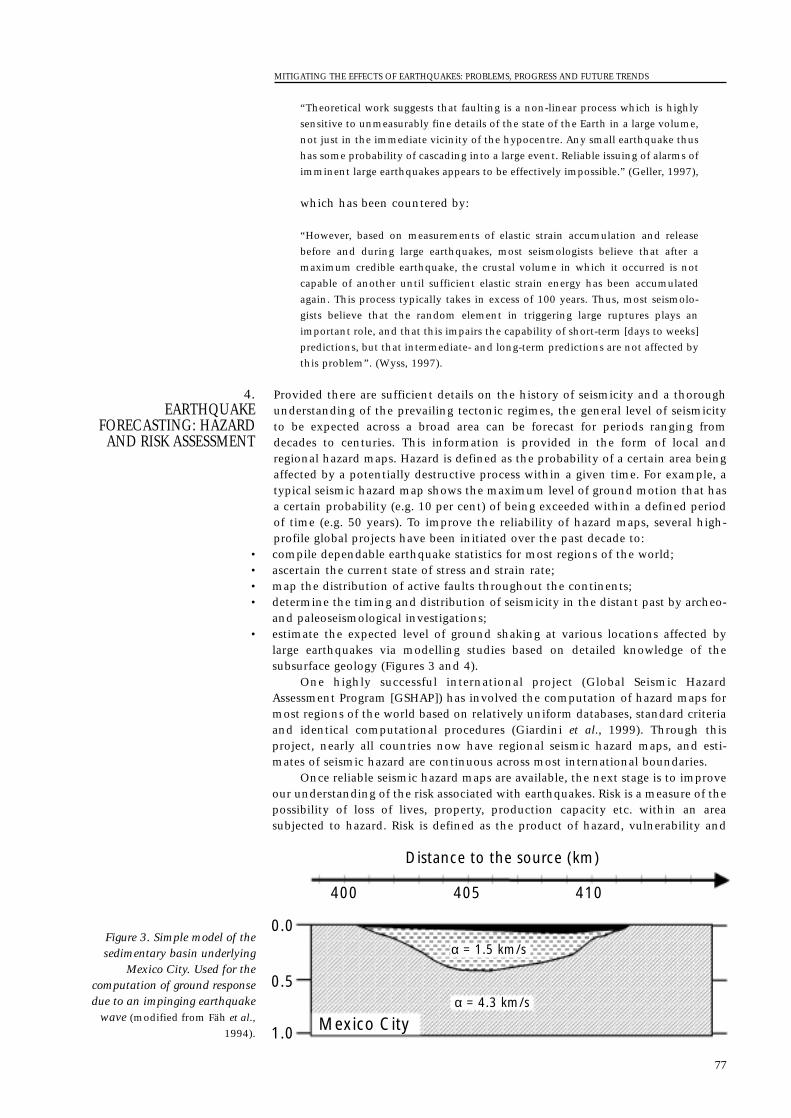
“Theoretical work suggests that faulting is a non-linear process which is highly
sensitive to unmeasurably fine details of the state of the Earth in a large volume,
not just in the immediate vicinity of the hypocentre. Any small earthquake thus
has some probability of cascading into a large event. Reliable issuing of alarms of
imminent large earthquakes appears to be effectively impossible.” (Geller, 1997),
which has been countered by:
“However, based on measurements of elastic strain accumulation and release
before and during large earthquakes, most seismologists believe that after a
maximum credible earthquake, the crustal volume in which it occurred is not
capable of another until sufficient elastic strain energy has been accumulated
again. This process typically takes in excess of 100 years. Thus, most seismolo-
gists believe that the random element in triggering large ruptures plays an
important role, and that this impairs the capability of short-term [days to weeks]
predictions, but that intermediate- and long-term predictions are not affected by
this problem”. (Wyss, 1997).
Provided there are sufficient details on the history of seismicity and a thoroughunderstanding of the prevailing tectonic regimes, the general level of seismicityto be expected across a broad area can be forecast for periods ranging fromdecades to centuries. This information is provided in the form of local andregional hazard maps. Hazard is defined as the probability of a certain area beingaffected by a potentially destructive process within a given time. For example, atypical seismic hazard map shows the maximum level of ground motion that hasa certain probability (e.g. 10 per cent) of being exceeded within a defined periodof time (e.g. 50 years). To improve the reliability of hazard maps, several high-profile global projects have been initiated over the past decade to:
• compile dependable earthquake statistics for most regions of the world;• ascertain the current state of stress and strain rate;• map the distribution of active faults throughout the continents;• determine the timing and distribution of seismicity in the distant past by archeo-
and paleoseismological investigations;• estimate the expected level of ground shaking at various locations affected by
large earthquakes via modelling studies based on detailed knowledge of thesubsurface geology (Figures 3 and 4).
One highly successful international project (Global Seismic HazardAssessment Program [GSHAP]) has involved the computation of hazard maps formost regions of the world based on relatively uniform databases, standard criteriaand identical computational procedures (Giardini et al., 1999). Through thisproject, nearly all countries now have regional seismic hazard maps, and esti-mates of seismic hazard are continuous across most international boundaries.
Once reliable seismic hazard maps are available, the next stage is to improveour understanding of the risk associated with earthquakes. Risk is a measure of thepossibility of loss of lives, property, production capacity etc. within an areasubjected to hazard. Risk is defined as the product of hazard, vulnerability and
4.EARTHQUAKE
FORECASTING: HAZARDAND RISK ASSESSMENT
MITIGATING THE EFFECTS OF EARTHQUAKES: PROBLEMS, PROGRESS AND FUTURE TRENDS
77
Distance to the source (km)
400 405 410
0.0
0.5
1.0
α = 1.5 km/s
α = 4.3 km/s
Mexico City
Figure 3. Simple model of thesedimentary basin underlying
Mexico City. Used for thecomputation of ground responsedue to an impinging earthquake
wave (modified from Fäh et al.,
1994).
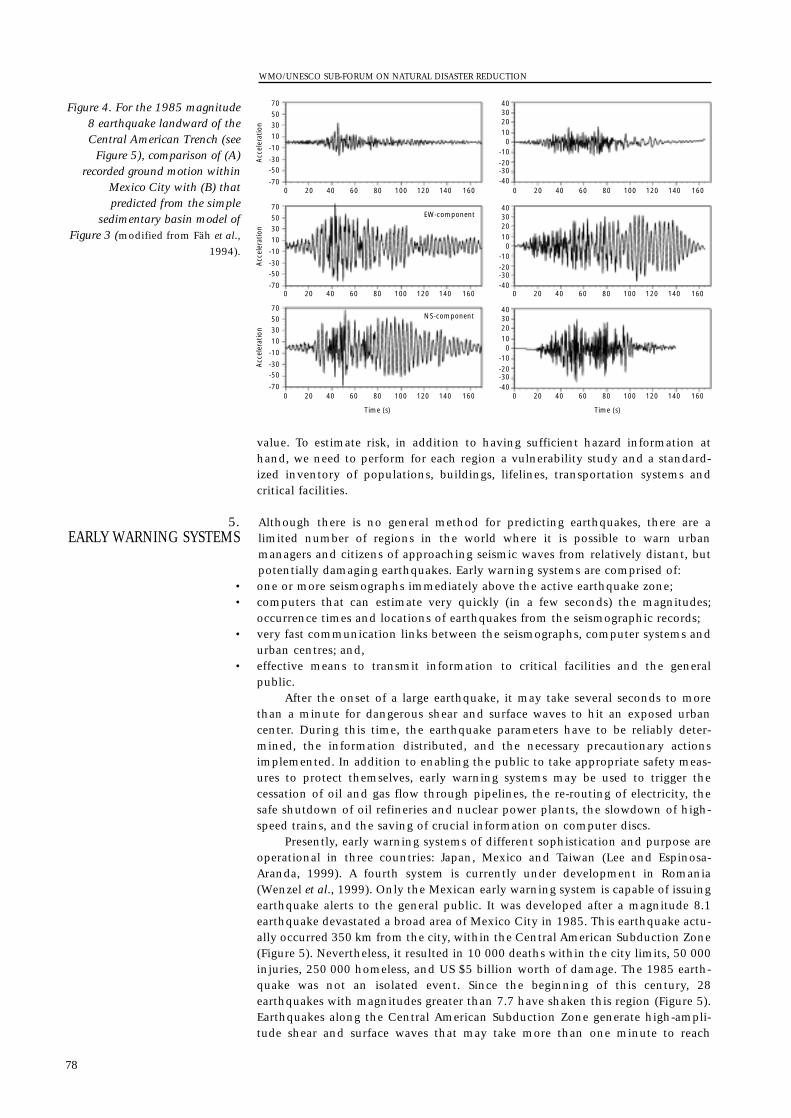
value. To estimate risk, in addition to having sufficient hazard information athand, we need to perform for each region a vulnerability study and a standard-ized inventory of populations, buildings, lifelines, transportation systems andcritical facilities.
Although there is no general method for predicting earthquakes, there are alimited number of regions in the world where it is possible to warn urbanmanagers and citizens of approaching seismic waves from relatively distant, butpotentially damaging earthquakes. Early warning systems are comprised of:
• one or more seismographs immediately above the active earthquake zone;• computers that can estimate very quickly (in a few seconds) the magnitudes;
occurrence times and locations of earthquakes from the seismographic records;• very fast communication links between the seismographs, computer systems and
urban centres; and,• effective means to transmit information to critical facilities and the general
public.After the onset of a large earthquake, it may take several seconds to more
than a minute for dangerous shear and surface waves to hit an exposed urbancenter. During this time, the earthquake parameters have to be reliably deter-mined, the information distributed, and the necessary precautionary actionsimplemented. In addition to enabling the public to take appropriate safety meas-ures to protect themselves, early warning systems may be used to trigger thecessation of oil and gas flow through pipelines, the re-routing of electricity, thesafe shutdown of oil refineries and nuclear power plants, the slowdown of high-speed trains, and the saving of crucial information on computer discs.
Presently, early warning systems of different sophistication and purpose areoperational in three countries: Japan, Mexico and Taiwan (Lee and Espinosa-Aranda, 1999). A fourth system is currently under development in Romania(Wenzel et al., 1999). Only the Mexican early warning system is capable of issuingearthquake alerts to the general public. It was developed after a magnitude 8.1earthquake devastated a broad area of Mexico City in 1985. This earthquake actu-ally occurred 350 km from the city, within the Central American Subduction Zone(Figure 5). Nevertheless, it resulted in 10 000 deaths within the city limits, 50 000injuries, 250 000 homeless, and US $5 billion worth of damage. The 1985 earth-quake was not an isolated event. Since the beginning of this century, 28earthquakes with magnitudes greater than 7.7 have shaken this region (Figure 5).Earthquakes along the Central American Subduction Zone generate high-ampli-tude shear and surface waves that may take more than one minute to reach
5.EARLY WARNING SYSTEMS
WMO/UNESCO SUB-FORUM ON NATURAL DISASTER REDUCTION
78
70
-70
50
-50
30
-30
10
-10
70
-70
50
-50
30
-30
10
-10
70
-70
50
-50
30
-30
10
-10
400 20 60 80 100 140 160120
400 20 60 80 100 140 160120
400 20 60 80 100 140 160120
400 20 60 80 100 140 160120
400 20 60 80 100 140 160120
400 20 60 80 100 140 160120
40302010
0-10-20-30-40
40302010
0-10-20-30-40
40302010
0-10-20-30-40
NS-component
EW-component
Acc
eler
atio
nA
ccel
erat
ion
Acc
eler
atio
n
Time (s) Time (s)
Figure 4. For the 1985 magnitude8 earthquake landward of theCentral American Trench (see
Figure 5), comparison of (A)recorded ground motion within
Mexico City with (B) thatpredicted from the simple
sedimentary basin model ofFigure 3 (modified from Fäh et al.,
1994).
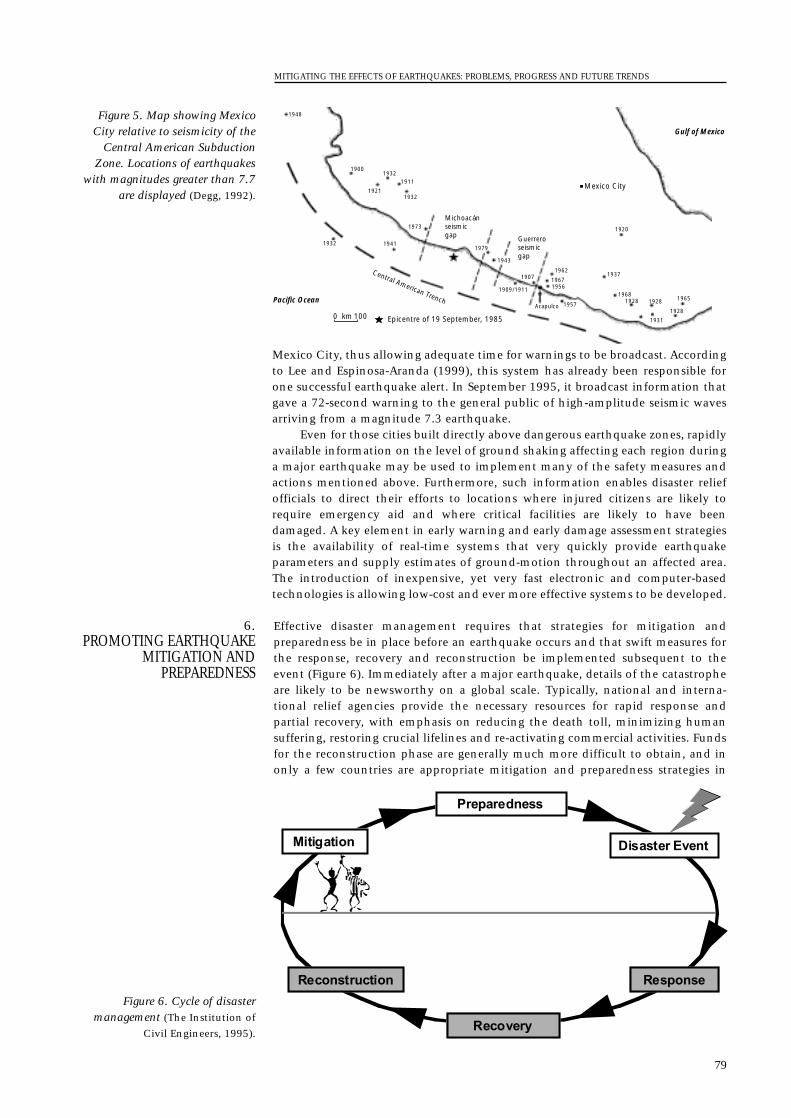
Mexico City, thus allowing adequate time for warnings to be broadcast. Accordingto Lee and Espinosa-Aranda (1999), this system has already been responsible forone successful earthquake alert. In September 1995, it broadcast information thatgave a 72-second warning to the general public of high-amplitude seismic wavesarriving from a magnitude 7.3 earthquake.
Even for those cities built directly above dangerous earthquake zones, rapidlyavailable information on the level of ground shaking affecting each region duringa major earthquake may be used to implement many of the safety measures andactions mentioned above. Furthermore, such information enables disaster reliefofficials to direct their efforts to locations where injured citizens are likely torequire emergency aid and where critical facilities are likely to have beendamaged. A key element in early warning and early damage assessment strategiesis the availability of real-time systems that very quickly provide earthquakeparameters and supply estimates of ground-motion throughout an affected area.The introduction of inexpensive, yet very fast electronic and computer-basedtechnologies is allowing low-cost and ever more effective systems to be developed.
Effective disaster management requires that strategies for mitigation andpreparedness be in place before an earthquake occurs and that swift measures forthe response, recovery and reconstruction be implemented subsequent to theevent (Figure 6). Immediately after a major earthquake, details of the catastropheare likely to be newsworthy on a global scale. Typically, national and interna-tional relief agencies provide the necessary resources for rapid response andpartial recovery, with emphasis on reducing the death toll, minimizing humansuffering, restoring crucial lifelines and re-activating commercial activities. Fundsfor the reconstruction phase are generally much more difficult to obtain, and inonly a few countries are appropriate mitigation and preparedness strategies in
6. PROMOTING EARTHQUAKE
MITIGATION ANDPREPAREDNESS
MITIGATING THE EFFECTS OF EARTHQUAKES: PROBLEMS, PROGRESS AND FUTURE TRENDS
79
1948
1900
1921
1932
1932 1941
1932
1973 1920
1965
1928
192819281968
19371907
1943
1979
1957
1909/1911 19561967
1962
1931
1911
Pacific Ocean
Gulf of Mexico
Mexico City
Acapulco
0 100km Epicentre of 19 September, 1985
Central American Trench
Michoacánseismicgap Guerrero
seismicgap
Figure 5. Map showing MexicoCity relative to seismicity of the
Central American SubductionZone. Locations of earthquakes
with magnitudes greater than 7.7are displayed (Degg, 1992).
Mitigation
Preparedness
Disaster Event
Reconstruction
Recovery
Response
Figure 6. Cycle of disastermanagement (The Institution of
Civil Engineers, 1995).
place. Yet, it has been estimated that for every dollar spent on the protection sideof the disaster mitigation cycle (Figure 6), ten dollars are saved on the recoveryside; efficient earthquake mitigation and preparedness strategies make economicsense.
A common mission of several projects contributing to the InternationalDecade of Natural Disaster Reduction (IDNDR) is to markedly increase theresources directed towards earthquake mitigation and preparedness. Here, threeinternational projects shall be mentioned briefly (WSSI, GHI, RADIUS) and afourth (EMI) reviewed in a little more detail.
One of the first projects to become truly operational as a result of IDNDR wasthe World Seismic Safety Initiative (WSSI), which was initiated in 1992 by theInternational Association for Earthquake Engineering. The goals of WSSI are to:
• disseminate state-of-the-art earthquake engineering information;• incorporate experience and research findings into recommended practices and
codes;• advance engineering knowledge through problem-focused research;• encourage governments and financial institutions to establish policies directed
towards understanding and preparing for future earthquakes.Countries in which WSSI has been particularly active include Bangladesh,
Burma, Malaysia, Nepal, Singapore, Sri Lanka, Uganda and Vietnam.GeoHazards International (GHI) was established in 1993 as a non-profit
organization dedicated to reducing earthquake-related death and injury in devel-oping countries. Until quite recently, GHI concentrated on two high-profiledevelopment and training projects, one in Quito (Ecuador) and one in Katmandu(Nepal). Over the past two years, GHI has also been a major contributor to theIDNDR project “Risk Assessment Tools for Diagnosis of Urban Areas againstSeismic Disaster (RADIUS)”. The principal objectives of the RADIUS project are toraise the awareness of earthquake risk among decision makers and the generalpublic, and to provide them with appropriate earthquake mitigation technologies.Specific components of RADIUS include the development of:
• seismic damage scenarios for several cities;• a practical manual for seismic damage assessment in urban areas;• guidelines for simple assessment of seismic safety of buildings and for practical
retrofitting.Cities chosen for full-case study by RADIUS are Addis Ababa (Ethiopia),
Guayaquil (Ecuador), Tashkent (Uzbekistan), Tijuana (Mexico) and Zigong(China). Also under investigation are the cities of Antofagasta (Chile), Bandung(Indonesia), Izmir (Turkey) and Skopje (TFYR Macedonia).
The Earthquakes and Megacities Initiative (EMI) is an international scientific non-governmental organization dedicated to the acceleration of earthquakemitigation, preparedness and recovery of large urban centres, with emphasis ondeveloping countries. EMI has many goals in common with other IDNDR-oriented projects. One difference is its concentration on problems associated withvery large cities. Growth in world population and urbanization is truly alarming.By the year 2000 it is expected that 450 cities with populations greater 1 millioninhabitants will crowd our planet. Of these, 50 cities with populations more than3.5 million and 25 with populations greater than 8 million will compete forlimited space and resources (Figure 7). More than half of these cities will belocated in the developing world, of which 50 per cent will be situated in majorearthquake zones (compare Figures 1 and 7). EMI’s multidisciplinary scientificagenda includes four major themes:
• modelling ground motion for realistic earthquake scenarios;• encouraging the installation of local seismographic and strong-motion
networks.• reviewing the effectiveness of building codes and their implementation;• developing methodologies for collecting standardized inventories of build-
ings, lifelines, transportation systems and critical facilities;
Determine vulnerability and risk by:
Assess earthquake hazard by:
6.1EARTHQUAKE AND
MEGACITIES INITIATIVE (EMI)
WMO/UNESCO SUB-FORUM ON NATURAL DISASTER REDUCTION
80
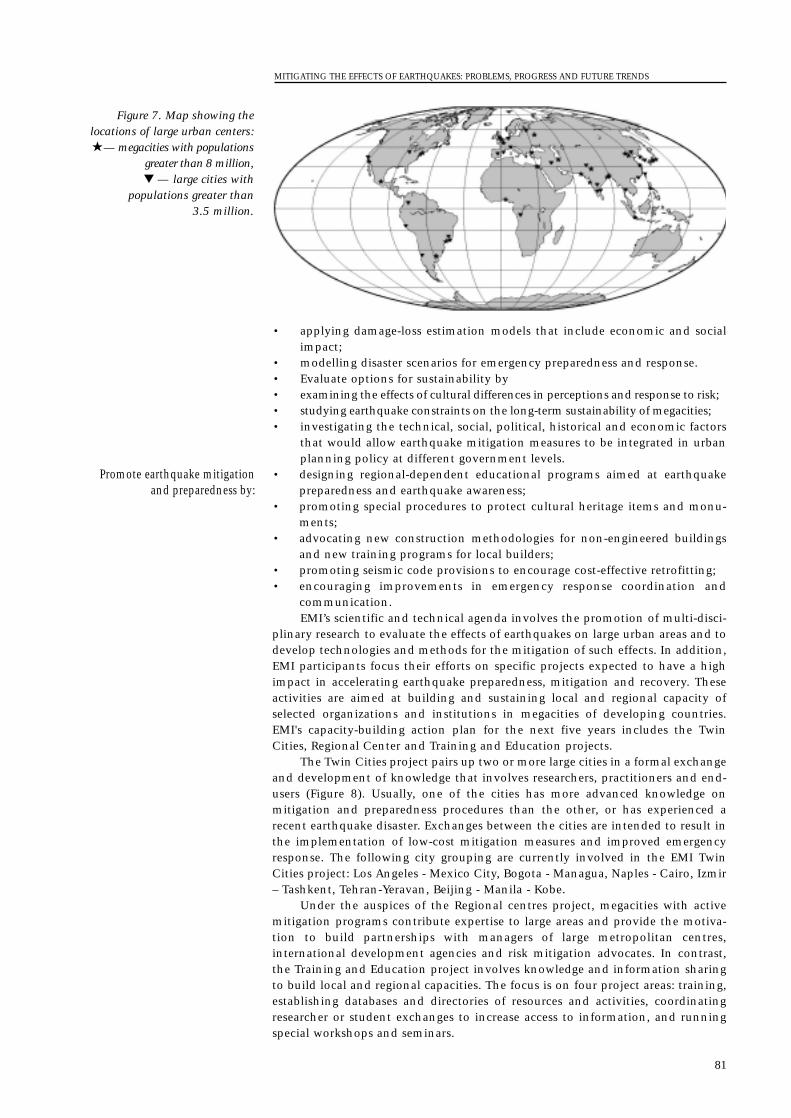
• applying damage-loss estimation models that include economic and socialimpact;
• modelling disaster scenarios for emergency preparedness and response.• Evaluate options for sustainability by• examining the effects of cultural differences in perceptions and response to risk;• studying earthquake constraints on the long-term sustainability of megacities;• investigating the technical, social, political, historical and economic factors
that would allow earthquake mitigation measures to be integrated in urbanplanning policy at different government levels.
• designing regional-dependent educational programs aimed at earthquakepreparedness and earthquake awareness;
• promoting special procedures to protect cultural heritage items and monu-ments;
• advocating new construction methodologies for non-engineered buildingsand new training programs for local builders;
• promoting seismic code provisions to encourage cost-effective retrofitting;• encouraging improvements in emergency response coordination and
communication.EMI’s scientific and technical agenda involves the promotion of multi-disci-
plinary research to evaluate the effects of earthquakes on large urban areas and todevelop technologies and methods for the mitigation of such effects. In addition,EMI participants focus their efforts on specific projects expected to have a highimpact in accelerating earthquake preparedness, mitigation and recovery. Theseactivities are aimed at building and sustaining local and regional capacity ofselected organizations and institutions in megacities of developing countries.EMI's capacity-building action plan for the next five years includes the TwinCities, Regional Center and Training and Education projects.
The Twin Cities project pairs up two or more large cities in a formal exchangeand development of knowledge that involves researchers, practitioners and end-users (Figure 8). Usually, one of the cities has more advanced knowledge onmitigation and preparedness procedures than the other, or has experienced arecent earthquake disaster. Exchanges between the cities are intended to result inthe implementation of low-cost mitigation measures and improved emergencyresponse. The following city grouping are currently involved in the EMI TwinCities project: Los Angeles - Mexico City, Bogota - Managua, Naples - Cairo, Izmir– Tashkent, Tehran-Yeravan, Beijing - Manila - Kobe.
Under the auspices of the Regional centres project, megacities with activemitigation programs contribute expertise to large areas and provide the motiva-tion to build partnerships with managers of large metropolitan centres,international development agencies and risk mitigation advocates. In contrast,the Training and Education project involves knowledge and information sharingto build local and regional capacities. The focus is on four project areas: training,establishing databases and directories of resources and activities, coordinatingresearcher or student exchanges to increase access to information, and runningspecial workshops and seminars.
Promote earthquake mitigationand preparedness by:
MITIGATING THE EFFECTS OF EARTHQUAKES: PROBLEMS, PROGRESS AND FUTURE TRENDS
81
Figure 7. Map showing thelocations of large urban centers: — megacities with populations
greater than 8 million, — large cities with
populations greater than3.5 million.
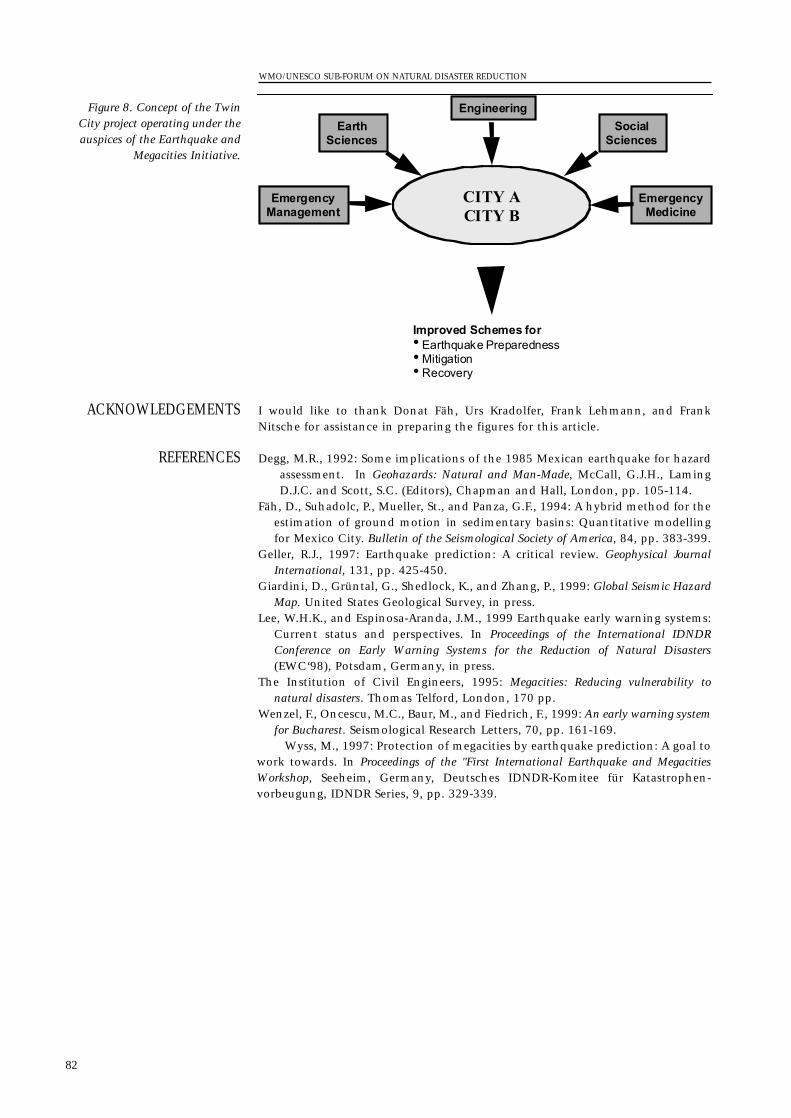
I would like to thank Donat Fäh, Urs Kradolfer, Frank Lehmann, and FrankNitsche for assistance in preparing the figures for this article.
Degg, M.R., 1992: Some implications of the 1985 Mexican earthquake for hazardassessment. In Geohazards: Natural and Man-Made, McCall, G.J.H., LamingD.J.C. and Scott, S.C. (Editors), Chapman and Hall, London, pp. 105-114.
Fäh, D., Suhadolc, P., Mueller, St., and Panza, G.F., 1994: A hybrid method for theestimation of ground motion in sedimentary basins: Quantitative modellingfor Mexico City. Bulletin of the Seismological Society of America, 84, pp. 383-399.
Geller, R.J., 1997: Earthquake prediction: A critical review. Geophysical JournalInternational, 131, pp. 425-450.
Giardini, D., Grüntal, G., Shedlock, K., and Zhang, P., 1999: Global Seismic HazardMap. United States Geological Survey, in press.
Lee, W.H.K., and Espinosa-Aranda, J.M., 1999 Earthquake early warning systems:Current status and perspectives. In Proceedings of the International IDNDRConference on Early Warning Systems for the Reduction of Natural Disasters(EWC‘98), Potsdam, Germany, in press.
The Institution of Civil Engineers, 1995: Megacities: Reducing vulnerability tonatural disasters. Thomas Telford, London, 170 pp.
Wenzel, F., Oncescu, M.C., Baur, M., and Fiedrich, F., 1999: An early warning systemfor Bucharest. Seismological Research Letters, 70, pp. 161-169.
Wyss, M., 1997: Protection of megacities by earthquake prediction: A goal towork towards. In Proceedings of the "First International Earthquake and MegacitiesWorkshop, Seeheim, Germany, Deutsches IDNDR-Komitee für Katastrophen-vorbeugung, IDNDR Series, 9, pp. 329-339.
REFERENCES
ACKNOWLEDGEMENTS
WMO/UNESCO SUB-FORUM ON NATURAL DISASTER REDUCTION
82
CITY ACITY B
EmergencyManagement
EarthSciences
Engineering
SocialSciences
EmergencyMedicine
Improved Schemes for• Earthquake Preparedness• Mitigation• Recovery
Figure 8. Concept of the TwinCity project operating under theauspices of the Earthquake and
Megacities Initiative.
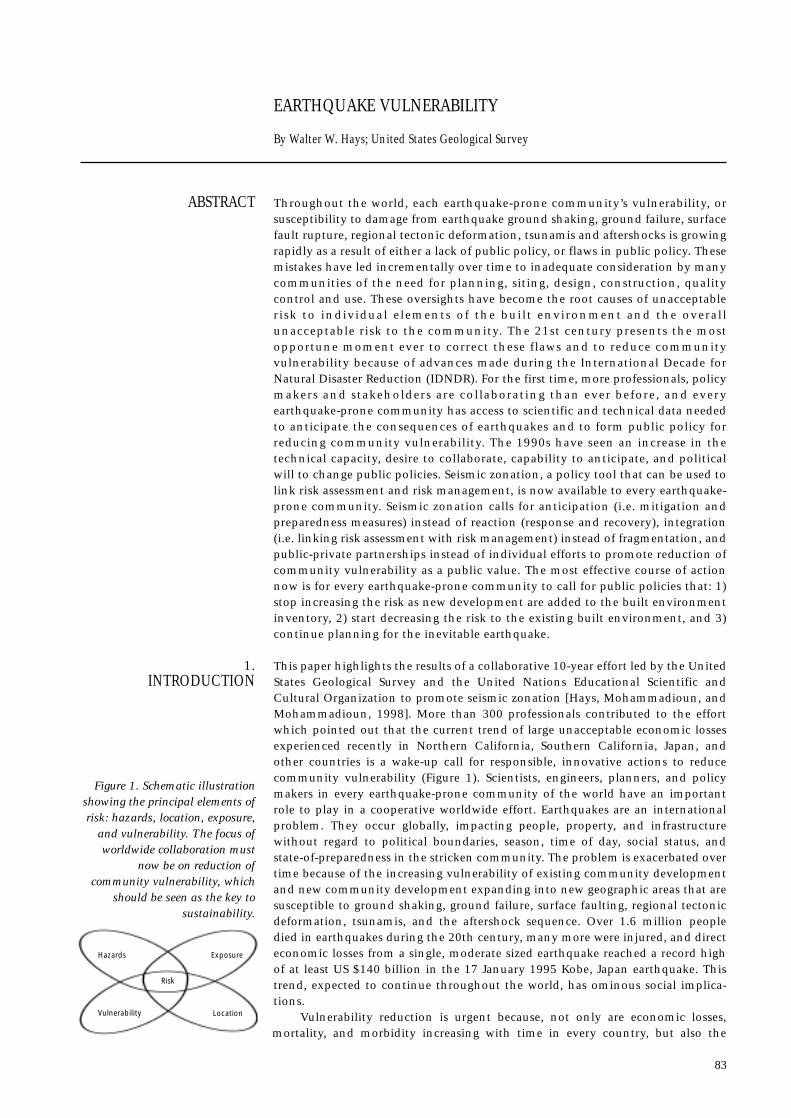
EARTHQUAKE VULNERABILITY
By Walter W. Hays; United States Geological Survey
Throughout the world, each earthquake-prone community’s vulnerability, orsusceptibility to damage from earthquake ground shaking, ground failure, surfacefault rupture, regional tectonic deformation, tsunamis and aftershocks is growingrapidly as a result of either a lack of public policy, or flaws in public policy. Thesemistakes have led incrementally over time to inadequate consideration by manycommunities of the need for planning, siting, design, construction, qualitycontrol and use. These oversights have become the root causes of unacceptablerisk to individual elements of the built environment and the overallunacceptable risk to the community. The 21st century presents the mostopportune moment ever to correct these flaws and to reduce communityvulnerability because of advances made during the International Decade forNatural Disaster Reduction (IDNDR). For the first time, more professionals, policymakers and stakeholders are collaborating than ever before, and everyearthquake-prone community has access to scientific and technical data neededto anticipate the consequences of earthquakes and to form public policy forreducing community vulnerability. The 1990s have seen an increase in thetechnical capacity, desire to collaborate, capability to anticipate, and politicalwill to change public policies. Seismic zonation, a policy tool that can be used tolink risk assessment and risk management, is now available to every earthquake-prone community. Seismic zonation calls for anticipation (i.e. mitigation andpreparedness measures) instead of reaction (response and recovery), integration(i.e. linking risk assessment with risk management) instead of fragmentation, andpublic-private partnerships instead of individual efforts to promote reduction ofcommunity vulnerability as a public value. The most effective course of actionnow is for every earthquake-prone community to call for public policies that: 1)stop increasing the risk as new development are added to the built environmentinventory, 2) start decreasing the risk to the existing built environment, and 3)continue planning for the inevitable earthquake.
This paper highlights the results of a collaborative 10-year effort led by the UnitedStates Geological Survey and the United Nations Educational Scientific andCultural Organization to promote seismic zonation [Hays, Mohammadioun, andMohammadioun, 1998]. More than 300 professionals contributed to the effortwhich pointed out that the current trend of large unacceptable economic lossesexperienced recently in Northern California, Southern California, Japan, andother countries is a wake-up call for responsible, innovative actions to reducecommunity vulnerability (Figure 1). Scientists, engineers, planners, and policymakers in every earthquake-prone community of the world have an importantrole to play in a cooperative worldwide effort. Earthquakes are an internationalproblem. They occur globally, impacting people, property, and infrastructurewithout regard to political boundaries, season, time of day, social status, andstate-of-preparedness in the stricken community. The problem is exacerbated overtime because of the increasing vulnerability of existing community developmentand new community development expanding into new geographic areas that aresusceptible to ground shaking, ground failure, surface faulting, regional tectonicdeformation, tsunamis, and the aftershock sequence. Over 1.6 million peopledied in earthquakes during the 20th century, many more were injured, and directeconomic losses from a single, moderate sized earthquake reached a record highof at least US $140 billion in the 17 January 1995 Kobe, Japan earthquake. Thistrend, expected to continue throughout the world, has ominous social implica-tions.
Vulnerability reduction is urgent because, not only are economic losses,mortality, and morbidity increasing with time in every country, but also the
1.INTRODUCTION
ABSTRACT
83
Hazards Exposure
Vulnerability
Risk
Location
Figure 1. Schematic illustrationshowing the principal elements ofrisk: hazards, location, exposure,
and vulnerability. The focus ofworldwide collaboration must
now be on reduction ofcommunity vulnerability, which
should be seen as the key tosustainability.
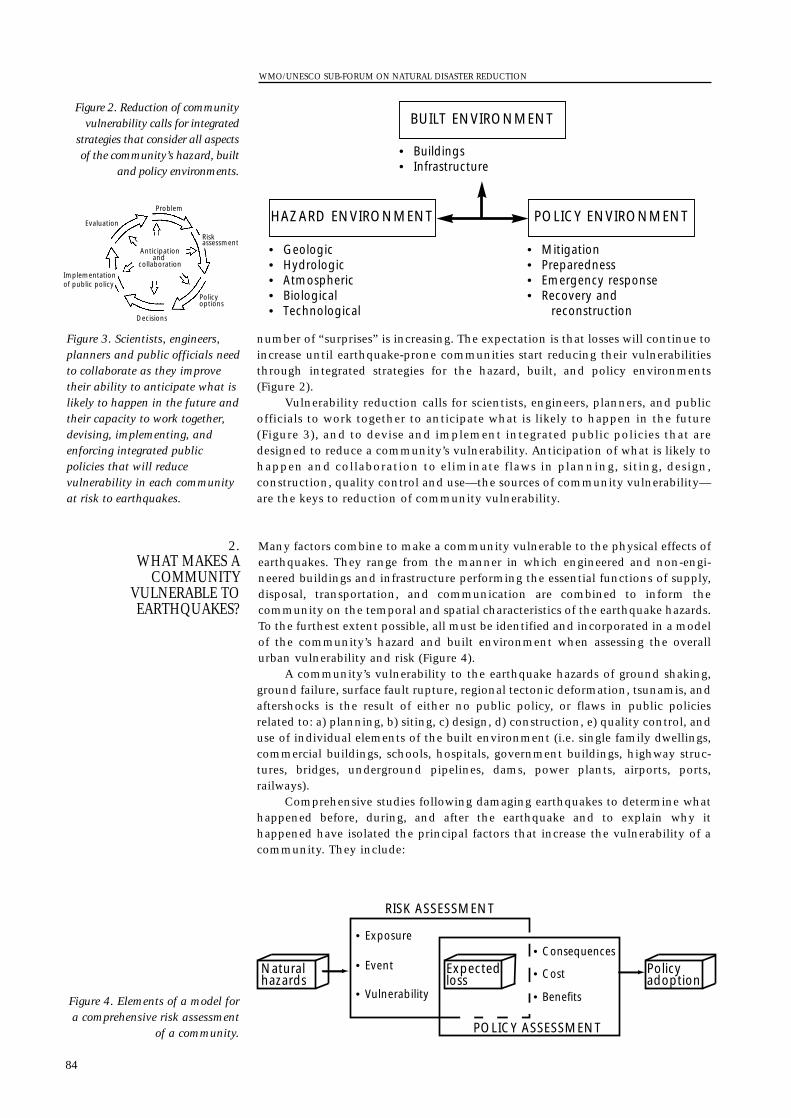
number of “surprises” is increasing. The expectation is that losses will continue toincrease until earthquake-prone communities start reducing their vulnerabilitiesthrough integrated strategies for the hazard, built, and policy environments(Figure 2).
Vulnerability reduction calls for scientists, engineers, planners, and publicofficials to work together to anticipate what is likely to happen in the future(Figure 3), and to devise and implement integrated public policies that aredesigned to reduce a community’s vulnerability. Anticipation of what is likely tohappen and collaboration to eliminate flaws in planning, siting, design,construction, quality control and use—the sources of community vulnerability—are the keys to reduction of community vulnerability.
Many factors combine to make a community vulnerable to the physical effects ofearthquakes. They range from the manner in which engineered and non-engi-neered buildings and infrastructure performing the essential functions of supply,disposal, transportation, and communication are combined to inform thecommunity on the temporal and spatial characteristics of the earthquake hazards.To the furthest extent possible, all must be identified and incorporated in a modelof the community’s hazard and built environment when assessing the overallurban vulnerability and risk (Figure 4).
A community’s vulnerability to the earthquake hazards of ground shaking,ground failure, surface fault rupture, regional tectonic deformation, tsunamis, andaftershocks is the result of either no public policy, or flaws in public policiesrelated to: a) planning, b) siting, c) design, d) construction, e) quality control, anduse of individual elements of the built environment (i.e. single family dwellings,commercial buildings, schools, hospitals, government buildings, highway struc-tures, bridges, underground pipelines, dams, power plants, airports, ports,railways).
Comprehensive studies following damaging earthquakes to determine whathappened before, during, and after the earthquake and to explain why ithappened have isolated the principal factors that increase the vulnerability of acommunity. They include:
2.WHAT MAKES A
COMMUNITYVULNERABLE TOEARTHQUAKES?
WMO/UNESCO SUB-FORUM ON NATURAL DISASTER REDUCTION
84
BUILT ENVIRONMENT
HAZARD ENVIRONMENT POLICY ENVIRONMENT
• Buildings• Infrastructure
• Geologic• Hydrologic• Atmospheric• Biological• Technological
• Mitigation• Preparedness• Emergency response• Recovery and
reconstruction
Figure 2. Reduction of communityvulnerability calls for integrated
strategies that consider all aspectsof the community’s hazard, built
and policy environments.
Anticipationand
collaboration
Evaluation
Implementationof public policy
Decisions
Policy options
Riskassessment
Problem
Figure 3. Scientists, engineers,planners and public officials needto collaborate as they improvetheir ability to anticipate what islikely to happen in the future andtheir capacity to work together,devising, implementing, andenforcing integrated publicpolicies that will reducevulnerability in each communityat risk to earthquakes.
Naturalhazards
Policyadoption
RISK ASSESSMENT
POLICY ASSESSMENT
• Exposure• Consequences
• Cost
• Benefits
• Event
• Vulnerability
Expectedloss
Figure 4. Elements of a model fora comprehensive risk assessment
of a community.
1. Older, non-engineered residential and commercial buildings typicallyconstructed with un-reinforced masonry or other construction materialshaving little or no resistance to the lateral forces of ground shaking.
2. Older infrastructure constructed at one time to conform with a seismic codeor standard that is now considered to be outdated, and inadequate as a resultof changes in the state-of-the art or state-of-practice.
3. Non-engineered residential and commercial buildings that are vulnerable tofire following an earthquake.
4. New buildings and/or infrastructure that have been sited, designed, andconstructed without adequate consideration of the proximity to the fault.
5. Communities sited at the water’s edge or in low-lying or coastal areas thatare susceptible to tsunami.
6. Buildings or lifeline systems sited on or encased within poor soils that eitherenhance ground shaking, or fail through permanent displacements (e.g.liquefaction, lateral spreading, falls, topples, slides, and flows of soil and rock).
7. Buildings with irregular plan, and elevation and vertical and/or horizontal discon-tinuities in mass, strength, and stiffness.
8. Schools and hospitals—a community’s “safe haven” facilities — that have beendesigned and constructed with materials with low resistance to lateral forces andirregular plan and elevation and vertical and horizontal discontinuities in mass,strength, and stiffness.
9. Communities with their communication facilities and disaster response controlcentres concentrated in the most hazardous areas instead of being widely distrib-uted geographically to spread the risk.
10. Outdated bridges and viaducts.11. Underground utilities providing the essential community services of supply and
disposal for electricity, gas, water, and sewage that are likely to fail or be renderedunusable by ground failure.
12. Ports and harbours that are in locations susceptible to regional tectonic deforma-tion, lateral spreads, and liquefaction.
The number of “surprises” after earthquake disasters throughout the world indi-cate that, at present, many communities: 1) do not know that they are vulnerable;2) do not understand why they are vulnerable; or 3) are ineffective in reducingtheir vulnerability. In fact, most communities are just beginning to be willing toacknowledge that they are vulnerable because of inadequate public policies toensure comprehensive planning, siting, design, construction, and use of the builtenvironment. The numerous so-called “surprises” that the media has highlightedin most countries during the past two decades have included the following situa-tions:
1. Discovering after the earthquake disaster that an active fault system was locateddirectly beneath the community or very close to the community.
2. Experiencing unanticipated damage and loss of function to essential buildings(e.g. hospitals, schools, government buildings), and lifelines (e.g. elevatedhighway systems, ports), especially when the scientific and technical consensusbefore the earthquake is that these structures have adequate earthquake resist-ance.
3. Discovering that portions of the community are susceptible to fire following theearthquake.
4. Experiencing thousands to tens of thousands of deaths and injuries, and thou-sands to hundreds of thousands left without homes and jobs.
5. Unexpected loss of community revenue, tax base, economic loss, and insuredpayments in the billions of dollars.
6. Discovering that the community lacks the capability for speedy emergencyresponse and effective recovery and reconstruction.
7. Discovering after the earthquake disaster that the causes of the surprises werewithin the power of the community’s policy makers and stakeholders (earthscientists, engineers, planners, insurers, businesses, and others) to correct beforethe disaster occurred.
3.WHAT DO THE
"SURPRISES"THROUGHOUT THEWORLD INDICATE?
EARTHQUAKE VULNERABILITY
85
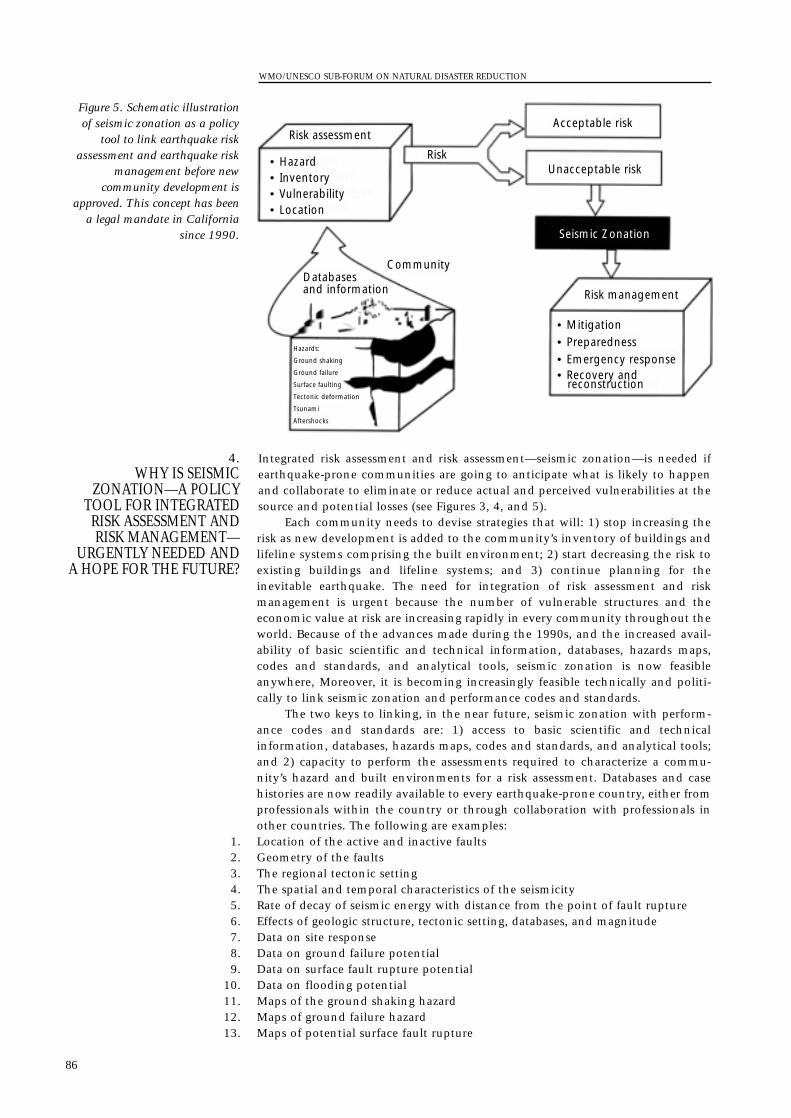
Integrated risk assessment and risk assessment—seismic zonation—is needed ifearthquake-prone communities are going to anticipate what is likely to happenand collaborate to eliminate or reduce actual and perceived vulnerabilities at thesource and potential losses (see Figures 3, 4, and 5).
Each community needs to devise strategies that will: 1) stop increasing therisk as new development is added to the community’s inventory of buildings andlifeline systems comprising the built environment; 2) start decreasing the risk toexisting buildings and lifeline systems; and 3) continue planning for theinevitable earthquake. The need for integration of risk assessment and riskmanagement is urgent because the number of vulnerable structures and theeconomic value at risk are increasing rapidly in every community throughout theworld. Because of the advances made during the 1990s, and the increased avail-ability of basic scientific and technical information, databases, hazards maps,codes and standards, and analytical tools, seismic zonation is now feasibleanywhere, Moreover, it is becoming increasingly feasible technically and politi-cally to link seismic zonation and performance codes and standards.
The two keys to linking, in the near future, seismic zonation with perform-ance codes and standards are: 1) access to basic scientific and technicalinformation, databases, hazards maps, codes and standards, and analytical tools;and 2) capacity to perform the assessments required to characterize a commu-nity’s hazard and built environments for a risk assessment. Databases and casehistories are now readily available to every earthquake-prone country, either fromprofessionals within the country or through collaboration with professionals inother countries. The following are examples:
1. Location of the active and inactive faults2. Geometry of the faults3. The regional tectonic setting4. The spatial and temporal characteristics of the seismicity5. Rate of decay of seismic energy with distance from the point of fault rupture6. Effects of geologic structure, tectonic setting, databases, and magnitude7. Data on site response8. Data on ground failure potential9. Data on surface fault rupture potential
10. Data on flooding potential11. Maps of the ground shaking hazard12. Maps of ground failure hazard13. Maps of potential surface fault rupture
4.WHY IS SEISMIC
ZONATION—A POLICYTOOL FOR INTEGRATEDRISK ASSESSMENT ANDRISK MANAGEMENT—
URGENTLY NEEDED ANDA HOPE FOR THE FUTURE?
WMO/UNESCO SUB-FORUM ON NATURAL DISASTER REDUCTION
86
Hazards:
Ground shaking
Ground failure
Surface faulting
Tectonic deformation
Tsunami
Aftershocks
Databasesand information
Risk assessment
• Hazard• Inventory• Vulnerability• Location
• Mitigation• Preparedness• Emergency response• Recovery and reconstruction
Risk
Risk management
Acceptable risk
Unacceptable risk
Seismic Zonation
Community
Figure 5. Schematic illustrationof seismic zonation as a policy
tool to link earthquake riskassessment and earthquake risk
management before newcommunity development is
approved. This concept has beena legal mandate in California
since 1990.
14. Maps of potential regional tectonic deformation15. Maps of potential tsunami flood wave run-up16. Locations of the community’s engineered and non-engineered buildings in rela-
tion to soil deposits and their earthquake resistance in terms of the criteria of amodern building code
17. Locations/routes of the community’s lifeline systems in relation the soil depositsand the criteria of modern lifeline standards
18. Vulnerability/fragility relations for the community’s buildings and lifelines
Gaps in knowledge exist. The most critical gaps in knowledge that need to befilled by ongoing "works in progress" in order to improve seismic zonation as apolicy tool to link risk assessments and risk management include the following:
1. The physics of the fault rupture2. Near-source phenomena3. Identifying tsunami sources4. Basin effects5. Attenuation laws for plate margin and intra-plate regions6. Effects of soil non-linearity on site response7. Optimum soil profile characterizations for generalized site response characterization8. Prediction of lateral displacements associated with liquefaction-induced lateral
spreading9. Prediction of non-liquefaction related settlements and lateral displacements (e.g.
in soft clay soils)10. Tsunami modelling11. Synthetic seismograms for specific source-path-site-structure configurations12. Vulnerability/fragility relations for buildings of various types, materials, and
functions1. Vulnerability/fragility relations for lifeline systems of various types, materials,
and functions2. Implications of uncertainty in the characterizations of a community’s hazard
and built environments for the enactment and implementation of public poli-cies for risk assessment and risk management
At present, community policy makers and community stakeholders have manyoptions available for reducing community vulnerability, each having a wide rangeof potential benefit and costs. The ultimate realization of a specific benefit costdepends on the capability of the community to enact and enforce specific miti-gation measures and regulations. The options and estimated ranges of benefit orcost are summarized below:
1. Insurance, with a potential benefit or cost ranging from one to one million, whichspreads the risk and enhances recovery and, because of recent paradigm shifts withinthe insurance sector, offers hope for new mitigation incentives and initiatives.
2. Non-structural mitigation, with a potential benefit or cost ranging from one toone thousand, which protects equipment and contents, while ensuring continueduse of buildings and facilities.
3. Building codes, with a potential benefit or cost ranging from one to one thou-sand, which prevent collapse of buildings; protects life and reduces injuries.
4. Demolition, with a potential benefit or cost ranging from one to one thousand,which eliminates collapse- hazard buildings and highway structures and reducespotential for loss of life and injuries.
5. Standards and guidelines for lifelines, with a potential benefit or cost rangingfrom one to one thousand, which protect community infrastructure.
6. Performance-based design, with a potential benefit or cost ranging from one to ahundred, which prevent loss of function and loss of use, especially in essentialand critical facilities.
7. Training and exercises, with a potential benefit or cost ranging from one to ahundred, which expand the capability and self-reliance of professionals.
8. Retrofit, strengthening, upgrading, and repair, with a potential benefit or costranging from one to a hundred, which prevent collapse, eliminate vulnerabilities
6.WHAT ARE THE
PRINCIPAL OPTIONS FORREDUCING COMMUNITY
VULNERABILITY?
5.WHAT ARE THE GAPS IN
KNOWLEDGE
EARTHQUAKE VULNERABILITY
87
caused by asymmetries, irregularities, and vertical and horizontal discontinuitiesin mass, stiffness, and strength in elevation and plan and reduce damage.
9. Base isolation, with a potential benefit or cost ranging from one to a hundred,which ensures continued functioning of essential and critical structures and facil-ities.
10. Soil remediation, with a potential benefit or cost ranging from one to a hundred,which prevents liquefaction, lateral spreading and landslides.
11. Public-private partnerships, with a potential benefit or cost ranging from one toten, which spread responsibility.
12. Earthquake disaster scenarios, with a potential benefit or cost ranging from one toten, which facilitate advance planning for the expected and the unexpected (i.e."the surprises").
13. Siting criteria and land-use, with a potential benefit or cost ranging from one toten, which avoid surface fault rupture, soil failure and soil-structure resonance.
14. Relocation and rerouting, with a potential benefit or cost ranging from one to ten,which reduce the likelihood of damage to communities, buildings, and importantlifelines.
15. Protective works, with a potential benefit or cost ranging from one to ten, whichprevent release of hazardous materials.
16. Changes in use and density of use, with a potential benefit/cost ranging from oneto ten, which reduce the likelihood of loss of function; loss of life and injuries.
The time is right for all earthquake-prone communities to collaborate in order toincrease their capacity to anticipate the consequences of earthquakes, devise andenact mitigation measures to eliminate or reduce community-specific vulnerabil-ities at the source, and to decrease the likelihood of an earthquake disaster.Reduction of community vulnerability, an increasingly urgent goal for everynation during the 21st century, is feasible and closer to realization now becauseof the scientific, technical, and political advances made during the 1990s underthe auspices of the IDNDR.
The key action for the 21st century is for community professionals andcommunity policy makers and stakeholders to anticipate the need and to collab-orate in solving their problems. Seismic zonation, a policy tool to integrate riskassessment and risk management before permitting new construction, is now anoption that all earthquake-prone communities can consider. The next step, apolicy tool for linking seismic zonation with performance codes and standards isalso feasible now and is perhaps the best way to move the state-of-the-art and thestate-of-practice forward.
Hays, W.W., B. Mohammadioun and J. Mohammadioun, 1998: Seismic zonation: aframework for linking earthquake risk assessment and earthquake risk management,Ouest Editions, Nantes, France, 147 p.
REFERENCE
7.CONCLUSIONS
WMO/UNESCO SUB-FORUM ON NATURAL DISASTER REDUCTION
88
SUCCESSES AND FAILURES IN FIGHTING LANDSLIDES:SOME EXPERIENCES FROM ITALY AND ELSEWHERE
By Paolo Canuti, Nicola Casagli, Filippo Catani; Earth Science Department, University of Firenze
When is an action taken to cope with a hazardous mass movement considered asuccess ? When is it necessary to admit failure ? This paper attempts to give ananswer to these questions by examining the three main aspects of a landslide riskmanagement programme: prediction, prevention (or mitigation) and emergencyplanning. Examples of successes and failures are given with reference to some ofthe best known case histories that have occurred, more or less recently, in Italyand elsewhere in the world. The recent developments of scientific research regard-ing the different aspects of landslide risk management are briefly outlined.
As far as the prediction phase is concerned, the state-of-the-art on landslide riskassessment and the basic differences between spatial and temporal prediction are brieflysummarized and discussed. The GIS database of the Emilia-Romagna region, containingover 30 000 individual landslides, is presented as a successful example of a spatialprediction containing elements for temporal forecasting. The exceptional 1996 Versiliarainstorm that triggered more than 450 debris flows, causing 13 casualties, is describedas a representative case of an unpredictable event.
A general framework for the main strategies and techniques employed forlandslide risk prevention is proposed. A successful case history, the urban trans-formation accomplished in the second half of the 19th century on the SanMiniato hill of Florence is presented: the architectonic transformation, of highartistic and landscape value, was combined with an effective stabilization of thehill, the instability of which was documented in a number of historic documentsstarting from the 11th century. The 1998 Sarno disaster is illustrated as anexample of prevention failure: a series of debris flows caused 161 casualties in thesuburbs of Sarno and Quindici, where uncontrolled urban development tookplace on areas historically exposed to high hazard.
The basic requirements of a successful emergency plan are thereforediscussed, such as monitoring and warning systems and simulation techniques forrisk scenario analyses. The emergency plan devised and implemented after theoccurrence of the 1993 La Josefina landslide in Ecuador is presented as a success:the landslide produced a dam on the Rio Paute and the successive emergencymeasures managed to reduce the losses caused by the dam breaching and over-topping to a minimum. Finally, the well-known 1963 Vaiont disaster is proposedas a representative example of unsuccessful emergency planning: more than 1 700casualties were caused by the catastrophic flood wave generated by the suddenfailure of a huge mass of rock into a reservoir.
Landslides and, in general, mass movements of earth receive less attention fromthe mass media and policy makers than other natural disasters such as earth-quakes, volcanic eruptions and floods, probably because they are less impressive.However, they undeniably represent one of the major risks for the safety andwelfare of people, property and wealth. Very often the damage caused by land-slides is strongly underestimated, since they frequently represent a relevant partof multi-hazard disasters such as earthquake-induced failures, rainfall-inducedfloods and debris flows, or rock avalanches and lahars triggered by volcanic erup-tions. A worldwide survey carried out by the International Association ofEngineering Geology for UNESCO between 1971–1974 showed that 14 per centof all casualties caused by natural disasters are connected with landslides. In thesame period, an average of 600 people were killed by landslides each year (Varnes,1981). This figure, however, gives only a partial idea of landslide impact on publicsafety, as single major events that have occurred in this century have caused, insome cases, over ten thousands victims (Schuster, 1996).
1.INTRODUCTION
ABSTRACT
89
Schuster (1996) has published an updated review on the socio-economicsignificance of landslides showing that Japan is the most severely affected nation,suffering an estimated total loss of 4 × US $109 per year (value referred to 1990).It is followed by the United States, Italy and India, where the estimated lossesranges between 1 × US $109 and 2 × US $109 each year. These losses include bothdirect and indirect costs. The first involve costs of repair, replacement or mainte-nance of damaged property and installations. Indirect costs include loss ofproductivity, reduced real estate value, loss of tax revenues and other inducedeconomic effects not directly produced by the landslides (Schuster, 1996).According to Schuster, a significant proportion of landslides affect transportationfacilities or lifelines such as railways, highways, channels and pipelines, produc-ing both Civil Protection problems and damage to economic activities. Anotherimportant aspect that must be taken into consideration relates to cultural heritageand environmental and ecological resources; the damage caused by landslides canin some cases be of inestimable value.
The mitigation of damage caused by natural disasters and risk reduction isone of the institutional duties of UNESCO. In 1976, the United Nations DisasterRelief Organization (UNDRO) promoted the constitution of a “landslide commis-sion” within the IAEG, where a global framework for landslide hazard and riskanalysis was defined (Varnes and IAEG, 1984). The 42nd General Assembly of theUnited Nations decided that the period between 1990–2000 would be theInternational Decade for Natural Disaster Reduction (IDNDR). In this context aWorking Party on the World Landslide Inventory (WP/WLI) was formed by themain international geotechnical societies. With the enlargement of theInternational Union of Geological Sciences (IUGS), the WP/WLI was transformedinto the IUGS Working Group on Landslides (IUGS/WGL). The main outcomes ofthis activity consist in the publication of suggested methods for landslide descrip-tion and inventory (WP/WLI, 1990, 1991, 1993a, 1994; IUGS/WGL, 1995; Crudenand Varnes, 1996), a multilingual glossary on landslides (WP/WLI, 1993b), and areview of the state-of-the-art on quantitative risk assessment for slopes and land-slides (Cruden and Fell, 1997).
The socio-economic significance of landslides has been recognized in recentdecades, following the occurrence of several disasters. The reasons can be listed asfollows:
1) landslide hazard is growing both in developing countries, due to continuousdeforestation, and in industrialized countries, because of the gradual abandon-ment of rural areas;
2) global climate change appears to negatively affect hazard through increasedannual precipitation in some countries, or higher frequency and intensity ofextreme meteorological events in others;
3) the exposure of the elements at risk has risen rapidly in recent decades due todemographic growth and to increased urbanization and development; if thistendency seems to have been reversed in technologically advanced nations, it isnow a major problem in developing countries where the population is growingrapidly and regional development is often uncontrolled;
4) the vulnerability of the elements at risk is also on the rise given the growingcomplexity of the socio-economic structure of industrialized countries; evenevents causing minor direct loss can generate major indirect losses linked, forexample, to the interruption of productive activities, loss of competition, non-fulfilment of contracts, legal or insurance problems and even psychologicaleffects;
5) acceptable risk thresholds have been drastically reduced in more developednations as today’s society no longer tolerates losses from natural unexpectedevents.
For these reasons, the mitigation of landslide effects has, in recent decades,become even more challenging. The objective of this paper is to provide a generalframework for the definition of the effectiveness of society’s fight against land-slides, providing case studies of both successful achievements and distressingfailures. The first step in landslide mitigation is to examine what type of
WMO/UNESCO SUB-FORUM ON NATURAL DISASTER REDUCTION
90
phenomenon a landslide represents. A landslide is a mass of rock, debris or earth,which moves down a slope under the action of the force of gravity (Cruden,1991). Despite this simple definition a landslide is a very complex phenomenon.It is characterized by five fundamental mechanisms of movement (fall, topple,slide, spread and flow) and their combinations (Cruden and Varnes, 1996). Thematerial involved can range in size and consistency from hundreds of millions ofcubic meters of solid rock to single particles of soil. The rate of movement rangesover ten orders of magnitude, from imperceptible creeping (velocity <10-10 m/s)to catastrophic, extremely rapid, failures (velocity >10 m/s) (IUGS/WGL, 1995).The material can move as a whole, like a solid block, or flow like a fluid depend-ing on the water content. The activity of the movement can vary spatially andthrough time and between different parts of the same displaced mass (WP/WLI,1993a). A landslide can occur as a first-time rupture of intact material or along apre-existent sliding surface. The first case is less common but usually has moreviolent effects given the brittle characteristics of failure, whereas re-activationsoccur more frequently but are usually characterized by limited displacements andslow rates of movement, because of the non-brittle nature of the pre-existing slipsurface (Hutchinson, 1987, 1988).
Another aspect that must be considered in a landslide risk analysis is theinduced risk. A landslide, in fact, may be the triggering cause of another type ofhazard: a volcanic eruption, as in the 1980 Mount St. Helen event in the state ofWashington (USA); groundwater pollution, when industrial plants or wastedisposals are damaged; or a flood, when the landslide causes the blockage of astream or river channel. This last case is perhaps the most common and canproduce dangerous consequences: a landslide dam represents a potential source offlood hazard since it may cause flooding both upstream, by water impoundment,and downstream, by breaching and overtopping of the dam.
The type of action that can be taken in the face of landslide hazard is themain aspect that needs to be discussed, before proceeding to the examination ofsuccesses and failures in combating landslides. Generally speaking, a hazardousphenomenon can be either forecasted, prevented and mitigated or tackled withan emergency plan. The three main phases concerning landslide risk managementare the following:
(a) prediction: includes all the activities aimed at studying and determining thecauses of landslides, at identifying the risks and at the zonation of the areasexposed to risk;
(b) prevention: includes all the activities aimed at avoiding or reducing to aminimum the possibility of occurrence of loss as consequence of landslide events,based on the knowledge acquired in the prediction phase;
(c) emergency planning: consists of the decisional and operational framework forthe protective measures to put into effect in situations of crisis.
In the following sections these three aspects of landslide management will bediscussed in detail. For each of them, two case studies are presented and brieflycommented on: one relating to a success and one to a failure. The case studies presentedare well-known events where the authors had a direct research experience and, in somecases, a direct operational responsibility as members of the National Group for Hydro-geological Disaster Prevention (GNDCI), an organization funded by the Italian CivilProtection Department, with the aim of supplying technical support to the Governmentin the fight against landslides and floods. Many of them are Italian examples, where theauthors have gained most of their experience, but they are chosen as representative oflandslide phenomena and socio-economic contexts that can be easily encountered inother parts of the World.
A formal framework for landslide risk prediction is shown in Figure 1. The basic initialinformation is represented by the description of the state of nature (Einstein, 1988; Wuet al., 1996) which can be divided into the following three aspects:
(a) thematic mapping of landslide factors: providing all the relevant information onslope instability causes, such as lithology, bedrock structure, debris cover, vegeta-tion, groundwater, slope gradient and aspect, etc.;
2. PREDICTION
SUCCESSES AND FAILURES IN FIGHTING LANDSLIDES: SOME EXPERIENCES FROM ITALY AND ELSEWHERE
91
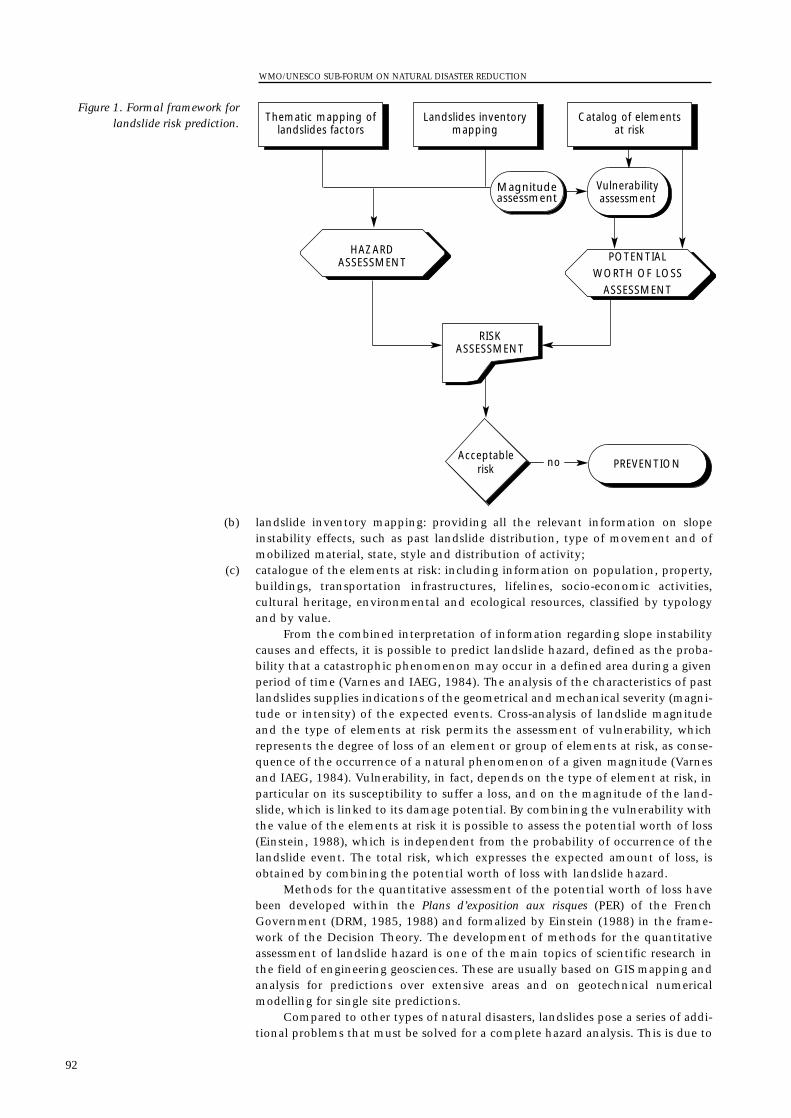
(b) landslide inventory mapping: providing all the relevant information on slopeinstability effects, such as past landslide distribution, type of movement and ofmobilized material, state, style and distribution of activity;
(c) catalogue of the elements at risk: including information on population, property,buildings, transportation infrastructures, lifelines, socio-economic activities,cultural heritage, environmental and ecological resources, classified by typologyand by value.
From the combined interpretation of information regarding slope instabilitycauses and effects, it is possible to predict landslide hazard, defined as the proba-bility that a catastrophic phenomenon may occur in a defined area during a givenperiod of time (Varnes and IAEG, 1984). The analysis of the characteristics of pastlandslides supplies indications of the geometrical and mechanical severity (magni-tude or intensity) of the expected events. Cross-analysis of landslide magnitudeand the type of elements at risk permits the assessment of vulnerability, whichrepresents the degree of loss of an element or group of elements at risk, as conse-quence of the occurrence of a natural phenomenon of a given magnitude (Varnesand IAEG, 1984). Vulnerability, in fact, depends on the type of element at risk, inparticular on its susceptibility to suffer a loss, and on the magnitude of the land-slide, which is linked to its damage potential. By combining the vulnerability withthe value of the elements at risk it is possible to assess the potential worth of loss(Einstein, 1988), which is independent from the probability of occurrence of thelandslide event. The total risk, which expresses the expected amount of loss, isobtained by combining the potential worth of loss with landslide hazard.
Methods for the quantitative assessment of the potential worth of loss havebeen developed within the Plans d’exposition aux risques (PER) of the FrenchGovernment (DRM, 1985, 1988) and formalized by Einstein (1988) in the frame-work of the Decision Theory. The development of methods for the quantitativeassessment of landslide hazard is one of the main topics of scientific research inthe field of engineering geosciences. These are usually based on GIS mapping andanalysis for predictions over extensive areas and on geotechnical numericalmodelling for single site predictions.
Compared to other types of natural disasters, landslides pose a series of addi-tional problems that must be solved for a complete hazard analysis. This is due to
WMO/UNESCO SUB-FORUM ON NATURAL DISASTER REDUCTION
92
Thematic mapping oflandslides factors
Landslides inventorymapping
Catalog of elements at risk
Magnitudeassessment
Vulnerabilityassessment
HAZARD ASSESSMENT POTENTIAL
WORTH OF LOSSASSESSMENT
RISKASSESSMENT
Acceptablerisk PREVENTIONno
Figure 1. Formal framework forlandslide risk prediction.
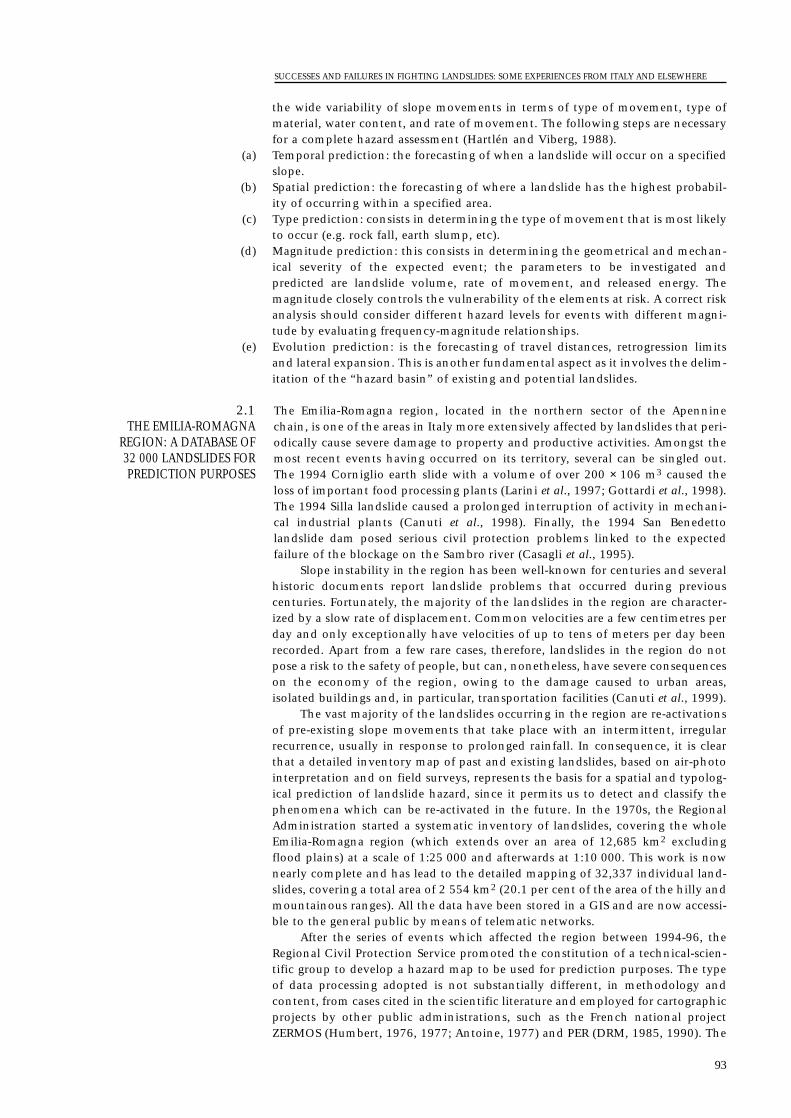
the wide variability of slope movements in terms of type of movement, type ofmaterial, water content, and rate of movement. The following steps are necessaryfor a complete hazard assessment (Hartlén and Viberg, 1988).
(a) Temporal prediction: the forecasting of when a landslide will occur on a specifiedslope.
(b) Spatial prediction: the forecasting of where a landslide has the highest probabil-ity of occurring within a specified area.
(c) Type prediction: consists in determining the type of movement that is most likelyto occur (e.g. rock fall, earth slump, etc).
(d) Magnitude prediction: this consists in determining the geometrical and mechan-ical severity of the expected event; the parameters to be investigated andpredicted are landslide volume, rate of movement, and released energy. Themagnitude closely controls the vulnerability of the elements at risk. A correct riskanalysis should consider different hazard levels for events with different magni-tude by evaluating frequency-magnitude relationships.
(e) Evolution prediction: is the forecasting of travel distances, retrogression limitsand lateral expansion. This is another fundamental aspect as it involves the delim-itation of the “hazard basin” of existing and potential landslides.
The Emilia-Romagna region, located in the northern sector of the Apenninechain, is one of the areas in Italy more extensively affected by landslides that peri-odically cause severe damage to property and productive activities. Amongst themost recent events having occurred on its territory, several can be singled out.The 1994 Corniglio earth slide with a volume of over 200 × 106 m3 caused theloss of important food processing plants (Larini et al., 1997; Gottardi et al., 1998).The 1994 Silla landslide caused a prolonged interruption of activity in mechani-cal industrial plants (Canuti et al., 1998). Finally, the 1994 San Benedettolandslide dam posed serious civil protection problems linked to the expectedfailure of the blockage on the Sambro river (Casagli et al., 1995).
Slope instability in the region has been well-known for centuries and severalhistoric documents report landslide problems that occurred during previouscenturies. Fortunately, the majority of the landslides in the region are character-ized by a slow rate of displacement. Common velocities are a few centimetres perday and only exceptionally have velocities of up to tens of meters per day beenrecorded. Apart from a few rare cases, therefore, landslides in the region do notpose a risk to the safety of people, but can, nonetheless, have severe consequenceson the economy of the region, owing to the damage caused to urban areas,isolated buildings and, in particular, transportation facilities (Canuti et al., 1999).
The vast majority of the landslides occurring in the region are re-activationsof pre-existing slope movements that take place with an intermittent, irregularrecurrence, usually in response to prolonged rainfall. In consequence, it is clearthat a detailed inventory map of past and existing landslides, based on air-photointerpretation and on field surveys, represents the basis for a spatial and typolog-ical prediction of landslide hazard, since it permits us to detect and classify thephenomena which can be re-activated in the future. In the 1970s, the RegionalAdministration started a systematic inventory of landslides, covering the wholeEmilia-Romagna region (which extends over an area of 12,685 km2 excludingflood plains) at a scale of 1:25 000 and afterwards at 1:10 000. This work is nownearly complete and has lead to the detailed mapping of 32,337 individual land-slides, covering a total area of 2 554 km2 (20.1 per cent of the area of the hilly andmountainous ranges). All the data have been stored in a GIS and are now accessi-ble to the general public by means of telematic networks.
After the series of events which affected the region between 1994-96, theRegional Civil Protection Service promoted the constitution of a technical-scien-tific group to develop a hazard map to be used for prediction purposes. The typeof data processing adopted is not substantially different, in methodology andcontent, from cases cited in the scientific literature and employed for cartographicprojects by other public administrations, such as the French national projectZERMOS (Humbert, 1976, 1977; Antoine, 1977) and PER (DRM, 1985, 1990). The
2.1 THE EMILIA-ROMAGNA
REGION: A DATABASE OF32 000 LANDSLIDES FORPREDICTION PURPOSES
SUCCESSES AND FAILURES IN FIGHTING LANDSLIDES: SOME EXPERIENCES FROM ITALY AND ELSEWHERE
93

landslides already mapped in the GIS have been classified according to their stateof activity (WP/WLI, 1993a) and ranked in different classes of relative hazard. Thenext step was the zonation of slopes in which there was no evidence of past move-ments. These areas are susceptible to occasional first-time slides and also tore-activations of pre-existing dormant landslides that may have escaped system-atic inventory, due to obliteration by geomorphic or anthropogenic activity. Inthese non-affected areas, the hazard ranking has been based on the arealfrequency of landslides over homogeneous lithological units, following a criterionalready successfully tested in other parts of the world (Radbruch-Hall et al., 1976,1982; Brabb, 1972; De Graff, 1978).
The available data on the state of nature permitted only a spatial and typo-logical hazard prediction (Figure 2), with the assessment of the degree of relativehazard amongst different sectors of the territory. Data on landslide types andmechanisms also allowed a ranking in classes of relative magnitude, which can beused for an analysis of the vulnerability of the elements at risk and of the poten-tial worth of loss. To also formulate a temporal hazard prediction, ongoingresearch is concentrated on correlating rainfall time series and historic records oflandslide events. A first attempt, the results of which are shown in Figure 3, is thecombination of a hydrological soil balance model with an empirical rechargemodel (Casagli et al., 1999). The resulting hydrogeological function is empiricallycorrelated with the recorded landslides. The results obtained are encouragingdespite the well-known difficulties in modelling groundwater response to rainfallin low permeability terrain with deep-seated landslides.
A risk prediction is obtained by overlaying hazard maps and the elements atrisk stored in the GIS. The results of this process provide a measure of the land-slide impact on the region: 150 municipalities are affected by landslides, with 235urban areas threatened by problems of instability. Where transportation facilitiesare concerned, the analysis shows that landslides threaten 11 882 km of railwaytracks, 14 668 km of highways, 1 031 950 km of National and Provincial roads
WMO/UNESCO SUB-FORUM ON NATURAL DISASTER REDUCTION
94
900 9000 1800 Metres
Non-landslide areas
Landslide areas
Hazard
Low Low
Low
Low
Low
Low
Medium-low
Medium-low
Low
Medium
High
High
High
Medium-high
Medium-high
High
Magnitude
Hazard Magnitude
Very high
Very high
Maximum
Maximum
Maximum
Maximum
Urban areas
Main rivers
Main roads
Figure 2. Example of landslidehazard and magnitude zonationfrom the Emilia-Romagna GIS.
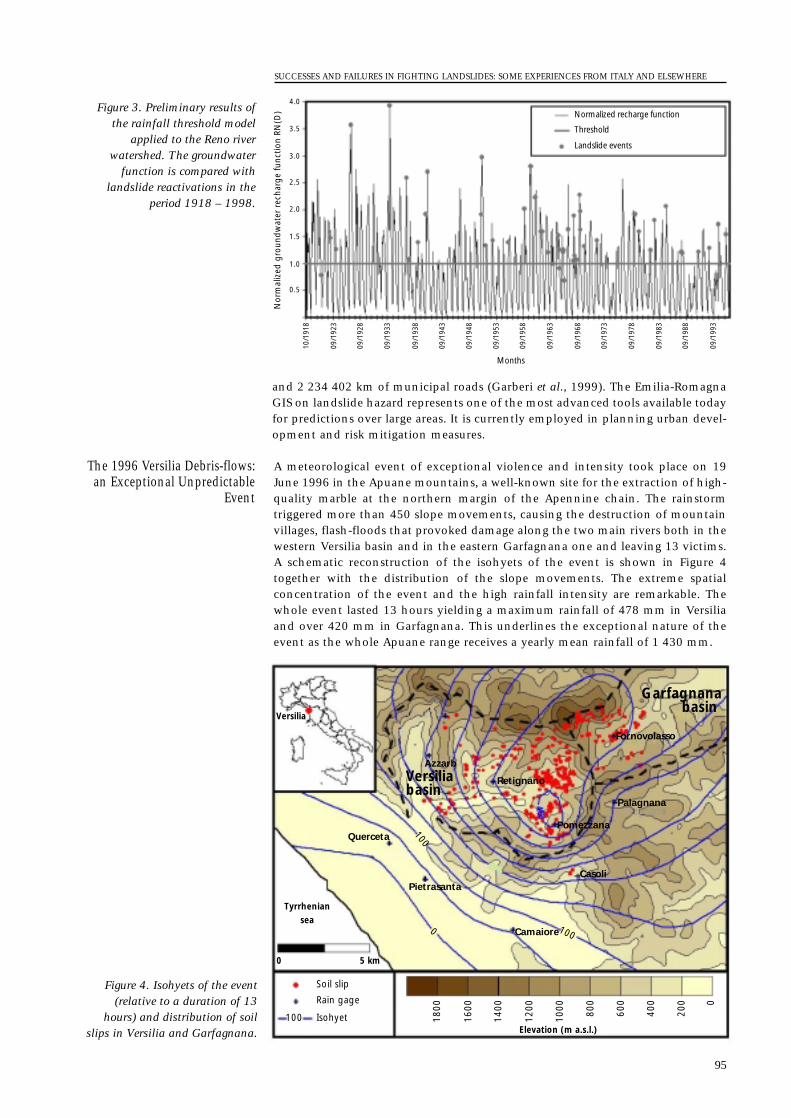
and 2 234 402 km of municipal roads (Garberi et al., 1999). The Emilia-RomagnaGIS on landslide hazard represents one of the most advanced tools available todayfor predictions over large areas. It is currently employed in planning urban devel-opment and risk mitigation measures.
A meteorological event of exceptional violence and intensity took place on 19June 1996 in the Apuane mountains, a well-known site for the extraction of high-quality marble at the northern margin of the Apennine chain. The rainstormtriggered more than 450 slope movements, causing the destruction of mountainvillages, flash-floods that provoked damage along the two main rivers both in thewestern Versilia basin and in the eastern Garfagnana one and leaving 13 victims.A schematic reconstruction of the isohyets of the event is shown in Figure 4together with the distribution of the slope movements. The extreme spatialconcentration of the event and the high rainfall intensity are remarkable. Thewhole event lasted 13 hours yielding a maximum rainfall of 478 mm in Versiliaand over 420 mm in Garfagnana. This underlines the exceptional nature of theevent as the whole Apuane range receives a yearly mean rainfall of 1 430 mm.
The 1996 Versilia Debris-flows:an Exceptional Unpredictable
Event
SUCCESSES AND FAILURES IN FIGHTING LANDSLIDES: SOME EXPERIENCES FROM ITALY AND ELSEWHERE
95
3.5
3.0
2.5
2.0
1.0
10/1
918
09/1
923
09/1
928
09/1
933
09/1
938
09/1
943
09/1
948
09/1
953
09/1
958
09/1
963
09/1
968
09/1
973
09/1
978
09/1
983
09/1
988
09/1
993
0.5
1.5
4.0
Nor
mal
ized
gro
undw
ater
rec
harg
e fu
nctio
n RN
(D)
Months
Normalized recharge function
Threshold
Landslide events
Figure 3. Preliminary results ofthe rainfall threshold model
applied to the Reno riverwatershed. The groundwater
function is compared withlandslide reactivations in the
period 1918 – 1998.
Soil slip
Rain gage
100 Isohyet 1600
1400
1200
1000 800
600
400
200 0
1800
1000
100
Pietrasanta
Querceta
AzzarbVersiliabasin
Retignano
Casoli
Camaiore
Fornovolasso
Palagnana
Pomezzana
Garfagnanabasin
Versilia
Tyrrheniansea
0 5 km
Elevation (m a.s.l.)
Figure 4. Isohyets of the event(relative to a duration of 13
hours) and distribution of soilslips in Versilia and Garfagnana.
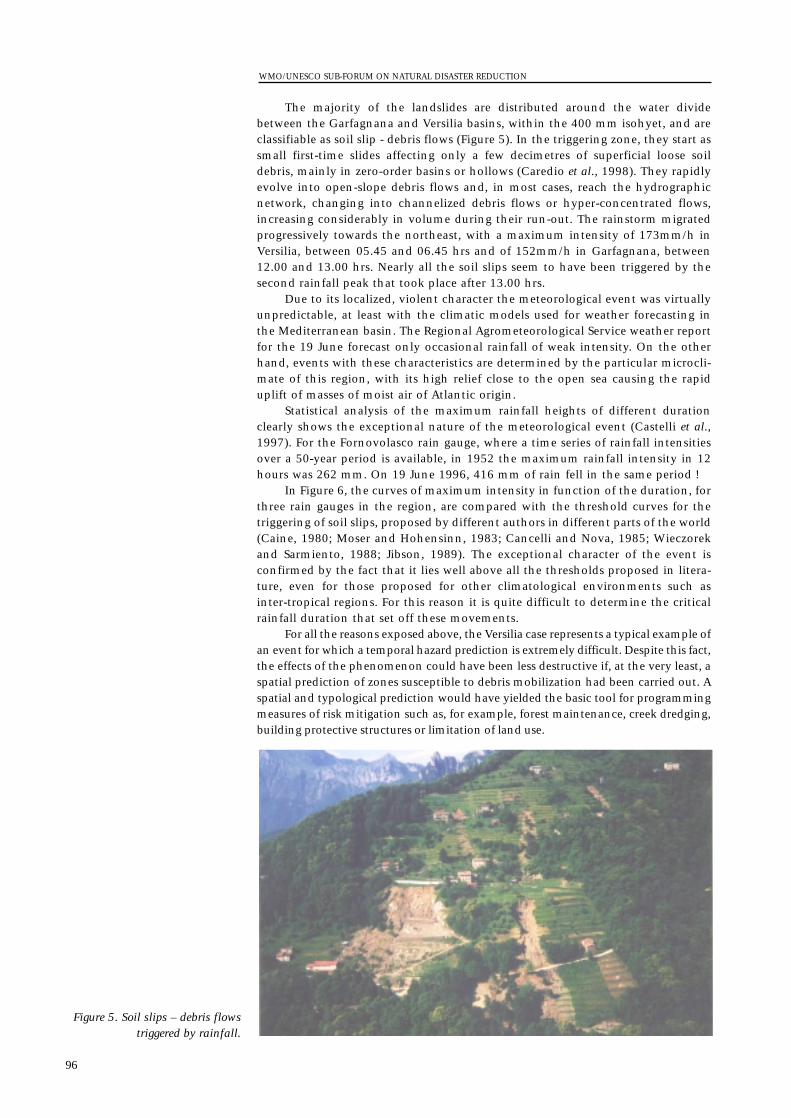
The majority of the landslides are distributed around the water dividebetween the Garfagnana and Versilia basins, within the 400 mm isohyet, and areclassifiable as soil slip - debris flows (Figure 5). In the triggering zone, they start assmall first-time slides affecting only a few decimetres of superficial loose soildebris, mainly in zero-order basins or hollows (Caredio et al., 1998). They rapidlyevolve into open-slope debris flows and, in most cases, reach the hydrographicnetwork, changing into channelized debris flows or hyper-concentrated flows,increasing considerably in volume during their run-out. The rainstorm migratedprogressively towards the northeast, with a maximum intensity of 173mm/h inVersilia, between 05.45 and 06.45 hrs and of 152mm/h in Garfagnana, between12.00 and 13.00 hrs. Nearly all the soil slips seem to have been triggered by thesecond rainfall peak that took place after 13.00 hrs.
Due to its localized, violent character the meteorological event was virtuallyunpredictable, at least with the climatic models used for weather forecasting inthe Mediterranean basin. The Regional Agrometeorological Service weather reportfor the 19 June forecast only occasional rainfall of weak intensity. On the otherhand, events with these characteristics are determined by the particular microcli-mate of this region, with its high relief close to the open sea causing the rapiduplift of masses of moist air of Atlantic origin.
Statistical analysis of the maximum rainfall heights of different durationclearly shows the exceptional nature of the meteorological event (Castelli et al.,1997). For the Fornovolasco rain gauge, where a time series of rainfall intensitiesover a 50-year period is available, in 1952 the maximum rainfall intensity in 12hours was 262 mm. On 19 June 1996, 416 mm of rain fell in the same period !
In Figure 6, the curves of maximum intensity in function of the duration, forthree rain gauges in the region, are compared with the threshold curves for thetriggering of soil slips, proposed by different authors in different parts of the world(Caine, 1980; Moser and Hohensinn, 1983; Cancelli and Nova, 1985; Wieczorekand Sarmiento, 1988; Jibson, 1989). The exceptional character of the event isconfirmed by the fact that it lies well above all the thresholds proposed in litera-ture, even for those proposed for other climatological environments such asinter-tropical regions. For this reason it is quite difficult to determine the criticalrainfall duration that set off these movements.
For all the reasons exposed above, the Versilia case represents a typical example ofan event for which a temporal hazard prediction is extremely difficult. Despite this fact,the effects of the phenomenon could have been less destructive if, at the very least, aspatial prediction of zones susceptible to debris mobilization had been carried out. Aspatial and typological prediction would have yielded the basic tool for programmingmeasures of risk mitigation such as, for example, forest maintenance, creek dredging,building protective structures or limitation of land use.
WMO/UNESCO SUB-FORUM ON NATURAL DISASTER REDUCTION
96
Figure 5. Soil slips – debris flowstriggered by rainfall.
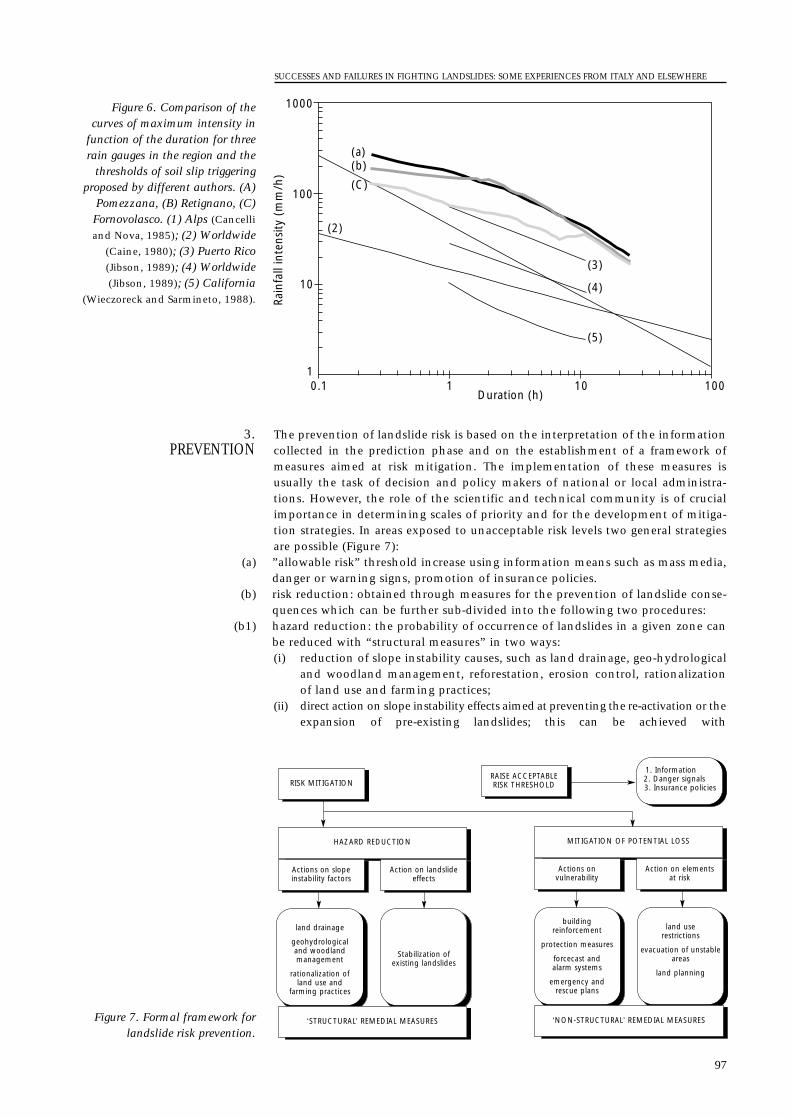
The prevention of landslide risk is based on the interpretation of the informationcollected in the prediction phase and on the establishment of a framework ofmeasures aimed at risk mitigation. The implementation of these measures isusually the task of decision and policy makers of national or local administra-tions. However, the role of the scientific and technical community is of crucialimportance in determining scales of priority and for the development of mitiga-tion strategies. In areas exposed to unacceptable risk levels two general strategiesare possible (Figure 7):
(a) ”allowable risk” threshold increase using information means such as mass media,danger or warning signs, promotion of insurance policies.
(b) risk reduction: obtained through measures for the prevention of landslide conse-quences which can be further sub-divided into the following two procedures:
(b1) hazard reduction: the probability of occurrence of landslides in a given zone canbe reduced with “structural measures” in two ways:(i) reduction of slope instability causes, such as land drainage, geo-hydrological
and woodland management, reforestation, erosion control, rationalizationof land use and farming practices;
(ii) direct action on slope instability effects aimed at preventing the re-activation or theexpansion of pre-existing landslides; this can be achieved with
3.PREVENTION
SUCCESSES AND FAILURES IN FIGHTING LANDSLIDES: SOME EXPERIENCES FROM ITALY AND ELSEWHERE
97
1000
100
10
10.1 1 10 100
Duration (h)
Rain
fall
inte
nsity
(m
m/h
)
(2)
(3)
(4)
(5)
(a)(b)
(C)
Figure 6. Comparison of thecurves of maximum intensity in
function of the duration for threerain gauges in the region and the
thresholds of soil slip triggeringproposed by different authors. (A)
Pomezzana, (B) Retignano, (C)Fornovolasco. (1) Alps (Cancelli
and Nova, 1985); (2) Worldwide(Caine, 1980); (3) Puerto Rico(Jibson, 1989); (4) Worldwide(Jibson, 1989); (5) California
(Wieczoreck and Sarmineto, 1988).
RISK MITIGATION
HAZARD REDUCTION
Actions on slope instability factors
Action on landslideeffects
MITIGATION OF POTENTIAL LOSS
Actions on vulnerability
Action on elements at risk
RAISE ACCEPTABLE RISK THRESHOLD
1. Information2. Danger signals3. Insurance policies
land drainage
geohydrological and woodland management
rationalization of land use and
farming practices
Stabilization of existing landslides
building reinforcement
protection measures
forcecast and alarm systems
emergency and rescue plans
land userestrictions
evacuation of unstableareas
land planning
‘STRUCTURAL’ REMEDIAL MEASURES ‘NON-STRUCTURAL’ REMEDIAL MEASURESFigure 7. Formal framework forlandslide risk prevention.
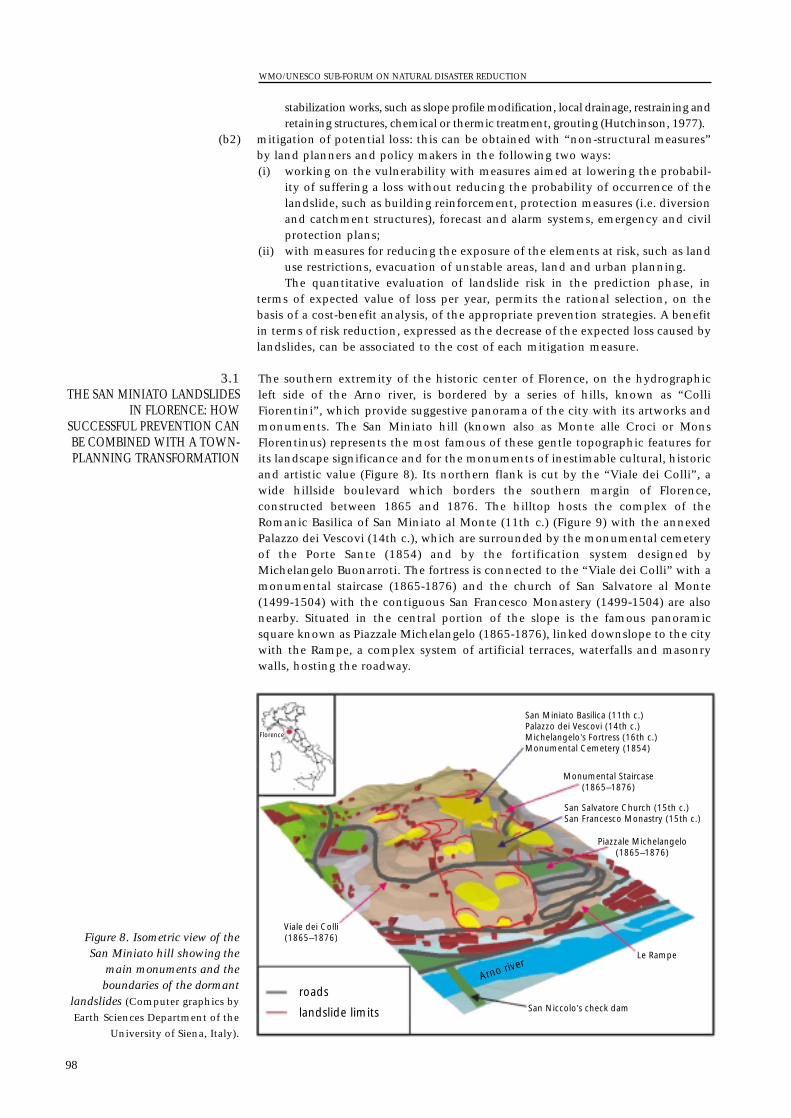
stabilization works, such as slope profile modification, local drainage, restraining andretaining structures, chemical or thermic treatment, grouting (Hutchinson, 1977).
(b2) mitigation of potential loss: this can be obtained with “non-structural measures”by land planners and policy makers in the following two ways: (i) working on the vulnerability with measures aimed at lowering the probabil-
ity of suffering a loss without reducing the probability of occurrence of thelandslide, such as building reinforcement, protection measures (i.e. diversionand catchment structures), forecast and alarm systems, emergency and civilprotection plans;
(ii) with measures for reducing the exposure of the elements at risk, such as landuse restrictions, evacuation of unstable areas, land and urban planning.The quantitative evaluation of landslide risk in the prediction phase, in
terms of expected value of loss per year, permits the rational selection, on thebasis of a cost-benefit analysis, of the appropriate prevention strategies. A benefitin terms of risk reduction, expressed as the decrease of the expected loss caused bylandslides, can be associated to the cost of each mitigation measure.
The southern extremity of the historic center of Florence, on the hydrographicleft side of the Arno river, is bordered by a series of hills, known as “ColliFiorentini”, which provide suggestive panorama of the city with its artworks andmonuments. The San Miniato hill (known also as Monte alle Croci or MonsFlorentinus) represents the most famous of these gentle topographic features forits landscape significance and for the monuments of inestimable cultural, historicand artistic value (Figure 8). Its northern flank is cut by the “Viale dei Colli”, awide hillside boulevard which borders the southern margin of Florence,constructed between 1865 and 1876. The hilltop hosts the complex of theRomanic Basilica of San Miniato al Monte (11th c.) (Figure 9) with the annexedPalazzo dei Vescovi (14th c.), which are surrounded by the monumental cemeteryof the Porte Sante (1854) and by the fortification system designed byMichelangelo Buonarroti. The fortress is connected to the “Viale dei Colli” with amonumental staircase (1865-1876) and the church of San Salvatore al Monte(1499-1504) with the contiguous San Francesco Monastery (1499-1504) are alsonearby. Situated in the central portion of the slope is the famous panoramicsquare known as Piazzale Michelangelo (1865-1876), linked downslope to the citywith the Rampe, a complex system of artificial terraces, waterfalls and masonrywalls, hosting the roadway.
3.1THE SAN MINIATO LANDSLIDES
IN FLORENCE: HOWSUCCESSFUL PREVENTION CANBE COMBINED WITH A TOWN-PLANNING TRANSFORMATION
WMO/UNESCO SUB-FORUM ON NATURAL DISASTER REDUCTION
98
roads
landslide limits
Viale dei Colli(1865–1876)
San Niccolo’s check dam
Le Rampe
Piazzale Michelangelo(1865–1876)
San Salvatore Church (15th c.)San Francesco Monastry (15th c.)
Monumental Staircase(1865–1876)
San Miniato Basilica (11th c.)Palazzo dei Vescovi (14th c.)Michelangelo’s Fortress (16th c.)Monumental Cemetery (1854)
Arno river
Florence
Figure 8. Isometric view of theSan Miniato hill showing the
main monuments and theboundaries of the dormant
landslides (Computer graphics by
Earth Sciences Department of the
University of Siena, Italy).

Unfortunately, the hill has always been affected by slope instability phenom-ena, with periodical re-activations documented in several historic documents.Most of the monuments and art works on the hill are affected by fissures which,in various circumstances during the centuries after their construction, requiredrestoration. The first documented studies on the stability of the hill were carriedout by Leonardo da Vinci in the 15th century and afterwards by various commis-sions appointed for the restoration works. The studies carried out in the pastpointed out the presence of a generalized translational sliding of the entire hill,down the slope facing the Arno river, linked to the adversely oriented strata.Detailed geomorphological investigations showed the presence of distinct slidesscattered over all the slopes of the hill (Figure 8) (Bertocci et al., 1995). Theirrecognition and delimitation is made extremely difficult by the urbanization ofthe entire hill over many centuries which has led to the almost complete obliter-ation of the evidence of past movements. The main landslide bodies which havebeen detected are:
(a) the large earth slide on the northern slope which laps the Piazzale Michelangeloand the church of San Salvatore and extends over a green zone used today as acamping site;
(b) the earth slide on the western slope which affects the Monumental Staircase ofSan Miniato;
(c) the coalescent slides on the eastern slope which affect some private villas andsome public facilities such as the Florence Orthopedic Hospital;
(d) the earth slide on the southern slope, the crown of which reaches the base of theMichelangelo bastions.
Various documents testify to the periodic re-activations of the different land-slides: the main events date back to 1499, 1551, 1562, 1652, 1695, 1709 and 1853.
Between 1865 and 1876, dates which coincided with the designation ofFlorence as temporary Capital of the Italian Kingdom, the hill was involved in aradical town-planning transformation directed by the Architect Giuseppe Poggi.On the San Miniato hill, Poggi designed and constructed the scenic Viale dei Colliwith its panoramic open squares, of which the Piazzale Michelangelo is the mostfamous. Among the reasons cited by Poggi to support his extremely expensiveplan, was the necessity of a global geo-hydrological and hydraulic re-arrangementof the entire slope, in order to prevent the future occurrence of instabilityphenomena. The implementation of the project lead to a general modification ofthe slope profile, with excavations and fillings involving impressive earth move-ments, the building of drainage systems and canals which supplied water for thewaterfalls and fountains, and the construction of a series of earth retaining struc-tures along the boulevard and on the Rampe terraces (Figure 10). The mostunstable zones, including the area used today as a campsite, were left green andused as public gardens.
The entire complex of works has an undoubted artistic and architecturalvalue and represents one of the key elements of the landscape of the Florentinehills. Apart from these aesthetic aspects, it is clear that the entire works weresupported by a full appreciation of the local, critical stability conditions and bythe necessity of putting into effect preventive measures to protect the culturalheritage from the risk of landslides. For this reason Poggi’s opera still today repre-sents an excellent and prestigious example of appropriate land management andsustainable urban development that, unfortunately, has not always been followedin the successive periods.
On 5 May 1998, in the Sarno area in southern Italy, 30 km east of Naples, approx-imately 150 shallow landslides (soil slips — debris flows) were triggered by anintense rainstorm. The mobilized material was conveyed into the hydrographicnetwork, giving rise to large channelized debris flows that hit the urban areas ofSarno, Quindici, Siano and Bracigliano (Figure 11). This catastrophic eventproduced 161 casualties and heavy, widespread loss of property, services, infra-structures and economic activities. Available rainfall records show a total rainfallof 100 mm in 24 hours (4–5 May), with a peak intensity of 11 mm/h. Although
3.2THE 1988 SARNO EVENT: ADISASTER CAUSED BY THE
LACK OF PREVENTIVEMEASURES
SUCCESSES AND FAILURES IN FIGHTING LANDSLIDES: SOME EXPERIENCES FROM ITALY AND ELSEWHERE
99
Figure 9. The San MiniatoBasilica (11th c.) at the top of themonumental staircase (1865-1876).
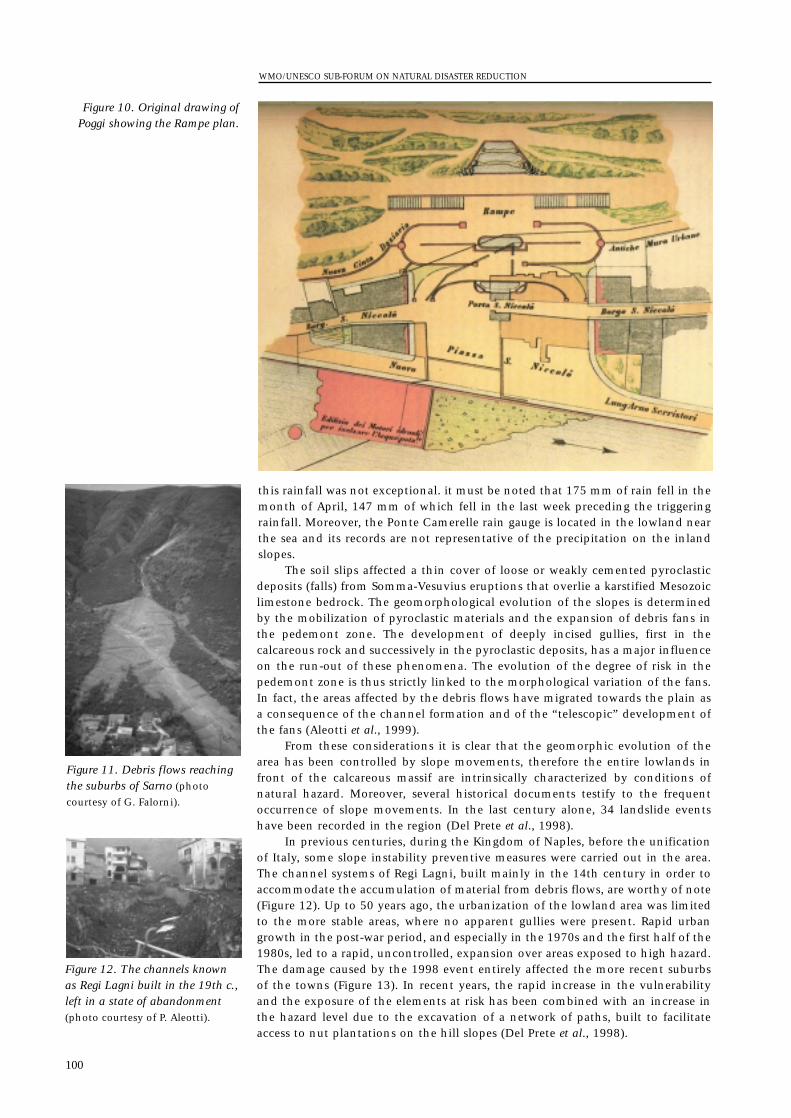
this rainfall was not exceptional. it must be noted that 175 mm of rain fell in themonth of April, 147 mm of which fell in the last week preceding the triggeringrainfall. Moreover, the Ponte Camerelle rain gauge is located in the lowland nearthe sea and its records are not representative of the precipitation on the inlandslopes.
The soil slips affected a thin cover of loose or weakly cemented pyroclasticdeposits (falls) from Somma-Vesuvius eruptions that overlie a karstified Mesozoiclimestone bedrock. The geomorphological evolution of the slopes is determinedby the mobilization of pyroclastic materials and the expansion of debris fans inthe pedemont zone. The development of deeply incised gullies, first in thecalcareous rock and successively in the pyroclastic deposits, has a major influenceon the run-out of these phenomena. The evolution of the degree of risk in thepedemont zone is thus strictly linked to the morphological variation of the fans.In fact, the areas affected by the debris flows have migrated towards the plain asa consequence of the channel formation and of the “telescopic” development ofthe fans (Aleotti et al., 1999).
From these considerations it is clear that the geomorphic evolution of thearea has been controlled by slope movements, therefore the entire lowlands infront of the calcareous massif are intrinsically characterized by conditions ofnatural hazard. Moreover, several historical documents testify to the frequentoccurrence of slope movements. In the last century alone, 34 landslide eventshave been recorded in the region (Del Prete et al., 1998).
In previous centuries, during the Kingdom of Naples, before the unificationof Italy, some slope instability preventive measures were carried out in the area.The channel systems of Regi Lagni, built mainly in the 14th century in order toaccommodate the accumulation of material from debris flows, are worthy of note(Figure 12). Up to 50 years ago, the urbanization of the lowland area was limitedto the more stable areas, where no apparent gullies were present. Rapid urbangrowth in the post-war period, and especially in the 1970s and the first half of the1980s, led to a rapid, uncontrolled, expansion over areas exposed to high hazard.The damage caused by the 1998 event entirely affected the more recent suburbsof the towns (Figure 13). In recent years, the rapid increase in the vulnerabilityand the exposure of the elements at risk has been combined with an increase inthe hazard level due to the excavation of a network of paths, built to facilitateaccess to nut plantations on the hill slopes (Del Prete et al., 1998).
WMO/UNESCO SUB-FORUM ON NATURAL DISASTER REDUCTION
100
Figure 10. Original drawing ofPoggi showing the Rampe plan.
Figure 11. Debris flows reachingthe suburbs of Sarno (photo
courtesy of G. Falorni).
Figure 12. The channels knownas Regi Lagni built in the 19th c.,left in a state of abandonment(photo courtesy of P. Aleotti).
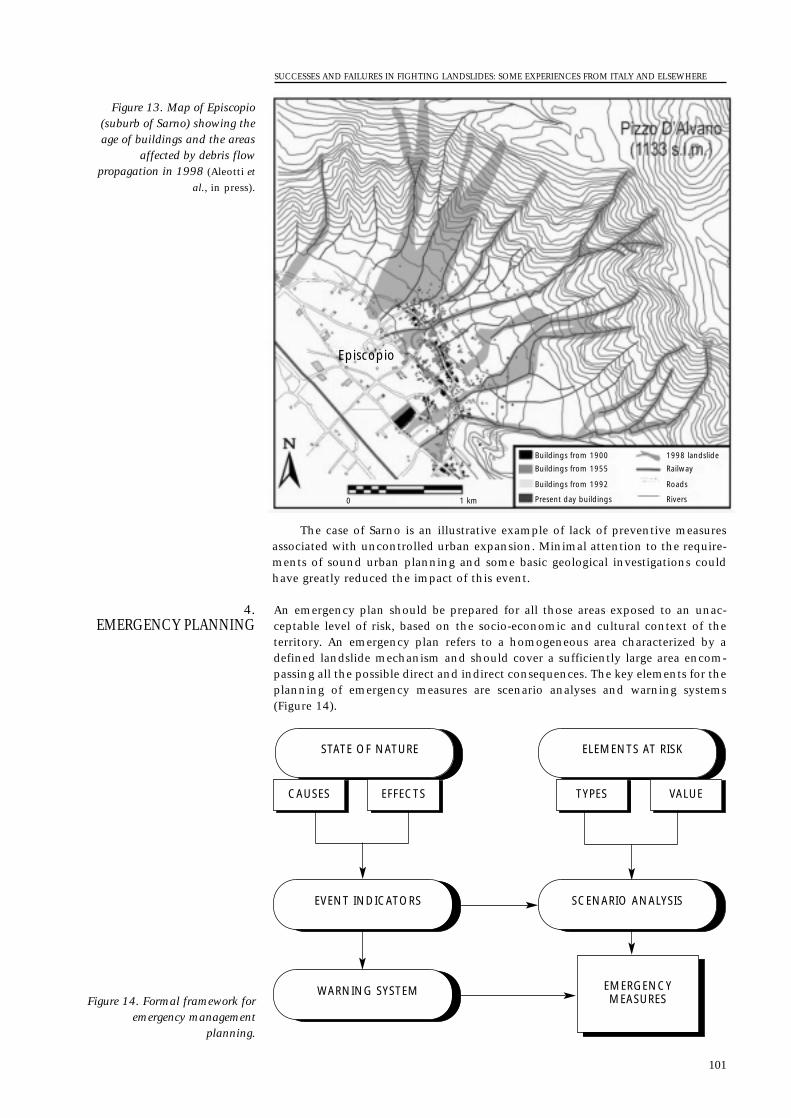
The case of Sarno is an illustrative example of lack of preventive measuresassociated with uncontrolled urban expansion. Minimal attention to the require-ments of sound urban planning and some basic geological investigations couldhave greatly reduced the impact of this event.
An emergency plan should be prepared for all those areas exposed to an unac-ceptable level of risk, based on the socio-economic and cultural context of theterritory. An emergency plan refers to a homogeneous area characterized by adefined landslide mechanism and should cover a sufficiently large area encom-passing all the possible direct and indirect consequences. The key elements for theplanning of emergency measures are scenario analyses and warning systems(Figure 14).
4.EMERGENCY PLANNING
SUCCESSES AND FAILURES IN FIGHTING LANDSLIDES: SOME EXPERIENCES FROM ITALY AND ELSEWHERE
101
Buildings from 1900
Buildings from 1955
Buildings from 1992
Present day buildings
1998 landslide
Railway
Roads
Rivers0 1 km
Episcopio
Figure 13. Map of Episcopio(suburb of Sarno) showing theage of buildings and the areas
affected by debris flowpropagation in 1998 (Aleotti et
al., in press).
CAUSES EFFECTS
EMERGENCY MEASURES
STATE OF NATURE
EVENT INDICATORS
WARNING SYSTEM
SCENARIO ANALYSIS
ELEMENTS AT RISK
TYPES VALUE
Figure 14. Formal framework foremergency management
planning.
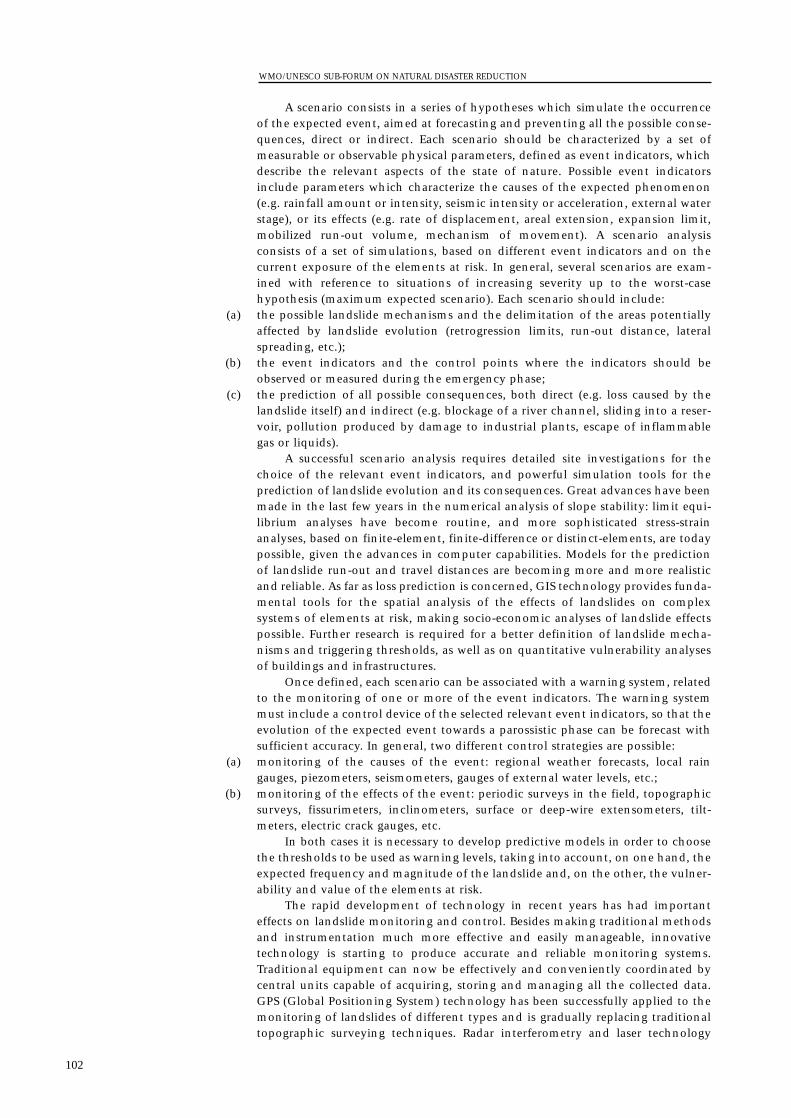
A scenario consists in a series of hypotheses which simulate the occurrenceof the expected event, aimed at forecasting and preventing all the possible conse-quences, direct or indirect. Each scenario should be characterized by a set ofmeasurable or observable physical parameters, defined as event indicators, whichdescribe the relevant aspects of the state of nature. Possible event indicatorsinclude parameters which characterize the causes of the expected phenomenon(e.g. rainfall amount or intensity, seismic intensity or acceleration, external waterstage), or its effects (e.g. rate of displacement, areal extension, expansion limit,mobilized run-out volume, mechanism of movement). A scenario analysisconsists of a set of simulations, based on different event indicators and on thecurrent exposure of the elements at risk. In general, several scenarios are exam-ined with reference to situations of increasing severity up to the worst-casehypothesis (maximum expected scenario). Each scenario should include:
(a) the possible landslide mechanisms and the delimitation of the areas potentiallyaffected by landslide evolution (retrogression limits, run-out distance, lateralspreading, etc.);
(b) the event indicators and the control points where the indicators should beobserved or measured during the emergency phase;
(c) the prediction of all possible consequences, both direct (e.g. loss caused by thelandslide itself) and indirect (e.g. blockage of a river channel, sliding into a reser-voir, pollution produced by damage to industrial plants, escape of inflammablegas or liquids).
A successful scenario analysis requires detailed site investigations for thechoice of the relevant event indicators, and powerful simulation tools for theprediction of landslide evolution and its consequences. Great advances have beenmade in the last few years in the numerical analysis of slope stability: limit equi-librium analyses have become routine, and more sophisticated stress-strainanalyses, based on finite-element, finite-difference or distinct-elements, are todaypossible, given the advances in computer capabilities. Models for the predictionof landslide run-out and travel distances are becoming more and more realisticand reliable. As far as loss prediction is concerned, GIS technology provides funda-mental tools for the spatial analysis of the effects of landslides on complexsystems of elements at risk, making socio-economic analyses of landslide effectspossible. Further research is required for a better definition of landslide mecha-nisms and triggering thresholds, as well as on quantitative vulnerability analysesof buildings and infrastructures.
Once defined, each scenario can be associated with a warning system, relatedto the monitoring of one or more of the event indicators. The warning systemmust include a control device of the selected relevant event indicators, so that theevolution of the expected event towards a parossistic phase can be forecast withsufficient accuracy. In general, two different control strategies are possible:
(a) monitoring of the causes of the event: regional weather forecasts, local raingauges, piezometers, seismometers, gauges of external water levels, etc.;
(b) monitoring of the effects of the event: periodic surveys in the field, topographicsurveys, fissurimeters, inclinometers, surface or deep-wire extensometers, tilt-meters, electric crack gauges, etc.
In both cases it is necessary to develop predictive models in order to choosethe thresholds to be used as warning levels, taking into account, on one hand, theexpected frequency and magnitude of the landslide and, on the other, the vulner-ability and value of the elements at risk.
The rapid development of technology in recent years has had importanteffects on landslide monitoring and control. Besides making traditional methodsand instrumentation much more effective and easily manageable, innovativetechnology is starting to produce accurate and reliable monitoring systems.Traditional equipment can now be effectively and conveniently coordinated bycentral units capable of acquiring, storing and managing all the collected data.GPS (Global Positioning System) technology has been successfully applied to themonitoring of landslides of different types and is gradually replacing traditionaltopographic surveying techniques. Radar interferometry and laser technology
WMO/UNESCO SUB-FORUM ON NATURAL DISASTER REDUCTION
102
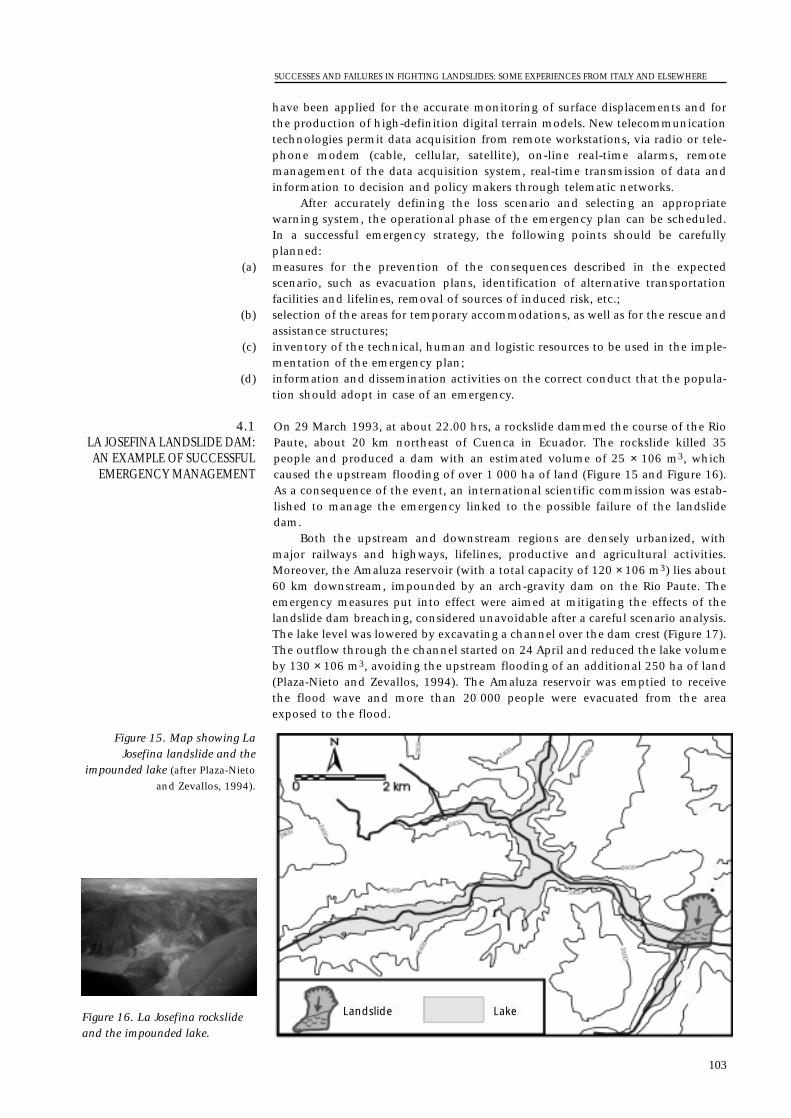
have been applied for the accurate monitoring of surface displacements and forthe production of high-definition digital terrain models. New telecommunicationtechnologies permit data acquisition from remote workstations, via radio or tele-phone modem (cable, cellular, satellite), on-line real-time alarms, remotemanagement of the data acquisition system, real-time transmission of data andinformation to decision and policy makers through telematic networks.
After accurately defining the loss scenario and selecting an appropriatewarning system, the operational phase of the emergency plan can be scheduled.In a successful emergency strategy, the following points should be carefullyplanned:
(a) measures for the prevention of the consequences described in the expectedscenario, such as evacuation plans, identification of alternative transportationfacilities and lifelines, removal of sources of induced risk, etc.;
(b) selection of the areas for temporary accommodations, as well as for the rescue andassistance structures;
(c) inventory of the technical, human and logistic resources to be used in the imple-mentation of the emergency plan;
(d) information and dissemination activities on the correct conduct that the popula-tion should adopt in case of an emergency.
On 29 March 1993, at about 22.00 hrs, a rockslide dammed the course of the RioPaute, about 20 km northeast of Cuenca in Ecuador. The rockslide killed 35people and produced a dam with an estimated volume of 25 × 106 m3, whichcaused the upstream flooding of over 1 000 ha of land (Figure 15 and Figure 16).As a consequence of the event, an international scientific commission was estab-lished to manage the emergency linked to the possible failure of the landslidedam.
Both the upstream and downstream regions are densely urbanized, withmajor railways and highways, lifelines, productive and agricultural activities.Moreover, the Amaluza reservoir (with a total capacity of 120 × 106 m3) lies about60 km downstream, impounded by an arch-gravity dam on the Rio Paute. Theemergency measures put into effect were aimed at mitigating the effects of thelandslide dam breaching, considered unavoidable after a careful scenario analysis.The lake level was lowered by excavating a channel over the dam crest (Figure 17).The outflow through the channel started on 24 April and reduced the lake volumeby 130 × 106 m3, avoiding the upstream flooding of an additional 250 ha of land(Plaza-Nieto and Zevallos, 1994). The Amaluza reservoir was emptied to receivethe flood wave and more than 20 000 people were evacuated from the areaexposed to the flood.
4.1LA JOSEFINA LANDSLIDE DAM:AN EXAMPLE OF SUCCESSFULEMERGENCY MANAGEMENT
SUCCESSES AND FAILURES IN FIGHTING LANDSLIDES: SOME EXPERIENCES FROM ITALY AND ELSEWHERE
103
Landslide Lake
Figure 15. Map showing LaJosefina landslide and the
impounded lake (after Plaza-Nieto
and Zevallos, 1994).
Figure 16. La Josefina rockslideand the impounded lake.
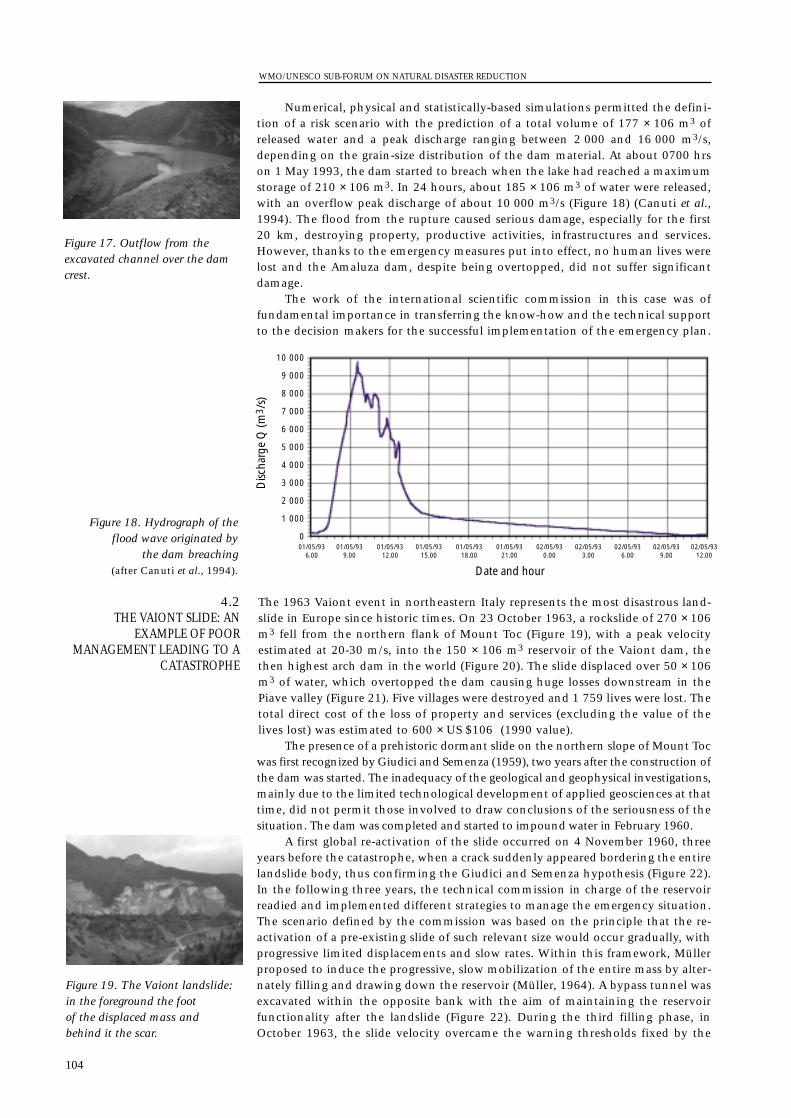
Numerical, physical and statistically-based simulations permitted the defini-tion of a risk scenario with the prediction of a total volume of 177 × 106 m3 ofreleased water and a peak discharge ranging between 2 000 and 16 000 m3/s,depending on the grain-size distribution of the dam material. At about 0700 hrson 1 May 1993, the dam started to breach when the lake had reached a maximumstorage of 210 × 106 m3. In 24 hours, about 185 × 106 m3 of water were released,with an overflow peak discharge of about 10 000 m3/s (Figure 18) (Canuti et al.,1994). The flood from the rupture caused serious damage, especially for the first20 km, destroying property, productive activities, infrastructures and services.However, thanks to the emergency measures put into effect, no human lives werelost and the Amaluza dam, despite being overtopped, did not suffer significantdamage.
The work of the international scientific commission in this case was offundamental importance in transferring the know-how and the technical supportto the decision makers for the successful implementation of the emergency plan.
The 1963 Vaiont event in northeastern Italy represents the most disastrous land-slide in Europe since historic times. On 23 October 1963, a rockslide of 270 × 106m3 fell from the northern flank of Mount Toc (Figure 19), with a peak velocityestimated at 20-30 m/s, into the 150 × 106 m3 reservoir of the Vaiont dam, thethen highest arch dam in the world (Figure 20). The slide displaced over 50 × 106m3 of water, which overtopped the dam causing huge losses downstream in thePiave valley (Figure 21). Five villages were destroyed and 1 759 lives were lost. Thetotal direct cost of the loss of property and services (excluding the value of thelives lost) was estimated to 600 × US $106 (1990 value).
The presence of a prehistoric dormant slide on the northern slope of Mount Tocwas first recognized by Giudici and Semenza (1959), two years after the construction ofthe dam was started. The inadequacy of the geological and geophysical investigations,mainly due to the limited technological development of applied geosciences at thattime, did not permit those involved to draw conclusions of the seriousness of thesituation. The dam was completed and started to impound water in February 1960.
A first global re-activation of the slide occurred on 4 November 1960, threeyears before the catastrophe, when a crack suddenly appeared bordering the entirelandslide body, thus confirming the Giudici and Semenza hypothesis (Figure 22).In the following three years, the technical commission in charge of the reservoirreadied and implemented different strategies to manage the emergency situation.The scenario defined by the commission was based on the principle that the re-activation of a pre-existing slide of such relevant size would occur gradually, withprogressive limited displacements and slow rates. Within this framework, Müllerproposed to induce the progressive, slow mobilization of the entire mass by alter-nately filling and drawing down the reservoir (Müller, 1964). A bypass tunnel wasexcavated within the opposite bank with the aim of maintaining the reservoirfunctionality after the landslide (Figure 22). During the third filling phase, inOctober 1963, the slide velocity overcame the warning thresholds fixed by the
4.2THE VAIONT SLIDE: AN
EXAMPLE OF POORMANAGEMENT LEADING TO A
CATASTROPHE
WMO/UNESCO SUB-FORUM ON NATURAL DISASTER REDUCTION
104
Figure 17. Outflow from theexcavated channel over the damcrest.
10 000
9 000
8 000
6 000
5 000
4 000
3 000
2 000
1 000
0
7 000
01/05/936.00
01/05/939.00
01/05/9312.00
01/05/9315.00
01/05/9318.00
01/05/9321.00
02/05/930.00
02/05/933.00
02/05/936.00
02/05/939.00
02/05/9312.00
Date and hour
Disc
harg
e Q
(m3 /
s)
Figure 18. Hydrograph of theflood wave originated by
the dam breaching (after Canuti et al., 1994).
Figure 19. The Vaiont landslide:in the foreground the foot of the displaced mass and behind it the scar.
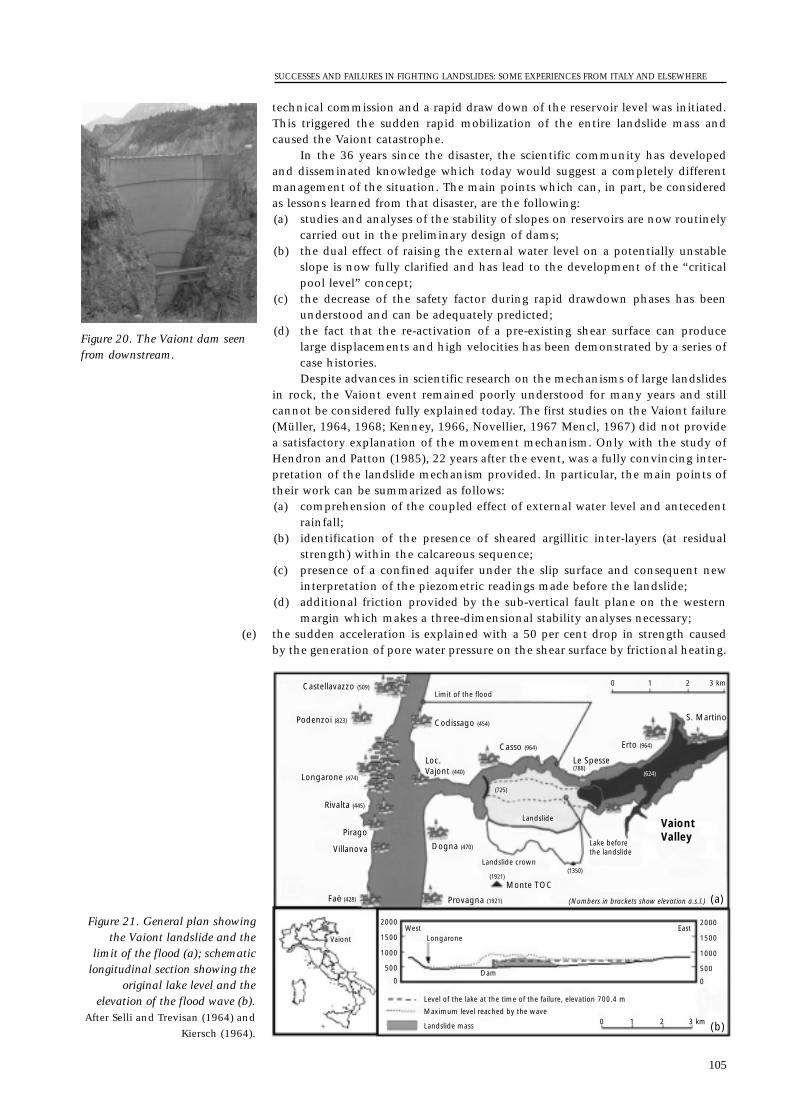
technical commission and a rapid draw down of the reservoir level was initiated.This triggered the sudden rapid mobilization of the entire landslide mass andcaused the Vaiont catastrophe.
In the 36 years since the disaster, the scientific community has developedand disseminated knowledge which today would suggest a completely differentmanagement of the situation. The main points which can, in part, be consideredas lessons learned from that disaster, are the following:(a) studies and analyses of the stability of slopes on reservoirs are now routinely
carried out in the preliminary design of dams;(b) the dual effect of raising the external water level on a potentially unstable
slope is now fully clarified and has lead to the development of the “criticalpool level” concept;
(c) the decrease of the safety factor during rapid drawdown phases has beenunderstood and can be adequately predicted;
(d) the fact that the re-activation of a pre-existing shear surface can producelarge displacements and high velocities has been demonstrated by a series ofcase histories.Despite advances in scientific research on the mechanisms of large landslides
in rock, the Vaiont event remained poorly understood for many years and stillcannot be considered fully explained today. The first studies on the Vaiont failure(Müller, 1964, 1968; Kenney, 1966, Novellier, 1967 Mencl, 1967) did not providea satisfactory explanation of the movement mechanism. Only with the study ofHendron and Patton (1985), 22 years after the event, was a fully convincing inter-pretation of the landslide mechanism provided. In particular, the main points oftheir work can be summarized as follows:(a) comprehension of the coupled effect of external water level and antecedent
rainfall;(b) identification of the presence of sheared argillitic inter-layers (at residual
strength) within the calcareous sequence;(c) presence of a confined aquifer under the slip surface and consequent new
interpretation of the piezometric readings made before the landslide;(d) additional friction provided by the sub-vertical fault plane on the western
margin which makes a three-dimensional stability analyses necessary;(e) the sudden acceleration is explained with a 50 per cent drop in strength caused
by the generation of pore water pressure on the shear surface by frictional heating.
SUCCESSES AND FAILURES IN FIGHTING LANDSLIDES: SOME EXPERIENCES FROM ITALY AND ELSEWHERE
105
Figure 20. The Vaiont dam seenfrom downstream.
Level of the lake at the time of the failure, elevation 700.4 m
Maximum level reached by the wave
Landslide mass
0
500
1000
1500
2000
0
500
1000
1500
2000West East
Longarone
Dam
Vaiont
0 1 2 3 km
0 1 2 3 km
(a)
(b)
(Numbers in brackets show elevation a.s.l.)
VaiontValley
Lake before the landslide
Landslide crown
Landslide
Limit of the flood
(1350)(1921)
Monte TOC
Provagna (1921)
Dogna (470)
Faè (428)
Rivalta (445)
Longarone (474)
Podenzoi (823)
Castellavazzo (509)
Codissago (454)
Casso (964) Erto (964)
Le Spesse(788)
(624)
(725)
S. Martino
Loc. Vajont (440)
Villanova
Pirago
Figure 21. General plan showingthe Vaiont landslide and the
limit of the flood (a); schematiclongitudinal section showing the
original lake level and theelevation of the flood wave (b).
After Selli and Trevisan (1964) and
Kiersch (1964).

The last point is perhaps the weakest of the Hendron and Patton study, sinceit does not appear to be sufficiently documented nor supported by thermody-namical modelling. Hutchinson (1987) offered an alternative explanation of thesudden acceleration. The markedly non-circular shape of the slip surface (insection) did not allow the mass to slide without triggering internal deformationsor ruptures. The high strength and brittleness of the Cretaceous limestone couldhave caused the accumulation of strains with a sudden drop in strength followingthe development of internal shear zones. A further decrease in strength is attrib-uted by Hutchinson (1987) to the drop in residual strength caused by rapidshearing. This idea seems to be confirmed by high-speed ring shear tests carriedout on samples from the slip surface (Tika and Hutchinson, 1999) that showed aloss of up to 60 per cent of the slow residual strength. Thirty-six years after thedisaster a complete interpretation of the event seems to be close.
The actions to be carried out for coping with landslide hazard can be divided intothree main phases: prediction, prevention, and emergency management. In theprediction phase, it should be considered that landslides are complex phenomenacaused by many factors, such as intrinsic ground conditions, geomorphological,physical and man-made processes. All of these factors interact and can rarely becompletely recognized before the occurrence of an event. Therefore the predic-tion, in particular the temporal prediction, is difficult and complex and can onlybe obtained by keeping these factors under control by monitoring systems. Thiscan be implemented only in special cases where the value of the elements at riskjustifies the expense. Particular care should be used when the territory has been
5.CONCLUSIONS
WMO/UNESCO SUB-FORUM ON NATURAL DISASTER REDUCTION
106
Control points installed before Nov. 1960
Roads
Perimetral crack after Selli and Trevisan (1964)
Perimetral crack after Rossi and Semenza (1965)Remains of pre-historic slide, right bankGiudici and Semenza (1960)
Outcrop of slip surface of pre-historic slide, right bankGiudici and Semenza (1960)
Principal slides prior to 9 October 1963
Faults after Carloni and Mazzanti (1964)
Faults after Rossi and Semenza (1965)
Control points installed during Nov. 1960
Drill holed made in 1959–1960
Drill holed made in 1961 (piezometers)
Lake (maximum elevation 722.5)
Legend
Casso
DamBy-pass tunnel
Figure 22. General plan of theVaiont valley before the slide
(after Hendron and Patton, 1985).
strongly modified by human activity, which frequently disturbs the pre-existingconditions of natural equilibrium. Spatial hazard prediction is usually more feasi-ble since the integrated analysis of slope stability factors, such as lithology,morphology and hydrogeology, makes landslide-prone areas readily identifiable.Landslides are dynamic processes that, in most cases, show evident traces of theirpresence before occurring. This is obvious in re-activations of pre-existing events,but it is also frequently true in first-time failures characterized by precursorysymptoms that, if promptly detected with detailed geomorphic investigations, areof invaluable help in landslide hazard zoning. These considerations point outhow landslide inventory mapping can be a powerful predictive tool. The Emilia-Romagna case is an excellent example of how the systematic collection ofgeologic and geomorphic data, with the aid of modern geographic informationsystems, can be successfully employed in the regional assessment of landslide risk.Unfortunately, man is still confronted with situations that are difficult to predict,such as in the Versilia example, that show how extreme events can escape theprediction techniques currently available and cause huge unexpected losses.
Regarding landslide risk prevention, success is linked to a clear spatial andtypological prediction: when the phenomena are clearly spatially delimited andtheir mechanism is fully described, risk mitigation actions can be successfullyimplemented. Therefore prevention can be pursued, on one hand, through themitigation of hazard, following the identification of precursory symptoms and ofpreparatory casual factors and, on the other, through a correct management ofhuman activities and land use. With the combination and coordination of theseactions, the success rate of preventive measures becomes satisfactory. Careful landand urban planning is of paramount importance in countries exposed to landslidehazard and the cases illustrated in this paper have shown two differentapproaches. These can either lead to effective slope stabilization, even promotingthe re-beautification of a landscape such in the San Miniato hill example, or to amajor catastrophe such as in the Sarno event where incomplete geologic andgeomorphic knowledge was combined with uncontrolled urban development.
For effective management, an emergency should be accurately planned anddefined before hand, integrating both elements of prediction and prevention. Theimplementation is usually carried out in rapid succession and under conditions ofgreat stress. It is in this phase that the scientific community can play a funda-mental role, transferring to the decision makers the necessary knowledge forsuccessfully overcoming a crisis. The comparison between La Josefina and theVaiont examples points out how the development of investigation and simulationtechniques can help define reliable scenarios, with functional warning systems,that permit us to correctly manage emergency situations.
Research on high-risk slope movements is carried out within the NationalResearch Council Group for Hydro-geological Disaster Prevention, funded by theCivil Protection Department of the Italian Government. Research on landslidehazard in cultural heritage sites is funded by the National Research Councilthrough the Special Project “Safeguard of Cultural Heritage”.
The case studies presented are derived directly from the authors’ experiencein projects and tasks involving other scientists, boards and institutions. For theEmilia-Romagna Region, data were kindly supplied by the Servizio ProtezioneCivile, Servizio Difesa del Suolo and Servizio Cartografico e Geologico. For theVersilia case, the authors wish to acknowledge the National Hydrographic Surveyfor providing rainfall data and colleagues at the University of Pisa for the collab-oration in the research. The authors are also grateful to R. Bertocci and G.D’Amato-Avanzi for the extensive historic and geomorphic researches on thestability of the San Miniato hill. The State Archive of Florence kindly permittedaccess to historic maps and documents. A. Iotti and P. Aleotti are acknowledgedfor the data and analyses on the Sarno event. Most of the hydraulic analyses onthe Josefina landslide dam have been carried out by L. Natale and A. Frassoni. Theauthors acknowledge E. Semenza for his invaluable experience, data and materialon the Vaiont disaster. G. Falorni is acknowledged for the final review of the text.
ACKNOWLEDGEMENTS
SUCCESSES AND FAILURES IN FIGHTING LANDSLIDES: SOME EXPERIENCES FROM ITALY AND ELSEWHERE
107
Aleotti P., Bastianelli L., Canuti P., Iotti A., Polloni G. and Vannocci P. (1999); Theuse of airborne laser terrain mapping techniques in slope instability assessment:preliminary results in the Sarno area. Proc. General Assembly of the EuropeanGeophysical Society. In press.
Antoine P. (1977); Rèflexions sur la cartographie ZERMOS et bilan des expériences encours. BRGM Bull., Sect.III, N.1-2, pp. 9-20.
Bertocci R. and D'Amato Avanzi G. (1993); Il contributo dell'analisi ed interpre-tazione dei documenti storici relativi ai dissesti che interessano la collina di S.Miniatoal Monte (Firenze). Atti 3 congresso Giovani Ricercatori in Geologia Applicata,Potenza (in stampa)
Bertocci , R., Canuti P., Focardi P., Garzonio C.A., Trivisonno R. (1995); I problemidi stabilità della collina di San Miniato nella storia urbanistica e monumentaledi Firenze. Geologia Applicata e Idrogeologia, Bari, 30, pp. 451-168.
Brabb E.E., Pampeyan E.H. and Bonilla M.G. (1972); Landslide susceptibility in SanMateo County, California. USGS Misc. Field Study Map, MF-360.
Caine N. 1980; The rainfall intensity-duration control of shallow landslides anddebris flows. Geografiska Annal, 62A, pp. 23-27.
Cancelli A. and Nova R. (1985); Landslides in soil and debris cover triggered by rain-fall in Valtellina (Central Alps-Italy). Proc. IV Int. Conf. & Field Workshop onLandslides, Tokio, pp. 267-272.
Canuti P., Egidi D. and Palmieri S. (1998); Prevenzione e gestione del rischio nellafrana di Silla (Gaggio Montano, BO) del novembre 1994. Proc. InternationalConference on Prevention of Hydrogeological Hazards, Alba 1996, 1, 613-624.
Canuti P., Frassoni A., Natale L. (1994); Failure of Rio Paute Landslide Dam.Landslide News, 8, pp. 6-7.
Canuti P. & Casagli N. (1996); Considerazioni sulla valutazione del rischio di frana.Atti del Convegno “Fenomeni franosi e centri abitati”. Bologna, 27 Maggio 1994.CNR-GNDCI - Regione Emilia-Romagna. 29-130.
Canuti P., Casagli N., Pellegrini M. and Tosatti G. (1999); Geo-hydrologicalhazard. In: G.B. Vai and P. Martini (eds.) Apennine Book Chpt.28. In press.
Caredio F., D’Amato Avanzi G., Puccinellic A., Trivellini M., Venutelli M. and Verani M.(1998); La catastrofe idrogeologica del 19/6/1996 in Versilia e Garfagnana (Toscana, Italia):aspetti geomorfologici e valutazione idrauliche. Proc. International Conference onPrevention of Hydrogeological Hazards, Alba 1996, 1, pp. 75-88.
Casagli N., Catani F. and Salvadori A. (1999); A model for prediction of landslide trig-gered by prolonged rainfall in low permeability terrains. European GeophysicalSociety Plinius Conference on Mediterranean storms. Maratea, Italy. 14-16October 1999.
Casagli N., Iotti A. and Tarchiani U. (1995); Caratteri geomorfologici e geotecnici dellafrana di San Benedetto Val di Sambro (BO). Proc. 2° International Meeting ofYoung Researchers in Applied Geology, Peveragno (CN). Politecnico di Torino.Dipartimento di Georisorse e Territorio. Sez.A, pp. 32-37.
Castelli F., Becchi I., Caporali E., Mazzanti B. and Castellani L. (1997); Hydro-sedi-mentological analysis of the '96 Apuanian Alps flash-flood event. Proc. XXIIGeneral Assembly of the European Geophysical Society, In press.
Cruden D. M. (1991); A simple definition of a landslide. Bull. InternationalAssociation Engineering Geology, 43, pp. 27-29.
Cruden D.M. and Varnes D.J. (1996); Landslides types and processes. In:Landslides: investigation and mitigation. Transportation Research Board. NationalResearch Council. Special Report 247. National Academy Press, Washington.Chap.3, pp. 36-75.
Cruden , D. and Fell, R. (Eds.) (1997); Landslide risk assessment. Proceedings of theInternational Workshop on Landslide Risk Assessment, Honolulu, 19-21February 1997. Balkema, Rotterdam, 371pp.
De Graff, J.V. (1978); Regional landslide evaluation: two Utah examples.Enviromental geology, 2(4), pp. 203-214.
Del Prete M., Guadagno F.M. and Hawkins A.B. (1998); Preliminary report on thelandslides of 5 May 1998, Campania, Italy. Bull. Engineering Geology and theEnvironment. Springer-Verlag. 57, pp. 113-129.
REFERENCES
WMO/UNESCO SUB-FORUM ON NATURAL DISASTER REDUCTION
108

DRM (Délégation aux Risques Majeurs) (1985); Mise en oeuvre des Plansd’Exposition aux Risques naturels prévisibles. Plan d'Exposition aux risques.Rapport Administratif et technique provisoire. Premier Ministre.
DRM (Délégation aux Risques Majeurs) (1988); Evaluation de la vulnérabilité. Pland'Exposition aux risques. Ministère de l'Environnement. Direction de l'Eau et dela Prévention des Pollutions et des Risques. La Documentation Française.112pp.
DRM (Délégation aux Risques Majeurs) (1990); Les études préliminaires à lacartographie réglementaire des risques naturels majeurs. Secrétariat d' Ètat auprèsdu Premier ministre chargé de l'Environnement et de la Prévention des Risquestechnologiques et naturels majeurs. La Documentation Française. 143pp.
Einstein H.H. (1988); Special Lecture: Landslide risk assessment procedure. Proc. 5thInt. Symp. on Landslides, Lausanne, 2, pp. 1075-1090.
Garberi M.L., Palumbo A. and Pizziolo M. (1999); I numeri sulle frane. RegioneEmilia-Romagna. Direzione Generale Sistemi Informativi e Telematica –Servizio Cartografico e Geologico. Grafiche Damiani, Bologna, 94pp.
Giudici F. and Semenza E. (1959); Studio geologico del serbatoio del Vaiont. Relazioneinedita. SADE.
Gottardi G., Malaguti C., Marchi G., Pellegrini M., Tellini C. and Tosatti G. (1998);Landslide risk management in large, slow mass movements: an example in theNorthern Apennines (Italy). Proc. 2nd Internat. Conf. on EnvironmentalManagement, University of Wollongong, Australia. 2, pp. 951-962.
Hartlén J. and Viberg L. (1988); General report: Evaluation of landslide hazard. Proc.5th Int. Symp. on Landslides, Lausanne, 2, pp. 1037-1058.
Hendron A. J. and Patton F. D. (1985); The Vaiont slide, a geotechnical analysis basedon new geologic observations of the failure surface. Depart. of Army, U. S. ArmyCorps of Engineers, Tech. Rep. GL-85-5, p. 103.
Humbert M. (1976); Le cartographie en France des zones exposées à des risquesliés aux mouvements du sol; Cartes ZERMOS. IAEG Bull., 16, pp. 80-82.
Humbert M. (1977); La cartographie ZERMOS. Modalités d'établissement descartes des zones exposées à des risques liés aux mouvements du sol et du sous-sol. BRGM Bull., Serie II, sect. III, n.1/2, 5-8.
Hutchinson J.N. (1977); Assessment of the effectiveness of corrective measures inrelation to geological conditions and types of slope movements. IAEG Bull., 16,pp. 131-155.
Hutchinson J.N. (1987); Mechanisms producing large displacements in landslides onpre-existing shears. 1st Sino-British Geol. Conf., Tapei, Memoir of the GeologicalSurvey of China, 9, pp. 175-200.
Hutchinson J.N. (1988); General report: Morphological and geothecnical parameters oflandslides in relation to geology and hydrogeology. Proc. 5th Int. Symp. onLandslides, Lausanne, 1: pp. 3-36.
International Union of Geological Sciences Working Group on Landslides(IUGS/WGL) (1997); Quantitative risk assessment for slopes and landslides –The state-of-the-art. In Cruden, D. & Fell, R. (Eds.) Landslide risk assessment.Proceedings of the International Workshop on Landslide Risk Assessment,Honolulu, 19-21 February 1997. Balkema, Rotterdam, pp. 3-12.
International Union of Geological Sciences Working Group on Landslides(IUGS/WGL) (1995); A suggested method for describing the rate of movementof a landslide. IAEG Bull., 52, pp. 75-78.
Jibson R.W. (1989); Debris flows in southern Puerto Rico. Geol. Soc. Am. Spec. Pub.,236, pp. 1-13.
Kenney T.C. (1966); Stability of the Vaiont slide slope. Rock Mech. Eng. Geol., 1,pp. 10-16.
Kiersch G.A. (1964); Vaiont Reservoir Disaster. Civil Engineering, March 1964, 32-39.
Larini G., Marchi G. Pellegrini M. and Tellini C. (1997); La grande frana di Corniglio(Appennino settentrionale, Provincia di Parma) riattivata negli anni 1994-96. Proc.International Conference on Prevention of Hydrogeological Hazards, Alba1996, 1, pp. 505-516.
SUCCESSES AND FAILURES IN FIGHTING LANDSLIDES: SOME EXPERIENCES FROM ITALY AND ELSEWHERE
109
Mencl V. (1967); Mechanics of landslides with non-circular slip surface withspecial reference to the Vaiont slide. Géotechnique, 16, pp. 329-337.
Moser M. and Hohensinn F. (1983); Geotechnical aspects of soil slips in AlpineRegions. Engineering Geology, 19, pp. 185-211.
Müller L. (1964); The Rock Slide in the Vaiont Valley. Rock Mech. Eng. Geol. 2(3-4), pp. 148-212.
Müller L. (1968); New considerations on the Vaiont slide. Rock Mech. Eng. Geol. 6,pp. 1-91.
Novellier E. (1967); Shear strength of bedded and jointed rock as determined from theZalesina and Vaiont slides. Proc. Geotechnical Conference, Oslo, 1, pp. 289-294.
Plaza-Nieto G. and Zevallos O. (1994); The 1993 La Josefina rockslide and RioPaute landslide dam, Ecuador. Landslide News, 8, pp. 4-6.
Radbruch-Hall D.H., Colton R.B., Davies W.E., Lucchitta I., Skipp B.A. and VarnesD.J. (1982); Landslide overview map of the conterminous United States. USGS Prof.Papers 1183, US Gov. Printing Office, 25pp.
Radbruch-Hall D.H., Colton R.B., Davies W.E., Skipp B.A., Lucchitta I., and VarnesD.J. (1976); Preliminary landslide overview map of the conterminous United States.U.S. Geol. Survey Misc. Field Studies Map, MF-771.
Selli R. and Trevisan L. (1964); Caratteri e interpretazione della frana del Vaiont.Annali del Museo Geologico di Bologna, Ser.2, 32(1).
Schuster R.L. (1996); Socio-economic significance of landslides. In: Landslides:Investigation and Mitigation. Transportation Research Board. National ResearchCouncil. Special Report 247. National Academy Press, Washington. Chap.2, pp.12-35.
Tika TH.E. and Hutchinson J.N. (1999); Ring shear tests from the Vaiont landslideslip surface. Géotechnique, 49(1), pp. 59-74.
Varnes D.J. and IAEG Comm. on Landslides (1984); Landslide hazard zonation - areview of principles and practice. UNESCO Paris. 63pp.
Varnes D.J. (1981); Slope-stability problems of the Circum-Pacific region as relatedto mineral and energy resources. In: Halbouty M.T. (ed.) Energy resources of thePacific Region. American Association of Petroleum Geologist Studies in Geology,12, pp. 489-505.
Wieczorek G.F. and Sarmiento J. (1988); Rainfall, piezometric levels and debrisflows near La Honda, California, in storms between 1975 and 1983. In:Landslides, floods and marine effects of the storm of Jan 3-5, 1982, in the S.FranciscoBay region, California. USGS Prof. Papers., 1434, pp. 43-63.
WP/WLI - International Geotechnical Societies’ UNESCO Working Party on WorldLandslide Inventory (1990); A suggested method for reporting a landslide.IAEG Bull., 41, pp. 5-12.
WP/WLI - International Geotechnical Societies’ UNESCO Working Party on WorldLandslide Inventory (1991); A suggested method for a landslide summary.IAEG Bull., 43, pp. 101-110.
WP/WLI - International Geotechnical Societies’ UNESCO Working Party on WorldLandslide Inventory (1993a); A suggested method for describing the activity ofa landslide. IAEG Bull., 47, pp. 53-57.
WP/WLI - International Geotechnical Societies’ UNESCO Working Party forWorld Landslide Inventory (1993b); Multilingual Glossary for Landslides. TheCanadian Geotechnical Society. BiTech Publisher Ltd., Richmond (CAN).
WP/WLI - International Geotechnical Societies’ UNESCO Working Party on WorldLandslide Inventory (1994) - A suggested method for reporting landslidecauses. IAEG Bull., 50, pp. 71-74.
Wu T.H., Tang W.H. and Einstein H.H. (1996); Landslide hazard and risk assess-ment. In: Landslides: Investigation and Mitigation. Transportation ResearchBoard. National Research Council. Special Report 247. National Academy Press,Washington. Chap.6, pp. 106-118.
WMO/UNESCO SUB-FORUM ON NATURAL DISASTER REDUCTION
110
SNOW AVALANCHES
By Paul M.B. Föhn, Walter J. Ammann, Swiss Federal Institute for Snow and Avalanche Research
For alpine countries, avalanches represent one of the major hazards, threateningpeople in villages as well as on highways and railways. Measures have to be takento reduce the avalanche risk. Avalanche hazard mapping, as a basis for land useplanning, and avalanche warning are the most cost-effective measures to reduceor even avoid avalanche exposure. Long-term technical measures, such assupporting structures, deflecting dams and afforestations, or short-term measures,such as avalanche forecasting, artificial avalanche release or evacuation, might bechosen to reduce the avalanche risk to an acceptable level. It is important to eval-uate the different measures within the framework of an overall risk managementprocedure.
In the Alps and elsewhere, expanding settlements and increasing mobility due totourism have resulted in a growing number of structures under threat byavalanches. Eleven million people live in the Alpine region from France throughSwitzerland, Italy, Austria to Slovenia and this number is temporarily tripled dueto winter tourism. A number of important highways and railways cross the Alps.For example over 19 000 vehicles daily cross the Gotthard Pass, a very importanttransit route between Italy and Germany (CIPRA, 1998). Since the catastrophicavalanche winter in 1950–51, the mobility of people in terms of vehicle-kilome-tres may have increased by a factor of 100. Therefore, it is no surprise thatavalanche mitigation has continued to play an important role in the life of peopleliving in the Alps. In Switzerland alone, over the past 50 years, about 1.5 billionSwiss francs have been invested in engineering construction work for avalancheprotection such as snow supporting structures, deflectors or snow sheds. Togetherwith daily avalanche forecasts, the avalanche hazard zoning and sustainable silvi-culture of the protection forests, has led to a high degree of safety (compared toother hazards) in densely populated mountainous areas and on roads with highvolumes of traffic.
Although avalanche research and avalanche hazard mitigation have mademajor progress in recent decades, there are still deficiencies and not enoughknowledge or suitable tools to sufficiently protect life and property. The cata-strophic 1998–99 winter, with many hundreds of devastating avalanches all overthe central Alps, clearly showed this. In Switzerland alone, 17 people were killedduring January–February 1999, half of them in buildings and half of them onroads and in rural areas. Total damages are estimated at 1 billion Swiss francs,composed of 250 million Swiss francs in direct damages and 750 million Swissfrancs in indirect damages. Neighbouring alpine countries suffered from similarexperiences during this devastating period. In the European Alps, a total of 75fatalities were counted during January–February 1999.
Instabilities in the snow cover and external impacts can cause avalanches onslopes with an angle of 25°–55°. Extreme weather situations with heavy snowfallover several days may lead to catastrophic avalanches threatening villages, accessroads and railways. Different kinds of avalanches occur depending on the char-acteristics of the snow pack, the snow volume involved, the slope angle,additional loading, etc. Slab avalanches are most frequent and are typically ofmoderate size and involve snow masses in the order of a few 1 000 m3 up to some10 000 m3. Over the long-term, on average, most fatalities are due to accidentalsnow slab avalanche releases, set-off locally by off-piste skiers, ski mountaineersor similar leisure activities (in Switzerland these kind of avalanches caused 24 out
2.AVALANCHE HAZARD
AND DAMAGE SCENARIOS
1.INTRODUCTION
ABSTRACT
111
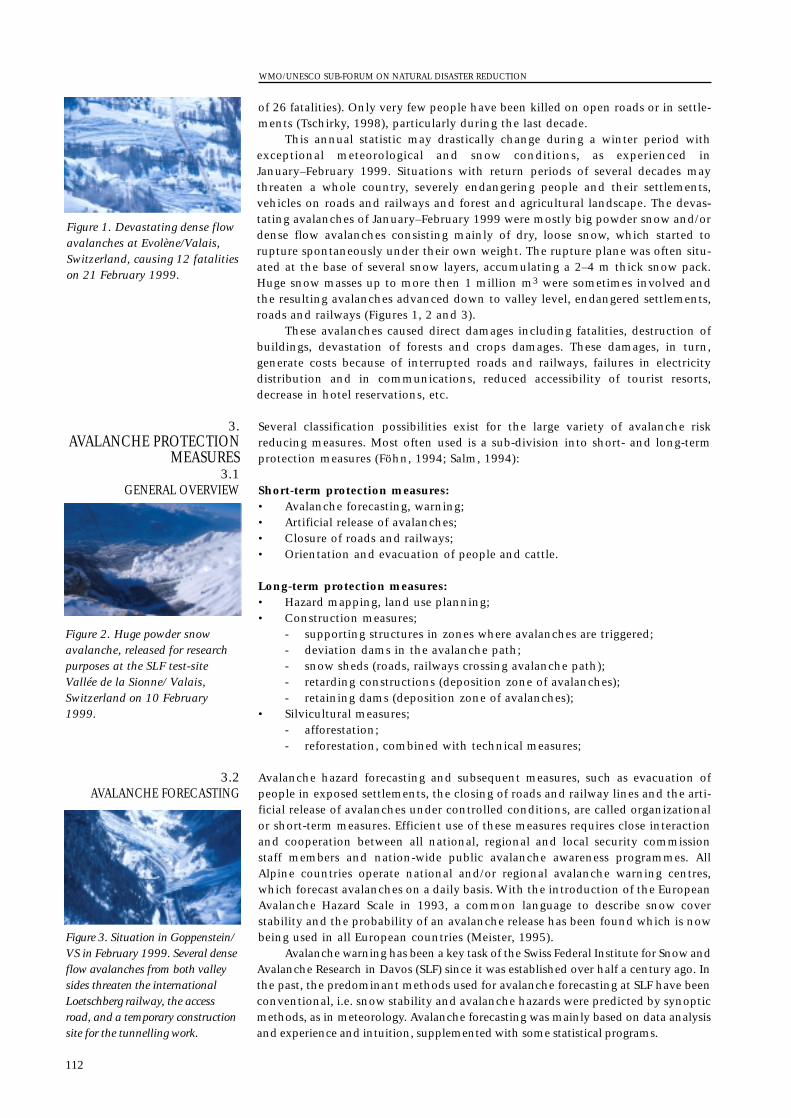
of 26 fatalities). Only very few people have been killed on open roads or in settle-ments (Tschirky, 1998), particularly during the last decade.
This annual statistic may drastically change during a winter period withexceptional meteorological and snow conditions, as experienced inJanuary–February 1999. Situations with return periods of several decades maythreaten a whole country, severely endangering people and their settlements,vehicles on roads and railways and forest and agricultural landscape. The devas-tating avalanches of January–February 1999 were mostly big powder snow and/ordense flow avalanches consisting mainly of dry, loose snow, which started torupture spontaneously under their own weight. The rupture plane was often situ-ated at the base of several snow layers, accumulating a 2–4 m thick snow pack.Huge snow masses up to more then 1 million m3 were sometimes involved andthe resulting avalanches advanced down to valley level, endangered settlements,roads and railways (Figures 1, 2 and 3).
These avalanches caused direct damages including fatalities, destruction ofbuildings, devastation of forests and crops damages. These damages, in turn,generate costs because of interrupted roads and railways, failures in electricitydistribution and in communications, reduced accessibility of tourist resorts,decrease in hotel reservations, etc.
Several classification possibilities exist for the large variety of avalanche riskreducing measures. Most often used is a sub-division into short- and long-termprotection measures (Föhn, 1994; Salm, 1994):
Short-term protection measures:• Avalanche forecasting, warning;• Artificial release of avalanches;• Closure of roads and railways;• Orientation and evacuation of people and cattle.
Long-term protection measures:• Hazard mapping, land use planning;• Construction measures;
- supporting structures in zones where avalanches are triggered;- deviation dams in the avalanche path;- snow sheds (roads, railways crossing avalanche path);- retarding constructions (deposition zone of avalanches);- retaining dams (deposition zone of avalanches);
• Silvicultural measures;- afforestation;- reforestation, combined with technical measures;
Avalanche hazard forecasting and subsequent measures, such as evacuation ofpeople in exposed settlements, the closing of roads and railway lines and the arti-ficial release of avalanches under controlled conditions, are called organizationalor short-term measures. Efficient use of these measures requires close interactionand cooperation between all national, regional and local security commissionstaff members and nation-wide public avalanche awareness programmes. AllAlpine countries operate national and/or regional avalanche warning centres,which forecast avalanches on a daily basis. With the introduction of the EuropeanAvalanche Hazard Scale in 1993, a common language to describe snow coverstability and the probability of an avalanche release has been found which is nowbeing used in all European countries (Meister, 1995).
Avalanche warning has been a key task of the Swiss Federal Institute for Snow andAvalanche Research in Davos (SLF) since it was established over half a century ago. Inthe past, the predominant methods used for avalanche forecasting at SLF have beenconventional, i.e. snow stability and avalanche hazards were predicted by synopticmethods, as in meteorology. Avalanche forecasting was mainly based on data analysisand experience and intuition, supplemented with some statistical programs.
3.2AVALANCHE FORECASTING
3.AVALANCHE PROTECTION
MEASURES3.1
GENERAL OVERVIEW
WMO/UNESCO SUB-FORUM ON NATURAL DISASTER REDUCTION
112
Figure 3. Situation in Goppenstein/VS in February 1999. Several denseflow avalanches from both valleysides threaten the internationalLoetschberg railway, the accessroad, and a temporary constructionsite for the tunnelling work.
Figure 1. Devastating dense flowavalanches at Evolène/Valais,Switzerland, causing 12 fatalitieson 21 February 1999.
Figure 2. Huge powder snowavalanche, released for researchpurposes at the SLF test-siteVallée de la Sionne/ Valais,Switzerland on 10 February1999.
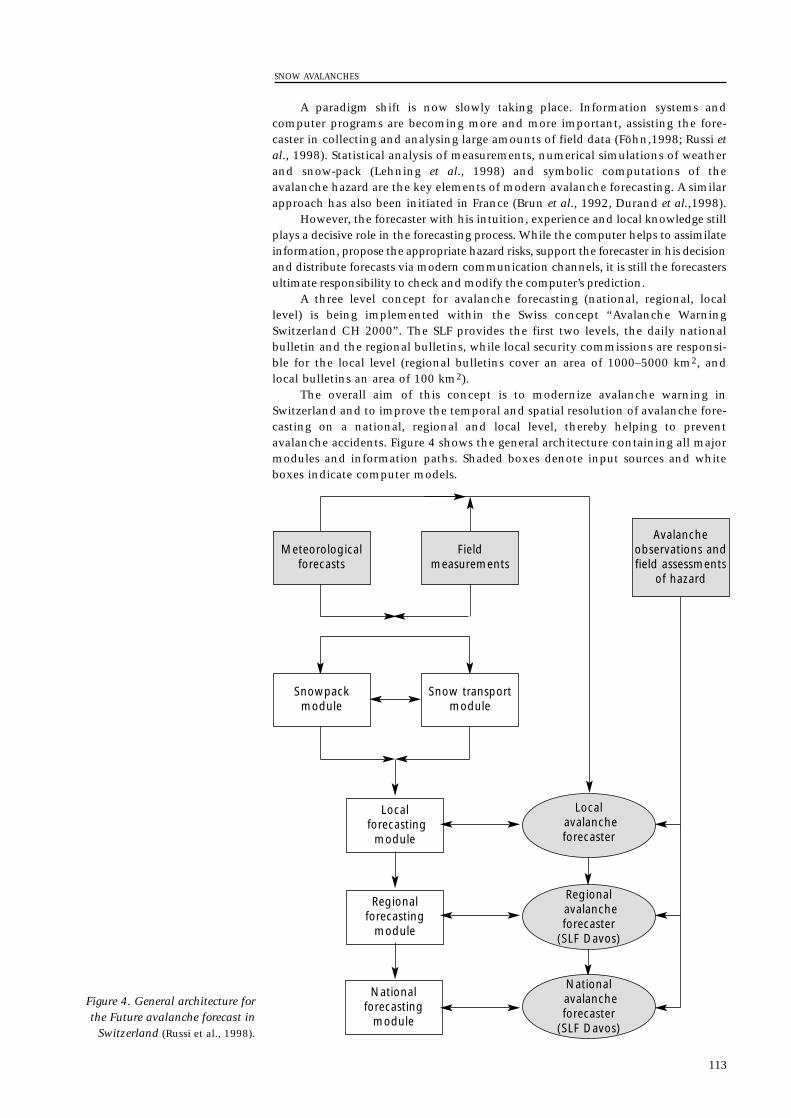
A paradigm shift is now slowly taking place. Information systems andcomputer programs are becoming more and more important, assisting the fore-caster in collecting and analysing large amounts of field data (Föhn,1998; Russi etal., 1998). Statistical analysis of measurements, numerical simulations of weatherand snow-pack (Lehning et al., 1998) and symbolic computations of theavalanche hazard are the key elements of modern avalanche forecasting. A similarapproach has also been initiated in France (Brun et al., 1992, Durand et al.,1998).
However, the forecaster with his intuition, experience and local knowledge stillplays a decisive role in the forecasting process. While the computer helps to assimilateinformation, propose the appropriate hazard risks, support the forecaster in his decisionand distribute forecasts via modern communication channels, it is still the forecastersultimate responsibility to check and modify the computer’s prediction.
A three level concept for avalanche forecasting (national, regional, locallevel) is being implemented within the Swiss concept “Avalanche WarningSwitzerland CH 2000”. The SLF provides the first two levels, the daily nationalbulletin and the regional bulletins, while local security commissions are responsi-ble for the local level (regional bulletins cover an area of 1000–5000 km2, andlocal bulletins an area of 100 km2).
The overall aim of this concept is to modernize avalanche warning inSwitzerland and to improve the temporal and spatial resolution of avalanche fore-casting on a national, regional and local level, thereby helping to preventavalanche accidents. Figure 4 shows the general architecture containing all majormodules and information paths. Shaded boxes denote input sources and whiteboxes indicate computer models.
SNOW AVALANCHES
113
Meteorologicalforecasts
Snowpackmodule
Localforecasting
module
Regionalforecasting
module
Nationalforecasting
module
Snow transportmodule
Field measurements
Avalancheobservations andfield assessments
of hazard
Localavalancheforecaster
Regional avalanche forecaster
(SLF Davos)
National avalanche forecaster
(SLF Davos)
Figure 4. General architecture forthe Future avalanche forecast in
Switzerland (Russi et al., 1998).
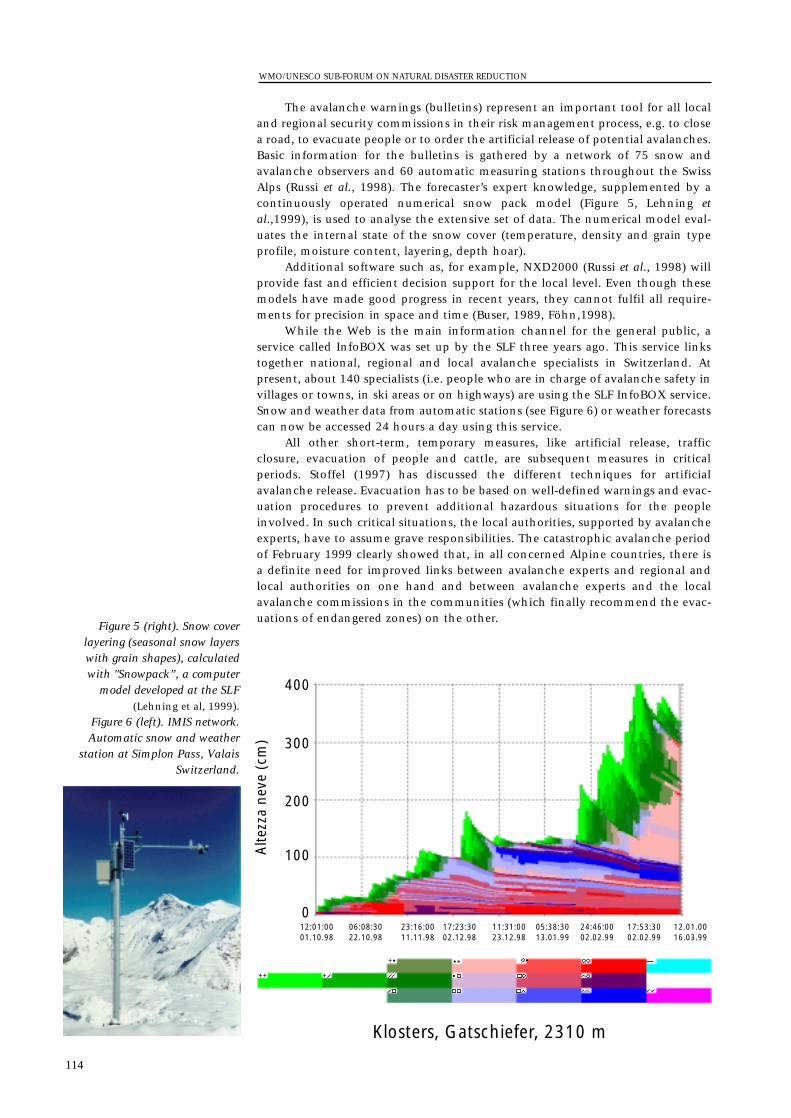
The avalanche warnings (bulletins) represent an important tool for all localand regional security commissions in their risk management process, e.g. to closea road, to evacuate people or to order the artificial release of potential avalanches.Basic information for the bulletins is gathered by a network of 75 snow andavalanche observers and 60 automatic measuring stations throughout the SwissAlps (Russi et al., 1998). The forecaster’s expert knowledge, supplemented by acontinuously operated numerical snow pack model (Figure 5, Lehning etal.,1999), is used to analyse the extensive set of data. The numerical model eval-uates the internal state of the snow cover (temperature, density and grain typeprofile, moisture content, layering, depth hoar).
Additional software such as, for example, NXD2000 (Russi et al., 1998) willprovide fast and efficient decision support for the local level. Even though thesemodels have made good progress in recent years, they cannot fulfil all require-ments for precision in space and time (Buser, 1989, Föhn,1998).
While the Web is the main information channel for the general public, aservice called InfoBOX was set up by the SLF three years ago. This service linkstogether national, regional and local avalanche specialists in Switzerland. Atpresent, about 140 specialists (i.e. people who are in charge of avalanche safety invillages or towns, in ski areas or on highways) are using the SLF InfoBOX service.Snow and weather data from automatic stations (see Figure 6) or weather forecastscan now be accessed 24 hours a day using this service.
All other short-term, temporary measures, like artificial release, trafficclosure, evacuation of people and cattle, are subsequent measures in criticalperiods. Stoffel (1997) has discussed the different techniques for artificialavalanche release. Evacuation has to be based on well-defined warnings and evac-uation procedures to prevent additional hazardous situations for the peopleinvolved. In such critical situations, the local authorities, supported by avalancheexperts, have to assume grave responsibilities. The catastrophic avalanche periodof February 1999 clearly showed that, in all concerned Alpine countries, there isa definite need for improved links between avalanche experts and regional andlocal authorities on one hand and between avalanche experts and the localavalanche commissions in the communities (which finally recommend the evac-uations of endangered zones) on the other.
WMO/UNESCO SUB-FORUM ON NATURAL DISASTER REDUCTION
114
Alte
zza
neve
(cm
)
400
300
200
100
006:08:3022.10.98
23:16:0011.11.98
17:23:3002.12.98
05:38:3013.01.99
11:31:0023.12.98
24:46:0002.02.99
17:53:3002.02.99
12.01.0016.03.99
12:01:0001.10.98
Figure 5 (right). Snow coverlayering (seasonal snow layerswith grain shapes), calculatedwith "Snowpack”, a computer
model developed at the SLF(Lehning et al, 1999).
Figure 6 (left). IMIS network.Automatic snow and weather
station at Simplon Pass, ValaisSwitzerland.
++ +
+• ••
•
•
Klosters, Gatschiefer, 2310 m
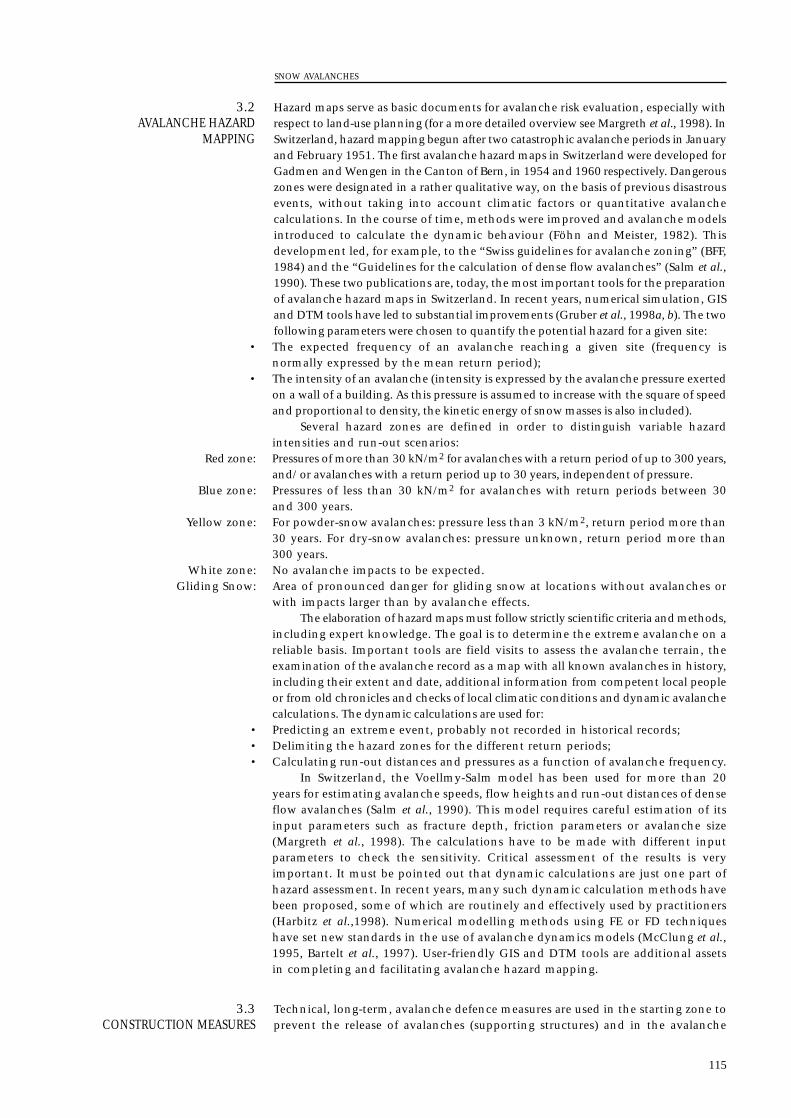
Hazard maps serve as basic documents for avalanche risk evaluation, especially withrespect to land-use planning (for a more detailed overview see Margreth et al., 1998). InSwitzerland, hazard mapping begun after two catastrophic avalanche periods in Januaryand February 1951. The first avalanche hazard maps in Switzerland were developed forGadmen and Wengen in the Canton of Bern, in 1954 and 1960 respectively. Dangerouszones were designated in a rather qualitative way, on the basis of previous disastrousevents, without taking into account climatic factors or quantitative avalanchecalculations. In the course of time, methods were improved and avalanche modelsintroduced to calculate the dynamic behaviour (Föhn and Meister, 1982). Thisdevelopment led, for example, to the “Swiss guidelines for avalanche zoning” (BFF,1984) and the “Guidelines for the calculation of dense flow avalanches” (Salm et al.,1990). These two publications are, today, the most important tools for the preparationof avalanche hazard maps in Switzerland. In recent years, numerical simulation, GISand DTM tools have led to substantial improvements (Gruber et al., 1998a, b). The twofollowing parameters were chosen to quantify the potential hazard for a given site:
• The expected frequency of an avalanche reaching a given site (frequency isnormally expressed by the mean return period);
• The intensity of an avalanche (intensity is expressed by the avalanche pressure exertedon a wall of a building. As this pressure is assumed to increase with the square of speedand proportional to density, the kinetic energy of snow masses is also included).
Several hazard zones are defined in order to distinguish variable hazardintensities and run-out scenarios:
Red zone: Pressures of more than 30 kN/m2 for avalanches with a return period of up to 300 years,and/ or avalanches with a return period up to 30 years, independent of pressure.
Blue zone: Pressures of less than 30 kN/m2 for avalanches with return periods between 30and 300 years.
Yellow zone: For powder-snow avalanches: pressure less than 3 kN/m2, return period more than30 years. For dry-snow avalanches: pressure unknown, return period more than300 years.
White zone: No avalanche impacts to be expected.Gliding Snow: Area of pronounced danger for gliding snow at locations without avalanches or
with impacts larger than by avalanche effects.The elaboration of hazard maps must follow strictly scientific criteria and methods,
including expert knowledge. The goal is to determine the extreme avalanche on areliable basis. Important tools are field visits to assess the avalanche terrain, theexamination of the avalanche record as a map with all known avalanches in history,including their extent and date, additional information from competent local peopleor from old chronicles and checks of local climatic conditions and dynamic avalanchecalculations. The dynamic calculations are used for:
• Predicting an extreme event, probably not recorded in historical records;• Delimiting the hazard zones for the different return periods;• Calculating run-out distances and pressures as a function of avalanche frequency.
In Switzerland, the Voellmy-Salm model has been used for more than 20years for estimating avalanche speeds, flow heights and run-out distances of denseflow avalanches (Salm et al., 1990). This model requires careful estimation of itsinput parameters such as fracture depth, friction parameters or avalanche size(Margreth et al., 1998). The calculations have to be made with different inputparameters to check the sensitivity. Critical assessment of the results is veryimportant. It must be pointed out that dynamic calculations are just one part ofhazard assessment. In recent years, many such dynamic calculation methods havebeen proposed, some of which are routinely and effectively used by practitioners(Harbitz et al.,1998). Numerical modelling methods using FE or FD techniqueshave set new standards in the use of avalanche dynamics models (McClung et al.,1995, Bartelt et al., 1997). User-friendly GIS and DTM tools are additional assetsin completing and facilitating avalanche hazard mapping.
Technical, long-term, avalanche defence measures are used in the starting zone toprevent the release of avalanches (supporting structures) and in the avalanche
3.3CONSTRUCTION MEASURES
3.2 AVALANCHE HAZARD
MAPPING
SNOW AVALANCHES
115
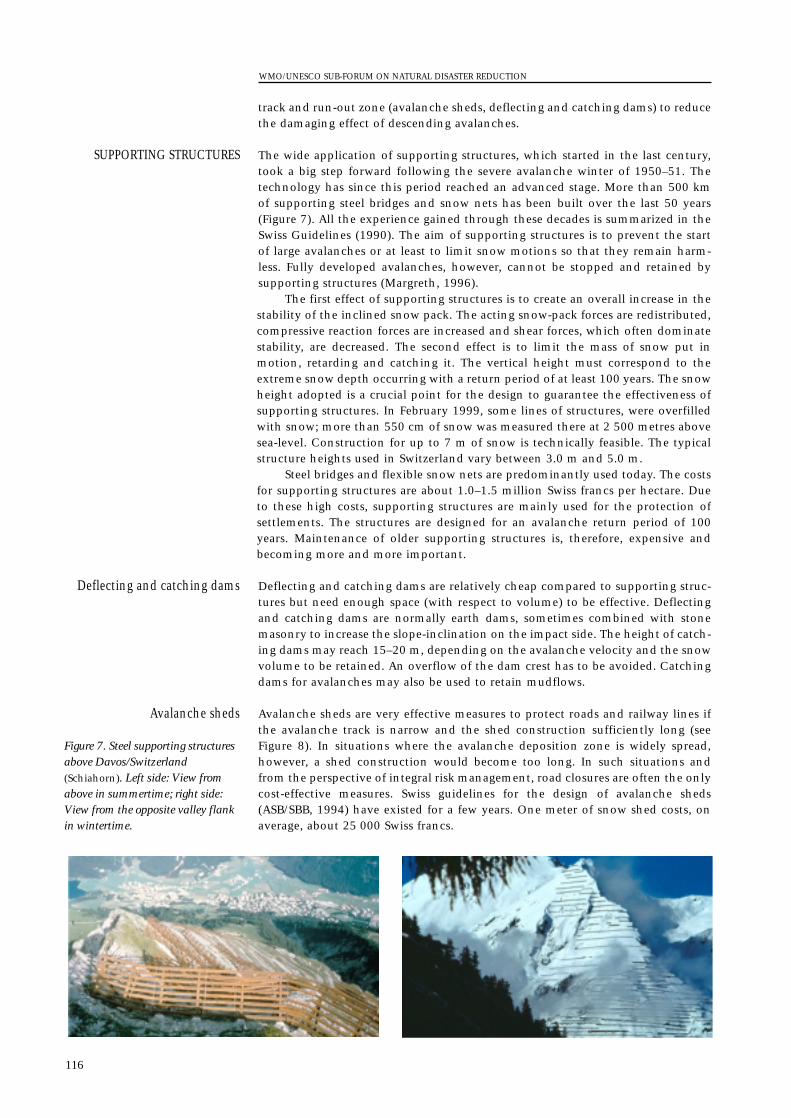
track and run-out zone (avalanche sheds, deflecting and catching dams) to reducethe damaging effect of descending avalanches.
The wide application of supporting structures, which started in the last century,took a big step forward following the severe avalanche winter of 1950–51. Thetechnology has since this period reached an advanced stage. More than 500 kmof supporting steel bridges and snow nets has been built over the last 50 years(Figure 7). All the experience gained through these decades is summarized in theSwiss Guidelines (1990). The aim of supporting structures is to prevent the startof large avalanches or at least to limit snow motions so that they remain harm-less. Fully developed avalanches, however, cannot be stopped and retained bysupporting structures (Margreth, 1996).
The first effect of supporting structures is to create an overall increase in thestability of the inclined snow pack. The acting snow-pack forces are redistributed,compressive reaction forces are increased and shear forces, which often dominatestability, are decreased. The second effect is to limit the mass of snow put inmotion, retarding and catching it. The vertical height must correspond to theextreme snow depth occurring with a return period of at least 100 years. The snowheight adopted is a crucial point for the design to guarantee the effectiveness ofsupporting structures. In February 1999, some lines of structures, were overfilledwith snow; more than 550 cm of snow was measured there at 2 500 metres abovesea-level. Construction for up to 7 m of snow is technically feasible. The typicalstructure heights used in Switzerland vary between 3.0 m and 5.0 m.
Steel bridges and flexible snow nets are predominantly used today. The costsfor supporting structures are about 1.0–1.5 million Swiss francs per hectare. Dueto these high costs, supporting structures are mainly used for the protection ofsettlements. The structures are designed for an avalanche return period of 100years. Maintenance of older supporting structures is, therefore, expensive andbecoming more and more important.
Deflecting and catching dams are relatively cheap compared to supporting struc-tures but need enough space (with respect to volume) to be effective. Deflectingand catching dams are normally earth dams, sometimes combined with stonemasonry to increase the slope-inclination on the impact side. The height of catch-ing dams may reach 15–20 m, depending on the avalanche velocity and the snowvolume to be retained. An overflow of the dam crest has to be avoided. Catchingdams for avalanches may also be used to retain mudflows.
Avalanche sheds are very effective measures to protect roads and railway lines ifthe avalanche track is narrow and the shed construction sufficiently long (seeFigure 8). In situations where the avalanche deposition zone is widely spread,however, a shed construction would become too long. In such situations andfrom the perspective of integral risk management, road closures are often the onlycost-effective measures. Swiss guidelines for the design of avalanche sheds(ASB/SBB, 1994) have existed for a few years. One meter of snow shed costs, onaverage, about 25 000 Swiss francs.
Avalanche sheds
Deflecting and catching dams
SUPPORTING STRUCTURES
WMO/UNESCO SUB-FORUM ON NATURAL DISASTER REDUCTION
116
Figure 7. Steel supporting structuresabove Davos/Switzerland(Schiahorn). Left side: View fromabove in summertime; right side:View from the opposite valley flankin wintertime.

Mountain forests is the most effective and the cheapest protection for villages,roads and railways. The trees retain the snow, stabilise the snow-pack and preventavalanches from starting. The mechanical resistance of the trees is not, however,sufficient to stop avalanches. In consequence, the protective effect of mountainforest, against avalanches, is only valid for starting zones below the timberline. InSwitzerland, about 1000 km2 of forest area serves, primarily, as avalanche androck-fall protection. If this effect were to be replaced by technical measures, ayearly investment of 2 billion Swiss francs would be necessary.
Risk management is an integral approach of human thinking and acting. It incor-porates the anticipation and assessment of risk, a systematic approach to limitingthe risk to an acceptable level and undertaking the necessary measures. Avalancherisk is the result of the temporal and the spatial overlapping of the two inde-pendent domains “potential avalanche danger” and “spatial area in use”. Thecombined probability, or the risk (R) as a product of the avalanche hazard (A), ofthe probability that human beings, dwellings, vehicles or other goods are endan-gered in a zone (Z), and of the value of or damage probability of these goods (D)has to be evaluated for each area:
R = A · Z · D
The avalanche danger is described by the avalanche probability and the extent ofthe avalanche. The spatial area in use corresponds to the probability of the presence ofany objects and the value of these objects (or the number of people present).
To avoid the disastrous effects of avalanches, different kinds of preventivemeasures are used to reduce the avalanche risk to an acceptable level. These meas-ures have to be seen as an integral set of possible protection measures. In mostcases, a combination of the different measures is used. The optimal combinationcan be found by maximising the cost-effectiveness and cost-benefit of all possibleavalanche control measures. Basic principles to be applied in an integral riskmanagement approach include the identification of the avalanche danger interms of probability of occurrence; the estimation of the risk potential based onthe vulnerability of the corresponding values exposed to risk; the assessment ofprotection goals; and the cost-estimation for control measures (e.g. Wilhelm, 1997and 1998, Heinimann et al., 1998).
Cost-effectiveness can be expressed in terms of amount of money spent persaved life (Wilhelm, 1997). For avalanche control measures, it varies to a largeextent, depending on the actual situation (1 to 20 million CHF). The whole riskmanagement process is iterative with several assessment and control loops. Forpreliminary design purposes, Wilhelm (1998) has established simplified cost-effec-tiveness evaluation charts which will be published as a BUWAL-Guideline for therisk assessment of roads and railways.
Snow as material for avalanches is a complex mixture of air, water and ice which,in our environment, is always close to its melting point and henceforth changesits physical properties continuously in time and space. This metamorphic processchanges the shape of the snow particles from fine dendrites to rounded grains orother shaped particles depending on temperatures, density, solar insulation,wind, etc. These physical properties need to be known in depth if the formationof the various types of avalanches is to be predictable for detailed avalanche fore-casting. Unfortunately, however, very little is known on the quantitativedescription of, for example, the shrinking, settling and re-crystallisation processeswithin the snow pack combined with the corresponding changes in mechanicalproperties such as shear resistance and cohesion. Consequently, the numericalsimulation of snow pack layering is still lacking of many details.
An overview of avalanche forecasting models and methods has recently beenpublished (Föhn,1998), and the research needs may be briefly summarized asfollows. In order to increase the accuracy of avalanche forecasting in time andspace, research has to concentrate on questions such as:
5.2AVALANCHE FORECASTING
5.RESEARCH NEEDS
5.1PHYSICS AND MECHANICS OF
SNOW
4.AVALANCHE RISKASSESSMENT AND
MANAGEMENT
3.5MOUNTAIN FORESTS
SNOW AVALANCHES
117
Figure 8. Example of a too shortavalanche shed Bm/GL Switzerland(end of February 1999).
Figure 9. Snow deposit of anavalanche near Linthtal/GLSwitzerland.
• How can the stability of various slopes with different aspect, altitude and slopeangle be quantitatively assessed by simulation models and introduced in opera-tional avalanche forecasting service? What are the most likely triggeringmechanisms for the release of avalanches in a given situation?
• How can the known local (in hundreds of metres) and temporal (in days) vari-ability of the snow cover on slopes and its stability be taken into account?
• How can snow drift be quantitatively described on a local to regional scale andhow can this description be used to improve avalanche forecasting ?
• How can the information available on a local, regional and national scale becombined and used as input to avalanche warning models (statistical methods,expert systems, neural networks) which support the decision process?
Avalanche hazard mapping is very closely linked to avalanche dynamics. Variousdynamic avalanche models have been developed in the last 20–40 years, based ondifferent flow-types (hydraulic, aerosol, mixed, granular). In addition, statisticalmodels, based on a few topographical factors and observed run-out distances,compete with the various flow-type models as far as run-out distances areconcerned (Lied,1998).
Significant improvements could be obtained in the avalanche dynamicscalculations which serve as a basis for hazard mapping by:
• Improved knowledge of initial conditions (fracture area and depth of sliding snowlayers, quality of sliding snow, e.g. various friction coefficients), all dependent onthe return period;
• Development of adequate physical models to describe the flow regime of dense-flow avalanches (Bartelt et al., 1997), the snow entrainment in powder-snowavalanches (Issler, 1998) and the impact mechanisms on structures;
• Validation of physical models and numerical modelling with field and laboratorydata.
Real progress will only be possible when field and laboratory data becomeavailable covering all major parameters influencing avalanche dynamics. Since1997, therefore, the SLF operates a test-site in the Vallée de la Sionne/VS,Switzerland (Figures 2 and 10, Ammann, 1998). At this site, it is possible to studythe overall dynamic behaviour of dense-flow and powder-snow avalanches and tomeasure avalanche impact forces along their path
Avalanche defence structures and dams still need improvements in:• The design of the load bearing capacity of the foundations (anchors);• The design of defence structures in permafrost sub-soil (Stoffel, 1995);• The implementation of maintenance strategies for existing structures;• The design of deflecting and retaining dams (McClung, 1995); and• The design of reinforced structures in the blue avalanche hazard zone.
Major improvements in risk reduction may be achieved by a consequent riskmanagement. Research efforts are needed in the following domains:• The devastating events in January/ February 1999 showed clearly the impor-
tance of indirect damage costs. Damage patterns have changed, the increasedmobility and poor public awareness are major reasons. To develop strategiesto address this changed damage pattern will be an important task.
• What is the acceptable risk level. Has aversion to be taken into account;• Development of tools to assess the cost- effectiveness of different defence
strategies for settlements;• roads, railways;• Implementation of a strategy for the continuous education of local and regional
avalanche safety managers ( e.g. members of avalanche commissions).
Ammann, W., 1998: A new Swiss test-site for avalanche experiments in the Vallée dela Sionne/Valais. Proceedings Int. Snow Science Workshop, ISSW 1998,Sunriver USA.
ASB/SBB, 1994: Richtlinie Einwirkungen auf Lawinenschutzgalerien. Eidg.Drucksachen- und Materialzentrale, Bern.
REFERENCES
5.4TECHNICAL MEASURES AND
RISK MANAGEMENT
5.3AVALANCHE HAZARD
MAPPING
WMO/UNESCO SUB-FORUM ON NATURAL DISASTER REDUCTION
118
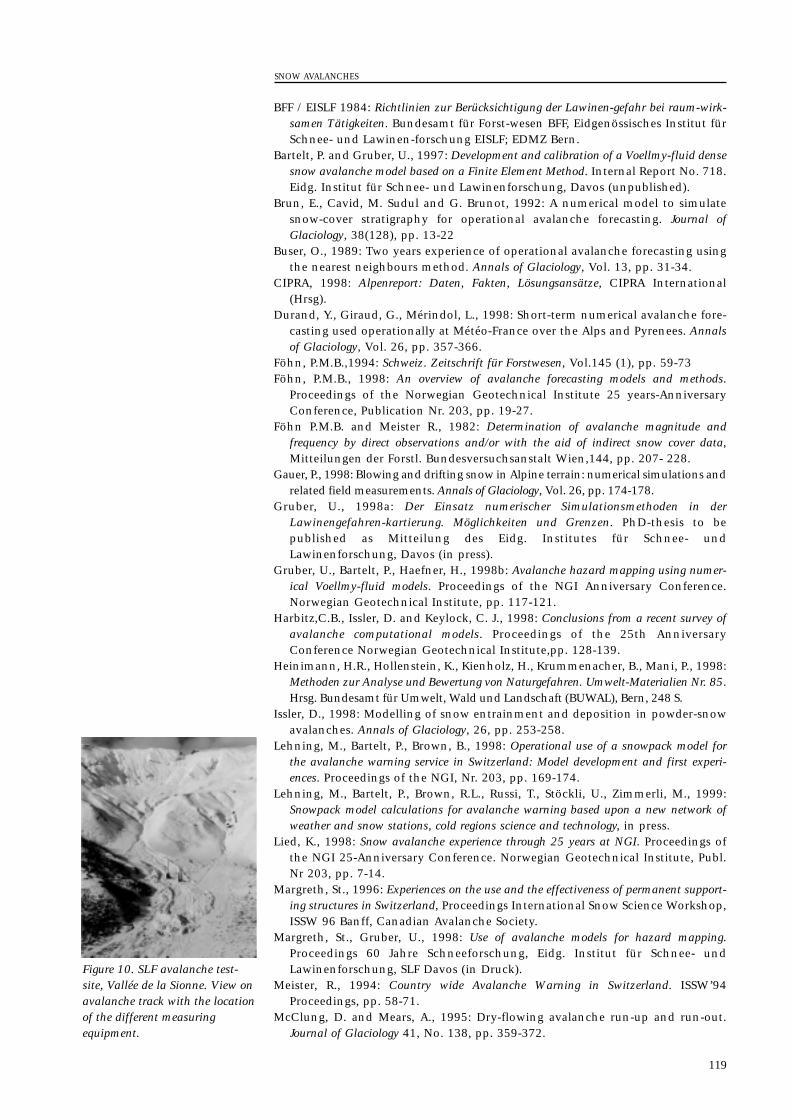
BFF / EISLF 1984: Richtlinien zur Berücksichtigung der Lawinen-gefahr bei raum-wirk-samen Tätigkeiten. Bundesamt für Forst-wesen BFF, Eidgenössisches Institut fürSchnee- und Lawinen-forschung EISLF; EDMZ Bern.
Bartelt, P. and Gruber, U., 1997: Development and calibration of a Voellmy-fluid densesnow avalanche model based on a Finite Element Method. Internal Report No. 718.Eidg. Institut für Schnee- und Lawinenforschung, Davos (unpublished).
Brun, E., Cavid, M. Sudul and G. Brunot, 1992: A numerical model to simulatesnow-cover stratigraphy for operational avalanche forecasting. Journal ofGlaciology, 38(128), pp. 13-22
Buser, O., 1989: Two years experience of operational avalanche forecasting usingthe nearest neighbours method. Annals of Glaciology, Vol. 13, pp. 31-34.
CIPRA, 1998: Alpenreport: Daten, Fakten, Lösungsansätze, CIPRA International(Hrsg).
Durand, Y., Giraud, G., Mérindol, L., 1998: Short-term numerical avalanche fore-casting used operationally at Météo-France over the Alps and Pyrenees. Annalsof Glaciology, Vol. 26, pp. 357-366.
Föhn, P.M.B.,1994: Schweiz. Zeitschrift für Forstwesen, Vol.145 (1), pp. 59-73Föhn, P.M.B., 1998: An overview of avalanche forecasting models and methods.
Proceedings of the Norwegian Geotechnical Institute 25 years-AnniversaryConference, Publication Nr. 203, pp. 19-27.
Föhn P.M.B. and Meister R., 1982: Determination of avalanche magnitude andfrequency by direct observations and/or with the aid of indirect snow cover data,Mitteilungen der Forstl. Bundesversuchsanstalt Wien,144, pp. 207- 228.
Gauer, P., 1998: Blowing and drifting snow in Alpine terrain: numerical simulations andrelated field measurements. Annals of Glaciology, Vol. 26, pp. 174-178.
Gruber, U., 1998a: Der Einsatz numerischer Simulationsmethoden in derLawinengefahren-kartierung. Möglichkeiten und Grenzen. PhD-thesis to bepublished as Mitteilung des Eidg. Institutes für Schnee- undLawinenforschung, Davos (in press).
Gruber, U., Bartelt, P., Haefner, H., 1998b: Avalanche hazard mapping using numer-ical Voellmy-fluid models. Proceedings of the NGI Anniversary Conference.Norwegian Geotechnical Institute, pp. 117-121.
Harbitz,C.B., Issler, D. and Keylock, C. J., 1998: Conclusions from a recent survey ofavalanche computational models. Proceedings of the 25th AnniversaryConference Norwegian Geotechnical Institute,pp. 128-139.
Heinimann, H.R., Hollenstein, K., Kienholz, H., Krummenacher, B., Mani, P., 1998:Methoden zur Analyse und Bewertung von Naturgefahren. Umwelt-Materialien Nr. 85.Hrsg. Bundesamt für Umwelt, Wald und Landschaft (BUWAL), Bern, 248 S.
Issler, D., 1998: Modelling of snow entrainment and deposition in powder-snowavalanches. Annals of Glaciology, 26, pp. 253-258.
Lehning, M., Bartelt, P., Brown, B., 1998: Operational use of a snowpack model forthe avalanche warning service in Switzerland: Model development and first experi-ences. Proceedings of the NGI, Nr. 203, pp. 169-174.
Lehning, M., Bartelt, P., Brown, R.L., Russi, T., Stöckli, U., Zimmerli, M., 1999:Snowpack model calculations for avalanche warning based upon a new network ofweather and snow stations, cold regions science and technology, in press.
Lied, K., 1998: Snow avalanche experience through 25 years at NGI. Proceedings ofthe NGI 25-Anniversary Conference. Norwegian Geotechnical Institute, Publ.Nr 203, pp. 7-14.
Margreth, St., 1996: Experiences on the use and the effectiveness of permanent support-ing structures in Switzerland, Proceedings International Snow Science Workshop,ISSW 96 Banff, Canadian Avalanche Society.
Margreth, St., Gruber, U., 1998: Use of avalanche models for hazard mapping.Proceedings 60 Jahre Schneeforschung, Eidg. Institut für Schnee- undLawinenforschung, SLF Davos (in Druck).
Meister, R., 1994: Country wide Avalanche Warning in Switzerland. ISSW’94Proceedings, pp. 58-71.
McClung, D. and Mears, A., 1995: Dry-flowing avalanche run-up and run-out.Journal of Glaciology 41, No. 138, pp. 359-372.
SNOW AVALANCHES
119
Figure 10. SLF avalanche test-site, Vallée de la Sionne. View onavalanche track with the locationof the different measuringequipment.
Russi, T., Ammann, W., Brabec, B., Lehning, M., Meister, R., 1998: Avalanchewarning Switzerland CH 2000. Proceedings Int. Snow Science Workshop, ISSW1998, Sunriver, USA.
Salm, B., 1987: Schnee, Lawinen und Lawinenschutz. Vorlesungsmanuskript ETHZürich. VAW ETHZ, Zürich.
Salm, B., Burkard, A. and Gubler, H.U., 1990: Berechnung von Fliesslawinen. EineAnleitung für den Praktiker mit Beispielen. Mitteilung Nr. 47. Eidg. Institut fürSchnee- und Lawinenforschung, Davos.
Salm, B., 1994: Lawinen- Gefahr und Risiko langfristig betrachtet. Schweiz. Zeitschriftfür Forstwesen, 1994, 145(1), pp. 75- 86
Stoffel, L. 1995: Bautechnische Grundlagen für das Erstellen von Lawinenverbauungenim alpinen Permafrost. Mitteilungen des Eidg. Institut für Schnee- undLawinenforschung, SLF, Davos, Nr. 52.
Stoffel, L., 1996: Künstliche Lawinenauslösung. Hinweise für den Praktiker.Mitteilungen des Eidg. Institutes für Schnee- und Lawinenforschung, SLFDavos, Nr. 53.
Swiss Guidelines, 1990: Richtlinien für den Lawinenverbau im Anrissgebiet. BUWAL,WSL, Eidg. Institut für Schnee und Lawinenforschung, SLF, Davos.
Tschirky, F., 1998: Lawinenunfälle, Vorabdruck des Winterberichtes SLF Nr. 61,SLF Davos
Wilhelm, Ch., 1997: Wirtschaftlichkeit im Lawinenschutz. Methodik und Erhebungenzur Beurteilung von Schutzmassnahmen mittels qualitativer Risikoanalyse undökonomischer Bewertung. Mitteilungen des Eidg. Institutes für Schnee- undLawinenforschung, Davos, Nr. 54.
Wilhelm, Ch., 1998: Beurteilung der Kosten-Wirksamkeit vonLawinenschutzmassnahmen an Verkehrs-achsen. Praxishilfe, Vollzug Umwelt,BUWAL Bern/SLF Davos.
WMO/UNESCO SUB-FORUM ON NATURAL DISASTER REDUCTION
120
MITIGATING THE EFFECTS OF TSUNAMIS: WHERE DO WE GO FROM HERE?
By Charles S. McCreery; Pacific Tsunami Warning Center
During the decade of the IDNDR, significant progress has been made towardsmore effectively mitigating the tsunami hazard, much of it though the activitiesof the IOC International Coordination Group for the Tsunami Warning System inthe Pacific (ITSU) and its Member States. Worldwide historical tsunami data havebeen compiled in computer databases with graphical interfaces for more wide-spread access and to better assess the tsunami hazard in each coastal region.Numerical modelling of tsunamis has matured, and this technology has beentransferred to many countries at risk for producing realistic tsunami run-up mapsto guide coastal development and emergency planning. Warning systems havebetter and faster access to high-quality seismic and water level data, better tech-niques for evaluating tsunamis, and more effective methods for disseminatingwarnings. Educational materials for both children and adults have been producedin many languages. But with ever-increasing coastal development and populationgrowth, significant challenges remain. Eleven destructive tsunamis have occurredsince 1990, causing over 4 000 casualties and significant property damage. Whenthese events are examined, it is possible to identify ways that mitigation effortshave helped, but more often how those efforts need to be expanded andimproved in the future.
A tsunami is a series of ocean waves generated by any sudden and large-scaledisturbance of the sea or other large body of water. Earthquakes generate mosttsunamis, but they can also be generated by landslides and submarine slumps, byvolcanic eruptions next to or beneath the sea, and even by meteorite impacts.Recently it has been recognized that some tsunamis that accompany earthquakesare enhanced or may have been produced entirely by landslides or slumps.Tsunamis have occurred in every ocean, but are most common in the Pacificowing to its high level of seismic and volcanic activity. Most often, large tsunamisoccur at subduction zones — regions where two of the earth’s plates converge andone is diving beneath the other (Figure 1). When great earthquakes take placealong these boundaries, the sea-floor over a very large area can be vertically andpermanently displaced by as much as several meters. This deformation in turnproduces an elevation or depression of the sea surface. In the process of the seasurface coming back to equilibrium, tsunami waves form and propagate away inall directions from the displacement.
Tsunami waves are distinguished from ordinary ocean wind waves by theirvery long period, high propagation speed, and long wavelength. Tsunami waveperiods — the time between one wave crest and the next — range from about 5to 60 minutes, depending upon the size of the disturbance that generated them.The speed a tsunami travels depends upon the depth of the ocean by the simplerelationship: speed = square root (acceleration of gravity x water depth). In mid-ocean, tsunamis can travel at speeds of 800 km/hr or more — the speed of acommercial jet aircraft. As a consequence, it takes less than 24 hours for a tsunamito cross the entire Pacific basin (Figure 2). As a tsunami waves near shore,however, they slow down to the speed of the wind waves — a few tens of kilo-metres per hour. The wavelength of a tsunami, which is simply its speed times itsperiod, also depends upon the ocean depth. In mid-ocean, tsunami wavelengthsmay be several hundred kilometres, but near shore the same waves can shorten toonly a few kilometres in length as they slow down.
The height of a tsunami depends upon several factors. Near the source, theheight may be several meters and it mirrors the deformation that has occurred onthe ocean floor. As it moves away from the source, tsunami wave heights arereduced by the spreading of the wavefronts into ever-larger circles, thus reducing
TSUNAMI PHENOMENON
ABSTRACT
121
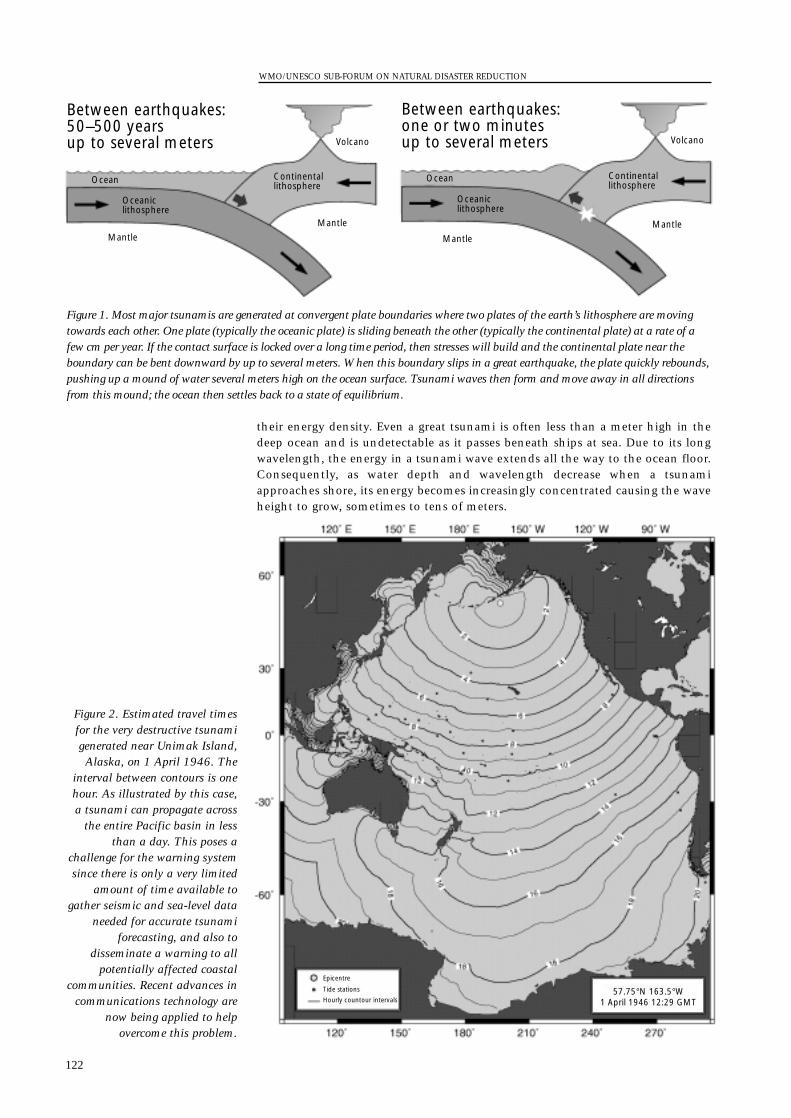
their energy density. Even a great tsunami is often less than a meter high in thedeep ocean and is undetectable as it passes beneath ships at sea. Due to its longwavelength, the energy in a tsunami wave extends all the way to the ocean floor.Consequently, as water depth and wavelength decrease when a tsunamiapproaches shore, its energy becomes increasingly concentrated causing the waveheight to grow, sometimes to tens of meters.
WMO/UNESCO SUB-FORUM ON NATURAL DISASTER REDUCTION
122
Between earthquakes:50–500 yearsup to several meters
Ocean
Oceaniclithosphere
Mantle
Mantle
Volcano
Continentallithosphere
Between earthquakes:one or two minutesup to several meters
Ocean
Oceaniclithosphere
Mantle
Mantle
Volcano
Continentallithosphere
Figure 1. Most major tsunamis are generated at convergent plate boundaries where two plates of the earth’s lithosphere are movingtowards each other. One plate (typically the oceanic plate) is sliding beneath the other (typically the continental plate) at a rate of afew cm per year. If the contact surface is locked over a long time period, then stresses will build and the continental plate near theboundary can be bent downward by up to several meters. When this boundary slips in a great earthquake, the plate quickly rebounds,pushing up a mound of water several meters high on the ocean surface. Tsunami waves then form and move away in all directionsfrom this mound; the ocean then settles back to a state of equilibrium.
Epicentre
Tide stations
Hourly countour intervals57.75°N 163.5°W
1 April 1946 12:29 GMT
Figure 2. Estimated travel timesfor the very destructive tsunamigenerated near Unimak Island,Alaska, on 1 April 1946. The
interval between contours is onehour. As illustrated by this case,a tsunami can propagate across
the entire Pacific basin in lessthan a day. This poses a
challenge for the warning systemsince there is only a very limited
amount of time available togather seismic and sea-level data
needed for accurate tsunamiforecasting, and also to
disseminate a warning to allpotentially affected coastal
communities. Recent advances incommunications technology are
now being applied to helpovercome this problem.
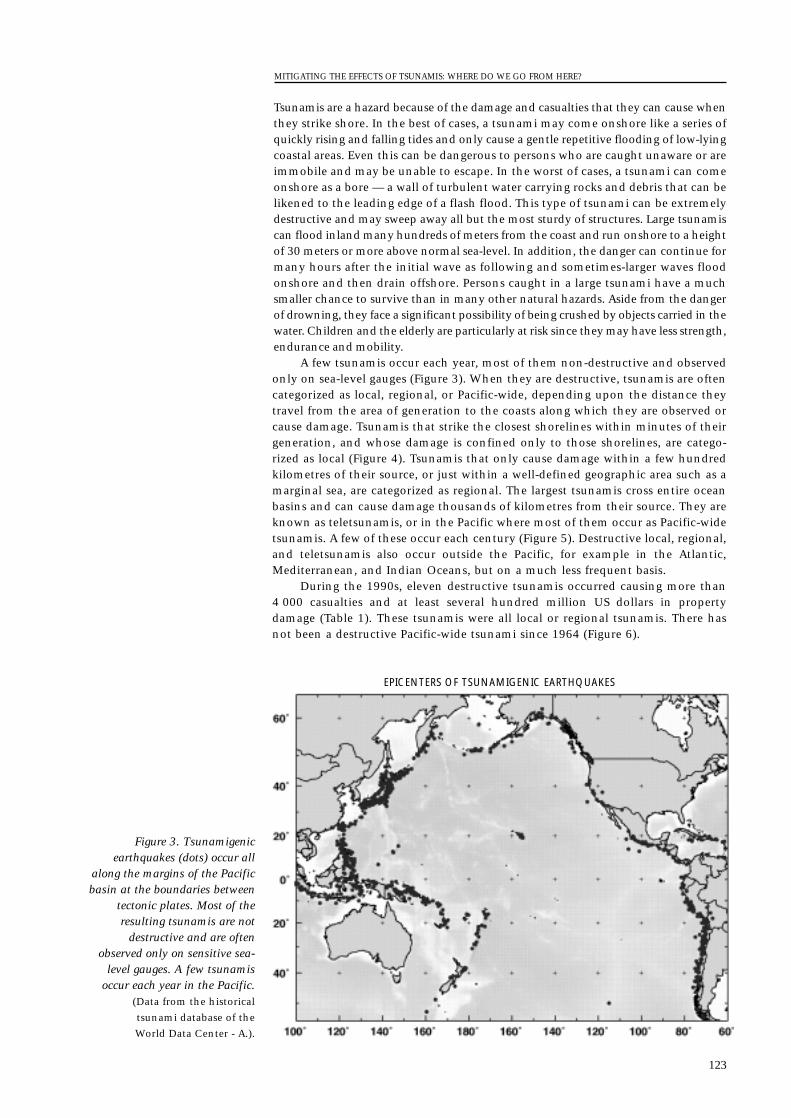
Tsunamis are a hazard because of the damage and casualties that they can cause whenthey strike shore. In the best of cases, a tsunami may come onshore like a series ofquickly rising and falling tides and only cause a gentle repetitive flooding of low-lyingcoastal areas. Even this can be dangerous to persons who are caught unaware or areimmobile and may be unable to escape. In the worst of cases, a tsunami can comeonshore as a bore — a wall of turbulent water carrying rocks and debris that can belikened to the leading edge of a flash flood. This type of tsunami can be extremelydestructive and may sweep away all but the most sturdy of structures. Large tsunamiscan flood inland many hundreds of meters from the coast and run onshore to a heightof 30 meters or more above normal sea-level. In addition, the danger can continue formany hours after the initial wave as following and sometimes-larger waves floodonshore and then drain offshore. Persons caught in a large tsunami have a muchsmaller chance to survive than in many other natural hazards. Aside from the dangerof drowning, they face a significant possibility of being crushed by objects carried in thewater. Children and the elderly are particularly at risk since they may have less strength,endurance and mobility.
A few tsunamis occur each year, most of them non-destructive and observedonly on sea-level gauges (Figure 3). When they are destructive, tsunamis are oftencategorized as local, regional, or Pacific-wide, depending upon the distance theytravel from the area of generation to the coasts along which they are observed orcause damage. Tsunamis that strike the closest shorelines within minutes of theirgeneration, and whose damage is confined only to those shorelines, are catego-rized as local (Figure 4). Tsunamis that only cause damage within a few hundredkilometres of their source, or just within a well-defined geographic area such as amarginal sea, are categorized as regional. The largest tsunamis cross entire oceanbasins and can cause damage thousands of kilometres from their source. They areknown as teletsunamis, or in the Pacific where most of them occur as Pacific-widetsunamis. A few of these occur each century (Figure 5). Destructive local, regional,and teletsunamis also occur outside the Pacific, for example in the Atlantic,Mediterranean, and Indian Oceans, but on a much less frequent basis.
During the 1990s, eleven destructive tsunamis occurred causing more than4 000 casualties and at least several hundred million US dollars in propertydamage (Table 1). These tsunamis were all local or regional tsunamis. There hasnot been a destructive Pacific-wide tsunami since 1964 (Figure 6).
MITIGATING THE EFFECTS OF TSUNAMIS: WHERE DO WE GO FROM HERE?
123
EPICENTERS OF TSUNAMIGENIC EARTHQUAKES
Figure 3. Tsunamigenicearthquakes (dots) occur all
along the margins of the Pacificbasin at the boundaries between
tectonic plates. Most of theresulting tsunamis are not
destructive and are oftenobserved only on sensitive sea-
level gauges. A few tsunamisoccur each year in the Pacific.
(Data from the historical
tsunami database of the
World Data Center - A.).
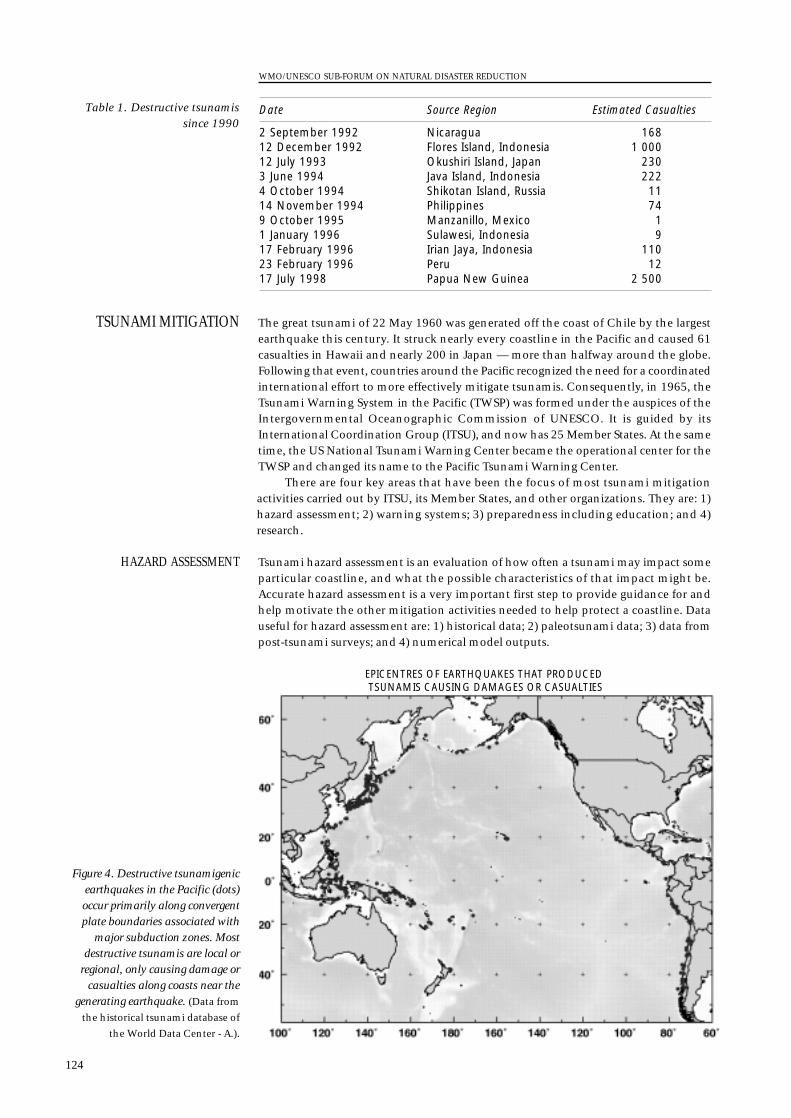
The great tsunami of 22 May 1960 was generated off the coast of Chile by the largestearthquake this century. It struck nearly every coastline in the Pacific and caused 61casualties in Hawaii and nearly 200 in Japan — more than halfway around the globe.Following that event, countries around the Pacific recognized the need for a coordinatedinternational effort to more effectively mitigate tsunamis. Consequently, in 1965, theTsunami Warning System in the Pacific (TWSP) was formed under the auspices of theIntergovernmental Oceanographic Commission of UNESCO. It is guided by itsInternational Coordination Group (ITSU), and now has 25 Member States. At the sametime, the US National Tsunami Warning Center became the operational center for theTWSP and changed its name to the Pacific Tsunami Warning Center.
There are four key areas that have been the focus of most tsunami mitigationactivities carried out by ITSU, its Member States, and other organizations. They are: 1)hazard assessment; 2) warning systems; 3) preparedness including education; and 4)research.
Tsunami hazard assessment is an evaluation of how often a tsunami may impact someparticular coastline, and what the possible characteristics of that impact might be.Accurate hazard assessment is a very important first step to provide guidance for andhelp motivate the other mitigation activities needed to help protect a coastline. Datauseful for hazard assessment are: 1) historical data; 2) paleotsunami data; 3) data frompost-tsunami surveys; and 4) numerical model outputs.
HAZARD ASSESSMENT
TSUNAMI MITIGATION
WMO/UNESCO SUB-FORUM ON NATURAL DISASTER REDUCTION
124
Date Source Region Estimated Casualties
2 September 1992 Nicaragua 16812 December 1992 Flores Island, Indonesia 1 00012 July 1993 Okushiri Island, Japan 2303 June 1994 Java Island, Indonesia 2224 October 1994 Shikotan Island, Russia 1114 November 1994 Philippines 749 October 1995 Manzanillo, Mexico 11 January 1996 Sulawesi, Indonesia 917 February 1996 Irian Jaya, Indonesia 11023 February 1996 Peru 1217 July 1998 Papua New Guinea 2 500
Table 1. Destructive tsunamissince 1990
EPICENTRES OF EARTHQUAKES THAT PRODUCED TSUNAMIS CAUSING DAMAGES OR CASUALTIES
Figure 4. Destructive tsunamigenicearthquakes in the Pacific (dots)occur primarily along convergentplate boundaries associated with
major subduction zones. Mostdestructive tsunamis are local or
regional, only causing damage orcasualties along coasts near the
generating earthquake. (Data from
the historical tsunami database of
the World Data Center - A.).
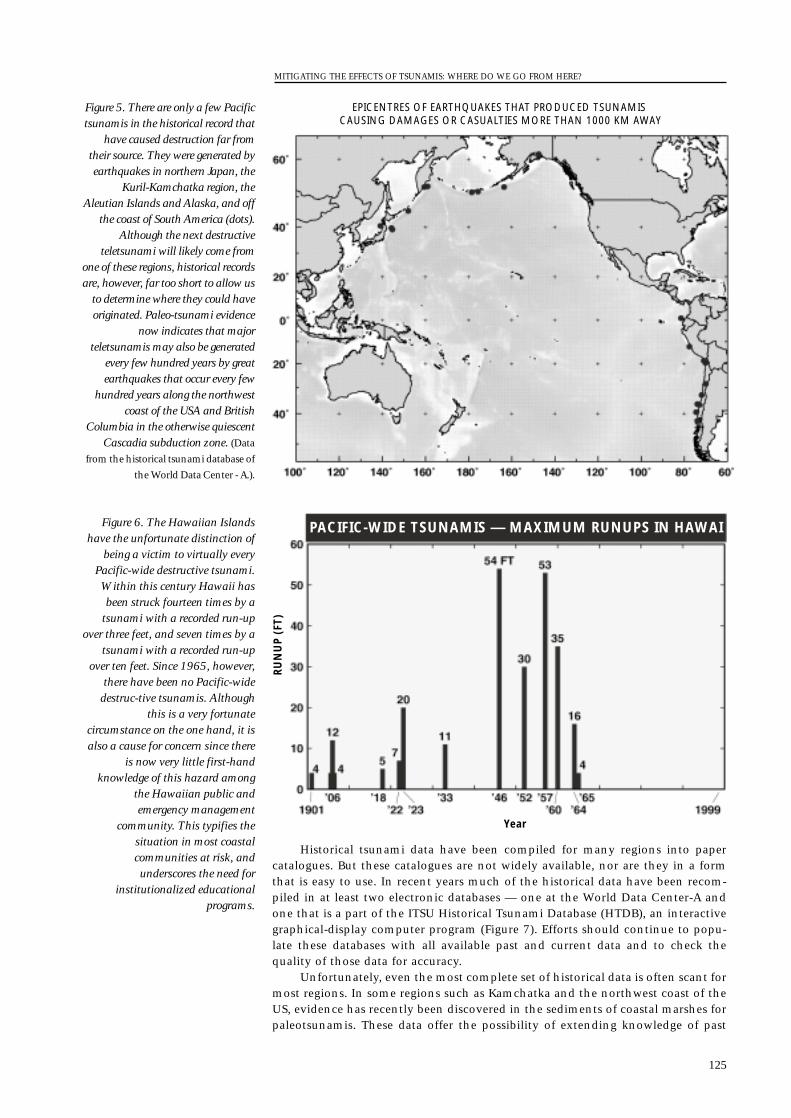
Historical tsunami data have been compiled for many regions into papercatalogues. But these catalogues are not widely available, nor are they in a formthat is easy to use. In recent years much of the historical data have been recom-piled in at least two electronic databases — one at the World Data Center-A andone that is a part of the ITSU Historical Tsunami Database (HTDB), an interactivegraphical-display computer program (Figure 7). Efforts should continue to popu-late these databases with all available past and current data and to check thequality of those data for accuracy.
Unfortunately, even the most complete set of historical data is often scant formost regions. In some regions such as Kamchatka and the northwest coast of theUS, evidence has recently been discovered in the sediments of coastal marshes forpaleotsunamis. These data offer the possibility of extending knowledge of past
MITIGATING THE EFFECTS OF TSUNAMIS: WHERE DO WE GO FROM HERE?
125
EPICENTRES OF EARTHQUAKES THAT PRODUCED TSUNAMIS CAUSING DAMAGES OR CASUALTIES MORE THAN 1000 KM AWAY
Figure 5. There are only a few Pacifictsunamis in the historical record that
have caused destruction far fromtheir source. They were generated byearthquakes in northern Japan, the
Kuril-Kamchatka region, theAleutian Islands and Alaska, and off
the coast of South America (dots).Although the next destructive
teletsunami will likely come fromone of these regions, historical recordsare, however, far too short to allow us
to determine where they could haveoriginated. Paleo-tsunami evidence
now indicates that majorteletsunamis may also be generated
every few hundred years by greatearthquakes that occur every few
hundred years along the northwestcoast of the USA and British
Columbia in the otherwise quiescentCascadia subduction zone. (Data
from the historical tsunami database of
the World Data Center - A.).
PACIFIC-WIDE TSUNAMIS — MAXIMUM RUNUPS IN HAWAI
Year
RUN
UP
(FT)
Figure 6. The Hawaiian Islandshave the unfortunate distinction of
being a victim to virtually everyPacific-wide destructive tsunami.Within this century Hawaii hasbeen struck fourteen times by a
tsunami with a recorded run-upover three feet, and seven times by a
tsunami with a recorded run-upover ten feet. Since 1965, however,
there have been no Pacific-widedestruc-tive tsunamis. Although
this is a very fortunatecircumstance on the one hand, it isalso a cause for concern since there
is now very little first-handknowledge of this hazard among
the Hawaiian public andemergency management
community. This typifies thesituation in most coastalcommunities at risk, andunderscores the need for
institutionalized educationalprograms.
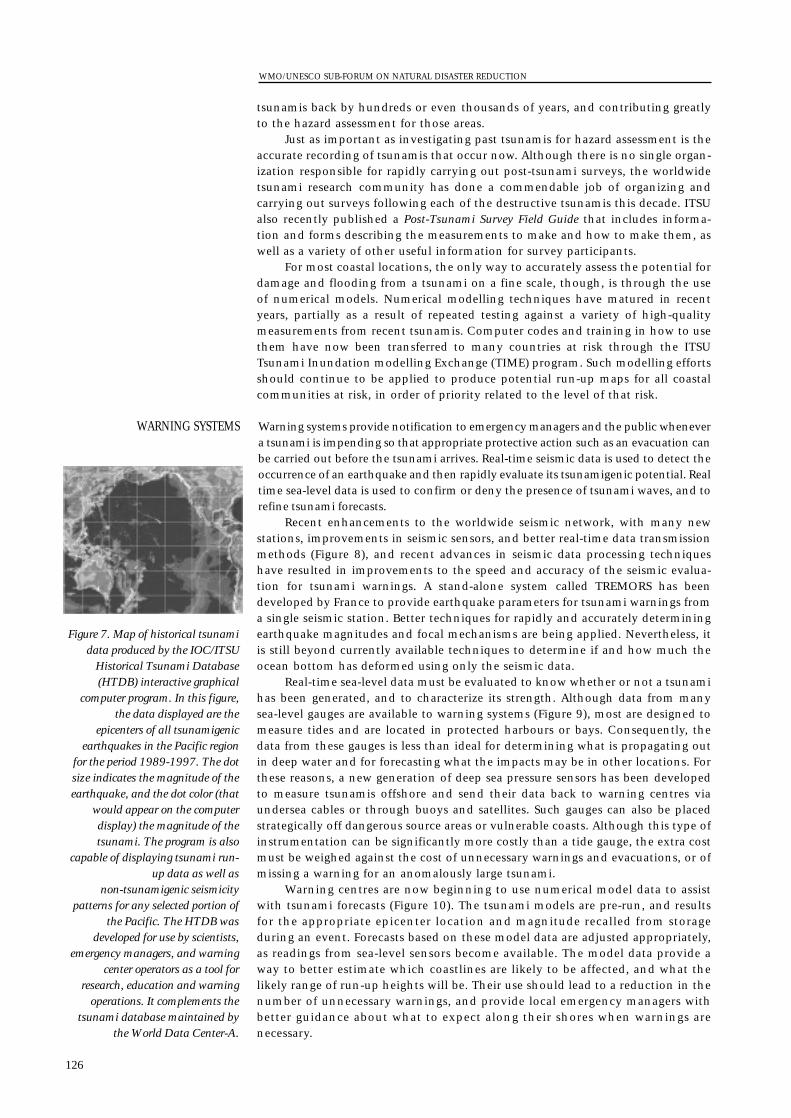
tsunamis back by hundreds or even thousands of years, and contributing greatlyto the hazard assessment for those areas.
Just as important as investigating past tsunamis for hazard assessment is theaccurate recording of tsunamis that occur now. Although there is no single organ-ization responsible for rapidly carrying out post-tsunami surveys, the worldwidetsunami research community has done a commendable job of organizing andcarrying out surveys following each of the destructive tsunamis this decade. ITSUalso recently published a Post-Tsunami Survey Field Guide that includes informa-tion and forms describing the measurements to make and how to make them, aswell as a variety of other useful information for survey participants.
For most coastal locations, the only way to accurately assess the potential fordamage and flooding from a tsunami on a fine scale, though, is through the useof numerical models. Numerical modelling techniques have matured in recentyears, partially as a result of repeated testing against a variety of high-qualitymeasurements from recent tsunamis. Computer codes and training in how to usethem have now been transferred to many countries at risk through the ITSUTsunami Inundation modelling Exchange (TIME) program. Such modelling effortsshould continue to be applied to produce potential run-up maps for all coastalcommunities at risk, in order of priority related to the level of that risk.
Warning systems provide notification to emergency managers and the public whenevera tsunami is impending so that appropriate protective action such as an evacuation canbe carried out before the tsunami arrives. Real-time seismic data is used to detect theoccurrence of an earthquake and then rapidly evaluate its tsunamigenic potential. Realtime sea-level data is used to confirm or deny the presence of tsunami waves, and torefine tsunami forecasts.
Recent enhancements to the worldwide seismic network, with many newstations, improvements in seismic sensors, and better real-time data transmissionmethods (Figure 8), and recent advances in seismic data processing techniqueshave resulted in improvements to the speed and accuracy of the seismic evalua-tion for tsunami warnings. A stand-alone system called TREMORS has beendeveloped by France to provide earthquake parameters for tsunami warnings froma single seismic station. Better techniques for rapidly and accurately determiningearthquake magnitudes and focal mechanisms are being applied. Nevertheless, itis still beyond currently available techniques to determine if and how much theocean bottom has deformed using only the seismic data.
Real-time sea-level data must be evaluated to know whether or not a tsunamihas been generated, and to characterize its strength. Although data from manysea-level gauges are available to warning systems (Figure 9), most are designed tomeasure tides and are located in protected harbours or bays. Consequently, thedata from these gauges is less than ideal for determining what is propagating outin deep water and for forecasting what the impacts may be in other locations. Forthese reasons, a new generation of deep sea pressure sensors has been developedto measure tsunamis offshore and send their data back to warning centres viaundersea cables or through buoys and satellites. Such gauges can also be placedstrategically off dangerous source areas or vulnerable coasts. Although this type ofinstrumentation can be significantly more costly than a tide gauge, the extra costmust be weighed against the cost of unnecessary warnings and evacuations, or ofmissing a warning for an anomalously large tsunami.
Warning centres are now beginning to use numerical model data to assistwith tsunami forecasts (Figure 10). The tsunami models are pre-run, and resultsfor the appropriate epicenter location and magnitude recalled from storageduring an event. Forecasts based on these model data are adjusted appropriately,as readings from sea-level sensors become available. The model data provide away to better estimate which coastlines are likely to be affected, and what thelikely range of run-up heights will be. Their use should lead to a reduction in thenumber of unnecessary warnings, and provide local emergency managers withbetter guidance about what to expect along their shores when warnings arenecessary.
WARNING SYSTEMS
WMO/UNESCO SUB-FORUM ON NATURAL DISASTER REDUCTION
126
Figure 7. Map of historical tsunamidata produced by the IOC/ITSU
Historical Tsunami Database(HTDB) interactive graphical
computer program. In this figure,the data displayed are the
epicenters of all tsunamigenicearthquakes in the Pacific region
for the period 1989-1997. The dotsize indicates the magnitude of theearthquake, and the dot color (that
would appear on the computerdisplay) the magnitude of thetsunami. The program is also
capable of displaying tsunami run-up data as well as
non-tsunamigenic seismicitypatterns for any selected portion of
the Pacific. The HTDB wasdeveloped for use by scientists,
emergency managers, and warningcenter operators as a tool for
research, education and warningoperations. It complements the
tsunami database maintained bythe World Data Center-A.
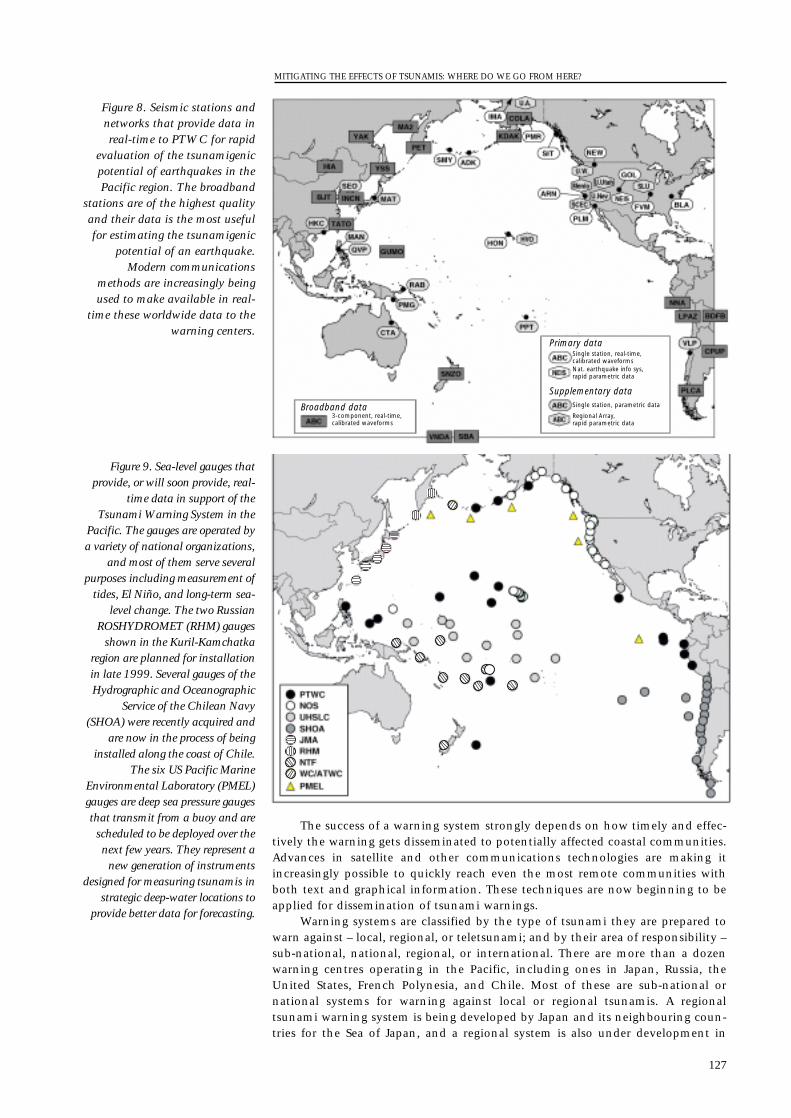
The success of a warning system strongly depends on how timely and effec-tively the warning gets disseminated to potentially affected coastal communities.Advances in satellite and other communications technologies are making itincreasingly possible to quickly reach even the most remote communities withboth text and graphical information. These techniques are now beginning to beapplied for dissemination of tsunami warnings.
Warning systems are classified by the type of tsunami they are prepared towarn against – local, regional, or teletsunami; and by their area of responsibility –sub-national, national, regional, or international. There are more than a dozenwarning centres operating in the Pacific, including ones in Japan, Russia, theUnited States, French Polynesia, and Chile. Most of these are sub-national ornational systems for warning against local or regional tsunamis. A regionaltsunami warning system is being developed by Japan and its neighbouring coun-tries for the Sea of Japan, and a regional system is also under development in
MITIGATING THE EFFECTS OF TSUNAMIS: WHERE DO WE GO FROM HERE?
127
Broadband data
Primary data
Supplementary data
3-component, real-time, calibrated waveforms
Single station, real-time, calibrated waveforms
Single station, parametric data
Nat. earthquake info sys, rapid parametric data
Regional Array,rapid parametric data
Figure 8. Seismic stations andnetworks that provide data inreal-time to PTWC for rapid
evaluation of the tsunamigenicpotential of earthquakes in thePacific region. The broadband
stations are of the highest qualityand their data is the most usefulfor estimating the tsunamigenic
potential of an earthquake.Modern communications
methods are increasingly beingused to make available in real-
time these worldwide data to thewarning centers.
Figure 9. Sea-level gauges thatprovide, or will soon provide, real-
time data in support of theTsunami Warning System in the
Pacific. The gauges are operated bya variety of national organizations,
and most of them serve severalpurposes including measurement of
tides, El Niño, and long-term sea-level change. The two Russian
ROSHYDROMET (RHM) gaugesshown in the Kuril-Kamchatka
region are planned for installationin late 1999. Several gauges of theHydrographic and Oceanographic
Service of the Chilean Navy(SHOA) were recently acquired and
are now in the process of beinginstalled along the coast of Chile.
The six US Pacific MarineEnvironmental Laboratory (PMEL)gauges are deep sea pressure gaugesthat transmit from a buoy and arescheduled to be deployed over thenext few years. They represent anew generation of instruments
designed for measuring tsunamis instrategic deep-water locations to
provide better data for forecasting.
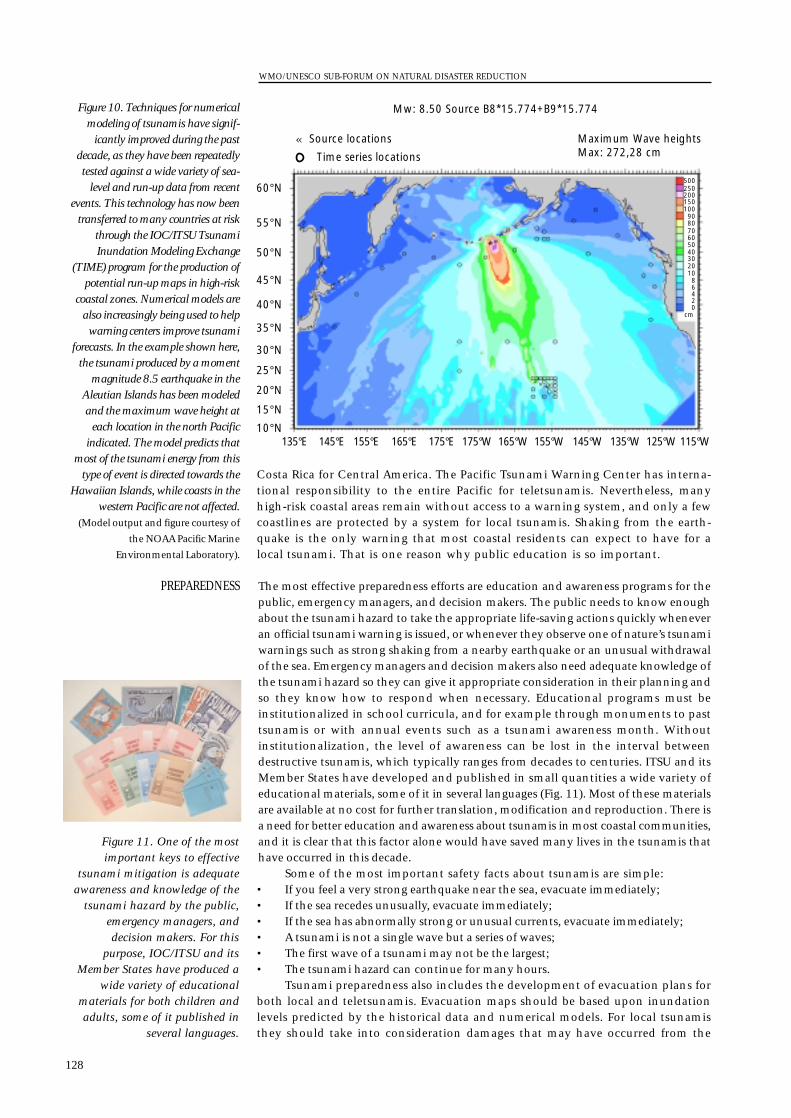
Costa Rica for Central America. The Pacific Tsunami Warning Center has interna-tional responsibility to the entire Pacific for teletsunamis. Nevertheless, manyhigh-risk coastal areas remain without access to a warning system, and only a fewcoastlines are protected by a system for local tsunamis. Shaking from the earth-quake is the only warning that most coastal residents can expect to have for alocal tsunami. That is one reason why public education is so important.
The most effective preparedness efforts are education and awareness programs for thepublic, emergency managers, and decision makers. The public needs to know enoughabout the tsunami hazard to take the appropriate life-saving actions quickly wheneveran official tsunami warning is issued, or whenever they observe one of nature’s tsunamiwarnings such as strong shaking from a nearby earthquake or an unusual withdrawalof the sea. Emergency managers and decision makers also need adequate knowledge ofthe tsunami hazard so they can give it appropriate consideration in their planning andso they know how to respond when necessary. Educational programs must beinstitutionalized in school curricula, and for example through monuments to pasttsunamis or with annual events such as a tsunami awareness month. Withoutinstitutionalization, the level of awareness can be lost in the interval betweendestructive tsunamis, which typically ranges from decades to centuries. ITSU and itsMember States have developed and published in small quantities a wide variety ofeducational materials, some of it in several languages (Fig. 11). Most of these materialsare available at no cost for further translation, modification and reproduction. There isa need for better education and awareness about tsunamis in most coastal communities,and it is clear that this factor alone would have saved many lives in the tsunamis thathave occurred in this decade.
Some of the most important safety facts about tsunamis are simple:• If you feel a very strong earthquake near the sea, evacuate immediately;• If the sea recedes unusually, evacuate immediately;• If the sea has abnormally strong or unusual currents, evacuate immediately; • A tsunami is not a single wave but a series of waves;• The first wave of a tsunami may not be the largest;• The tsunami hazard can continue for many hours.
Tsunami preparedness also includes the development of evacuation plans forboth local and teletsunamis. Evacuation maps should be based upon inundationlevels predicted by the historical data and numerical models. For local tsunamisthey should take into consideration damages that may have occurred from the
PREPAREDNESS
WMO/UNESCO SUB-FORUM ON NATURAL DISASTER REDUCTION
128
60°N
50°N
55°N
45°N
40°N
35°N
30°N
25°N
20°N
15°N10°N
135°E 145°E 165°E 175°E 175°W 135°W145°W165°W 155°W 125°W155°E 115°W
cm
500250200150100
807060
4050
30201086420
90
Maximum Wave heightsMax: 272,28 cm
« Source locations
Time series locations
Mw: 8.50 Source B8*15.774+B9*15.774
Figure 11. One of the mostimportant keys to effective
tsunami mitigation is adequateawareness and knowledge of the
tsunami hazard by the public,emergency managers, anddecision makers. For this
purpose, IOC/ITSU and itsMember States have produced a
wide variety of educationalmaterials for both children andadults, some of it published in
several languages.
Figure 10. Techniques for numericalmodeling of tsunamis have signif-
icantly improved during the pastdecade, as they have been repeatedlytested against a wide variety of sea-
level and run-up data from recentevents. This technology has now been
transferred to many countries at riskthrough the IOC/ITSU TsunamiInundation Modeling Exchange
(TIME) program for the production ofpotential run-up maps in high-risk
coastal zones. Numerical models arealso increasingly being used to helpwarning centers improve tsunami
forecasts. In the example shown here,the tsunami produced by a moment
magnitude 8.5 earthquake in theAleutian Islands has been modeledand the maximum wave height ateach location in the north Pacific
indicated. The model predicts thatmost of the tsunami energy from this
type of event is directed towards theHawaiian Islands, while coasts in the
western Pacific are not affected.(Model output and figure courtesy of
the NOAA Pacific Marine
Environmental Laboratory).
generating earthquake that could block access routes. Land-use planning is alsoimportant. Critical facilities such as fire stations, police stations, and hospitals canbe sited outside the inundation zones and have access routes that do not crossinundation zones. Vulnerable populations should not be put at risk, so schoolsand retirement homes can be located outside inundation zones. Building codesfor inundation zones can include measures to minimize the effects of tsunamissuch as barriers to prevent the scouring of foundations by repeated flooding anddraining at the coast. When there are substantial assets at risk and the risk is high,large engineering works such as protective seawalls and dikes may be justified.
Tsunami research is carried out primarily by academic and government researchinstitutions. Research efforts are coordinated, with a considerable exchange of data andideas, through bodies such as the IUGG Tsunami Commission and the Tsunami Society.Areas for research include numerical modelling, paleotsunamis, remote sensing oftsunamis, tsunami source parameters from seismic data, tsunamis generated by non-seismic sources, and even the response of the public to tsunami warnings. Continuedresearch is needed to improve all methods of tsunami mitigation.
Although significant progress has been made in recent years to mitigate the adverseeffects of tsunamis, with numerous advancements in hazard assessment, warnings, andpreparedness, much remains to be done. Potential run-up maps based on historical andnumerical model data need to be produced for all vulnerable coastal communities. Morelocal and regional warning systems are needed for high-risk areas without access towarnings. Instrumentation to measure tsunamis in the deep ocean as well asappropriate numerical model data are needed for more accurate tsunami forecasts.Educational programs need to be more widely established and institutionalized to givethe public, emergency managers, and decision makers the crucial information theyneed to minimize the loss of life and property damage from the tsunami hazard. Onlywith these kinds of improvements can the impact of future tsunamis be reduced.
CONCLUSIONS
RESEARCH
MITIGATING THE EFFECTS OF TSUNAMIS: WHERE DO WE GO FROM HERE?
129
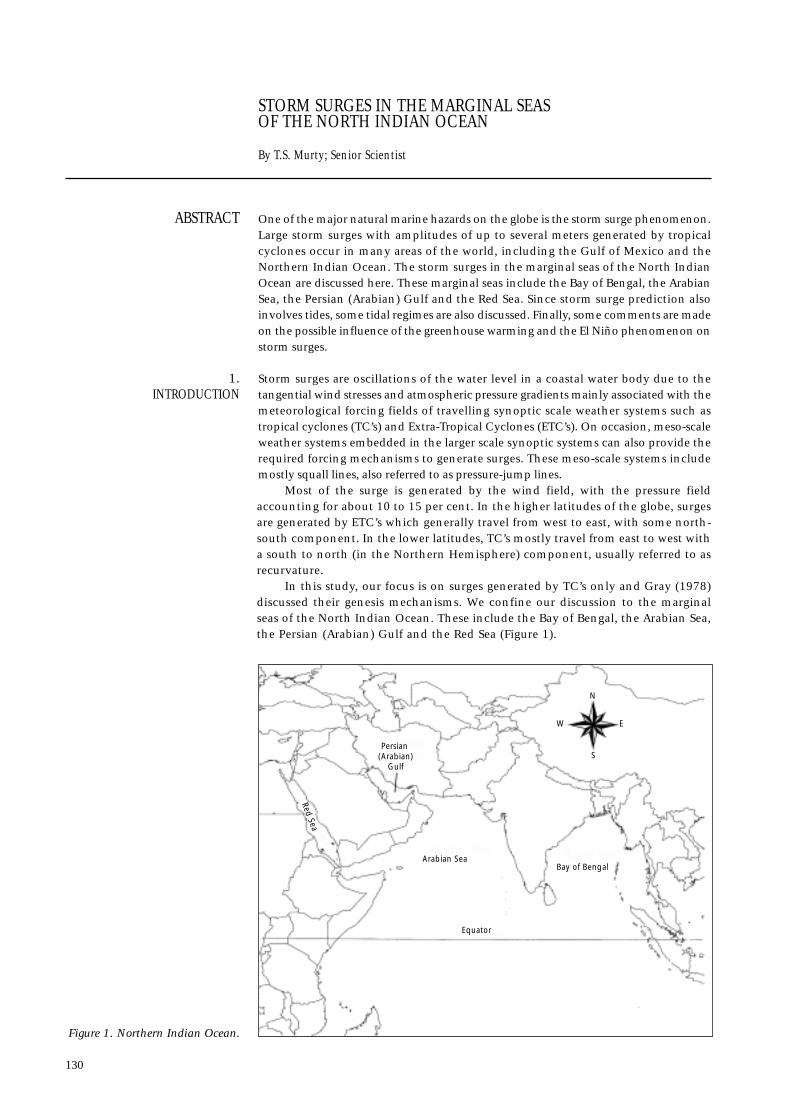
STORM SURGES IN THE MARGINAL SEAS OF THE NORTH INDIAN OCEAN
By T.S. Murty; Senior Scientist
One of the major natural marine hazards on the globe is the storm surge phenomenon.Large storm surges with amplitudes of up to several meters generated by tropicalcyclones occur in many areas of the world, including the Gulf of Mexico and theNorthern Indian Ocean. The storm surges in the marginal seas of the North IndianOcean are discussed here. These marginal seas include the Bay of Bengal, the ArabianSea, the Persian (Arabian) Gulf and the Red Sea. Since storm surge prediction alsoinvolves tides, some tidal regimes are also discussed. Finally, some comments are madeon the possible influence of the greenhouse warming and the El Niño phenomenon onstorm surges.
Storm surges are oscillations of the water level in a coastal water body due to thetangential wind stresses and atmospheric pressure gradients mainly associated with themeteorological forcing fields of travelling synoptic scale weather systems such astropical cyclones (TC’s) and Extra-Tropical Cyclones (ETC’s). On occasion, meso-scaleweather systems embedded in the larger scale synoptic systems can also provide therequired forcing mechanisms to generate surges. These meso-scale systems includemostly squall lines, also referred to as pressure-jump lines.
Most of the surge is generated by the wind field, with the pressure fieldaccounting for about 10 to 15 per cent. In the higher latitudes of the globe, surgesare generated by ETC’s which generally travel from west to east, with some north-south component. In the lower latitudes, TC’s mostly travel from east to west witha south to north (in the Northern Hemisphere) component, usually referred to asrecurvature.
In this study, our focus is on surges generated by TC’s only and Gray (1978)discussed their genesis mechanisms. We confine our discussion to the marginalseas of the North Indian Ocean. These include the Bay of Bengal, the Arabian Sea,the Persian (Arabian) Gulf and the Red Sea (Figure 1).
1.INTRODUCTION
ABSTRACT
130
Equator
Arabian SeaBay of Bengal
Persian (Arabian)
Gulf
Red Sea
N
W E
S
Figure 1. Northern Indian Ocean.
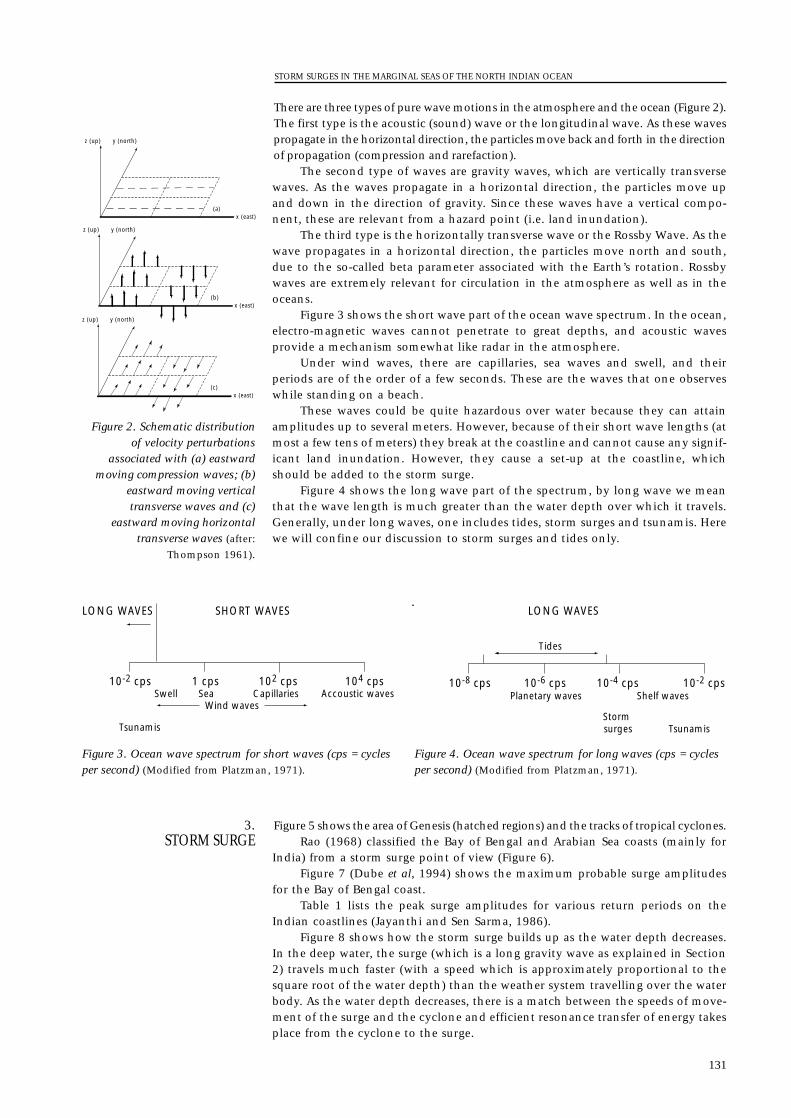
There are three types of pure wave motions in the atmosphere and the ocean (Figure 2).The first type is the acoustic (sound) wave or the longitudinal wave. As these wavespropagate in the horizontal direction, the particles move back and forth in the directionof propagation (compression and rarefaction).
The second type of waves are gravity waves, which are vertically transversewaves. As the waves propagate in a horizontal direction, the particles move upand down in the direction of gravity. Since these waves have a vertical compo-nent, these are relevant from a hazard point (i.e. land inundation).
The third type is the horizontally transverse wave or the Rossby Wave. As thewave propagates in a horizontal direction, the particles move north and south,due to the so-called beta parameter associated with the Earth’s rotation. Rossbywaves are extremely relevant for circulation in the atmosphere as well as in theoceans.
Figure 3 shows the short wave part of the ocean wave spectrum. In the ocean,electro-magnetic waves cannot penetrate to great depths, and acoustic wavesprovide a mechanism somewhat like radar in the atmosphere.
Under wind waves, there are capillaries, sea waves and swell, and theirperiods are of the order of a few seconds. These are the waves that one observeswhile standing on a beach.
These waves could be quite hazardous over water because they can attainamplitudes up to several meters. However, because of their short wave lengths (atmost a few tens of meters) they break at the coastline and cannot cause any signif-icant land inundation. However, they cause a set-up at the coastline, whichshould be added to the storm surge.
Figure 4 shows the long wave part of the spectrum, by long wave we meanthat the wave length is much greater than the water depth over which it travels.Generally, under long waves, one includes tides, storm surges and tsunamis. Herewe will confine our discussion to storm surges and tides only.
Figure 5 shows the area of Genesis (hatched regions) and the tracks of tropical cyclones. Rao (1968) classified the Bay of Bengal and Arabian Sea coasts (mainly for
India) from a storm surge point of view (Figure 6). Figure 7 (Dube et al, 1994) shows the maximum probable surge amplitudes
for the Bay of Bengal coast. Table 1 lists the peak surge amplitudes for various return periods on the
Indian coastlines (Jayanthi and Sen Sarma, 1986).Figure 8 shows how the storm surge builds up as the water depth decreases.
In the deep water, the surge (which is a long gravity wave as explained in Section2) travels much faster (with a speed which is approximately proportional to thesquare root of the water depth) than the weather system travelling over the waterbody. As the water depth decreases, there is a match between the speeds of move-ment of the surge and the cyclone and efficient resonance transfer of energy takesplace from the cyclone to the surge.
3.STORM SURGE
STORM SURGES IN THE MARGINAL SEAS OF THE NORTH INDIAN OCEAN
131
z (up) y (north)
x (east)(a)
z (up) y (north)
x (east)(b)
z (up) y (north)
x (east)(c)
Figure 2. Schematic distributionof velocity perturbations
associated with (a) eastwardmoving compression waves; (b)
eastward moving verticaltransverse waves and (c)
eastward moving horizontaltransverse waves (after:
Thompson 1961).
LONG WAVES SHORT WAVES
10-2 cps 1 cps 102 cps 104 cps
Wind wavesSwell Sea Capillaries Accoustic waves
Tsunamis
LONG WAVES
10-8 cps 10-6 cps 10-4 cps 10-2 cps
Tides
Planetary waves Shelf waves
TsunamisStorm surges
Figure 3. Ocean wave spectrum for short waves (cps = cyclesper second) (Modified from Platzman, 1971).
Figure 4. Ocean wave spectrum for long waves (cps = cyclesper second) (Modified from Platzman, 1971).
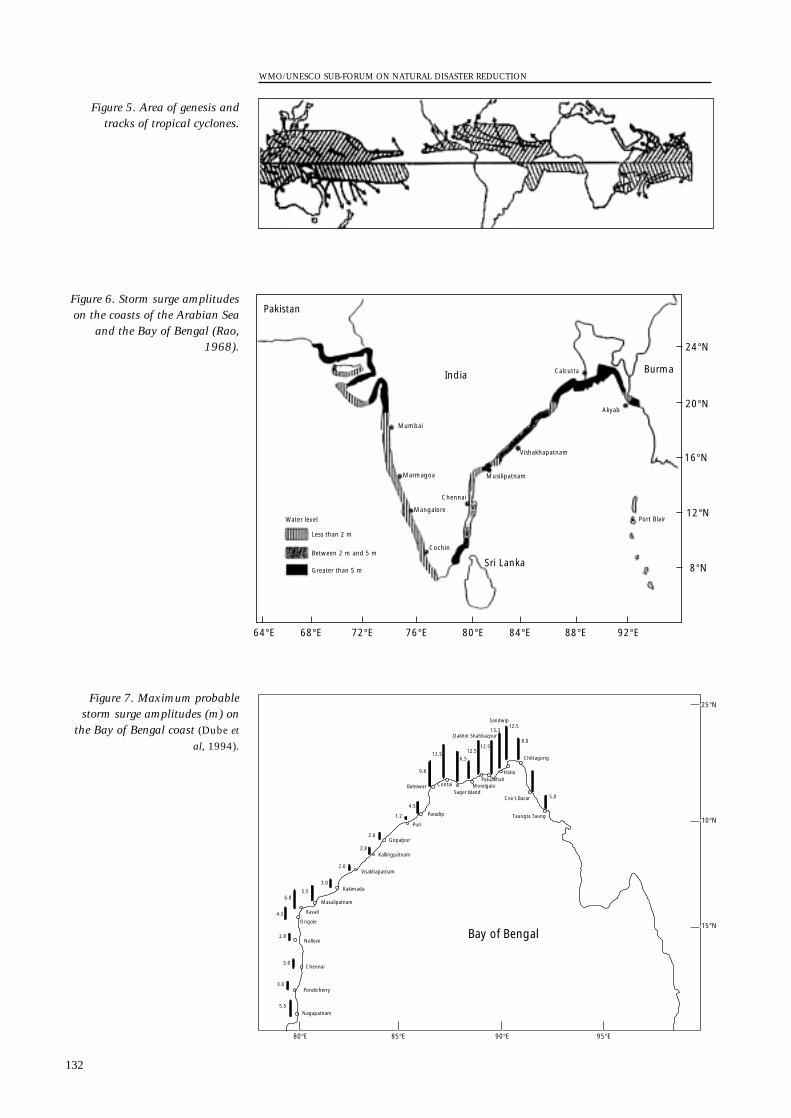
WMO/UNESCO SUB-FORUM ON NATURAL DISASTER REDUCTION
132
Figure 5. Area of genesis andtracks of tropical cyclones.
64°E 68°E 72°E 76°E 80°E 84°E 88°E 92°E
8°N
12°N
16°N
20°N
24°N
Pakistan
India Burma
Sri Lanka
Marmagoa Musilipatnam
Vishakhapatnam
Calcutta
Akyab
Mangalore
Cochin
Chennai
Port Blair
Mumbai
Water level
Less than 2 m
Between 2 m and 5 m
Greater than 5 m
Figure 6. Storm surge amplitudeson the coasts of the Arabian Sea
and the Bay of Bengal (Rao,1968).
25°N
10°N
15°N
95°E90°E80°E 85°E
5.5
3.0
3.0
2.8
4.5
6.85.5
3.0
2.0
2.8
2.6
1.2
4.5
9.8
12.56.5
12.512.5
12.5
5.0
8.0
13.3
Nellore
Ongole
Kavali
Masulipatnam
Kakimada
Visakhapatnam
Kallingpatnam
Gopalpur
Puri
Paradip
Nagapatnam
Pondicherry
Chennai
Baleswar ContaiSager Island
Morelgaiu
Dakhin Shahbazpur
Sandwip
PatuakhaliHatia
Chittagong
Cox’s Bazar
Taungta Taung
Bay of Bengal
Figure 7. Maximum probablestorm surge amplitudes (m) on
the Bay of Bengal coast (Dube et
al, 1994).

Another qualitative way of explaining the build-up of the surge is in termsof the wind field associated with the weather system. The tangential wind stresspushes the water towards the coast. In deep water, the water could escape laterallyor sideways, whereas in shallow water, it cannot go anywhere but up. This is avery simple explanation of how the surge is generated.
The peak surge usually only occurs on a relatively small stretch of the coast-line (a hundred km at most, usually a few dozen of km), as can be seen fromFigure 9. The fact that the peak surge occurs on only a small stretch of the coast-line can also be seen from Figures 10, 11 and 12 (Rao, 1968). It should be notedthat in the Northern Hemisphere, the peak surge occurs to the right of the stormtrack (and to the left in the Southern Hemisphere).
In Figure 12, the fact that the surge did not occur continuously everywhere on thecoast needs some explanation. The orientation of the coastline with reference to thestorm track as well as the local bathymetry also plays an important role.
Computation and prediction of the land inundation in river deltas is acomplex problem involving interaction of the surge with tide, river flow andprecipitation. Figure 13 and 14 show inundation limits for two major river deltason the east coast of India. Such inundation computations can be done more accu-rately through the use of finite element (f-e) models employing irregulartriangular grids rather than the traditional finite-difference (f-d) models withregular grids. Figure 15 shows an irregular triangular grid for the northern part ofthe Bay of Bengal and Figure 16 shows a zoom-in for the northern extremity ofthe grid.
STORM SURGES IN THE MARGINAL SEAS OF THE NORTH INDIAN OCEAN
133
Table 1. Peak surge amplitudes(m) for various return periods, onthe coastlines of India, based ondata for 1890 to 1984 (from
Jayanthi and Sen Sarma, 1986).
State Peak Surge (m) for Return Periods (Years of 1890–1984)
10 25 50 100 200Tamil NaduSouth of 10°N 4.8 5.9 6.6 7.5 8.1
Tamil NaduNorth of 10°N 2.2 2.7 3.0 3.4 3.7
Andhra Pradesh 3.8 4.2 4.8 5.2 5.6Orissa-S. of 20.5°N 2.0 2.7 3.2 3.8 4.4
Orissa-N. of 20.5°N 5.1 6.4 6.9 8.8 10.4
West Bengal 4.5 6.3 7.8 9.2 10.9
Maharashtra 1.1 1.4 1.6 1.8 2.0
Gujarat 1.9 2.2 2.4 2.6 2.9
Chittagong
Duleswar
TigerPl
HireanPl
S. Hatia Is.
S. Sandwip Is.
0.5
1.0
2.5
0.0
0.5
1.0
1.0
1.5
1.5
2.0
2.5
3.5
4
4
5
Figure 8. Storm surge heights inthe northern part of the Bay ofBengal from a hypothetical stormmodeled after the November1970 storm.

WMO/UNESCO SUB-FORUM ON NATURAL DISASTER REDUCTION
134
0 100
200
300
400
500
600
655
00.
51.
52.
53.
54.
55.
51.
02.
03.
04.
05.
06.
0
Kalli
ngap
atna
m
Poon
di
Baru
a
Gop
alpu
r
Puri
Kona
rk
Para
dip
land
fall
fals
e po
int
Cha
ndba
li
Bala
sore
Con
tai
Surg
e in
met
res
Orissa Cyclone 1971
Distance along east coast of India in km
Peak surge = 3.924
Figure 9. Peak surge (m) alongthe east coast of India for theOrissa Cyclone of 1971 (Dube et
al., 1997).
82° 84°80°
14°
16°
18°
ANDHRA PRADES
HVisakhapatnam
KakinadaEluru
Masulipatnam
Ongole
Nellore
Figure 10. Track of the storm of October 1949 on thesoutheast coast of India. Hatched area shows the coastlineaffected by the storm surge (Rao 1968).
Figure 11. Track of the storm of November 1952 on thesoutheast coast of India. Hatched area shows the coastline
affected by the storm surge (Rao 1968).
80°79°
10°
11°
Karaikal
Nagapattinam
Track of storm
Calimere pt.
Jaffna
Tanjore
Adiramapatnam
Tamil N
adu
Palk
strait
Ceylon
72°70°60°
20°
22°
24° Great Rann of Kutch
Trackof
storm
Naliya
Gulf of Kutch
Bhuj
MandviKanola
Navlahi
DwarkaNayagar
PorbunderBhavanagar
VeravalJararabad
Diu
Figure 12. Track of the Kutch cyclone ofJune 1964 on the west coast of India.
Dark grey area is affected by minorsurges; light grey areas are affected by
major surges (Rao 1968).

STORM SURGES IN THE MARGINAL SEAS OF THE NORTH INDIAN OCEAN
135
India
Bay of Bengal
GodavariRiver
Rajamundry
Narsapur
Antarvedj
Razole
Amalapuram
Yanam
Coringa
Kakinada
Figure 13. Composite cyclone flood map for the Godavaririver.
N
Tenali
Masulipatnam
Challapali
Repalle
Nizampatnam
Krishna river
Figure 14. Cyclone map for the Krishna River.
Figure 15. Irregular triangular grid forthe northern part of the Bay of Bengal(Henry et al., 1997).
Figure 16. Zoom-in for thenorthern extremity of the grid.
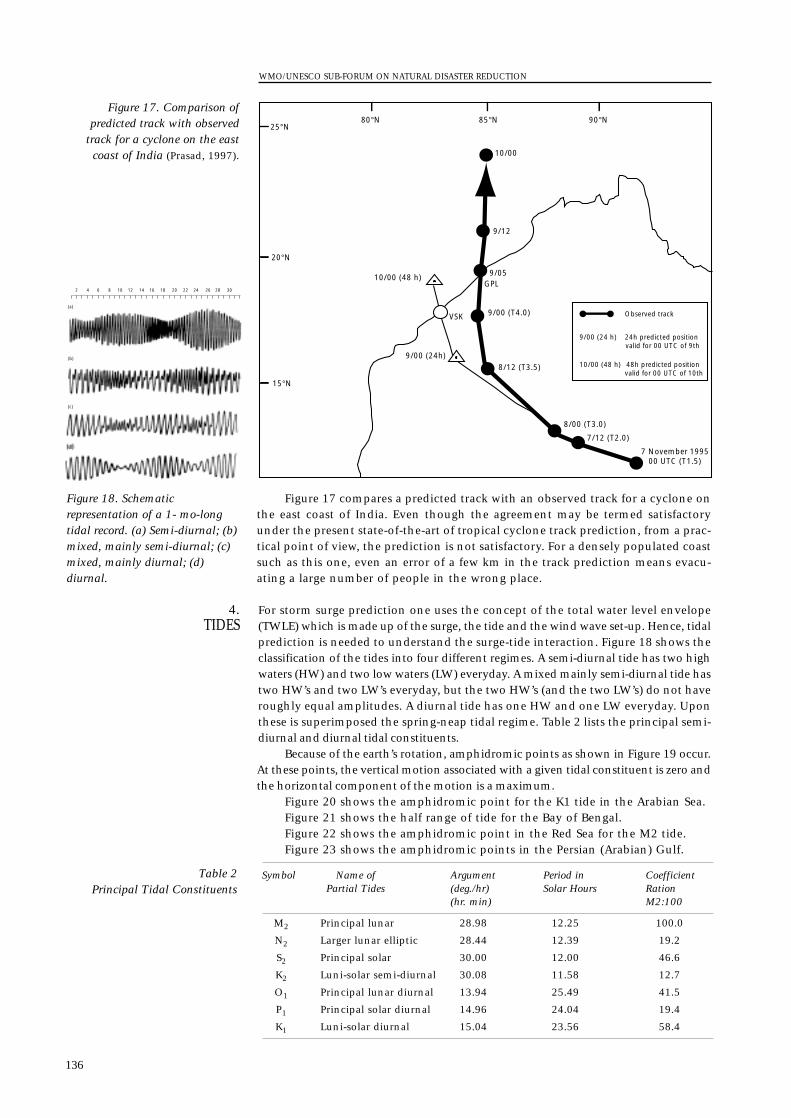
Figure 17 compares a predicted track with an observed track for a cyclone onthe east coast of India. Even though the agreement may be termed satisfactoryunder the present state-of-the-art of tropical cyclone track prediction, from a prac-tical point of view, the prediction is not satisfactory. For a densely populated coastsuch as this one, even an error of a few km in the track prediction means evacu-ating a large number of people in the wrong place.
For storm surge prediction one uses the concept of the total water level envelope(TWLE) which is made up of the surge, the tide and the wind wave set-up. Hence, tidalprediction is needed to understand the surge-tide interaction. Figure 18 shows theclassification of the tides into four different regimes. A semi-diurnal tide has two highwaters (HW) and two low waters (LW) everyday. A mixed mainly semi-diurnal tide hastwo HW’s and two LW’s everyday, but the two HW’s (and the two LW’s) do not haveroughly equal amplitudes. A diurnal tide has one HW and one LW everyday. Uponthese is superimposed the spring-neap tidal regime. Table 2 lists the principal semi-diurnal and diurnal tidal constituents.
Because of the earth’s rotation, amphidromic points as shown in Figure 19 occur.At these points, the vertical motion associated with a given tidal constituent is zero andthe horizontal component of the motion is a maximum.
Figure 20 shows the amphidromic point for the K1 tide in the Arabian Sea.Figure 21 shows the half range of tide for the Bay of Bengal.Figure 22 shows the amphidromic point in the Red Sea for the M2 tide.Figure 23 shows the amphidromic points in the Persian (Arabian) Gulf.
4.TIDES
WMO/UNESCO SUB-FORUM ON NATURAL DISASTER REDUCTION
136
10/00
9/12
9/05
9/00 (T4.0)
8/12 (T3.5)
8/00 (T3.0)
GPL
VSK
10/00 (48 h)
9/00 (24h)
7/12 (T2.0)
7 November 199500 UTC (T1.5)
25°N80°N 85°N 90°N
20°N
15°N
Observed track
9/00 (24 h) 24h predicted position valid for 00 UTC of 9th
10/00 (48 h) 48h predicted position valid for 00 UTC of 10th
Figure 17. Comparison ofpredicted track with observed
track for a cyclone on the eastcoast of India (Prasad, 1997).
2 4 6 8 10 12 14 16 18 20 22 24 26 28 30
(a)
(b)
(c)
Figure 18. Schematicrepresentation of a 1- mo-longtidal record. (a) Semi-diurnal; (b)mixed, mainly semi-diurnal; (c)mixed, mainly diurnal; (d)diurnal.
Table 2Principal Tidal Constituents
Symbol Name of Argument Period in Coefficient Partial Tides (deg./hr) Solar Hours Ration
(hr. min) M2:100
M2 Principal lunar 28.98 12.25 100.0
N2 Larger lunar elliptic 28.44 12.39 19.2
S2 Principal solar 30.00 12.00 46.6
K2 Luni-solar semi-diurnal 30.08 11.58 12.7
O1 Principal lunar diurnal 13.94 25.49 41.5
P1 Principal solar diurnal 14.96 24.04 19.4
K1 Luni-solar diurnal 15.04 23.56 58.4
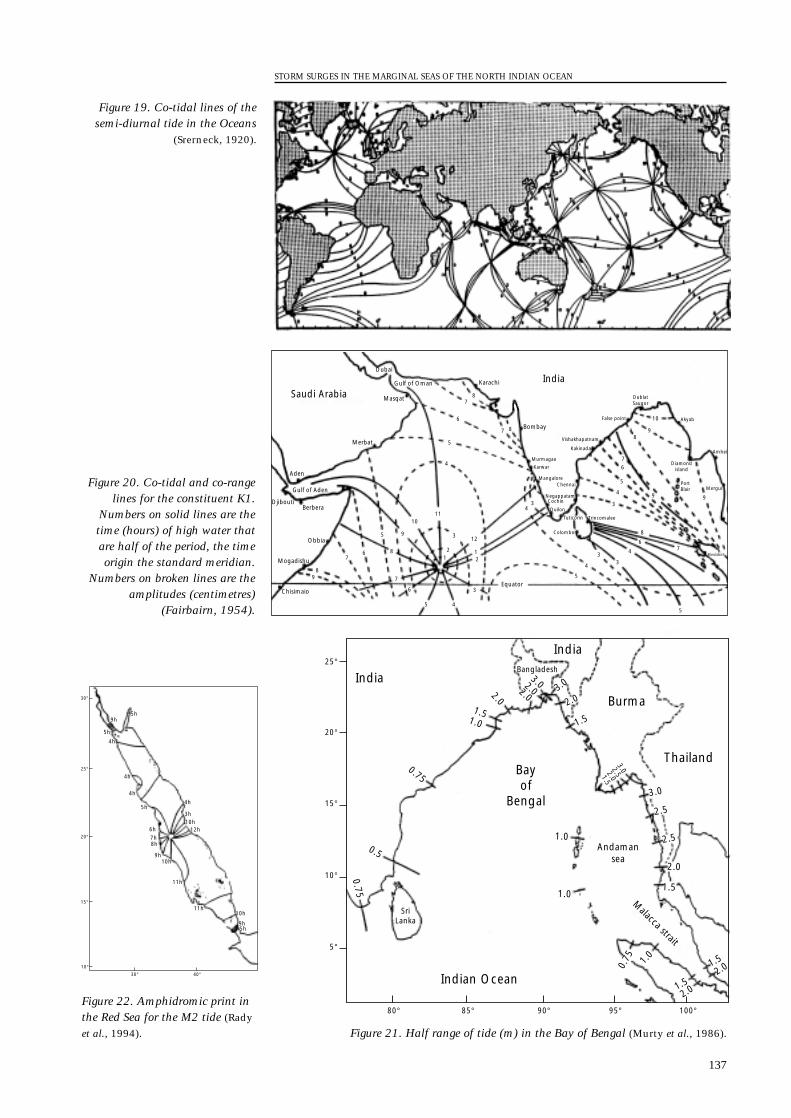
STORM SURGES IN THE MARGINAL SEAS OF THE NORTH INDIAN OCEAN
137
Figure 19. Co-tidal lines of thesemi-diurnal tide in the Oceans
(Srerneck, 1920).
Chisimaio
Mogadishu
Obbia
BerberaDjibouti
Gulf of Aden
Aden
Merbat
Masqat
Dubai
Gulf of Oman Karachi
Bombay
Murmagao
Karwar
Mangalore
Saudi Arabia
India
9
9
9
99
10
10
11
12
8
8
8
8
8
87
7
7
7
7
76
6
6
6
65
5
5
5
5
5
4
4
4
4
4
4
3
3 3
33
3
2
2 11
Cochin
Quilon
Negappatam
Chennai
Kakinada
Vishakhapatnam
False point
Tuticorin Trincomalee
Colombo
DublatSaugor
Akyab
Amhei
Diamondisland
PortBlair Mergui
Meulaboh
Equator
Figure 20. Co-tidal and co-rangelines for the constituent K1.
Numbers on solid lines are thetime (hours) of high water thatare half of the period, the timeorigin the standard meridian.
Numbers on broken lines are theamplitudes (centimetres)
(Fairbairn, 1954).
25°
20°
15°
10°
5°
80° 85° 90° 95° 100°
SriLanka
India
IndiaBangladesh
Burma
ThailandBayof
Bengal
Andamansea
Indian Ocean
Malacca strait
0.75
0.5
0.75
1.01.5
1.5
2.0
2.02.0
2.03.0
2.01.52.5
3.0
3.0
3.0
2.5
2.5
1.5
1.5
1.5
1.0
1.0
1.0
2.0
2.0
2.00.75
Figure 21. Half range of tide (m) in the Bay of Bengal (Murty et al., 1986).
40°30°10°
15°
20°
25°
30°
9h5h
5h
5h
6h7h8h
5h
9h
9h
10h
11h
11h
10h
10h
12h
4h
4h
4h
4h
3h
Figure 22. Amphidromic print inthe Red Sea for the M2 tide (Rady
et al., 1994).
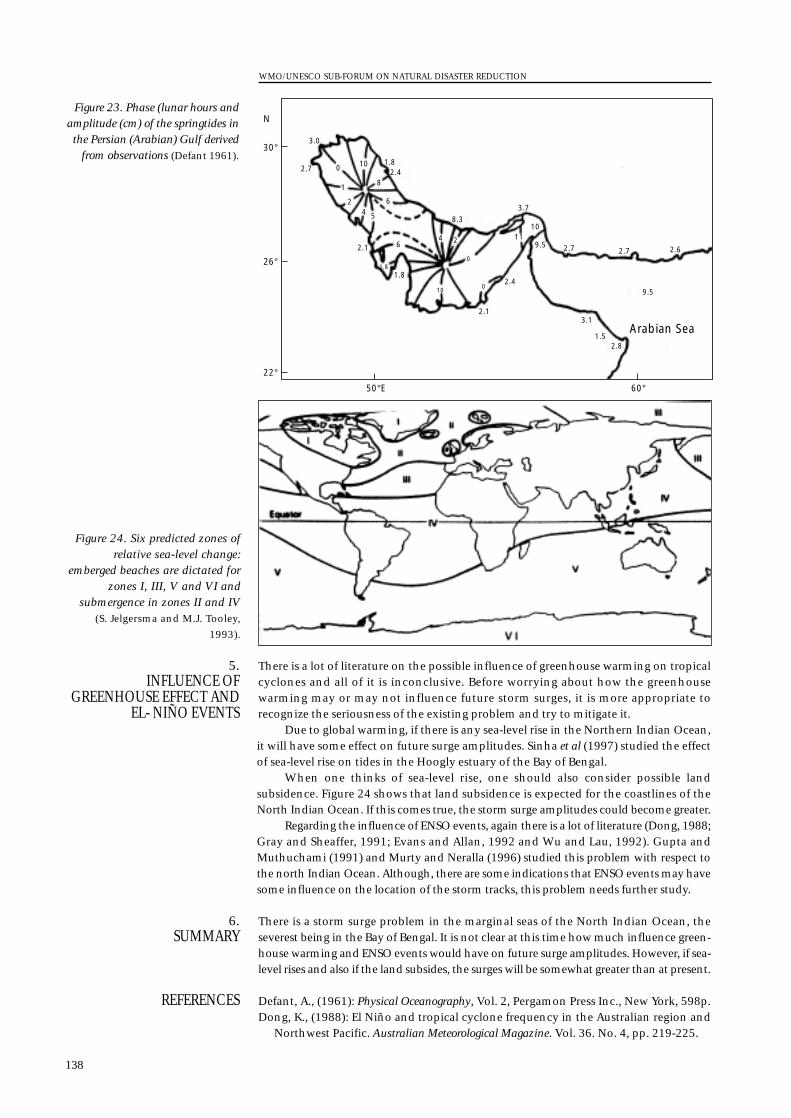
There is a lot of literature on the possible influence of greenhouse warming on tropicalcyclones and all of it is inconclusive. Before worrying about how the greenhousewarming may or may not influence future storm surges, it is more appropriate torecognize the seriousness of the existing problem and try to mitigate it.
Due to global warming, if there is any sea-level rise in the Northern Indian Ocean,it will have some effect on future surge amplitudes. Sinha et al (1997) studied the effectof sea-level rise on tides in the Hoogly estuary of the Bay of Bengal.
When one thinks of sea-level rise, one should also consider possible landsubsidence. Figure 24 shows that land subsidence is expected for the coastlines of theNorth Indian Ocean. If this comes true, the storm surge amplitudes could become greater.
Regarding the influence of ENSO events, again there is a lot of literature (Dong, 1988;Gray and Sheaffer, 1991; Evans and Allan, 1992 and Wu and Lau, 1992). Gupta andMuthuchami (1991) and Murty and Neralla (1996) studied this problem with respect tothe north Indian Ocean. Although, there are some indications that ENSO events may havesome influence on the location of the storm tracks, this problem needs further study.
There is a storm surge problem in the marginal seas of the North Indian Ocean, theseverest being in the Bay of Bengal. It is not clear at this time how much influence green-house warming and ENSO events would have on future surge amplitudes. However, if sea-level rises and also if the land subsides, the surges will be somewhat greater than at present.
Defant, A., (1961): Physical Oceanography, Vol. 2, Pergamon Press Inc., New York, 598p.Dong, K., (1988): El Niño and tropical cyclone frequency in the Australian region and
Northwest Pacific. Australian Meteorological Magazine. Vol. 36. No. 4, pp. 219-225.
REFERENCES
6.SUMMARY
5.INFLUENCE OF
GREENHOUSE EFFECT ANDEL- NIÑO EVENTS
WMO/UNESCO SUB-FORUM ON NATURAL DISASTER REDUCTION
138
60°50°E
22°
26°
30°
N
3.0
2.7 0
1
2
2
4
4
8
10 1.8
1.81.8
2.4
6
6
5
2.1
2.1
2.410
0
0
11
8.33.7
10
9.5
9.5
2.7
3.1
1.5
2.7 2.6
2.8
Arabian Sea
Figure 23. Phase (lunar hours andamplitude (cm) of the springtides inthe Persian (Arabian) Gulf derived
from observations (Defant 1961).
Figure 24. Six predicted zones ofrelative sea-level change:
emberged beaches are dictated forzones I, III, V and VI and
submergence in zones II and IV(S. Jelgersma and M.J. Tooley,
1993).
Dube S.K., A.D. Rao, P.C. Sinha and P. Chittibabu, (1994): A real-time storm surgeprediction system: An application to east coast of India, Proc. Indian National Sci.Academy, Vol. 60, pp. 157-170.
Dube S.K., A.D. Rao, P.C. Sinha, T.S. Murty and N. Bahulayan, (1997): Storm surgein the Bay of Bengal and Arabian Sea. The problem and its prediction, Mausam,Vol. 48, No. 283-304.
Evans, J.L. and R.J. Allan, (1992): El Niño/Southern Oscillation: Modification tothe structure of the monsoon and tropical cyclone activity in the AustralasianRegion. International Journal of Climatology. Vol. 12, pp. 611-623.
Fairbairn, L.A., (1954): The semi-diurnal tides along the equator in the Indian Ocean,Phil. Trans. Proy. Soc. London, Ser. A., Vol. 247, No. 927, pp. 191-212.
Gray, M. and J.D. Shaeffer, (1991): El-Niño and QBO influences on tropicalcyclone activity, in Teleconnections linking worldwide climate anomalies: scientificbasis and social impact. Edited by M.H. Glantz, R.W. Katz and N. Nicholls.Cambridge University Press. New York pp. 258-284.
Gray, W.M., (1978): Hurricanes: their formation, structure and likely role in the tropi-cal circulation, p. 155-218, in D.B. Shaw (Edited), Meteorology Over the TropicalOceans, Royal Meteorological Society, Bracknell, U.K.
Gupta A. and A. Muthuchami, (1991): El Niño and tropical storm tracks over Bay ofBengal during post-monsoon season. Mausam. Vol. 42, No. 3, pp. 257-260.
Henry, R.F., D.S. Duncalf, R.A. Walters, M.J. Osborne, and T.S. Murty, (1997): Astudy of tides and storm surges in offshore waters of the Meghna estuary using a finiteelement model, Mausam, Vol. 48, No. 4, pp. 519-530.
Jayanthi, N. and A.K. Sen Sarma, (1986): A catalogue of storm surges in India, Report86-1, Regional Meteorological Center, Madras, India, 25p.
Jelgersma, S. and M.J. Tooley, (1993): Sea-level changes during the recent geologicalpast, state-of-the-art report, sea-level changes and their consequences for hydrologyand water management, International Workshop, 19-23 April 1993,Noordwijkerhout, Netherlands, pp. 9-41.
Murty, T.S., (1984): Storm surges-meteorological ocean tides, Canadian Bulletin ofFisheries and Aquatic Sciences, No. 212, 897p.
Murty, T.S. and V .R. Neralla, (1996): El-Niño and storm surges in the Bay ofBengal, in Land-based and marine hazards: scientific and management issues,advances in natural and technological hazards research, edited by M.I. El-Sabh, S.Venkatesh, H. Denis and T.S. Murty, Kluwer Academic Publishers, Dordrecht,Netherlands, pp. 97-111.
Murty, T.S., R.A. Flather and R.F. Henry, (1986): The storm surge problem in the Bayof Bengal, Progress in Oceanography, Vol. 16, pp. 195-233.
Platzman, G.W., (1971): Ocean tides and related waves, lectures for the Americanmathematical society, 1970, Summer Seminar on Mathematical Problems in theGeophysical Sciences, Held at the Rensselaer Polytechnique Institute, Troy,N.Y., 94p. (also in W.H. Reid (Ed). Mathematical Problems in the GeophysicalSciences, Vol. 14, Part 2, pp. 239-291.
Prasad, K., (1997): Prediction of tropical cyclones by numerical models, A Review,Mausam, Vol. 48, No. 2, pp. 225-238.
Rady, M.A., M.I. El-Sabh, T.S. Murty and J. O. Backaus, (1994): Numerical modellingof tides in the Gulf of Suez, Egypt, Marine Geodesy, Vol. 17, No. 1, pp. 11-36.
Rao, N.S.B., (1968): On some aspects of local and tropical storms in the Indian area,Ph.D. Thesis, University of Jadavapur, Jadavapur, West Bengal, India, 262 p.
Sinha P.C., Y.R. Rao, S.K. Dube and T.S. Murty, (1997): Effect of sea-level rise on thetidal circulation in the Hooghly estuary, Bay of Bengal, Marine Geodesy, Vol. 20,No. 4, pp. 341-366.
Sterneck, R.V., (1920): Die Gezeiten Der Ozeane, Stiz.Ber.Akad.Wiss.Wien, Vol. 129,pp. 131-150.
Thompson, P.D., (1961): Numerical weather analysis and prediction, the MacMillanCompany, New York, 170 p.
Wu, G. and N.C. Lau, (1992): A.G.C.M. Simulation of the relationship betweentropical storm formation and ENSO. Monthly Weather Review. Vol. 13, pp. 958-977.
STORM SURGES IN THE MARGINAL SEAS OF THE NORTH INDIAN OCEAN
139
EARLY WARNING FOR THE 1991 ERUPTIONS OF PINATUBOVOLCANO — A SUCCESS STORY —
by Raymundo S. Punongbayan and Christopher G. Newhall
The success or failure of a warning system can be gauged in terms of the number of lives(and value of assets) lost to or saved from a disaster causing event. In these terms, theearly warning system used at Pinatubo Volcano in 1991 can be considered a successstory — the death toll of 250-300 out of the 20 000 immediately at risk was small despitethe magnitude and violence of the eruption which was one of the world’s biggesteruptions this century. This success can be attributed to a number of factors: earlydetection of the unrest, timely identification of hazards and delineation of vulnerableareas to them, successful application of state-of-the-art monitoring and surveillancetechniques, accurate prediction of the most destructive phase of the eruption, timelyissuance and dissemination of easily understood warnings, prompt action of key civildefence officials and disaster response workers, and timely evacuation of majority ofthe inhabitants at risk.
What made the Pinatubo story a classic are not only its success factors butalso its near-misses — the things that could easily have gone wrong but luckilydid not, which provide valuable lessons for developing warning systems in partic-ular and volcanic risk mitigation plans in general. The positive aspects of theexperience highlighted the value of the following: state-of-the-art monitoringequipment and techniques, international cooperation based on mutual respect,sustained intensive public education on volcanic hazards; active involvement ofselected scientists as the designated spokespersons in awareness promotion andwarning dissemination; open and speedy communication lines between thescience people on one hand and the civil defence officials on the other; and goodrelations between scientists and the media. The near-misses or potentially nega-tive aspects of the experience underscored the need to conduct geologic data basestudies and hazard zonation on all active volcanoes long before the onset ofunrest. We were lucky because Pinatubo gave us sufficient lead time to conductreconnaissance geological studies and mapping of deposits of its past eruptions,thus enabling us to forecast the life-threatening hazards when it decided to eruptand to warn/educate concerned sectors into taking appropriate protective actions.We know that we will not always be as lucky. Hence, efforts will now be focussedon detailed studies and mapping of the unmonitored active volcanoes and onconducting in communities-at-risk an Pinatubo education campaign that woulderode their indifference, scepticism and hostility to long-term action plan forvolcanic disaster mitigation.
Ideally, for a nation to effectively minimize or prevent disasters from volcanicphenomena, it must be able and willing to: 1) identify its high-risk volcanoes; 2) assessthe hazards posed by these volcanoes, and delineate the areas likely to be affected bythese hazards in hazard zonation maps; 3) monitor and forecast/predict the eruptions ofthese volcanoes; and, based on the outputs of these three activities; and 4) adoptmeasures or take actions that would reduce potential losses to volcanic hazards, suchas: a) the formulation and strict implementation of land use and development plans asconstrained by major volcanic hazards; b) relocation of communities at risk; c)emplacement of structural protection measures; and d) putting in place contingencyplans and volcano emergency response. These four volcanic disaster mitigationcomponents require two major sets of people and activities: the scientists on one handto do the first three, and on the other the concerned policy makers, disastermanagement officials/organizations and endangered communities to do the fourth.The scientific findings of the former must be communicated effectively to the latterwho, in their turn, plan and implement appropriate mitigation measures and actions.The chain linking these two sets of people and activities, ensuring that scientificfindings are translated into concrete loss reduction/prevention actions is — the warning
1.INTRODUCTION
ABSTRACT
140
system. Each link in the chain — monitoring and forecasting, warning messageformulation, transmission and response to warning — is important; any weakness orfailure in one component could render the whole system ineffective in preventing oraverting volcanic disaster.
The 1991 Pinatubo Volcano eruption experience can be considered awarning system success story. The unrest was diagnosed early enough, the hazardswere identified and the areas vulnerable to them were delineated based on inter-pretation of geologic record of the volcano’s past eruptions, the most destructivephase of the eruption was predicted, timely warnings were issued, the disasterresponse machinery was mobilized, and endangered populations were evacuatedon time. Thus, all except about 250-300 of the more than 20 000 dwellers in theareas overrun by the destructive agents unleashed by Pinatubo's climactic 12-15June eruption, escaped certain death. This death toll is small considering that themagnitude and violence of the eruption made it one of the world’s largest thiscentury.
What makes the Pinatubo story a classic are not only its success factors butalso its near-misses — the things that could easily have gone wrong, but luckilydid not. These provide valuable lessons for developing warning systems in partic-ular and volcanic risk mitigation plans in general. We keep discovering more andmore of these “lessons” each time we recall and retell the Pinatubo story. So weshall keep recalling and retelling the story until we exhaust its treasure of lessons.
The Pinatubo story recounted in this paper shows how the warning systemevolved as scientists, disaster response officials and workers, and the endangeredinhabitants responded or acted in each scene of the unfolding Pinatubo Volcanodrama. For additional information on the story, see Punongbayan et al (1996) andNewhall and Punongbayan (1996).
Before the 1980s, the Commission on Volcanology or COMVOL, the governmentagency responsible for monitoring active volcanoes and forecasting their eruptions, hada reactive orientation: waiting for a volcano to erupt, monitoring the activities of anerupting volcano and pulling out of the scene when the volcano stopped erupting.Volcanology, as pursued then by COMVOL, had been mainly done by identifyingvolcanoes with short repose periods and constructing one or two monitoring stationson their slopes. No attention was given to conduct volcanogeological mapping of themonitored active volcanoes and generate volcanic hazards zonation maps, nor werethere attempts to map areas impacted by volcanic hazards from a volcano that justerupted. Hence when COMVOL was re-organized into the Philippine Institute ofVolcanology and Seismology (PHIVOLCS) in 1984 and transformed into a research andmonitoring body, the latter only inherited volcano monitoring stations on five activevolcanoes with short repose periods and growing populations (and therefore high-risk),namely Mayon, Bulusan, Taal, Canlaon and Hibok-Hibok.
During the 1980s, PHIVOLCS started upgrading and expanding the moni-toring network with the addition of a sixth permanent station at Mt. Banahaw.Also initiated was a long-term program of basic studies on these six monitoredvolcanoes and Iriga Volcano, another known active volcano. These studies wereaimed at generating information for deciphering past eruptive behaviour, under-standing current behaviour and making long-term forecasts of the volcanoes’activities. Hazard assessments and zonation were also conducted on these volca-noes and the hazard zone maps produced have been disseminated to concernedland use and development planners, policy makers and local leaders of endan-gered communities. However, the results of these hazards assessments and ourlong-term (looking years to decades ahead) forecasts and warnings have beenlargely ignored or met with scepticism and/or outright hostility. Long-term miti-gation measures such as restricting land uses and development activities for amere “probable” event in the not-too-distant to distant future are often unpalat-able to both policy makers and citizens.
During this same decade, three of the monitored volcanoes erupted —Mayon, Bulusan and Canlaon. In these volcanic crises, our medium- to short-termforecasts and warnings were often received with scepticism. Luckily, with the
2.VOLCANIC RISK MITIGATION
EFFORTS BEFORE THE 1990S
EARLY WARNING FOR THE 1991 ERUPTIONS OF PINATUBO VOLCANO — A SUCCESS STORY
141
exception of Mayon’s eruption in 1984, the other events were mild and of shortduration thus not necessitating evacuation. During the Mayon Volcano 1984eruption, the respondents to a post-eruption survey claimed that they evacuatedmore on the basis of their own perception of the volcano's activity than on warn-ings from government and media sources (Tayag et al., 1985).
Of the 220 or so Quaternary volcanoes in the Philippine Archipelago, wehave classified as active the 22 that have erupted during historic time (or withinthe past 500 years) and those with no reported eruption during historical time butwhich showed evidence of having erupted during the last 10 000 years. PinatuboVolcano is one of the active volcanoes with no historical eruption but was classi-fied as such (Punongbayan 1987) on the basis of the youngest age yielded byradiocarbon dating of charcoal fragments from one of its pyroclastic flowdeposits: 650 + 80 radiocarbon years (Ebasco Services Inc, 1977). Parker Volcanoin southern Mindanao was added to the list in 1995 as collected charcoal frag-ments from its deposits yielded a carbon-14 date of 250 years.
In view of the limitations of PHIVOLCS monitoring capability and the prior-ity given to volcanoes with short repose periods, Pinatubo Volcano which has along repose period was not covered by the PHIVOLCS monitoring network andbecause of this, the onset of its unrest was not properly documented. Pre-eruptionPinatubo Volcano used to be the home of Aeta or Negrito tribes which were scat-tered on the slopes of the volcano straddling the three provinces of Zambales,Tarlac and Pampanga. Traditionally semi-nomadic, these tribes thrived onkaingin, or slash and burn farming, producing mostly coffee, root crops andbananas. The Aetas consider Pinatubo as their god whom they call as ApoNamalyari. When they have a good harvest, they make offerings to ApoNamalyari in the steaming ground located on the northern slopes of Pinatubo.
On 16 July 1990, a Magnitude-7.8 earthquake was generated by the Digdig Faultsegment of the Philippine Fault Zone and whose epicenter was located about 100km northeast of Pinatubo Volcano (Figure 1). A few hours after the main shock, asmall magnitude earthquake occurred about 10 km southeast of the volcano.Quakes continued to be felt around the volcano area during the following weeks.We do not know, and will probably never know, whether these earthquakes werelocally generated volcanic quakes or distant aftershocks of the 16 July northernLuzon earthquake.
In early August, indigenous Aetas living on the slopes of Pinatubo accompa-nied by nuns of the Franciscan Missionaries of Mary, reported to PHIVOLCSaudible rumbling sounds, ground cracking and increased steaming from a pre-existing thermal area. A quick response team was dispatched by PHIVOLCS toinvestigate the reported phenomena. After conducting a cursory investigationaround the thermal area, the team reported that: “Preliminary findings indicatethat the phenomenon is not related with any volcanic activity...The parametersnecessary for deducing an approaching... volcanic eruption were not observed inthe locality” (Ramos and Isada, 1991). The team thus concluded that the reportedobservations of the volcano dwellers were possibly related to a landslide that wastriggered by the continuing aftershocks of the regional earthquake and the recentheavy rains in the area.
On 2 April 1991, an unusually large explosion at the volcano's northern slope,accompanied by rumbling sounds and intense new steaming from several vents,prompted the same nuns and Aetas to again call on PHIVOLCS on 3 April.
PHIVOLCS again reacted by immediately dispatched another Quick ResponseTeam which conducted ocular and aerial observations with the assistance of the Officeof Civil defence and the Philippine Air Force. The team found all the reportedmanifestations, as well as a fissure and new craters at the northeast end of an east-westline of steaming vents. The initial assessment of the team was that the explosion was ofhydrothermal origin and from one of the steaming vents on the northern slopes ofPinatubo Volcano. The team was ordered to deploy a seismograph on Pinatubo whenit failed to give a satisfactory answer to the question: “Why were the Aetas bothered
3.2APRIL 1991
3.CHRONOLOGY OF
PINATUBO’S ACTIVITIESAND SCIENTIFIC
RESPONSES3.1
JULY-AUGUST 1990
WMO/UNESCO SUB-FORUM ON NATURAL DISASTER REDUCTION
142
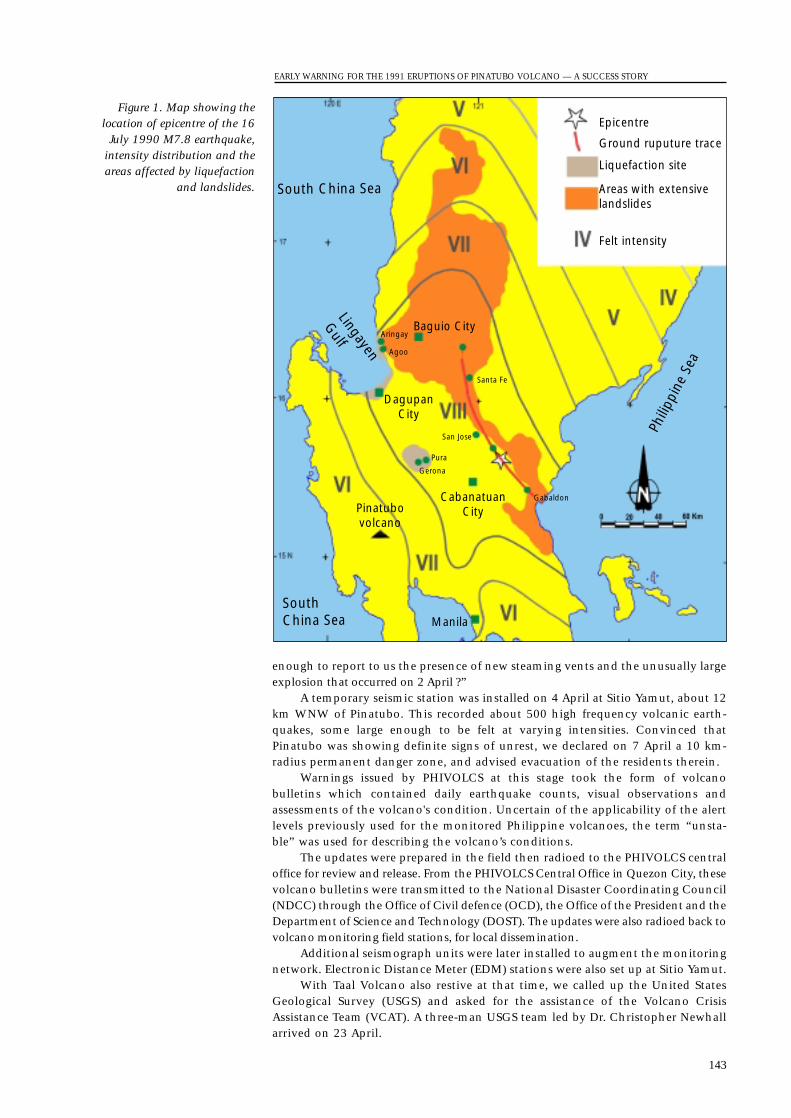
enough to report to us the presence of new steaming vents and the unusually largeexplosion that occurred on 2 April ?”
A temporary seismic station was installed on 4 April at Sitio Yamut, about 12km WNW of Pinatubo. This recorded about 500 high frequency volcanic earth-quakes, some large enough to be felt at varying intensities. Convinced thatPinatubo was showing definite signs of unrest, we declared on 7 April a 10 km-radius permanent danger zone, and advised evacuation of the residents therein.
Warnings issued by PHIVOLCS at this stage took the form of volcanobulletins which contained daily earthquake counts, visual observations andassessments of the volcano's condition. Uncertain of the applicability of the alertlevels previously used for the monitored Philippine volcanoes, the term “unsta-ble” was used for describing the volcano’s conditions.
The updates were prepared in the field then radioed to the PHIVOLCS centraloffice for review and release. From the PHIVOLCS Central Office in Quezon City, thesevolcano bulletins were transmitted to the National Disaster Coordinating Council(NDCC) through the Office of Civil defence (OCD), the Office of the President and theDepartment of Science and Technology (DOST). The updates were also radioed back tovolcano monitoring field stations, for local dissemination.
Additional seismograph units were later installed to augment the monitoringnetwork. Electronic Distance Meter (EDM) stations were also set up at Sitio Yamut.
With Taal Volcano also restive at that time, we called up the United StatesGeological Survey (USGS) and asked for the assistance of the Volcano CrisisAssistance Team (VCAT). A three-man USGS team led by Dr. Christopher Newhallarrived on 23 April.
EARLY WARNING FOR THE 1991 ERUPTIONS OF PINATUBO VOLCANO — A SUCCESS STORY
143
Epicentre
Ground ruputure trace
Liquefaction site
Areas with extensivelandslides
Felt intensity
Phili
ppin
e Se
a
South China Sea
South China Sea
Lingayen
Gulf
Pinatubovolcano
Manila
GabaldonCabanatuanCity
DagupanCity
Baguio City
Gerona
Pura
San Jose
Santa Fe
Agoo
Aringay
Figure 1. Map showing thelocation of epicentre of the 16
July 1990 M7.8 earthquake,intensity distribution and theareas affected by liquefaction
and landslides.
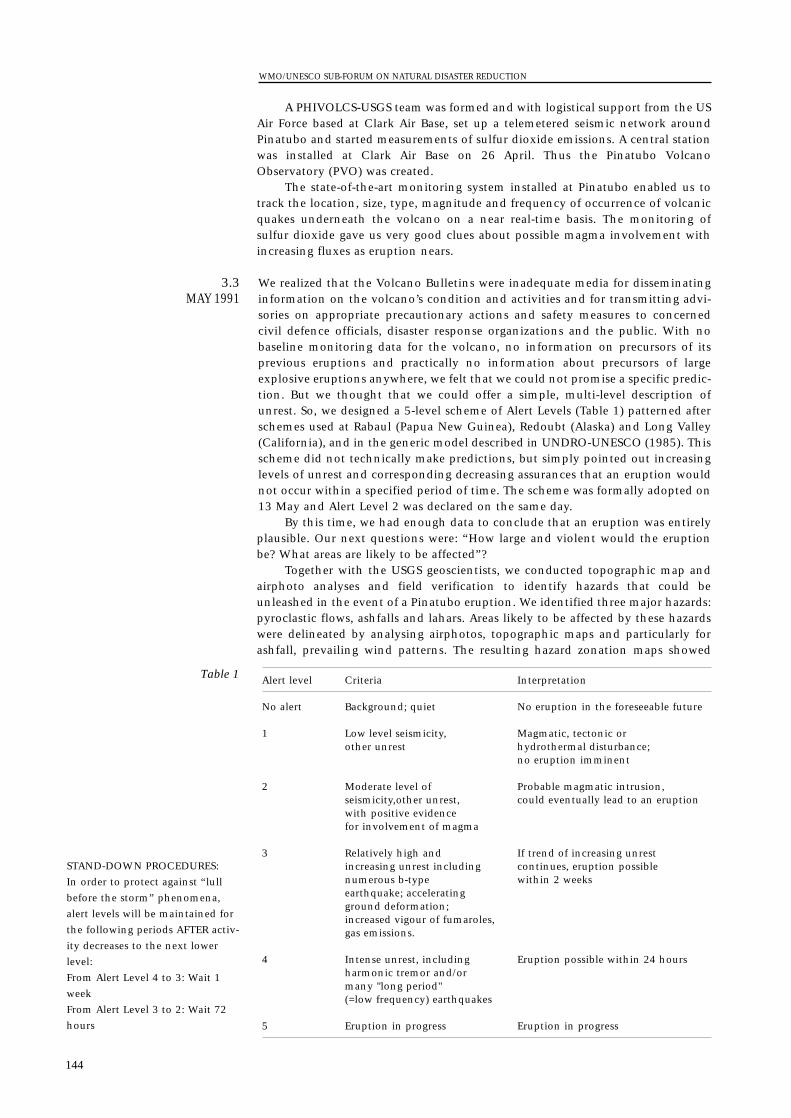
A PHIVOLCS-USGS team was formed and with logistical support from the USAir Force based at Clark Air Base, set up a telemetered seismic network aroundPinatubo and started measurements of sulfur dioxide emissions. A central stationwas installed at Clark Air Base on 26 April. Thus the Pinatubo VolcanoObservatory (PVO) was created.
The state-of-the-art monitoring system installed at Pinatubo enabled us totrack the location, size, type, magnitude and frequency of occurrence of volcanicquakes underneath the volcano on a near real-time basis. The monitoring ofsulfur dioxide gave us very good clues about possible magma involvement withincreasing fluxes as eruption nears.
We realized that the Volcano Bulletins were inadequate media for disseminatinginformation on the volcano’s condition and activities and for transmitting advi-sories on appropriate precautionary actions and safety measures to concernedcivil defence officials, disaster response organizations and the public. With nobaseline monitoring data for the volcano, no information on precursors of itsprevious eruptions and practically no information about precursors of largeexplosive eruptions anywhere, we felt that we could not promise a specific predic-tion. But we thought that we could offer a simple, multi-level description ofunrest. So, we designed a 5-level scheme of Alert Levels (Table 1) patterned afterschemes used at Rabaul (Papua New Guinea), Redoubt (Alaska) and Long Valley(California), and in the generic model described in UNDRO-UNESCO (1985). Thisscheme did not technically make predictions, but simply pointed out increasinglevels of unrest and corresponding decreasing assurances that an eruption wouldnot occur within a specified period of time. The scheme was formally adopted on13 May and Alert Level 2 was declared on the same day.
By this time, we had enough data to conclude that an eruption was entirelyplausible. Our next questions were: “How large and violent would the eruptionbe? What areas are likely to be affected”?
Together with the USGS geoscientists, we conducted topographic map andairphoto analyses and field verification to identify hazards that could beunleashed in the event of a Pinatubo eruption. We identified three major hazards:pyroclastic flows, ashfalls and lahars. Areas likely to be affected by these hazardswere delineated by analysing airphotos, topographic maps and particularly forashfall, prevailing wind patterns. The resulting hazard zonation maps showed
3.3MAY 1991
WMO/UNESCO SUB-FORUM ON NATURAL DISASTER REDUCTION
144
Table 1
STAND-DOWN PROCEDURES:
In order to protect against “lull
before the storm” phenomena,
alert levels will be maintained for
the following periods AFTER activ-
ity decreases to the next lower
level:
From Alert Level 4 to 3: Wait 1
week
From Alert Level 3 to 2: Wait 72
hours
Alert level Criteria Interpretation
No alert Background; quiet No eruption in the foreseeable future
1 Low level seismicity, Magmatic, tectonic orother unrest hydrothermal disturbance;
no eruption imminent
2 Moderate level of Probable magmatic intrusion,seismicity,other unrest, could eventually lead to an eruptionwith positive evidence for involvement of magma
3 Relatively high and If trend of increasing unrestincreasing unrest including continues, eruption possiblenumerous b-type within 2 weeksearthquake; acceleratingground deformation;increased vigour of fumaroles, gas emissions.
4 Intense unrest, including Eruption possible within 24 hoursharmonic tremor and/or many "long period"(=low frequency) earthquakes
5 Eruption in progress Eruption in progress
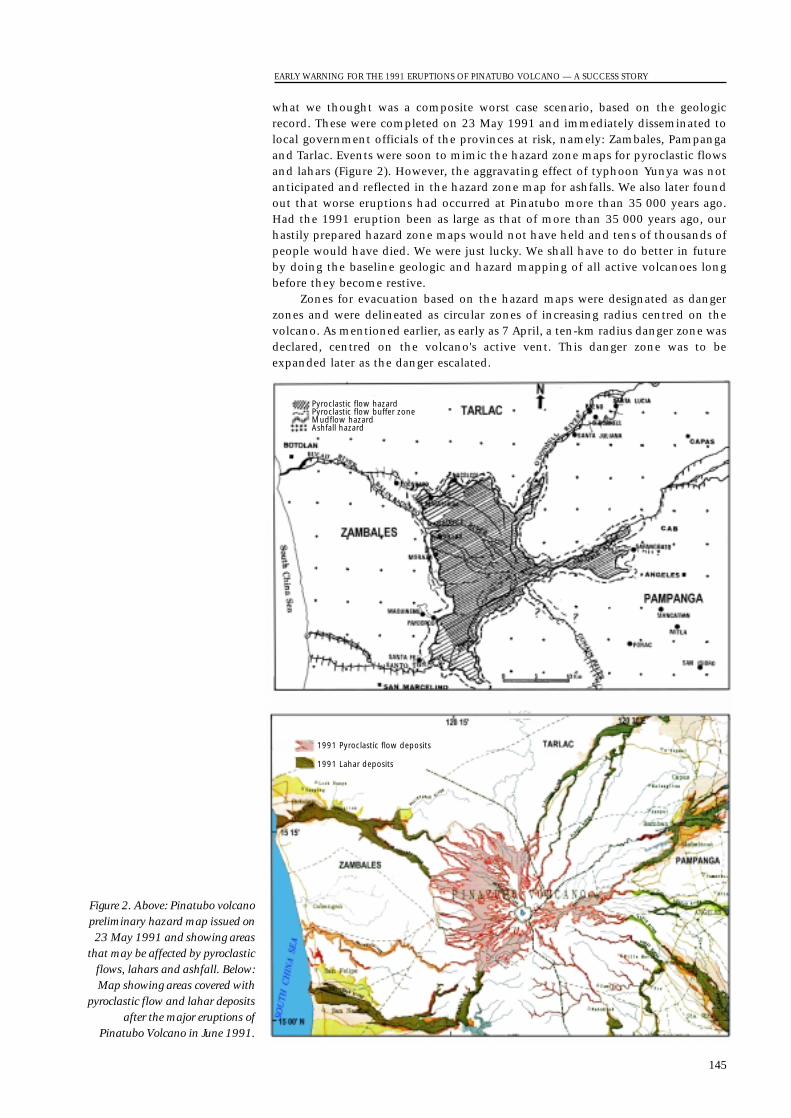
what we thought was a composite worst case scenario, based on the geologicrecord. These were completed on 23 May 1991 and immediately disseminated tolocal government officials of the provinces at risk, namely: Zambales, Pampangaand Tarlac. Events were soon to mimic the hazard zone maps for pyroclastic flowsand lahars (Figure 2). However, the aggravating effect of typhoon Yunya was notanticipated and reflected in the hazard zone map for ashfalls. We also later foundout that worse eruptions had occurred at Pinatubo more than 35 000 years ago.Had the 1991 eruption been as large as that of more than 35 000 years ago, ourhastily prepared hazard zone maps would not have held and tens of thousands ofpeople would have died. We were just lucky. We shall have to do better in futureby doing the baseline geologic and hazard mapping of all active volcanoes longbefore they become restive.
Zones for evacuation based on the hazard maps were designated as dangerzones and were delineated as circular zones of increasing radius centred on thevolcano. As mentioned earlier, as early as 7 April, a ten-km radius danger zone wasdeclared, centred on the volcano's active vent. This danger zone was to beexpanded later as the danger escalated.
EARLY WARNING FOR THE 1991 ERUPTIONS OF PINATUBO VOLCANO — A SUCCESS STORY
145
Pyroclastic flow hazardPyroclastic flow buffer zone
Ashfall hazardMudflow hazard
1991 Pyroclastic flow deposits
1991 Lahar deposits
Figure 2. Above: Pinatubo volcanopreliminary hazard map issued on23 May 1991 and showing areas
that may be affected by pyroclasticflows, lahars and ashfall. Below:Map showing areas covered with
pyroclastic flow and lahar depositsafter the major eruptions of
Pinatubo Volcano in June 1991.
Having devised several ways of expressing the warning messages, our nextproblem was how to make the concerned officials, community leaders andendangered inhabitants appreciate the dangers they faced — at least to the extentthat they could take appropriate defence or protective actions. How could weexplain to them the hazards, the need for action as well as the uncertainties in ourwarnings with possibilities for both false alarms and unpredicted eruptions?
Nagging at us was the tragedy of Nevado del Ruiz in 1985 where 22 000people died as a result of the failure of key officials to heed and act on the hazardassessments and warnings of the scientists (Hall, 1990; Voight, 1990). We weredetermined that such a tragedy would not be repeated but we were faced with asimilar problem. The people at risk and their leaders were understandably scepti-cal as most of them had never heard or witnessed an eruption, Pinatubo had beendormant throughout their and their grandfathers’ lifetime, and such terms aspyroclastic flows, ashfalls and lahars were new to them. So we launched an aggres-sive and intensive education campaign, first among the concerned civil defenceofficials, then among the endangered inhabitants.
We took advantage of briefing sessions for government officials. We foundthat we could catch audience attention most effectively by showing the videoentitled Understanding Volcanic Hazards produced by the late Maurice and KatiaKrafft for the International Association on Volcanology and Chemistry of theEarth's Interior (IAVCEI). The video shows dramatic examples of hot ash flows,ashfalls, lahars, large volcanic landslides, volcanogenic tsunami, lava flows andvolcanic gases. It illustrates the nature of each hazard, how fast and far it travelsand what it does to people and objects on its path. For maximum impact, weshowed only the segments on ash flows, ashfall and lahars during each briefingsession to retain the attention of government officials and because these were themajor hazards that Pinatubo may unleash when it erupts.
We showed the video to as many audiences as we could reach — the thenPresident of the Republic, Corazon C. Aquino, the then Secretary of defence andChairman of the National Disaster Coordinating Council (NDCC) Fidel V. Ramos,Department Secretaries, Governors and other provincial officials, base command-ers, municipal/city officials, students, religious leaders and barangay residents. Wemade about 50 copies of the tape and left a copy with each group that we briefed;an untold number of second generation copies were made. Initial response was,typically, shock and disbelief or denial, but somehow, the tape must have joltedmany viewers into preparing for a possible eruption.
We also had to see to it that the information and warnings we were dissem-inating to higher government and military officials were being transmitted to theinhabitants on the volcano. PHIVOLC usually channeled warnings through theconcerned Disaster Coordinating Council which upon receipt of the warning, setsin motion its machinery for warning transmission and response. In the case ofPinatubo, we reached out to the villages, whenever we could. We conductedintensive information drives among the inhabitants in the barangays just outsidethe Clark Air Base. A similar grassroots educational campaign was also conductedin the villages at the western flank of Pinatubo, by PHIVOLCS staff with the assis-tance of the Franciscan Missionaries of Mary and the LAKAS, an organization ofAytas in Zambales. Our monitoring personnel staying in the villages at risk enter-tained and answered the queries of the villagers.
To expand the coverage of the campaign, we involved the national and localmedia. Press, radio and TV people practically camped at the PHIVOLCS main office andat the field station in Zambales, grabbing every information which they felt would makethe headlines. The quality and actual contributions of media coverage to the pre-eruption education campaign remain to be assessed but there is no doubt that mediainvolvement was a key factor in rapid and widespread dissemination of information.
During the first few days of June, shallow seismicity and the amount of ash in the steamplume gradually increased. The clusters of earthquake epicentres also started to shift fromthe NW to the active vent area and were located at shallower depths. More high frequencyor rock fracturing earthquakes were being recorded but some of these had a lower
3.41-11 JUNE
WMO/UNESCO SUB-FORUM ON NATURAL DISASTER REDUCTION
146
frequency component. On 05 June, SO2 values suddenly decreased, suggesting that somenew material from below was plugging the path of these gases. Some of the steaming ventshad also stopped steaming and ash emission increased. These developments prompted usto raise the alert level to 3, indicating that eruption was “possible within 2 weeks”. On 7June , we raised the alert level to 4 (meaning eruption possible within 24 hours) due tofurther increase in seismicity, and the noticeable shift in the earthquake type —from adominant high frequency to a low frequency type, suggesting shallow earthquake sourceand/or magmatic origin. A telemetered tiltmeter installed at the steaming vent area alsoshowed progressive tilting from 6 to 7 June. A lava dome, measuring about 150 m long,100 m wide and 50 m high was sighted near the most active steam vent the next day. Thisdome was the first visible manifestation that magma had risen to the surface. At this point,we began to question the appropriateness of alert level 4 because technically, dome growthis an eruption in progress.
On 9 June, when the monitoring team in Zambales reported the sighting ofa pyroclastic flow (this was actually a pyroclastic flow-like ash cloud) rolling downthe northwest flank of the volcano, we declared Alert Level 5 (meaning “eruptionin progress”) and recommended a 20 km radius danger zone on all sides of thevolcano. The declaration of Alert Level 5 convinced more people to evacuatebefore the large eruptions actually began. By 10 June, about 25 000 inhabitants,mostly Aytas, were evacuated from the barangays closest to the volcano. Some14 500 US personnel and their dependents were also evacuated from Clark AirBase to Subic Naval Base, leaving behind skeleton security and the Clark Air BaseCommand (CABCOM) personnel.
The evacuation of the endangered inhabitants should have made us feel relaxed,but at that time, it made us feel uncomfortable. Evacuation of large numbers of peopleis costly, and the “eruption in progress” on 9-11 June did not appear to warrant suchmassive evacuation. We were under considerable pressure to prove that our forecastswere correct and that our recommendations were necessary.
When the large explosive eruptions began on 12 June, the volcano spoke mainlyfor itself. At the height of the climactic eruption on 15 June, we expanded thedanger zone radius to 40 km, fearing that a large sector of the volcano edificemight collapse as a result of a large caldera eruption. However, during this time,our monitoring operation was temporarily disabled and radio link was disruptedwhile our personnel were fleeing from the volcano. We re-established our moni-toring station some 25 km northwest of Pinatubo. The enlarged evacuation zonehad been immediately transmitted to the concerned communities with the assis-tance of major radio stations. On 16 June, we were able to tell the country thatthe caldera-forming eruption had already created a 2 km-diameter summit calderaand that the worst had probably passed.
A typhoon happened to pass by on the same day, its winds carryingPinatubo's ash to distant lands. Pinatubo’s ash reached Metro Manila, giving thenations’ policy makers and leaders a direct experience of the eruption and possi-bly inspiring their meaningful responses to the ongoing disaster. Classes in thecity were suspended and the Ninoy Aquino International Airport was closed. Thetyphoon brought rains, wetting the ash that accumulated on roofs, causing roofcollapse. About 200 persons died under roofs that collapsed. The typhoon-triggered lahars claimed more lives in addition to the several dozens who wereburied by pyroclastic flows and the 200 victims of collapsed roofs, increasing thecasualty number to 250-300.
After 16 June, Pinatubo's activities gradually abated. The danger zone was offi-cially reduced to a 20 km radius on 18 June. Most of our warnings and concernsince then until the volcano's renewed activity in 1992 were about lahars andsecondary explosions. The last eruption of 1991, a small puff, occurred on 4September, the same day on which the alert level was lowered from 5 to 3 and the20 km radius danger zone was reduced from to 10 km radius.
On 4 December 1991, the eruption alert level was lowered to 2, but the 10km radius danger zone was retained.
3.616 JUNE - 4 DECEMBER 1991
3.512-15 JUNE
EARLY WARNING FOR THE 1991 ERUPTIONS OF PINATUBO VOLCANO — A SUCCESS STORY
147
Not all the civil defence and public officials and community leaders whom wereached were responsive to our warnings and advisories. Some provincial andmunicipal groups and military commanders remained sceptical until the volcanoproved us right. The most vocal sceptic was the then mayor of Angeles City whorefused to meet with national civil defence officials and USGS-PHIVOLCS scien-tists, and accused us of speaking in ignorance and berating the Americans at ClarkAir Base of overreacting to a non-existent threat !
However, most of the key officials and groups who mattered were responsiveand supportive. First and foremost, the then Chairman of the National DisasterCoordinating Council (Secretary Fidel V. Ramos) who later became President ofthe Philippines, actively participated in promoting mitigation and preparednessamong the local and national officials, nongovernmental organizations andendangered communities. He personally visited the vulnerable communities, heldbriefings and dialogues with concerned officials and saw to it that the Presidentand her Cabinet were informed about the volcano’s activities and potentialhazards. Without being asked, he also gave substantial additional operating fundsto PHIVOLCS for carrying-out monitoring activities with the USGS.
Second, the Administrator of the Office of Civil defence, an engineer, appre-ciated both the value and the uncertainties of scientific investigations, andprovided us considerable support in our monitoring activities as well as in oureducation and information dissemination campaign.
The Regional Disaster Coordinating Council officials of Region 3 and anumber of NGOs, including the Franciscan Missionaries of Mary, were equallysupportive. Several individuals in the commands and ranks at Clark Air Base andSubic Bay Naval Station, supported us and volcano emergency planning in theface of scepticism among their colleagues.
Many media reporters established and maintained strong “friendly” linkswith us and helped us promote public awareness of the impending hazards. Theywere ever present around the volcano during the unrest and crisis and shared andcross-checked with us whatever news or information they gathered in the field. Inthis manner it was possible to avoid causing undue panic among the people atrisk. These reporters also heeded our plea to refrain from venturing into thedeclared danger zone and helped us convince others to comply.
How about the affected inhabitants, how did they respond to the warnings ? Toassess this, a post-eruption survey was conducted by a PHIVOLCS team. Results showthat a majority (58 per cent) took defensive/adaptive action and evacuated immediatelyas and when advised. Communities covered by the LAKAS, an organization of Aytas ornatives, showed the most exemplary operation of the system, namely transmission wastotal and response was consistently appropriate. These communities were reached byinformation drives which featured the showing of the tapes on volcanic hazardsproduced by the Kraffts. Results of the study indicated some weakness in thetransmission system and the failure of some endangered inhabitants to fully appreciatethe risks and take protective action. Those who did not evacuate immediately when,and as advised, gave various reasons, such as: they thought the eruption would not bestrong enough to affect their place; they were reluctant to leave behind their properties,livestock and crops — especially as it was harvest time; they had no ready means oftransport and some community members could not walk long distances; and, theybelieved that their god, Apo Namalyari which is Pinatubo Volcano, would not let themcome to harm (Tayag et al., 1996).
From the positive aspects of the experience, the following insights were high-lighted: the value of state-of-the-art monitoring equipment and techniques,international cooperation, intensive public education on volcanic hazards; theactive involvement of scientists in awareness promotion and warning dissemina-tion; the open and speedy communication lines between the science people onone hand and civil defence officials on the other; and the good relations betweenscientists and the media.
Without the state-of-the-art monitoring equipment loaned (and laterdonated) to us by the USGS and the assistance of our American geoscientist
5.INSIGHTS AND LESSONSFROM THE EXPERIENCE
4.PUBLIC RESPONSE TO THE
PINATUBO WARNINGS
WMO/UNESCO SUB-FORUM ON NATURAL DISASTER REDUCTION
148
friends who spent sleepless nights and hectic days with us to the end, we doubt ifwe could have been able to forecast Pinatubo's activities as accurately as we did.
We also believe that if we had simply confined ourselves to the responsibil-ity of studying, forecasting and releasing warnings and did not take the pains ofeducating the concerned officials, the media and the endangered inhabitants,making them understand/appreciate the hazards, and ensuring that they tookappropriate protective actions — more lives would have been lost and thePinatubo crisis would have created another Nevado del Ruiz tragedy.
From the near-misses or potentially negative aspects, the experience underscoredthe need to conduct geologic database studies and hazard zonation on all activevolcanoes long before the onset of unrest. Had we done these before Pinatubo, we wouldnot have had to cram and prepare hazard zonation maps hastily. The hazard zone mapswould have reflected the worst worst-case scenario which we later discovered, andperhaps the ashfall hazard map would have been more accurate. Many of ourconclusions were tentative, based on the sketchiest of data and review. Our warningsand emergency preparations by civil defence and other officials, were only one stepahead of Pinatubo. We were only lucky that Pinatubo gave us this short lead time, andthen followed a remarkably straight and rapid course toward eruption once we declaredits eruption deadline in our hastily prepared Alert Level scheme.
It is our goal at PHIVOLCS to identify all our active and potentially activevolcanoes, study them in sufficient detail to determine which of them are the mostdangerous and likely to erupt within our lifetime, conduct hazards assessments, producehazards zonation maps and see to it that these are reflected in land use and developmentplans, establish adequate monitoring networks that would enable us to make medium-term, as well as short-term forecasts of these volcanoes’ activities and accordingly issuetimely warnings and appropriate advice to reduce if not prevent volcanic disasters. It isalso our objective to pursue a sustained education and information disseminationprogram to promote and sustain awareness of volcanic hazards and appreciation of theneed for mitigation or prevention.
Ebasco Services Inc, 1977: A report on geochronological investigation of materials relating tostudies for the Philippine Nuclear Power Plant Unit I.
Hall M.L., 1990: The 1985 Nevado del Ruiz eruption: scientific, social and governmentalresponse and interaction prior to eruption. In: McCall G.J.H, Laming D.J.C. and Scott S.(eds) Geohazards. Chapman and Hall, London , pp 43-52.
Newhall C.G, Punongbayan R.S., 1996: The narrow margin of successful volcanic-riskmitigation. In: Scarpa and Tilling (eds) Monitoring and mitigation of volcano hazards.Springer-Verlag Berlin Heidelberg, pp. 808-838.
Punongbayan R.S., 1987: Disaster preparedness systems for natural hazards in thePhilippines: an assessment. In: PHIVOLCS, Geologic hazards and preparednesssystems. PHIVOLCS Press, Quezon City, pp 77-109.
Punongbayan R.S., Newhall C.G., Bautista M.L,P., Garcia D., Harlow R.P., Sabit J.,Solidum R.U., 1996: Eruptive hazard assessment and warnings. In: Newhall C.G.,Punongbayan R.S. (eds) Fire and mud: eruptions and lahars from Mount Pinatubo,Philippines. PHIVOLCS, Quezon City and University of Washington Press, Londonand Seattle, pp 67-86
Ramos A.F., Isada M.G., 1990: Emergency investigation of the alleged volcanic activity ofMount Pinatubo in Zambales Province. PHIVOLCS Memorandum Report,1-2.
Tayag J.C., Cola R., Natividad R., 1985: Socio-economic impacts of the Mayon Volcano 1984eruption. PHIVOLCS Press, Quezon City
Tayag J.C., Insauriga S., Ringor A., Belo M., 1996: People’s response to eruption warning: thePinatubo experience, 1991-1992, Philippines. In: Newhall C.G., Punongbayan R.S. (eds)Fire and mud: eruptions and lahars from Mount Pinatubo, Philippines. PHIVOLCS,Quezon City and University of Washington Press, London and Seattle, pp 87-106.
UNDRO/UNESCO, 1985: Volcanic Emergency Management.UNDRO/UNESCO, pp 1-86.Voight B., 1990: The 1985 Nevado del Ruiz volcano catastrophe: anatomy and retrospection.
J Volcanol Geotherm Res 44:349-386.
REFERENCES
EARLY WARNING FOR THE 1991 ERUPTIONS OF PINATUBO VOLCANO — A SUCCESS STORY
149
REDUCING THE IMPACTS OF TROPICAL CYCLONES DURING THE IDNDR
By Greg J. Holland; Bureau of Meteorology Research Centre; Melbourne, Australia
An overview is provided of the impacts of tropical cyclones and of the activitiesthat have occurred during the IDNDR to help ameliorate these impacts. The focusis on WMO and ICSU activities and their major international activities andachievements. A discussion is provided on tropical cyclone impacts, the WMOand ICSU programs during the decade, major related research programs andefforts to reduce the impacts of tropical cyclones. An outlook for the next decadecompletes the essay.
Tropical cyclones are rightly feared as being amongst the most destructiveweather systems on earth and potentially the most destructive for coastalcommunities in tropical and subtropical countries. The historical toll in humanlife has been huge. Although the death toll has been reduced dramatically duringthis century, more than 125 000 people were killed in Bangladesh as recently as1991. The increasing development and population density in coastal regionsaffected by tropical cyclones has further resulted in an exponentially increasingscale of disruptions and long-term effects to communities, small states and eventhe global economy. A landfall by a severe tropical cyclone on a small islandnation can cause damage that exceeds the GNP of the country and can severelydisrupt the economy for several years afterward. The combination of HurricanesAndrew, Iniki and Omah in 1992 shook the global insurance industry andbrought major companies to the brink of collapse.
“Insurers had at least one ‘billion dollar’ storm event every year from 1987 to
1993. With such an unexpectedly high frequency, some local insurance compa-
nies collapsed, and the international reinsurance market went into shock.”
(Watson et al. 1996, p547)
Here, I provide an overview of the impacts of tropical cyclones and of the activitiesthat have occurred during the IDNDR to help ameliorate these impacts. My overviewfocuses on WMO and ICSU activities as these have been the major internationalcomponents and are the ones with which I am most familiar. I start with a briefdiscussion of cyclone impacts, then describe the WMO and ICSU programs during thedecade. Some major related research programs and efforts to reduce the impacts oftropical cyclones are next described. Finally, I look forward to where we might be goingin the next decade.
Tropical cyclones are characterized by a relatively small core of intense winds andvery low surface pressure surrounded by a decreasing wind field with radius. Thesurrounding winds can extend destruction and disruption over very largedistances of over 1 000 km in extreme cases. The core of an intense systemcontains a clear eye surrounded by a wall of clouds with heavy rainfall and thehigh winds. Farther out are often found major spiral bands of clouds that can alsoproduce heavy rainfall, strong winds and occasionally tornadoes.
Tropical cyclones impact oceanic regions, particularly international shippingand offshore structures, but the major impact occurs when they move over islandsor come ashore and move inland over major land masses. As summarized inFigure 1, the coastal and inland impacts are quite varied.
The intensity of tropical cyclones is universally related to the maximumwinds and the highest observed gusts approach 300 km/h*. These strong windsimpact on structures and the natural environment with a static force that varieswith the square of wind speed. Thus, doubling the wind speed quadruples thestatic forces on structures. Added to this are dynamic forces in which sheddedvortices from overhanging eaves, local wind channeling around obstacles, etc,further increase the loading on structures. A cascade effect of damage due to
2.TROPICAL CYCLONE
IMPACTS
1.INTRODUCTION
ABSTRACT
150
* All extreme values quoted here havebeen referenced in Holland et al., 1993,p9.28
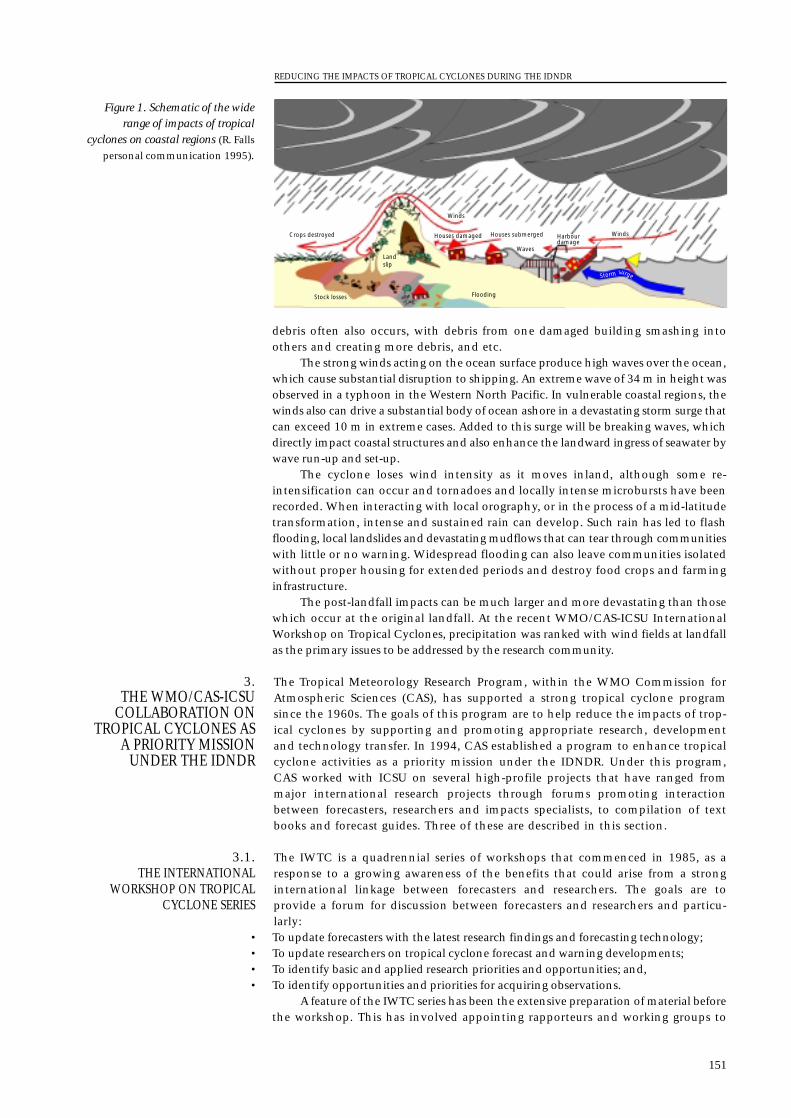
debris often also occurs, with debris from one damaged building smashing intoothers and creating more debris, and etc.
The strong winds acting on the ocean surface produce high waves over the ocean,which cause substantial disruption to shipping. An extreme wave of 34 m in height wasobserved in a typhoon in the Western North Pacific. In vulnerable coastal regions, thewinds also can drive a substantial body of ocean ashore in a devastating storm surge thatcan exceed 10 m in extreme cases. Added to this surge will be breaking waves, whichdirectly impact coastal structures and also enhance the landward ingress of seawater bywave run-up and set-up.
The cyclone loses wind intensity as it moves inland, although some re-intensification can occur and tornadoes and locally intense microbursts have beenrecorded. When interacting with local orography, or in the process of a mid-latitudetransformation, intense and sustained rain can develop. Such rain has led to flashflooding, local landslides and devastating mudflows that can tear through communitieswith little or no warning. Widespread flooding can also leave communities isolatedwithout proper housing for extended periods and destroy food crops and farminginfrastructure.
The post-landfall impacts can be much larger and more devastating than thosewhich occur at the original landfall. At the recent WMO/CAS-ICSU InternationalWorkshop on Tropical Cyclones, precipitation was ranked with wind fields at landfallas the primary issues to be addressed by the research community.
The Tropical Meteorology Research Program, within the WMO Commission forAtmospheric Sciences (CAS), has supported a strong tropical cyclone programsince the 1960s. The goals of this program are to help reduce the impacts of trop-ical cyclones by supporting and promoting appropriate research, developmentand technology transfer. In 1994, CAS established a program to enhance tropicalcyclone activities as a priority mission under the IDNDR. Under this program,CAS worked with ICSU on several high-profile projects that have ranged frommajor international research projects through forums promoting interactionbetween forecasters, researchers and impacts specialists, to compilation of textbooks and forecast guides. Three of these are described in this section.
The IWTC is a quadrennial series of workshops that commenced in 1985, as aresponse to a growing awareness of the benefits that could arise from a stronginternational linkage between forecasters and researchers. The goals are toprovide a forum for discussion between forecasters and researchers and particu-larly:
• To update forecasters with the latest research findings and forecasting technology;• To update researchers on tropical cyclone forecast and warning developments;• To identify basic and applied research priorities and opportunities; and,• To identify opportunities and priorities for acquiring observations.
A feature of the IWTC series has been the extensive preparation of material beforethe workshop. This has involved appointing rapporteurs and working groups to
3.1.THE INTERNATIONAL
WORKSHOP ON TROPICALCYCLONE SERIES
3.THE WMO/CAS-ICSU
COLLABORATION ONTROPICAL CYCLONES AS
A PRIORITY MISSIONUNDER THE IDNDR
REDUCING THE IMPACTS OF TROPICAL CYCLONES DURING THE IDNDR
151
Crops destroyed
Stock losses
Landslip
Winds
WindsHouses damaged Houses submerged
Waves
Harbourdamage
Flooding
Storm surge
Figure 1. Schematic of the widerange of impacts of tropical
cyclones on coastal regions (R. Falls
personal communication 1995).
investigate the state of the science in each of a defined set of topic areas and to submitrecommendations on impediments and opportunities.
During the IDNDR, WMO and ICSU collaborated on two workshops: IWTC-IIIheld in Huatulco, Mexico and IWTC-IV held in Haikou, China. Further, the IWTC-II,held in Manila in the Philippines, had a marked impact on IDNDR activities. Each ofthese workshops produced a large number of recommendations and resulted incollaborations extending across forecast and research activities. Only a brief summaryof a few major outcomes is provided here.
IWTC-II produced two major outcomes: the international research program ontropical cyclone motion, described in Section 3, and the Global Guide to TropicalCyclones (Holland et al., 1993).
The Global Guide utilized the extensive material produced during the firsttwo IWTCs, together with an extensive review of the state of the science, tosummarize available information on tropical cyclone forecasting. The contentscovered all aspects of the forecast requirement, including a global climatology andsummary of warning zones, specific forecast techniques, an extensive bibliogra-phy, and a list of useful facts and figures. The initial book was printed in aloose-leaf format, with the support of the WWW Tropical Cyclone Program, anddistributed free of charge to all forecast offices. Following a recommendation atIWTC-IV the Global Guide has been transferred to a web page <http:www.bom.gov.au/bmrc/meso/New/wmocas_pubs/global_guide/globa_guide_intro.htm>that will be substantially updated over the next few years.
IWTC-III came at the maturation of the intensive international research effort ontropical cyclone motion and the discussion and recommendations reflected thesubstantial progress in knowledge that had been gained from this program. The majoroutcome was the compilation of the publication “A Global Perspective on TropicalCyclones” (Elsberry et al., 1997), an update of “The Global View of Tropical Cyclones”(Elsberry et al., 1987) produced following the first IWTC. The Global Perspectiveprovided an extensive review of the state of knowledge of tropical cyclones. It wasprinted by WMO and distributed free of charge to all forecast offices with tropicalcyclone responsibilities. The collaboration between WMO and ICSU in this meeting alsoled to development of an initial scientific consensus on the potential impacts of climatechange on tropical cyclones (Lighthill et al., 1994).
IWTC-IV saw the changing emphasis on forecasting towards addressing thesocietal impacts of tropical cyclones directly and on ameliorating the effects of tropicalcyclone landfall. The emphasis on societal impacts arose directly from the focus on suchissues arising out of the IDNDR and particularly the Beijing Symposium described in thenext section. The major outcomes of IWTC-IV have been the continued development ofthe “Global Guide to Tropical Cyclone Forecasting”, together with initiation of internationalefforts to directly address tropical cyclone landfall issues.
ICSU and WMO collaborated in convening a major symposium covering both thescientific and societal aspects of tropical cyclones in Beijing in 1992. This was partof the Joint ICSU/WMO Program on Tropical Cyclone Disasters, which recognizedthe vital role that the world scientific community could play in helping to allevi-ate the impacts of tropical cyclones. As with the IWTC series, this symposiumprovided an opportunity for the research, operational and impacts communitiesto meet.
The major outcomes of the meeting were a book, together with severalrecommendations on research and data collection. The book “Tropical CycloneDisasters” (Lighthill et al., 1993) contained 59 papers presented at the meeting.This provides a valuable snapshot of the state of the science at the time andcovered almost all related fields, from observations, to understanding and predict-ing cyclone processes, and to methods of mitigating the cyclone impacts.
The meeting recognized the major uncertainties in both observations andknowledge of the processes operating in the surface spray layer of intense wind regimes.Of particular concern were the complex ocean-atmosphere feedback cycle and itsimpact on cyclone intensity and structure. This recognition has led to a substantialinternational effort addressing the cyclone-ocean interface.
3.2THE BEIJING SYMPOSIUM ON
TROPICAL CYCLONES ASNATURAL DISASTERS
WMO/UNESCO SUB-FORUM ON NATURAL DISASTER REDUCTION
152
The meeting also helped increase research interactions by recommendingvisits from scientists in small countries to major research institutes.
A major outcome of the meeting was the recognition of the need forimproved data to enable better specification of the detailed structure of tropicalcyclones and their near environment. In particular, a strong recommendation wasmade to pursue development of small autonomous aircraft, such as theAerosonde, for use in tropical cyclone reconnaissance. The development of thisaircraft has been one of the more innovative programs under the IDNDR.
The potential impacts of climate change on tropical cyclones have been thesubject of considerable debate both within and outside the scientific community.The IPCC report on the effects of climate change noted the considerable uncer-tainty in our knowledge and concluded that:
"It is not possible to say whether the frequency, area of occurrence, time of occur-
rence, mean intensity or maximum intensity of tropical cyclones will change"
(Houghton et al.,1996, p. 334).
At the same time, Watson et al., (1996) stated that:
"Reinsurers have noted a fourfold increase in disasters since the 1960s. Much of
the rise is due to socioeconomic factors, but many insurers feel that the
frequency of extreme events also has increased." (p. 547)
and that:
"Lack of information about extreme events…makes insurers wary of committing
their capital." (p. 548)
In recognition of the importance of the issue and the fact that the under-standing of tropical cyclone processes had moved rapidly in the period since theIPCC deliberations, the WMO/CAS Working Group on Tropical MeteorologyResearch and ICSU established a steering committee to report on the state of thescience. This committee, consisting of eminent tropical cyclone experts and arepresentative of the Insurance Industry, under the leadership of ProfessorHenderson-Sellers, produced a report to CAS (Henderson-Sellers et al., 1997a) andpublished an article in the Bulletin of the American Meteorological Society(Henderson-Sellers, 1997b). Their main conclusions were as follows:
“Recent studies indicate the MPI of cyclones will remain the same or undergo a
modest increase of up to 10-20%. These predicted changes are small compared
with the observed natural variations and fall within the uncertainty range in
current studies. Furthermore, the known omissions (ocean spray, momentum
restriction and possibly also surface to 300 hPa lapse rate changes) could all
operate to mitigate the predicted intensification.”
“Little … can be said about the potential changes of the distribution of intensi-
ties as opposed to maximum achievable intensity. Current knowledge and
available techniques are too rudimentary for quantitative indications of poten-
tial changes in tropical cyclone frequency.”
“The broad geographic regions of cyclogenesis and therefore also the regions
affected by tropical cyclones are not expected to change significantly. It is
emphasized that the popular belief that the region of cyclogenesis will expand
with the 26°C SST isotherm is a fallacy. The very modest available evidence
points to an expectation of little or no change in global frequency. Regional and
local frequencies could change substantially in either direction, because of the
dependence of cyclone genesis and track on other phenomena (e.g. ENSO) that
are not yet predictable. Greatly improved skills from coupled global ocean-
atmosphere models are required before improved predictions are possible.”
The research on tropical cyclones has continued to move rapidly since 1997and further information is being provided to the new round of IPCC delibera-tions.
3.3TROPICAL CYCLONES AND
CLIMATE CHANGE
REDUCING THE IMPACTS OF TROPICAL CYCLONES DURING THE IDNDR
153
The commencement of the IDNDR occurred in conjunction with the establish-ment of a major international program aimed at improved track forecastingthrough a better understanding of the processes responsible for tropical cyclonemotion. This program was carried out under the WMO/CAS Tropical MeteorologyResearch Program, with major funding support from the US Office of NavalResearch.
The program started with specialist meetings that both defined the scope of theresearch effort that was required and the level of current understanding. Three mainthemes evolved:
• Basic research aimed at understanding the mechanisms of tropical cyclone motion; • Conduct of a series of field experiments in the western North Pacific Region, to both test
a set of hypotheses and to gather data to support the research effort; and,• Transfer of the improved understanding to the forecast community and the
development of forecast techniques.The major early effort was directed towards international collaboration on a field
program in the western North Pacific (Elsberry, 1990). This program, organized underthe auspices of the WMO/CAS Tropical Meteorology Research Program and theESCAP/WMO Typhoon Committee, consisted of four coordinated programs:
• Tropical Cyclone Motion 1990 (TCM-90), conducted by the USA and Australia;• Special Experiment Concerning Typhoon Recurvature and Unusual Motion
(SPECTRUM) conducted by the Typhoon Committee countries; • TYPHOON 90, conducted by the former USSR; and,• The Taiwan Area Typhoon Experiment (TATEX).
The result of these experiments was a data set of unprecedented value forexamining the environmental influences on tropical cyclone motion, together with asurge of research investigations and collaborations. The data were available both in rawform and analyzed into gridded form using specially developed 4D assimilationprocesses. The grid analysis of one typhoon has been used as the basis for anintercomparison of regional models, conducted by the JMA under the WMO/CAS-ICSUWorking Group on Numerical Model Experimentation.
This research identified and examined a range of motion mechanisms, which havebeen reviewed in Wang et al. (1998).
The effects of the interactions between the cyclone and its environment wereextensively investigated in this research phase. These interactions are essentially non-linear and cannot, in general, be clearly separated. However, a conceptual picture similarto that shown in Figure 2 has emerged. In this picture, cyclone motion consists of astable translation, associated with the mean atmospheric flow, with a superimposedsecondary translation and oscillations or transient motion arising from complexinteractions between the cyclone and its environment.
The major process is the steering of the vortex by the environment in whichit is embedded. This is a relatively straightforward process for a uniform environ-ment, being simply the advection of the cyclone vorticity by the general flow. Thedominant environmental interaction (though not necessarily the major one inindividual storms) is the effect of a cyclone rotating across a gradient of earth rota-tion (the Beta effect). In essence, the cyclone generates a set of gyres thatintroduce an additional flow component across the cyclone centre, with a result-ing deviation from the movement that would result from large-scale steeringalone. A number of methods have been derived to attempt to separate out thesetwo processes, but with only marginal success due, largely, to the highly non-linear nature of the process.
Environmental interactions take on a range of guises. If there is a horizontalshear of the wind, then the resulting vorticity gradients can act in a similar senseto the Beta effect. However, in this case, the cyclone also modifies the wind shear,leading to a complex, non-linear interaction that can evolve substantially in time.Vertical wind shear tends to tilt the cyclone initially in the direction of the shear.The tilted vortex then begins to act on itself, with the upper part advecting thelower part and vice versa. In some cases, a large distorted upper cyclone candevelop, which affects the cyclone over a long period. In other cases, the cyclonegoes through a series of small oscillations or loops.
4.MAJOR IDNDR-RELATEDRESEARCH INITIATIVES
4.1TROPICAL CYCLONE MOTION
WMO/UNESCO SUB-FORUM ON NATURAL DISASTER REDUCTION
154
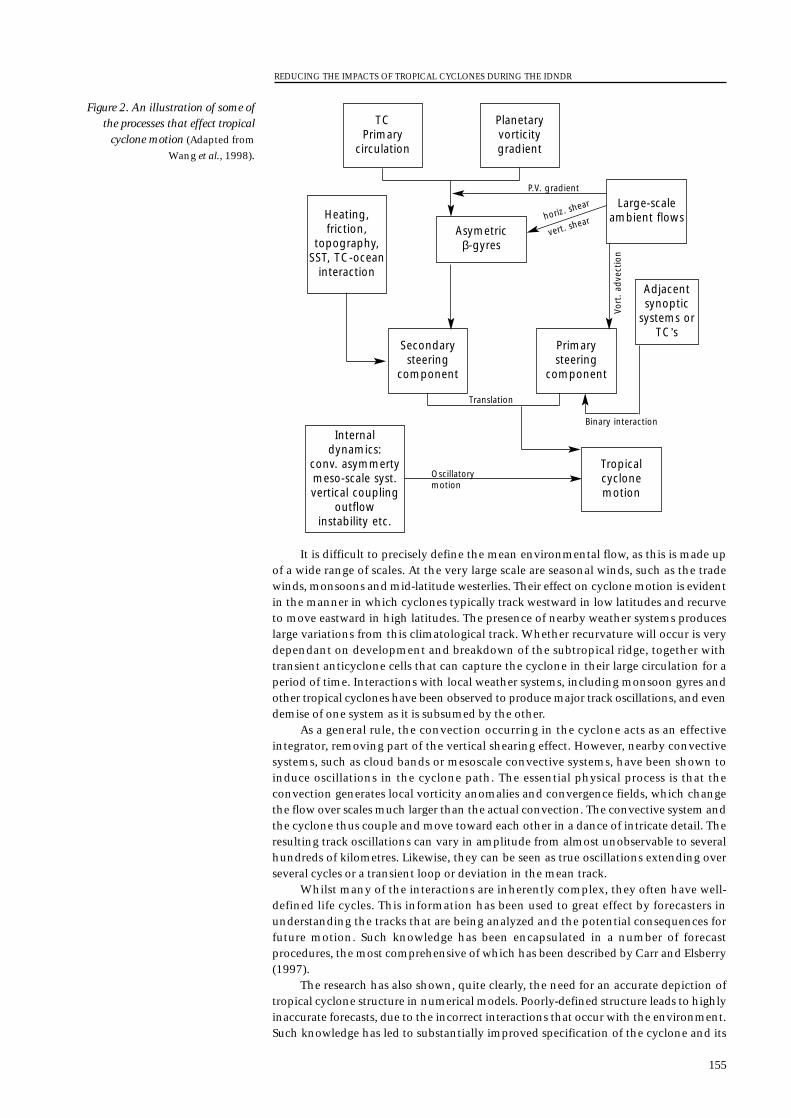
It is difficult to precisely define the mean environmental flow, as this is made upof a wide range of scales. At the very large scale are seasonal winds, such as the tradewinds, monsoons and mid-latitude westerlies. Their effect on cyclone motion is evidentin the manner in which cyclones typically track westward in low latitudes and recurveto move eastward in high latitudes. The presence of nearby weather systems produceslarge variations from this climatological track. Whether recurvature will occur is verydependant on development and breakdown of the subtropical ridge, together withtransient anticyclone cells that can capture the cyclone in their large circulation for aperiod of time. Interactions with local weather systems, including monsoon gyres andother tropical cyclones have been observed to produce major track oscillations, and evendemise of one system as it is subsumed by the other.
As a general rule, the convection occurring in the cyclone acts as an effectiveintegrator, removing part of the vertical shearing effect. However, nearby convectivesystems, such as cloud bands or mesoscale convective systems, have been shown toinduce oscillations in the cyclone path. The essential physical process is that theconvection generates local vorticity anomalies and convergence fields, which changethe flow over scales much larger than the actual convection. The convective system andthe cyclone thus couple and move toward each other in a dance of intricate detail. Theresulting track oscillations can vary in amplitude from almost unobservable to severalhundreds of kilometres. Likewise, they can be seen as true oscillations extending overseveral cycles or a transient loop or deviation in the mean track.
Whilst many of the interactions are inherently complex, they often have well-defined life cycles. This information has been used to great effect by forecasters inunderstanding the tracks that are being analyzed and the potential consequences forfuture motion. Such knowledge has been encapsulated in a number of forecastprocedures, the most comprehensive of which has been described by Carr and Elsberry(1997).
The research has also shown, quite clearly, the need for an accurate depiction oftropical cyclone structure in numerical models. Poorly-defined structure leads to highlyinaccurate forecasts, due to the incorrect interactions that occur with the environment.Such knowledge has led to substantially improved specification of the cyclone and its
REDUCING THE IMPACTS OF TROPICAL CYCLONES DURING THE IDNDR
155
TCPrimary
circulation
Heating,friction,
topography,SST, TC-ocean
interaction
Planetaryvorticitygradient
Large-scaleambient flows
Asymetricβ-gyres
Secondarysteering
component
Tropicalcyclonemotion
Internal dynamics:
conv. asymmertymeso-scale syst.vertical coupling
outflowinstability etc.
Primarysteering
component
Adjacentsynoptic
systems orTC’s
P.V. gradient
Binary interaction
Translation
Oscillatorymotion
Vort
. ad
vect
ion
horiz. shear
vert. shear
Figure 2. An illustration of some ofthe processes that effect tropical
cyclone motion (Adapted from
Wang et al., 1998).
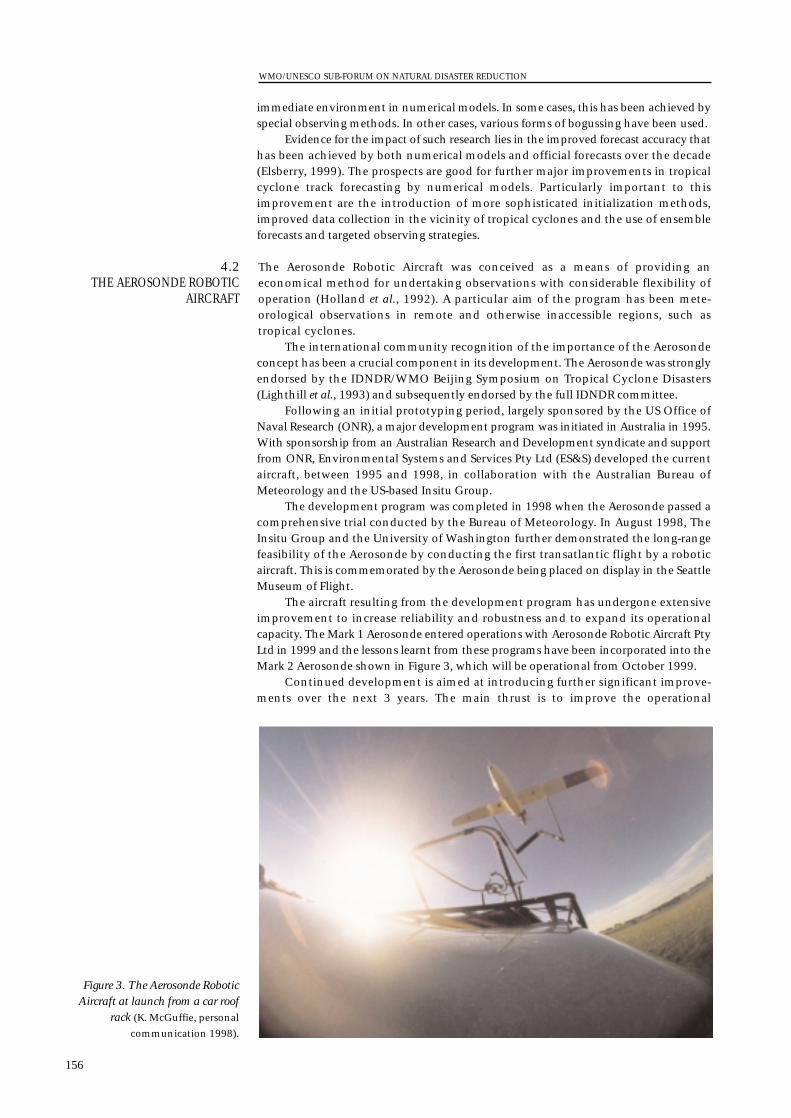
immediate environment in numerical models. In some cases, this has been achieved byspecial observing methods. In other cases, various forms of bogussing have been used.
Evidence for the impact of such research lies in the improved forecast accuracy thathas been achieved by both numerical models and official forecasts over the decade(Elsberry, 1999). The prospects are good for further major improvements in tropicalcyclone track forecasting by numerical models. Particularly important to thisimprovement are the introduction of more sophisticated initialization methods,improved data collection in the vicinity of tropical cyclones and the use of ensembleforecasts and targeted observing strategies.
The Aerosonde Robotic Aircraft was conceived as a means of providing aneconomical method for undertaking observations with considerable flexibility ofoperation (Holland et al., 1992). A particular aim of the program has been mete-orological observations in remote and otherwise inaccessible regions, such astropical cyclones.
The international community recognition of the importance of the Aerosondeconcept has been a crucial component in its development. The Aerosonde was stronglyendorsed by the IDNDR/WMO Beijing Symposium on Tropical Cyclone Disasters(Lighthill et al., 1993) and subsequently endorsed by the full IDNDR committee.
Following an initial prototyping period, largely sponsored by the US Office ofNaval Research (ONR), a major development program was initiated in Australia in 1995.With sponsorship from an Australian Research and Development syndicate and supportfrom ONR, Environmental Systems and Services Pty Ltd (ES&S) developed the currentaircraft, between 1995 and 1998, in collaboration with the Australian Bureau ofMeteorology and the US-based Insitu Group.
The development program was completed in 1998 when the Aerosonde passed acomprehensive trial conducted by the Bureau of Meteorology. In August 1998, TheInsitu Group and the University of Washington further demonstrated the long-rangefeasibility of the Aerosonde by conducting the first transatlantic flight by a roboticaircraft. This is commemorated by the Aerosonde being placed on display in the SeattleMuseum of Flight.
The aircraft resulting from the development program has undergone extensiveimprovement to increase reliability and robustness and to expand its operationalcapacity. The Mark 1 Aerosonde entered operations with Aerosonde Robotic Aircraft PtyLtd in 1999 and the lessons learnt from these programs have been incorporated into theMark 2 Aerosonde shown in Figure 3, which will be operational from October 1999.
Continued development is aimed at introducing further significant improve-ments over the next 3 years. The main thrust is to improve the operational
4.2THE AEROSONDE ROBOTIC
AIRCRAFT
WMO/UNESCO SUB-FORUM ON NATURAL DISASTER REDUCTION
156
Figure 3. The Aerosonde RoboticAircraft at launch from a car roof
rack (K. McGuffie, personal
communication 1998).
capacity of the aircraft, for example by development of the power plants, moreflexible payload capacity, longer range and endurance, higher altitude operation,the addition of satellite communications and incorporation of a range ofimproved ground and airside operational systems.
A crucial component for tropical cyclone observations is the addition of aLow Earth Orbiting (LOE) satellite communications system. Delays in availabilityof the LOE satellite have frustrated attempts to undertake the first cyclone recon-naissance, as the range requirements are too far for the current UHF radio system.As a result, only one mission into the periphery of Severe Tropical Cyclone Tiffany(Western Australia) was accomplished in 1998. It is expected that this system willbecome available in late 1999, leading to the first full tropical cyclone missionssoon after.
Aerosondes are particularly seen as providing an excellent support fortargeted observations both within tropical cyclones and in the surrounding envi-ronment. They will be used to satisfy the requirements of numerical models andto both complement and extend other observing systems such as satellite remotesensing.
Please refer to Elsberry (1999) for a more detailed assessment of these trendsdescribed above.
The decade has been one of contrasts for observing tropical cyclones and relatedparameters. We have seen a sustained threat to essential observing systems, such asradiosondes, together with remarkable progress in others, such as satellites. The realityremains that, over much of the globe, crucial details of the core region of tropicalcyclones are only obtainable by inference and assessment from external parameters.Only the USA retains direct observing capacity for cyclone core region dynamics andrecent observations have shown that there is considerable variability and transientchanges especially in the low-level wind fields.
The Dvorak satellite assessment technique for estimating tropical cyclone intensityis now the international standard. Indeed, much of the cyclone database has beenderived largely from Dvorak analysis. Whilst this has introduced a welcome degree ofconsistency in tropical cyclone analysis, the lack of ground-truth validation in manyregions is of major concern.
Substantial improvements in track forecasting have been achieved through thedecade, largely due to a combination of improved observing systems, numerical modelcapacity and the understanding of relevant processes that has enabled improvedforecaster assessment and proper targeting of forecast improvements. These are analyzedby Elsberry (1999). An indicative figure for the western North Pacific is provided inFigure 4.
There has not been the same level of improvement in forecasting cyclone structureand intensity for which forecasts are barely better than simple climatology can provide.However, numerical models have shown considerable potential for forecasting tropicalcyclone formation in recent years.
WMO members have organized five Regional Specialized Meteorological Centres(RSMC) in a number of strategic locations to promote local sharing of tropical cycloneanalyses and forecasts (Figure 4). Each centre, which is hosted by a national weatherservice, monitors tropical disturbances and provides analyses and forecasts of tropicalcyclones in their area of responsibility. The responsibility for issuing warnings resideswith individual countries and the RSMCs provide analysis and forecast support for theseactivities, as required. Crucial to the successful analysis and prediction of tropicalcyclones is the free distribution of satellite and other data to and from RSMCs andcyclone warning centres.
In addition to the forecast function, the real amelioration of cyclone impactsrequires careful attention to the cultural, social and economic conditions ofaffected communities. Whilst there has been substantial work on such aspects inindividual countries in the past, the IDNDR has seen the growth of a major inter-national effort in this area. The IWTC-IV in 1998 contained a full session onreducing tropical cyclone impacts, and several local programs have been
6.REDUCING SOCIETAL
IMPACTS DUE TOTROPICAL CYCLONE
LANDFALL
5.ANALYSIS AND
FORECASTING OFTROPICAL CYCLONES
DURING THE IDNDR
REDUCING THE IMPACTS OF TROPICAL CYCLONES DURING THE IDNDR
157
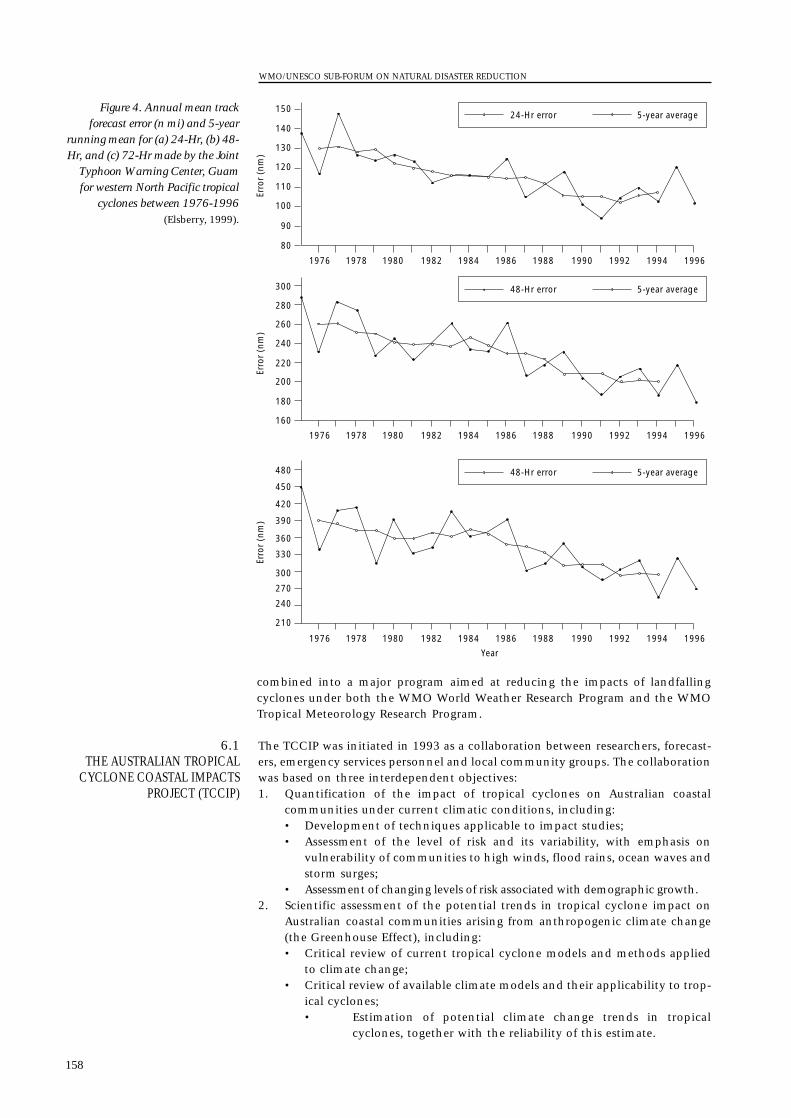
combined into a major program aimed at reducing the impacts of landfallingcyclones under both the WMO World Weather Research Program and the WMOTropical Meteorology Research Program.
The TCCIP was initiated in 1993 as a collaboration between researchers, forecast-ers, emergency services personnel and local community groups. The collaborationwas based on three interdependent objectives:1. Quantification of the impact of tropical cyclones on Australian coastal
communities under current climatic conditions, including:• Development of techniques applicable to impact studies;• Assessment of the level of risk and its variability, with emphasis on
vulnerability of communities to high winds, flood rains, ocean waves andstorm surges;
• Assessment of changing levels of risk associated with demographic growth.2. Scientific assessment of the potential trends in tropical cyclone impact on
Australian coastal communities arising from anthropogenic climate change(the Greenhouse Effect), including:• Critical review of current tropical cyclone models and methods applied
to climate change;• Critical review of available climate models and their applicability to trop-
ical cyclones;• Estimation of potential climate change trends in tropical
cyclones, together with the reliability of this estimate.
6.1THE AUSTRALIAN TROPICAL
CYCLONE COASTAL IMPACTSPROJECT (TCCIP)
WMO/UNESCO SUB-FORUM ON NATURAL DISASTER REDUCTION
158
19961994199219901988198619841982198019781976
150
140
130
120
110
100
90
80
300
280
260
240
220
200
180
160
480
450
420
390
360
330
300
240
270
210
19961994199219901988198619841982198019781976
19961994199219901988198619841982198019781976
24-Hr error 5-year average
48-Hr error 5-year average
48-Hr error 5-year average
Erro
r (n
m)
Erro
r (n
m)
Erro
r (n
m)
Year
Figure 4. Annual mean trackforecast error (n mi) and 5-year
running mean for (a) 24-Hr, (b) 48-Hr, and (c) 72-Hr made by the Joint
Typhoon Warning Center, Guamfor western North Pacific tropical
cyclones between 1976-1996(Elsberry, 1999).
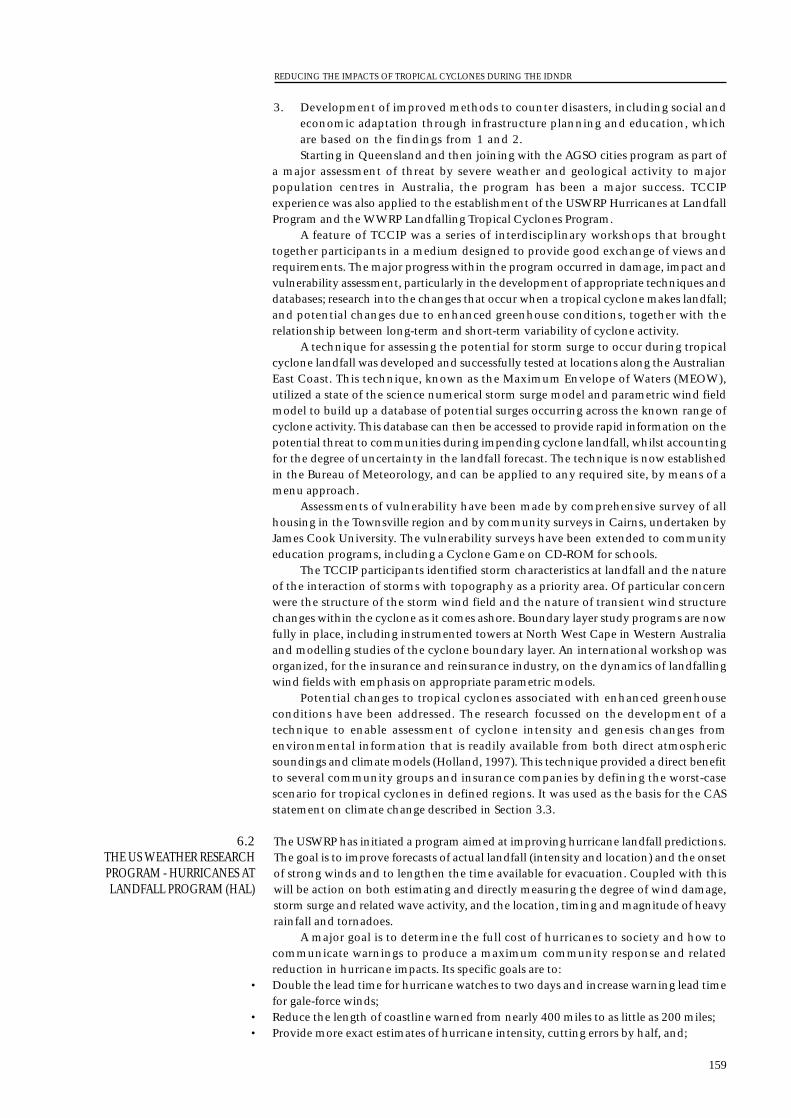
3. Development of improved methods to counter disasters, including social andeconomic adaptation through infrastructure planning and education, whichare based on the findings from 1 and 2.Starting in Queensland and then joining with the AGSO cities program as part of
a major assessment of threat by severe weather and geological activity to majorpopulation centres in Australia, the program has been a major success. TCCIPexperience was also applied to the establishment of the USWRP Hurricanes at LandfallProgram and the WWRP Landfalling Tropical Cyclones Program.
A feature of TCCIP was a series of interdisciplinary workshops that broughttogether participants in a medium designed to provide good exchange of views andrequirements. The major progress within the program occurred in damage, impact andvulnerability assessment, particularly in the development of appropriate techniques anddatabases; research into the changes that occur when a tropical cyclone makes landfall;and potential changes due to enhanced greenhouse conditions, together with therelationship between long-term and short-term variability of cyclone activity.
A technique for assessing the potential for storm surge to occur during tropicalcyclone landfall was developed and successfully tested at locations along the AustralianEast Coast. This technique, known as the Maximum Envelope of Waters (MEOW),utilized a state of the science numerical storm surge model and parametric wind fieldmodel to build up a database of potential surges occurring across the known range ofcyclone activity. This database can then be accessed to provide rapid information on thepotential threat to communities during impending cyclone landfall, whilst accountingfor the degree of uncertainty in the landfall forecast. The technique is now establishedin the Bureau of Meteorology, and can be applied to any required site, by means of amenu approach.
Assessments of vulnerability have been made by comprehensive survey of allhousing in the Townsville region and by community surveys in Cairns, undertaken byJames Cook University. The vulnerability surveys have been extended to communityeducation programs, including a Cyclone Game on CD-ROM for schools.
The TCCIP participants identified storm characteristics at landfall and the natureof the interaction of storms with topography as a priority area. Of particular concernwere the structure of the storm wind field and the nature of transient wind structurechanges within the cyclone as it comes ashore. Boundary layer study programs are nowfully in place, including instrumented towers at North West Cape in Western Australiaand modelling studies of the cyclone boundary layer. An international workshop wasorganized, for the insurance and reinsurance industry, on the dynamics of landfallingwind fields with emphasis on appropriate parametric models.
Potential changes to tropical cyclones associated with enhanced greenhouseconditions have been addressed. The research focussed on the development of atechnique to enable assessment of cyclone intensity and genesis changes fromenvironmental information that is readily available from both direct atmosphericsoundings and climate models (Holland, 1997). This technique provided a direct benefitto several community groups and insurance companies by defining the worst-casescenario for tropical cyclones in defined regions. It was used as the basis for the CASstatement on climate change described in Section 3.3.
The USWRP has initiated a program aimed at improving hurricane landfall predictions.The goal is to improve forecasts of actual landfall (intensity and location) and the onsetof strong winds and to lengthen the time available for evacuation. Coupled with thiswill be action on both estimating and directly measuring the degree of wind damage,storm surge and related wave activity, and the location, timing and magnitude of heavyrainfall and tornadoes.
A major goal is to determine the full cost of hurricanes to society and how tocommunicate warnings to produce a maximum community response and relatedreduction in hurricane impacts. Its specific goals are to:
• Double the lead time for hurricane watches to two days and increase warning lead timefor gale-force winds;
• Reduce the length of coastline warned from nearly 400 miles to as little as 200 miles; • Provide more exact estimates of hurricane intensity, cutting errors by half, and;
6.2THE US WEATHER RESEARCHPROGRAM - HURRICANES ATLANDFALL PROGRAM (HAL)
REDUCING THE IMPACTS OF TROPICAL CYCLONES DURING THE IDNDR
159
• Improve forecasts of inland flooding by 50%. Following an extensive program of discussion and development of priorities and
needs, USWRP’s HAL program identified the following priority research topics:• Pre-landfall track: Crucial for the provision of maximum lead time and accuracy of
landfall.• Pre-landfall wind structure: Important for the warning requirements of onset of gale-
force and higher winds, together with the intensity at landfall.• Landfall wind structure: Provides input to storm surge and damage models.• Landfall precipitation: Local flash flooding and especially combination with storm
surge.• Socioeconomic impact: Especially defining the benefits and costs of the analysis and
warning system, and providing improved warning content.Further information is available at <http://uswrp.mmm.ucar.edu/uswrp.html>.
There is considerable overlap between the objectives of USWRP’s HAL and TCCIPs, andalso with those determined from discussions at the IWTC-IV. This common themeacross many warning systems and cultural requirements means that there is a largeelement of transferability of techniques and research findings. The major advantagethat the USWRP has is access to a remarkable array of observation systems and a highlydeveloped research infrastructure. The goals of the WWRP Tropical Cyclone Landfallprogram are to take advantage of this research and coordinate national activities bydeveloping a set of forecast demonstration projects aimed at illustrating the potentialimprovements in landfall warnings in other regions.
The WWRP was established by the WMO Commission for Atmospheric Sciencesin 1998, following extensive deliberation and discussion on both the need for, and theroles of, such a program. The mission and objectives are:
To develop improved and cost-effective forecasting techniques, with emphasis on high-impact weather, and to promote their application among Member States.
• To improve public safety and economic productivity by accelerating research on theprediction of high-impact weather;
• To facilitate the integration of weather prediction research advances achievedvia relevant national and international programmes;
• To demonstrate improvements in the prediction of weather, with emphasis onhigh impact-events, through the exploitation of advances in scientific under-standing, observational network design, data assimilation and modellingtechniques, and information systems;
• To encourage the utilization of relevant advances in weather predictionsystems for the benefit of all WMO Programmes and all Members;
• To improve understanding of atmospheric processes of importance to weatherforecasting, through the organization of focussed research programmes.
• Identify the types of weather events where multinational research collaboration islikely to lead to improved prediction and associated benefits to participants;
• Develop and apply methods for assessing the cost-benefits of improved forecasts ofhigh-impact weather events, in conjunction with other WMO Programmes;
• Promote, organize and/or endorse research programmes including, wherenecessary, field experiments to develop understanding of weather processesand improve forecasting techniques;
• Organize and lead projects, in conjunction with other WMO Programmes, todemonstrate and objectively verify improvements in weather forecasting accuracy;
• Sponsor technical workshops and conferences to further understanding of thescience and technology involved in improved weather prediction;
• Organize training programmes to ensure that all Members can benefit fromWWRP advances.
A key component of the WWRP activities will be to sponsor forecastdemonstration projects, which can both illustrate the application of research findingsto operations and provide an objective verification of new forecast methodologies.
WWRP Strategies
WWRP Objectives
WWRP Mission
6.3 THE WORLD WEATHERRESEARCH PROGRAM -
TROPICAL CYCLONELANDFALL INITIATIVE
WMO/UNESCO SUB-FORUM ON NATURAL DISASTER REDUCTION
160
Further information can be obtained from: <http://uswrp.mmm.ucar.edu/uswrp/wwrp/reports/Bulletin_WWRP.html>.The WMO/CAS WWRP and TMRP have proposed an international Tropical
Cyclone Landfall initiative with the goal of improving specification of the rainfall andwind field occurring both at the coast and inland as a cyclone makes landfall. This willimplicitly require improved track forecasts and will lead to improvements in secondaryparameters, such as storm surge estimation. This will require a program of research anddevelopment into cyclone intensity and structure changes that accompany landfall,including the potential for rapid intensification. Since the actual impact is cruciallydependent on the landfall location, a continued program of research and developmentinto track is required, but with an emphasis on track processes near landfall.
This program will have several components but will develop from existingprograms on tropical cyclone research, including the long-standing internationalinitiative on tropical cyclone track forecasting coordinated by the US Office of NavalResearch, the USWRP Hurricanes at Landfall Program and the Australian TropicalCyclone Coastal Impacts Project. The aim of the project is to:
• Develop an international research program aimed at improved understanding of theassociated processes;
• Conduct associated field programs, especially in association with USWRP’s HALprogram and the ONR Tropical Cyclone Motion Initiative, both as a basis for theresearch and to provide indications of the likely data requirements for forecasting;
• Specify two or three Forecast Demonstration Projects, covering a range of forecastcapacities, to assess the potential improvements in forecasting resulting fromapplication of the research and development findings and the improved observingsystems.
This program is expected to be one of the major initiatives to be taken from theIDNDR into the twenty-first century.
It is always dangerous to peer into a crystal ball and even more dangerous to putin print what is seen there ! However, the IDNDR decade of the 1990s has seensteady and sustained improvements in the manner in which we forecast, preparefor and mitigate the impact of tropical cyclones. As we move into the nextdecade, a number of trends that will potentially lead to remarkable improvementsare apparent in many aspects of cyclone mitigation.
The first trend is the major research and socioeconomic emphasis that is beingplaced on tropical cyclones. This has occurred through national programs, such as theAustralian Tropical Cyclone Impacts Project and the US Weather Research Program.Interactions between these programs and the newly-established World WeatherResearch Program will strongly focus research and impacts studies on landfallingtropical cyclones and will support transition of the findings to operations throughForecast Demonstration Projects.
The second trend is the enormous increases in computer power and the associatedimprovements in the capacity of numerical models to forecast many components of thetropical cyclone more accurately and to undertake ensemble forecasts aimed at definingthe overall uncertainty in individual forecasts. Associated with this is the potential forimproved weather system observations, by use of satellite and other remote sensing andby direct reconnaissance using robotic systems, such as the Aerosonde. Provided that wecan hold against the considerable economic pressures being exerted on the currentobservation system, we shall move into a new era — one in which we will have anunprecedented opportunity to properly combine observations and modelling in anoptimal mix that can target the regions and observations crucial to the forecast process.
The last, but by no means the least, important trend lies in the combined approachto all aspects of the cyclone mitigation problem. Attention to public education andcommunity preparedness and a full understanding of the true economic and socialbenefits of the cyclone warning system will produce reductions in cyclone impacts farbeyond what could be achieved by forecast improvements alone.
It is likely that improvements in the combined modelling and observation systemwill lead to quite accurate forecasts of cyclone genesis. This is a subtle process, but onethat often seems to be associated with a well-defined, large-scale signature (e.g. Holland,
7.THE NEXT DECADE
REDUCING THE IMPACTS OF TROPICAL CYCLONES DURING THE IDNDR
161
1995). Current model forecasts are already showing considerable skill in this regard.Cyclone track also has substantial potential improvement before the predictability limitis reached. A combination of carefully defined observations and numerical models,supported by statistical combinations of various models or ensembles, can potentiallyhalve current forecast errors, especially over long-time periods.
Current research trends will lead to much better understanding of the transient,and potentially dangerous, processes occurring in the boundary layer of tropicalcyclones, especially those that are making landfall. Making use of this knowledge willpresent a major challenge to warning and communications systems and to the way inwhich society reacts to the warnings.
Perhaps the major continuing difficulty will lie in both fully understanding andpredicting cyclone intensity change. Substantial research into the related mechanismsremains a major requirement. It may well be that, for the next decade, intensity forecastswill continue to be best undertaken by statistical techniques and prudently conservativeforecast strategies.
Carr, L. and R.L. Elsberry, 1997: Systematic and integrated approach to tropical cyclonetrack forecasting. Part I: Overview and environmental structure characteristics.Weather Forecasting.
Elsberry, R. L., 1990: International experiments to study tropical cyclones in the westernNorth Pacific. Bull. Amer. Meteor. Soc., 71, pp. 1305-1316.
Elsberry, R. L., 1995: Tropical cyclone motion. Chap. 4, Global Perspectives on TropicalCyclones, (R. L. Elsberry, Ed.), WMO/TD-No. 693, WMO, Geneva, Switzerland, pp.106-197.
Elsberry, R.L., 1999: Track forecast guidance improvements for early warnings of tropicalcyclones. Potsdam INDNDR Symposium (in press).
Elsberry, R.L. (Ed) 1987: A global view of tropical cyclones. Marine Meteorology Program,Office of Naval Research, 185pp.
Elsberry, R. L., and R. F. Abbey, Jr., 1991: Recent advances in the understanding of tropicalcyclone motion. Tech. Rep. NPS-MR-91-003, Naval Postgraduate School, Monterey, CA93943, 92 pp.
Henderson-Sellers A., G. Berz, R. Elsberry, K. Emanuel, W.M. Gray, C. Landsea, G.Holland, J. Lighthill, S-L. Shieh, P. Webster and H. Zhang, 1997a: Tropical cyclones andglobal climate change: Report from the WMO/CAS/TMRP Committee on ClimateChange Assessment (Project TC-2)
Henderson-Sellers A., G. Berz, K. Emanuel, W.M. Gray, C. Landsea, G. Holland, J.Lighthill, S-L. Shieh and H. Zhang, 1997b: Tropical Cyclones and Global ClimateChange. Bull. Amer. Meteor. Soc., 79, 9-38.
Holland, G.J., T. McGeer and H. Youngren, 1992: Autonomous Aerosondes foreconomical atmospheric soundings anywhere on the globe. Bull. Amer. Met. Soc., 73,1987-1998.
Holland, G.J., 1995: Scale interaction in the western Pacific monsoon. Met. Atmos. Phys.,56, 57-79.
Holland, G.J., 1997: The maximum potential intensity of tropical cyclones. Journal ofAtmospheric Sciences, 54, pp. 2519-2541.
Holland, G.J., ed, 1993: The global guide to tropical cyclone forecasting, WMO/TD-560.World Meteorological Organization, Geneva, 342 pp.
Houghton, J.T., L.G. Meira Filho, B.A. Callander, N. Harris, A. Kattenberg, and K.Maskell, 1996: Climate change 1995: The science of climate change, Contribution ofWorking Group I to the Second Assessment of the Intergovernmental Panel onClimate Change, Cambridge University Press, 572pp.
Lighthill, J., Zheng, Z., G.J. Holland, and K. Emanuel, ed., 1993: Tropical cyclone disasters.Peking University Press, Beijing, 588pp.
Lighthill, J., G.J. Holland, W.M. Gray, C. Landsea, G. Craig, J. Evans, Y. Kurihara and C.P.Guard, 1994: Global climate change and tropical cyclones. Bulletin of the AmericanMeteorological Society, pp. 2147-2157.
Wang, B., R. Elsberry, Y. Wang, and L. Wu, 1998: Dynamics in tropical cyclone motion:A review. Chinese Journal of Atmospheric Sciences, 22, pp. 535-547.
REFERENCES
WMO/UNESCO SUB-FORUM ON NATURAL DISASTER REDUCTION
162

Watson, R.T., M.C. Zinyoweya, and R.H. Moss (eds.), 1996: Climate change 1995: Impacts,adaptations and mitigation of climate change: scientific-technical analyses. Contributionof Working Group II to the Second Assessment Report of the IntergovernmentalPanel on Climate Change, Cambridge University Press, Cambridge, 879pp.
REDUCING THE IMPACTS OF TROPICAL CYCLONES DURING THE IDNDR
163
REVIEW OF SCIENCE, TECHNOLOGY AND POLICY FOR RIVER AND COASTAL FLOODING
By Tauhidul Anwar Khan and Stephen Brichieri-Colombi
This paper looks at the causes and impacts of two natural disasters, river and coastalflooding, through reviews of papers written by people living worldwide and from ourown experience of living and working in Bangladesh. We offer no apology for referringfrequently to Bangladesh as, more than any other country in the world, it has learned toendure the consequences of these twin events which occur with dreadful regularity. Theless well-known fact is that Bangladesh also suffers from water shortage and droughtsin its seven month dry season.
The paper considers the concepts of vulnerability and hazard, and thechanges in our perceptions of them in the light of global climate change.Experiences with physical protection measures, assessing risks and improvingwarning capacities in the major flood events of recent years are discussed, andstrategies for basin wide water resource policies reviewed.
The paper concludes by pointing out the benefits which have accrued inricher countries from investments made long ago over many decades in floodcontrol infrastructure, and the advantages of investment in prevention ratherthan cure for the people still at risk, many of them living in the poorer countriesof the world.
Flooding from rivers is a natural phenomenon that can occur in great and small rivers,and in wet and dry climates and affects great numbers of people around the world. Fourmain types of flooding are recognized these ones:
• Local drainage congestion: This occurs when run-off from local intense rainfallexceeds the capacity of natural or artificial drainage canals, causing them to backup or overflow. The rainfall can be due to an intense storm, cyclone or hurricane.
• Flash flooding: Flooding which occurs in smaller rivers in response to rainfall onan upstream catchment, with a very sudden rise in water level. Frequent in plainsareas close to hilly areas, or in desert wadis.
• Major river floods: Flooding as a result of prolonged rainfall in the river catch-ment, causing a large but relatively slow-moving wave to descend the river,overtopping its banks as it moves downstream
• Surge-induced flooding: Sudden and violent flooding when strong winds causethe sea-level to rise locally due to low pressure and shear forces on the surface, anddrive it into a confined area where a steep fronted wave develops, often movingas a tidal bore many kilometres up estuaries.
The first three types of flooding can occur anywhere where there is rainfallor a major river. Surge, the other topic of this paper, is much more localized,affecting only those who live in coastal areas, where the rather specialized condi-tions behind this phenomenon are created and in the lower reaches of riversdraining to these coasts. However, as a natural disaster, surge is the killer. Riverfloods can cause huge economic losses, but do not kill people on the scale of the300 000 people who died in 1970 on the shores of Bangladesh. In the decade upto 1996, 245 000 people died from floods throughout the world, but 140 000 ofthese deaths occurred in a single surge event, again in Bangladesh, in 1991.
The impact of flooding tends to be described in numbers of events, in flooddamage and in numbers of deaths. The following table clearly shows that in Asia, we dopay not in dollars, but with our lives. A better measure might be damage expressed as aproportion of GNP but even this does not reflect the real impact. When a family iswarned to evacuate in the face of an impending flood in a rich country, it drives off inthe car and files an insurance claim for US $3 000 for carpets and repainting. A familyin a poor country clings to a tree as the family pair of bullocks are drowned and the fewpossessions worth US $300 are washed away, and retreats to the nearest urban slum,never to return. What value is placed on a livelihood lost ?
1. FLOODING AS A NATURAL
HAZARD
ABSTRACT
164
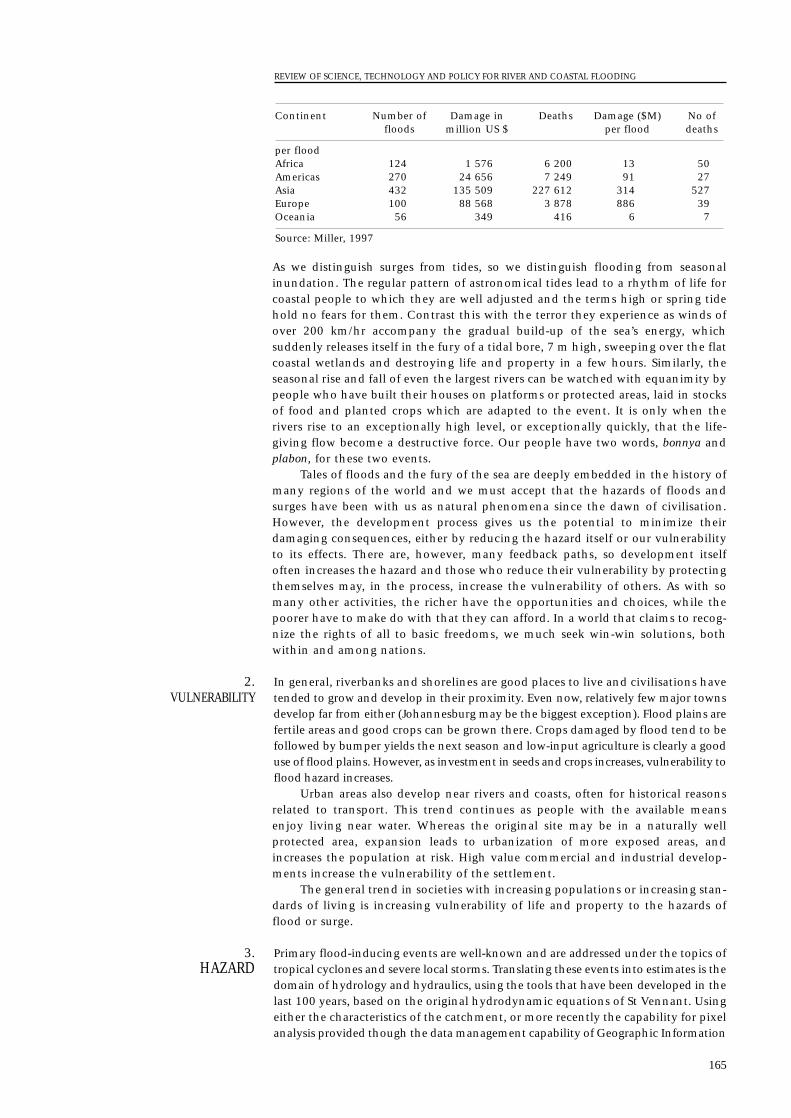
As we distinguish surges from tides, so we distinguish flooding from seasonalinundation. The regular pattern of astronomical tides lead to a rhythm of life forcoastal people to which they are well adjusted and the terms high or spring tidehold no fears for them. Contrast this with the terror they experience as winds ofover 200 km/hr accompany the gradual build-up of the sea’s energy, whichsuddenly releases itself in the fury of a tidal bore, 7 m high, sweeping over the flatcoastal wetlands and destroying life and property in a few hours. Similarly, theseasonal rise and fall of even the largest rivers can be watched with equanimity bypeople who have built their houses on platforms or protected areas, laid in stocksof food and planted crops which are adapted to the event. It is only when therivers rise to an exceptionally high level, or exceptionally quickly, that the life-giving flow become a destructive force. Our people have two words, bonnya andplabon, for these two events.
Tales of floods and the fury of the sea are deeply embedded in the history ofmany regions of the world and we must accept that the hazards of floods andsurges have been with us as natural phenomena since the dawn of civilisation.However, the development process gives us the potential to minimize theirdamaging consequences, either by reducing the hazard itself or our vulnerabilityto its effects. There are, however, many feedback paths, so development itselfoften increases the hazard and those who reduce their vulnerability by protectingthemselves may, in the process, increase the vulnerability of others. As with somany other activities, the richer have the opportunities and choices, while thepoorer have to make do with that they can afford. In a world that claims to recog-nize the rights of all to basic freedoms, we much seek win-win solutions, bothwithin and among nations.
In general, riverbanks and shorelines are good places to live and civilisations havetended to grow and develop in their proximity. Even now, relatively few major townsdevelop far from either (Johannesburg may be the biggest exception). Flood plains arefertile areas and good crops can be grown there. Crops damaged by flood tend to befollowed by bumper yields the next season and low-input agriculture is clearly a gooduse of flood plains. However, as investment in seeds and crops increases, vulnerability toflood hazard increases.
Urban areas also develop near rivers and coasts, often for historical reasonsrelated to transport. This trend continues as people with the available meansenjoy living near water. Whereas the original site may be in a naturally wellprotected area, expansion leads to urbanization of more exposed areas, andincreases the population at risk. High value commercial and industrial develop-ments increase the vulnerability of the settlement.
The general trend in societies with increasing populations or increasing stan-dards of living is increasing vulnerability of life and property to the hazards offlood or surge.
Primary flood-inducing events are well-known and are addressed under the topics oftropical cyclones and severe local storms. Translating these events into estimates is thedomain of hydrology and hydraulics, using the tools that have been developed in thelast 100 years, based on the original hydrodynamic equations of St Vennant. Usingeither the characteristics of the catchment, or more recently the capability for pixelanalysis provided though the data management capability of Geographic Information
3. HAZARD
2.VULNERABILITY
Continent Number of Damage in Deaths Damage ($M) No of floods million US $ per flood deaths
per floodAfrica 124 1 576 6 200 13 50Americas 270 24 656 7 249 91 27Asia 432 135 509 227 612 314 527Europe 100 88 568 3 878 886 39Oceania 56 349 416 6 7
Source: Miller, 1997
REVIEW OF SCIENCE, TECHNOLOGY AND POLICY FOR RIVER AND COASTAL FLOODING
165

Systems (GIS) combined with kinematic wave theory, estimates can be made of theeffects of the passage of a flood of a event of given probability.
These analysis have to be kept continuously up-to-date as land use and flooplain configurations change and the channels change both in plan geometry andin cross-section, due to the continuous processes of erosion, accretion and sedi-mentation. Suites of programmes, now widely available both in the publicdomain and in more sophisticated form within specialist institutes, allowmodellers to calibrate the models to observed conditions at the boundaries andgauging stations, and then extrapolate with new boundaries or river configura-tions. The transport of sediments, pollutants and salinity can be modelled bypost-processing of the output files, thereby facilitating the study of the impacts ofchanges in conditions due, for example, to climate change.
Despite the worldwide concern over global climatic change, there is little evidence of achange in the frequency and severity of primary flood-inducing events such as rainfalland cyclones. However, general circulation models do predict that there will be changesin patterns such as monsoon intensity and duration, as well as increased frequency ofdays with heavy precipitation (Huq et al., 1999). Such predictions tend to be revisedfairly frequently as more parameters are introduced, such as the effect of sulphateaerosols, and it is necessary to view them as potential scenarios rather than forecasts.Under these scenarios, we can expect both flash floods and seasonal floods to increase,but not necessarily in a uniform fashion. Scenarios for northern India, for example,indicate more intense annual floods but little change in lower frequency flooding (e.g.1:20 years flood), for which much non-critical flood protection infrastructure isdesigned.
What effect this will have on flood design infrastructure depends on howrigidly economic principles are followed. Engineers design embankments to mini-mize the sum of capital cost, operation and maintenance costs and expectedannual damage, all capitalized at a certain discount rate which is intended toreflect the opportunity cost of investment capital. In developed countries withlow interest rates in the 2-3 per cent range, the long-term benefits of protectingagainst future conditions will figure significantly in the equation. In poorer coun-tries, development agencies typically require public infrastructure investment toshow a return of 12 per cent, and potential benefits accruing gradually over 25years and beyond are heavily discounted. Unless the poorer countries depart fromcurrently accepted advice and abandon these high discount rates for investmentin flood alleviation infrastructure, they will be left with only the “poor man’ssolution” of flood-proofing. This is particularly ironic given that the causes ofclimate change arise within the richer developed world.
Although there is little evidence that the incidence of cyclones that give riseto surges will increase, many cyclones die before reaching landfall. One effect ofa rise in sea surface temperatures will be that a proportion of those that die underpresent conditions will retain enough energy to reach land, and one recent esti-mate was that the incidence of surge-inducing cyclones could increase by 30 percent (Ali, 1999) as a result. Areas affected by storm surges include India,Bangladesh and Myanmar around the Bay of Bengal; Germany, Netherlands andEngland around the North Sea; and China.
Sea-level rise will increase flooding in estuarial areas of rivers and could haveeffects further inland due to a regrading of river beds. The effect of a sea-level riseof 0.5 m in the Bay of Bengal would be to raise the bed of the Brahmaputra by 15cm for a distance of at least 200 km from the coast (Halcrow, 1995).
Countries with extensive areas of land close to sea-level have tended to buildcoastal polders to protect farmland and this complicates the assessment of theimpacts of sea-level rise on flooding and waterlogging. These polders are drainedby tidal sluices and pumps such as the famous Dutch windmills. Where drainageis by pumps, sea-level rise will increase drainage pumping costs, but only gradu-ally and not by very much. Where drainage is by tidal sluices, the sluices willgradually go out of operation as the tide-locked period increases, requiring moreor larger sluices. Re-investment is unlikely as the economics of farming have
4.TRENDS AND CLIMATE
CHANGE
WMO/UNESCO SUB-FORUM ON NATURAL DISASTER REDUCTION
166
changed since many of polders were built. Governments around the North Sea arerethinking policies in view of high maintenance costs and, indeed, the last polderof the Zuyder Zee in the Netherlands was never drained. In areas aroundChesapeake Bay, polders are already being demolished as environmental costs areweighed against the limited benefits they now bring (Stevenson, 1999).
In Bangladesh, most of the area less than 1m above sea-level is alreadyempoldered, but very few polders have pumped drainage as very large capacitieswould be required to drain monsoon rainfall. The result has been extensive water-logging, a situation which will be aggravated but not necessarily extended. Theresponse has been a change from rice farming to shrimp cultivation in manyareas, a change that has brought about economic gains to a minority and lossesto a majority, leading to severe social impacts.
Sea-level rise will, for many decades, be small in relation to surge and waverun-up, so the direct effect on the design height of embankments and structuressuch as the tidal barriers on the Thames will be small. However, there are situa-tions where indirect effects are significant. Wave run-up is affected by the depthof water on the foreshore and greater depths mean that waves reach embank-ments without having dissipated energy in the approach, thus releasing moreenergy against the structure. In other situations, the dominant direction of theincoming waves may change due to changes in diffraction caused by the changein wave velocity associated with increased water depth and a correspondingchange in the direction of waves reflected by marine structures. Studies usingnumerical and physical models will be needed to assess these effects in individualcases and may well lead to design modifications other than raising structureheights.
The two major structural measures used to control floods are reservoirs and dykes.Reservoirs (and detention ponds) formed behind dams and embankments hold waterback at the peak of the flood for later controlled release. Dykes confine floodwaters intothe river and parts of its flood plain reserved for that purpose.
A 1:100 year flood may be typically 2 to 6 times the magnitude of the meanannual flood (MAF), a 1:1000 year flood 3-15 times MAF. To be effective, floodcontrol dams have to be large, and and are in consequence, expensive. To coverthe cost, they are frequently designed for multi-purpose use, for irrigation andhydropower, and often during project life the structure is operated to raiserevenue. As one South African writer observed:
"Due to the trauma of water managers in seeing crucially important dams reach-
ing levels of less than 20 per cent during drought situations, their inclination is
to operate dams as full as possible" (Sweigers, 1997).
For efficient hydropower, reservoir levels are kept high and flood controlbenefits accrue only at the start of the wet season. Larger reservoirs can be veryeffective in controlling flash floods, which tend to have a small volume but a highpeak that can be attenuated with little rise in reservoir level. Very large reservoirscan regulate for hydropower and flood control simultaneously by smoothingseasonal flows over several years and have the added advantage that they takecenturies rather than decades to silt up, even in areas of high sedimentation suchas the Himalayas.
The High Aswan Dam in Egypt provided a good example of flood control in1988. After eight dry years, the reservoir level was close to minimum operatinglevel when the Blue Nile flooded. Although the flood caused major problemswhen it swept through the suburbs of Khartoum, on arrival at Aswan a few dayslater it merely replenished vital storage instead of sweeping through the streets ofCairo as in former times. Nevertheless, the reservoir is operated entirely for irri-gation benefits, even hydropower being generated as a secondary benefit.
Embanking has been practiced on river like the Po and the Yangtze forcenturies, and the tradition has been continued on rivers like the Mississippi inconjunction with flood storage reservoirs.
The 70 800 km2 basin of the Po lies largely in Italy, but also drains parts ofFrance and Switzerland. Over 1 000 km of levees have been constructed over the
5.PROTECTIVE MEASURES
REVIEW OF SCIENCE, TECHNOLOGY AND POLICY FOR RIVER AND COASTAL FLOODING
167

last 500 years but, despite continuous improvement, they still do not providecomplete protection from floods. Failures of flood control dykes and levees mayoccur through mechanisms such as:
• simple overtopping, when the cumulative level of the flood and wave run-upcause water to spill over the crest;
• erosion, when the velocity of water at the toe of the embankment removes mate-rial from the embankment or the bank on which it is founded;
• seepage, when water seeping from the river through the embankment emergesabove ground level on the landward side, causing the back face to start collapsing,and;
• piping, when water flows through or under the embankment in pipes of weaksandy materials, animal burrows or holes left by old tree roots.
All are still common, the last two being particularly dangerous because oftheir relatively sudden development. Piping can cause failure within 45 minutesof fine sediment appearing at the toe of the embankment (Govi et al, 1996). In1994, almost all the 86 km valley floor of the Tanaro tributary was flooded, andpulse flooding occurred in downstream reaches when logjams of trees and debrisagainst bridges suddenly collapsed.
The “Great Flood” of 1993 on the Mississippi also led to the collapse of alarge proportion of the levees constructed since the eighteenth century to containfloodwater failed, flooding some 6 Mha of farmland and 50 000 homes inhundreds of towns (Ingram, 1996), some of which may never be rebuilt. Thelevees nevertheless prevented damages of US $11.6 billion, against total lossesestimated at US $ 15-20 billion (Miller, 1997).
In China, the Yangtze River has been bounded by levees for centuries butprogressive siltation has caused the bed to rise 5 m above the surrounding plain.When these levees burst, as they did in 1996, they caused the worst flooding fordecades, with 10 Mha of farmland flooded, 5 million homeless and losses of someUS $20 billion.
The evidence suggests that structural protection can confer only partialsafety for people inhabiting the flood plain and must be combined with othermeasures for flood management to be effective. When protection fails, damagescan be increased because of the increased investment made by those living behindthe embankments. Current opinion in Bangladesh is that that full flood controlis neither practicable nor, indeed, desirable for rural areas on environmentalgrounds. However, the benefits of urban protection were obvious to many citydwellers in Dhaka when, in 1998, river flood levels rose to the same levels experi-enced a decade earlier, but large parts of the city were protected by embankmentsbuilt since that time.
The components that the engineer has to consider when designing for flood risk includethe water level with a given probability of occurrence, afflux due to changes in physicalsurroundings, wave run-up, and settlement of the construction and its foundations.Other events may also occur, such as tsunamis, low-frequency oscillations in large lakesor inland seas and collapse of ice or mud dams. Some are interdependent, others not,but in the assessment of risk all may need to be considered.
Methods for the statistical analysis of river floods were introduced intohydrology in the 1920s (Kite, 1963) and the distribution functions developed overthe next 30 years are still used today, with variations in fitting methods. Othertechniques, such as the unit hydrograph and non-linear catchment routingmethods have also been developed to estimate floods. Combined with estimatesof extreme rainfall, these techniques can be used to estimate “maximum” events.These are used in the design of critical structures intended to “never” fail (proba-bility of events 1:100 000 years or greater). There are fundamental philosophicalobjections to the concept of a maximum event and economic design principlesrequire costs to be justified through risk assessment.
The estimation of the risk of surge events is more complicated as there areseveral factors to be taken into account, such as atmospheric pressure, wind speedand direction and time of landfall in relation to the astronomic tide.
6.RISK ASSESSMENT
WMO/UNESCO SUB-FORUM ON NATURAL DISASTER REDUCTION
168
Independently maximising each of these may lead to over investing in structures,which may need to be long and contiguous to be effective. The 1800 km longcoast of China is exposed to tropical cyclones in the south and extratropicalcyclone in the north and different fitting parameters are required for fitting statis-tical models in each zone.
Computer-based deterministic models are also needed, especially for theprediction of specific events in real-time. Methods used in China are reviewed ina 1994 WMO paper (Guo Dayuan et al., 1994), which points out the need formodels to be tailored to the data and financial resources available. Complexmodels can certainly provide improved accuracy, but only if funds are availablefor installation, and operation and maintenance of the sensing equipment.
As noted earlier, computer models are also used to model hydraulic processesbut, in many cases, physical models are required to confirm findings. Few majorflood control structures are built these days without physical models to examinesome aspect of their behaviour, whether it be the influence on currents, scour orwave regime. Both fixed and mobile bed models are used, often requiring largeamounts of space in speciality laboratories in many parts of the world.
Hybrid models, which combine features of both physical models andcomputer simulations, are also being used to assess the interactions of complexevents. The Hybrid Simulation Model (Barthel, 1991) developed at the HydraulicLaboratory in Ottawa is one such example. Such models are particularly impor-tant in view of the work done in Australia (Neilson et al., 1991) on wave set-up,which show large differences between the results of theoretical models and actualmeasurements.
For many people and many situations in throughout the world, the cost of controllingfloods is simply too high to be affordable, or the side effects of the works required toodamaging to the environment. The options are then to avoid habitation anddevelopment of flood prone areas or to devise means to warn people of impendingfloods.
The evidence worldwide is that people will not abandon flood prone areas,whether they are in the flood plains of the Mississippi, the mountains ofHonduras, or the tidal mud flats of the Bay of Bengal. Consequently, the task ofthe water resources planner is to find ways to make life liveable in the floodplains, even if there is considerable risk to life and property. The greatest contri-bution the Government can make is to enable people to save their lives bywarning them of impending floods, and facilitating their evacuation to temporarysafe havens.
There are several components of this activity. Forecasters must be able tomake reasonably accurate forecasts with an appropriate lead time; the informa-tion must be relayed in a reliable manner to the people likely to be affected; andthe people must have a clear idea of what they should do to protect themselveswhen warned.
Flood plain maps, which show the area at risk of flooding with a given prob-ability, provide the most advance warning. Typical maps in use in Canada and theUSA are based on a flood with a return probability of 1 per cent (1:100 years),routed through the current configuration of the flood channel and plain. Variantsinclude maps that show flooding at a given time of year, such as harvest time fora major crop, with a 20 per cent risk, appropriate to agriculture. Such maps allowpeople to improve their own decisions about their investments, whether in afactory or an earth mound on which to build their houses. Flood plain zoninggoes one step further and imposes regulations on the types of activity which canbe carried out in vulnerable areas. This can be unpopular, and can lead to legalaction where it limits profitable developments.
Flood forecasting for rivers can use radar reflections from raindrops to esti-mate rainfall intensity a few hours ahead and routing models to generate real-timeforecasts, which can be updated and recalibrated as the storm event develops.Such systems are in widespread use in countries that can afford them. The systemon the Rhine (Wilke, 1996) includes no less than 19 flood forecasting centres
7. WARNING CAPACITIES
REVIEW OF SCIENCE, TECHNOLOGY AND POLICY FOR RIVER AND COASTAL FLOODING
169
distributed over 5 countries. Other systems use satellite information relayed toground stations in near real-time. One such system, developed in Cairo for theNile (Barrett, 1995), uses satellite observations of cloud temperature readings overthe upper catchment. These are calibrated with data from a few synoptic stationsin Ethiopia and Sudan and used to generate estimates of the flood volume in theBlue Nile and Abara. Such systems are much more affordable and appropriate forlarger rivers with slower response times.
Political difficulties may surround the exchange of the data needed and thisis an area of greatest need in integrated river basin management. Despite meetingsover many years between experts from India and Bangladesh, the release of thedata from the upper catchment of rivers like the Ganges and Brahmaputra,needed to make predictions 72 hours ahead on the major rivers, has still not beenagreed, despite the major benefits this would bring.
An integral part of the system is the telemetry network needed to transmitthe data reliably from the sensors to the modelling centres. Here again satellitesplay a major role, although other ingenious methods are also used, such as meteorburst telemetry, which uses the ionised particles in the trail of small meteorites asa reflector for radio signals.
The key issue is how much time is needed to prepare and disseminate a forecast,and for people to react. Floods on the lower reaches of large rivers and cyclone-inducedsurges can be predicted, but the accuracy diminishes rapidly with increases in lead time.The flood warning agency has to be careful not to issue false warnings, which not onlycause unnecessary disruption but also reduces the credibility of the agency and couldlead to later warnings being ignored.
In poorer countries, there are few options for people without motorizedtransport. They can go to cyclone shelters, stand in the wind and the rain onembankments, or stay and pray for deliverance. It is a sad reality that motherswith teenage daughters will sometimes chose the third option rather than riskharassment in the shelters.
Nevertheless, the programme of construction of shelters on the cycloneprone coast of Bangladesh is held to be the major reason why the death toll of140 000 in 1991, horrifying as it is, was less than the 300 000 in 1970. Conditionsof wind and tide were similar and there had been a 50 per cent growth in popu-lation. The reduction in the number of deaths was, in part, because of improvedwarning systems and the fact that people had somewhere safe to go.
Within the river basin, there is little to be done to reduce the intensity of rainfall orcyclone events. However, flooding is often exacerbated by human use and abuse of theland and it may be possible to do much to mitigate the intensity of flood hazard or thevulnerability of human activities.
It is now commonplace to advocate policies for integrated basin-wide meas-ures to harness water resources and improve land management practices,particularly afforestation of the uplands and control of agriculture. These are seenas complementing structural measures such as dam and embankment construc-tion. A typical flood plain management strategy is shown in Table 2.
Neat presentations of integrated strategies can all too easily conceal somevery hard choices. What may be a satisfactory solution for some may be a muchless satisfactory solution for others. Almost all structural measures require land tobe acquired, and that can mean a dramatic change of life for those affected. Theproblem is made considerably worse if compensation is slow or important aspectsof community social life are destroyed, such as the networking arrangementsupon which many people in developing countries depend.
Structural measures also have environmental impacts. The protection ofarable lands by ring dykes in Bangladesh has impacts upon fish stocks, which arethe main source of protein for its people. Some rivers have silted up and water-logging is widespread in heavily empoldered areas. Any new dam anywhere in theworld is the immediate target for activist groups campaigning on social or envi-ronmental issues. Such concerns are legitimate but must be related to the actualneeds of each country to reconcile conservation and development objectives.
8.BASIN-WIDE WATER
RESOURCES AND LANDMANAGEMENT
WMO/UNESCO SUB-FORUM ON NATURAL DISASTER REDUCTION
170
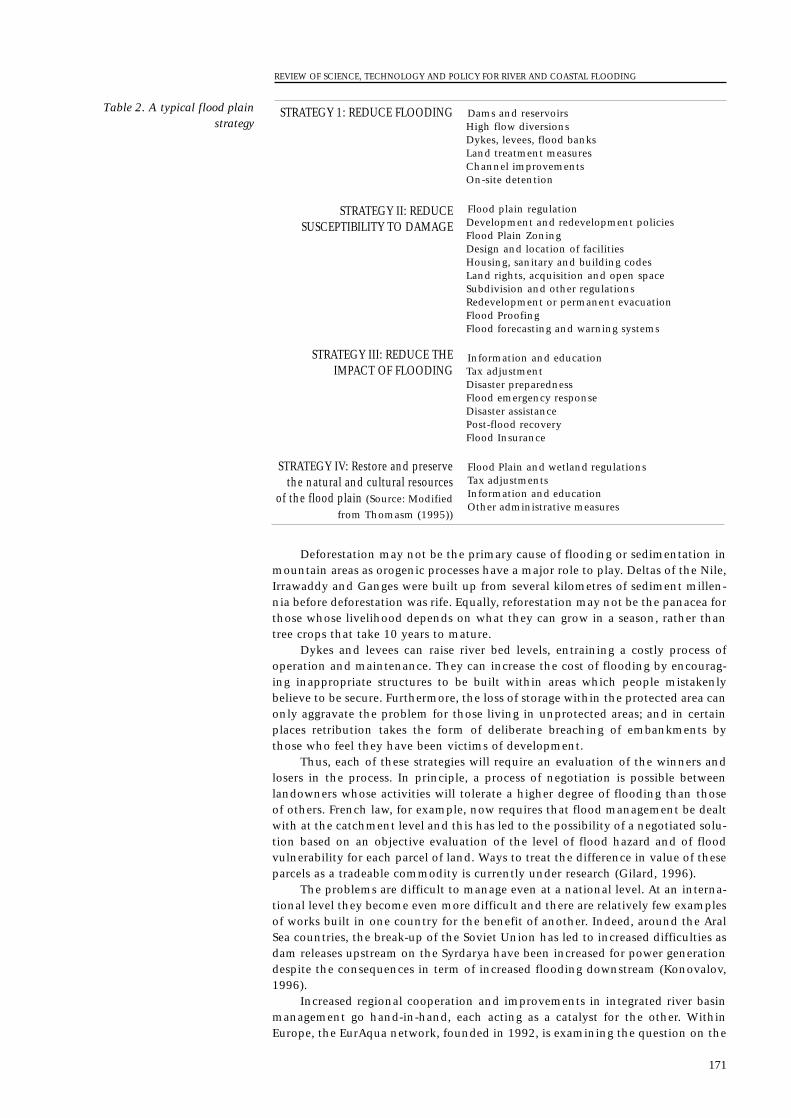
Deforestation may not be the primary cause of flooding or sedimentation inmountain areas as orogenic processes have a major role to play. Deltas of the Nile,Irrawaddy and Ganges were built up from several kilometres of sediment millen-nia before deforestation was rife. Equally, reforestation may not be the panacea forthose whose livelihood depends on what they can grow in a season, rather thantree crops that take 10 years to mature.
Dykes and levees can raise river bed levels, entraining a costly process ofoperation and maintenance. They can increase the cost of flooding by encourag-ing inappropriate structures to be built within areas which people mistakenlybelieve to be secure. Furthermore, the loss of storage within the protected area canonly aggravate the problem for those living in unprotected areas; and in certainplaces retribution takes the form of deliberate breaching of embankments bythose who feel they have been victims of development.
Thus, each of these strategies will require an evaluation of the winners andlosers in the process. In principle, a process of negotiation is possible betweenlandowners whose activities will tolerate a higher degree of flooding than thoseof others. French law, for example, now requires that flood management be dealtwith at the catchment level and this has led to the possibility of a negotiated solu-tion based on an objective evaluation of the level of flood hazard and of floodvulnerability for each parcel of land. Ways to treat the difference in value of theseparcels as a tradeable commodity is currently under research (Gilard, 1996).
The problems are difficult to manage even at a national level. At an interna-tional level they become even more difficult and there are relatively few examplesof works built in one country for the benefit of another. Indeed, around the AralSea countries, the break-up of the Soviet Union has led to increased difficulties asdam releases upstream on the Syrdarya have been increased for power generationdespite the consequences in term of increased flooding downstream (Konovalov,1996).
Increased regional cooperation and improvements in integrated river basinmanagement go hand-in-hand, each acting as a catalyst for the other. WithinEurope, the EurAqua network, founded in 1992, is examining the question on the
REVIEW OF SCIENCE, TECHNOLOGY AND POLICY FOR RIVER AND COASTAL FLOODING
171
Dams and reservoirsHigh flow diversionsDykes, levees, flood banksLand treatment measuresChannel improvementsOn-site detention
Flood plain regulationDevelopment and redevelopment policiesFlood Plain ZoningDesign and location of facilitiesHousing, sanitary and building codesLand rights, acquisition and open spaceSubdivision and other regulationsRedevelopment or permanent evacuationFlood ProofingFlood forecasting and warning systems
Information and educationTax adjustmentDisaster preparednessFlood emergency responseDisaster assistancePost-flood recoveryFlood Insurance
Flood Plain and wetland regulationsTax adjustmentsInformation and educationOther administrative measures
STRATEGY IV: Restore and preservethe natural and cultural resources
of the flood plain (Source: Modified
from Thomasm (1995))
STRATEGY III: REDUCE THEIMPACT OF FLOODING
STRATEGY II: REDUCESUSCEPTIBILITY TO DAMAGE
STRATEGY 1: REDUCE FLOODINGTable 2. A typical flood plainstrategy
“Prevention and management of crisis situations: Floods, droughts and the institutionalaspects” and, using the Rhine as the cornerstone of policy, has identified tenpoints to be followed in practical flood-related management (Lullwitz, 1996).Other forums such as the Mekong Secretariat and the Ganges-Brahmaputra-Meghna Track II initiative are pursuing similar basin-wide goals.
Investments in flood control works are huge and it is vital that they be madecorrectly. Worldwide, about 20 major dams collapse each decade. In a survey bythe US Corps of Engineers, one-third of 9 000 US dams in high-hazard areas weretentatively classified as unsafe, but the cost of bringing them up to current safetystandards is prohibitive. River embankments regularly fail in a variety of modes,sometimes with considerable loss of life. They then have to be reconstructed,often in a hurry, before the next flood season, leaving little time for thoroughinvestigation. Maintenance costs are also high, particularly for embankments onmajor rivers.
Good design is essential, and elaborate test beds mounted on centrifuges arenow being used by US Bureau of Reclamation to examine failure modes and assesssolutions. Other problems can arise on rivers such as the Ganges and theBrahmaputra, where scour depths of up to 60 m are recorded. A recent failure wasattributed to mass movement of sand fill with small amounts of silica, followingvery rapid scour hole development at the toe of the launching apron within a fewweeks of construction.
Food forecasting and flood warning systems are expensive, but considerablyless expensive, and costs are falling as remote sensing systems and telecommuni-cations costs fall. This allows for improvements not only on the forecasting side,but also in the dissemination of information. As real incomes rise around theworld, more and more people have access to radio and television, more roads arebuilt, and more safe havens can be provided.
There are still major uncertainties about the combined effects of wind, surgeand river flow. In 1998, we in Bangladesh experienced the most severe long dura-tion flood in our history, a flood aggravated by a significant rise in sea-level(compared with the astronomical tide) in the Bay of Bengal for a 40-day period.The cause has yet to be identified.
The likelihood of a major pay-off from increased research is high, particularlyif this is linked to field trials of promising solutions. Recent years have seen greatlyincreased use of complex geotextiles in river and marine embankment works.These expensive materials are fabricated to exact specifications according to thegeotechnical properties of the soils and exposure to abrasion. Other materials,blending artificial fibres with natural ones such as jute, could reduce costs andoffer environmental advantages. In Bangladesh, we have been building pilot proj-ects with costs from $300 to $10 000 per metre and annual maintenance costs of5 to 20 per cent but, even so, have no guarantees we can keep our major riversstable. Research into new and cheaper solutions is desperately needed.
Options to reduce damage by flood may be summarized as:• Keep the flood away from people — control or reduce the flood, through
structural and catchment management;• Keep people away from the flood — use flood zoning and judicious practices
in the flood plains, and help them find shelter when floods occurThe costs of the first option are huge and, if some of the possible scenarios
for global climate change materialize, will increase rather than decrease. As recentfloods in Europe and the USA have shown, even the richest countries of the worldare unable to construct works that provide full protection. But it is the failuresthat make the headlines, the exceptional circumstances when floods exceeddesign standards which are a compromise between a desire for complete safetyand limitations on the budget available to pay for it. The successes go unrecordedwhen, year after year, all but the most extreme floods are contained. In theseyears, economic activity continues and expands, creating the wealth to repay theearlier investment.
10.OPTIONS FOR FLOODMANAGEMENT AND
CONTROL
9.RESEARCH AND CAPACITY
BUILDING
WMO/UNESCO SUB-FORUM ON NATURAL DISASTER REDUCTION
172
The investment costs of the second option are rather less, although the tollin human misery is greater, and this tends to be the poor man’s solution.However, one great turning point may be approaching, as the growth rate in thepopulations of LDCs slows to the point (as in Bangladesh) where rural growthrates are outstripped by urban migration. As a result, the pressure to live on theflood plains may reduce, or at least stop expanding, and judicious policies mayfinally be given a chance to work effectively. However, lower investment bringslower returns and the penalty is reduced economic activity at a time when expan-sion is needed.
However, in the developing countries today, we are being advised to adopt athird option “clean-up afterwards”, — i.e., to use all means possible, includinginsurance and post-flood assistance and rehabilitation, to get people back on theirfeet. Countries hit by flooding depend on each other for post-flood recovery andone of the more encouraging sights of the twentieth century has been the will-ingness of governments to come to the assistance of those in need. Offers of helpby countries with military personnel and equipment, NGO’s and relief organiza-tions and dispersal of food, medical supplies and shelter are greatly welcomed.These cement understanding and humanitarian concepts and will probablyalways be a necessary part of the solution. The post-flood rehabilitation inBangladesh this year has been enormously aided because of the timely assistancewhich enabled people to replant immediately after the floodwaters receded andbring in a bumper spring rice crop.
The flood-affected nations, and the people directly affected, must be gratefulfor assistance in the clean-up option, but how much better it would be if moneywhich seems to flow so freely after a disaster has hit could be made availablebefore hand. Used wisely to invest in either of the first two options, it would showa far higher rate of return, improve standards of living and the quality of life forpeople now reduced to depending on others to survive the hazards of flooding.
These arguments point to the potential benefit from investment intoimproved designs and warning systems and to the need for strengthening thecapacity of organizations to manage the entire flood mitigation and preparednessprocess. Such investment needs to be on a broad front, for people living in allcountries, not just those in developed countries. Let us remember that “rich man’ssolutions” were being built 100-200 years ago in countries which were no richerthen than poor countries are today. The difference is that, then, there were no richcountries telling them what they could or could not afford. They were simplybuilding for a better future, and their children, and their children’s grandchildren,are the beneficiaries. We, in this generation, are trying to improve our manage-ment of natural disasters, and we must create a comparable legacy for our ownchildren.
Ali. A., 1999: Impacts of global warming on tropical cyclones and storm survey in Bangladesh.International seminar on sea-level rise and sustainable coastal management, Dhaka,March 1999.
Barrett C.B., 1993: The development of the Nile hydrometeorological forecast system.Barthel V., 1991: Hybrid modelling techniques for the simulation of extreme events in
tidal rivers. Intl. workshop on storm surges, river flow and combined effects,Hamburg, 1991.
Gilard O., 1996: Flood risk management: risk cartography for objective negotiations.Proc. Sem. River Flood Disasters, Koblenz, 1996.
Govi M. and O. Turitto, 1996: Recent floods and past experience in northern Italy.Proc. Sem. River Flood Disasters, Koblenz, 1996.
Guo Dayuan and Wang Juemou, 1994: Methods for estimating and forecasting floodsin areas affected by tides and storm surges. WMO Technical Reports in Hydrologyand Water Resources, WMO/TD-644, 1994.
Halcrow Sir W.,1995: Brahmaputra river training studies. Gov. of Bangladesh, WaterDevelopment Board, 1995.
Huq S. et al., 1999: Vulnerability and adaptation to climate change in Bangladesh.Bangladesh Centre for Advance Studies, Kluper, 1999.
REFERENCES
REVIEW OF SCIENCE, TECHNOLOGY AND POLICY FOR RIVER AND COASTAL FLOODING
173
Ingram J.J., 1996: Lessons taught by floods in the USA. Proc. sem. river flood disas-ters, Koblenz, 1996.
Kite J.W., 1963: Frequency and risk analysis in hydrology.Konovalov V.G. et al., 1996: Natural and man-made floods in the river basins of
Central Asia. Proc. sem. river flood disasters, Koblenz, 1996.Lüllwitz T., 1996: Report on the results of the European workshop. Proc. sem. river
flood disasters, Koblenz, 1996.Miller J.B., 1997: FLOODS: People at risk, strategies for prevention.Neilson P. and P.G. Evans, 1991: Wave set-up on beaches and river entrances. Intl.
Workshop on storm surges, river flow and combined effects, Hamburg, 1991.Stevenson J. C.,1999: Personal communication. U. Maryland.Sweigers C.G., 1996: Flood management in South Africa. Proc. sem. river flood disas-
ters, Koblenz, 1996.Thomas F.H., 1995: Principles of flood plain management. In J. Gardiner et al.,
Defence from flood and flood plain management, Kluwer Academic Publishers,Dordrecht.
Wilke K., 1996: Operational flood forecasting in the River Rhine basin. Proc. sem. riverflood disasters, Koblenz, 1996.
WMO/UNESCO SUB-FORUM ON NATURAL DISASTER REDUCTION
174

PROCEEDINGS OF THE WMO/UNESCO SUB-FORUM ON SCIENCE AND TECHNOLOGY IN
SUPPORT OF NATURAL DISASTER REDUCTION
Geneva, 6-8 July 1999
UNITED NATIONS EDUCATIONAL, SCIENTIFIC AND CULTURAL ORGANIZATION
WORLD METEOROLOGICAL
ORGANIZATION
PRO
CEE
DIN
GS
OF
THE
WM
O/U
NES
CO
SU
B-FO
RUM
ON
SC
IEN
CE
AN
D T
ECH
NO
LOG
Y IN
SU
PPO
RT O
F N
ATU
RAL
DIS
AST
ER R
EDU
CTI
ON
WMO