Proceedings of the Utah Water Pollution Control Association ...
129
Utah State University Utah State University DigitalCommons@USU DigitalCommons@USU Reports Utah Water Research Laboratory January 1977 Proceedings of the Utah Water Pollution Control Association Proceedings of the Utah Water Pollution Control Association Annual Meeting 1977 Annual Meeting 1977 James H. Reynolds Donna H. Falkenborg Follow this and additional works at: https://digitalcommons.usu.edu/water_rep Part of the Civil and Environmental Engineering Commons, and the Water Resource Management Commons Recommended Citation Recommended Citation Reynolds, James H. and Falkenborg, Donna H., "Proceedings of the Utah Water Pollution Control Association Annual Meeting 1977" (1977). Reports. Paper 136. https://digitalcommons.usu.edu/water_rep/136 This Report is brought to you for free and open access by the Utah Water Research Laboratory at DigitalCommons@USU. It has been accepted for inclusion in Reports by an authorized administrator of DigitalCommons@USU. For more information, please contact [email protected].
-
Upload
khangminh22 -
Category
Documents
-
view
0 -
download
0
Transcript of Proceedings of the Utah Water Pollution Control Association ...

Utah State University Utah State University
DigitalCommons@USU DigitalCommons@USU
Reports Utah Water Research Laboratory
January 1977
Proceedings of the Utah Water Pollution Control Association Proceedings of the Utah Water Pollution Control Association
Annual Meeting 1977 Annual Meeting 1977
James H. Reynolds
Donna H. Falkenborg
Follow this and additional works at: https://digitalcommons.usu.edu/water_rep
Part of the Civil and Environmental Engineering Commons, and the Water Resource Management
Commons
Recommended Citation Recommended Citation Reynolds, James H. and Falkenborg, Donna H., "Proceedings of the Utah Water Pollution Control Association Annual Meeting 1977" (1977). Reports. Paper 136. https://digitalcommons.usu.edu/water_rep/136
This Report is brought to you for free and open access by the Utah Water Research Laboratory at DigitalCommons@USU. It has been accepted for inclusion in Reports by an authorized administrator of DigitalCommons@USU. For more information, please contact [email protected].

PROCEEDINGS OF THE
UTAH WATER POLLUTION CONTROL ASSOCIATION
ANNUAL MEETING
AprU21.22,1fJ17 Salt Lake City, Utah
CompUedby James H. Reynolds and DOIID8 H. Falkenborg
Utah Water Research Laboratory College of Engineering Utah Su..te UnlYenity Logan, Utah 84322
AprU 1977
- ------ - - --:.. - -=----

Preface
This volume is the first published proceeding of the Utah Water Pollution Associations Annual Meeting. The Technical Program of the Annual Meeting was divided into five separate sessions. The program was developed to attract individuals concerned with management, design and operation of wastewater treatment facilities. Special emphasis was given to the design and operation of wastewater ffitration devices.
Unfortunately, four papers are not included in the proceedings because the authors failed to meet the submission deadline. These papers are (1) "Utah Discharge Requirements" by Calvin Sudweeks, (2) "Chlorine. CoJiforms, 1977 Standards and You" by Robert A. Sperling, (8) "Panel Discussion" by Ken Watson, and (4) "Panel Discussion" by Michael Miner. One additional paper entitled "Problems of Mounting a Major Water Pollution Control Program" by Martin Lang is not included in the proceedings due to personal eommittment as National Vice President of the Water Pollution Control Federation.
The Technical Program Committee greatly appreciates the time and effort expended by the authors and advertisers who made these proceedings possible.
IU
J(].ffI£8 H. Reynolds Program Chairman

Proeeedingsofthe
UTAH WATER POLLUTION CONTROL ASSOCIATION
Annual Meeting held
April 21.22, 1977 Salt Lake City, Utah
Compiled by
Jam. H. Reyaolda and Donna H. FaIkeDborg
UTAH WATER POLLUTION CONTROL ASSOCIATION
President, E. Joe Mld6broob President Elect, Garth Morpa
Vice President, LaVen B. Merritt Past President, Lloyd S. Mulyey
Secretary-Treasurer, Norman B. Jones National Director, ROIeOe Godfrey
Association Directors. David B. Brinton, Gayle Lanon, Dean Wheadon
1977 UWPCA TECHNICAL PROGRAM COMMITI'EE
Chairman, Jbn Reyaolda Members, BW Laee
JIm CbamholDl Steve Moehbnann
DonO.tler DayeNeIIon
Utah Water Reseueh Laboratory College of Enatneerlng Utah State UnlYenlty Logan, Utah 84322
April 1977

Table of Contents
SESSION I
UTAH DISCHARGE REQUIREMENTS Calvin SudweekB (Paper Not Available)
IUSTORY OF WASTEWATER TRAINING IN UTAH Stephen·E. MoelUm.ann .......................................................... .1
THE UTAH ENVIRONMENTAL SYSTEMS OPERATION TRAINING PROGRAM-A FIRST PROGRESS REPORT N 01'1'IlI1.'¥& B. Jones ............. . . . . . . . . . . . . . . . . . . . . . . . . . . . . . . . . . . . . . . . . . . . . . . . . .. 9
SESSIOND
PLANT START-UP OF THE SALINA. UTAH, SEWAGE TREATMENT PLANT Dougl48 D. Drury, W'tlIiam J. Spear'. and Robe" M. McEO'Il1'4 . ......................••••...•........................•.............. 15
CHLORINE, COLIFORMS, urn STANDARDS AND YOU Robe" A. Sperling (Paper Not Available)
PANEL DISCUSSION Ken Watson and Michael MVJer (Papers Not Available)
208 AND REGIONALIZATION IN MOUNTAINLAND Stephen E. 8o'wby ............................................................. 19
WASTEWATER FILTRATION, DESIGN CONSIDERATIONS E. Robe" Baulmann ............................................................ 21
SESSIONm
INTERMITTENT SAND FILTER OPERATION J. H. Re'l/1WlIU. S. E. Harris, D. W. Hill, D. S. Filip, antlE. J. MiddlebrookB ......................................................... 89
MANAGEMENT ALTERNATIVES FOR TRAINING WASTEWATER TREATMENT PLANT OPERATORS Robe" A. Gearheart ........................................................... 45
PROBLEMS OF MOUNTING A MAJOR WATER POLLUTION CONTROL PROGRAM Martin Lang (Paper Not Available)
SEWER USE CHARGES Richard A. Johnston ........................................................... 51
PRETREATMENT OF INDUSTRIAL WASTEWATER AT lULL AIR FORCE BASE ColonelHarry C. R'US8ell . ................................ " ..................... 55
UTAH POWER AND LIGHT CO. WASTEWATER HANDLING SYSTEMAT GADSBY AND HUNTINGTON PLANTS K. M. Neusch'UJ(Jnaer ........................................................... 63

Table of Contents (Continued)
BIOLOGICAL TREATMENT OF PETROCHEMICAL AND REFINERY WASTES Davis L. Ford .................................................................. 67
SESSION IV
.GLEANING. TV INSPECTION AND REHABILITATION OFSANITAaY SEWER LINES C. Sketc/r.le'll aM James J. King . ................................................. 77
FLOW REDUCTION BY PIPE INSERTION RENEWAL AT HEBER,UTAH Carl H. Carpenter . ............................................................. 79
EXPERIENCES IN WASTEWATER FILTRATION WITH THE LOW HEAD AUTOMATIC BACKWASH FILTER (ABW) 1l0fUlld F. Ctdp ................................................................ 86
DESIGN CONSIDERATIONS FOR FILTRATION Of' SECONDARY EFFLUEN'l' William R. Kirkpatrick aM NiclwlJu L. Presecan . .................................. 89
WHY SETTLE FOR ONLY SECONDARY TREATMENT? WilliamL. Berk .............................................•................. 97
LAND TREATMENT FOR ROOSEVELT, UTAH Gilbert R. Horrocks . .......................................................... 107
CHLORINATION OF WASTE STABILIZATION LA.GOON EFFLUENT Bruce A. Johmtm, Jeff Wight,J. H. ReyMldB, and E. J. Middlebrooks. . . . . . . . . . . . . . . . . . . . . . . . . . . . . . . . . . . . . . . . . . . . . . . . . . . . . . . . . .. 113
PERFORMANCE EVALUATION OF A SEVEN CELL LAGOON SYSTEM FOR BOD5' SS, AND FECAL COLIFORM Ralph E. Swiss, James H. ReyMldB, Christine A. Macko, and E. Joe Middlebrooks . ...................................................... 121
- -List of Advertisers
Ann Arbor Science ........................................................... m Cover Betz Laboratories .................................................................. 76 Bush and Gudgell ................................................................. 129 Caldwell. Richards, and Sorensen. Inc. . .............................................. 78 Engineering Science ............................................................... 95 Envirotech, Eimco PMD ............................................................ 54 Folsom and Associates .............................................................. 20 Hamilton and Voeller. Inc. . ............................. , ........................... 43 Horrocks and Associates ........................................................... 112 James M. Montgomery Consulting Engineers, Inc ...................................... 61 John Carollo Engineers ............................................................. 88 Modern Equipment Company ....................................................... 120 Nielsen. Maxwell and Wangsgard .................................................... 83 Valley Engineering, Inc. . . . . .. . .................................................... 18 W. R. White Company .............................................................. 13

History of Wastewater Treatment in Utah
StephenE. Moehlmann*
Salt Lake City and Ogden constructed wastewater collection systems in 1890. promoted by a need for improved sanitation.
In the 1930s it was clear that sewer systems alone were not the ultimate solution to the waste disposal problems in Utah. But, in addition, construction of adequate treatment facilities was necessary to protect public health, conserve water resources, and protect the State's waters from degradation. At that early time the State Division of Health determined that all wastes should receive at least secondary treatment.
The early 1940s saw the construction of the first modern treatment facilities at military bases such as Hill Field, Ogden Arsenal and Kearns. Dragerton, Horse Canyon. and Geneva Steel. The first modern municipal plant was constructed in 1949 at Nephi.
Greater population growth. the State Law in 1953, and the initiation of the construction grants program under the United States Public Health Service in 1956 further stimulated the construction of municipal facilities. A decade after the opening of the first municipal plant 27 treatment facilities had been constructed.
More rapid population growth and the development of the environmental movement with the formation of the Environmental Protection Agency in 1970 and the passage of the 1972 Clean Water Amendments, demanded both the construction of more treatment facilities, and the enlargement of existing facilities.
Presently in 1977. less than 30 years after construction of the first municipal facility, we have 85 municipal facilities with over 200 operators.
The advent of so many sophisticated secondary treatment facilities in such a short time presented several difficulties. Voters, elected officials, city and district officials. and operators had to be made aware of the necessity and importance of these facilities. and they had to be taught how to properly and efficiently operate these facilities.
The League of Cities and Towns laid the ground work for education of city and district officials with the Waterworks and Sanitation Conference which started in 1944. Since then. the Conference has been a regular part of the League's Annual Meeting in the fall and the regional schools for municipal officials in the spring.
·Stephen E. Moehlmann is a Public Health Engin~r for the Bureau of Water Quality. Utah State Division of Health.
1
Operator training started in the Spring of 1950 with inception of the Municipal Water and Sewage Works School-sponsored by the University of Utah, Division of Health, League of Cities and later joined by the Utah Water Pollution Control Association and Intermountain Section of the American Water Works Association. This school was held annually from 1950 through 1972 with a total of 23 sessions.
Additional operator training programs were provided by the "In Plant Training Program" offered in 1956, 1957, and 1964 at the Salt Lake City Suburban Sanitary District Treatment Plant, the 1959 "In Service Training" programs and 1964 Short School for Sewage Works Operators offered at the University of Utah.
The need for a professional organization for all of those concerned with wastewater collection, treatment and disposal culminated in the formation of the Utah Water Pollution Control Association in 1957, initially known as the Utah Sewage and Industrial Wastes Association.
Association membership meetings were highlighted by talks and by tours of wastewater treatment facilities or wastewater related industries.
In 1964, Utah State University offered the first Management Institute for Water and Sewer Districts and Municipalities. These Institutes were designed to provide the city and district managers with training and information to improve their operations.
By 1965, the Utah Board for Voluntary Certification of Water and Wastewater Works Operators had adopted a certification plan. This Plan had been approved by the Division of Health. the League of Cities and Towns, the Utah Water Pollution Control Association and the Intermountain Section of the American Water Works Association. The Board offered its first exams in 1966 and each year since.
Certification and growing numbers of untrained operators stimulated the formation of the Utah Water and Wastewater Operators Basic Training School.
This school offered basic and intermediate level courses for water distribution, water treatment and wastewater treatment in 1966, 1967, and 1968. The basic school led to formation of the Utah Water and Wastewater Training Committee, known as the Joint Committee. The Joint Committee's bylaws were adopted by the Parent Associations (the Utah Water Pollution Control Association and the Intermountain Section of the American Water Worb Association) in 1969 and their first school was conducted in 1970.

In 1971, 1972, and 1974, the State Division of Health sponsored a 44 week operator training course called Utah's Wastewater Treatment Plant Operators On-the-job TraiD~' ing Program.
In 1971, Utah State University offered a short course in Lagoon and Package Plant Operation for the U.S. Forest Service operators.
The Utah Board of Voluntary Certification became a member of the Associated Boards of Certification in 1973.
EPA has sponsored seminars in 1973,1974, and 1976 for consulting engineers. The seminars discussed upgrading the design and operation of wastewater facilities.
Under an EPA grant, Utah State University offered a Resource Utilization and Environmental Management Institute in 1974 and 1975.
The State Division of Health held five regional Waste Stabilization Pond Seminars for lagoon operators in 1974.
The adoption of new regulations concerning overtime pay by the U.S. Department of Labor prevented the Joint Committee from holding the Joint School in 1975. To fill the gap, the Division of Health offered a nine week Short Course for Wastewater Operators.
To meet increasing needs for qualified wastewater instructors, the Division of Health requested and sponsored the EPA Instructor Basic Techniques course in 1975. This course taught operators how to be instructors.
To comply with requests to reduce time commitment of operators in training, the Division of Health's 44 week course was split into two 27 week courses: Introduction to Wastewater Treatment Plant Operation and Advanced -Wastewater Treatment Plant Operation. Also to meet the needs of more distant facilities, the Introduction training course was held in two locations, Salt Lake City and Orem. The advanced course was only offered in Salt Lake City.
The State Division of Health has sponsored seminars for consulting engineers in 1974, 1975, and 1976. These seminars discussed various aspects and requirements of the EPA Construction Grants program and regulations.
The Joint School was offered again in 1976 but under a new framework. To comply with the U.S. Department Labor regulations, the Joint School was sponsored by Utah State University.
In addition, the Joint School added two new courses, Basic Wastewater Collection Systems and Advanced Water and Wastewater.
Additional instructor training was offered by the EPA Instructor Development Workshop in 1976. The instructors trained in the Techniques Course received more detailed information on class and training material preparation.
To meet the needs of operators unable to attend training courses offered in Salt Lake City, the Division of
2
Health started a Self-Paced Operator Training course in 1976. This course was designed for those operators who couldn't, for various reasons, attend operator training courses offered along the Wasatch Front.
1976 also saw the formation of the Utah Environmental Systems Operations Training Program (UESOTP). The UESOTP was organized to coordinate the numerous training activities for Water, Wastewater, Solid Waste, and Air Pollution personnel now available in the State and offer them under a unified format.
The first course offered under UESOTP in 1976 was the Utah State University's Wastewater Safety Supervisors Course. Next .was the NPDES Self-Monitoring Basic Laboratory Skills Workshop sponsored by the Division of Health. This coursE} was designed to give operators the skills necessary to perform the NPDES laboratory tests. Also, a NPDES Permits Seminar was sponsored by UESOTP in 1976. The seminar was to help the permittee more accurately fill in his NPDES Permit Report form.
Programs offered under UESOTP in 1977 include the Joint School, the Division of Health's Wastewater Mathematics Course and the NPDES Self-Monitoring Basic Parameters for Municipal Effluent Workshop.
The 1977 Joint School added an Intermediate Wastewater Collection Systems course.
The Division of Health's Wastewater Mathematics course gave the operator practice with the mathematics geared specifically to plant operation and certification.
The NPDES Basic Parameters Workshop was also sponsored by the Division of Health and was the second half of wastewater laboratory training provided under an EPA grant. It provided actual experience in running laboratory tests required by the permit for operators who have successfully completed the previous NPDES Skills Workshop.
Training efforts in the State of Utah since 1944 have involved nearly everybody concerned with wastewaterelected officials, engineers, managers, and operators.
The League's Waterworks and Sanitation Conference and Utah State University's Management Institute have provided elected officials and managers with training.
Utah Water Pollution Control Association, State Division of Health, University of Utah, and the League have offered the operator a wide variety of training from basic theory through instructor development. This group has also provided the operator with the means to become certified.
With the advent of the Utah Environmental Systems Operations Training Program, the process of operator training will be additionally refined to further coordinate efforts between the Associations, League of Cities, and Towns, the Division of Health, the State's educational institutions and the Board of Certification.

UTAH LEAGUE OF CITIES AND TOWNS REGIONAL SCHOOLS MUNICIPAL WATERWORKS AND
SANITATION CONFERENCE
The League's Municipal Waterworks and Sanitation Conference was organized to assist city and district officials and to keep these officials abreast of new technology, operations, and regulations.
The conference has been held each year during the regular League meetings since 1944.
In 1975, the League format was changed and the "conference" changed to the Water and Wastewater Works Section of the Public Works Session.
UNIVERSITY OF UTAH
Municipal Water and Sewage Works School
The Municipal Water and Sewage Works School held annual meetings in the spring of the year from 1950 through 1972. The school lasted for 2 or 3 days with the time split equally between waterworks and wastewater works operator training. The school was organized to provide personnel involved with water and wastewater works operations the basic information to properly operate and maintain their facilities, plan for future expansion and comply with local, State and Federal regulations. In 1965, the name was changed to the Municipal Water and Wastewater Works School. At the end of the 1966 session and all subsequent schools, certification examinations were provided.
The school was sponsored by the University of Utah, Utah State Division of Health, Utah League of Cities and Towns, Utah Water Pollution Control Association and the Intermountain Section of the American Water Works Association. Attendance averaged between 150 and 200.
UTAH WATER POLLUTION CONTROL ASSOCIATION
The Utah Water Pollution Control Association was formally organized in 1957 as the Utah Sewage and Industrial Waste Association. They changed their name to the Utah Water Pollution Control Association in 1967.
The Association has held regular meetings throughout each year in addition to the annual conference. These meetings were often highlighted by plant tours and discussions of pertinent topics.
The Association has been instrumental in stimulating operator training and providing the necessary expertise to run the training programs.
UTAH STATE UNIVERSITY MANAGEMENT INSTITUTE FOR WATER AND
SEWER DISTRICTS AND MUNICIPALITIES
In 1964, Utah State University sponsored the first Management Institute for Water and Sewer Districts and Municipalities. It meets for 2 days each spring and averages about 50 participants.
3
"The Institute aims to provide training and information to water and sewer districts management, district board members and trustees, city mayors, managers, commissioners and councilmen, and others involved in the management and operation of water and sewer facilities."
U.S. FOREST SERVICE LAGOON AND PACKAGE PLANT OPERATOR SHORT COURSE
This course was provided by a grant from the U.S. Forest Service to Utah State University in 1972 to provide training for operators of U.S. Forest Service package plants and lagoons with training.
RESOURCE UTILIZATION AND ENVmONMENTAL MANAGEMENT INSTITUTE
This Institute was founded by an EPA grant in 1974 and 1975. It was to provide teachers with information regarding the environment and the production of training modules. The course met for 3 weeks and had 15 graduates.
UTAH BOARD FOR VOLUNTARY CERTIFICATION OF WATER AND WASTEWATER OPERATORS
Operator certification efforts officially started with the formation of the Utah Board for Voluntary Certification of Water and Wastewater Works Operators in 1965.
The first exams were offered in 1966 and each year since. The Plan set up separate exams for Water Treatment and Wastewater Treatment with four grade levels.
In 1976, exams for Water Distribution and Wastewater Collection were added to the program.
A special classification of Grade V was set aside for those. who did not pass the grade IV exams.
In 1973, the Board joined the "Associated Boards of Certification." The Board is presently making changes necessary to fully comply with the ABC program.
By 1976, there were 156 certified wastewater operators in Utah.
UTAH WATER AND WASTEWATER JOINT TRAINING COMMITTEE
The Utah Water and Wastewater Joint Training Committee, known as the Joint Committee, was officially formed in 1969. The Joint Committee was formed by the adoption of the bylaws by the Parent Association-the Utah Water Pollution Control Association and the Intermountain Section of the American Water Works Association.
The purpose of the Joint Committee is to improve the qualifications of operators by providing them with formal training.
The objectives are outlined as follows:

1.
2.
3.
To develop a curriculum for and administer operator training programs.
To advance the fundamental and practical knowledge required to effectively and efficient· ly operate water and wastewater works.
To aid operators in progressing with certification.
The Joint Committee spoIisored their first training school in 1970 and every year since, except for i975. The Committee membership is appointed by the Parent Associations. The Committee originally established by adopted bylaws was composed of 14 members-7 from each association. It was expanded ih 1976 to 18 members with 9 members from each association.
The history of the J oint Committee goes back to the In Plant Training Programs, In Service Program, the Short School for Sewage Works Operators and the Basic Schools of the 1950s and early 1960s.
The In Plant Training Program was offered by Salt Lake City Suburban Sanitary District HI in 1956, 1957, and 1964. It met one evening a week for 2 hours for 10 weeks and had guest speakers at each session.
The In Service Program in 1959 and the Short School for Sewage Works Operators in 1964 were cooperative efforts of the Utah Water Pollution Control Association, the Division of Health, the League of Cities and TowIis, and the University of Utah. These programs held classes once a week for 3 hours for 8 weeks and had guest speakers at each session.
These training programs led to the formation of the Utah Water and Wastewater Operator Basic Training ScMol in 1966. The Basic School was held in 1966, 1967, and 1968. The Basic Training School established the training framework to be used by the Joint Committee. This framework consisted of basic and intermediate level courses in wastewater treatment, water distribution and water treatment. The Basic Training School held evening classes in the winter. These classes met once a week for 2 to 3 hours for 8 to 10 weeks and had guest lectures for instructors.
The Joint Committee has used the same framework and timing for their courses. .
In 1976, the Joint Committee added two new courses, Basic Wastewater Collection Systems and Advanced Water and Wastewater. 1977, the Joint School added Intermediate Wastewater Collection Systems. The Joint School has approximately 50 wastewater graduates each year.
The Committee did not present a school in 1975 because of an unfavorable decision by the U.S. Department of Labor concerning overtime pay for municipal employees. To adapt to the U.S. Labor regulations the 1976 and 1977 sessions of the Joint School have been sponsored by Utah State University.
4
The Schools have used the New York Manual of instruction for Sewage Treatment Plant Operators, the Texas A & M University Engineering Extension Service Manuals, the Sacramento State College Operation of Wastewater Treatment Plant manual, and the Sacramento State College Operation and Maintenance of Wastewater Coll~ion Systems manual.
STATE DIVISION OF IlEALm
1. Wastewater TreatmeJit Put Operator On-the-Job 1'rainiIii Program
The Division of Health has sponsored Wastewater Treatment Plant Operator On-the-Job Training Programs in 1971, 1972, and 1974.
The 1971 class was the first course of its kind offered in the United States. The 1971 and 1972 courses were cooperative efforts by the Division of Health and EPA, and were jointly funded. It 1974, the Division of Health solely sponsored and funded the training.
These courses used the New York Manual of Instruction for Sewage Treatment Plant Operators, the Sacramento State College Operation of Wastewater Treatment Plants, WPCF MOP 1, WPCF MOP 6, WPCF MOP 11, WPCF MOP 16, WPCF MOP 18, and WPCF MOP 20.
Objectives of the training program were to transfer those necessary operational skills to operators of wastewater treatment plants to achieve the best effluent possible. More specifically, these objectives included a basic orientation in water supply and wastewater control; development in educational skills-math. communications, and science; coordinating education skills with unit process operation skills; knowledge of local treatment plant design and operation; preparation for unit process operator on-the-job training;. and motivation to seek further education for career development in the wastewater field.
The classes averaged 20 graduates. They met twice a week for 4 hours for 44 weeks with approximately 350 hours of classroom instruction and 70 hours of the On-the-Job training.
The 1971 and 1972 courses were held during the evening. and the 1974 course was split into morning and afternoon sessions.
A point of interest, Governor Calvin L. Rampton awarded certificates to the firstgi'aduating class in 1971.
2. Waste Stabilization Pond Seminars
In 1974, the Division of Health sponsored five one-day Waste Stabilization Pond Seminars throughout the State. Seminars were held at Salt Lake City, Corinne, Wasbington. Duchesne, and Ephriam with a total attendance of 49 operators.
The seminars Were held to acquaint operators with terminology. operation and problems associated with waste stabilization ponds. A 32 page outline concerning

waste stabilization ponds served as the basis of instruction given at the seminars.
3. Construction Grant Semiaar
In 1974 and 1975, the State Division of Health sponsored a one-day seminar on the EPA construction grant program for consulting engineers. The seminar reviewed the regulations and requirements for facility plans.
4. Wastewater Treatment Plant Operator Short Course
To fill the gap left by the absence of the Joint School in 1975, the Division of Health offered a nine week Wastewater Treatment Plant Operator Short Course.
The course met once a week for 3 hours. Half of the session was a general review of treatment principles and the other half was mathematics.
Nineteen operators received certificates.
5. 0 & M Manual Preparation Semiaar
The Division of Health sponsored a half day seminar in 1975 called 0 & M Manual Preparation Seminar. The purpose of the seminar was to assist the consultants or prospective 0 & M manual writers in organizing and preparing 0 & M manuals. Division of Health and EPA regional people responsible for review conducted the program.
6. Instructor Techniques Course
Upon request of the Division of Health, EPA held their Instructor Techniques Course - B in Salt Lake City in 1975. This course met for one week-40 hours-with 14 graduates.
Objective of the course was to prepare operators to serve as instructors by giving them the necessary techniques to organize and conduct classes.
7. Introduction to Wastewater Treatment Plant Operation
To reduce the time and personnel commitments of the 44 week OJT Training Program, the Division of Health in 1975 split the course into two 27 week courses, Introduction to Wastewater Treatment Plant Operation and Advanced - Wastewater Treatment Plant Operation.
Introduction to Wastewater Treatment Plant Operac tion was designed for entry level operators having at least 3 months of experience and interested in taking the grade 3 or 4 certification exam.
This course was held in Salt Lake City and Orem and had 16 graduates. Texts used in the course were New York Manual of Instruction for Sewage Treatment Plant Operators, Sacramento State College Operation of Wastewater Treatment Plant Manual, WPCF MOP 1, WPCF MOP 6, WPCF MOP 11, and WPCF MOP 18. The course met once a week for 3 hours for 27 weeks.
5
8. Advaneed - Wastewater Treatment Plant Operation
Advanced - Wastewater Treatment Plant Operation was the second half ofthe 44 week course split held in 1975.
It was designed for lead operators, foremen, and superintendents desiring more information on the details of plant operation and design, and who were interested in taking the Grades 1 or 2 certification exam.
This course was held in Salt Lake City and had 9 graduates. WPCF MOP 1, WPCF MOP 16, and WPCF MOP 20 were used for texts. This course was conducted weekly for 3 hours for 27 weeks.
9. Instructor Development Workshop
In the spring of 1976, follow-up week of training to the EPA Instructor Technique Course-B was the Instructor Development Workshop.
The workshop was designed to provide the necessary knowledge and skills to develop, validate and implement an effective instruction package for water and wastewater treatment programs.
10. SeH-Paced Wastewater Treatment Plant Operator Course
To meet the needs of those operators who couldn't attend the Wasatch Front Operator Training Courses offered by the Division of Health, Joint School, USU, and others, the Division of Health developed a Self-Paced Wastewater Treatment Plant Operator Course and offered it in 1976.
The course requires students to submit preassignments and post assignments. After preassignments were corrected, the instructor would visit the plant and conduct the class. As a follow-up to the class, the student submitted a post assignment.
The whole course is geared to the operators' own plant. Preassignments usually describe the plant unit to be discussed and the post assignment lists the necessary operation, maintenance and troubleshooting procedures related to the unit. The course involved 19 operators.
The course was divided into 3 parts with a total of 20 lessons.
The New York Manual of Instruction for Sewage Treatment Plant Operators, the Sacramento State College Operation of Wastewater Treatment Plants, WPCF MOP 1, WPCF MOP 6, WPCF MOP 11, WPCF MOP 16, and WPCF MOP 18 were used for textbooks.
11. Appendix CI, C2 Engineering and Construction Contracts
In 1976, the State Division of Health held a seminar discussing the new regulations for EPA's construction grant program in Appendix C1, C2 Engineering and Construction Contracts for consulting engineers. The

seminar discussed the hew regulations and their effect on the consultants.
ln 19'13. EPA sponsored a a day teclinologytransfer seminar for "Upgradmg Tricklihg Fllter pianist PhysicalChemical Treatment, and Upgradirig Lagoons" for design engineers.
In 197 4. EPA sponSOred it 3 day technology transfer seminar at Utah state University fQr "Upgrading Wastewater Stabilization Ponds to Meet New Discharge Standards" for design engirieers.
In 1976, EPA held . a one day conference called "Operability. Flexibility,. Mamtliiriability of. Wastewater Treatment Facilities." Its objeCtive was to consider and discuSs techniques to improve the operability, fieXibility; and maiIltaiIlability iri. the design. of wastewater treatment facliities. Improved designs will help asstire that those facilities can be operaU;ld at. their designed level of efficiency and will meet alliegill discharge requirements.
UTAH ENVIRONMENTAL SYSTEMS OPERATIONS TRAINING PROGRAM PLAN
The Utah Environmentai SystelIlsOIlerations Traming Program (UESOTP) was developed in i976 to coordinate and promote effective water, wastewater, Solid waste and air pollution training programs offered in the State of Utah.
UESOTP was formed by the Utah state I)ivisioh of Health, Utah Water Pollution Control As!!ociation, tht; Intermountain Section of the American Water Works Association, . the Utah. Refuse Collection ~nd Disposal Association, and the Utah League of Cities and Towns, and is sponsored by Utah State University.
To this point, the UESOTP has coordinated the followiIlg wastewater training programs: USU Wastewater Safety Supervisors Course, the Division of Health's NPDES Self~Monitoring-Basic Laboratory Skills Workshop, the NPDES Permit Report Seminar in 1976 and the bivision of Health's Wastewater Mathematics Course, the J".oirit School, and the NPDES Self-Monitoring-Basic Parameters (.or Municipal EffiuEmts Workshop in 1977.
i. Utah state University's Wastewater Safety Supervisor CoarBe
Utah State University conducted a Wastewater Safety Supervisor Course in 1976. Its purpose was to aquaint the safety supervisors with the UOSHA regulations and to help them organize and conduct their own safety programs.
. The course had 12 sessions which met every other week for two hours and had 12 graduates. The course used the UOSHA regulations and related WPCF materials for the texts.
6
2. Division of Health's NPDES SelfMoIiitOriIig-Basle Laboratory Skills Worksbop
The NPDES SEt.F-Moni~ring-Basic. Laboratory Skills Course was provided by the Division of Health under a special EPA grant to. j;ted Rocks Community College iri Deliver; Colorado iIl 1976.
The course met for oile. week for 40 hours and had eight grad~ates. Purpose of tlie biJutse was to provide the operators "\\lith thetiecesSiiry labOratOry skillii to perform the laboratory testing required by the permit.
3. NPDts Petiliit Report Seiliiiiar
The NPDES Permit RepOrt Seminar was held for one day iii 197ft Personnel from the EPA Region VIII Permits Offi~e conducted the one day serirl.nar on "How to Properly Fill Olit the NPDES Permit F6nn" lit 1976. It was designed to help the Ilerrilittee properly complete. his selfIilonitorihg report form. Forty-four people attended the semlliar.
4. IilvisioD of liealth's Wa8teftter Mathematic:s Course
Iri 1977, the Division of Hehlth offered a VI astewater Mathematics Course. The course met 3 hours once a week for i6 weeks and had 12 graduates. The course provided the operators with iristruction m Iilathematics neCessary (or operation. reports, arid certification.
5. DMsIoii of lleutb'li. NPDE$ SeU~M,nitoftDg-Basic: Plirii.lil.e~ for MlDlidpai Effluents WorlWaop
.The second haIl of the laboratory trainiIlg provided by the Division of Health under the EPA grant to Red Rocks Conimunity College wiitS . conducted. in 1977. The NPDES ~e1f-Monitoring-Basie Parameter for MuniciIlai Effluents Workshop met one week for 40 hours and had nine graduates.
This workshop required the opl\lrator to successfully perrorm tests for BOD, SS, pH, chlorine residual, and coliforins in order to graduate.
TIME LINE
1980 Salt Lake City Collection System Ogden - Collection System
1938 Division of Health: Standards for home septic tanks prepared
1941-43 Military Installations - Hill AFB, Ogden Arsenal, Kearns, Wendover Air Base, Industrial Installations (Domestic sewage) - Dragerton, Horse Canyon, Geneva Steel
1944 League: Municipal Waterworks and Sanitation Conf. 1945 League: Municipal Waterworks and Sanitation Conf. 1946 League: Municipal Waterworks and Sanitation Conf. 1947 League: Municipal Waterworks and Sanitation Conf. 1948 League: Municipal Waterworks and Sanitation Conf . 1949 Nephi - First Modem Municipal Plant
League: Municipal Waterworks and Sanitation Conf. 1950 U of U: Municipal Water and Sewage Works School
League: Municipal Waterworks and Sanitation Conf.

1951
1952
1953
1954
1955
1956
1957
1958
1959
1960
1961
1962
1963
1964
1965
1966
1967
U ofU: Municipal Water and Sewage Works School League: Municipal Waterworks and Sanitation Conf. "Tentative Standards for Sewage Works" adopted by
State Department of Health. Water Pollution Con trol Legislation referred to Citizens Study Committee
U of U: Municipal Water and Sewage Works School League: Municipal Waterworks and Sanitation Conf. U of U: Municipal Water and Sewage Works School Utah Water Pollution Control Act became law League: Municipal Waterworks and Sanitation Conf. "Standards for Sewage Works Jan. 1954" - adopted by
Utah Water Pollution Control Board - Dec. 18, 1953 U of U: Municipal Water and Sewage Works School "Water Classifications and Standards" - adopted by
Utah Water Pollution Control Board - Feb. 4, 1954 League: Municipal Waterworks and Sanitation Conf. U of U: Municipal Water and Sewage Works School League: Municipal Waterworks and Sanitation Conf. U of U: Municipal Water and Sewage Works School United States Public Health Service - Construction
Gran ts Pro gram League: Municipal Waterworks and Sanitation Conf. Salt Lake City Suburban Sanitary District #1: In
Plant Training Program U ofU: Municipal Water and Sewage Works School Utah Sewage and Industrial Wastes Association formed League: Municipal Waterworks and Sanitation Conf. Salt Lake City Suburban Sanitary District #1: In
Plant Training Program U of U: Municipal Water and Sewage Works School League: Municipal Waterworks and Sanitation Conf. U of U: Municipal Water and Sewage Works School UWPCA: In Service Training Program League: Municipal Waterworks and Sanitation Conf. U of U: Municipal Water and Sewage Works School League: Municipal Waterworks and Sanitation Conf. "Utah State Inter-Departmental Committee on Water
Pollution" - established by Governor George D. Clyde
U of U: Municipal Water and Sewage Works School League: Municipal Waterworks and Sanitation ConL U of U: Municipal Water and Sewage Works School League: Municipal Waterworks and Sanitation Conf. U ofU: Municipal Water and Sewage Works School League: Municipal Waterworks and Sanitation Conf. U ofU: Municipal Water and Sewage Works Operators USU: Management Institute UWPCA: Short School for Sewage Works Operators League: Municipal Waterworks and Sanitation Conf. Salt Lake City Suburban Sanitary Dist. #1: In Plant
Training Program U of U: Municipal Water and Wastewater Works School USU: Management Institute Utah Code of Waste Disposal Regulations (Parts I, V)·
adopted by Utah State Board of Health and Water Pollu tion Can trol Board (first official authorization for lagoons in Utah)
Voluntary Certification Plan adopted League: Municipal Waterworks and Sanitation ConL U of U: Municipal Water and Wastewater Works School Certification Exam Utah Water and Wastewater Operators Basic Training
School USU: Management Institute League: Municipal Waterworks and Sanitation Conf. U ofU: Municipal Water and Wastewater Works School Certification Exams Utah Water and Wastewater Operators Basic Training
School USU: Management Institute League: Municipal Waterworks and Sanitation ConL
7
1968
1069
1970
1971
1972
1973
1974
1975
1976
U of U: Municipal Water and Wastewater Works School Certification Exams USU: Management Institute League: Municipal Water and Sewage Conference U of U: Municipal Water and Wastewater Works School Certification Exams USU: Management Institute Utah Water and Wastewater Training Committee formed League: Municipal Water and Sewage Conference U of U: Municipal Water and Wastewater Works School Utah Water and Wastewater Joint Training School Certification Exams USU: Management Institute E.P.A. formed
U of U: Municipal Water and Wastewater Works School Utah Water and Wastewater Joint Training School Certification Exams USU: Management Institute Division of Health: 44 week Wastewater Treatment Plant
Operators' On-the-Job Training Program
League: Municipal Water and Sewage Conference U of U: Municipal Water and Wastewater Works School Utah Water and Wastewater Joint Training School Certification Exams USU: Management Institute USU: U.S. Forest Service Lagoon and Package Plant
Operations Short Course Division of Health: Wastewater Treatment Plant
Operators' On-the-Job Training Program
League: Municipal Water and Sewage Conference Federal Clean Water Act Amendments Utah Water and Wastewater Joint Training School Certification Exams USU: Management Institute Board of Certification joins ABC League: Municipal Water and Sewage Conference EPA: Upgrading Trickling Filter Plants, Physical and
Chemical Treatment, and Upgrading Lagoons Utah Water and Wastewater Joint Training School Certification Exams USU: Management Institute USU: Resource Utilization and Environmental Manage
men tins titu te Division of Health: Waste Stabilization Pond Seminars EPA: Upgrading Wastewater Stabilization Ponds to Meet
New Discharge Standards Division of Health: Wastewater Treatment Plant
Operators' On-the-Job Training Program
Division of Health: Wastewater Treatment Plant Operator Short Course
Certification Exam USU: Management Institute Division of Health: Operation and Maintenance Manual
Preparation Seminar Division of Health: Instructor Techniques Course USU: Resource Utilization and Environmental Manage-
men t Institute Division of Health: EPA Construction Grants Seminar Division of Health: Introduction to Wastewater Treat
ment Plant Operation Division of Health: Advanced-Wastewater Treatment
Plant Operation League: Water and Wastewater Section of Public Works
Session Utah Water and Wastewater Joint Training School Certification Exam USU: Management Institute Division of Health: Instructor Development Workshop

Division of Health: Self-Paced Wastewater Treatment Plant Operator Course
Division of Health: Appendix Col, C-2 Engineering and Construction Con tracts Seminar
Utah Environmental System Operation Training Program (UESOTP) formed
EPA: Operability, Flexibility, Maintainability of Wastewater Treatmen t F acili ties
UESOTP: USU: Wastewater Safety Supervisors Course League: Water and Wastewater Section of Public Works
Session
8
1977
UESOTP: Division of Health: NPDES Self-Monitoring Procedures· Course I Basic Laboratory skills
UESOTP: NPDES Report Seminar
UESOTP: Utah Water and Wastewater Joint Training School
UESOTP: Division of Health: Wastewater Mathematics Course
UESOTP: Division of Health: NPDES Self-Monitoring Procedures - Course II Basic Parameters for Municipal Effluents

The Utah Environmental Systems Operations Training Program-_
A First Progress Report
Normn:nB. Jones.
INTRODUCTION
In recent years the emergence of comprehensive federal and state legislation related to protection of the environment has created substantial demands and obligations for local governments and industry to upgrade and expand their facilities concerned with the areas of water pollution control, water supply, air quality control, and solid waste management. These legislative requirements have placed a heavy responsibility for compliance on the personnel who operate and manage such systems.
Operators of environmental control systems in Utah find themselves being required to achieve job performance levels significantly beyond the level expected of them just a few years ago. Most operators now recognize the need for additional training to achieve these higher performance levels, and indeed, are actively seeking such training opportunities. Additionally, elected officials, as they begin to understand their own responsibilities and obligations under the various laws, are finally sensing the need to encourage and support their personnel in acquiring additional training.
These developments, along with expectations of mandatory certification requirements in the near future, have created a real driving force for expanding and improving operator and management training opportunities.
mSTORY OF TRAINING IN UTAH
In the previous paper, Mr. Moehlmann has presented the historical development of water and wastewater operator training in Utah. Essentially. each training activity that he described emerged as a result of the needs of the time. Today, we stand on the threshold of another new era with respect to training needs in Utah. The tas~ of responding, by developing these expanded training opportunities, presents an awesome challenge for those professionals concerned with providing this leadership. Most certainly, it will require a renewed and innovative approach, building on previous training efforts where possible, but demanding a much greater intensity of participation and cooperation by those organizations and individuals responsible for previous training efforts, such as our own Utah Water Pollution Control Association.
*Norman B. Jones is Professor, Division of Environmental Engineering, Utah State University.
9
THE UTAH ENVIRONMENTAL SYSTEMS OPERATORS TRAINING PROGRAM
In late 1975, a group of individuals who had been working in various aspects of operator training recognized this need to upgrade and expand the training approach and began discussions related to establishment of a mechanism by which it would be possible to integrate, coordinate, upgrade and extend the impact of training in Utah.
In early 1976, the Utah Environmental Systems Operators Training Program (UESOTP) was conceived. A formal organizational framework and basic guidelines for implementing the. program were developed. Letters of support were solicited from participating organizations in order to establish some official recognition and justification for the concept. The goals, objectives, guidelines, and organization (GOGO) ofUESOTP as originally adopted are included in Appendix A.
OBJEcnvESANDCURRENTSTATUS
The basic objective of UESOTP is to improve the competency and qualifications of water, wastewater and solid waste operations personnel in the operation, maintenance, and management of their facilities and systems through the promotion, development, coordination, and scheduling of appropriate training activities. A related purpose is to promote, support, and complement the objectives of the Utah Voluntary Certification Program for Water and Wastewater Works operators.
Participation in UESOTP is on a voluntary basis and the program and its Coordinating Training Committee (CTC) have no direct powers or controls over training activity in Utah. The basic premise of UESOTP is that by providing leadership in the development and coordination of meaningful training programs, all related training activities proposed will voluntarily utilize the UESOTP framework, its resources, and standards of training quality control as measured by the Continuing Education Unit (CEU).
DEVELOPMENTS SUPPORTIVE OF UESOTP
Two developments subsequent to the creation of UESOTP have added considerable credibility and reinforcement to the validity of its concept.
The first reinforcement for the UESOTP concept came with a report presented at the Water Pollution Control Federation Annual Conference in Minneapolis on October 3, 1976 by the Association of Boards Certification (ABC) entitled "Roles and Responsibilities for Developing a Comprehensive State Water and Wastewater Operator

Training Program" (cover page and summary in Appendix B). The report findings and recommendations are essentially those adopted in the creation of UESOTP, which was developed independently and prior to the release of this important document.
A second supportive development occurred in November, 1976 when the Environmental Protection Agency, Region 8, Office of Technology Transfer and Manpower development awarded Utah State University a grant in the amount of $18,954 to assist in implementing the Utah Environmental Systems Operations Training Plan. These funds will be used for the acquisition of visual aid training equipment. training materials, travel support to assist in carrying training activity throughout the state, and miscellaneous operating expenses.
SUMMARY
UESOTP represents a well conceived and feasible approach to developing comprehensive training activity for environmental systems personnel in Utah. It can effectively meet the challenge of developing expanded and innovative training that is necessary for the future. Its organizational framework is flexible and adaptive for accommodating new and changing training needs. It has no official authority or power that can be construed or suggested as an attempt to "corner" Utah's training efforts and activity. It is a voluntary organization comprised of dedicated and competent persons, contributing their time and energy for one single purpose-improved performance of environmental control systems through effective training programs.
There is much to be done to achieve this objective. The success for UESOTP looks promising.
In my opinion, it is worthy of your support.
APPENDIX A ,
THE UTAH ENVIRONMENTAL SYSTEMS OPERATIONS TRAINING PLAN
1.0 Objective:
The basic purpose and objective of this training plan is to improve the competency and qualifications of water. wastewater and solid waste operations personnel in the operation, maintenance, and management of their facilities and systems through the promotion, development, coordination, and scheduling of appropriate training activities. A related purpose is to promote. support. and complement the objectives of the Utah Voluntary Certification Program for Water and Wastewater Works operators.
2.0 SPODlIOring and Partieipatiag OrganDtioDII:
2.1 Utah State University, through its Cooperative· Extension Service, will provide basic sponsorship, coordination, and liason for the training activity.
2.2 The following organizations. representing the essential elements and interests necessary to
10
effectively carry out and achieve the stated objectives of the plan. are formally committed to active support of the prOgram concept and training activities. *
2.21 American Water Works Association. Intermountain Section.
2.22 Utah Water Pollution Control Association.
2.28 Utah Refuse Collection and Disposal Association.
2.24 Utah State Division of Health.
2.25 Utah League of Cities and Towns.
2.3 Other organizations and institutions of higher learning will be utilized and involved where specialized training needs or liason is required or deemed appropriate in carrying out the training plan objectives.
3.0 CoordIaatmg TniDing Committee (CTC)
3.1 A Coordinating Training Committee shall be created for the purpose of:
3.11 Implementing the plan by developing policy and guidelines for its operation.
3.12 Providing liason and feedback to the parent participating organization.
3.13 Providing leadership for the stimulation, development and coordination of training activity.
3.14 Assisting and supporting the Utah Voluntary Certificate program.
3.2 The Committee shall consist of members as follows:
3.21 Two members representing the American Water Works Association, Intermountain Section.
3.22 Two members representing the Utah Water Pollution Control Association.
3.28 One member representing the Utah Refuse Collection and Disposal Association.
3.24 Three members representing the Utah State Division of Health.
3.25 One member representing the Utah League Cities and Towns.
3.26 One member representing the Utah State University Cooperative Extension Service.
·See Appendix A for support letters of intent from participating organizations.

3.3 The committee members shall be appointed by the parent organizations that they represent for a time period deemed appropriate by the parent organization.
4.0 Speeife Objeedves of the CGordIu.tInK TraIDiDg Committ_
4.1 Identification, Coordination, and Scheduling of Training
4.22 Identify, acquire and make available existing relevant training materials and resources.
4.28 Develop new training materials and resources where needed, including correspondence courses, special workshops, ete.
4.24 Actively seek sources of funding where necessary for improvement in the quality and scope of training activities. 4.11 Develop a physical inventory of environ
mental systems operations and personnel for entire state. 4.3 Relationship to Utah Voluntary Certification
Board 4.12 Identify needs and priorities for specific
training oHerings as a basis for scheduling of training courses.
4.13 Identify and establish regional training centers suitable and equitable for servicing the training requirements of the entire state.
4.14 Develop an operator's Newsletter as a basic mechanism for communications, for improvement of operator morale and professional image, and for general public relation purposes.
4.2 Training Courses, Materials, Resources
4.21 Identify, outline and describe the types of training courses and activities necessary to carry out program objectives.
Sponsor Plan I Utah State University Utah Environmental Systems I Cooperative Extension Service Operations Training Plan
Coordinating Training Comrr.ittee (crC)
Representative, USU .. Cooperative Extension Representative, A~"WAJ Intermountain Section Rcpr€>scntativc, Al,'t4A, Intermountain Section Representative. UWPCA Representative. Ut~PCA
4.31 Enhance operator progression toward certification by coordinating training programs with standards and policies of the board.
4.32 Assist Certification Board in recording and documenting professional advancement by implementing the Continuing Education Unit (CEU) concept in association with all training activity.
4.88 Improve communications between operators and the Certification Board by providing Newsletter liason between training and certification activity.
4.84 Continually review certification exam results as one criterion for evaluating training eHeetiveness.
Participating Organizations
American Water 'Works Associatlon* Intermountain Section
Utah Water Pollution Control Association Utah Refuse Collection and Disposal Association Utah League "f Cities and Towns Utah State Division of Health,
Bureau of Environmental Health
!"--- Program for Water and Waste-
Representative. Utah Refuse Collection & Disposal Assn.
Utah Voluntary Certificatio~ j water Works Operators
Representative, Utah League of Cities and Towns Representative. Utah State Div. of Health (Water) Representative, Utah State Div. of Health (Wastewater) Representative, Utah State Div. of Hedth (Solid Waste)
Education and Training Programs
I I I 1 AI,'WA-Ul,'PCA Utah State Divis!on of Health I Utah League of Cities & Towns Utah H1~her· Education Sl,stem
Joint Training Program. Ra tp.r Training Programs Short Schools USU and U of U Av:'.,IA \.lorkshops Wastewater Training Programs I Annual Meeting "~~;~;~~~'lCl Courses AWWA Annual fleeting Solid Waste Training Programs Classes UWPCA ~orkshops Workshops U\''PCA Annual Heetillg UOSHA Training
Trade Tech Schools MaintenClnce Courses Basic Training Courses
11

APPENDIXB
ROLES AND RESPONSmlLITIES FOR DEVELOPING A COMPREHENSIVE STATE WATER AND
WASTEWATER OPERATOR TRAINING PROGRAM
Project Report by the
Association of Boards of Certification for Operating Personnel
in Water and Wastewater Utilities ABC Administrative Office
Municipal Building Ames, Iowa 50010
Robert L. Wubbena, Project Director
for the Office of Water Program Operations
U.S. Environmental Protection Agency Grant~0.T900661010
July, 1976
TO THE READER:
~umerous studies have shown that many water and wastewater facilities are not meeting design criteria due to poor operation. State Boards for Certification have sbown through their examinations and evaluation procedures that many operators may lack the skills and ability to provide proper operation.
This report discusses what is involved in the development of an adequate level of training and education for these operators; it also identifies the roles and responsibilities for the participants in the program development and is intended for use by the following organizations:
A WW A (and Local Sections) EPA State Regulatory Agencies State Boards of Certification ~ongovernmental Training Organizations Utility Management WPCF (and Local Associations) EPS (Environment Canada) Provincial Regulatory Agencies Provincial Boards of Certification Federal Agencies Education and Vocational Training Institutions Professional Societies and Organizations
The project was initiated by ABC on behalf of the state and provincial boards of certification. It was financed by a grant from EPA. The study and preparation of the report was directed by a joint committee for A WW A, WPCF, four states, and a representative of the Canadian Government.
The Committee apreciates that the recommendations will not solve all operator training problems. Their implementation will, however, establish much needed coordination and provide a training system that will permit nation-wide pooling and sharing of resources. We urge you full cooperation in achieving these goals.
12
PROJECT STEERrnG COMMITTEE R.L. Wubbena, Project Director Samuel S. Baxter E.H. Braatelien, Jr. WilHam R. Hill Peter Mack Alex B. Redekopp Sam L. Warrington
SUMMARY
Managers and operators of water supply and wastewater utilities need to be highly qualified to achieve effective and economic operation of their facilities in accordance with current day practices and standards.
The independent effort of most states and Canadian provinces to provide essential training has been inadequate. Their experiences clearly indicate the need for leadership to (1) coordinate independent efforts and direct the sharing of their resources, (2) provide guidance for the numerous participants in the development of new training material, and (3) develop training to meet the needs being identified by certification programs. Establishment of this leadership and the provision of some beginning guidelines is the purpose of this study and report.
Recognizing their capabilities for providing this leadership, the American Water Works Association (AWWA) , the Water Pollution Control Federation (WPCF) , and the Association of Boards of Certification (ABC), appointed representatives to participate in a joint study funded by an Environmental Protection Agency (EPA) grant. They were assisted by four persons knowledgeable of specific state or provincial training activities.
The study is the first nationwide comprehensive analysis of the availability of training and problems associated with the development of effective state programs.
Based on the analysis of 4 state programs and a survey of the other states and 10 provinces, the report identifies the responsibilities and methods for utility management, educational institutions, regulatory agencies, consulting engineers, professional organizations and others in meeting the need.
Included in the report are specific recommendations for action that include the following:
1.
2.
3.
That better working relationships be established between state agencies, local units of A WW A and WPCF, colleges and vocational training institutions, industry. consulting engineers, and ongoing training programs in related fields to improve training opportunities;
That legal mandates and authorizations be secured to assist in implementation of training;
That the basic state training programs be funded by program budget funds and tuition and not by federal grants;

4. That all training material development by A WW A. WPCF and the federal and state governments be based upon the "need to know" criteria developed by ABC and validated by A WW A. WPCF. and other recognized experts.
5. That all new training material be developed in modular form and be assigned a CEU value;
6. That a "means to coordinate training" be established in each state to promote the use of all available training; and
7. That a national eommittee that ineludes representation from AWWA. WPCF. ABC. and others be established to provide national leadership in the development of a eomprehensive operator training program.
A PIPE FOR EVERY PURPOSE In addition to the concrete and corrugated metal pipe manufactured at the Ogden Plant W. R. WHITE COMPANY maintains complete inventories of supplies and accessories for the Waterworks and Sewer Industries. These quality products are available in both Ogden & Murray.
*Vulcan PVC Sewer & Water Pipe *Plastic Pipe Fittings *Polyethylene Water Service Pipe
& Fittings' *PVC Flexible Underground
Drainage Pipe *Asbestos Cement Water & Sewer Pipe *Cast Iron & Ductile Iron Pipe *Cast I ron Fittings & Accessories *Copper Tubing *Corporation Stops, Valves and
Tapping Equipment
*Manhole Rings & Covers *Air & Pressure Release Valves *Valves & Gates *Pressure Regulators *Couplings & Repair Clamps *Sewer Pipe Couplings & Adaptors *Fire Hydrants *Thermoline Trailer Connections *Yard Hydrants *Complete line of meters - 1/2" thru 10",
Backflow Preventers, Hydraulic Control Valves' & Repair Parts
9 W·~:~'~d~n!~ ~S~'~",~~hNY Dial 394-6621 Dial 262-2561
13

Plant Start-up of the Salina, Utah. Sewage Treatment Plant .
DwgIa8 D. lJrury, William J. Spear, and Robert M. McEown*
INTRODUCTION
The design and construction of unique or different processes for small towns often results in operational problems and in poor quality effluent for the sewage plant. The design engineer can insure that these treatment processes will operate as designed by conducting plant start-up and training the operator in the proper control of the treatment process. An aerated equalization basin was designed and constructed for the Salina Sewage Treatment Plant. Plant start-up and operator training began after the plant did not produce the removal efficiencies which were anticipated. Plant start-up identified and corrected many operational problems and design deficiencies. This should enable the treatment plant to meet its discharge permit as originally designed.
Salina City is a town approximately 2,000 people located in south central Utah on the western edge of coal country. Over the last year Salina City has experienced a tremendous growth and development. There were 64 new connections in 1976 alone. This represented a 15 percent increase in total connections in 1976 alone.
HISTORY
The Salina City Sewage Treatment Plant was constructed in 1960 for a design flow of O.S MGD. At that time the plant consisted of bar screens, grit removal chambers, a primary clarifier, a standard rate trickling filter, a secondary clarifier, and an anaerobic digester.
The major contributor of flow and BOD to the plant was the local turkey processing plant. The plant operated approximately 10 hours per day from June through November. The turkey plant produced flows in excess of 0.5 MGt> and averaged over 250,000 gallons per day. The sewage from the turkey plant would then flow through the sewage treatment plant over a 12-hour period. The BOD's of the sewage from the turkey plant averaged about 400 mg/l with peaks in excess of 1300 mg/I being observed. At· that time the city did not employ a full time operator. The operation consisted of the City Maintenance Foreman visiting the plant twice a day to make sure the pumps were running. Needless to say, the plant experienced serious operating problems. By the early 1970s the BOD's and TSS in the effluent of the sewage treatment plant averaged over 50 mg/l with peaks in excess of 150 mg/l being noted. In addition, total coliform concentrations in excess of 230,00011/100 ml were observed
*Douglas D. Drury is presently the Sanitary Engineer and Operation and Maintenance Specialist for Valley Engineering. Inc. of Logan. Utah. William J. Spear is President of the Project Services, Inc .• of Salt Lake City. Utah. Robert MeEown in the Plant Operator of the Salina. Utah, Sewage Treatment Plant.
15
DESIGN
In 1972 Salina City hired Canyon Lands Engineering to design modifications to the plant. By 1973 the design was finished. It was decided that the new construction to the sewage treatment plant should be staged. The initial step would consist of an aerated equalization basin, a recirculation pump station for the trickling filter and repair of the anaerobic digester. The flow diagram for the plant is included in Figure 1. The aerated equalization basin would be used to dampen out the high flows and BOD's produced by the turkey plant during the day. At the same time the turkey plant planned to implement a water conservation program and install flotation tank for the removal of grease and feathers. The plant would then be reevaluated after construction had been completed and after changes had been made within the turkey plant. It was felt that with these changes the plant could meet its N.P.D.E.S. Permit requirements of 25 mg/l for BOD and TSS and 2000 and 200 11m] for total fecal coliforms respectively. The construction at the plant was completed by the spring of 1976. During construction a full time operator was hired from the local community. This man had no previous experience in the operation of sewage treatment plants. The plant went on line in June 1976.
PLANT START-UP
Initially, the plant operated as expected. A characterization of the sewage flows entering the plant during this period appears in Table 1. The flows averaged over 0.3 MGD during the summer. The effluent BOD and TSS for the month of July averaged 19 mg/I and 22 mg/l respectively, well within the permit limits of 25 mg/l. However, there were indications of problems. The dissolved oxygen concentrations in the aerated equalization basin were at 1.0 mg/l and were dropping. By August the D.O. concentration in the aerated equalization basin dropped to only a trace. This adversely affected the effluent quality of the plant. The average BOD and TSS for August were respectively 32 mg/l and 42 mg/l.
At this time, Salina City sought assistance in the operation of the new facility and in training their operator. Plant start-up at the Salina Plant began September 1, 1976. by Valley Engineering. Inc. As a result in the plant start-up the following operational changes were made:
1. More frequent cleaning of grit chambers 2. Minimize recycling of flow back to the head of
the plant 3. Optimized the recirculation of flow around the
trickling fIlter 4. Operation of aeration basin as an equalization
basin 5. Optimization of wet all pumping

AERATED EQUALIZATION BASIN p
t . .
EFFLUENT TO ..... _---------~-o ..... J~!.!!.i-....L.SEVIER RIVER
._._., i
...... ¢=:;;::;:;;:;::2~....!iINt!F:.\;iLUENT HEAOWORI<S
SLUDGE DISPOSAL ___ ..., SLUDGE DRYING SEDS
Figure t. Flow di.agnJm, Salina Sewage 7'lreatment Plant.
Table 1. CAamcterization of the sewage flows entering the Salina Sewage 7Ireatment Plant in 1976 during the plant start-up.
Influent BOD with turkey plant Influent TSS II n 11
Influent BOD without turkey plant Influent TSS II It n
Maximum Daily Flow with turkey plant Average Daily Flow" " " Minimum Daily Flow "
Maximum Daily Flow without turkey plant Average Daily Flow U H If
Minimum Daily Flow
= 200-400 mg/l 200-400 mg/l 150-200 mg/l 150-200 mg/l
0.55 MGD > 0.3 MGD = 0.05 MGD
= 0.27 MGD = 0.1 MGD
0.05 MGD
In addition to the operating changes. the plant start-up identified several piping and process changes which were necessary. The following modifications are presently being made to the plant by means of a change order to their existing EPA grant:
1. Install new influent flow recorder and totalizer 2. Modi!1 Plant by-pass to flow to the aerated
eqUalization basin 3. Modify existing wet wall pumps 4. Install new aeration system with increased
capacity in the equalization basin 5. Place rip rap in the equalization basin down to
the bottom 6. Modify blower buildings
16
7. 8. 9.
10.
11.
Pipe supernatant return to the wet well Install sight glass in secondary sludge line Construct new wash water system Modify chlorination system to include post clarification chlorination Obtain laboratory equipment
Because of the difficulty in separating the operational changes from the physical changes needed for a better operation. the major items will be discussed together in an order which will reflect the flow through the plant.
The sewage enters the plant and immediately flows through the Parshall Flume. Two problems were noted with the flume and the flow recorder. The flow entering the flume was not being evenly distributed across the throat of the flume. This problem was caused by the influent pipe not being in alignment with the throat of the flume. thereby causing the water "to bank" on one side of the flume. This problem was drastically reduced by taking a sludge hammer and knocking out one side of the pipe. This produced a more uniform distribution of flow across the flume. The second problem with the meter was with the recorder-totalizer. It needed frequent cah'bration. and the totalizer was always giving erroneous readings. Parts couldn't be obtained for repair because the meter was obsolete. The only way to solve this problem was to totally replace the recorder-totalizer. The correction of these problems is paramount to the proper operation of the plant. Because only by knowing the flow entering the plant

will the operator be able to obtain total equalization of flow. Because of the problems with the flow meter the flows reported in this paper are at best only good estimates of the actual flow.
The sewage then flows out of the Parshall Flume and into the grit channels. Because of the turkey plant operation, the sewage contains large amounts of grit. It was found that the operator was not cleaning the channels frequently enough, thereby allowing grit to enter the wet well. As a result of plant start-up the grit channels are now cleaned two to three times per week during the turkey season.
Two problems were noted with the operation of the wet well. The first problem was the result of an inoperative float valve on the secondary sludge return line. The float had been removed and the operator was returning a constant amount of sludge to the wet well. The recirculation was excessive and when combined with high flows from the turkey plant during the day, it produced flows estimated to be in excess of 600 GPM. The sewage is pumped out of the wet well using two float activated 460 GPM pumps. However, the discharge capacity of one of the pumps had been reduced to about 800-850 GPM, because of wear on the impellar from pumping excessive amounts of grit. When high flows occurred both pumps would kick on and they would pump about 750 to 800 GPM to the primary clarifier. In order to correct this problem, it was necessary to minimize the recirculated flow during high flow periods and obtain better control of the wet well pumps. The float valve was repaired and was set to recirculate flows only at low flow periods which occurred during the night when the turkey plant was not operating. The secondary sludge was then returned to the wet well several times each day by manually opening the float valve. Once the recirculation flows were reduced, one of the wet well pumps could handle the entire flow. It was decided that the best operation for pumping from the wet well would be to produce a uniform flow to the primary clarifier. In order to do this it would be necessary to reduce the flow of the wet well pump so that it would run continuously and not kick off and on. This was done by partially closing a valve on the discharge side of the pump and making the discharge from the wet well pump equal the average flow produced by the turkey plant. After several weeks of trial and error, the desired operation was achieved. One pump ran constantly and variations in flow resulted in fluctuations in the water level of the wet well. Only on rare occasions would the water level raise high enough to turn on the second pump.
Before the changes were made in the operation of the wet well, the excessive flows being pumped to the primary clarifier resulted in operational problems in the primary clarifier. During high flow conditions it was estwated that the surface settling rate was 2400 GPD/ft and the detention time was less than 30 minutes. In addition, during this time there was extensive short circuiting. This problem was probably best characterized by the black grit which would collect in the weir troughs of the primary clarifier. Needless to say, the overall removal efficiencies for BOD and TSS were dramatically reduced. The increased BOD loading to the aerated equalization contributed to its operation problems. Once constant flows were pumped to the primary clarifier, the operation
17
. ,
, ... \ ;
returned to normal conditions. SettleabJe-.Solids removal are now greater than 90 percent and T8S removals are approximately 50 percent.
the previously mentioned problems of anaerobic conditions in the aerateiJ equalization basin were the direct result of an engineering design oversight. However, it should be mentioned that the inefficient operation of the primary clarifier did not help this problem. Review of the design calculations showed that the aeration system was inadequately designed and that adequate amounts of oxygen could not be supplied by the existing aerator. In addition, the aeration system selected would not allow equalization. The State Health Department's requirements of 3 feet for freeboard resulted in a minimum depth of 5 feet. The minimum suggested operation depth by the manufacturer was 5 feet. This resulted in the maximum and minimum depth being the same. Therefore, equalization could not occur without a loss of aeration efficiency. While a second compressor was available for increased air flow, it could not be used with the system because of excessive pressures which developed. During anaerobic conditions, excessive amounts of sludge from the bottom would rise to the surface of the equalization basin. The. equalization then pumped it to the triekling filter, where it would clog the orifices in the rotary distributor. At times it was necessary to clean the distributor arm twice a day. In addition, it was. apparent that the anaerobic conditions in the equalization basin significantly reduce the BOD removal efficiencies of the trickling filter process. In order to solve these problems, it will be necessary to install a new aerator with increased capacity and which will lay on the bottom of the basin. The existing aeration system will be used but will be modified so that excessive pressures will not develop when the second compressor is running. The end result of these modifications to the equalization basin will be: 1) to allow the depth to fluctuate, thereby obtaining equalization and improving the performance of the triekling filter and the secondary clarifier; 2) to provide increased aeration capacity, thereby eliminating anaerobic conditions; 3) allow both blowers to run simultaneously, if necessary.
The trickling filter is a 105 foot diameter standard rate triekling filter. It was initially designed very conservatively. It will take flows up to 0.9 MGD and still be classified as a standard rate filter. It was for this reason that a recirculation pump station around the triekling filter was designed and constructed. Soon after construction, problems surfaced with the automatic control and operation of the two pumps. It was determined that the float switches had been wired as if the pumps were to act as wet well pumps. As a result the recirculation pumps would turn on as the flows increased. This is exactly opposite of the proper operation. The system is now operated manually with one pump running continuously. The system will be rewired, so that the second pump will turn on if low flow conditions occur. It should be mentioned that besides providing for increased BOD removal efficiencies, recirculation also helps keep the distributor arm moving during low flow periods when the turkey plant is not operating.
Another problem which was identified during plant start-up was the erratic concentrations of total and fecal

coliform in the plant's effluent. The variation was attributed to the pre-clarification chlorination process which was being used at the plant. At the same time the problem wasn't considered critical. The 1.0 mg/l chlorine dosage and the total and fecal coliforms were for the most part kept under the permit limitation of 5000 and 500 ##/100 mI respectively. However, the permit conditions were going to change on June 30, 1977. The chlorine residual requirement would then be lowered to 0.5 mg/l and the total and fecal coliforms concentrations would be lowered to 2000 and 200 ##/100 mI respectively. It was felt that at this time the permit conditions would be extremely hard to meet with the existing preclarification chlorination· process. Since the chlorination process is much more efficient, once the solids have been removed, the permit limitation after June 30, 1977 could be met by post-clarification chlorination. Fortunately for Salina. they have a 1450 foot 15 inch sewer outfall line to the Sevier River. Flowing full, this line can provide over 1 hours detention time and could be utilized as a chlorine contact chamber. In order to use the outfall line, it will be necessary to put a riser on the end of the pipe. thus backing up the water in the pipe and allowing it to flow full. The chlorine feed line will then be extended to the secondary clarifier effluent box. The modified chlorination system will then allow for pre-and/or post-clarification chlorination.
Proper operation of a sewage treatment plant requires the laboratory analysis of various chemical parameters and the Salina sewage treatment plant is no different. During plant start-up the laboratory was found to be deficient. As a result much laboratory equipment was purchased and is now being used. Some of the more notable pieces of laboratory equipment were the dissolved oxygen meter, the pH meter, the turbidimeter and a DPD (Diethyl-ppenylene Diamine) free and total chlorine test kit. The dissolved oxygen meter became invaluable in trouble shooting the problems with the aerated equalization basin. It was used daily during the time the aerated eqUalization basin was in service. The pH meter was obtained because a daily pH measurement is required by the discharge permit and a more accurate measurement could be obtained at the plant than could be obtained by shipping a sample to a commercial laboratory in Salt Lake City. The turbidimeter will be used to evaluate the performance of the secondary clarifier. In the past the operator has used the settleable solids test for this purpose. But the test becomes useless when the concentration drops below 0.1 mI/l. The turbidimeter will allow the operator to monitor the operation of the secondary clarifier when the suspended solids are very low. The DPD chlorine test kit was obtained because the orthotolidine test kit the plant had did not meet the requirements of its discharge permit.
In addition to the changes already mentioned, many piping changes were made. These changes resulted in the virtual elimination of plant by-passes and easier operation and maintenance of the facilities.
RESULTS
It is very difficult to state what all the exact results of the plant start-up will be. The operator now understands the various processes and is aware of factors controlling
18
their operation. He is now capable of evaluating each process and obtaining optimum operating conditions. Work is still progressing and even after completion, additional time will be required for full evaluation. Significant improvements have been made in the performance of the plant. It is anticipated that the plant will meet its June 30. 1977, discharge requirements for BOD, TSS, chlorine residual and total and fecal coliforms. This could not have been accomplished without the plant start-up and operator training.
CONCLUSIONS
1. When working with smaller towns, the engineer must follow up on unique or nonstandard designs to insure that they will be operated as designed.
2. Often the operator will not have previous operating experience and will require training.
3. Plant start-up and operator training at the Salina sewage treatment plant resulted in the proper operation in the equali2ation process as well as the other processes in the plant.
4. The improper operation of wet well pumping and excessive recirculation resulted in operational problems for the primary clarifier, which aggrevated the already existing operational problems within the equalization basin, which in turn created operational problems for the trickling filter and created excessive BOD concentrations in the effluent of the plant.
OPERATION & MAINTENANCE SERVICE
TREATMENT PLANT DESIGN
PLANT START' UP
offices in Logan,Richfield and Vernal
Utah
telephone 801/753'0153
VALLEY ENGINEERING INC.
CIVIL AND ENVIRONMENTAL ENGINEERING LAND PLANNING AND SITE DESIGN LAND SURVEYING ~

Panel Discussion 208 and RegionaliZation
in Mountafularid . StepAenE. Sowby, P.E.·
ROLE OF MOUNTAINLAND ASSOCIATION OF GOVERNMENTS IN WATER POLLUTION CONTROL
In 1974, elected officials in the MAG area determined that they should be involved in ~ater qu~y manage~~nt because of the interest and desJl'e of thelr member CIties and counties. EPA provided funding in 1975 fo~ a 208 areawide water quality management study. MAG 18 made up of Summit. Utah. and Wasatch Counties and the following communities in those counties.
Coalville Midway Springville Oakley Lehi Mapleton Kamas American Fork Spanish Fork Francis Pleasant Grove Salem Park City Alpine Payson Snyderville Orem Spring Lake Charleston Provo Santaquin Henefer Heber Lindon Salem Hills
At this stage, it may be well to state that MAG is not another layer of government nor is it a regional government. The association is exactly that-an association-made up of and working for local cities and counties. MAG is working for local government in trying to reduce expenditures while achieving cost-effectiveness and good operating conditions. The association staff does only those things that are requested by the member agencies, and all staff action and plans, including regionalization of wastewater facilities, must be approved by the advisory and executive committees made up of elected officials.
REGIONALIZATION AND 208
At the outset of this presentation, may I state that 208 does not necessarily mean regionalization. Somehow these two words seem to be equated. This simply is not so. The goal of Section 208 of P.L. 92-500 is not to regionalize wastewater treatment plants and do away with the sovereignty of individual cities and towns. Rather, it is an areawide water quality management program to intensively study the overall water pollution control and management problems. Section 303 is a basin approach and Section 201 provides for individual facility construction funds. So let's not automatically equate 208 with regionalization although it has taken 208 studies and staffs to achieve regional cooperation in most cases.
NON-POINT SOURCE POLLUTION
Perhaps the greatest contribution of 208 is in the evaluation, identification, and monitoring of non-point sources of pollution. Very little was said prior to 208 about non-point pollution-not to even mention management of
*Stephen E. Sowby is with Mountainland Association of Governments. Provo. Utah.
19
these fugitive sources. Now, however, we recognize the magnitude of these problems and the need to manage and control them. However. our purpOse today is not to discuss these non-point sources. So let's turn our attention to what the 208 Study recommends for point source management.
COST EFFECTIVENESS
One main re«plirement of both 208 and 201 is to develop cost-effective plans for wastewater treatment facilities. This involves studying alternatives to combine municipal plants. Both the 303. the 201's, and now the 208 basically confirm the findings of each other. Regionalization is cost-effective in most cases. especially with new higher levels of treatment required by the State of Utah. With more sophisticated processes, higher O&M costs, expanding population, accelerated coru:true,tio~ cos~, and ensuing management problems. reglonalizatlon m the three-county area of Mountainland is cost-effective.
RESULTS OF THE 208 STUDY
Now for a few facts and figures: These will be general in nature and more specific answers can be given in the Q & A period. Suffice it to say that not everything is set in concrete and many decisions are yet to be made by the local elected officials in the affected cities and counties. The information presented below represents the best recommendations of the MAG 208 Study.
NUMBERANDLOCATIONOFFACIL~S
There are now 26 cities and towns in the MAG area, 17 of which had sewer collection systems and treatment facilities last year. It is anticipated that by 1995 there will be 11 or 12 wastewater treatment facilities serving 25 commmities. Seven of these 11 plants will incorporate some form of regionalization while four will remain a facility for an individual city only. In other words. regionalization is beneficial to more than half of ~he communities of Summit. Utah, and Wasatch Counties. Where possible. MAG is merely adopting the completed 201 plans and regionalization schemes as part of the 208 areawide plan.
TREATMENT PROCESSES AND CONSTRUCTION DATES
Construction of these facilities will take place between now and 1985 depending on federal funding. Treatment processes will vary. including single stage trickling filters, two-stage trickling filters. activated sludge. extended aeration oxidation ditches. phosphorus removal, and granular media final filters. Individual schedu~es ~d processes will be answered at your requests. InfiltratIOn and storm water are also handled differently in each case, and expansion of collection and treatment facilities will proceed as the need warrants.

SERVICE CHARGES, BILLINGS, AND MANAGEMENT
Service charges will range from between $4 to $15 per month for residential users with connection fees ranging from $200 - $1.500. Billings in most eases will be done by the existing municipalities. using existing personnel. Management of the collection facilities varies widely with the loeality. Included will be existing municipalities. cities. county service areas and sewer districts. special service districts, or a combination of the above. Some management boards are appointed. some elected. with local mayors and city councilmen on the board in most eases.
OPERATIONS
There are now 35 operators at the 17 present wastewater treatment facilities and it is anticipated that there will be a minimum of 60 operators required for the 11 or 12 facilities by 1995. This does not include collection system personnel or other water treatment or distribution system operators. Some supervisors. managers and lab technicians have been included. This is a low figure and could go as high as 80 under full capacity. 24-hour operation, and expanded monitoring requirements. This represents roughly a doubling in the need for trained, quaIified personnel.
TRAINING
It can be easily seen that there will be no loss of operator jobs. There is. indeed. a need for more and better-trained operators for water distribution and wastewater facilities. Operators need to be educated and trained in management, new treatment processes, repair and maintenance, electrical systems, and communication skills. Newer equipment and better working conditions will result and personnel need to be flexible and adaptable to changing conditions. Training opportunities are expanding under programs of Utah State University and Utah Technical College. Certification is becoming more necessary and continuing education is a must. Repairs will always be necessary as will maintenance of existing equipment.
20
CONCLUSION
Specific information on regionaJization on a plant-byplant basis can be obtained from the MAG staff or individual city concerned; but regionaIization is becoming a fact of life. There will continue to be a need for good quality operators and training is essentiai. Sewer service costs will continue to rise and population will continue to grow. You, the operator, are an essential part of this entire process.
FOLSOM
We are pleased to announce
DEAN R. WORLEY
has joined us as Manager. Water and Wastewater Division.
We represent, among other firms. ENVIREX (Rex Chain Belt), LFE, Clow Corp., and General Filter.
Dean looks forward to assisting you in selection and application in this field.
Use our toll free number. 800-453-8007, when calling from Idaho. Wyoming, and Nevada.
H. A. Folsom and Associates 1815 West 2300 South Salt Lake City. Utah 84120 801-972-4600

Wastewater Filtration, De$igtI Considerations .
E. Robert Baumatm*
INTRODUCTION
Wastewater filtration is but one of the design engineer's alternatives which can be considered in wastewater treatment flow schemes to meet specified effiuent quality objectives. He should consider it along with other alternatives, finally reaching a decision as to which of the several alternatives is cost effective. This paper presents the questions which must be asked in wastewater filtration, the alternatives available in answering the questions, and the design procedures involved in those alternatives.
The paper presumes that the reader is familiar with granular media filtration from potable water experience or from study of textbook sources (1), and therefore stresses the special aspects related to wastewater filtratio~. Typical wastewater filtration flow schemes are shown m Figure 1.
The first and most important question the designer must ask is whether filtration can meet the specified effiuent quality goals. U the goal is to upgrade the effiuent of an existing secondary treatment works, one must first evaluate the present performance and the reasons for that performance. For example, what portions of the present effiuent BOD are of soluble and suspended origin? The filter can only remove a portion of the suspended BOD. U the effiuent contains high soluble BOD, the only solution may be to upgrade the secondary treatment. If the e~uent contains primarily suspended BOD, effiuent filtration or upgrading the secondary settling will be possible alternative solutions.
The expected performance of the granular filters can be estimated from the performance at similar" plants elsewhere, or by pilot studies at the plant in question. Similar compilations with more data from U.S. activated sludge plants are available in recent EPA Design Manuals (2,3). The mean range of the performance data from these two sources is summarized in Table 1.
The data in Table 1 and the sources from which it was derived indicate that a marginal secondary effiuent could easily be upgraded to a 30·30 standard, and probably to a 20·20 standard, by tertiary filtration, i.e., without. chemical treatment. A good secondary effiuent which already meets the 30·30 standard may approach a 10·10 goal by tertiary filtration. If the effiuent quality goal is less than 10·10, some form of chemical treatment will be needed in the secondary or in a tertiary stage prior to filtration.
After considering the effiuent quality goals and the ability of granular filtration to achieve those goals, if
·E. Robert Baumann is Anson Marston Distinguished Professor of Engineering, and Professor of Civil Engineering. Iowa State University, Ames. Iowa.
21
Table 1. Medilm range' of perf01'11iance of wasteUJater filters, dombined data jrQm Appendix A and ReferenCe 2. The data below give the range of mean values and the medilm of the means including aU filtration rates from 2 to 6 gpm/Bq It (inclusive) and media sizes 1 mm effective size.
Filter Influent Type Suspended Solids (mg/l) BODS (01g/1)
Influent Effluent lnfluen.l Effluent
Range Median Range Median Range fledian Range Vedian
Tertiary Filtration 20-51 29 5-13 of Trickling Filter Plant Effl uent
n ~ (number Of observations
Terti ary Fil tration of Activated Sludge Plant Effluent
n • 31
7-55 16
n 23
6-16 10
n = 7
n 31
2-10
n ~ 23
1-8 1.5
n 6
23·35 30 10-14 12
n 6 n 6
No Data
No Oata
filtration is still one viable alternative, the following design questions must be considered in arriving at a successful installation.
1. What are the appropriate flow schemes? 2. What minimum filter run length is acceptable? 3. What filter configurations are appropriate for
wastewater? 4. Is pilot scale testing needed, . and if so, how
should it he conducted? 5. What filtration rate and terminal headloss
should be provided? . 6. What filter media size and depth should be
provided? 7. Should gravity or pressure filters be provided? 8. What system of flow control should be used? 9. What backwash provisions are needed for each
filter media alternative being considered to ensure effective backwashing in the long term?
10. What underdrain system is appropriate for the media and backwash regime intended?
FILTER DESIGN-GENERAL CONSIDERATIONS
Mbdmum. Aeeeptahle FDter Run Length
Since the capital cost of a filter is chiefly a function of the area of filter provided, the use of a high filtration rate is usually preferred. In general, the filter design should seek to maximize the net water production per square foot of filter consistent with filter operating feasibility. Useful relationships between net water production and ~n lengths obtained at different filtration rates are shown m Figures 2 and 3. Two alternatives exist. The. first case shown in Figure 2, occurs when filtered water IS used for backwashing as in all potable water filtration ".nd most

wastewater filtration plants. The second ease, shown in Figure 8, occurs when unfiltered water is used for backwashing.
The latter method is used for some wastewater filters. However, it is not generally recommended because of potential clogging of underdrain strainer or orifice openings.
The data for both figures was calculated assuming 80 minutes total. down time per backwash to allow for draindown time, auxiliary scour time, actual backwash time ~d start-up time to reach normal rate. A1so, the 100 gal/ft total wash water per backwash is typical of volumes adequate for most filtration situations. In the ease of recovered wash water, it is assumed that dirty wash water would pass through a holding tank to permit flow
BACKWASH WATER RECYCLE
(0)
PRETREATED PRIMARY RAW CLARIFICATION WASTEWATER '--.--___ -'
fiNAL SLUDGE RECYCle
WASTE SLUDGE
BACKWASH WATER RECYCLE
(b)
PRETRE.ATED PRIMARY RAW CLARIFICATION WASTEWATER .......,,------'
WASTE SLUDGE
BACKWASH WATER RECYCLE
(e)
PRETREATED PRIMARY RAW CLARIFICATION WASTEWATER 0..-,------'
equalization of the recirculated water. An example calculation for Figure 2 is shown below:
BaCkwashes per day (S-hour cycles) = 4 Downtime per backwash = 80 min Actual filtration time (1,440 • 4 x 80) = 1820 min Plant production = 4 gal/min/ft2 x 1440 min/day =
5760 gal/day/ft2 Backwash water used = 100 x 4 = 400 gal Needed filtration rate during actual operating t\re =
(5760 gal + 400 gal)/1820 = 4.67 gal/min/ft Backwash water as percent of production = (400/
5760) x 100 = 6.9 percent
Figure 2 whicb is appropriate for most wastewater filtration, would indicate little loss of production if the number of backwash cycles per day per filter is limited to four or less, i.e., 6 hour filter cycles or longer. Thus, under
ORGANIC CARBON
CHLORINE CONTACT DISCHARGE AND/OR TO RIVER
BACKWASH STORAGE
TANK
CHLORINE CONTACT AND/OR DISCHARGE
BACKWASH TO RIVER STORAGE
TANK
CHLORINE CONTACT AND/OR DISCHARGE
BACKWASH TO RIVER STORAGE
TANK
Figure 1. Granular media filters for tertiary wastewater treatment: (a) folImcing biological secondary treatment for carbonaceQUIJ BOD 1'ef1W1Jal; (b) folJowi:n.g biological secondary and biological tertiary (packed-bed reactors) treatment for earbonaceQUIJ BOD and ammonia reduction; (c) following biological secondary and biological tertiary (packed-bed reactors, both aerobic and amerobic) for earbonaceQUIJ BOD, ammonia, and nitrate reduction. (Phosphonu levels may also be reduced by adding ferric or aluminum salts and a polymer feed to solids contact units located ahead of the granular-media filters.)
22

NEEDED FILTRATION RATE (GPM/SQ FT)
DURING ACTUAL OPERATING TIME
Figure 2. Effect of number of filter cycles per (i4y on filtrate production with filtered water v.sed for backwashing. Pl4nt Production is the average plant output over the fuJl ~ hours of ~he do.y.
the peak flow and suspended solids load conditions predicted for the design year. the cycles should be at least 6 hours. Considering typical flow and solids load variations. this should result in 24 hour cycles under average design year loads.
One must keep in mind the conditions selected. to construct Figures 2 and S. Some filters require more than 30 minutes to complete a backwash cycle, especially if complete gravity draindown is essential or desired. Some require more than 100 gal/sq ft/wash. If the downtime and water use for a particular type of filter are expected to deviate significantly from those used above, then the figures should be reconstructed and the cycle length decision reconsidered. Different baekwashing routines are discussed in more detail in a later section of this paper.
FDter CoaIigaratioas
A filter configuration must be selected for a wastewater filter which is appropriate for the higher influent solids anticipated as discussed in the previous sections. A granular media filter is intended to filter in depth, i.e., it is intended that solids removal take place within the filter. 8l!d n_ot primarily at the entering surface.
A number of alternate filter configurations have developed to accommodate the higher solids loads I described above and to encourage filtration in depth. These are illustrated in Figure 4.
23
IO~----------------------------------~
z 2 6 I-U :::l C o a: Q. <4 I-Z <t ...J Q.
2
Filter cycles per day
O~------r------'------.-------r-----~ o 2 4 6 8
NEEDED FILTRATION RATE IGPM/sq. ft.l DURING ACTUAL OPERATING TIME
10
Figure 3. Effect of number of filter cycles per day on filtrate production when using unfilter.:d water for backwashing. Pl4nt Production is the average plant output over the juU ~ hour day.
FD...TER DESIGN -DETAILED CONSIDERATIONS
The objective of filtration is to produce the desired quality and quantity of filtrate at least cost per unit of filtrate produced. The designer must choose between the various pretreatment alternatives and various performance variables discussed below in reaching a final design. The various alternatives must be tested against the basic objective.
The variables which affect performance fall in two categories: (1) the influent suspended solids variable. such as the type. amount. and filtrability of the solids. and (2) the physical filtration variables such as the rate of filtration, terminal head loss provided; and the size, depth. and type of filter media.
PRot Seale TestJac
When new types of waters are to be filtered containing solids of unfamiliar filtrability, pilot testing may be necessary to arrive at the proper design. Pilot testing on various wastewaters has become increasingly common as such filters are needed in process flow schemes.
The pilot filtration apparatus should have three or more filters which can be run in parallel. This is necessary because the influent solids may change from day to day (even hour to hour) so that various design or operating variables must be compared in parallel rather than sequentially. The three pilot filters can be operated in a

series of experiments to evaluate the effect of media size, media depth. media type (single. dual or multi media) and filtration rate on filtrate quality and head loss generation. The filters should be equipped with pressure taps at intervals through the depth so that the extent of depth filtration can be aseertained. The influent and effluent would be monitored for suspended solids, turbidity and other parameters of interest so that the ability to achieve filtrate quality goals can be determined, and the relation of solids load to head loss development can be approximated. The pilot experiments should cover the full range of the variables that may be used in the plant design, e.g .• filtration rates of 2 to 8 gal/min/ft2 and terminal head
losses to say 30 feet. A good deal about expected performance can be learned by studying the results of . other investigators who have filtered similar influent solids. Substantial data of this type is presented for wastewater filtration in other sources (2. 3). Table 2 contains typical pilot plant data.
Influent
~ T Fine ~~_
.' .-~
.:0 Sand M ,
...". N
~ .Cogrse· ~
.'
Underdrain system
Conventional sand
Influent
~
T Coarser sand unstrcti fi ed
1 "
- '-+-
Effluent
Single media unstratifi ed'
fi Iter
OptimizathJD CorudderatioDa
The various feasible design alternatives which will meet filtrate quality goals can be compared on a capital and operating cost basis.
- -- v-... ~ ~-
Influent Influent'
~ ~ \~~\~~\~~\\~~'~~ '\ \\,'\,\\\ '\
\ \\\ \"" \\\ \\\\
Co \(\ 'Coo I' \ ~ \\ \ \\~\ '\ ,,'\, \\,
~~{~~~~~~~~~~~~ ~~\~~~~~~~~~~~~~
arse
: ~ ~'\ ~ ~ . .\ ~ ~ {',\\\~ \~-: .,,'\ I"" C \\~\Coa \~\\ \\,' \\'\
~{.\ ~ ~;.' ~{-.;.~ ~ \\~ ~ .--- Fi ' Sil ica Sand -
oarse
ner Sand
Fin . . Gc:r';e(S~n~ FI e -~ -
-nest
Effluent r---
Dual media
Effluent
Triple (mixed) media
'-----H ...
T Sand ~ size range
unstrcti fi ed 11-2mm
4i ~ 2-3 mm >0 N, t--.;.....~.:..--I
10-15 mm ,'i\ ~ \.J 20-30 mm
T""'"------'+'----" Influent
Upflow "Immedium" fi Iter
Retaining grid
~
Effluent
+ Effluent collecter
Sand
• \.,:-
Bi-flow fi Iter
II Influent
-
Figure... Sch.ematic diBgra'I'IUI of filter configuratiom for granular media filtration.
24

Table I. Solids capture per foot of Aead loss i1IcreaBe in direct filtration -of secondary effluents.
Solids Capture
Filtration Mode Media lb/ft2/ft Secondary Effluent Rate 2 of Size Headloss
T~Eel ga 1 Imi nlft °Eeration rnm Increase Reference Location
TF (Full Scale Sand) 2.5 - 4 C 0.85-1. 7* .04-.05 9 & 10 Luton, Eng. TF (Pilot Dual Media) 2 - 6 C 1.84 ES 0.07 7 Ames, Iowa TF (Pilot Sand) 2 - 6 C 0.55 ES .06-.07 11 Ames, Iowa TF (Full Scale Sand) 2.3 0.55 ES .03 12 Pretori a TF (Pilot Dual Media) 2.1 C 1.03 ES .08 8 } Ames,Ia Para-TF (Pil ot Sand) 2.1 C 2.0-3.6* .16 lell Operation TF (Pilot Dual Media) 3.2 C 1.03 ES .04 8
J Ames, Ia Para-
TF (Pilot Sand) 3.2 C 2.0-3.6* .14 lell Operation TF (Pilot Sand) 3.2 - 3.B 1-2.06* 0.29 13 Finham, Eng. TF (Pilot Sand) 2 C 2.31 ES* 0.23 14 1 TF (Pilot Sand) 2 C 1.B2 ES* 0.19 Ames, Iowa
TF (Pi lot Sand) 2 C 1.49 ES* 0.11 Parallel
TF (Pilot Sand) 2 C 0.97 ES* 0.06 \ .)
Operation
TF (Pil ot Sand) 4 C 2.31 ES* 0.26 14 -, ~ i Ames, Iowa TF (Pilot Sand) 4 C 1.82 ES* 0.21 i TF (Pilot Sand) 4 C 1.49 ES* 0.12 >
Parallel
TF (Pilot Sand) 4 C 0.97 ES* 0.07 \ Operation , ---'
TF (Pilot Sand) B C 2.31 ES* 0.31 14 --I
jAmes, Iowa TF (Pilot Sand) 8 C 1.B2 ES* 0.26 I
:- Parallel TF (Pi lot Sand) B C 1.49 ES* 0.15 i
I Operation TF (Pilot Sand)
j
8 C 0.97 ES* 0.10 J
AS (Pilot Dual Media) 16 C 1. 78 ES .35 15 l Cleveland, Oh AS (Pilot Dual Media) 24 C 1.78 ES .093 r Parallel AS (Pilot Dual Media) 32 C 1. 78 ES .093 ! Operation
"V
AS (Pil ot Dual Media) 16 D 1. 78 ES .23 15 .--, Cleveland, Oh AS (Pilot Dual Media) 22.2 D 1.78 ES .21 r Parallel AS (Pilot Dual Media) 27.6 D 1. 78 ES .12 Operation AS ( Pil ot Upfl ow) 2-5 C 1-2* .26 16 w. Hertford-AS (Pilot Dual Media) 5.1 C LOB ES .24 17 shire, Eng.
AS (Pilot Dual Media) 5.1 C 1.45 ES .34 17 TF (Pilot Dual Media) 4.24 D 1.28 ES 0.07-0.10 36 Nevada, Iowa AS {Pilot Dual Media) 4.24 0 1.28 ES" 0.01-0.04 36 Marshalltown, lOWe
~TF = trickling-filter-plant final effluent; AS = activated-sludge-plant final effluent. C = ~orystant rate; D = declining rate. *Media size range, unstratified due to backwash
**prov1 Slons. . ES = effective-size of media, in dual media, only the top coal layer ES 1S presented. ES* means unstratified due to backwash provisions.
2S

A particular combination of the physical variables may result in the filter effluent quality reaching its upper limit of acceptability at the same time that the total head loss reaches a selected limit. Such a combination constitutes an optimum (18), or more precisely has been described as an operational optimum (19). A number of operational optimums are possible with a given influent water and filtrate quality goal. but only one would yield water at least cost, i.e., at the economic optimum. In recognition of these concepts. attempts are being made to optimize filter design (19, 20. 21).
Seleetion of FiltratioD Bate and TermIDaI Beadloss
Wastewater solids may generate rapid headloss development due to the high solids concentrations in the filter influent and the strong surface removal tendency of the solids. This is especially true in the tertiary filtration of secondary effluents where filtrate quality is not appreciably deteri~rated by filtration rates as bigh as 6 or 6 gal/min/ft using media with effective sizes up to about 2 mm with media depths appropriate ~ the size. Nevertheless, averar. rates of 2-3 gal/min/ft and peak rates of 6 gal/min/ft are common to achieve run length objectives (2). Thus, in wastewater filtration, the rate of filtration is dictated more by run length considerations than by filtrate quality considerations.
Modeling of the filtration process has not yet progressed to the point where it is possible to determine precisely what economic filtration rate and terminal headloss should be provided for a granular-media filter. Huang and Baumann (20) found that the most economic terminal headloss for filtration of iron on unisized-sand filters ranged between 8 and 11 feet at all filtration rates from 2 to 6 gal/min/ft2. Normal American water treatment practice would use a terminal headloss of 8 to 10 feet when using gravity filters. The filtration rate and terminal head should not be so high so as to result in failure of the filtration process by solids breakthrough. However, solids breakthrough does not generally occur in the filtration of secondary effluents. A fraction of the solids pass through the filter during the entire run, but further deterioration does not usually occur as the run progresses.
Studies indicate that pressure drops of as much as 30 feet of water could be used in filtration of trickling filter effluents (7, 23) and in activated sludge effluents (16. 36) througft dual-media filters without solids breakthrough. Economic considerations, however. may dictate pressure filters if such terminal headlosses are to be provided.
The selection of the filtration rate and terminal headloss to be provided in design involves consideration of a number of interrelated questions.
What are the desired minimum and maximum filter run lengths? As discussed earlier, run length should be at least 6-8 hours to avoid excessive backwash water use, but less than about 36-48 hours to reduce anaerobic decomposition within the filter and possible detriment to the effluent BOD. The desired run length can be achieved by selecting either the terminal headloss or the filtration rate or both.
26
Will the backwash operation be automated to avoid manpower costs if short filter runs occur? Automatic backwash is commonly provided in wastewater filtration plants.
Is pressurized discharge desired to a subsequent treatment unit or to an effluent force main? Pressurized discharge would tend to favor the use of pressure filters. In such cases, higher rates and/or higher terminal beadlosses may be economieally feasible where they would not be with gravity filters.
Is the hydraulic profile of the existing secondary plant such that tertiary filters could be added without repumping by limiting the terminal headloss?
What is the size of the plant, the capital available. and the space available for tertiary filters? A large plant with adequate capital resources may prefer multiple gravity filters. at lower filtration rates and lower terminal headloss, using a more-or-less conventional water plant design. A smaller plant. or one with limited capital or space, may prefer pressure filters operated at higber filtration rates.
Are there any regulatory agency policies which require gravity filters or prohibit pressure filters, or does the client insist upon gravity filters for easier maintenance?
What variations in influent flow rate and suspended solids concentration are expected, and how will they be handled? If influent flow equalization is provided, this concern is partially eliminated. If 24-hour-minimum filter runs are the goal. the hourly variations in load will balance out over the day and become of less concern. On the other hand, if 6-hour-minimum cycles are selected, peak 6-hour loads would be of concern.
To answer these questions rationally, some method of predicting run length as a function of filtration rate, terminal loss, media size, and influent suspended solids is needed. As discussed earlier, pilot plant studies at the plant in question yield the most reliable prediction. In their absence, the designs can be based on a conservative value of solids capture per unit head loss.
If pilot plant data are collected for different filter media and different terminal head losses, the data can be used to select several alternative design combinations of media, filtration rate, and terminal head loss. These can be compared on the basis of capital and operating costs. Furthermore, if the flow and solids load variations are predicted. the operational consequences of those variations can be analyzed. One must be sure to limit the design alternatives to those that have been shown to produce acceptable filtrate quality.
To illustrate the use of pilot plant data, assume that the minimum desired run length is selected to be 8 hours, the maximum 8 hour influent solids concentration is estimated to be 40 mg/l. and the terminal head loss is limited to 10 ft by one of the factors discussed above. From the pilot study, the pe~ 8 hour filtration rate must then be limited to 6 gal/min/ft . If the average annual flow rate is

one third the peak, and the average influent solids is predicted to be 20 mg/l; then from the figure, the average run length could be 42 hours. It would be desirable under such loads to wash on a maximum 24 hour override to prevent anaerobic conditions in the filter.
If the design must be based on an assumed solids capture per unit head loss, then alternative designs can be selected as illustrated below.
Assume that a value of 0.07 lb/sq ft/ft head loss has been estimated for a trickling filter effluent and a media size of 1.2 mm ES from Table 2. This value can be used to estimate the terminal head loss that must be provided to achieve a desired filter run length using an estimated secondary effluent suspended solids concentration. For example, find the needed terminal head loss to achieve 24-hour average filter runs under the following conditions:
Average filtration rate = 3 gal/min/ft2, with range of 2-4.5 during the day
Average secondary effluent suspended solids = 30 mg/l
Average effluent suspended solids = 5 mg/l Average suspended solids capture = 25 mg/l Top media size = 1.2 mm
Calculate solids capture per square f~t per run: 25 mg/l removed x 3 gal/min/ft x 1,440 min/filter
25 mg/l removed x 3 gal/min/ft2 x 1,440 min/filter run x 8.33 106
= 0.90 Ib/ft2/run 0.90 Ib/ft
2/run 3 f /
Terminal head loss increase = 1 t run 0.07 Ib/ft2 /ft head loss
Thus, a terminal head loss increase of about 13 feet would be required to meet the 24-hour filter run. The initial head loss must be added to this figure to obtain the total terminal head loss. This total is above the normal head loss provided for gravity filters and suggests either that pressure filters be considered, or tgat the average filtration rate be reduced to 2 gal/min/ft .
The filter runs could become substantially shorter during periods of poorer secondary treatment plant performance. For example, if the secondary effluent suspended solids climbed to 50 mg/l, the run length would drop to 13.3 hours, other conditions being unchanged. Peak flows could prevail for such a run length, further accentuating the solids load and reducing the run to 8.9 hours. When filter cycles get this short, the backwash water being returned through the plant becomes substantial and further increases the load on the filters shortening the filter runs.
SeIeetIoa of Fater Meclia
The selection of the size and depth of filter media and the appropriate filtration rate are interrelated. In general, filtrate quality is improved by the use of finer media, greater media depth, or lower filtration rates. Similarly, head loss generation rate is increased by finer media, greater media depth and higher filtration rates. With some influent suspensions, these generalizations are not
27
demonstrated significantly. For example, in filtration of secondary effluents, filtration rate has little effect upon filtrate qu~ity over the usual range of rates employed, 2-5 gal/min/ft , and increased media depth may not compensate for coarser media in achieving filtrate qUality. As evidence, Tables 3 and 4 show that a dual media and a triple media filter provided slightly better filtrate quality than an unstratified coarse sand filter of 46 in. depth. Further, Table 5 shows that changing the depth of the unstratified coarse sand filter had little effect on performance at the filtration rate of 3 gal/min/ft2. However, greater depth is of benefit in maintaining filtrate quality at higher filtration rates (14).
Granular filter media commonly used in water and wastewater filtration include silica sand, garnet sand, and anthracite coal. These media can be purchased in a broad range of effective sizes and uniformity coefficients. (The term "effective size" indicates the size of grain (in millimeters) such that 10 percent, by weight, of the particles are smaller and 90 percent larger than itself. "Uniformity coefficient" designates the ratio of the size of grain which has 60 percent of the sample finer than itself to the effective size which has 10 percent finer than itself.) The media have specific gravities approximately as follows:
Anthracite coal, 1.35-1.75, Most U.S. anthracite 1.6-1.75, U.K. anthracite 1.35-1.45
Silica sand, 2.65 Garnet sand, 4-4.2
Table I. Performance of a dual media, triple media and unstratified coar8e 8and filter when filtering 8econdary effluent from the trickling filter pw.nt at Ame8, Iowa (8). Result8 are the mean values from periodic composite 8ample8 collected during 8 weeks of operation in 1974 at 2.1 gallmi'TI/jt2.
Filter Effluent
Dual ~~~~!6 Influent Mp.diaa
Suspended Sol ids 37.49 6.84 6.31 (mg/l )
n = 14d
TurbidHy (FTU)
n • 16
BODS (mg/l)
n = 13
Soluble BODS (mg/ll
n • 10
a Dual Media:
0=12.03e 0=3.23 0=3.87
16.38 2.38 2.20
0= 4.31 0=0.97 0=0.56
14.61 3.73 4.11
0= 6.00 0=1. 72 0=2.03
3.88 1.97 2.20
0= 1.79 0=0.96 0=0.99
15 in. of 1.03 mm ES coal, 1.57 U.C. 9 in. of 0.49 mm ES sand, 1.41 U.C.
Unstratified Nediac
7.92
0=5.80
7.89
0=1.10
4.73
0=2.56
2.34
0=1.11
b Triple Media: Same as above plus 3 in. garnet with 0.27 LS. and 1.55 U.C.
c Unstratified Sand: 46 in. of 2.0 mm LS. sand (2-3.6 mm size range, 1.52 U.C.)
d n => number of composites averaged, each representing one filter run
e a = standard deviation

The detrimental effects of the strong surface removal tendaney previously discussed for wastewater filtration must be counteracted by selecting a media size where the flow enters the media which will ensure that the bulk of the suspended solids removal does not occur at the entering surface. Pilot testing of different media is desired if time
Table 4. Per/ornw.nce of a dtuJl media, triple media and u1I.Btratijied coarse sand filter when filtering secondary effluent from the trickling filter plant at AmeB, Iowa (8). ReB'lLlts are the mean values from pe'l'Wdic composite sampleB collected dunng 9 weeks of operation in 1974 at I.' gal/min/jt2.
Filter Effluent"
Influent
Suspended Solids (mg/l)
34.08 7.05 6.82 9.46
n l4b 0=16.87C 0=4.27 a=3.l0 a=4.53
Turbidity (FTU) 17.60 4.80 , 6.78 4.66
n = 15 0= 6.18 0=2,28 0=3.01 0=2.12
B005 (mg/1) 30.38 12.68 12.99 14.46
n = 15 0=14.52 0=6.88 0=6.82 0'=6.56
Soluble BODS 9.67 7.21 7.27 7.78 (11l9!1l
n = 15 a= 3.76 0=3.72 0'=3.61 cr=3.57
a Filter media same as in Table IV-2a except coal depth in dual and mixed media incr~ased to 17 in.
b n = number of composites averaged, each representing one filter run.
c" standard deviation
Table 5. Performance of three u1I.Btratijied coarBe sand filters of different depth when filtering Becondary effluent from the trickling filter plant at AmeB, Iowa (8). Results are the mean valueB from periodic composite BampleB collected during 5 weeks of operation in 1975. Sand size was 2.5 to 1.7 mm size range.
Filter Effluenta
Filter ·-'1;lfii1. Influent Oepth
Suspended So 1 i ds 31.3 5.9 6.4 5.7 (mg/l)
cr(n 11 )c 9.7 2.1 2.1 1.8
Turbidity (FlU) 12.6 3.30 3.38 3.14
o(n=l1) 3.14 1.21 1.14 1.14
BODs (mg/l) 15.6 6.5 7.1 6.6
"(n = 11) 4.7 2.8 2.5 2.5
Soluble BDDS 5.3 3.9 4.0 3.8 (mg/!)
a{n = ll} 1.7 1.3 1.3 1.3
" Filtration rate,3.0 gal/min/ft2
b Filtrate from 24 inches of sand and 12 inches of supporting gravel
c 0= standard deviation. n'" number of composites averaged. Each representing one filtpr run
28
and budgets permit. If it is not feasible. the following information will assist in selecting the media size or sizes.
For the tertiary filtration of secondary effluents, media size of at least 1.2 mm E.S. is required, and coarser media is preferred if appropriate backwash is provided. Benefits to filter run length accrue at least up to 2.3 mm E.S. as shown in the prior solids capture data in Table 2.
For the filtration of chemiea1ly treated secondary effluents, a media size of not less than 1.0 mm has been suggested (2). However, benefits of coarser media should also occur here, and the sparsity of data makes pilot testing even more important.
Once the size of the media at the entering surface has been selected, the rest of the media specification is dependent thereon. For example, the uniformity coefficients, the size of the sand in dual media. and the depth of each media must be selected.
Low uniformity coefficients (U.C.) are desired to achieve easier backwashing. This is especially true where fluidization of the media is required during backwashing as with dual and triple media filters. This is true for dual and triple media because the entire media should be fluidized to achieve restratification; therefore. the greater the U.C. (i.e. less uniform size range), the larger the backwash rate required to fluidize the coarser grains thus provided. A U.C. of less than 1.3 is not generally practical because of the sieving capabilities of commericia1 suppliers. A U.C. of less than 1.5 can be obtained at a cost premium and is recommended.
A U.C. of less than 1.5 has the advantage that it will ensure that the coarser grain size in the media (such as the 90 percent finer size. d90) is not excessively large, requiring a large backwash rate. Sieve analyses of filter media will usually plot linearly on either log-probability or arithmetic-probability paper. The ratio of dgo/d10 for media with a U.C, of 1.5 is 2.0 for the log probability distnbution and 1.83 for the arithmetic probability distribution. These ratios are useful in estimating the dQn grain size which can then be used to determine the needoo. backwash rate.
An alternate method of specifying filter media which is used in the U.K. is to specify the range of size within which the media must fall. For example, a 1.4-2.4 mm size range would fall between a U.S. standard 14 mesh and 8 mesh sieve. Some tolerance must be allowed at either end to allow for the sieving capabilities of the suppliers. A 10 percent tolerance at each end is suggested, i.e., 10 percent by weight could be smaller than 1,4 mm and 10 percent coarser than 2.4 mm. This system of specification has the advantages that the effective size could be no smaller than the lower end of the range, and the coarser media is more precisely limited which is of importance is selecting the needed backwash rate.
Dual media
For dual media filters, the sizes of the sand layer must be selected to be compatible with the coal which has been selected. The bottom sand (e.g., the 90 percent finer size)

should have approximately the same or a somewhat lower now rate required for nuidization than the bottom coal to ensure that the entire bed nuidizes at the selected backwash rate.
To assist in the selection of the required backwash rate, and to assess the compatibility question above, empirical data on the minimum nuidization velocity of coal, sand and garnet sand at 2500 are presented in Table 6, as well as empirical correction factors to be applied for other water temperatures. The temperature correction factors agree substantially with data presented by Camp (24).
The effective size of the sand for a dual media filter should be selected to achieve the goal of coarse-to-fine filtration without causing excessive media intermixing. If the coal density is in the typical range of 1.66 to 1.76 g/cm3, a ratio of the 90 percent finer coal size to the 10 percent finer sand size equal to about 3 will result in a few inches of media intermixing at the interface (24). A ratio of these sizes of 4 will result in substantial media intermixing, whereas a ratio of 2 to 2.5 will cause a sharp interface. Choosing media sizes to achieve a sharp interface will mean that the benefits of coarse-to-fine filtration will be partly lost. Therefore, a size ratio of about 3 is recommended.
Table 6. Minimum Jluidizaticm velocities for various uniform sized media to achieve 10 percent expanBion at fSOC, observed empirically (8).
8etween u.s. Flow rate to achieve Std. Si eves Mean 10% expansion at 250C. 9pm/ft2
Size Passing Retained mm Coal Sand Garnet -rl1111j
7 2.83 8 2.59 37
)l 2.38 10 2.18 30
10 2.00 12 1.84 24 41
12 1.68 14 1.54 20 33
14 1.41 16 1.30 15.7 27 49
16 1.19 18 1.09 12.5 21 40
18 1.00 20 0.92 9.9 16.4 32
20 0.841 25 0.78 8.4 12.6 27
25 0.707 30 0.65 7.0 9.0 22
30 0.595 35 0.55 6.3 1B.O
35 0.500 40 0.46 5.4 13.7
40 0.420 .45 0.38 4.0 11.3
50 0.297 60 (0.2511111) 0.27 6.3
Specific Gravity 1.7 2.55 4.1
Temperature correction - The following are approximate co~rection factors to be appl ied for temperatures other than 250C.
Temperature Multiply 25° CO value b.l'
30 1.09 25 1.00 20 0.91 15 0.83 10 0.75 5 0.68
29
The use of Table 6 and the foregoing recommendation can be illustrated with an example. Assume a coal of 1.2 mm ES has been selected with a U.C. less than 1.6 (size range of 1.2-2.2 mm, 8 to 16 mesh range). The sand should have an effective size about 0.7 mm to be one third of the coarse coal size. A sand size range of 0.7 to 1.4 mm could be specified (14 to 25 mesh range), or one with an ES of 0.7 mm. The backwash rate for the coarse end of the coal (2.88 mm) is 30 gal/min/ft2 at 250 C and the coarse sand (1.4 mm) is 27 gal/min/ft2. Thus, they are compatible. If the peak expected operating temperature is 15OO-the required ~aekwash rate would be 30 x 0.83 = 25 gal/min/ft .
It should be noted that no harm would be done if the coarser sand grains were smaller than 1.4 mm. They would merely reach nuidization before the coarser coal grains. There is no danger of inversion of the coal and sand layers during baekwashing or complete intermixing as there is with sand and garnet sand. The intermixing behavior of coal and sand. and sand and garnet sand has been experimentally demonstrated (25).
In addition to specifying the gradation of filter media used, the depth of media must be established. At present. there is no reasonable method-other than pilot-plant operation-that can be used to determine the optimum depth of filter media. Huang (7, 23) established that, for filtration of trickling filter plant effiuent, a depth of at least 15 inches of 1.84 mm ES coal was desirable. Theoretical considerations would indicate that media depths should increase with media size. For practical designs based on a minimum of available information, the following minimum media depths are recommended for dual media filters:
Anthracite coal, 15 inches minimum to 20 inches Silica sand, 12 inches minimum to 15 inches
It should be emphasized that the media design illustrated by the foregoing example is one appropriate design for tertiary filtration but it is not the only possibility. A coarser coal would yield longer filter runs but required higher backwash rates. Nor is the example media design necessarily best for chemieally pretreated wastewaters, or where polyelectrolytes are to be used as filter aids. In the latter ease, a coarser top size may be desired (1.2-1.5 mm).
In dual or triple media filters, after each media layer is installed in the filter, it should be baekwashed and skimmed to remove unwanted fines before installing the next layer. This step can be important, for example, because the sand may collect a low density coating after a number of filter cycles. In one ease, using alum coagulation of secondary effiuent, these coatings caused the fine sand to migrate to the coal surface where it formed a blinding surface layer (26).
Unstrati.fWd ringle media
Single media filter beds comprised of unstratified coarse sand are also being used for wastewater filtration. Sand depths of 4 to 5 ft and size ranges of 1.5·2.5 mm, 2-3 mm, and 2-4 mm are being used.

These ffiters offer the advantage of using a coarser media size and thus achieve greater solids capture per unit headloss as shown previously' in Table 2. However the provision of adequate backwashing is essential.
Because of the coarse sand sizes, backwash by fluidization and bed expansion in the usual U.S. fashion would require excessive wash rates and is not feasible. Therefore, these ffiters are backwashed with air and water simultaneously at rates just sufficient to cause a pulsing and a slow circulation of the sand in the bed. This is followed by a short water wash to a rate below fluidization to expell some air from the bed.
The overflow level during backwashing must be high enough above the sand surface to prevent excessive loss of sand during the simultaneous air-water backwash. Even though the bed is not fluidized, grains of sand are thrown above the fixed bed surface by the violence of the combined air-water action. A vertical distance to overflow of 24 inches is recommended for the sand sizes mentioned above based on laboratory, pilot and plant seale observations (8). The common wash routines for these sand sizes are presented in Table 7.
Methods of Fnter Flow Control
Variable declining me fil,tratiDn
Variable declining rate operation is similar to influent . flow splitting, and is another desirable method of operation
for gravity ffiters. Variable declining rate operation achieves all the influent flow splitting advantages and some additional ones. without any of the disadvantages. Despite the merits of this method, however, it has not received enough explanation or attention (27).
Figure 5a illustrates the desirable arrangement for new plants designed for variable declining rate operation. Great similarity exists between Figure 5a, the principal
Table 7. Unstratified 8and filter desigm far wastewater with appropril:J.te backwash rounne8.
Media Sil11Ultaneous Wash
Size range Depth Air Rate Water Rate n"r. Rate Our,
(m) (tt) (cfm/ft2 ) (ga1/min/ft2) (min) (931/2 (min) min/H )
1.5-2.5
2-3
2.5-3.7
--------------------4-6
4&5
2.7
6-8
7
5,5
6-8
15
10
15
10
11
8
15
* 1. Successfully operating full scale plant in tertiary filtration at activated sludge plant in England observed by autllOrs,
2. Manufacturers suggested media and wash routine in the U.S. for 2-3 m and 2-4 m sand. Provided acceptable wash of 2-3.6 m sand in tertiary filtration study at Ames, Iowa (8).
3. Successful wash routine in pilot scale study at Ames, Iowa, in tertiary filtration of trickling filter plant effluent (8).
30
differences being the location and type of influent arrangement and the provision of less available headloss.
Figure 5b illustrates the typical water level variation and head loss variation observed with this mode of operation. The ffiter influent enters below the wash trough level of ffiters. When the water level in the mters is below the level of the wash trough. the installation operates as an influent flow splitting constant rate plant. When the water level is above the level of the wash trough, the installation operates as a variable declining rate plant. In general, the only time the ffiter water level will be below the wash trough level will be when all ffiters are backwashed in rapid sequence or after the total plant has been shut down. with no influent, so that the water level drops below the wash trough. In most eases, the clean ffiter head loss through the piping, media. and underdrains will range from 3 to 4 feet and keep the actual low water level above the wash trough. The water level is essentially the same in all operating ffiters at all times; this is achieved by providing a relatively large influent header (pipe or channel) to serve all the mters, and a relatively large influent valve or gate to each individual ffiter. Thus. head losses along the header or through the influent valve are small and do not restrict the flow to each ffiter. The header and influent valve will be able to deliver whatever flow each individual ffiter is capable of taking at the moment. A flow restricting orifice or valve is recommended in the effluent pipe to prevent excessively high ffitration rates when the ffiter is clean and to indicate the approximate clean bed ffitration rate.
Each ffiter will accept at any time that proportion of the total flow that the common water level above all ffiters will permit it to handle. As mtration continues. the flow through the dirtiest filter tends to decrease the most rapidly, causing the flow to redistribute itself automatically so that the cleaner ffiters pick up the capacity lost by the dirtier ffiters. The water level rises slightly in the redistribution of flow to provide the additional head needed by the cleaner ffiters to pick up the decreased flow of the dirtier filters. The cleanest filter accepts the greatest flow increase in this redistribution. As the water level rises, it partly offsets the decreased flow through the dirtier ffiters; as a result. the flow rate does not decrease as much or as rapidly as expected.
This method of operation causes a gradually declining rate toward the end of a ffiter run. Filter effluent quality is affected adversely by abrupt increases in the rate of flow-here, the rate increases occur in the cleaner ffiters where they have the least effect on ffiter effluent quality (29). Rate changes throughout the day due to changes in total plant flow, both upward and downward (in all of the filters, dirty or clean), occur gradually and smoothly without any automatic control equipment.
The advantages of declining rate operation over constant rate operation are as follows (27, 28):
For waters that show effluent degradation toward the end of the run, the method provides significantly better filter effluent quality than that obtained with constant rate (or constant water level) mter operation.

Less available head loss is needed compared with that required for constant rate operation because the flow rate through the ffiter decreases toward the end of the ffiter run. The head loss in the underdrain and effiuent piping system therefore decreases (with the square of the flow rate) and becomes.available to sustain the run for a longer period than would be possible under constant rate operation with the same available head. Similarly, the head dissipated through the clogged portions of the ffiter media decreases linearly with decreasing flow rate.
For the foregoing reasons, declining rate ffiten are considered to be the most desirable type of gravity ffiter operation, unless the design terminal head loss is quite high (e.g., greater than 10 feet). Then constant level control or pressure ffiters may be a more economical choice. A bank of pressure ffiters can also operate using variable declining rate ffitration; however, any rate
changes imposed on the plant cause sudden changes in ffitration rates with pressure ffiters.
Some of the concerns and questions raised about variable declining rate ffitration are as follows: (1) It appears to be an uncontrolled system with little available operator manipulation. This is, in fact, an attribute which prevents operational abuse of the delicate filtration mechanisms. (2) If the rate limiting device is sized for design year peak loads, it will permit higher than necessary ffitration rates in the early plant life. This is true unless one limits the head loss utilized during the early plant life, i.e., backwashes at lower water levels. (3) What is the total available head loss to be provided? This is a difficult question but no more difficult than it has been in the past for constant rate ffitration plants. It is best guided by past experience at the plant in question, or by piloting testing. In the absence of these, one must resort to an
Influent valve or gate to each filter
(a)
.. .::: -. z .E o E - -. 1--et & a:: • I-
w ...JI_et Ll..a::
W > ... o~ III _
eta:: Jw W~ >1-~z a:: w w:::l I-...J etLl.. ~:t
(b)
. T~
- High-water level_ Common influent header pipe or channel
Available • Wash trough headless .<1---------1"--""] • ;...........:....!!.-_.,..:.. ,,-' .:.-,,-0 ..:.. . ...,;. :i..
6
4
2
Ii Media
~I---------~ Underdrain
Backwash No.1
\ Rate indication & limitations
Clear well
~ .... , ..... ," .
\------L Rale for filter 1 only ---___ \.. .... _____ _
O~------------------------------------------------
6
5
4
3
Backwash
No.1 Rj~ in watttr level during wash
Water level same in all filters
\./
.c\ -______ ~ t: --", 0 "",-M\"i
III .. :x::
Clean media -------Underdrain$ and piping
M
, 0 c.i \ Z Z
.c .c \ .. ill - - - - - - - :;J' Backwash , ~ ~ \
"1) - - - - - - 1) \ .... ______ No.1 ~ ~ \ £Xl en "' ______ _
OL---____________ ~_L~--------------------------------------TIME DURING ONE FILTER RUN
..
Figure 5. Variable dec_ng-rate jilt'lV.ll:iun: (a) typicaljilter and clear weU arrangement; (b) filtration rate, headloss, and • water level during one jilter run in a plant luwing four jilters.
31

assumed solids capture per unit head loss design as discussed previously to select terminal head loss, and make adjustments downward for . the head loss recovery discussed above.
. Surprisingly, the water level fluctuation in plants operating on this system is not as great as anticipated. Typical variations of 1.5 to 2 ft (0.5-0.7 m) have been reported in potable waterplp.nts (31, 32).
4 BACJ[WASBING OF WASTEWATER FILTERS
The principal problems in filter operation are associated with maintaining the filter bed in good condition. Inadequate cleaning leaves a thin layer of compressible dirt or floc around each grain of the media. As pressure drop across the filter media increases during the subsequent filter run, the grains are squeezed together and cracks may form in the surface of the media, usually along the walls first.
The heavier deposits of solids near the surface of the media break into pieces during the backwash. These pieces, called mudballs, may not disintegrate during the backwash. If small enough and of low density, they float on the surface of the fluidized media. If larger or heavier, they sink into the filter, to the bottom, or to the sand-eoal interface in dual media filters. Ultimately, they must be broken up or removed from the filter or they reduce filtration effectiveness, or cause shorter filter runs by dissipating available head loss.
In wastewater filters, slimes can reduce the average density of the filter grains and can cause more loss of filter media during baekwashing, or migration of fine sands in dual media higher into the coal layer. Filimentous growths can cause blinding of the surface layers which shorten filter runs.
Dirty filter media may be chemically cleaned in place as a temporary expedient short of rebuilding the filter bed. Various chemicals have been used, including eblorine, copper sulfate, acids and alkalies. Chlorine may be used where the material to be removed includes living and dead organisms or their metabolites. Copper sulfate is effective in killing algae growing on the walls or medium. Alkalis can be effective on greasy deposits on the filter grains.
However, rather than attempting to correct dirty filter problems after they occur, the backwashing system should be designed to prevent them from the onset.
Potable water filter backwashing practice in the U.S. has used the high velocity wash with substantial bed expansion (20-50 percent). This method does not solve all problems with dirty filters, and it has created problems with shifting of the finer supporting gravel layers. The provision of a surface wash system which introduces high velocity water jets before and during the backwash has largely solved the problem of dirty filter media for potable water filters, but has not solved the problem of shifting gravel. The growing use of wastewater filtration has further demonstrated the weakness of water fluidization backwash. Backwashing is substantially more difficult and problems of agglomerates and filter cracks are prominent.
32
The problem of shifting gravel and the more difficult baekwashing of a wastewater filter has stimulated renewed interest in the air scour method of auxiliary agitation, which has continued in use in European practice. There is also interest in the use of underdrain systems with fine strainers that do not require gravel, a system which was abandoned in the U.S. in the early twentieth century due to clogging and corrosion problems.
In view of the difficulty of backwashing wastewater filters, and the various filter media and backwash routines available, a research study was conducted to compare the various alternatives as applied to wastewater filtration. Various granular media filters were studied including single, dual, and triple media. Various methods of backwashing were compared including (1) water fluidization only, (2) air scour followed by water fluidization, (3) surface wash and subsurface wash before and during water fluidization backwash, and (4) simultaneous air scour and subfluidization water backwash.
Some of the conclusions of that study are important to design of wastewater filters and are, therefore. quoted below (8).
"The cleaning of granular media filters by water backwash alone to fluidize the filter bed is inherently a weak cleaning method because particle collisions do not occur in a fluidized bed and thus abrasion between the filter grains is negligible.
"The weakness of water fluidization backwash alone was clearly demonstrated during wastewater filtration studies where a dual media filter which was washed by water fluidization alone developed serious dirty filter problems such as floating mud balls, agglomerates at the walls and surface cracks. These problems were observed when filtering either secondary effluent or secondary effluent which had been treated with alum for phosphorous reduction.
"The heavy mud ball and agglomerate accumulations caused higher initial headlosses and shorter filter cycles. They may also cause poorer filtrate quality in some eases, although such detriment was not demonstrated in this research.
"Simultaneous air scour and subfluidization backwash of unstratified coarse sand filters proved to be the most effective method of backwash. However, this method should not be used for finer filter media such as the coals and sands of the typical sizes used in dual and triple media filters because loss of media will occur during backwash overflow. The choice of simultaneous air and water flow rates must be appropriate for the sand being used and should result in some circulation of the sand for effective backwashing.
"The other two methods of improving backwashing, namely air scour followed by water fluidization backwash. and surface (and subsurface) wash before and during water fluidization backwash, proved to be comparable methods of backwash which can be applied to single, dual and triple

media filters. These two methods did not completely eliminate all dirty filter problems, but both auxiliaries reduced the problems to acceptable levels so that filter performance was not impaired.
"The use of some form of air scour auxiliary or some form of surface wash auxiliary is essential to the satisfactory functioning of wastewater filters comprised of deep beds (2-6 ft) of granular material which are backwashed after several feet of head loss development. The auxiliary and the backwash routine must be appropriate to the filter media. For example, subfluidization wash is limited to single media filters because stratification is not essential (or even desired) for such filters. Fluidization capability is essential for dual or triple media filters to permit restratification of the layers in their desired positions at the end of the backwash. Air scour and water backwash simultaneously during overflow is primarily useful on coarse sand filters because finer media will be lost due to the violence of the combined air and water action. However, the simultaneous use of air and water can be useful on dual and triple media filters prior to the onset of backwash overflow. The above conclusion is not intended to apply to all types of wastewater filters such as the various proprietary filters with their special backwashing provisions. Such filters and provisions were not studied.
"The use of graded gravel to support the filter media is not recommended where the simultaneous flow of air scour and backwash water can pass through the gravel by intention, or by accident, due to the danger of moving the gravel and thus upsetting the desired size stratification of the gravel.
"Media retaining underdrain strainers with openings of less than 1 mm are not recommended for wastewater filters due to the danger of progressive clogging.
"The filter influent feedwater (e.g., secondary effluent) is not recommended as a backwash water source because of the danger of progressive clogging of underdrain strainers and/or gravel. The advantages of using feed water do not justify the risks that result therefrom.
"Air scour is compatible with dual or triple media filters from the standpoint of minimal abrasive loss of the anthracite coal media. However, the backwash routine must be concluded with a period of fluidization and bed expansion to restratify the media layers after the air scour."
The authors urge you to use the foregoing conclusions as design guides. In addition, the following design suggestions concerning the backwashing provisions should also be considered.
First, consider the use of air scour as applied to dual or triple media filters backwashed with fluidization capability. In this case:
Provide operational flexibility in the period of air scour between, let us say, 2 and 10 minutes so the operator could select the period he deems most appropriate.
33
H supporting gravel is not used, provide the capability for simultaneous air and water backwash. This technique requires provisions to allow for rapid draining of the filter to near the filter media surface, followed by the brief simultaneous air and water backwash until the water reaches within 6 to 8 inches of the wash troughs. The simultaneous wash is then stopped, and either air alone or water alone may be continued. The water rate during the simultaneous air water wash should be below fluidization velocity to extend the time duration of the action to the maximum.
Provide a backwash volume of at least 100 gal/ft2 of filter per wash. This is based on the observation that when backwashing at rates above the fluidization velocity for the media, the total wash water required for effective cleaning is about the same regardless of the backwash rate-about 76 to 100 gal/ft2 of filter. This observation is for trpical U.S. wash trough spacing with the trough edges about 3 feet above the surface of the filter media. Larger spacing between troughs, or greater height of trough above the media, would increase the wash water requirements. No economy of total wash water use is achieved by adopting lower backwash rates (above fluidization), because the length of required backwash must be increased proportionately.
Second, consider the use of air and water backwash simultaneously without fluidization capability. In this case:
Provide a backwash water volume of about 160-200 gal/ft2 of filter per wash. This is larger than the prior case because less experience is available.
Because of the effective solids transport capability of air and water used simultaneously, wash troughs can be eliminated in favor of a single overflow trough along the length of the filter if the transport distance is limited to 12 feet.
Third, consider the use of surface wash auxiliary in dual or triple media filters backwashed with fluidization capability.
Provide a subsurface washer (as well as the surface washer) to attack the mud balls that sink to the interface between the coal and the sand. The subsurface jets should be located at the expected depth of the expanded interface. The writers have no information on the ability of full scale rotary subsurface washers to remain operational in the long term due to the greater drag they encounter, and the hostile environment. The pilot rotary subsurface washer used in the foregoing research was not a good model of a full scale unit, and considerable difficulty was encountered in keeping it operational.
Two additional back washing problems are of impor- .. tance in wastewater filter plant design.
Where do we get the water for backwashing? What do we do with the dirty backwash water? •
The best source of water for back washing will be the effluent from the filters. H disinfection of the plant effluent is practiced, the chlorine or ozone contact tank should

provide sufficient capacity to permit drawing backwash water from this tank. If disinfection is not provided, then a special backwash storage tank should be provided, through which all filter emuent should be directed before final discharge. The backwash water storage tank should normally have sufficient capacity to store all the water needed to backwash at least three filters in succession with the volumes suggested above.
The dirty backwash water must be returned to the plant influent for further treatment. Because of the nonuniform scheduling of filter backwashing, the backwash water presents a significant slug load on the primary or secondary treatment facilities if returned to them at the rate of backwashing. For that reason, dirty backwash water should be sent to a dirty backwash storage tank and delivered from there at a nearly constant rate to the plant influent or secondary innuent. If now equalization is not being practiced at the plant, it would be desirable to return the backwash wastewater during the low now period of the day. This would entail a larger wastewater storage tank and return pumping capability, but it would assist in now balancing.
SUMMARY
The key questions involved in the proper design of granular filters for wastewater filtration have been discussed in the foregoing sections, and design recommendations have been presented. These recommendations are summarized as follows:
The variable hydraulic and suspended solids load in secondary emuents must be considered in the design to avoid short filter runs and excessive backwash water requirements.
A filter that allows penetration of suspended solids is essential to obtain reasonable filter run lengths. The filter media on the innuent side should be at least 1.2 mm for tertiary filtration, and preferably larger if appropriate backwash is provided.
The filtration rate and terminal head loss should be selected to achieve a minimum filter run length of 6 to 8 hours if now equalization is not provided. Estimates of head loss development and filtrate quality preferably should be based on pilot scale observations at the particular installation. If such studies are not feasible, head loss development should be based on past experience on the suspended solids capture per foot of head loss increase from other similar installations.
Th~ effect of recycling of used backwash water through the plant on the filtration rate and filter operation must be considered in predicting peak loads on the filters and resulting run lengths.
High filtration rates (3 gal/min/ft2 or higher at C average load) and/or high influent suspended solids to the
filters (30 mg/l or higher at average load) will cause high terminal head losses and may favor the use of pressure filters over gravity filters, especially for smaller plants with limited capital resouroos.
34
Lower filtration rates or lower influent suspended solids may permit the economical use of gravity filters, especially in larger plants where multiple filters will be needed. At least two, and preferably four, filters should be provided. U only two filters are provided, each should be capable of handling peak design nows to allow for one filter to be out of service for backwashing or repair. U four or more gravity filters are provided, the variable declining rate method of operation is stronglY recommended.
The success of the wastewater filtration plant depends upon the provision of an effective backwash system which is appropriate for the media selected. Details of backwashing requirements for dual and triple media filters and for unstratified coarse sand filters are presented.
REFERENCES
1. W.J. Wtlber, Jr., PhY!,!ieochemical Processes for Water Quality Control, Wiley Interseience, New York, N.Y., 1972.
2. Environmental Proteetion Agency, Teehnology TraI1llfer, "ProcelIS Design Manual for Suspended Solids Removal". EPA 625/1-75-00Sa. January. 1975.
3. Environmental Proteetion Ageney. TeehDology Transfer. "Proce!l!l Design ;Manual for. Upgrading Existing Wastewater Treatment Plants", Oetober. 1974.
4. Jung. H. and Savage. E.S .. "Deep Bed Filtration". J. Amer. Water Works Assoc •• 66:73-78. 1974.
5. Joslin. J.R. and Greene, G .• "Sand Filter Experiments at Derby". Water Pollution Control. 69:611-622. 1970.
6. A.E. Naylor, S,C. Evans. and K.M. Dqnseo~be, "Recent Developments on the Rapid Sand Filters at Luton", Water PoDution Control. pp. 809-320, 1967.
7. J.Y.C. Huang, Granular Filters for Tertiary Wastewater Treatment", UnpUblished doetoral thesis. Iowa State University Library. Ames. Iowa, 1972.
8. J.L. Cleasby, "Bacltwash of Granular Filters Used in Wastewater Filtration". Final Report. EPA Project R802140, January, 1976. (ISU·ERI-Ames 761141.
9. S.C. Evans and F.W. Roberts, "Twelve Month's Operation of Sand FRtration and Miero-Straining Plimt at Luton", J. Proc., lost. Sewage Purif., pt 4, 838-341. 11152.
10. S.C. Evans. "Ten Years of Operation and Development at Luton Sewage Treatment Works", Water Sewage Works, 104, 214·219, 1957.
11. K.J. Merry, "Tertiary Treatment of Domestic Wastewater by Rapid Sand Filtration", unpUblished master's thesis, Iowa University Library, Ames, Iowa, 1965.
12. Nicolle, N.P. "Humas Tank Performance, Mierostraining and Sand Filtration", J. and Proc., Institute of Sewage Purification, Part 1:19, 1955.
13. A.E.S. Pettet, W.F. Collett, and T.H. Summers, "Meehanieal Filtrstion of Sewage Effluents. I. Removal of Humas". J. Proe., Inst. Sewage Purif., pt 4, 899-411. 1940.
14. Dahab, M.F. "Single-Media. Unatratified-Bed Filtration of Seeondary Effluent". unpublished Master of Scienee Thesis, Iowa State University LIbrary, Ames, Iowa, 1976.
15. Ross NebolsiDe, I. Pouscbine, Jr., and Chi-Yuan Fan, "mtra High Rate Filtrstion of Aetivated Sludge Plant Effluent". U.S.

16.
17.
18.
Environmental Protection Agency, Office of Research and Monitoring, EPA-R2-73-222, April, 1973.
R. Wood, W.S. Smith. and J.K.Murray,"An IIlvestigation Into Upflow Filtration", Water Pollut. Cont. (British). 67. 421426.1968.
G. Tehobanoglous, "Filtration T~hniques in Tertiari Treat· ment", J. Water PoIlut, Cont. Fed., 42, 604-628. 1970.
Huang, J.Y.C .. "Least cOst Sand Filter· Desig!l.for Iron Removal", Unpublisbed M.S. Thesis, Iowa State University Library, Ames. Iowa, 1969.
19. BaIlJll&Dll, E.R.. "Least Cos~ D6sign-Optimization of peep Bed Filters", The Scientific Basis of Filtration. EditorK.J. Ives. Noordoof Internatiomll Publishing, Leyden. The Nether~ lands, 1976.
20. Jerry Y.C. Huang and E. Rohert Baumann, ".Least CoSt SaUd Filter Design for Iron Removal", J. Sanit.Engr. Div .• Amer. Soc. Civil Engineers, 97, SA2, 171-190. April. 1971.
21. K.J. IV'e!I, "OptinliMtionof Deep Bed Filters", Proeeedinp, First Pacific Chemical Engineering Congress. So$ty of Chemical Engineers. Japan, pt. I. pp. 99-10'1, Oetober 10-14. 1972.
22. G. Tchobanoglous I\Ild R. Elia8sen. "Filtration of Treated Sewage Effluent, J. Sank. Engr. Div., American Society of Civil Engr., 96, 243-265, 1970.
28. E.R. Bl!.1IJII&DlI I\Ild J. Y .C. auang. "Gr&I!ular Filters· for Tertiary Wastewater Treatment", J. Water Pollut. Cont. Fed., 46. 8, 1968-1973. August. 1974.
24. T.F. Camp. "Disepasion-Experienee with Anthracite Filters", J. Amer. Water Works Assoc .• 58. 1478-1483.1961.
26. J .L. Cleuby and C.F. Woods. "Intermmng of D~ MediI and Multimedia Granular Filters. J. Amer. Water Works Aasoe •• 67:4:197-203. April, 1975.
26. J.L. Cleasby. E.W. Stangl. and G.A. Rice. "Developments in Bacir.washing Granular Filters", J. Env. Eng. Div .• Amer. Soc. Civil Engineers. 101:EE5. 713-727. 1975.
27. J.L. Cleuby. "Filter Rate Control Without Rate Controllers", J. Amer. Water Works Assoc •• 61, 4, 181·180, April. 1969.
28. H.E. Hudson, Jr .• "Dedining Rate Filtration", J. Amer. Water Works Assoc., 51, 11. 1455. November. 1959.
29. J.L. Cleuby, M.l'of. Williamson, and E.R. BaIlJll&Dll. "Ef:{eet of Filtration Rate Changes on Quality", J. Amer. Water Works Assoc., 56,7,869-880, July. 1963.
30. J. Tuepker, "Filter Performance Under Varying Operat,!ng Conditions", J>roeeedings of Conference on Water Filtration, University of Missouri, Rolla, Mo., 1965.
31. J. Arboleda. "Hydraulie Control Systems of Constant and Deelining Rate in Filtration", J. Amer. Water Works Assoc., 66:87-94. 1974.
32. J.L. Cleuby, "New Ideas in Filter Control SystemS", In the Proceedings of a symposium "Proeesos ModernOll De Tra· tamiento De Aqua" xm Congreso Interamericano De Ingenieria Sanitaria, Published by the Pan American Health Organization, August. 1972.
33. L. Huisman, "Rapid Filtration, Part 1", Delft University of Teebnology, Department of Civil Engineering, mimeographed book of leetures in English. 1974.
35
34. S.A. Degremont, "We,terTreatmeDt Handbook", Third English Edition. Diltnbuted by Hugh K. Elliot, Ltd. 2a Ruuell Gardens Mews, Kensington, London W14, England. 1965.
35. E.S. Savage, Dravo Corp., personal eommunieation, February 19. 197&. desenbing media and backwash provisions used by Pintsc:h Bamag (Germany) and Dravo (U.S.), 1975.
36. Dean A. Willis, "Variable declining·rste filtration of seeondary effluent.» Unpublisbed M.S. Thesis, Iowa State University LIbrary, Ames. Iowa, 1976.
APPENDIX
REFERENCES
1. Culp, G.L. and Haneen, S.P. Extended aeration effluent polishing by mixing media filtration. Water and Sewage Worb 114: 46-51. 1967.
2. Evans. S.C. Ten years of operation and development at Luton sewage treatment works. Water and Sewage Works 104: 214·219. 1957.
3. Fall. E.B., Jr. and Kraus. L.S. Tertiary treatment for high rste activated sludge effluent. UnpUblished pl!.per p~nted at the 37th Central States Water Pollution Control Association meeting. June, 1964.
4. Joslin, J.R. and Greene, G. Sand filter experiments at Derby. Water Pollution Control (British) 69: 611-622. 1970.
5. Laverty. F.B., Meyerson. L.A. and Stone. R. Redaiming Hyperion effluent. Journal of the Sanitary Engineering Division. American Society of Civil Engineers 87: 1-40. 1961.
6. Merry. K.J. Tertiary treatment of domestic waste water by rapid sand filtration. Unpublished M.S. thesis. Ames, Iowa, Library. Iowa State University of Science and Teebnology. 1965.
7. Naylor. A.A., Evans. S.C. and DW1lIeOmhe, K.M. Recent developments on the rapid sand filter at Luton. Water Pollution Control (British) 66: 309·315. 1967.
8. Pettet, A.E.J., Collett. W.F. and Summers, T.H. Mechanical filtration of sewage effluents. I. Removal of hUl!lull. Journal and Proeeedings. Institute of Sewage Purifieation Part 4: 399·411. 1949.
9. Truesdale. G.A. and Birkbeclt, A.E. Tertiary t~tment of activated sludge effluents. Water Pollution Control (British) 67: 488·492. 1968.
10. Wood, R., Smith. W.S. and Murray. J.K. An investigation into upward flow filtration. Water Pollution Control (British) 67: 421426.1968.
11. Nebolsine, R., Pousebine. I., and Fan, C.Y. Ultra high rate filtration of activated sludge plant effluent. EPA·R2·73·222. April. 1978.

APPENDIX
Performaaee Data for WlUJtewater Filtration front the Literature
REPORTED EFFICIENCIES FOR DIRECT FILTRATION OF TRICKLING FILTER PlANT EFFUJENTS *
~ Ref. }ledia Filter !** Suspended Solids (mg/;'~ BODS (mg/t) ~ S1ze* Depth ~ ;t!lUU~!I~ EHluent InEIuent Unuent
(mm) (in.) gpm/sq ft Range Avg ~~ Range Avg Rat\ge Avg (U.S. )
Luton, Eng land 8 (1945)
Lab Study sand .85-2.0 21 2.0 5 34-77 53 1-20 6 coal 1.0-2.0 21 2.0 7 41·67 51 4-13 1 sand 0.5-0.85 21 2.0 2 40·59 SO 1-2 2 sand 0.5-1.0 21 2.0 2 49 49 0 0 .
Pilot Study sand 0.85-1.7 24 2.33 3m 20-37 28 2-5 3 24-40 30 8-15 11 sand 0.85-1.7 24 2.66 1m 20 20 3 3 31 31 15 15 sand 0.85-1.1 24 2.83 Sm 15-25 19 2-5 3 17-28 21 6-9 7 coal \0.85-2 18} {1.7 2m 20-31 29 3-5 4 27-40 34 10-14 12
2-5 10 2.8 1m 15-28 21 2-5 3 17-28 23 6-13 8
Bingham, England 6 sand 1.0-2.0 24 1.6 !II 32 5 26 10 Pilot Study sand 1.0-2.0 24 1. 9-2.4 m 40 6 31 10
(1949) sand 1.0-2.0 24 2.9-3.2 !II 35-36 7-8 22-25 lC-l3 sand 1.0-2.0 24 3.2-3.8 !II 34·35 7-9 27-36 11-14 coal \1.0-2.0 2j}
r"" m 43 10 32 14
2-5 2.0-2.3 m 38 5 27 10 2.4-2.8 m 32 11 35 14 2.9-3.2 !II 34 8 28 13 3.2-3.7 !II 34-35 7-8 30-31 14
Lu~on, England sa.nd 2.5 12m 1-18 13 1-1 6-15 9 2-8 4 Full Scale
(1957)
Preparod by Gary A. Rice and John L. C1easby, Iowa State University, ffarch, 1974.
~ Ref. fledia Filter !!** Suspended Solids (mg/t) BODS (mg/t)
~ Size* (ePt) ~ !nHuent ill!'Uuent Influent Effluent (ii;ii) in. gpm/sq ft Range AYK Range ~ Range ~ Range ~
(U.S.) Luton (Cont' d) full Scale 7 sand 0.85-1.1 36 3.4 3m 28-35 9-10 9-10 3-4
(1967) sand 0.85-1.1 36 5 3m 13 8 5 3
Pilot Scale sand 0.85-1.1 60 3.4 3m 29-35 5 9-10 3 Upflow sand 0.65-1.7 60 4.8 3m 13 6 5 3
Ilerby, England 4 sand 1.2-2.3 24 2.0 4 25-35 29 1-14 10 pilot Study 3.0 2 29-31 30 10-13 12
(1970) 4.0 5 27-31 29 12-14 13 8.0 2 24-29 27 16-18 17
sand 1.2-1.1 24 2.0 4 26-35 29 7-15 10 3.0 2 29-31 30 9-13 11 4.0 5 24-32 28 11-14 13 8.0 2 23-29 26 16-18 11
Triple Media "a" r0al 1.4-2.3 !} CO 2 25-35 29 6-12 8 sand 1.2-1.4 4.0 4 27-28 27 11-13 12 garnet 0.1-0.85 8.0 3 23-29 26 15 15
tlpflow Sand "a" sand 0.1-2.3 24 2.0 2 28-37 33 9-15 12 4.0 3 21-30 27 13-14 13 8.0 2 23-29 26 16-17 17
Triple Hed1a "b" rOal 1.4-2.3 ., 3,0 29-31 30 7-11 9
sand 0.85-1.0 :1 4.0 29-32 31 10 10 garnet 0.1-0.85
Upflow Sand "bl! sand 0.85-2.3 24 3.0 2 29-:31 30 10-14 12 4.0 2 28-32 30 11-14 13
36
7. RemOval
l. ~
34-45 11-39
45 15-47
33
38 38

Loeation Ref. Hedia ~ !i** Suspended Solids (mg/L) BOD:; (mg/L) !:tJ2ll. 512e* Depth Rate InUuent EUluenE Influent ElfIuenE %
(-) (in.) gp;;;tSq ft Range ~ Range ~ Range ~ Range ~ Removal (U.S.)
nerby, England 4 sand 1.2-2.3 24 3.0 2 22-25 24 9-10 10 31 Pilot Study 4.0 5 20-24 22 7-10 9 50-64 After Trickling 6.0 2 19-26 23 10-11 11 35 Fil ter Improve-ment
sand 1.2-1.7 24 3.0 2 22-25 24 9-10 10 54 4.0 4 21-24 23 8-10 9 53-65
Triple Media lOb"~ triple (see above) 3.0 1 22 22 8 8 4.0 5 20-24 22 6-9 8 6.0 2 19-26 23 9 9
UpfloY Sand H'blt sand (see above) 3.0 2 22-25 24 8-10 9 69 4.0 4 21-24 23 8-11 10 59-71
Upfloy Sand sand 1.2-2.3 36 6.0 4 19-26 23 9-11 10 43-67
Ames, Iowa Pilot Study 6 sand 0.55 ES 24 2.0 15 11-49 20 I-IS 6 38-115 56 13-49 24 (1965) 2.36 UC 4.0 15 10-58 19 1-24 6 29-130 53 15-65 23
6.0 15 8-60 18 2-27 6. 25-132 50 13-74 24
Pilot Study dual media (1973) cOlll 0.9 ES 12 1.7 12 21-75 33 1-8 4 39-85 57 6-19 13 Unpublished sand 0.4 ES 12
* Blank spaces in table due to d,ta missing or not presented in manner needed for table. e.g., for averaging. All mgt! values rounded to nearest 1 mg/.t.
'.' Range in size given, British pnctice, or ES (effective size) and UC (uniformity coefficient). U.S. practice. **N = number of values reported in the range and average presented.
N generally represents individual filter runs unless followed by the letter m which indicates the number of average monthly values presented. m without numeral means av .. -.,se of several months data (unspecified duration).
REPORTED EFFICIENCIES FOR nIRECT FILTRATION OF ACTIVATED SWDGE PLANT EFFLUENTS *
Location Ref. Media ~ N** Suseended Solids!msl~J. Stze* Depth Rate - Influent Effluent
-1!Q!ls {ms l t l Influent Effluent % !il!!.
(-) (in,) gpm/sq ft Range Avg Range ~ Range Avg Range Avg RemOval {U.S.}
West Hertfordshire 10 England (1968) rravel
40-50
19J C' 10-89 44 1-2 2 58 3.9 gravel 8-12 4.0 9-70 37 2-7 3.7 53 4.6
Pilot Scale "Baby" Up £low gravel 2-3 10 5.0 12-128 55 1-17 7.1 42 5.6 Filter sand 1-2 60 6.0 5-97 37 2-22 9.9 35 4.7
Letchworth. England 9 (1968)
raVel 20-30
jJ C-4 81 10-26 22 1-12 5.5 gravel 10-15 4-6 66 10-28 16 2-15 6.7
Pilot Scale "Boby" Up fl ow !;ravel 2-3 6-8 65 7-24 14 6-14 8.8 Filter sand 1-2
Lo. Angeles, Calif. (1961) sand 0.95 ES 1l 2 5 19-34 27 7-21 15 6-15 10 2-8 4 Preliminary Tests 1.6 UC
Philowith, Ore. (1967) mixed 30 5 30-2180 59 1-20 4.6 17-36 26 1-4 2.5 (Extended Aeration AS) aledia
Peoria, Ill. (1964) 3 sand 1.1 35 8 45 17 (High rate AS)
Cleveland, Ohio 11 dual media coal 1.78 ES
.oJ r 1 20 5 19 14 1,63 UC
24 H 1 27 8 9 5 sand 0.95 ES 2 22-23 9-11 9-10 4-6
1.41 UC 1 29 .. 14, 9 7
Declining Rate dual media Fi! ters .,.1- Cle" .. t • ...d. :oal 4.0 ES 61 (I! 1 13 4 7 5
(Avg filter rate 1.5 UC 1 13 4 7 5 presented) sand 2.0 ES 24 24 1 13 6 7 5
1.32 UC
37
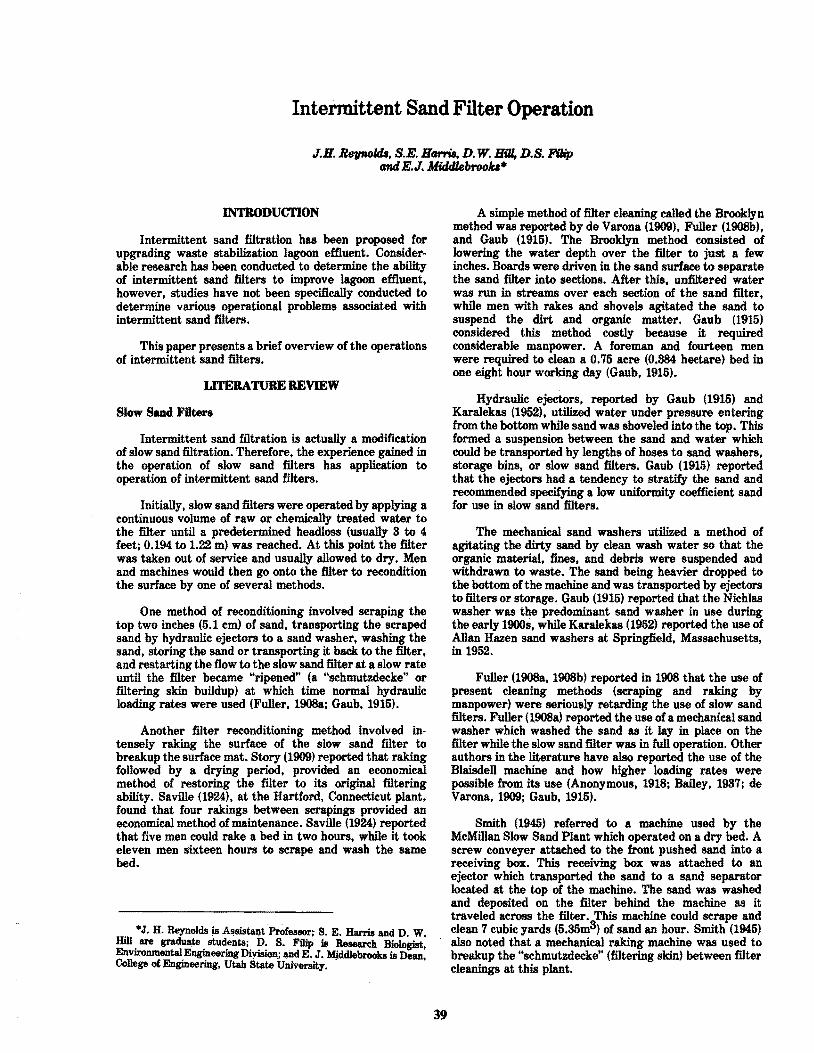
Intemrlttent Sand Filter Operation
J.B. Re'IfIWlds, S.E. B41TiB, D. w. Bill. D.S. Filip andE.J. Middlebroou*
INTRODUCTION
Intermittent sand filtration has been proposed for upgrading waste stabilization lagoon effiuent. Considerable research has been conducted to determine the ability of intermittent sand filters to improve lagoon effiuent, however, studies have not been specifically conducted to determine various operational problems associated with intermittent sand filters.
This paper presents a brief overview of the operations of intermittent sand filters.
LITERATURE REVIEW
Slow Sand FiJters
Intermittent sand filtration is actually a modification of slow sand filtration. Therefore, the experience gained in the operation of slow sand filters has application to operation of intermittent sand filters.
Initially, slow sand filters were operated by applying a continuous volume of raw or chemically treated water to the filter until a predetermined headloss (usually 3 to 4 feet: 0.194 to 1.22 m) was reached. At this point the filter was taken out of service and usually allowed to dry. Men and machines would then go onto the filter to recondition the surface by one of several methods.
One method of reconditioning involved scraping the top two inches (5.1 cm) of sand, transporting the scraped sand by hydraulic ejectors to a sand washer, washing the sand, storing the sand or transporting it back to the filter. and restarting the flow to the slow sand filter at a slow rate until the filter became "ripened" (a "schmutzdecke" or filtering skin buildup) at which time normal hydraulic loading rates were used (Fuller, 1908&: Gaub, 1915).
Another filter reconditioning method involved intensely raking the surface of the slow sand filter to breakup the surface mat. Story (1909) reported that raking followed by a drying period, provided an economical method of restoring the filter to its original filtering ability. Saville (1924), at the Hartford. Connecticut plant. found that four rakings between scrapings provided an economical method of maintenance. Saville (1924) reported that five men could rake a bed in two hours, while it took eleven men sixteen hours to serape and wash the same bed.
*J. H. Reynolds is As~t 'PrOfessor; S. E. Harris and D. W. Hill are gradllB,te stUdents; D. S'. Filip is Rel!Mlal'eh Biologist Environmental Engineering Diyisionj 4Dd E. J. Middlebroob is Dean: College of Engineering. Utah State University. -
39
A simple method of filter cleaning called the Brooklyn method was reported by de Varona (1909). Fuller (1908b), and Gaub (1915). The Brooklyn method consisted of lowering the water depth over the filter to just a few inches. Boards were driven in the sand surface to separate the sand filter into sections. After this, unfiltered water was run in streams over each section of the sand filter, while men with rakes and shovels agitated the sand to suspend the dirt and organic matter. Gaub (1915) considered this method costly because it required considerable manpower. A foreman and fourteen men were required to clean a 0.75 acre (0.384 hectare) bed in one eight hour working day (Gaub, 1915).
Hydraulic ejectors, reported by Gaub (1915) and Karalekas (1952), utilized water under pressure entering from the bottom while sand was shoveled into the top. This formed a suspension between the sand and water which could be transported by lengths of hoses to sand washers, storage bins. or slow sand filters. Gaub (1915) reported that the ejectors had a tendency to stratify the sand and recommended specifying a low uniformity coefficient sand for use in slow sand filters.
The mechanical sand washers utilized a method of agitating the dirty sand by clean wash water so that the organic material, fines, and debris were suspended and withdrawn to waste. The sand being heavier dropped to the bottom of the machine and was transported by ejectors to filters or storage. Gaub (1915) reported that the Nichlas washer was the predominant sand washer in use during the early 19008. while Karalekas (1952) reported the use of Allan Hazen sand washers at Springfield. Massachusetts, in 1952.
Fuller (1908a, 1908b) reported in 1908 that the use of present cleaning methods (scraping and raking by manpower) were seriously retarding the use of slow sand filters. Fuller (1908a) reported the use of a mechanical sand washer which washed the sand as it lay in place on the filter while the slow sand filter was in full operation. Other authors in the literature have also reported the use of the Blaisdell machine and how higher loading rates were possible from its use (Anonymous, 1918; Bailey, 1937: de Varona, 1909: Gaub, 1915).
Smith (1945) referred to a machine used by the McMillan Slow Sand Plant which operated on a dry bed. A screw conveyer attached to the front pushed sand into a receiving box. This receiving box was attached to an ejector which transported the sand to a sand separator located at the top of the machine. The sand was washed and deposited on the filter behind the machine as it traveled across the filter. This machine could scrape and clean 7 cubic yards (5.35m3) of sand an hour. Smith (1946) also noted that a mechanical raking machine was used to breakup the "schmutzdeeke" (filtering skin) between filter cleanings at this plant.

Operational problems have been cited by several authors Flu, 1922; Madiley, 1921, 1927; Story, 1909). Flu (1922) reported that insects, crabs. and fish created a nuisance at the Weltercreden, Dutch East Indies slow sand filter plant because they bored through the filtering layer. Madiley (1921) agreed with Flu's assessment that fish, crabs. and insects caused a deterioration in the effluent quality because of the breaking and floating of the filtering skin ("schmutzdecke"). Madiley (1921) noted that the sunlight caused excessive algal growth in the filtering skin. Madiley (1921) suggested putting screens over the influent pipes to solve the fish and crab problem and increase the depth of water over the filters to solve the algal growth problem.
On the same filters at Madras City, Madiley (1927) cited a failure of slow sand filters. Ferrous sulfide presence in the quartz filter sand produced hydrogen sulfide gas in the hot, humid climate. The gas collected in pockets within the sand bed and eventually burst through the filtering layer. No amount of cleaning of the filters 01' pretreatment of the water seemed to help. It is emphasized that the .. problems cited by Flu (1922) and Madiley (1921, 1927) took place in tropical climates. Madiley (1921) stated that slow sand filters located in the tropics worked quite differently than slow sand filters located in more moderate climates such as England.
Story (1909) reported on the operation of filters at Ludlow Reservoir at Springfield, Massachusetts. This was a temporary solution for Springfield until a new source of potable water could be found. In June 1907, when the slow sand filters were placed into operation for the year, the raw water had large numbers of Uroglena gp. and Asterionella gp. (distom). These organisms formed a cement like layer on the filter causing rapid clogging. Story (1909) found that intense raking followed by a period of sunlight and drying worked almost as wen as scraping in renewing the filtering ability of the sand. Anabaena gp. (a blue-green alga) appeared in the water supply in late June, and when these organisms died they created numerous problems forthe filtering plant. Lengths of filter runs were short and taste and odor problems plagued the plant. However, the filters continued to give a good quality effluent though this difficult period. Story (1909) found that subsurface clogging had taken place during the summer of 1907, because new sand had been laid over old unscraped sand during the spring. The clogged sand was removed and length of filter runs improved slightly. Story (1909) reported that intermittent sand filtration was also tried at the Ludlow plant, but this produced about the same results as slow sand filtration.
INTERMITrENT SAND FD..TERS
The operation of intermittent sand filters for treating sewage was much like the operation of slow sand filters for treating water except for the intermittent operation. Daniels (1945) has stated that unless they are carefuny and intelligently operated, intermittent sand filtration can be a nuisance and even suffer total failure. Daniels (1945) noted that the term "intermittent" was often overlooked. Many intermittent sand filters were continuously operated, and this had -a serious effect upon the bed. The sand filter needs
40
a rest period between applications to keep the bed aerobic and functioning properly. This resting period is needed because the filtered substances must be mineralized or oxidized within the top layer of sand or the pores will rapidly clog (Fair et al., 1968). Steel (1960) stated that complete resting of the bed is needed if septic conditions are present in parts of the bed. The resting period should be at least one week and two to four weeks if the condition is serious.
An example of a well operated filter was one at the Lawrence Experiment Station (Massachusetts Board of Health, 1912). Sand has not been removed from the surface of this filter in 23 years of operation. It had a surface area of 1/200 acre (0.002 hectare). This anonymous (1912) article stDted that within this time 2,395,582 gallons (9,068.1m ) of sewage containing about 6,000 lbs (2,727.8 kg) of organic matter had been applied to the intermittent sand filter. This example should demonstrate the potential of intermittent sand filtration for upgrading wastewater treatment plants.
Even when intermittent sand filters were operated properly eventually the filters became plugged and cleaning was necessary. Plugging occurred when the daily dosage of sewage failed to percolate through the filter bed in a 24-hour period. For multiple loadings, a cleaning was necessary when the preceding dosage still covered the surface at the time of the next loading (Furman et al., 1965).
When cleaning was necessary, the bed was taken out of service and allowed to dry. The surface mat of strained solids would crack and curl up. This mat, composed of organics and sand, was then scraped off and wasted or washed to remove the organic portion. An economical number of rakings between scrapings was used to increase filter runs. The amount of sand surface removed depended upon the condition of the influent sewage as well as other external conditions. Usually only a 1/4 - 1/2 inch (0.6 - 1.2 cm) thickness of sand surface needed to be removed, but this was extended to 2 inches (5.1 cm) at times (Babbitt and Baumann, 1968). Cleaning and removing of the sand continued until the minimum depth of filter sand was reached. At this point the intermittent sand filter was thorougbly scraped and clean sand was added.
The winter operation of intermittent sand filters presented special maintenance and operational problems as the sand surface of the filters could not be allowed to freeze. Daniels (1945) discusses three methods of managing intermittent sand filters during the winter. The first method, called the Brockton method, involves furrowing and ridging the beds at the start of winter. When the ice sheets are formed, they would come to rest upon the ridges and eventually would break up. At the start of a cold spell the beds are loaded heavier to provide extra protection against the freezing of the sand surface.
The second method, called the Worchester method, is similar to the Brockton method except that during the last scraping of the filters in the fall the scrapings are heaped into piles. These piles serve as a support for the ice layer and also require much less cleaning and rearrangement when spring comes.

The third method of managing the sand bed is identical to the regular summertime operation. However. much care has to be taken to prevent the ice layer from settling upon the flat sand surface and solidly freezing the surface. If the incoming influent dosage is unable to thaw out the settled ice layer, the filter will be unusable until the spring thaw arrives (Metcalf and Eddy, 1936). Although more expensive, intermittent sand filters could be covered by wooded planks or plastic covers during the winter ~ prevent freezing.
COLD WEATHER OPERATION
The operation of intermittent sand filters during harsh winter conditions in states like Utah has been a serious concern to many design engineers. A study was conducted at Utah State University (Harris et al., 1975) to evaluate several difficult operational modes. The study was divided into a warm weather experimental period and a winter experimental period.
During the wintBr experimental period a hydraulic loading rate of 8700 m /ha.d (0.4 mgad) was applied to four ofthe six filters (one remained at 1900 m8/haod (0.2 mgad) loading, one was out of service) employed in the study. It was anticipated that cold weather and freezing would create serious winter operational problems. Therefore, four separate operational modes were studied. The first mode used a furrow technique. That is, the surface of the filter was plowed into furrows (small hills and valleys). The second operational model involved placing 0.8 m (1 ft) wooden stakes at 1.22. m (4 ft) centers across the filter surface to break up any ice sheets which formed. The third method involved maintaining at least 0.8 m of water standing on the filter at all times (flooding). The fourth operational mode was the control and involved making no changes in the mter operation or configuration.
The winter experimental period was conducted under fairly harsh climatic conditions. Ambient air temperature dropped to below -23oC HOOF) for several consecutive days on several occasions and nighttime temperatures were constantly below freezing. Thus, ice sheets formed on the top of each filter. However, in general all operational modes studied performed satisfactorily.
All of the data collected during the winter experimental period have been averaged and these average values are reported in Table 1. The number of individual data
points averaged depends on the length of the particular mter run. However, in no case were fewer than three data points used to obtain an average value. The biochemical oxygen demand removal and suspended solids removal performance for each filter is shown graphically in Figures 1 and 2.
e I,,'LUEHT
/!;. EFFLUENT
to
WAft APR IIAY .lUff
TIME IN MOm"HS (1974 -1975)
Figure 1. Filter biochemical oxygen demand performance (mgad = 9860 m8/haod).
Table 1. Average of all8amp/.e8 during winter (1974-1975) operation.
Total Filter BOD, COD SS VSS Phosphorus O-PO ... P NH,-N NO,...N NO,..N Temp. DO No. Treatment (mg/I) (mg/I) (mg/\) (mg/I) (mg/I) (mg/I) (mg/l) (mg/I) (mg/l) pH (OC) (mg/I)
"Influent 18.0 64.3 28.3 25.6 3.462 2.866 4.961 0.011 0.084 8.6 3.3 9.9 1 3700 m'/ha·d 4.1 17.9 3.5 3.2 3.012 2.909 1.149 0.029 4.335 7.5 3.0 8.0
furrowed 2 3700 m'/ha·d 9.4 33.2 9.6 7.6 3.105 2.840 4.609 0.037 1.031 1.9 2.8 1.8
head maintained 4 3700 m'/ha·d 4.0 \9.2 5.1 3.9 3.209 2.915 1.171 0.126 5.065 1.1 2.1 8.6
staked 5 3100 m'/ha·d 2.6 18.0 3.3 2.7 3.247 3.018 1.983 0.093 3.208 7.7 2.1 8.6
no modification 6 1900 m'/ha·d 3.1 16.7 3.4 2.8 3.106 2.888 2.347 0.022 2.521 7.7 2.2 8.3
no modification
41

The averages for filter number 2 show a marked difference from the other four filters in operation. Anaerobic conditions caused by a constant head on the filter greatly reduced its removal capacities. As can be seen, BOD5' COD, SS, VSS, and NH3-N are twice as high in the effiuent of filter number 2 as in the others. The NOS-N concentration is half the value of the four other filters. The DO concentration is almost as high, but probably because of agitation as the water flowed from the sample ports. A very objectionable odor accompanied the effiuent of filter number 2.
Filters 6, 1,4, and 5 (control, furrowed, staked, and raked respectively) all performed satisfactorily. There were minor variations among them, but each produced quality effiuents. However, the overall quality dropped below that of the warm weather period.
The length of filter run during the winter experimental period is shown in Table 2. The length of run varied from 58 days for the filter which was raked to lS0 days for the furrowed filter. Each of the filters had a hydraulic loading rate of 3700 m3/ha.d (0.4 mgad). Filter number 6
o INfLU£HT
A [frLUOn
40
20
0
4" 20
0
40 --'" E to
<f) £:)
::; 0
0 <f)
TIME IN MONTHS (1974 -1975)
Figure 2. Filter 8'U8pended solids per/ormIlnce.
42
Table 2. Length of filter "'fa for winter e~enmefatal period.
Hydraulic Loading Length of
Mode of Filter Rate Filter Run Operation No. (m'/ha·d) (days)
Control 6· 1900 188 Furrowed 1 3700 130 Flooded 2 3700 73 Staked 4 3700 92 Control (raked) 5 3700 58
had a filter rulliength of 188 $ays; however, the hydraulic loading rate was only 1900 m /ha·d (0.2 mgad).
CLEANING
Intermittent sand filters are generally loaded hydraulically once a day during a four to six hour period. That is, the amount of water to be applied to the filter is placed on the filter in a period of four to six hours and then allowed to percolate through the filter bed for the remainder of the twenty-four hour period. A filter is considered to be plugged and to require cleaning when the applied dose of water will not percolate through the filter in a single twenty-four hour period.
When the filter is plugged, it is taken out of service and the top two or three inches of filter sand is removed. For small systems (less than 2 MGD), this filter sand could be removed with a small tractor with a blade and front end loader. For larger systems (greater than 2 MGD) more sophisticated cleaning equipment may be justified (see Literature Review).
The spent filter sand may be washed in a conventional sand washer and then replaced on the filter. It may be disposed in a landfill or employed as a soil conditioner. Because the sand is rich in organic material, when mixed with a clay soil, it produces a nutrient rich fertile soil. Studies conducted at Utah State University (Elliott et al., 1976) indicate that spent filter sand has an excellent affect on soil productivity.
SUMMARY
The operation of intermittent sand filters is relatively simple and economical. Experience in the operation of slow sand filters and sewage intermittent sand filters can be applied to the operation of intermittent sand filters to upgrade lagoon effiuent. Winter operation has not presented any serious operational problems to date. Cleaning of the intermittent sand filters appears to be the greatest and most costly operational problem associated with intermittent sand filters.
LITERATURE CITED
Anonymous. 1918. Intennediate rate fine-sand water filter operates under vacuum. Engineering News Record 80(26):1230-1282.
Babbitt. Harold E., and E. Robert Baumann. 1958. Sewerage and sewage treatment. Eighth edition. J OM Wiley and Sons, Inc •• New York. New York. 790 pages.

Bailey. Allen C.I937. Use of anthrafilt in a slQw aand filter. Journal of the American Water Works Association 29(12):1909·1915.
Daniels. Francis E. 1945. Operation of intermittent aand filters. Sewage Works Journal 17(5):1001·1006.
de Varona, I.M. 1909. Alternative design for hand-washed and machine· washed slow aand water filters. Borough of Queens. New York City. Engineering News 61(20):556-557.
Elliott. J., D.S. Filip, and J .H. Reynolds. 1976. Intermittent Sand Filter Scrappings Utilization. OWRT JER 088-1. Utah Water Research Laborstory, Utah State University. Logan. Utah.
Flu. P.C. 1922. Investigations into the workings, of II. slow· filter in the tropics. Public H~alth Engineering Abstracts. December: 16, 1922. (Original not seen; abstracted in Chemical Abstracts 17(4):604.)
FuUer. William B. 1908a. High relative rates Or filtration 'with slow aand filters. Engineering News 69(11):287·288.
FuUer. William B. 1908b. Sand filtration of water. Engineering News 59(8):191.
Furman, Thomas de Saussure, Wilson T. Calaway, and George R. Grantham. 1965. Intermittent sand filters· multiple loadings. Sewage and Industrial Wastes Journal 27(3):261-276.
Gaub, John. 1916. Methods of washing slow sand filters. Journal of the American Water Works Association 2(4):696-611.
Harris. Steven E •• James H. Reynolds, David W. am, D.S. Filip, and E.J. Middlebrooks. 1976. I}ltermittent aand filtration for
upgrading waste stabilization pond emuents. Presented at 48th Water Pollution Control Federation Conference, Miami, Florida (October 6-10, 1976). 49 pages.
Karalekas, Peter. 1952. High·rate slow sand water filters. American City 67(9):99·100.
Madiley, J.N. 192'7. Failure of slow sand filtration in Madras City. Surveyor 72:593. (Original not seen; abstracted in Chemical Abstracts 22(4):663.)
Madiley, James W. 1921. Water filtration in Madras. Engineering and Contracting 56:218·219.
Massachusetts Board of Health. 1912. The condition of an intermittent aand filter for sewage. afWr twenty·three years operation. Engineering and Contracting 37:271.
Metcalf, Leonard, and Harrison P. Eddy. 1936. American sewerage practice. Vol. Ill: Disposal of sewage. Second edition. McGraw· Hill Book Company, New York, New York. 892 pages.
Saville, Caleb M. 1924. Operation of slow sand water filters at Hartford, Connecticut. Engineering News Record 93(18):608·609.
Smith, J .C. 1945. Upra,ting McMillan Slow Sand Plant. Journal of the American Water Works Asaociation 37(3):269-279.
Story. C.F. 1909. Operation of the intermittent water inters at the Ludlow Reservoir. Springfield. Massachusetts. Engineering 61(11):301-303.
YOEU.ER, INC. VALUE ENGINEERING
PLANNING I STRUCTURES WASTE WATER SURVEYING
WATER SUPPLY WATER RESOURCES
AIRPORTS - HIGHWAYS PROJECT MANAGEMENT
428 SOUTH MAIN POCATELLO, IDAHO 83201 (208) 232-4631
537 MAIN AVE, EAST TWIN FALLS, IDAHO 83301 (208) 734-7H50
43
5255 OVERLAND ROAD BOISE, IDAHO 83705 (208) 345-5328
333 PALOUSE RIVER DRIVE MOSCOW, IDAHO 83843 (208)882-1510

Management Alternatives for Training Wastewater'
Treatment Plant . Operators
Robert A. Gearheart·
INTRODUCl'ION
A need exists in the complex training area of wastewater treatment plant operations to effeetively determine training needs. As the need for operating personnel increases with new and upgraded plants, and the process state of the art inereases, the eontinuing education and entry level training problems become more complex. The skill levels in wastewater treatment plant operation is quite varied and in many eases is based upon specified attainment of formal degrees or eertificates of completion. A training management system has been developed to assist in identifying the training needs for any type of treatment training. The training management system identifies those training modules needed to perform a given task for specifie treatment process, orders the training modules in sequence of prerequisities, determines the time necessary for training, and the eost of implementing the training. The system was designed speeifically for training personnel associated with municipalities, wastewater authorities, industry, and state regulatory authorities. Transfer of knowledge in a training sense is nothing more than a simulation of the working world. A careful survey of the tasks associated with operation of waste treatment process was the initial step in developing the training management matrix. The various tasks must then be arbitrarily placed under job descriptions. For any given plant these tasks might be reordered under different job descriptions. As an example, under one-man plant operations all of the tasks will be under one job description.
Under the present mode of wastewater treatment plant operator certifieation there is a minimum of relationship between what it takes to perform a job and those skills necessary to successfully pass certification examinations. This training matrix does not address certification examination not based upon operational skills. Hopefully, in the near future this discrepancy will not exist and training will satisfy both requirements.
Task analyses have been performed on wastewater treatment plant operators for various types of treatment processes. A task analysis is comprised on an action performed by a worker on a subject or object with some result or output.
Table 1 shows the various elements of wastewater treatment operation subfunctions. Each of these opera·
*Robert A. Gearheart is Associate Professor, Environmental Resources Engineering Department, Humboldt State University, Arcata, California.
45
tions can then be further divided into waste treatment plant processes.
THE SYSTEM
The purpose of this system is to provide a tool by which a manager may study the training needs of his personnel. The eurrent usage is oriented toward sewage treatment plant personnel, but the program could be used for any situation in which the jobs and training requirements can be sufficiently defined.
The definition process consists of several steps and results in a set of data that is stored on disc pack file (auxiliary storage on the computer). This file will be called the database. Describing the database definition process will be a good base for understanding the other functions of the system. The first step in the process would be to compile a set of tasks that can be combined to deseribe all the jobs in the particular situation under examination. The second step is to develop definitions of training modules that will cover the educational needs of all of the tasks. The module definition must inelude: a descriptive name, the
Tabk 1. System II1Lbjunctitm.
I. Separation of coarse-suspended and floating matterbar racks, comminuters, screens.
n. Separation of grease and oil-scum collectors, skimming tank.
m. Separation of finely suspended matter and various types of settleable solids-grit chambers, primary clarifiers, ehemical, precipitation tanks.
IV. Separation or stabilization of organie matter in suspension, the colloidal state, or solutions; biological treatment; soil mantle treatment Oand treatment, irrigation), trickling filter, activated sludge, oxidation ponds.
V. Reduction and/or disposal of mineral organic solids separated in preceding operations (sludge treat· ment), anaerobic digestion, filtration, elutrication, incineration, eoncentrating (pressing, centrifuging).
VI. Tertiary treatment-removal of suspended and dissolved organie matter removed above-removal of nitrogen and phosphorus species. (Filtration, absorption. stripping. chemical precipitation, ion exehange.)
vn. Disinfection of wastewater of fecal contaminant indicator. chlorinatioJ~L.ozonation.

total number of hours required to complete it. the total number of weeks required to complete it, a dollar cost of the module to the employer, and the modules that would be prerequisites. The third step is to list for each previously defined task, the training modules that would provide the educational background needed to perform the task. The total definition is punched on cards and is edited by a program called TRADATA. If no errors are found in the definition, TRADATA writes it to the database disc pack fIle. When the database for a given situation has been created, a manager can use the interaction program, TRAMODEL, to define sets of jobs and generate reports that will allow him to study their training requirements.
OBJECTIVE
The matrix depicts the modules of instruction which have been determined to be necessary to perform the given task. The matrix would serve as a curriculum guide for training an individual who must perform a given set of tasks with designated processes. The matrix would serve as planning tools in development of training materials (instructional packages) and visual aid requirements.
FORMAT
All the identifiable tasks (Table 2) are listed on the vertical dimensions of the matrix, somewhat grouped into function components such as: manager. supervisor. operator, laboratory technician, maintenance personnel, and laborers. The task analysis is independent of the functional nomenclature in terms of analysis. though, it serves simply as an arbitrary grouping of tasks. The important idea is that all of the tasks are listed that are performed by someone at the plant.
The instructional modules are listed on the horizontal dimensions of the matrix. These instructional modules are arbitrary groupings of training behaviors commonly used in training of operators. The arrangement of the modules are in somewhat ascending order of complexity of objectives. The only values in this is the pictoral arrangement for management reasons. The intersection of instructional modules and task performed is determinal by backing out the training seq uence or produce a given act or task and given types of processes. The linkages between the modules will not be shown due to space limitation, but will be shown for a typical training need. The matrix will be dev~loped such that a computer program will be used to identify modules and the sequence of presentation to meet a given set of tasks.
MANAGER
The manager has overall responsibility for the operation and maintenance of the wastewater treatment plant, the total system. This operational responsibility includes the overall delegational responsibility and scheduling of personnel, maintaining adequate personnel work records, resolving personnel problems. assigning maintenance personnel to replace or repair malfunctioning or cooperative equipment, and establishing priorities for the maintenance of equipment. supervising the installation of new equipment, and the planning and ordering of all supplies to support the day-to-day operation of the
46
Table 2. 7'a8k A_riB ..
0100 Unsldlled Labor
0101 - Prepare surfaces for protective coatings 0102 - Apply protective coatings to surfaces 0103 - Ground keeping task 0104 - Install and remove equipment and!or parts of
plant processes 0105 - Deliver or pick up information or parts
necessary for operation of plant 0106 - Perform housekeeping duties 0107 - Deliver process chemical to point of application 0108 - Remove solids to point of ultimate disposal
0200 MamtelUlllee
0201 - Recognize inoperative equipment in the various unit processes
0202 - Read blueprints of plant design including structural. electrical, hydraulic, and mechanical
0203 - Repair mechanical equipment by replacing parts, welding and cutting
0204 - Prepare preventative maintenance procedures 0205 - Prepare normal operation procedures to reduce
maintenance requirements 0206 Prepare parts inventory and orders for
replacement parts 0207 - Repair instrumentation used in lift stations and
wastewater treatment plants 0208 - Lubricate equipment 0209 - Calibrate equipment 0210 - Repair equipment by a construction replace-
ment parts . 0211 - Maintenance of power system for plant 0212 - Read maintenance and repair manuals for
various pieces of equipment both by mechanical and electrical in plant
0300 Laboratory Teeluddan
0301 Obtain samples from plant processes 0302 - Order chemicals and supplies for analysis 0303 - Perform standard wastewater analysis both for
process control and! or regulatory reporting 0304 - Log process control and regulatory reporting
data 0305 - Perform process control bench scale experi
ments 0306 - Perform standard industrial wastewater analy
sis (heavy metals. solvents, refractory organics). Analytical instrumentation
0307 . Analyze plant performance data for purposes of reports and operational strategies
0308 - Perform routine maintenance of analytical equipment used in laboratory
0309 - Perform routine laboratory cleaning duties, work area, glassware, equipment
fNOO Operator
0401 - Manipulate valves pertaining to process control 0402 . Perform routine cleaning of unit processes

Table 2. (Continued)
0403 - Collect samples for analysis to control processes, observe unit process and indicate normal or abnormal operations
0404 - Perform routine operations, housekeeping functions on plant premise
0405 - Compute data concerning flow volume, characteristics of influent and effluents, and amount of chemicals used in treatment
0406 - Enter computed data into plant records 0407 - Record accurate readings and occurrences in
plant log books 0408 - Monitor control readouts for purposes of plant
operations 0409 - Perform routine preventative maintenance to
system and subfunctions. unit processes, pumps, motors, controllers, etc.
0500 Supervisor
0501 - Prepare work schedule 0502 - Observe process operation by observing opera
tion, consulting with operator. and examining laboratory control data
0503 - Transfer daily operation log to acceptable form to be received by management
0504 - Review and implement preventative mainten-ance program
0505 - Establish operational procedure 0506 - Implement plant safety program 0507 - Devise laboratory analysis program for plant
operators and regulatory agency 0508 - Identify manpower needs as to tasks needed to
be performed 0509 - Translate total system objectives to operators 0510 - Observe and document operating experience of
various pieces of equipment for future information in replacement or expansion
0511 - Observe and document· effectiveness and efficiency of plant personnel for purposes of promotion, training. and manpower needs
0600 Management
0601 - Prepare annual budgets for plant operation 0602 - Prepare capital expenditure proposal for feder
al, state, and private financing 0603 - Determine alternatives for purchasing replace
ment and new equipment 0604 Present operating, financing, and technological
alternatives to public and private groups 0605 - Establish personnel policies 0606 - Initiate and sustain relationship with local,
state, and federal regulatory agencies 0607 - Prepare annual report including cost of service,
plant efficiency, personnel changes. and abnormal events
0608 Establish plant safety program 0609 - Implement plant safety program 0610 - Establish plant training program 0611 - Implement plant training program 0612 Establish plant operation procedures 0613 - Prepare emergency operational procedures
47
Thble 2. (Coratinued)
0614 - Establish and maintain data bank on plant operations
0615 - Design information storage and retrieval system for plant operation data, payroll data. plant financial data, etc.
0616 - Conduct meetings with state and local officials, engineering and construction officials. and plant personnel
wastewater treatment plant and associated pumping stations. The manager is also responsible for coordinating with consulting engineers, state and federal regulatory agencies, and proprietory equipment representatives.
SUPERVISOR
The supervisor has responsibility for the operation of a wastewater treatment plant. This responsibility includes day -to-day scheduling and keeping of personnel records for each work shift, holidays, and weekends. The supervisor evaluates personnel for promotions, pay increases, education benefits. and termination of employment. The supervisor is responsible for storing and distributing supplies and equipment as needed and for requesting additional supplies, responsible for maintaining safe and clean work conditions. The supervisor must maintain complete and accurate records on samples taken on a scheduled basis, supervisory or actually doing some of the analytical analysis, insuring that laboratory samples are ready for collection. responsible for providing on-the-job training to employees. daily checking the operation of the entire plant and the functioning of all major items of equipment, review of operational procedure for each unit processes to optimize efficiency, insuring that the relieving day shift knows what has transpired on the previous shift, and replacing all personnel who are not available for work on a particular day. The supervisor is the information link between total plant objectives and the personnel who operate the plant.
OPERATOR
The operator has the responsibility during an assigned shift for the actual operation of a wastewater treatment plant. This responsibility includes operating pumps, valves, motors, and related machinery and equipment, regulates and adjusts meters, flow meters, chlorinators, and digester temperature. He performs minor maintenance on motors, pumps, gages, and chlorinators, conducts numerous daily and periodic tests of sewage, and inspection of meters, gages, and indicators. The operator maintains a log of plant operation and performs house-keeping duties in connection with the maintenance of buildings and grounds. The operator is the information link between the total plant objectives and the equipment which does the work.
MECHANIC-ELECTRICIAN
The mechanic-electrician has the responsibility for the preventative and corrective maintenance of all m<f'~hanical, electrical, and hydraulic equipment at the wastewater treatment plant and at the pumping station. This

maintenance responsibility includes the replacement of defective parts, minor repair work, lubrication and oiling of equipment, checking on the operation of motors and pump, and making adjustments as needed. In addition, the mechanic-electrician is responsibile for the preventative maintenance of electrical equipment such as cleaning contact paints as well as the installation of new and relatively simple electrical equipment.
LABORATORY TECHNICIAN
The laboratory technician has the responsibility of performing and recording the analytical analysis required for state and federal regulatory agency compliance. In addition, the laboratory technician is responsible for performing and recording process control analyses which are required for efficient plant operation. The laboratory technician is responsible for cleaning and maintenance of all laboratory equipment and facilities and for recommending the purchase of supplies, equipment, and chemicals. The laboratory technician is responsible for communicating the results of analysis to the plant operation staff for their use in plant operations. Pertinent operational parameters will be graphed by the laboratory technician to facilitate changes in now. strength, temperature, etc. on process operations.
UNSKDJ..EJ) LABOR
The unskilled laborer has the responsibility for the routine and repetitive operating and housekeeping tasks required during each shift. On orders received from the shift operator, the laborer could make adjustments in valving pump settings and other devices as well as maintain and lubricate certain pieces of equipment. The laborer directed by shift operator could be involved in process chemical storage and distribution and final solid handling procedures. Routine housekeeping tasks associated with the exterior buildings and processes, interior of buildings and processes. The grounds and protective coating application are the duties of unskilled labor.
TASK LISTING
This report is a listing of the tasks as they have been defined in the database. It contains the task code number, the descriptive name, and the module code numbers of the training modules needed to provide the educational background to perform the task. This listing is in order on task code numbers. It can be used to edit the entries in the
JDJ! TR'$~ IlEFJNITION~
CODE
1 01 PREPARE $.t.IFi'FAC E 102 APPl. Y FPOU: COFtT 201 I"IAINTEtWi;:E 01 20e MAINTENANCE 02 203 MAINTEf'+RtICE 03 301 LA'£I 01 302 LAfi 02
'303 LAB: 03 ~ 01 DPEP 01 402 QPER 02 403 OPEIiI' 03 404 ACTlYATED ~LUDGE '501 SIJPERVnOp (H "502 SuPERVl~OFt OC' "503 ::UPEFtVJSOP (\:<
601 MBNA6Ef't€NT Ot 60Z MGT oe 603 1'fGT li;l ,.:·04 MGT 04 60s P1I';;T 0"5
110 126 110 110 1.2(1 130 110120 130 30'? ~:10 320 410 41":· 4,;01) !S1(1 110 120 130 110120 13(1 3(11-' 31(1 320410 4t:'(1 '510 "':.2D ')::0 lin 120 130 '30';" JI0 J21) 41Q 4ao !·10 520 "n(l
604 110
" 0 110 110 11(1
116 111):
110 .10 11 Q
1::1) l~"(!
1i-(I L::(I 120
41 (I '51(1
1 1 1 1 1
309' J:lo _32041(141':. 311) 3E:0 41(1 41'5 :520 -410 31032041(1
604
310 Jc!(1 41.0 4t5 602 >:-04 309310 328 4!(! 41'5420 '510 "",>(1 '5::<0
309 31 (J 41 3(1'~ 310 41 4t5 3(i-~ 31 (l 41 309 310 41 41 420 '51(1 '.;·20 0;',0,::
48
database or as a reference when analyzing a set of jobs. It is written by either TRADATA or TRAMODEL.
SYNTBE'rIC MANAGEMENT MATRIX
This report shows the relationship between the training modules and the tasks as defined in the database. It is a two-way table with the training module codes across the top and the task codes down the side. The entries in the table are 1 if the module is required for a specific task or 0 if it is not required. It is written in command by TRAMODEL.
SEQ TASk TF'f:i<. TRAHON!;; MODULE: NIJI1 CODE NAME Itl) 1':'(1 1 "'1(1'~ :~·l!.l ·':::~I 41' 4!C 4.:::1. .... ·t
01 l 01 F'FtEPAPE :: U~FACE 02 102 ftPPLY P!iiiOfE COAT 03 ZOI MAINTENANCE 01 04 20Z I1AHHEMFiNCE oa 05 2:03 MAINTEMANCE 03 06 301 LAB vi 07 302 LAB u2 08 303 LAB 0-3 09 4Ql DPE~ (Il IJ
10 40;?- DPC:fO' 02 1 11 4(1.3 DF-EFt (I'; I 12 404 ACTIVATED SLUDGE 1 13 S'UPc:ro-vISOP 01 l' 14 -:;;IJPEPV ! :'OF<' 02 1 1'5 'S,UPERV 1 SO~ (/3 16 I'IANAf::EMEMT 01 17 MGT 112 18 1'16T 1)3 19 604 MGT 1)4 20 605 MGT (1'5
TRAINING MODULES NEEDED
This report is basically the same format as the Training Module Listing exeept that it contains only the modules required for the current job set and it also lists the number of people that would need each module. It is written during the analysis process in TRAMODEL.
':ODe'
110 120 t 30 3(1"::' j1(,
320 411) 41~
TIjAINll'i6 MODI)LE'S NEEDED FOP TKJ';: )011 "ET
1'"t~"'E
(Of'1'"1)f'(t,AfIOH :FP'1TEMCE -: T~.I( T ;;oE ::OI,JS::-C E Mf1TEIQ 1nT"'0 c_ !DE PULE HLGEJ:PfHC E""PPE'S .... IH£AP j:1JN(TIONS" :~L1DS • Ll·)UID"'$-HEwT ~ TE"'P, ·:At.O j:U':JON. YAPDP (>iE/'lt:TJOIY 1 01EMI ~ TRY 2 CHEMI ~ TPy 3 roI!C.POJIOl..OGY 2 "'IC~O'HOL06Y 4
PEOPLE
12 1':.' '0 . " 1 0 Ie .0 .0 10 10 f.1f,
OE-Q6 06
HPS
2,0(1 ~.OQ
"" .0(; 1.'S0
12" .00 $.00 2.50 L'50 .:.. (to
:1. nO 4.'50
1 Ow~O 6.00 ';-.00
1.ljl)
no 41~ -;';:(1
-':'02
TRAINING MODULE PRECEDENCE MATRIX
This report shows the required modules for the current job set and the prerequisites. This is the basis for
TRAINING ..,OtlULE PPEC£DEtI(:E I"tATRlx
0"'16['" tiES Tr MATI OP'1 ,:ODE CODE 0(11 110 t20 1)0 )09 jlO 3-204104154':'·1., ":fO '520 ~;:u ~·CI.~ . -,4 -<.::..,:,
QOI 110 120
410 41'5 420 '51(1 "52"0 5-3"0 602 16-04 999

the algorithm that fipres the module schedule. It is a two-way table with the prerequisite modules aCl'088 the top and the acquired modules down the side. The entries in the table are a 1 of the top module and it is a prerequisite for the side module and 0 is not. It is written during the analysis process in TRAMODEL.
SCHEDULE TIMES
This report shows each training module that is required for the current job set in chronological order on their starting times. It contains the code number of the module, its starting time in terms of weeks (EVENT), (BEVENT), and the difference between the two (SLACK). Time 0.00 is the beginning of the first week. Time 1.00 is the beginning of the second weeks, etc. It is written during the analysis process of TRAMODEL.
"S:CHEDULED T I"fiiIFS: . -'
SEG! CODE EYENT BEYENT :5: LACK
1 2 :3 4 5 6 7
10 11 12 13 14 15 16
001 110 120 130 :30'3 310 320 410 415 420 510 520 530 602 604 9'3'9
0.00 0.00 1. 00 '~ .50 0.00 1.50 6.00 1.50 2.50 :3.50 E..OO '3.50
11 .50 16.00 19.00 22.00
0.00 0.00 0.00 0.00 0.00 0.00 0.00 0.00 0.00 0.00 0.00 0.00 0.00 0.00 0.00
22.00
0.00 0.00 1.00 9.50 0.00 1.50 6.00 1.50 2.50 :3.50 E..OO .~ .50
- 11.50 - lE .• OO
1·~. 00 0.00
CHRONOLOGICAL SYNTIIE1'IC MANAGEMENT MATRIX
This report shows each job in the current job set, with the tasks that have been specified as making up the job, and all the training module codes for each task. The report is written during the analysis process of TRAMODEL.
.EO HHt< T'1:" rRiM '::':ODE /"lHM~
100 LAflOR'EJ!'
," " I) (, (I II
Oc: l02 RPPL,' J) /I !~ 1.1 ;)
(1':; MAIHTEMf1fiCE 01 l' II l' I.! II
(J4 fl1Alt1TENAN~E ("..Ii: 1 1 8'5 MAII'ITENFlN(E 0:' • (I I) I} I
:;(,(1 LABDRATOPY lEM
(u:' ~:1)1 LAB 01 1)7 ?-0,2" LA! 0":: 0$ 303 LAB 0:3 o 1
49
40(1 Of;-ERFHOFO>
'.r~ OPEP 01 1 (I OPEfi' {Ie 1 i [)PE~ G3 12 404 ACTIVATED SLlJIIGE
13 '501 $UPEPVl SOP (I t 14 '502 ~lJPE~VI'.\DR 02 1'5 50'3 SUPERVISOR <',
16 601 MANAGE"""T 01 Ii' .;oa "ST 02 18 603 MGT 0'3 1~ .04 MGT 0 .. 20 605 MGT 05
I} 0
1 1 1 !
o 1
1 1 1
" I.'
SEQ NUM
TRAI~ING MODULES CONT. 520 530 602 604 999
01 02
0:3 04 05
06 07 08
0'3 10 11 12
13 14 15
16 17 18 19 2(1
100 LABORER
o I)
(I
I)
200 r'1AINTENAMCE
I)
o I)
o (I
I)
o o
o (I
(I
:::: I) 0 LABORATOR'r' TECH
1 1 1
1 1 1
400 OPEP-ATOP.
(I 0 (I (I
(I 0 (I (I
500 SUPERVISOR
o o 1
I)
(I
1
600 MANAGEMENT
(I
(I
I)
1 (I
o o o I)
(I
1 1 1
o o 1 I)
I)
1 1
(I
(I
(I
1 o
o I)
o (I
(I
(I
1 o
o I)
1 (I
(I
1 (I
(I
(I
(I
o o
o o
(I
(I
o
(I
(I
I)
o o o I)
(I
o (I
(I
o I)
I)
(I
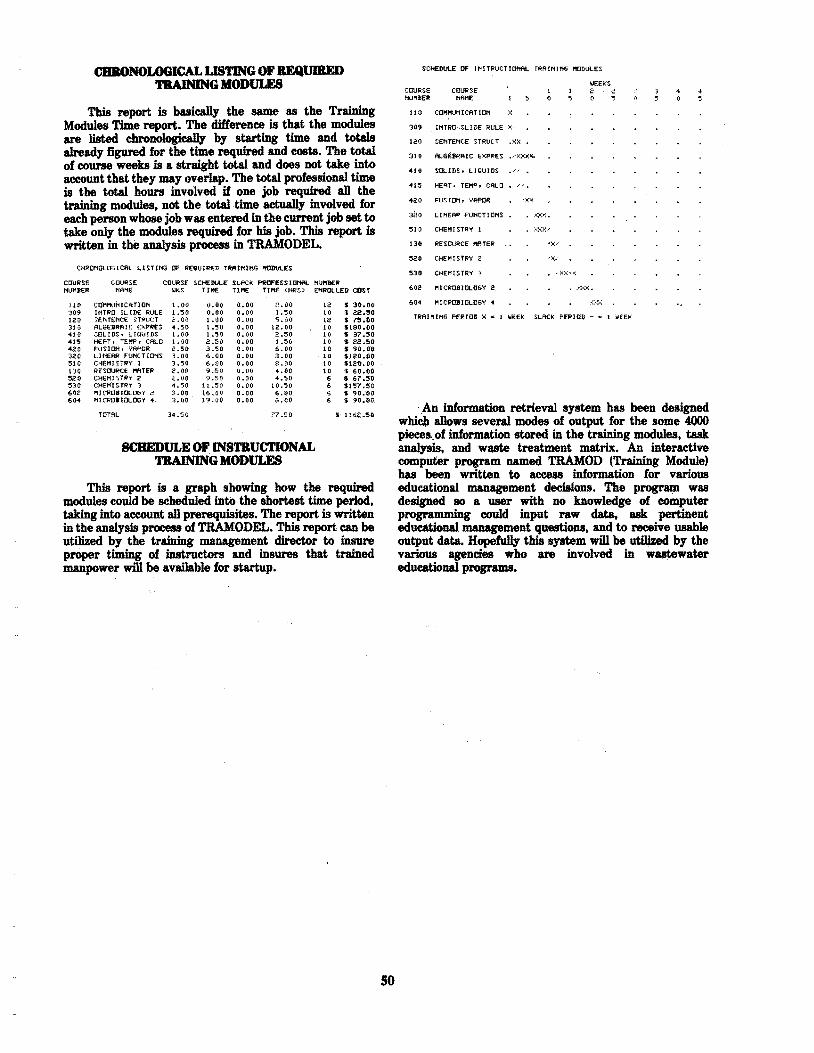
CBBONOLOGICAL LISTING OF REQUIRED TRAINING MODULES
This report is basieally the same as the Training Modules Time report. The differenee is that the modules are listed chronologieally by starting time and totals already figured for the time required and costs. The total of course weeks is a straight total and does not take into account that they may overlap. The total professional time is the total hours involved if one job required all the training modules, not the total· time actually involved for each person whose job was entered in the current job set to take only the modules required for his job. This report is written in the analysis process in TRAMODEL.
CHRONOLOGICAL LISTING OF REQUIRED TRAINING ~D\JLES
COURSE NUI"IJEJi
110 309 120 310 410 41S 4ao ,ao 510 130 520 530 602 6 ••
couRSE CO'JRSE SCHEDULE SLACk PRCFnS IONlOL l'U'J£R l'iHNE ~kS Tlf'!E TillE fll!E (HRS) ENROLLED COST
COMI!LNICflTlOH 1.00 0.00 0.00 2~UO 12 S 30.00 IHTP[J SLIDE RULE 1."50 0.00 0.00 1.50 10 i 22.,,0 ;ENTEHCE STI'ruCT " .00 1.00 0.00 "5_00 12 $ ?!I.co AL6EBR~IC EXPI;£S •• 50 !,~O 0.00 12.00 10 st90.00 ::':OLIDSii LIQUIDS 1.00 1.50 0.00 2.50 10 S 31.50 HEAT, TEf'!P, CALC 1. 00 2.50 0.00 1 ~'5u 10 S 22.50 FUSION, VAPOR i! .50 3.'50 0.00 6.00 10 S 90.00 LINEAR FUNCTIONS 3.00 6.00 0.00 3.00 . I. SH10.00 CHEI1H'TRY 1 3.50 6.00 0.00 8.00 10 nEt}. 00 ~ESOURCE PlATE" a.oo 9.50 0.00 '.00 I. ~ 60.00 CHEMI:;TP'f 2: e.oo 9~50 0.00 4.-.»0 6 S 67.50 CHEMISTRV 3: 4. '50 11.50 0.00 10.50 6 5157.50 I'1IC"POBIOUJ6Y 2- 3.00 16.00 0.00 6 .00 6 'S 90e'00 MICPOJlOL06Y •. 3.00 19.(t0 0.00 6.00 6 i 30.00
TOTAL 34.50 77.50 $' 116£.50
SCHEDULE OF INSTRUCTIONAL TRAINING MODULES
This report is a graph showing how the required modules could be scheduled into the shortest time period. taking into account all prerequisites. The report is written in the analysis process of TRAMODEL. This report can be utilized by the training management director to insure proper timing of instructors and insures that trained manpower will be available for startup.
so
SCHEDULE OF JI'iST~UCTlOHAL TRAINtf'fG I10IIULES
COURSE HUMBER
COURSE NAME
"uo COI1l!\JNI CATUIIi :~
')09 INTRO.SLIDE RULE ~,
120 SENTENCE STRUrT .XX.
.,0 SOLIDS. LIQUIDS .0.
420 FUS: I ON, VAf>{lR 'X-":
3aO LINEAR FUNCTIONS • .>(;..:,.;.
51'0 CHENI STRY t :";XY,/
130 RESOURCE f'tATER /X,'
520 CHEMISfPY 2
530 CHE"ISTRY3
602 MICROSIOLOGY 2
604 MICROBIOLOGY.
'",EEKS 1 2 2 5 0 S
TRRIl"lIl'i6 PERIOD X ~ 1 WEEK SLACK PEPIOD - 1 I,.I£EI<
'An information retrieval system has been designed which allows several modes of output for the some 4000 pieces.. of information stored in the training modules, task analysis, and waste treatment matrix. An interactive computer program named TRAMOD (Training Module) has been written to access information for various educational management decisions. The program was designed 80 a user with no knowledge of computer programming could input raw data, ask pertinent educational management questions, and to receive usable output data. Hopefully this system will be utilized by the various agencies who are involved in w8Jtewater educational programs.

Sewer Use Charges -
RieAe.nl A. JOAU'mt, P.E.·
The problem of disposal of our liquid wastes has been with us since civilization began. As a utility, sewers have been around far longer than other major utilities such as gas, electric, or telephone but the service of providing collection and treatment of wastewater has historically been the simplest and most taken for granted of the utilities. No problems of building dams, reservoirs and water purification plants. or problems of power outages and continuous maintenance of power poles and lines, or problems of constantly upgrading fuel and gas supplies occur with sewer utilities. Until recently sewage service has amounted to laying pipe and directing wastes to a simple primary or secondary plant and almost letting the system run itself. Operation and maintenanee costs for sewer utilities have always been relatively minor when compared with major utilities. Historically many localities have been able to fund their sewer system costs from general government funds or other sources without the need for a special sewer rate as other utilities have had to do.
But as increasing population demands and more stringent water quality requirements have forced the need for more expensive sewage collection and treatment facilities, a corresponding need arose for far more funding; funding not only for capital improvement costs but also to provide operation and maintenance of these larger more complicated facilities.
The result of all these problems and increasing costs is that sewer systems are now entering the spotlight with other utilities. Sewage collection and treatment is today given much more attention than in the past by both citizens and politicians and the importance of establishing efficient and well run sewage systems becomes paramount. It now becomes more logical and important than ever that sewer utilities establish and maintain efficient and sound collection and treatment facilities, and they they provide mechanisms to pay for these costs through the use of sewer use rate changes.
The hard fact must be recognized by all, including the citizens and the politicians that as in the other major utilities, the costs to operate and maintain our sewer systems is increasing at an alarming rate. Such operational costs as power for pumping. chemicals. and labor costs have increased drastically in the last few years and have in some cases more than doubled. As we increase sewer rates to meet these higher costs. sewer utilities become more and more under close scrutiny from all rate payers demanding that the rates be justifiable, fair, and equitable.
4<Richard A. Johnston is Assistant City Engineer, Salt Lake City Corporation.
51
Not only does a good sewer use charge system need to be developed to satisfy our needs as I have mentioned, but an "approved" system must be developed before EPA will approve funding of major treatment facility construction projects. Section 204 of the Federal Water Pollution Control Act Amendment of 1972, PL·500 set forth guidelines to be followed in the establishment of user charge systems. Since we all anticipate spending EPA funds in the upcoming years, I would like to discuss these guidelines and how they can be followed in establishment or upgrading of user charge systems.
The basic intent of this Act is to evenly distribute the costs of operating and maintenance of treatment works to the pollutant source and to promote self sufficiency with respect to operation and maintenance. There are two basic user charge systems suggested by EPA. The first is the establishment of a system where each user pays his share of operation and maintenance costs. Idealistically this would mean a separate charge being figured for each connection into the sewer system based on the amount of sewage flow which actually enters to that system in proportion to the entire sewage flow to the treatment facilities. The establishment of this type of system would be dependent on establishing actual flow rates for each individual user, either by the use of sewage flow meters or through providing estimates of the sewage rate to water consumption rates and charging according to water consumption meter rates. The second basic recommenda· tion for a user charge system is to establish classes of users based on similar flow and wastewater characteristics (BOD, suspended solids) and assign that class its share of waste treatment costs. An example of this would be to determine the proportion of total waste flow which comes from all residential users in the system and base the residential charge on what that proportional share of the overall costs are.
Again the intent of these two recommendations and EPA's basic requirement is that "Fair and proportionate share of costs be apportioned to each user based on his contribution to the costs of operation and maintenance of the facilities." It is of course unrealistic to accomplish this task completely as a sewage flow meter would have to be placed at every sewer connection in the system, and this of course is totally unfeasible. So the main problem here is determining a method by which the above basic requirement can be realistically met without undue
. administrative and regulatory hassles. EPA has developed outlines for development of user charge systems. These guidelines are shown on "Federal Guidelines-User Charges for Operation and Maintenance of Publically Owned Treatment Works" which follows this paper.
Model No.1: If a treatment works flow dependent or if most users have similar wastewater strength characteris· tics the user charges can be developed on a volume basis by determining a proportion of each user's volume to the total volume of all users.

This requires an estimate of sewage flow rate which for most users would have to be based on the water consumption rates. Certain heavy industries which have varying percentages of water consumption to actual sewage flow rate would probably have to install their own sewage flow meters.
Model No.2 is based on proportionate shares of BOD, SS or other pollutant surcharge. This requires extensive sampling of users to determine BOD, and SS strengths.
Model No.3 is a combination of Models 1 and 2 and is called the quantity/quality formula. This model is recommended for treatment facilities which handle both domestic and industrial flows.
As you can see, the effective use of these models is dependent on the sewer utility having a great deal of information as to the flow rate and wastewater strength characteristics of each user or user class. Lacking this information or a reasonable estimate of this information, a utility may have a difficult time in convincing EPA to approve their user charge system.
There are different methods which are used by varying localities and sewage systems to establish these equitable sewer use charges. The first method is the use of flat rate charge. This method is used in areas where water meters are not available or where it has been determined that flat rate charge is simpler and more accurate. A flat rate charge based on each type of user paying a specified rate each month is used. The advantage of a flat rate charge is that it establishes a fIXed consistent rate and is easy to budget for. Disadvantages of this rate are that it can be inconsistent and unfair, and can also be very hard to keep track of and cumbersome for commericial and industrial type users. An example of how cumbersome this type of rate can be is the previous Salt Lake City sewer charge system which was updated in 1973.
In this system there was a charge for hotels and motels of $1.00 for each unit of occupancy per month, less an automatic allowance of 10 percent for vacancies. One can imagine the administrative nightmare involved in determining a charge for each hotel and motel based on monthly figures for vacancy rates. Another charge was for restaurants, cafes, dining rooms, lodges, and private clubs of $10.00 per month. One type of charge would be totally inconsistent and unfair in that the same charge would be levied for a small cafe as would be for a very large restaurant. Many cities have gotten around the inconsistency in such a charge by setting a charge based on the number of tables or the area of each restaurant. Again such a charge would be cumbersome and result in an administrative problem.
The second basic method of establishing a sewer use charge. and the one which appears to be the most feasible by EPA guidelines is to base that charge on a proportion of the water consumption rate. Usually this will give a more equitable figure as to actual sewage flow' contributed by each user. The problem in this type of charge is again that it can be inconsistent and unfair. The percentage of sewage flow to water consumption varies for not only each class of user but for varying users in the same class. For example a
52
small restaurant specializing in take-out foods may contribute very little of its water consumption to the sewage flow whereas a large restaurant which completely prepares the food may contribute a good deal more sewage percentage. Another problem in respect to the residential users is providing for the times of the year in which lawn sprinkling takes place. The best way to get around this problem has been found to determine the charge based on the water consumption rate during the winter months and thereby eliminating the charging of sewer fees for water which winds up on lawns and gardens. However, providing a winter rate consumption charge can become an administrative problem depending on the type of billing and accounting procedures which are set up for the water utility.
Salt Lake City in adopting its latest sewer use charge system has gone to a combination of both flat rate charges and charges based on water consumption. Because of the administrative problems which the City would have in using a winter based water consumption charge we have decided to go to a flat rate charge for residential. units. This charge was established by determining the total amount of residential sewage flow to the treatment plant and determining a share of the operation and maintenance costs for that flow. This share was then apportioned evenly over the 44,000 residential units (single-triplex) in Salt Lake City. This is an example of using a user claSs estimate for determining a sewer use charge to meet EPA requirements. All other users both commercial and industrial were charged based on a water consumption rate charge. Additionally, Salt Lake City will provide a surcharge for any users whose sewage strength exceeds the following: 200 parts per million BOD and 250 parts per million suspended solids. Because we have never collected on a surcharge basis before, and therefore have no experience in how this will be administered, we cannot relate how we will completely set up our sampling programs and surcharge systems. We do. anticipate however that some administrative problems will have to be overcome.
I have attempted to point out the importance of establishing a fair and equitable sewer use charge and insuring that this charge adequately provides the needed compensation for efficient operation and ma.iritenance of sewage treatment facilities. And as pointed out in the report it is not an easy task to determine an effective and equitable means of establishing a sewer use charge. Each locality should carefully study their own peculiarities and characteristics before determining which type of user charge system is most adaptable for their needs. Again I think it is important in determining these sewer charges to always keep in mind the basic federal guidelines put out by EPA "The charges will assure that each recipient ot waste treatment services will pay its proportionate share of the cost of operation and maintenance."
FEDERAL GUIDELINES
User Cbarps for Operation and Maintenanee of PuhUdy Owned Treatmeut Works
(a) Purpose-To set forth advisory information concerning user charges pursuant to Section 2()4 of the Federal Wate> Pollution Control Act Amendments of 1972.

PL 92-500, hereinafter referred to as the Act. Applicable requirements are set forth in Subpart E (40 CFR Part 35).
(b) Authority-The Authority for establishment of the user charge guidelines is contained in section 204(b) (2) of the Act.
(c) Background-Section 204(b) (1) of the Act provides that after March 1, 1973, Federal grant applicants shall be awarded grants only after the Regional Administrator has determined that the applicant has adopted or will adopt a system of charges to assure that each recipient of waste treatment services will pay its proportionate share of the costs of operation and maintenance, including replacement. The intent of the Act with respect to user charges is to distribute the cost of operation and maintenance of publicly owned treatment works to the pollutant source and to promote self-sufficiency of treatment works with respect to operation and maintenance costs.
(d) Definitions-(l) Replacement.-Expenditures for obtaining and installing equipment, accessories, or appurtenances which are necessary to maintain the capacity and performance during the service life of the treatment works for which such works were designed and constructed. The term "operation and maintenance" includes replacement. (2) User charge.-A charge levied on users of treatment works for the cost of operation and maintenance of such works.
(e) Classes of users-At least two basic types of user charge systems are common. The first is to charge each user a share of the treatment works operation and maintenance costs based on his estimate of measured proportional contribution to the total treatment works loading. The second system establishes classes for users having similar flows and wastewater characteristics; i.e., levels of biochemical oxygen demand, suspended solids, etc. Each class is then assigned its share of the waste treatment works operation and maintenance costs based on the proportional contribution of the class to the total treatment works loading. Either system is in compliance with these guidelines.
(f) Criteria against which to determine the adequacy of user charges -The user charge system shall be approved by the Regional Administrator and shall be maintained by the grantee in accordance with the following requirements:
(1) The user charge system must result in the distribution of the cost of operation and maintenance of treatment works within the grantee's jurisdiction to each user (or user class) in proportion to such user's contribution to the total wastewater loading of the treatment works. Factors such as strength, volume, and delivery flow rate characteristics shall be considered and included as the basis for the user's contribution to ensure a proportional distribution of operation and maintenance costs to each user (or user class).
(2) For the first year of operation, operation and maintenance costs shall be based upon past experience for existing treatment works or some other rational method that can be demonstrated to be applicable.
53
(3) The grantee shall review user charges annually and revise them periodically to reflect actual treatment works operation and maintenance costs.
(4) The user charge system must generate sufficient revenue to offset the cost of all treatment works operation and maintenance provided by the grantee.
(5) The user charge system must be incorporated in one or more municipal legislative enactments or other appropriate authority. If the project is a regional treatment works accepting wastewaters from treatment works owned by others, then the subscribers receiving waste treatment services from the grantee shall have adopted user charge systems in accordance with this guideline. Such user charge systems shall also be incorporated in the appropriate municipal legislative enactments or other appropriate authority.
(g) Model user charge systems -The user charge system adopted by the applicant must result in the distribution of treatment works operation andmaintenance costs to each user (or user class) in approximate proportion to his contribution to the total wastewater loading of the treatment works. The following user charge models can be used for this purpose; however, the applicant is not limited to their use. The symbols used in the models are as defined below:
Ct = Total operation and maintenance (0 & M) costs per unit of time
Cu = A user's charge for 0 & M per unit of time Cs = A surcharge for wastewaters of excessive strength V c = 0 & M cost for transportation and treatment of a unit
of wastewater volume Vu= Volume contribution from a user per unit of time Vt = Total volume contribution from all users per unit of
time Bc = 0 & M cost for treatment of a unit of biochemical
oxygen demand (BOD) Bu= Total BOD contribution from a user per unit of time Bt = Total BOD contribution from all users per unit of
time B = Contribution of BOD from a user above a base level Sc = 0 & M cost for treatment of a unit of suspended solids Su = Total suspended solids contribution from a user per
unit of time S = Concentration of SS from a user above a base level Pc = 0 & M cost for treatment of a unit of any pollutant Pu= Total contribution of any pollutant from a user per
unit of time Pt = Total contribution of any pollutant from all users per
unit of time P = Concentration of any pollutant from a user above a
base level
(1) Model No. 1.-If the treatment works is primarily flow dependent or if the BOD, suspended solids, and other pollutant concentrations discharged by all users are approximately equal, then user charges can be developed on a volume basis in accordance with the model below:
Ct Cu=-(Vu)
Vt

(2) Model No. 2.-When BOD. suspended solids. or other pollutant concentrations from a user exceed the range of concentration of these pollutants in normal domestic sewage, a surcharge added to a base charge, calculated by means of Model No.1. can be levied. The surcharge can be computed by the model below:
Cs=(Bc(B)+Sc(S)+Pc(P)Vu
(3) Model No. 3.-This model is commonly called the quantity/quality formula:
Your investment in wastewater
treatment equipment
demands the proven
performance and dependability
of Eimco® products
ENVIROTEOH EIMOO PMD
669 West Second South Salt LaI!:e City, Utah 84110 801/521-2000
54
Cu=VcVu +BcBu +ScSu+PcPu
(h) Other considerations.-(1) Quantity discounts to large volume users will not be acceptable. Savings resulting from economies of scale should be apportioned to all users or user classes.
(2) User charges may be established based on a percentage of the charge for water usage only in cases where the water charge is based on a constant cost per unit of consumption.

Pretreatment of Industrial Wastewater at Hill Air .
Force Base
ColoDelHafT1l C. Rus8eU·
Almost all industrial processes produce wastes whose uncontrolled disposal can result in serious environmental pollution. The Air Force has long recognized the potential for environmental problems arising from the operation of its highly industrialized installations. Since the early 1950s, the Air Force has emphasized environmental pollution abatement to minimize the effect of its operations.
In Utah, Hill Air Force Base. one of the largest industrial complexes in the state, has been one of the leaders in pollution abatement. Since 1957. pretreatment of wastewater generated by various industrial operations at Hill has been standard practice. This practice has materially reduced the impact of Air Force operations on the Wasateh Front environment during the past 20 years.
In the mid-fifties. when pretreatment of industrial wastewater was initiated at Hill Air Foree Base, the major sources of wastewater requiring treatment were segregated from both sanitary and storm sewers to maximize the effectiveness of the treatment plant at that time. The major sources of industrial wastewater included: aircraft washrack. aircraft maintenance shops, engine test cells, chemical laboratories and some metal plating and finishing operations. The wastewater generated by these sources can be best described as a mixed liquior whose constituents were heavy metals; chromium and cadmium; oils and greases; and suspended solids. Concentrated wastes of chromium. cadmium. cyanides. acids and alkalis were also being produced in significant quantities by the metal finishing and plating industry.
To minimize and control the potential degradation of the environment from the uncontrolled discharge of these pollutants, the Air Force designed and constructed a pretreatment facility at Hill Air Force Base. In 1957, this facility represented perhaps the ultimate in advanced state-of-the-art in industrial and wastewater treatment. The plant constructed for only $191,000 employed a chemical-physical treatment scheme to neutralize and remove the major pollutants from the wastewater. The plant was designed to handle a rather small hydraulic load of only 0.33 MGD.
Figure 1 illustrates the 1957 facility constructed to treat industrial wastewater generated at Hill Air Force Base. The principal unit processes of the plant consisted of:
·Colonel Harry C. Russell is Chief. Bioenvironmental Engineering Division, Hill Air Foree Base. Utah.
55
1. A bar rack and screen for removal of rags. sticks and large objects.
2. Primary sedimentation for suspended solids removal.
3. One 150.000 gallon flow equalization tank to minimize fluctuations in flow and waste concentrations.
4. Chemical ·addition for hexavalent chromium reduction.
5. Dissolved air flotation for removal of oil. grease, emulsions and fine suspended solids.
6. Neutralization for pH;control.
Sludge Drying
Beds
Bar Rack and
Screen
PIsnt Effluent
Batch Treatment
Figure 1. Flow diagram-original treatment plant, 0.99 MGD capacity.

Treatment of concentrated cyanide. chromate, acid and alkali batch wastes was achieved by chemical addition in batch holding/miXing bays, followed by delivery to the plant influent.
Wastewater entering the plant through the bar rack was pumped to the primary clarifier from a 'wet well for suspended solids and primary fuel oil and grease removal. From the primary clarifier, the wastewater flows by gravity to the equaIization tank where fluctuations in flow and constituents were normalized. After equalization, ferrous sulfate was added to the wastewater to reduce hexavalent chromium to the trivalent state. Chemieally, this reaction can be expressed as follows:
2Cr +6 + 3 FeS04 -" 2Cr +3 + 3(S04)' + 3Fe +3
While this reaction proceeds more rapidly at a pH of 2, the presence of cyanide in the influent prevented the use of this procedure. To complete the removal of chromium, the wastewater was maintained at or near a pH of 8. which promotes the following reaction:
Cr+3 + 30H ...,. CrOH3
Mixing is achieved by pumping the wastewater to the dissolved air flotation unit through the air retention tank. In the air retention tank, air is dissolved into the wastewater under pressure. Optimum pressures for flotation of heavy metal sludges and oils and greases range from 40 to 50 psi.
From the air retention unit, the wastewater was pumped to the dissolved air flotation unit. Upon release of this pressurized water to the atmosphere, small bubbles are formed in the DAF as the water releases the dissolved air. These bubbles capture oils, greases, and fine suspended solids forcing them to the surface where they are removed by skimming.
The clarified effiuent was then discharged to a wet well where the pH is controlled to the limits of the discharge standards. The effiuent of the plant was then discharged into the North Davis County Sanitary Sewer for additional treatment. Ultimately. the North Davis plant discharged the treated wastewater into a 1500 yard long stream, which empties into the Great Salt Lake.
Concentrated wastes of chromium, cyanides, acids, and alkalis from spent plating baths were delivered to the treatment plant in carboys for treatment. Originally, we were treating only those wastes generated by Hill Air Force Base, but today we receive these types of wastes from as far away as North Dakota for treatment.
Treatment of cyanide wastes is accomplished by chlorination under basic conditions to neutraIize the cyanide. Chemically, this neutralization process can be expressed as follows:
(1) NaCN + C12 - CNCI + NaCI (2) CNCI + 2NaOH -- NaCNO + NaCI + H20 (3) 2NaCNO + 3Cl2 + 4NaOH - 2C02 + N2 +
6NaCI + 2H20
56
The first reaction occurs at any pH and is almost instantaneous. However. the formation of CNCI (cyanogen chloride) represents a hazard unless the reaction is impaired by a pH of 10 or greater. This hydrolysis reaction is virtually complete in approximately 20 minutes. After neutralization, the wastewater is introduced into the head works of the plant.
The neutraIization of concentrated chromium wastes is accomplished by procedures that essentially follow those described for the flow through portion of the plant. Other wastes are neutralized by standard acid/alkali additions to meet pH standards for the plant. Here again, the neutralized wastes are pumped to the head of the plant for final treatment.
Over the years, industrial growth at Hill Air Force Base has been significant. This growth has required two major modifications to upgrade the hydraulic capacity of the plant. In 1960, the hydraulic capacity was increased to 0.5 MGD with the addition of a second dissolved air flotation unit and associated pumping capacity, and piping to handle this increased loading. Again in 1971, the hydraulic capacity of the plant was increased. This time to 1.0 MDG. This modification included a third dissolved air flotation unit and an additional 150,000 gallon equalization tank (See Figure 2).
Following the 1971 modification, the operation of this plant was evaluated and found to be operating satisfac· torily, however, a lot has happened since 1971. New standards for treatment and discharge of industrial wastes have been promulgated and upgraded, not only by the State. but the EPA as well. By 1974 it was apparent that the present plant was no longer capable of producing a satisfying effiuent to meet these new requirements. Additionally, new pretreatment standards required plants to be operated more efficiently and required closer scrutiny of daily operations.
To satisfy these new requirements, the Air Force is upgrading the existing plant to meet these future standards. Congress approved this project at $2.7 million of our original estimate with construction scheduled to begin in late 1977.
This new plant was designed to meet the EPA's pretreatment guidelines, which under Sections 304 and 307 of the 1972 Federal Water Pollution Control Act (PL 92·500), were to take effect in 1977. In Dcember 1976, however. EPA withdrew these guidelines in the light of new data documenting certain inaccuracies and inequities in these standards. EPA is currently developing new strategies and standards for pretreatment of industrial wastewater to eliminate these inequities. We believe that our new facility will meet all but the most severe standards. a zero discharge limitation.
As previously mentioned, the effluent of the Hill Industrial Waste Treatment Plant is discharged to the sanitary sewer system of the North Davis County Sewer District, which operates a 19 MGD two stage trickling filter plant with intermediate classification. Currently, the plant is treating appoximately 11 MGD of which approximately 2.0 MGD is attributed to Hill Air Force

Base. The plant is efficiently run as designed to remove domestic sewage pollutants, e.g., BOD5' suspended solids, etc. However, any industrial wastes such as cyanides, and heavy metal would pass through the plant without significant removal.
At the present time, the Nation8.J. Pollution Discharge Elimination System (NPDES) permit for the North Davis County Sewer District does not include restrictions on industrial pollutants, although the effluent must be sampled and analyzed for these types of pollutants monthly. Their current NPDES permit expires 1 January 1978 and a more stringent replacement is anticipated. The new permit will probably incorporate the Utah Class "C" Water Standards and may provide impetus to the Sewer District to revise the current 1956 sewer code discharge limitations.
Table 1 lists the current discharge limitations imposed by the North Davis County Sewer District Code. It is easily seen that with the exception of two or three
Sludge Drying
Beds
Plant Effluent
Figure 2. Flow diagram-original treatment plant, 0.99 MGD capacity. (1960 m,odificatirm-0.5 MGD capacity: 1971 m,odification-1.0 MGD capacity.)
57
Table 1. North Davis Sewer District Discharge.
Total Solids 1500
Sodium Compounds 750
Fluoride 50
Hexavalent Chromium 3
Phenols 50
Oils 20
Cyanide 2
Arsenic 0.01
Copper 1.0
ABS 0.5
pH 6.5-8.7
standards, this code incorporates acceptable discharge limits. The limitation of 20 mg/l for oils and greases appears to be quite low when compared to a concentration of 50 mg/l suggested in most literature as typical of a weak domestic sewage, like that discharged by Hill Air Force Base. Another example of the code which may require revision is the 3 mg/l total chromium limitation. This concentration is excessively high, even considering dilution, if the Utah Class "C" Water Standards are imposed stringently on the so called "stream" into which North Davis discharges.
The water quality standards established both by EPA and the state to limit discharges into streams were designed to protect the water quality of the stream and its ultimate receiving body of water from pollution. In so doing, these waters may be used as drinking water for down stream users. In this particular case, the application of these standards to this stream seems unrealistic. In light of the natural "sink" attributes of the Great Salt Lake, the ultimate receiving body of water, the uninhabited area through which the stream flows, and the length of the "stream," it would appear more logical to develop different criteria for this case. Presently, the Great Salt Lake is not being used as a source of drinking water, nor to our knowledge, are plans being made to develop this water source for drinking purposes. It would appear, therefore, that these discharge standards are being improperly applied. Unfortunately, state law may not allow develop· ment of different criteria to solve this problem.
We expect more stringent standards to be imposed on the North Davis County Sewer District by the State in 1978. In order for North Davis to comply with these

impending new restrictions, two options are foreseeable. North Davis could install tertiary treatment facilities to remove industrial pollutants in the wastewater effluent, or, they might decide to revise the current code to limit discharges from various users. Of these, the later appears the least costly in terms of investment capital and most likely represents the action selected.
There are three possible approaches the North Davis Sewer District might take to limit industrial discharges so they can meet these new standards. One approach would be to limit industrial pollutants from each discharge point to the limit of their new NPDES permit limit. This might incorporate the class "C" water discharge standards. A second approach might be to allow individual users to discharge industrial waste such that the dilution of their industrial wastes with their non-industrial wastes would meet the permit limitation. A third approach might be to allow all sources of industrial waste to be diluted with all other non-industrial wastewater entering the plant. This approach would require a total mass balance of the system to insure that permit limitations are not exceeded.
Applying each of these approaches to Hill Air Force Base, one can calculate numerical values for limiting discharges into North Davis Sewer System. Assuming a hypothetical NPDES permit based on Utah Class "c" Standards, Table 2 presents a comparison of these options. Level I concentrations, Option 1, allows no dilution and essentially represents a zero discharge. This approach represents a drastic philosophical change in wastewater treatment. Neither EPA nor the State to our knowledge
has adopted this approach, and we believe such an approach is unrealistic. It would require substantial capital investment and provide very little obvious benefit t(I the environment. The cost of upgrading our new pretreatment facility to meet such a hypothetical limitation would soar to an astronomical 5 to 6 million dollars. At the least, the adoption of this approach would certainly require the Air Force to assess the economics of total recycling of wastewater. We believe such an approach cannot be justified either economically or environmentally.
Level II concentrations, Option 2, depict concentrations of a hypothetical discharge code calculated as the aggregate concentration of both the industrial waste and non-industrial wastes produced by Hill Air Force Base. In adopting this approach, the North Davis Plant could comply with the NPDES limits, but would not require total recycling of wastewater by the Air Force.
The concentrations calculated under Level m assume no industrial wastes are being discharged to North Davis except those of Hill Air Force Base. These concentrations are the least restrictive of the options presented. As shown, Hill Air Force Base could meet Level m concentrations with the present plant effluent in all parameters except that for iron. These concentrations are so lenient that it is unlikely that this approach would be taken by North Davis.
With our present plant effluent, Level II concentrations would be consistently exceeded for cadmium, chromium, and possibly cyanides, mercury and nickel:
Table!. HwotketiOOl iftdustrial pollutant discharge limitOOona for Hill AFB EHL/K 81£",e1l, Hill AFB UT, 14-80 June 1978.
Level I Hypothetical Level II Level III
Utah EPA ReVised Hypothetical Hypothetical Present NDCSD Class "c" Quality NDCSD NPDES Revised Revised NPDES Permit Water Criteria Permit NDCSD Sewer NDCSD Sewer Hill AFB Limitations Standards for Water Limitations Code Code IWTP
Parameter (m~/l) (ms/l) (m~;ll) (m~/l) Effluent
pH (Units) 6.5-9.0 6.5-8.5 5-9 6.5-8.5 6.5-8.5 6.5-8.5 7.3 Phenol * 0.001 0.001 0.')01** ** ** 3.70 Cadmium * 0.1 0.01 0.01 0.03 0.20 0.08 Chromium (+6) * 0.05 0.05 0.05 0.17 0.98 0.01 Chromium (Total) * 0.05 0.05 0.17 0.98 0.85 Copper 1. l.0 l.0 3.3 19.6 0.21 Cyanides * 0.01 0.01 0.01 0.03 0.20 0.08 Iron 0.3 1.3 0.3 1.0 5.9 9.04 Lead 0.05 0.05 0.05 0.17 0.98 0.05 Manganese 0.05 0.05 0.17 0.98 0.14 Mercury * 0.00005 0.00005 0.00017 0.0001 0.005 . Nickel * 0.01 0.01 0.03 0.20 0.11 Silver 0.05 0.05 0.05 0.17 0.98 0.01 Zinc 5 5 5 17 98 0.07 Aluminum 0.99 Arsenic 0.01 0.01 0.01 0.03 0.20 0.01 Barium 1.0 l.o 1.0 3.3 19.6 0.1 Beryllium 0.1 0.1 0.3 2.0 0.001 Selenium 0.01 0.01 0.01 0.03 0.20 0.01
*Effluent monitored for this parameter, but no limitations. **This value should be higher than the Utah Class "c" Standards, since biological treatment/removal of up
to 500 mg/l .is possible.
58

however. with our new plant. these levels would be achieved. We recognize that these standards may be considered lenient by North Davis since they assume non-industrial wastes generated on base do not contain industrial pollutants. For this reason, we believe that the revised North Davis Sewer Code will probably restrict discharges to levels somewhere between the hypothetical concentration to Level I and n.
Since the treatment processes of our existing plant cannot possibly meet either Level I or n limitations. we have undertaken an in-house project to maximize the efficiency of our current operation. Here,let's look at some of our present operational problems with the plant. Suspended solids overflow the weir of the primary clarifier almost continuously. They can also be observed to build up on the weir surface. This is due in part to the 1960 and 1971 modifications to upgrade the hydraulic capacity of the plant. In both modifications. which increased the hydraulic capacity of the plant, no attempt was made to upgrade the air retention tank supplying air for the dissolved air flotation units. As a result, this portion of the plant is still sized for a 0.88 MGD operation. Instead of an optimum pressurization of 40 to 50 psi. we are currently operating at a pressure of only 28 psi. The flotation and removal of suspended solids. oils, and greases in the wastewater is less than optimum.
The heavy metal floes produced by the addition of ferrous sulfate to reduce the hexavalent chromium to the trivalent state tends to settle in the dissolved air flotation units. These floes must be continuously recycled from the
Table 9. Percent removal of poUutantB by IW7F.
mg/1
Suspended Solids 23.0 39.3
Oils/Grease 9.8 27.5
Phenol 5.9 4.537
Cadmium 0.25 0.13
Chromium (Hexavalent) 4.8 1.88
Chromium (Total) 14.1 8.95
Copper 0.45 0.41
Cyanide 0.061 0.10
Iron 2.5 1.08
Lead 0.5 0.06
Nickel 0.28 0.19
Zinc 0.18 0.17
** Added during treatment
dissolved air flotation units to the primary clarifier for removal. This action not only reduces the efficiency of the dissolved air flotation units. but it overloads the primary clarifier.
Table 3 illustrates typical influent concentrations entering the plant in comparison with eIDuent concentrations during 1974 and 1976. During 1974. the percent removal of chromium was only 55 percent, which is considered good for a plant not designed for total chrome removal. But as shown in 1976 we were and are achieving a 90 percent removal of total chrome with the present facility. How we did this is novel and represents considerable effort on the part of the plant operators.
The operation of dissolved air flotation units are maximized to achieve the best possible operstion. Skimmer arms are observed every 15 minutes to assure they are set at proper elevation to remove floated solids. This is required because of the fluctuations in flow through the plant. Recycling of settled sludge in the dissolved air flotation units is only accomplished when the unit is taken off line for an hour to allow maximum sedimentation. After sludge removal to primary clarifier. the unit is placed back into service. This proeedure has allowed us to reduce our average discharge to chrome from 6.4 mg/l in 1974 to 1.3 mg/l in 1976.
Another problem associated with the present operation of the existing facility are sludge drying beds. As part of our in-house project to maximize plant efficiency in 1975. we constructed new drying beds at the plant to eliminate
mg/1
97.0 43.2 ** **
6.6 24.0 33% 13
5.1 3.698 14 18
0.17 0.08 32 38
0.05 0.01 99 99
6.4 0.86 55 90
0.45 0.21 ** 49
0.045 0.08 26 20
11.7 9.04 ** ** 0.5 0.05 ** 17
0.25 0.11 10 42
0.15 0.07 17 59
59

the potential problem of ground water pollution. PreviousIy. these bedS had no bottoms. With the new beds. emuent of the ~udge dewatering is 1'8cycled to the head of the plant. In our new plant we plan to separate .the oils and greases from the heavy metal sludges to lDlprove the effectiveness.
Another part of our. in-house effort to maximize efficiency of the. current plant until. the new modification cn be compieted, has been directed at the individual industrial wastewater sources. Weare developing capability to segregate mdividuai. wastewaters into maximum treatment efficiencies. W ~ have also improved the heac:) works of the plant by installing II grit chamber and parshall flume, and we have also constructed a 50.000 gallon holding tan1t at the front of the pint to contain accidental spills so that effective treatment can be taken without further overloading of the plant. All of these in-house improvements will uitimately become part of our new industrial wastewater treatment plant.
A new industrial wastewater treatment facility currently is undergoing final design to meet the new reeinded EPA guidelines for treatment of industrial wastewaterS. Figure 3 illustrates the treatment scheme that will be employed at this facility. In this scheme, wastewaters generllted by various industrial processes will be segregated at the source to maximize contamination with other wastes and maximize plant efficiency. The
Influent
Effluent POlyeo:trolpte Addition and ,1occ:ulaUOIl
Figure!. FWw diagram-modified treatment plant.
60
wastes are then piped separately to the plant for treatment. In employing this treatment scheme, the new facility should produce anemuent of sufficient quality that the normal operations of the North Davis Plant is not upset. The plant will not achieve consistent removal of the industrial pollutaJits to a zero discharge level, but it maximizes efficiency of each unit.
Oils and grease removal should be significantly improved in this treatment scheme. Since the cyanides wastes will completely segregate from other wastes, the reduction of the pH of the plant influent to a pH of 2 is now possible. This will maximize not only the oxidationreduction potential for chromates, but will also improve the removal characteristics of the dissolved air flotation units. But perhaps more importantly, the segregation of the oils and greases will prodUce heavy metal sludges more ammenable to dewatering.
Another improvement in operations will be the use of S02 instead of ferrous sulfate for reducing hexavalent chrome to the trivalent state. This should reduce significantly the volume of· sludge produced and the concentration of iron in the finished water.
Heavy metal removal will be accomplished by sedimentation. a two step process. Chromium is best removed at a pH of 8, while other metals such as Cadmium and Zinc are best removed at a pH of 10.5. Flocculation

aids will also be used although the specific aid has not been identified at this time. Following sedimentation, the heavy metal sludges will be subjected to thickening and finally dewatered on the drying beds described previously.
Finally, the improvements planned to allow complete segregation of both continuous and batch wastewater sources entering the plant will materially improve plant capabilities and operations. All of these planned actions should allow our new upgraded facility to produce a polished industrial wastewater effiuent that will consistently meet any rational discharge standard.
SUMMARY
In summary. this paper has described the long term interest and investment the Air Force has made in protecting the water quality along the Wasatch Front. Past efforts in treating industrial wastewater generated by Air Force operations at Hill Air Force Base are described in detail.
New Federal and State water quality protection standards have required the Air Foree to upgrade its present plant in order to meet these new criteria. A $2.7 million treatment plant to accomplish this is currently being designed. This plant will incorporate advanced state-of-the-art treatment processes to meet all but the most severe zero discharge limitation. Additional treatment would be required to meet this standard and most assuredly would result in complete recycling of wastewater by Hill Air Foree Base.
The approach the Air Force is taking in addressing these problems illustrates their intent to invest even more
61
in the water quality emphasis and will continue to support national environmental protection goals.

Utah Power and Light Co. Wastewater Handlfug . System-At Gadsby
and HuntingtOn.. . Plants·
K. M. NeuacAWOIIIde'"
I will present an over view of two wastewater handling systems now in operation at the Huntington and Gadsby plants. We have five operating plants and each
- plant has a different requirement. therefore. a different treatment system. The system at our Huntington plant represents the latest concept in wastewater handling systems and the Gadsby plant represents a retrofit system to one of our older operating plants.
The Huntington Steam Plant the newest operating plant on the UP&L system is located in south central Utah in Huntington Canyon 8 miles northwest of the town of Huntington. This plant. consisting of two 480 MW units. is located·near the source of fuel. deep mined coal, and a good water supply for the plant's cooling system. The plant site was originally laid out as a 2000 MW plant consisting of 4 units.
Make up water for the plant is obtained from Huntington creek at the diversion structure. The water is carried through a quarter mile long pipe line to the raw water holding pond. Pumps convey the water from the raw water pond to the condenser cooling water systems making up water lost through evaporation in the cooling tower and blowdown from the system. Each unit consumptively uses between 6000 and 8000 acre ft. of water per year. The condenser cooling system consists of a main steam turbine condenser, and two small boiler feed pump turbine condensers, several hundred feet of 72 inch circulating water line. two circulating pumps and a 10 cell mechanical draft cooling tower. The main equipment in the plant is the steam generator or boiler and the turbine-generator along with the associated auxiliary equipment.
Power produced by the plant generators is delivered to the plant switch yard then fed out over the 846 kV transmission system to the load centers of the Utah Power & Light service system.
In the last 8 to 10 years Environmental Legislation has been responsible for important changes in the handling of wastewater from new electric generating plants and for that matter all other industrial wastewater discharges also. To better descnoo the wastewater control and treatment at the UP&L Huntington plant, a brief explanation of the water supply system is necessary.
*K. M. lIj'euaehwander·~ Enviro~meDt!d EngiJieer. Utah Power and Light Company. Salt Lake City, Utah.
63
To meet the water needs for a plant of 2000 MW, and to assure sufficient water for the operation of the plant including those years when precipitation is below normal. two dry years back to back, UP&L purchased water rights from the local Irrigation Companies, developed excess surface run off rights in the upper Huntington Canyon area by the construction of the Electric Lake Reservoir and contracted with the Bureau of Reclamation for uncommitted water in the Joes Valley Reservoir. One stipulation in this water contract with the Bureau of Reelamation was that no wastewater would he discharged from the plant.
This stipulation laid the basic requirement for the wastewater handling system-a zero discharge requirement. The system required several years of development and design, requiring innovation and use of an unproven technically, contrary to normal utility practice. Utilities are basieally conservative in the pioneering of new concepts because of the high availability and reliability factor required for steam plant operation.
The wastewater handling system that was accepted included a vapor compression brine concentrator, a wastewater holding and detention structure, a holding pond for reusable boiler and cooling tower water and a large evaporation pond for the disposal of final wastewater.
The wastewater holding structure is used to collect the unusable wastewater which is then pumped to the evaporation pond for final disposal by solar evaporation.
The reusable wastewater pond is used to hold water drained from the boiler and the cooling towers (condenser cooling water system) when the units are shut down for overhaul. This water can be reused in the condenser cooling water system thus cutting down on the amount of wastewater that must be disposed of.
The major source of wastewater is from the blowdoWli. of the condenser cooling water system. Blowdown from this system is required to maintain control of the dissolved solids, particularly sulfates and silica, along with other dissolved solids. These solids are concentrated due to the evaporation of the heated water in the cooling tower to dissipate the heat picked up in the main condenser from the steam cycle.
This blowdown water is still usable and is used as make-up water for the ash sluicing system, and will be used as make-up water to the Unit No. 1 S02 scrubber when it goes into service. Water is lost in the ash handling
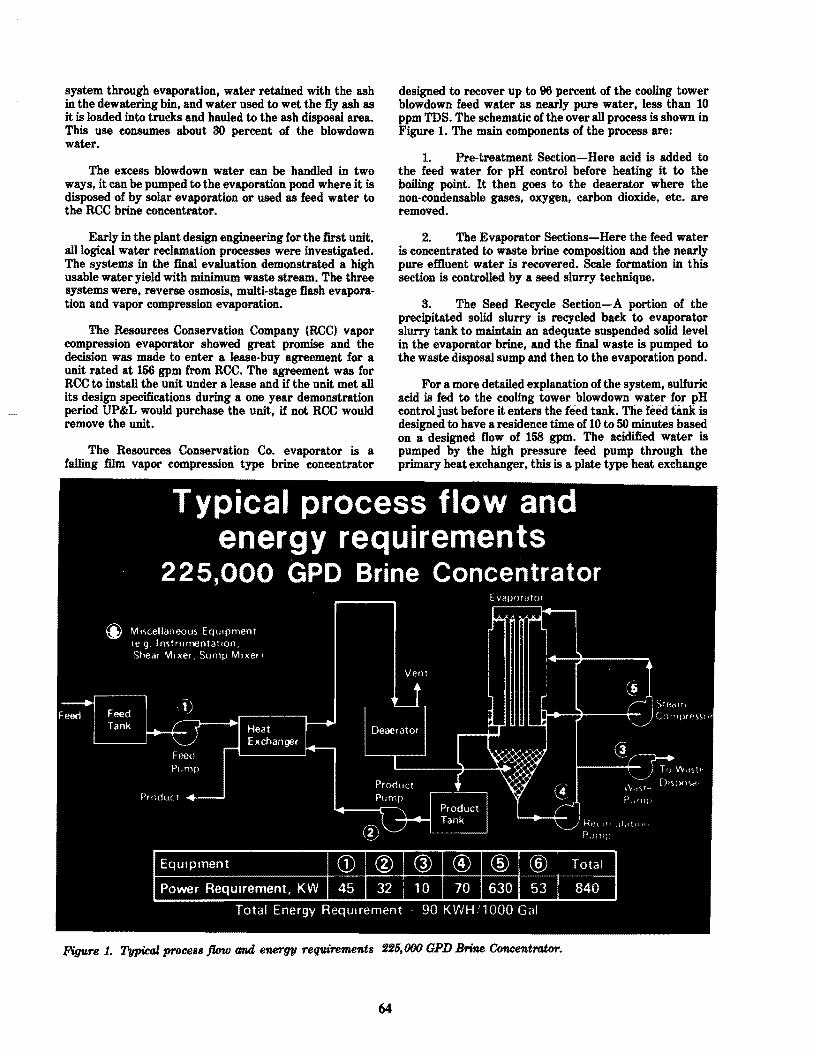
system through evaporation, water retained with the ash in the dewatering bin. and water used to wet the fly ash as it is loaded into trucks and hauled to the ash disposal area. This use consumes about 30 percent of the blowdown water.
The excess blowdown water can be handled in two ways, it can be pumped to the evaporation pond where it is disposed of by solar evaporation or used as feed water to the RCC brine concentrator.
Early in the plant design engineering for the first unit, all logical water reclamation processes were investigated. The systems in the final evaluation demonstrated a high usable water yield with minimum waste stream. The three systems were, reverse osmosis, multi-stage flash evaporation and vapor compression evaporation.
The Resources Conservation Company (ReC) vapor compression evaporator showed great promise and the decision was made to enter a lease-buy agreement for a unit rated at 156 gpm from RCC. The agreement was for RCC to install the unit under a lease and if the unit met all its design specifications during a one year demonstration period UP&L would purchase the unit, if not RCC would remove the unit.
The Resources Conservation Co. evaporator is a falling film vapor compression type brine concentrator
designed to recover up to 96 percent of the cooling tower blowdown feed water as nearly pure water, less than 10 ppm TDS. The schematic of the over all process is shown in Figure 1. The main components of the process are:
1. Pre-treatment Section-Here acid is added to the feed water for pH control before heating it to the boiling point. It then goes to the deaerator where the non-condensable gases, oxygen, carbon dioxide, etc. are removed.
2. The Evaporator Sections-Here the feed water is concentrated to waste brine composition and the nearly pure effluent water is recovered. Scale formation in this section is controlled by a seed slurry technique.
3. The Seed Recycle Section-A portion of the precipitated solid slurry is recycled back to evaporator slurry tank to maintain an adequate suspended solid level in the evaporator brine, and the final waste is pumped to the waste disposal sump and then to the evaporation pond.
For a more detailed explanation of the system, sulfuric acid is fed to the cooling tower blowdown water for pH control just before it enters the feed tank. The feed tank is designed to have a residence time of 10 to 50 minutes based on a designed flow of 158 gpm. The acidified water is pumped by the high pressure feed pump through the primary heat exchanger, this is a plate type heat exchange
Figure 1. Typical process flow and energy requirements 225,000 GPD Brine Concentrator.
64
.f
and the heat source is from the counter flowing distilled effiuent water. The water then passes through the trim. heat exchanger and finally through the 8e&venge heat exchanger. At tbia point in the eyete the feed water temperature has been raised to about 60F above its atmospheric boiling point. This water enters the deaerator where it is allowed to Dash at near atmospheric pressure releasing the dissolved gas. The steam and gases Dashed off in the evaporator are pumped to the 8e&venge heat exchange to retum heat to the system. The deaerated water then enters the evaporator sump where it mixes with the concentrated brine. The concentrated brine is recirculated over the heat transfer surfaces within the evaporator where the flow is distributed around the tubes and allowed to flow down the tubes in a thin film keeping the tubes wet at all times. Water is evaporated from the brine and passed through a demister to the suction side of the vapor compressor. The vapor is then pumped by a single-stage centrifugal· compressor which raises its saturation temperature 6 to 80F above the boiling point of the brine. The compressor is driven by an 800 horsepower electric motor which converts electrical energy to thermal energy in the saturated steam. This is the main source of energy input to the system.
The compressed steam is pumped to the inside of the evaporator tubes supplying the heat to vaporize the water from the brine. The condensed condensate or product water is then pumped from the product water tank through the heat exchanger to give up its thermal energy to the incoming feed water.
A bleed stream in taken from the brine blowdown line to maintain the proper brine concentration in the evaporator brine tank.
The process is controlled by an automatic control system that keeps the system within dose operating tolerance to produce an effluent of less than 10 ppm total dissolved solids.
The BCC system met all the requirements of the specifications during the one year test period and was purchased by Utah Power & Light.
The main operating problem experienced with the system was fouling of the plate heat exehanger. A filter has been installed in the make-up water line and tbia should minimize this problem.
The effiuent from the brine concentrator is used as make-up water to the mixed bed demineralizer which produces the ultra pure water for boDer make-up needs. The BCC effiuent materially extends the demineralizer runs and produces a plus in the over all system economies, plus reducing the wastewater flow to the evaporation pond by about 50 percent.
I will now discuss the retrofit wastewater handling system at our Gadsby plant as contrasted to the new system at Huntington.
The Utah Power & Light Company's Gadsby plant is a three unit steam electric generating plant located west of downtown Salt Lake City on the west bank of the Jordan
6S
River. The first unit, rated at 66 MW went into service in 1951 followed by the second, a 75 MW unit, in 1952, and the third a 100 MW unit in 1955.
The water supply system for the plant consists of a diversion dam in the Jordan River, an intake structure with a rotating screen, a eireular clarifier, a holding tank and pumps. This system supplies the make-up water to the condenser cooling water systems for the three units. Water is lost from the system through evaporation in the cooling towers and system blowdown the same as at the Huntington plant.
The main wastewater streams from the plant are from the condenser cooling system blowdowns, the clarifier blowdowns, the wash water from the ash handling system, the sodium and hydrogen zeolite water softener back wash and rinse drains, and boner and evaporator blowdown. There is also a tbermo drain from the steam heated pitched tank heaters in the on tank farm area.
Originally these waste streams discharged into the Jordan River on the east side of the plant or to the industrial canal to the west of the plant. This was the logical and accepted procedure at the time these units were designed and constructed in the early 1950s.
The passage of the Clean Water Act in 1972 and the implementation of the National Pollution Discharge Elimination System regulations ushered in a new set of standards and parameters for wastewater handling and discharge control requirements which we must now meet.
The first permits for the Gadsby plant were received late in 1978 and were for a three year period. The permit limits for TSS was for an average of 30 ppm for one of the five discharge points, the other four discharge points had to meet 30 ppm by January 1, 1974; the pH range was 6.5 to 9.0; temperJt;ure 900F and 95OF; chlorine residual of 1.0 ppm; and on or grease at 10 ppm.
Renewal permits were received in 1976 and are for a five year period. The total suspended solid limit was reduced to an average of 25 ppm with a maximum of 50 ppm. The average and maximum value for TSS will be further reduced to 10 ppm and 25 ppm respectively in 1980. The chlorine was changed to 1.0 ppm free available chlorine. Temperature remained at 950F and on and grease remained the same at 10 ppm.
The issuing of the discharge permits with these low limitations on the quality of wastewater allowed from the plant discharge was the catalyst that set into motion the engineering and design process for controlling the various wastewater streams.
Two studies were initiated to determine the total flow rate of all water discharges, where they originated in the system and the average and maximum parameter of these streams.
As stated before, the Gadsby plant is located on the west side of the Jordan River with the intake structure, the water treating plant, the cooling tower for the No. 1 unit and the pitch tank farm all located east of the plant,

therefore all drains from the No. 1 unit diseharge into the Jordan River.
When Units 2 and 8 were constructed. the cooling towers for these two units were constructed west of the plant and the blowdowns from these units discharge into the industrial canal.
It was. therefore. necessary in the pre-engineering studies to determine accurately. if possible, the source of all the wastewater streams and the present operating parameters and conditions.
The studies indicated that TSS was the most serious problem faced, and occurred mainly from drains on the east side of the plant. The greatest TSS load was from the air washer drain for the ash handling system and the clarifier blowdown. The boiler and evaporator blowdowns had a component oj basieally low TSS along with temperature, also a temperature problem occurred with . the pitch farm heater condensate drain. The baek flush and regeneration drains from the sodium and hydrogen zeolite water softening system also required control to minimize pH swings.
The design of the new system also addressed the problem of reducing the need for city water to meet the make-up water requirements during peak load periods especlally during the hot summer months, therefore, a second clarifier was designed into the system.
The new wastewater system contains an ash water sump where the air washer water was collected along with the boiler and evaporation blowdowns. This water was pumped to a thickner where ash and other TSS are settled out. The heavy under flow is pumped to a tank truck and the waste disposed of in a land fill area. The dear eMueDt is discharged to the new clarifier and supplements raw river water producing additional make-up water for the three condenser cooling water systems. The under flows from the two clarifiers, and the zeoHte softener back flush and rinse drains are piped to the thiekner for disposal. This reduces the number of discharge points to the Jordan River to one, which handles the No. 1 cooling tower blowdown and the emergency over flows of dean water from the thiekner or clarifier.
This system was plaeedin service in May of 1976 and has undergone several chanps in concept and in equipment. Several pump failures were experienced along with failures in other equipment components, m8.inly in the control . sy~ms. One majOr system change was also required. The draining of the hot boiler and evaporator blOwdown water into the ash water pump sump increase the calcium carbonate disposition in the line from the pump sump to the thickner. The blowdown line has been changed to discharge into the No.1 cOoling tower basin in hopeS of easing this problem, An agitator was also installed in the ash pump sump to minimize ash build up in the sump and to prevent plugging of the pump suction sereena, this seems to be working very well.
The blowdown from the No. 2 and 3 towers are now planned to be diverted to the Jordan River this summer and during the summer of 1979 the No.1 cooling tower will be diverted to this line. A sand ruter will be installed in this line to bring the TSS of wastewater discharges to the Jordan River into compliance with the 10 ppm TSS limitation. by 1980. At the Carbon plant we have a sand ruter operating on the cooling tower blowdowns from the two cooling towers at this plant with very good suecess.
There are emergency conditions that imposed abnormal loads on the wastewater discharge system that were not adequately considered in the initial design phase. to correct this a surge or holdfug pond is being designed to handle the short term heavy flows from emergency situations without violating the discharge 1imitations and over loading the wastewater treatment system.
The presently installed system and modificationa planned should allow the wastewater discharges from the Gadsby plant to meet all of the requirements in our NPDES permits. So far this has r1lquired the eXpenditure of approximately $675,000 and inCreased the operating eXpense at this plant which must be compensated for by increased cost of electrical power for our customers. We have a mandate to keep our expenditures for new equipment and operating eXpenses at a minimum. therefore any c in waStewater control requirements by congress or should be evaluated as to the soe-eeonomie impact they will have along with the cost-benefit ratio of the regulation. We must strive to keep our operating costs down and to meet accepted environmental standards.

BiologieaLTreatment of . Petrochemical and RefinerY Wastes
INTRODUCTION
The control of wastewater discharged from a modern petrochemical or refinery complex will depend on an understanding of all processes contnbuting to the waste, available optiOIUl for treatment and waste disposal, effiuent quality standards and operation of the treatment plant.
The successful treatment of wastewaters discharged from refineries and petrochemical plants is predicated on many factors and while it is recognized that each industry poses its individual problems, there is a logical approach to selecting .efficient treatment processes.
The present and future levels of wastewaters and residuals depend on the sources and management of these inputs. Figure 1 depicts the six general sources as proeess streams, utility wastes, sewage,' contaminated storm water, ballast from ships and miscellaneous discharges.
The solutioll'of a specific pollution probleJll normally involves the completion of a series of individual phases, with the final result being the construetion of the necessary treatment process units. The engineering effort needed to obtain design data is divided into phases and further grouped into tasks. Phase I colUlists of the proeess inventory, the wastewater survey, localizing major pollutional streams, identifying sources. of major pollutants, outIining and implementing an analytical schedule, and misinterpretation of data. Under Phase n, candidate processes are reviewed and selective wastestreams screened for toxic reactiolUl prior to bench-scale and pilot plant studies. Phase ill consists of preparing a preliminary engineering report which tralUllates information developed from the treatability study to rational engineering designs. This phase outlines the conceptual design, the sizing of the major unit processes, the estimated cost of the system, and the finalized conclusions and recommendations. The final phase in the USA involves preparing bid documents; namely, the colUltruction drawings and specificatiolUl.
Information gained during the wastewater survey forms the basis for all future deeisiolUl and it is, therefore,
~avis L. Ford. Ph.D., P,E., Is Stmior Vb President. Engineering-Science, Inc. Austin. Texaa.
67
imperative that careful consideratiOlUl be given to this phase of the water pollution abatement program. In order to accomplish these objectives, a series of investigations should be performed as follows:
1. Review process information and plant records; 2. Establish sampling points based on potential
waste reuse, product recovery, and segregation of specific waste streams;
3. Establish a sampling and flow measurement program;
4. Conduct field surveys to locate wastewater colleetion points; and
NORMAL PROCESS OPERATION::::-t PRIMARY POLLUTANTS: Dill$clv.d OrgORlcl.
Oil e Grea.e '
UTILITY OPERATIONS PRIMARY POLLUTANTS: Di .. ,olve<l Soli ••
Tellll)etOlut •• CooItIlO To • ., Addifh •••
SANITARY SEWAGE .. PRIMARY POLLUYl.NTS; Organic •• PollIO-
.. ,entG MIt;oorOOllilml, Nul,lellf. COMBINED)
EFFLUENT
~ONTAMINJl.TEO STORM RUNO~F .. PRIMARY POLLUTANTS: Oi,"lved Orgonicl~
Oil a .... 0 ..
BALLAST WATER SLOWDOWN .. lA S APPLICABLE) ""
. PRIMARY POLLUTANTS, Oiaeolvld Organic., Oil a GrIO'.
MISCELLANEOUS DISCHARGES .. PRIMARY POLLUTANTS: OlllOlv.d Orgonle,""
011 e Gr.a ..
Figure 1 .. Ge1aef.oal sources 0/ wasteB.

5. Perform the sampling and analytical progra!p based on field conditions, treatability parameters, and regulatory quality requirements.
The importance of representative samples cannot be overemphasized. In some instances, wastes must be prepared from a variety of sources. When industrial plants exist, grab samples may be acceptable and even necess~ in cases of unstable constituents, but composited samples are desirable for the treatability studies.
The trend toward more stringent emuent standards has generated an increased interest in the handling and treatment of storm runoff. Because storm flow is intermittent and unpredictable in nature and little data has been collected to typify its characteristics within industrial installations, the design of handling and treatment facilities presents a challenging engineering problem. Since direct treatment of the high flow volumes experienced during a storm is normally impractical, the contaminated runoff must generally be surged and temporarily stored prior to treatment. The design of appropriate storage facilities must be predicated upon the degree of segregation to be practiced, a reasonable determination of required volumes, peak flow rates anticipated and the development of an economic balance between required storage volumes and the additional treatment capacity needed to handle peak flows due to runoff.
Ballast derived from ships and barges should not be overlooked. Ballast and storm runoff may be considered as batch discharges and usually some storage is required.
Petrochemical and refinery wastewaters are highly variable with regard to both quantity and quality, and as a consequence, characterization is difficult. The organic component of the wastewater is usually estimated in terms of the five-day biochemical demand (BOD5)' chemical oxygen demand (COD), total oxygen demand (TOD), or total organic carbon (TOC). The BOD5 analyses are sometimes more difficult to undertake; consequently, COD. TOC, and TOD have gained in popularity.
Inorganic characterization is also an important part of the overall treatability program. These analyses should include potential toxic elements such as heavy metals and possible pollutants such as acidity. alkalinity, suspended solids, nitrogen, phosphorus. chlorides, etc.
Wastes from the petroleum industry may include various volatile fractions, lubricants, gas oil, fuel oil, wax, asphalt. petroleum coke, etc. Additionally, chemicals are derived from petroleum derivatives and natural gas.
Traditionally, refinery wastewaters have been categorized as clean water or process wastewater. These general classifications are often further segregated into high and low total dissolved solids (TDS) streams, dirty and clean storm water, high and low organic streams, sanitary wastewaters, and ballast water. Low TDS streams are usually segregated for their reuse potential.
Most hydrocarbon wastes usually occur from leaks. spills, and product dumps. Steam condensate from reflux systems contain significant amounts of both hydrogen
68
sulfide and mercaptans and, depending on the plant processes and temperatures, sulfide concentrations of combined sewers may be between 2 and 5 mg/l. Petrochemical wastewaters are often alkaline since caustics are used to purify various hydrocarbon streams. and these wastes are often toxic. oxygen demanding. and disagreeable to the senses. Phenols and eresols are produced by various cracking processes used in refinery operations and these wastes are among the most troublesome pollutants produced by the petroleum industry. Ammonia arises from two sources: ammonia added directly to process streams for the control of corrosion, and ammonia resulting from the breakdown of nitrogenous compounds. Corrosion inhibitors. particularly heavy metals. may create some waste disposal problems.
CHARACTERIZATION OF INDUSTRIAL WASTEWATERS
The analysis, design. operation, and control of biological treatment systems are all based on the characterization of the liquid waste using selected parameters. The proper analytical techniques as well as correct interpretation of the results are, therefore, of prime importance when considering the biological treatment of industrial wastes.
Parameters used to characterize industrial wastewaters can be categorized into organic and inorganic analyses. The organic content of wastewater is estimated in terms of oxygen demand using biochemical oxygen demand (BOD). chemical oxygen demand (COD) or total oxygen demand (TOD). Additionally. the organic fraction can be expressed in terms of carbon using total organic carbon (TOC). It should be recognized that these parameters do not necessarily measure the ~e constituents. Speeifieally. they reflect the following:'
1. BOD-biodegradable organics in terms of oxygen demand
2. COD-organics amenable to chemical oxidation as well as certain inorganics, such as sulfides, sulfites, ferrous iron, chlorides, and nitrites.
3. TOD-all organics and some inorganics in terms of oxygen demand .
4. TOC -all organic carbon expressed as carbon.
Another organic parameter commonly used in defining industrial wastewaters is the measurement of oil and grease. This analysis is particularly important since oils have both a recovery value and reduce. the efficiency of biological treatment systems.
Extraction techniques using various organic solvents such as n-hexane. petroleum ether. chloroform, and trichloro-trifluoro-ethane are used to determine the oil and grease content of wastewaters. The method outlined by the Environmental Protection Agency (EPA) measures hexane extractable matter from wastewaters, but excludes hydrocarbons that volatilize at temperatures below 800c (3). Additionally, not all emulsified oils are measured using these extraction techniques. However, a modified procedure provides for the release of water soluble oils by saturating an acidified sample with salt (4).

The inorganic characterization schedule for wastewaters to be treated using biological systems should include those tests which provide information concerning:
1. Potential toxicity, such as heavy metals, ammonia. etc.
2. Potential inhibitors, such as total dissolved solids (TDS), chlorides, sulfates, etc.
3. Contaminants requiring specific pretreatment such as pH, alkalinity, acidity, suspended solids, etc.
4. Nutrient availability.
CORRELATION OF ORGANIC PARAMETERS
A comparative analysis of organic parameters alludes to a more interpretive definition of the nature of the wastewater organic component. Moreover, correlation of these parameters can result in the more effective operation and control of existing biological facilities as well as predicting the applicability of these systems in treating the wastewater(s) in question. A discussion of these organic parametric relationships follows.
BOD/COD Relationship
The BOD/COD relationship is generally considered to indicate the fraction of the chemically oxidizable organics which are amenable to biological degradation. For example, if the BODult/COD ratio of a wastewater approached unity, a major fraction of the organic materials in the waste would be considered as biodegradable. Conversely, a BODult/COD ratio of 0.1 to 0.3 would indicate that a major portion of the organics which are amenable to chemical oxidation are resistant to biochemical oxidation, and a proposed biological treatment system should be considered as questionable on this basis. It is, of course, possible that a large fraction of the observed COD is attributable to the oxidation of reduced inorganic constituents, but this can be determined by performing ancillary chemical analyses.
An evaluation of BOD and COD for selected chemicals categorized into four groups is presented in Table 1. The results are tabulated in terms of the COD and BOD yield as a percent of theoretical oxygen demand (ThOD) (5). As a rule, the higher the percentage of BOD yield, the more applicable one would expect biological treatment to be. Another list which states relative biodegradability of certain organic compounds is tabulated in Table 2 (6).
BOD-COD/TOC Relationships
In attempting to correlate the BOD or COD of an industrial wastewater to TOC, certain factors which might constrain or discredit the correlation should be considered at the outset. These include:
1. A portion ofthe COD may be attributable to the oxidation of inorganics as previously described while the TOC analysis does not include the oxidation of these compounds.
2. The BOD or COD tests do not include those organic compounds which are partially or totally resistant to chemical or biochemical oxidation. However. all of the organic carbon is recovered in the TOC analysis.
69
Table 1. Evaluation of COD and BOD 'With respect to theoretical orggen demand-test organic mao terials.
Measured COD ~easured .. ~
ThOa COD 'fIiW BODs ffiW CHEMICAL GROUP (mgl!!!!!) (mg/mg) 1%1 (mgl!!!!!l (%)
ALIPHATICS
Methanol 1.50 1.05 70 1.12 75 Ethanol 2.08 2.11 100 1.58 76 Ethylene glycol 1.26 1.21 96 0.39 29 Isopropanol 2.39 2.12 89 0.16 7 Maleic acid 0.83 0.80 96 0.64 77 Acetone 2.20 2.07 94 0.81 37 Methyl ethyl ketone 2.44 2.20 90 1.81 74 Ethyl acetate 1.82 1.54 85 1.24 68 Oxalic acid 0.18 0.18 100 0.16 89
Group Average 91 56
AROMATICS
Toluene 3.13 1.41 45 0.86 28 Ben za 1 dehyde 2.42 1.98 80 1.62 67 Benzoic acid 1.96 1.95 100 1.45 74 Hydroqui none 1.89 1.83 100 1.00 53 o-Cresol 2.52 2.38 95 1.76 70
Group Average 84 58
NITROGENOUS ORGANICS
t-lonoethano 1 ami ne 2.49 1.27 51 0.83 34 Acryl onitril e 3.17 1.39 44 nil 0 Anil i ne 3.18 2.34 74 1.42 44
Group Average 58 26
REFRACTORY
Tertiary - butanol 2.59 2.18 84 0 0 Diethylene glyCOl 1.51 1.06 70 0.15 10 Pyridine 3.13 0.05 2 0.06 2
Group Average 52 4
Table f. Relo.tive biodegradabiJi.t1l of certain orga'Tl.ic compounds.
Biodegradable OrganiC
Compo"nds*
Acryl ic Acid
AliphatiC Acids
Al iphat ic Alcc:,01 s (normal, iso, secondary)
Aliphatic Aldehydes
Aliphatic Esters
Alkyl Benzene Sulfonates w/exception Of propylene-based Benza ldehyde
Aron1atic AI:;ines
UichlorophenOlS
Ethanolamines
Glycols
Ketones
Methacryl ic Acid
~ethy 1 ;'\e1.hacry I a te
t-lQnoc',lorophenol S
IH trll es
Phenol s
Prill'<lry Aliphatic Amines
Styrene
Vinyl Acetate
Compounds Genera 11 y Resistant to Biological
Degradation
Ethers
Ethylene Chlorohydrin
Isoprene
Methyl Vi nyl Ketone
Morphol ine
Oil
Pol ymeri c Compounds
Polypropylene Benzene Sulfonates
Sel ected Hydrocarbons Aliphatics Aromatics Alkyl-Aryl Groups
Tertiary Al iphatic Alcohol s Tertiary Benzene
Trichlorophenol s
* Some compounds can be degraded biologically only ,after extended periods
of seed accl imation.

8. The BOD test is susceptible t() va.rlll.bles which include seed acclimati()n, pli. temperature, toxic substances, etc. The COD and TOe tests are iq~ependent of these variables. . ..
One would expect the stoichiometric COD/TOC ratio of a wastewater to approxima~ the molecular ratio of oJ!;ygen to ~bon (82/12 = 2.67). Th~retic~y. the r~tio limits would range frQm zerQ, whe~ tile o!:,ganic ~aterial is resistant to dichromate o1\idatiQn, to {:i.as for methane. Higher ratio· values pos.si~ly infer the presence of inorganic-reducing ageftis. Reported COD and TOC values fo!:, several chemical an~ re(iqery wastewaters investigated indicate the COD/TOe :fl,ltio varying fJ,-om 2.19 to 6.65 (7). This variability is attribu,ted to the COD yield, and waste streams cont~ing a poff;iPll of these substances would be subjected to a iluctuatmg CPD/TOC ratio in the event of relative concentration changes. The greater the variability in the characteristics of an industrial w~te stream. the more p~nounced will ~ the change in its COD/TOC ratio. This in itself is a good indicator of the degree of consistency of wastewater constituents and can be a valuable aid in predicting the <l~sign organic load applied to a biological treatment facility.
The BOD5/COD and COD/TOC ratios recently reported for various industrial pro(luct~on facUities are shown in Table 8. (8). Samp~es were t!!.ken directly from the process units and in most cases excluded d)Jution from cooling tower or boiler blowdown sources.
CODITOD Relationship
The COD and TOD values have been correlated for several waste streams, although extensive correlation data
Thble 8. Individual wastewater characterizati!m
WASTEWATER BOD,/COO COO/TOC
Acrylonitril e 0.19 2.0
Ammonia 0.06
AiTIllOnia 0.55 4.4
Ammonia + Util ities 0.37 3.4
Butadi ene-Styrene 0.05 3.8
Chlorine-Soda 0.03 22.5*
Cumene 0.12 5.6
EDC-Di rect 0.49 1.6
EDC-Oxyhydrochlori nati on 0.64 1.8
Ethylene Oxide 0.35 17 .0*
01efins 0.25 3.4
Polystyrene 0.44 3.3
Polyvinyl chloride 0.10 1.9
Propylene Oxide 0.45 5.0
Propyl ene Glycol 0.48 4.9
Propylene Tetramer 0.34 0.7
Sewage 0.37 3.4
Synthetic Rubber 0.51 3.9
Urea 0.79 0.8
Vinyl Chloride 0.04 0.9
* TDS > 20,000 mg/l
70
is not presently available. The TOD concentration usually can be expected to be higher than the corresponding COD values by virtue of the fact that chemical oxidation is· less effici!:lnt than that obtllined in the catalyzed combustion chamber of the TOD analYZj;lr. Preliminary unpublished data indicate that the COD yield of refinery wastewaters ranges from 70 to 80 percent of the total oxygen demand. Unusually bigh COD/TOD l'8:tios favor the chemical oxidation of inorganies over their oxidation in a catalytic combustion chamber. If the COD/TOD value was unusually low, then the presence of constituents resistant to chemical oxidation would be inferred, or perhaps a more complete oxidation of inorgani~ in the combustion tube was . observed than that ob~ed chemically. Reported COP/TOD values foJ:' untreated industrial wastewaters are tabulated in Table 4 (91 itO). These data indicate that average eOD/TOD values for the raw industrial wastewaters cited approximate unity, with the variations being attributed to the aforementioned factors.
PROCESS DESIGN FORMULATION
Once the industrial wastewater has been characterized, decisions can be made regarding pre- or primary treatment requirements. the type of biological processes to be considered, and the degree of bench or pilot scale treatability studies necessary for adequately developing process design criteria.
Pre- Qr Primary Treatment
One of the critical features in designing a biological treatment system receiving industrial wastewaters is inclusion of the necessary pre- or primary treatment processes. There are many constituents in industrial wastewaters which adversely affect biological treatment systems. Reported limiting or inhibitory concentrations for some of these constituents are listed in Table 5 (7). The characterization results of the industrial wastewater will indicate which, if any, of the contaminants should be removed prior to being treated biologically. Of those cited in Table 5, the organic load variation generally is the most significant. Most industrial effiuents are highly fluctuative both in terms of flow and constituents. Such variations are highly detrimental to the biological process and indicate the need for equalization. The size of the equalization basin and its degree of mixing will determine the effectiveness of dampening these variations. If sufficient flow and quality information is obtained during the wastewater characterization study. a rational basis for designing the equalization
Table 4. COD/TOD ratio8 for untreated industrial wastewater8.
TYPE OF WASTEWA TEll Refi nery Wa ste
Pesticide Manufacturing Waste
Petrochemical Waste
Petrochemica 1 Waste
Petrochemical Waste
PlastiCS Manufacturing Waste
Cryogenics Plant Waste
Refinery Waste
Combined Refinery-Petrochemical Waste
COD/TOD 0.99
0.95
0.98
1.20
1.12
1.25
1.04 0.71
0.75

Table 5. General tolenmce limits/or biological treatment.
LIMITING OR INHIBITORY CONSTITUENT CONCENTRATION PRETREATMENT
Suspended Sol ids >125 mgll Lagooning, sedimen-tation, flotation
Oil or Grea se >50 mg/l Skimming tank or separator
Hea vy Meta 1 s <1-10 mgll Precipitation Or ion exchange
Acidity Free mineral acidity Neutralization
Organic Load Variation (based on 4 hour composite) >4:1 Equal ization
Sulfides > 100 mg/1 Precipitation or stripping
Ch 1 ori des > (8 ,000 - 15,000 mgll) Dilution, deionization
Phenol s >(70 - 160 mgll) Stripping, provide complete mixing
AImlonia >1,600 mg{l Dilution; pH adjust-ment and stripping
Dissolved Salts >20,000 mgfl Dilution, ion exchange
facility can be developed. One approaeh is the use of the following equation:
where:
X(t + ill)
Q v t
Ct 1 - exp v v
. (l)
time increment chosen for the numerical step-bystep calculation input concentration averaged over Ll t basin concentration before addition of the increment of flow at concentration of Ct basin concentration after addition of increment of flow volumetric flow rate basin volume time, varies between zero and Ll t in the equation. The expression need only be evaluated at t = Ll t.
Using this model, the equalization basin coneentration of a eritieal pollutant or that discharged to the biological process can be ealeulated at selected time intervals for various equalization volumes. This assumes that the eritieal pollutant in the industrial diseharge was measured at time intervals of suffieient frequency to aeeurately define the variation. The standard deviation of the equalized eoncentration will decrease with inereasing basin retention time. The relationship then ean be used for selecting the retention time whieh eorresponds to the maximum fluctuation that can be tolerated in the biological system.
Oil and grease are of paramount importanee when designing biological systems for industrial wastewaters
71
sueh as those discharged from petroleum refinery and petrochemical installations. Hexane extractables adversely affect a biological system as theeoneentration in the mixed liquor approaehes 50 to 75 mg/l. A recent study conducted for the Environmental Protection Agency indicated that an activated sludge system will perform satisfactorily with a continuous loading of hexane extractables of 0.1 Ibs per lb of mixed liquor suspended solids. It was recommended that the influent to the biological system should eontain less than 75 mgll hexane extractables, and preferably less than 50 mg/l. The most significant problem related to oils in biological systems was attributed to lowering floc density to a level where the sludge settling properties were destroyed (11). The removal of free, and to some extent, emulsified oils through gravity separation, air flotation or possible mtration, its therefore required in many instanees.
BIOLOGICAL TREATABD..ITY STUDIES AND DESIGN CRITERIA
The necessary prerequisite in the formulation of design eriteria for biological systems, partieularly where complex organie wastewaters are involved, is a process simulation study programmed to provide key information relative to the removal of pollutants. The preliminary eharacterization analyses as previously deseribed may be indicative of the applicability of biological treatment applieation, but a treatability study is necessary in many eases to deseribe and relate process removal kineties to the nature of the wastewater and the obtainable effluent quality.
There are several approaehes whieh can be utilized to evaluate eandidate biologieal systems. The most obvious technique for process evaluation is to simulate alternate systems on a beneh or pilot seale and measure biologieal responses to various organie and environmental conditions. It should be recognized, however, that the aceuracy of information developed from process simulation depends on several factors.
These include:
1. The eharacteristics of the wastewater used in the treatability tests are representative of those antieipated in field tests.
2. The physical nature of the beneh or pilot scale process is similar to the proposed full seale unit.
S. Independent and dependent operational variables are eonsidered.
4. Environmental parameters affecting process efficiency are defined.
It is apparent from these eonstraints that process simulation techniques can provide predietor relationships and mathematieal expressions for the treatment process and wastewater in question, but does not necessarily define a specifie· model with general applications. However, a treatability study whieh is properly programmed and judieiously implemented does afford the basis for the logieal development of unit process selection, design, and predietive performance.
Continuous flow and batch biological reactor systems are used in the laboratory to assess the treatment capaeity

and process kinetics of a fluidized high rate biological system such as extended aeration or activated sludge. A batch reactor is primarily used in "screening" analyses; namely. determining toxic thresholds by varying the concentration of wastewater or delineating biologically "treatable" wastewaters from those which are not amenable to biological degradation. Such reactors are normally "fill and draw" type units. with the biological solids and wastewater being aerated until the organic constituents are reduced to a specific level. It is not recommended that batch developed bio-kinetics be applied to a continuous system.
Continuous flow systems in the laboratory are designed to provide a steady supply of wastewater through the reactor, permitting a continuous withdrawal of the spent substrate or treated effluent.
There have been many biological pilot facilities constructed, varying in size and design. Basically. the extent of pilot plant operations is a function of:
1. The degree of reliability required: 2. The size of the full scale facility: 3. The nature of the wastewater to be treated;
and. 4. The time and budgetary allowances.
This basically includes an evaluation of substrate removal, sludge production, and oxygen requirements.
There is an increasing use of completely mixed biological systems, particularly in the activated sludge treatment of industrial wastes. In this case, the soluble BOD in the effluent is equal to that in the aeration tank. A material balance results in the following relationship:
where:
~ (V). . . . . . . . . . (2) dt
So = raw waste COD, BOD Se = effluent COD, BOD V = tank volume t = detention time Q = flow
Substituting the simplest form of dS/dt in terms of a retardant equation will yield the relationship:
(So - Se)/(Xat) = KSen. . . . . . . . . . (3)
where:
Xa = VSS undergoing aeration K = substrate removal rate n = exponent (for a first order approximation, n =
1)
It is recognized that the rate of biochemical reaction (K) is temperature dependent. and the most traditional expression for relating K with temperature in the range of 50C to 350C is the following equation:
72
where:
KT = substrate reDloval rate at temperature "T" K200C = substrate removal rate at 200C
T = aeration basin temperature, OC 8 = coefficient
The coefficient .. 8 " is a function of many variablesnamely, the nature of the wastewater and the type of process. Reported values range from 1.02 for domestic wastewaters to over 1.08 for soluble industrial wastewaters (12). Where there is seasonal variation in temperature, winter conditions will control design.
It has been established previously that the total oxygen requirements in a biological system are related to the oxygen consumed to supply energy for synthesis and the oxygen consumed for endogenous respiration. This assumes that oxygen must be supplied to the system in order to:
1.
2.
3.
Provide oxygen for biological organic removal (a'SrQ); Provide oxygen for endogenous respiration where cells lyse and release soluable oxidizable organic j:Ompounds (b'X V); and, Provide oxygen requiJ for chemical oxidation as measured by the immediate oxygen demand (KoQ).
This expression is:
where:
Rr = oxygen utilization per day a' = fraction of substrate (BOD or COD) used for
oxidation S = substrate (BOD or COD) removed b' = fraction per day of VSS oxidized (oxygen basis) KO == chemical oxygen demand coefficient (as mea-
sured by immediate oxygen demand)
Sludge accumulation in the activated sludge system from the biological oxidation of wastewaters can be computed using a similar approach. The components of a mathematical relationship would include:
1. Increase in sludge attributable to influent SS(Q X·)
2. ufcrease in sludge due to cellular synthesis (aSrQ)
3. Decrease in sludge due to cellular oxidation or endogenous respiration (bX V)
4. Decrease in sludge due to efriuent SS (QXe)
The expression is:

Ax = [QXi + aSrQI - [bXa V + QXel . . . . . (5)
where:
A X = sludge production day a = fraction of substrate (COD, BOD) converted to
new cells b = fraction per day of VSS oxidized (sludge basis) Xi = influent SS Xe = effluent SS
A graphical solution for determining the design coefficients can be obtained by varying organic loadings to the bench or pilot scale units and measuring the parametric responses. The substrate removal rate indicated in Equation 3 can be estimated by plotting the response data in accordance with Figure 2-A. If a non-removable COD or BOD persists as shown in Figure 2-B, then Equation 8 must be modified accordingly:
5e
( mgll)
So
(mgtl)
/
/ /
®
1~4----Y----.~1 So-Se Xa t
® Figure 2. Substrate removal rate.
73
The system oxygen requirements can be estimated by rearranging Equation 4:
where:
t = V /Q and KOQ is neglected assuming this oxygen demand is satisfied prior to testing. The a' coefficient is taken as the slope and b' as the intercept when plotting the data as shown in Figure 8-A.
The synthesis sludge production is predicted by rearranging Equation 5 and neglecting or accounting for the influent and effluent suspended solids.
the "a" and "b" coefficients are taken as the slope and intercept values respectively of the plot shown in Figure a-B.
It is to be emphasized that a key parameter in the analysis of the data is:
This parameter is known as the removal velocity and has the units of pounds substrate removed/pound MLVSS/day.
An equally important parameter is:
This parameter is referred to as the organic load and has the units of pounds of substrate applied/pound MLVSS/day. It should be noted that the removal velocity is approximately equal to the organic loading in the lower ranges when the effluent concentration of substrate (Se) is small.
EFFLUENT POLISHING
Increasingly stringent quality standards which are either being imposed or considered for many industries indicate the requirement for polishing or further upgrading the biologically treated effluent. This suggests the use of carbon or filtration processes following biological treatment. The concepts of biological-carbon systems treating refinery and petrochemical wastewaters were recently reported based on extensive pilot work conducted at various industries in the Eastern and Southwestern regions oithe United States (13). This study described the interrelationship of the biological-carbon adsorption system and predicted the effluent quality obtainable by polishing the biologically treated effluent with fixed-bed

carbon columns. This effluent quality projection is shown in Table 6. In certain cases, filtration alone is sufficient as an effluent polishing step. This is particularly true when most of the organic materials in the biologically treated effluent are in suspended form. In a recently conducted study for a refinery, 93 percent of the TSS, 78 percent of the BOD5' and 37 percent of the COD were removed from a biologically treated effluent using an upflow sand filter as the polishing device (14).
.&..
SUMMARY
In summary. biological systems have been and will continue to be an effective process for treating many industrial wastewaters. It is important. however. that the applicability of these systems be proven before the design is finalized. The required pre- or primary treatment should be carefully considered. An adequate wastewater characterization program will indicate the need for equalization. oil removal. or other forms of treatment required as a pretreatment step if the biological system is to perform effectively.
Polishing processes, such as carbon adsorption or filtration, can be applied following biological treatment as required when more stringent effluent quality requirements are established .
Xo REFERENCES
6X Xo
®
@ Figure I. Oxygen requirements and sludge production.
74
1. G10yna, E.F., Ford, D.L., and Eller, J.M., "Water Reuse in Industry.~ WPCF Annual Meeting, Dallas. Texas (1969).
2. Ford. D.L., and Eller, J.M., Unpublished Report (1971).
8. "FWPCA Methods for Chemical Analysis of Water and Wastes," U.S. Department of the Interior. FWPCA (1969).
4. Taras, M.J., and Blum, K.A .• "Determination of Emulsifying Oil in Industrial Wastewater." Journal WPCF, November (1968).
5. Buzzell. J.C., Young. R.H.F .• and Ryclunan. D.W., "Behavior of Organic Chemiea1s in the Aquatic Environment." Report to Manufacturing Chemists' Aasoeiation, April (1968),
6. G1oyna, E.F •• and Ford. D.L., Petrochemical EMuents-Treat· ment Practices, FWPCA, February (1970).
7. Eckenfelder, W.W .• and Ford. D.L •• Water Pollution ControlExperimental Procedures Cor Process Design, Pemberton Press. Austin. Texas (1970).
8. Ford. D.L., Confidential Report. (1972).
9. Ford. D.L., Eller, J.M.. and G1oyn&, E.F., "Analytical Parameters of Petrochemical and Refinery Wastewaters." ACS Conference, Houston. Texas, February (1970).
10. Wood. E., Perry, A.E .. and Hitchcock. M .. "A Critique on Total Oxygen Demand Measurements." ACS Meeting. Houston, Texas. February (1970).
11. Environmental Protection Agency, Project No. 12050 DSH, "The Impact of Oily Materials on Activated Sludge Systems," Hydroscience, Inc .. March (1971).
12. Ford, D.L. and Sebesta, E.C .• "Teropersture Predictions in Activated Sludge Basins Using Mechanical Ae~on," 27th Industrial Waste Conference, Purdue University (1972).
18. Ford. D.L .. and Buereklin. M.A .. ''The Interrelationship of Biologieal-Carbon Adsorption Systems for the Treatment of Refinery and Petrochemical Wastewaters." 6th International Conference. International Aasoeiation of Water Pollution Researeh. Jerusalem. June (1972).
14. Eller, J.M., and Ford, D.L .. Confidential Report (1971).

.... (II
7hble 6. Estimated effluent quality for the activated sludge, carbon. and combined treatment of refinery wastewaters. *
t~ean
Val ue Range Activated Primary Sludge
CONSTITUENT Effl uent Effl uent
COD 500-700 mg/l 100-200 mg/1
BOD_ :"l
250- 350 mg!1 20-50 mgll
Phenols 10-100 mg!1 . 1 Olg/l
pH 8.5 - 9.5 7 - 8.5
S5 50-200 mg/l 20-50 mg/l
TDS 1500-3000 mgll 11500-3000 mgll
NH3-N 15-150 mgll 5-100 mg/l
p 1-10 mg/1 <1-7 mgll
C:onibiried Activated Sludge-Carbon Effluent
30-100
5-30
·1 mg/l
7 - 8.5
·20 mg!1
1500-3000 mg/l
2-100 mg/1
<1-7 mgl1
REr~ARKS
Exact COO residuals vary with complexity of refinery & design contact times in the Activated Sludge and Carbon Treatment Plants.
BOD residual depends on BOO/COD ratio which characterizes relative biodegradability of wastewater.
Phenols (ics) are generally amenable to biological and sorption removal.
pH dro~ in Activated Sludge systems attributed to biologicd~'~Oduction of CO 2 and intermediate acids. pH change in carbon columns depends on preferential adsorption of acidic and basic organics.
Primary effluent solids depend on design and operation of oil removal units. Activated Sludge effluent solids depend on effectiveness of secondary clarifier. Low effluent solids characterize carbon column effluent.
TDS is essentially unchanged through both systems.
Exact concentration depends on pre-stripping facilities, nitrogen content of crude charge, corrosion additive practice and bio-logical nitrification.
Only removal attributed to biological synthesis.
* Based on wastewater characterization data and treatability studies conducted by the author at eight refineries and petrochemical installations.

r
A few experts are deep in water technology. Talk with one ... To upgrade your cooling engineering facilities on your w~ter system protection. Your project. And thafs a lot. bOiler woter progr~Or,tp'get , You benefit wtth sound answers on ~w tii". ~deal wi.". oOl'rO$llOIly d'eIPQI*','~,
i Cleantp plant efflu:nt. . and foul ""{our Bnl representtitlve work ... OWllJIlllt·CC1mlJllY
no paffttmedle&. ~~~~~>,; answe(s
•
There aren't many true expeds. able to give you not only technology but also .. scientlftcally developed ,prodpcts. A!ld the follow'through of qependable technical ServIQ8,;' " " ,
, BEll Is one "r them. '. .
" ,
: . .,.. I' -
II .. · ..... .,., til'
flit·
fI'. W\ ""
lilt.
'" .,.
... .;..
"'.
76
z: ,.' • r1 .'

Cleanin~, TV Inspection and Rehabilitation of· Sanitary
Sewer Lines·
C. Sketchley and Jame8 J. King·
SEWER CLEANING
Rodding-Cleaning Machines. Inc. is very appreciative for having this opportunity of speaking to you today. My talk will be based on three subjects-Sewer Cleaning. TV Inspection. and Sanitary Sewer Rehabilitation. The purpose for Cleaning. TV Inspection and Rehabilitation of Sanitary Sewers is the preservation of pipelines and structures to assure a useful life and ability to withstand the effects of corosion. erosion. age and settling. and further. to make corrections of existing structural deficiencies from all causes and finally the reduction or elimination of infiltration and exfiltration. The elimination of stoppages or control of infiltration and or exfiltration must be accomplished in three steps. The first step is a cleaning program. A cleaning program must be set up for preventative maintenance of the system. This is the first step to the control of stoppages. corosion, build up of sedimentation and sulfides. With the present day sewer cleaning equipment, the guess work of what to do and how to do it is a thing of the past.
Let's take a moment and talk about what cleaning equipment is available for the purpose of cleaning and maintaining a sanitary sewer system. Do you realize that it has only been in the last 20 years that equipment has been available for the maintenance of sewers? Up to the early forties. cleaning and maintenance was performed by either hand rods. tires, cones, or winches. If this did not work, other methods would be performed on a trial and error basis. The results would be temporary. But more important, it developed poor relations with industry and the private citizens of the community. To overcome this type of situation the community had to be educated to the fact that you just don't install a sewer system and forget it. This re-education to the pUblic, board members, and budget officials was a difficult task. It was not until an accident occurred, such as a cave-in in the street, and a person was hurt or killed, or a shut down of a plant that replacement must be performed. In the past 20 years great strides have been made in sewer maintenance. This came in part from communities and cities forming a sewer maintenance section where they would get together once a month and discuss their problems and equipment needs. Through these meetings and supplying requests for sewer equipment, the sewer departments were able to meet the needs and perform their jobs.
"'C. SketchIer and James J. King are with Rodding-Cleaning Machines, Inc. Los Angeles, California.
77
The purchasing of modern cleaning equipment is not limited to rodding machines, bucketing equipment, high pressure water cleaning units or hydraulic balling equipment, but also includes portable equipment such as scooters and self-propelled scrappers. With this type of equipment available, all types of maintenance and sewerage problems can be dealt with.
TV INSPECTION
The introduction of TV Inspection in the early sixties was the foundation for sewer rehabilitation. It is through TV inspection that conditions of sewer lines can be seen and evaluated. Problems such as deterioration, shifting of lines, cracks, sags, off-set joints, infiltration and exfiltration can be seen from this. and a plan of attack can be made to eliminate them. Not only from a preventative maintenance is TV Inspection useful, but also when new sewer lines are installed. the cities and or sewer districts can be assured of a proper and acceptable job. To go another step further with TV Inspection, the Environmental Protection Agency insists on Closed Circuit TV Inspection with Audio-Video Tapes to uphold the findings and determinations of Engineering Firms doing sewer system analysis. Through TV Inspection, all peoples concerned will have a complete visual record of the problems in their system and from that, recommendations for correction can be made.
SEWER REHABn.rrATION
From this point, we enter into the third subject of my presentation-Sanitary Sewer Rehabilitation. As of this date, there are three methods of sewer system rehabilitation-INTERNAL GROUTING. POLYETHELENE SLIP LINING. AND TOTAL REPLACEMENT.
Internal Grouting is the most common and widely used rehabilitation method. This type of rehabilitation consists of locating a sealing packer over a joint and with air pressure testing this joint for tightness and if the joint fails this test, then seal it with chemical grout. This grout not only seals the joint within the connection, but also penetrates outside the joint into the ground and combines itself with this material and forms a lasting seal around the pipe and joint. Depending on the drop of air pressure when applied to the joint. the setting time for the gel can be calculated. If the air pressure drops very slowly, then a fast setting time should be set. If the air pressure drops fast, then a slower gelling time is calculated so that penetration can be made into and around the joint to secure a tight seal. Internal Grouting can be used effectively to correct infiltration and or exfiltration when the following conditions are encountered: (1) Structurally

Sound Pipe with deteriorated joints, off-set joints, open joints or occasional small cracks; (2) House Service Connections; (3) Manhole walls, bases. and inverts. Internal Grouting has its limitations and should not be used as a structural repair for broken. crushed or badly cracked pipes. There may be some of you here today that don't agree with the use of Internal Grouting for the reduction of infiltration and or exfiltration from sewer systems. Let me assure you that this method is proven and reliable. Of the three methods of Sanitary Sewer Rehabilitation. it is the most economical and has been proven on hundreds of projects throughout the country. Let me emphasize at this time that a grouting project is only as good as its applicator.
Polyethelene Slip Lining involves the pulling of a polyethelene pipe into and throughout an existing Sanitary \ Sewer. This technique was introduced in the early seventies for rehabilitation projects. and many of the projects that couldn't be Internal Grouted successfully can now be Slip Lined at a lower cost and expense than if it had to be totally replaced. Such advantages as minimum excavations. savings in trenching costs and safety. heat fused joints. minimum interruption for traffic and (50 percent) savings time for installation versus Total Replacement enhance the method of rehabilitation by Polyethelene Slip Lining. A major advantage that everyone cares about is cost. With this type of rehabilitation. there is an approximate savings of 30 percent over Total Replacement. Polyethelene Slip Lining can be used effectively when the following conditions exist: (1) Deteriorating pipe having shallow grade. septic conditions. and corosive liquids; (2) Extensively cracked pipe in unstable soil conditions; (3) Pipe with massive and destructive root intrusion problems; (4) Off-set and Open joints; and (5) Deteriorated House Service Connections. Total Replacement involves the removal of existing pipes and or excavations. backfill. and paving. The cost of this method is extremely expensive and much higher than the previous two types.
You are aware of the procedures involved in this method and an extensive discussion would not enlighten you to any degree. The main advantage of total replacement is when sewer lines are so badly deteriorated that extensive excavations would be needed in order to correct the alignment so that a liner could be installed. When this situation arises, there is no alternative but to totally replace the line.
At this time, I would like to add that combination methods for sewer system rehabilitation are needed. In
78
many instances where Sewer System Evaluation Studies have been performed. the corrective methods suggested have been combinations of all three types of rehabilitation. Depending on the conditions encountered. Internal Grouting, Polyethelene Slip Lining, and Total Replacement may be needed. Rehabilitation is what it says. The method or the combination of methods is what makes up that final program that eliminates sewer problems.
To summarize, the three subjects that I have talked about are all interrelated. Our main objective is the preservation of the sewer system. Through Cleaning. TV Inspection, and when needed, a proper rehabilitation program, Sanitary Sewer Systems will be maintained. checked. and corrected; and, thus. problems will be eliminated.
CALDWELL, RICHARDS 8 SORENSEN, INC. CONSULTING ENGINEERS SALT LAKE CITY, UTAH
SERVICES: Feasibility studies, reports, en-ergy studies, cost analyses, project design, planning, preparation of drawings and specifications, and supervision of construction.
ENGINEERING AREAS: Civil, Structural, Mechanical
Engineering and Surveying. SPECIALTIES: Water treatment, supply, stor
age and distribution systems. Industrial plant design. Flood control and storm sewer collection systems. Sewage and industrial waste treatment and collection systems. Irrigation dams, reservoirs. canals and pressure systems. Plumbing, heating. and air conditioning systems for buildings. Central chilled water systems and boiler plants. Roads. streets, and subdivision.

Flow Reduction by Pipe Insertion Renewal at Heber,'Utah
CarIH. Carpenter, P.E.·
INTRODUCTION
Heber, Utah is a small rural community of about 3,500 population situated 40 miles southeast of Salt Lake City. It has a sanitary sewer system which was constructed in 1939 and a single-stage trickling filter plant of 1.5 MGD capacity which was constructed in 1954. The sewer system includes more than 112,000 feet of concrete pipe ranging in size from 6 to 15 inches. (see Figure 1.) The pipe joints were caulked with mortar which has deteriorated over the years and allowed excessive infiltration to take place. The source of infiltration is irrigation water delivered throughout the city in a system of open ditches. Thus, the sewer system
·Carl H. Carpenter is a Consulting Engineer with Niltlsen. Maxwell & Wangsgard Consulting Engineers. Salt Lake CitY. Utah.
1: '-,\' ....... , •• ,,'1' .... ",
fI\..tJIoI,1 I
• }
{( \
Figure 1.
·0 .-------·r.~~~~ 2 t. t,
~.. .'. I j', ~ .... ~'; L~~ 4 .. 4 ,- +
.... ~, .. '. r .,' ,"
• . "'."10< • I ,. . I .' .. "I.
I, . • !. + .... ~ t,.,.: ~"
: ' •• t .. .4_
79
has acted as a drain during the irrigation season, and picked up massive amounts of water which is conveyed to the treatment plant. When irrigation water is applied to the city lots in the spring and summer each year the flow at the plant increases from 0.6 MGD to 6.0 MGD in a matter of a fe,! daIS greatly overloading the plant capacity. (See Figure 2.)
1969 STUDY
In 1969, the city retained Nielsen, Maxwell & Wangsgard to investigate a means of correcting this massive infiltration problem. After a year of study it was recommended that the ultimate solution would be to better control the irrigation water by installing a pressure irrigation system throughout the city. The city adopted the
, I ,I
'. r •
.' , I.
" I"
• I
:1L J iJ
','
, .- . .,-
~~- ~ ~~ -'~
.. , " • I ~i' -- -.
I HO"T~
NOTE ."(.S ,"' .Hle .. 'If*tll ....... ' .. "., 0111 II TO H 0'),,( aqt ~'U ..... .
I,!. T, •• t, • 1:1
._.J
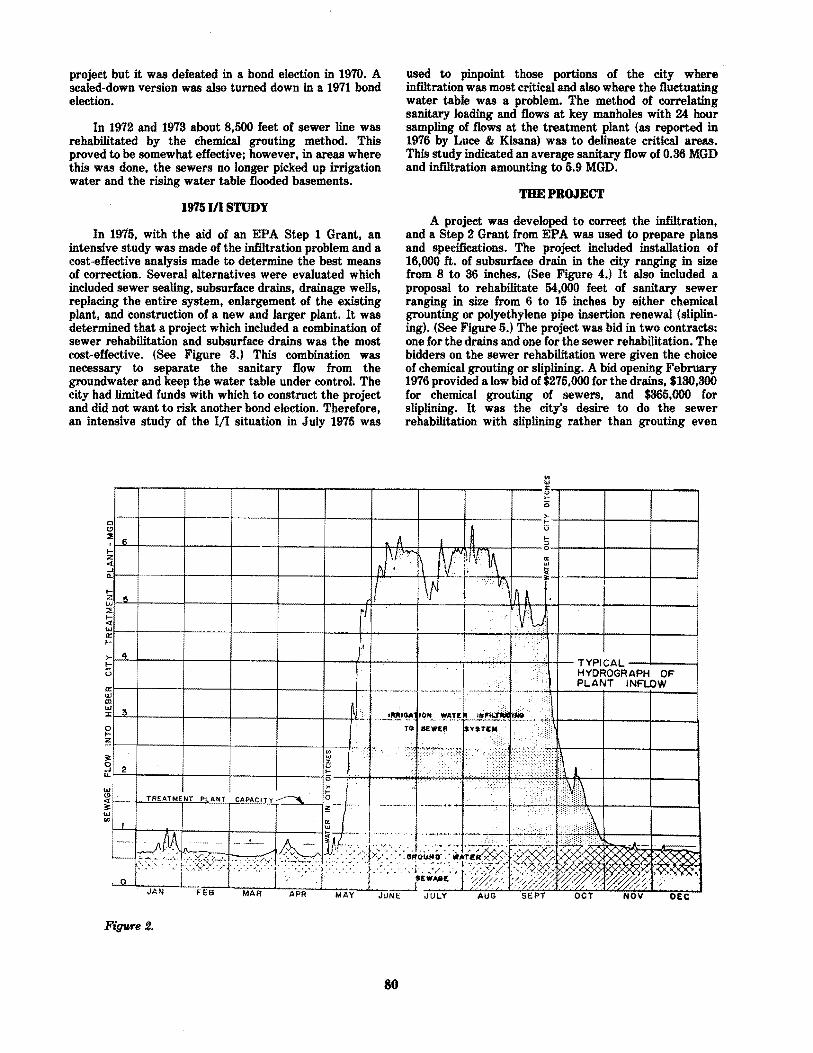
project but it was defeated in a bond election in 1970. A sealed· down version was also turned down in a 1971 bond election.
In 1972 and 1973 about 8.500 feet of sewer line was rehabilitated by the chemical grouting method. This proved to be somewhat effective; however. in areas where this was done, the sewers no longer picked up irrigation water and the rising water table flooded basements.
1975111 STUDY
In 1915. with the aid of an EPA Step 1 Grant, an intensive study was made of the infiltration problem and a cost·effective analysis made to determine the best means of correction. Several alternatives were evaluated which included sewer sealing. subsurface drains, drainage weDs, replacing the entire system. enlargement of the existing plant, and construction of a new and larger plant. It was determined that a project which included a combination of sewer rehabilitation and subsurface drains was the most cost-effective. (See Figure 3.) This combination was necessary to separate the sanitary flow from the groundwater and keep the water table under control. The city had limited funds with which to construct the project and did not want to risk another bond election. Therefore. an intensive study of the III situation in July 1975 was
used to pinpoint those portions of the city where infiltration was most critical and also where the fluctuating water table was a problem. The method of correlating sanitary loading and flows at key manholes with 24 hour sampling of flows at the treatment plant (as reported in 1976 by Luce & Kisana) was to delineate critical areas. This study indicated an average sanitary flow of 0.36 MGD and infiltration amounting to 5.9 MGD.
THE PROJECT
A project was developed to correct the infiltration, and a Step 2 Grant from EPA was used to prepare plans and specifications. The project included installation of 16,000 ft. of subsurface drain in the city ranging in size from 8 to 36 inches. (See Figure 4.) It also included a proposal to rehabilitate 54,000 feet of sanitary sewer ranging in size from 6 to 15 inches by either chemical grounting or polyethylene pipe insertion renewal (sUplining). (See Figure 5.) The project was bid in two contracts: one for the drains and one for the sewer rehabilitation. The bidders on the sewer rehabilitation were given the choice of chemical grouting or sliplining. A bid opening February 1976 provided a low bid of $275,000 for the drains. $180.300 for chemical grouting of sewers. and $365.000 for sliplining. It was the city's desire to do the sewer rehabilitation with sliplining rather than grouting even
'" w r--r----~-----,------r-----~----,_----~----~----_,----G_r----~----~----~
f-a
Figure 2.
80

4
o o o 0 3 o O~ ... ~ 2 t-OO o U
l __ ~=o~====::=================~R~E~M~O~V~A~~~=-~~~~--~ __ ~-1: ~::::::~~ INFILTRATIO o !~%
o 10 20 30 40 50 60 70 80 I 90
6.5 6.0 5.5
Figure 8.
Figure .t. - .. ~----~-
0/0 INFILTRATION REMOVED : ... 2.35 M ..... D. I.! 5.0 4.5 4.0' 3.5 3.0 2.5 I 2.0
TREATMENT CAPACITY. M.G.D.
1[ 1
;~l_x. \ I 1.
llG£NA
T [:lIU,TINQ .£W["
-.....- "E,:W DRAIN
~~~~:'!ll I h-. ==..::====== I
I NOA1'H:
.c",-_ .-. eoo'
J
81

tho.ugh it was mo.re expensive. because it provided fo.r a new. tight service connectio.n at each ho.use lateral; whereas. the grouting did no.t. The III study has sho.wn that leaking service laterals were a big co.ntributo.r to. infiltratio.n. EPA agreed to. this request and a Step 3 Grant was provided to. pay fo.r 75 percent o.f the two. co.ntracts.
Co.nstructio.n o.n bo.th contracts began April 1. 1976 and they ran co.ncurrently thro.ugh the summer with co.mpletio.n by No.vember 1. The drain contracto.r was Knudsen Constructio.n Co.mpany o.f Ogden. and the sewer rehabilitatio.n co.ntracto.r was Hodding-Cleaning Machines. Inc. o.f Los Angeles. Califo.rnia.
Drain co.nstructio.n was co.mpleted using co.nventio.nal methods. Because some trenches were mo.re than 14 feet in depth. a box o.r shield was used thro.ugho.ut the pro.ject. Co.ncrete pipe with lugs cast in the bell to. pro.vide an o.pen jo.irit was used. A gravel envelo.pe was placed around the pipe to. keep sediment o.ut o.f the drains and allo.W flo.W to. enter the jo.ints.
The sliplining required cleaning and televising each line befo.re pipe insertio.n. The exact locatio.n o.f each ho.use
Figure 5. ;.
82
lateral was required and this was do.ne with the televisio.n camera. One serio.us pro.blem was differentiating between active and inactive co.nnectio.ns. This was reso.lved by asking ho.meowners to discharge water to. the sewer during televising. Access shafts were required at manho.les to. allo.W pulling the slipliner through. A ho.le was cut where the o.ld sewer co.nnected to the manho.le. and the slipliner with a pulling head was inserted. A cable was threaded thro.ugh the line to the pulling manho.le and attached to. the pulling head. The exact length and size o.f slipliner was fused together o.n the surface and laid o.ut in the city street. It was then attached to. the pulling head. and pulled thro.ugh the sewer line to. the pulling manho.le. Excavatio.ns had to. be made to. exPo.se each ho.use lateral befo.~ pulling and a ho.le in the o.ld co.ncrete line was cut to. allo.w access to. the slipliner. As soon as the slipliner was pulled, crews immediately began to. cut holes in the liner at each ho.use lateral to make that co.nnectio.n. A fitting was fused to. the liner at each co.nnectio.n and also. fused to. the ho.use lateral pipe to. pro.vide a tight seal. Co.ncrete was poured under each co.nnectio.n and backfill placed. The co.nnectio.n was then sealed at each manho.le. One to. two. blo:cks were pulled at a single o.peratio.n. Preparatio.n time. including fusing liners. excavating access shafts, and exposing ho.use
,
t
I NO"TN
I.EOE"O -+- PG.'l'Cl'Wn.I. &1111\,'''. l~ -+- IJrtI'f1_ NWU ...... "',.... ~ '_OICAnrl ............. .
-_ .... ~~t:.
Nons-fI'OfII""" .,.., .. 10"1 ____ _
=;;=;-.::.~ ,.., .... m ...... ,. ... .. ....", ..... lt1INeT1OIt....,.. . ......o..c. ' .•. 1.' ....... " ...... _ ~ .... CTft: •• ~

laterals would take several days; but. pulling the liner averaged about 2 minutes. While the house connection was being made. sewage was allowed to dissipate in the trench excavation. No bypassing was required.
The cost to clean the lines ranged from 30 to 40 cents per foot. to televise averaged 30 cents per foot, sliplining ranged from $3.25 to $8.85 per foot. access shafts cost $200 apiece. and each service connection cost $300. The polyethylene liner was supplied by Dupont with brand name Aiydl "D" and had a SDR ratio of 32 with a wall thickness ranging from 0.223 toO.418 inches. The material was quite flexible and the fuxed joints were as strong as' the original material.
RESULTS
Even though the project was not completed until November, the results of both the drains and lining were quite dramatic. Discharge of the drain outlet was about 12 efs during the July to September period, and the sampling of the water shows so far that it meets the State's Class "c" standard; thus, indicating that the sewers have been effectively sealed. Flow at the treatment plant did not get higher than 3.6 MGD during the summer months even though the lining job was not completed until fall. This compares with a peak of more than 6.5 MGD for the previous year. (See Figure 6.) The results of lining the areas delineated by the 1/1 study confirm that the method used to determine the areas of high infiltration was accurate. In conclusion, there was not a single complaint of basement flooding in Heber City in 1976. Total cost per foot to do the sliplining, including all items. was $6.70 per foot; and, for installation of the drains. $16.97 per foot. Approximately half of the sewer system was rehabilitated.
0:: W
~ I o~~~~~~OO(t~ ti ci cj ~
~
3: g 0 I 'f-h-,--,--;-+ u..
~ ~ cj
~
Figure 6.
83
When funds become available, the city will probably complete the sewer rehabilitation in the remainder of the system.
NIELSEN. MAXWELL & WANGSGARD
CONSULTING ENGINEERS
HIGHWAY It AIRPORT DESIGN
WATER RESOURCES • IRRIGATION
WATER TREATMENT It DISTRIBUTION
STORMWATER COllECTION It DISPOSAL
WASTEWATER COLLECTION It TREATMENT
ESTABLISHED-1953
SALT LAKE CITY, UTAH
1111/328-0368

Experiences in Wastewater Filtration with the Low
Head Automatic Backwash Filter (ABW)
INTRODUCTION
The Automatic Backwash Filter, as manufactured by Environmental Elements Corporation. a subsidiary of Koppers Company, Inc., was originally invented in the late 1930s by the Hardinge Company of York. Pennsylvania. now a part of Koppers. Since that time much development and continual updating of design has been accomplished, however, the overall concept of continuous or uninterrupted filtering has remained essentially the same and has been used in municipal and industrial water and wastewater treatment facilities for more than thirty years.
This unique filter design has a media bed divided into a number of compartments or cells and an automatic mechanism is used to backwash and clean individual compartments sequentially, while the remaining cells continue to filter the water or wastewater applied (Refer to Figure 1).
Referring to Figure 1, a channel distributes influent along the length of the filter. The influent enters the filter through evenly spaced ports. The filter bed and u~de~,drain are partit~oned. The water is approximately 8 -10. deep. The sand m each compartment is 11" deep, the alummum oxide support plate developed especially for this unit is 1" thick, and the underdrain channel is approximately 8" deep. Water flowing downward through the bed passes into the effluent channel through a port from each underdrain section.
The automatic backwash mechanism, suspended from the motor driven carriage, draws finished water from the effluent channel (via a separate backwash pump) and discharges it into the underdrain of the compartment simultaneously covered by the hood. Another pump withdraws the washwater from under the length of the hood, discharging into a washwater trough for removal. Normally, tbe mechanism moves slowly and continuously along the length of the filter, backwashing each compartment until all have been cleaned and the loss of head across the filter has returned to normal.
Because the entire filter remains in operation. except for the compartment being backwashed, there is plenty of clean water in the effluent channel, eliminating the need for separate wash water storage. Automatic compartmental backwashing requires only about 150 gpm. Rarely does the automatic backwash system use more than 2.0 percent of the total throughput to clean the filter bed. The short
"Ronald F. Culp is with Water/Wastewater Treatment Systems Group, Environmental Elements Corporation, Baltimore. Maryland.
85
cleaning cycle, repeated regularly, keeps the sand in a nea~ly clean condition and limits penetration to the upper 1 to 2 mches. Also, the presence of some material on the bed aids in removing particulate from the flow.
WASTEWATER TREATMENT EXPERIENCES
In 1961, the Los Angeles County Flood Control District ran studies using the ABW Filter and others to determine if wastewater from a secondary treatment plant could be reclaimed suitable for well injection (1). It was of considerable importance to remove the major portion of water-borne solids and precipitate forming constituents which could deposit in soil voids causing a loss of aquifer pern;eability. Tests with the ABW confirmed that the high quality effluent necessary for well injection could be produced.
Later, in 1968, comparative studies were undertaken by the Metropolitan Sanitary District of Greater Chicago at the Hanover Park, Illinois Treatment Facility to determine tertiary filtration efficiencies of the ABW and ~cros~rainers(2). ,!h~ filter produced an effluent superior m quality to the IllinoIS Sanitary Water Board criteria of 5 mg/l suspended solids and 4 mg/l BOD. Percent removal of suspended solids ranged from 76.4 to 77.5 percent. Hydraulic loading was approximately 2 gpm/ft2• Since this study was undertaken, a design for additions to the treatment facility has been completed and construction ?egan,in 1976 for the installation of additional equipment, mcludmg four new filter units.
Mu~h da~a collected by treatment facilities using the ABW filter illustrated suspendfld solids removal at a conventional rate of 2.0 gpm/ft2. Since many of these p!ants are not yet oper~ting at design capacity, or rates hl~her than .2.0 gpm/ft , ?ata on removal of suspended solids at higher hydraulic loadings was not readily obtainable in detail. To demonstrate and test the removal efficiency at higher rates, a pilot ABW unit was constructed and used at several facilities. The pilot plant is an automatic backwash filter having 36 square feet of filter a~a d~yided into e~ghteen separate eells, each measuring 8 x 36 , or apprOXImately two (2) square feet. Silica sand, 11" deep, having an effective size of .599 mm and a unif~rmity coefficient of 1.252 was used as the filtering media. The filter was placed in a trailer equipped with flow met~rs, headloss gages, and miscellaneous laboratory eqUIpment.
A trickling filter plant operating with an average daily flow o~ 45 MGD was chosen as one of the first testing sites. The pilot ABW operated continuously for more than 500

~
ENVIRONMENTAL ELEMENTS CORPORATION
AUTOMATIC BACKWASH FILTER,
A - INFLUENT LINE B - INFLUENT PARTS C - INFLUENT CHANNEL 0- COMPARTMENTED FILTER BED E - SECTIONALIZED UNDER-DRAIN F - EFFLUENT AND BACKWASH PARTS G .. EFFLUENT CHANNEL H .. EFFLUENT DISCHARGE LINE I .. BACKWASH VALVE J .. BACKWASH PUMP ASSEMBL Y K - WASHWATER HOOD L .. WASHWATER PUMP ASSEMBLY M .. WASHWATER DISCHARGE PIPE N .. WASHWATER TROUGH o .. WASHWA TER 01 SCHARGE
Form 7092 9175
P - MECHANISM DRIVE MOTOR Q .. BACKWASH SUPPORT RETAINING RINGS R .. PRESSURE CONTROL RINGS S .. CONTROL INSTRUMENTATION T .. TRAVELING BACKWASH MECHANISM
FIGURE I
ElMAONMENTAL IUMINTS
COAPOAATION Slbsidiary o'Kopper_ ~.Inc.

hours at rates ranging from 106,000 to 250,000 gpd, the source of influent being secondary clarifier overflow. Grab and composite samples were taken throughout the testing period by plant personnel and analyzed for suspended solids concentrations according to Standard Methods(5). Table 1 lists a summary of results at the various hydraulic loadings. Terminal head loss was low, ranging from 5" to 11".
Following this study, the pilot ABW was placed in operation in an activated sludge plant having an average daily flow of 1.5 MGD. The unit operated for more than 137 hours processing approximately 100,000 gpd. As shown in Table 2, influent suspended solids ranged from 32 to 86 mg/I. Percent removal of suspended solids averaged 87.2 percent. Both grab and composite samples were taken in this case also, and suspended solids concentrations were determined by a State approved laboratory according to Standard Methods. Additional effluent samples were taken following backwashing to determine if solids breakthrough occurred.
SUMMARY
This recent testing further illustrated the capability of this unique single media filter design to process influents at higher rates with higher than normal suspended solids, as has been shown with conventional filter units using a dual or multi media(4). Proper design and coordination of components such the backwash pump discharge valve, carriage speed, underdrain, washwater collection, and method of operation contribute significantly to the efficiency of the ABW unit.
Studies are presently underway to determine the effectiveness of using dual media (anthracite coal and silica sand). These studies are planned to determine if filtering efficiency, better than that reported above, will result.
Table 2. Operating Summary· Activated Sludge Wastewater Treatment Plant, December 1976.
OPERATING SUMMARY'
ACTIVATED SLUDGE WASTEWATER TREATMENT PLANT
DECEMBER, 1976
FLOW RATE DATE
(gpm/ft2)
1. 929 12/3
12{6
12/7
TIME
8:00 10:00 12:00
2:00 4:00 (4)
Composite
8:00 10:00 12:00
2:00 4:00 (4)
Composite
8:00 10:00 12:00
2:00 4:00 (4)
Composite
SUSPENDED SOLIDS
INFLUENT (mgfl) ( )
EFFLUENT 1
37.0 3 - 5 41.0 ~ = ~(2) 34.0 36.0 1 - 4 32.0 2 38.0 4
34.0 3 - 4 86.0 3 64.0 4 5 71.0 ~0-_112(3) 66.0 67.0 7
38.0 7 - 7.5 58.0 9 10 43.0 6 - 7 39.0 6 - 6.5 36.0 8 - 10 42.0 7.5
NOTE: Average Terminal Headloss was 511
(1) Two effluent samples were analyzed vs. one influent
(2) Sample taken immediately after backwash (10 min.)
(3) Sample Taken shortly after backwash (20 min.)
% REMOVAL
86.5 . 91.9 90.2 - 95.1 91.2 - 94.1 88.9 - 97.2
93.8 89.4
88.2 - 91.2 96.5
92.2 - 93.8 80.3 - 87.3 81.8 - 84.8
89.5
80.2 - 81.6 82.7 - 84.5 83.7 - 86.0 83.3 - 84.6 72.2 - 77.7
82.1
(4) Composite consisted of samples taken every two hours from 8:00 B.m. to 4:00 p.m.
• The above results are based on 51 data points.
Table 1. Operating Summary· Trickling Filter Wastewater Treatment Plant, November 1976.
INFLUENT EFFLUENT INFLUENT SUSPENDED SOLIDS SUSPENDED SOLIDS AVERAGE TERMINAL
FLOW RATE RANGE RANGE REMOVAL HEADLOSS 2 (gpm/ft ) (mg/l) (mg/l) (%) (inches)
2.049 13-20 1.5-4.8 84.4 5
3.05 15-18.7 2.4-4.3 80.3 6
4.059 16-19.3 2.9-5.0 77.6 8
4.823 17.3-31 3.6-6.5 78.9 11
*The Above results are based on 58 data points
87

The ABW provides a number of advantages other than those already mentioned:
1. Mudballing, a common problem in conventional filters, does not occur.
2.
3.
4.
5.
The bed does not pack, therefore, there is no danger of a packed bed cracking and shortcircuiting or breakthrough occurring. The filter uses a low driving force.
The low operating head permits water to be transferred from the pretreatment section or secondary clarifier with minimum free-fall which avoids floc breakup. This low head also limits the shearing forces to which floc in the bed is subjected. Floc breakup is also avoided since influent pumping is usually not a requirement.
Construction of the filter itself is simple, its profile is low.
Through the use of channels and the automatic travelling bridge mechanism, the pipe gallery has been eliminated.
6. There is no longer a need for an operator to be in attendance to control backwashing.
7. There is no "surge" of washwater from the filter during backwashing. The continuous flow of washwater eliminates the need for storage to prevent upset conditions at the head of the plant or point of discharge.
All of these result in a lower installed cost, minimum connected horsepower, low operating costs, and minimal maintenance. Thus, the ABW Filter provides the cost effectiveness currently desired by regulatory agencies and consulting engineers. The many plants presently in operation give evidence to its world wide acceptance.
NOTE: Reference of specific testing lOcations has been intentionally deleted. Supportive information is available upon written request to the author.
88
REFERENCES 1. Mitchen, John K. Reclamation of Waste Water for Wen
Injeetion. Presented at the National Symposium on sanitary engineering research, development, and design. Pennsylvania State University, July 1965. .
2. Lynam, B., Ettelt, G., and McAloon. T. Tertiary Treatment At Metro Chicago by Means of Rapid Sand Filtration and Micro-Strainers. Journal WPCF, 41, 247 (February, 1969)
3. Zenz,D.R., Lynam B., et aI. Suspended Solids Removal Processes Studied at Metro Chicago. Presented at third U.S./Japan Conference on sewage treatment technology. Tokyo, Japan, February, 1974.
4. Culp. R.L. and Cuip, G.L. Advanced Wastewater Treatment. Van Nostrand-Reinhold Co., New York (1971).
5. Standard Methods for Treatment of Water and Wastewater. 13th edition, 1971, APHA, AWWA, WPCF.
JOHN CAROLLO ENGINEERS
r ~IVERSE CONSULTING SERVICES,\ In
: CIVIL, SANITARY, MECHANICAL, MINING, I ELECTRICAL,ENVIRONMENTAL,and STRUCTURAL)
ENGINEERING . ..
OFFICES: • PHOENIX. ARIZONA • WALNUT CREEK, CALIFORNIA • SANTA ANA, CALIFORNIA
JOINT VENTURE OFFICES: • SALT LAKE CITY, UTAH • LAS VEGAS, NEVADA • RENO,NEVADA

Design Considerations for Filtration of Secondary Effluent .
WilMm R. Kirkpatrick and Nicholas L. Presecan*
In the past few years there has been an increased legislative emphasis on reducing the adverse environmental effects of pollution from urban wastewaters. More stringent standards are being set which reduce not only the allowable mean concentration of pollution constituents but limit the frequency of deviation from the mean allowable discharge concentration. Filtration of secondary effluent provides an excellent method of reducing the variability and concentration of some effluent constituents. More stringent public health aspects of pollution control have resulted in the need to reduce bacterial and virus levels in effluents. Filtration used in proper combination with chemical pretreatment and post filtration disinfection will produce an effluent which significantly reduces bacteria and virus levels in the final effluent. In addition, filtration provides an ideal treatment ahead of more advanced forms of tertiary treatment such as carbon adsorption, electrodialysis, and reverse osmosis by preventing secondary solids carryover which would tend to foul the advanced process operation.
The major applications of secondary effluent filtration are: (1) direct filtration, (2) filtration of chemically pretreated effluents, and (3) filtration of chemically coagulated and clarified effluent. In many cases, direct filtration is all that is required. These are cases for which the effluent is not destined for intimate contact with animal and plant life subject to significant human contact. In addition, operational and testing results indicate that for very low suspended solid and turbidity concentrations, chemical coagulants prior to filtration have little effect. Where, however, this type of contact or potential significant contact produces a reasonable public health concern, regulatory agencies may require additional pretreatment with chemicals.
This paper discusses the various significant design considerations necessary to achieve proper filtration of secondary effluents from the conventional activated sludge process. In the cases discussed, the controlling regulatory agencies have determined that chemicals injected prior to filtration wilJ in fact aid in the production of an effluent low in bacteria and virus levels in addition to reducing suspended solids, BOD, and turbidity. In particular, the paper discusses the design of the Whittier Narrows Water Reclamation Plant effluent filtration facilities, County Sanitation Districts of Los Angeles County, and the Burbank Water Reclamation Plants, City of Burbank, California. Where appropriate, other similar filtration facilities and filtration research are cited.
*William R. Kirkpatrick is Project Manager. and Nicholas L. Presecan is Senior Vice President and Chief Engineer. Engineering· Science. Inc .• Arcadia. California.
89
CASE mSTORIES
The Whittier Narrows effluent filters are open top, dual media gravity filters. There are six common wall basins 16-feet wide by 32-feet long and 27-feet deep (total), constructed of cast-in-place reinforced concrete. The 27-foot depth includes the underdrain plenum, underdrains, media, and head above the media including extra space required to convert the filter to a deep bed carbon filter. The principal components of the completely automated system are the chemical pretreatment system, dual media filters, low headJoss underdrains, air-water backwash system, backwash recovery system, and the filtered effluent chlorination system. The filtered effluent flows into a wet well where it is lifted by several vertical turbine pumps and discharged into the chlorine rapid mixing basin. The chlorinated effluent continues through the chlorine contact tanks, a dechlorination tank, and then is discharged into the groundwater recharge channels of either the Rio Hondo or San Gabriel Rivers. The two river channels are subject to intensive public use for swimming, sun bathing, biking, and horse trails (Reference 1).
The Burbank Water Reclamation Plant effluent filters are enclosed, dual media gravity filters. The three prefabricated steel tanks are 26-feet in diameter and lO-feet deep; each tank has three independe~t equal area filter compartments (cells). The principal components of the automatic filtration system are the pumps, dual media filters, air-water backwash system and the chemical feed system. The filtered effluent passes through a chlorine contact tank and discharges either to the Los Angeles Flood Control Channel or to the Burbank Steam Power Plant for use as makeup cooling water.
DESIGN CONSIDERATIONS
Many factors are involved in proper filtration design. Current published filtration technology is rather thorough in terms of presenting a list of considerations as well as good design "numbers" and "rules of thumb." This paper will not reiterate these items but will present specific significant design considerations used for two aforementioned polJution control facilities to produce the desired effluent. The design considerations discussed include pre-filtration chemical treatment requirements, filter loadings, media selection for "in-depth" filtration, low headloss underdrains, backwash systems, filter galleries with virtually no valves and piping, and the effects of secondary effluent quality on system functions. Additional design parameters include control techniques, hydraulics and post filtration requirements.
Pre-filtration Chemical Treatment
Perhaps the single most important reason for filtering secondary effluent which discharges to receiving water,

subject to reasonably constant human contact, is to significantly aid in the reduction of bacteria and virus concentrations. Investigations performed to date have generally shown that direct filtration without any form of chemical pretreatment results in poor removal of viruses (References 2 & 3). The same investigations show that proper development of chemical floc prior to filtration results in an improved removal efficiency. It would appear that virus removal by sand media, at least, is poor without chemical pretreatment; perhaps this can be attributed to inefficient attachment of these particles to the filter media surfaces.
The purpose of the chemical pretreatment at both the Whittier Narrows and the Burbank effluent filtration facilities is to coagulate the suspended and colloidal solids and flocculate them such that they can be filtered. The chemicals used at the plants are polyelectrolytes at Burbank and polyelectrolytes and alum at Whittier Narrows.
Pilot studies (Reference 4) performed specifically for determining the chemical doses required for proper operation of the Whittier Narrows effluent filters (and others) resulted in doses of 5-7 mg/l alum and 0.01 mg/l anionic polymer. (Cationic polymers were also investigated and found to have comparable results. Availability of the anionic polymer made it the preferred polymer for testing.) Flexibility must be designed into the plant chemical feed systems owing to scale factors, potential shock load situations, and variability of wastewater characterization. This flexibility is not only to allow for wide variability in dosages but to allow for the use of both dry and liquid polymers. Systems with such flexibility are readily able to optimize chemical usage as well as to allow for changes in the type of chemical used should economic or other considerations change during the system design life. The dosage ranges are 2:1 on the alum and a polyelectrolyte range of 50:1. Both the alum and the polymers are mixed at medium mixing intensities (about 7 ft-Ib/sec/cu ft) and injected just prior to the filters. The alum is fed first and allowed approximately five minutes for the formation of the floc; the polymer is injected and mixed with the flocculating wastewater just prior to the filters.
FILTER DESIGN
With adequate land area and site conditions, it is generally felt that the more commonly used gravity downflow filter offers the most cost-effective design. It is energy conservative, flexible, easy to operate and allows a simple, non-complex design in terms of mechanical equipment required. This section will discuss filter flow proportioning and loading, media designs used, low headloss underdrains. and gal1eries with virtually no piping or mechanical equipment required. The media discussion addresses the pilot testing and results which led to the selection of filter media at the Whittier Narrows effluent filters.
Flow ProportioDing aDd Filter LoadiDg
The filters at Whittier Narrows are all equally loaded at an average flow rate of 3.4 gpm/sq. ft. with a peak
90
loading of 5.4 gpm/sq. ft. (The latter loading will occur at peak plant flow with one filter backwashing.) The flow to each of the six filters is the same and is controlled by free-flowing sharp crested weirs .which receive their feedwater from a tranquil influent channel. The operating water surface over the media cannot fall to below the top of the packed media as it is controlled by the backwater from the filtered effluent wet well. The water surface during filtration is maintained within three inches of a preset elevation, twelve feet above the media, by a pneumatically operated modulating butterfly valve which gradually opens as the water surface in the filter tends to rise.
Filter run time is regulated by a timer or a high level override and is further discussed in a later section. Timer control is preferable to assure that the filters do not reach a point when either several or all require backwashing at the same time. For filters set to backwash at a "high head loss" level only, it can be shown that the need for several filters to backwash at the same time will in fact occur if there are any differences in the operating characteristics of the filters at all. This is an extremely important consideration if the desigu relies on flow from other filters for backwash water. (See Backwash Systems for detailed discussion.)
Media Design
Filtering secondary effluents is decidedly different from filtering potable water supplies. In water filtration plants, the floc to be filtered is a chemical precipitate and has a relatively weak structure; hence, it is desirable to use a fine media, thus "straining" the solids from the flow. This results in rapidly increasing headlosses and a diminished allowable loading on the filter. On the other hand, biological floc in a wastewater effluent is stronger and can be driven into a filter media with larger voids thus increasing the length of the filter runs without increasing headlosses beyond a reasonable limit or reaching breakthrough. Dual media filter designs exhibit these characteristics and allow for greater solids loadings, and hence, longer and more economical filter runs. The nomenclature given this type of filtration is "In-Depth" filtration; the filtration occurs throughout most of the depth of the media rather than merely straining at the filter surface.
Pilot studies were performed on four dual media designs for the Whittier Narrows Plant. (Reference 4.) Tests were performed on secondary effluent from the plant itself. With the exception of one, each of the media was a design with full scale operating experience. Five separate runs were made over a several month period and each of . the pilot filter runs was operated over a 14 to 22 hour period. The primary criteria for filter evaluation was effluent turbidity and headloss. All of the designs produced comparable turbidities, yielding reductions of 65 to 90 percent with composite influent turbidities ranging from 1.2 to 6.5 FTU. It should be noted that the filtered effluent turbidities remained consistently between 1.0 and 2.0 almost without regard to fluctuations in influent turbidity. The times the filter effluent turbidities substantially deviated from the above values (before "breakthrough") were during periods of extremely high values of turbidity and suspended solids in the secondary effluent. In the

headloss category, two of the four media designs exhibited very similar performance and both were five to ten-fold superior when compared to the other two designs. It is interesting to note, however, that when the same pilot testing program was performed at another secondary wastewater treatment plant, one of the filter media designs that performed poorly at both Whittier Narrows and a third treatment plant. showed itself superior to the two media designs that showed best performance at the latter two plants. Thus, suffice it to say that pilot testing for each wastewater is of extreme value to the designing engineer and should be performed if at all possible before finalizing the filtration system characteristics.
Low Beadloss UnderdraJns
Headloss in underdrain systems is only of importance during the backwash as most. if not all, underdrains impose insignificant head loss at standard filtration surface loading rates.
Conventionally, underdrains are designed to impose a controlling loss of head at the interface between the filter media and the underdrainage system. Recent experience (Reference 5) has shown that with proper underdrains design this "imposed" head loss is not required. Such "low headloss" designs are being used in many successful filtration operations and such a design is used at the Whittier Narrows plant.
The design used is a 12-inch wide V-shaped precast reinforced concrete underdrain. Small 1/2-inch flow orifices are located in the underdrain walls. At a backwash rate of 20 gpm/ft2 the head loss through the underdrains is one foot as compared to a conventional underdrain with loss in excess of three to four feet. This design not only provides a cost effective support for the gravel and media, but assures uniform distribution of backwash water and backwash air. During the backwash cycle. air is introduced by PVC laterals from a central air header; located in the underdrain plenum; the laterals are located under alternate V-blocks. When the combination air-water backwash is operating. the water and air are able to continuously and uniformly discharge from the orifices and thoroughly mix before arriving at the media-support gravel interface.
Installation of the precast V-block underdrains is simple. A sling may be used to place the blocks in position on their support beams. To insure proper fit. a gap of I-inch is designed into the spacing. the gap is grouted to within 1!4-inch ofthe orifice invert. To date, the performance of the V -block underdrains in the water treatment plants such as the 150 MGD Robert A. Skinner Filtration Plant is entirely satisfactory. Another similar design. the M-block underdrain used at the Reynosa. Mexico Water Treatment Plant, performs in the same manner as the V -block and its performance is also satisfactory (Reference 6).
Baekwuh Systems
Given the selection of "In-Depth" filtration as perhaps the most effective form of filtering a biologically treated effluent, special consideration should be given to the backwash system as the imbedded particulate matter must
91
be thoroughly and efficiently removed. In addition, if future conversion to activated carbon media is considered, as it is at the Whittier Narrows facilities, deep penetrating particulate matter or biological growths will require that the backwash and scour systems be capable of being effective throughout the entire filter bed.
The backwash concept consists of water moving counter to the flow direction during filtration to pick up the imbedded solids and "lift" them to the wastewater trough. To effectively accomplish this, two primary conditions are required. First, the filter media must be fluidized or expanded to allow the particulate matter to escape. Fluidizing the bed will allow perched solids to rise up with the upflow current and out of the filter via the washwater troughs. However, to free the media from attached and adsorbed solids, a scouring system must be introduced with enough energy to cause the media to collide and scour and shake the particulate matter loose while not injuring the media. Merely fluidizing the media does very little if any scrubbing as in general, collisions between grains in a fluidized bed are nearly non-existent (Reference 7).
For single media sand filters. where foreign particulates are removed in the upper few inches of the media, various types of surface agitation systems efficiently provide the desired scrubbing action. With "In-Depth" filtration. where virtually the entire depth of the upper anthracite layer and the upper few inches of the sand layer are used to remove and hold the solids, effective scrubbing of the media deep in the bed cannot be attained solely with a surface wash system. A subsurface system to create sufficient and uniform turbulence is required.
To provide proper agitation, two primary methods can be used: (1) the introduction of air into the bottom of the filter (air-water backwash) or, (2) by high pressure water scrubbers. Both of these systems are presently in use and each represents advantages in certain applications. The following discussion compares the two systems (Reference 8):
(1) For filtering systems utilizing the "In-Depth" concept, the filter media must be scrubbed throughout its entire depth during backwash to remove solids, slimes, and potential for mud ball formation.
(2) To get adequate total bed cleansing with a water scrubbing system, rotary arms or fixed nozzles should be installed at several levels throughout the depth of the expanded bed.
(3) At Whittier Narrows, the three foot deep dual media filter bed eventually may be replaced by activated carbon, the carbon depth is proposed to be six feet deep. Because of this depth a three foot gravel spacer is required to raise the initial dual media filter to a level for efficient removal of rising particulate during fluidization. With this gravel support bed for the inert filter media and without an air backwash. there might be a tendency for anaerobic conditions and slime growths to develop in the lower portions of the media unless the operation includes a continuous application of chlorine to the filter. With the uniformly applied air-water backwash this would be eliminated. With future conversion to a six-foot deep

activated carbon bed, there will be increased need for in-depth cleansing of the bed. Only air scour can effectively and uniformly clean the deeper portions of the carbon bed.
(4) With an air scour system, there is no requirement to remove piping and fixtures to a fixed subsurface mechanical scour when replacement of the dual media is contemplated.
(5) The attrition loss of activated carbon due to - abrasion is expected to be the same with either the use of
an air-water backwash or the subsurface water scrubbers. The amount of abrasion anticipated is expected to be generally proportional to the energy used to scrub the bed, regardless of whether the energy is created from air or high pressure water.
(6) With air-water backwash, the energy input to the filter bed is essentially uniform over the entire bed and moves in the direction which supports the transport of solids, whereas, with a water scrubbing system, the energy is highest near the nozzles and decreases as the distance from the nozzles increases. Thus, with a given level of scrubbing energy input to the filter during backwash, there may be a tendency for more abrasion between carbon particles near the nozzles in a water scrubbing system. In addition, the nozzle energy is generally dissipated transverse to the flow and thus primarily mixes without aiding the desired upward materials transport.
In view of the greater problems associated with wastewater filtering, the need for very efficient cleaning of the filters, the potential for future conversion to deep bed activated carbon, and the uniform control and scour intensity of air backwash systems, and the prevention of anaerobic conditions developing in the filter bed due to the inherent biological activity level in secondary effluent, air-backwash system seems to offer the best system in terms of assuring efficient media cleaning. Both Whittier Narrows and the Burbank effluent filters use the air-water backwash system.
Operationally, Burbank and Whittier Narrows differ slightly. Burbank scours with air alone and then follows with the water wash to fluidize the bed and remove the loosened particulate. Degremont (Reference 9) recommends using an air scour with a minimal non-fluidizing backwash flow. Apparently, some concern exists regarding the downward movement of mud balls and other solids in deep bed filters. Air scour alone may create some downward movement which may result in lodging impurities low in the deep bed filters and they might not be removed during fluidization.
At Whittier Narrows, the backwash cycle begins by closing the influent valve. and draining the filter to within a foot or two of the top of the media. The water wash control valves then slowly modulate from the closed position and accelerate the-backwash flow-rate to about 4 gpm/sq. ft. at which time the air scour will start. The air scour will operate for a preset time ranging from two to five minutes. Concern is expressed in the literature regarding the loss of filter media during backwash in dual media filters if air and water are used simultaneously; at
92
Whittier Narrows the simultaneous air and low flow water backwash will occur with the water surface below the washwater troughs and thus no media can be lost. When air scour is terminated, the backwash rate will accelerate to between 15 and 20 gpm/sq. ft. to remove the loosened particulate from the fluidized bed. After sufficient backwash, the backwash flow is linearly reduced to 4 gpm/sq. ft. over a preset adjustable time period to allow proper restratification of the anthracite and sand media. At the 4 gpm/sq. ft. flow rate the valve is rapidly shutoff.
Backwash water, laden with solids removed from the filters, can be disposed of and treated in several ways. In wastewater treatment, the flow is usually returned to a point in the treatment train. At Burbank, the spent backwash water is returned to the primary clarifiers. At Whittier Narrows, the spent backwash water discharges to a holding tank and from the holding tank it is pumped at a uniform rate of about 900 gpd/sq. ft. to a clarifier. The solids settle and the clarified effluent discharges prior to the chemical pretreatment basin and undergoes filtration once again. The backwash sludge at Whittier Narrows is collected by chain and flight collectors and then discharged to a large trunk sewer for transportation and treatment by a downstream treatment plant, as the Whittier Narrows plant has no final solids treatment and disposal facilities.
NEW DEVELOPMENTS
Complex pipe galleys seem to be automatically associated with filtration facilities, however, such an extravagant design is not required. Lee Streicher1 an accomplished and innovative engineer in the area of filtration and water quality, developed a filter design which:
(a) eliminates the need for a filter pipe gallery and its associated piping, valves, and controllers;
(b) eliminates the possibility of negative head developing in the filter which causes airbinding and high velocity channeling resulting in a decrease in effluent quality;
(c) requires only two flap gates for operation of each unit; and
(d) eliminates the need for a washwater storage tank if the plant flow is sufficient to maintain the backwash flow rate of a single unit.
The Streicher concept (See Figure 1) currently being used in the design of a water treatment plant for the City of Oceanside, California (Reference 10). The filters are constant rate type with the feed-rate controlled by influent weirs with an automatic flap gate cover which closes to isolate the filter during backwash. The filtered water flows through the low velocity underdrain plenum and into the filtered effluent conduit. The level in this conduit is controlled by a sharp-crested weir which fixes the minimum water level that can occur within the filter. The
lLee Streicher: Chief Water Treatment Engineer. EngineeringScience, Inc.; formerly with Metropolitan Water District of Southern California (36 years).

flAP GATE FILTER INflUENT CONDUIT
LONGITUDINAL SECTION THROUGH STREICHER CONSTANT RATE FILTER
- WEIR - SlOT
DRAIN GATE
I I
MAXIMUM OPERATING W.S.
MINIMUM OPERATING W.S.
WASH TROUGH
FIGURE 1
WEIR ------F I L TER EFflUENT CONDUIT
COAL SAND BACKWASH
WATER CONDUIT ........... --lL-l~..L..¥-'<-...l"-"'-.......... -1<-.......... -"'---"'--"-"-"---"-¥'--'I'lN- GRAY EL
UNDERDRAIN SUPPORT
SECTION THROUGH PRECAST CONCRETE UNDERDRAINS
93

overflow elevation is adjustable and set above the top of the media.
The backwash water is fed into the low velocity underdrain plenum from the filtered effluent channel. The backwash energy grade line is developed by virtue of the elevation difference between water surface and the fIltered effluent channel and water surface in the fIlter while backwash water is entering the washwater troughs.
Experience at the Robert A. Skinner Water Filtration Plant in Los Angeles County (where the Streicher concept is being successfully used) shows that between 20 and 38 inches of head differential is required to achiev(l' adequate backwash rates with complete media fluidization. Backwash water is supplied directly from the "on-line" fIlters; hence. no backwash water storage tank is required. (This, however, requires that the plant be large enough to produce enough fIltered water to meet the backwash flow rate requirements, i.e. four to five fIlters minimum in addition to the backwashing fIlter.)
Upon thorough backwashing, the effluent flap gates close and the backwash flow gradually and smoothly diminishes, owing to the decreasing head differential, allowing the fIlter media to restratily and settle uniformly. At a preset fIlter water level the influent flap gate is opened and the fIlter returns to service. With this operation, the fIlter gradually accelerates to the design surface loading rate; this minimizes the initial filter loading shock and eliminates the need for a fIlter-to-waste period.
For the Oceanside, California, plant presently under design, it was found that there was a twenty percent savings in capital cost by using the Streicher filter concept when compared to a conventional "pipes and valves" type filter design. This does not recognize the additional cost savings in operations.
POST FILTRATION DISINFECTION
It is felt that a discussion considering effluent fIltration and its effect on virus and bacteria removal must deal with the post fIltration advantages obtained in the disinfection process. Here, the discussion is limited to disinfection by chlorination. Filtration prior to chlorination aids the disinfection operation in that it removes particulate matter which not only exerts a chlorine demand but harbors and protects bacteria and virus from the chlorine.
Perhaps the single most important operation in the entire treatment train for reducing bacteria and virus levels is effluent disinfection. Key factors in design of these facilities are simple and should produce good results if properly adhered to. The following design considerations are those used at the Whittier Narrows plant and are the result of an extensive design research and preparation for final design of the disinfection facilities.
In short, the chlorine should be injected and mixed with the filtered effluent as rapidly as possible and with considerable turbulence or mixing intensity (about 25 ft-Ib/sec/cu ft) and long detention times. Recent literature suggests that contact times should be on the order of one and one-half hours at peak flow and the system should
provide a plug flow reactor condition. This is achieved at Whittier Narrows by a five-pass contact tank with an overall length to width ratio of 74:1; the minimum recommended is 40:1 (Reference 11).
At the end of the chlorine contact tank is a sulfur dioxide dechlorination system consisting of a vertical baffle five-pass system. The sulfur dioxide contact basin should be covered to inhibit the growth of algae. .
SUMMARY
There are several ways of improving fIltration design to assure a cost-effective design and operation with minimal energy costs. Each of the design considerations discussed herein were applied to the design of filtration facilities which were being added to existing secondary treatment plants. The design criteria were obtained from actual operating experience or pilot testing.
. It should be emphasized that pilot seale operations are warranted almost without exception. Areas of particular importance are media selection and operational control. Where it is unfeasible to pilot a particular unit operation. flexibility must be designed into the full scale plant. In effluent fIlter designs. the most important areas requiring flexibility are in the chemical feed systems and the media baekwashing system. Each of these are very important to the success of the filter and the poor performance of one operation will negate the benefits of the other.
94
At this writing full seale plant operational data is limited on the effluent filters presently in operation. The complete pilot study results (Reference 2) will be published by April, 1977. Some preliminary results can be summarized as follows:
(1) Suspended solids removal through the filter ranges from 80 to 90 percent. For the most part in the activated sludge plant effluents considered suspended solids concentrations in the secondary effluents range from 5 mg/l to 15 mg/l. Filtered effluents suspended solids ranged from 2 to 3 mg/l. In addition, mild secondary upsets were not reflected to any large degree in the filter effluents. For example, secondary effluent SS concentrations of 30-50 mg/l were consistently reduced to less than 5 to 10 mg/l for the wastewaters tested.
(2) Turbidity removals are on the order of 65 to 90 percent. Strong correlations between secondary effluent turbidity and SS were observed. Filtered effluent turbidities ranged between 1 and 2 FTU with frequent ranging to 6 FTU.
(8) COD removals were on the order of 40 percent. All of the pilot testing work was performed on the basis of COD. The results of actual operation at the Burbank effluent fIlters show little effect of the filters on BOD5 removal. The secondary effluent BOD5 at Burbank is. however, very low ranging around 5 to 10 mg/l. In these ranges, most of the BOD5 is soluble and thus little effect is exerted by the fIlters.
(4) Both extensive pilot testing and full seale fIlter operation show that the SS, turbidity. and BOD5 removal efficiencies are directly proportional to the secondary

effiuent concentrations. Additionally, with relatively consistent secondary activated sludge process results (Le. mild to medium extremes in effiuent concentration of the above constituents) the filtered effiuent will negate the affect of these upsets thus eliminating the extreme final effiuent values.
(5) Post filtration treatment with chlorination at long detention times in plug flow systems with good initial mixing is the single most important process in bacteria and virus removal. The success of this disinfection operation is dependent upon receiving a secondary effiuent low in suspended solids which effiuent filtration can provide. Pilot test findings (Reference 2) show that in a chemically treated, filtered secondary effiuent, considerably more than 50 percent of the virus removal is accomplished by the chlorination facilities. These tests were performed in plug flow reactors, with chlorine doses of 10 mg/l, and detention time in excess of 2-1/2 hours.
REFERENCES
1. County Sanitation Distriets of Los Angeles County, "Project Report-Effluent Filters for Upstream Treatment Plants," April 1975.
2. Carlson, A.J.; Ridenour, G.M.; and McKhann, C.F.; "Efficiency of Standard Purification Methods in Removing Poliomyelitis Virus from Water," American Journal of Public Health. 82:1266, 1942.
8. Kempf, J.E.; Wilson, M.G.; Pierce, M.E.; and Soule, M.H.; "Effect of Aluminum Hydroxide Sedimentation, Sand Filtration. and Chlorination of Poliomyelitis, American Journal of Public Health. 82:1366, 1942.
4. County Sanitation Distriets of Los Angeles County; Chen, Ching· Lin, Ph.D.; and Leon S. Direeto, Ph.D.; Pilot Filtrations Studies for Filtration of Effluent, unpublished, 1975-1976.
5. Streicher, Lee and Metropolitan Water District of Southern California, "Treatment-Plant Design," Journal A WW A, Vol. 66, No. 11, November 1974.
6. Jung H. and Savage ES, "Deep-Bed Filtration," Journal AWWA, Vol. 66, No.2, February 1974.
7. Cleasby, John C., University of London. "Research Achievements-Existing and Expected," Journal AWWA. June 1976.
95
8_ Engineering-Science, Inc., "Basis of Design Report-Whittier Narrows Effluent Filters," for County Sanitation Districts of Los Angeles County, July 1975.
9. Degremont. Water Treatment Handbook, Distributed in U.S. and Canada by Taylor and Carlisle, NY. New York. 1973.
10. Engineering-Science. ~c •• Water Treatment Plant Design and Reservoir-Dam Study. Oeeanside. California. Study in Pr0-gress, est. completion April, 1978.
11. White, George C •• Handbook of Chlorination, Van Nostrand Reinhold Co .• New York, 1972.
I ES IENGINEERING-SCIENCE
150 North Santa Anita Avenue Arcadia, California 91006
• Wastewater Collection, Treatment and Disposal
• Water Reclamation and Reuse
• Water Supply, Treatmentand Distribution
• Industrial Wastewater Treatment
• Water Resources Planning and Development
• Solid Waste Management
• Air Pollution Control
• Environmental Impact Analysis
Atlanta • Arcadia • Austin • Berkeley Chicago .• Cleveland • Houston • McLean
San Diego • Washington, D.C.

· Why Settle for Only Secondary Treatment? .
William L. Berk*
With the continued demand for more rigid effluent requirements, it becomes necessary to investigate different approaches to meet these requirements. The Oxidation Ditch is one approach that should be investigated because of its effective performance capabilities, the simplicity of operation and also its cost effectiveness.
Region vn of the United States Environmental Protection Agency made a multiyear study of 225 operating secondary treatment plants (1) in their region using analytical results from multi-day. 24 hour influent and effluent composite samples. Of all the various processes studied. only the group of Oxidation Ditch plants averaged secondary treatment or better. This study included a rigorous 30 plant special winter operation study to further confirm their original findings.
The Oxidation Ditch process is a modified form of the activated sludge process. and may be classified in the complete mix, long term aeration group. The process is a fresh. unique and economical approach for the treatment of municipal and most industrial wastes. The Oxidation Ditch provides effective secondary treatment with BOD5 and suspended solids reductions of 90 to 98 percent. In addition to this excellent secondary treatment, additional purification of the contaminated flow is also occurring. Nitrification of ammonia and organic nitrogen is virtually complete under normal operation. Phosphorus removal can be achieved with standard Oxidation Ditch plant design
·William L. Berk is with Lakeside Equipment Corporation. Bartlett. lllinois.
TO WASTE
INFLUENT
BAR SCREEN
simply by the addition of chemicals upstream of the rotor. A full seale Oxidation Ditch plant study at Port Elgin. Ontario (2) showed 75 percent total phosphorus removal was achieved 80 percent of the time. Some denitrification is also present and with controlled and close operator control. substantial nitrogen removal is possible. The federal EPA demonstration grant for the Oxidation Ditch at Dawson. Minnesota (3) produced 51 percent nitrogen removal and it was felt with better operational control. this could have been increased to 80 percent.
The Institute of Public Health Engineering. TNO, Holland (4) in an effort to develop a highly efficient and cost effective treatment process, developed the Oxidation Ditch plant. The first full scale plant was installed at Voorschoten, Holland in 1954 (5). In 1963, the first Oxidation Ditch in the United States was installed at the Tektronix plant compound, Beaverton, Oregon. At present, there are well over 700 installations of this process in the United States and Canada.
PROCESSFLOWSBEET
There is normally no primary settling tank used in the Oxidation Ditch process, see Figure L Raw sewage passes directly through a bar screen to the ditch. The bar screen is necessary for the protection of mechanical equipment such as the rotors and return sludge pumps.
The Oxidation Ditch forms the aeration basin and here the raw sewage is mixed with the active microorganisms. The rotor is the aeration device that entrains the necessary
SETTLED SLUDGE
RETURN SLUDGE PUf.1P
EFFLUENT
OXIDATION DITCH FINAL
SETTLING TANK
Figure 1. Oxidation Ditch Plant, line dialfl'dm.
97

oxygen into the liquid for microbial life and keeps the contents of the ditch mixed and moving to insure ready contact of all microorganisms with the incoming sewage or food supply. Velocity of the liquid in the ditch must be sufficient to prevent settling of solids. The ends of the ditch must be well rounded or baffled to prevent eddying or dead areas. The mixture of treated sewage and microorganisms, called mixed liquor, formed in the ditch, flows to the final clarifier for separation. Quiescent conditions in the clarifier afford separation of the solids, formed in the ditch, from the liquid. The clarified liquid passes over the effluent weir and may be discharged to the receiving stream or sent for further treatment such as disinfection, tertiary filtration, or post aeration.
The settled sludge is removed from the bottom of the clarifier by an air lift or pump and is returned to the ditch. All sludge formed by the process and settled in the clarifier is returned to the ditch. Scum which floats to the surface, in the race of the clarifier, is removed and also returned to the Oxidation Ditch.
The Oxidation Ditch is operated as a closed system and the net growth of volatile suspended solids will increase until it will be neCessary to periodically remove some sludge from the process. Excess sludge formed by the process is stable and requires no further treatment. This excess. odor-free sludge may be applied direct to drying beds, sludge lagoons, hauled away for land disposal or further processed by mechanical dewatering equipment.
PROCESS CHARACTERISTICS
The Oxidation Ditch process, with its long term aeration basin. is designed to carry mixed liquor suspended solids concentrations of 3,000 to 8,000 mg/l. This provides a large active microbial mass within the system. Food to mircoorganism ratio is low, ranging from 0.03 to 0.1 lbs of BOD per day per pound of volatile suspended solids. This low food to microorganism ratio produces a system that can absorb shock loadings without upsetting the total operation. By carrying concentrations of this magnitude, the Oxidation Ditch can provide continual BOD and suspended solids removal of 90 to 9B percent. Virtually complete nitrification of ammonia and organic nitrogen is just an added bonus to this effective secondary treatment operation. The operation of the plant is relatively simple. It does not require continual manipulation to produce high quality effluents. The oxygenation capacity of the rotor is readily adjustable by manipulation of thp. adjustable weir installed at the ditch effluent· which controls the liquid level and rotor immersion. Control of the rate of sludge return is possible by adjustment of a telescoping sludge valve or adjustment in the speed of the recirculation pump. There are no odor problems and there is no foam problem once the concentration of mixed liquor suspended solids reaches the minimum recommended operating level. When excess sludge accumulates in the process, it may be wasted directly for drying or disposal without additional treatment. As recorded in the Region vn report, (1) the Oxidation Ditch plants were least affected by the caliber of operator competency.
There are few components to the Oxidation Ditch plant and therefore it makes the operator's task much
98
more simple. The rotor sits completely above the ditch level with the exception of the tip of the blades immersed in the liquid. The equipment is readily accessible for necessary greasing of bearings which is required weekly and the changing of oil in the reducer required on a semi-annual basis. Similar maintenance is also required on the drives for the final tank and the return sludge pumping equipment. There is no primary tank to maintain, aerobic or anaerobic sludge digestion equipment to service and maintain, or diffusers or spargers that must be pulled from the liquid and cleaned on a regular basis.
Another very important characteristic of the Oxidation Ditch plant is the economic operation and the economic first cost. Rotor Aerators are highly efficient mechanical surface aerators with a very large flexibility in actual operation. Minor adjustments in rotor immersion provide considerable variation in oxygen input with almost no change in the rotor's pumping capabilities. The actual power draw by the rotor is dependent upon the operating immersion of the rotor and not the nameplate rating of the drive assembly. The cost effectiveness of the Oxidation Ditch plant over other treatment processes is because of the earthen lined ditch or channel that is used for the aeration basin instead of a reinforced concrete structure. This economical first cost is one of the major reasons for the rapid growth in the employment of an Oxidation Ditch for waste treatment.
APPLICATION
The Oxidation Ditch may be used for treatment of any waste that is amenable to aerobic degredation. The basic design criteria recorded herein will be directed toward normal domestic waste. Modification of this criteria is required when handling various types of industrial wastes. The plant is normally sized based on the average daily design flow and the average BOD5 waste strength. With normal operation, basic design will produce BOD and suspended solids removals of 90 to 98 percent and will provide complete nitrification.
The process is based on the theoretical destruction of all organic matter applied using an extended aeration period. Untreated wastewater containing organic matter that is amendable to biological degradation is attacked by the bacteria previously formed in the system. The food to microorganism ratio is low and will range from 0.03 to 0.1 lbs of BOD per day per pound of volatile suspended solids.
Most plants are proceeded by only a hand rake bar screen. The bar screen should have a clear opening of 1" and a drain rack must be provided at the top of the screen. Comminutors or mechanical bar screens can be provided. Normally the flow passes directly from the bar screen to the aeration chamber. Plants that will be handling wastes from combined sewers or wastes which contain large quantities of grit should be preceded by some type of grit chamber. No primary tank need be employed.
OXIDATION DITCH
The Oxidation Ditch forms the reactor or aeration tank. The initial ditch plants were generally an elongated oval, with sloping side walls and center island. This elongated oval may be straight, bent at one end, bent at

both ends or circular. The prime criteria is that it does form a complete circuit. It's also possible to employ an elongated channel, either with sloping or vertical side walls, a center dividing wall and now guide baffles at either end. The liquid depth employed in the ditch can vary between 3' and 5'-6" when you employ a Cage Rotor or a Mini-Magna Rotor and these liquid depths can be increased to 10' to 14' when the Magna Rotor is employed. When the Magna Rotor is used in liquid depths greater than 7', a horizontal baffle downstream of the rotor is required.
For domestic sewage, the volume of the ditch is sized based on a loading of 13.5 lbs of BOD per thousand cubic feet. The ditch volume for weak wastes may be as low as 8 lbs of BOD per thousand cubic feet and for the stronger wastes, the design loading may be increased to 15 lbs of BOD per thousand cubic feet. Regardless of the loading, the minimum detention time in the ditch should not be less than 18 hours. Loadings of up to 40 lbs of BOD per thousand cubic feet of ditch volume have been employed for strong industrial wastes. The actual loadings used for an industrial waste, dependent upon the strength of the waste, type of waste and the waste's amenability to aerobic degradation.
Normally the Oxidation Ditch has sloping side walls. The compacted earthen ditch is preferably lined with 4" to 6" of poured concrete or shot-crete. A variety of other construction materials such as asphalt, wood, preformed materials and clay have been used. The rotor moves the liquid in a horizontal plane and it is preferred to have the rotor sitting upstream of a straight section of a least 40' in length. Where center islands are used, they should be wide enough to provide a smooth now around the bend. The width of the island should vary depending upon the width of the ditch at the liquid level. Figures normally used should be a 12' center island for ditch widths up to 13', 16' for ditch widths from 13' to 24' and larger islands where the ditch width is 25' greater.
Ditches with vertical side walls can be used and these can be furnished with a center island or a center dividing waD. Where a center dividing wall is used, additional consideration has to be given to now guide baffles at either end of the ditch. These flow guide baffles should be off center in the direction of now. Another method would be to form a bulb type of return bend at either end of the ditch.
The Oxidation Ditch aeration channel produces the most effective, controlled, complete mix aeration basin at present available. This controlled mixing basin insures the most efficient use of oxygen and aeration volume. The rotor accelerates the liquid until the entire ditch basin is moving at a near constant velocity around the ditch. The raw waste and return sludge, added just upstream of the rotor, are thoroughly mixed and distributed across the cross section at the rotor. There is a continuous addition of raw flow or new food supply to the mixed liquor concentration as it passes the rotor. There is no short circuiting around the rotor which provides the most effective utilization of rotor oxygenation.
ROTORS
Rotors are mechanical surface aerators which rotate in a plane horizontal with the liquid surface and are placed
99
perpendicular across the aeration channel. Operation of the rotor carries out a twofold function of supplying the necessary propulsion and complete mixing of the ditch contents and inducing the necessary oxygen to support biological activity.
The length of rotor used for a given project should be the maximum length computed by either the velocity criteria or the required oxygenation capacity. In selecting the length of rotor, first calculate the length of rotor required to satisfy the velocity criteria. The ditch velocity is based on the propulsion capability of the rotor and the frictional resistance of the wetted perimeter of the ditch. Sufficient propulsion must be provided to produce a minimum velocity of approximately l' per second so that all solids are maintained in suspension.
Lakeside manufactures three different rotors. Cage Rotors are 27·1/2" in diameter and are manufactured in l' intervals from 3' through 12' in a single length. Mini-Magna Rotors are 28" in diameter and are available in I' increments from 10' through 16' in a single length. Operation of these rotors is from 60 to 90 rpm and from 3" to 10" immersion.
To meet the needs of larger plant designs and also to provide greater 02 input per foot of rotor for strong industrial wastes, the Magna Rotor was developed. Magna Rotors are 42" in diameter and are manufactured in l' increments from 6' through 30' in a single length. Operation of the Magna Rotor is from 50 to 72 rpm and from 4" to 15" immersion.
A rotor assembly can have mUltiple rotor lengths, hut these must be supported by intermediate bearings. All rotor lengths should be constructed with bearings supporting both ends of each rotor length. Rotors may be mounted directly on concrete pads, on vertical piers. side waD mounted, suspended from an overhead support structure or mounted on noats. Side wall mounted rotor assemblies are preferred in that this mounting provides a clean and dry area, easily accessible for lubrication, maintenance and repair, if needed, of the drive assembly and outboard bearing. Reduced ditch cross sections at rotor mounts should not be used. This reduced cross sectional area produces increased velocities in the contriction at the rotor and reduces oxygenation capcity of the rotor.
Ditch velocity criteria is based on actual experience accumulated from operating plants. For plant designs with population equivalents less than 600 persons, using the Cage or Mini-Magna Rotor with a lined ditch, the ditch volume should not exceed 13,000 gallons per foot of rotor. For plant designs with population equivalents above 600 persons, using a Cage or Mini-Magna Rotor, with a lined ditch, the ditch volume should not exceed 16,000 gallons per foot of rotor. Where the Magna Rotor is used with a lined ditch, the ditch volume should not exceed 21,000 gallons per foot of rotor. In the few cases where unlined ditches are used, the above figures should be reduced.
OXYGENATION
To suitably apply mechanical surface aerators to various aeration processes and various wastes, it is

essential that the oxygenation capacity and power requirements are known. It is impractical to test an aerator in each used water application, and it is therefore necessary to adapt some sort of standard for testing. With suitable formulation it is then possible to properly size the aeration units for a given project. The standard technique is to evaluate the aerator in a properly sized tank of de-oxygenated tap water and determine the rate of reoxygenation of this water by the aerator. Test results are then converted to standard conditions of 2()OC., 76 mm mercury pressure and 0 dissolved oxygen. Net power requirements are also recorded during each run.
Several series of tests were conducted under the direction of Dr. E.R. Baumann of Iowa State University, Ames. Iowa. The testing of the Cage Rotor was done at Iowa State University and the procedure adopted duly recorded (6). The work on the Magna Rotor, under the direction of Dr. E.R. Baumann, was done in a full scale Oxidation Ditch plant at Somonauk, Illinois. The end product of this work was the development of the family of Magna Rotor curves for oxygenation, recorded in Figure 2. and power requirements, recorded in Figure 3, at various rpm's and immersions. The curves give the Magna Rotor oxygenation and power requirements in tap water under standard conditions. A rather formidable looking equation. Figure 4, has been developed to convert oxygen input
under standard conditions to oxygen input required for various forms of activated sludge and different wastes that are amenable to aerobic degradation.
Suitable figures have been developed for the alpha and beta factors for domestic waste and these can be substituted into equation 2. By solving equation 2 for No in terms of N, you arrive at what ean be called a conversion factor. The normal conversion factor, for domestie waste, for Oxidation Ditch application is 2.35. Adjustments of this conversion factor must be considered for industrial wastes. A correction must also be taken into account for water pollution control facilities that are located at elevations greater than 2000 feet. As an example, the corrected conversion factor for a plant site at 4500' elevation would be 2.92 in lieu of the 2.35. Correction for elevation is aecomplished by utilization of equation 1.
With the conversion factor, the BOD can be converted to pounds of oxygen required at standard conditions. This is then divided by the total length of rotor arrived at by the velocity criteria to come up with the pounds of 02 required per hour per foot of rotor. Under normal conditions we would enter the oxygenation curve at 72 rpm and determine the proper immersion required to give us the necessary oxygenation. The flexibility of the oxygenation capacity of the Magna Rotor is noted from reviewing
F'igKre 8.
100

~~~~ion f~~~evatio!l ,
(1)
Where:
Csw saturation value of oxygen in waste at operating temperature and plant elevation.
Cs Sa'turation value of oxygen in waste at operating temperature.
Ap Atmospheric pressure at plant elevation.
Ao Atmospheric pressure at sea level.
Oxygenation Capacity
l.SxN
! (2)
Where:
lbs. 0;2/day tnmsfe,,::red to water at zero D.O. and 200 C. ' _
oC Oxygen transfer ratio.
~ Ratio saturation of waste to saturation of water.
Cst Saturation value of oxygen used in test operation.
CL Operation D.O. level.
T Temperature of waste degrees Centigrade.
1.5 Conversion from 5 day BOD to ultimate BOD.
N lbs. of 02/day transferred to the waste mixture.
Figure ~.
Figure 2. At 72 rpm and 15" immersion, we have an 02 input of 6.60 lbs of 02 per foot of rotor _ and at 5" immersion. the unit is capable of 2.05 Ibs of 02 per hour per foot of rotor. This gives an increase in 02 input of 3.22 times merely by operating the rotors. through its full range of immersions. It should also be noted that additional variation in 02 input is also possible by regulating the speed of the rotor. At 50 rpm and 5" immersion. the actual input of the rotor is 1.06 lbs of 02 per hour per foot of rotor which gives a total difference between this and the maximum point of 6.23 times.
The actual power requirements depends upon the rotor immersion and not the nameplate rating of the driving motor. Once the design conditions have been selected for 02 input, you can go to Figure 3 and obtain the kilowatts per foot of rotor at the selected rpm and immersion. The required motor size is calculated as follows:
HP = Length of Rotor x Kilowatts per Foot x 1.34 (4) Drive and Reducer efficiency
Efficiency of 0.95 is used. figuring 4 percent loss in the double reduction helical gear reducer and a 1 percent loss in the belt drive. For domestic waste, a 1-112" increase in rotor immersion above the design immersion is used in selecting the actual motor size. This is to afford some variation in the liquid level of the aeration basin to handle the fluctuation of flows coming to the plant. A 2" increase in immersion above design is required when you're considering industrial waste.
101
i Good operation of the process depends on the rotor supplying the proper oxygenation to the waste. For the best operation, a D.O. concentration of 0.5 mg/l should be registered just upstream of the rotor. Over-oxygenation wastes power and excessive D.O. levels can form a pinpoint floc which settles poorly in the final tank and allows excessive loss of solids over the effiuent weir. Various types of handwheel operated weir assemblies are available to regulate the rotor oxygenation by adjusting the rotor immersion. Preferred design is to employ weir lengths that will provide variations in liquid crests over the weir, between maximum and minImum flows, of something less than 1".
FINALTANJ{
The Oxidation Ditch plant operates as a closed system in that all solids formed by the prOcess should be retained within the process. Operation of the process must be such that a suitable size flocculated solid is formed that can be separated from the liquid when it is subjected to the near quiescent volume in the final settling tank.
1'he iinal settling tank is sized based -on hydraulic loadings using the average daily flow. The tank should have, based on average design flow, a surface settling rate not exceeding 600 gallons per squ~re foot per day and a detention time of at least 3 hours. Special consideration should be given to plants receiving theu-tou.!daily flow in less than 16 hours by sizing the final tanks bued 0!1 JJat hourly rated flow. Where excessively large pumps lift directly to the ditch or final tank or the plant receives extremely high peak flows. consideration should also be given to modifying the final tank design.
The Oxidation Ditch can provide efficient aeration, excellent mixing, sufficient velocity and good flocculation, but if you do not provide an efficient settling basin, excessive solids will be lost over the effiuent weir. A small settling tank or a suitably sized tank with an inefficient settling mechanism can materially hamper the overall effectiveness of the process. The peripheral feed Spiraflo Clarifier has proven to be the most effective mechanism for this process. The construction of the peripheral feed clarifier reduces short-circuiting within the basin. All flow must move into the race area, move around the race and down and then pass underneath the bottom of the skirt and then flow up through the sludge blanket. Many of the fine colloidals, normally lost from other types of clarifiers, are retained within the sludge blanket as the flow rises through the sludge blanket.
SLUDGE
All of the activated sludge formed by the process and settled in the clarifier is returned to the ditch. Grease and floating solids retained in the race -of the clarifier are also collected and returned to the ditch. The return sludge pump or air lift for domestic waste should be sized to handle a minimum of 100 percent of the average design flow. For strong industrial waste, the rate of sludge returned should be somewhat greater.
Adjusting the rate of sludge returned is a means of regulating plant operation. Continuous return is preferred

over intermittent operation. Intermittent operation of a pump taking its suction directly from the bottom of the clarifier is definitely not recommended. The rate of sludge return can be controlled by the use of telescoping sludge valves or pumps fitted with variable speed motors. For medium and large size plants, Screw Pumps are an excellent mechanism for return activated sludge.
The Oxidation Ditch process is operated as a closed system and with efficient operation, there will be a slow growth or increase in suspended solids. In that the process operates at the lower end of the endogenous respiration curve, the actual growth rate is low. The excess sludge drawn from the process has undergone complete nitrification and additional treatment of this excess sludge is not required or actually possible. These excess solids may be wasted directly to, and will dry r\apidly with little or no odor on open sludge drying beds, dried by mechanical means, or stored in holding tanks or in excedss sludge lagoons for later disposal. For normal climatic conditions, sludge drying beds may be sized based on one square foot per population equivalent.
OPERATION OF PLANTS.
Tl,1e theory, design and oper&tion of the Oxidation Ditch process make it pos"sib.ie for this process to provide effective secondary treatment with a minimum operational adjustment or UP.S.fSt by shock loadings. Operation with a
.. highly effiejent rotor· aerator keeps power costs to a mmiu:r..:rn and complete nitrification is provided as a bonus. The . proof of this performance can be observed by reviewing actual operating data from several plants.
Table 1 of the Appendix lists operating data collected by Region VII of the Federal EPA (1) covering three of the Oxidation Ditch plants included in their study. The Data includes both summer and winter operation.
The Nixa, Missouri, plant was designed for 0.412 MGD flow and 204 mg/I BOD with operation starting in 1971. The current average daily flow rate is reported to be 0.159 MGD. Seymour, Missouri, was designed for 0.255 MGD flow and 204 mg/l BOD with operation starting in 1973. Current average daily flow is reported to be 0.225 MGD. Battle Creek, Nebraska, was designed for 0.21 MGD flow and 215 mg/l BOD and operation of this plant began in 1968. This plant is fully loaded with current average daily flow at the designed figure of 0.21 MGD.
All three of these plants were designed based on a ditch loading of 13.5 lbs of BOD per thousand cubic feet. This data illustrates operation of partly loaded to fully loaded installations. BOD and suspended solids removals more than meet effluent requirements for secondary treatment regardless of the ditch loading. It should be noted the summer data on the Battle Creek, Nebraska, plant was taken with the return sludge pump being closed and inoperative. The data also shows that complete nitrification is possible at various loadings and during summer and winter operation. All three plants used sludge drying beds for their excess sludge and this sludge is pumped directly from the final tank to the sludge drying beds with little or no apparent odor and with no additional treatment.
102
Data on the Berthoud, Colorado Oxidation Ditch plant appears in Table 2 of the Appendix. This plant consists of a single ditch fitted with four (4) 11'-0" Cage Rotors and a 55'-0" diameter final settling tank. The plant sits at about 5000' elevation and is in the northern part of Colorado and does experience considerable cold weather operation. Actual operation of this plant started in 1978. The plant design was 0.9 MGD flow and 163 mg/I BOD and a ditch loading of 13.5 lbs BOD per thousand cubic feet. For 1975 this plant produced an average BOD reduction of 96.5 percent and a suspended solids reduction of 95.4 percent. It should be noted that the average BOD and suspended solids in the effluent were less than 5 mg/1.
West Liberty, Ohio operating data is shown in Table 3 of the Appendix. This Oxidation Ditch plant consists of dual ditches each fitted with a 16' long Cage Rotor and dual • 24'-0" diameter final tanks. Operation of this plant commenced late 1972. Plant design was for a flow ')f 0.5 MGD and a strength of 122 mg/l BOD or 51f) Ibs of BOD per day. This plant was designed to handle a very weak waste. OperatinK data ~r the year 1974 shows that the flows to) the piant varied considerably depending upon the amount of rainfall. Actual operation was at loadings even less titan were originally set forth in the design. Based on the operating data, the average loading to this ditch was 1.27lbs of BOD per thousand cubic feet. Normally there is concern with very weak wastes that it's not possible to get the high reductions expected from the stronger waste . Even with this very weak waste, the plant provided average BOD and suspended solids reductions of 97 percent.
The Oxidation Ditch plant at Somerset, Ohio consists also of dual ditches and dual final tanks. This plant was put into operation in 1965. Operating data was collected by composite samples under a U.S. demonstration grant to Ohio University, Athens, Ohio under the direction of H.M. Kaneshige. Some of the data is shown in Table 4 of the Appendix illustrating operation over a 9 month period which includes operation right through the winter. The total plant design is for a flow of 0.287 MGD and a strength of 298 mg/l or 715 Ibs of BOD per day. Each ditch has a volume of 28,600 cubic feet with a design loading of 12.51bs of BOD per thousand cubic feet and is equipped with two (2) 8'long Cage Rotor assemblies. There are also two (2) 20' diameter final settling tanks, each fitted with return sludge air lifts.
During the test period, only one ditch was being operated and the data shown in Table 4 represents a fully loaded operation. The results show the ditch carried a mixed liquor solids concentration ranging from 5,228 to 7,812 mg/l. The percentage of volatile solids ranged from 50 to 70 percent. Nitrogenous reduction shows that almost 100 percent of the ammonia was converted to nitrates. No difference is shown in this nitrification between the summer and the winter operation. The table shows an average BOD reduction of 97.1 percent and a reduction of suspended solids of 95 percent. This plant is doing an exceedingly excellent job.
Oxidation Ditch plants are in operation on domestic wastes for popUlations as low as 150 persons and as high as 33,000 persons. At present, there's an Oxidation Ditch

under construction to handle 8 MGD and there are several other large plants in the design stage above this 8 MGD figure. The interest in and use of the Oxidation Ditch has expanded since the original introduction here in the States. The reasons are that the Oxidation Ditch does provide effective secondary treatment with BODS and suspended solids reductions of 90 to 98 percent and nitrification of ammonia and organic nitrogen is virtually complete in summer and winter operation. The Oxidation Ditch will perform effectively with a minimal amount of personal operation and minimum power costs.
REFERENCES
1. William J. Keffer, Winter Performance of Seeondary Wastewater Treatment Facilities, Environmental Protection Agency, Region vn Report, 1977.
Table 1. Openmng data.
Avg. Previous
2. N.R. Abberg, P~OSpboru8 ~mova1 Studies at the p(!rt Elgin wpcp, Ontario MiniIIt17. of the Environment, Technical Advisory Services Section, Research Branch, Jwyl972.
3. James M. Bullert and Harry C. Grounds, Demonstration Project, Dawson, Minnesota Wastewater Treatment Plant, U.S. EPA Grant I#S-803067-01-1.
4. A. Pasveer, Developments in Activated Sludge Treatment in the Netherlands, 1960 Conference on Biological Waste Treatment, Manhattan College. Report 1#34.
5. P.G .H. Walker, Rotor Aeration of Oxidation Ditches, Water and Sewage Works, June 1962.
6. E.R. Baumann and J.L. C1easby, Oxygenation Efficiency of a Bladed Rotor, Journal Water Pollution Control Federation. March 1968, p. 412 to 424.
Current Winter Nixa, Missouri % Rem. Eff. Performance
Flow MGD
BODS mg/l
COD mg/l
NFS mg/l
NH3-N mg/l
Seymour! Missouri
Flow MGD
BODS mg/l
COD mg/l
NFS mg/l
Flow MGD
BODS mg/l
COD mg/l
NFS mg/l
NH3-N mg/l
H20 Temp. C.
0.058
3.4
15.2
1.3
0.92
17.4
0.196
5.1
15.2
1.8
0.42
16.4
13
19
8
103
0.029
99 3 98.4
98.3 21 96.0
99 <5 97.8
98.2 <0.5 98.4
8.3
0.107
96 4.5 97.9
94.8 48 87.5
98 11 94.7
98.1 <0.5 98.4
8.7
0.21
87.7 14.6 93.4
86.4 54 90.1
96 22.3 93.4
1.23 94.5
4.7

Table fl. Town 01 BertTioud, Colorado, average monthly operating data 1M' 1975.
Month
JAN .
FEB.
MAR.
ARPIL
MAY
JUNE
JULY
AUG.
SEPT.
OCT.
NOV.
DEC.
AVG.
INFLUENT
Temp. SettI. Flow (F) oH Solids I ~~~
.403 51 7.~ 7.0
.406 49 7.7 6.5 173
.412 48 7.6 4.5 171
.466 53 7.5 6.8 192
.548 54 7.1 5.0 206
.714 59 6.9 4.3 104
.807 64 3.0 88
.829 65 7.3 1.9 70
.670 62 7.4 4.3 105
.552 60 7.1 4.4 137
.488 58 7.1 6.6 158
.464 56 7.2 4.5 153
.563 57 7.3 4.9 142
Notes: Settleable Sollds = ml/liter Flow is in mgd.
Susp. Solids
147
130
110
220
130
93
79
88
104
137
113
150
125
Table 8. WeBt Liberty, Ohio, operating data, 1974.
WEST LIBERTI, OHIO
•
EFFLUENT
Temp. SettI. (F)
44
44
46
46
58
61
64
66
63
57
50
47
54
oH Solids D.O BOD
7.3 I 0 3.7
7.3 0 3.6 4.5
7.2 0 3.9 4.8
7.5 0 3.8 5.6
7.4 0 3.2 9.3
7.4 0 1.1 6.6
0 3.0 3.0
7.1 0 3.7 2.8
7.1 0 3.5 3.2
6.9 0 3.4 4.3
6.9 0 3.7 4.2
6.8 0 3.4 3.3
7.2 0 3.5 4.3
Suspended Solids & BOD is mg/I. Temperature is of llquid.
OPERATING DATA 1974 FLOW SUSPENDED SOLIDS 5 - DAY BOD mod moll mill
MONTH Averaoe/Day Raw Final 1
January .404 52 3 36 1.6
February .379 52 5.5 55 2.4
March .305 52 3.7 41 3.3
April .324 33 1.7 32 1.8
May .208 58 1.5 65 1.4
. June .124 142 2.9 67 1.2
July .098 74 .6 56 1.0
SusP. % Red % Red Solids Rnn S.S.
6.0 95.9
1.2 97.3 98.0
3.0 97.2 94.4
6.6 97.0 96.9
6.3 95.4 95.1
5.1 93.6 94.5
3.0 96.5 96.1
7.0 96.0 92.0
2.5 96.4 97.5
5.0 96.8 96.2
3.8 97.3 96.6
11.3 !
97.8 91.5
5.1 96.5 95.4
DISSOLVED OXYGEN mall
Final
7.8
7.2
6.5
6.3
4.6
4.8
4.5
August .107 175 3 58 .8 I 4.5
September .128 82 2.2 48 .9 5.1
October .092 86 1.6 62 1.3 5.0
November .079 70 1.0 60 .9 5.5
December .115 62 2.1 53 1.5 6.0
Total 2.363 938 28.8 633 18.1 67.8
Average .196 78 2.4 52 1.5 5.6
104
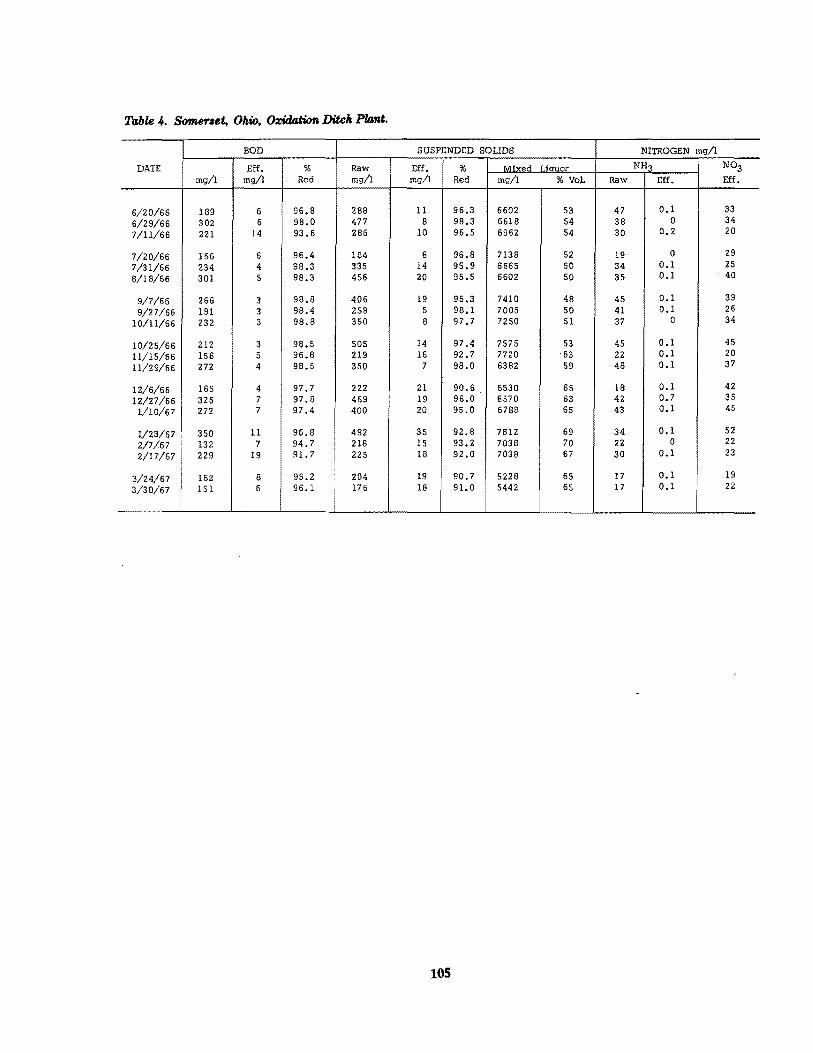
7bble 4. Somenet. Ohio. Orilation Ditch Plant.
BOD SUSPENDED SOLIDS NITROGEN mg/l
DATE Eff. % Raw Eff. % Mixed ljouor NH~ N03 mg/1 mg/l Red mg/l mg/l Red mg/1 % Vol. Raw Eff. Eff.
6/20/66 189 6 96.8 288 11 96.3 6602 53 47 0.1 33 6/29/66 302 6 98.0 477 8 98.3 6618 54 38 0 34
7/11/66 221 14 93.6 286 10 96.5 6962 54 30 0.2 20
7/20/66 156 6 96.4 184 6 96.8 7138 52 19 0 29
7/31/66 234 4 98.3 335 14 95.9 6665 50 34 0.1 25
8/18/66 301 5 98.3 456 20 95.5 6602 50 35 0.1 . 40
9/7/66 266 3 98.8 406 19 95.3 7410 48 45 0.1 39
9/27/66 191 3 98.4 258 5 98.1 7005 50 41 0.1 26
10/11/66 232 3 98.8 350 8 97.7 7250 51 37 0 34
10/25/66 212 3 98.5 505 14 97.4 7575 53 45 0.1 45
11/15/66 156 5 96.8 219 16 92.7 7720 63 22 0.1 20
11/29/66 272 4 98.5 350 7 98.0 6382 59 48 0.1 37
12/6/66 165 4 97.7 222 21 90.6 6530 65 18 0.1 42
12/27/66 325 7 97.8 469 19 96.0 6570 63 42 0.7 35
1/10/67 272 7 97.4 400 20 95.0 6788 65 43 0.1 45
1/23/67 • 350 11 96.8 492 35 92.8 7812 69 34 0.1 52
2/7/67 132 7 94.7 218 15 93.2 7038 70 22 0 22
2/17/67 229 19 91.7 225 18 92.0 7038 67 30 0.1 23
3/24/67 162 8 95.2 204 19 90.7 5228 65 17 0.1 19
3/30/67 151 6 96.1 176 16 91.0 ! 5442 65 17 0.1 22
I
lOS
Land Treatment for Roosevelt, Utah
GilbertR. H()fTOCks, P.E.·
INTRODUCTION
During the early 1970s oil exploration and development increased rapidly in the Uintah Basin, spreading from the Western Colorado oil fields into the Uintah and Duchesne Counties in Utah. Roosevelt City, located in Duchesne County near the Uintah County line, serves as a commercial center for the surrounding area and was heavily impacted by the influx of new people. Population increased from 3,372 in the 1970 census to an estimated 6,400 in early 1975.
The existing wastewater treatment facility is a facultative lagoon system at five stabilization ponds with a ?esiK? capacity of approximately 4,000 people. This facility IS senously overloaded resulting in discharge of unsatisfactory effluents, odors and aesthetic problems to encroaching development.
Faced with the requirements to provide a high level of treatment to conform with the new state and federal requirements, as well as to increase its wastewater treatment ~pacity to accommodate future flows from a rapidly increasing population, Roosevelt City initiated a facilities planning study.
DESIGN CONDmONS
Population
The most important economic factors affecting the fut~re population of Roosevelt City is the oil industry, agnculture and tourism. The total potential yield of the Uintah Basin crude oil fields could amount to as much as 1 billion barrels, which would make this area one of the ten largest on-shore discoveries in the United States.
The single most important mineral resource of the Uintah Basin is the oil shale formations. Total oil in Uintah Basin shale is estimated to be between 900 and 1300 billion barrels. Some of the richer deposits are estimated to be . more than 25 feet thick and to contain at least 25 gallons of crude oil per ton of oil-bearing rock. The total oil content of these richer shale deposits, which are located in the southern half of Uintah County and Duchesne County, has been estimated at 100 billion barrels.
Construction of the two prototype oil-shale facilities, to be located about 50 miles southeast of Roosevelt City, is expected to begin in 1978 and continue for about three years.
*Gilbert R. Horrocks is President. Horrocks and Associate~ American Fork. Utah. •
107
The following table gives the projected population for the RooselveIt area assuming no significant shale oil developments during the design period, and projections assuming a moderate development of the shale-oil resources. It should be noted that a moderate shale-oil development would increase the 1995 design population of the study area by a factor of 2.67.
ROOSEVELT AREA POPULATION PROfECTIONS
Projected Population
NO MODERATE Year Oil-Shale Development Oil-Shale Development
i975 7.000 7.000
1980 8,500 10,000
1985 10,500 15.000
1990 II ,000 24,000
1995 12,000 32,000
Because of the unpredictable nature of the Uintah Basin economics and the impact it will have on the study area economics. it is extremely difficult to make an accurate prediction of the population growth. For the purposes of design of new sewage treatment facilities, it is p~o~~ed th!lt the population projections assuming no Significant oil shale development be used. However it is essential that any proposed treatment facility hav~ the flexibility for expansion without major modifications.
Because of the strong possibility of the oil-shale development, and the long lifetime of sewer mains and interceptors, it was felt that some consideration for the projected population impact of these oil-shale developments must be taken into consideration. In the design of the new: interceptor sewers, it was proposed that a design population of 22,000 be used (average of projections assuming no oil-shale industry and assuming full-scale development) .
Wastewater Flow and Chuacteristies
The present average per capita sewage flow for Roc;'se,:elt City appears to be about 100 gallons per day, which IS typical for communities of its size with metered water consumption. However, as the size of the city and the average family income increases and the life style becomes more complex. the average per capita sewage flow is likely to increase. Comparisons of the sewage treatment system alternatives and designs for the proposed treatment system. and the proposed interceptor system were based on a per capita sewage flow of 125 gallons per day. The design peak flow rate was assumed to be four times the design average flow rate.
The average daily organic loadings for the influent raw wastewater for Roosevelt City has been estimated

using 0.17 pounds of BOD5 per person per day (present and future). Under design conditions this amounts to 2,040 pounds of BOD5 per day for the influent raw wastewater.
Water Quality and Wastewater Diseharge Standards
Any proposed system must be capable of meeting the 1977 discharge requirements and must have provision for increasing the treatment efficiency to conform with the 1980 and the 1983 discharge requirements.
A summary of these discharge and water quality requirements is as follows:
Date for Compliance Requ1rement 30 Day LImitatiOn
June 30, 1977 State Interim Discharge Re- BODs - 25 mg/L 85% removal qulrement SS = 25 mg/l, 85% removal
Fecal coliform = 200/100 ml
Jull, 1977 EPA Secondary Treatment 13005 = 30 mg/l. 85% removal SS = 30 mg/L 85% removal Fecal coliform = 200/100 ml
Jun 30, 1980 State Interim Discharge re- BODS = 10 mg/l. 90% removal quirement S6 = 10 mg/I. 90% removal
Fecal coliform = 20/100 ml
Jul 1, 1983 EPA Best Practicable Treat- Nitrification'" ment
Dec 31, 1983 State Class "C" Water Qual- BODS = 5 mg/l in receiving ity Standard stream
"Possible exclusion for 'Wastes with a temperature less than ZOo C9
Receiving Waters
Dry Gulch Creek with an annual average flow of about 50 ds receives the discharge from the present lagoon system. Water is diverted at various downstream points for irrigation purposes.
WASTEWATER TREATMENT SYSTEM ALTERNATIVES
Principal Constraints
The most important requirements for any new wastewater treatment system for Roosevelt City is that it have the capability for having its population capacity increased beyond its design capacity without major modifications; be capable of meeting the 1977 discharge requirements with provision for increasing the treatment efficiency to conform with the 1980 and 1983 discharge requirements; be compatible with area land use planning; minimize adverse environmental impacts; be politically and financially implementable.
Alternatives Considered
Many wastewater treatment alternatives were considered in a preliminary evaluation, and of these only six merited a detailed evaluation.
1. 2.
3.
Complete Containment Lagoons Aerated Lagoon with Winter Storage and Land Disposal Facultative Lagoon with Winter Storage and Land Disposal
4. 5. 6.
Mechanical-Biological Treatment Plant Physical-Chemical Treatment Plant No Action
All of these alternatives have the capability of meeting the constraints given above. A semi-detailed description of each of these is given below.
1. Complete Containment Lagoon. This facility would be designed such that the anticipated total inflow during the design year would be equal to the net evaporation plus the seepage from the ponds. The lagoon would consist of three or more cells, the number of ponds being dictated by economic and operation considerations, with the primary or receiving pond sized to keep the BOD5 I
loading below the odor producing threshold. Increasing the. number of ponds would also provide a smaller wind-fetch.
2. Aerated Lagoon with Winter Storage and Land Disposal. This system would consist of two aerated cells designed with a detention time and aeration capacity such as to achieve 85 percent reduction in the BOD of the influent raw wastewater. Effiuent from the second aeration cell would be discharged into the winter storage pond. The winter storage pond would be designed to retain all of the wastewater for 180 days during the colder months. During the late spring, summer, and early fall the treated wastewater would be withdrawn from the winter storage pond, chlorinated. and spray irrigated at a land disposal site. The withdrawal rate would coincide with the cover crop evapotranspiration demand and the soil moisture content.
3. Facultative Lagoon with Winter Storage and Land Disposal. For this alternative, primary-secondary treatment would be accomplished by a series of shallow facultative ponds. Again the design average BOD reduction would be 85 percent before the wastewater was discharged into the winter storage pond. The operation of the chlorination facility and the spray irrigation system would be the same as described for Alternative 2.
4. Mechanical-Biological Treatment Plant. Of the mechanical-biological systems that are capable of meeting the effiuent limitations required for new facilities, the system which appears to be the most economical and the least susceptible to operational problems for small installations would consist of a) comminutors; b) grit chambers; c) primary clarifiers; d) redwood media biological tower; e) high rate aeration cell; f) final clarifiers with sludge return to tower; g) final filter; h) chlorination facility; and i) sludge treatment and disposal facilities.
5. Physical-Chemical Treatment Plant. A physical-chemical plant would consist of: a) comminutors; b) grit chambers; c) primary clarifiers; d) rapid mix chamber with chemical feed system; e) flocculation; f) final clarifiers; g) final filter; h) chlorination facility; and i) sludge treatment and disposal facilities_
6. No Action. Under this alternative the existing treatment facility would be retained in operation and would not be modified, expanded or improved. The facility is presently overloaded. The effluent does not conform with the requirements soon to be enforced by the State of
108

Utah. After July I, 1977, continued operation of the existing facility would be unlawful. As the population increases, as it has rapidly done so over the past few years, the efficiency of the existing system will undoubtedly worsen.
Another serious limitation of the No Action Alternative is the rapid development of the area around the existing lagoon system. To allow proper growth of the city and to alleviate the problems associated with the unsightly condition of the lagoon facility and the associated odors, there is a severe need for a relocation of the treatment facility.
The requirement by law that the Roosevelt City wastewater treatment system comply with the new state and federal regulations coupled with the serious need to provide an increased treatment capacity and to relocate the treatment facility, makes this alternative unviable.
Preliminary Cost Comparisons
The following table gives the preliminary cost estimates for each of the six treatment alternatives. It should be noted that alternatives four and five were much more costly than any of the other alternatives, both in terms of initial construction costs and equivalent total annual costs. On the basis of these preliminary cost estimates and the demonstrated un viability of Alternative 6, it was concluded that detailed comparisons would be required of Alternatives 1, 2. and 3 ouly. Alternatives 4 and 5 offer no significant advantages to justify the higher cost and increased operational complexity.
COMPARISON OF APPARENT THKEEBEST WASTEWATER TREATMENT
ALTERNATIVES
General
The three alternatives which are considered to be the apparent best alternatives are: 1) Complete Containment Lagoons. 2) Aerated Lagoon with Winter Storage and Land Disposal, 3) Facultative Lagoon with Winter Storage and Land Disposal. Each of these alternatives would be considered by the State of Utah, Bureau of Environmental Health to be complete containment system, since there would be no direct discharge to any surface water course.
Functional Comparisons
In terms of the alternatives ability to meet the necessary effluent discharge limitations, each of these alternatives would perform adequately since there would be no direct discharge in any case. However, more careful management would be required for Alternatives 2 and 3 in order for them to function properly.
Enviroomental Comparisons
. Alternative 3 is considered the most environmentally sound of the three alternatives, with the following justifications: 1) where suitable land is obtainable, land disposal of domestic secondary effluent is perhaps the best method of tertiary treatment available and where land prices are low, it is often the least expensive. The biologically active soil-plant system provides almost
TREI\TMENT SYSTEM ALTERNATIVES COST COMPARISONS
Estimated EPA Share Local Share Net Annual Effective Actual Total Total of of o & M Costs Total Annual Annual Local
Capital Costs Capital Capital Cost Costs Alternative Costs Costs Initial Design (20 , 7%) Initial Design
Complete 1 Containment 1,433,000 948,750 484,250 5,250 5,450 140,770 33,480 33,680
Lagoons
Aerated Lagoon 2 With Winter Storage 1,233,000 858,750 374,250 13,750 11,990 129,390 33,570 33,810
and Land Disposal
Facultative Lagoon 3 with Winter Storage 1,343,000 941,250 401,750 2,480 760 128,530 25,900 24,180
and Land Disposal
Mechanical-4 Biological 1,955,000 1. 451,250 503,750 47,500 54,400 235,700 76.870 83,770
Plant
Phys ical-Chemical 5 Plant 2.300,000 1,710,000 590,000 67,000 95,100 298,400 101,400 129,500
No Action* 0 0 0 3,000 3,000 3,000 3,000 3,000
*Does not meet project objectives
109

complete renovation of wastewater, including removal of eutrophication inducing nutrients. The following table presents an estimate of the efficiency of land disposal for treatment of secondary effluent.
ESTIMATED EFFECTIVENESS OF LAND DISPOSAL TECHNIQUES
Spray OVerload Rap!d Infiltration F<unoff Ponds
BOD 99 80 99
SS 99+ 80 99
N 80-90 80 80
P 99 80 90
Heavy Metals 99 10-30 95
Ol\lan!c Cpds. 99 SO 90
Viruses and Bacteria . 99+ 90 99+
Tm
Cations 75 30-50 50-75
Anions 0-50 0-10 30-50
Source: Eugene B. Welch and Demetro!s E. Spyr!dak!s. TF<EATMENT PROCESSES AND ENVIF<ONMENTAL IMPACTS OF LIQUID WASTE DISPOSAL ON SOIL. Fourth Environmental Engineers, Conference, Montana State University , February 1973.
A large portion of the applied water (as much as 50 percent under design conditions) would be renovated by the 'oil-plant system and returned to groundwater. Although an equal amount of the water might be returned to groundwater as seepage from a completed containment lagoon, the soil column through which the water would pass would not be biologically active and would not provide as effective renovation; 2) the nutrients in the wastewater would be utilized beneficially for the production of crops; 3) the proposed land disposal site contains no unique biological, geological, archaelogical, historical, or aesthetic values and thus the conversion of this land to productive, income producing agricultural land would appear to be environmentally beneficial; 4) the capacity of the system could be increased at less cost than for either of the other alternatives; 5) net energy and resources consumption would be less than for Alternative 2. As much as 650,000 killowatt-hours of power per year would be required for Alternative 2 under design conditions; 6) Alternative 3 is more aesthetically pleasing than Alternative 1 because of the smaller total pond area: 7) the net annual cost to Roosevelt City would be less for this alternative.
Eeonomie Comparison
On an effective total annual cost basis, Alternative 3 appears to be the most economical. The net annual cost to Roosevelt City would be about 35 percent more for either Alternative 1 or 2 than for Alternative 3.
Seleetion of Apparent Best Alternative
Alternstive 3 was selected as the apparent best alternative with the following justifications:
1.
2. 3.
It appears to be the most environmentally sound alternative It has the least effective total annual cost Local annual cost would be considerably less than for Alternatives 1 and 2
DESIGN FACTORS
Successful design of a land application system depends upon the specific site available and proper application of the principals of environmental engineering, hydrology, soil science, agriculture, geology, and land use planning.
Wastewater Quality
Complete chemical analyses of the existing lagoon effluents were obtained to determine whether they contained any constituents which would affect permeability of the soil, be toxic to crops, excessive salinity or boron or excessive heavy metals which might have an adverse impact. No ions were found in excess of the recommended level for the maximum design application rate of 00 inches per year.
Site Seleetion
The proposed land application site was selected while considering such criteria as: 1) elevation differences between the site and the collection system to avoid having to pump: 2) sufficient area available for facultative lagoons, winter storage and irrigated land required: 3) land availability and cost; 4) environmental impact; 5) compatible with the area zoning and land use plan.
Local representation of not only Roosevelt City but the surrounding areas were consulted and their recommendations received regarding the treatment process and treatment site. The site selected best met the above criteria.
Soil Charaeteristies
The proposed irrigation site had previously been mapped by the local Soil Conservation Service soil scientist and was shown to be suitable for irrigation and the crops planned. Additional samples were taken in the root zone (top 5 feet) and to depths of 14 feet to check the permeability and water table level.
The results of the physical and chemical analysis of the soils investigation showed the soils to be deep, homogeneous, uniform, loamy sands with high permeabilities and low sensitivity to any of the common chemical constituents of the wastewater. There was no evidence of water table above 10 feet.
Crops
Field evaluation and consultation by a Plant/Soil Scientist from the Utah State University Extension
110
Service was utilized to make recommendations regarding suitable crops for the area. Productivity studies were made by the Plant/Soil Scientist.
A local advisory group composed of farmers from the area evaluated the proposed site, cropping plans and economics of the proposed irrigated farm operation. Both the Plant/Soil Scientist and the farmers advisory group felt that the farming operation could be economically successful and recommended alfalfa as the main crop with rotation of grain as necessary to reestablish the alfalfa.
State Dlviaion of Health Evaluation
The proposed site together with all criteria and data were reviewed by the Utah State Division of Health and found to be acceptable. It is not anticipated that there will be any contamination of underground water in the area and that sufficient buffer zone is available to prevent aerosols from escaping the irrigation area.
PROPOSED SYSTEM
Evaluation of the above design factors resulted in the following design (See Figure VI-A).
Raw wastewater will be transported to the treatment site through a 36 inch interceptor and pass through a Parshall flume (2 foot throat) into an inlet structure. The wastewater then passes through a 15 inch and 24 inch inlet pipe to the primary cell of the lagoon.
The State of Utah maximum allowed BOD5 loading for any lagoon cell is 40 lbs per acre per day. This requirement dictates the size of the primary cell for the proposed lagoon, which has a total mid-depth water surface area of 51 acres and a working depth of 6 feet. The theoretical detention time under design conditions will be 66 days. The primary effluent will then pass into the first of two secondary cells.
The two secondary cells will be equally sized and will increase the detention time under design conditions to 120 days. The average reduction in BOD5 will be 85 percent or more. The treated wastewater will then pass into the winter storage pond.
The winter storage pond will have a mid-depth water surface area of approximately 55 acres and a working depth of 15 feet. The pond will be designed to retain all the treated wastewater, under design flow conditions, from the middle of October to the middle of April. The wastewater will be discharged from the winter storage pond during the irrigation season through the chlorine contact chamber.
The chlorine contact chamber consists of 800 feet of 6 foot diameter aluminum pipe submerged in the winter storage pond adjacent to the inside toe of the north dike of the storage pond. This pipe will be laid such that the top of the pipe will be at roughly the same elevation as the pond bottom. The contact chamber will be sized for a one hour minimum detention time under design conditions.
The chlorine solution will be introduced into the contact chamber just upstream of a 2 foot diameter orifice
111
plate, which will be located near the upstream end of the chamber. The orifice plate ru:d two sets of baffles, which will be located 10 to 20 feet respectively downstream of the orifice plate, will provide effective mixing. The disinfected wastewater will be withdrawn from the contact basin at the downstream end by five short couple constant-speed lineshaft turbine pumps. The chlorine feed rate will be coordinated with the pumping rate. The upstream end of the chlorine contact chamber will be covered with a mechanical screen to prevent debris from entering the chamber and damaging the booster pumps. The winter storage pond will be pumped empty once each year and overflow from the secondaries stopped, so that rhlorine contact basin might be cleared and inspected.
The pump station will consist of a wet well, five manually controlled pumps with surge release valves, an electrical control system to synchronize operation of the pumps and the spray system shut-off valves, and adequate housing. The chlorination equipment will be housed in a separate room of the same building.
The spray irrigation system will consist of center pivoted, electrically propelled spray irrigation units. These spray units will be turned on and off by remotely controlled, motor operated shut-off valves. The land disposal area will include a total wetted area of about 268 acres, which will be divided into 5 sub-areas. Under normal operating conditions each sub-area would receive its weekly anocation of water during a 48 hour period or less and then no water would be applied to that particular parcel for 5 days.
The cover crop will be harvested 3 or 4 times each year. Any nutrients not supplied in sufficient quantities by the wastewater will be applied as needed. Yearly check of soil conditions will be required to insure a proper nutrient balance.
The irrigated area will be surrounded by a 200 foot buffer zone, with a 4 foot high fence on the outside border of the buffer zone. As an added precaution to prevent aerOsols from escaping the spray area, the spray units will be shut down during high winds.
Dikes will be constructed where needed to minimize the possibility of surface runoff from the spray area. Test wens will be installed around the perimeter of the spray area to allow testing of the groundwater quality during " system operation.
ANTICIPATED ANNUAL OPERATION AND MAINTENANCE COSTS FOR PROPOSED WASTEWATER TREATMENT SYSTEM
Initial 0 & M Year Costs 0& Costs
Lagoons and Winter Storage Pond $ 3,800 $ 3,800
ChlOrination Facil!ty 10,200 11,320
Land Disposal Sy" tern -11,250 -20,360*
Net 0 & M $ 2,480 160
*Negative Costs indicate that cover crop gross sales exceed total year expenditures.

...
.~i· ..
~:t\~,
Figure VI·A. Experience in Treatment PltLnt Design, Wastewater Land Application (Irrigation), and Lagoon Design.
EXPERIENCE IN TREATMENT PLANT DESIGN, WASTEWATER LAND APPLICATION (IRRIGATION), AND LA800N DESIGN.
SERVING INDUSTRY / ENERGY
POWER, COAL, MINING, PETROLEUM, SURVEY a CONSTRUCTKlN STAKING
SERVING MUNICIPALITIES WATER • SEWER (LARGE OR SMALL), ROADS, SOILS a MATERIALS,. IRRIGATION It DRAINAGE, REPORTS It STUDIES. LAND It CONSTRUCT~ SURVEY
HORROCKS a ASSOCIATES CONSULTING ENGINEERS
AMERICAN FORK.J UTi 101-756-7628 SALT LAKE CITY, UTI 101-532-1!l40 OTHER uFFlcES IN RICHFIELD, ROO.SEvt:LT, a PROVO UTAH
112
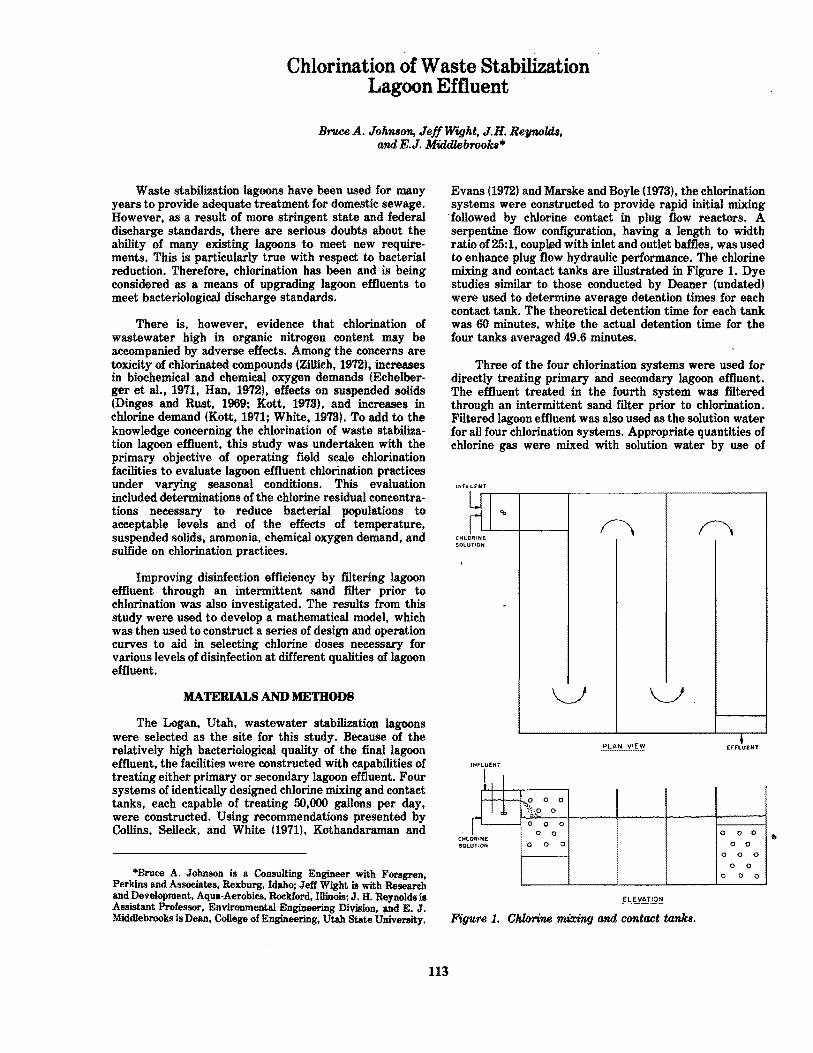
Chlorination of Waste Stabilization Lagoon Effluent
BruceA. Johmon, Jeff Wight. J.H. Reynolds. andE.J. Middlebrooks·
Waste stabilization lagoons have been used for many years to provide adequate treatment for domestic sewage. However. as a result of more stringent state and federal discharge standards. there are serious doubts about the ability of many existing lagoons to meet new requirements. This is particularly true with respect to bacterial reduction. Therefore, chlorination has been and is being considered as a means of upgrading lagoon effluents to meet bacteriological discharge standards.
There is. however. evidence that chlorination of wastewater high in organic nitrogen content may be accompanied by adverse effects. Among the concerns are toxicity of chlorinated compounds (Zillich. 1972), increases in biochemical and chemical oxygen demands (Echelberger et al •• 1971. Han. 1972). effects on suspended solids (Dinges and Rust, 1969; Kott. 1973), and increases in chlorine demand (Kott, 1971; White, 1973). To add to the knowledge concerning the chlorination of waste stabilization lagoon effluent, this study was undertaken with the primary objective of operating field scale chlorination facilities to evaluate lagoon effluent chlorination practices under varying seasonal conditions. This evaluation included determinations of the chlorine residual concentrations necessary to reduce bacterial populations to acceptable levels and of the effects of temperature. suspended solids. ammonia, chemical oxygen demand. and sulfide on chlorination practices.
Improving disinfection efficiency by filtering lagoon effluent through an intermittent sand filter prior to chlorination was also investigated. The results from this study were used to develop a mathematical model. which was then used to construct a series of design and operation curves to aid in selecting chlorine doses necessary for various levels of disinfection at different qualities of lagoon effluent.
MATERIALS AND METHODS
The Logan, Utah. wastewater stabilization lagoons were selected as the site for this study. Because of the relatively high bacteriological quality of the final lagoon effluent, the facilities were constructed with capabilities of treating either primary or secondary lagoon effluent. Four systems of identically designed chlorine mixing and contact tanks, each capable of treating 50,000 gallons per day. were constructed. Using recommendations presented by Collins. Selleck. and White (1971). Kothandaraman and
-Bruce A. Johnson is a Consulting Engineer with F~gren. Perkins and Associates. Rexburg. Idaho; Jeff Wight is with Researeh and Development. Aqua-Aerobics, Rockford. Illinois; J. H. Reynolds is Assistant Professor. Environmental Engineering Division, !1Dd E. J. Middlebrooks is Dean, College of Engineering, Utah State University.
Evans (1972) and Marske and Boyle (1973), the chlorination systems were constructed to provide rapid initial mixing
. followed by chlorine contact in plug flow reactors. A serpentine flow configuration, having a length to width ratio of 25:1, coupled with inlet and outlet baffles, was used to enhance plug flow hydraulic performance. The chlorine mixing and contact tanks are illustrated in Figure 1. Dye studies similar to those conducted by Deaner (undated) were used to determine average detention times for each contact tank. The theoretical detention time for each tank was 00 minutes. white the actual detention time for the four tanks averaged 49.6 minutes.
113
Three of the four chlorination systems were used for directly treating primary imd secondary lagoon effluent. The effluent treated in the fourth system was filtered through an intermittent sand filter prior to chlorination. Filtered lagoon effluent was also used as the solution water for all four chlorination systems. Appropriate quantities of chlorine gas were mixed with solution water by use of
INfLUENT
I ~ OfflkE eHL
SOLU liON
cOt SOL
lNFl..uENT
~ I
I .L
CEl UTlON
-
,0
.. ~~~~~.?? 0
0
0
f"'\
~ "--.J .
PLAN VIEW
0 0
0
0 0
0
0 0
ELEVATION
Figure 1. Chlorine mi:c,;ng and contact tanks.
'"
• EFFLUENT
0 0 0
0 0
0 0 0
0 0
0 0 0

vacuum operated diffusers prior to introducing solution lines into chlorine mixing tanks and exposing the main flow of lagoon effluent to chlorine. A schematic diagram of the chlorination operation is presented in Figure 2.
Chlorination of lagoon effluent began on August 6, 1975 and continued until August 24, 1976. Samples were collected at least twice a week throughout the study period except between December 1975 and February 1976. No samples were collected during that period because of pipeline freeze-up. Samples were collected just prior to chlorination as well as at points corresponding to residence time of 17.5,35.0, and 49.6 minutes in each contact tank. Chlorine doses were varied between .25 and 30 mg/l. In addition to chlorinated samples, other samples were collected from the influent and effluent of the lagoon systems and from the effluent from each cell in the system. This was done to characterize the performance of the lagoon system and to assist in determining how to adjust chlorination practices to compensate for seasonal fluctuations in lagoon performance.
The chlorinated samples were analyzed bacteriologically for MPN total and fecal collforms (TC and FC). Five tubes were used for each dilution. Membrane filter total and fecal collforms were also determined on all unchlorina-
<oJ Z :::; o <oJ
'" UJ .... .J .: z :>
SUMP
OJ
~ ~ IoI--,S""O""LU~T""IO,,-N _ :::;
CHLORINE
CONTACT
TREATED EFFLUENT
z o ;:: ::l
5 '"
~__ ...J INTER~!TTENT
SANO FILTERS
STORAGE
CHLORINE
CONTACT
TREATEO EFFLUENT
Figure 2. Experimental chloriootion schematic.
ted samples. Additional water quality analyses included ammonia (NHa-N), biochemical oxygen demand (BOD5)' dissolved oxygen (DO), total and soluble chemical oxygen demand (TCOD and SCOD), sulfide (S;, suspended solids (SS), volatile suspended solids (VSS), pH, temperature, and turbidity. Free and combined chlorine residuals (FCI and CCl) were also measured for all chlorinated samples using the amperometric titration method. With the exception of the sulfide, all samples were collected and analyzed using recommended procedures outlined in APHA Standard Methods (1971). Sulfide was analyzed using a method described by Oris (undated).
In addition to the field study as described, laboratory studies were also conducted. These studies were performed to assist in describing relationships between chlorine and other wastewater consitutents.
RESULTS AND DISCUSSION
In studying chlorination practices of waste stabilization lagoon effluent, it was found that ammonia, organic nitrogen, sulfide, suspended solids, and chemical oxygen demand were the most sensitive parameters of concern. Evaluation of these water quality characteristics were made to appraise chlorine demand and disinfection and to develop design and operation curves.
Ammoaia and Organic: Nitrogen
Reactions between chlorine and ammonia (NH:rN) in wastewater are significant due to the formation of chloramines and subsequent reduction in disinfection capacity. This reduction of disinfection capacity represents an effective chlorine demand. Breakpoint chlorination is also of interest as a possible means of removing ammonia from wastewater and producing free chlorine residual, a more effectiVe disinfectant. Results of this study show that in most cases there was little reduction of ammonia concentrations and disinfection was accomplished by combined chlorine residual. In 6 percent of the data, the chlorination breakpoint was reached and free chlorine residual produced. However, it was determined that breakpoint chlorination is almost never necessary for achieving satisfactory disinfection and that adequate disinfection of lagoon effluents can be achieved with combined chlorine residual in less than ao minutes contact time. As a means of removing ammonia, the theoretical breakpoint curve was found to be of limited applicability for wastewater chlorination. The shape of the breakpoint curve was found to be highly variable as evidence indicates that interactions between chlorine and organic nitrogen influence breakpoint chlorination. Attempts to identify the quality and quantity factors which determine the shape of the breakpoint curve in wastewater were largely unsuccessful due to insufficient data and the complex nature of breakpoint reactions in wastewater.
Sulfide
During certain periods of the year, when ice covered the lagoons, it was found that up to 1.8 mg/l sulfide was produced in secondary lagoon effluent. Under these conditions, up to seven times more chlorine dose was required to produce the same chlorine residual resulting
114

during other times of the year. It was determined that chlorine reacts with hydrogen sulfide according to the following reactions.
HOCI + H2S .... H2S04 + 4HCI ................ (1) moci + H2S HCI + H20 + S .............. (2)
For sulfide concentrations between 1.0-1.8 mg/I it was determined that 3.6 moles of chlorine were required for each mole of sulfide oxidized. Sulfide production in the lagoons continued until shortly after spring overturn, when sulfide concentrations quickly disappeared. Close surveillance of chlorine doses and residuals must be maintained during this period.
Suspended Solids
In evaluating interactions between chlorine and suspended solids (SS) (mostly composed of volatile suspended solids (VSS)) it was found that increases in SS do not necessarily coincide with increases in chlorine demand. Regression analyses performed between applied chlorine dose and total chlorine residual for varying ranges of SS were inconclusive, largely because of seatter in the field data. However, it was observed that chlorine does have some effect on SS concentrations. From field data, reductions in SS of up to 40 percent were observed following chlorination. However, accumulations of solids in the contact tanks were also observed, indicating that a large portion of SS reduction was the result of settling.
. Laboratory tests were conducted on algae suspensions to determine if some reduction of SS was caused by chemical interaction with chlorine. The results, as shown in Figure 3, do indicate reductions of SS, along with increases in turbidity, with increasing chlorine doses. These changes are probably the result of chlorine oxidizing suspended solids into soluble material and breaking large particles into smaller ones. The same tests, performed on solids suspensions not compound of algae, did not show these trends. This indicates that changes in SS are determined by the composition of the material in suspension, as well as by concentrations of SS and chlorine.
60
::: 50
'" E ~ 40
~ o w 30 o Z W Q.
'" ~ 20
'0
o
~\ \\
\\ \ \ 55
\\\----~=--=--:::::;..--:!===:=-":= . .-::. -=--~---+ \ --: \..--_ . .--
-------------------,---------- Do ... 4.2:3 flI,9:11
--- Dos. • IS.S mi" -,- Do •• • SO.7&m911
15 30 45 60 75 90 '05 '20
TIME (Minu!es)
20
Figure 8. Effects of chlorine on SS and turbidity (April 9·10, 1976).
Chemic:al Oxypn Demand
In considering the chlorination of waste stabilization lagoon effluent, concern has been expressed that the lysis of algae cells would cause an increase in chemical oxygen demand (COD). Results of laboratory and field studies indicate that chlorine has little, if any, affect on total COD. However, in laboratory studies using algae suspensions, it was found that increases in soluble COD were produced with increasing concentrations of total chlorine residual for contact periods of up to two hours. The same trends were not observed for field data using total chlorine residual. However, when only data involving free chlorine residual was evaluated, increases of soluble COD were observed for unfiltered effluent. The correlations between changes in soluble COD (SCOD) and free chlorine residual are given in Figure 4. The same trend, however, was not observed for filtered data, probably because of lower SCOD concentrations initially and fewer data points.
Chlorine Demand
The level of coliform reduction expected for a given chlorine dose is determined by the chlorine residual remaining after a specified contact period. The chlorine residual is determined by the chlorine demand exerted by a particular quality of lagoon effluent. For this study, the chlorine demand was generally found to be almost 50 percent of the applied chlorine dose. The principle exception to this was observed during periods of sulfide production when the chlorine demand was much higher. In evaluating chlorine demand, it was observed that the demand increases with increasing contact time. It was also observed that for a given chlorine dose, less demand was exerted by filtered effluent than by unfiltered effluent, as illustrated in Figures 5 and 6. This can be attributed to the removal of chlorine demanding material as a result of filtration. Generally, it was determined that the exertion of chlorine demand can be expressed as a function of total chemical oxygen demand.
.'O,------r-----.------.-----.------.
... ... .. ,
~ ·6
.§ a o u 4 -6: •• ..
, ,
EQuOlion of line
Y~4,692X-2:.948
R·.54i'
.'0-1-------,-----,-.----.---.-------1
FREE CHLORINE RESIDUAL (mgll)
Figure 4. Changes ,"n soluble COD when free chlorine resid:ual is present in unfiltered lagoon effluent.
115

Disinfection
As expected, the field data shows that increases in total chlorine residual produce increased total and fecal coliform reductions for both filtered and unfiltered lagoon effluent. Statistically significant reductions in coliform concentrations were also observed with increasing chlorine contact times. It was also found that less total chlorine residual was required to produce a given level of disinfection for filtered effluent. On the average, the chlorine residual required for a given level of disinfection was 42 percent less for total coliform and 23 percent less for fecal coliform in filtered effluent as compared to unfiltered effluent. As an example, a comparison between the chlorine residual required at different times for total coliform reduction in both filtered and unfiltered lagoon effluent is presented in Figures 7 and 8. Similar trends were observed for fecal coliform reduction.
15...,-----,--------r------.------,
::: .. .s ...J '0 ... 5 in '" '" ... z
~ :I: o • ...J
~ g
-- 11.$ MIN. COfrIlACT nIAE. R='" ----- 3$.0 ~ .. ... R" 9J3 _.- 4$,6 .. .. • FlO' •• '2
'. '0
APPLIED CHLORINE DOSE (",gil)
Figure 5. Summary of total chlorine residual remaining after application of chlorine dosage using filtered lagoon effluent at various chlorine conUJct times.
15,-----r----.--~--_.---------._--~
::: ... .s ...J .. '0 :> Q q; ... 0:
w z 0: g '" t.>
...J
~ g
-- 17$IIIIN. CONTAt' 11~E. If" 847 _____ ~$O .. ., ".1'1'': !!Ill
_._ 49.6 ~ m • R= eZl
0~---_,----r------_.--------r_------4
'. '4 '0 APPLIED CHLORINE DOSE (",gm
Figure 6. Summary of total chlorine residual remaining after application of chlorine dosage using unfiltered lagoon effluent at various chlorine contact times.
116
Desfp. and Operation Curves
The data derived from this study was used to develop a mathematical model, largely based upon kinetic rate expressions. The model was then used to construct a series of curves to aid in the design and operation of lagoon effluent chlorination facilities. Referring to Figures 9 through 15, an example may best illustrate how these curves are to be applied.
Assume that a particular lagoon effluent is characterized as having a fecal coliform concentration of 10,000/100 mI, 0 mg/l sulfide. 20 mg/l COD (TCOD), and a temperature of 50 C. If it is necessary to reduce the fecal coliform counts to lOO/lOOml, a combined chlorine residual sufficient to produce 99 percent bacterial reduction must be obtained. If an existing chlorine contact chamber has an
o.0-.c-----.----.------,------.,.-------.
-- 11! MIH CONTACT TI"E.Jt~_92:2 - - - '$0 " .. ", "".939 -.- 496" :' ,R:Ji08
·'0
-'0
-.O-j----_,----r--->.----'-...,------,.-----4
TOTAL CHLORINE RESIDUAL (m~l!)
Figure 7. Summary of total coliform removal efficiency, using filtered lagoon effluent, as a junction of total chlorine residual at various chlorine contact tim~s.
0.0 "IC""-------,--------.-------,-----,.-----,
-- 17$ MIN (:OfITAC7 nMe:, A; .• ,& - - - ,,~U) • .. ... R~ ."5 - . - "96 " .• A~ e2S
-10
-." o ~ z .; 9 -'0
-40
'0
TOTAL CHLORINE RESIDUAL (mgl!)
Figure 8. SUmmary of total coliform removal efficiency, using unfiltered lagoon effluent, as a junction of total chlorine residual at various chlon'ne conUJct times.

Z " 0 ~ (l)
9
5.0
4.0
3.0
2.0
1.0
No FECAL ::. IO~IOO ml
No iOTAL ~ 'O~[OO ml
I • FECAL COLIFORM
A TOTAL COLIFORM
CombitUld Chlor4ne Residual 1.5 mg/Y
I /.
. /
/ /
/
/
/ /
O~--~~--~~--~3~O~---+'~---+'~--~
TIME (Minutesl
Figure 9. Combined chlorine Tesid:ual at 5°C for col:iform = 1(/1/100 mL
average residence time of 30 minutes, the required chlorine residual is obtained from Figure 9. A 99 percent bacterial reduction corresponds to log (No/N) equal to 2.0. For a contact period of 30 minutes, a combined chlorine residual of between 1.0 and 1.5 mg/l is required to produce that level of fecal coliform reduction. Upon interpolating, the actual chlorine residual is determined to be 1.30 mg/1. This is indicated by part 1 in Figure 9.
Going to Figure 10, it is determined that if a chlorine dose produces a residual of 1.30 mg/I at 5OC, the same dose would produce a residual of 0.95 mg/l at 2OOC. This is because of the faster rate of reaction between TCOD and chlorine at the higher temperature. This is indicated by point 2 in Figure 10. For an equivalent chlorine residual of 0.95 mg/l at 200C and 20 mg/l TCOD, it is determined from Figure 11 that the same chlorine dose would produce a residual of 0.80 mg/l if the TCOD were 60 mg/1. This is because higher concentrations of TCOD increase the rate of chlorine demand. Point 3 in Figure 11 corresponds to this residual. The chlorine dose required to produce an equivalent residual of 0.80 mg/I at 200C and 60 mg/I TCOD is determined from Figure 12. For a chlorine contact period
117
of 30 minutes, a chlorine dose of 2.15 mg/l is necessary to produce the desired combined residual as indicated by point 4 in Figure 12. This dose will produce a reduction of fecal coliform from 10,000/100 ml to 100/100 ml within 30 minutes at 50 C and with 20 mg/l TCOD.
If, in the previous example, the initial sulfide concentrations was 1.0 mg/l instead of 0 mg/l, it would be necessary to go directly from Figure 9 to Figure 13. Here, a chlorine residual of 1.30 mg/l at a TCOD of 20 mg/l and a temperature of 50 C is converted to an equivalent chlorine residual of 1.10 mg/l for a TCOD of 60 mg/I.
This is represented by the point 5 in Figure 13. Going to Figure 14, which corresponds to an initial sulfide concentration of 1.0 mg/I, it is determined that a chlorine dose of 6.65 mg/I is necessary to produce an equivalent chlorine residual of 1.1 mg/I after a contact period of 30 minutes. Point 6 in Figure 14 corresponds to this dose. The sulfide remaining after chlorination is determined to be 0.44 mg/l from Figure 15 as indicated by point 7.
SUMMARY
From this study it was determined that disinfection of waste stabilization lagoon effluent can generally be achieved with relatively low doses of chlorine and in contact times of less than 50 minutes. The chlorine demand was found to be less than reported in other literature during most of the year. Generally, it was found that the chlorine demand was about 50 percent of the applied dose during all times of the year except When hydrogen sulfide was produced. During that period. the chlorine demand was found to be as high as 85 percent. Combined chlorine residuals of between 0.5 to 1.0 mg/l were found to be adequate in reducing fecal coliforms below the discharge standard of 200/100 ml. This residual is produced by a chlorine dose of between 2-3 mg/I, except during periods of hydrogen sulfide production when a dose of 7-8 mg/l is required.
Chlorination of these algae laden waters was accompanied by few adverse effects. Soluble COD was observed to increase in the presence of free chlorine residual. Increases in turbidity and redu~tions in SS were also observed for high chlorine doses. However, it was rarely necessary to chlorinate at high enough doses for these responses to have any major repercussions. Breakpoint chlorination was observed to be of minimal importance in providing adequate disinfections. Filtering of lagoon effiuent through intermittent sand filters prior to chlorination was found to reduce chlorine demand and enhance disinfection efficiency.
REFERENCE
APHA. 1971. Standard methods for examination of water and wastewater. 13 ed. American Public Health Association, Inc. 874 pages.
Collins. Harvey F .• Robert E. Selleck, and George C. White. 1971. Problems in obtaining adequate sewage disinfection. Journal of the Sanitary Engineering Division of ASeE. 97(SA5J:649-562.

3.5
3.0
-, 01 .§ 2.5
..J
~ ~ 2.0 a:
!.i! ga:
1.5 J: u Q
.~ en 1.0I4--.... ___ --,~~:,;..:::,('
8 ®
0.5
4.0 4.5
COMBINED CHLORINE RESIDUAL AT TEMP I (mglll
Figure 10. Conversion of combined chlorine residual at Temp 1 to equivalent residual at 2ooC.
3.5
3.0
-, tit ! 2.5
...J
~ iii l:! 2.0
w z Ii 9 1.5 J: (..)
Q W z iii 1.0 :::i! 8
® Q5
COMBINED CHLORINE RESIDUAL AT TCOD f AND TEMP=20° C (mgll)
5.0
Figure 11. Conversion of combined chlorine residual at TCODland 200C to equivalent residual at 200C and TCOD = 60 mg/l. .
118

5.0
TIME (Minutes)
Figure If. Determination of chlorine dose required for equivalent combined residuals at TCOD = 60 mgll and Temp. = fooC.
3.'
'.0
~ .§. 2.5
~ e ~ 2.0 II:
'" i!f
'" g I., '" u a ® '" i!f
1.0 .. :0 8
M
<.0 '.0 COMBINED CHt.ORrNE RESIDUAL Ai TeOD I ANO 'TEMP f 5\1 C 1.m9/11
Figure 18. Conversion of combined chlorine at SOC and TCODI to equivalent residual at SOC and TCOD = 60 mg/l.
119
4.0
Figure 11,. Determination of chlorine dose required when S= = 1.0 mg/l, TCOD = 60 mg/l, and Temp. = SOC.
Z.O
'.0
... 1.&
1l' w 1.2 0 u: ..J :> <I)
0.8
0.0 (j)
B 10 12 14 16 ,6 CHLORINE DOSE (mgll)
Figure 15. SU1fide reduction as afunction of chlorine dose.
20

Deaner, David G. Undated. A procedure for conducting dye tracer studies in chlorine contact chambers and to determine detention times and flow characteristics. Technical Paper, Bureau of Sanitary Engineering, California State Department of Publie Health.
Dinges. Ray and Alfred Rust. 1969. Experimental chlorination of stabilization pond effluent. Public Works. 100(8):98-101.
Echelber~er. Wayne F., Joseph L. Pavoni, Philip C. Singer. and Mark W. Tenney. 1971. Disinfection of algal Jaden waters. Journal of the Sanitary Engineering Division of ASCE. 97(SA5):721·780.
Han. Leonard W. 1972. Kinetics of chlorine disinfection in an ecosystem. Journal of Sanitary Engineering Division of ASCE 98(SA5):183-194.
Kolhandaraman. V. and R.L. Evans. 1m. Hydraulie model studies of chlorine contact tanks. UWPCF. 44(4):625.635.
Kott. Yehuda, 1971. Chlorination dynamics in wastewater effluents. Journal of the Sanitary Engineering Division of ASCE. 97(SA5):647-659.
Kott, Yehuda. 1978. Hazards associated with the use of chlorinated oxidation pond effluents for irrigation. Water Research 7:858-862.
Marske. Donald M. and Jerry D. Boyle. 1978. Chlorine contact chamber design-a field evaluation. Water and Sewage Works. 120(1):70-77.
Oria Research Incorporated. Undated. Determination of total sulfide content in water. Application Bulletin No. 12. Oria Research. Inc. Cambridge, Massachusetts.
White, G. Clifford. 1978. Disinfection practices in the San Franeisoo Bay area. UWPCF. 46(1):89-101.
Zillieh, John A. 1972. Toxicity of combined chlorine residuals to freshwater fish. JWPCF 44(21:212-220.
120
Moyno® pumps what others can't Moyno® Industrial Pumps handle products that stop other pumps cold. Feed or transfer fluid corrosives, raw sewage, grease, sludge, abrasive slurries. filter cake, solids to 1 Y2" d.-almost any low or high viscosity industrial product or waste. On-site maintenance and repair. Metering capability, self-priming, excellent vacuum characteristics, capacities to 1200 GPM, pressures to 1000 psi. Modern Equipment Co., 740 W. 1700 South, Suite 3, Salt Lake City, Utah 84104. Phone 801-972-3607.
~ ~~F?u!~~a~i~X!:~

Performance Evaluation ofa Seven Cell Lagoon System for· BOD5, SS, and Fecal
Coliform
RolpA E. Swiss, James H. Reynolds, Christine A. Macko, E. Joe MiddlePwookB*
INTRODUCTION
Wastewater stabilization lagoons have provided aceeptable, low eost, efficient wastewater treatment for nearly 5,000 eommunities in the United States. However, with the implementation of the Water Pollution Control Amendments of 1972 (PL 92-500) stringent secondary diseharge standards have been established. It is possible that waste stabilization lagoon systems may not be capable of satisfying these new discharge requirements. At present. very little data exist whieh adequately deseribe the yearly performanee of waste stabilization lagoon systems.
The general objective of this study was to determine the yearly performanee of a seven eell facultative waste stabilization lagoon system treating domestie wastewater from a eommunity with a population of 471 persons and to compare this actual performance with existing federal diseharge standards, State of Utah diseharge standards, eriteria used to design the lagoon system and to evaluate existing design equations.
Twenty-four hour eomposite samples of the raw sewage influent to the lagoon system and the effluent from eaeh pond in the system were eollected twiee each week for approximately 13 months. In addition, these same samples were collected for four 30 eonsecutive days (onee each season) during the same 13 month period. The samples were analyzed for biochemieal oxygen demand (BODij) and suspended solids. Fecal eoliform and bacteria were monitored with grab samples. In addition, influent and effluent daily flowrates, air temperature, wind, evaporation, and solar radiation were reeorded.
The results indieate that the system did not exceed the federal biochemieal oxygen demand requirement of 30.0 mg/l at any time during the study. However, it failed to meet the 85 percent biochemieal oxygen demand (BOD5) removal requirement 4 of the 13 months studied. The system also satisfied the State of Utah biochemieal oxygen demand requirement of less than 10.0 mg/l 8 of the 13 months studied. The system was able to meet the federal suspended solids requirement of less than 30.0 mg/l 10 of
·Ralph E. Swiss is Research Assistal\t. Utah Water Research Laboratory; James H. Reynolds is Assistant Professor. Environmental . Engineering Division: Christine A. Macko is Research Assistant. Utah Water Research Laboratory; and E. J. Middlebrooks is Dean. College of Engineering, Utah State University.
the 13 months studied. It also satisfied the State of Utah suspended solids diseharge requirement of less than 10 mg/18 of the 13 months studied. However, it failed to meet the federal 85 percent suspended solids removal requirement 5 of the 13 months studied. The system never exeeeded the federal or State of Utah fecal eoliform bacteria diseharge standard.
In general, the loading on the lagoon exeeeded the criteria used to design the system. Application of the data to existing design equations indicated that the equations were not adequate to predict overall performanee.
ACKNOWLEDGEMENTS
Special thanks is given to the mayor of Corinne, Utah and his staff for their help in the conducting of this study.
This study was conducted in fulfillment of Environmental Protection Agency Contract Number 68·03·2060.
PROCEDURES
Study Location
The study was conducted at the Corinne Waste Stabilization Lagoon System. Corinne, Utah. The City of Corinne is located in Box Elder County in the Northwestern portion of Utah. The community has a population of 471 persons (1970 Census) and no major industry. It is predominantly a rural farming community with a few residents eommuting to surrounding industries outside the Corinne area.
Lapon System
The Corinne City Wastewater Lagoon System was construeted during 1970 and began discharging in the spring of 1971. A flow diagram of the system is shown in Figure 1. The facility eonsists of seven facultative cells conneeted in series. None of these cells are meehanically aerated and comminution is the only pretreatment prior to the raw sewage entering the primary eell.
The system was designed aeeording to State of Utah requirements for waste stabilization pond design in 1970 (Sudweeks, 1970). The original design ealeulations were based on a design population of 700 people, a design flowrate of 265,000 liters/day (70,000 gal/day), assuming a raw sewage strength of 0.077 kg BODp/person/day (0.17 lbs BOD5/person/day) and a flowrate of 378.5 liters/person/day (100 gal/person/day). The design organic load
121

was 36.2 kg BOD5/ha/day (32.2 Ibs BOD5/acre/day) with a winter theoretical total hydraulic detention time of 180 days. Thus, the total surface area of the system is approximately 3.86 ha (9.53 acres). The average depth of all the ponds is approximately 1.22 meters (4 ft).
The comminutor is located at a pump lift station located approximately 152.4 meters (500 feet) from the primary lagoon. Also located at the pump lift station is the influent flow recorder. The influent flow meaning device is a 20.32 em (8 inch) Palmer Bowlus Flume coupled to a Stevens Model 61-Rl continuous flow recorder.
The effluent flowrate from the final pond (final system effluent) was monitored with a 45 degree V-notch weir coupled with a Stevens Model 61-R continuous flow recorder.
Sample Collection and Analysis
The location of each sampling station is shown on Figure 1 and described in Table 1. Automatic 24-hour
tx.eupold and Stevens, Inc., Box 688, Beaverton, Oregon.
EFFLUENT
17'\ SAMPliNG \.!..I STATION
II ® 0.34 Hectares 0.405 Hectores
(0.84 Acres) (1.00 Acres I
o :lZl m I
0.405 Hectares 0.405 Hectares 1.49 Hectares (LOO Acres) (1.00 Acres) (3.69 Acres)
0.405 Heetores 0.405 Hectares (1.00 Acresl 0,00 Acres)
Figure 1. Flow diagram of Corinne City Wastewater Lagoon System.
composite samplers were located at Stations 2 through 7. A flow proportional 24-hour composite sampler was located at Station Number 1 (raw sewage influent).
Sampling began January 23, 1975 and continued until January 31, 1976. Samples were collected every third day on a rotating schedule except for a 30 day period each season when samples were collected daily for 30 consecutive days. All samples were collected between 5:00 a.m. and 10:00 a.m. At the Utah Water Research Laboratory, Logan, Utah, the composite samples were analyzed for BOD5' and suspended solids. Grab samples were substituted for the composite samples when the automatic composite samplers failed to function properly. This occurred on less than 10 percent of the samples.
All chemical analyses performed at the UWRL and by the EPA laboratory followed the methods and procedures described in Methods for Chemical Analysis of Water and Wastewater (EPA, 1974).
In addition to the composite samples, grab samples for fecal bacteria analysis were collected at each station. Bacteria samples were analyzed at the UWRL for fecal coliforms using the membrane filter technique. All analyses were performed according to the methods described in Standard Methods (1971). The methods and media used are tabulated in Table 2.
All samples were transported from the study site to the Water Quality Laboratory, Utah Water Research Laboratory, Utah State University, Logan, Utah. Transportation required approximately 45 minutes, all samples were transported in their collection containers and shielded from sunlight. The bacterial samples were iced during transportation.
Meterologieal Data
Precipitation, wind speed, temperature (maximum, average, minimum), pan evaporation and solar radiation (total incident radiation) was collected at weather stations near Corinne and published in Climatological Data (NOAA, 1975, 1976). All information except that relating to evaporation and solar radiation was obtained from the Corinne reporting station located 1.6 kilometers (1 mile)
Table 1. Description of sampling stations for Corinne City Wastewater Lagoon System.
Sampling Station Number
2 3 4 5 6 7 8
Station Description
Raw wastewater influent to system; pump lift station (a totalizer flow meter is located at this pain t)
Effluent from CellI Effluent from Cell II Effluent from Cell III Eflluent from Cell IV Effluent from Cell V Effluent fr0111 Cell VI Effluent from Cell VII and also final effluent from the Lagoon System (a
totalizer flow meter is located at this point) ,
122

from the treatment facility. Evaporation data were furnished by the Bear River Refuge reporting station located 16 kilometers (10 miles) from the study site. Solar radiation data were obtained from the solar radiation station, located at Utah State University in Logan, Utah, 82 kilometers (20 miles) from the Corinne site.
HydrauHe Data
Flow rates and total volumes of wastewater entering and leaving the lagoon system were recorded at Stations Number 1 and Number 8. Flow patterns and detention times were determined by injecting rhodamine B dye into the influent of each pond and monitoring the effluent of each pond for dye concentration.
Dye samples were analyzed on a Turner! model 111 fluorometer using a 568 /lm primary filter and a 590 /lm secondary filter. The meter was calibrated according to procedures outlined by Buttes (1969). Dye dispersion curves were plotted using the temperature-corrected readings. These curves were analyzed using the techniques provided by Marske and Boyle (1978).
Data Analyses
Statistical calculations were performed according to methods provided by Sokal and Rohlf (1969).
RESULTS AND DISCUSSION
SeasoaaJ Performance
General
All of the ponds are designated by pond number. The data for a given pond represent the quality of the effluent water from that particular pond. Pond Number 7 is the fmal pond in the system, its effluent is, therefore, the effluent for the entire system and is generally designated as "Effluent" rather than "Pond 7." "Influent" represents the incoming raw sewage wastewater from the City of Corinne.
Hydraulic perf01'1/'Ul,nce
The average monthly influent and effluent daily flowrates are recorded in Table 3 and shown graphically in Figure 2. The average monthly daily flowrate varied from 1,029,645 liters/day (272,083 gal/day) in October to 253,667 liters/day (67,019 gal/day) in December. The yearly average influent daily flowrate was 693,724 liters/day (188,282 gal/day). This represents a per capita hydraulic load to the system of 1472.9 liter/person/day (5,574.93 gal/person/day). The yearly average daily flowrate exceeds the hydraulic design flowrate by 2.62 times.
Dye studies were conducted on each lagoon to determine the actual hydraulic residence· time in the system. The results are recorded in Table 4. The actual total hydraulic residence time for the system was found to
~rner Fluorometer, Model Ill, by G. K. Turner Associates, Palo Alto. California.
123
be 88.3 days which is 49.1 percent of the 180 day requirement of the State of Utah. These dye studies were from December 1975 to July 1976 and thus represent the condition existing at that time. .
In summary, the hydraulic load to the lagoon system exceeded the design hydraulic flowrate by 2.62 times. This excessive hydraulic loading is most likely due to
Table !. Metlwd8 and media 1I.8ed for the bacteriological analyses.
Method Media
(ManufaCWfer) Die-off/Lagoon Study
Fecal coUforms Standard Methods (APHA. 1971) m-FC broth Die-off and Lagoon Study Section 408 B (BBL 11365)
Table S. Monthly average influent and efluent daily flowrate in liters per day.
Month
Januaty 1915 February March April May June July Augurl September October November December January 1916
Average lJteu Jt :1.18.$ .. pUont
Influent ~d.y
408,941 799,695 929,051 182,083 638,222 665,630 816,413 951,153 862,348
1,029,645 489,139 253,661 325,811
693,124
Effluent J/day
51,129 196,305 140,698 503,394 335P14 455,113 296,612 265,310 296,490 294,954 530,831 225,192 116,103
336P31
Table 4. Retridence times.
Dye
Pond No. J)ye Study Date Theoretical Actual Dispersion Res.idence Time Residence Time Chart
Figure No.
12.8.15/1·30·16 77.2 days 35.1 day, A·l 5·10-16/6-23·16 9.1 days 8.5 days A·2 6-23.16/1·31·16 9.1 days 6.1 days A·3 5·10·16/6-23·16 lOA days S.l days A-4 6-23.16/1·31·16 11.3 days 9.0 days A·5 5· I 0-16/6-2J.16 12.2 days B.8days A<i 6-2J.16/1·31·16 16.4 days 12.1 days A·1
Nato: Theo«Iti(;IJ ~l'Ice times calCulated ftorn no..., (or the !Wlte pe:rioru durin8 11M yw 197.5. Conection WI.! made for enpo-nUan dIet( on tio'IIfJ In lho Ialter ponch..
,.. C
~
W ~ tr 3l: 0 .J u..
~ g IJJ t!) <l: tr IJJ
:it ~ :c f-Z 0 ::;;
Com:clion 'If'd adthd 10 t.rn poDd fw- ~radob.
1,000
900
800
700
600
500
400
300
200
100
o----GINFLUENT
I::t:- --6EFFLUENT
1\ 1\ I \
1\ \ I \ A . \ / \ / \ / ~ \ / \ I
I }){ I
t /
/
Jon.FMAM '75
b... __ t.-_" ' -k .
-ill.
A SON 0 Jon. '76
MONTH
Figure !. Monthly average influent and effluent daily jlowrate.

groundwater inmtration from agricultural irrigation and stormwater inflow into the sewage collection system. The yearly average effluent flowrate from the system is only 48.4 percent of the yearly average influent to the system.
Biochemical oxygen demand (BODS)
The monthly average biochemical oxygen demand (BOD5) performance for the lagoon system is reported in Table 5 and illustrated in Figure 3 for each pond in the system.
100
.. .0
eo
" PO~.' -
70
., 60
40
30
10
Tl~E (frlllO""\I)
Figure 8. Monthly average biochemical oxygen demand (BODS) performance of the Connne Waste Stabilization Lagoon System.
The influent monthly average BOD5 ranged from a maximum of 139.98 mg!1 to a minimum of 40.26 mg!1, with a mean of 74.62 mg!1. During the ~ter period, when the influent flowrate was low, 2.5 x 10 l/day (0.067 MGD), the BOD5 concentration of the influent was high (121 mg!1). The summer period was characterized by a diluted influent BOD5' This trend of summer dilution and winter concentration of the influent flow was evidenced in many of the parameters.
Spring thaw was accompanied by hydraulic mixing in all of the ponds. This period, February to May. was characterized by rising influent flows with a corresponding dilution of the influent BOD5' and a resuspension of winter-settled organic materials by the overturning pond water. The monthly average effluent BOD5 concentration of Pond Number 1 was much higher (57.3 mg!1) than was the monthly average effluent BOD5 concentration of the other ponds (see Figure 3). The other six ponds had average monthly effluent BOD5 concentrations ranging from 26.5 mg!1 (Pond Number 7) to 35.5 mg!1 (Pond Number 5). Summer temperatures and the uptake of spring-mixing·generated organics supported an increase in treatment efficiency resulting in a marked drop in the BOD5 concentrations of all the pond effluents except the effluent from Pond Number 1. Late summer and the end of the irrigation season caused the influent to become more concentrated. Following this concentrating was an increase in the BOD5 level of the effluents from all of the ponds except Pond Numbers 6 and 7. Effluent BOD5 concentration from all the ponds continued to rise throughout the fall until the colder weather caused the ponds to destratify and mix again. This fall overturn increased the effluent BOD5 rise which was then followed by a sharp decline in effluent BOD5 concentrations (see Figure 3).
Statistical analysis of the data indicated that the effluent BOD5 concentrations from Pond Numbers 5, 6, and 7 were statistieally alike. This would indicate that no significant difference in BOD5 treatment is achieved by Pond Numbers 6 and 7 over that accomplished by Pond Number 5. However. the actual yearly mean concentration for Pond Number 7 was 8.91 mg/l, a decrease of 6.82 mg/l over the 15.73 mg/l yearly mean concentration for Pond Number 5. Also, Pond Number 7 was the only pond which remained below the federal standard (30 mg!1) throughout the entire year.
The only pond to comply with the Utah State standard of 10 mg/l was Pond Number 7. However, it exceeded the
Table S. Monthly average biochemical oxygen demand (BODS)of the C01'i1me Waste Stabilization Lagoon System.
TOTAL 900('S) C "GIl) "OHrKlY AY£RA~ES
"O"T" I H~lU£HT PO H£) J POND 2 PONO 1 POHO • POND'S pOHO " £HlUE'"
JU-" 1l1.~. U.21 ZZ.'SZ 19.5~ a.13 '.Z I ~.I' 4.l ~ HB JO"_11 I ft.09 la.'S 1 Z'.or ZZ.,O n.ba n.u &.3? "AR. ~$.JZ ,r.H l~. " B.1l 31.l' 1 !.Q8 H.$r Z4.zr ~P/l. 4&.ft" 3 ] •• " H.fto H.3' 10.?f l~.'S Jl.B l£.,.1
"AY 61.52 H.ez 2$.0~ zs.n ZS.lS 2,.09 ZQ.9T 19 .. 00 JUHE 'H.8Z J(l.22 J9.H 10.49 10.10 II.e,> 8.2 J 1 .. 91 JULY 40.2& Z8.60 13.0' n.ll ,.n ' .. 2:& ~.Zl l.1,> AU •• 38.21 14.21 25.5' 2~.H 4.l~ l.'>l l.H 1.96 S[P. 92.\. "l4.94 35.11 30.,,0 15.5& 2.19 l.1I 1.40 OCT. ".1" 11.'S6 36.Z0 14.U 2'.17 5.B I.~I 1.89 "OY. n." so." 26.40 27.74 27.76 l'>.ez S.U .I.U DEC. 01 •• 2 19.00 16 ••• 11.08 11.6Z I~.H 7.04 ~.H
JAII-76 111'.9 J 111.62 13.S9 2t.S~ H.lt 19.e& ".2? 7.H
124

Utah State standard during the spring overturn period for nearly four months (February to May 1975). All of the other ponds exceeded the state standard for longer periods of time.
The BOD5 treatment efficiency ranged from 47.7 percent during April 1975 to 97.8 percent during October 1975. The yearly average treatment efficiency was 88.06 percent. The system failed to satisfy the 85 percent removal requirement of PL 92-500 during four of the 13 months studied. However, as discussed earlier, the system never exceeded a final effluent BOD5 concentration of 30 mg/I. The ability of the system to satisfy the 85 percent removal requirement appears to be more dependent on the raw sewage influent BOD5 concentration than on the final system effluent BODS concentration.
The organic loading on the primary cell (Pond Number 1) of the system is shown in Table 6. The organic load ranged from IS.1 kg BOD5/ha/day (13.4 lbs BODS/acre/ day) to 60.2 kg BODS/ha/day (53.6 lbs BODS/acre/day). The yearly average organic load to the primary cell was 33.6 kg BOD5/ha/day (29.9 lbs BODS/acre/day). The system was designed for an organic load of 36.2 kg BOD5/ha/day (32.2Ibs BOD5.(acre/day). On a yearly basis the system was not organically loaded beyond the design capacity. However, during three of the 13 months studied,
Table 6. Average monthly organic loading rate on the primary ceU (PO'TId Number 1) of the Carine Waste Stabilizatit.m System.
Month
January 1975 February March April May June July August September October November December January 1976
Yearly Average
kg/ha/day x 0.89 ~ Ibs/acre/day
Average Organic Loading (kg/ha/day)
33.4 57.3 36.2 25.6 26.3 23.1 23.6 24.6 53.5 60.2 27.8 15.1 30.6
33.6
the organic loading rate did exceed the design capacity. Each of these three months (February. September, October) were during periods of the year when the lagoon system should have been less able to assimilate the overload. However, during each of these months the final effluent BODS concentrations were less than 10 mg/I. Thus, it appears that the 36.2 kg BODS/ha/day (32.2 lbs BOD5/acre/day) used to design the system was at least adequate and may be somewhat conservative.
In summary, the BODS influent to the Corinne system was effectively reduced to levelsaeceptable to the federal standard (i.e. 30 mg/l), and to the state standard (10 mg/I) the majority of the time. Effluent BODS levels were subject to mixing conditions both in spring and fall causing all pond effluents except Pond Number 7 effluent to reach unacceptable levels. Winter effluent BOD5 concentrations were. acceptable with respect to the federal and state standards. These concentrations were also lower than effluent BOD5 concentrations during other portions of the year. Finally, statistical analysis showed little improvement in BOD5 removal beyond that attained by Pond Number 5.
Suspended BOIid8 (SS)
The monthly average suspended solids concentration for the raw sewage influent and the effluent for each pond in the system is reported in Table 7 and illustrated in Figure 4.
The monthly average raw sewage influent suspended solids (SS) concentration ranged from 39.12 mg/l in August to 119.76 mg/l in January 1976 with a yearly average of 71.3 mg/I. The raw sewage influent suspended solids concentration was closely related to the raw sewage influent flowrate (see Figure 2). As· the raw sewage influent flowrate increased the influent raw sewage suspended solids concentration tended to decrease. In general, the raw sewage influent suspended solids concentration was less than expected for a typical domestic sewage.
The fmal effluent monthly average suspended solids concentration (Pond Number 7) varied from 2.53 mg/l in September to 179.24 mg/l in April with a yearly average concentration of 33.69 mg/I. The yearly average final effluent suspended solids concentration (i.e. 30.2 mg/l) is somewhat misleading in that during eight of the 13 months studied the monthly average final effluent suspended
Table 7. Monthly average BUBpended BOIid8 per/OT'11tI1.'IWe of each pond in the Corinne Waste Stabilization Lagoon SyBtem.
SUS~["DrD SOLIDS (HG/Ll "OHI~LY AYE'tAGES
MGHTH IHFLOENr PQ ~o I PONO Z po,o;o I PO~D , po,o 5 POND (, (HLlIEN'
.JAN-1~ ".~s 06.10 21.8} H.2J 1'. " 8_71 11_18 '.U FEB 12.82 61.la 49 ... 76 ~,.'" 49.21 SO.TS ZO.H lZ.5J MAR. 7S.H ~ 5.2~ 5J.22 'S7.66 ~8.11 61.66 101.51 13 ..... APR. 5~.7' 68_9& 80_09 37 .. &1 10&.75 119.17 1'>2.0 I IT •• io HH 71.07 7 '.12 71.17 61.31 10.8 t H.03 f.S.01 f. ••• J .JOII( 61.89 'i 5. 81 50.0' l'i.10 1l.11 24.31 12_80 ._11. .JUlT U.~8 '4.14 40.l6 Z& .10 S.99 7.,,> '5 .. "& 1_'2 AUG. 39.1l 86.16 10.51 'i1.~5 5.:n ~.61 3.41 1 •• 6 SEP_ H.l0 9S.1a 100_9' 7 •• 16 Z&.TS 4.54 4.'6 Z.S! ocr. 10&.91 ~5.Z6 8 •• 53 &8.f.0 39.l2 9.16 7.29 S.H hOY. r8.Zl 6&.11 57.95 53.95 ".77 <'3.01) U •• 8Z '>.2(, DEC. 65.0& ?&.76 la.'52 2'>_1l H.16 20.U lZ.80 '.O~ JAII-" 119.lt 16.10 20.63 lZ."1 2i.(,5 3Z.6~ 20.110 16_01
125

solids concentration never exceeded 10 mg/l and in fact, during only three of the 13 months studied did the monthly average final effluent suspended solids concentration exceed 30 mg/l (see Figure 4 and Table 7).
The peak monthly average final effluent suspended solids concentration (179.24 mg/l in April, 1975) occurred during the spring overturn. The effluent suspended solids concentration for all of the ponds in the system increased significantly during this period. Although the same phenomenon occurred during the fall overturn period (November), the increase in effluent suspended solids concentration was not as dramatic as it was during the spring overturn. The influence of the fall overturn was found in the effluent suspended solids concentrations measured by Pond Numbers I, 2,3, and 4. The effluent from Pond Number 1 had the highest fall concentration (95.38 mg/l). A sharp decline was seen in the effluent from Pond Numbers 1 through 4 at the onset of cold weather. The suspended solids concentrations plotted in Figure 4 correspond very closely to the effluent BOD5 concentrations plotted in Figure 3.
Statistical analysis indicated that there was no significant difference (95 percent level) in the effluent suspended solids concentration from Pond Numbers 4, 5, 6, and 7. Thus. statistically, no additional suspended solids removal occurred beyond Pond Number 4. However, inspection of Figure 4 clearly illustrates that Pond Numbers 5, 6, and 7 did provide meaningful suspended
200
"0
TIME {~oIqnth.)
Figure 4. Monthly average suspended solids performance of each pond in the Corinne Waste Stabilization Lagoon System.
126
solids removal during September, October, November, and December. Thus, it appears that the additional ponds did provide a measure of protection during the fall overturn period.
The suspended solids performance of the system with respect to both federal (PL 92·500) and State of Utah requirements is illustrated in Figure 4 and reported in Table 8. The final effluent suspended solids concentration was 30.2 mg/l which is slightly in violation of the federal standard of 30.0 mg/1. However. the federal standard is based on the monthly average effluent suspended solids concenttation and as reported earlier during only three of the 13 months studied was the monthly average effluent suspended solids concentration greater than 30.0 mg/1. Table 8 indicates the suspended solids removal efficiency of the system. The yearly average suspended solids removal efficiency was only 51.47 percent. However, the system failed to remove 85 percent of the raw sewage influent suspended solids concentration during only five of the 13 months studied. The system satisfied the State of Utah's effluent suspended solids standard of 10 mg/l during eight of the 13 months studied. During the summer months (June to September, 1975) of peak algal activity, the final effluent suspended solids concentration averaged 3.3 mg/l. This indicates that algae were not a problem in satisfying discharge requirements during the summer months for this particular system.
Fecal coliform
The results of 12 months of monitoring the fecal coliform die-off in the waste stabilization lagoon system located in Corinne. Utah are shown in Figure 5.
In general, the fecal coliform number in each of the 3 lagoons plotted stayed within two log seales throughout the year. The most noticeable exceptions occurred in January and February under ice cover when the numbers increased by one order of magnitude in each pond. In June. the numbers decreased by one log scale. These effects were most noticeable in the secondary and tertiary ponds. These ponds received relatively stable flows compared to the primary pond which was subject to large variations in flow and influent fecal coliform concentrations.
The two overturn periods were reflected in the fecal coliform counts during March and October. During the
Table 8. Treatment ejficiency of the Corinne Waste Stabilization Lagoon System with respect to BUBpe1Uled solids (SS).
Monthly A ""age SS Treatment
Month Influent Effluent Efficiency (mg/I) (mg/I) (:if,)
Januazy 1975 91.53 9.13 90.0 February U,82 12.53 82.7 March ,75:99 73.69 3.0 April ~.79 179.24 -221.3 May 73.07 64.93 ILl June 61.89 9.36 84.8 July 42.58 3.92 90.8 August 39.12 3.46 91.2 Septemper 44.70 2.53 94.3 October 106.97 3.51 96.7 November 78.21 5.26 93.3 December 65.06 9.02 86.1 January 1976 119.76 16.07 86.6

M 8
first overturn period in early March, fecal coliform counts increased. The period between overturns showed decreased numbers of fecal coliforms with the count increasing during the second overturn period and dropping again afterwards. Increased counts during overturn could be the result of the circulation of organisms which had settled. Increased nutrient concentrations during overturn could also decrease die-off by providing substrates for these organisms. The effects of fall overturn are not readily apparent in the fecal coliform data collected for Pond Numbers 4,5,6, and 7.
The mean monthly fecal coliform bacteria concentration for the raw sewage influent and the effiuent from each pond in the system is illustrated in Figure 5. At no time during the 13 month study period did the final effiuent fecal coliform concentration exceed the federal effiuent fecal coliform standard of 200 colonies/100 ml, or the State of Utah effiuent fecal coliform standard of 20 colonies/100 ml. As Figure 5 indicates, both the federal and State of Utah effiuent discharge requirements for fecal coliform were satisfied after the wastewater had passed through the third pond in the system. The coliform removal in the Corinne system is due solely to natural forces since disinfection of the effiuent is not practicaL
"-~~I,~IFORMS (Colonin /100 ml)
WASTE STABILIZATION BASIN SY$TEM COR~NNE. UTAH
INFLUENT -
POtiO .. I ------
'#2 --• 3
• #4 - - --
.. .,--
. .6-EFFLUENT ---
o • £ "-<II
" ... ~
oS • o $
TIME (Monlhl)
Figure 5. Mean monthly fecal coliform bacteria concentrations of the raw sewage influent and effluent from each pond in the Corinne Waste Stabilization Lagoon System.
Fecal coliform die-off in the 7 cell Corinne system appears to be a function of detention time or cell number. The large primary cell reduces the fecal coliforms by two orders or magnitude. Each of the smaller succeeding cells reduce the count by one order of magnitude. The last 3 cells showed very few fecal coliforms consistently throughout the year (average<2O colonies/100 mI).
Performance Summary
General
All of the parameters examined for the Corinne system were reduced in concentration by the lagoon system. Reduction percentages for the parameters are listed in Table 9. Also included is a recording of the statistically suggested most effective pond number and the corresponding percent reduction in concentration.
On a yearly basis the Corinne waste stabilization system provided 88 percent removal of the incoming BOD5' 51 percent removal of the suspended solids and 99.99 percent removal of the fecal coliforms.
Table 9 also contains the statistical recommended number of ponds in series for effective treatment at the 95 percent confidence level. It can easily be recognized that the maximum number of effective ponds depends on the parameter in question.
All of the parameters examined at the Corinne system showed either direct or indirect affect from the hydraulic mixing forces during the spring and fall of the year. Winter altered the operation of the lagoons and some build occurred in the BODS and SS. However, despite winter conditions effiuent stabilization continued .
Most of the summer period was characterized by low levels for all of the parameters. Fall produced a second hydraulic mixing (fall overturn). Lower temperatures and light levels served to curtail the fall peak and forced an alteration of activity to a winter state. Ice formation on the surface of the lagoons in November and December. 1975, sealed the lagoons until spring thaw and the beginning of another yearly cycle.
In general, the raw sewage influent suspended solids concentrations was less than expected for a typical domestic sewage.
Satisfying federal and State of Utah discharge standards
The biochemical oxygen demand (BOD5) concentration of the final effiuent from the Corinne Waste
Table 9. Performance summary and recommended number of ponds to achieve federal standards (PL 92-500) for the Corin'M Waste Stabilizaion Lagoon System.
Final Total Numbtlr Rcco=~U{j::~&!~onda Pulll'l'1e.# lnfil,l .. nl Effluenl Reductkm of Ponds Emu.ent Reduction
mall mgfl ~ Recomml:nded mill %
- .... 01)----'.-:.62-:----.:"0.9-1 --8.-:.06:-----:--· (r~lyl;~:AAe) (yeIUIY1~".~f;a.) 55 '9.42 3'U9 51.41 36.4!1 47.44 FC 918673. 1.40 99.99 11.40 99.99
'Fe in coloniM/IOO mI.
127

Stabilization Lagoon System never exceeded the federal standard of a 30 day arithmetic mean concentration of less than 30.0 mg/l. or the 7 day arithmetic mean concentration of less than 45.0 mg/I. The monthly average final effluent BODS ranged 1.40 mg/l to 26.53 mg/l. However. it did not satisfy the requirement for 85 percent BODS removal 4 of the 13 months studied. The system satisfied the State of Utah BODS final effluent standard of less than 10 mg/l10 of the 13 months studied.
The suspended solids concentration of the final effluent from the system exceeded the federal standard of a 30 day arithmetic mean concentration of less than 80.0 mg/l 3 of the 13 months studied. The federal standard requiring a final effluent 7 day suspended solids concentration of less than 45.0 mg/l was consistently exceeded during the spring overturn (i.e. March. April. May). However, after the spring overturn period, the 7 days studied was not exceeded. The system satisfied the 85 percent removal requirement of the federal standard 8 of the 13 months studied. In addition. it satisfied the State of Utah 30 day average effiuent suspended solids require· ment of less than 10.0 mg/l 8 of the 13 months studied.
The system never exceeded the federal effiuent discharge fecal coliform bacteria standard of less than 200 colonies/100 ml during the entire study, nor did it exceed the same effiuent standard for the State of Utah even though disinfection was never practiced. In addition, the system never exceeded the State of Utah's total coliform bacteria studied of 2000 colonies/100 ml during the entire study.
CONCLUSIONS
Based on the results of 13 months of the performance of the Corinne Waste Stabilization Lagon System. Corinne. Utah, the following conclusions can be made.
1.
2.
3.
4.
The yearly average daily hydraulic influent flowrate of 693.724 liters/day (183.282 gallons/ day) exceeded the design hydraulic flowrate by 2.62 times.
The actual hydraulic residence time in the system was 88.3 days. This was 49.1 percent less than the 180 day hydraulic residence time required by the State of Utah.
The organic strength of the raw influent sewage was less than a typical domestic sewage. The monthly average influent biochemical oxygen demand (BOD5) concentration to the system ranged from 40.26 mg/l to 139.93 mg/l with a yearly mean concentration of 74.62 mg/l.
On a yearly basis the system was not organically overloaded. However. the organic load did exceed the design organic load of 36.2 kg BODQ/ha/day (29.9 lbs BOD5/acre/day) several tlD1es during the study. The average monthly organic loading on the primary cell ranged from 15.1 kg BODS/ha/day (13.4 lbs BODS/acre/day) to 60.2 kg BOD5/ha/day (53.6 lbs BOD5/acre/day) with a yearly average of
128
s.
6.
7.
8.
9.
10.
11.
12.
13.
33.6 kg BOD5/ha/day (29.9 lbs BOD5/acre/ day).
The final effiuent biochemical oxygen demand of the system never exceeded the Federal Secon· dary Treatment Standards. The monthly aver· age final effluent biochemical oxygen demand (BODS) concentration ranged from 1.40 mg/l in August to 26.55 mg/l in April with a yearly average concentration of 8.91 mg/l.
The ability of the system to satisfy the 85 percent biochemical oxygen demand (BODS) removal requirement of the Federal Secondary Treatment Standards appears to be more a function of the influent BOD5 concentration rather than the effiuent BODS concentration. The system failed to satisfy the 85 percent biochemical oxygen demand (BODo) removal requirement of the Federal Secondary Treat· ment Standards four of the 13 months studied.
The final effiuent biochemical oxygen demand (BODS) concentration satisfied the State of Utah requirement of less than 10.0 mg/l, ten of the 13 months studied.
Statistical analysis indicated that no significant (95 percent level) biochemical oxygen demand (BODS) removal occurred beyond the fifth pond in the seven pond series.
The raw sewage influent suspended solids concentration was less than that expected for a typical domestic sewage. Monthly average raw sewage influent suspended solids concentrations ranged from 39.12 mg/l in August to 119.76 mg/l in January with a yearly average concentrations of 71.3 mg/l.
The final effiuent monthly average suspended solids concentration of the system satisfied the Federal Secondary Treatment Standards ten of the 13 months studied. The monthly average final effiuent suspended solids concentration ranged from 2.53 mg/l in September to 179.24 mg/l in April with a yearly average concentration of 33.69 mg/l.
The ability of the system to satisfy the 85 percent removal of suspended solids requirement of the Federal Secondary Treatment Standards appears to be more a function of the influent suspended solids concentration rather than the effluent suspended solids concentration. The system exceeded this requirement five of the 13 months studied.
The final effluent monthly average suspended solids concentrations satisfied the State of Utah effiuent suspended solids discharge requirement of less than 10.0 mg/l eight of the 13 months studied.
Statistical analysis indicated that no significant (95 percent level) removal of suspended

solids occurred beyond the fifth pond in the seven pond series.
14. The system was very efficient at removing fecal coliform bacteria even though disinfection was not practiced. At no time did the final effiuent exceed the Federal Secondary Treatment Standards or the State of Utah discharge requirement for fecal coliform bacteria. Although fecal coliform bacteria removal continued throughout the system, the monthly average effiuent fecal coliform bacteria concentration of the fourth pond never exceeded 200 colonies/lOO mI.
REFERENCES
APHA. A WW A. WPCF. 1971. Standard methods for the examination of water and wastewater. 18th ed. American Public Health Assoc. 1015 Eighteenth Str., N.W .• Washington, D.C. 20086. 874 pages.
Buttes. Thomas A. 1969. Fluorometer calibration curves and nomographs Journal of Sanitary Engineering Division, Proceeding:,,, ASeE Proc. Paper 6728. 95(SA4):705-714.
Marske. Donald M., and Jerry D. Boyle. 1978. Chlorine contact chamber design/a field evaluation. Water and Sewage Works. p. 70·77.
NOAA. National Oceanic and Atmospheric Administration. 1975, 1976. Clilnatological data, Utah. Environmental Data Service, Asheville. N.C., Vol. 77. No. 1·12; Vol. 78, No.1.
Sokal. R.R .. and F.J. Rohlf. 1969. Biometry. W.H. Freeman and Co .• San Francisco. California. 776 pages.
129
Sudweeks. C.L. 1970. Development of lagoon design standards in Utah. Second International Symposium for Waste Treatment Lagoons. June 23·25. Kansas City. Missouri._
Civil and Environmental Studies
Water and Wastewater Systems
Municipal Planning Highway Design
Bush & Gudgell
bl~~ ~
... salt lake city-mcl< springs-st.george ~

NEW-NEW FROM THE ENERGY-ENVIRONMENT PUBLISHER
Purdue University Industrial Waste Conference Proceedings-$39.95 Chemistry of Marine Sediments-Yen-$24.95 Identification & Analysis of Organic Pollutants-Keith-$27.50 Carbonate Chemistry of Aquatic Systems-Loewenthal-$22.50 Environmental Toxicity of Aquatic Radionuclides-Miller-$26.50 Isotopes of Water-A Bibliography-Summers-$16.50 Biostimulation and Nutrient Assessment-Middlebrooks-$22.50 Environmental Biogeochemistry, 2 vols.-Nriagu-$29.50 Modeling Biochemical Processes in Aquatic Ecosystems-Canale
-$22.50 Physical/Chemical Characteristics of Aquatic Humus-Gjessing-
$14.50 Indicators of Viruses in Water and Food-Berg-$35.00 Water Supply Design-AI-Layla-$22.50 Management of Phosphorus Water Pollution-Porcella-$20.00 Mathematical Modeling of Water Pollution Control-Keinath-
$23.50 Proceedings WWEMA Pollution Conference-Langworthy-$25.00 Disinfection: Water and Wastewater-Johnson-$29.50 Water Resources Instrumentation, 2 vols.-Krizek-$37.50 Manual of Grey Water Treatment Practice-Winneberger-$12.50 land As a Waste Management Alternative-Loehr-$29.50 land Treatment / Disposal Municipal/Industrial Wastewater-
Sanks-$20.00 Nitrogen and Phosphorus-Porter-$24.50 Energy, Agriculture and Waste Management-Jewell-$24.50 Thermal Processing of Solid Waste/Resource Recovery-Wein-
stein-$20.00 Waste Management, Control, Recovery and Reuse-Kirov-$18.50 Modem Methods of Trace Elements Analysis-Pinta-$29.50 The Role of Trace Metals in Petroleum-Yen-$22.50 Handbook of Ventilation for Contaminant Control~McDermott-
$29.50 Air Monitoring Survey Design-NolI-$22.50 Air Pollution Indices-Thom-$14.95 Annotated Canadian Air Pollution-Sparrow-$24.95 International Clean Air Conference, 2 vols.-$29.50 Air Pollution Control and Industrial Energy-NolI-$22.50 Industrial Odor Technology Assessment-Cheremisinoff-$29.50 Respiratory Protection-OSHA/Small Business-Ruch-$12.50 The Concept of Energy-Hoffman-$32.50 The Consumer's Guide to Electric Cars-Wakefield-$9.95 EnvirOlJmentaI Aspects of Nuclear Power-Eichholz-$27.50 Power Generation-NolI-$27.50 Science and Technology of Oil Shale-Yen--$32.50 Introduction to Energy Technology-Shepard-$16.50 The Unsettled Earth-Jones-$7.95 Solar Directory-Pesko-$20.00 Fuels, Minerals and Human Survival-Reed-$12.50 Fusion Reactor Physics-Kammash-$29.50 X-Ray Fluorescence Analysis of Samples-Dzubay-$27.50 Environmental Impact Statements Handbook-Cheremisinoff-
$29.50 The Environmental Control Industry-Leung-$14.95 Environmental Pollutants-Analytical Methods-Gallay-$22.50 Environmental Pollution and Control-Vesilind-$10.00 Environmental Biogeochemistry, Third International Proceedings-
Krumbein
Order NOW-or send for your NEW 1977 CATALOG-with a complete selection of professional level text and reference books from Ann Arbor Science, including energy, environment, engineering, chemistry, and biochemistry .
Statistical Calculations-Middlebrooks-$12.50 Pollution Engineering Practice Handbook-Cheremisinoff-$29.50 Technology and Human Values-Watkins-$l2.50 Economic Impacts of Extended Fisheries-Anderson-$15.00 Leisure and Recreation Places-Cheek-$12.50 Urban-Regional Economic Growth and Policy-Prescott-$12.50 Politics of Shore Erosion-Heikoff-$15.OD Industrial Noise Control Handbook-Cheremisinoff-$29.50 Transportation Noises-Chalupnik-$22.95 Scanning Electron Microscopy of Fertility-Hafez-$l5.00 Peptides-Walter-$34.50 Survey of Modem Industrial Chemistry-Cook-$16.50 Elementary Organic Synthesis-Serve-$10.00 , Principles of Immunohematology-Goudemand-$l6.50 Individual Onsite Wastewater Systerns-McClelland-$22.50 Biochemical Effects of Environmental Pollutants-Lee Drinking Water Quality Enhancement-Pojasek
~~ANN ARBOR SCIENCE ~ PUBLISHERS INC "" P.O. BOX 1425 • ANN ARBOR. MICH. 48106