Proceedings of IAC-MEBM in Budapest 2016
101
Proceedings of IAC-MEBM in Budapest 2016 International Academic Conference on Management, Economics, Business and Marketing in Budapest, Hungary 2016 (IAC-MEBM 2016), November 23 - 24, 2016 ISBN 978-80-906231-4-9 Czech Technical University in Prague
-
Upload
khangminh22 -
Category
Documents
-
view
1 -
download
0
Transcript of Proceedings of IAC-MEBM in Budapest 2016
Proceedings of IAC-MEBM in Budapest 2016
International Academic Conference on Management, Economics, Business and Marketing in
Budapest, Hungary 2016 (IAC-MEBM 2016), November 23 - 24, 2016
ISBN 978-80-906231-4-9
Czech Technical University in Prague

2
Author Index
Eze Benneth Uchenna IAC201611BU005
Kolawole Olabode Olufemi IAC201611BU005
Obawunmi Rasheed Biodun IAC201611BU005
Małgorzata Ćwiek IAC201611BU008
Agnieszka Wałęga IAC201611BU008
Mahmuda Nasrin IAC201611BU009
Siegfried Bauer IAC201611BU009
Md. Arman IAC201611BU009
Danny Kao IAC201611BU012
Joanna Błach IAC201611BU019
Joanna Błach IAC201611BU030
Anna Doś IAC201611BU030
Daria Zhaparova IAC201611BU031
Olivera Gjorgieva-Trajkovska IAC201611BU036
Blagica Koleva IAC201611BU036
Janka Dimitrova IAC201611BU036
Krume Nikoloski IAC201611BU036
Vesna Georgieva Svrtinov IAC201611BU036
Mehtap Dursun IAC201611BU037
Zeynep Sener IAC201611BU037
Guray Gumus IAC201611BU037

3
Reviewers:
Ass. Prof. PhDr. Maria Janesova - Slovakia
(Czech Technical University in Prague)
Mgr. Helena Kratochvilova, DiS. - Czech Republic
(Czech Institute of Academic Education z.s.)
Ass. Prof. Dr. Ioan-Gheorghe Rotaru - Romania
- 'Timotheus' Brethren Theological Institute of Bucharest
Ass. Prof. Souvik Pal - India
(Department of Computer Science and Engg. in Nalanda Institute of Technology)
Ass. Prof. Anjali - India
(Department of Computer Science & Engg, GNIT, Mullana)
Ing. Radek Kratochvil - Czech Republic
(Czech Technical Universtity in Prague)
Ass. Prof. Jitender Grover - India
(Department of Computer Science & Engg., M.M. University)
Ass. Prof. Dr. Ömer Beyhan - Turkey
(Konya NE.University, A.K. Education Faculty)
4
Název:
Proceedings of IAC-MEBM in Budapest 2016
Listopad 2016 v Praze, První vydání
Vydavatel / Tvůrce CD / Nositel autorských práv:
Czech Institute of Academic Education z.s.
Adresa vydavatele:
Vestecká 21, 252 42 – Vestec, Česká Republika
Email: [email protected]
Web: www.conferences-scientific.cz
Technická redakce tohoto vydání:
Mgr. Helena Kratochvílová, DiS.
Ing. Radek Kratochvíl
---------------------------------------------------------------------------------
Title:
Proceedings of IAC-MEBM in Budapest 2016
November 2016 in Prague, 1st edition
Publisher / Creator of CD / Copyright holder:
Czech Institute of Academic Education z.s.
Address of Publisher:
Vestecká 21, 252 42 – Vestec, Czech Republic
Email: [email protected]
Web: www.conferences-scientific.cz
Technical editorial staff this CD:
Helena Kratochvílová
Radek Kratochvíl
5
Entrepreneurship and Economic Growth: Evidence from SMEs Financing in Nigeria.
1Eze, Benneth Uchenna 2Kolawole, Olabode Olufemi 3Obawunmi, Rasheed Biodun
1 Department of Business Administration, Olabisi Onabanjo University,Ago Iwoye, Ogun 2&3 Department of Business Administration, Lagos State University, Ojo, Lagos
Email: Corresponding Author: [email protected] 2 [email protected] 3 [email protected]
Abstract
Perfectly structured SMEs can contribute significantly to employment generation, wealth creation, poverty alleviation and
sustainable economic growth and development. SMEs lack of access to effective source of finance has been identified as
one of the major quagmire hindering their contributions to economic growth. On this premise, this paper assesses specific
financing options available to SMEs in Nigeria and contribution to economic growth. The paper uses secondary sources of
data which were generated from the publications of Central Bank of Nigeria (CBN) statistical Bulletin and World
Development Indicators (WDI). Asymmetric Ordinary Least Square (AOLS) estimation technique is employed to determine
the effect of SMEs financing on economic growth in Nigeria. The analysis of the results suggested that there is an
insignificant direct and indirect relationship between both positive and negative component of SMEs financing and
Economic growth in Nigeria, this can be adduced to policy inconsistencies in SMEs financing. The paper recommended that
strenuous effort should be made by the government by easing access to SMEs finance via subsidized interest rate in order
enhance economic growth and development.
Keywords: Small & Medium Scale Enterprises, Financing Options, Asymmetric Ordinary Least Square and Economic Growth
1.0 Introduction
The diverse role of small and medium enterprises (SMEs) in third world countries as catalyst through which the
growth objectives can be achieved has long been documented. SMEs are pertinent agent of economic
transformation as they account for more than 50 percent of GDP of developing economies. They are main
source of modernization and technological development, source of supply of both human capital and raw
materials to larger businesses and main source of entrepreneurship and enterprise (Sanusi, 2003) and
(PECC,2003). SMEs as a form of business sector are known as an essential component of economic
development and animperativeingredient in the alleviationofpoverty in an economy (Wolfenson, 2001).
There is a rapid growth in the number of privately owned small and medium-sized companies worldwide;
however, this category of business is beleaguer by several issues that hinder their growth. A key challenge for
most SMEs is the problem of financing. According to Da Silva et al (2007), all small firms live under tight
6
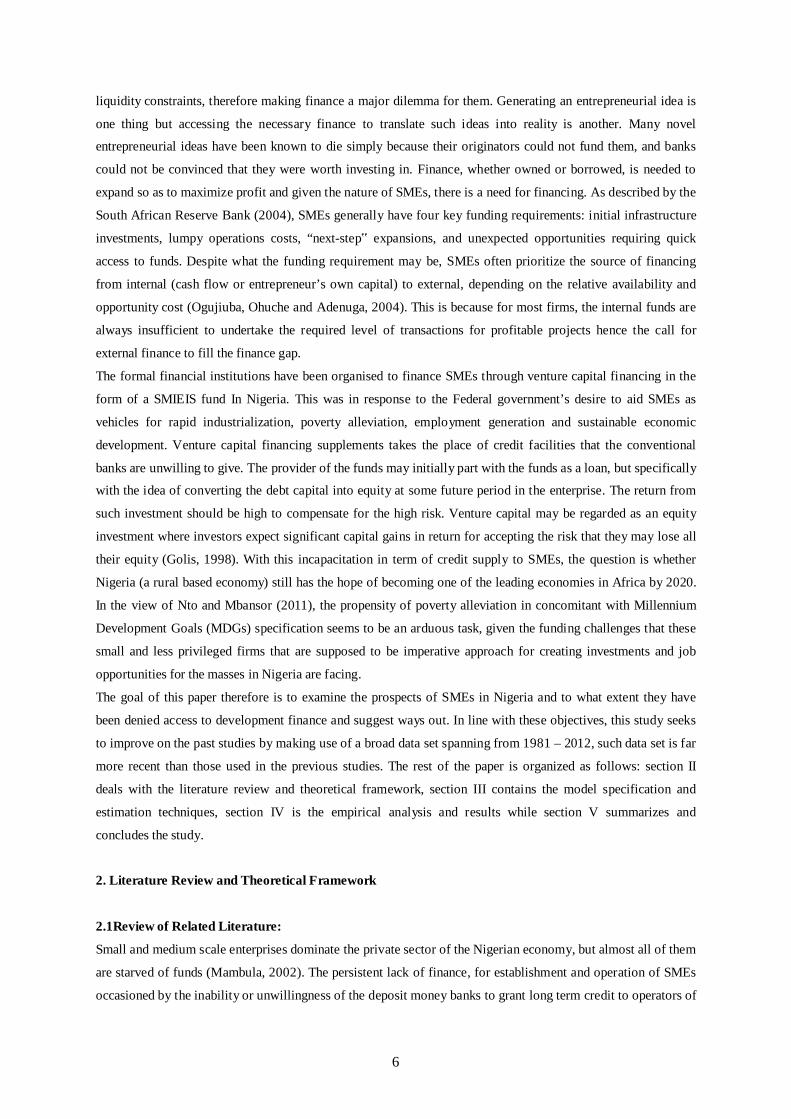
liquidity constraints, therefore making finance a major dilemma for them. Generating an entrepreneurial idea is
one thing but accessing the necessary finance to translate such ideas into reality is another. Many novel
entrepreneurial ideas have been known to die simply because their originators could not fund them, and banks
could not be convinced that they were worth investing in. Finance, whether owned or borrowed, is needed to
expand so as to maximize profit and given the nature of SMEs, there is a need for financing. As described by the
South African Reserve Bank (2004), SMEs generally have four key funding requirements: initial infrastructure
investments, lumpy operations costs, “next-step‟ expansions, and unexpected opportunities requiring quick
access to funds. Despite what the funding requirement may be, SMEs often prioritize the source of financing
from internal (cash flow or entrepreneur’s own capital) to external, depending on the relative availability and
opportunity cost (Ogujiuba, Ohuche and Adenuga, 2004). This is because for most firms, the internal funds are
always insufficient to undertake the required level of transactions for profitable projects hence the call for
external finance to fill the finance gap.
The formal financial institutions have been organised to finance SMEs through venture capital financing in the
form of a SMIEIS fund In Nigeria. This was in response to the Federal government’s desire to aid SMEs as
vehicles for rapid industrialization, poverty alleviation, employment generation and sustainable economic
development. Venture capital financing supplements takes the place of credit facilities that the conventional
banks are unwilling to give. The provider of the funds may initially part with the funds as a loan, but specifically
with the idea of converting the debt capital into equity at some future period in the enterprise. The return from
such investment should be high to compensate for the high risk. Venture capital may be regarded as an equity
investment where investors expect significant capital gains in return for accepting the risk that they may lose all
their equity (Golis, 1998). With this incapacitation in term of credit supply to SMEs, the question is whether
Nigeria (a rural based economy) still has the hope of becoming one of the leading economies in Africa by 2020.
In the view of Nto and Mbansor (2011), the propensity of poverty alleviation in concomitant with Millennium
Development Goals (MDGs) specification seems to be an arduous task, given the funding challenges that these
small and less privileged firms that are supposed to be imperative approach for creating investments and job
opportunities for the masses in Nigeria are facing.
The goal of this paper therefore is to examine the prospects of SMEs in Nigeria and to what extent they have
been denied access to development finance and suggest ways out. In line with these objectives, this study seeks
to improve on the past studies by making use of a broad data set spanning from 1981 – 2012, such data set is far
more recent than those used in the previous studies. The rest of the paper is organized as follows: section II
deals with the literature review and theoretical framework, section III contains the model specification and
estimation techniques, section IV is the empirical analysis and results while section V summarizes and
concludes the study.
2. Literature Review and Theoretical Framework
2.1Review of Related Literature:
Small and medium scale enterprises dominate the private sector of the Nigerian economy, but almost all of them
are starved of funds (Mambula, 2002). The persistent lack of finance, for establishment and operation of SMEs
occasioned by the inability or unwillingness of the deposit money banks to grant long term credit to operators of
7
the real sector of the economy, led to the establishment of development finance institutions and the introduction
of numerous funding programmes for the development of SMEs in Nigeria. In spite of these institutions and
funding programmes, there continues to be persistent cry against inadequate finance for the development of the
SMEs in the country.
Njoku (2007) postulated that to forestall the imminent capital flight from the real sector to the banking sector,
banks should begin to take second look at the industrial sector in terms of lending operations. Banks should
plough back large proportion of the money available to them to the real sector of the economy as long-term
loans at rates not exceeding 5%. This he said will encourage industrialists not only to remain in their present
businesses but also to achieve their business expansion targets. Lammers, Willebrands and Hartog (2010) used
econometric techniques to examine attitude towards risk and profits among small enterprises in Lagos State,
Nigeria. Their results showed that the propensity to take risk is negatively related to profit. When risk perception
is included, risk propensity no longer appears significant. They added that the perception of risk appears to be
the most important risk attitude characteristic, with a positive effect on profit. On firms with only positive
profits, the results indicated that the number of employees, the sector in which they operate, the number of
months in business, and owner characteristics such as education, age, gender, are significant and consistent. In
terms of access to finance, Kounouwewa and Chao (2011) conducted a survey on financing constraint
determinants in 16 African countries including Nigeria. The results indicated that the sizes of firm and
ownership structure are factors responsible for small and medium enterprises growth. These factors also limit
their access to capital and consequently financial constraints. They concluded that there must be efficient
financial institutions to tackle problems of financial constraints in entrepreneurship and MSMEs.
Evidence in the literature that finance can contribute to Growth is also essential in entrepreneurship and MSMEs
to enable them contribute to the economy. This is because entrepreneurship and MSMEs must have resources,
mobilize them and deploy them efficiently before they can generate growth and contribute to overall economic
growth (Naude, 2007; OECD, 2010; Hemert, 2008).
Anderson and Tell (2009) citing Birch (1979) and Davidson et al.(2001) also submitted that fast-growing
entrepreneurship and MSMEs contribute significantly to job creation and fast growing firms survive better than
firms that do not grow. He argues further that “high-growth firms are heterogeneous groups, and there are
number of factors and definitions that characterise the growth of this phenomenon” (citing Delmar etal, 2003).
Goedhuys and Sleuwaegen (2009) examined the growth performance of a large set of entrepreneurial firms in
ten manufacturing sectors of 11 Sub-Sahara African countries including Nigeria and the results show that the
growth of entrepreneurship is being constrained by poor infrastructure, insecurity, transportation deficiencies,
and financial constraints.
Obamuyi (2007) in a study conducted in Ondo State of Nigeria, observed that, the major determinants of loan
supply to SMEs are regulatory requirements such as Capital Adequacy Ratio (CAR), Reserve Requirements
(RR), Liquidity Ratio (LR), Interest Rate Development (IRD) and lending policies of the banks. These
determinants have varied degrees of influence on the amount of money available for lending by the banks but
failed to estimate the direction of the influence of identified policy instruments. Rahji and Apata (2012)adopted
tobit model in a study on “Understanding the Credit Supply Decisions of Banks under the Small and Medium
Enterprises Equity Investment Scheme in Nigeria” They found that interest rate was positively related to credit

8
supply to SMEs at 1% probability level. This implies that increase in interest rate will stimulate savings in banks
thus improvement in credit availability to SMEs. The findings of this analysis may be misleading considering
that credit supply to SMEs may not respond to short run interest rate changes based on cross sectional data but
on long run changes and time series approach in Nigeria are under nourished in credit supply by formal financial
institutions, hence, the need for policy intervention to forestall the financial crisis that may befall the sector.
As a remedy to the above shortcoming, the present study attempt to fill the loophole of SMEs In summary, the
evidence so far have shown the extent to which SMEs have been denied access to development finance.
However, the subsequent sections picked up the issue of financial constraint and how it will impact economic
growth in Nigeria
2.2 Theoretical Framework
In discussing the contribution of SME in overall development in LDCs, two theories are predominant in the
literature viz; the classical and the modern theories. The seminal articles by Hoselitz (1959), Staley and Morse
(1965), and Anderson (1982), among some others works are often classified as the ‘classical’ theories on SMEs’
development. The ‘classical’ theories predict that advantages of SMEs will diminish over time and large
enterprises (Les) will eventually predominate in the course of economic development marked by the increase in
income. From the ‘modern’ theories perspective, MSMEs have two important roles to play simultaneously: to
accelerate economic growth through the growth of their output contributions to gross domestic product (GDP),
and to reduce poverty through employment creation and income generation effects of their generated output
growth. In addition to these direct effects, SMEs have also indirect effects on economic growth and poverty
reduction through their growth linkage effects. Output and employment increases in MSME lead output and
employment to increase in the rest of the economy through three main linkages: production (forward and
backward), investment, and consumption. The World Bank gives three core arguments in supporting SMEs in
LDCs, which is in line with the arguments of the ‘modern’ paradigm on the importance of SMEs in the
economy (World Bank, 2002, 2004). First, SMEs enhance competition and entrepreneurship and hence have
external benefits on economy-wide efficiency, innovation, and aggregate productivity growth. Second, SMEs
are generally more productive than LEs but financial market and other institutional failures and not-conducive
macroeconomic environment impede SME development. Third, SMEs expansion boosts employment more than
LEs growth because SMEs are more labor intensive. In other words, the World Bank believes that direct
government support for SMEs in LDCs help these countries exploit the social benefits from their greater
competition and entrepreneurship, and their MSMEs can boost economic growth and development (World
Bank, 2004). The above arguments do not mean, however, that LEs are not important, or MSMEs can fully
substitute the role of LEs in the economy. Even, there are skeptical views from many authors about this World
Bank’s pro-MSME policy. Some authors stress the advantages of LEs and challenge the assumptions underlying
this pro-MSME policy. Specifically, LEs may exploit economies of scale and more easily undertake the fixed
costs associated with research and development (R&D) with positive productivity effects. This study adopts the
modern theory paradigm.

9
3. Method and Materials:
The study utilized secondary data. Time series data which was collected from Central Bank of Nigeria (CBN)
statistical bulletin was analyzed using Ordinary least square (OLS) estimation technique. The data collected was
from 1981-2012 due to paucity of data.
The data for relevant variables comprises of growth rate of real gross domestic product, growth rate of
commercial bank loans to small and medium scale enterprises, unemployment rate and interest rate.
The theoretical frame work adopted in this paper is based on the modern economic theory on SMEs, that SMEs
play two important roles, to accelerate economic growth through the growth of their output contributions to
gross domestic product (GDP), and to reduce poverty through employment creation and income generation
effects of their generated output growth.
The Asymmetric Ordinary Least Square (AOLS) estimation technique is adopted in this study so as to fish out
the negative and positive components of the variables used. The aim is to ascertain how finance of SMEs impact
on Economic Growth. As such the following linear relationship is
Specified as;
……………………………….1
This is explicitly stated as;
……………
.2
Where are to be estimated
= Growth Rate of Real Gross Domestic Products
= Growth Rate of Commercial Bank Loans to Small and Medium Scale Enterprises
= Unemployment rate
= Interest rate
p- Positive part of the variable
m- Negative part of the variable
µ= stochastic error term
3.2 Estimation Techniques:
Empirical research in financial economics is largely based on time series data which have two central properties
i.e non-stationarity and time varying volatility. Therefore, Philips (1986) reported that regression analysis with
variables that contain such properties may produce misleading and spurious results thereby causing biased
economic analysis. As such, stationarity tests were adopted to eliminate the problem. The linear unit root test
adopted to check whether the time series data are stationary or not are Augumented Dickey Fuller (ADF) and
Philip-Perron, while the non-linear unit root test are KSS and Solis which is a modification to KSS and was
developed by Solis(2009)
--------------------------------------------------------- (3)
--------------------------------------------------------- (4)
--------------------------------------------------------- (5)
10
NB: specification for equation (3) above is for a linear unit toot at first difference, while (4) and (5) are non-
linear unit root test at first difference i.e KSS and Solis respectively
4. Analysis and Discussion of Results:
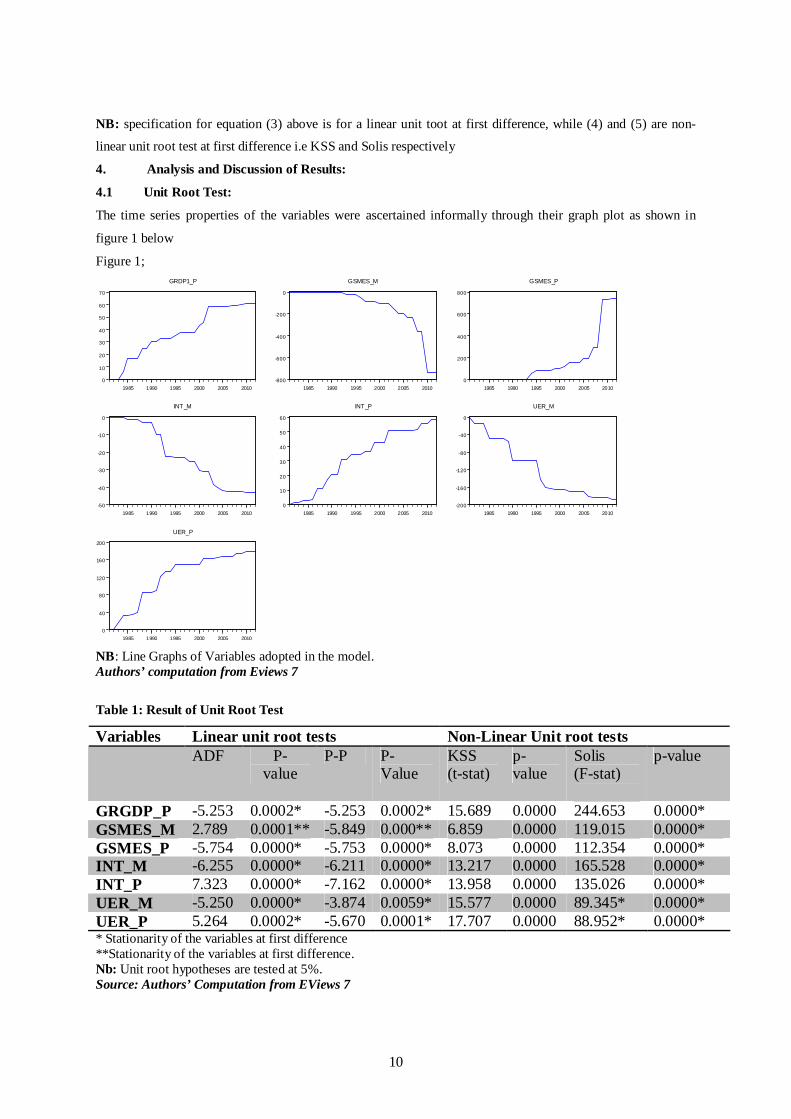
4.1 Unit Root Test:
The time series properties of the variables were ascertained informally through their graph plot as shown in
figure 1 below
Figure 1;
0
10
20
30
40
50
60
70
1985 1990 1995 2000 2005 2010
GRDP1_P
-800
-600
-400
-200
0
1985 1990 1995 2000 2005 2010
GSMES_M
0
200
400
600
800
1985 1990 1995 2000 2005 2010
GSMES_P
-50
-40
-30
-20
-10
0
1985 1990 1995 2000 2005 2010
INT_M
0
10
20
30
40
50
60
1985 1990 1995 2000 2005 2010
INT_P
-200
-160
-120
-80
-40
0
1985 1990 1995 2000 2005 2010
UER_M
0
40
80
120
160
200
1985 1990 1995 2000 2005 2010
UER_P
NB: Line Graphs of Variables adopted in the model. Authors’ computation from Eviews 7
Table 1: Result of Unit Root Test
Variables Linear unit root tests Non-Linear Unit root tests ADF P-
value P-P P-
Value KSS (t-stat)
p-value
Solis (F-stat)
p-value
GRGDP_P -5.253 0.0002* -5.253 0.0002* 15.689 0.0000 244.653 0.0000* GSMES_M 2.789 0.0001** -5.849 0.000** 6.859 0.0000 119.015 0.0000* GSMES_P -5.754 0.0000* -5.753 0.0000* 8.073 0.0000 112.354 0.0000* INT_M -6.255 0.0000* -6.211 0.0000* 13.217 0.0000 165.528 0.0000* INT_P 7.323 0.0000* -7.162 0.0000* 13.958 0.0000 135.026 0.0000* UER_M -5.250 0.0000* -3.874 0.0059* 15.577 0.0000 89.345* 0.0000* UER_P 5.264 0.0002* -5.670 0.0001* 17.707 0.0000 88.952* 0.0000* * Stationarity of the variables at first difference **Stationarity of the variables at first difference. Nb: Unit root hypotheses are tested at 5%. Source: Authors’ Computation from EViews 7
11
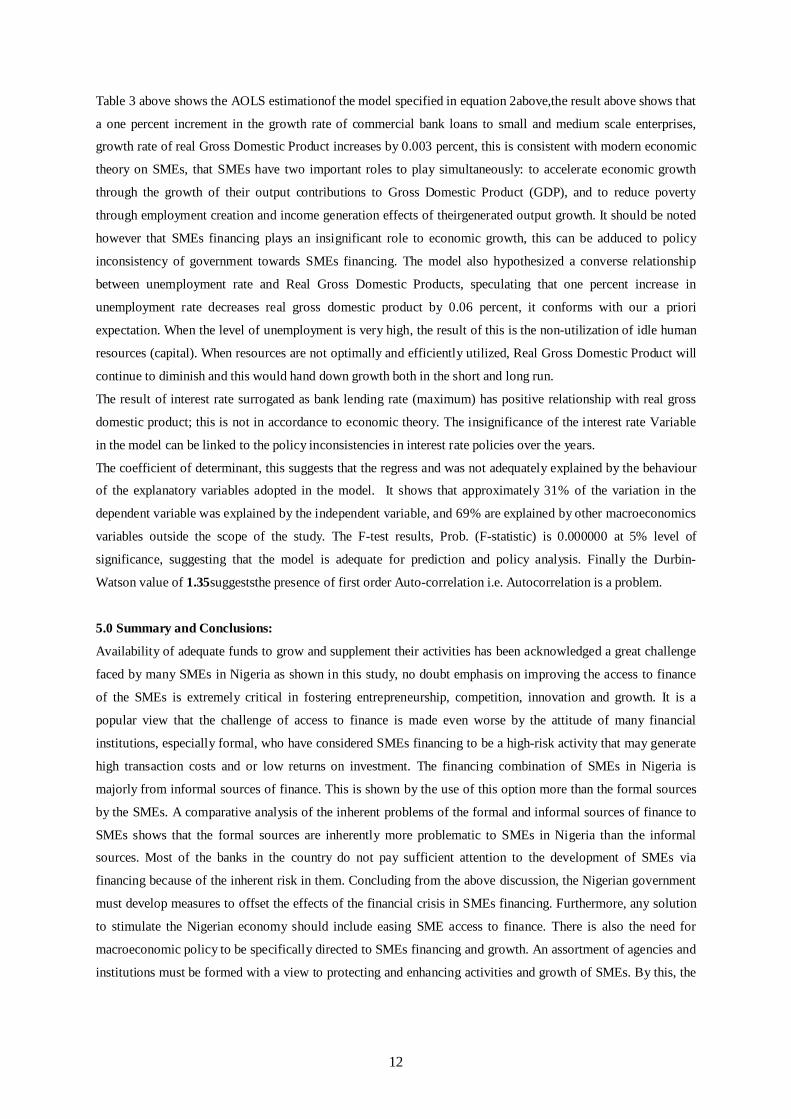
4.2 Table 2: Result of Asymmetric Co-integration (Hidden Co-integration)
Johansen cointegration test for the variables in equation 1 Trace test
Hypothesized no of CE(s)
Eigenvalue Trace statistics 5% critical level Prob*
None* 0.869454 170.7672 125.6154 0.0000 At most 1* 0.743000 109.6862 95.75366 0.0039 At most 2* 0.579962 68.92588 69.81889 0.0587 At most 3* 0.493624 42.90355 47.85613 0.1349 At most 4* 0.368296 22.48929 29.79707 0.2721 At most 5* 0.204299 8.709243 15.49471 0.3930 At most 6* 0.059907 1.853298 3.841466 0.1734
Trace test indicates 2 cointegratingeqn(s) at the 0.05 level * denotes rejection of the hypothesis at the 0.05 level Source: Authors’ Computation from EViews 7
Maximum Eigenvalue Test
Hypothesized no of CE(s)
Eigenvalue Max-Eigenvalue 5% critical level
Prob*
None* 0.869454 61.08095 46.23142 0.0007 At most 1* 0.743000 40.76033 40.07757 0.0418 At most 2* 0.579962 26.02233 33.87687 0.3194 At most 3* 0.493624 20.41426 27.58434 0.3132 At most 4* 0.368296 13.78005 21.13162 0.3834 At most 5* 0.204299 6.855945 14.26460 0.5063 At most 6* 0.059907 1.853298 3.841466 0.1734
Max-eigenvalue test indicates 2 cointegratingeqn(s) at the 0.05 level * denotes rejection of the hypothesis at the 0.05 level Source: Authors’ Computation from EViews 7
After decomposing the variables, it was discovered that there is hidden cointegration in the model this was
developed by Granger and Yoon (2002) and Schorderet (2004)
4.3Table 3: Result of Asymmetric OLS Estimation
Variable Coefficient Std. Error
t-Statistic Prob.
C 3.929862 2.442175 1.609165 0.1201 GSMES_P 0.001094 0.012990 -0.084231 0.9335
INT_P 0.652949 0.333945 1.955258 0.0618 UER_P 0.017762 0.069322 0.256228 0.7999
GSMES_M -0.004283 0.014001 -0.305892 0.7622 INT_M -0.055838 0.225805 -0.247283 0.8067 UER_M -0.068707 0.058361 -1.177282 0.2502
R-squared 0.951821 Mean dependent var 37.25626 Adjusted R-squared
0.940258 S.D. dependent var 20.02824
S.E. of regression 4.895357 Akaike info criterion 6.205091 Sum squared resid 599.1130 Schwarz criterion 6.525721 Log likelihood -92.28146 Hannan-Quinn criter. 6.311371 F-statistic 82.31563 Durbin-Watson stat 0.531382 Prob(F-statistic) 0.000000 Source: Authors’ Computation from EViews 7
12
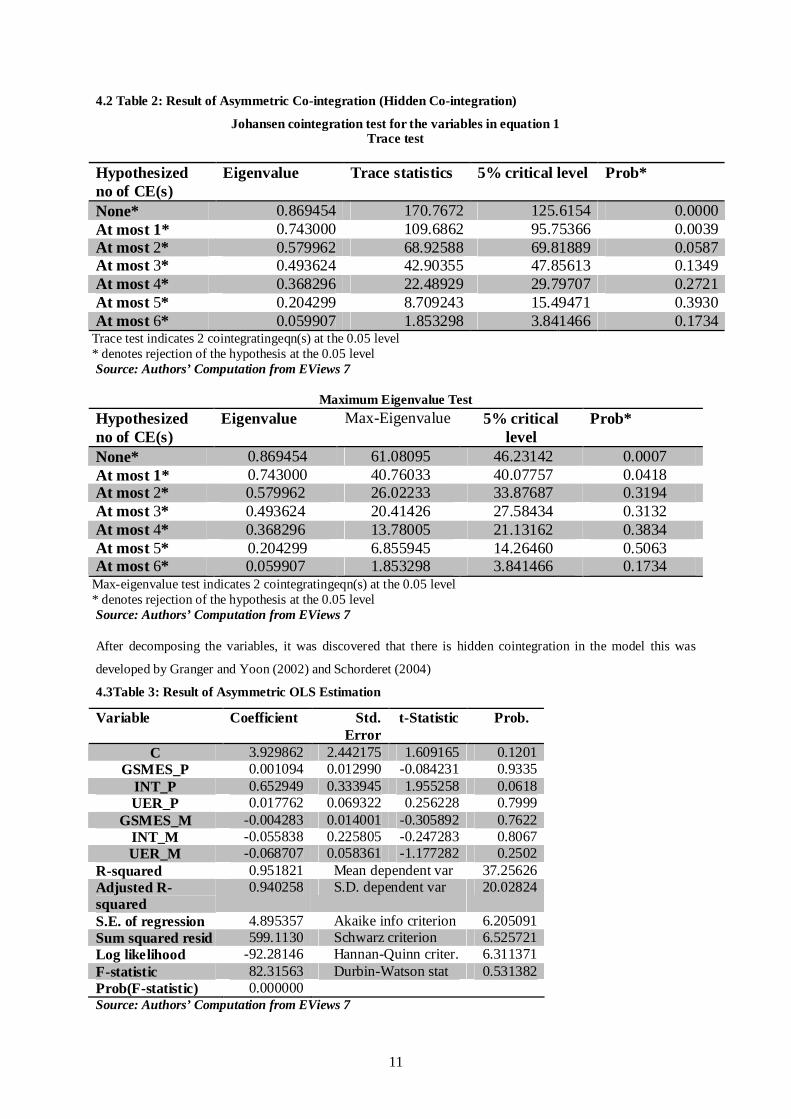
Table 3 above shows the AOLS estimationof the model specified in equation 2above,the result above shows that
a one percent increment in the growth rate of commercial bank loans to small and medium scale enterprises,
growth rate of real Gross Domestic Product increases by 0.003 percent, this is consistent with modern economic
theory on SMEs, that SMEs have two important roles to play simultaneously: to accelerate economic growth
through the growth of their output contributions to Gross Domestic Product (GDP), and to reduce poverty
through employment creation and income generation effects of theirgenerated output growth. It should be noted
however that SMEs financing plays an insignificant role to economic growth, this can be adduced to policy
inconsistency of government towards SMEs financing. The model also hypothesized a converse relationship
between unemployment rate and Real Gross Domestic Products, speculating that one percent increase in
unemployment rate decreases real gross domestic product by 0.06 percent, it conforms with our a priori
expectation. When the level of unemployment is very high, the result of this is the non-utilization of idle human
resources (capital). When resources are not optimally and efficiently utilized, Real Gross Domestic Product will
continue to diminish and this would hand down growth both in the short and long run.
The result of interest rate surrogated as bank lending rate (maximum) has positive relationship with real gross
domestic product; this is not in accordance to economic theory. The insignificance of the interest rate Variable
in the model can be linked to the policy inconsistencies in interest rate policies over the years.
The coefficient of determinant, this suggests that the regress and was not adequately explained by the behaviour
of the explanatory variables adopted in the model. It shows that approximately 31% of the variation in the
dependent variable was explained by the independent variable, and 69% are explained by other macroeconomics
variables outside the scope of the study. The F-test results, Prob. (F-statistic) is 0.000000 at 5% level of
significance, suggesting that the model is adequate for prediction and policy analysis. Finally the Durbin-
Watson value of 1.35suggeststhe presence of first order Auto-correlation i.e. Autocorrelation is a problem.
5.0 Summary and Conclusions:
Availability of adequate funds to grow and supplement their activities has been acknowledged a great challenge
faced by many SMEs in Nigeria as shown in this study, no doubt emphasis on improving the access to finance
of the SMEs is extremely critical in fostering entrepreneurship, competition, innovation and growth. It is a
popular view that the challenge of access to finance is made even worse by the attitude of many financial
institutions, especially formal, who have considered SMEs financing to be a high-risk activity that may generate
high transaction costs and or low returns on investment. The financing combination of SMEs in Nigeria is
majorly from informal sources of finance. This is shown by the use of this option more than the formal sources
by the SMEs. A comparative analysis of the inherent problems of the formal and informal sources of finance to
SMEs shows that the formal sources are inherently more problematic to SMEs in Nigeria than the informal
sources. Most of the banks in the country do not pay sufficient attention to the development of SMEs via
financing because of the inherent risk in them. Concluding from the above discussion, the Nigerian government
must develop measures to offset the effects of the financial crisis in SMEs financing. Furthermore, any solution
to stimulate the Nigerian economy should include easing SME access to finance. There is also the need for
macroeconomic policy to be specifically directed to SMEs financing and growth. An assortment of agencies and
institutions must be formed with a view to protecting and enhancing activities and growth of SMEs. By this, the
13
capacity and capability of SMEs in term of employment generation, contribution to industrial production and its
influence on economic growth can be well sensed.
REFERENCES:
Andrews, Donald W. K. (1991). Heteroskedasticity and Autocorrelation Consistent Covariance Matrix
Estimation.Econometrica, 59, 817–858.
Aruwa, S.A.S (2005). The Business Entrepreneur: A Guide to Entrepreneurial Development. Kaduna’s copy
Publishing.
Bankers Committee (2005).Revised operational Guidelines for the Operation of Small and Medium Enterprises
Equity Investment Scheme (SMEEIS).
Engle, R. F., and Granger, C. W. (1987). Co-integration and Error Correction: Representation, Estimation, and
Testing. Econometrica, 55, 251–276.
Golis, C. (1998). Enterprise andVenture Capital: A Business Builder and Investment Handbook, 3rd edition,
Australia: Allen and Urwin
Mambula, C. (2002). Perceptions of SME growth constraints in Nigeria.Journal of Small Business Management,
Vol. 40 (1), pp.58-65.
Manyong V. M., A. Ikpi, Olatyemi J. K., Yusuf S. A, Omonona B.T, Okoruwa J. V.,&Idachaba F. S. (2005).
Agriculture in Nigeria: Identifying opportunities for Increasedcommercialisation and investment.
Inter-national institute of tropical Agriculture (IITA), Ibadan.
Nto, P. O. O., &Mbanasor, J. A. (2009). Determinants of Credit Procurement among Rural Farmers in Abia
State, Nigeria. Paper presented at the 43rd Annual Conference of Agricultural Society of Nigeria,
20th-23rd Oct. 2009, Abuja. Pp345-349
Nto, P. O. O., &Mbanasor, J. A. (2011). Analysis of Determinants of Agribusiness Investment in a Young
Economy: Nigeria (1999-2008). Journal of Social and Development Sciences, 2(3), 137-146.
Obamuyi, T. M. (2007). An Exploratory Study of Loan Delinquency Among Small and Medium Enterprises in
Ondo State of Nigeria. Labour and Management in Development Journal, 8.
Ogujiuba, K. K.,Oluche.F. K., &Achenuga A. O. (2004).Credit Availability to Small and Medium Scale
Enterprises in Nigeria: Importance of New Capital for Banks-Background and issues.working paper.
Organisation for Economic Cooperation and Development OECD.(2006). Financing SMEs and Entrepreneurs.
Policy Brief, OECD Observer, November.
Peter, C., & Philips, B. (1995).Fully Modified Least Squares and Vector Autoregression.Econometrica, 63(5),
1023-1078.
PECC (2003).Financing Small and medium Enterprises: Challenges and Options. California: The Pacific
Economic Cooperation Council.
Philips, B., & Peter, C. (1986).Understanding Spurious Regressions in Econometrics.Journal of Econometrics,
33, 311-340.
Rahji,I. &Apata, A. (2012). Understanding the Credit Supply Decisions of Banks under Small and Medium
Enterprises Equity Investment Scheme (SMEEIS) in Nigeria.
Sanusi, J.O. (2003). Overview Of Government’s Efforts In The Development Of SMEs and The Emergence Of
Small And Medium Industries Equity Investment Scheme (SMIEIS). Presented At The National

14
Summit On SMIEIS Organized By The Bankers’ Committee and Lagos Chambers Of Commerce
And Industry (LCCI), Lagos On 10th June.
Sanusi, J. (2004). Research study presentation at the Nationalsummit on revamping small and medium
industries, Thisday. Vol. 10, No. 3243, page 25.
15
Income of single-person households in Poland
Małgorzata ĆWIEKa, Agnieszka WAŁĘGAb1
aCracow University of Economics, Faculty of Management, Department of Statistics, 27 Rakowicka St., 31-510 Cracow, Poland, [email protected]
bCracow University of Economics, Faculty of Management, Department of Statistics, 27 Rakowicka St., 31-510 Cracow, Poland, [email protected]
Abstract
In Poland, as in other EU countries, the share of single-person households is on the increase. On the one hand, living alone allows one to have their property, income and leisure time at their free disposal; on the other hand, it forces them to obtain funds on their own to run the household. The purpose of the paper is to assess the income situation of single-person households (income levels and income inequalities), as well as to identify determinants conditioning the income amount. Research results indicate a better situation of single-person households than of those multi-person ones in terms of the income level, and smaller income inequalities in this group of households.
Keywords:single-person households, income distribution,income inequality
1. INTRODUCTION
In recent few decades, living alone has become an increasingly popular lifestyle. It is significant the number of single-person households has increased, mostly in urban areas. Many factors affect the number, type, and size of households. These include patterns of population growth such as fertility and mortality, decisions individuals make about their living arrangements, and changes in social norms, health, and the economy that influence how individuals organize their lives [Vespa, Lewis, Kreider 2013]. These days not only widowed people but also many young adults who are divorced or have never been married live alone. This trend can observed not only among Europeans [Bennett, Dixon 2006]but also Americans [Jacobsen, Mather, Dupuis 2012]and other nations of the world [Li-Min, Gi-Hsian, Hsin-Yi 2011]. According to the projections by 2025-30 single person households will make up around 40% or more of all households in Austria, England, France, Germany, Norway, Netherlands and Switzerland [The Future… 2011].
With the proportion of single-person households increasing in Europe, an international comparison of inequality in income distribution, taking into account this target group, is very interesting from a social and economic point of view. It is becoming increasingly pertinent to investigate the multivariate relationship between income and then poverty and individual characteristics, such as gender, age, marital status and education in different European countries.
Thus, this paper evaluates the development and outlook of the single-person household in Poland and analyzes income distribution and income inequality of those householdsin cross-section of selected socio-demographic characteristics. The Authors try to answer the question what are the determinants the amount of income of single-person household.
Information on single-person households used in the study has been obtained from the Eurostat database, from the EU-SILC survey and survey on household budgets conducted by the Central Statistical Office (CSO) in Poland in the years 2005-2014.
1Corresponding author.

16
2. SINGLE-PRSON HOUSEHOLDS – INTRODUCTORY REMARKS
In recent years, the concept of a single person has been widely discussed in literature, especially in that in the field of psychology [Czernecka 2011, pp. 51-54]. Because of its ambiguity, studies on living a single life include various categories of persons, and thus make different aspects of their lives the subject of the analysis.
An increasing number of people living alone makesthis demographic trend has attracted many researchers, mostly psychologists but also demographers and economists. For example J. Scott [1997] dealt with the implications in understanding family life in the U.K., Hatland [2001] wrote about changing family patterns as a challenge to social security, C. Quintano and A. D’Agostino [2006] reported on income and inequality.L. Youngho and H. Jungmin [2013] wrote about consumption patterns of single-person households.
In Polish literature, research on living alone has appeared relatively recently, at the turn of the 20th and 21st centuries. W. Warzywoda-Kruszyńska and P. Szukalski wrote on this subject in the context of changes taking place in families, drawing attention not only to the issue of an increasing number of people living alone, but also to changes in their social status and demographic characteristics [Warzywoda-Kruszyńska, Szukalski 2004]. Other studies were conducted by A. Żurek [2008], who focused on a group of people at the age of 20-50 living in single-person households. Research on the phenomenon of single persons was carried out, for example, by E. Grzeszczyk [2005] and E. Paprzycka [2008]. Their studies involved only young women. J. Czernecka [2011], in turn, dealt with problems of singles living in large cities.
This paper focuses on single-person households. These households are formed by individuals who do not have joint property with others and provide for themselves on their own, regardless of whether they live alone or with other people [Budżety... 2016, p. 18]. They are created by people of a different social status, i.e. maidens and bachelors, divorcees, widows and widowers, as well as those who are separated in marriage. On the other hand, temporary separation resulting from the nature of occupation is not a basis to recognize a household as a single-person one [Żurek 2003. p. 124].
Changes in the number of single-person households are largely a consequence of young people’s decisions to postpone marriage and pro-family moves in favour of fulfilling their professional and personal goals. Single-person households are also relatively often formed by elderly people, especially women, which is associated with the second demographic transition [Żurek 2008, pp. 163-167].
3. EMPIRICAL RESULTS
According to the latest statistics, in many economically advanced countries such as Sweden, Finland, Denmark, Austria, and Germany more than one-third of households contained only one person (Table 1). While the prevalence of single-person households in Asia is generally lower than in Europe and North America. It is significant that single-person households are most common in the Nordic and North-Western groups of countries (where divorce is relatively common and where it is relatively unusual for older people to live with children or other relatives) and least common in the Southern countries (where divorce rates remain low, and where it is common for older people to live with adult children) [Household… 2010, p. 14].
Table 1. Share (in %) of single-person households in selected European countries in the years 2006–2014 (EU-SILC survey)
Specification 2006 2007 2008 2009 2010 2011 2012 2013 2014
European Union (27 countries) : 30.1 30.5 30.7 30.9 31.1 31.2 31.6 31.8
Austria 34.7 35.0 35.3 35.7 36.0 36.2 36.5 36.7 37.0
Bulgaria 18.6 21.1 18.4 19.1 19.4 19.9 21.6 22.4 24.2
Cyprus 16.0 16.0 20.8 20.8 20.8 20.8 20.7 20.8 20.8
Czech Republic 23.7 23.8 24.8 24.5 23.5 23.7 27.2 27.8 27.9
Denmark 43.9 44.3 45.8 46.1 46.2 44.0 44.2 45.1 45.0
Estonia 33.2 33.6 34.4 34.2 34.5 34.9 36.0 36.0 36.0
Finland 38.5 38.5 39.2 39.8 39.5 40.1 40.2 40.3 40.8
Germany 38.1 38.4 39.1 39.5 39.8 40.1 40.2 40.2 40.5
Greece 19.8 20.0 20.1 20.2 20.3 20.4 20.6 25.7 25.7
Hungary 24.7 24.4 24.1 24.1 23.9 29.9 31.0 32.0 32.3
Italy 27.9 28.7 29.3 29.8 30.3 30.3 31.6 32.5 32.9
17
Latvia 25.3 26.6 28.4 29.7 29.3 30.9 30.7 30.4 32.3
Lithuania 28.1 27.0 30.0 30.4 32.7 34.2 35.2 36.6 36.0
Portugal 16.7 17.0 17.6 17.5 17.7 19.1 19.3 20.0 21.4
Slovakia 24.2 24.5 24.2 23.8 23.1 24.4 24.7 23.5 25.7
Sweden 41.3 39.5 37.6 42.0 39.5 39.2 38.7 39.8 39.9
United Kingdom 31.2 31.1 31.1 30.9 30.9 31.3 29.0 28.5 28.7
Largely as a consequence of ageing populations, the number of one-person households is expected to grow in all the OECD countries for which projections are available. The largest increases are expected in Korea, Australia, England, New Zealand, and France. Equally important from a policy perspective is that the general direction of changes in these household and family categories holds both for absolute numbers and for shares in households or families as a whole [The Future… 2011, p. 10].
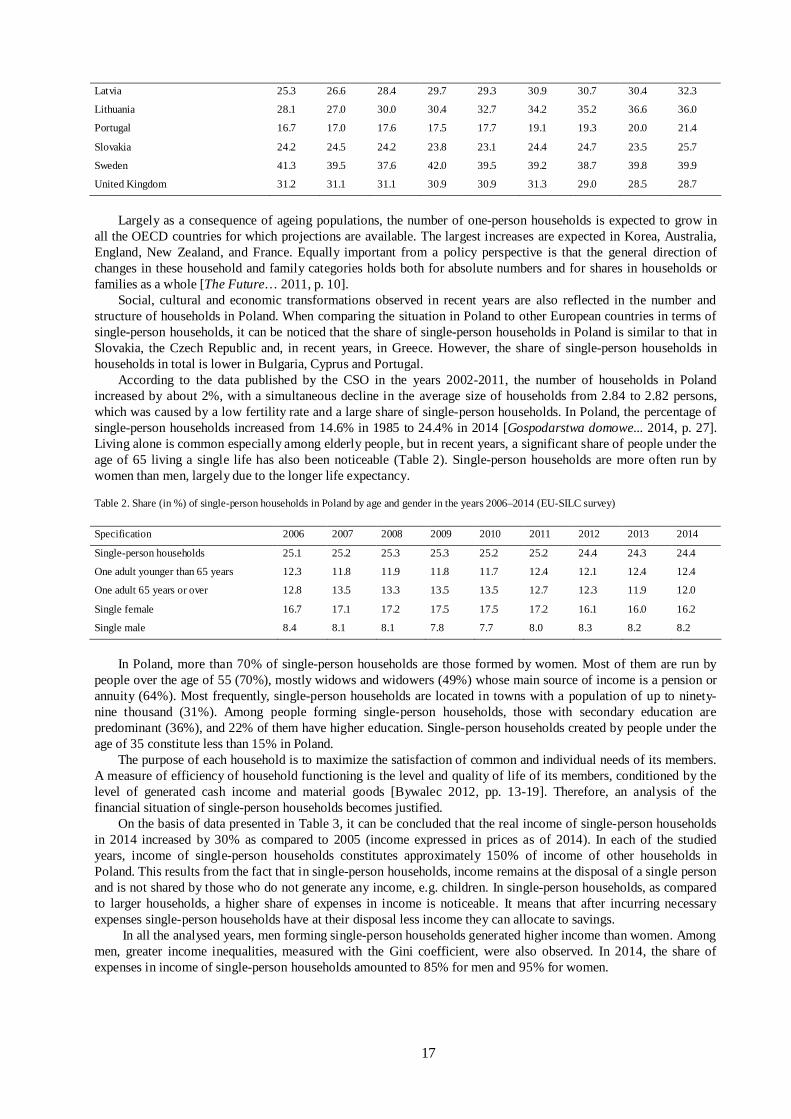
Social, cultural and economic transformations observed in recent years are also reflected in the number and structure of households in Poland. When comparing the situation in Poland to other European countries in terms of single-person households, it can be noticed that the share of single-person households in Poland is similar to that in Slovakia, the Czech Republic and, in recent years, in Greece. However, the share of single-person households in households in total is lower in Bulgaria, Cyprus and Portugal.
According to the data published by the CSO in the years 2002-2011, the number of households in Poland increased by about 2%, with a simultaneous decline in the average size of households from 2.84 to 2.82 persons, which was caused by a low fertility rate and a large share of single-person households. In Poland, the percentage of single-person households increased from 14.6% in 1985 to 24.4% in 2014 [Gospodarstwa domowe... 2014, p. 27]. Living alone is common especially among elderly people, but in recent years, a significant share of people under the age of 65 living a single life has also been noticeable (Table 2). Single-person households are more often run by women than men, largely due to the longer life expectancy.
Table 2. Share (in %) of single-person households in Poland by age and gender in the years 2006–2014 (EU-SILC survey)
Specification 2006 2007 2008 2009 2010 2011 2012 2013 2014
Single-person households 25.1 25.2 25.3 25.3 25.2 25.2 24.4 24.3 24.4
One adult younger than 65 years 12.3 11.8 11.9 11.8 11.7 12.4 12.1 12.4 12.4
One adult 65 years or over 12.8 13.5 13.3 13.5 13.5 12.7 12.3 11.9 12.0
Single female 16.7 17.1 17.2 17.5 17.5 17.2 16.1 16.0 16.2
Single male 8.4 8.1 8.1 7.8 7.7 8.0 8.3 8.2 8.2
In Poland, more than 70% of single-person households are those formed by women. Most of them are run by people over the age of 55 (70%), mostly widows and widowers (49%) whose main source of income is a pension or annuity (64%). Most frequently, single-person households are located in towns with a population of up to ninety-nine thousand (31%). Among people forming single-person households, those with secondary education are predominant (36%), and 22% of them have higher education. Single-person households created by people under the age of 35 constitute less than 15% in Poland.
The purpose of each household is to maximize the satisfaction of common and individual needs of its members. A measure of efficiency of household functioning is the level and quality of life of its members, conditioned by the level of generated cash income and material goods [Bywalec 2012, pp. 13-19]. Therefore, an analysis of the financial situation of single-person households becomes justified.
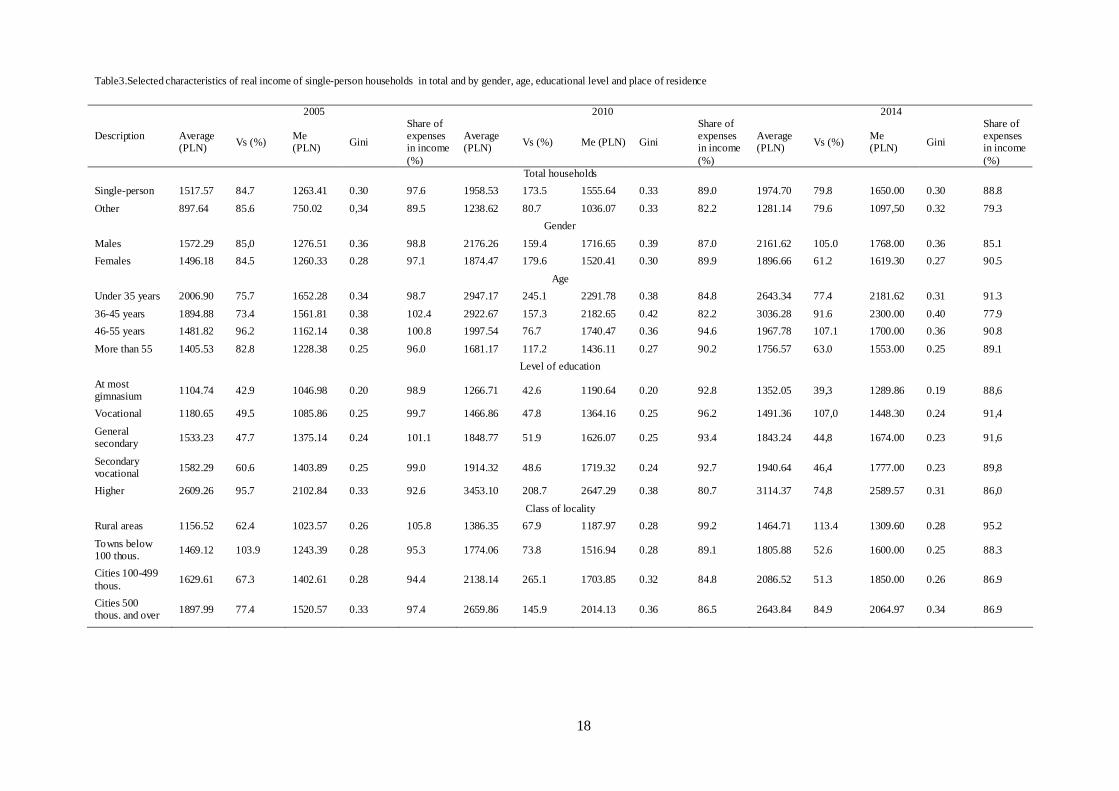
On the basis of data presented in Table 3, it can be concluded that the real income of single-person households in 2014 increased by 30% as compared to 2005 (income expressed in prices as of 2014). In each of the studied years, income of single-person households constitutes approximately 150% of income of other households in Poland. This results from the fact that in single-person households, income remains at the disposal of a single person and is not shared by those who do not generate any income, e.g. children. In single-person households, as compared to larger households, a higher share of expenses in income is noticeable. It means that after incurring necessary expenses single-person households have at their disposal less income they can allocate to savings.
In all the analysed years, men forming single-person households generated higher income than women. Among men, greater income inequalities, measured with the Gini coefficient, were also observed. In 2014, the share of expenses in income of single-person households amounted to 85% for men and 95% for women.
18
Table3.Selected characteristics of real income of single-person households in total and by gender, age, educational level and place of residence
2005 2010 2014
Description Average (PLN) Vs (%)
Me (PLN) Gini
Share of expenses in income (%)
Average (PLN) Vs (%) Me (PLN) Gini
Share of expenses in income (%)
Average (PLN) Vs (%)
Me (PLN) Gini
Share of expenses in income (%)
Total households
Single-person 1517.57 84.7 1263.41 0.30 97.6 1958.53 173.5 1555.64 0.33 89.0 1974.70 79.8 1650.00 0.30 88.8
Other 897.64 85.6 750.02 0,34 89.5 1238.62 80.7 1036.07 0.33 82.2 1281.14 79.6 1097,50 0.32 79.3
Gender
Males 1572.29 85,0 1276.51 0.36 98.8 2176.26 159.4 1716.65 0.39 87.0 2161.62 105.0 1768.00 0.36 85.1
Females 1496.18 84.5 1260.33 0.28 97.1 1874.47 179.6 1520.41 0.30 89.9 1896.66 61.2 1619.30 0.27 90.5
Age
Under 35 years 2006.90 75.7 1652.28 0.34 98.7 2947.17 245.1 2291.78 0.38 84.8 2643.34 77.4 2181.62 0.31 91.3
36-45 years 1894.88 73.4 1561.81 0.38 102.4 2922.67 157.3 2182.65 0.42 82.2 3036.28 91.6 2300.00 0.40 77.9
46-55 years 1481.82 96.2 1162.14 0.38 100.8 1997.54 76.7 1740.47 0.36 94.6 1967.78 107.1 1700.00 0.36 90.8
More than 55 1405.53 82.8 1228.38 0.25 96.0 1681.17 117.2 1436.11 0.27 90.2 1756.57 63.0 1553.00 0.25 89.1
Level of education
At most gimnasium 1104.74 42.9 1046.98 0.20 98.9 1266.71 42.6 1190.64 0.20 92.8 1352.05 39,3 1289.86 0.19 88,6
Vocational 1180.65 49.5 1085.86 0.25 99.7 1466.86 47.8 1364.16 0.25 96.2 1491.36 107,0 1448.30 0.24 91,4
General secondary 1533.23 47.7 1375.14 0.24 101.1 1848.77 51.9 1626.07 0.25 93.4 1843.24 44,8 1674.00 0.23 91,6
Secondary vocational 1582.29 60.6 1403.89 0.25 99.0 1914.32 48.6 1719.32 0.24 92.7 1940.64 46,4 1777.00 0.23 89,8
Higher 2609.26 95.7 2102.84 0.33 92.6 3453.10 208.7 2647.29 0.38 80.7 3114.37 74,8 2589.57 0.31 86,0
Class of locality
Rural areas 1156.52 62.4 1023.57 0.26 105.8 1386.35 67.9 1187.97 0.28 99.2 1464.71 113.4 1309.60 0.28 95.2
Towns below 100 thous. 1469.12 103.9 1243.39 0.28 95.3 1774.06 73.8 1516.94 0.28 89.1 1805.88 52.6 1600.00 0.25 88.3
Cities 100-499 thous.
1629.61 67.3 1402.61 0.28 94.4 2138.14 265.1 1703.85 0.32 84.8 2086.52 51.3 1850.00 0.26 86.9
Cities 500 thous. and over 1897.99 77.4 1520.57 0.33 97.4 2659.86 145.9 2014.13 0.36 86.5 2643.84 84.9 2064.97 0.34 86.9
19
In 2005 and 2010, the highest average income was generated by single-person households formed by people under the age of 35, and an average income decreased in subsequent age categories. This situation changed in 2014 when the highest average income was recorded in the group of single-person households formed by people at the age of 36 to 45 years. In this age group, the lowest share of expenses in income was also observed (78%).
As in the case of households in total, income of single-person households grows together with an increase in the level of education of people forming the households. Along with the increase in the level of education, diversification of income measured by the coefficient of variation increases, as well.
Both average income and median income of single-person households increases with the size of the city/town/village where the household is located. For all classes of localities, a decrease in the share of expenses in income is also noticeable in the period considered. The larger the locality of a household, the greater the inequalities.
On the basis of the above analysis, it can be concluded that socio-demographic characteristics affect the shape of income of single-person households in a noticeable way.
The analysis of the impact of selected socio-demographic characteristics of single-person households on the development of the household income has been carried out using econometric modelling. To describe the level of income, there has been proposed a linear, power, exponential and power-exponential model. The analysis has found that for the empirical data, the best fit is the power-exponential model (see e.g. [Podolec, Ulman, Wałęga 2008, pp. 66-67]):
),....exp( 22111
0 iikkississ
s
jiji xxxxy j εαααα α ++++⋅= ++++
=∏
where: yi– amount of income per capita of the i-th household, xij – j-th exogenous variable for the i-th household, αj– parameter standing by the j-th exogenous variable, εj – value of the random component for the i-th household.
As the exogenous variables, there have been assumed characteristics of a household: • age of the household head, • gender of the household head, • marital status (five dummy variables – reference group: bachelors/maidens), • level of education of the household head (five dummy variables – reference level: at most lower secondary
education), • class of place of residence (three dummy variables – reference group: households situated in the rural areas), • socio-economic group (sixdummy variables – reference group: households of employees). The variable selection method has been the stepwise regression and the parameters have been estimated by the least
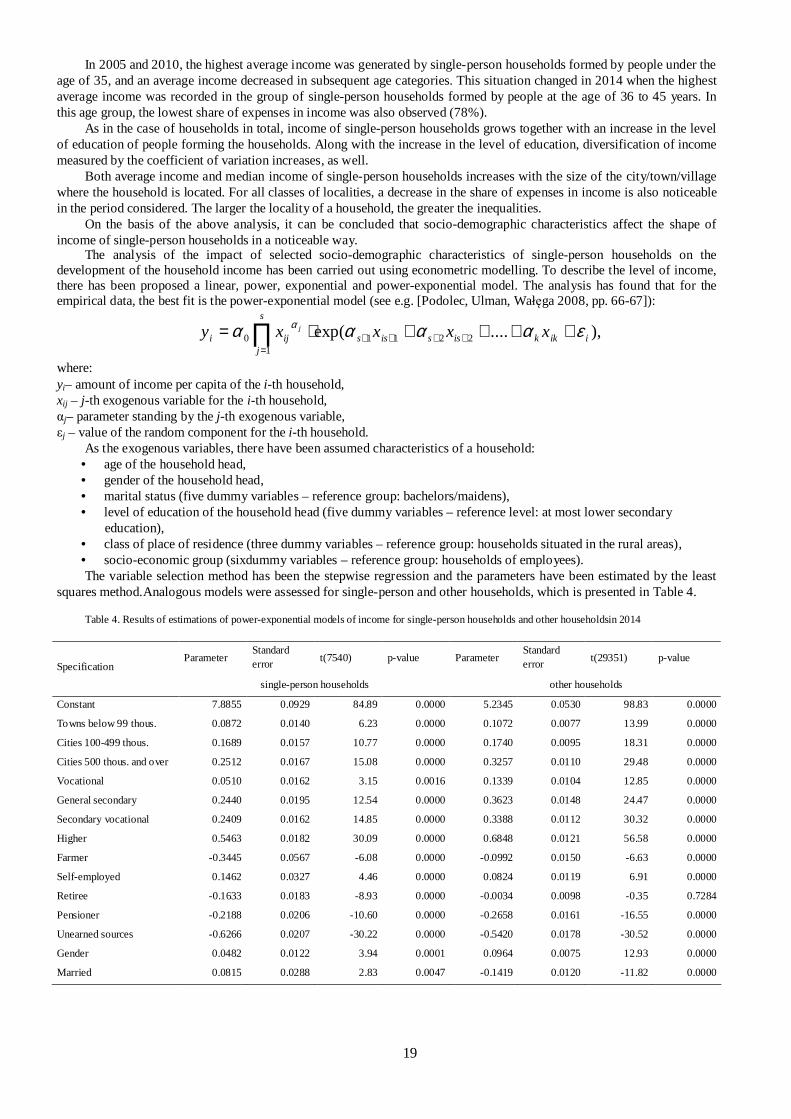
squares method.Analogous models were assessed for single-person and other households, which is presented in Table 4.
Table 4. Results of estimations of power-exponential models of income for single-person households and other householdsin 2014
Parameter Standard error
t(7540) p-value Parameter Standard error
t(29351) p-value Specification
single-person households other households
Constant 7.8855 0.0929 84.89 0.0000 5.2345 0.0530 98.83 0.0000
Towns below 99 thous. 0.0872 0.0140 6.23 0.0000 0.1072 0.0077 13.99 0.0000
Cities 100-499 thous. 0.1689 0.0157 10.77 0.0000 0.1740 0.0095 18.31 0.0000
Cities 500 thous. and over 0.2512 0.0167 15.08 0.0000 0.3257 0.0110 29.48 0.0000
Vocational 0.0510 0.0162 3.15 0.0016 0.1339 0.0104 12.85 0.0000
General secondary 0.2440 0.0195 12.54 0.0000 0.3623 0.0148 24.47 0.0000
Secondary vocational 0.2409 0.0162 14.85 0.0000 0.3388 0.0112 30.32 0.0000
Higher 0.5463 0.0182 30.09 0.0000 0.6848 0.0121 56.58 0.0000
Farmer -0.3445 0.0567 -6.08 0.0000 -0.0992 0.0150 -6.63 0.0000
Self-employed 0.1462 0.0327 4.46 0.0000 0.0824 0.0119 6.91 0.0000
Retiree -0.1633 0.0183 -8.93 0.0000 -0.0034 0.0098 -0.35 0.7284
Pensioner -0.2188 0.0206 -10.60 0.0000 -0.2658 0.0161 -16.55 0.0000
Unearned sources -0.6266 0.0207 -30.22 0.0000 -0.5420 0.0178 -30.52 0.0000
Gender 0.0482 0.0122 3.94 0.0001 0.0964 0.0075 12.93 0.0000
Married 0.0815 0.0288 2.83 0.0047 -0.1419 0.0120 -11.82 0.0000
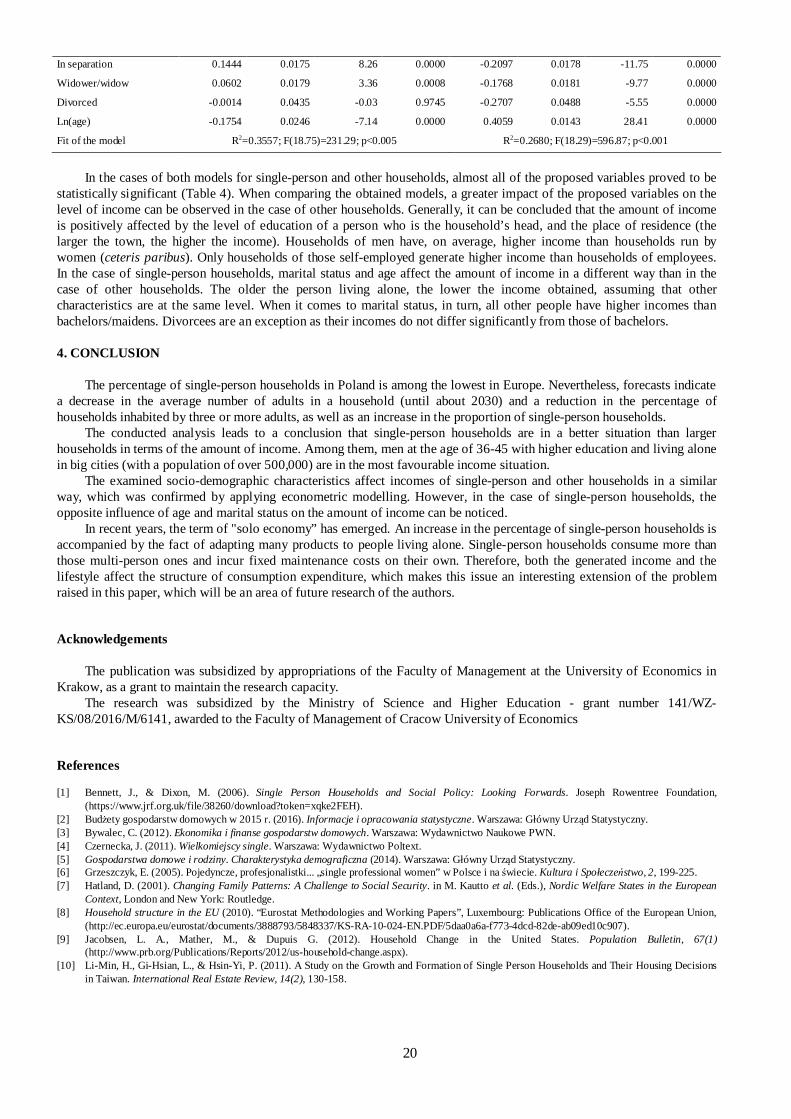
20
In separation 0.1444 0.0175 8.26 0.0000 -0.2097 0.0178 -11.75 0.0000
Widower/widow 0.0602 0.0179 3.36 0.0008 -0.1768 0.0181 -9.77 0.0000
Divorced -0.0014 0.0435 -0.03 0.9745 -0.2707 0.0488 -5.55 0.0000
Ln(age) -0.1754 0.0246 -7.14 0.0000 0.4059 0.0143 28.41 0.0000
Fit of the model R2=0.3557; F(18.75)=231.29; p<0.005 R2=0.2680; F(18.29)=596.87; p<0.001
In the cases of both models for single-person and other households, almost all of the proposed variables proved to be statistically significant (Table 4). When comparing the obtained models, a greater impact of the proposed variables on the level of income can be observed in the case of other households. Generally, it can be concluded that the amount of income is positively affected by the level of education of a person who is the household’s head, and the place of residence (the larger the town, the higher the income). Households of men have, on average, higher income than households run by women (ceteris paribus). Only households of those self-employed generate higher income than households of employees. In the case of single-person households, marital status and age affect the amount of income in a different way than in the case of other households. The older the person living alone, the lower the income obtained, assuming that other characteristics are at the same level. When it comes to marital status, in turn, all other people have higher incomes than bachelors/maidens. Divorcees are an exception as their incomes do not differ significantly from those of bachelors.
4. CONCLUSION
The percentage of single-person households in Poland is among the lowest in Europe. Nevertheless, forecasts indicate a decrease in the average number of adults in a household (until about 2030) and a reduction in the percentage of households inhabited by three or more adults, as well as an increase in the proportion of single-person households.
The conducted analysis leads to a conclusion that single-person households are in a better situation than larger households in terms of the amount of income. Among them, men at the age of 36-45 with higher education and living alone in big cities (with a population of over 500,000) are in the most favourable income situation.
The examined socio-demographic characteristics affect incomes of single-person and other households in a similar way, which was confirmed by applying econometric modelling. However, in the case of single-person households, the opposite influence of age and marital status on the amount of income can be noticed.
In recent years, the term of "solo economy” has emerged. An increase in the percentage of single-person households is accompanied by the fact of adapting many products to people living alone. Single-person households consume more than those multi-person ones and incur fixed maintenance costs on their own. Therefore, both the generated income and the lifestyle affect the structure of consumption expenditure, which makes this issue an interesting extension of the problem raised in this paper, which will be an area of future research of the authors.
Acknowledgements
The publication was subsidized by appropriations of the Faculty of Management at the University of Economics in Krakow, as a grant to maintain the research capacity.
The research was subsidized by the Ministry of Science and Higher Education - grant number 141/WZ-KS/08/2016/M/6141, awarded to the Faculty of Management of Cracow University of Economics
References
[1] Bennett, J., & Dixon, M. (2006). Single Person Households and Social Policy: Looking Forwards. Joseph Rowentree Foundation, (https://www.jrf.org.uk/file/38260/download?token=xqke2FEH).
[2] Budżety gospodarstw domowych w 2015 r. (2016). Informacje i opracowania statystyczne. Warszawa: Główny Urząd Statystyczny. [3] Bywalec, C. (2012). Ekonomika i finanse gospodarstw domowych. Warszawa: Wydawnictwo Naukowe PWN. [4] Czernecka, J. (2011). Wielkomiejscy single. Warszawa: Wydawnictwo Poltext. [5] Gospodarstwa domowe i rodziny. Charakterystyka demograficzna (2014). Warszawa: Główny Urząd Statystyczny. [6] Grzeszczyk, E. (2005). Pojedyncze, profesjonalistki... „single professional women” w Polsce i na świecie. Kultura i Społeczeństwo, 2, 199-225. [7] Hatland, D. (2001). Changing Family Patterns: A Challenge to Social Security. in M. Kautto et al. (Eds.), Nordic Welfare States in the European
Context, London and New York: Routledge. [8] Household structure in the EU (2010). “Eurostat Methodologies and Working Papers”, Luxembourg: Publications Office of the European Union,
(http://ec.europa.eu/eurostat/documents/3888793/5848337/KS-RA-10-024-EN.PDF/5daa0a6a-f773-4dcd-82de-ab09ed10c907). [9] Jacobsen, L. A., Mather, M., & Dupuis G. (2012). Household Change in the United States. Population Bulletin, 67(1)
(http://www.prb.org/Publications/Reports/2012/us-household-change.aspx). [10] Li-Min, H., Gi-Hsian, L., & Hsin-Yi, P. (2011). A Study on the Growth and Formation of Single Person Households and Their Housing Decisions
in Taiwan. International Real Estate Review, 14(2), 130-158.

21
[11] Paprzycka, E. (2008). Kobiety żyjące w pojedynkę. Między wyborem a przymusem. Warszawa: Wydawnictwo Akademickie Żak. [12] Podolec, B., Ulman, P., & Wałęga, A. (2008). Aktywność ekonomiczna gospodarstw domowych. Kraków: Wydawnictwo Uniwersytetu
Ekonomicznego w Krakowie. [13] Quintano, C., & D’Agostino, A. (2006). Studying Inequality in Income Distribution of Single-Person Households in Four Developed Countries.
Review of Income and Wealth, 52(4), 525-546. [14] Scott, J. (1997). Changing Households in Britain: Do Families Still Matter?. The Sociological Review, 45(4), 591–620. [15] The Future of Families to 2030. A Synthesis Report (2011). Paris: OECD. (http://www.oecd.org/futures/49093502.pdf). [16] Vespa, J., Lewis, J. M., & Kreider, R. M. (2013). America’s Families and Living Arrangements: 2012 Population Characteristics. U.S. Department
of Commerce. Economics and Statistics Administration, U.S. Census Bureau (https://www.census.gov/prod/2013pubs/p20-570.pdf). [17] Warzywoda-Kruszyńska, W., Szukalski P. (Eds.) (2004). Rodzina wzmieniającym się społeczeństwie polskim. Łódź: Wydawnictwo Uniwersytetu
Łódzkiego. [18] Youngho, L., Jungmin, H. (2013). The Rise of Single-Person Households and Changes in Consumption Patterns. Industrial Economic Review,
18(4), 16-28. [19] Żurek, A. (2003). Osoby samotne życiowo jako zjawisko społeczne.Blaski i Cienie Życia Rodzinnego Roczniki Socjologii Rodziny, XV, 123-136. [20] Żurek, A. (2008). Single. Żyjąc w pojedynkę. Poznań: Wydawnictwo Naukowe UAM.
22
An Ordered Probit Analysis of Farmer’s Willingness to Pay for Getting Quality Fertilizers: Evidence from Bangladesh
Mahmuda Nasrina1, Professor Dr. Siegfried Bauerb, Md. Armanc
a Ph.D. student, Faculty of Agricultural Science, Nutritional Science andEnvironmentalManagement,Justus-Liebig University, Senckenbergstrasse 3, 35392 Giessen, Germany, Email: [email protected]
bProfessor, Faculty of Agricultural Science, Nutritional Science andEnvironmental Management, Justus-Liebig University,GruenbergerStrasse 9,35390 Giessen, Germany, Email: [email protected]
c Master’s student, Faculty of Agricultural Science, Nutritional Science andEnvironmental Management, Justus-Liebig University, Senckenbergstrasse 3, 35392, Giessen, Germany, Email: [email protected]
Abstract
This study investigates the farmer’s willingness to pay for quality fertilizers when this becomes an issue to farmers as government assures affordable market prices for them following a universal subsidy policy. Primary data were collected from 299 farm households in three regions of Bangladesh based on farming concentration. For analyzing, a combination of probit and ordered probit models following the direct interview technique of stated preference method was employed. Results indicate that farmers have the most likelihood of paying in between one to ten percent more than market price for urea, one to fifteen percent less than the market price for TSP and eleven to twenty percent more than the market price for MoP. An average farmer’s WTP is influenced significantly by the farm size group which a particular farmer belongs to, annual income, off-farm income, product prices and financial constraints. All farmers except marginal farmers are more likely to be willing to pay more than market prices for urea and MoP. The findings suggest for adjusting the farm size group and nutrient specific pricing and subsidy polices in the country. Moreover, to strengthen farmer’s financial capability, more off-farm employment opportunities should be created in the farming regions.
Key words:willingness-to-pay, stated preference method, universal subsidy policy, quality fertilizers, farm size groups.
1. INTRODUCTION AND PROBLEM STATEMENT
Considering the central role of agriculture in the economies of Bangladesh, promoting efficient and effective use of fertilizer through providing subsidies has emerged as an important target of policies in recent decades. Agriculture sector contributes about 16.33 percent to the country’s gross domestic product (GDP) with an average growth rate of 3.35 percent (BER, 2015). Government policy reforms related to agricultural input sectors such as the fertilizer, seed and irrigation sectors are believed to have played an important role in the country’s agricultural growth. Among them, fertilizer use is a vital input in ensuring domestic food grain production. Roy and Farid (2011) showed that, mineral fertilizer use accounts for about 50 to 60 percent of the increase in cereal production in Bangladesh. Following the introduction, the use of chemical fertilizers in Bangladesh agriculture grew from 8.8 kg of nutrients per hectare in 1968 to 208.66 kg per hectare of land in 2013-14 (World Bank, 2016) in response to various factors along with subsidies and pricing policies. This is justified for Bangladesh agriculture as the country has virtually no possibility of increasing its
1 Corresponding author
23
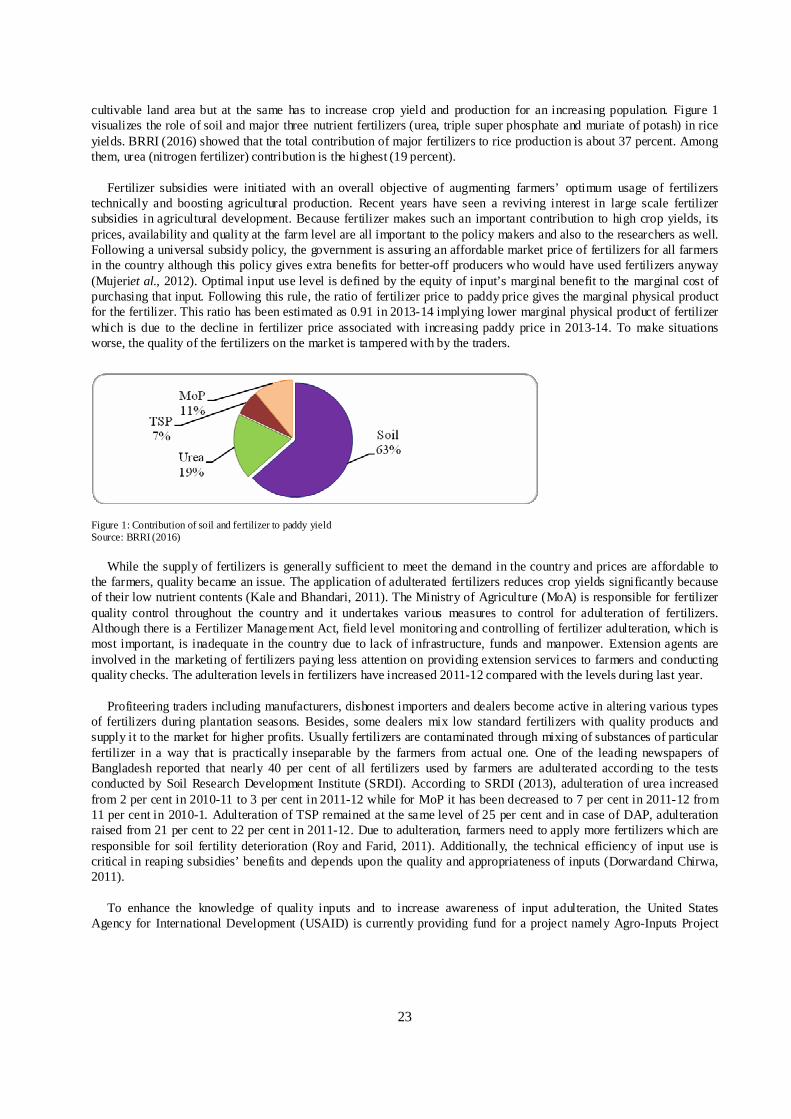
cultivable land area but at the same has to increase crop yield and production for an increasing population. Figure 1 visualizes the role of soil and major three nutrient fertilizers (urea, triple super phosphate and muriate of potash) in rice yields. BRRI (2016) showed that the total contribution of major fertilizers to rice production is about 37 percent. Among them, urea (nitrogen fertilizer) contribution is the highest (19 percent).
Fertilizer subsidies were initiated with an overall objective of augmenting farmers’ optimum usage of fertilizers
technically and boosting agricultural production. Recent years have seen a reviving interest in large scale fertilizer subsidies in agricultural development. Because fertilizer makes such an important contribution to high crop yields, its prices, availability and quality at the farm level are all important to the policy makers and also to the researchers as well. Following a universal subsidy policy, the government is assuring an affordable market price of fertilizers for all farmers in the country although this policy gives extra benefits for better-off producers who would have used fertilizers anyway (Mujeriet al., 2012). Optimal input use level is defined by the equity of input’s marginal benefit to the marginal cost of purchasing that input. Following this rule, the ratio of fertilizer price to paddy price gives the marginal physical product for the fertilizer. This ratio has been estimated as 0.91 in 2013-14 implying lower marginal physical product of fertilizer which is due to the decline in fertilizer price associated with increasing paddy price in 2013-14. To make situations worse, the quality of the fertilizers on the market is tampered with by the traders.
Figure 1: Contribution of soil and fertilizer to paddy yield Source: BRRI (2016)
While the supply of fertilizers is generally sufficient to meet the demand in the country and prices are affordable to the farmers, quality became an issue. The application of adulterated fertilizers reduces crop yields significantly because of their low nutrient contents (Kale and Bhandari, 2011). The Ministry of Agriculture (MoA) is responsible for fertilizer quality control throughout the country and it undertakes various measures to control for adulteration of fertilizers. Although there is a Fertilizer Management Act, field level monitoring and controlling of fertilizer adulteration, which is most important, is inadequate in the country due to lack of infrastructure, funds and manpower. Extension agents are involved in the marketing of fertilizers paying less attention on providing extension services to farmers and conducting quality checks. The adulteration levels in fertilizers have increased 2011-12 compared with the levels during last year.
Profiteering traders including manufacturers, dishonest importers and dealers become active in altering various types
of fertilizers during plantation seasons. Besides, some dealers mix low standard fertilizers with quality products and supply it to the market for higher profits. Usually fertilizers are contaminated through mixing of substances of particular fertilizer in a way that is practically inseparable by the farmers from actual one. One of the leading newspapers of Bangladesh reported that nearly 40 per cent of all fertilizers used by farmers are adulterated according to the tests conducted by Soil Research Development Institute (SRDI). According to SRDI (2013), adulteration of urea increased from 2 per cent in 2010-11 to 3 per cent in 2011-12 while for MoP it has been decreased to 7 per cent in 2011-12 from 11 per cent in 2010-1. Adulteration of TSP remained at the same level of 25 per cent and in case of DAP, adulteration raised from 21 per cent to 22 per cent in 2011-12. Due to adulteration, farmers need to apply more fertilizers which are responsible for soil fertility deterioration (Roy and Farid, 2011). Additionally, the technical efficiency of input use is critical in reaping subsidies’ benefits and depends upon the quality and appropriateness of inputs (Dorwardand Chirwa, 2011).
To enhance the knowledge of quality inputs and to increase awareness of input adulteration, the United States
Agency for International Development (USAID) is currently providing fund for a project namely Agro-Inputs Project
24
(AIP) in Bangladesh (Ellicott, 2016). This project is working for raising awareness of using quality, transmitting conventional ways to recognize quality and correct application methods among input retailers and farmers through mass media campaigns such as billboards, booklets, posters and cell phone Short Message Service (SMS). This project is committed to identify and combat the adulteration of all inputs. AIP supports more than 2500 agro-retailers through the Agro-Inputs Retailers’ Network (AIRN) which is an inputs training and service provider and works with retailers committed to supply quality agro-inputs, including fertilizers, to farmers. Therefore, adulteration or contamination of fertilizers at the farm level becomes one of the major problems regarding the fertilizer marketing in the country. Ensuring that Bangladeshi farmers have access to high quality and unadulterated fertilizers is critical to the country’s journey of improving productivity, achieving food security and generating higher incomes (Ellicott, 2016). In one hand, intensive cultivation along with climatic pressure is leading to soil depletion.
On the other hand, a combination of weak quality controls and lack of market information results in reduced yields
and income potential for the poorest populations. Government needs and should take into consideration the farmer’s willingness to pay for quality fertilizers in the pricing and subsidy policies. In this perspective, it is necessary that producers’ willingness to pay for quality fertilizers to be measured. This part of information will contribute to the debate of fertilizer subsidy policy and appropriate price decisions by the policy makers. Till date, no empirical research has been conducted in the country to deal with this issue. This research is an endeavor to extend the literature which will benefit producers, policy makers and government as a whole. Once we have an idea about the maximum amount that farmers are willing to pay, we can suggest some policies regarding market prices of fertilizers. The WTP results together with the factors affecting WTP of producers’ analysis will help to give an informed decision on the viability of existing subsidy policy and fertilizer marketing. Therefore, the major objective of the study is to model and analyze the farmer’s willingness-to-pay (WTP) for fertilizers with ensured quality and assess which factors are affecting mostly their WTP.
2. METHODOLOGY
The whole Bangladesh is divided into eight divisions which are further disaggregated into total 64 districts for administrative purposes. Districts are the prominent administrative unit in the country. Each district consists of several sub-districts (locally named as upazila) which are further divided into several villages. This research covers three districts namely, Dinajpur, Mymensingh and Tangailfrom northern part of Bangladesh based on the farming concentration.From each district, several sub-districts are selected. The economy of all the areas is predominantly agricultural of which more than 50 percent of the holdings are engaged in farming activities. During 2013-14, the consumption of four major chemical fertilizers (urea, TSP, MoP and DAP) is recorded as 178, 140 and 134 thousand metric tons which represents about 4.2 percent, 3.3 percent and 3.2 percent of country’s total fertilizer consumption in Dinajpur, Mymensingh and Tangail districts, respectively (BBS, 2014). The research is conducted at farm household level which is considered as the sampling unit. The households that are engaged in agricultural activities and have agricultural land are defined as farm households. The primary data and information required for analytical tools have been collected from the sampling units. Based on the objective and nature of the study, sampling units were identified through a multi-stage sampling procedure based on purposive selection. In total, 299 farm households were interviewed for necessary data collections along with some focus group discussions and key informant interviews. For investigating farmers’ willingness-to-pay, probit and ordered probit models are employed.
3. CONCEPTUALIZING WILLINGNESS TO PAY
Willingness to pay (WTP) is the foundation of the economic theory of value. In the neoclassical economic model, value is measured by willingness to pay for goods and services that are consumed as outputs or used as inputs. Researchers and policy makers consider WTP as a monetized individual value or utility for a good, input or service. Ward et al. (1991) define WTP as the price that society would be willing to pay for each successive unit of a good indicated by marginal demand or prices. On the other hand, Boardman et al. (1996) regards WTP as benefits which are the sums of the maximum amounts that people would be willing to pay to get outcomes that they view desirable. In the same manner, WTP is defined as the maximum price a buyer accepts to pay for a given quantity of goods or services by Kalish and Nelson (1991), Kohli and Mahajan (1991) and Wertenbroch and Skiera (2002). Therefore, it is the maximum amount of money that an individual would pay, along with a change in policy, without being made worse off.
25
Selection and application of a feasible method for measuring WTP is restricted by the time, finance and type of product for which WTP is to be estimated and obviously by research objectives. For our specific research problem, we followed direct survey under the stated preference method for revealing farmer’s WTP for fertilizers. The stated preference method has been applied to a wide range of applied research for measuring willingness to pay for both marketed and non-marketed products and inputs. This method relies on the hypothetical responses of respondents regarding their preferences and willingness to pay. Based on the nature of product or input for which WTP is to be estimated, one can conduct direct and indirect surveys for collecting the relevant data. With direct surveys, respondents are asked to directly state how much they would be willing to pay for the product to have some policy changes. This is termed as open-ended surveys. On the other hand, respondents may be asked to answer several successive questions on whether he would or would not buy the product at a given price or at a range of several given prices, in which case it will be closed-ended survey.Since we have collected primary data by directly interviewing the farmers, one question was asked to the farmers about how much maximum amount they would be willing to pay for a unit of unadulterated fertilizer considering their financial conditions and crop prices in a situation where they could afford a sufficient amount for their farm on regular basis? Before starting to ask questions about the prices, the respondents were explained very carefully about the quality issues of fertilizers. Zapata and Carpio(2012) explained the theoretical structures of producer’s willingness to pay which imply that the maximum amount of money that a producer is willingness to pay for quality inputs depends on the changes in farm’s profit levels. Because the use of more efficient inputs with higher quality levels is expected to reduce costs that are incurred in producing each additional unit of output. Moreover, producers’ WTP is an increasing function of final quality level and output prices.
4. ANALYTICAL TOOLS FOR ANALYZING WILLINGNESS TO PAY F OR FERTILIZERS
The reliability of WTP estimates depends on both the underlying survey design and the method of econometric analysis (Smith, 2007). In this section, we develop probit and ordered probit model within the context of the double hurdle model to analyze empirically the farmer’s willingness to pay for fertilizer and the factors which influences their WTP. This allows for a more flexible framework to model a producer’s willingness to pay as a simultaneous choice of two decisions instead of a single decision as proposed by Cragg (1971). The farmers first decide whether they will pay more or less than the current market price and then they decide the amount that they will be ready to pay. Arthur et al. (1994) argued that the development of this model is of particular relevance for analyzing data collected from surveys to reduce biased responses due to presupposition effects. If the respondents are not asked first if they will pay more than the current price or not, many respondents may presupposes that they should pay more than the market price and hence, overstate their willingness.
4.1 Empirical model for identifying the factors affecting farmer’s willingness to pay more than the market price for fertilizer
We used a probit regression model for estimating the influence of factors that affect farmer’s willingness to pay more than the current market price of three major fertilizers (urea, TSP and MoP). Here, the dependent variable used in the model has only two outcomes: will the farmers pay more than market price or not? Therefore, we cannot use the ordinary Least Square (OLS) method. Instead, we applied limited dependent variable regression model that is, probit model. The model takes the following form as presented in Gujarati (2003):
Pr (Y=1| X1i… Xni) = F(β1 X1i + β2 X2i + β3 X3i +…+ βnXni + εi) (1)
Where, Pr = Probability; Y= Farmer’s willingness to pay more than market price (1: Yes, if farmer is willing to pay more; O: otherwise); F = Cumulative distribution function (CDF) which follows standard normal distribution; X1i… Xni = Factors that affect farmer’s willingness to pay more; β1… βn = The parameters estimated using maximum likelihood estimation (MLE) procedure; and εi = Random component.
26
4.2 Econometric model for analyzing farmers’ willingness to pay
The model for analyzing the farmers’ WTP for fertilizer could be specified using a normal linear probability model (LPM). The LPM model is a simple ordinary least square (OLS) regression that relates the probability of a ranking occurrence to the attributes of that product. Due to the discrete nature of the dependent variable, the LPM is constrained by its linear definition, heteroscedasticity and non-normality of the disturbances (Gujarati, 2003). We ranked the discrete WTP responses into six ordinal groups of percentages which makes the conclusion more readable, convenient and comparable. Hamathet al. (1997) explain that the utility of preference or WTP is an ordinal measure and the relative magnitude of the coefficients is more important than their absolute magnitude. Given the ordinal ranking of the WTP dependent variable, the ordered version of probit regression model was applied. In this study as WTP takes the form of a multiple response variable that has intrinsic order, the WTP model can be written using a latent variable as follows:
= βi Xi + εi(2)
Where, is the farmer’s unobserved willingness to pay;
X i is a vector of variables thought to influence willingness to pay; βi is a vector of parameters reflecting the relationship between willingness to pay and variables inand εi is an independently and identically distributed error term with mean zero and variance one.
If a farmer’s falls within a certain range, their WTPis assigned a numerical value that reflects the category in which their unobserved willingness to pay lies. Therefore, If then, = j -1 for all j = 1,..., J. Where, j is the WTP category and γ are unknown threshold parameters associated with WTP categories. These unknown threshold parameters are estimated along with βi assuming = −∞, = 0 and = ∞ (Senturk, 2009).Theoretically, willingness to pay is determined by the changes in utility from the choice made by an individual (Cranfield& Magnusson, 2003). Also WTP is likely to vary across individuals. Therefore, it is rational to use the relationship between WTP and factors affecting WTP to predict the probability of a farmer’s WTP within a certain range. The difference in these probabilities indicates the chance of that consumer’s WTP being between the defined levels. Specifically, the probability of having a WTP between two defined WTP levels is:
Pr (WTP1<WTP < WTP2) = Pr (Xiβi + εi≤ ) – Pr (Xiβi + εi ≤ ) (3)
Where, Pr is the probability; WTP1 and WTP2 are two limits of WTP; and and are threshold changes in utility
consistent with the WTP limits. Further, according to Cranfield and Magnusson (2003), we can express the probability of a farmer’s WTP being in one of J finite WTP categories as follows:
Pr ( = j -1) = Ф ( - Xiβi) - Ф ( - Xiβi) (4)
Where, Ф is the cumulative density function (CDF) which measures the probability of WTP being in one of the WTP
category. The discrete nature of WTP implied the adoption of either ordered probit or logit regression models to accomplish the model estimation. Both models are appropriate in dealing with discrete dependent variables and adjust better to a probability curve by using a logistic and a normal distribution function to estimate the probability of a certain WTP range. They also have the advantage that the utility function itself remains linear in the parameters. The difference between the output of an ordered probit and logit is minimal (Gujarati, 2003; Greene, 2003), although ordered probit is preferred when the order value of the dependent variable is important. Therefore, an ordered probit model is used in this research.
The ordered probit model allows for the calculation of predicted probabilities for each WTP category and marginal
effects like other probability models. When calculated at the means of the data, predicted probabilities indicate the chance of an individual being willing to pay a price falling within each of the categorical WTP levels. These can be used to measure the level of farmer’s WTP for different fertilizers. The estimated coefficients obtained from the model should
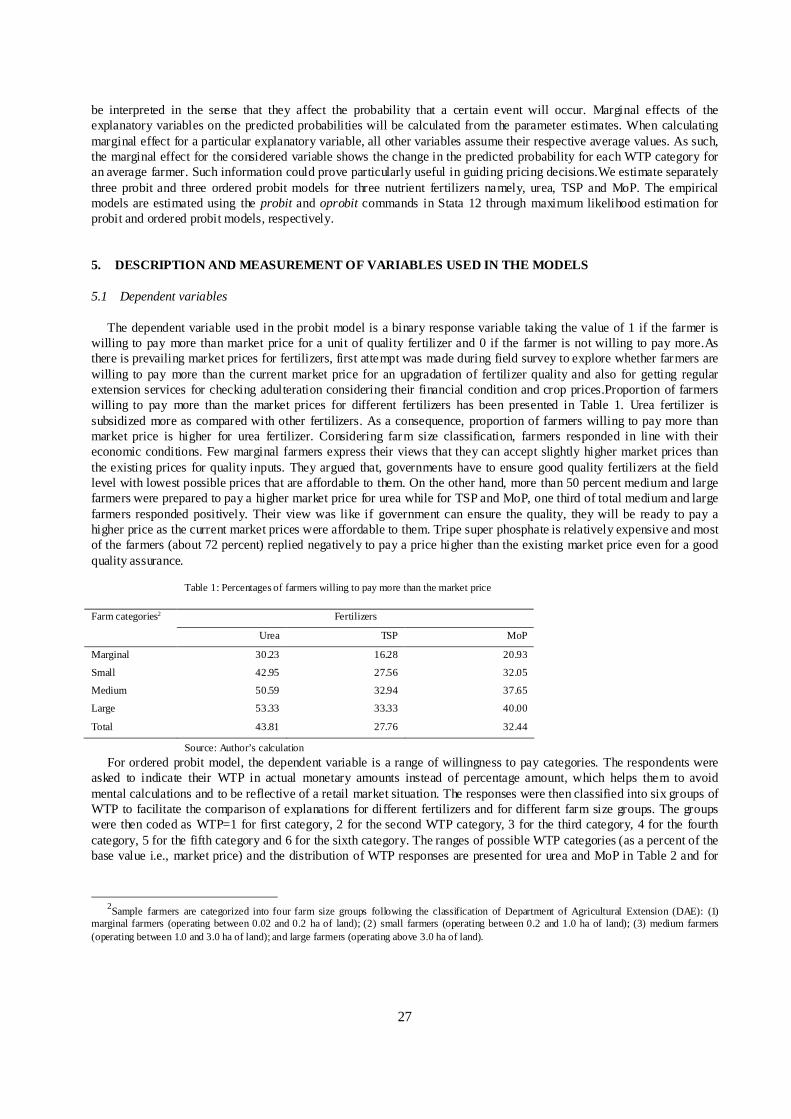
27
be interpreted in the sense that they affect the probability that a certain event will occur. Marginal effects of the explanatory variables on the predicted probabilities will be calculated from the parameter estimates. When calculating marginal effect for a particular explanatory variable, all other variables assume their respective average values. As such, the marginal effect for the considered variable shows the change in the predicted probability for each WTP category for an average farmer. Such information could prove particularly useful in guiding pricing decisions.We estimate separately three probit and three ordered probit models for three nutrient fertilizers namely, urea, TSP and MoP. The empirical models are estimated using the probit and oprobit commands in Stata 12 through maximum likelihood estimation for probit and ordered probit models, respectively.
5. DESCRIPTION AND MEASUREMENT OF VARIABLES USED IN TH E MODELS
5.1 Dependent variables
The dependent variable used in the probit model is a binary response variable taking the value of 1 if the farmer is willing to pay more than market price for a unit of quality fertilizer and 0 if the farmer is not willing to pay more.As there is prevailing market prices for fertilizers, first attempt was made during field survey to explore whether farmers are willing to pay more than the current market price for an upgradation of fertilizer quality and also for getting regular extension services for checking adulteration considering their financial condition and crop prices.Proportion of farmers willing to pay more than the market prices for different fertilizers has been presented in Table 1. Urea fertilizer is subsidized more as compared with other fertilizers. As a consequence, proportion of farmers willing to pay more than market price is higher for urea fertilizer. Considering farm size classification, farmers responded in line with their economic conditions. Few marginal farmers express their views that they can accept slightly higher market prices than the existing prices for quality inputs. They argued that, governments have to ensure good quality fertilizers at the field level with lowest possible prices that are affordable to them. On the other hand, more than 50 percent medium and large farmers were prepared to pay a higher market price for urea while for TSP and MoP, one third of total medium and large farmers responded positively. Their view was like if government can ensure the quality, they will be ready to pay a higher price as the current market prices were affordable to them. Tripe super phosphate is relatively expensive and most of the farmers (about 72 percent) replied negatively to pay a price higher than the existing market price even for a good quality assurance.
Table 1: Percentages of farmers willing to pay more than the market price
Fertilizers Farm categories2
Urea TSP MoP
Marginal 30.23 16.28 20.93
Small 42.95 27.56 32.05
Medium 50.59 32.94 37.65
Large 53.33 33.33 40.00
Total 43.81 27.76 32.44
Source: Author’s calculation
For ordered probit model, the dependent variable is a range of willingness to pay categories. The respondents were asked to indicate their WTP in actual monetary amounts instead of percentage amount, which helps them to avoid mental calculations and to be reflective of a retail market situation. The responses were then classified into six groups of WTP to facilitate the comparison of explanations for different fertilizers and for different farm size groups. The groups were then coded as WTP=1 for first category, 2 for the second WTP category, 3 for the third category, 4 for the fourth category, 5 for the fifth category and 6 for the sixth category. The ranges of possible WTP categories (as a percent of the base value i.e., market price) and the distribution of WTP responses are presented for urea and MoP in Table 2 and for
2Sample farmers are categorized into four farm size groups following the classification of Department of Agricultural Extension (DAE): (1)
marginal farmers (operating between 0.02 and 0.2 ha of land); (2) small farmers (operating between 0.2 and 1.0 ha of land); (3) medium farmers (operating between 1.0 and 3.0 ha of land); and large farmers (operating above 3.0 ha of land).
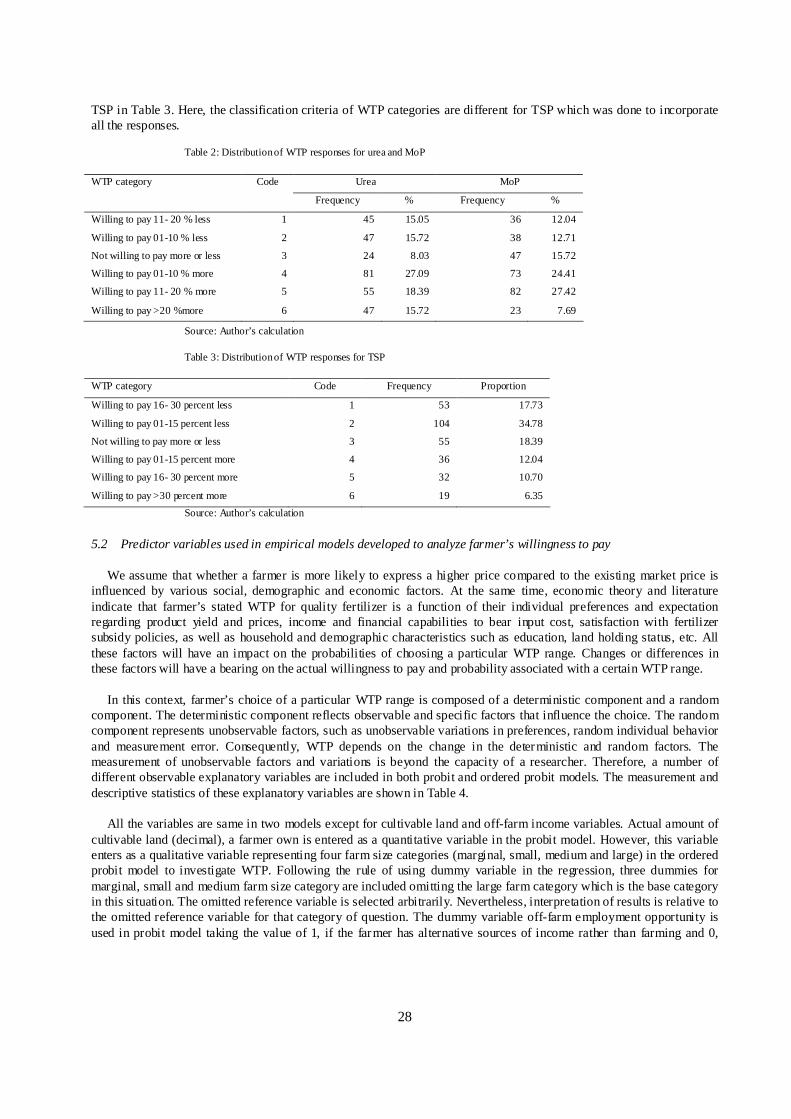
28
TSP in Table 3. Here, the classification criteria of WTP categories are different for TSP which was done to incorporate all the responses.
Table 2: Distribution of WTP responses for urea and MoP
Urea MoP WTP category Code
Frequency % Frequency %
Willing to pay 11- 20 % less 1 45 15.05 36 12.04
Willing to pay 01-10 % less 2 47 15.72 38 12.71
Not willing to pay more or less 3 24 8.03 47 15.72
Willing to pay 01-10 % more 4 81 27.09 73 24.41
Willing to pay 11- 20 % more 5 55 18.39 82 27.42
Willing to pay >20 %more 6 47 15.72 23 7.69
Source: Author’s calculation
Table 3: Distribution of WTP responses for TSP
WTP category Code Frequency Proportion
Willing to pay 16- 30 percent less 1 53 17.73
Willing to pay 01-15 percent less 2 104 34.78
Not willing to pay more or less 3 55 18.39
Willing to pay 01-15 percent more 4 36 12.04
Willing to pay 16- 30 percent more 5 32 10.70
Willing to pay >30 percent more 6 19 6.35
Source: Author’s calculation
5.2 Predictor variables used in empirical models developed to analyze farmer’s willingness to pay
We assume that whether a farmer is more likely to express a higher price compared to the existing market price is influenced by various social, demographic and economic factors. At the same time, economic theory and literature indicate that farmer’s stated WTP for quality fertilizer is a function of their individual preferences and expectation regarding product yield and prices, income and financial capabilities to bear input cost, satisfaction with fertilizer subsidy policies, as well as household and demographic characteristics such as education, land holding status, etc. All these factors will have an impact on the probabilities of choosing a particular WTP range. Changes or differences in these factors will have a bearing on the actual willingness to pay and probability associated with a certain WTP range.
In this context, farmer’s choice of a particular WTP range is composed of a deterministic component and a random
component. The deterministic component reflects observable and specific factors that influence the choice. The random component represents unobservable factors, such as unobservable variations in preferences, random individual behavior and measurement error. Consequently, WTP depends on the change in the deterministic and random factors. The measurement of unobservable factors and variations is beyond the capacity of a researcher. Therefore, a number of different observable explanatory variables are included in both probit and ordered probit models. The measurement and descriptive statistics of these explanatory variables are shown in Table 4.
All the variables are same in two models except for cultivable land and off-farm income variables. Actual amount of
cultivable land (decimal), a farmer own is entered as a quantitative variable in the probit model. However, this variable enters as a qualitative variable representing four farm size categories (marginal, small, medium and large) in the ordered probit model to investigate WTP. Following the rule of using dummy variable in the regression, three dummies for marginal, small and medium farm size category are included omitting the large farm category which is the base category in this situation. The omitted reference variable is selected arbitrarily. Nevertheless, interpretation of results is relative to the omitted reference variable for that category of question. The dummy variable off-farm employment opportunity is used in probit model taking the value of 1, if the farmer has alternative sources of income rather than farming and 0,
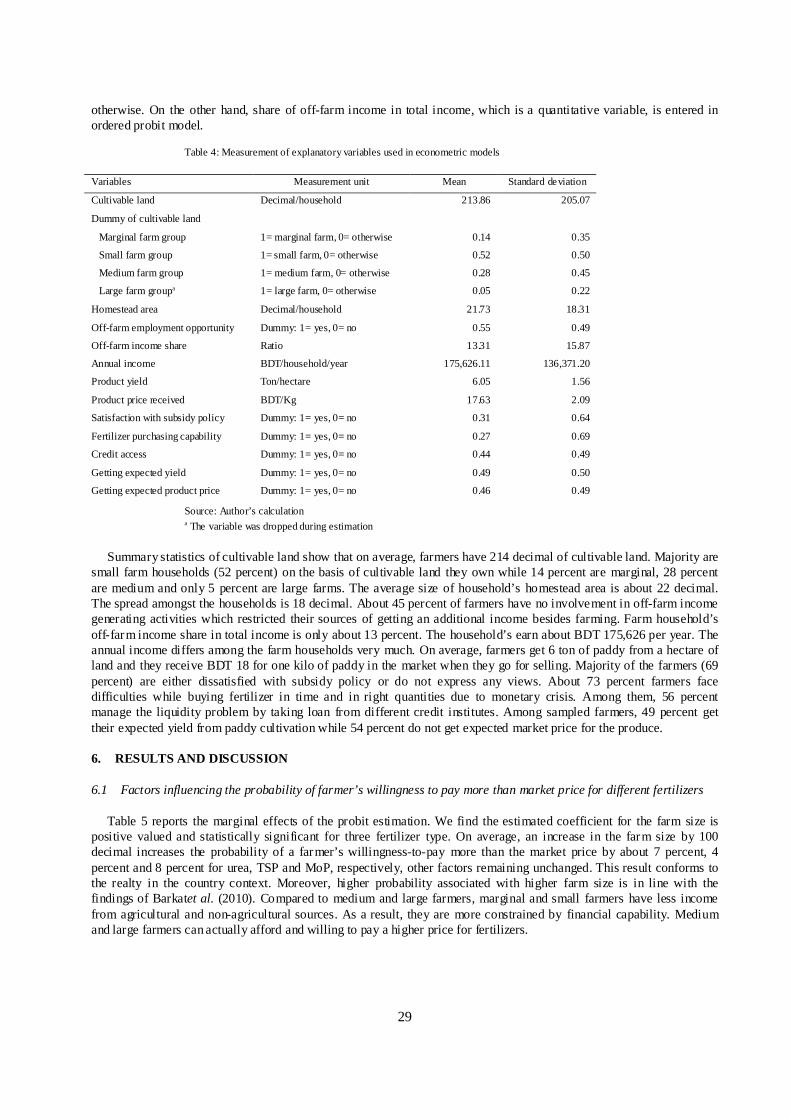
29
otherwise. On the other hand, share of off-farm income in total income, which is a quantitative variable, is entered in ordered probit model.
Table 4: Measurement of explanatory variables used in econometric models
Variables Measurement unit Mean Standard deviation
Cultivable land Decimal/household 213.86 205.07
Dummy of cultivable land
Marginal farm group 1= marginal farm, 0= otherwise 0.14 0.35
Small farm group 1= small farm, 0= otherwise 0.52 0.50
Medium farm group 1= medium farm, 0= otherwise 0.28 0.45
Large farm groupa 1= large farm, 0= otherwise 0.05 0.22
Homestead area Decimal/household 21.73 18.31
Off-farm employment opportunity Dummy: 1= yes, 0= no 0.55 0.49
Off-farm income share Ratio 13.31 15.87
Annual income BDT/household/year 175,626.11 136,371.20
Product yield Ton/hectare 6.05 1.56
Product price received BDT/Kg 17.63 2.09
Satisfaction with subsidy policy Dummy: 1= yes, 0= no 0.31 0.64
Fertilizer purchasing capability Dummy: 1= yes, 0= no 0.27 0.69
Credit access Dummy: 1= yes, 0= no 0.44 0.49
Getting expected yield Dummy: 1= yes, 0= no 0.49 0.50
Getting expected product price Dummy: 1= yes, 0= no 0.46 0.49
Source: Author’s calculation a The variable was dropped during estimation
Summary statistics of cultivable land show that on average, farmers have 214 decimal of cultivable land. Majority are small farm households (52 percent) on the basis of cultivable land they own while 14 percent are marginal, 28 percent are medium and only 5 percent are large farms. The average size of household’s homestead area is about 22 decimal. The spread amongst the households is 18 decimal. About 45 percent of farmers have no involvement in off-farm income generating activities which restricted their sources of getting an additional income besides farming. Farm household’s off-farm income share in total income is only about 13 percent. The household’s earn about BDT 175,626 per year. The annual income differs among the farm households very much. On average, farmers get 6 ton of paddy from a hectare of land and they receive BDT 18 for one kilo of paddy in the market when they go for selling. Majority of the farmers (69 percent) are either dissatisfied with subsidy policy or do not express any views. About 73 percent farmers face difficulties while buying fertilizer in time and in right quantities due to monetary crisis. Among them, 56 percent manage the liquidity problem by taking loan from different credit institutes. Among sampled farmers, 49 percent get their expected yield from paddy cultivation while 54 percent do not get expected market price for the produce.
6. RESULTS AND DISCUSSION
6.1 Factors influencing the probability of farmer’s willingness to pay more than market price for different fertilizers
Table 5 reports the marginal effects of the probit estimation. We find the estimated coefficient for the farm size is positive valued and statistically significant for three fertilizer type. On average, an increase in the farm size by 100 decimal increases the probability of a farmer’s willingness-to-pay more than the market price by about 7 percent, 4 percent and 8 percent for urea, TSP and MoP, respectively, other factors remaining unchanged. This result conforms to the realty in the country context. Moreover, higher probability associated with higher farm size is in line with the findings of Barkatet al. (2010). Compared to medium and large farmers, marginal and small farmers have less income from agricultural and non-agricultural sources. As a result, they are more constrained by financial capability. Medium and large farmers can actually afford and willing to pay a higher price for fertilizers.
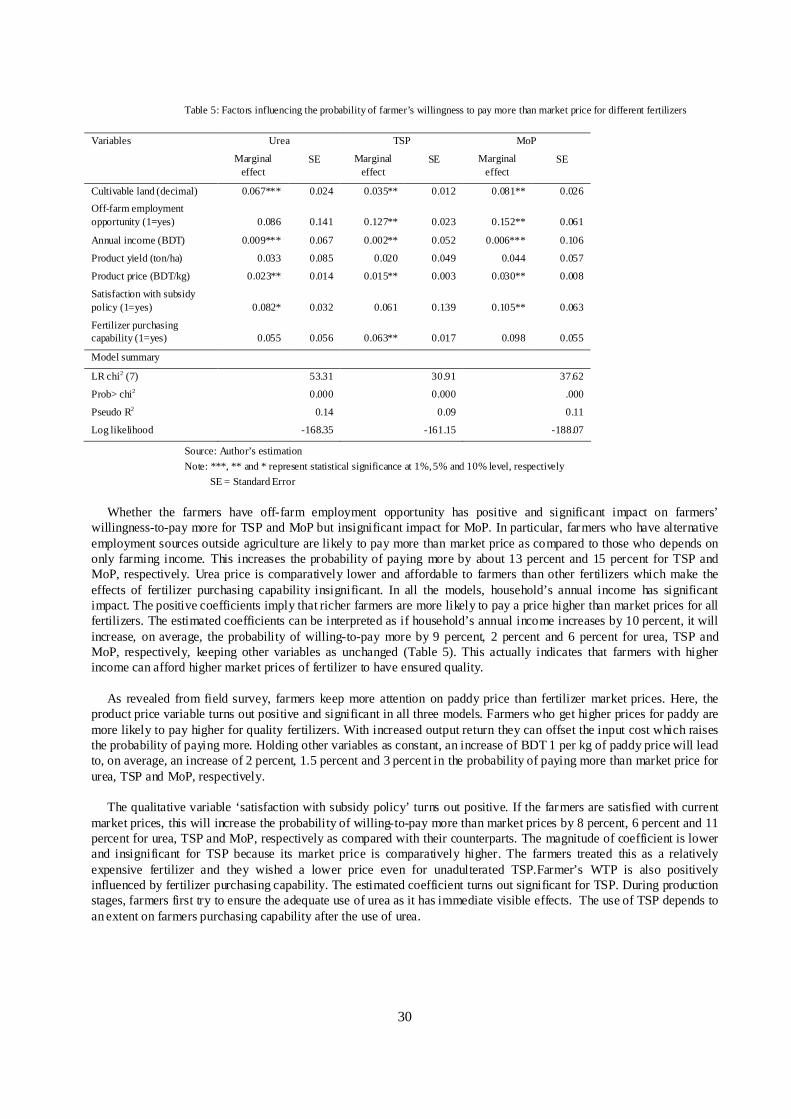
30
Table 5: Factors influencing the probability of farmer’s willingness to pay more than market price for different fertilizers
Urea TSP MoP Variables
Marginal effect
SE Marginal effect
SE Marginal effect
SE
Cultivable land (decimal) 0.067*** 0.024 0.035** 0.012 0.081** 0.026
Off-farm employment opportunity (1=yes)
0.086
0.141
0.127**
0.023
0.152**
0.061
Annual income (BDT) 0.009*** 0.067 0.002** 0.052 0.006*** 0.106
Product yield (ton/ha) 0.033 0.085 0.020 0.049 0.044 0.057
Product price (BDT/kg) 0.023** 0.014 0.015** 0.003 0.030** 0.008
Satisfaction with subsidy policy (1=yes)
0.082*
0.032
0.061
0.139
0.105**
0.063
Fertilizer purchasing capability (1=yes)
0.055
0.056
0.063**
0.017
0.098
0.055
Model summary
LR chi2 (7) 53.31 30.91 37.62
Prob> chi2 0.000 0.000 .000
Pseudo R2 0.14 0.09 0.11
Log likelihood -168.35 -161.15 -188.07
Source: Author’s estimation
Note: ***, ** and * represent statistical significance at 1%, 5% and 10% level, respectively
SE = Standard Error
Whether the farmers have off-farm employment opportunity has positive and significant impact on farmers’
willingness-to-pay more for TSP and MoP but insignificant impact for MoP. In particular, farmers who have alternative employment sources outside agriculture are likely to pay more than market price as compared to those who depends on only farming income. This increases the probability of paying more by about 13 percent and 15 percent for TSP and MoP, respectively. Urea price is comparatively lower and affordable to farmers than other fertilizers which make the effects of fertilizer purchasing capability insignificant. In all the models, household’s annual income has significant impact. The positive coefficients imply that richer farmers are more likely to pay a price higher than market prices for all fertilizers. The estimated coefficients can be interpreted as if household’s annual income increases by 10 percent, it will increase, on average, the probability of willing-to-pay more by 9 percent, 2 percent and 6 percent for urea, TSP and MoP, respectively, keeping other variables as unchanged (Table 5). This actually indicates that farmers with higher income can afford higher market prices of fertilizer to have ensured quality.
As revealed from field survey, farmers keep more attention on paddy price than fertilizer market prices. Here, the
product price variable turns out positive and significant in all three models. Farmers who get higher prices for paddy are more likely to pay higher for quality fertilizers. With increased output return they can offset the input cost which raises the probability of paying more. Holding other variables as constant, an increase of BDT 1 per kg of paddy price will lead to, on average, an increase of 2 percent, 1.5 percent and 3 percent in the probability of paying more than market price for urea, TSP and MoP, respectively.
The qualitative variable ‘satisfaction with subsidy policy’ turns out positive. If the farmers are satisfied with current
market prices, this will increase the probability of willing-to-pay more than market prices by 8 percent, 6 percent and 11 percent for urea, TSP and MoP, respectively as compared with their counterparts. The magnitude of coefficient is lower and insignificant for TSP because its market price is comparatively higher. The farmers treated this as a relatively expensive fertilizer and they wished a lower price even for unadulterated TSP.Farmer’s WTP is also positively influenced by fertilizer purchasing capability. The estimated coefficient turns out significant for TSP. During production stages, farmers first try to ensure the adequate use of urea as it has immediate visible effects. The use of TSP depends to an extent on farmers purchasing capability after the use of urea.
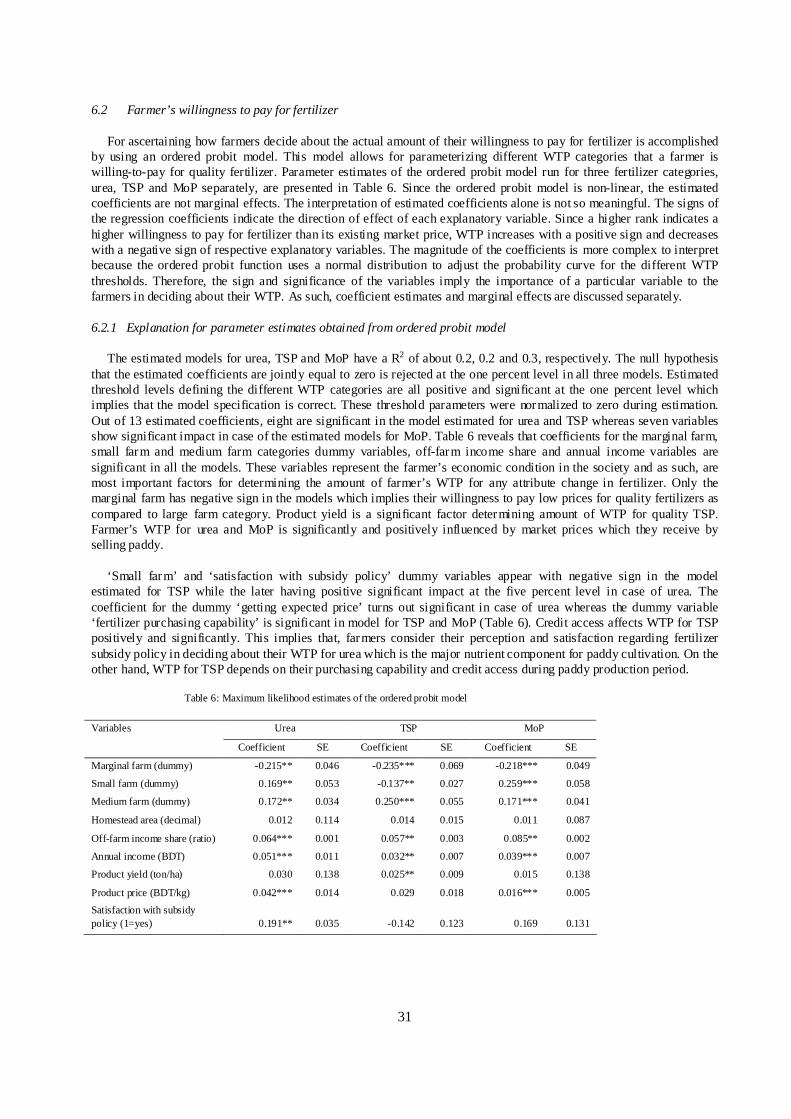
31
6.2 Farmer’s willingness to pay for fertilizer
For ascertaining how farmers decide about the actual amount of their willingness to pay for fertilizer is accomplished by using an ordered probit model. This model allows for parameterizing different WTP categories that a farmer is willing-to-pay for quality fertilizer. Parameter estimates of the ordered probit model run for three fertilizer categories, urea, TSP and MoP separately, are presented in Table 6. Since the ordered probit model is non-linear, the estimated coefficients are not marginal effects. The interpretation of estimated coefficients alone is not so meaningful. The signs of the regression coefficients indicate the direction of effect of each explanatory variable. Since a higher rank indicates a higher willingness to pay for fertilizer than its existing market price, WTP increases with a positive sign and decreases with a negative sign of respective explanatory variables. The magnitude of the coefficients is more complex to interpret because the ordered probit function uses a normal distribution to adjust the probability curve for the different WTP thresholds. Therefore, the sign and significance of the variables imply the importance of a particular variable to the farmers in deciding about their WTP. As such, coefficient estimates and marginal effects are discussed separately.
6.2.1 Explanation for parameter estimates obtained from ordered probit model
The estimated models for urea, TSP and MoP have a R2 of about 0.2, 0.2 and 0.3, respectively. The null hypothesis that the estimated coefficients are jointly equal to zero is rejected at the one percent level in all three models. Estimated threshold levels defining the different WTP categories are all positive and significant at the one percent level which implies that the model specification is correct. These threshold parameters were normalized to zero during estimation. Out of 13 estimated coefficients, eight are significant in the model estimated for urea and TSP whereas seven variables show significant impact in case of the estimated models for MoP. Table 6 reveals that coefficients for the marginal farm, small farm and medium farm categories dummy variables, off-farm income share and annual income variables are significant in all the models. These variables represent the farmer’s economic condition in the society and as such, are most important factors for determining the amount of farmer’s WTP for any attribute change in fertilizer. Only the marginal farm has negative sign in the models which implies their willingness to pay low prices for quality fertilizers as compared to large farm category. Product yield is a significant factor determining amount of WTP for quality TSP. Farmer’s WTP for urea and MoP is significantly and positively influenced by market prices which they receive by selling paddy.
‘Small farm’ and ‘satisfaction with subsidy policy’ dummy variables appear with negative sign in the model
estimated for TSP while the later having positive significant impact at the five percent level in case of urea. The coefficient for the dummy ‘getting expected price’ turns out significant in case of urea whereas the dummy variable ‘fertilizer purchasing capability’ is significant in model for TSP and MoP (Table 6). Credit access affects WTP for TSP positively and significantly. This implies that, farmers consider their perception and satisfaction regarding fertilizer subsidy policy in deciding about their WTP for urea which is the major nutrient component for paddy cultivation. On the other hand, WTP for TSP depends on their purchasing capability and credit access during paddy production period.
Table 6: Maximum likelihood estimates of the ordered probit model
Urea TSP MoP Variables
Coefficient SE Coefficient SE Coefficient SE
Marginal farm (dummy) -0.215** 0.046 -0.235*** 0.069 -0.218*** 0.049
Small farm (dummy) 0.169** 0.053 -0.137** 0.027 0.259*** 0.058
Medium farm (dummy) 0.172** 0.034 0.250*** 0.055 0.171*** 0.041
Homestead area (decimal) 0.012 0.114 0.014 0.015 0.011 0.087
Off-farm income share (ratio) 0.064*** 0.001 0.057** 0.003 0.085** 0.002
Annual income (BDT) 0.051*** 0.011 0.032** 0.007 0.039*** 0.007
Product yield (ton/ha) 0.030 0.138 0.025** 0.009 0.015 0.138
Product price (BDT/kg) 0.042*** 0.014 0.029 0.018 0.016*** 0.005
Satisfaction with subsidy policy (1=yes)
0.191**
0.035
-0.142
0.123
0.169
0.131
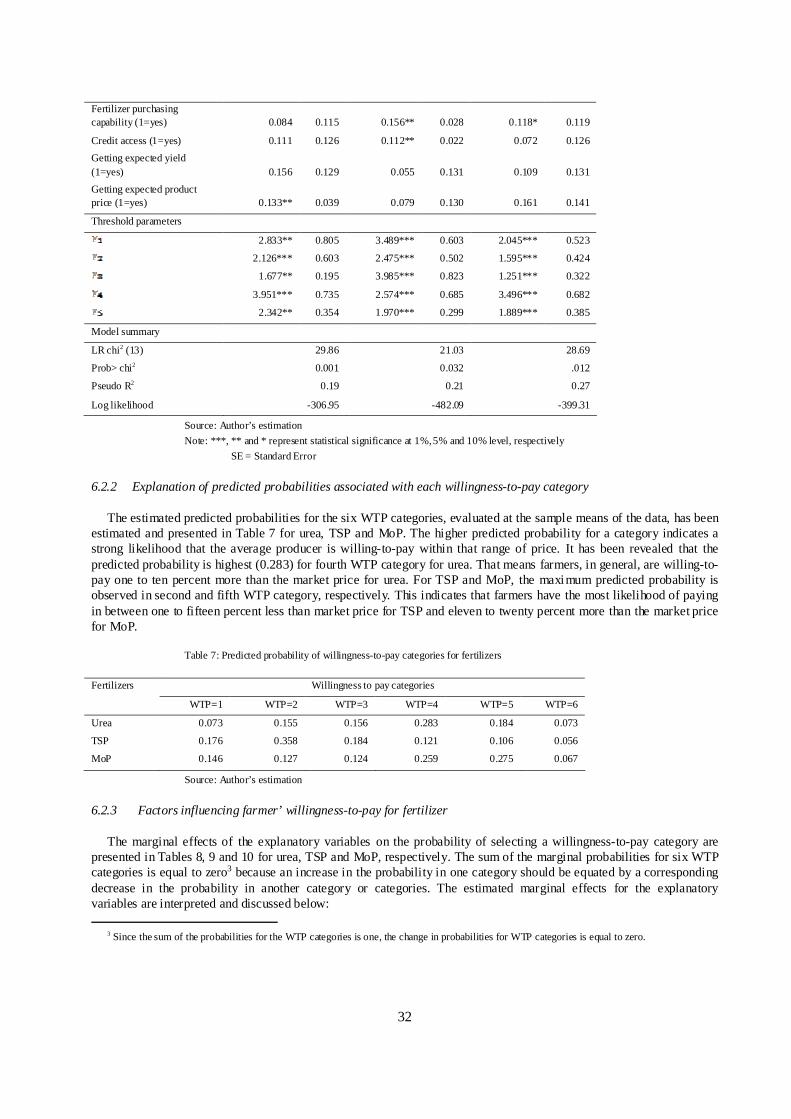
32
Fertilizer purchasing capability (1=yes)
0.084
0.115
0.156**
0.028
0.118*
0.119
Credit access (1=yes) 0.111 0.126 0.112** 0.022 0.072 0.126
Getting expected yield (1=yes)
0.156
0.129
0.055
0.131
0.109
0.131
Getting expected product price (1=yes)
0.133**
0.039
0.079
0.130
0.161
0.141
Threshold parameters
2.833** 0.805 3.489*** 0.603 2.045*** 0.523
2.126*** 0.603 2.475*** 0.502 1.595*** 0.424
1.677** 0.195 3.985*** 0.823 1.251*** 0.322
3.951*** 0.735 2.574*** 0.685 3.496*** 0.682
2.342** 0.354 1.970*** 0.299 1.889*** 0.385
Model summary
LR chi2 (13) 29.86 21.03 28.69
Prob> chi2 0.001 0.032 .012
Pseudo R2 0.19 0.21 0.27
Log likelihood -306.95 -482.09 -399.31
Source: Author’s estimation
Note: ***, ** and * represent statistical significance at 1%, 5% and 10% level, respectively
SE = Standard Error
6.2.2 Explanation of predicted probabilities associated with each willingness-to-pay category
The estimated predicted probabilities for the six WTP categories, evaluated at the sample means of the data, has been estimated and presented in Table 7 for urea, TSP and MoP. The higher predicted probability for a category indicates a strong likelihood that the average producer is willing-to-pay within that range of price. It has been revealed that the predicted probability is highest (0.283) for fourth WTP category for urea. That means farmers, in general, are willing-to-pay one to ten percent more than the market price for urea. For TSP and MoP, the maximum predicted probability is observed in second and fifth WTP category, respectively. This indicates that farmers have the most likelihood of paying in between one to fifteen percent less than market price for TSP and eleven to twenty percent more than the market price for MoP.
Table 7: Predicted probability of willingness-to-pay categories for fertilizers
Willingness to pay categories Fertilizers
WTP=1 WTP=2 WTP=3 WTP=4 WTP=5 WTP=6
Urea 0.073 0.155 0.156 0.283 0.184 0.073
TSP 0.176 0.358 0.184 0.121 0.106 0.056
MoP 0.146 0.127 0.124 0.259 0.275 0.067
Source: Author’s estimation
6.2.3 Factors influencing farmer’ willingness-to-pay for fertilizer
The marginal effects of the explanatory variables on the probability of selecting a willingness-to-pay category are presented in Tables 8, 9 and 10 for urea, TSP and MoP, respectively. The sum of the marginal probabilities for six WTP categories is equal to zero3 because an increase in the probability in one category should be equated by a corresponding decrease in the probability in another category or categories. The estimated marginal effects for the explanatory variables are interpreted and discussed below:
3 Since the sum of the probabilities for the WTP categories is one, the change in probabilities for WTP categories is equal to zero.
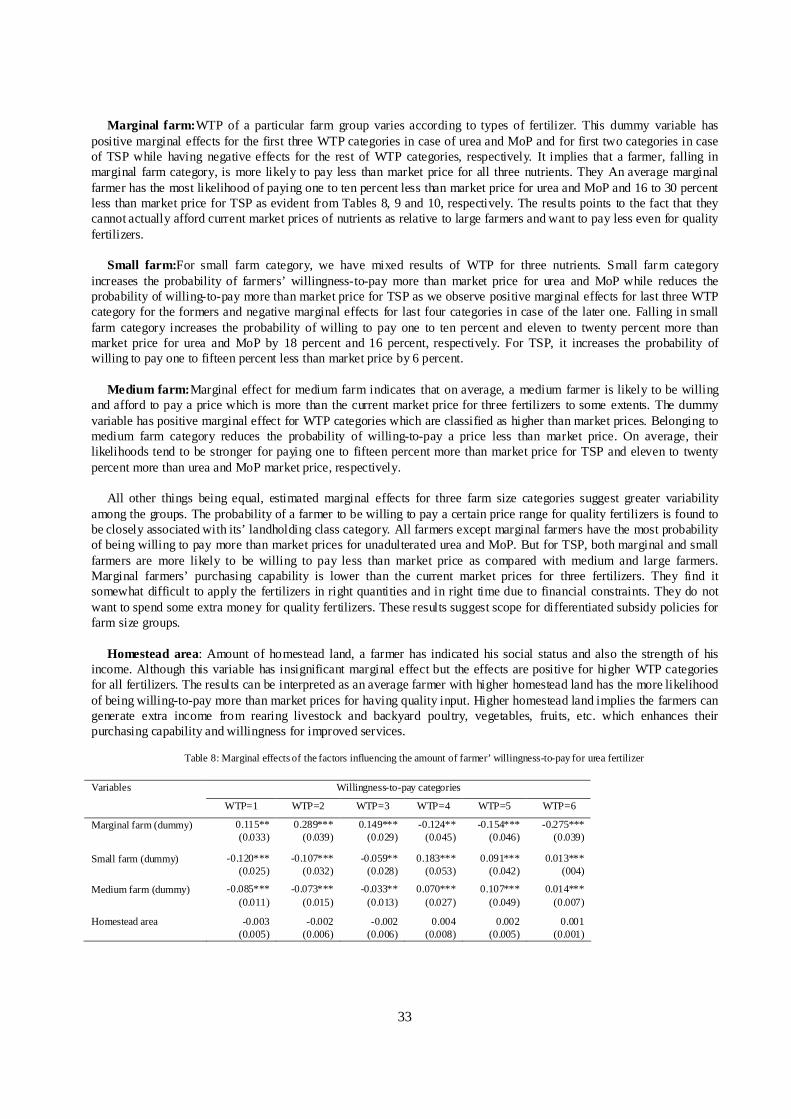
33
Marginal farm: WTP of a particular farm group varies according to types of fertilizer. This dummy variable has
positive marginal effects for the first three WTP categories in case of urea and MoP and for first two categories in case of TSP while having negative effects for the rest of WTP categories, respectively. It implies that a farmer, falling in marginal farm category, is more likely to pay less than market price for all three nutrients. They An average marginal farmer has the most likelihood of paying one to ten percent less than market price for urea and MoP and 16 to 30 percent less than market price for TSP as evident from Tables 8, 9 and 10, respectively. The results points to the fact that they cannot actually afford current market prices of nutrients as relative to large farmers and want to pay less even for quality fertilizers.
Small farm:For small farm category, we have mixed results of WTP for three nutrients. Small farm category
increases the probability of farmers’ willingness-to-pay more than market price for urea and MoP while reduces the probability of willing-to-pay more than market price for TSP as we observe positive marginal effects for last three WTP category for the formers and negative marginal effects for last four categories in case of the later one. Falling in small farm category increases the probability of willing to pay one to ten percent and eleven to twenty percent more than market price for urea and MoP by 18 percent and 16 percent, respectively. For TSP, it increases the probability of willing to pay one to fifteen percent less than market price by 6 percent.
Medium farm: Marginal effect for medium farm indicates that on average, a medium farmer is likely to be willing
and afford to pay a price which is more than the current market price for three fertilizers to some extents. The dummy variable has positive marginal effect for WTP categories which are classified as higher than market prices. Belonging to medium farm category reduces the probability of willing-to-pay a price less than market price. On average, their likelihoods tend to be stronger for paying one to fifteen percent more than market price for TSP and eleven to twenty percent more than urea and MoP market price, respectively.
All other things being equal, estimated marginal effects for three farm size categories suggest greater variability
among the groups. The probability of a farmer to be willing to pay a certain price range for quality fertilizers is found to be closely associated with its’ landholding class category. All farmers except marginal farmers have the most probability of being willing to pay more than market prices for unadulterated urea and MoP. But for TSP, both marginal and small farmers are more likely to be willing to pay less than market price as compared with medium and large farmers. Marginal farmers’ purchasing capability is lower than the current market prices for three fertilizers. They find it somewhat difficult to apply the fertilizers in right quantities and in right time due to financial constraints. They do not want to spend some extra money for quality fertilizers. These results suggest scope for differentiated subsidy policies for farm size groups.
Homestead area: Amount of homestead land, a farmer has indicated his social status and also the strength of his
income. Although this variable has insignificant marginal effect but the effects are positive for higher WTP categories for all fertilizers. The results can be interpreted as an average farmer with higher homestead land has the more likelihood of being willing-to-pay more than market prices for having quality input. Higher homestead land implies the farmers can generate extra income from rearing livestock and backyard poultry, vegetables, fruits, etc. which enhances their purchasing capability and willingness for improved services.
Table 8: Marginal effects of the factors influencing the amount of farmer’ willingness-to-pay for urea fertilizer
Willingness-to-pay categories Variables
WTP=1 WTP=2 WTP=3 WTP=4 WTP=5 WTP=6
Marginal farm (dummy) 0.115** (0.033)
0.289*** (0.039)
0.149*** (0.029)
-0.124** (0.045)
-0.154*** (0.046)
-0.275*** (0.039)
Small farm (dummy) -0.120*** (0.025)
-0.107*** (0.032)
-0.059** (0.028)
0.183*** (0.053)
0.091*** (0.042)
0.013*** (004)
Medium farm (dummy) -0.085*** (0.011)
-0.073*** (0.015)
-0.033** (0.013)
0.070*** (0.027)
0.107*** (0.049)
0.014*** (0.007)
Homestead area -0.003 (0.005)
-0.002 (0.006)
-0.002 (0.006)
0.004 (0.008)
0.002 (0.005)
0.001 (0.001)
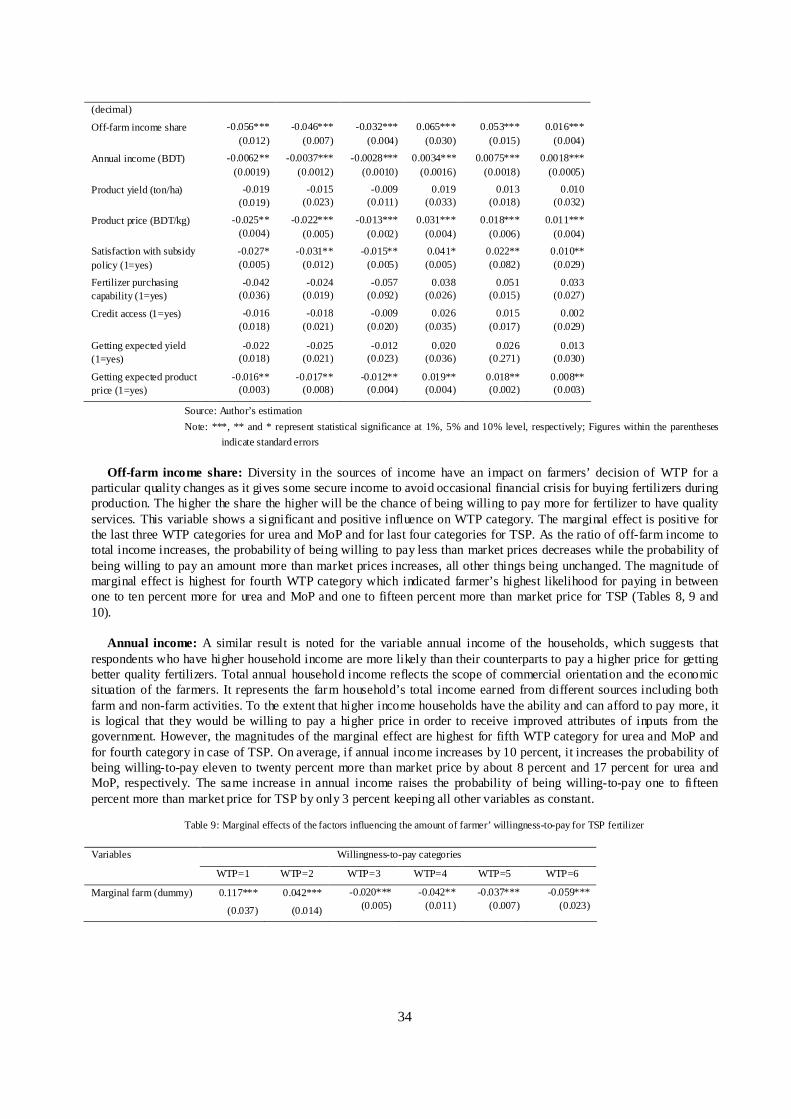
34
(decimal)
Off-farm income share -0.056*** (0.012)
-0.046*** (0.007)
-0.032*** (0.004)
0.065*** (0.030)
0.053*** (0.015)
0.016*** (0.004)
Annual income (BDT) -0.0062** (0.0019)
-0.0037*** (0.0012)
-0.0028*** (0.0010)
0.0034*** (0.0016)
0.0075*** (0.0018)
0.0018*** (0.0005)
Product yield (ton/ha) -0.019 (0.019)
-0.015 (0.023)
-0.009 (0.011)
0.019 (0.033)
0.013 (0.018)
0.010 (0.032)
Product price (BDT/kg) -0.025** (0.004)
-0.022*** (0.005)
-0.013*** (0.002)
0.031*** (0.004)
0.018*** (0.006)
0.011*** (0.004)
Satisfaction with subsidy policy (1=yes)
-0.027* (0.005)
-0.031** (0.012)
-0.015** (0.005)
0.041* (0.005)
0.022** (0.082)
0.010** (0.029)
Fertilizer purchasing capability (1=yes)
-0.042 (0.036)
-0.024 (0.019)
-0.057 (0.092)
0.038 (0.026)
0.051 (0.015)
0.033 (0.027)
Credit access (1=yes) -0.016 (0.018)
-0.018 (0.021)
-0.009 (0.020)
0.026 (0.035)
0.015 (0.017)
0.002 (0.029)
Getting expected yield (1=yes)
-0.022 (0.018)
-0.025 (0.021)
-0.012 (0.023)
0.020 (0.036)
0.026 (0.271)
0.013 (0.030)
Getting expected product price (1=yes)
-0.016** (0.003)
-0.017** (0.008)
-0.012** (0.004)
0.019** (0.004)
0.018** (0.002)
0.008** (0.003)
Source: Author’s estimation
Note: ***, ** and * represent statistical significance at 1%, 5% and 10% level, respectively; Figures within the parentheses
indicate standard errors
Off-farm income share: Diversity in the sources of income have an impact on farmers’ decision of WTP for a
particular quality changes as it gives some secure income to avoid occasional financial crisis for buying fertilizers during production. The higher the share the higher will be the chance of being willing to pay more for fertilizer to have quality services. This variable shows a significant and positive influence on WTP category. The marginal effect is positive for the last three WTP categories for urea and MoP and for last four categories for TSP. As the ratio of off-farm income to total income increases, the probability of being willing to pay less than market prices decreases while the probability of being willing to pay an amount more than market prices increases, all other things being unchanged. The magnitude of marginal effect is highest for fourth WTP category which indicated farmer’s highest likelihood for paying in between one to ten percent more for urea and MoP and one to fifteen percent more than market price for TSP (Tables 8, 9 and 10).
Annual income: A similar result is noted for the variable annual income of the households, which suggests that
respondents who have higher household income are more likely than their counterparts to pay a higher price for getting better quality fertilizers. Total annual household income reflects the scope of commercial orientation and the economic situation of the farmers. It represents the farm household’s total income earned from different sources including both farm and non-farm activities. To the extent that higher income households have the ability and can afford to pay more, it is logical that they would be willing to pay a higher price in order to receive improved attributes of inputs from the government. However, the magnitudes of the marginal effect are highest for fifth WTP category for urea and MoP and for fourth category in case of TSP. On average, if annual income increases by 10 percent, it increases the probability of being willing-to-pay eleven to twenty percent more than market price by about 8 percent and 17 percent for urea and MoP, respectively. The same increase in annual income raises the probability of being willing-to-pay one to fifteen percent more than market price for TSP by only 3 percent keeping all other variables as constant.
Table 9: Marginal effects of the factors influencing the amount of farmer’ willingness-to-pay for TSP fertilizer
Willingness-to-pay categories Variables
WTP=1 WTP=2 WTP=3 WTP=4 WTP=5 WTP=6
Marginal farm (dummy) 0.117***
(0.037)
0.042***
(0.014)
-0.020*** (0.005)
-0.042** (0.011)
-0.037*** (0.007)
-0.059*** (0.023)
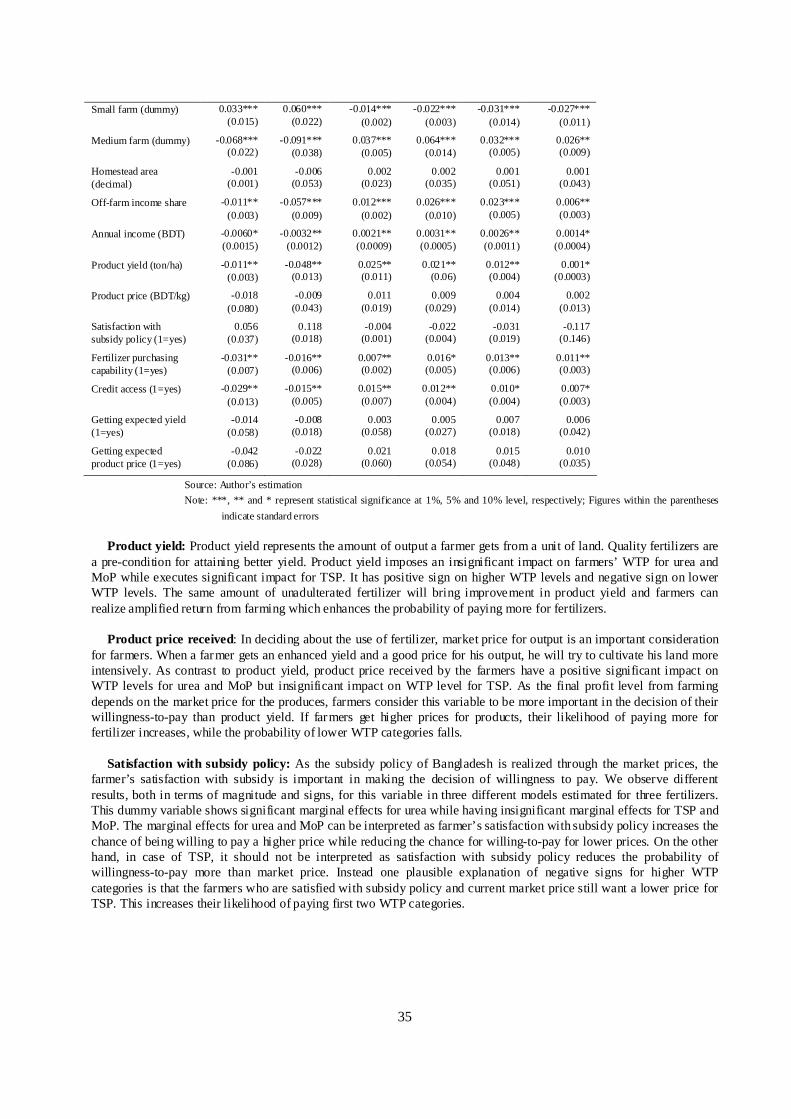
35
Small farm (dummy) 0.033*** (0.015)
0.060*** (0.022)
-0.014*** (0.002)
-0.022*** (0.003)
-0.031*** (0.014)
-0.027*** (0.011)
Medium farm (dummy) -0.068*** (0.022)
-0.091*** (0.038)
0.037*** (0.005)
0.064*** (0.014)
0.032*** (0.005)
0.026** (0.009)
Homestead area (decimal)
-0.001 (0.001)
-0.006 (0.053)
0.002 (0.023)
0.002 (0.035)
0.001 (0.051)
0.001 (0.043)
Off-farm income share -0.011** (0.003)
-0.057*** (0.009)
0.012*** (0.002)
0.026*** (0.010)
0.023*** (0.005)
0.006** (0.003)
Annual income (BDT) -0.0060* (0.0015)
-0.0032** (0.0012)
0.0021** (0.0009)
0.0031** (0.0005)
0.0026** (0.0011)
0.0014* (0.0004)
Product yield (ton/ha) -0.011** (0.003)
-0.048** (0.013)
0.025** (0.011)
0.021** (0.06)
0.012** (0.004)
0.001* (0.0003)
Product price (BDT/kg) -0.018 (0.080)
-0.009 (0.043)
0.011 (0.019)
0.009 (0.029)
0.004 (0.014)
0.002 (0.013)
Satisfaction with subsidy policy (1=yes)
0.056 (0.037)
0.118 (0.018)
-0.004 (0.001)
-0.022 (0.004)
-0.031 (0.019)
-0.117 (0.146)
Fertilizer purchasing capability (1=yes)
-0.031** (0.007)
-0.016** (0.006)
0.007** (0.002)
0.016* (0.005)
0.013** (0.006)
0.011** (0.003)
Credit access (1=yes) -0.029** (0.013)
-0.015** (0.005)
0.015** (0.007)
0.012** (0.004)
0.010* (0.004)
0.007* (0.003)
Getting expected yield (1=yes)
-0.014 (0.058)
-0.008 (0.018)
0.003 (0.058)
0.005 (0.027)
0.007 (0.018)
0.006 (0.042)
Getting expected product price (1=yes)
-0.042 (0.086)
-0.022 (0.028)
0.021 (0.060)
0.018 (0.054)
0.015 (0.048)
0.010 (0.035)
Source: Author’s estimation
Note: ***, ** and * represent statistical significance at 1%, 5% and 10% level, respectively; Figures within the parentheses
indicate standard errors
Product yield: Product yield represents the amount of output a farmer gets from a unit of land. Quality fertilizers are
a pre-condition for attaining better yield. Product yield imposes an insignificant impact on farmers’ WTP for urea and MoP while executes significant impact for TSP. It has positive sign on higher WTP levels and negative sign on lower WTP levels. The same amount of unadulterated fertilizer will bring improvement in product yield and farmers can realize amplified return from farming which enhances the probability of paying more for fertilizers.
Product price received: In deciding about the use of fertilizer, market price for output is an important consideration
for farmers. When a farmer gets an enhanced yield and a good price for his output, he will try to cultivate his land more intensively. As contrast to product yield, product price received by the farmers have a positive significant impact on WTP levels for urea and MoP but insignificant impact on WTP level for TSP. As the final profit level from farming depends on the market price for the produces, farmers consider this variable to be more important in the decision of their willingness-to-pay than product yield. If farmers get higher prices for products, their likelihood of paying more for fertilizer increases, while the probability of lower WTP categories falls.
Satisfaction with subsidy policy: As the subsidy policy of Bangladesh is realized through the market prices, the
farmer’s satisfaction with subsidy is important in making the decision of willingness to pay. We observe different results, both in terms of magnitude and signs, for this variable in three different models estimated for three fertilizers. This dummy variable shows significant marginal effects for urea while having insignificant marginal effects for TSP and MoP. The marginal effects for urea and MoP can be interpreted as farmer’s satisfaction with subsidy policy increases the chance of being willing to pay a higher price while reducing the chance for willing-to-pay for lower prices. On the other hand, in case of TSP, it should not be interpreted as satisfaction with subsidy policy reduces the probability of willingness-to-pay more than market price. Instead one plausible explanation of negative signs for higher WTP categories is that the farmers who are satisfied with subsidy policy and current market price still want a lower price for TSP. This increases their likelihood of paying first two WTP categories.
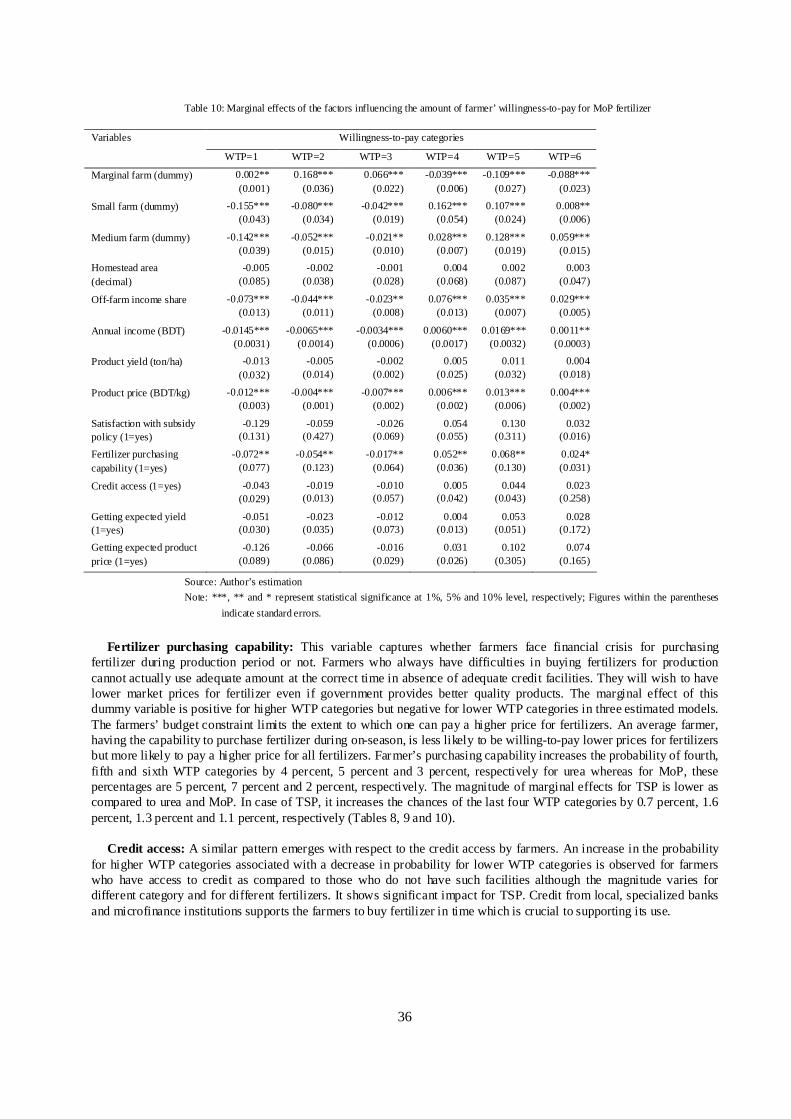
36
Table 10: Marginal effects of the factors influencing the amount of farmer’ willingness-to-pay for MoP fertilizer
Willingness-to-pay categories Variables
WTP=1 WTP=2 WTP=3 WTP=4 WTP=5 WTP=6
Marginal farm (dummy) 0.002** (0.001)
0.168*** (0.036)
0.066*** (0.022)
-0.039*** (0.006)
-0.109*** (0.027)
-0.088*** (0.023)
Small farm (dummy) -0.155*** (0.043)
-0.080*** (0.034)
-0.042*** (0.019)
0.162*** (0.054)
0.107*** (0.024)
0.008** (0.006)
Medium farm (dummy) -0.142*** (0.039)
-0.052*** (0.015)
-0.021** (0.010)
0.028*** (0.007)
0.128*** (0.019)
0.059*** (0.015)
Homestead area (decimal)
-0.005 (0.085)
-0.002 (0.038)
-0.001 (0.028)
0.004 (0.068)
0.002 (0.087)
0.003 (0.047)
Off-farm income share -0.073*** (0.013)
-0.044*** (0.011)
-0.023** (0.008)
0.076*** (0.013)
0.035*** (0.007)
0.029*** (0.005)
Annual income (BDT) -0.0145*** (0.0031)
-0.0065*** (0.0014)
-0.0034*** (0.0006)
0.0060*** (0.0017)
0.0169*** (0.0032)
0.0011** (0.0003)
Product yield (ton/ha) -0.013 (0.032)
-0.005 (0.014)
-0.002 (0.002)
0.005 (0.025)
0.011 (0.032)
0.004 (0.018)
Product price (BDT/kg) -0.012*** (0.003)
-0.004*** (0.001)
-0.007*** (0.002)
0.006*** (0.002)
0.013*** (0.006)
0.004*** (0.002)
Satisfaction with subsidy policy (1=yes)
-0.129 (0.131)
-0.059 (0.427)
-0.026 (0.069)
0.054 (0.055)
0.130 (0.311)
0.032 (0.016)
Fertilizer purchasing capability (1=yes)
-0.072** (0.077)
-0.054** (0.123)
-0.017** (0.064)
0.052** (0.036)
0.068** (0.130)
0.024* (0.031)
Credit access (1=yes) -0.043 (0.029)
-0.019 (0.013)
-0.010 (0.057)
0.005 (0.042)
0.044 (0.043)
0.023 (0.258)
Getting expected yield (1=yes)
-0.051 (0.030)
-0.023 (0.035)
-0.012 (0.073)
0.004 (0.013)
0.053 (0.051)
0.028 (0.172)
Getting expected product price (1=yes)
-0.126 (0.089)
-0.066 (0.086)
-0.016 (0.029)
0.031 (0.026)
0.102 (0.305)
0.074 (0.165)
Source: Author’s estimation
Note: ***, ** and * represent statistical significance at 1%, 5% and 10% level, respectively; Figures within the parentheses
indicate standard errors.
Fertilizer purchasing capability: This variable captures whether farmers face financial crisis for purchasing
fertilizer during production period or not. Farmers who always have difficulties in buying fertilizers for production cannot actually use adequate amount at the correct time in absence of adequate credit facilities. They will wish to have lower market prices for fertilizer even if government provides better quality products. The marginal effect of this dummy variable is positive for higher WTP categories but negative for lower WTP categories in three estimated models. The farmers’ budget constraint limits the extent to which one can pay a higher price for fertilizers. An average farmer, having the capability to purchase fertilizer during on-season, is less likely to be willing-to-pay lower prices for fertilizers but more likely to pay a higher price for all fertilizers. Farmer’s purchasing capability increases the probability of fourth, fifth and sixth WTP categories by 4 percent, 5 percent and 3 percent, respectively for urea whereas for MoP, these percentages are 5 percent, 7 percent and 2 percent, respectively. The magnitude of marginal effects for TSP is lower as compared to urea and MoP. In case of TSP, it increases the chances of the last four WTP categories by 0.7 percent, 1.6 percent, 1.3 percent and 1.1 percent, respectively (Tables 8, 9 and 10).
Credit access: A similar pattern emerges with respect to the credit access by farmers. An increase in the probability
for higher WTP categories associated with a decrease in probability for lower WTP categories is observed for farmers who have access to credit as compared to those who do not have such facilities although the magnitude varies for different category and for different fertilizers. It shows significant impact for TSP. Credit from local, specialized banks and microfinance institutions supports the farmers to buy fertilizer in time which is crucial to supporting its use.
37
Getting expected yield and product price: Farming is always very risky in Bangladesh. All farmers try to cultivate intensively their land to get expected yield and market price. Farmer’s expected yield and market price for output depends on many factors. When their expectation meets with realty, it represents a normal production period and market situation. In that situation, they may quote their maximum amount as price higher than market prices. During field survey, farmers were asked whether they get product yield and price as expected before planting during the survey year. All other things being equal, there is a higher probability of being willing to pay a higher price and of being unwilling to pay a lower price for fertilizers when farmers get their expected yield as compared to a situation when they did not get it. In contrast to ‘getting expected yield’, when farmers get their expected product price this also increases their probability of being willing to pay more. The reverse is true for farmers who get a lower market price for product than their expectations. Farmers are most likely to pay one to ten percent more than market price for urea, not more or less than market price for TSP and in between eleven to twenty percent more than market price for MoP, respectively.
7. CONCLUSION
This study deals with econometric modeling and measurement of farmer’s willingness-to-pay for three basic nutrient fertilizers that is, urea, TSP and MoP, mostly used by the farmers in Bangladesh in order to ensure timely availability of better quality fertilizers. The two step approach is followed to explore WTP. At first it measures which factors are mostly affecting the farmer’s willingness to pay more than market prices for fertilizers. And then it analyzes the amount of farmer’s actual WTP. With respect to amount of WTP, ordered probit model gives estimates of predicted probability for each WTP category. It also provides additional insights as to how each explanatory variable may affect the different WTP categories. Farmers stated different WTP for different fertilizers. Econometric results indicated that farmers, in general, have the most likelihood of paying in between one to ten percent more than the market price for urea, while one to fifteen percent less than the market price for TSP and eleven to twenty percent more than the market price for MoP.
Moreover, an average farmer’s WTP is influenced significantly by the farm size group which a particular farmer
belongs to, annual income as well as off-farm income, product prices and financial constraints. All farmers except marginal farmers are more likely to be willing to pay more than market prices for urea and MoP. Specifically, on average, marginal farmers have the most likelihood of paying one to ten percent less than market price for urea and MoP; and sixteen to thirty percent less than the existing market price for TSP in order to get ensured quality of fertilizers as compared with large farmers. Small farm category increases the probability of farmers’ willingness-to pay more than market price for urea and MoP while reduces the probability of willing-to-pay more than market price for TSP. On the other hand, medium farmer’s likelihoods tend to be stronger for paying more than market price for all fertilizers. The policy makers shall have to focus on the fraction of farmers who are willing-to-pay more for some fertilizers. These findings have implications for farm size group specific and pricing and subsidy polices in the country. Nutrient specific pricing should be re-adjusted to accommodate the extra costs for ensuring quality of fertilizers at the farm level. Moreover, to strengthen farmer’s financial capability, more off-farm employment opportunities should be created in the farming regions.
Acknowledgements
This study is conducted with the financial support from DeutscherAkademischerAustauschDienst (DAAD) for which
the author is grateful. She expresses sincere gratitude to her doctoral supervisor, Professor Dr. Siegfried Bauer for his continuous supervision, empirical suggestions, advices and mental support throughout the study period. She is also thankful to her working place in home country, Bangladesh Agricultural University for granting her the leave for pursuing higher studies. All the family members are remembered with special acknowledgements for their never-ending prayers and encouragements. Cordial thanks are extended to all of the departmental colleagues and friends for making the living in abroad very comfortable. Final acknowledgement goes to the Czech Institute of Academic Education z.s. and the organizing committee for accepting this paper to present in the International Conference on Management, Economics, Business and Marketing in Budapest.
38
References
Alam, M. J. (2013). Fertilizer marketing, distribution and pricing in Bangladesh. Paper presented in the International Conference ‘Agricultural Transformation in Asia: Policy Options for Food and Nutrition Security’, organized by International Food Policy Research Institute (IFPRI) and Cambodia Development Resource Institute, Siem Reap, Cambodia.
Arthur, S., Warland, R. H. and Herrmann, R. O. (1994). Do surveys overstate public concerns? Public Opinion Quarterly, 58 (2): 255-263. Basarir A., Sayili, M. and Muhammad, S. (2009). Analyzing producers’ willingness to pay for high quality irrigation water.Bulgarian Journal of
Agricultural Science, 15 (6): 566-573. Barkat, A., Faridi, R., Wadood, S. N., Sengupta, S. K. and Hoque, S. N. M. E. (2010).A quantitative analysis of fertilizer demand and subsidy policy in
Bangladesh.Manob Sakti UnnayanKendro, Dhaka. BBS (2014).Statistical Yearbook of Bangladesh.Bangladesh Bureau of Statistics, Ministry of Planning, Government of the People’s Republic of
Bangladesh, Dhaka. BER (2015).Bangladesh Economic Review.Economic Advisory Section, Department of Finance, Ministry of Finance, Bangladesh. Boardman, A. E., Greenberg, D. H., Vining, A. R. and Weimer, D. L. (1996). Cost benefit analysis: Concepts and practice. Upper Saddle River,
Prentice Hall, New Jersey. BRRI (2016). Fact sheet: Soil and fertilizer management. Bangladesh Rice Research Institute, Gazipur, Bangladesh. Available on
URL:http://knowledgebank-brri.org/soil-and-fertilizer-management/ (Accessed on 03.06.2016). Casselbrant, M. and Stahle, S. L. (2012).Demand and perception of fertilizer among small-holder farmers in Kenya. Independent project in
Economics, Faculty of Natural Resources and Agricultural Sciences, Swedish University of Agricultural Sciences, Sweden. Cragg, J. G. (1971). Some statistical models for limited dependent variables with applications to the demand for durable goods.Econometrica, 39 (5):
829-844. Cranfield, J. A. L. and Magnusson, E (2003). Canadian consumer’s willingness-to-pay for pesticide free food products: An ordered probit analysis.
International Food and Agribusiness Management Review, 6 (4): 13-30. Dorward, A. and Chirwa, E. (2011). The Malawi agricultural input subsidy program: 2005/06 to 2008/09. International Journal of Agricultural
Sustainability, 9 (1): 232-247. Ellicott, A. (2016). Developing awareness of the quality and proper use of fertilizers in Bangladesh.Fertilizers and agriculture, Quarterly newsletter,
International Fertilizer Industry Association, Paris.Kale, S. and Bhandari, L. (2011). Fertilizer quality control in India: The Need for systemic change. Occasional Paper, Federation of Indian Micro and Small & Medium Enterprises, New Delhi.
Ellis, F. (1992).Agricultural policies in developing countries.Cambridge University Press. Greene, W. H. (2003). Econometric analysis.Upper Sadler River, New Jersey 07458, Prentice Hall. Gujrati, D. N. (2003).Basic econometrics.Fourth edition, McGraw Hill, United States Military Academy, West Point, New York. Hamath, A. S., Faminow, M. D., Johnson, G. V. and Crow, G. (1997).Estimating the values of cattle characteristics using an ordered probit
model.American Journal of Agricultural Economics, 79: 463-476. Horna, J. D., Smale, M. and Oppen, M. V. (2005). Farmer willingness to pay for seed-related information: Rice varieties in Nigeria and Benin. EPT
Discussion Paper 142, Environment and Production Technology Division, International Food Policy Research Institute (IFPRI), Washington, DC. Jaim, W. M. H. and Akter, S. (2012). Seed, fertilizer and innovation in Bangladesh: Industry and policy issues for the future. Project paper,
International Food Policy research Institute (IFPRI), Washington DC. Kalish, S. and Nelson, P. (1991).A comparison of ranking, rating and reservation price measurement in conjoint analysis.Marketing Letters, 2 (4): 327-
335. Kohli, R. and Mahajan, V. (1991).A reservation-price model for optimal pricing of multi-attribute products in conjoint analysis.Journal of Marketing
Research, 28 (3): 347-354. MoFDM (2015).Ministry of Food and Disaster Management.Monitoring Report, National Food Policy Plan of Action and Country Investment Plan,
FPMU, Food Division, Dhaka. Mujeri, M. K., Shahana, S., Chowdhury, T. T. and Haider, K. T. (2012). Improving the effectiveness, efficiency and sustainability of fertilizer use in
South Asia.Briefing Paper, Global Development Network, New Delhi, India. Roy, R.N. and Farid, A.T.M. (2011). Bangladesh. In: Case studies on policies and strategies for sustainable soil fertility and fertilizer management in
South Asia. RAP publication, Food and Agriculture Organization of the United Nations (FAO), Regional Office for Asia and the Pacific, Bangkok.
Senturk, I. (2009). Willingness to pay for genetically modified foods in Turkey: An ordered probit analysis. The Empirical Economics Letters, 8 (5): 431-438.
Smith, V. K. (2007). Judging quality.In: Kanninen, B. (ed.). Valuing environmental amenities using Stated Choice Studies: A common sense approach to theory and practice, Springer, Dordrecht, The Netherlands.
SRDI (2013).Standards of fertilizers.Research report, Soil Resources Development Institute, Farmgate, Dhaka. Ward, W. A., Deren, B. J. and D’Silva, H. (1991). The economics of project analysis: A practitioner’s guide. EDI technical materials, The World
Bank, Washington DC. Wertenbroch, K. and Skiera, B. (2002).Measuring consumers’ willingness to pay at the point of purchase.Journal of Marketing Research, 39 (2): 228-
241. World Bank (2016).Fertilizer usage.The World Bank, Washington DC. Available on URL: http://data.worldbank.org/indicator/AG.CON.FERT.ZS
(accessed on 29.05.2016). Zapata, S. D. and Carpio, C. E. (2012).The theoretical structure of producer willingness to pay estimates. Selected paper prepared for presentation at
the Agricultural and Applied Economics Association’s (AAEA) annual meeting, Seattle, Washington DC.
39
Emotional vs. Rational? Exploring the Factors Affecting Consumers’ Brand Preferences
Danny Kao
National Hsinchu University of Education, Division of Industrial & Organizational Psychology, Hsinchu, Taiwan, [email protected]
Abstract
This research attempts to explore the moderating roles of cognitive load and brand biography style in the impact of consumers’ affective orientation on brand preferences. This research consists of three studies, which were designed to examine the main effects and the interaction effect of consumers’ affective orientation, cognitive load and brand biography style on brand preferences. Firstly, results show that low affectively oriented consumers are likely to engender stronger brand preferences for brands accompanied with top dog brand biography than those with underdog brand biography; conversely, highly affectively oriented consumers are likely to engender stronger brand preferences for brands accompanied with underdog brand biography than those with top dog brand biography. Moreover, low affectively oriented consumers are likely to engender stronger brand preferences for brands when the cognitive load is low than the cognitive load is high; in contrast, highly affectively oriented consumers are likely to engender no differential brand preferences for brands either the cognitive load is low or high. Furthermore, when the cognitive load is low, low affectively oriented consumers are likely to engender stronger brand preferences for brands accompanied with top dog brand biography than those with underdog brand biography; however, when the cognitive load is high, low affectively oriented consumers are likely to engender no differential brand preferences for brands accompanied with underdog brand biography over those with top dog brand biography. Lastly,highly affectively oriented consumers are likely to engender stronger brand preferences for brands accompanied with underdog brand biography than those with top dog brand biography, regardless of cognitive load.
Keywords: affective orientation, cognitive load, brand preferences
1. INTRODUCTION
Showalter (2011) states that there is a trend that underdog brand positioning affects consumer behavior. More clearly, firms are increasingly applying underdog branding as a marketing strategy, especially with underdog in their brand biography. Even if the company’s scale is large or the awareness is high now, if they struggled to survive during their difficult stages of entrepreneurial development (such as Apple, Southwest Airlines) they can use their underdog brand stories as emotional appeals, since underdog stories regarding overcoming great odds through passion and determination are inspiring. Those underdog brand stories help inspire individuals to see that if you work hard with passion and determination, success is not beyond the scope. In contrast to underdog brand stories, top dog brand stories are usually described as a smooth start for the company’s founders, who did not suffer from overwhelming odds during their entrepreneurial period, as well as being abundant with internal and external resources, compared to their unrivaled competitors. Traditionally, top dog brand stories are conceived as favorable, since individuals tend to connect themselves to winners and disconnect themselves to losers. However, Parahia et al., (2011) propose an opposite conclusion, which posits that underdog brands help increase purchase intentions, real choice, and brand loyalty. These mixed conclusions lead to the motivation of the third-year project. Like in the first two year projects, personality traits have been acknowledged as a factor in influencing consumer evaluations of a brand. On the basis of the first two year projects in this research, personality traits have been investigated for a possible link to brand preferences, such as construal level and underdog disposition. This third project attempts to apply affective orientation to examine the moderating effect of underdog (vs. top dog) brand biography on brand preferences.
40
2. BACKGROUND OVERVIEW AND THEORETICAL DEVELOPMENT
2.1. Brand biography style The underdog brand biography, addressed by Parahia, Keinan, Avery, and Schor (2011), describes an emerging trend in branding where firms depict a historical review of their humble origins, lack of resources, and determined struggle against the odds. An underdog brand biography consists of two essential dimensions: external disadvantage, and passion and determination. Underdog stories are often delivered to consumers through a brand biography, an unrevealed story that chronicles the brand’s origins, life experiences, and evolution over time in a selectively constructed story (Parahia, Keinan, Avery, & Schor, 2011). Many world-class brands, such as Google, Microsoft, and Apple, have included their underdog brand stories which highlight the company’s humble beginnings, founder’s solid hopes and dreams, as well as indomitable struggles against hardship, in their brand biographies.
Hoch and Deighton (1989) categorize brands into underdogs and top dogs based on their market standing (weak vs. dominant), as compared with other brands in their category. For instance, classic underdog brands are the Apple (vs. Microsoft), and Southwest Airlines (vs. American or United Airlines), as well as the local coffee shops (vs. Starbucks). In contrast, a top dog brand is often a leading brand that dominates small or local players, such as Wal-Mart driving traditional mom-and-pop stores out of local business. Brands which embody the weak side of dichotomies such as local (versus national) and independent (versus part of a corporate conglomerate) are often perceived as underdogs (Parahia, Keinan, Avery, & Schor, 2011).
2.2. Affective orientation Apart from rational judgments, individuals may also possess affective sensibilities to assess a variety of information for decision making. Booth-Butterfield & Booth-Butterfield (1990) propose the affective processing of information (affective orientation) in contrast to the logic-based processing of information and define affective orientation as “the propensity to use affect as information”, which argues that consumers who are affection-oriented appear to acknowledge subtle changes in their emotional states.
Sojka and Deeter-Schmelz (2008) have argued that affective orientation is conceptualized as a predisposed individual difference. The highly affection-oriented individuals acknowledge their feelings and regard affect as information to guide decisions (Pham et al. 2001). In addition, Sojka and Deeter-Schmelz (2008) posit that highly affection-oriented individuals differ from low affection-oriented individuals in two ways. First, highly affection-oriented individuals possess a differentiated system for recognizing emotions and are sensitive to the intensity of these emotions; however, low affection-oriented individuals neither recognize their emotions nor attend to their emotions. Second, affect-as-information theory (Schwarz & Clore, 1988) indicates that highly affection-oriented individuals appear to conceive their emotions as effective information sources for decision making; in contrast, low affection-oriented individuals who neither recognize nor acknowledge their emotions tend to disregard their emotions as a basis for decision making. Specifically, while making decisions, low affection-oriented individuals tend to be rational and highly affection-oriented individuals appear to be emotional.
As defined, low affection-oriented individuals neither recognize their emotions nor attend to their emotions. Specifically, while making brand evaluations, low affection-oriented individuals are logic-based and process information with few or no emotional ingredients. The underdog brand biography with emotional stories neither resonates nor conforms to the personality traits of low affection-oriented consumers, who usually process information rationally. Thus, it is predicted that top dog brand biography, rather than underdog brand biography, is preferred by low affection-oriented consumers.
As Schwarz and Clore (1988) and Deeter-Schmelz (2008) implied; however, highly affection-oriented consumers appear to treat their emotions as critical information sources and judgment criteria. While making brand evaluations, highly affection-oriented consumers, who are emotion-based, are more likely to resonate with the “struggle-to-success” story-based underdog brand biographies, generate empathy and further engender brand preferences for the underdog brands, as compared with those top dog brands.
H1: Low affection-oriented consumers are likely to engender stronger brand preferences for brands accompanied with top dog brand biographies than those with underdog brand biographies; conversely, highly affection-oriented consumers are likely to engender stronger brand preferences for brands accompanied with underdog brand biographies than those with top dog brand biographies. 2.3. Cognitive load
Cognitive load is a multi-faceted concept, which consists of mental load and mental effort. When the learning is difficult for an individual to proceed or an individual lacks sufficient mental effort, the cognitive load increases (van Merriënboer, Schuurman,
41
de Croock, & Paas, 2002) . Cognitive load has been examined under some contexts (Pelham, Sumarta, & Myaskovsky, 1994; Roehm & Sternthal, 2001); however, scant research has explored the role of cognitive load in the branding strategies. Several prior studies have examined how consumers deal with product information under differential cognitive load levels and have concluded that a high level of cognitive load drives people to rely on intuitive rather than analytical information processing (Pelham et al., 1994; Scarabis, Florack, & Gosejohann, 2006; Shiv & Fedorikhin, 1999). For example, Pelham et al. (1994) indicate that, when individuals are under the condition of highly cognitive demands (by giving participants difficult tasks), they are unable to make use of higher-order inferential rules and have to rely disproportionately on heuristics to make decisions. Put another way, individuals under high cognitive load are likely to apply heuristic processing rather than systematic processing (Biswas & Grau, 2008).
However, this research argues that personality traits can affect how individuals process information (heuristically vs. systematically). Put another way, it does not always hold true that individuals tend to apply heuristics to process information under high cognitive load when the consumers’ affective orientation is considered. Specifically, low affection-oriented consumers, who are characterized as logic-based, tend to systematically process information with few or no emotional ingredients when their cognitive loads are low. As compared with low cognitive load, high cognitive load is more likely to restrict low affection-oriented consumers to apply cognitive resources to systematically process and scrutinize the information. Therefore, low affection-oriented consumers are likely to evaluate the context of low cognitive load more favorably than that of high cognitive load. In contrast, highly affection-oriented consumers usually treat emotions as effective information sources and evaluation criteria, and appear to disregard the context of cognitive load. More clearly, they tend to process information heuristically rather than systematically, regardless of the context of cognitive load.
H2: Low affection-oriented consumers are likely to engender stronger brand preferences when the cognitive load is low than the cognitive load is high; in contrast, highly affection-oriented consumers are likely to engender no differential brand preferences of low cognitive load over high cognitive load.
Under the context of low cognitive load, low affection-oriented consumers have sufficient cognitive resources to further analyze information. The brand ads accompanied with underdog brand biography are usually emotion-oriented and thus are incongruent to the logic-based personality traits of low affection-oriented consumers. Conversely, brand ads accompanied with top dog brand biography are usually presented in a rational fashion with few emotional plots in the story-telling, which are consistent with the logic-based personality traits of low affection-oriented consumers. Therefore, they are likely to evaluate the ad accompanied with top dog brand biography more favorably than that with underdog brand biography.
In contrast, high cognitive load is likely to restrict low affection-oriented consumers to systematically process and scrutinize the information. Specifically, when the cognitive load is high, low affection-oriented consumers lack sufficient cognitive resources to systematically process the information, either the brand ads are accompanied with underdog or top dog brand biography. Therefore, no differential brand preferences will be found for underdog and top dog brand biographies when low affection-oriented consumers are under high cognitive load.
H3: When the cognitive load is low, low affection-oriented consumers are likely to engender stronger brand preferences for brands accompanied with top dog brand biographies than those with underdog brand biographies; however, when the cognitive load is high, low affection-oriented consumers are likely to engender no differential brand preferences for brands with underdog brand biographies over those accompanied with top dog brand biographies.
When the cognitive load is low, highly affection-oriented consumers are able to scrutinize the information and style of the brand biography. As compared with the information in the top dog brand biography, the information in the underdog brand biography is usually characterized by the more emotional plots in the story-telling. Therefore, highly affection-oriented consumers have sufficient cognitive resources to comprehend the content and the style of brand biography and thus are likely to more favorably evaluate the brand ads accompanied with underdog brand biography than those with top dog brand biography when the cognitive load is low. However, when the cognitive load is high, highly affection-oriented consumers lack cognitive resources to scrutinize the information either in underdog or top dog brand biography, and accordingly still use their affections as the key criteria to heuristically assess and differentiate the style of brand biography. As stated above, the underdog brand biography presented in an emotion-based style is more consistent with the personality traits of highly affection-oriented consumers than the top dog biography presented in a logic-based style. Therefore, highly affection-oriented consumers tend to more favorably evaluate the brand ads accompanied with underdog brand biography than those with top dog biography when the cognitive load is high.
H4: Highly affection-oriented consumers are likely to engender stronger brand preferences for brands accompanied with underdog brand biographies than those with top dog brand biographies, regardless of cognitive load.
42
3. METHODOLOGY
3.1. Pretests of stimulus material
According to Martin et al. (2003), a pretest for identifying an appropriate product /service is based on two criteria: (1) the product / service offers a range of attributes for manipulation, and (2) the product / service is relevant to the research sample. Hence, a pretest has been conducted to assure the appropriateness of the stimulus material for the following experiments. 20 on-the-job students have been asked to create a list of the most frequently used services. Next, another 20 on-the-job students have rated the four most frequently used products or services from stage one on five, seven-point scales (e.g., unimportant/important) for involvement, from which an average score is derived. The pretest reveals that banking services are among the highest involvement score (M = 5.57), all subjects currently own at least two bank accounts, (100 %), and a large number of them use financial services (either via Internet or physically visit the bank) more than once a week (95%), suggesting a fairly high frequency of use. Thus, the bank’s financial services are selected as the stimulus material in this research. 3.2. Research design and procedure
A total of 216 on-the-job graduate students were randomly assigned to a 2 (brand biography style: underdog vs. top dog) × 2 (cognitive load: low vs. high) factorial design, where the consumers’ affective orientation acts as the measured independent variable, brand biography style and cognitive load as the manipulated moderators and brand preferences as the dependent variable.
3.2.1. Measurement of affective orientation
The measurement of affective orientation was adapted from the study of Booth-Butterfield & Booth-Butterfield (1990). The affective orientation for each subject was measured by the 20 7-point affective orientation scales devised by Booth-Butterfield & Booth-Butterfield (1990). Subjects were dichotomized into low and high affection-oriented groups based on a median split (median= 85.5, α= .95). Consumers with low and highly affective orientations exhibited significantly different scores (Mlow-
affective= 54.41, Mhigh-affective= 98.51, t(214)= -70.26, p < .001).
3.2.2. Manipulation of cognitive load
The manipulation of cognitive load was adapted from the studies of Ward and Mann (2000), Shiv and Huber (2000), and Elder and Krishna (2010). The cognitive load manipulation is a working memory task. In the condition of highly cognitive load, participants were asked to memorize at least 10 out of 20 mutual funds in the ad sponsored by the bank and were asked to recall and write down those mutual funds at the end of the questionnaire. In contrast, in the condition of low cognitive load, participants were asked to memorize at least 3 out of 20 mutual funds in the ad sponsored by the bank and were asked to recall and write down those mutual funds at the end of the questionnaire. Subjects were asked to view the advertisement and read a statement about the ad appeals for a fictitious Bank of Global Wealth (BGW). The ad copies for highly cognitive load and low cognitive load are completely identical; however, the memory task for both conditions of cognitive load varies. The following excerpt shows the main ad copy for BGW:
∼ Apart from the 20 best-performed mutual funds listed beside, the innovative financial services offered by Bank of Global Wealth always keep you ahead of others, since we started with the basics.
3.2.3. Manipulation of brand biography style
The manipulation of brand biography style (underdog vs. top dog) was adapted from the study of Parahia et al (2011). Two versions of print advertisements were created, equal in all respects except for their brand biography style. Participants were randomly assigned to one of two brand biography conditions, where a fictitious Bank of Global Wealth was given either an underdog brand biography characterized by external disadvantage and the founder’s passion and determination, or a top dog brand biography characterized by external advantage and the founder’s passion and determination. When the bank is portrayed as an underdog, participants were told “the founders of BGW experienced a scarcely-resourced start, but held an indomitable spirits and struggled to succeed. They finally overcame the odds to bring their financial services to market with success. In the primed top dog condition, participants were told that “the founders of BGW came from the industry, were well-resourced, and were favored to succeed in the market.” This version of brand ads was identical to another version in all aspects except for underdog versus top dog framing. Specifically, the framing is varied in the two ad versions through the headline of the advertisements, and through the wording of the brand biography style. Subjects were asked to view the advertisement and read a statement about the ad appeals for a fictitious Bank of Global Wealth (BGW). The following shows the main ad copy and the excerpts of underdog brand biography for BGW
43
∼ The innovative financial services offered by Bank of Global Wealth always keep you ahead of others, since we started with the basics.
Thomas Zwick and Don Ashburg, the founders of BGW, experienced a scarcely-resourced start, but held an indomitable spirits and struggled to succeed. They finally overcame the odds to bring their financial services to market with success.
In contrast, the main slogan for the ad copy and the excerpts of top dog brand biography for BGW read:
∼ The innovative financial services offered by Bank of Global Wealth always keep you ahead of others, since we started with experiences.
Thomas Zwick and Don Ashburg, the founders of BGW, came from the bank industry, were well-resourced, and were favored to succeed in the market. They did not encounter many challenging odds and smoothly brought their financial services to market with success.
3.2.4. Combination manipulations of cognitive load and brand biography style
Subsequently, cognitive load and brand biography style were manipulated simultaneously. The ways how cognitive load and brand biography style were manipulated were the same as aforementioned. In the condition of highly cognitive load, participants were asked to memorize at least 10 out of 20 mutual funds in the ad sponsored by the bank and were asked to recall and write down those mutual funds at the end of the questionnaire. In contrast, in the condition of low cognitive load, participants were asked to memorize at least 3 out of 20 mutual funds in the ad sponsored by the bank and were asked to recall and write down those mutual funds at the end of the questionnaire. Subjects were asked to view the advertisement and read a statement about the ad appeals for a fictitious Bank of Global Wealth (BGW). The ad copies for highly cognitive load and low cognitive load are completely identical; however, the memory task for both conditions of cognitive load varies. The following excerpt shows the main ad copy of the version of cognitive load with the underdog brand biography:
∼ Apart from the 20 best-performed mutual funds listed beside, the innovative financial services offered by Bank of Global Wealth always keep you ahead of others, since we started with the basics.
Thomas Zwick and Don Ashburg, the founders of BGW, experienced a scarcely-resourced start, but held an indomitable spirits and struggled to succeed. They finally overcame the odds to bring their financial services to market with success.
Moreover, the main slogan of the ad copy of the version of cognitive load with the top dog brand biography reads:
∼ Apart from the 20 best-performed mutual funds listed beside, the innovative financial services offered by Bank of Global Wealth always keep you ahead of others, since we started with the experiences.
Thomas Zwick and Don Ashburg, the founders of BGW, came from the bank industry, were well-resourced, and were favored to succeed in the market. They did not encounter many challenging odds and smoothly brought their financial services to market with success.
3.2.5. Dependent measure
Brand preferences were measured with 3 items and were adapted from the study of Hellier et al (2003). The items consist of ‘I am NOT interested in trying another bank‘s financial services’, ‘ my favorite bank performs better than all other banks’, and ‘ This bank is the finest for me’. All responses were collected on 7-point Likert scales (1= ‘strongly disagree’; 7=’strongly agree’). All items were averaged to form an index for brand preferences (α = .91).
4. RESULTS 4.1. Manipulation check of cognitive load
The manipulation check of cognitive load was assessed by having respondents rate the difficulty of memory task on a seven-point semantic differential scale anchored by 1 = extremely easy and 7 = extremely difficult (Jae, 2011). As expected, an independent samples t-test revealed that the perceived the perceived valences of low cognitive load and highly cognitive load differed significantly (Mlow CL = 2.51, Mhigh CL = 5.05, t(214) = -17.35, p= .000 < .001), implying that the conditions of low cognitive load and highly cognitive load were regarded as being different. Therefore, the manipulation of cognitive load was successful.
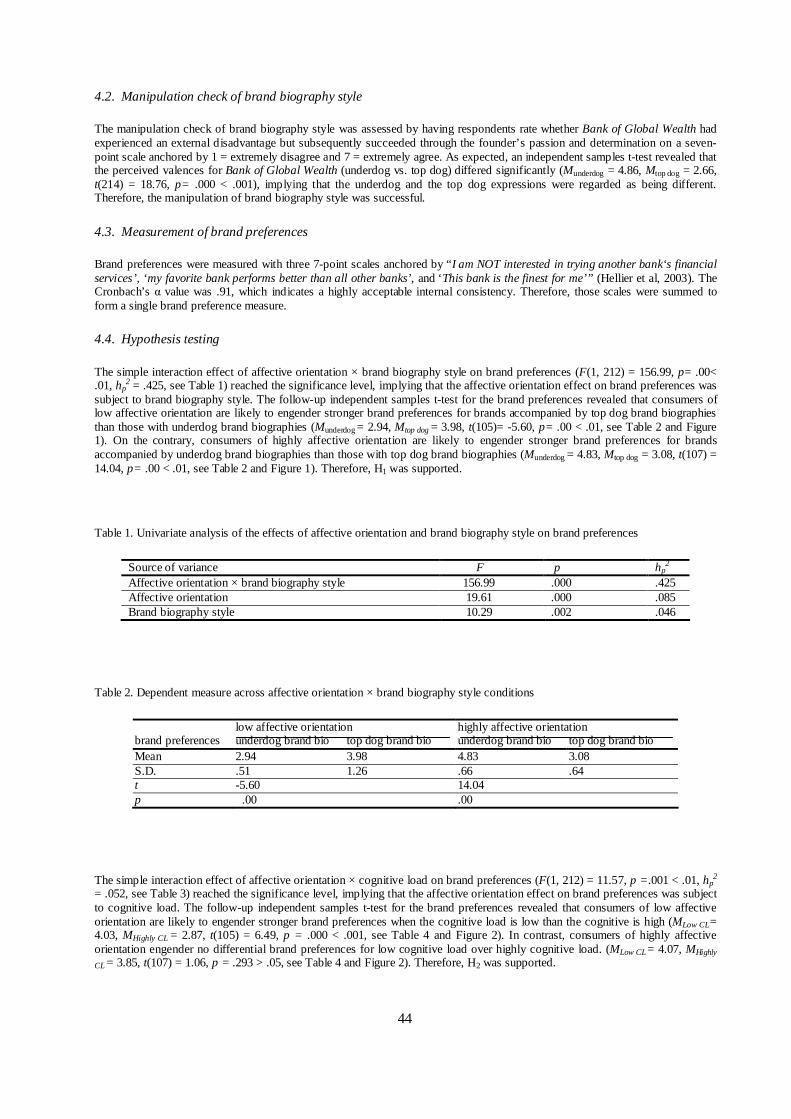
44
4.2. Manipulation check of brand biography style
The manipulation check of brand biography style was assessed by having respondents rate whether Bank of Global Wealth had experienced an external disadvantage but subsequently succeeded through the founder’s passion and determination on a seven-point scale anchored by 1 = extremely disagree and 7 = extremely agree. As expected, an independent samples t-test revealed that the perceived valences for Bank of Global Wealth (underdog vs. top dog) differed significantly (Munderdog = 4.86, Mtop dog = 2.66, t(214) = 18.76, p= .000 < .001), implying that the underdog and the top dog expressions were regarded as being different. Therefore, the manipulation of brand biography style was successful.
4.3. Measurement of brand preferences
Brand preferences were measured with three 7-point scales anchored by “I am NOT interested in trying another bank‘s financial services’, ‘my favorite bank performs better than all other banks’, and ‘This bank is the finest for me’” (Hellier et al, 2003). The Cronbach’s α value was .91, which indicates a highly acceptable internal consistency. Therefore, those scales were summed to form a single brand preference measure.
4.4. Hypothesis testing
The simple interaction effect of affective orientation × brand biography style on brand preferences (F(1, 212) = 156.99, p= .00< .01, hp
2 = .425, see Table 1) reached the significance level, implying that the affective orientation effect on brand preferences was subject to brand biography style. The follow-up independent samples t-test for the brand preferences revealed that consumers of low affective orientation are likely to engender stronger brand preferences for brands accompanied by top dog brand biographies than those with underdog brand biographies (Munderdog = 2.94, Mtop dog = 3.98, t(105)= -5.60, p= .00 < .01, see Table 2 and Figure 1). On the contrary, consumers of highly affective orientation are likely to engender stronger brand preferences for brands accompanied by underdog brand biographies than those with top dog brand biographies (Munderdog = 4.83, Mtop dog = 3.08, t(107) = 14.04, p= .00 < .01, see Table 2 and Figure 1). Therefore, H1 was supported.
Table 1. Univariate analysis of the effects of affective orientation and brand biography style on brand preferences
Source of variance F p hp2
Affective orientation × brand biography style 156.99 .000 .425 Affective orientation 19.61 .000 .085 Brand biography style 10.29 .002 .046
Table 2. Dependent measure across affective orientation × brand biography style conditions
low affective orientation highly affective orientation brand preferences underdog brand bio top dog brand bio underdog brand bio top dog brand bio Mean 2.94 3.98 4.83 3.08 S.D. .51 1.26 .66 .64 t -5.60 14.04 p .00 .00
The simple interaction effect of affective orientation × cognitive load on brand preferences (F(1, 212) = 11.57, p =.001 < .01, hp2
= .052, see Table 3) reached the significance level, implying that the affective orientation effect on brand preferences was subject to cognitive load. The follow-up independent samples t-test for the brand preferences revealed that consumers of low affective orientation are likely to engender stronger brand preferences when the cognitive load is low than the cognitive is high (MLow CL = 4.03, MHighly CL = 2.87, t(105) = 6.49, p = .000 < .001, see Table 4 and Figure 2). In contrast, consumers of highly affective orientation engender no differential brand preferences for low cognitive load over highly cognitive load. (MLow CL = 4.07, MHighly
CL = 3.85, t(107) = 1.06, p = .293 > .05, see Table 4 and Figure 2). Therefore, H2 was supported.
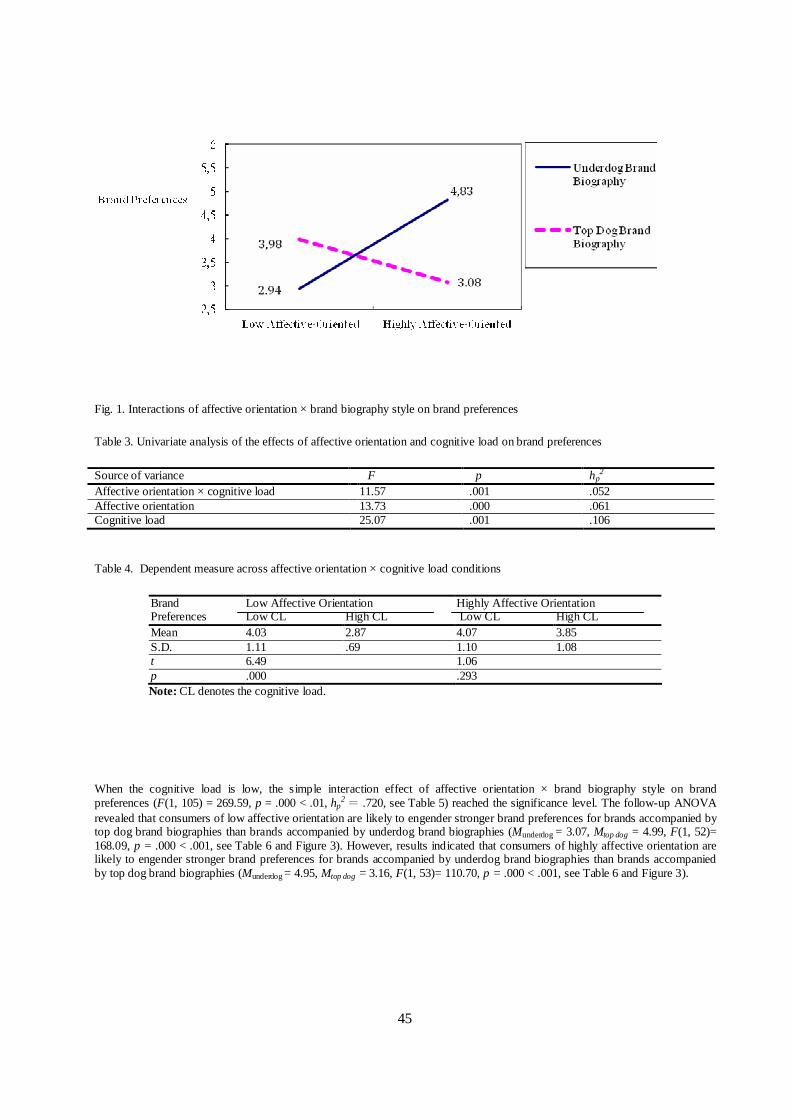
45
Fig. 1. Interactions of affective orientation × brand biography style on brand preferences
Table 3. Univariate analysis of the effects of affective orientation and cognitive load on brand preferences
Source of variance F p hp2
Affective orientation × cognitive load 11.57 .001 .052 Affective orientation 13.73 .000 .061 Cognitive load 25.07 .001 .106
Table 4. Dependent measure across affective orientation × cognitive load conditions
Brand Low Affective Orientation Highly Affective Orientation Preferences Low CL High CL Low CL High CL Mean 4.03 2.87 4.07 3.85 S.D. 1.11 .69 1.10 1.08 t 6.49 1.06 p .000 .293
Note: CL denotes the cognitive load.
When the cognitive load is low, the simple interaction effect of affective orientation × brand biography style on brand preferences (F(1, 105) = 269.59, p = .000 < .01, hp
2 = .720, see Table 5) reached the significance level. The follow-up ANOVA revealed that consumers of low affective orientation are likely to engender stronger brand preferences for brands accompanied by top dog brand biographies than brands accompanied by underdog brand biographies (Munderdog = 3.07, Mtop dog = 4.99, F(1, 52)= 168.09, p = .000 < .001, see Table 6 and Figure 3). However, results indicated that consumers of highly affective orientation are likely to engender stronger brand preferences for brands accompanied by underdog brand biographies than brands accompanied by top dog brand biographies (Munderdog = 4.95, Mtop dog = 3.16, F(1, 53)= 110.70, p = .000 < .001, see Table 6 and Figure 3).
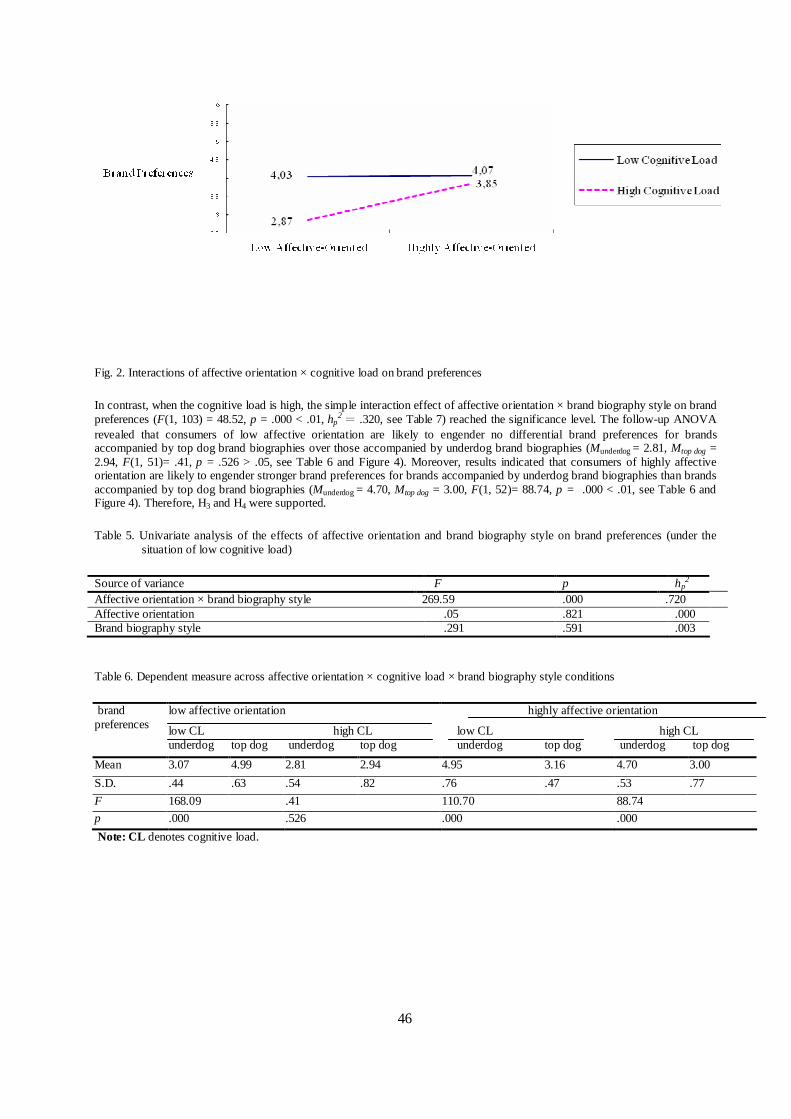
46
Fig. 2. Interactions of affective orientation × cognitive load on brand preferences
In contrast, when the cognitive load is high, the simple interaction effect of affective orientation × brand biography style on brand preferences (F(1, 103) = 48.52, p = .000 < .01, hp
2 = .320, see Table 7) reached the significance level. The follow-up ANOVA revealed that consumers of low affective orientation are likely to engender no differential brand preferences for brands accompanied by top dog brand biographies over those accompanied by underdog brand biographies (Munderdog = 2.81, Mtop dog = 2.94, F(1, 51)= .41, p = .526 > .05, see Table 6 and Figure 4). Moreover, results indicated that consumers of highly affective orientation are likely to engender stronger brand preferences for brands accompanied by underdog brand biographies than brands accompanied by top dog brand biographies (Munderdog = 4.70, Mtop dog = 3.00, F(1, 52)= 88.74, p = .000 < .01, see Table 6 and Figure 4). Therefore, H3 and H4 were supported.
Table 5. Univariate analysis of the effects of affective orientation and brand biography style on brand preferences (under the situation of low cognitive load)
Source of variance F p hp2
Affective orientation × brand biography style 269.59 .000 .720 Affective orientation .05 .821 .000 Brand biography style .291 .591 .003
Table 6. Dependent measure across affective orientation × cognitive load × brand biography style conditions
low affective orientation highly affective orientation brand preferences low CL high CL low CL high CL underdog top dog underdog top dog underdog top dog underdog top dog
Mean 3.07 4.99 2.81 2.94 4.95 3.16 4.70 3.00
S.D. .44 .63 .54 .82 .76 .47 .53 .77
F 168.09 .41 110.70 88.74
p .000 .526 .000 .000
Note: CL denotes cognitive load.
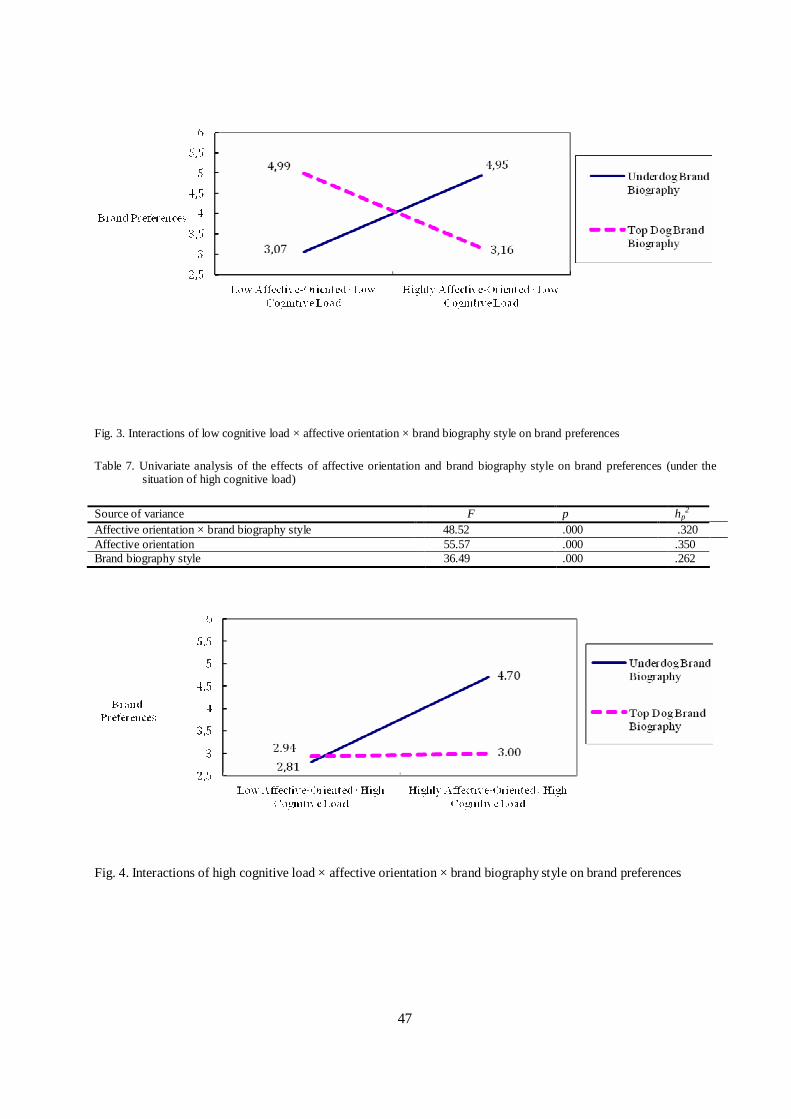
47
Fig. 3. Interactions of low cognitive load × affective orientation × brand biography style on brand preferences
Table 7. Univariate analysis of the effects of affective orientation and brand biography style on brand preferences (under the situation of high cognitive load)
Source of variance F p hp2
Affective orientation × brand biography style 48.52 .000 .320 Affective orientation 55.57 .000 .350 Brand biography style 36.49 .000 .262
Fig. 4. Interactions of high cognitive load × affective orientation × brand biography style on brand preferences

48
5. CONCLUSION 5.1. Research findings
Research findings empirically support that consumers’ affective orientation and cognitive load can moderate consumers’ brand preferences. Most important, this research revealed that cognitive load has a significant impact on low affective-oriented consumers’ brand preferences. Specifically, when the cognitive load is low, low affective-oriented consumers tend to engender stronger brand preferences for top dog brands than for underdog brands; however, when the cognitive load increases, the gap of brand preferences between top dog brands and underdog brands increasingly decreases and subsequently reaches an insignificant level. In contrast, highly affective-oriented consumers engender stronger brand preferences for underdog brands than top dog brands, no matter how the cognitive load fluctuates.
5.2. Theoretical contribution
This research differs from the prior research in three main respects, which contribute to consumer psychology literature. First, from an academic perspective, theoretical understanding of the effects of consumers’ affective orientation is promising but underdeveloped. This research successfully links consumers’ affective orientation with cognitive load and brand biography style, and examines their interaction effects on consumers’ brand preferences.
Second, brand biography is a brand new concept, which was first introduced to consumer psychology literature by Paharia et. al., (2011). Paharia et. al., (2011) conclude that underdog brand biography effect is driven by identity mechanisms. Specifically, the underdog brand biography effect is stronger when consumers identify themselves as underdog, as well as when consumers purchase for themselves than for others. This research further examines how brand biography style (underdog vs. top dog) interacts with cognitive load and consumers’ affective orientation, and contributes to broaden the horizon of brand biography in consumer psychology literature.
At last, while prior research regarding cognitive load has focused on information processing (i.e. Scarabis, Florack, & Gosejohann, 2006; Biswas & Grau, 2008), cognition (i.e., Drolet & Luce, 2004; Jae, 2011), decision making (i.e., Allen, Edwards, Snyder, Makinson & Hamby, 2014; Kolfschoten & Brazier, 2013) and economic behavior (i.e., Kessler & Meier, 2014; Guillemette, James III & Larsen, 2014), this research applies consumers’ cognitive load to examine the impact of different strategies of brand biography style on brand preferences. Findings of this research show that consumers do not always rely on heuristics to process information under the context of low or high cognitive load. Specifically, consumers’ affective orientation may moderate how the information is processed (heuristically or systematically).
5.3. Practical implications
Findings of this research suggest that the effect of brand biography style on brand preferences can be moderated by both internal (i.e., consumers’ affective orientation) and external factors (i.e., cognitive load), which implies that advertisers are advised to adopt a brand biography strategy together with other marketing stimuli or market segmentation to achieve the stronger brand preferences. The results of H1 support the notion that low affection-oriented consumers are likely to engender stronger brand preferences for brands accompanied by top dog brand biographies than those with underdog brand biographies, whereas highly affection-oriented consumers tend to engender stronger brand preferences for brands accompanied by underdog brand biographies than those with top dog brand biographies. In practice, for the target market consisting of low affection-oriented consumers, advertisers are encouraged to conduct the strategy of top dog brand biography with highlighting how the brand has experienced no odds since the initial stage and reached success later on. On the contrary, advertisers are advised to use the underdog brand strategy with highlighting how the brand overcame the hardship and reached success, with an attempt to touch the minds of highly affection-oriented consumers.
Although the results of H2 support the notion that while low affection-oriented consumers appear to engender stronger brand preferences when cognitive load is low than when cognitive load is high, highly affection-oriented consumers are likely to engender no differential brand preferences of low cognitive load over high cognitive load. Accordingly, advertisers are encouraged to devise an ad context accompanied by cognitive-saving or heuristic information (low cognitive load) for the target market consisting of low affection-oriented consumers. By reducing the cognitive load, low affection-oriented consumers are likely to engender brand preferences. It is suggested to minimize use of terminologies, which may increase the cognitive load, in the ad. Instead, for highly affection-oriented consumers, advertisers are advised to leave the cognitive load strategy aside and adopt other marketing strategies to attain strong brand preferences.
Subsequently, the results of H3 support the notion that when the cognitive load is low, low affection-oriented consumers tend to engender stronger brand preferences for brands accompanied with top dog brand biographies than those with underdog brand biographies; in contrast, when the cognitive load is high, low affection-oriented consumers are likely to engender no differential brand preferences for brands accompanied with underdog brand biographies over those accompanied with top dog brand
49
biographies. From a practical perspective, when advertisers decide to utilize a little heuristic and intuitive information in the ad content (low cognitive load) and wish to pinpoint low affection-oriented consumers as their target market, they are encouraged to stress their success all the way (top dog) to reduce the potential counterarguments and further increase brand preferences. However, while deciding to utilize much complex and systematical information in the ad content (high cognitive load), advertisers are advised to “pale” their brand biography style and adopt other marketing strategies for attaining brand preferences.
At last, the results of H4 support the notion that highly affective-oriented consumers tend to engender stronger brand preferences for brands accompanied with underdog brand biographies, no matter how high the cognitive load is. In a practical view, for highly affective-oriented consumers, advertisers are suggested to emphasize how the brand overcame the past odds and reached the current success (underdog) and may apply a cognitive load strategy, either low or high.
5.4. Limitations and future research
This research contributes to the knowledge base of advertising psychology and proposes some practical implications to advertising practitioners; however, some limitations need to be mentioned for future research. First, this research concludes that advertisers can apply the strategy of different brand biography styles (underdog vs. top dog) and manipulate differential cognitive loads (low load vs. high load) for targeting consumers of differential extents of affective orientation. Nonetheless, it is a tough job for advertisers to distinguish from consumers with a differential affective orientation (low affective-oriented vs. highly affective-oriented) before an ad strategy is devised. Second, this research does not take consumers’ familiarity of mutual funds into account. Though the pretest indicated a high frequency of using financial services in the research sample; however, using financial services is not homogeneous to familiarity with mutual funds. Specifically, consumers’ familiarity with mutual funds may moderate how the cognitive load is perceived. The more familiar the consumers are with mutual funds, the lower the cognitive load may be. At last, this research utilizes intangible financial services as the experiment stimulus material and thus the external validity of this research is underexplored. Future research is expected to examine the generalizability of this research by adopting tangible goods as the experiment stimulus material. References
[1] Allen, P. M., Edwards, J. A., Snyder, F, J., Makinson, K. A., & Hamby, D. M. (2014). The effect of cognitive load on decision making with graphically displayed uncertainty information. Risk Analysis: An International Journal, 34, 1495-1505.
[2] Biswas, D., & Grau, S. L. (2008). Consumer choices under product option framing: Loss aversion principles or sensitivity to price differentials? Psychology & Marketing, 25, 399-415
[3] Booth-Butterfield, M., & Booth-Butterfield, S. (1990). Conceptualizing affect as information in communication production. Human Communication Research. 16, 451-476.
[4] Drolet, A., & Luce, M.F. (2004). The rationalizing effects of cognitive load on emotion-based trade-off avoidance. Journal of Consumer Research, 31(1), 63-77.
[5] Elder, R. S., & Krishna, A. (2010). The effects of advertising copy on sensory thoughts and perceived taste. Journal of Consumer Research, 36 (February), 748-757.
[6] Guillemette, M. A., James III, R. N., & Larsen, J. (2014). Loss aversion under cognitive load. Journal of Personal Finance, 13(2), 72-81.
[7] Hellier, P.K., Geursen, G.M., Carr, R.A., & Rickard, J.A. (2003). Customer repurchase intention: A general structural equation model. European Journal of Marketing, 37, 11/12, 1762-1800.
[8] Hoch, S., & Deighton, J. (1989). Managing what consumers learn from experience. Journal of Marketing, 53, April, 1-20.
[9] Jae, H. (2011). Cognitive load and syntactic complexity of printed advertisements: Effects on consumers’ attitudes. Marketing Management Journal, 21, 12-159.
[10] Kessler, J., & Meier, S. (2014). Learning from (failed) replications: Cognitive load manipulations and charitable giving. Journal of Economic Behavior & Organization, 102(June), 10-13.
[11] Kolfschoten, G., & Brazier, F. (2013). Cognitive load in collaboration: Convergence. Group Decision & Negotiation, 22(5), 975-996.
50
[12] Martin, B., Lang, B., & Wong, S. (2003). Conclusion explicitness in advertising: The moderating role of need for cognition (NFC) and argument quality (AQ) on persuasion. Journal of Advertising, 32(4), 57-65.
[13] Parahia, N., Keinan, A., Avery J., & Schor, J. B. (2011). The underdog effect: The marketing of disadvantage and determination through brand biography. Journal of Consumer Research, 37, 5, 775-790.
[14] Pelham, B. W., Sumarta, T. T., & Myaskovsky, L. (1994). The easy path from many to much: The numerosity heuristic. Cognitive Psychology, 26, 103-133.
[15] Pham, M. T., Cohen, J. B., Pracejus, J. W., & Hughes, G. D. (2001). Affect monitoring and the primacy of feelings in judgment. Journal of Consumer Research, 28, 167–188.
[16] Roehm, M. L., & Sternthal, B. (2001). The moderating effect of knowledge and resources on the persuasive impact of analogies. Journal of Consumer Research, 28, 257-272.
[17] Scarabis, M., Florack, A., Gosejohann, S., Münster, U., Basel, U., & Münster, F. (2006). When consumers follow their feelings: The impact of affective or cognitive focus on the basis of consumers’ choice. Psychology and Marketing, 23, 1015-1034.
[18] Schwarz, N., & Clore, G. L. (1988). How do I feel about it? The informative function of affective states. In K. Fiedler & J. Forgas (Eds.), Affect, cognition, and social behavior (pp. 44–62). Toronto, Canada: Hogrefe.
[19] Shiv, B., & Fedorikhin, A. (1999). Heart and mind in conflict: The interplay of affect and cognition in consumer decision making. Journal of Consumer Research, 26, 278-292.
[20] Shiv, B., & Huber, J. (2000). The impact of anticipating satisfaction on consumer choice. Journal of Consumer Research, 27 (September), 202-16.
[21] Showalter, A. (2011). Engaging the underdog edge for persuasion success. Agency Sales, 41, 10, 42-44.
[22] Sojka, J. Z., & Deeter-Schmelz, D. R. (2008). Need for cognition and affective orientation as predictors of sales performance: An investigation of main and interaction effects. Journal of Business and Psychology, 2, 179-190.
[23] van Merriënboer, J. J. G., Schuurman, J. G., de Croock, M. B. M., & Paas, F. (2002). Redirecting learners’ attention during training: Effects on cognitive load, transfer test performance and training efficiency. Learning and Instruction, 12, 11-37.
[24] Ward, A., & Mann, T. (2000). Don't mind if I do: Disinhibited eating under cognitive load. Journal of Personality and Social Psychology, 78 (April), 753-63.
51
Conflicts of interest in a company and methods of their reduction – a Polish experience
Joanna Błacha
a University of Economics in Katowice, Faculty of Finance and Insurance, Department of Corporate Finance and Insurance, ul. 1 Maja 50, 40-287 Katowice, Poland,e-mail: [email protected]
Abstract
Importance of various stakeholders for the company’s financial situation and performance is unequivocal. However, different needs and expectations of different groups of stakeholders may lead to the conflicts of interest. These conflicts may hinder the smooth development of a company. To avoid the negative consequences of conflicts of interest a company has to apply various methods of reducing the risk of conflicts of interest. Most of these methods are related to the corporate governance mechanisms. The main objective of the theoretical part of this study is to present the main types of conflicts of interest in a modern company, to identify their main consequences for the financial performance and market valuation, as well as to indicate the potential methods of conflicts of interest reduction. The objective of the empirical research is to examine whether the companies with lower risk of conflicts of interest are characterized by better financial performance and higher market valuation. Based on the analysis of a sample companies listed on the Warsaw Stock Exchange we have proved the relationship between the risk of conflicts of interest and the activity of board committees as well as the type of ownership structure. Unfortunately, lower risk of conflicts of interest is not accompanied by higher profitability or higher market valuation measured by the price-to-book value ratio.
Keywords: stakeholder theory, corporate governance, conflicts of interest, code of best practices, financial management
1. Introduction
Modern company’s activity can be explained by one of two basic theories – the shareholder theory and the stakeholder theory. The assumptions of the shareholder theory place owners (equity holders) and their interest in the centre of the decision making process of the company with the main objective defined as the shareholder wealth (value) maximisation.
On the other hand, growing popularity of the Corporate Social Responsibility (CSR) and the sustainable development concepts promote the stakeholder orientation. Today the efficient financial management requires taking into consideration the objectives and needs of all primary stakeholders of the company, such as: shareholders, creditors, managers, employees, customers, local community, etc. However, as these stakeholders represent various groups of interest their conflicting objectives and needs may hamper the smooth development of the company.
Presented paper consists of two parts. The main objective of the theoretical part is to present the main types of conflicts of interest in a modern company, to identify their main consequences for the financial performance and market valuation, as well as to indicate the potential methods of conflicts of interest reduction. Theoretical part is followed by empirical research based on the analysis of sample Polish companies. The objective of the empirical research is to examine whether the companies with lower risk of conflicts of interest are characterized by better financial performance and higher market valuation.
This paper is organized as follows. Section 2 presents the theoretical foundation for the conflicts of interest problem in the company with regard to the main types of conflicts of interest, the most important consequences and methods of their reduction. Section 3 explains the construction of the empirical research characterizing sample
52
companies and defining variables of interest. Section 4 includes results and discussion while section 5 concludes paper.
2. Conflicts of interest in a company – types, consequences and methods of reduction
The stakeholder theory was firstly formalised by Freeman in 1984 [1] and developed by Cornell and Shapiro in 1987[2]. According to this theory, a company is described as a nexus of contracts (formal and informal ones) or a network of relationships with different groups of stakeholders. The contractual perspective with the stakeholder orientation is now considered as the appropriate theoretical foundation for the analysis of modern companies [3].
Stakeholder is defined as any group or individual who is affected by or can affect the performance of a company and achivement of its objectives [2]. These stakeholders bear certain risk as a result of their involvement in the company – in a form of financial capital, human capital or other resources. Without their participation the company can not survive and as a consequence can not be developed. Primary stakeholders include: capital suppliers (shareholders and creditors), employees, customers, other resource suppliers, local community, the natural environment, the government and its agencies.
Modern company to be successfull has to achieve and maintain a permanent balance that satisfies all stakeholders as a result of the sound integrated stakeholder management process. Within this process a company must identify its stakeholders, determine their benefits-contributions profile and find its own balance in respect of each group. The creation of value and the development of a company is possible when a satisfactory relationship of benefits-contributions is achieved and maintained. As a consequence, choices and decisions within integrated financial management of a company are defined as a function of balancing stakeholders’ influences and expectations. Empirical studies proved that efficient and effective stakeholder relationship management leads to improved shareholder value [4], generates long-term competitive advantage for the company and for society as well [5].
However, the effective stakeholder relationship management may be hindered by the conflicting expectations and objectives of various groups of stakeholders. The main reasons for conflicts of interest in the company consist of [6]: • different access to information and asymmetric information among stakeholders (as one of the financial market
imperfections) with its consequences: adverse selection and moral hazard problems;
• separation of ownership and control function (as a result of hiring professional managers to run the business on behalf of the owners) and its consequences – agency problem and agency costs;
• different risk attitude (risk aversion) of stakeholders;
• behavioural mechanisms impeding rational choices of stakeholders (related to the bounded rationality hypothesis);
• decisions and activity of primary and secondary stakeholders (e.g. block-holders/strategic investors control not only their own capital but also the investment of minority shareholders);
Based on the main types of stakeholders and their characteristics four types of conflicts of interest can be distinguished - between: • managers and shareholders,
• company and capital providers,
• controlling shareholders and minority shareholders,
• shareholders and creditors.
The first type of conflict of interest – between managers (as agents) and shareholders (as principals) lies in the centre of the agency theory formulated by Jensen and Meckling in 1976, which explains the relationships between managers and shareholders under the separation theorem [7]. The managers should act in the best interest of the shareholders, however they may use their information advantage (problem of asymmetric information between managers as insiders and shareholders as outsiders) to make decisions that help them to achieve their own particular interest, which may have negative consequences for the company and its shareholders. This leads to the agency
53
conflict hindering the achievement of value-maximization objective due to the increase of agency costs, including monitoring costs and costs of incentive programmes (e.g. stock options plans for managers).
Possible conflicts of interest between managers and shareholders may take the form of [8]: • payment of excessive salaries or benefits for managers and the problem of “empire building”,
• reluctance to undertake high-risk, high NPV projects,
• retaining profits rather than paying them out in dividends,
• working less efficiently than the shareholders might desire.
As a consequence, the conflicts of interest between managers and shareholders may be analyzed in four key areas related to: (1) moral hazard, (2) earnings retention, (3) time horizon and (4) risk aversion.
The first area is related to the moral hazard problem. Jensen and Meckling in 1976 first proposed a moral hazard explanation for agency conflicts [7]. They developed a model whereby the incentive of the manager to undertake private perquisite consumption (e.g. benefits, privilege, extra payment, exclusive business trips) rather than invest in positive net present value projects increases as the manager’s ownership stake in the company declines. Empirical research proved that managers may choose to invest in assets best suited to their personal skills or preferences (investing in visible or fun industry for extra personal non-financial benefits e.g. meeting with celebrities). Such investment decisions increase their individual value to the company and make manager replacement more difficult. Moral hazard problems are also related to a lack of managerial effort and to the size of the company. Decreasing managerial effort may damage corporate value. Larger companies are difficult to be effectively monitored which increases the monitoring costs.
The second area of conflict of interest between managers and shareholders is related to the earnings retention decisions and dividend policy. Jensen in 1986 found out that managers prefer to retain earnings whereas shareholders prefer higher levels of cash distributions especially when the company has few positive NPV investment projects [9]. Managers benefit from retained earnings because company’s size growth gives them a larger power base, greater prestige, ability to dominate the board of directors and allows them to extract higher levels of remuneration. This reduces also the amount of firm-specific risk within the company and strengthens their job security. It should be stressed that earnings retention reduces the need for external financing for new investment projects. At the same time, it reduces the monitoring function of external financing that should encourage management to undertake value-maximizing decisions.
Conflicts of interest may also arise between shareholders and managers with regard to the timing of cash flows. Shareholders are concerned with all future cash flows of the company as these are reflected in the current share price. On the other hand, managers may only be concerned with company cash flows for their term of employment. Thus, they may prefer short-term projects with high accounting rates of return, ignoring their long-term potentially negative consequences for the company’s value and shareholders’ wealth.
The next area of conflicts is related to the managerial risk aversion which arises because of portfolio diversification constraints. Shareholders are concerned only with systematic risk while company managers are concerned with both systematic and firm-specific risk. As a consequence managers may decide to apply investment and financing policies that minimize the risk of a company. If risky investment projects are successful, the shareholders make the gain, if unsuccessful – the shareholders will lose only a small part of their diversified portfolios but the managers may lose their jobs. Similarly, although higher debt is expected to reduce agency conflicts and gives the potential of tax shield and positive financial leverage effect, risk-adverse managers prefer equity financing due to the potential bankruptcy risk related to debt financing. Concluding, the consequences of the first type of conflict of interest are noticeable within: investment strategy, capital structure decisions, dividend policy and risk management process in the company.
The second type of conflict of interest refers to the relationship between a company and capital providers
(potential and existing ones), both equity holders and debt holders. This type of conflict is related to the asymmetric information problem described by Leland and Pyle in 1977 [10]. Asymmetric information may occur in one of two following forms: • hidden information and hidden knowledge possessed by a company, that can not be accessed by the capital
providers and may result in an adverse selection problem (it occurs before the transaction is made and capital is invested in the company);
54
• hidden action of a company, that can not be assessed and monitored by the capital providers and may result in a moral hazard problem (it occurs after the transaction is made and capital is invested in the company).
Under such circumstances the company may decide to increase equity capital by issuing shares to transfer the potential loss to the new shareholders (when the prospects are bad) and in opposite situation - to increase debt by taking a bank loan or issuing bonds when the prospects are good. Companies characterize by higher level of risk are more willing to accept higher required rate of return expected by the capital providers. Thus, the asymmetric information between company and capital providers may result in the limited access to capital (capital gap problem), higher cost of capital, lower market prices of shares and limited development of a company.
The third type of conflict of interest occurs between controlling shareholders and minority shareholders. This
conflict is also related to the moral hazard problem. By controlling the company through majority voting rights, large shareholders (strategic investors, institutional investors, family members) can undertake action that expropriate wealth from non-controlling (minority) shareholders. This may also lead to the suboptimal investment decisions to lower the cash flow risk. In case of family controlled companies there may be also a problem of: • suboptimal capital structure - applying lower level of debt and tax shield effect due to a fear of bankruptcy;
• related-party transactions - making contracts with related-parties (e.g. companies controlled by family members) at prices below market value;
• costs of succession - founders may continue to be involved in running the family business even when it is not in the best interests of the company and its shareholders.
The negative consequences of such problems create agency costs for non controlling (non-family) shareholders because of the loss of corporate value. Minority shareholders dissatisfied with company’s performance may decide to sell the shares, which may decrease share prices and increase the threat of a hostile takeover.
The last type of conflict of interest may be observed between shareholders and creditors (bondholders) and is also
related to the moral hazard problem. Shareholders prefer value-maximizing decisions, while creditors are concern about the safety of their capital involved in a company. As their income on invested capital is fixed, they will not participate in the increasing value of the company. Thus, the decisions that may be assessed as negative from the creditors point of view include [11]: • undertaking risky investment projects increasing the overall level of company’s risk,
• increasing level of debt financing (related to the claim dilution problem),
• increasing level of dividend payments (related to the claim dilution problem),
• disposal and substitution of assets (replacing old assets with the new ones of different risk-return profile).
These actions are usually taken after the transaction with creditors was made, which means that creditors can not increase interest rate on debt to cover the increased risk. However, they may decide to cancel the agreement and demand from the company to repay the debt before maturity. They may be reluctant to provide company with additional debt financing in future (adverse selection problem) which may lead to suboptimal capital structure and underinvestment problems. If they decide to provide capital, they may insist on implementing debt covenants which increase creditors safety but at the same time they decrease the independence of a company. As a result, this may have negative consequences for the company and its shareholders in a long-term horizon.
In conclusion, consequences of all types of conflicts of interest are observable in different areas of financial
management. The most important consequences include [12]: • ineffective risk-sharing between capital providers and other stakeholders that influences the expected rate of
return and cost of capital for a company;
• suboptimal capital structure together with the application of financial instruments inadequate to the actual market conditions, company’s financial situation and its ability to meet the expectations of capital providers (existing and potential ones),
55
• suboptimal investment decisions impeding the development of a company and the realization of a company’s strategy and objectives,
• conflicting free cash flow management decisions with regard to earnings retention and dividend policy,
• undervaluation or overvaluation of shares (market value of a company) in comparison to the economic value of a company (value gap).
Based on the identification of these types of conflicts of interest, appropriate tools and methods aiming at reducing their negative consequences can be selected and applied. The most important ways of reducing the risk of conflicts of interest and its consequences consist of [13], [14]: • sound corporate governance mechanisms based on internal solutions, including independent supervisory board
with the activity of board subcommittees: audit, risk management and remuneration committees;
• transparent financial reporting together with effective investor relations programme;
• external control of independent auditors guaranteeing quality of disclosures and financial statements of a company;
• equity-based earnings systems with stock option incentive programmes for managers;
• institutional and strategic investors controlling and monitoring the activity of management;
• law regulations protecting rights of different stakeholders e.g. minority shareholders, creditors, employees;
• capital market regulations and actions taken by market supervisory agencies promoting codes of corporate governance best practices;
• education programmes increasing the awareness of corporate governance problems within society;
These methods and tools (both voluntary and obligatory ones) may be applied at the micro-level (by a company for its own purposes) and/or the macro-level (for entire financial market or economy by international organisations or government agencies and market regulators).
In our empirical research we will focus on two main methods of reducing the risk of conflict of interest related to the corporate governance mechanisms: • internal corporate governance mechanisms in a form of supervisory board and board subcommittees activity[15],
[16], [17];
• external corporate governance solutions based on the codes of best practices [18],[19].
The objective of corporate governance is to develop tools supporting efficient management, effective supervision, respect for shareholders’ and other stakeholders’ rights, and transparent communications between companies and the market. The organization structure of the Polish companies is based on the two-tier board model which consists of: the management board and the supervisory board. The central feature of internal corporate governance lies in the organisational and personal division of management and control by a two-tier structure that is mandatory for large companies (in a legal form of joint-stock company or private limited company). The clear responsibility of the management board is to run the business. The legal functions of the supervisory board is the appointment, supervision and removal of members of the management board. Also networking with stakeholders and business partners and balancing interests within the company is valuable, particularly for resolving conflicting situations. The supervisory board controls the management, its compliance with the law and articles of the company and its business strategies. Internal corporate governance mechanisms aiming at the reduction of conflicts of interest include formation of board subcommittees such as audit, remuneration & nomination, risk management, strategy & development and internal control committees.
The second method is related to the codes of good practices which are defined as a set of recommendations regarding the behaviour and structure of a management board with regard to the company’s stakeholders. They have been designed to recommend a comprehensive set of norms on the role and composition of the board of directors,
56
relationships with shareholders, other stakeholders and top management, auditing and information disclosure, and the selection, remuneration and dismissal of directors and top managers. The two objectives every code states are improving the quality of a company’s board governance and increasing the accountability of a company to shareholders and other stakeholders while maximizing shareholder or stakeholder value. They attempt to improve a company’s corporate governance overall, especially when other mechanisms such as takeover markets and the legal environment fail to guarantee adequate protection of stakeholders’ rights. Codes of best practices are considered to be important contributor to the companies’ competitive position and a key driver of the attractiveness of the capital market.
Companies listed on Warsaw Stock Exchange (GPW) regulated market are required to follow the document “Best Practice for GPW Listed Companies 2016” which is consistent with European Commission Recommendation of 9 April 2014 on the quality of corporate governance reporting (2014/208/EU). The Best Practice document is divided into thematic sections: Disclosure Policy, Investor Communications, Management Board, Supervisory Board; Internal Systems and Functions, General Meeting, Shareholder Relations, Conflict of Interest, Related Party Transactions, Remuneration [20]. The recommendations require the disclosure of compliance details in a statement of compliance with the corporate governance principles included in the issuer’s annual report. The detailed provisions of the Best Practice follow the ‘comply or explain’ approach. Consistent non-compliance with a principle or an incidental breach require the company to immediately report. It should be noted that the companies’ explanations of the reasons and circumstances of non-compliance should be sufficiently exhaustive to provide genuine information on the reasons for the non-compliance and to allow for an assessment of the company’s position on compliance with the principles of the Best Practice [20].
3. Data and methodology
The data consists of a unique sample of Polish firms listed on the Warsaw Stock Exchange (GPW) in 2015 included in the WIG30 index covering 30 major and most liquid companies on the GPW Main List. Banks and insurance companies are excluded due to their specificity. This gives a sample of 20 firm-time observations.
The primary source of data consists of the firms’ annual reports i.e. financial data are obtained by manually collecting each firm’s annual accounts. Stock market information is obtained from the Warsaw Stock Exchange.
Figure 1 presents analyzed companies by the sector. These companies represent 9 sectors with the dominant share of industrial sectors: oil & gas, energy, basic materials and chemicals (comprising 60% of sample). Analyzed companies are characterized by various ownership structures – more or less concentrated or dispersed with the direct State Treasury stake in the ownership structure in 10 companies (representing from 30% to more than 70% share in the ownership structure) and indirect involvement in 1 company. Part of the analyzed companies are included in the Respect Index portfolio. These are 9 companies classified as socially responsible while, the social responsibility is understood as a management strategy and approach to the concept of conducting business, which involves building a good and lasting relationship based on mutual understanding and respect expectations of the wider business environment (i.e. with all stakeholders: employees, suppliers, customers, community, shareholders and envisaging the care of natural environments). Most of these companies (8 out of 9) operate in the industrial sectors: oil & gas, energy, basic materials and chemicals. It may be assumed that companies included in the Respect Index portfolio should have lower risk of conflicts of interest.
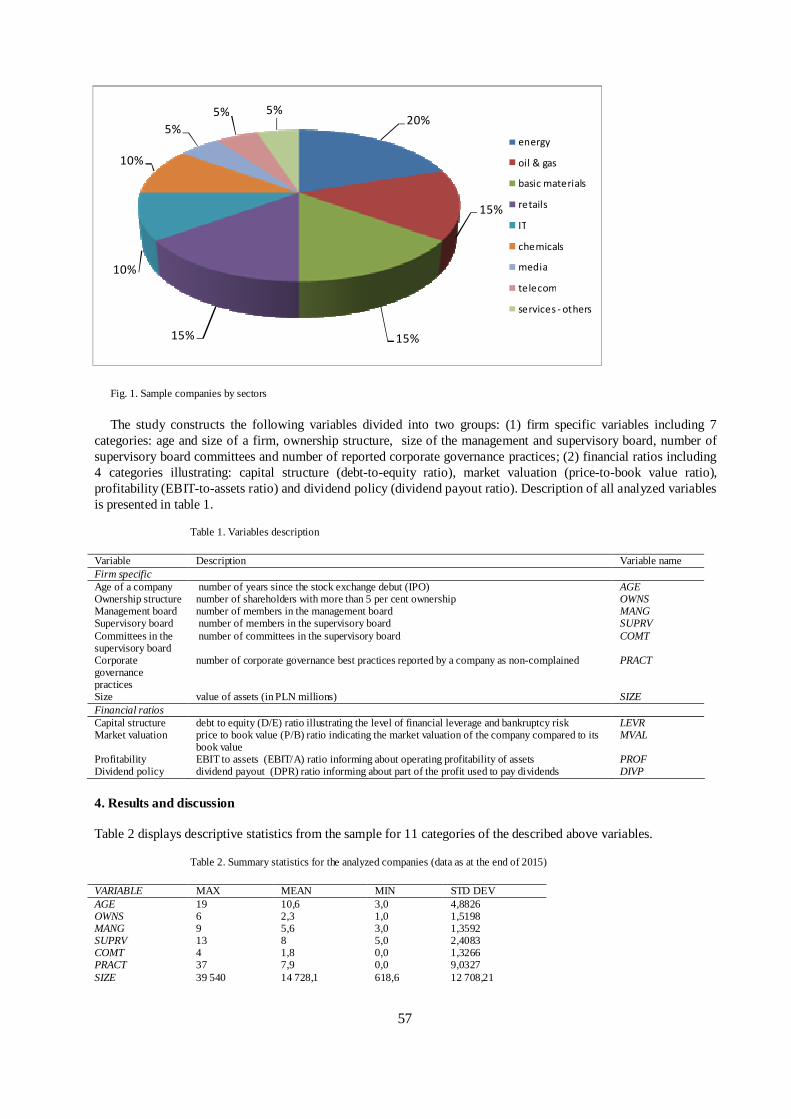
57
Fig. 1. Sample companies by sectors
The study constructs the following variables divided into two groups: (1) firm specific variables including 7 categories: age and size of a firm, ownership structure, size of the management and supervisory board, number of supervisory board committees and number of reported corporate governance practices; (2) financial ratios including 4 categories illustrating: capital structure (debt-to-equity ratio), market valuation (price-to-book value ratio), profitability (EBIT-to-assets ratio) and dividend policy (dividend payout ratio). Description of all analyzed variables is presented in table 1.
Table 1. Variables description
Variable Description Variable name Firm specific Age of a company number of years since the stock exchange debut (IPO) AGE Ownership structure number of shareholders with more than 5 per cent ownership OWNS Management board number of members in the management board MANG Supervisory board number of members in the supervisory board SUPRV Committees in the supervisory board
number of committees in the supervisory board COMT
Corporate governance practices
number of corporate governance best practices reported by a company as non-complained PRACT
Size value of assets (in PLN millions) SIZE Financial ratios Capital structure debt to equity (D/E) ratio illustrating the level of financial leverage and bankruptcy risk LEVR Market valuation price to book value (P/B) ratio indicating the market valuation of the company compared to its
book value MVAL
Profitability EBIT to assets (EBIT/A) ratio informing about operating profitability of assets PROF Dividend policy dividend payout (DPR) ratio informing about part of the profit used to pay dividends DIVP
4. Results and discussion
Table 2 displays descriptive statistics from the sample for 11 categories of the described above variables.
Table 2. Summary statistics for the analyzed companies (data as at the end of 2015)
VARIABLE MAX MEAN MIN STD DEV AGE 19 10,6 3,0 4,8826 OWNS 6 2,3 1,0 1,5198 MANG 9 5,6 3,0 1,3592 SUPRV 13 8 5,0 2,4083 COMT 4 1,8 0,0 1,3266 PRACT 37 7,9 0,0 9,0327 SIZE 39 540 14 728,1 618,6 12 708,21
20%
15%
15%15%
10%
10%
5%
5% 5%
energy
oil & gas
basic materials
retails
IT
chemicals
media
telecom
services - others
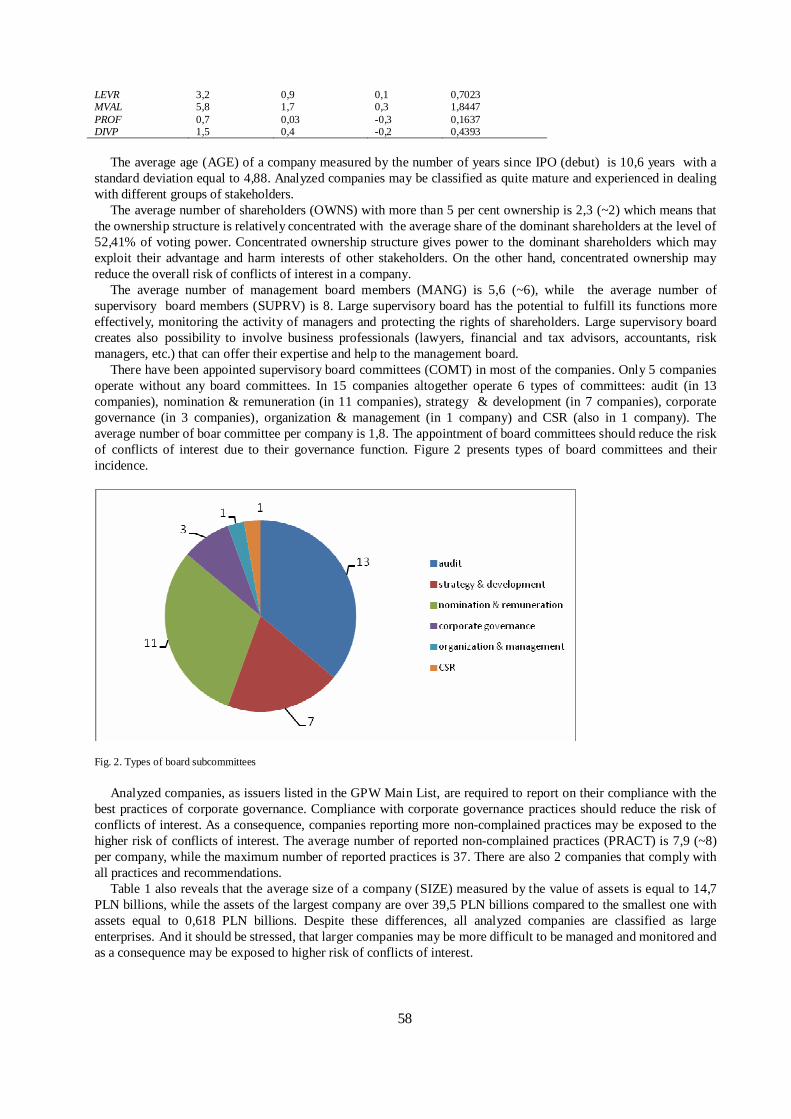
58
LEVR 3,2 0,9 0,1 0,7023 MVAL 5,8 1,7 0,3 1,8447 PROF 0,7 0,03 -0,3 0,1637 DIVP 1,5 0,4 -0,2 0,4393
The average age (AGE) of a company measured by the number of years since IPO (debut) is 10,6 years with a standard deviation equal to 4,88. Analyzed companies may be classified as quite mature and experienced in dealing with different groups of stakeholders.
The average number of shareholders (OWNS) with more than 5 per cent ownership is 2,3 (~2) which means that the ownership structure is relatively concentrated with the average share of the dominant shareholders at the level of 52,41% of voting power. Concentrated ownership structure gives power to the dominant shareholders which may exploit their advantage and harm interests of other stakeholders. On the other hand, concentrated ownership may reduce the overall risk of conflicts of interest in a company.
The average number of management board members (MANG) is 5,6 (~6), while the average number of supervisory board members (SUPRV) is 8. Large supervisory board has the potential to fulfill its functions more effectively, monitoring the activity of managers and protecting the rights of shareholders. Large supervisory board creates also possibility to involve business professionals (lawyers, financial and tax advisors, accountants, risk managers, etc.) that can offer their expertise and help to the management board.
There have been appointed supervisory board committees (COMT) in most of the companies. Only 5 companies operate without any board committees. In 15 companies altogether operate 6 types of committees: audit (in 13 companies), nomination & remuneration (in 11 companies), strategy & development (in 7 companies), corporate governance (in 3 companies), organization & management (in 1 company) and CSR (also in 1 company). The average number of boar committee per company is 1,8. The appointment of board committees should reduce the risk of conflicts of interest due to their governance function. Figure 2 presents types of board committees and their incidence.
Fig. 2. Types of board subcommittees
Analyzed companies, as issuers listed in the GPW Main List, are required to report on their compliance with the best practices of corporate governance. Compliance with corporate governance practices should reduce the risk of conflicts of interest. As a consequence, companies reporting more non-complained practices may be exposed to the higher risk of conflicts of interest. The average number of reported non-complained practices (PRACT) is 7,9 (~8) per company, while the maximum number of reported practices is 37. There are also 2 companies that comply with all practices and recommendations.
Table 1 also reveals that the average size of a company (SIZE) measured by the value of assets is equal to 14,7 PLN billions, while the assets of the largest company are over 39,5 PLN billions compared to the smallest one with assets equal to 0,618 PLN billions. Despite these differences, all analyzed companies are classified as large enterprises. And it should be stressed, that larger companies may be more difficult to be managed and monitored and as a consequence may be exposed to higher risk of conflicts of interest.
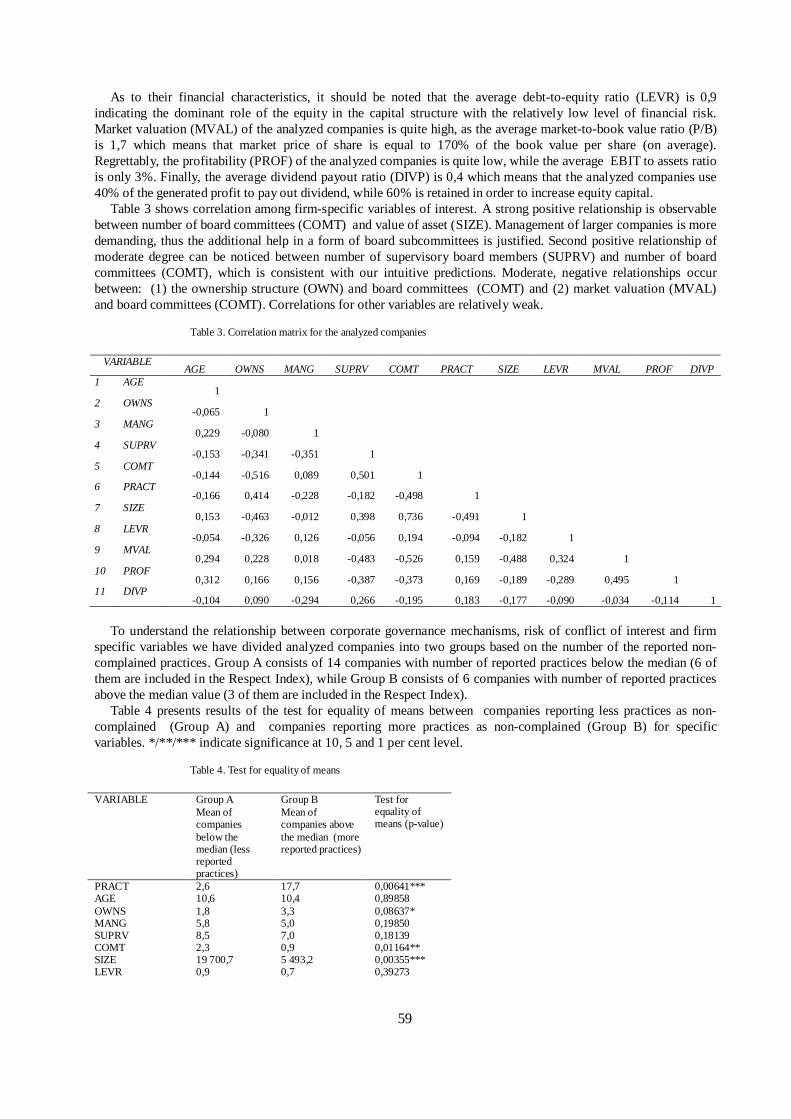
59
As to their financial characteristics, it should be noted that the average debt-to-equity ratio (LEVR) is 0,9 indicating the dominant role of the equity in the capital structure with the relatively low level of financial risk. Market valuation (MVAL) of the analyzed companies is quite high, as the average market-to-book value ratio (P/B) is 1,7 which means that market price of share is equal to 170% of the book value per share (on average). Regrettably, the profitability (PROF) of the analyzed companies is quite low, while the average EBIT to assets ratio is only 3%. Finally, the average dividend payout ratio (DIVP) is 0,4 which means that the analyzed companies use 40% of the generated profit to pay out dividend, while 60% is retained in order to increase equity capital.
Table 3 shows correlation among firm-specific variables of interest. A strong positive relationship is observable between number of board committees (COMT) and value of asset (SIZE). Management of larger companies is more demanding, thus the additional help in a form of board subcommittees is justified. Second positive relationship of moderate degree can be noticed between number of supervisory board members (SUPRV) and number of board committees (COMT), which is consistent with our intuitive predictions. Moderate, negative relationships occur between: (1) the ownership structure (OWN) and board committees (COMT) and (2) market valuation (MVAL) and board committees (COMT). Correlations for other variables are relatively weak.
Table 3. Correlation matrix for the analyzed companies
VARIABLE AGE OWNS MANG SUPRV COMT PRACT SIZE LEVR MVAL PROF DIVP
1 AGE 1
2 OWNS -0,065 1
3 MANG 0,229 -0,080 1
4 SUPRV -0,153 -0,341 -0,351 1
5 COMT -0,144 -0,516 0,089 0,501 1
6 PRACT -0,166 0,414 -0,228 -0,182 -0,498 1
7 SIZE 0,153 -0,463 -0,012 0,398 0,736 -0,491 1
8 LEVR -0,054 -0,326 0,126 -0,056 0,194 -0,094 -0,182 1
9 MVAL 0,294 0,228 0,018 -0,483 -0,526 0,159 -0,488 0,324 1
10 PROF 0,312 0,166 0,156 -0,387 -0,373 0,169 -0,189 -0,289 0,495 1
11 DIVP -0,104 0,090 -0,294 0,266 -0,195 0,183 -0,177 -0,090 -0,034 -0,114 1
To understand the relationship between corporate governance mechanisms, risk of conflict of interest and firm
specific variables we have divided analyzed companies into two groups based on the number of the reported non-complained practices. Group A consists of 14 companies with number of reported practices below the median (6 of them are included in the Respect Index), while Group B consists of 6 companies with number of reported practices above the median value (3 of them are included in the Respect Index).
Table 4 presents results of the test for equality of means between companies reporting less practices as non-complained (Group A) and companies reporting more practices as non-complained (Group B) for specific variables. */**/*** indicate significance at 10, 5 and 1 per cent level.
Table 4. Test for equality of means
Group A Group B VARIABLE Mean of companies below the median (less reported practices)
Mean of companies above the median (more reported practices)
Test for equality of means (p-value)
PRACT 2,6 17,7 0,00641*** AGE 10,6 10,4 0,89858 OWNS 1,8 3,3 0,08637* MANG 5,8 5,0 0,19850 SUPRV 8,5 7,0 0,18139 COMT 2,3 0,9 0,01164** SIZE 19 700,7 5 493,2 0,00355*** LEVR 0,9 0,7 0,39273
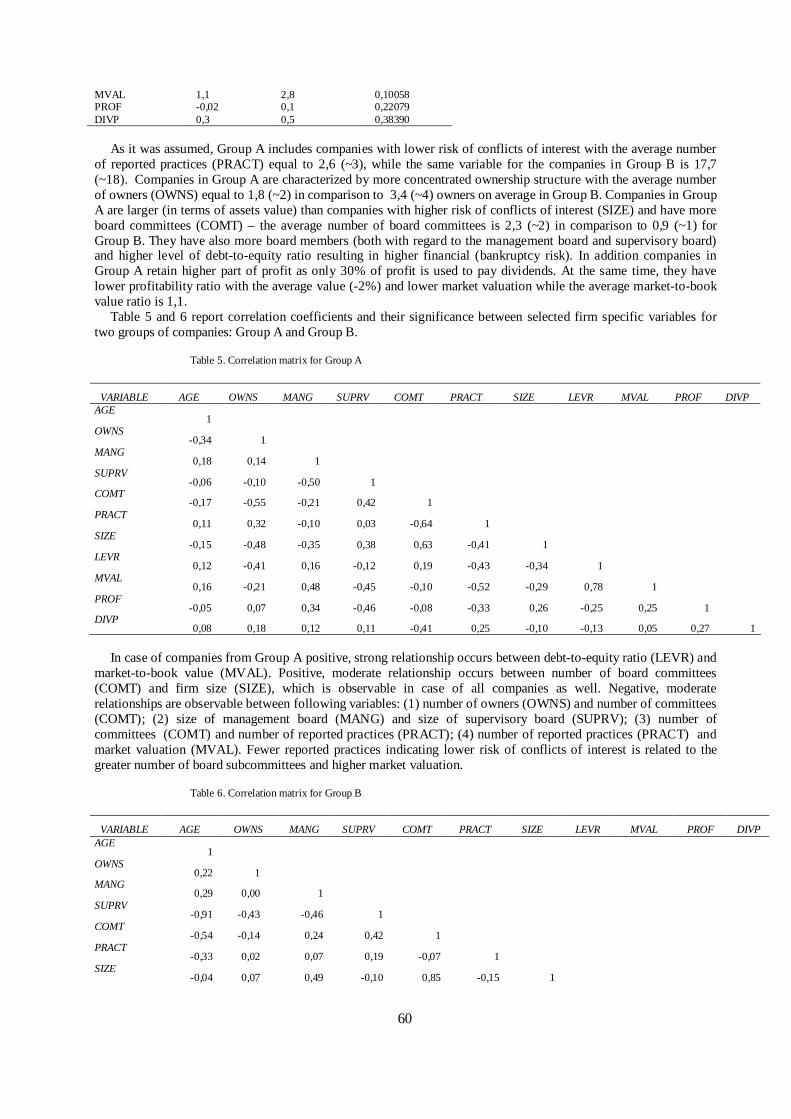
60
As it was assumed, Group A includes companies with lower risk of conflicts of interest with the average number
of reported practices (PRACT) equal to 2,6 (~3), while the same variable for the companies in Group B is 17,7 (~18). Companies in Group A are characterized by more concentrated ownership structure with the average number of owners (OWNS) equal to 1,8 (~2) in comparison to 3,4 (~4) owners on average in Group B. Companies in Group A are larger (in terms of assets value) than companies with higher risk of conflicts of interest (SIZE) and have more board committees (COMT) – the average number of board committees is 2,3 (~2) in comparison to 0,9 (~1) for Group B. They have also more board members (both with regard to the management board and supervisory board) and higher level of debt-to-equity ratio resulting in higher financial (bankruptcy risk). In addition companies in Group A retain higher part of profit as only 30% of profit is used to pay dividends. At the same time, they have lower profitability ratio with the average value (-2%) and lower market valuation while the average market-to-book value ratio is 1,1.
Table 5 and 6 report correlation coefficients and their significance between selected firm specific variables for two groups of companies: Group A and Group B.
Table 5. Correlation matrix for Group A
VARIABLE AGE OWNS MANG SUPRV COMT PRACT SIZE LEVR MVAL PROF DIVP AGE
1 OWNS
-0,34 1 MANG
0,18 0,14 1 SUPRV
-0,06 -0,10 -0,50 1 COMT
-0,17 -0,55 -0,21 0,42 1 PRACT
0,11 0,32 -0,10 0,03 -0,64 1 SIZE
-0,15 -0,48 -0,35 0,38 0,63 -0,41 1 LEVR
0,12 -0,41 0,16 -0,12 0,19 -0,43 -0,34 1 MVAL
0,16 -0,21 0,48 -0,45 -0,10 -0,52 -0,29 0,78 1 PROF
-0,05 0,07 0,34 -0,46 -0,08 -0,33 0,26 -0,25 0,25 1 DIVP
0,08 0,18 0,12 0,11 -0,41 0,25 -0,10 -0,13 0,05 0,27 1
In case of companies from Group A positive, strong relationship occurs between debt-to-equity ratio (LEVR) and market-to-book value (MVAL). Positive, moderate relationship occurs between number of board committees (COMT) and firm size (SIZE), which is observable in case of all companies as well. Negative, moderate relationships are observable between following variables: (1) number of owners (OWNS) and number of committees (COMT); (2) size of management board (MANG) and size of supervisory board (SUPRV); (3) number of committees (COMT) and number of reported practices (PRACT); (4) number of reported practices (PRACT) and market valuation (MVAL). Fewer reported practices indicating lower risk of conflicts of interest is related to the greater number of board subcommittees and higher market valuation.
Table 6. Correlation matrix for Group B
VARIABLE AGE OWNS MANG SUPRV COMT PRACT SIZE LEVR MVAL PROF DIVP AGE
1 OWNS
0,22 1 MANG
0,29 0,00 1 SUPRV
-0,91 -0,43 -0,46 1 COMT
-0,54 -0,14 0,24 0,42 1 PRACT
-0,33 0,02 0,07 0,19 -0,07 1 SIZE
-0,04 0,07 0,49 -0,10 0,85 -0,15 1
MVAL 1,1 2,8 0,10058 PROF -0,02 0,1 0,22079 DIVP 0,3 0,5 0,38390
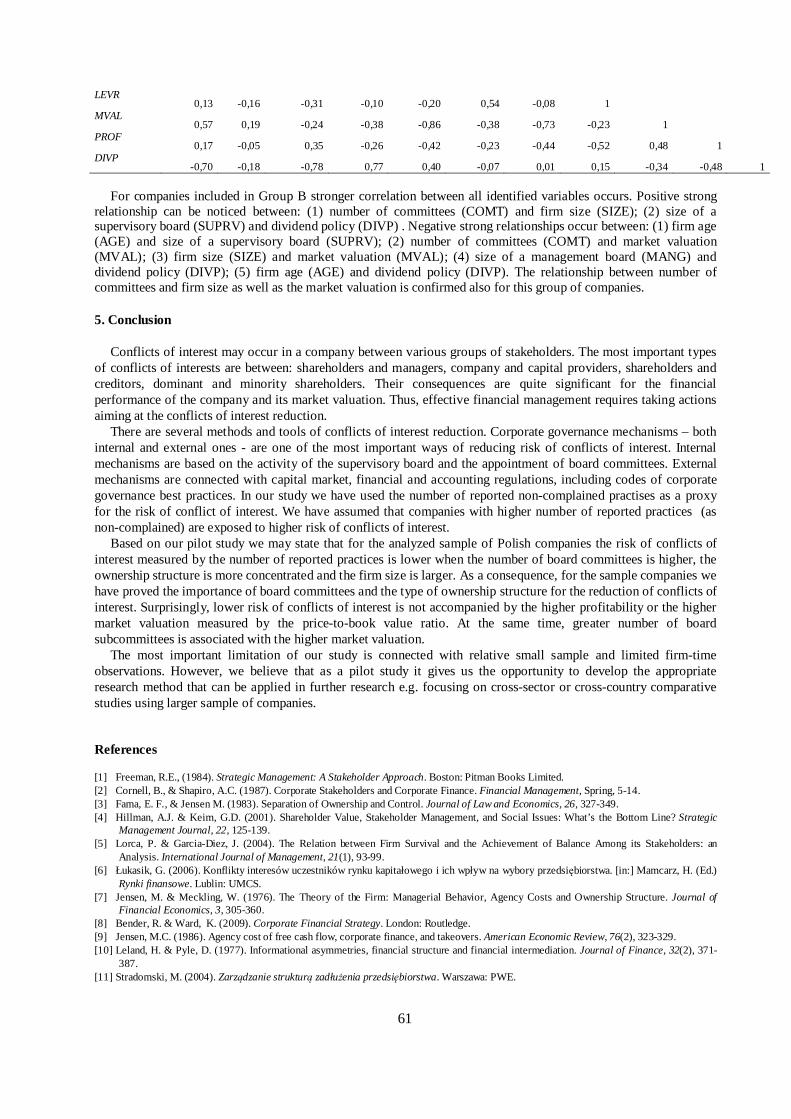
61
LEVR 0,13 -0,16 -0,31 -0,10 -0,20 0,54 -0,08 1
MVAL 0,57 0,19 -0,24 -0,38 -0,86 -0,38 -0,73 -0,23 1
PROF 0,17 -0,05 0,35 -0,26 -0,42 -0,23 -0,44 -0,52 0,48 1
DIVP -0,70 -0,18 -0,78 0,77 0,40 -0,07 0,01 0,15 -0,34 -0,48 1
For companies included in Group B stronger correlation between all identified variables occurs. Positive strong
relationship can be noticed between: (1) number of committees (COMT) and firm size (SIZE); (2) size of a supervisory board (SUPRV) and dividend policy (DIVP) . Negative strong relationships occur between: (1) firm age (AGE) and size of a supervisory board (SUPRV); (2) number of committees (COMT) and market valuation (MVAL); (3) firm size (SIZE) and market valuation (MVAL); (4) size of a management board (MANG) and dividend policy (DIVP); (5) firm age (AGE) and dividend policy (DIVP). The relationship between number of committees and firm size as well as the market valuation is confirmed also for this group of companies.
5. Conclusion
Conflicts of interest may occur in a company between various groups of stakeholders. The most important types of conflicts of interests are between: shareholders and managers, company and capital providers, shareholders and creditors, dominant and minority shareholders. Their consequences are quite significant for the financial performance of the company and its market valuation. Thus, effective financial management requires taking actions aiming at the conflicts of interest reduction.
There are several methods and tools of conflicts of interest reduction. Corporate governance mechanisms – both internal and external ones - are one of the most important ways of reducing risk of conflicts of interest. Internal mechanisms are based on the activity of the supervisory board and the appointment of board committees. External mechanisms are connected with capital market, financial and accounting regulations, including codes of corporate governance best practices. In our study we have used the number of reported non-complained practises as a proxy for the risk of conflict of interest. We have assumed that companies with higher number of reported practices (as non-complained) are exposed to higher risk of conflicts of interest.
Based on our pilot study we may state that for the analyzed sample of Polish companies the risk of conflicts of interest measured by the number of reported practices is lower when the number of board committees is higher, the ownership structure is more concentrated and the firm size is larger. As a consequence, for the sample companies we have proved the importance of board committees and the type of ownership structure for the reduction of conflicts of interest. Surprisingly, lower risk of conflicts of interest is not accompanied by the higher profitability or the higher market valuation measured by the price-to-book value ratio. At the same time, greater number of board subcommittees is associated with the higher market valuation.
The most important limitation of our study is connected with relative small sample and limited firm-time observations. However, we believe that as a pilot study it gives us the opportunity to develop the appropriate research method that can be applied in further research e.g. focusing on cross-sector or cross-country comparative studies using larger sample of companies.
References
[1] Freeman, R.E., (1984). Strategic Management: A Stakeholder Approach. Boston: Pitman Books Limited. [2] Cornell, B., & Shapiro, A.C. (1987). Corporate Stakeholders and Corporate Finance. Financial Management, Spring, 5-14. [3] Fama, E. F., & Jensen M. (1983). Separation of Ownership and Control. Journal of Law and Economics, 26, 327-349. [4] Hillman, A.J. & Keim, G.D. (2001). Shareholder Value, Stakeholder Management, and Social Issues: What’s the Bottom Line? Strategic
Management Journal, 22, 125-139. [5] Lorca, P. & Garcia-Diez, J. (2004). The Relation between Firm Survival and the Achievement of Balance Among its Stakeholders: an
Analysis. International Journal of Management, 21(1), 93-99. [6] Łukasik, G. (2006). Konflikty interesów uczestników rynku kapitałowego i ich wpływ na wybory przedsiębiorstwa. [in:] Mamcarz, H. (Ed.)
Rynki finansowe. Lublin: UMCS. [7] Jensen, M. & Meckling, W. (1976). The Theory of the Firm: Managerial Behavior, Agency Costs and Ownership Structure. Journal of
Financial Economics, 3, 305-360. [8] Bender, R. & Ward, K. (2009). Corporate Financial Strategy. London: Routledge. [9] Jensen, M.C. (1986). Agency cost of free cash flow, corporate finance, and takeovers. American Economic Review, 76(2), 323-329. [10] Leland, H. & Pyle, D. (1977). Informational asymmetries, financial structure and financial intermediation. Journal of Finance, 32(2), 371-
387. [11] Stradomski, M. (2004). Zarządzanie strukturą zadłużenia przedsiębiorstwa. Warszawa: PWE.

62
[12] Łukasik, G. (ed.). (2007). Przedsiębiorstwo na rynku kapitałowym. Katowice: Prace Naukowe Akademii Ekonomicznej im. K. Adamieckiego w Katowicach.
[13] Megginson, W.L., & Smart, S.B. (2011). Introduction to Corporate Finance. Chichester: Wiley. [14] Lumby, S. & Jones, Ch. (2011). Corporate Finance, Theory and Practice. Andover: Cengage Learning, South-Western. [15] Adams, R., Hermalin, B.E., & Weisbach, M.S. (2008). The role of boards of directors in corporate governance: a conceptual framework &
survey. Working Paper Series, Center for Resposible Business, UC Berkeley. [16] Hopt, K.J., & Leyens, P.C. (2004). Board Models in Europe. Recent developments of internal corporate governance structures in Germany,
the United Kingdom, France and Italy. Law Working Paper no. 18/2004, ECGI Working Papers in Law. [17] Collier, P., & Zaman, M. (2005). Convergence in European Governance Codes: the Audit Committee Concept. Corporate Governance. An
International Review, 13(6), 753-768. [18] Aguilera, R.V., & Cuervo-Cazzurra, A. (2004). Codes of Good Governance Worldwide: What is the Trigger? Organization Studies, 25(3),
417-446. [19] Seidl, D. (2007). Standard Setting and Following in Corporate Governance: An Observation-Theoretical Study of the Effectiveness of
Governance Codes. Organization, 14(5), 705-727. [20] Best Practice for GPW Listed Companies 2016 (2016). Warszawa: GPW. [https://www.gpw.pl/WSE_corporate_governance].
63
Financial innovations offered by insurance sector to enterprises – Polish experience
Joanna BŁACHa1 , Anna DOŚb,
a University of Economics in Katowice, Faculty of Finance and Insurance, Department of Corporate Finance and Insurance, ul. Bogucick 14, 40-287 Katowice, Poland, [email protected]
b University of Economics in Katowice, Faculty of Finance and Insurance, Department of Corporate Finance and Insurance, ul. Bogucick 14, 40-287 Katowice, Poland, [email protected]
Abstract
In a rapidly changing world, it is stressed that innovation is no longer an option, it is a necessity. This holds for insurance sector as well, where insurance companies offer novel solutions for their corporate customers. The main objective of this research paper is to identify and analyze the types of financial innovations offered by insurance sector in Poland to non-financial enterprises. Two research methods are exploited: internet survey of insurance products offered by ten largest insurance companies and telephone interviews with experienced insurance brokers. Many diverse innovations are observable at Polish insurance market. There are supply-driven as well as demand-driven innovations. Some of them are positively evaluated and other are still not well suited to corporate clients’ needs. There is an urgent need to personalize relationship between insurers and insured.
Keywords: insurance producs, insurance market, interview, insurance brokers, risk management
INTRODUCTION
Financial system with its elements: markets, instruments, institutions and regulations - is constantly evolving. This evolution results in new financial solutions, instruments and mechanisms which constitute category of financial innovations. Although financial innovations are created and implemented in the financial sector to increase efficiency, to improve financial results and to gain competitive advantage by financial institutions, they can be also applied by the non-financial enterprises within financial decisions and risk management process. Thus, financial innovations are also created as a response to the new needs and expectations of all participants of the financial system.
Increasing volatility of business environment results in growing exposure to risk. Therefore in our study we would like to address the problem of risk management process with regard to the new solutions, products and services available for non-financial enterprises. In particular we focus on one group of financial innovations that are created by the insurers and offered to their corporate customers. These innovations are created to improve the risk management process and can be applied within risk transfer and risk retention decisions.
The main objective of this research paper is to identify and analyze the types of financial innovations offered by insurance sector in Poland to non-financial enterprises. We would like to confront the applied innovations with trends and solutions noticeable in the global insurance market.
The paper is structured as follows. Section 2 provides theoretical framework for our research with regard to the types and motives of financial innovations in the insurance sector and the space for financial innovations within risk
* Corresponding author.
64
management process in a company. Section 3 describes sources of data and the applied methods which include: internet survey (analysis of current insurance products and services offered to non-financial companies with regard to their novelty) and telephone interview (analysis of insurance brokers’ opinions on the innovations in the Polish insurance sector devoted to non-financial companies). Section 4 presents the results of internet survey indicating the main types of innovations related to the risk management and risk transfer. Section 5 reveals the opinion of insurance brokers on the current state and the development of the insurers’ offer to corporate clients. Discussion of results is provided in section 6 while section 7 concludes the paper.
2. Theoretical framework
2.1. Financial innovations in the insurance sector
Role of innovation in the economic growth is indisputable. It is said that innovation is at the heart of any healthy business [1]. Innovation is also described as being among the most desired but least understood of corporate goals[2]. Innovation can be defined an classified in many ways. But the most important feature is the novelty and the opportunity to improve the situation of users of innovation.
In a rapidly changing world, it is stressed that innovation is no longer an option, it is a necessity. It was confirmed that companies that innovate have higher survival during downturns, are more profitable and outplace competitors in periods of economic growth. Success depends upon aligning innovation with firm’s strategy and using the most modern approaches to innovation management.
One particular type of innovation is financial innovation that occurs in the financial system and its elements: markets, institutions, instruments and regulations [3] [4]. Based on the positive approach (innovation-growth approach) to the innovation process, financial innovations are created and applied to meet market imperfections (agency costs, transaction costs, asymmetric information, risk and tax regulations) and improve the functions performed by the financial system [5], [6]. These functions can be classified as: payment, investment, financing, pricing and risk management functions [7].
Financial innovations, as any other types of innovations, may take form of product, process, marketing and organization innovations. In narrow meaning financial innovations are defined as new financial products and services that change financial strategy and improve financial results of their users: households, business entities, financial institutions, government. However, financial institutions are not only users of financial innovations, as their main role is to create financial innovations.
Financial institutions, including insurers, are nowadays forced to innovate on a regular basis. Intense market competition, globalization and disintermediation are the most important factors that determine the innovation activity of financial institutions (creators of financial innovation). They are willing to innovate to improve their market reputation, to reduce the business risk and to protect their financial results. The process of financial innovation is intensified by the dynamic development of communication and information technology including internet and Big Data solutions. Financial innovation initiated by and for the purposes of financial institutions falls into the supply-driven category of innovation [7]. However most of the financial innovation can be explained by the demand theory of innovation which focuses on the needs of customers (end-users of financial innovation). According to this approach financial innovation can be described as: finding new ways to meet existing needs, ways to meet new needs and ways to meet and create as yet unknown needs. Nowadays demand-driven innovations represent the dominant part of financial products and services offered by financial institutions to their customers.
Insurance sector is regarded as the most traditional part of financial system. However financial innovations are also created and applied in insurance sector, while changes are fuelled in large part by technological transformations (such as the Internet of things, Big Data and mobility applications), as well as the general open-mindedness on the part of regulators and customers toward new sources of coverage and emerging methods of sharing risk and transferring risk [8].
In insurance sector first group of innovation consists of product innovation with many insurers investing large budgets in product development to gain their competitive advantage. The history of insurance product innovation is a history of human trade and development [2]. However innovation in insurance industry may take also other forms such as: process, organization and marketing innovation. Insurers may innovate in all areas of excellence that are relevant to their business and exploit them for sustainable competitive advantage. These levers for success include: operational framework, product proposition, pricing and analytics, new business organization and distribution and risk, capital and tax management [8].
Most of the innovative trends in the insurance industry now are either technology related or have technology as one of its drivers. The Internet of Things (IoT) and usage-based insurance (UBI), Big Data and entry of non-
65
traditional firms in the insurance industry are high impact trends which will have significant bearing on both insurers and customers. Other innovative trends include: insurance-linked securitization and insurance-linked securities (ILS), peer-to-peer insurance and microinsurance, cyber risk and cyber insurance, aerial and digital imagery, gamification, mHealth apps with customer adherence apps[9] [10].
Financial innovations in insurance sector can be classified as disruptive (radical) innovations and sustaining (incremental) innovations. Disruptive innovations put through the frontiers to create a new business model. They have power to alter the market and the way an industry operates. Exemplary disruptive innovations in the insurance sector include: predictive analytics, usage-based insurance (UBI), insurance-linked securitization and ILS and micro-insurance. Sustaining innovations expand boundaries of an existing business model. They take something that exists today and make it better. In case of insurance sector incremental innovations may include: added features to the insurance products, streamlined processes expanded (Big Data analysis) or new/improved distribution channels (bancassurance, teleassurance).
2.2. Financial innovations in the risk management process
Financial innovations – as it was previously assumed - are created and applied to enhance the functions of
financial system, including risk management function. Non-financial enterprises (both large corporations and SMEs) may implement successfully financial innovations in their risk management process. In applicative sense, financial innovations are tied to the methods and techniques of so called risk treatment being the last stage of risk management process according to the framework of risk management consistent with ISO guideline [11]. Risk treatment stage is preceded by the risk assessment and the context establishment stages, accompanied by the constant communication & consultation with stakeholders and the monitoring and reviewing actions taken by the management. Risk treatment is the stage at which an enterprise decides which tools and techniques should be implemented in order to reduce the level of identified risk [12]. Risk treatment techniques include physical risk control and financial risk control, while the latter creates the space for the financial innovations. Financial risk control applies various tools and techniques that assure a future source of financing and covering the possible financial outcome of risk occurrence. Thus financial innovations may emerge in both elements of financial risk control – risk retention (based on the alternative risk finance mechanisms) and risk transfer (based on insurance risk transfer and financial market instruments solutions). Non-insurance risk transfer based on the financial market instruments is related to the application of derivatives, structured instruments and Insurance-Linked Securities (ILS) that are used to hedge against market risk [13] [14]. However, this interesting area of risk management is beyond the scope of this paper, as here we focus on the innovations offered by the insurance sector.
Innovation in risk retention emerges in the creation of so called Alternative Risk Finance (ARF) instruments that
allow the use of risk retention on a larger scale by combining the features of both: risk transfer and risk retention. The solutions that belong to ARFs are identifiable by high level of customization, multi-year and multi-trigger approach, with the inclusion of traditionally non-insurable risks. ARFs include: finite risk programs, MTPs (multi-line, multi-trigger products) or MMPs (multi-line, multi-year products) [15] [16] [13].
Within insurance risk transfer three areas of financial innovations may be analyzed: (a) the changing conditions
of insurance protection, (b) parameterization and (c) new insurance products [17][18]. The first area of innovation is tied to the changes of typical elements of insurance contract, that leads to the
changes of the scale of insurance coverage. As a consequence of customization process, new insurance products are better adjusted to the needs of particular customers. Typical directions of such innovations are connected with: • changes of co-insurance features (deductibles) that increase or decrease the financial participation of an insurer in
financial outcome of risk;
• changes of insurance caps;
• changes in the length of insurance periods (e.g. multi-year covers);
• changes in insurance protection subject-, object- or space dimensions (e.g. inclusion or exclusion of certain types of risk, property, localizations);
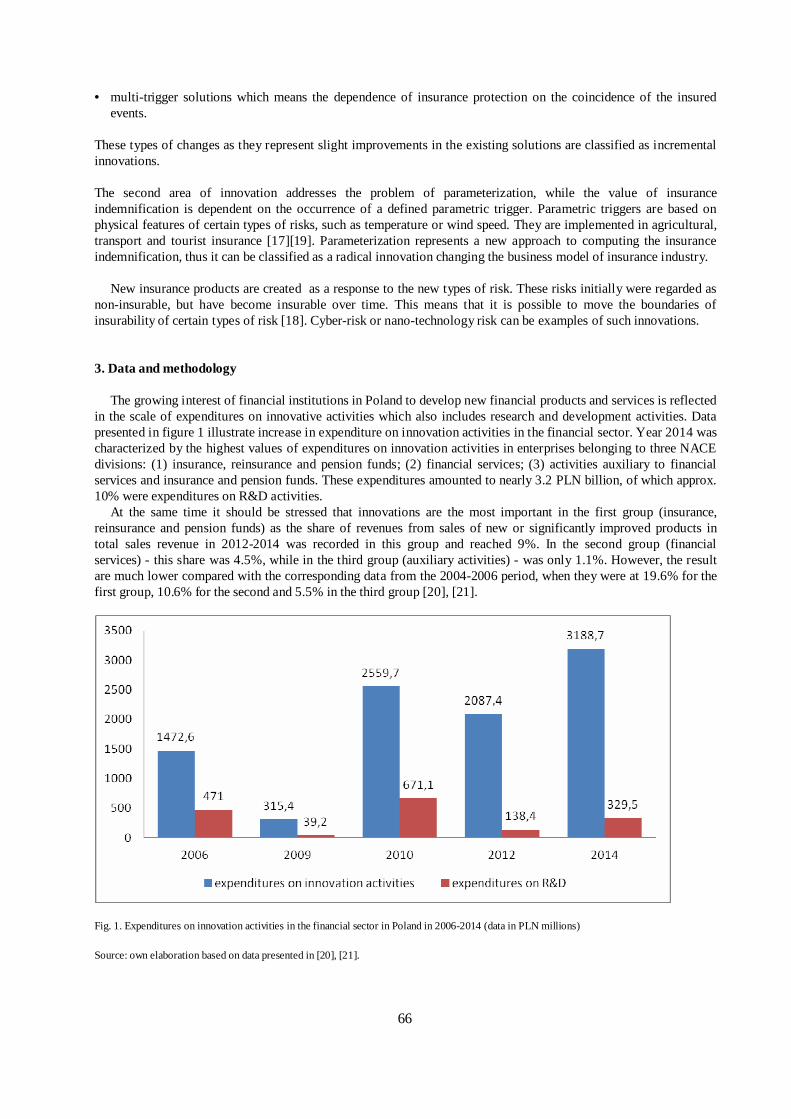
66
• multi-trigger solutions which means the dependence of insurance protection on the coincidence of the insured events.
These types of changes as they represent slight improvements in the existing solutions are classified as incremental innovations.
The second area of innovation addresses the problem of parameterization, while the value of insurance indemnification is dependent on the occurrence of a defined parametric trigger. Parametric triggers are based on physical features of certain types of risks, such as temperature or wind speed. They are implemented in agricultural, transport and tourist insurance [17][19]. Parameterization represents a new approach to computing the insurance indemnification, thus it can be classified as a radical innovation changing the business model of insurance industry.
New insurance products are created as a response to the new types of risk. These risks initially were regarded as non-insurable, but have become insurable over time. This means that it is possible to move the boundaries of insurability of certain types of risk [18]. Cyber-risk or nano-technology risk can be examples of such innovations.
3. Data and methodology
The growing interest of financial institutions in Poland to develop new financial products and services is reflected in the scale of expenditures on innovative activities which also includes research and development activities. Data presented in figure 1 illustrate increase in expenditure on innovation activities in the financial sector. Year 2014 was characterized by the highest values of expenditures on innovation activities in enterprises belonging to three NACE divisions: (1) insurance, reinsurance and pension funds; (2) financial services; (3) activities auxiliary to financial services and insurance and pension funds. These expenditures amounted to nearly 3.2 PLN billion, of which approx. 10% were expenditures on R&D activities.
At the same time it should be stressed that innovations are the most important in the first group (insurance, reinsurance and pension funds) as the share of revenues from sales of new or significantly improved products in total sales revenue in 2012-2014 was recorded in this group and reached 9%. In the second group (financial services) - this share was 4.5%, while in the third group (auxiliary activities) - was only 1.1%. However, the result are much lower compared with the corresponding data from the 2004-2006 period, when they were at 19.6% for the first group, 10.6% for the second and 5.5% in the third group [20], [21].
Fig. 1. Expenditures on innovation activities in the financial sector in Poland in 2006-2014 (data in PLN millions)
Source: own elaboration based on data presented in [20], [21].
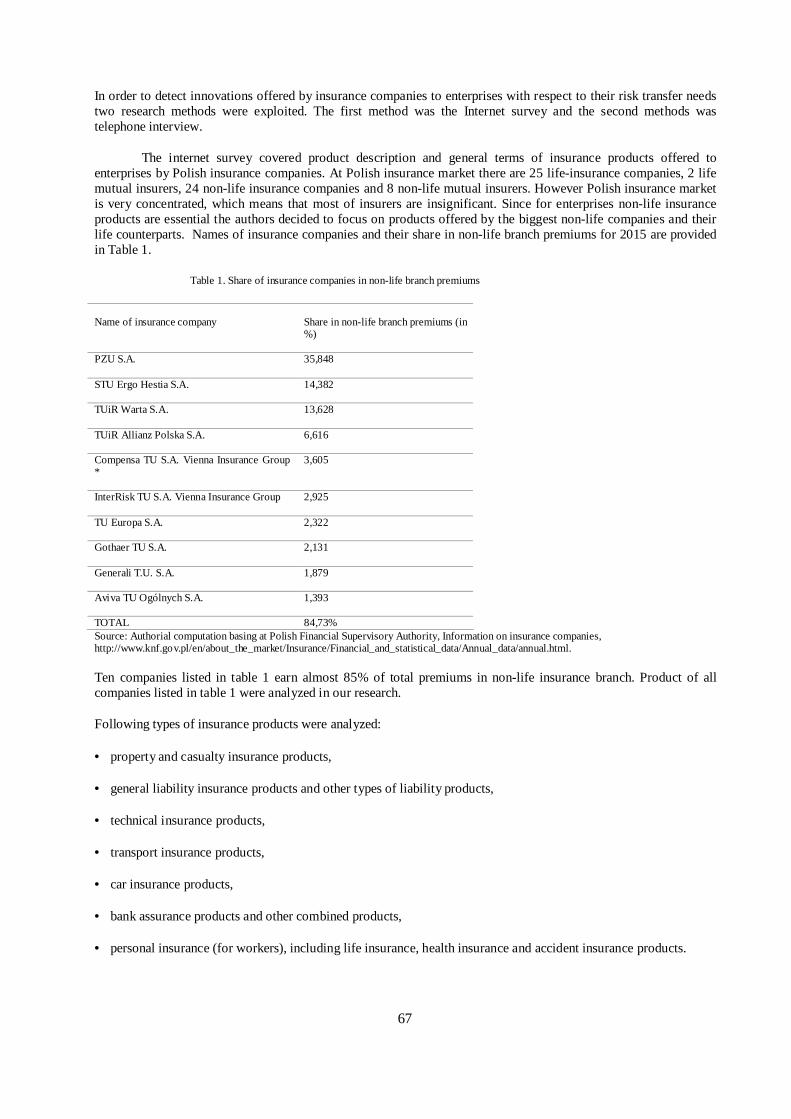
67
In order to detect innovations offered by insurance companies to enterprises with respect to their risk transfer needs two research methods were exploited. The first method was the Internet survey and the second methods was telephone interview.
The internet survey covered product description and general terms of insurance products offered to enterprises by Polish insurance companies. At Polish insurance market there are 25 life-insurance companies, 2 life mutual insurers, 24 non-life insurance companies and 8 non-life mutual insurers. However Polish insurance market is very concentrated, which means that most of insurers are insignificant. Since for enterprises non-life insurance products are essential the authors decided to focus on products offered by the biggest non-life companies and their life counterparts. Names of insurance companies and their share in non-life branch premiums for 2015 are provided in Table 1.
Table 1. Share of insurance companies in non-life branch premiums
Name of insurance company
Share in non-life branch premiums (in %)
PZU S.A. 35,848
STU Ergo Hestia S.A.
14,382
TUiR Warta S.A.
13,628
TUiR Allianz Polska S.A.
6,616
Compensa TU S.A. Vienna Insurance Group *
3,605
InterRisk TU S.A. Vienna Insurance Group
2,925
TU Europa S.A.
2,322
Gothaer TU S.A.
2,131
Generali T.U. S.A.
1,879
Aviva TU Ogólnych S.A.
1,393
TOTAL 84,73% Source: Authorial computation basing at Polish Financial Supervisory Authority, Information on insurance companies, http://www.knf.gov.pl/en/about_the_market/Insurance/Financial_and_statistical_data/Annual_data/annual.html.
Ten companies listed in table 1 earn almost 85% of total premiums in non-life insurance branch. Product of all companies listed in table 1 were analyzed in our research.
Following types of insurance products were analyzed:
• property and casualty insurance products,
• general liability insurance products and other types of liability products,
• technical insurance products,
• transport insurance products,
• car insurance products,
• bank assurance products and other combined products,
• personal insurance (for workers), including life insurance, health insurance and accident insurance products.
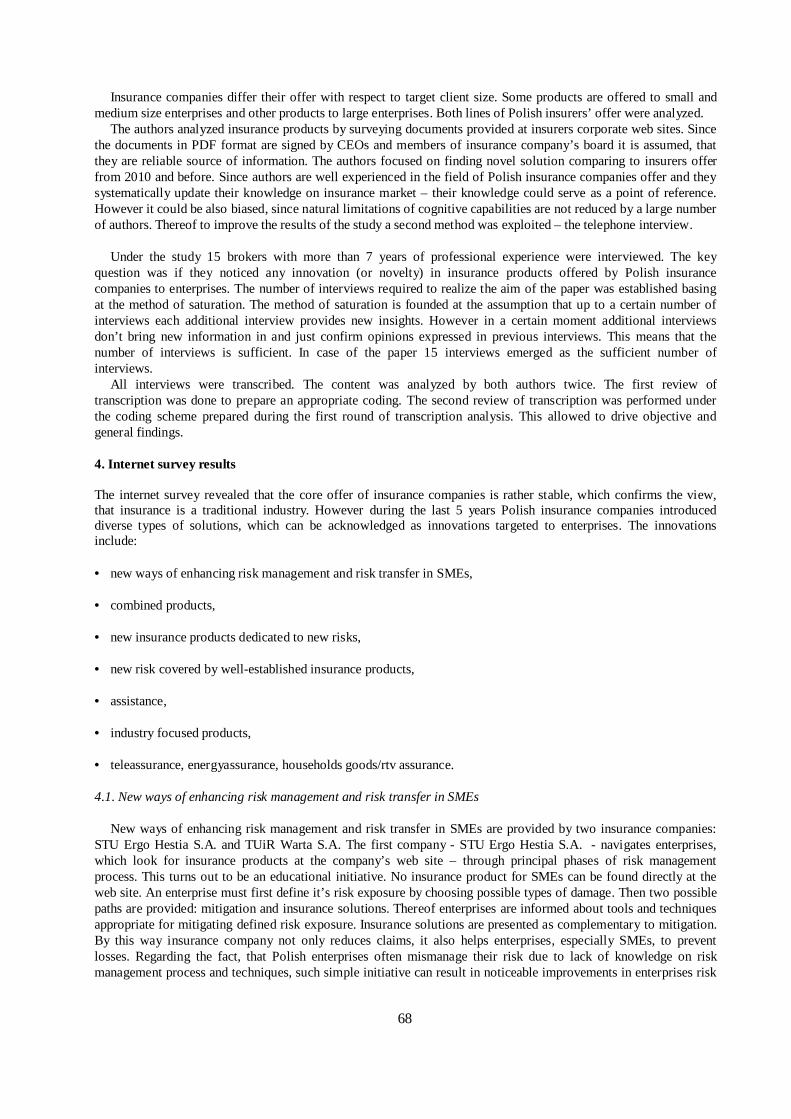
68
Insurance companies differ their offer with respect to target client size. Some products are offered to small and medium size enterprises and other products to large enterprises. Both lines of Polish insurers’ offer were analyzed.
The authors analyzed insurance products by surveying documents provided at insurers corporate web sites. Since the documents in PDF format are signed by CEOs and members of insurance company’s board it is assumed, that they are reliable source of information. The authors focused on finding novel solution comparing to insurers offer from 2010 and before. Since authors are well experienced in the field of Polish insurance companies offer and they systematically update their knowledge on insurance market – their knowledge could serve as a point of reference. However it could be also biased, since natural limitations of cognitive capabilities are not reduced by a large number of authors. Thereof to improve the results of the study a second method was exploited – the telephone interview.
Under the study 15 brokers with more than 7 years of professional experience were interviewed. The key
question was if they noticed any innovation (or novelty) in insurance products offered by Polish insurance companies to enterprises. The number of interviews required to realize the aim of the paper was established basing at the method of saturation. The method of saturation is founded at the assumption that up to a certain number of interviews each additional interview provides new insights. However in a certain moment additional interviews don’t bring new information in and just confirm opinions expressed in previous interviews. This means that the number of interviews is sufficient. In case of the paper 15 interviews emerged as the sufficient number of interviews.
All interviews were transcribed. The content was analyzed by both authors twice. The first review of transcription was done to prepare an appropriate coding. The second review of transcription was performed under the coding scheme prepared during the first round of transcription analysis. This allowed to drive objective and general findings.
4. Internet survey results
The internet survey revealed that the core offer of insurance companies is rather stable, which confirms the view, that insurance is a traditional industry. However during the last 5 years Polish insurance companies introduced diverse types of solutions, which can be acknowledged as innovations targeted to enterprises. The innovations include:
• new ways of enhancing risk management and risk transfer in SMEs,
• combined products,
• new insurance products dedicated to new risks,
• new risk covered by well-established insurance products,
• assistance,
• industry focused products,
• teleassurance, energyassurance, households goods/rtv assurance.
4.1. New ways of enhancing risk management and risk transfer in SMEs
New ways of enhancing risk management and risk transfer in SMEs are provided by two insurance companies: STU Ergo Hestia S.A. and TUiR Warta S.A. The first company - STU Ergo Hestia S.A. - navigates enterprises, which look for insurance products at the company’s web site – through principal phases of risk management process. This turns out to be an educational initiative. No insurance product for SMEs can be found directly at the web site. An enterprise must first define it’s risk exposure by choosing possible types of damage. Then two possible paths are provided: mitigation and insurance solutions. Thereof enterprises are informed about tools and techniques appropriate for mitigating defined risk exposure. Insurance solutions are presented as complementary to mitigation. By this way insurance company not only reduces claims, it also helps enterprises, especially SMEs, to prevent losses. Regarding the fact, that Polish enterprises often mismanage their risk due to lack of knowledge on risk management process and techniques, such simple initiative can result in noticeable improvements in enterprises risk

69
managements. STU Ergo Hestia S.A. provides two additional tools to help their clients improving risk management. These tools are: “Risk Focus” – a journal dedicated to describe diverse types of risk, and “Ekoszkody” – a handbook on ecological risk. Nevertheless those tools have been provided for almost a decade, thereof they are not acknowledged as “innovations” in terms of this study.
The second company - TUiR Warta S.A. – provides other solution for enhancing risk management in SMEs. It is
called “insurance configurator”. The configurator allows enterprises to scan risk types according to a branch. It is possible to scan six branches, for which from 24 to 31 types of risk are described. This allows preparing a kind of risk check-list. Appropriate insurance products are recommended according to identified risk check-list. After the configuration is done, a client can print the results. The configurator is beneficial for insurers clients, because it helps enterprises to define their insurance needs. It means that it supports avoiding loopholes in coverage and at the same time it helps to avoid buying superfluous insurance products. Nevertheless the configurator could be improved with regard to its details, that often turn out to be crucial for insurance usefulness for a certain client as well as for insurance premium.
Both ways of enhancing risk management can be useful for inexperienced SMEs but not for larger enterprises. Nevertheless considering that SMEs constitute a foundation for the economy, such simple solutions should be recommended to be offered by other insurance companies.
4.2. Combined products
A noticeable novelty is that almost all insurance companies offer combined products to SMEs. Contrary to standard products (eg. property FLEXA insurance), whose general terms of insurance are almost the same in every insurance company, combined products are very diverse. Although the very basic insurance coverage for firms should include property and casualty insurance and general liability insurance, only few insurance companies (eg. PZU S.A., InterRisk TU S.A., Vienna Insurance Group) actually provide those two basic types of insurance within combined products. Other insurance companies pack only property insurance in the combined product and add additional non-standard coverage (eg. cargo insurance, legal protection insurance, assistance insurance or business interruption insurance) leaving general liability to be covered by a separate insurance product.
Combined products seem to be a comfortable solution to SMEs, however in authors’ opinion this is not actually the case. The fact is that single agreement, single premium and single documents administration eases managing insurance programs. However significant diversity of products is confusing for enterprises looking for appropriate coverage. For example: one insurance company within combined product offers property insurance (FLEXA type) jointly with insurance of theft and vandalism, electronic equipment insurance, damage in inventory due to defrosting, cargo insurance and glass broking. Another insurance company (within its combined product) offers property insurance, business interruption insurance, general liability insurance, vandalism, accident and health insurance and legal protection insurance. In that case insurance decision turns out to be much more complex. In the end combined products don’t fit exactly client’s needs and client must construct an entire insurance program. Finally comparing insurance premiums becomes truly difficult for SMEs. For this reason this type of innovation in insurers offer seems to be for the purpose of differentiation and marketing rather than a response to client’s needs.
4.3. New insurance products
Another novelty observed by authors in the offer of Polish insurance targeted to enterprises are completely new products. These new products are designed to cover new risks emerging from turbulent business environment.
The prominent example of such products is a cyber insurance. Cyber insurance is offered by STU Ergo Hestia S.A. It’s coverage is quite complex and it is adjusted to modern risk profile. Under the cyber insurance enterprise can transfer following types of risk: loss of data risk (including costs of recapturing data, costs of buying new software, costs of removing malicious software), other costs (including costs of public relations necessary to restore firm’s image, costs of data protection, costs of legal consulting) as well as third party liability insurance (costs of restoration of data at injured side, costs of system restoration at injured side, costs of investigation, costs of administrative procedures, third party business interruption). Compensa TU S.A., Vienna Insurance Group and Aviva TU Ogólnych S.A. offer cyber insurance products too, however their coverage is much narrower – it covers data carriers damage and data restoration. STU Ergo Hestia offers also third-party insurance dedicated to enterprises contracted to design and implement IT systems. This product is tailored to specific needs of IT companies.
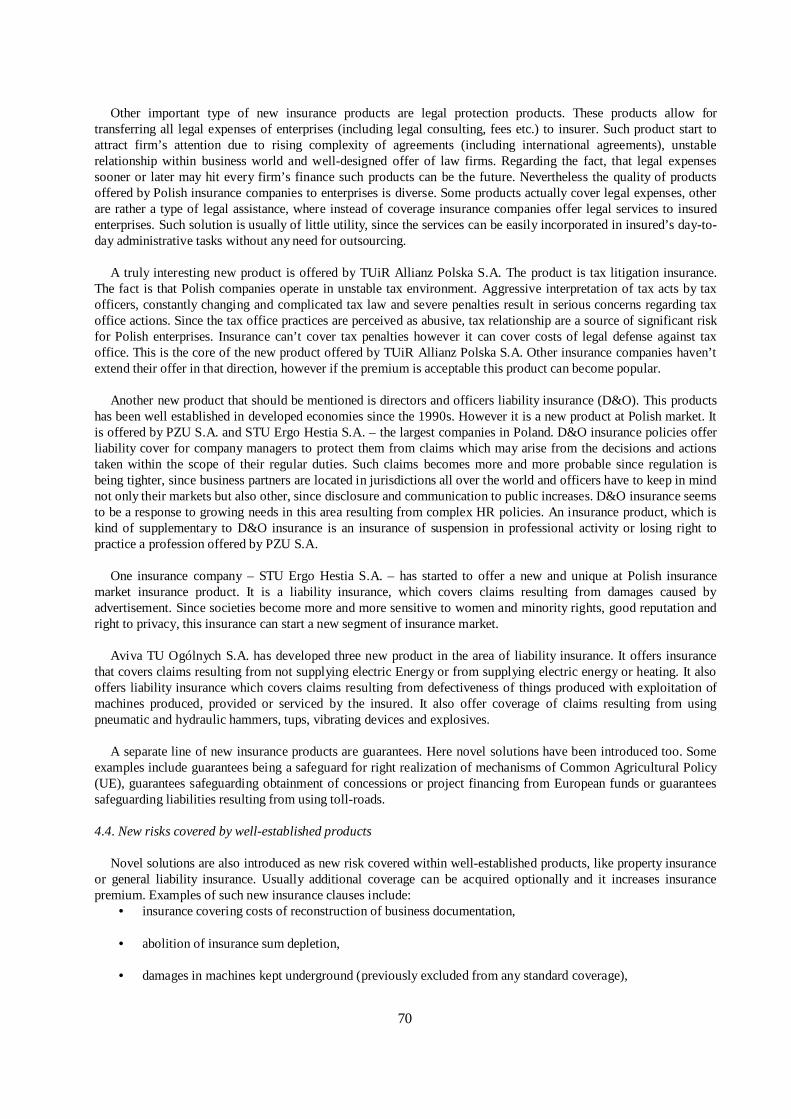
70
Other important type of new insurance products are legal protection products. These products allow for
transferring all legal expenses of enterprises (including legal consulting, fees etc.) to insurer. Such product start to attract firm’s attention due to rising complexity of agreements (including international agreements), unstable relationship within business world and well-designed offer of law firms. Regarding the fact, that legal expenses sooner or later may hit every firm’s finance such products can be the future. Nevertheless the quality of products offered by Polish insurance companies to enterprises is diverse. Some products actually cover legal expenses, other are rather a type of legal assistance, where instead of coverage insurance companies offer legal services to insured enterprises. Such solution is usually of little utility, since the services can be easily incorporated in insured’s day-to-day administrative tasks without any need for outsourcing.
A truly interesting new product is offered by TUiR Allianz Polska S.A. The product is tax litigation insurance.
The fact is that Polish companies operate in unstable tax environment. Aggressive interpretation of tax acts by tax officers, constantly changing and complicated tax law and severe penalties result in serious concerns regarding tax office actions. Since the tax office practices are perceived as abusive, tax relationship are a source of significant risk for Polish enterprises. Insurance can’t cover tax penalties however it can cover costs of legal defense against tax office. This is the core of the new product offered by TUiR Allianz Polska S.A. Other insurance companies haven’t extend their offer in that direction, however if the premium is acceptable this product can become popular.
Another new product that should be mentioned is directors and officers liability insurance (D&O). This products
has been well established in developed economies since the 1990s. However it is a new product at Polish market. It is offered by PZU S.A. and STU Ergo Hestia S.A. – the largest companies in Poland. D&O insurance policies offer liability cover for company managers to protect them from claims which may arise from the decisions and actions taken within the scope of their regular duties. Such claims becomes more and more probable since regulation is being tighter, since business partners are located in jurisdictions all over the world and officers have to keep in mind not only their markets but also other, since disclosure and communication to public increases. D&O insurance seems to be a response to growing needs in this area resulting from complex HR policies. An insurance product, which is kind of supplementary to D&O insurance is an insurance of suspension in professional activity or losing right to practice a profession offered by PZU S.A.
One insurance company – STU Ergo Hestia S.A. – has started to offer a new and unique at Polish insurance
market insurance product. It is a liability insurance, which covers claims resulting from damages caused by advertisement. Since societies become more and more sensitive to women and minority rights, good reputation and right to privacy, this insurance can start a new segment of insurance market.
Aviva TU Ogólnych S.A. has developed three new product in the area of liability insurance. It offers insurance
that covers claims resulting from not supplying electric Energy or from supplying electric energy or heating. It also offers liability insurance which covers claims resulting from defectiveness of things produced with exploitation of machines produced, provided or serviced by the insured. It also offer coverage of claims resulting from using pneumatic and hydraulic hammers, tups, vibrating devices and explosives.
A separate line of new insurance products are guarantees. Here novel solutions have been introduced too. Some
examples include guarantees being a safeguard for right realization of mechanisms of Common Agricultural Policy (UE), guarantees safeguarding obtainment of concessions or project financing from European funds or guarantees safeguarding liabilities resulting from using toll-roads.
4.4. New risks covered by well-established products
Novel solutions are also introduced as new risk covered within well-established products, like property insurance or general liability insurance. Usually additional coverage can be acquired optionally and it increases insurance premium. Examples of such new insurance clauses include:
• insurance covering costs of reconstruction of business documentation,
• abolition of insurance sum depletion,
• damages in machines kept underground (previously excluded from any standard coverage),
71
• liability insurance covering claims resulting from losing or destroying entrusted documents,
• liability insurance covering claims resulting from transferring infectious diseases,
• insurance covering losses caused by intentional fault or gross negligence,
• insurance covering costs of withdrawal of dangerous or defective products form the market.
An important improvement in insurance offer for enterprises is a clause of automatic coverage (offered by few Polish insurers). The clause allows for covering property, which was modernized or acquired during insurance period without a need to sign additional agreement.
4.5. Assistance
Assistance product have become popular as products dedicated to households. However recently there has been a move toward assistance dedicated to enterprises. Such assistance is proposed as technical assistance or informational assistance. Technical assistance includes of course everything that is connected with exploitation of cars, but recent developments include plumber assistance, electric assistance or health assistance. Informational assistance is provided in form of helplines or consulting. Following areas are covered: legal information, administrative information, EU funds information, HR information and economic information. An interesting assistance package includes concierge for business.
4.6. Industry-focused products
Up to 2010 insurance companies had rarely differentiated their products with respect to industry. Insurance coverage had been universal and easily applicable in different kinds of economic branches. Some specific of enterprises could be included by the way of individual negotiations. Presently insurance companies offer products dedicated to specific branches. Most often there are products focused on private health services providers. Such products allow for covering medical equipment and liability for providing health services, which is a very specific kind of liability. Regarding the fact, that healthcare is a fragile and special industry of growing importance in Poland, it is reasonable to prepare focused insurance products. Nevertheless one Polish insurers (TU Allianz Polska S.A.) has prepared insurance products dedicated also to: dealers of cars, education (eg. language schools), pharmacies, hotels, B&Bs, bars and restaurants and finally even for butcheries. It is hard to recognize if this path of product development is promising with respect for both: insurers earnings and insured interests.
4.7. Bank assurance, teleassurance, energyassurance, households goods/RTV assurance
Bank assurance is a well-known channel of insurance product distribution. All insurance companies design products dedicated to credit card users and sell them as a part of a credit card, debit card or even a deposit. Although it seems that insurance combined with credit cards is targeted to households, such products are now designed to enhance enterprises HR policies. Many enterprises give their managers credit cards with additional insurance, which includes standard coverage (eg. health coverage or theft coverage) but also aero assistance or personal concierge.
Selling insurance product as a part of different sector product has developed rapidly during last 5 years. In Poland insurance companies started to sell assistance and property insurance and even personal insurance combined with non-financial companies products. This includes mainly: insurance sold with telephones, insurance sold with energy and insurance sold with household goods or RTV. Such insurance usually covers damages in the products (telephones or household goods) caused by casualty or theft. However it can provide also with technical assistance or accident insurance. For example insurance sold with energy protects against non-paying for energy due to unemployment, accident or hospitalization. Additionally insured, who lost a job, is provided with recruitment assistance.
Although insurance products described above protect individuals, they are a part of an offer prepared for enterprises, which produce or distribute certain goods. This helps them to manage the risk of reclamation.
4.8. Products named as “innovative” or “novel”
72
The Internet survey revealed that some insurance companies inform about their product by calling them “innovative” or “novel” or with terms that hadn’t been used at Polish insurance market. This adjectives are highlighted in product basic description. However the closer look at such products revealed that there is nothing innovative in. For example one insurance company calls combined insurance for SMEs as “innovative”. Other company claims that a possibility to adjust a coverage to client’s needs via clauses included is a “novel solution”. Product, advertised as “Investment Process Insurance” with CAR/EAR and ALOP put in (English terms an abbreviations are here cited exactly as they are written at Polish insurance company web site used to communicate with Polish enterprises). Longer description provided below shows, that “Investment Process Insurance” is a rather standard construction insurance including coverage of property damage, liability, accidents, guarantees and business interruption. This examples show that “innovation” can be used as a vehicle to market product or solutions, which actually are not innovative
5. Interviews results
Out of fifteen interviewed brokers, four brokers started their answer by noticing, that insurance market is stable and constant (“There is no revolution at the market”). They stated, that changes can be easily seen in the level of insurance premiums, cause the sector has gone through hard and soft periods during last 5 years. However later they pointed to some changes in the offer for corporate clients.
Internet survey revealed, that two insurers web-sites enhance risk management in SMEs. One broker mentioned that insurance companies start to offer training for enterprises managers with respect to risk management and insurance programs. This could be an interesting path of improving cooperation between insurers and insured and enhancing sound risk management. Nevertheless the interviewed broker noticed, that when it comes to practice and details, insurance companies which offer such trainings are “fussy”. They refuse to train managers form industries that are too difficult to insure or to small companies. They want to “catch a fat fish”. Consequently the trainings are not done where they are needed most. Thereof innovation within support for clients risk management requires further development.
With respect to practical problems connected with managing insurance programs interviews revealed an interesting bias. Usually e-insurance and all forms of IT support for insurance market are seen as efficient innovation, three out of fifteen interviewed strongly complained about technological change that features Polish market. They revealed, that increased focus on e-communication, call centers, internal insurers IT systems is hostile for clients and creates a significant barrier in relationship between insured and insurer to the detriment of the insured. All three brokers claimed, that personal contacts are more efficient in managing communication between two sides of the contracts. They insisted in the need to know the client personally and on resigning from system solutions for building insurance program as well as for claims management. One broker said that:
“Client wants to be known. Relationship is crucial. Internet is not good for insurance. This is a traditional
business. Technological solutions are sometimes introduced to “imitate” innovativeness, where actually there is no innovativeness. This is not good for a client, especially for SMEs. Only reachable and professional staff truly
matters”. Two brokers strongly complained on divestiture of insurance staff form their competencies. One broker said:
“Before a worker or manager could check how the premium would change if coverage is narrowed or extended. Now it is not possible anymore. All details must be filled in each time in the system. This is exhausting. There is no communication between client as a person and someone responsible at insurer’s side. There is only a client and a
“system”, which “spits” some results”.
The other broker said that:
“I’m almost unable to deal with problem that used to be trifling before. Before I could call Mr … and he could give me an answer or redirect me to someone more competent or more capable. Some problems are really trivial but now I have to spend whole day on dealing with this. Ladies in call centers don’t know anything, they can’t give a name of anyone more competent. They can only tell me that they will write my complain and they will as. After they don’t do anything. E-mail communication fails totally. It seems that insurers have put all the responsibility and all the blame on the “system”. No one is responsible personally for anything. I’m capable to help my clients inly because I still have my old phonebook and I remember people and they remember me. They help me because of our long-lasting

73
professional relationship. But this should not be that way. Insurance companies have become too greedy and too impersonal. We need to go back to the general idea of insurance.”
Quoted opinions are a grave testimony on Polish insurance companies technological innovativeness. Only one broker focused on advantages of technological change. She gave an example of “mobile policy” offered by Compensa TU S.A, which doesn’t have to be signed, because mail confirmation is enough.
Four brokers mentioned combined products as something new at insurance market. Some brokers remained
skeptical about their usefulness. They believe, that insurance companies created combined products only for the purpose of increasing sales without a proper attention paid to enterprises’ needs. One broker said:
“I don’t believe that these product were prepared basing at an in-depth analysis of SMEs risk exposure. I believe that they just assumed that gluing five elements will help to sell these elements”.
This opinion is in accordance with the result of the internet survey. However one broker noticed, that combined products enhance risk consciousness and insurance demand. He noticed, that his clients, which get additional coverage (eg. against risk of vandalism or forklift insurance) while buying combined product after they change insurance provider they want to get such coverage again. He said:
“They would never even think about paying for this type of insurance unless they were granted this coverage “in package” once”.
This solution is noticed by brokers also in life insurance products bought by corporate client for their employees. Recently insurance companies have started to add pieces of health insurance into life insurance. One broker expressed her opinion, that:
“They want to saw the seeds. When clients get used to this, they will be able to sell more”.
With respect to new insurance products six interviewed brokers put an accent on cyber insurance described in the previous part of the paper. With respect of cyber insurance interviewed brokers notice that the risk is growing and that more and more enterprises are aware of this risk. Brokers stated, that many enterprises are afraid of data leakage consequences, which can be caused i.e. by hacking. Some of enterprises, which have a lot of data (for example health services providers) and are not capable to build or to buy truly resilient IT system. Thereof they prepare for risk realization by transferring risk to insurance companies. Brokers generally appreciated cyber insurance as an useful innovation. One broker said that:
“More and more enterprises are interested in cyber-insurance. And these are not only very large companies, like banks, but also medium size enterprises. For example housing cooperatives. They know that they have a lot of data
and in case of data leakage they will suffer”.
The same number of brokers (six) focused on novelties in liability insurance products (general liability and specific liability focused on industry or profession). They notice that presently there is a number of targeted liability products (eg. D&O or gross negligence insurance) that actually fit a growing need for thus type of coverage. They also point to a growing need for good general liability insurance products. Brokers explained, that this trend is driven by several factors. The first factor is regulation, which makes liability more concrete. The second factor is growing expectations of victims resulting in growing claims. And the third factor is a growing fear of entrepreneurs of being accused for damaging someone’s property or personal goods and of being incapable to make it up.
Most of interviewed brokers noticed that new risks are covered by well-established insurance products and that new niche products (eg. assistance or guarantees) are offered. Five brokers claimed, that this solutions are beneficial because they enhance desired elasticity and fitting coverage to client’s needs. Most of brokers expressed the opinion, that now insurance companies are able to take more risks than it used to be and that the coverage is wider (“We are able to ask for more and we get it”). However some brokers highlighted, that few industries are still in difficult situation (for example construction) and others are still uninsurable (sawmills, foam producers). This is usually explained by reinsurance contracts.
74
Deeper analysis of transcription revealed brokers opinion about factors driving this change. Four interviewed brokers believe, that this type of development is for the purpose of “standing out”. One broker explained:
“There is strong competition at the market, thereof they always must show something new: new clause or new risk in the basic product’s coverage.”
Another broker stated:
“Sometimes insurance companies strive to be original. They rename known products. They present old product in novel way in order attract clients”.
This opinions confirms findings of the internet survey performed by the authors. The interesting insight from the interviews is finding that three brokers are convicted, that innovative changes at
insurance market are driven by brokers. They claim that brokers know clients’ needs, changing business environment and ask insurance companies to prepare suitable products (“We design clauses”).
Three brokers pointed to the institutional change at Polish insurance market. The biggest Polish insurance company – PZU S.A. is a state-owned company. This company created a non-life mutual. Brokers claim, that although it is not written explicitly in regulation – all state-owned companies know that they should transfer their risk to that mutual company. This is allows them to avoid tendering risk transfer service with respect to Polish public procurement law.
6. Discussion
Theoretical framework prescribes, that there can be three different directions of innovations offered to enterprises by Polish insurance companies, namely (a) the changing conditions of insurance protection, (b) parameterization and (c) new insurance products. Empirical research based on the internet survey and on the telephone interviews with brokers confirmed that first and third direction can be observable at Polish insurance market while parametrization hasn’t been introduced yet.
As it was stressed in the theoretical part of the paper customization of insurance products can be multi-pillar (multi-trigger, new ways of calculating deductibles, multi-year coverages etc.). Empirical investigation allows for stating, that this trend at Polish market is represented only by changes in the coverage and multi-trigger solutions.
Interviews generally confirmed findings derived from the internet survey, that innovations offered by Polish
insurance companies for enterprises have different forms and scope. Both methods allowed for finding, that some novelties emerge as new products are offered, new risks are covered by well-established products, that combined products are prepared for SMEs and that insurance companies have started to engage in some new types of risk management enhancing. With respect to new products offered for enterprises both methods allowed for finding that new types of third-party liability insurance and cyber insurance are the most important observable advancement: such insurance are truly needed by enterprises. With respect to combined products offered for SMEs both methods lead to the conclusion, that these products are of diverse quality and utility for enterprises – some of them don’t provide some crucial coverage and ultimately can be even more difficult to manage than traditional products.
Both methods allow for a conclusion, that innovations mentioned above are driven by diverse factors. Some
innovations, like cyber-insurance, new guarantees or wider coverage – are driven by the demand for innovation. This demand is shaped by two factors. The first factor is increased consciousness of risk driving propensity to insure quite well-known risks (for example tax risk, risk of losing or destroying documents). The second factor is changeable business environment bringing new risks in (for example cyber-risk, risk connected with EU finding). However some innovations are initiated by insurers (supply-driven innovation) and the motive, that stand behinds the innovation is willingness to increase sales. Insurance companies are under the pressure of competition. They compete by offering new products. This can be beneficial for the market, if it allows for increasing risk consciousness and willingness to transfer risk when it is efficient (for example business interruption risk build in combined products). Nevertheless in some cases it seems that a product is constructed carelessly and client’s disappointment will be soon reflected in sales.
Although much findings were confirmed by both methods there are some discrepancies too.
75
None of interviewed brokers paid any attention to banc-assurance, tele-assurance energy-assurance and rtv/household goods-assurance. This can be explained easily by the fact, that such products are tailored to specific and unique business partner needs (for example needs of energy supplier). It is not possible to buy this type of insurance at the market. Thereof broker’s don’t intermediate and this type of insurance may not enter their professional perspective. In authors opinion such products are novelty and bring a significant change to the market. Since the both: coverage and product related can be extended – insurance may start to proliferate the market in a completely different way. This way seems to be more promising than internet. Many enterprises (for example e-commerce platforms, construction firms, i-phone application providers) may be interested in enriching their offer by joining it with an insurance. This interest may be driven by both: a willingness to increase sales and by willingness to hedge. Also none of the brokers commented new insurance products prepared for a particular industries (for example healthcare companies, pharmacies, auto-dealers or hotels). In their statements brokers focused rather on branches, that are difficult to insure. The shortage of opinions about this new phenomena may result from the fact, that the interviewed brokers don’t cooperate with this specific industries. However still this novelty should be seen as an important innovation at Polish insurance market.
However brokers noticed an important change in insurance quality and utility, that couldn’t be observable via internet survey. They noticed new difficulties faced by them and their clients due the ongoing technological change and de-personalisation of relationship between insurance companies and insured enterprises. They claim, that this change is inefficient and is to the detriment of insured, who aren’t served well anymore. Thereof the mentioned change can be seen as an attempt to increase insurer’s advantage over insured resulting from the fact, that clients pay for the service before they know it’s true quality. It is interesting to compare this observation should with the observation on supply-driven innovation. It seems that offering not well designed new insurance products may help to achieve short-term earnings. However clients looking for a good quality need something else. It is probable, that introducing a pro-personal innovation, for example a competent curator for an insurance agreement, could result in a long-term advantage over competitors.
Better understanding of motives for introducing novel solutions in insurance products targeted to enterprises requires other research methods. Additional knowledge could be derived from interviewing insurance companies managers.
7. Conclusions
Insurance sector is often seen as a traditional one. However, there are many interesting novel solutions offered by insurance companies to Polish enterprises. These solutions have a potential to improve enterprise risk management. It can be noticed, that innovations at insurance market take many diverse forms. Not only new products or new risk covered by well-established products, but also technological change, risk management enhancing, combining insurance with financial and non-financial products, wide spectrum of assistance and guarantees and industry-specific products have been introduced in the last 5 years in the Polish insurance market.
Observed innovations cover both: supply-driven and demand-driven innovations. The motive that stands behind supply-driven innovations is competition. Supply-driven innovations, including combined products, seem to be still not well suited to corporate client’s needs. Demand-driven innovations (for example cyber insurance, tax litigation insurance) are positively evaluated as they help enterprises to control newly emerging risks. Risk management enhancing practices are a valuable option, however some initiatives still need to be improved. A negative phenomenon is a technologically-driven de-personalisation of relationship between insurer and insured. IT systems hoped to smooth insurance administration process, turn out to be inefficient to the detriment of insured party.
Acknowledgements
The research project was founded by National Center of Science Poland, granted with the decision No. Dec -2011/03/D/HS4/01924.
References
[1] Roberts, Ph. & Nurse, J. (2014). Insurers, Are You Ready for a Disruptive Innovator? How to Prepare for Game Changers. Emphasis, 2.
76
[2] Mills, H. & Tubiana, B. (2013). Innovation in insurance. The path to progress. Deloitte University Press. [3] Gubler, Z.J. (2011). The financial innovation process: Theory and Application. Delaware Journal of Corporate Law, 36. [4] Tufano P. (2003). Financial innovation. [In:] Constandinides, G., Harris, M. & Stulz, R. (eds.), The handbook of the economics of finance.
Amsterdam: Elsevier. [5] Lerner, J. & Tufano, P. (2011). The consequences of financial innovation: a counterfactual research agenda. National Bureau of Economic
Research Working Paper Series, Cambridge. [6] Llewellyn, D.T. (2009). Financial innovation and the economics of banking ant the financial system. [In:] Anderloni L., Llewellyn D.T. &
Schmidt, R. (eds.), Financial innovation in retail and corporate banking. Cheltenham: Edward Elgar. [7] Błach, J. (2011). Financial innovations and their role in the modern financial system – identification and systematization of the problem.
Financial Internet Quarterly “eFinanse”, vol. 7, no. 3. [8] Deloitte, (2016). Insurers on the brink. Disrupt or be disrupted. Deloitte Center for Financial Services. [9] Capgemini, (2016). Top 10 Trends in Insurance in2016. What you need to know. [10] Modlin, C. (2016). Three Things Insurers Must do to innovate. https://www.towerswatson.com/en-
US/Insights/Newsletters/Americas/americas-insights/2015/insurance-industry-innovation-3-things-insurers-must-do, access 26.09.2016. [11] ISO, (2009). Risk Management – Principles and Guidelines. ISO 31000:2009. International Standard. International Organization for
Standardization. [12] Błach, J. & Wieczorek-Kosmala, M. (2013). Financial innovations in risk management - enterprise perspective. Financial Management of
Firms and Financial Institutions. Proceedings (Part I), 9th International Scientific Conference, Ostrava: VSB Technical University of Ostrava.
[13] Banks, E. (2004). Alternative Risk Transfer: Integrated Risk Management through Insurance, Reinsurance and Capital Markets. Chichester: John Wiley & Sons.
[14] Błach, J., Wieczorek-Kosmala, M., Gorczyńska, M., (2014). Innovations in the Application of Insurance-linked Securities in Non-financial Companies. China-USA Business Review, vol. 13, no. 6.
[15] Hartwig, R.P. & Wikinson, C. (2007). An overview of alternative risk transfer market. [In:] Cummins, J.D. & Vernard, B. (eds.). Handbook of international insurance: Between global dynamics and local contingencies. New York: Springer.
[16] Wieczorek-Kosmala, M. (2010). Innovative Design of Insurance Risk Transfer – a corporate perspective. Managing and Modelling of Financial Risks. Books of proceedings from 5th International Scientific Conference, Ostrava: VSB Technical University of Ostrava.
[17] Pain, D. (2011). Innovations in the non-life insurance market. Sigma, no. 4, Zurich: Swiss Re. [18] Laster, D. & Schmidt, C. (2005). Innovate to Insure Uninsurable. Sigma, no. 5, Zurich: Swiss Re. [19] Frey, A., Kirova, M. & Schmidt, C. (2009). The role of indicies in transferring risks to the capital markets. Sigma, no. 4, Zurich: Swiss Re. [20] GUS, [2008]. Działalność innowacyjna przedsiębiorstw w latach 2006-2008. Innovation activities of enterprises in 2006-2008. Warszawa:
GUS. [21] GUS, [2015]. Działalność innowacyjna przedsiębiorstw w latach 2012-2014. Innovation activities of enterprises in 2012-2014. Warszawa:
GUS.
77
Evaluation of innovative development of the intensive use of nature regions: to the question of the factor’s choice
Daria Zhaparovaa1
a Tyumen State University, Department of the world economy and international business, Lenina 16 st., Tyumen, Russia, [email protected]
Abstract
Nowadays, one of the challenges of innovative policy is the correct selection of the parameters which reflect the accumulated scientific potential, the educational level and the sectoral structure of the regional economies. In this regard, the aim of the article is to construct a system of indicators, which is based on the existing foreign and domestic researches in the studied area, for further study of innovative processes in the Tyumen region as one of the regions of intensive use of nature. With the help of a factor analysis (method of principle components) the key factors which characterize an innovative development of the region have been determined. Innovative development of the Tyumen region has been evaluated with the defined factors. The revealed features suggest the necessity of encouraging of the inter-regional integration processes in the field of innovation, and of creation a more efficient environment for the development of relations between science and industry.
Keywords: factors; innovative development; region of the natural resources intensive use.
1. INTRODUCTION
Innovations and public policy which stimulates innovations are the key factors for long-term economic development in many countries of the world, and the awareness of the special role of the regions in the promoting of innovation processes has become an important trend in the recent years [6, 16]. Those people, who implement an innovative policy of the state, increasingly take into account the regional context which is based on the following principles: the creation of an adequate territorial projection, as well as the involvement of regions in the process of its formation and implementation; coordination of activities aimed at supporting the activities of the different actors of innovation (universities, research organizations, large businesses, small and medium enterprises); the formation of an atmosphere of trust and the increase of effective interaction between the co-localized economic entities [13].
Implementation of these principles leads to a gradual displacement of the cognitive management schemes from a single national innovative system to regional innovation systems, to decentralization and the development of competitive forms of support from the national government [17]. This is mainly due to the uneven distribution of the fundamental innovation activity between regions. Even the leading economies of the world have the differentiation of regions in terms of innovative development, thus, public policies, which is aimed at leveling the innovative landscape among regions, is ineffective [2, 4].
Thus, the modern innovation policy should be designed taking into account the heterogeneity of the innovative landscape, the need for a differentiated approach on the objectives and instruments for different regions or groups of regions. This transformation creates new requirements for the provision of information, presenting a request for an objective assessment of regional innovative development. However, one of the major problems faced by the public authorities, which are responsible for the stimulation of innovative activity of economic entities, is the lack of information on the status and dynamics of innovative processes in the regions. Info hunger does not adequately
* Corresponding author.
78
assess the effectiveness of various measures of innovation policy and the differentiation of them on the basis of the existing regional context.
2. METHODOLOGY
In the past two decades, all sorts of works, which authors’ set out to a comprehensive assessment of the innovative development of the regions, began to appear. All approaches to the assessment of the innovative development of the regions can be divided into two groups: qualitative and quantitative. The main feature of qualitative methods is no use or fragmentary use of statistical methods to rank the regions. But despite the fact that the qualitative approach is justified in the absence of the required statistics, and firmly occupy a niche, they have been put on the backburner in the last decade. The analysis of foreign and domestic literature on the evaluation of regional innovative development clearly shows the growing popularity of the quantitative approach. Field of discussions gradually shifting towards the selection of consistent, reliable and valid indicators to measure innovative processes in the region and the ways to integrate them. This quantitative approach pretends to be analytical support of science, technology and innovative policies, implemented by public authorities at various levels [13].
In this regard, let us construct a system of indicators, which is based on the existing foreign and domestic researches in this area, for further study of innovative processes in the regions of the Russian Federation. It is worth noting that the most cited studies in the field of evaluation of innovative development of regions, which use the quantitative analysis techniques, are: Clarysse, Muldur, 1999; De Bruijn, Lagendijk, 2005; Hollanders, 2006; Navarro, et al., 2008; Hollanders, et al., 2009; Wintjes, Hollanders, 2010; Capello, Lenzi, 2013; INEC, 2008; Gusev, 2009; NAIR 2011; Financial University, 2012; Hochberg et al., 2012 [1, 3, 5, 7-12, 14, 15, 18].
Almost all of the works is characterized by a broad understanding of innovation and recognition of the diversity of factors, which influence on them, that is why it is impossible to use one or more sufficiently reliable and valid indicators, because, no doubt, every indicator has limitations. The complex systems of innovations’ evaluation, including quite a number of indicators also indirect, reflecting the accumulated scientific potential, the educational level, the sectoral structure of regional economies, are being created for the compensation of indicators’ limitation. This, in turn, gives rise to problems concerning the correct selection of these parameters and their balance in a single system.
Table 1 shows a two-level hierarchical system of indicators to measure the innovative development of the regions of the Russian Federation, which were developed on the basis of the above studies. Let us note that the figures in the group of well-being of the region, are defined by some authors as a result of innovations. Innovative activity is associated to the level of socio-economic development of the region with multiple bilateral ties. On the one hand, a high level of welfare of the population is a prerequisite for innovations to be in demand and to be widely implemented in the economic activity. On the other hand, innovative activity leads to further economic development, which is reflected in the growth of welfare, changes in the sectoral structure of the economy, raising the level of education, the penetration of information technology, etc.
Table 1. The system of indicators to measure the innovation development of the regions
Innovative development of the region GRP per capita (X1)
Labor productivity (X2) Welfare of the region
Unemployment rate (X3)
Number of students at educational organizations of higher education per 10 000 economically active population (X4)
Educational potential of the population
Employed in the economy completed tertiary (higher) education, % (X5) Share of organizations that have a website in the total number of organizations, % (X6)
Share of organizations using broadband Internet access in the total number of organizations, % (X7) The level of
development of the information society
Share of households with Internet access from home PC in the total number of households, % (X8)
Share of the higher education sector in gross domestic expenditures on research and development, % (X9) Share of budgets of the subjects of the Russian Federation and local budgets in the total expenditures on
technological innovations, % (X10
Funding for R&D
Gross domestic expenditures on research and development as a percentage of GRP, % (X11) The number of researchers per 10 000 economically active population (X12)
Share of researchers with PhD degrees in the total number of researchers, %. (X13) Personnel
Share of researchers under the age of 39 in the total number of researchers, % (X14)
Expenditures of organizations on trainings related with innovations as a percentage of GRP, % (X15) Innovative activity of business
Share of organizations that have participated in the implementation of joint projects on research and development
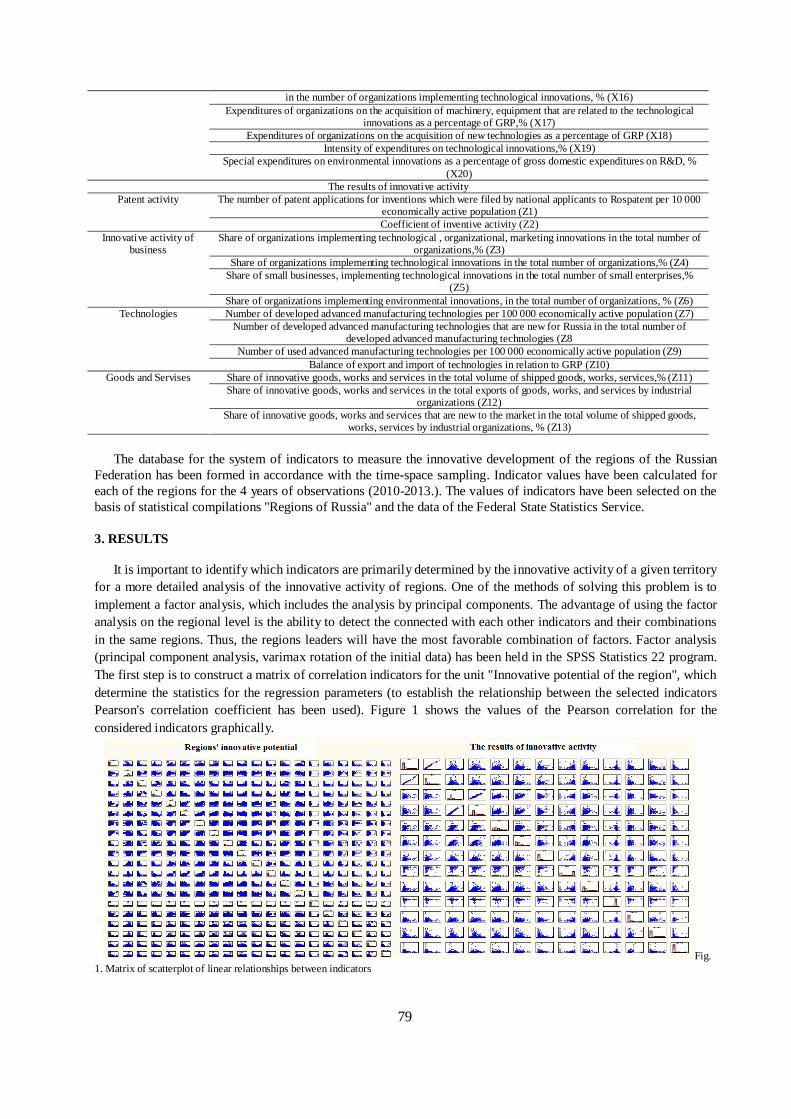
79
in the number of organizations implementing technological innovations, % (X16) Expenditures of organizations on the acquisition of machinery, equipment that are related to the technological
innovations as a percentage of GRP,% (X17) Expenditures of organizations on the acquisition of new technologies as a percentage of GRP (X18)
Intensity of expenditures on technological innovations,% (X19) Special expenditures on environmental innovations as a percentage of gross domestic expenditures on R&D, %
(X20) The results of innovative activity
The number of patent applications for inventions which were filed by national applicants to Rospatent per 10 000 economically active population (Z1)
Patent activity
Coefficient of inventive activity (Z2) Share of organizations implementing technological , organizational, marketing innovations in the total number of
organizations,% (Z3) Share of organizations implementing technological innovations in the total number of organizations,% (Z4)
Share of small businesses, implementing technological innovations in the total number of small enterprises,% (Z5)
Innovative activity of business
Share of organizations implementing environmental innovations, in the total number of organizations, % (Z6) Number of developed advanced manufacturing technologies per 100 000 economically active population (Z7)
Number of developed advanced manufacturing technologies that are new for Russia in the total number of developed advanced manufacturing technologies (Z8
Number of used advanced manufacturing technologies per 100 000 economically active population (Z9)
Technologies
Balance of export and import of technologies in relation to GRP (Z10) Share of innovative goods, works and services in the total volume of shipped goods, works, services,% (Z11) Share of innovative goods, works and services in the total exports of goods, works, and services by industrial
organizations (Z12)
Goods and Servises
Share of innovative goods, works and services that are new to the market in the total volume of shipped goods, works, services by industrial organizations, % (Z13)
The database for the system of indicators to measure the innovative development of the regions of the Russian
Federation has been formed in accordance with the time-space sampling. Indicator values have been calculated for each of the regions for the 4 years of observations (2010-2013.). The values of indicators have been selected on the basis of statistical compilations "Regions of Russia" and the data of the Federal State Statistics Service.
3. RESULTS
It is important to identify which indicators are primarily determined by the innovative activity of a given territory for a more detailed analysis of the innovative activity of regions. One of the methods of solving this problem is to implement a factor analysis, which includes the analysis by principal components. The advantage of using the factor analysis on the regional level is the ability to detect the connected with each other indicators and their combinations in the same regions. Thus, the regions leaders will have the most favorable combination of factors. Factor analysis (principal component analysis, varimax rotation of the initial data) has been held in the SPSS Statistics 22 program. The first step is to construct a matrix of correlation indicators for the unit "Innovative potential of the region", which determine the statistics for the regression parameters (to establish the relationship between the selected indicators Pearson's correlation coefficient has been used). Figure 1 shows the values of the Pearson correlation for the considered indicators graphically.
Fig. 1. Matrix of scatterplot of linear relationships between indicators
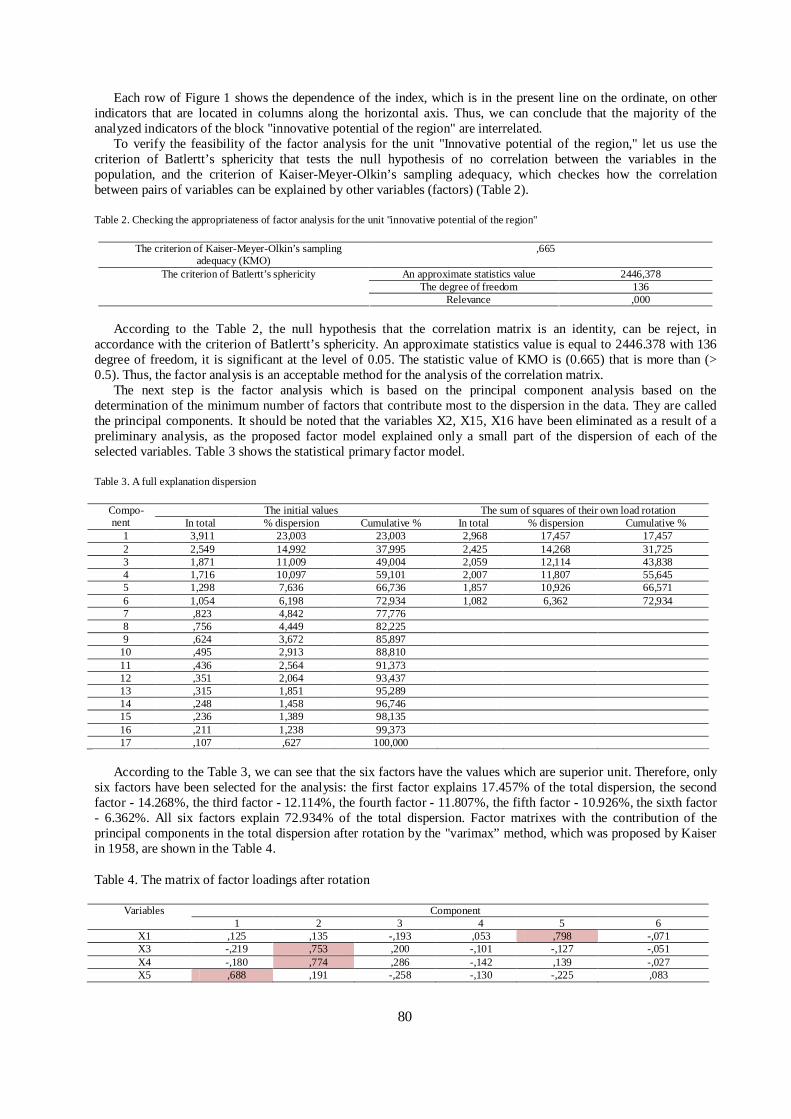
80
Each row of Figure 1 shows the dependence of the index, which is in the present line on the ordinate, on other indicators that are located in columns along the horizontal axis. Thus, we can conclude that the majority of the analyzed indicators of the block "innovative potential of the region" are interrelated.
To verify the feasibility of the factor analysis for the unit "Innovative potential of the region," let us use the criterion of Batlertt’s sphericity that tests the null hypothesis of no correlation between the variables in the population, and the criterion of Kaiser-Meyer-Olkin’s sampling adequacy, which checkes how the correlation between pairs of variables can be explained by other variables (factors) (Table 2).
Table 2. Checking the appropriateness of factor analysis for the unit "innovative potential of the region"
The criterion of Kaiser-Meyer-Olkin’s sampling adequacy (КМО)
,665
An approximate statistics value 2446,378 The degree of freedom 136
The criterion of Batlertt’s sphericity
Relevance ,000
According to the Table 2, the null hypothesis that the correlation matrix is an identity, can be reject, in accordance with the criterion of Batlertt’s sphericity. An approximate statistics value is equal to 2446.378 with 136 degree of freedom, it is significant at the level of 0.05. The statistic value of KMO is (0.665) that is more than (> 0.5). Thus, the factor analysis is an acceptable method for the analysis of the correlation matrix.
The next step is the factor analysis which is based on the principal component analysis based on the determination of the minimum number of factors that contribute most to the dispersion in the data. They are called the principal components. It should be noted that the variables X2, X15, X16 have been eliminated as a result of a preliminary analysis, as the proposed factor model explained only a small part of the dispersion of each of the selected variables. Table 3 shows the statistical primary factor model.
Table 3. A full explanation dispersion
The initial values The sum of squares of their own load rotation Compo-nent In total % dispersion Cumulative % In total % dispersion Cumulative %
1 3,911 23,003 23,003 2,968 17,457 17,457 2 2,549 14,992 37,995 2,425 14,268 31,725 3 1,871 11,009 49,004 2,059 12,114 43,838 4 1,716 10,097 59,101 2,007 11,807 55,645 5 1,298 7,636 66,736 1,857 10,926 66,571 6 1,054 6,198 72,934 1,082 6,362 72,934 7 ,823 4,842 77,776 8 ,756 4,449 82,225 9 ,624 3,672 85,897
10 ,495 2,913 88,810 11 ,436 2,564 91,373 12 ,351 2,064 93,437 13 ,315 1,851 95,289 14 ,248 1,458 96,746 15 ,236 1,389 98,135 16 ,211 1,238 99,373 17 ,107 ,627 100,000
According to the Table 3, we can see that the six factors have the values which are superior unit. Therefore, only
six factors have been selected for the analysis: the first factor explains 17.457% of the total dispersion, the second factor - 14.268%, the third factor - 12.114%, the fourth factor - 11.807%, the fifth factor - 10.926%, the sixth factor - 6.362%. All six factors explain 72.934% of the total dispersion. Factor matrixes with the contribution of the principal components in the total dispersion after rotation by the "varimax” method, which was proposed by Kaiser in 1958, are shown in the Table 4.
Table 4. The matrix of factor loadings after rotation
Component Variables 1 2 3 4 5 6
X1 ,125 ,135 -,193 ,053 ,798 -,071 X3 -,219 ,753 ,200 -,101 -,127 -,051 X4 -,180 ,774 ,286 -,142 ,139 -,027 X5 ,688 ,191 -,258 -,130 -,225 ,083
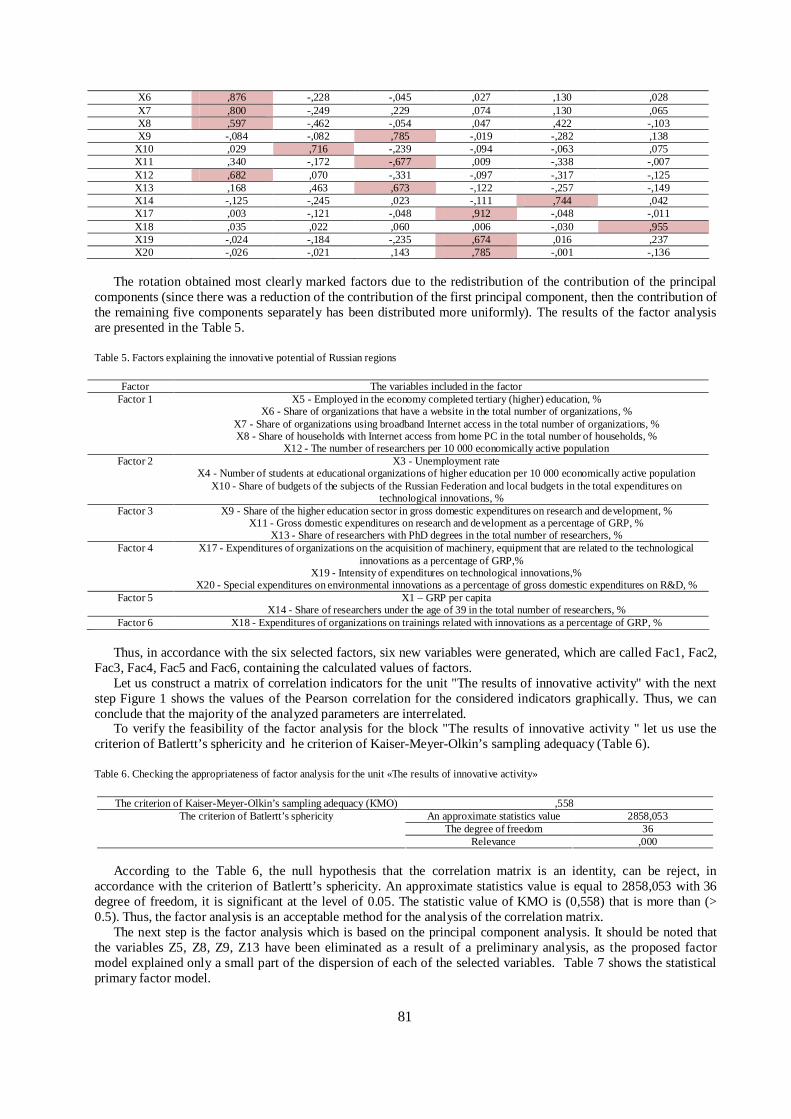
81
X6 ,876 -,228 -,045 ,027 ,130 ,028 X7 ,800 -,249 ,229 ,074 ,130 ,065 X8 ,597 -,462 -,054 ,047 ,422 -,103 X9 -,084 -,082 ,785 -,019 -,282 ,138
X10 ,029 ,716 -,239 -,094 -,063 ,075 X11 ,340 -,172 -,677 ,009 -,338 -,007 X12 ,682 ,070 -,331 -,097 -,317 -,125 X13 ,168 ,463 ,673 -,122 -,257 -,149 X14 -,125 -,245 ,023 -,111 ,744 ,042 X17 ,003 -,121 -,048 ,912 -,048 -,011 X18 ,035 ,022 ,060 ,006 -,030 ,955 X19 -,024 -,184 -,235 ,674 ,016 ,237 X20 -,026 -,021 ,143 ,785 -,001 -,136
The rotation obtained most clearly marked factors due to the redistribution of the contribution of the principal
components (since there was a reduction of the contribution of the first principal component, then the contribution of the remaining five components separately has been distributed more uniformly). The results of the factor analysis are presented in the Table 5.
Table 5. Factors explaining the innovative potential of Russian regions
Factor The variables included in the factor Factor 1 X5 - Employed in the economy completed tertiary (higher) education, %
X6 - Share of organizations that have a website in the total number of organizations, % X7 - Share of organizations using broadband Internet access in the total number of organizations, % X8 - Share of households with Internet access from home PC in the total number of households, %
X12 - The number of researchers per 10 000 economically active population Factor 2 X3 - Unemployment rate
X4 - Number of students at educational organizations of higher education per 10 000 economically active population X10 - Share of budgets of the subjects of the Russian Federation and local budgets in the total expenditures on
technological innovations, % Factor 3 X9 - Share of the higher education sector in gross domestic expenditures on research and development, %
X11 - Gross domestic expenditures on research and development as a percentage of GRP, % X13 - Share of researchers with PhD degrees in the total number of researchers, %
Factor 4 X17 - Expenditures of organizations on the acquisition of machinery, equipment that are related to the technological innovations as a percentage of GRP,%
X19 - Intensity of expenditures on technological innovations,% X20 - Special expenditures on environmental innovations as a percentage of gross domestic expenditures on R&D, %
Factor 5 X1 – GRP per capita X14 - Share of researchers under the age of 39 in the total number of researchers, %
Factor 6 X18 - Expenditures of organizations on trainings related with innovations as a percentage of GRP, %
Thus, in accordance with the six selected factors, six new variables were generated, which are called Fac1, Fac2,
Fac3, Fac4, Fac5 and Fac6, containing the calculated values of factors. Let us construct a matrix of correlation indicators for the unit "The results of innovative activity" with the next
step Figure 1 shows the values of the Pearson correlation for the considered indicators graphically. Thus, we can conclude that the majority of the analyzed parameters are interrelated.
To verify the feasibility of the factor analysis for the block "The results of innovative activity " let us use the criterion of Batlertt’s sphericity and he criterion of Kaiser-Meyer-Olkin’s sampling adequacy (Table 6).
Table 6. Checking the appropriateness of factor analysis for the unit «The results of innovative activity»
The criterion of Kaiser-Meyer-Olkin’s sampling adequacy (КМО) ,558 An approximate statistics value 2858,053
The degree of freedom 36 The criterion of Batlertt’s sphericity
Relevance ,000
According to the Table 6, the null hypothesis that the correlation matrix is an identity, can be reject, in accordance with the criterion of Batlertt’s sphericity. An approximate statistics value is equal to 2858,053 with 36 degree of freedom, it is significant at the level of 0.05. The statistic value of KMO is (0,558) that is more than (> 0.5). Thus, the factor analysis is an acceptable method for the analysis of the correlation matrix.
The next step is the factor analysis which is based on the principal component analysis. It should be noted that the variables Z5, Z8, Z9, Z13 have been eliminated as a result of a preliminary analysis, as the proposed factor model explained only a small part of the dispersion of each of the selected variables. Table 7 shows the statistical primary factor model.
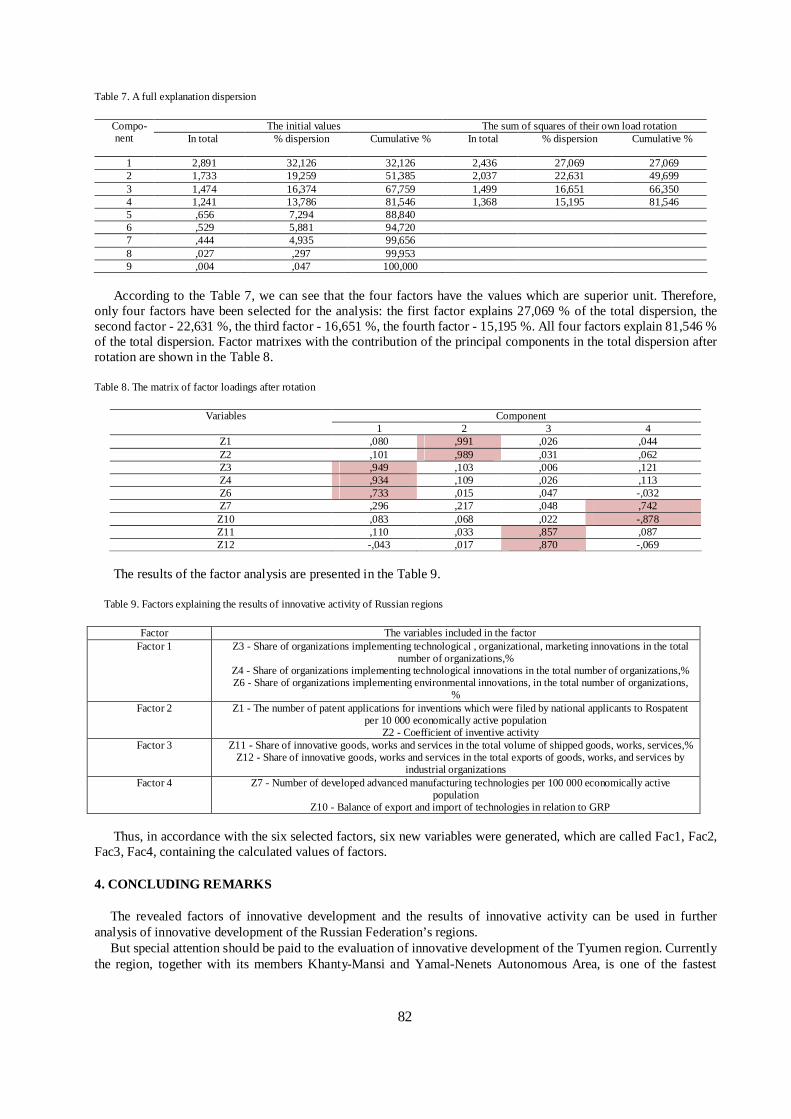
82
Table 7. A full explanation dispersion
According to the Table 7, we can see that the four factors have the values which are superior unit. Therefore,
only four factors have been selected for the analysis: the first factor explains 27,069 % of the total dispersion, the second factor - 22,631 %, the third factor - 16,651 %, the fourth factor - 15,195 %. All four factors explain 81,546 % of the total dispersion. Factor matrixes with the contribution of the principal components in the total dispersion after rotation are shown in the Table 8.
Table 8. The matrix of factor loadings after rotation
Component Variables 1 2 3 4
Z1 ,080 ,991 ,026 ,044 Z2 ,101 ,989 ,031 ,062 Z3 ,949 ,103 ,006 ,121 Z4 ,934 ,109 ,026 ,113 Z6 ,733 ,015 ,047 -,032 Z7 ,296 ,217 ,048 ,742 Z10 ,083 ,068 ,022 -,878 Z11 ,110 ,033 ,857 ,087 Z12 -,043 ,017 ,870 -,069
The results of the factor analysis are presented in the Table 9.
Table 9. Factors explaining the results of innovative activity of Russian regions
Factor The variables included in the factor Factor 1 Z3 - Share of organizations implementing technological , organizational, marketing innovations in the total
number of organizations,% Z4 - Share of organizations implementing technological innovations in the total number of organizations,% Z6 - Share of organizations implementing environmental innovations, in the total number of organizations,
% Factor 2 Z1 - The number of patent applications for inventions which were filed by national applicants to Rospatent
per 10 000 economically active population Z2 - Coefficient of inventive activity
Factor 3 Z11 - Share of innovative goods, works and services in the total volume of shipped goods, works, services,% Z12 - Share of innovative goods, works and services in the total exports of goods, works, and services by
industrial organizations Factor 4 Z7 - Number of developed advanced manufacturing technologies per 100 000 economically active
population Z10 - Balance of export and import of technologies in relation to GRP
Thus, in accordance with the six selected factors, six new variables were generated, which are called Fac1, Fac2,
Fac3, Fac4, containing the calculated values of factors.
4. CONCLUDING REMARKS
The revealed factors of innovative development and the results of innovative activity can be used in further analysis of innovative development of the Russian Federation’s regions.
But special attention should be paid to the evaluation of innovative development of the Tyumen region. Currently the region, together with its members Khanty-Mansi and Yamal-Nenets Autonomous Area, is one of the fastest
The initial values The sum of squares of their own load rotation Compo-nent
In total % dispersion Cumulative % In total % dispersion Cumulative %
1 2,891 32,126 32,126 2,436 27,069 27,069 2 1,733 19,259 51,385 2,037 22,631 49,699 3 1,474 16,374 67,759 1,499 16,651 66,350 4 1,241 13,786 81,546 1,368 15,195 81,546 5 ,656 7,294 88,840 6 ,529 5,881 94,720 7 ,444 4,935 99,656 8 ,027 ,297 99,953 9 ,004 ,047 100,000

83
growing regions of the Russian Federation. The gross regional product of the region in 2013 was 9.3% of GDP of the Russian Federation (the region holds the second position on this indicator, giving Moscow the first place). The growth rate of this indicator consistently is not only ahead of the average index, but is also among the highest ones. Moreover, the region is the main supplier of crude oil to domestic and foreign markets, occupying an extremely important place in the economy and energy security. In these circumstances, Tyumen region acts as the "engine of growth" for the whole Russia, and it can be classified as the "reference areas" which creates the main financial, human resources and innovation.
However, analysis of innovative development of the Tyumen region indicates a weak position of the region in the studied area. Analysis of the effectiveness of the regional innovation system (RIS) in the Tyumen region reveals two trends. Firstly, the Tyumen region leads in terms of GRP per capita, which is associated with the raw nature of the regional economy and a high share of fuel and energy complex in the industrial structure. In addition, there is a high value in labor productivity in the high-tech sector. Secondly, there is the low innovative activity of business, science and higher education, which hinders the implementation of the existing potential (Table 10).
Table 10. Comparative analysis of the revealed factors of the Tyumen region with the leading region and average values of the regions of
Russia, 2013
Factor Tyumen region Average value Region - Leader
Innovative potential of the region
Factor 1 0,77715 0,63998 4,90414 Factor 2 -0,73448 -0,11996 3,9042 Factor 3
0,4784 0,235 2,53376 Factor 4 -0,09921 -0,00147 6,7195 Factor 5 2,34934 0,36913 5,89896 Factor 6
-0,4093 -0,02293 2,58984 The results of innovative activity
Factor 1 -0,54046 -0,2382 2,47159 Factor 2 -0,43694 0,0485 5,29719 Factor 3
-0,70079 0,0812 5,99599 Factor 4
-0,09066 0,21331 10,02518
Table 10 proves a low level of innovative development of Tyumen region due to the fact that almost all of the factors’ values (except Factor 5
in the group of innovative potential that includes indicator of GRP per capita) are far behind the values of the region-leader’s factors. As for
innovative potential, Tyumen region has three factors which values exceed the values of the average level, these are Factor 1, Factor 2, Factor 3
that characterize mostly the educational potential, the level of development of the information society, welfare of the region and personnel
potential. But speaking of the results of innovative activity, it is worth noting that Tyumen region has no single factor which values would exceed
the values of the average level of Russian regions. It proves the existing problems of implementation of the region’s innovative potential.
Acknowledgements
The article is prepared on the basis of research carried out with the financial support of the grant RGNF (project №15-32-01350) “Innovative development of the Tyumen region’s circumpolar area: the possibility of localization and the effects of inter-regional cooperation”.
References
[1] Capello, R., Lenzi, C. (2013). Territorial patterns of innovation: a taxonomy of innovative regions in Europe. Ann Reg Sci, 51, 119–154. [2] Cheshire, P. C., Malecki, E. J. (2004). Growth, development and innovation: a look back and forward. Papers in Regional Science, 83, 249-
267. [3] Clarysse, Muldur, (2009), Regional cohesion in Europe? An analysis of how EU public RTD support influences the techno-economic
regional landscape. Directorate General for Science, Research and Development, European Commission. [Online] Available: ftp://ftp.cordis.europa.eu/pub/indicators/docs/ind_wp_um1.pdf (September 10, 2016).
84
[4] Crescenzi, R., Rodríguez-Pose, A., Storper, M. (2007). The territorial dynamics of innovation: a Europe-United States comparative analysis. Journal of Economic Geography, 7, 673-709.
[5] De Bruijn, P., Lagendijk, A. (2005). Regional innovation systems in the Lisbon strategy. European Planning Studies, 13(8), 1153-1172. [6] European Commission, (2009), The Role of Community Research Policy in the Knowledge-Based Economy. Expert group report. Brussels.
[Online] Available: http://ec.europa.eu/research/era/pdf/community_research_policy_role.pdf (September 10, 2016). [7] Financial University, (2012), The concept of the formation of the index of innovative development of Russia's regions. [Online] Available:
http://www.fa.ru/institutes/efo/Documents/Индекс_Презентация_2012.pdf (September 10, 2016). [8] Gusev, (2009), Formation of ratings of innovative development of Russian regions and recommendations to stimulate innovative activity of
subjects of Russian Federation. [Online] Available: http://www.kapital-rus.ru/articles/article/2574 (September 10, 2016). [9] Hochberg, Grachev, Ditkovskiy, Kirchik, Kovalev, Kovaleva, Kuznetsov, Kuznetsova, Kuznetsova, Kutsenko, Martynov, Martynov,
Nechayev, Rataj, Sagieva, Fridlyanov, Khotko, Khramov, Shuvalov, (2012), Ranking of innovative development of Subjects of the Russian Federation: analytical report. [Online] Available: http://www.hse.ru/primarydata/rir2012/ (September 10, 2016).
[10] Hollanders, (2006), European Regional Innovation Scoreboard 2006. Brussels: European Commission, DG Enterprise. [Online] Available: http://arno.unimaas.nl/show.cgi?fid=16269 (September 10, 2016).
[11] Hollanders, Tarantola, Loschky, (2009), Regional Innovation Scoreboard 2009. INNO Metrics Thematic Paper. Brussels: European Commission, DG Enterprise. [Online] Available: http://ec.europa.eu/enterprise/policies/innovation/files/ris-2009_en.pdf (September 10, 2016).
[12] INEC, (2008), The Social Atlas of Russian Regions. The index of innovations. [Online] Available: http://www.socpol.ru/atlas/indexes/index_innov.shtml#rating (September 10, 2016).
[13] Kutsenko, Nechayev, (2014), The review of foreign and domestic researches in the field of measurement of innovative development of regions. [Online] Available: http://regconf.hse.ru/uploads/c7f4107599baf2fdf7ea20b8ecb2055406959fe6.pdf (September 10, 2016).
[14] NAIR, (2011) Rating of innovative activity of the regions of Russia 2010. [Online] Available: http://www.nair-it.ru/news/17.05.2011/217 (September 10, 2016).
[15] Navarro, Gibaja, Aguado, Bilbao-Osorio, (2008), Patterns of innovation in the EU-25 regions: a typology and policy recommendations. [Online] Available: http://www.orkestra.deusto.es/images/publicaciones/archivos/000283_WPS2008- 04_English_version.pdf (September 10, 2016).
[16] OECD. (2010). The OECD Innovation Strategy: Getting a Head Start on Tomorrow. Paris: OECD Publishing. [17] Pilyasov, A., Khomich, Yu. (2012). The study of the regional innovation in Russia. Smolensk: Oecumene. [18] Wintjes, Hollanders, (2010), The regional impact of technological change in 2020. Synthesis report. [Online] Available:
http://ec.europa.eu/regional_policy/sources/docgener/studies/pdf/2010_technological_change.pdf (September 10, 2016).
85
Informative Perspective Of Financial Disclosure And Its Importance For Capital Market Efficiency
Olivera GJORGIEVA-TRAJKOVSKAa1, Blagica KOLEVA) b, Janka DIMITROVA) c, Krume NIKOLOSKI) d, Vesna GEORGIEVA SVRTINOV) e
a Goce Delcev University, Faculty of Economics, st. Krste Misirkov 10-A, Stip, Macedonia, [email protected]
bGoce Delcev University, Faculty of Economics, st. Krste Misirkov 10-A, Stip, Macedonia, [email protected]
cGoce Delcev University, Faculty of Economics, st. Krste Misirkov 10-A, Stip, Macedonia, [email protected]
d Goce Delcev University, Faculty of Economics, st. Krste Misirkov 10-A, Stip, Macedonia, [email protected]
eSt. Cyril and Methodius University, Institute of Economics, st. Prolet 1, Skopje, Macedonia, [email protected]
Abstract
The impact of various factors on the formation of organizational structure of accounting system exists, as the accounting structure under the influence of environmental factors show atypical behavior.It can be concluded that these factors primarily affect the accounting measurement and disclosure practices, which is reflected in the preparation and evaluation of positions in financial statements of business entities.In this context, the relationship between the capital markets and accounting system of values regulates the amount of information disclosure.
Besides the disharmonization of accounting practices in different national economies, existing of asymmetric information is inevitable factor which determines the level of disclosure and transparency of information, i.e. responsibility of businesses in preparation and presentations of financial statements.
This paper also describes the variety of financing sources available to both individual consumers and businesses, and the considerations that lead a consumer or a business to choose a specific financing source. A robust, efficient, and diverse financial system facilitates economic growth. Research has shown that the level of financial development is a strong predictor of economic growth. It then discusses how this variety of financing sources provides benefits to the economy and how they affect the practice of financial reporting.
Keywords:information, disclosure, capital, market, financial
1. INTRODUCTION
In the wake of the recent financial crisis, some have argued that the economic growth was merely an unsustainable bubble, and that when the bubble burst, the economy came crashing down (Center for capital markets, CCMC, USA, 2011). While the causes of this crisis are not the subject of this paper, it is worth noting that the crisis was a consequence of a variety of factors: an excess supply of liquidity due to a global liquidity-imbalance, an easy-money monetary policy, a political desire for widespread home ownership, and various developments in the financial sector. All of these factors need attention if we are to have a well-regulated, transparent, efficient, and robust financial system, consisting of a diversity of financing sources. Thus, financial reform must go hand in hand with a strong financial services sector. Nonetheless, an important point to remember is that the data show a strong correlation between economic growth and strength of financial services.
It was not a coincidence that a lot of economies grew so rapidly during a time that financial services grew in importance. Financial markets and the financial service firms that operate in those markets help individuals and businesses raise capital of various sorts, as they channel money from savers to those with investment ideas. The
* Corresponding author.
86
more well developed the financial system, the better lubricated this channel, and the lower the transactions costs and other impediments to investment and economic growth.
Indeed, one of the roadblocks to economic growth in the former socialistic countries in Europe, such as Macedonia, has been the lack of developed financial systems. The fact that the U.S financial system is well developed and innovative has been a big boon to individuals and businesses, as they have been able to access a variety of financing sources to raise relatively low-cost capital to grow. Even within the United States, the number one reason for the failure of small businesses is lack of access to funding. Put differently, when small businesses do succeed and create employment and growth, an important factor in their success is access to the financing needed to support growth. The strength of the financial system has also been a significant factor in the creation of prominent new firms that have been launched in the past 25 years and have gone on to become global powerhouses. Starbucks, Yahoo, Google, and eBay are but a few examples. No other country in the world can match this, in large part because no other country in the world has such a deep and vibrant financial system.
In order to get access to public equity markets corporations need to meet investor expectations with respect to corporate governance practices. They need to establish a formal structure of procedures, rights and responsibilities that make investors willing to provide money and make the original owners willing to share ownership with a new circle of outsiders. The Principles of Corporate Governance provide the elements of such a framework. They also provide guidance for policy makers and regulators on how to assess, design and improve corporate governance related laws and regulation. The Principles provide recommendations in a number of critical areas such as the rights of shareholders, institutional investor practices, the functioning of stock markets, the role of stakeholders, corporate disclosure and the responsibilities of the board of directors. Importantly, they also address the quality of supervision and enforcement.
2. Classification of capital markets on the base on diversity of financing sources
For many authors the type and development of capital market is one of the most dominant factor for the
differences between accounting systems. That’s why they make classification of the capital markets in two categories, depending on the source of financing, i.e. capital markets and debt markets. Those authors, whose findings are subject to discussion in this paper, are: Roberts, Weetman& Gordon, (2008); Radebaugh, Gray & Black (2006); Saudagaran (2004) and Nobes (1998). When the most companies in a country are oriented to the stock exchange, as a main capital source, in that case the market is referred as a capital market. In other countries, where business entities are seeking for fund sourcings from banks, as primary source of capital, the market is referred as debt market (Saudagaran, 2004). Business’s financing through capital market is more important than financing by debts (Roberts, Gordon (2008). In the process of financing through the capital market the accounting principles and rules are established with the aim of producing a forward-looking information necessary for effective decision making. While, in the second way of financing, conservative principles for accounting measurement have been more important, in order to protect the creditors.
In European Union countries, business entities vary in the way of financing, i.e. fund sourcing. In countries such Great Britain, the capital is usually divided between many small shareholders, and accounting principles require for accurate reporting of realized profit (earning). In Germany, for instance, business are more oriented to financing by credits, from relatively small number of banks, with concentrated ownership of capital. In this case the accounting system is based on the principle of conservatism. Capital is provided by several large shareholders that the companies communicate with, and public reporting is not primary. On the other side, in France and Sweden, the legislation has a huge role in capital sourcing management, and the companies are required to implement the government policy and macroeconomic plans. Companies are following the single set of accounting principles and methods in their financial reporting, in order to help the country to boost economic development (Joos& Lang, 1994) and to improve government decisions (Mueller, Gernon& Meek, 1987).
However, Radebaugh, Gray and Black (2006) state that the pressure concerning public responsibility and disclosure of information is bigger when the financing is done through the external shareholders and stock exchange, unlike the banks which usually have necessary information. For instance, in Germany, France and Italy, financing of small family businesses from banks is very important. Contrary, in USA and Great Britain there are a lot of entities who rely on funding from millions of shareholders, that’s why there are 250 listed entities in 2007, with market capitalization of 800 milliard dollars (Nobes& Parker, 2008). Strong capital market with different groups of shareholders, in general, is a base for generating of very sophisticated information. When banks are dominant financiers, accounting systems assume protection of creditors, primarily, and the scope of published information has been decreased (Doupnik& Salter, 1995).
87
At the same time, Nobes (1998) uses Zysman’s classification published his book “Governments, markets and Growth: Financial Systems and the Politics of Industrial Change”, to categorize the accounting systems in countries, regarding the intensity of influence of credits and capital, into dominant “insiders” and dominant “outsiders”. This idea has roots in financial literature, and has been used in many discussions concerning different systems of corporate governance. In the table below the Nobes’s matrix for financing systems is presented:
Table 1. Nobes’s matrix for distinguishing of financial systems
Systems oriented to credits Systems oriented to capital dominant “insiders” dominant “outsiders”
I II
III IV
Source: Nobes, (1998), Towards a general model of the reasons for international differences in financial reporting, Abacus, 34 (2), p.166
Basic setting of the matrix is the fact that the capital market, as the main source of external long-term financing,
rests on securities, with existing of large scope of capital instruments and financial institutions, which have relations with business entities. In these circumstances investors change the structure of their portfolios with the help of the secondary market of securities. Nobes describes “outsiders” as external members who doesn’t have a privileged relationship with the business entity, as they are not members of board of directors. They are, in fact, a small stakeholders (private ownership) and institution, as insurance companies and funds, with large dispersed portfolios, that decrease the possibility of a single important participation in entities’ capital. “Insiders”, like government, banks and other entities are long-term partners, connected through their own investments that requires timely and reliable accounting information. It can be concluded that different users require different set of information, from quantitative and qualitative aspect.
2.1. Review of the most significant researches in the field of capital markets and source financing
This section gives a short overview of several important researches about the degree of connection between capital market and sources of financing, regarding the differences in financial reporting in national practices. Subject of discussion are results from research and final conclusions of following authors: Leuz, Nanda and Wysocki (2002), Forst, Gordon and Hayes (20o2), and others.
Leuz, Nanda and Wysocki (2002) make classification of countries in clusters with similar legal and institutional characteristics, i.e.:
1. “outsider” economies with strong legal influence (as Great Britain and USA);
2. “insider” economies with strong legal influence (as Germany and Japan); 3. “insider” economies with week legal influence (Italy, India).
In terms of profit, “outsider” economies with strong influence of legal system disclose the lowest level of profit, and the “insider” economies, the highest one. Reduced profit appears in economies with strong investor’s support and large stock exchanges. Above mentioned authors made a sample of 70.955 business entities and 8.616 non-financial entities, from 31 countries, for the period 1990-1999, using the data from Worldscope base. In order to be included in the sample, each country should have at least 300 entities, analyzed through several accounting variables (total assets, sales, net income and operational income). Financial statements for last three years, for each entity, have also been used and also information for their net profit / loss. Each variable has been ranked, so higher scores mean greater importance for the capital market. First cluster is characterized with big stock exchanges, low ownership concentration, wide “outsider” rights, high level of information disclosure and strong legal control. Second and third cluster contain considerably smaller stock markets, higher concentration of ownership, weaker investor’s protection, low level of information disclosure and week legal system.
Similar research have been conducted by the authors Forst, Gordon and Hayes (2002), which resulted in the paper “Stock exchange disclosure and market development: an analysis of 50 international exchanges”. The main assumption in their work has been the fact that stock exchanges and countries differ a lot in tradition, requirements and disclosure practice. Conclusions from this study propose promotion of more rigorous standards for financial disclosure, assisting in this way in improvement of capital market quality and liquidity. For the purpose of this research systems of financial reporting and level of liquidity of 50 members of World Federation Exchange (WFE)
88
have been analyzed, through questionnaire consisting of 12 criteria for financial disclosure. With analysis of these 12 measures of financial disclosure, benefits of timely and objective disclosure of information concerning business entities, for the stock exchange, have been confirmed. First, total liquidity of the market can be increased, because the level of liquidity and extent of disclosure are in positive correlation. Increased liquidity can draw additional listing of entities on stock exchange, which will, in turn, increase possibilities for investor’s trading. Аs a result of this, market activities increase and investment process facilitates. Results of this research can also help the international organizations that works on harmonization of reporting standards, as a way of reduction of barriers to international capital flow.
Grey (1980), in his paper “The impact of international accounting differences from a security-analysis perspective: Some European evidence”, investigate why some countries are much more conservative than the others, from the view point of measurement of the profit, on the base on comparative-empirical research of big companies in France, west Germany and Great Britain, for the period 1972-1975, by using of standardized methods of analysis and presentation of financial statements of companies, respecting the recommendations of European Federation of Financial Analysts Societies – EFFAS). Conservatism or caution is a basic accounting principle in these countries, according the Directive IV of the European Union. Main goal of this “European method” is to determine the number that can be used in the assessment of profit and then calculating the ratio.
Taking into account the “European method”, as a measure of adjusted profit, it can be calculated the ratio of disclosedprofit vis-à-vis adjusted profit, using the “index of conservatism”, with the formula:
1 - [(Ra – Rd) / Ra](1) where, Ra = adjusted profit Rd = disclosed profit The result of this computation is so called “index of conservatism”. Depending on the results all ratios are
classified into nine categories, starting from very conservative (pessimistic) ratio – when < 0,50, till less conservative (optimistic) category – when > 1,50. At the same time, there are three subgroups of the ratio - pessimistic, neutral and optimistic variable. Group of pessimism includes ratio of conservatism < 0,95, and for optimism > 1,05. Neutral variable allows measuring of tolerance for ratios between 0,95 – 1,05. This is indicated in Table 2.
Table 2. Classification of disclosed profit using the “index of conservatism”
Pessimistic (< 0,95) Neutral (0,95 – 1,05) Optimistic (> 1,05) 0,50
0,50 – 0,74 0,75 – 0,94
0,95 – 0,99 1,00
1,01 – 1,05
1,06 – 1,25 1,26 – 1,50
1,05
Source: Gray, (1980), The Impact of International Accounting Differences from a Security-Analysis Perspective:
Some European Evidence, Journal of Accounting Research Differences in the conservatism of profit disclosure can be explained with the different needs of two groups of
information users, and also with the influence on managers and accountants in business entities. Equity investors, as first interest group, are primarily interested in the distribution of available profit, boosting the price of shares and active secondary market. This optimistic impact generate investor’s capital and also have positive impact on disclosed profit in Great Britain. As opposed to this, banks and other creditors, as second interest group, are more focused on certainty of investments and capacities of companies for paying the interest, typical for France and Germany, where the impact of conservatism generates pessimism in disclosure of profit (Grey, 1980).
Therefore, the degree of conservatism in a country determines the amount of disclosed information on the capital markets, whereby classical example of agency problem appears, as generator of information quality. Agency problem (or asymmetric information) is not only present at capital markets, but appears as a frequent problem in micro organizations. In fact, an increased degree of information asymmetry is inversely proportional with the quality and transparency of information disclosure, converting it in a big obstacle for the efficiency of financial markets.
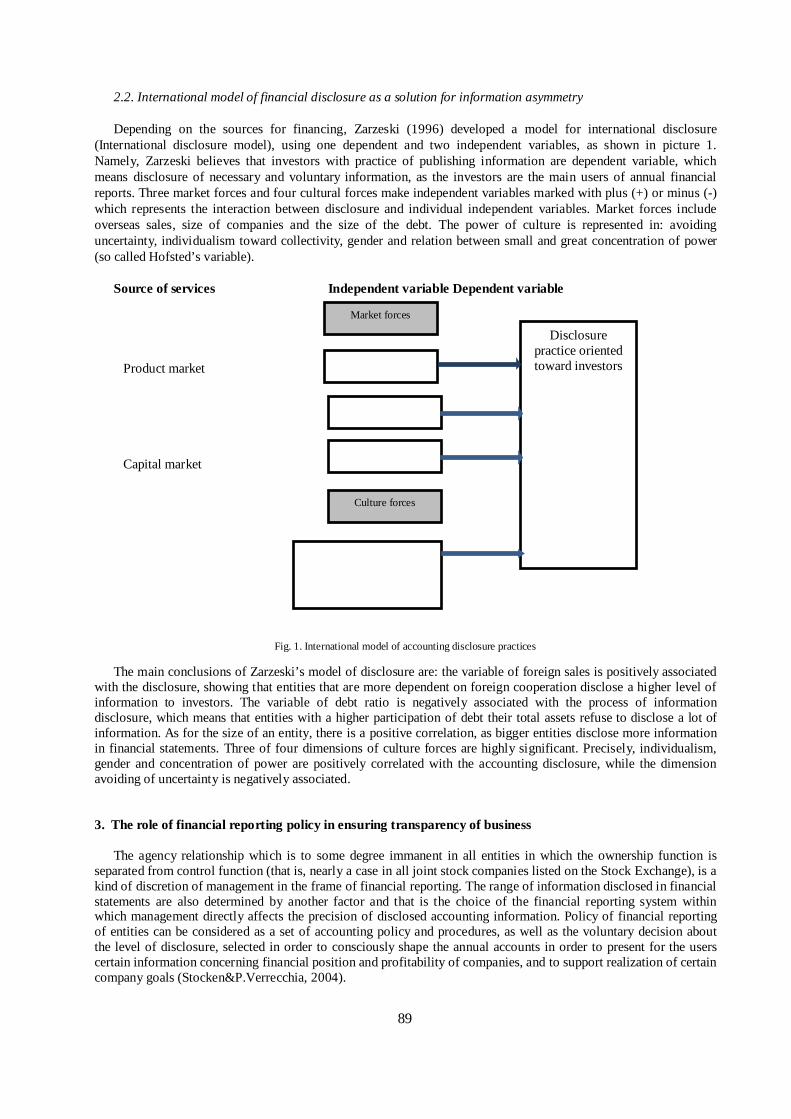
89
2.2. International model of financial disclosure as a solution for information asymmetry Depending on the sources for financing, Zarzeski (1996) developed a model for international disclosure
(International disclosure model), using one dependent and two independent variables, as shown in picture 1. Namely, Zarzeski believes that investors with practice of publishing information are dependent variable, which means disclosure of necessary and voluntary information, as the investors are the main users of annual financial reports. Three market forces and four cultural forces make independent variables marked with plus (+) or minus (-) which represents the interaction between disclosure and individual independent variables. Market forces include overseas sales, size of companies and the size of the debt. The power of culture is represented in: avoiding uncertainty, individualism toward collectivity, gender and relation between small and great concentration of power (so called Hofsted’s variable).
Source of services Independent variable Dependent variable Product market Capital market
Fig. 1. International model of accounting disclosure practices
The main conclusions of Zarzeski’s model of disclosure are: the variable of foreign sales is positively associated with the disclosure, showing that entities that are more dependent on foreign cooperation disclose a higher level of information to investors. The variable of debt ratio is negatively associated with the process of information disclosure, which means that entities with a higher participation of debt their total assets refuse to disclose a lot of information. As for the size of an entity, there is a positive correlation, as bigger entities disclose more information in financial statements. Three of four dimensions of culture forces are highly significant. Precisely, individualism, gender and concentration of power are positively correlated with the accounting disclosure, while the dimension avoiding of uncertainty is negatively associated. 3. The role of financial reporting policy in ensuring transparency of business
The agency relationship which is to some degree immanent in all entities in which the ownership function is separated from control function (that is, nearly a case in all joint stock companies listed on the Stock Exchange), is a kind of discretion of management in the frame of financial reporting. The range of information disclosed in financial statements are also determined by another factor and that is the choice of the financial reporting system within which management directly affects the precision of disclosed accounting information. Policy of financial reporting of entities can be considered as a set of accounting policy and procedures, as well as the voluntary decision about the level of disclosure, selected in order to consciously shape the annual accounts in order to present for the users certain information concerning financial position and profitability of companies, and to support realization of certain company goals (Stocken&P.Verrecchia, 2004).
Market forces
Foreign buyers
Size of entity
Debts ratio
Culture forces
Avoiding uncertainty Individualism – collectivism
Men – women Concentration of power
Disclosure practice oriented toward investors

90
In practice, not infrequently, the policy of financial reporting is identified with activities aimed at blurring the operating in accordance with the interests and the power of management. However, It is important to note that the above interpretation is wrong, since such actions are neither legal nor contribute to a more efficient capital market, but reflect the creative accounting. Contrary on this, policy of financial reporting should reflects the spirit of the principles of proper bookkeeping and as such should contribute to a more efficient decision-making of investors and the functioning of capital markets. In this context, financial reporting has important role to increase business transparency. The fact that in volatile conditions and unstable financial markets, information users are not always able to uncover the information content of financial statements, i.e. to recognize the perspective of companies, policy of financial reporting has an important role of signaling. As instruments of communication with the investment community, as well as other stakeholders, policy of financial reporting is focused on the realization of targets of the capital market. However, it must not be concluded that the realization of the objectives will be achieved at the expense of investors. On the contrary, it is a "game" in which both sides should benefit – in companies this is reflected in obtaining the necessary capital and the opportunity to realize the defined strategy in order to gain and maintain competitiveness advantage, while investors have the opportunity to better understand the business, recognize the stable and promising companies and thus make more effective decisions about their deposits.
The significance of the policy of financial reporting is reflected, among other things, in contribution to build and maintain the financial reputation of the company. The attractiveness of certain companies for investors is determined in high degree by the financial reputation of the company. The research results show that investors believe that financial reputation is an important factor in gaining the confidence in presented performances of the company. From the standpoint of investors, in the process of building a reputation of companies, following elements have great contribution: financial reporting, transparency, communication, performance and financial strength of companies, as well as the ability of the Board of Directors. In the opinion of financial investors, financial reporting is the largest contributor, especially if it has a high degree of transparency. In other words, companies with high financial reputation strive to provide high quality financial reports (Cao, Myers, Omer, 2011). This means that the reported performance reflects the changes in the real economic value of the company, thereby reducing the problems associated with the agency's attitude.
Communication based on a true and fair view of economic reality is the key to establish a relationship of trust, not only with investors, but also with other stakeholders. The fact is that the construction of reputation takes years, and it can disappear with just one inadequate disclosure. As for the factors that distort the reputation, investors emphasis on inadequate communication in companies, and financial reporting of low quality. It is often caused by incorrect recognition of revenue, as well as other elements of biased and unethical reporting. Precisely in this area is recognized the difference between policy of financial reporting and the so-called "Creative" accounting.
The role of financial reporting in solving the problem of adverse selection (as a result of information asymmetry) can be reflected in timely disclosure of relevant and reliable information, i.e. the conversion of insider information into the public. When it comes to moral hazards, the solution is a reliable measurement of performance - benchmarking, as the base of monitoring. It follows that the problem of information asymmetry can be mitigated if the management of the company instead of opportunism define the access of signaling through financial statements, as well as the engagement of audit firms that enjoy credibility in the financial community.
Reducing the problem of information asymmetry is further enhanced by activities of independent professionals such as financial analysts who mediate between companies and investors, and other mediators i.e. controller (gatekeepers), whose role is to protect the interests of investors. This is achieved not only through the monitoring of entities participating in the capital market, which among other things implies that the financial statements should be prepared and presented in an impartial manner, in accordance with generally accepted accounting principles and standards, but also with the help and monitoring of the corporate insiders behavior. The aim is to increase credibility of financial reporting and maintain confidence in the financial system.
4. The policy of financial reporting as support of creation shareholder value
Creating value for shareholder is one of the strategic goals of modern entities. The aforementioned shift of focus from maximizing short-term profits to long-term values creation initiates the question of whether and in what manner the change of corporate target causes a change in attitude of management towards the practices of financial reporting. The pursuit of profit maximization often results in applying techniques of aggressive and creative accounting, appropriating shareholder wealth by unscrupulous managers, as well as the collapse of the company. Described consequences suggest that the pursuit of maximization of profit reduces shareholders value. The reasons should be, among the others, the dysfunctional behavior of managers, who in an effort to maintain a high rate of profit, use to discard the projects that are economically justified, or promising a lower rate of return than the average achieved, in order to maintain the high performance of the company. On the other hand, highly profitable projects are accompanied by a high level of risk that may threaten the survival of the company.
91
The relationship between management and shareholders (the agent and principal) in large corporations is regulated with the agreement for compensation. The aim is to encourage agents to direct their efforts toward operation proprietary interests. An integral part of the compensation package for management, besides salary, includes share options, bonuses, cash incentives, actions i.e. shares in ownership. These components imply that the contract is designed in a way that makes the wealth of the management sensitive to changes in stock price. As for the shareholders, yield can be achieved in the form of cash dividends and capital gains. The basic premise for the realization of capital gains is to increase the market value of the company. Yield of shareholders represents the main motive behind their investment, and decisions on purchase of shares of a particular company. The fact that the capital market, for the needs of entity evaluation interpret, among other information, also the information contained in financial statements, implies that in the implementation of listed objective, the policy of financial reporting contributes with significantly high degree. In other words, in addition to the protection of values, financial reporting is assigned as the task of creating value.
The capital market is perceived by a significant number of investors and managers as a short-term oriented. The reasons should be find in the fact that the stock prices of companies who are in long term superior in terms of business efficiency and positioning in the industry, are not always extremely high. When we speak for the management, it often fails to see a direct connection between strategic decisions and actions on the one hand, and value creation on the other (Rappaport, Maubonssin, 2001). In addition, portfolio managers are oriented to achieve short-term results and maximizing personal benefits. This explains the choice of accounting policy which is not always rational in terms of maximizing long-term value, but increases stock prices in short terms. In this context, long-term speaking, investors (not speculators) will lose by at least two reasons: first, short-term gains provide little valuable information on long-term cash flows of the company, and secondly, consensus estimates and disclosed earnings are subject to arbitrary accounting choices that has little in common with actual performance.
Despite these perceptions, capital markets are long-term oriented (Koller, Geodhart, Wessels, Copeland, 2005). The “myopathy” of a part of the investment community can be attributed to misinterpretation of market reaction to the published profits. In the case of the above mentioned above-average efficiency of entities, if stock prices fully reflect competitive advantage, there is no room for expectation that shareholders will achieve above-average returns (capital gains). Superior returns are possible only for those investors who correctly anticipate the changes in the future competitive position of the company and related changes in cash flows, which are not reflected in the current share price.
Stock prices reflect the future cash flows of the company. If the basis for the valuation of the company is discounted cash flow, or if the gain itself is not an adequate approximation value, it is possible to ask the question why the market reacts to the disclosure of gains and why accordingly, management seeks to formulate gains?
In an effort to answer these questions it is necessary to start from the informative perspective of financial reporting. The gains of the current period serves as a basis for forecasting future cash flows and prosperity of entities. If the company disclose higher or lower gains than expected, such information is used by markets for revising of the previously performed forecast for long-term cash flows. Thus, for example, if the market is disappointed with current gain, unfavorable signals in the future cash flows will cause the decline in stock prices in observed companies. Research shows that changes in the reported gains, primarily caused by a change in accounting methods that do not touch the cash flows, have no influence on the share price (Rappaport, Maubonssin, 2001). This further implies that the market does not react mechanically, i.e. if there is no signal on the future prosperity of the company, there will be no changes in stock prices.
This is supported by the results of a US study that included 54 companies, examining the implications of changes in accounting for goodwill on stock prices. Specifically, in the context of "Project improving IAS" which was published in 2004 by the IASB, with amendments on IAS 38 - Intangible assets, is planned that by the first of January 2005th the goodwill should not be written down, but at the end of each year its value should be tested in terms of imperative losses. In such circumstances, gain of the companies that have had a significant amount of goodwill recognized due to missing of depreciation costs, showed an upward trend compared to previous periods. The increase in profit per share was accompanied by the appreciation of stock prices. However, within two weeks, share prices have returned to initial level (Koller et al, 2005). This phenomenon can be explained with specific market perception that the above changes in accounting treatment has no impact on future cash flows of the company.
On the other hand, certain changes in accounting estimates and policies directly reflect changes in future cash flows. So, for example, high imparity write-offs of goodwill shown in assets as a result of recently implemented acquisitions, suggests that the expected benefits of that operation are not realized, or that the actual benefits are lower than expected. As a result, lower gains reflect unexpected changes in future cash flows, and as such are reflected in the stock prices. This implies that the write-off policy has influence on stock prices in the degree to which shapes the assumptions of investors in terms of future cash flows of the company.
92
Seen through the perspective of information content, policies of financial reporting can be characterized as a useful, neutral and harmful (Ronen, Yaari, 2007). The phenomenon of creating financial and accounting information is considered useful if send to investors signals about the long-term prosperity of the company. Decisions and procedures that place signals on short-term performance have neutral character, while the destructive policy of financial reporting (creative accounting) is considered a practice that sends the wrong signals to balance addressees (users).
Although the evaluation process is primarily based on the expected cash flows, the importance of information for the profit is not contested. Namely, information about the profitability are important for investors due to the fact that disclosed gains represent a framework for the payment of dividends, evaluation the ability of investment and companies growth, the settlement of obligations (repayment of capital shall be made from the profit after tax), which implies the availability of a large amount of future cash flows for shareholders.
If we accept the view of the relevance of dividends, stock prices can be displayed as a function of the present value of future dividends. In addition to height, it is necessary to emphasize the aspect of the stability of dividends. As is well known, due to risk aversion, investors evaluate the stability (gains and dividends) compared to a profit "shocks". Such preferences suggest to the management the need of planning and pursuing the policy of uniform expression or less fluctuating results.
The cycles in the economy, as well as stages in the life cycle of the company, also have implications on the results. Showing stable gains, however, it is not possible without a policy of financial reporting and accounting basis, i.e. accounting policies. Reduced risk perception and consequent lower cost of capital (required rate of return on equity) as a crucial element of the discount factor, indicate that accounting policies are an integral part of the strategy of maximizing shareholder value. Thus, for example, management of the business which has an unexpectedly poor performance compared to the previous period, on the base on experience, can estimate that the difficulties are temporary. In this case portfolio of accounting policies which increase the gain can be applied, hoping to change – improving performance in the next period. In case the expectations are met, the strategy of equalization is successful and the market will assign the valuable premium to account for the stable performance. The reasons should be sought in a reduced perception of risk. Specifically, for a given level of risk, increase of revenue will result in the growth of stock prices.
By analogy, the same effect can be expected in conditions of reduced risk and unchanged profit. However, harmonization of the gains is without effects on the share price if the market is perfect, with enough information to identify the” cosmetic” changes in the financial statements. The increase, as well as the stability of the gain, can be achieved also with realistic economic decisions as an integral part of the policy of financial reporting. So, for example, granting discounts to customers at the end of the financial year in order to increase sales revenues, contributes to the realization of the desired result level in the current period. However, the implications of those decisions from the standpoint of value creation can be unfavorable. This is because with forcing of the selling, we are “borrowing” cash flows from future periods. After the return to the initial level of prices, sales volume will be reduced, which also influence the future cash flows, and thus the value of companies.
About the creation of value for the owners may be discussed only if the rate of return on investment projects is higher than the cost of capital, i.e. lower average cost of capital provide the possibility of having higher realized shareholder value, which is an additional argument for policy of stable profits. The cost of equity capital are defined as a rate of return that shareholders expect to realize as compensation for taking the risk of investing in a particular company. This yields, as it is highlighted, are manifested in the form of dividends and share price growth. Capital gains, as the potential return for shareholders, is the positive difference between the lower purchase and higher selling price of the shares. In relation to cash dividends, capital gains superiority is multiple: above all, they are reflected in the domain of tax advantages, in the sense that capital gains are taxed at a lower rate compared to the dividend. Then, realization of capital gains is based on the discretion of shareholders which is reflected in the selection of the time of shares sale. Finally, according to research by Standard & Poor's 500, the average growth rate of dividends in the long run is about 8%, i.e. during the period of five years, shareholders can expect to receive amount of dividends in the range of 10-15% of the stock price, but very often lower amount, given the fact that many companies do not pay dividends (Rappaport, Maubonssin, 2001). These arguments explain the preference of shareholders to companies whose market value tends to grow.
Starting from the fact that the market value of the company can be defined as the sum of the accounting value and the expected future profitability, the importance of the policy of financial reporting is recognized in providing the information basis for the determination of both these elements. In fact, with the choice of accounting policies, valuation methods, termination and decisions on capitalization or retirement of certain costs, an immediate effect on the balance value of certain positions is evident.
The goals in the area of value creation can be realized not only by the creation of results, but also by adjusting the forecast and expectations of the investment community. The financial statements are subject of designing in purpose that the company can achieved the appropriate "threshold", or avoid showing losses and gains reduction.
93
With this, the consensus of forecasts by financial analysts is implemented. In order one company to generate preconditions for the creation of value now and in future periods, applying conservative accounting policies may affect the reduction on the level of profit that analysts and investors expects. Otherwise, the impossibility of achieving the "targets" will be “punished” by reducing the stock prices.
Lower "threshold" or consensus forecast provides the possibility of realizing an additional positive influence on the value of the shares. It is the so-called, effect of the profit surprise. Let us assume, for illustrative purposes, that the company estimates finishing the business year with a profit per share (EPS) in the amount of € 2, and that the current expectations of the market is € 2.2. The company in a given case may, by information in quarterly reports, reduce the expected profits. If in this efforts the company succeeds and achieves the expectations of the capital market in the amount of profit per share of € 1.7, by the subsequent expression of the profit per share of € 2 management will be at opportunity to realize a market premium. Although the gain deviation is € 0.2 per share compared to initial expectations, the overall effect of changes of stock prices may be positive.
However, it is possible that despite the extraordinary efforts of management in achieving strategic goals, perceived value of the shares on the market to be significantly lower than the estimates of management. In other words, it is possible that the company's management believes that the value of shares on the market are underestimated. The reasons for such deviations should be sought in possibility that the market does not recognize the value of strategy, then, that management has superior information, and that the optimism of management is without coverage. Reasons cited, among other things, are result of the information gap, and the fact that market participants do not have enough relevant information about the observed company. It still implies high uncertainty and high discount rate, which will have negative reflection on the present value of expected cash flows, and consequently, the price of shares.
On the other hand, there is a possibility that stock prices are overvalued in relation with calculation of management, due to information placed about the prosperity of entities, on the basis on which shareholders expect a higher yield than management anticipates. If management is not able to meet these expectation neither by applying real policy measures of financial reporting, the decline in share prices is inevitable. Hence, an important aspect of creating and realizing value represents the effective communication between management-investors, which is the information policy of financial reporting perspective just how it serves. Namely, high-quality financial reporting builds investor confidence in the credibility of accounting report, and without trust the capital market can not function effectively. The fundamental goal of this communication is providing the investors with information within the limits that do not threaten competitiveness of the companies, in order to provide adequate interpretation and forecasts based on the key drivers of value (sales increase, the rate of business gain, reducing the average cost of capital, increasing competitive advantage). Reducing the information asymmetry reduces the transaction costs, increase the liquidity of the shares, which implies a reduction of required rate of return and higher stock prices.
Maximizing the value of the company through reducing agency costs presupposes the application of accounting policies that will enable effective monitoring, before appropriation of wealth by management. This in turn implies that the accounting policies are implemented and signalize optimal future cash flows of the company. Transparency of financial statements is negatively associated with capital costs (Barth, Konchitchki, Landsmna, 2013).
It is important to note that the value for shareholder can be generated by substantial or transactions that affect on real economic performance, rather than “cosmetic” changes. The policy of financial reporting can be seen as an auxiliary instrument - independently applied in the short term may increase stock prices. Starting from the perspective of efficiency, the creation of financial statements is carried out in a way that through influence of the financial flows increase the value of the company. Information perspective of financial reporting is considering the scope of disclosures that provide a basis for estimating future cash flows, with no direct influence on them. The significance of discretionary application of accounting policy can be explained through the irrational behavior of investors, as well as the imperfect functioning of capital markets. When it comes to the irrational behavior of investors, it is reflected in over-reaction or lack of reaction to certain financial information.
The first case in the literature is referred to as "reversal", which includes high fluctuations in the value of shares - up and down: when company has been operating successfully for years, investors are trying to extrapolate this trend in future periods, which is followed by a significant increase in stock prices. The first time when a company will fail to meet expectations, stock prices sharply depress. Another phenomenon is known as "momentum" and implies that stock prices continued to move by inertia with certain trends because investors react slowly, or do not revise their expectations in the short term, but in the same time they are underestimating the importance of information on changes disclosed profits, disinvestment, the purchase of own shares and more.
Although the market is inefficient in the sense that the price action in certain circumstances deviate from fundamental values, such imperfections are not enough common, nor provides significant long-term shareholder value generation. If the policy of financial reporting with discretionary character is not supported by a strategic decisions and actions aimed at creating real economic values, the short term increase of the reported profit can be converted to the destruction of long-term value. The destruction of value is not solely the result of poor quality
94
financial statements, on the contrary, is often accompanied by inadequate business model of the company, incompetent management, wrong economic decisions, unprofessional behavior of auditors. Low-quality financial statements represent a means for masking the unsatisfactory financial health of the company. In this context, it is undisputed that the losses of investors arising from the collapse of large companies around the world, would be far lower if high-quality and transparent financial reporting is provided.
5. Characteristics of financial reporting for the listed companies in Republic of Macedonia
The emergence of capital market in Macedonia is a direct result of the structural, economic and social changes in the country, since 1989. The legislation is comprised of numerous laws and regulations, the most important of which are the Trading Company Law, the Securities Law, the Law on Takeover of Joint-Stock Companies and the Investment Funds Law.
The Macedonian Stock Exchange (MSE) was established in September 1995, as the first organized stock exchange in the history of the Republic of Macedonia. On 28 March 1996, the commencement of trading operations created a central market place for securities trading. The MSE is organized as a joint-stock company. The major shareholders comprise banks and stockbroker companies. The main bodies of the MSE are the Shareholder’s Assembly and the Board of Directors, consisting of eight members (four non-executive members, three independent members and one executive member, who is also the Chief Executive officer of the MSE).
The Securities and Exchange Commission is responsible for stock market supervision. The Commission is an autonomous and independent organization with the status of a legal entity, which regulates and supervises all participants in transactions with securities in the Republic of Macedonia. The Commission has public authorizations established by the Securities Law, the Investment Funds Law and the Law on Takeover of Joint-Stock Companies. It is responsible, within its legal powers and authorizations, for the legal and efficient functioning of the securities market, as well as the protection of investor’s rights (KPMG, 2015).
Regulatory platform for the accounting and financial reporting in Macedonia is given by The Companies Act (Official Gazette No.28, 2004). The Companies Act classifies companies into four groups: large, medium sized, small and micro. IFRS are financial reporting platform for large and medium sized companies, listed companies, banks, insurance companies and subsidiaries of previously mentionedcompanies. Auditing of financial reports is regulated by Auditing Act (Official Gazette No.31, 2001), which requires usage of International Standards of Auditing. Audit of financial reports is obligatory for all listed companies.
Additional reporting requirements apply for the listed companies as defined by Securities act. The Act in the Chapter VI deals with the issue of financial reporting and transparency of the listed companies. Article 153 of the Act defines that Securities Commission must establish and maintain Registry of Reporting Companies. A listed company must submit to the Commission annual report, semi-annual report and quarterly reports. Annual report must be published no later than 4 months after the end of the calendar year. Annual report includes the following elements: financial statements, auditor opinion, discussion and analysis of business results, information on members of management and supervisory board, compensation arrangements, dividends policy, etc.
In December 2015, the World Bank presented the findings of the completed Report on the Observance of Standards and Codes on Accounting and Auditing (ROSC A&A), which is part of the joint initiative of the World Bank and the International Monetary Fund. This assessment focuses on the strengths and weaknesses of the accounting and auditing environment that influences the quality of corporate financial reporting, and includes a review of both statutory requirements and actual practice.
The strategic objective of this report is to support the Government in its efforts to improve the business climate in the country, as well as the country’s overarching goal of the EU membership. Findings and recommendations from this report informed the Government’s decision making aimed at increasing competitiveness and productivity across the economy, through the provision of timely and reliable financial information formulated according to internationally accepted standards, and also observing standards of governance that create confidence among local and foreign investors.
"Improved corporate sector financial reporting and auditing, along with appropriate disclosure of financial information, contributes to economic development and growth and to improving access to finance, the investment climate, the overall business environment and job creation”(Goran Tinjic, World Bank Acting Country Manager for FYR Macedonia, 2015). This ROSC Accounting and Audit contributed also to the overarching theme of the World Bank’s Country Partnership Strategy in the country, which is to support EU accession agenda.
The specific objective of this report is to help the Ministry of Finance and other stakeholders address deficiencies in the institutional infrastructure required for relevant and reliable corporate financial reporting. The three essential pillars of institutional infrastructure are: adequate and appropriate legal requirements, capacity sufficient to implement those requirements, and effective enforcement mechanisms.
95
This report is an update to the first ROSC A&A prepared in 2003, which identified a number of areas for improvement. The new report verifies that the country made significant progress in aligning the statutory and institutional framework with EU requirements. The Government has carried out reforms consistent with good institutional practices. Major improvements in accounting since 2003 include: the enactment of the law on accounting services, the adoption of a relatively recent version of International Financial Reporting Standards (IFRS), the adoption of the IFRS for Small and Medium-sized entities, improved filing mechanisms for financial statements and improved transparency through the availability of data in the Central Registry.
In addition, reforms that were conducted included: the enactment of a new law on auditing, the establishment of a professional institution for statutory auditors, the preparation of updated certification curricula, the replacement of outdated auditing standards with newer versions, and establishment of quality assurance and public oversight arrangements for the audit profession.
The ROSC A&A due diligence included a review of a sample of published financial statements and found that the general quality of financial reporting for public interest companies has improved compared to the 2003 report.
However, further efforts are needed to improve the quality of financial reporting and the report identifies a number of key areas that need be addressed in order to ensure that the gains achieved are solidified and made sustainable over the medium and longer period.The report notes several areas for further improvements, including: align fully the statutory framework with the EU directives including simplifying requirements on SMEs, revisit the organization of the accountancy profession to avoid duplication and ensure its long-term development, continue modernizing accountancy education and training, streamline accounting and auditing standard setting, strengthen the mechanisms to ensure compliance with the standards.
Suggested next steps are for the Government to discuss this diagnostic with the stakeholders, determine the priority areas for further reforms or improvements, assess the resources available and determine the corresponding allocations and remaining gaps. The World Bank is committed to supporting the country in this ongoing reform process.
Conclusion
Financial statements are an important component of financial reporting system necessary for the proper functioning of capital markets. Even if it is desirable to have a comparable or a unique model for reporting, this is still in process of achieving, due to the national characteristics, cultural influences and submission to different standards.
When designing policies of financial reporting and election of instruments for the creation of financial statements, management anticipate the outcomes of their decisions and actions. The imperative of generating shareholder value required to reduce costs, which can be the generated. In this sense, it is crucial to ensure unhindered access to capital by reasonable price. In other words, the value for shareholdersis created through the reduction of costs of capital and agency costs. In fact, the optimal choice of accounting policy provides the possibility of predicting future cash flows, better understanding of the operations and more efficient monitoring. This will reduce information risks on which investors in capital are exposed.
Accordingly, the policy of financial reporting should be both designed to contribute to the promotion of transparency in business through high-quality financial statements, thereby contributing to more efficient allocation of capital.For achieving qualitative and transparent financial reporting on capital market a higher degree of disclosureis required.
References
[1] Ball, R. Kothari, S.P. Robin, A., (2000), The effect of international institutional factors on properties of accounting earnings, Journal of Accounting Economics, 29
[2] Burgstahler, D., Hail, L., Leuz, C., (2006), The Importance of Reporting Incentives: Earnings Management in European Private and Public Firms, The Accounting Review, Vol. 81, No.5
[3] Gray S.J., (1980), The Impact of International Accounting Differences from a Security-Analysis Perspective: Some European Evidence, Journal of Accounting Research, 18
[4] Leuz, C., Nanda, D., Wysocki, P.D., (2003), Earnings management and investor protection: an international comparison, Journal of Financial Economics, 69 (3)
[5] Nobes, C., Parker, R., (2008), Comparative international accounting, 10th edition, Prentice Hall [6] Nobes, C.W., (1998), The future shape of harmonization: Some responses, European Accounting Review, 7 (2) [7] Radebaugh, L.H., Gray, S.J., Black, E.L., (2006), International accounting and multinational enterprises, 6th Edition, John Wiley & Sons [8] Saudagaran, S.M., (2004), International accounting – a user perspective, 2nd edition, South-Western [9] Zarzeski, (1996), Spontaneous harmonization effects of culture and market forces on accounting disclosure practices, Accounting Horizons,
(serial on Internet)

96
[10] Barth, M., Konchitchki Y. & Landsman W. (2013). Cost of capital and earning transparency.Journal of Accounting and Economics. Vol. 55, pp. 206-224.
[11] Bartov, E. &Bodnar, G. (1996). Alternative accounting methods, information asymmetry and liquidity. The Accounting Review. Vol. 71, No. 3, pр. 397-418.
[12] Gelb, D. (2000). Managerial Ownership and Accounting Disclosures: An EmpiricalStudy. Review of Quantative Finance and Accounting,Nо 15, pр. 169-185.
97
Supply Chain Integration and Performance Relationship Mehtap DURSUN a*, Zeynep SENERb, Guray GUMUSc
a Galatasaray University, Industrial Engineering Department, Istanbul, Turkey, [email protected] b Galatasaray University, Industrial Engineering Department, Istanbul, Turkey, [email protected]
c Istanbul Naval Shipyard, Istanbul, Turkey, [email protected]
Abstract
This study extends prior supply chain research by focusing on the body of supply chain integration (SCI) for defense industry. Internal integration, supplier integration, and customer integration’s interactions between four dimensions of operational performance (delivery, production cost, product quality, production flexibility) studied. The contingency effects of environmental uncertainty couldn’t observe because of the criteria of uncertainties are distinctive for defense industry. The survey responses collected from 10 different people from shipyard who are experienced at least 6 years. Their points mean, standard deviations and variance are used to form correlation matrix. It is efficient implementation to analyze relationships among all variables. Indication of maximum and minimum points shows the weak and strong form of SCI to improve. This paper contributes to start SCI approach for defense industry.
Keywords: Operational performance, supply chain integration, supply chain management
1. INTRODUCTION
A supply chain is defined as a network within an organization or between multiple organizations that involves the procurement of raw materials, conversion from raw materials to final products, and distribution of final products to markets [1]. A supply chain involves the flow of products, finances and information. Trends of increased market competition, rising costs, and increased globalization of manufacturing, supply and distribution, all contribute to the ever increasing importance of effective supply chain management to reduce costs, maintain acceptable service levels and mitigate uncertainty. This motivates the development of quantitative and systematic approaches for supply chain operation and design, and that recognize the supply chain as integrated system of components and decision levels [2].
Supply chain management (SCM) is the process of planning, implementing and controlling the operations of the supply chain in an efficient way. SCM spans all movements and storage of raw materials, work-in-process inventory, and finished goods from the point-of-origin to the point of consumption [3]. Part of the planning processes in SCM aims at finding the best possible supply chain configuration.
A supply chain network is supposed to be in use for a considerable time during which many parameters can change. If a probabilistic behavior is associated with the uncertain parameters (either by using probability distributions or by considering a set of discrete scenarios each of which with some subjective probability of occurrence), then a stochastic model may be the most appropriate for this situation. Another modeling possibility arises when some parameters change over time in a predictable way (e.g., demand levels and costs). In this case, if forecasts for the unknown parameters are known, they can be included in the model to obtain a network design that can cope with these future changes [4,5].
Economic globalization has created new opportunities for companies to grow their businesses by marketing their products and offering their services all over the world. As a consequence of this development, models for the strategic design of international supply chains have gained increasing importance. Such models address global features common to an international scenario in which the business activities of a company are geographically dispersed throughout multiple countries. Cohen and Malik [6]. Stress in their review that coordination of activities
* Corresponding author
98
and flexibility in responding to changing market conditions are crucial elements for global supply chains. Recently, Meixell and Gargeya [7] evaluated the appropriateness of existing models to support global SCND decisions.
2. Supply Chain Integration
The current trend towards globalization has not only provided companies with various opportunities, but also a number of challenges. On a global basis, companies have established warehouse facilities, production plants and distribution centers across countries for various reasons, such as cost advantages, Access to raw material sources or specialist skills and capabilities [8]. However, globalizing supply chains also result s in many challenges, that may include, increased complexity and various associated risks. Companies have been managing supply chain complexity through tightly integrated supply chains [9]. Supply chain integration (SCI) can be defined as the extent to which a company strategically interconnects sand aligns its supply chain with its partners, upstream and downstream [10].
It is generally accepted that tighter integration leads to improved performance. Integrating supply chain processes with customers and suppliers enables companies to improve and streamline information and data exchange, which may lead to the improvement of product and material flows throughout the supply chain [11]. In addition, SCI may enable companies to access various resources and capabilities in the form of knowledge embedded within other supply chain members and subsequently increase a company's innovativeness.
Whilst the general consent is that SCI leads to improved performance, some studies have failed to show this link [12]. During the recent years, a contingency view of SCI has been adopted, showing that the relationship between integration and performance depends on different contingency factors. Most of the studies have considered contingency factors at the firm level, such as product complexity, complexity of business conditions, uncertainty. Recently, [13] extended the SCI literature including country-level factors, such as the country's logistical capabilities.
Researchers have long articulated the need for a close, integrated relationship between manufacturers and their supply chain partners [14]. However, only recently has there been a call for a systematic approach to supply chain integration (SCI), as increasingly global competition has caused organizations to rethink the need for cooperative, mutually beneficial supply chain partnerships and the joint improvement of inter-organizational processes has become a high priority.
The existing research on SCI, however, is characterized by evolving definitions and dimensions [15]. While some focuses on the individual dimensions of SCI, in particular customer and supplier integration, others use various omnibus definitions [16], examining SCI as a single construct. In addition, many conceptualizations of SCI are incomplete, leaving out the important central link of internal integration.
These incomplete and evolving conceptualizations have led to inconsistent findings about the relationship between SCI and performance. In order to fully understand SCI and its relationship to performance, there is a need to examine both how individual dimensions of SCI are related to different dimensions of performance, as well as how patterns of SCI are related to different dimensions of performance. This suggests taking both a contingency and a configuration approach to studying SCI, echoing the appeal of Harland [17]. In particular, it is important to apply both approaches within a single study, in order to determine whether the findings are due to the relationship between SCI and performance or are an artifact of the data collection and survey design.
This study collapsed SCI construct into three dimensions: customer, supplier and internal integration, to reflect its multidimensionality [18]. Internal integration is defined as the strategic system of cross functioning and collective responsibility across functions [19], where collaboration across product design, procurement, production, sales and distribution functions takes place to meet customer requirements at a low total system cost. Internal integration efforts break down functional barriers and facilitate sharing of real-time information across key functions [20].
External integration comprises supplier and customer integration. Supplier integration involves strategic joint collaboration between a focal firm and its suppliers in managing cross-firm business processes, including information sharing, strategic partnership, collaboration in planning, joint product development, and so forth. Likewise, customer integration involves strategic information sharing and collaboration between a focal firm and its customers, which aim to improve visibility and enable joint planning [21]. Customer integration enables a deeper understanding of market expectations and opportunities, which contributes to a more accurate and quicker response to customer needs and requirements by matching supply with demand [22].
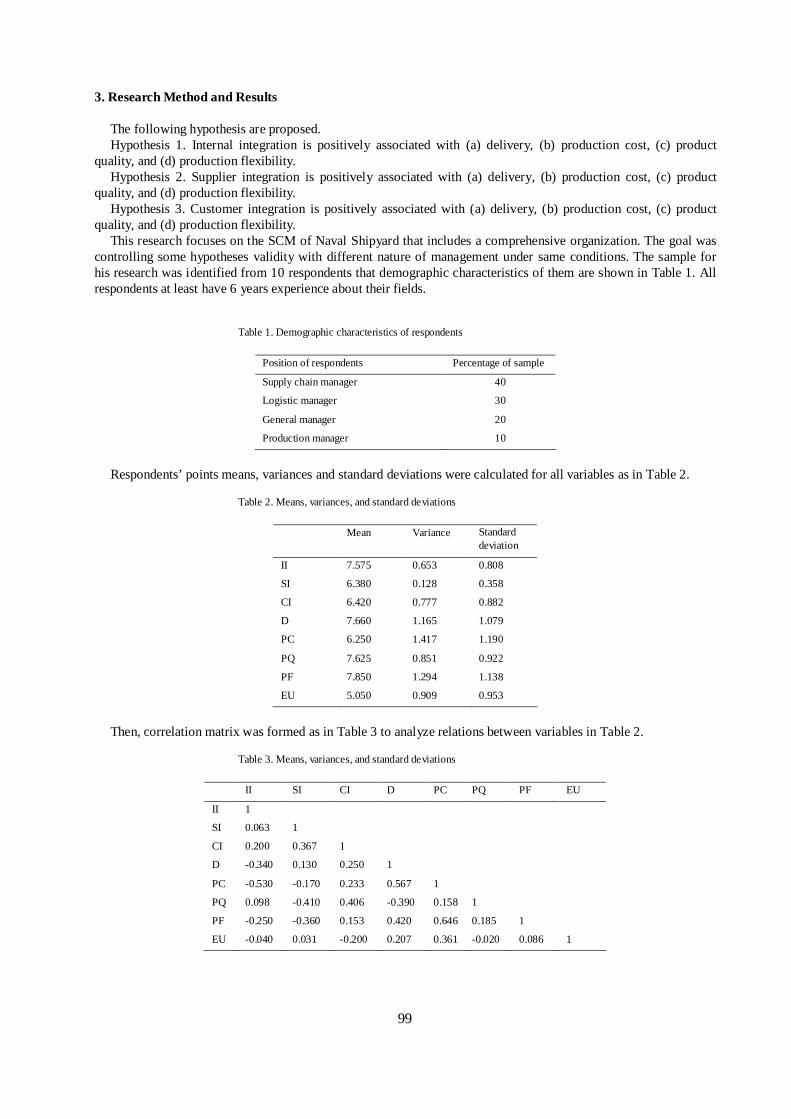
99
3. Research Method and Results
The following hypothesis are proposed. Hypothesis 1. Internal integration is positively associated with (a) delivery, (b) production cost, (c) product
quality, and (d) production flexibility. Hypothesis 2. Supplier integration is positively associated with (a) delivery, (b) production cost, (c) product
quality, and (d) production flexibility. Hypothesis 3. Customer integration is positively associated with (a) delivery, (b) production cost, (c) product
quality, and (d) production flexibility. This research focuses on the SCM of Naval Shipyard that includes a comprehensive organization. The goal was
controlling some hypotheses validity with different nature of management under same conditions. The sample for his research was identified from 10 respondents that demographic characteristics of them are shown in Table 1. All respondents at least have 6 years experience about their fields.
Table 1. Demographic characteristics of respondents
Position of respondents Percentage of sample
Supply chain manager 40
Logistic manager 30
General manager 20
Production manager 10
Respondents’ points means, variances and standard deviations were calculated for all variables as in Table 2.
Table 2. Means, variances, and standard deviations
Mean Variance Standard deviation
II 7.575 0.653 0.808
SI 6.380 0.128 0.358
CI 6.420 0.777 0.882
D 7.660 1.165 1.079
PC 6.250 1.417 1.190
PQ 7.625 0.851 0.922
PF 7.850 1.294 1.138
EU 5.050 0.909 0.953
Then, correlation matrix was formed as in Table 3 to analyze relations between variables in Table 2.
Table 3. Means, variances, and standard deviations
II SI CI D PC PQ PF EU
II 1
SI 0.063 1
CI 0.200 0.367 1
D -0.340 0.130 0.250 1
PC -0.530 -0.170 0.233 0.567 1
PQ 0.098 -0.410 0.406 -0.390 0.158 1
PF -0.250 -0.360 0.153 0.420 0.646 0.185 1
EU -0.040 0.031 -0.200 0.207 0.361 -0.020 0.086 1
100
Hypothesis 1. Internal integration is positively associated with (a) delivery, (b) production cost, (c) product quality, and (d) production flexibility.
According to correlation matrix only product quality is positively associated with Internal integration. These results doesn’t support hypothesis 1.
Hypothesis 2. Supplier integration is positively associated with (a) delivery, (b) production cost, (c) product quality, and (d) production flexibility.
According to correlation matrix only delivery is positively associated with Supplier integration. These results doesn’t support hypothesis 2.
Hypothesis 3. Customer integration is positively associated with (a) delivery, (b) production cost, (c) product quality, and (d) production flexibility.
According to correlation matrix all variables are positively associated with Supplier integration. These results support hypothesis 3.
When we analyze correlation matrix, PC and PF relation is the strongest with same directions. SI and PQ relation is the strongest with different direction.
4. Conclusions and Future Research Directions
Today’s world local uncertainties affect other countries. Therefore, decision makers have short time to decide. But we can use these fast effects positively for DMs. How? We can specify some uncertainties (For example economic uncertainties for Greece, political uncertainties for Turkey, geopolitical uncertainties for Iraq) and we can observe SCI and it is effects. The data were only collected from Istanbul Naval Shipyard. Future research can broaden other Naval Shipyard. The findings of the study extend the SCI literature by indicating the importance of SCI practices across naval SCM. This study shows that all variables especially environmental uncertainty should conceptualize according to national and international defense policy and organizations of navy. For example laws join the supply chain problem with lots of disadvantages. Therefore all conception of supplier and customer integration are changing. Different organizational structure, targets and risk perception cause different SCM and SCI approaches.
Acknowledgements
This work has been financially supported by Galatasaray University Research Fund under Grant 15.402.011.
References
[1] Simchi-Levi, D, Kaminsky, P, & Simchi-Levi E. (2003). Designing and managing the supply chain: concepts, strategies, and case studies (2nd ed.) McGraw-Hill.
[2] Grossmann, I. E. (2005). Enterprise-wide optimization: a new frontier in process systems engineering. AIChE J, 5, 1846-57. [3] Oliver, R. K. & Webber, M. D. (1982). Supply-chain management: logistics catches up with strategy. Logistics: The strategic issues.
London: Chapman & Hall. [4] Dogan, K. & Goetschalckx, M. (1999). A primal decomposition method for the integrated design of multi-period production–distribution
systems. IEEE Transactions, 31, 1027-1036. [5] Gunnarsson, H. Rönnqvist, M. & Lundgren, J.T. (2004). Supply chain modelling of forest fuel. European Journal of Operational Research,
158(1), 103-123. [6] Cohen, M. A. & Mallik, S. (1997). Global supply chains: Research and applications. Production and Operations Management, 6 (3), 193-
210. [7] Meixell, M. J. & Gargeya, V. B. (2005). Global supply chain design: A literature review and critique. Transportation Research Part E:
Logistics and Transportation Review, 41(6), 531-550. [8] Choi, K., Narasimhan,R., & Kim,S. W. (2012).Postponement strategy for international transfer of products in a global supply chain: a
system dynamics examination. J. Oper.Manag, 30(3), 167-179. [9] Chopra,S., & Sodhi, M. S. (2004). Managing risk to avoid supply chain break down. Sloan Manag. Rev., 46(1), 53-62. [10] Jayaram, J., Tan, K. C., & Nachiappan, S. P. (2010). Examining the interrelationships between supply chain integration scope and supply
chain management efforts. Int. J.Prod.Res., 48(22), 6837-6857. [11] Tucker, L. R. (1951). A method for synthesis of factor analysis studies. Personnel Research Section Report No. 984. Department of the
Army, Washington, DC. [12] Schoenherr, T., & Narasimhan, R. (2012). The fit between capabilities and priorities and its impact to performance improvement: revisiting
and extending the theory of production competence. Int.J.Prod.Res., 50(14), 3755-3775. [13] Wiengarten, F., Pagell, M., Ahmed, M. U., & Gimenez, C. (2014). Do a country's logistical capabilities moderate the external integration
performance relationship. J. Oper.Manag., 32(1), 51-63.

101
[14] Lambert, D. M., Robeson, J. F., & Stock, J. R. (1978). An appraisal of the integrated physical distribution management concept. International Journal of Physical Distribution and Materials Management, 9(1), 74-88.
[15] Lambert, D. M., & Cooper, M. C. (2000). Issues in supply chain management. Industrial Marketing Management, 29(1), 65-83. [16] Van der Vaart, T., & Van Donk, D. (2008). A critical review on survey-based research in supply chain integration. International Journal of
Production Economics, 111(1), 42-55. [17] Armistead, C. G., & Mapes, J. (1993). The impact of supply chain integration on operating performance. Logistics Information Management,
6(4), 9-14. [18] Devaraj, S., Krajewski, L., & Wei, J. C. (2007). Impact of e-business technologies on operational performance: the role of production
information in the supply chain. Journal of Operations Management, 25(6), 1199-1216. [19] Harland, C. M., Caldwell, N. D., Powell, P., & Zheng, J. (2007). Barriers to supply chain information integration: SMEs adrift of eLands.
Journal of Operations Management, 25(6), 1234-1254. [20] Flynn, B. B., Huo, B., & Zhao, X. (2010). The impact of supply chain integration on performance:a contingency and configuration approach.
Journal of Operations Management, 28, 58-71. [21] Follett, M. P. (1993). Freedom and Coordination: Lectures in Business Organization 1968–1933. Garland Publishing, New York.
(originally published in 1949). [22] Wong, C. Y., El-Beheiry, M. M., Johansen, J., & Hvolby, H. H. (2007). The implications of information sharing on bullwhip effects in a toy
supply chain. International Journal of Risk Assessment and Management, 7(1), 4-18.


![[2021] 45 IAC 3.1 Adjusted Gross Income Tax - IN.gov](https://static.fdokumen.com/doc/165x107/631ecbe61aedb9cd850feba1/2021-45-iac-31-adjusted-gross-income-tax-ingov.jpg)