PROCEEDING E - ISBN: 978-625-44427-2-8 - TICMET
562
1 The International Conference of Materials and Engineering Technology (TICMET’20) -------------------------------------------------------------------------- November 05-07, 2020 Gaziantep/TURKEY PROCEEDING E - ISBN: 978-625-44427-2-8
-
Upload
khangminh22 -
Category
Documents
-
view
1 -
download
0
Transcript of PROCEEDING E - ISBN: 978-625-44427-2-8 - TICMET

1
The International Conference of Materials and Engineering Technology (TICMET’20)
-------------------------------------------------------------------------- November 05-07, 2020 Gaziantep/TURKEY
PROC
EEDI
NG
E - ISBN: 978-625-44427-2-8

CONFERENCE OBJECTIVE
The International Conference of Materials and Engineering Technology (TICMET'20) will be held at
Gaziantep University on 05-07 November 2020.
The main purpose of TICMET is to present the latest research and results of scientists related to Computer Science, Electrical and Electronics, Energy Technologies, Materials Science, Manufacturing Technologies, Mechatronics and Biomedical Technologies. This conference provides different field
delegates with opportunities to exchange new ideas and application experiences, build business or
research relationships, and find global partners for future collaboration. In addition, due to Covid-19 that shook the world, in addition to face-to-face sessions, ONLINE presentation will be provided to our
participants. After this science feast, your full texts will be published in congress books with ISBNs and
will be brought to the world science literature with open access and significant contributions will be made to the scientific field.
Webinars will be used in online presentations and will be broadcast live. All participants will be able to
ask questions to be answered in the presentations. In the event that more than one session takes place
at the same time, it will be possible to follow from parallel rooms.
The conference organizing committee is pleased to invite prospective authors to send their
original texts to TICMET.
All papers are reviewed and evaluated by the referees in the field, based on their technical and / or research content / depth, accuracy, relevance to the conference, contributions and readability.
Selected papers presented face to face or online at the conference will be published in one of
the following journals:
International Journal of Materials and Engineering Technologies (TIJMET) (Dergipark) El-Cezeri Journal of Science and Engineering (TR Directory)
PROGRAM COMMITEES
Honorary Chair
Prof. Dr. Arif Ozaydin, Gaziantep University – TR
Chair
Prof. Dr. Necip Fazil Yilmaz, Gaziantep University – TR
Organizing Committee
Prof Dr Necip Fazil Yilmaz, Gaziantep University - TR
Assoc Prof Dr Halil Ibrahim Kurt, Gaziantep University - TR
Prof Dr Adem Kurt, Gazi University - TR
Prof Dr Ali Riza Yildiz, Uludag University - TR
Prof. Dr. Metin Bedir, Gaziantep University - TR
Prof Dr Murat Oduncuoglu, Gaziantep University - TR
Prof. Dr. Mustafa Bakkal, Istanbul Technical University - TR
Lect Aykut Bilici, Gaziantep University – TR

Scientific Committee (National Committee)
Prof. Dr. Abdulkadir Eksi, Cukurova University - TR
Prof Dr Ali Gursel, Duzce University - TR
Prof Dr Ismail Saritas, Selcuk University - TR
Prof. Dr. Mehmet Cengiz Kayacan, Süleyman Demirel University - TR
Prof Dr Mete Kalyoncu, Konya Technical University - TR
Prof. Dr. Mustafa Bakkal, Istanbul Technical University - TR
Prof. Dr. Mustafa Cigdem, Yildiz Technical University - TR
Prof. Dr. Oguzhan Yilmaz, Gazi University - TR
Prof. Dr. Omer Eyercioglu, Gaziantep University - TR
Prof Dr Rahmi Unal, Gazi University - TR
Prof. Dr. Serdar Salman, National Defense University - TR
Prof. Dr. Suleyman Can Kurnaz, Sakarya University - TR
Prof Dr Ugur Cem Hasar, Gaziantep University - TR
Prof. Dr. Yahya Bozkurt, Marmara University - TR
Assist Prof Dr Ali Yasar, Selcuk University - TR
Assist Prof Dr Aziz Baris Basyigit, Kirikkale University - TR
Assist Prof Dr Ilker Ali Ozkan, Selcuk University - TR
Assist Prof Dr Murat Koklu, Selcuk University - TR
Assist Prof Dr Yusuf Yilmaz, Gaziantep University - TR
Dr. Engin Ergul, Dokuz Eylul University - TR
Scientific Committee (International Committee)
Prof Dr Andrey Tsarkov, Moscow State Technical University - RU
Prof. Dr. Bekir Sami Yilbas, King Fahd University of Petroleum and Minerals - SA
Prof Dr Fabienne Delaunois, University Of Mons - BE
Prof Dr Hazman Seli, University Of Sains Malaysia - MY
Prof Dr Heiba Zein, Ain Shams University - EG
Prof Dr Marwan K Khraisheh, Hamad Bin Khalifa University - QA
Prof. Dr. Mohamed Elsayed Yahia, International University of Sarajevo - BA
Prof. Dr. Muammer Koç, Hamad Bin Khalifa University - QA
Prof. Dr. Ramazan Asmatulu, Wichita State University - US

Prof. Dr. Senay Simsek, North Dakota State University - US
Prof Dr Tai Cheng Chen, Institute Of Nuclear Energy Research Iner - TW
Prof Dr Vincent Ji, University Of Paris Sud - FR
Prof Dr Yousef Haik, Hamad Bin Khalifa University Hbku - QA
Prof. Dr. Yusuf Ozturk, San Diego State University - US
Prof Dr Zakaria Boumerzoug, University Of Biskra - DZ
Assoc Prof Dr Ahmad Azmin Mohamad, University Of Sains Malaysia - MY
Assoc. Prof. Dr. Mehmet Emin Aydin, UWE Bristol - GB
Assoc Prof Dr Mikhail E Semenov, Tomsk Polytechnic University - RU
Assist Prof Dr Faten Adel Ismael Chaqmaqchee, Koya University - IQ
Assist Prof Dr Nurettin Sezer, Hamad Bin Khalifa University Hbku - QA
Assist Prof Dr Sami G Al Ghamdi, Hamad Bin Khalifa University Hbku - QA
Assist Prof Dr Shoukat Alim Khan, Hamad Bin Khalifa University Hbku - QA
Assist Prof Dr Yusuf Bicer, Hamad Bin Khalifa University Hbku - QA
Dr Abdessalem Bouferrouk, University Of The West Of England - GB
Dr. Fahmi Fariq Muhammad, Koya University - IQ
Dr Mazhar Malik, University Of The West Of England - GB
Dr Mirza Nadeem Baig, Pakistan Welding Institute - PK
Dr. Mohammad Ghaffar Faraj, Koya University - IQ
Dr Peter Kay, University Of The West Of England - GB
Dr Sabir Ghauri, University Of The West Of England - GB
Dr Shahroz Sakhawat, Pakistan Welding Institute - PK

INVITED SPEAKERS
He was born in 1958
B.S., Gazi University,Faculty,1983
MsC,Gazi University Graduate School of Natural and Applied Sciences is
Gazi University ,1992
PhD, Firat University Graduate School of Natural and Applied Sciences is
Gazi University,1996
Asist Prof. at Gazi University Technical Education Faculty,1997
Assoc. Prof. at Gazi University Technical Education Faculty,1999
Full Prof. at Gazi University Technical Education Faculty,2005
Full Prof. at Gazi University Technologycal Faculty, Metallurgycal and Materials Eng. Dep. 2011-...
He Founed Turkish Welding Society in 2001 ( President of Welding Technology Society since 2001)
He founded Center for Welding and Joining Technologies in Gazi University (Director science 2013)
He has 5 book about welding Technologies and has more than hundered international published
article.
He is organising periodically ever twoo year International Conference on Welding Technologies and
Exhibition (ICWET).
Undergraduate:
1st Oct 1984 - 30th Jun 1988 - Aberdeen University, Scotland
Postgraduate:
1st Sep 1988 - 30th Jun 1994 - University of Western Ontario, Canada
AWARDS AND SCHOLARSHIPS:
Undergraduate:
Coutts Prize for Chemistry in 1985-86 & 86-87.
Forbes Prize for Physical Chemistry in 1987-88.
Postgraduate:
Ontario International Fee Waiver 1988-1994.
WORK EXPERIENCE:
* 1st Jul 1994 - 31st Mar 1997
Postdoctoral Fellow - University of Western Ontario (Prof. Martin J. Stillman)
* 1st Apr 1997 - 31st Mar 1999
Research Associate - University of Western Ontario (Prof. Emeritus J. R. Bolton)
* 1st Apr 1999 - 12th Oct 2004
Research Associate - University of Western Ontario (Prof. Martin J. Stillman)
RESEARCH EXPERIENCE:
MCD spectroscopy, Theoretical calculations,Electrochemistry,Photochemistry, CD spectroscopy,
Emission spectroscopy, EPR spectroscopy, Software Development, Analytical Chemistry.

i
CONTENTS
VERİ MADENCİLİĞİ YÖNTEMLERİ İLE TAM KAN SAYIMI SONUÇLARINDAN COVID-19
TEST SONUÇLARININ TAHMİNİ AYBÜKE BOZKURT, AYŞE MERVE ACILAR 1
MESLEKİ VE TEKNİK EĞİTİM KURUMLARINDA UYGULANAN ÖZDEĞERLENDİRME
VERİLERİNİN ANALİZİ HÜSEYİN ERÇİN, AYŞE MERVE ACILAR 7
WHAT IS THE POSSIBILITY OF USING METAL COMPLEXES OF PHENANTHROLINE IN
DYE-SENSITIZED SOLAR CELLS? KAYODE SANUSI, YUSUF YILMAZ 15
EFFECTS OF SUBSTITUENTS ON THE ELECTRONIC PROPERTIES OF SELECTED
PORPHYRINOID SYSTEMS FOR DYE-SENSITIZED SOLAR CELLS (DSSCS) YUSUF YILMAZ, KAYODE SANUSI 20
WIDE BAND METAMATERIAL ABSORBER WITH LUMPED ELEMENT
HÜSEYİN KORKMAZ, UĞUR CEM HASAR 25
CAM LAMİNAT ALÜMİNYUM TAKVİYELİ EPOKSİNİN (GLARE) ÖZEL GEOMETRİLİ
MATKAPLARLA DELİNMESİ: DELAMİNASYON FAKTÖRÜ ÜZERİNE BİR ÇALIŞMA ALİ RİZA MOTORCU, ERGÜN EKİCİ, ENSAR YILDIRIM 32
CFRP/Al2024 METALİK YIĞINLARIN FARKLI GEOMETRİLİ MATKAPLARLA
DELİNMESİNDE DELAMİNASYON FAKTÖRÜNÜN OPTİMİZASYONU
ERGÜN EKİCİ, ALİ RİZA MOTORCU 45
LASER POLISHING APPLICATIONS ON THE SURFACE OF THE TI-6AL-4V PART
PRODUCED BY ADDITIVE MANUFACTURING SAFAK NESLI, OGUZHAN YILMAZ 54
SINGLE BEAD PROPERTY OF SHORT FIBER CARBON REINFORCED ABS COMPOSITES
PRODUCED WITH LARGE SCALE ADDITIVE MANUFACTURING (LSAM) OMER EYERCIOGLU, ENGIN TEK, MEHMET ALADAG 60
OVERVIEW ON HIP JOINT FORGING TECHNOLOGY OF TI ALLOYS
OMER EYERCIOGLU, AHMAD LUTFI MANLA 67

ii
BEHAVIOUR OF ALUMINUM ALLOYS UNDER THE NORMAL AND OBLIQUE BALLISTIC
LOADS MUHAMMET DENİZ, EYÜP YETER, MEHMET HANİFİ DOĞRU, EDİP ÖZTÜRK 77
MODELLING AND SIMULATION OF ELASTIC PENDULUM
EDIP OZTURK, BURAK SAHIN, KURSAD GOV 88
INVESTIGATION OF THE EFFECT OF PARAMETERS ON KERF ANGLE AND SURFACE
QUALITY OF PLASMA ARC CUTTING NECİP FAZIL YILMAZ, AHMET YAREN YAROĞLU, MAHMUT FURKAN KALKAN, HALİL
İBRAHİM KURT 97
GEZER KÖPRÜLÜ VİNÇ KONSTRÜKSİYONUNUN ARI ALGORİTMASI KULLANILARAK
OPTİMUM TASARIMI SAMİ YEŞİLBEL, MAHMUT ÇİMEN, METE KALYONCU 104
MODELLING AND SIMULATION OF SPHERICAL FLIGHT SIMULATOR UNDER STATIC
LOADING EDIP OZTURK, BURAK SAHIN, KURSAD GOV 118
ANALYSIS OF CONCEPT UNMANNED AERIAL VEHICLE
IN TERMS OF WING ANGLE RESUL DEMİR, MEHMET HANİFİ DOĞRU, EDİP ÖZTÜRK 129
COMPUTER SIMULATION OF A NEW METHOD APPLIED TO PREVENT WELD DECAY IN
TIG WELDING MAHMUT FURKAN KALKAN, MUSA YILMAZ, NECİP FAZIL YILMAZ 144
PRODUCTION OF COPPER ADDED IRON MATRIX FUNCTIONAL GRADED MATERIALS
BY POWDER METALLURGY METHOD AND INVESTIGATION OF THEIR MECHANICAL
PROPERTIES MEHMET YILDIRIM, ENVER ATIK 150
INVESTIGATION OF MATERIAL SURFACE QUALITY IN DRY AND WATER-ASSISTED
CUTTING WITH FIBER LASER MUHAMMED PAKSOY, MAHMUT FURKAN KALKAN, NECİP FAZIL YILMAZ, HAKAN
ÇANDAR 161
THERMOMECHANICAL SIMULATION ANALYSIS OF INCONEL 718 ALLOY PARTS
PRODUCED BY ADDITIVE MANUFACTURING MUSTAFA KAS, OGUZHAN YILMAZ, CAN GULER, TANER KARAGOZ, METIN CALLI 166

iii
VALIDATION OF MATERIAL MODEL AND MECHANISM OF MATERIAL REMOVAL IN
ABRASIVE FLOW MACHINING ADEM AKSOY, OMER EYERCİOGLU, KURSAD GOV 176
A STUDY OF RESIDUAL STRESS MEASUREMENT OF AEROSPACE MATERIALS
BURAK SAHIN, KURSAD GOV 186
ADDITIVE MANUFACTURING OF CONTINUOUS FIBER-REINFORCED COMPOSITES
WITH HIGH MECHANICAL PROPERTIES FROM PLA THERMOPLASTIC RESIN BY FUSED
DEPOSITION METHOD RECEP GUMRUK, ALTUG USUN 196
EFFECT OF NANO-SILICA ON THE IMPACT ENERGY OF SELF-COMPACTING
GEOPOLYMER CONCRETE NECİP ALTAY EREN, ABDULKADİR CEVİK, RADHWAN ALZEEBAREE 204
USE OF WASTE MATERIALS IN SOIL IMPROVEMENT
AKTAN ÖZSOY, ALİ FIRAT ÇABALAR 208
GEOMETRIC OPTIMIZATION OF A RIGHT ANGLE BRACKET TO MAXIMIZE THE
FATIGUE LIFE USING TAGUCHI METHOD MEHMET SEFA GÜMÜŞ, METE KALYONCU, VEYSEL ALVER 213
ENERGY AND EXERGY ANALYSIS OF A FLUIDIZED BED SEWAGE SLUDGE
INCINERATION PLANT AYŞEGÜL ABUŞOĞLU, N. SUAT ATAY, ALPEREN TOZLU 219
A COMPARATIVE STUDY ON NUMERICAL AND EXPERIMENTAL ANALYSES OF A 3-D
SPOUTED BED EMRAH ÖZAHİ, ARİF ÇUTAY, ALPEREN TOZLU 229
INVESTIGATION ON THE EFFECT OF ECAP PROCESS FOR GRAPHENE REINFORCED
COPPER MATRIX NANOCOMPOSITES ÖNER KAĞAN ÖZER, HASAN SAFA, ÖMER GÜLER, ÖYKÜM BAŞGÖZ, ERTAN EVİN 238
HARD ANODIC OXIDATION OF A356 ALUMINUM ALLOY
AZİZ BARIŞ BAŞYİĞİT, HALİL İBRAHİM KURT 243
ZINC BASED ALLOY OXIDE FORMED BY THERMAL OXIDATION FOR ENERGY
MATERIALS ABDULCABBAR YAVUZ 249

iv
SYNTHESIZING AND WELDING OF ALUMINUM COMPOSITE WAFA MELIK, ZAKARIA BOUMERZOUG, FABIENNE DELAUNOIS 257
ALÜMİNYUM MATRİSLİ KOMPOZİTLERDE ISIL İŞLEMİN AŞINMA AĞIRLIK KAYBINA
ETKİSİ ENGİN ERGÜL, HALİL İBRAHİM KURT, MURAT ODUNCUOĞLU, CAN ÇİVİ, GÖKHAN EYİCİ
264
INTERPRETATION OF PHOTOCATALYTIC PERFORMANCE AND PROTEIN
ADSORBANCE OF POLYCAPROLACTONE - POTASSIUM TITANATE HYBRIDS
TARIK NEYAL, DERYA KAPUSUZ, NECİP FAZIL YILMAZ 269
A DAILY DIET PLANNING FOR DIABET PATIENTS
SERAP ULUSAM SEÇKİNER, ESRA CEYLAN 274
THE CORROSION EFFECT of CuO and ZnO FORMATIONS ON BRASS SURFACE
ABDULCABBAR YAVUZ, NECİP FAZIL YILMAZ, MAHMUT FURKAN KALKAN 292
EFFECT OF CEMENT BASED GROUT ON DIFFERENT WATER/CEMENT RATIOS ON UNIT
SOCKET RESISTANCE FOR GAZİANTEP BASALT STONE MUHAMMET ÇINAR, HASAN BOZKURT 300
INVESTIGATION OF MAGNETIC PROPERTIES OF STRONTIUM HEXAFERRITE
PRODUCED BY MECHANOCHEMICAL SYTHESIS KÜRŞAT İÇİN, DAMLA DİLARA ÇAKIL, FURKAN ALPTEKİN, SULTAN ÖZTÜRK 308
MODELLING OF ENERGY EFFICIENCY IN ELECTRIC MOTORS USING THE FINITE-
ELEMENT METHOD NECİP FAZIL YILMAZ, MUHAMMET YUSUF DULKADİR, MUSA YILMAZ, MAHMUT FURKAN
KALKAN 322
EROSIVE WEAR PERFORMANCE of Ti6Al4V COATED with MICRO ARC OXIDATION and
ELECTRO SPARK DEPOSITION DOĞAN ACAR, SALİM LEVENT AKTUĞ, KEMAL KORKMAZ, SALİH DURDU, ÖMER NECATİ
CORA 328
ZnO NANOSTRUCTURE REINFORCED DENTAL COMPOSITES
ILKNUR TAS, DERYA KAPUSUZ 336
STRUCTURE AND PROPERTIES OF CuAl10Ni5Fe4 ALLOY POWDERS PRODUCED BY
MELT SPINNING COMPARED WITH INGOT SEFA EMRE SÜNBÜL, KÜRŞAT İÇİN, ABDURRAHİM METOĞLU, DAMLA DİLARA ÇAKIL,
FURKAN ALPTEKİN, SULTAN ÖZTÜRK 347
v
SINTERING OF IRON POWDERS BY RESISTANCE HEATING TECHNIQUE
ADEM KURT, FAHRETTİN ATAR 361
A STUDY OF NUMERICAL ANALYSIS ON ARC STUD WELDING NECİP FAZIL YILMAZ, SEVAL POLAT, MAHMUT FURKAN KALKAN, MUSA YILMAZ 367
INVESTIGATION OF THE HEAT AFFECTED ZONE BY THERMAL CYCLE SIMULATION
TECHNIQUE ZAKARIA BOUMERZOUG, FABIENNE DELAUNOIS, OUALID BEZIOU, INES HAMDI 373
EFFECTS OF BLEND RATIO AND SPINNING TECHNOLOGY ON TRIBOLOGICAL
PROPERTIES OF POLYESTER-REGENERATED CELLULOSIC FIBER BLENDED YARNS GONCA BALCI KILIC, GAYE KAYA, HATİCE NİDA CİVAN, HATİCE KÜBRA KAYNAK, OSMAN
YAYLA 382
INVESTIGATION OF THE EFFECT OF DIFFERENT BASIS WEIGHT, BLEND RATIO, AND
PATTERN ON PHYSICAL AND MECHANICAL PROPERTIES OF WET WIPES EBRU CELIKTEN, EYUP ALI SATIL, YUNUS AYCAN, TULIN KAYA NACARKAHYA 392
OPTIMIZATION OF YARN QUALITY PARAMETERS OF HEMP FIBER BLENDED YARNS
PRODUCED BY RING SPINNING SYSTEM EYÜP ALİ SATIL, EBRU ÇELİKTEN, KUBİLAY ÖZDEN, TÜLİN KAYA NACARKAHYA 402
VORTEKS EĞİRME SİSTEMİNDE FARKLI ÖZ VE SARGI LİFLERİNİN
KULLANILMASIYLA ELDE EDİLEN İPLİKLERİN KALİTE PARAMETRELERİNİN
İNCELENMESİ KUBİLAY ÖZDEN, EYÜP ALİ SATIL, HADİ SAMET MUMCU, HATİCE NİDA CİVAN, TÜLİN
KAYA NACARKAHYA 416
DESIGN OF NOVEL COMPACT THREE-ROVING SPINNING TECHNOLOGY MURAT DEMIR, MUSA KILIÇ, SERDAR SAYIN, ZEKI KIRAL, FURKAN BALDUK, KIYMET
KUBRA DENGE 428
FİTİL KULLANIMI İLE ÜRETİLEN İKİ İPLİK VE ÜÇ İPLİK ÖRME KUMAŞLARIN HAVA
GEÇİRGENLİĞİNİN İNCELENMESİ MUSTAFA GÜRKAN BEKAR, HATİCE KÜBRA KAYNAK, YASEMİN KORKMAZ 434
POLYESTER HAV İPLİKLERİNDE FİLAMENT İNCELİĞİNİN HALILARDA STATİK
YÜKLEME SONRASI REZİLYANS PERFORMANSINA ETKİSİNİN İNCELENMESİ GÜLBİN FİDAN, YASEMİN KORKMAZ, HALİL İBRAHİM ÇELİK 443

vi
KOMPOZİT MALZEMELERDE OLUŞTURULAN YAPAY KUSURLARIN ULTRASONİK C-
TARAMA TEKNİKLERI İLE TAHRİBATSIZ MUAYENESİ BURAK ÖZTAŞ, HALİL İBRAHİM ÇELİK, YASEMİN KORKMAZ 452
KOMPLEKS KOASERVASYON YÖNTEMİ İLE OKALİPTÜS YAĞI İÇEREN
MİKROKAPSÜLLER GELİŞTİRİLMESİ VE TEKSTİL YÜZEYLERİNE UYGULANMASI
ZEYNEP HAYTA BAŞKAN, GAYE KAYA 458
TEKSTİLDE ÜRÜN TASARIMINDA SÜRDÜRÜLEBİLİRLİK YAKLAŞIMI
(SUSTAINABILITY APPROACH IN PRODUCT DESIGN IN TEXTILE)
SEDA YAPICI SUNAÇ, ZÜLEYHA DEĞİRMENCİ 468
DÖNER KOLLU TEMASSIZ STREÇ SARMA MAKİNASI TASARIMI
NECİP FAZIL YILMAZ, ERSİN ÖZPOLAT, VEDAT TEMİZ 476
A LITERATURE REVIEW OF HYBRID WIRE-ARC ADDITIVE MANUFACTURING WAAM
TECHNOLOGY M.BAKIR AFFAN, OMER EYERCİOGLU 483
ZINC OXIDE BASED METAMATERIAL ABSORBER FOR SOLAR CELL APPLICATIONS
HÜSEYİN KORKMAZ, UĞUR CEM HASAR 496
AĞIR VASITA HAVA KOMPRESÖRLERİNDE PİSTON SEGMANLARINDAN YAĞ VERME
PROBLEMLERİNİN RASTGELE ORMAN ALGORİTMASI İLE TAHMİNİ EMRE GÜL, METE KALYONCU, GÖKSELHAN KULA 503
MODELING AND OPTIMUM PARAMETERS OF CO2 LASER MIG HYBRID WELDING
PROCES RECEP TÜRKOĞLU, LEVENT AYDIN, ELİF GÜLTÜRK 515
EFFECT OF BUILD ORIENTATION ON MECHANICAL PROPERTIES OF ADDITIVELY
MANUFACTURED Ti-6Al-4V PARTS AKIN DAĞKOLU, AHMET ALPTUĞ TANRIKULU, HAKAN YAVAŞ, OĞUZHAN YILMAZ 525
USING HARD TEMPLATE SYNTHESIZED HOLLOW SILICA NANOSPHERES VIA
ECONOMIC METHOD EDA DEMIR, ÖMER GÜLER, ÖYKÜM BAŞGÖZ, KAZIM BUĞRA GÜRBÜZ, SEVAL HALE GÜLER
535

vii
PERFORMANCE OF METALS CERAMIC AND CARBON BASED NANOFLUID IN
NUCLEATE POOL BOILING HEAT TRANSFER SHOUKAT ALIM KHAN, MUAMMER KOC, SAMI G AL GHAMDI 539
PRODUCTION OF METAL OXIDE NANOSTRUCTURES AS ELECTRODES FOR LITHIUM
ION BATTERIES EVREN EGESOY, OZLEM KAP, MESUT ER, AHMET ATAC, NESRİN HORZUM POLAT 540
SN IV PORPHYRINS FOR PHOTODYNAMIC THERAPY PROGRESS TO DATE AND FUTURE
PERSPECTIVES JOHN MACK, BALAJI BABU, SOMILA DINGISWAYO, RODAH SOY, MAURICIO BAPTISTA,
THIAGO TASSO, TEBELLO NYOKONG 541
EXPERIMENTAL AND THEORETICAL EXAMINATION OF MATERIAL PROPERTIES OF
LIGAMENT STRUCTURE ISMAİL HAKKI KORKMAZ 542
OBTAINING THE ADDITIVE MANUFACTURING PROCESS PARAMETERS USING
RESPONSE SURFACE BASED OPTIMIZATION METHOD FAHRI MURAT, IRFAN KAYMAZ, ABDULLAH TAHIR SENSOY, ISMAIL HAKKI KORKMAZ
543
HIJYEN URUNLERINDE KULLANIMA UYGUN POLIOLEFIN VE AMORF
POLYALFAOLEFIN APAO BAZLI SICAKTA ERIYEN BASINCA DUYARLI VE DARBEYI
ABSORPLAYABILEN TUTKAL GELISTIRILMESI CELAL SOYLEMEZ 544
COMPARATIVE ANALYSIS OF THE SERVICES PROVIDED BY GSM OPERATORS WITH
MOBILE INTERNET IN TURKEY BUSRA SAVCILI, ALPTEKIN DURMUSOGLU 545
USING PSF METHOD TO FIND EXOPLANET CANDIDATES AROUND FAINT STARS
KAAN KAPLAN 546
CRITICAL REVIEW ON 3DP CONCRETE TRENDS NEEDS AND RESEARCH
RECOMMENDATIONS ANS AL RASHID, SHOUKAT ALIM KHAN, SAMI G AL GHAMDHI, MUAMMER KOC 547

VERİ MADENCİLİĞİ YÖNTEMLERİ İLE TAM KAN SAYIMI SONUÇLARINDAN COVID-19 TEST SONUÇLARININ TAHMİNİ
AYBÜKE BOZKURT *1, AYŞE MERVE ACILAR 2
*1Ostim Teknik Üniversitesi, Mühendislik Fakültesi, Yazılım Mühendisliği, Ankara, TÜRKİYE 2Necmettin Erbakan Üniversitesi, Mühendislik-Mimarlık Fakültesi, Bilgisayar Mühendisliği, Konya, TÜRKİYE
Özet
Yeni koronavirüs SARS-CoV-2, COVID-19 salgınının sebebi olmuştur. İlk kez 2019 yılında Çin’in Wuhan kentinde ortaya çıkmış ve küresel bir salgın haline gelerek bütün dünyayayayılmıştır. Soğuk algınlığı veya grip virüsleriyle benzer erken belirtileri sebebiyle insanlarda teşhisi zor olmuş ve vaka sayısı hızla artmıştır. Bu sebeple sağlık çalışanlarının ilk ve en önemli amacı virüsü erken teşhis edip vaka sayılarının önüne geçmek olmuştur. Bu çalışmadaki amaç, söz konusu hastalığın hızlı bir şekilde önüne geçip erken tanıda bulunabilmek için makine öğrenmesi algoritmalarından Destek Vektör Makineleri, Rastgele Orman ve Gaussian NaiveBayes sınıflandırma algoritmaları ile bireylerin yalnızca tam kan sayımlarını kullanarak COVID-19 pozitif hastalarını tahmin etmektir. Bu amaçla kullanılan veri seti Kaggle veri tabanından elde edilmiş ve algoritmaların performansları incelenmiştir.
Anahtar Kelimeler: COVID19, Destek Vektör Makineleri, NaiveBayes, Rastgele Orman, SARS-Cov-2
1. Girişİnsanoğlu geçmişten bugüne kadar birçok hastalıkla baş etmektedir. Bu hastalıkların bir kısmıkolayca geçebiliyorken bir kısmı ise tüm insanlığı etkileyecek şekilde büyüyüp yayılarak salgınhaline gelmiştir. Salgınlarla başa çıkabilmek için tüm dünyada seferberlik düzenlenmiş vesalgının bulaşıcılığını en aza indirerek etkisinden kurtulmak için aşı çalışmaları ve tedavi ediciyöntemler aranmıştır. 2019 yılının son zamanlarında ilk olarak Çin’in Wuhan kentindebaşlayarak ardından tüm dünyaya hızla yayılan yeni tip koronavirüs vakaları ortaya çıkmıştır.Dünya Sağlık Örgütü, başlangıçta bu virüsü 2019-nCoV olarak isimlendirmiş, ilerleyendönemlerde ise SARS-Cov-2 olarak adlandırmıştır [1].Virüsün neden olduğu bu hastalığa iseCOVID-19 (Coronavirüs Hastalığı 2019) adı verilmiştir. Ortaya çıktığı günden itibaren isehastalığın daha çok insana yayılması sebebiyle 11 Mart 2020 yılında Dünya Sağlık Örgütüpandemi ilan etmiştir [2].COVID-19 hastalığının en önemli belirtisi yüksek ateş ve kuru öksürükolup bu belirtiler genellikle iki ile on dört gün aralığında ortaya çıkmaktadır [3]. Belirtilerin gripveya soğuk algınlığı virüsleriyle benzer etkenler göstermesi hastalığın teşhis edilme süresiniarttırdığı için vaka sayıları hızla artmıştır.
Banerjee ve diğerleri, 2020 yılında SARS-CoV-2 virüsü ile ilgili tam kan sayımı sonuçlarını kullanarak Yapay Sinir Ağları algoritması ile bir sınıflandırma yapıp test sonuçlarının negatif ya
1

da pozitif olacağını tahmin etmeye çalışmışlardır. Yapay sinir ağları ile sınıflandırma sonucunda %90, Rastgele Orman ile sınıflandırma sonucunda ise %94 başarı elde etmişlerdir [4]. Başka bir literatürde ise, Yavaş, Güran ve Uysal 2020 yılında aynı veri setini kullanarak veri seti içindeki dengesizliği SMOTE ile dengeleyip Yapay Sinir Ağları ile sınıflandırma yaparak başarı oranlarını karşılaştırmıştır. Yapılan bu işlemler sonucunda %90 başarı oranı elde etmişlerdir [5]. Demircioğlu 2019 yılında, COVID-19 hastalığı kapsamında, 36 ülkenin sağlık verilerini değerlendirerek Türkiye’nin bu ülkeler arasındaki yerini kümeleme analizi ile belirlemeyeçalışmıştır [6]. Tekin 2020 yılında, COVID-19 pandemisi döneminde ülkelerin sağlık ve finansgöstergelerinin hiyerarşik kümeleme yöntemleri ile kıyaslayarak analiz sonuçlarını karşılaştırarak yorumlamıştır [7].
Bu çalışmada halkın büyük çoğunluğunu etkileyen ve hala da süregelen COVID-19 hastalığının, test sonuçlarının doğruluğunu teyit etmeye ve erken teşhise yardımcı olacak şekilde makine öğrenmesi sınıflandırma algoritmalarından Destek Vektör Makineleri (DVM), Rastgele Orman (Random Forest) ve NaiveBayes kullanılacaktır. Aynı zamanda veri içerisinde çok fazla eksik veri bulunduğu ve bu veriler algoritmaların çalışmasını engelleyeceği için veri ön işleme işlemleri yapılacaktır. Çalışma kapsamında COVID-19 (pozitif /negatif) test sonucunu yalnızcatam kan sayımı sonuçlarından tahmin ederek yöntemlerin sınıflandırmadaki performansı verilecektir.
2. Materyal ve Metot2.1. COVID-19 Veri SetiBu çalışmada kullanılan veri seti Kaggle çevrimiçi web tabanlı veri bilimi ve makine öğrenmesiortamından alınmıştır. Brezilya’nın Sao Paula şehrinde bulunan Albert Einstein Hastanesi’ndeyapılan SARS-CoV-2 RT-PCR tam kan sayımı testleri numunelerinden toplanarakanonimleştirilmiş veriler kullanılmıştır. Toplamda 5644 hasta ve 111 nitelikten oluşmaktadır [8].COVID-19 hastalığı tespiti için kullanılan veri setinde 5086 hastanın test sonucunun negatifsınıfta 558 hastanın ise test sonucunun pozitif sınıfta yer aldığı görülmektedir.Veri setinde hastaların yaş verileri, SARS-Cov-2 testi sonuçları ve standart tam kan sayımı:hematokrit, hemoglabin, trombosit, ortalama trombosit hacmi (MPV), kırmızı kan hücreleri,lenfositler, ortalama hemoglobin konsantrasyonu, lökositler, bazofiller, nötrofiller, monositler vekırmızı kan hücresi dağılım genişliği bulunur [8].
2.2. Veri Madenciliği Veri Madenciliği, belirli yöntemler kullanılarak veri üzerinden yeni ya da var olan bilgilerin ortaya çıkarılma sürecidir [6]. Veri madenciliği kullanılarak verideki değişiklikler ve ilişkiler keşfedilerek, ortaya çıkan problemlerin çözülmesi amaçlanır. Veri Madenciliğinde karşılaşılan bazı problemler eksik veri, gürültülü veri ve boş değerler olarak sayılabilir. Eksik Veri, veri kümesinin büyüklüğünden kaynaklanan bir problemdir. Sisteme giriş yapan kişi ya da veri setini tasarlayan kişi tarafından bazı veri niteliklerinin tanımlanmaması işlemidir [9]. Veri setinde karşılaşılan gürültü problemi ise veri girişi yapılırken ya da veri toplanması sırasında sistem dışında kaynaklanan hatalardır. Büyük ve geniş veri setlerinde nitelendirilen veri değeri yanlış olabilir. Bu durumlarda gürültülü verilerin düzeltilmesi veya ihmal edilmesi gerekir. Boş değerler ise, veri tabanlarında birincil anahtar haricinde diğer niteliklerin boş olabilmesi durumudur. Bu nitelikler ihmal edilebilir ya da boş olan nitelik yerine en yakın değer ataması yapılabilir [10].
2

2.2.1 Veri Ön İşlemeBu çalışmada öncelikle veri seti ile ilgili veri ön işleme yapılmıştır. Kaggle’dan alınan veri seti 5644 hastanın verisini içermektedir. Veri setinde çok fazla miktarda eksik veri olduğu için eksik veriler sınıflandırmaya dahil edilmeyecektir. Bu işlem için Python programlama dili ve buSpyder geliştirme ortamı kullanılmıştır.
Nitelik Seçimi: Veri setindeki 111 nitelik içinden hiçbir kayda sahip olmayan 17 nitelik, sınıflandırma sonucunu etkilemeyeceğinden silinmiştir. Geri kalan 94 nitelikten, %90 ve üzeri boş kaydı olan 74 nitelik veri setinden çıkarılmıştır. Kalan 20 nitelik sınıflandırmaalgoritmalarının girdisi olarak verilmiştir.
Örnek Seçimi: 20 nitelik içerisinden en çok kayda sahip olan nitelikler trombositler, ortalama trombosit hacmi ve kırmızı kan hücreleri sayısıdır. Bu nitelik değerleri boş olan kayıtlar veri seti içinden silinerek 598 örnek seçilmiştir. Bu veri setinde 517 örneğin SARS-Cov-2 sonucunegatifken geri kalan 81 örneğin ise sonucu pozitiftir.
Veri ön işlemesi ardından elde edilen veri seti üzerinde sınıflandırma işlemleri yapılabilmesi içinveri seti içinde birkaç ek düzeltme daha yapılmıştır. Bu işlem için öncelikle veri seti içindebulunan ‘Patient ID’ birincil anahtar olduğu için veri setinden silinmiştir. Ardından SARS-Cov-2 sonuçları için ise ‘Negative’ değer yerine ‘0’ ‘Positive’ değer yerine ise ‘1’ atanmıştır. Bu bölümün devamında çalışmada kullanılan sınıflandırma algoritmaları ve değerlendirme ölçütleri hakkında bilgiler verilmiştir.
2.2.2. Destek Vektör Makineleri Destek Vektör Makineleri(DVM), Boser, Guyan ve Vapnik tarafından 1992 yılında önerilen istatiksel teoriler üzerine kurulu bir makine öğrenmesi algoritmasıdır [17]. DVM’ler, doğrusalolmayan sınıflandırma yöntemi olup yoğunluk tahmini ve fonksiyon tahmini gibi problemleri çözmek için ve aynı zamanda çok sınıflı verilerin sınıflandırılması için kullanılan bir yöntemdir[18].
2.2.3. Rastgele Orman Algoritması Rastgele Orman algoritması ağaç benzeri sınıflandırma algoritması olarak nitelendirilebilir. Bu algoritma, her düğüm içerisinden rastgele değişkenler seçerek bu değişkenlerin en iyisini kullanır ve her düğümü dallara ayırır [19]. Yeni oluşan her veri seti orijinal veri seti içinden yer değiştirilmeli olarak üretilir. Ardından, rastgele özellik seçimi ile ağaçlar geliştirilir. Bu ağaçlarda budama yapılmaz [20]. Budama olmadığından Rastgele Orman algoritmasının doğruluğu eşsizdir. Bu algoritma aynı zamanda çok hızlı, çok fazla uyuma karşı dayanıklı ve ağaç sayısını istenen miktarda kullanabilir [19].
2.2.4. NaiveBayes Algoritması Naive Bayes algoritması basit bir olasılık sınıflandırıcı olup, veri kümesi içindeki değerlerin sınıfını tahmin eder. Bu algoritma Bayes teoremini kullanır ve sınıf değişkeninin değerine bakıldığında tüm bu özelliklerin bağımsız olduğunu varsayar [21].
2.2.5. Değerlendirme Ölçütleri Sınıflandırma sonunda elde edilen sonuçlar hata matrisi (confusion matrix) ile sunulmuştur. Bu matris makine öğrenmesi algoritmalarının sınıflandırma performanslarını ölçmek için kullanılır. İki sınıflı bir problem için hata matrisinin yapısı Tablo 1’de verilmiştir.
3

Tablo 1. Hata Matrisi Tahmin Edilen Sınıf
Sağlıklı Covid -19
Gerçek Sınıf Sağlıklı TN
(Doğru Negatif) FP
(Yanlış Pozitif)
Covid-19 FN (Yanlış Negatif)
TP (Doğru Pozitif)
Hata matrisindeki ‘Doğru Pozitif (TP)’ değeri doğru tahmin edilmesi beklenen pozitif sınıf değerini, ‘Yanlış Negatif (FN)’ değeri yanlış tahmin edilen negatif sınıf değerini, ‘Yanlış Pozitif (FP)’ yanlış tahmin edilen pozitif sınıf değerini ve ‘Doğru Negatif (TN) değeri ise doğru tahmin edilen negatif sınıf değerini temsil eder [22]. Matrisindeki bu değerler kullanılarak kesinlik, duyarlılık ve F1 puanı değerlendirme ölçütleri hesaplanmaktadır.
Kesinlik (Precision) değeri tüm pozitif sınıfların içinden ne kadarını doğru tahmin ettiğini gösterirken Duyarlılık (Recall) değeri pozitif olarak tahmin edilmesi gereken işlemlerin nekadarının pozitif olarak tahmin ettiğini gösterir. F1 puanı ise kesinlik ve duyarlılık değerlerinin harmonik ortalamasını göstermektedir. Doğruluk (Accuracy) değeri ise tüm doğru tahmin edilendeğerlerin bütün sonuca oranıdır.
3. Sonuçlar ve TartışmaUygulama esnasında sınıflandırma için Gausian Naive Bayes algoritması, Rastgele Ormanalgoritması ve Destek Vektör Makineleri kullanılarak başarı oranları elde edilmiştir. Bu işlemleri yerine getirebilmek için öncelikle veri seti %75 eğitim ve %25 test seti olarak ayrılmış vesınıflandırma gerçekleştirilmiştir.
(a)Destek Vektör Makineleri b) Rastgele Orman Algoritması c) Gausian Naive Bayes AlgoritmasıŞekil 1. Çalışmada Kullanılan Sınıflandırma Algoritmalarına ait Hata Matrisleri
Veri setinde SARS-Cov-2 sonuçları ‘Negative’ değer (sağlıklı birey) ise yerine ‘0’, ‘Positive’ değer (Covid-19 tanısı konmuş birey) ise yerine ‘1’ atanmıştır. Tablo 1’de görülen sınıflandırma algoritmalarına ait hata matrislerinde SARS-CoV-2 test sonuçları negatif çıkan ve sağlıklı diye teşhis konan bireylerden, algoritmaların doğru sınıflandırdığı bireylerin sayısı TN hücresinde verilmiştir. SARS-CoV-2 test sonuçları pozitif olan ve Covid-19 tanısı konan bireylerden, algoritmaların doğru olarak etiketlediği bireylerin sayısı TP hücresinde verilmiştir.
4

Tablo 2. Sınıflandırma Algoritmalarına ait Değerlendirme Ölçüt Değerleri Kesinlik
(Precision) Duyarlılık (Recall)
F1 Puanı Doğruluk
(Accuracy) Covid-19 Sağlıklı Covid-19 Sağlıklı Covid-19 Sağlıklı
Naive Bayes 0.38 0.95 0.6 0.89 0.46 0.92 0.86
Rasgele Orman 0.5 0.92 0.27 0.97 0.35 0.95 0.9 Destek Vek. Mak. 0.7 0.94 0.47 0.96 0.56 0.96 0.92
Bu çalışmada, SARS-Cov-2 test sonuçlarının tahmini için yapılan veri ön işleme adımlarınınardından sınıflandırma başarıları karşılaştırılmıştır. Bu sonuçlara göre Destek Vektör Makineleri %92 başarı oranıyla en yüksek başarıyı elde etmişken, Rastgele Orman %90 başarı oranı, NaiveBayes algoritması ise %86 ile en düşük başarıyı elde etmiştir. Ancak veri setinde 517 örneğin SARS-Cov-2 sonucu negatifken geri kalan 81 örneğin sonucu pozitif olduğundan, sınıflar arası bir dengesizlik söz konusudur. Bundan dolayı direkt doğruluk yüzdesine bakılarak sağlıklı bir sonuç çıkarmak mümkün olmayabilir. Problemin doğası gereği bulaş riskini artıracağı için en sıkıntılı durum, hasta bireyleri algoritmanın sağlıklı olarak etiketlemesidir. Bubireylerin sayısı Tablo 1’deki hata matrisinin FN hücresinde verilmektedir. Bu durumda algoritmanın başarısını kıyaslamak için bakmamız gereken Tablo 2’deki en önemli sütunu Covid-19 Tanısı Konmuş bireylerin Duyarlılık değeridir. Çünkü duyarlılık değeri pozitif olarak tahmin edilmesi gereken bireylerin ne kadarının pozitif olarak tahmin ettiğini gösterir. Tablo 2 incelendiğinde 0.6 değeri ile bu konudaki en başarılı algoritmanın naive bayes olduğugörülmektedir. Şekil-1(c) incelendiğinde de naive bayes algoritmasının 9 bireyi hasta iken sağlıklı olarak etiketlerken, bu sayı Rastgele orman algoritmasında 4, destek vektör makinelerinde ise 7 olduğu görülmektedir. Geleceğe yönelik çalışmalar olarak, öncelikle verisetindeki pozitif ve negatif hasta sayılarının dengesizliğinin giderilmesi için yöntemlerdenenmesi, aynı zamanda veri setindeki eksik verilerin giderilmesi üzerinde çalışılmalaryapılması ve deneme sayılarının artırılması planlanmaktadır.
Kaynaklar 1. Culp, W. C. (2020a). Coronavirus Disease 2019. A & A Practice, 14(6), e01218.
doi:10.1213/xaa.00000000000012182. Culp, W. C. (2020b). Wu F, Zhao S, Yu B, et al. A new coronavirus associated with human
respiratory disease in China. Nature 2020; published online Feb 3. DOI:10.1038/s41586-020-2008-3. A & A Practice, 14(6), e01218. doi:10.1213/xaa.0000000000001218
3. Hopkins,J. (2020). Coronavirus COVID-19 (SARS-CoV-2).4. https://www.hopkinsguides.com/hopkins/view/Johns_Hopkins_ABX_Guide/540747/all/
Coronavirus_COVID_19__SARS_CoV_2_5. Banerjee, A., Ray, S., Vorselaars, B., Kitson, J., Mamalakis, M., Weeks, S., … Mackenzie,
L. S. (2020). Use of Machine Learning and Artificial Intelligence to predict SARS-CoV-2infection from Full Blood Counts in a population. International Immunopharmacology, 86.doi:10.1016/j.intimp.2020.106705
6. YAVAŞ, M., GÜRAN, A. ve UYSAL, M. (2020). Covid-19 Veri Kümesinin SMOTETabanlı Örnekleme Yöntemi Uygulanarak Sınıflandırılması. European Journal of Scienceand Technology, 258–264. doi:10.31590/ejosat.779952
7. Demircioğlu, M. (2019). Covıd-19 Salgını İle Mücadelede Kümeleme Analizi İle ÜlkelerinSınıflandırılması.
5

8. Tekin, B. (2020). Covıd-19 Pandemisi Döneminde Ülkelerin Covıd-19, Sağlık Ve FinansalGöstergeler Bağlamında Sınıflandırılması: Hiyerarşik Kümeleme Analizi Yöntemi. FinansEkonomi ve Sosyal Araştırmalar Dergisi, 5(2), 261–280. doi:10.29106/fesa.738322
9. Kaggle çevrimiçi web tabanlı veri bilimi ve makine öğrenmesi ortamı,https://www.kaggle.com/dataset/e626783d4672f182e7870b1bbe75fae66bdfb232289da0a61f08c2ceb01cab01?select=dataset.xlsx
10. Liu, H. ve Zhang, S. (2012). Noisy data elimination using mutual k-nearest neighbor forclassification mining. Journal of Systems and Software, 85(5), 1067–1074.doi:10.1016/j.jss.2011.12.019
11. Tang Taghi, W. M. (2004). Noise Identification with the k-means Algorithm.12. Öztemel,E.(2008).Yapay Sı̇nı̇r Ağlari http://papatyabilim.com.tr/PDF/yapay_sinir_aglari.pdf13. Kutlugün, M. A. (2017). Gözetimli makine öğrenmesi yoluyla türe göre metinden ses14. sentezleme (Yüksek Lisans Tezi). İstanbul Sabahattin Zaim Üniversitesi Fen Bilimleri
Enstitüsü15. Hinton G. ve Sejnowski T.J. (1999). Hinton G. ve Sejnowski T.J. (editorler), 1999,
"Unsupervised Learning and Map FormationÇ Foundation of Neural Computation”, MITPress, ISBN 0-262-58168-X. MIT Press, ISBN 0-262- 58168-X.
16. Uzun, E. (2007). İnternet Tabanlı Bilgi Erişimi Destekli Bir Otomatik Öğrenme Sistemi.17. Edirne: Trakya Üniversitesi Fen Bilimleri Enstitüsü, Doktora Tezi18. Atalay, M. Ve Çelik, E. (2017). Büyük Veri Analı̇zı̇nde Yapay Zekâ Ve Makı̇ne Öğrenmesı̇
Uygulamalari - Artificial Intelligence and Machine Learning Applications in Big DataAnalysis. Mehmet Akif Ersoy Üniversitesi Sosyal Bilimler Enstitüsü Dergisi, 155–172.doi:10.20875/makusobed.309727
19. Çınar A., 2019. (2019). Algoritmalarının Performans Değerlendirmesi, 0–1.20. Boser, B. E., Laboratories, T. B., Guyon, I. M., Laboratories, T. B. ve Vapnik, V. N. (1992).
SVM-A training algorithm for optimal margin classifiers.pdf.21. Li, Y., Zhang, W. ve Lin, C. (2006). Simplify Support Vector Machines by Iterative
Learning. Neural Information Processing: Letters and Reviews, 10(1), 11–17.22. Akar, Ö. ve Güngör, O. (2012). Rastgele orman algoritması kullanılarak çok bantlı
görüntülerin sınıflandırılması. Journal of Geodesy and Geoinformation, 1(2), 139–146.doi:10.9733/jgg.241212.1t
23. Breiman, L. (2001). Random forests. Machine Learning, 45(1), 5–32.doi:10.1023/A:1010933404324
24. Huang, Y. ve Li, L. (2011). Naive Bayes classification algorithm based on small sample set.CCIS2011 - Proceedings: 2011 IEEE International Conference on Cloud Computing andIntelligence Systems, (2), 34–39. doi:10.1109/CCIS.2011.6045027
25. Kaya,Y., 2017.Motokaravan Sigortacılığı Tahmin Modellemesi Ve Uygulanan YöntemlerinKarşılaştırılması, Beykent Üniversitesi Fen Bilimleri Enstitüsü(Yüksek Lisans Tezi),İstanbul.
6

MESLEKİ VE TEKNİK EĞİTİM KURUMLARINDA UYGULANAN ÖZDEĞERLENDİRME VERİLERİNİN ANALİZİ
HÜSEYİN ERÇİN*1, AYŞE MERVE ACILAR2
*1Necmettin Erbakan Üniversitesi, Fen Bilimleri Enstitüsü, Bilgisayar Mühendisliği ABD, Konya, TÜRKİYE2Necmettin Erbakan Üniversitesi, Mühendislik-Mimarlık Fakültesi, Bilgisayar Mühendisliği, Konya, TÜRKİYE
Özet
Nitelikli insan kaynakları, bir ülkenin ekonomik anlamda dünyayla rekabet edebilmesi için gerekli olan en kritik faktördür. Bu ihtiyacı karşılamak ve eğitim hedeflerine ulaşmak için okullar sürekli olarak geliştirilmeli ve okullar arası kalite farkı azaltılmalıdır. Gelişimi başlatmadan önce ise, okulların performans düzeyleri doğru bir şekilde değerlendirilmelidir. TS 9005 Kalite Sözlüğü’nde kalite güvencesi “Ürün ya da hizmetin kalite için belirlenmişgereklilikleri karşılamada yeterli güveni sağlayacak planlı ve sistematik faaliyetler bütünü”olarak tanımlanmıştır. Teknolojik gelişmelerin hızla ilerlediği günümüzde kurumların gelişimeuyum sağlayabilmeleri için Kalite Güvence Sistemi bir zorunluluk olarak görülmektedir.
Mesleki ve Teknik Eğitim kurumlarında 2016 yılından itibaren Avrupa Mesleki Eğitim Kalite Göstergeleri ile uyumlu olarak Kalite Güvence Sistemi, Öz değerlendirme ve Dış Değerlendirme olarak uygulanmaktadır. Dış Değerlendirme ve izleme göstergelerinin sonucu kalite puanı olarak hesaplanmakta ve okullarla paylaşılmaktadır ancak tüm kalite standartlarının birleştirilmesi ilehesaplanan tek bir kalite puanı, sonuçların değerlendirilmesi açısından verimli olmamaktadır.Eğitim kurumlarında uygulanan Özdeğerlendirme çalışmasının veri analizi yöntemleri uygulanarak her alan için ayrı ayrı etkin bir şekilde sunulamadığı, bu veriler üzerinden yapılan tahmin ve çıkarımlarla kurum kapasitelerinin değerlendirilemediği, standart alanların birbirlerineolan etkilerinin değerlendirilmediği, bölgesel farklılıkları olan okullar arasında karşılaştırmayapılamadığı görülmüştür.
Anahtar Kelimeler: Kalite Güvence Sistemi, Mesleki ve Teknik Eğitim, Özdeğerlendirme, Veri Analizi.
1. GirişMesleki ve teknik eğitimin güçlenmesi Milli Eğitim Bakanlığının en önemli önceliklerindenbirisi haline gelmiştir. Mesleki ve Teknik Eğitim kurumlarının kalitelerinin sürekli olarakarttırılması, okullar arasındaki farkların azaltılması MEB 2023 Eğitim Vizyonu hedefleriiçerisinde bulunmaktadır.
Gelişmiş ülkelerde okullar arasındaki farklılıklar %10 civarında olup bu oran gelişmekte olan ülkelerde %40‟a kadar çıkmaktadır. OECD 2010 yılı verilerine göre, okullar arası başarı farkının azalmasının da olumlu ekonomik etkileri vardır. Örneğin, okullar arası eşitsizliğin azaltıldığı ve her öğrencinin PISA testlerinden en az 400 puan aldığı varsayıldığında bu durumun 2090 yılına kadar Türkiye ekonomisine 15 trilyon dolarlık bir dönüşü olacağı beklenmektedir ki bu, 2010 yılındaki gayri safi milli hasılanın %1100’ üdür. Mesleki ve Teknik Anadolu Liselerinin PISA
7

örneklemine göre dağılımı 2018 yılında %31.1ile %43.7 olan Anadolu Liselerinden sonra enyüksek ikinci sırada bulunmaktadır.
Şekil 1. PISA 2018 Türkiye örnekleminin okul türlerine göre dağılımı [3]
Eğitim kalitesini geliştirmek her hangi bir ürün kalitesini geliştirmek gibi nesnel bir yapıda olmaması ve etki faktörlerinin çok fazla sayıda olması Kalite Güvence Sisteminin sonuçlarının değerlendirilmesini güçleştirmektedir. İstatistiksel kaynaklardaki bilgilerin ve alanda uzman kişilerin bilgi ve tecrübelerinin bir yazılım aracılığı ile araştırmacılara kolay ve etkili sunulmasının faydalı olacağı düşünülmüştür [2].
Hızla gelişen teknoloji ile birlikte bilgisayar ve istatistik paket programlarının kullanımının hızla yaygınlaşmasının araştırmacıların veri analizi sorunlarını azaltmaktadır. Ancak bir istatistik paket programını kullanabilmek için, öncelikle temel istatistik ve araştırma teknikleri hakkında bilgi sahibi olmak gerekir. Paket program sadece uygun bilgi ve deneyime bağlı olarak araştırmacının verdiği komutlarla işlemin yapılmasını sağlar. Toplanan veriler, uygun istatistiksel teknikler kullanılarak analiz edilmediği ve analiz sonuçları doğru yorumlanmadığı takdirde araştırmanın bilimselliği şüphelidir [4].
2. Materyal ve Yöntem2.1. Mesleki Ve Teknik Eğitim Kurumlarında ÖzdeğerlendirmeNitelikli insan kaynakları, bir ülkenin ekonomik anlamda dünyayla rekabet edebilmesi içingerekli olan en kritik faktördür. Bu ihtiyacı karşılamak ve eğitim hedeflerine ulaşmak içinokullar sürekli olarak geliştirilmeli ve okullar arası kalite farkı azaltılmalıdır. Gelişimibaşlatmadan önce ise, okulların performans düzeyleri doğru bir şekilde değerlendirilmelidir [1].Mesleki ve Teknik Eğitim Kurumlarında, kalite gelişimlerini gözlemleyebilmeleri vegeliştirebilmeleri için Avrupa Mesleki Eğitim Kalite Göstergeleri ile uyumlu olarak KaliteGüvence Sistemi uygulanmaktadır. Kalite Güvence Sistemi Özdeğerlendirme ve DışDeğerlendirmeden oluşur.
8

Mesleki ve Teknik Eğitim kurumlarında 2016 yılından itibaren Özdeğerlendirme raporları hazırlanmakta ve Mesleki ve Teknik Eğitim Genel Müdürlüğünce dış değerlendirmeleri yapılmaktadır. Dış değerlendirme kanıt temelli olarak yapılır. Yapılan görüşmelerde sözlü veriler kanıt evrakları ile teyit edilir.
2.1.1. Öz Değerlendirme Birey, ekip ya da kurumların kendi kendilerini belirli yöntem ve teknikler kullanarak belirlenen standartlar doğrultusunda değerlendirmeleridir. Eğitim ve öğretime yönelik ulusal veuluslararası kalite göstergelerini içeren 6 standart alanı kapsar:
1- Eğitim Kurumu Yönetimi2- Planlama3- İnsan Kaynakları Yönetimi4- Eğitim – Öğretim5- Ortaklık ve Kaynaklar6- Sonuçlar ve Değerlendirme
2.1.2. Dış Değerlendirme Öz Değerlendirmenin etkinliğini ölçmek için ilgili idare dışından belirlenen vasıflı ve bağımsız bir uzman veya ekip tarafından yapılan değerlendirmedir. Dış değerlendirmede kullanılan kalite standartları 5 standart alanı kapsar;
1- Eğitim Kurumu Yönetimi2- İnsan Kaynakları Yönetimi3- Eğitim-Öğretim4- Ortaklık ve Kaynaklar5- Tesis ve Ekipmanlar
Dış değerlendirme tetkiklerinde 5 standart alanının Avrupa Mesleki Eğitim Kalite Göstergeleri ile uyumlu 30 göstergesi bulunmaktadır. Göstergeler eğitim kurumunun mevcut durumunu ve geliştirilebilir alanlarının tespit edilmesini sağlar. Geliştirilebilecek alanlarda eylem planı oluşturmayı destekler. Geliştirilebilir alanlar dışında güçlü alanların geliştirilmesi için yapılacak çalışmalarda da yardımcı olur. Göstergeler yeterli olma durumlarına göre 1-5 arasında derecelendirme ile belirlenmektedir.
Mesleki ve Teknik Eğitim Genel Müdürlüğü tarafından yapılan dış değerlendirme verileri, http://ozdegerlendirme.meb.gov.tr/disdegerlendirme/ adresinde bulunan dış değerlendirme portalı ile kaydedilmektedir. Dış Değerlendirme portalında kurumun özdeğerlendirme kapasitesi değerlendirilmekte ve dış değerlendirme ile izleme göstergesi verileri görevlendirilen değerlendiriciler tarafından kaydedilmekte ve onaylanmaktadır.
2.2. Materyal Bu çalışma için İzleme Göstergelerinden oluşturulan veri seti örneği Tablo-1’de verilmiştir. Analiz için kullanılan izleme göstergeleri: Paydaşlarla yapılmış Protokol Sayısı, Paydaşların desteği ile okula kazandırılan donatım ve temrinlik malzeme tutarı toplamı (Bin TL), Paydaşların desteği ile öğretmen ve/veya öğrencilere yönelik düzenlenen konferans/seminerve kurs toplam sayısı, Paydaşların desteği ile burs alan öğrenci sayısı, Paydaşların öğrenci ve öğretmenlere yönelik yapılan sosyal ve kültürel etkinliklere (fuar, sergi, gezi, yarışma vb.) sponsor olma toplam sayısı ve Öğrencilerin mesleki bilgi ve görgülerini artırmak için yapılan sektör ziyaretleri
9

alanları şeklindedir. Örnek 15 Mesleki ve Teknik Anadolu Lisesi (MTAL) için çalışma gerçekleştirilmiştir. Okullar Tablo 1’de P0-P14 arasında isimlendirilmiştir.
Tablo 1. Çalışmada kullanılan Veri Seti
Okul Adı Protokol Sayısı
Paydaş Desteği ile Dn.
ve Temr. Malz. Tutarı
(Bin TL)
Paydaşların Konferans-Seminer-
Kurs Toplam Sayısı
Paydaşlardan Burs Alan Öğrenci Sayısı
Sosyal ve Kültürel
Etkinliklere Sponsorluk
Toplam Sayısı
Sektör Ziyareti Sayısı
P0 MTAL 2 1,00 0 20 1 3
P1 MTAL 3 1,50 2 13 4 2
P2 MTAL 0 2,70 1 32 2 2
P3 MTAL 5 1,50 3 23 7 5
P4 MTAL 1 3,00 5 42 6 1
P5 MTAL 3 4,50 0 16 3 4
P6 MTAL 5 8,00 2 4 0 6
P7 MTAL 4 7,50 4 37 8 2
P8 MTAL 1 6,00 6 0 12 7
P9 MTAL 2 1,30 2 5 5 10
P10 MTAL 3 5,20 3 1 6 5
P11 MTAL 5 8,10 7 6 7 2
P12 MTAL 7 2,40 2 8 12 3
P13 MTAL 1 1,00 0 7 24 7
P14 MTAL 6 1,90 0 14 19 6
2.3. Kümeleme Algoritmaları Kümeleme, mevcut verileri birbirine olan benzerliklerine göre gruplama işlemidir. Kümeleme analizinde verilerin benzerlikleri, birbirlerinden olan uzaklıkların hesaplanması ile bulunmaktadır. Amaç aynı küme içindeki bireylerin benzerliklerini maksimize etmek (intra-cluster), farklı kümelerdeki (inter-cluster) bireylerin benzerliklerini minimize etmektir. Kümeleme algoritmaları hiyerarşik ve hiyerarşik olmayan olarak ikiye ayrılır. Hiyerarşik algoritmaların Aglomeratif ( Parçadan bütüne ) ve Divisive ( Bütünden parçaya ) olarak iki farklı varyasyonu vardır. Bu çalışmasında oluşturulan veri seti üzerinde kümeleme analizi yaparak, birbirleri ile ilişkili veri gruplarının keşfedilmesi hedeflenmektedir. Bunun için veri setine Aglomeratif Kümeleme algoritması (Şekil-2) uygulanmıştır. Küme içi mesafenin hesaplanması için Öklid, kümeler arası mesafenin hesaplanması içinde Ward uzaklık ölçütü kullanılmıştır.
Şekil 2. Aglomeratif Kümeleme Algoritması Kümeleme Yöntemi
10
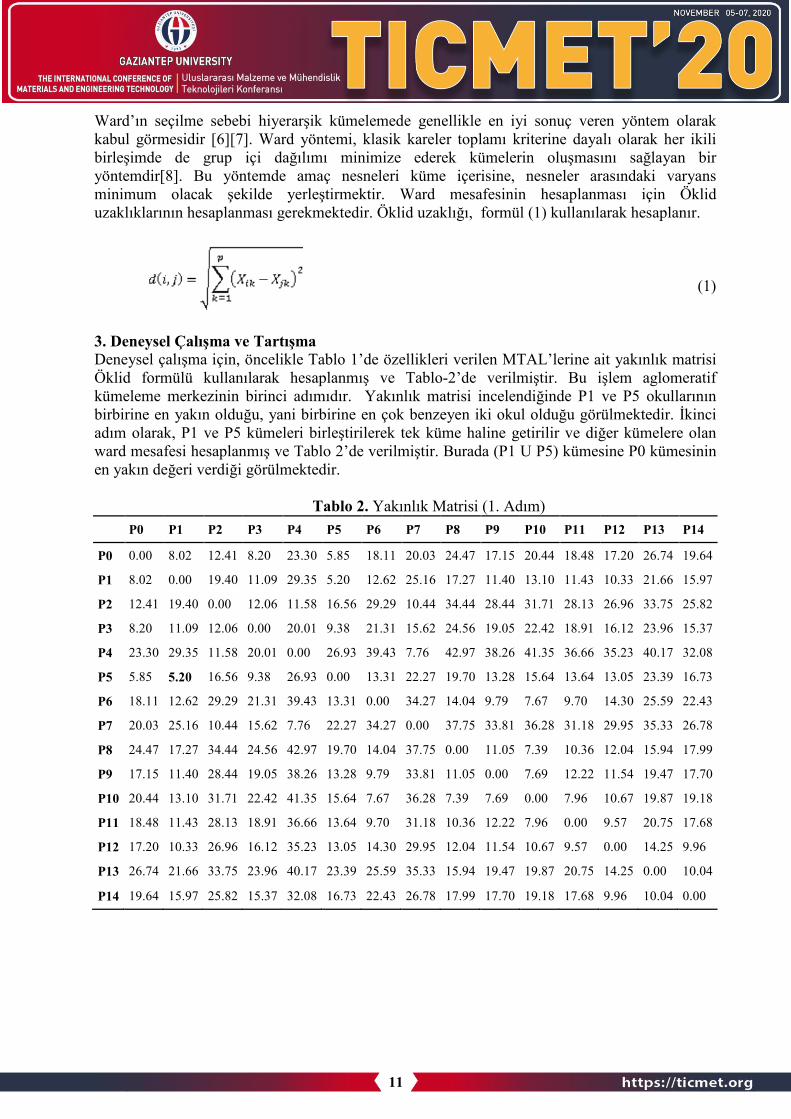
Ward’ın seçilme sebebi hiyerarşik kümelemede genellikle en iyi sonuç veren yöntem olarak kabul görmesidir [6][7]. Ward yöntemi, klasik kareler toplamı kriterine dayalı olarak her ikili birleşimde de grup içi dağılımı minimize ederek kümelerin oluşmasını sağlayan biryöntemdir[8]. Bu yöntemde amaç nesneleri küme içerisine, nesneler arasındaki varyans minimum olacak şekilde yerleştirmektir. Ward mesafesinin hesaplanması için Öklid uzaklıklarının hesaplanması gerekmektedir. Öklid uzaklığı, formül (1) kullanılarak hesaplanır.
(1)
3. Deneysel Çalışma ve TartışmaDeneysel çalışma için, öncelikle Tablo 1’de özellikleri verilen MTAL’lerine ait yakınlık matrisiÖklid formülü kullanılarak hesaplanmış ve Tablo-2’de verilmiştir. Bu işlem aglomeratif kümeleme merkezinin birinci adımıdır. Yakınlık matrisi incelendiğinde P1 ve P5 okullarının birbirine en yakın olduğu, yani birbirine en çok benzeyen iki okul olduğu görülmektedir. İkinciadım olarak, P1 ve P5 kümeleri birleştirilerek tek küme haline getirilir ve diğer kümelere olan ward mesafesi hesaplanmış ve Tablo 2’de verilmiştir. Burada (P1 U P5) kümesine P0 kümesinin en yakın değeri verdiği görülmektedir.
Tablo 2. Yakınlık Matrisi (1. Adım) P0 P1 P2 P3 P4 P5 P6 P7 P8 P9 P10 P11 P12 P13 P14
P0 0.00 8.02 12.41 8.20 23.30 5.85 18.11 20.03 24.47 17.15 20.44 18.48 17.20 26.74 19.64
P1 8.02 0.00 19.40 11.09 29.35 5.20 12.62 25.16 17.27 11.40 13.10 11.43 10.33 21.66 15.97
P2 12.41 19.40 0.00 12.06 11.58 16.56 29.29 10.44 34.44 28.44 31.71 28.13 26.96 33.75 25.82
P3 8.20 11.09 12.06 0.00 20.01 9.38 21.31 15.62 24.56 19.05 22.42 18.91 16.12 23.96 15.37
P4 23.30 29.35 11.58 20.01 0.00 26.93 39.43 7.76 42.97 38.26 41.35 36.66 35.23 40.17 32.08
P5 5.85 5.20 16.56 9.38 26.93 0.00 13.31 22.27 19.70 13.28 15.64 13.64 13.05 23.39 16.73
P6 18.11 12.62 29.29 21.31 39.43 13.31 0.00 34.27 14.04 9.79 7.67 9.70 14.30 25.59 22.43
P7 20.03 25.16 10.44 15.62 7.76 22.27 34.27 0.00 37.75 33.81 36.28 31.18 29.95 35.33 26.78
P8 24.47 17.27 34.44 24.56 42.97 19.70 14.04 37.75 0.00 11.05 7.39 10.36 12.04 15.94 17.99
P9 17.15 11.40 28.44 19.05 38.26 13.28 9.79 33.81 11.05 0.00 7.69 12.22 11.54 19.47 17.70
P10 20.44 13.10 31.71 22.42 41.35 15.64 7.67 36.28 7.39 7.69 0.00 7.96 10.67 19.87 19.18
P11 18.48 11.43 28.13 18.91 36.66 13.64 9.70 31.18 10.36 12.22 7.96 0.00 9.57 20.75 17.68
P12 17.20 10.33 26.96 16.12 35.23 13.05 14.30 29.95 12.04 11.54 10.67 9.57 0.00 14.25 9.96
P13 26.74 21.66 33.75 23.96 40.17 23.39 25.59 35.33 15.94 19.47 19.87 20.75 14.25 0.00 10.04
P14 19.64 15.97 25.82 15.37 32.08 16.73 22.43 26.78 17.99 17.70 19.18 17.68 9.96 10.04 0.00
11

Tablo 3.Ward Mesafesi (2. Adım)
P0 P2 P3 P4 P6 P7 P8
(P1 U P5)
24.125 93.14 38.18 210.12 53.87 152.093 97.62
P9 P10 P11 P12 P13 P14 50.09 63.83 51.37 46.46 138.87 78.67
Bu şekilde hesaplamalar tüm okullar tek bir kümede toplanasıya kadar devam eder. Kümeleme analizinin sonucu elde edilen dendrogram grafiği Şekil 3’de verilmiştir. Dendrogram grafiğinde yatay ekseninde okullar, dikey ekseninde ise okulların birbirlerine olan uzaklıkları ve oluşturdukları kümeler arasındaki bağlantılar görülmektedir.
Şekil 3. Kümeleme analizi sonucu elde edilen Dendrogram Grafiği
Kümeleme analizi uygulamalarında doğru küme sayısı çoğunlukla bilinemez. Kümeleme analizinin sonuçlarının kalitesini değerlendirmek için küme geçerliliği tekniklerine ihtiyaç vardır. Bu teknikler arasında en çok kullanılanları Silhouette indeksi, Calinski ve Harabazs indeksi, Krzanowski ve Lai indeksi olarak sayılabilir [10]. Bu çalışmada en uygun küme sayısının belirlenmesi için Silhouette indeksi kullanılmıştır. Hesaplanması formül (2) ve (3)’de verilmiştir. Formül (3)’e göre, maksimum ortalama Silhouette değerine ulaşılan küme sayısı uygun küme sayısı olarak seçilir.
(2)
(3)
Bu çalışma için çeşitli küme sayıları için silhoutte değerleri hesaplanmış ve sonuçlar tablo 3’de verilmiştir.
Tablo 4. Küme Sayılarına göre Silhouette Değerleri Küme Sayısı 2 3 4 5 6 Silhouette Değeri 0,4811 0,3412 0,4107 0,3086 0,2269
Tablo 4 incelendiğinde uygun küme sayısının 2 olduğu görülmektedir ancak okulların paydaş desteğini değerlendirirken 2 kümenin detayları görmede yetersiz kalacağından, küme sayısının en yüksek ikinci ortalama silhoutte değerine sahip olan 4 olarak alınması kararlaştırılmıştır. Bu
12

durumda veri setinde bulunan okullar A1={P2,P4,P7}, A2={P3,P0,P1,P5}, A3={P13,P14} ve A4={P6,P8,P9,P10,P11,P12} şeklinde kümelenmiş ve tablo 5’de verilmiştir. Tablo 5 incelendiğinde, okulların paydaş ilişkileri hakkında bir fikir sahibi olunmaktadır. Örneğin A1 ve A2 kümesinde burs alan öğrenci sayılarının ortalaması, diğer kümelere göre daha yüksek ikenA4 kümesinin sosyal ve kültürel etkinliklere sponsorluk sayıları toplamının ortalaması oldukçayüksektir. Gelecek çalışmalarda, öğrencilerin başarı notları ile bu etkinlikler arasındaki ilişki araştırılıp, hangi faaliyetin başarıyı yükseltmede daha etkili olduğu incelenebilir. Daha fazla okulla çalışıp, daha fazla değişken kullanarak analizler detaylandırılarak, okullar için eğitim kalitesini yükseltmede kullanabilecekleri rehberler hazırlanabilinir.
Tablo 5. Okullara ait kümeleme analiz sonucu
Küme Adı Okul Adı ProtokolSayısı
Paydaş Desteği ile Dn.
ve Temr. Malz. Tutarı
(Bin TL)
Paydaşların Konferans-Seminer-
Kurs Toplam Sayısı
Paydaşlardan Burs Alan Öğrenci Sayısı
Sosyal ve Kültürel
Etkinliklere Sponsorluk
Toplam Sayısı
Sektör Ziyareti Sayısı
A1
P0 MTAL 2 1 0 20 1 3 P1 MTAL 3 1.5 2 13 4 2 P3 MTAL 5 1.5 3 23 7 5 P5 MTAL 3 4.5 0 16 3 4
Ortalaması 3.25 2.125 1.25 18 3.75 3.5
A2 P2 MTAL 0 2.7 1 32 2 2 P4 MTAL 1 3 5 42 6 1 P7 MTAL 4 7.5 4 37 8 2
Ortalaması 1.67 4.40 3.33 37.00 5.33 1.67
A3
P6 MTAL 5 8 2 4 0 6 P8 MTAL 1 6 6 0 12 7 P9 MTAL 2 1.3 2 5 5 10
P10 MTAL 3 5.2 3 1 6 5 P11 MTAL 5 8.1 7 6 7 2 P12 MTAL 7 2.4 2 8 12 3
Ortalaması 3.83 5.17 3.67 4.00 7.00 5.50
A4 P13 MTAL 1 1 0 7 24 7 P14 MTAL 6 1.9 0 14 19 6
Ortalaması 3.5 1.45 0 10.5 21.5 6.5
4.SonuçMesleki ve Teknik Eğitim kurumlarında 2016 yılından itibaren Avrupa Mesleki Eğitim KaliteGöstergeleri ile uyumlu olarak Kalite Güvence Sistemi, Öz değerlendirme ve Dış Değerlendirmeolarak uygulanmakta ve sonuç olarak ilgili okullara bir tek bir kalite puan verilmektedir. Ancakokulun kendi durumunu analiz etmesi, eksikliklerini görmesi kalite puanı tek başına yeterliolmamaktadır. Eğitim kurumlarında uygulanan Özdeğerlendirme çalışmasının veri analiziyöntemleri uygulanarak sonuçların etkin şekilde yorumlanması, okulların eğitim kalitesiniyükseltebilmesi için önemlidir. Bu çalışmada küçük bir veri seti üzerinde agglomerativekümeleme algoritması kullanılarak bir uygulama örneği gerçekleştirilmiştir. Örnekte MeslekiTeknik Anadolu Liseleri ile paydaş ilişkileri kümeleme yöntemi kullanılarak analiz edilmiştir.Gelecek çalışmalarda, hangi faaliyetin başarıyı yükseltmede daha etkili olduğu incelenebilir,daha fazla okulla çalışıp, daha fazla değişken kullanarak analizler detaylandırılarak, okullar içineğitim kalitesini yükseltmede kullanabilecekleri rehberler hazırlanabilinir.
13

Kaynaklar 1. Kazan, H.,2015,Eğitim kurumlarının kurumsal performanslarının ölçüm modellemesi:Çok
kriterli yöntem uygulaması, Yüksek Lisans Tezi, Gebze Teknik Üniversitesi Sosyal BilimleriEnstitüsü, Gebze.
2. Uysal, M., 2014, Veri analizi için genişleyebilir bir karar ağacının oluşturulması, web vemobil uygulamalarının geliştirilmesi, Yüksek Lisans Tezi,Gazi Üniversitesi BilişimEnstitüsü, Ankara.
3. MEB, PISA 2018 Türkiye Ön Raporu.4. Büyüköztürk, Ş. (2011). Sosyal Bilimler İçin Veri Analizi El Kitabı, Ankara: Pegem
Akademi.5. MTEGM., “Dış Değerlendirme Portalı”,
http://ozdegerlendirme.meb.gov.tr/disdegerlendirme/ 20.07.2020.6. Hands, S, Everitt, B (1987). A Monte Carlo study of therecovery of clusterstructure in
binary data by hierarchical cluster techniques. Multivar. Behav. Res. 22, 235-243.7. Ferreira, L. ve Hitchcock, D. B. (2009). A comparison of hierarchical methods for cluster
functional data. Communications in Statistics-Simulationand Computation, 38(9), 1925-1949
8. Murtagh, F. ve Legendre, P. (2014). Ward’shierarchicalagglomerativeclustermethod:Whichalgorithm simplement ward’scriterion?.Journal of Classification, 31(3), 274-295.
9. Da CostaJr, N.,Cunha, J., ve Da Silva, S. (2005). Stockselection based on clusteranalysis.Economics Bulletin, 13(1), 1-9.
10. Günay Atbaş, A., 2008, Kümeleme analizinde küme sayısının belirlenmesi üzerine birçalışma, Yüksek Lisans Tezi, Ankara Üniversitesi Fen Bilimleri Enstitüsü, Ankara.
14

WHAT IS THE POSSIBILITY OF USING METAL COMPLEXES OF PHENANTHROLINE IN DYE-SENSITIZED SOLAR CELLS?
Kayode Sanusi11*, Yusuf Yilmaz2
1Department of Chemistry, Obafemi Awolowo University, Ile-Ife, Nigeria 2NT Vocational School, Gaziantep University, 27310 Gaziantep, Turkey
Abstract
DFT/TD-DFT methods were employed to determine the applicability of Fe(II) and Zn(II) phenanthroline complexes (A1-A5 and B1-B5) as photosensitizers in DSSCs. Overall results obtained show that tris-phenanthroline metal complexes are likely to perform poorly as photosensitizers in DSSCs application. Moreover, it was found that Fe(II) complexes favorshigher photovoltaic activity compared to Zn(II) complexes.
Keyword: Fluorescence factor, charge transfer, incident photon conversion efficiency,phenanthroline complex
1. Introduction Dye-sensitized solar cells (DSSCs) have become a topic of research interest in the last two decades due to their importance in renewable energy and solar conversion [1]. The typical DSSC is composed of a photoanode, a counter electrode, an oxide layer in between them, a dyesensitizer adsorbed on the oxide layer and an electrolyte [2]. One of the key roles in DSSCs is attributed to the sensitizers, which are responsible for light absorption and the generation of electric charges [3]. Efforts have been made to design efficient dye sensitizers suitable for practical use. Ruthenium-based sensitizers N3, N719 and black dye have achieved efficiencies of up to 11% under AM 1.5 G irradiation [4-6]. However, the availability of the Ru metal limit theirdevelopment for large-scale applications, therefore, dye sensitizers containing common metals are becoming attractive for this application. Phenanthroline ligands examined in this research are one of the widely used chelating ligands in modern coordination chemistry [7]. In the presentstudy, time-dependent/density functional theory (DFT/TD-DFT) methods have been employed to investigate the possibility of using metal complexes of phenanthroline shown in Fig. 1 as sensitizers in DSSCs.
2. Materials and Methods2.1 Computational detailsAll calculations were carried out using Gaussian 03W program suite [8]. Geometry optimizationwas calculated in the gas phase using the hybrid B3LYP correlation and exchange functionalwith a mixed basis set comprising of a polarized double zeta [6-31+g(d,p)] and an effective corepotential (LANL2DZ). Vibrational frequencies and electronic absorption properties of thecomplexes were obtained at the B3LYP/6-31g(d)/LANL2DZ and TDDFT/B3LYP/6-31+g(d,p)/LANL2DZ levels respectively. The frequency data was use to classify the optimizedstructures as minima and maxima stationary states on the potential energy surface (PES) or ascompletely unrealistic.
15

Figure 1. Basic structure of the investigated photosensitizers.
3. Results and Discussion3.1 Optimized geometry and electronic properties Geometry optimizations were used to obtain the prototype conformation of the dyes where its energy and steric hindrances are at minimum [9]. Absence of imaginary values in the frequency data obtained validates that the optimized structures have reached their stationary points. Theenergies of the HOMOs and the LUMOs of the photosensitizers are vital parameters to determine the photostability and electron injection efficiency of the dyes. Table 1 shows the HOMO, LUMO and the HOMO-LUMO energy gaps of the studied complexes. All the complexes were observed to have high energy band gap in the neighborhood of 4.0 eV (Table 1). This implies that they would require high energy incident photons for photoexcitation.
Table 1. HOMO-LUMO energy gaps of the dye molecules DYES HOMO (eV) LUMO (eV) HOMO-LUMO Gap
(eV) A1 -11.55 -7.50 4.06 A2 -11.89 -7.63 4.26 A3 -12.00 -8.01 3.99 A4 -11.41 -7.32 4.09 A5 -11.16 -7.19 3.97 B1 -11.86 -7.41 4.45 B2 -11.85 -7.56 4.29 B3 -12.04 -7.91 4.13 B4 -11.53 -7.25 4.29 B5 -11.25 -7.12 4.13
Figure 2 shows the orbital energy diagram of the studied dye molecules. The LUMO of a potential dye sensitizer must lie above the CB edge of the semiconductor used which has been given as -4.21 eV in order to have a good electron injection process into the TiO2 layer. In addition, the HOMO must be situated below the I-/I3- redox couple potential for an efficient electron accepting process [10, 11]. The LUMO of all the dyes are found below the CB edge of the TiO2 (Fig. 2). The estimated δp values obtained in (Table 2) are negative values while the
16
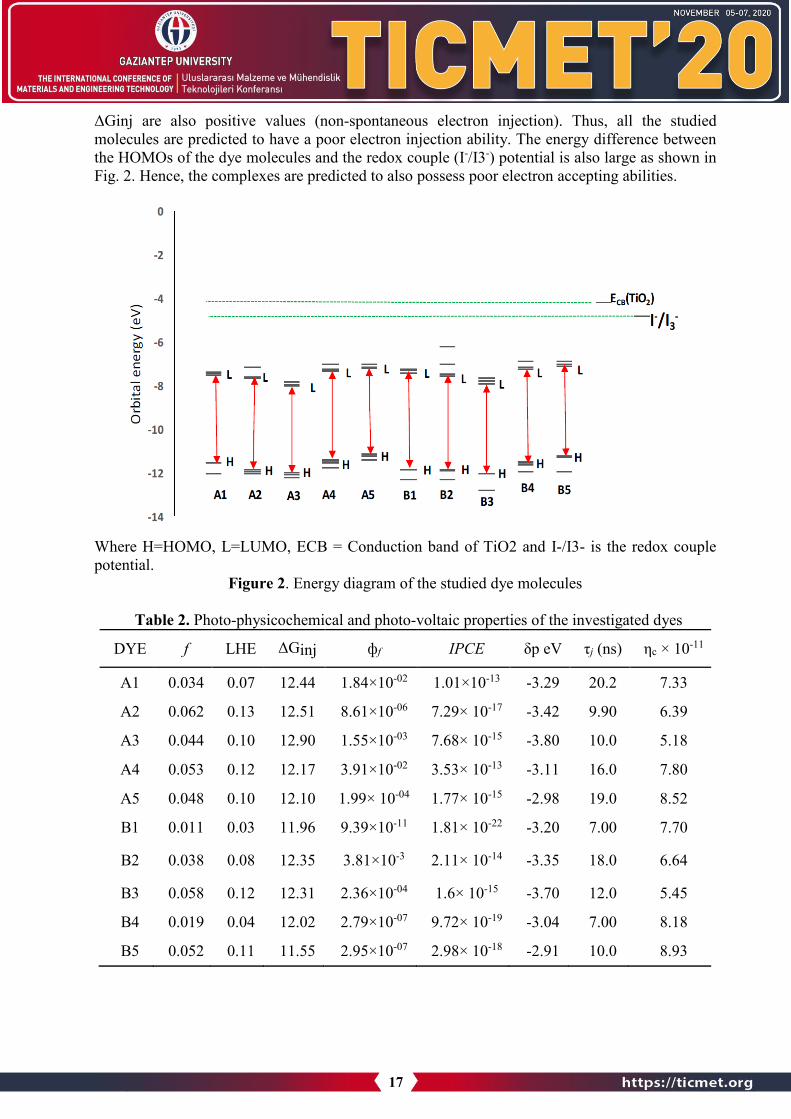
ΔGinj are also positive values (non-spontaneous electron injection). Thus, all the studiedmolecules are predicted to have a poor electron injection ability. The energy difference between the HOMOs of the dye molecules and the redox couple (I-/I3-) potential is also large as shown in Fig. 2. Hence, the complexes are predicted to also possess poor electron accepting abilities.
Where H=HOMO, L=LUMO, ECB = Conduction band of TiO2 and I-/I3- is the redox couple potential.
Figure 2. Energy diagram of the studied dye molecules
Table 2. Photo-physicochemical and photo-voltaic properties of the investigated dyes
DYE f LHE ΔGinj фf IPCE δp eV τj (ns) ηc × 10-11
A1 0.034 0.07 12.44 1.84×10-02 1.01×10⁻¹³ -3.29 20.2 7.33
A2 0.062 0.13 12.51 8.61×10-06 7.29× 10⁻¹⁷ -3.42 9.90 6.39
A3 0.044 0.10 12.90 1.55×10-03 7.68× 10⁻¹⁵ -3.80 10.0 5.18
A4 0.053 0.12 12.17 3.91×10-02 3.53× 10⁻¹³ -3.11 16.0 7.80
A5 0.048 0.10 12.10 1.99× 10-04 1.77× 10⁻¹⁵ -2.98 19.0 8.52
B1 0.011 0.03 11.96 9.39×10⁻¹¹ 1.81× 10⁻²² -3.20 7.00 7.70
B2 0.038 0.08 12.35 3.81×10⁻³ 2.11× 10⁻¹⁴ -3.35 18.0 6.64
B3 0.058 0.12 12.31 2.36×10-04 1.6× 10⁻¹⁵ -3.70 12.0 5.45
B4 0.019 0.04 12.02 2.79×10-07 9.72× 10⁻¹⁹ -3.04 7.00 8.18
B5 0.052 0.11 11.55 2.95×10-07 2.98× 10⁻¹⁸ -2.91 10.0 8.93
17

3.2 Photovoltaic properties. Based on the energy diagram alignment of the dyes, they are all predicted to exhibit poorperformances in DSSCs applications. However, photovoltaic results obtained was use to predictbest metal ion, substituent group and its position of attachment to the phenanthroline complex.
A potential dye sensitizer must exhibit high light harvesting (LHE), charge collection (ηc), electron injection (ϕinj) and incident photon conversion (IPCE) efficiencies. From Table 2, A2 has the highest LHE while B1 has the lowest. This indicates that the fluorine substituents contribute greatly to absorption of light compared to the methyl substituents. These substituents alter the LHE of these molecules by reducing and increasing their electron densities respectively.The charge collection efficiency is shown to be highest in dye B5 (Table 2). The general trend for the ηc values is A3 < B3 < A2 < B2 < A1 < B1 < A4 < B4 < A5 < B5. This implies that Zn(II) complexes has higher ηc compared to Fe(II) complexes possibly because of relative stability of its d-orbital compared to the Fe(II).
The IPCE values depend greatly on LHE, ηc and ϕinj. The general trend of the IPCE values for the dyes are B1< B4< B5< A2< B3< A5< A3<B2< A1< A4 (Table 2). This suggests that the A-series (Fe(II) complexes) relatively shows higher IPCE values compared to the B-series dyes (Z(II) complexes). This may be due to the presence of vacant d-orbitals and the presence of higher number of unpaired electrons in Fe(II) relative to Zn(II). IPCE values of molecule A4 in comparison to molecule A5 also indicates that the presence of electron donating groups in positions 2 and 9 of the phenanthroline complexes positively affect the IPCE compared to when they occur in positions 5 and 6.
4. ConclusionsDFT/TD-DFT method was employed to study the photo-voltaic and photo-physicochemical properties of Fe(II) and Zn(II) phenanthroline complexes for possible application as photosensitizers in dye sensitized solar cells (DSSCs). All the molecules were predicted to show unfavourable electronic properties that can optimally support photovoltaic processes. This is due to the unfavourable alignment of the dyes’ LUMO positions to that of the TiO2 CB edge. The IPCE values nonetheless, shows that Fe(II) phenanthroline complexes are better suited for the application than Zn(II). It was also observed that electron donating groups at positions 2 and 9 ofthe phenanthroline may improve photovoltaic response of the dyes.
References 1. Shalini. S.; Balasundaraprabhu. R.; Kumar. T.; Prabavathy. N.; Senthilarasu. S.; Prasann. S.
(2016). Status and outlook of sensitizers/dyes used in dye sensitized solar cells (DSSC): areview. Int. J. Energy Res. 40, 1303-1320.
2. Butler. M. A.; Ginley. D. S. (1980). Principles of photo-electrochemical, solar energyconversion. J. Mater. Sci. 15, 1-19
3. Katono. M.; Bessho. T.; Wielopolski. M.; Marszalek. M.; Moser. J. E.; Humphry-Baker. R.;G t e . M. (2012). Influence of the Anchoring Modes on the Electronic and Photovoltaic Pope ties of D− π–A Dyes. J. Phys. Chem. C. 116, 16876–16884.
4. Sauvage. . Decoppet. . D. ha g. M. a ee uddi . . M. omte. P. Na ee uddi . M. G t e . M. . ffectof se siti e adso ptio tempe atu e o the pe fo ma ce of dye-sensitized solar cells. J. Am. Chem.Soc. 133, 9304–9310.
18

5. Bessho. T.; Zakeeruddin. S. M.; Yeh. C. Y.; Diau. E. W. G.; Grätzel. M. (2010). Highlyefficie t mesoscopic dye‐se siti ed so a ce s based o do o –accepto ‐substituted porphyrins.Angew. Chem. Int. 49, 6646-6649.
6. Nazeeruddin. M. K.; De Angelis. F.; Fantacci. S.; Selloni. A.; Viscardi. G.; Liska. P.;Grätzel. M. (2005). Combined experimental and DFT-TDDFT computational study ofphotoelectrochemical cell ruthenium sensitizers. J. Am. Chem. Soc. 127, 16835–16847
7. Shen. Y.; Sullivan. B. P. (1995). A versatile preparative route to 5-substituted-1, 10-phenanthroline ligands via 1, 10-phenanthroline 5, 6-epoxide. Inorg. Chem.. 34, 6235-6236.
8. Pramanik. A.; Sarkar. S.; Pal. S.; Sarkar. P. (2015). Pentacene–fullerene bulk-heterojunctionsolar cell: A computational study. Phys. Lett. A. 379, 1036-1042.
9. Kim. J.; Pellacini. F. (2002). Jigsaw image mosaics. Acm. T. Graphic. 21, 657-664.10. Sanusi. K.; Fatomi. N. O.; Borisade. A. O.; Yilmaz. Y.; Ceylan. Ü.; Fashina. A.; (2019). An
approximate procedure for profiling dye molecules with potentials as sensitizers in solar cellapplication: A DFT/TD-DFT approach. Chem. Phys. Lett. 723, 111-117.
11. Xu. Y.; Schoonen. M. (2000). The absolute energy positions of conduction and valencebands of selected semiconducting minerals. Am. Miner. 85, 543-556.
19
Effects of substituents on the electronic properties of selected porphyrinoid systems for dye-sensitized solar cells (DSSCs)
Yusuf Yilmaz1, Kayode Sanusi2,*
1NT Vocational School, Gaziantep University, 27310 Gaziantep, Turkey 2Department of Chemistry, Obafemi Awolowo University, Ile-Ife, Nigeria
Abstract
Thirty-four dye molecules (A1 – A9, B1 – B9, C1 – C7 and D1 – D9) from four different classesof porphyrinoids (porphyrazines, porphyrins, corroles, and corrolazines) and possessing differentelectron withdrawing and electron donating groups were investigated using DFT/TD-DFT methods, as potential photosensitizers in dye-sensitized solar cells (DSSCs). The electronic structure property obtained via TD-DFT calculations were used in estimating the photo-physicochemical and photovoltaic properties of the molecules. The potential difference (𝛿𝛿p) between the lowest unoccupied molecular orbital (LUMO) position of the dyes and TiO2conduction band (CB) edge were obtained from the electronic structure data. Fluorescence emission factor of the dyes were calculated from integrated absorption and emission spectral data. Charge collection (𝜂𝜂c), light harvesting (LHE) and incident photon conversion efficiencies were estimated from the computed electronic absorption and emission data.
Keyword: Incident photon conversion efficiency (IPCE), electronic absorption, emission factor, excited state
1. IntroductionDye-Sensitized solar cells (DSSCs) have been extensively studied as an alternative tosiliconbased solar cells since their invention in 1991 [1,2]. They have attracted considerableresearch attention owing to their simple structure, modularity, flexibility and low production cost[3-8].
In a DSSC, a suitable wavelength of light is absorbed by the incorporated dye acting as sensitizer and adsorbed on the TiO2 semiconductor thin film. A charge separation thereafter occurs at the interface between the sensitizer and the TiO2 via a photo-induced electron transfer from the highest occupied molecular orbital (HOMO) of the dye to the conduction band (CB) of the TiO2semiconductor. The electron released is transported to the external circuit through the charge collectors [4-6]. The electron of the dye molecule would then be replenished by a redox couple system (e.g. iodide/triiodide), and which in itself is regenerated by electrons from the external circuit [9].
This study investigates by density/time-dependent density functional theory method the electronic properties of some selected porphyrinoid systems. The studied dyes belong to four
20

different classes in the porphyrinoid family, namely- the porphyrazines (A series), porphyrins (Bseries), corroles (C series), and corrolazines (D series) as shown in Fig. 1. Major factors that ledto our choice of these set of compounds include their unique electronic and electrochemicalproperties which made them suitable for many advanced technological applications, such as photonics, opto-electronics, photo-and electro-catalysis, sensing and photovoltaics [10-13].
Fig. 1. Structures of the investigated dye sensitizers
2. Computational detailsGeometry optimization of the porphyrinoids were carried out using the B3LYP exchange andcorrelation functionals [14] with either a 6-31+g(d,p), 6-31g or 6-31g(d) depending on thecomplexity of the molecular structures. The 6-31+g(d,p) was used for almost all the compoundsexcept in C3 where 6-31g, and A5 and B5 where 6-31g(d) basis sets were used for geometryoptimizations. The sensitizers having central metals were optimized using a mixed basis set ofthe form lanl2dz/6-31xg(y,w) where x = +/0, y = d/0 and w = p/0. All the calculations wereperformed in gas phase using Gaussian 09W software package [15]. Time-dependent self-consistent-field density functional theory (TD-SCF DFT) method was employed for the
21

electronic property description using the same level of theory adopted for the geometry optimization and frequency calculation for each molecule.
3. Results and DiscussionRu based dyes have been shown to achieve high efficiencies as photosensitizers in DSSCs [16], however, dye A8 was observed to give a LUMO state that lies below the CB edge of the TiO2semiconductor indicating non-spontaneous charge transfer to the TiO2 conduction band. This is also true of dye A4 shown in the MO-energy diagram in Fig. 2. A potentially good dye is expected to have its LUMO slightly above the CB edge of the TiO2 semiconductor for efficient charge transfer while the HOMO should be slightly below the potential energy level of the redox couple 3I-/I-
3[9]. The studies dyes were shown to fit these criteria with the exception of A4, A8and C3 Fig. 2.
Fig 2. Electronic bandgap of investigated dyes
3.1 Photovoltaic properties. The estimated Light Harvesting Efficiency (LHE) which is the fraction of light intensity absorbed by the dye at a certain wavelength. The data in Table 1 shows the LHE values of dye B4 and B5 to be sufficiently high, which is an indication that they would absorb strongly in the 200-800 nm wavelength range. The LHE values of B4 and B5 are very close and quite surprisingsince the substituents on the two porphyrin rings are both very strongly electron withdrawing andelectron donating substituents respectively. One would have expected the values to be in twodifferent extremes. The observed trend for the dyes with the best LHE value in each of the seriesis C3 < B4 < D9 < A5. The charge collection efficiency (𝜂𝜂𝒄𝒄) is highest in D4, and the trendobserved by taking the dye with the highest value of 𝜂𝜂𝒄𝒄 from each series is C4 < B8 < A4 < D4.
22

The incident photo conversion efficiency (IPCE) depends on three efficiency factors, that is, the LHE, 𝜂𝜂𝒄𝒄 and 𝜙𝜙inj, hence is used as the main parameter to predict the overall photovoltaic performance of a photosensitizer. A good photosensitizer should have a high IPCE value. InTable 1, the results show the highest value of IPCE was obtained for dye A5 while molecule C1 has the lowest value. It can also be seen that all the dyes in series C have very low IPCE therefore may not be well suitable for DSSC application. The general trend for IPCE for the best candidate dye from each series is C3 < B4 < D9 < A5.
Table 1: Photovoltaic properties of the studied dyes Dye f фf LHE 𝜂𝜂𝒄𝒄 IPCE δp (eV)
A1 0.1367 3.5×10⁻³ 0.27 20.68 1.9×10⁻¹² -0.58 0.69 A2 0.1753 9.2×10⁻³ 0.33 9.55 2.9×10⁻¹² -0.89 0.98 A3 0.1888 1.0×10⁻⁶ 0.35 6.56 2.3×10⁻¹⁶ -0.94 1.16 A4 0.1256 5.1×10⁻³ 0.25 210.49 2.7×10⁻¹¹ +0.33 -0.20A5 0.3701 2.6×10⁻¹ 0.57 6.77 1.0×10⁻¹⁰ -1.45 1.14A6 0.1886 1.0×10⁻² 0.35 8.19 3.0×10⁻¹² -1.00 1.06A7 0.1416 2.6×10⁻³ 0.28 142.58 1.0×10⁻¹¹ -0.16 0.25A8 0.1679 1.2×10⁻⁸ 0.32 14.29 5.6×10⁻¹⁸ +0.50 -0.79A9 0.1539 7.1×10⁻⁶ 0.30 15.19 3.2×10⁻¹⁵ -0.57 0.78B1 0.7496 1.1×10⁻⁴ 0.82 3.69 3.3×10⁻¹⁴ -2.18 1.63B2 0.8800 4.9×10⁻⁴ 0.87 2.73 1.1×10⁻¹³ -2.63 1.85B3 0.8862 9.5×10⁻⁵ 0.87 2.18 1.8×10⁻¹⁴ -2.63 2.02B4 1.2203 3.4×10⁻⁴ 0.94 15.45 4.9×10⁻¹³ -1.49 0.75B5 1.1882 2.0×10⁻³ 0.94 1.88 3.6×10⁻¹³ -2.94 2.16B6 0.8851 9.9×10⁻⁴ 0.87 2.56 2.2×10⁻¹³ -2.73 1.90B7 0.9456 4.8×10⁻⁶ 0.89 6.59 2.8×10⁻¹⁵ -2.00 1.18B8 0.6618 3.8×10⁻⁵ 0.78 32.48 9.8×10⁻¹⁴ -2.64 0.53B9 0.9612 9.3×10⁻⁴ 0.89 3.14 2.6×10⁻¹³ -2.19 1.72
4. ConclusionsThe geometries, electronic and optical characteristics of some selected of porphyrinoid dyes (A1– A9, B1 – B9, C1 – C7 and D1 – D9) have been predicted using DFT and TD-DFT calculations.The study showed that some of the chosen porphyrinoids have their LUMO greater than the CBedge of the TiO2 (-4.21 eV) indicating that charge transfer from these dyes to would benegatively impacted. The data showed that the dyes from the C series have lowest photovoltaicperformnace. The results showed that molecule A5 would be the best photosensitizer among thethirty-four (34) dyes investigated due to its high IPCE as a result of its small energy gapcompared to the other studied porphyrinoids.
References
1. O’Regan, B.; Grätzel, M. A Low-cost, high-efficiency Solar cell based on dye-sensitizedcolloidal TiO2 films. Nature, 1991, 353, 737–740.
2. Grätzel, M. Photoelectrochemical cells. Nature, 2001, 414, 338–344.3. Saehana, S.; Darsikin, F.; Yuliza, E.; Arifin, P.; Khairurrijal A.; Abdullah, M. A new
approach for fabricating low cost DSSCs by using carbon-ink from inkjet printer and itsimprovement efficiency by depositing metal bridge between titanium dioxide particles. J.Sol. Energy Eng., 136, 2014, 44504-44509.
4. Xu, F.; Zhu. K.; Zhao. Y. The layer boundary effect on multi-layer mesoporous TiO2 film-based dye sensitized solar cells. RSC Adv., 2016, 6, 98167–98170.
23

5. Luo, S. Transparent conductive oxide nanocrystals: new synthesis route, characterizationand applications. HKUST Lib., 2014, 120-124.
6. Ellmer, K.; Klein, A.; Rech, B. Transparent conductive zinc-oxide: basics and applicationsin thin film solar cells. J. Mater. Sci., 2007, 446.
7. Kim, H.J.; Lee, D.Y.; Koo, B.K.; Lee, W.J.; Song, J.S. Preparation and characterization ofPt counter electrode with buffer layer for dye-sensitized solar cell. Solid State Phenom.,2007, 119, 283–286.
8. Murakami, K.; Fujiwara, S.; Kobayashi, D.; Ishihara, H.; Shimomura, M. Nanostructuralcontrol of Pt layer on counter electrode for application to dye-sensitized solar cells. Adv.Mater. Res., 2011, 222, 126–129.
9. Sanusi, K.; Fatomi, O.N.; Borisade, A.; Yilmaz, Y.; Ceylan, Ü.; Fashina, A. An approximateprocedure for profiling dye molecules with potentials as sensitizers in solar cell application:A DFT/TD-DFT approach. Chem. Phys. Lett., 2019, 723, 111-117.
10. Minari, T.; Seto, M.; T. Nemoto. Molecular-packing-enhanced charge transport in organicfield-effect transistors based on semiconducting porphyrin crystals. Appl. Phys. Lett, 2007,91, 123501.
11. Groves, J.T. Reactivity and mechanisms of metalloporphyrin‐catalyzed oxidations. J.Porphyr. Phthalocyanines, 2000, 4, 350-352.
12. Drain, C.M.; Hupp, J.T.; Suslick, K.S. J. A perspective on four new porphyrin-basedfunctional materials and devices. J. Porphyr. Phthalocyanines, 2002, 6, 243-258.
13. Liu, Y.; Guo, X.; Xiang, N. Synthesis and photovoltaic properties of polythiophene starswith porphyrin core. J. Mater. Chem., 2010, 20, 1140-1146.
14. Lee, C.; Yang, W.; Parr, R.G. Development of the Colle-Salvetti correlation-energy formulainto a functional of the electron density. Annu. Rev. Condens. Matter Phys., 1988, 37, 785.
15. Gaussian 09, Revision D.01, Frisch, M. J.; Trucks, G.W.; Schlegel, H.B.; Scuseria, G.E.;Robb, M.A.; Cheeseman, J.R.; Scalmani, G.; Barone, V.; Mennucci, B.; Petersson, G.A.;Nakatsuji, H.; Caricato, M.; Li, X.; Hratchian, H.P.; Izmaylov, A.F.; Bloino, J.; Zheng, G.;Sonnenberg, J.L.; Hada, M.; Ehara, M.; Toyota, K.; Fukuda, R.; Hasegawa, J.; Ishida, M.;Nakajima, T.; Honda, Y.; Kitao, O.; Nakai, H.; Vreven, T.; Montgomery, J.A.; Jr.; Peralta,J.E.; Ogliaro, F.; Bearpark, M.; Heyd, J.J.; Brothers, E.; Kudin, K.N.; Staroverov, V.N.;Keith, T.; Kobayashi, R.; Normand, J.; Raghavachari, K.; Rendell, A.; Burant, J.C.; Iyengar,S.S.; Tomasi, J.; Cossi, M.; Rega, N.; Millam, J.M.; Klene, M.; Knox, J.E.; Cross, J.B.;Bakken, V.; Adamo, C.; Jaramillo, J.; Gomperts, R.; Stratmann, R.E.; Yazyev, O.; Austin,A.J.; Cammi, R.; Pomelli, C.; Ochterski, J.W.; Martin, R.L.; Morokuma, K.; Zakrzewski,V.G.; Voth, G.A.; Salvador, P.; Dannenberg, J.J.; Dapprich, S.; Daniels, A.D.; Farkas, O.;Foresman, J.B.; Ortiz, J.V.; Cioslowski, J.; and Fox, D.J. Gaussian, Inc., Wallingford CT,2013.
16. Backler, F.; Wilson, G.J.; Wang, F. Rational use of ligand to shift the UV–vis spectrum ofRu-complex sensitiser dyes for DSSC applications. Radiat. Phys. Chem., 2019, 161, 66–71.
24

WIDE BAND METAMATERIAL ABSORBER WITH LUMPED ELEMENT
HÜSEYİN KORKMAZ1, UĞUR CEM HASAR1
1Gaziantep University, Engineering Faculty, Department of Electrical and Electronics Engineering, Gaziantep, Turkey
Abstract
Many researchers take attention to the significance of harvesting energy from electromagnetic radiation to use in sensor networks. The purpose of this study is to design and analysis of ametamaterial absorber that has the ability to absorb energy in the microwave frequency band with perfect absorption. The results show that the proposed design is a good candidate for supply power from electromagnetic waves to sensor networks.
Keywords: Microwave, Metamaterials, Wide band absorber, Perfect absorption.
1. Introduction Energy requirement increase day by day with the technological development that we have in the 21.century. This situation emphasize by goverments, institutions, and researchers in every platform [1]. Energy is very important for industrial and financial development of every goverments. Many studies take attention to significance of harvesting energy from electromagnetic waves to use many applications [2-3].
Metamaterials are a new concept of multidisciplinary research area which is associated to artificial material for determine physical properties that not available independently in nature [4]. Due to this remarkable properties of metamaterial, they have used in many applications [5-6]. Generally, properties and composition of metamaterials depend on the periodic arrangement of structure and unit wavelength of subsystems [8]. Recently, metamaterials have ability to absorb electromagnetic radiation with high level of efficiency studied first time by Landy et al [7].
Dincer et al. designed metamaterial absorber that show tunable dual band. It includes a ring resonator with gap loaded varactor diode that operates in the microwave frequency band [10]. Gunduz et al. presented a multi-band metamaterial absorber based on concentric ring resonators can be used in many microwave applications [11]. Dincer et al designed a new perfect metamaterial absorber based on square resonator with gap and investigated in GHz regime. New design achieved above 90% absorption level at resonance frequency [12]. Karaaslan et al. presented a multiband absorber based on multilayer square split ring structure to be used in the frequency of satellite communication region. The proposed metamaterial absorber reached above 90% absorption level [13]. Al badri et al. designed a absorber based on metamaterial and lumped resistance with aim of harvesting energy from electromagnetic waves to supply power to sensor networks. The structure has ability to reach above 90% absorption level by using one spiral ring and 400 ohm lumped resistance [9].
25

In this work, we investigated and analyzed Reference 9 to get same results with originalpaper. After getting same result with Reference 9, we changed thickness of dielectric substrate (increase from 2.5 mm to 2.8 mm) and “d” parameter (decrease from 1 mm to 0.72 mm) to get better results if we compare with original paper. Geometrical dimension configuration of proposed design provide 90% above absorption with wide band in between 13.3 GHz and16.8 GHz. Also proposed design provide perfect absorption in between 13.6 GHz and 16.5GHz.
2. Design The proposed unit cell structure and dimensions are shown in Figure 1. The proposed designbased on spiral ring with two turns that operate as a wide band absorber in the microwave frequency region. The proposed design consist of three layers. A square spiral metalic ring is the top layer of structure. Under the top layer Flame Reterdant (FR-4) is located as a dielectric layer of proposed design which has 𝜖𝜖𝑟𝑟=5 dielectric constant and tan𝛿𝛿=0.004 loss tangent value. Also, dimension parameters are also set out in tabular form in Table 1.
Figure 1. Top view of the proposed design with geometric dimensions [9]
The ground layer is copper with 35 𝜇𝜇𝜇𝜇 thickness which behave as a mirror to prevent all transmission waves and increase absorption level of proposed design. Therefore, scattering parameter 𝑠𝑠21 is zero [9][14]. In order to get perfect wide band absorption the proposed structure was simulated with full wave electromagnetic software established on Finite Integration Technique (FIT), with frequency domain solver. The proposed design operated at frequency ranging from 11 GHz to 20 GHz. During the simulation, periodic boundary condition is applied along the x and y directions. The propagation constant is in negative direction on the z-axis. Additionally, electric field (E) and magnetic field (H) are applied in the positive direction on the y-axis and positive direction on the x-axis, respectively [9].
Table 1. Geometric parameter and value of proposed design. Parameter Value (mm)
l1 l2 Lx Ly d g w
Thickness of dielectric
5 7 11 11
0.72 0.5 0.5 2.8
26

3. Results and DiscussionAccording to general formula of the absorption shown in equation 1, 𝑠𝑠11(ω) and 𝑠𝑠12(ω) are the scattering parameters which are functions of power flow from reflected and transmitted radiations, respectively [15].
A(ω) = 1 − |𝑠𝑠11(ω)|^2− |𝑠𝑠12(ω)|^2 (1)
Due to copper ground layer behave as mirror to prevent all transmission waves, 𝑠𝑠12(ω) is zero. Electromagnetic software simulation program calculate absorption according to formula in equation 2.
A(ω) = 1 − |𝑠𝑠11(ω)|^2 (2)
The result of simulation related to reflection coefficient 𝑠𝑠11^2 that we used for calculate absorption is shown in Figure 2. Figure 4 show that all plots of equation 1 parameters in together.
Figure 2. Reclection plot of proposed design.
Absorption plot of proposed design that obtained after simulation in signified frequency region are shown in Figure 3. The combination of resonant frequencies generate a wide band absorption. High absorption occur with result of spectral matching of FR-4 with the metamaterial resonance. Due to proper arrangement of geometrical dimenension configuration of proposed design achieved above 90% absorption wide band in between 13.3 GHz and 16.8 GHz. Also proposed design provide perfect absorption level in between 13.6 GHz and 16.5 GHz.
27

Figure 3. Absorption plot of proposed design.
Figure 4. Absorption, reflection and transmission plots of proposed design.
4. Comprasion with Previous StudiesIn the introduction part of this study, we mentioned about reference study that we takeattention. In this section we will show some comparisons between this study and previousstudy. As we mentioned before, we change some parameters (“thickness of dielectiric” and“d”) of the reference study to get better result. Some important parameters for this type ofstudies shown in Table 2.
Table 2. Comparison parameters with previous study. Parameter Previous study This study
Dielectric substrate Ground plate
Thickness of dielectric Value of R Value of d
FR-4 Copper 2.5 mm 400 ohm
1 mm
FR-4 Copper 2.8 mm 400 ohm 0.72 mm
28

First of all, we re-simulated simulation of reference article with the same parameters to make sure that program is working correctly. We got same results with the reference article as shown in Figure 5, Figure 6, and Figure 7. Most important coefficient of absorption, S11^2comparison for previous study and this study shown in Figure 5. We can observe from the Figure 5, changing of parameter provide better results with wider bandwidth. After obtain s11^2 of both previous study and this study, we obtained absorption plots of both study. Comparison of absorption plots for previous study and this study shown in Figure 6. It can be understand from the Figure 6, the changing of parameters increased the perfect absorption bandwidth of the proposed structure, especially between 13.6 GHz and 16.5 GHz which shows a better results than previous study.
Figure 5. Reflection plots comparison of previous study and this study.
Figure 6. Absorption plots comparison of previous study and this study.
29

Figure 7. All absorption coefficient plots comparison for both previous study and this study.
5. Conclusion A broadband metametarial absorber structure with unity absorption in specified frequency ranges is simulated in this study. Also, due to perfect geometrical arrangement of structure we achieved better results especially in between 13.6 GHz and 16.5 GHz frequency region. Comprasion of simulation results for this study and previous study provide us to realize difference between them. Contribution of the this study to the literature is energy harvestig based on a metamaterial with lumped resistance is a good candidate for the maximum absorption in the specified frequency region for supply power to sensor networks with wide absorption band and perfect absorption level via structure which is designed proper geometrical parameters.
Acknowledgments I would like to thanks my dear friends Furkan Cemal SAVAŞ, Selman YAVUZ and Ali Alper DEGER, whom I have exchanged ideas on every issue. I would like to express my respect to my dear uncle Mehmet KORKMAZ who encouraged me to pursue an academic career. Finally, I am thankful to my dear mother Nahide KORKMAZ and my father pharmacist Salih KORKMAZ who raised and educated me, for their all kinds of moral and material supports.
References 1. Shaikh, F. K., & Zeadally, S. (2016). Energy harvesting in wireless sensor networks: A
comprehensive review. Renewable and Sustainable Energy Reviews, 55, 1041-1054.2. Read, S., Lindhult, E., & Mashayekhi, A. (2016). The Inefficiencies of Energy
Efficiency: Reviewing the Strategic Role of Energy Efficiency and its Effectiveness inAlleviating Climate Change. Journal of Settlements and Spatial Planning, 2016(Spec. Iss.5), 77-87.
3. Van de Graaf, T., & Sovacool, B. K. (2020). Global Energy Politics. John Wiley & Sons.4. Feng, L., Huo, P., Liang, Y., & Xu, T. (2019). Photonic Metamaterial Absorbers:
Morphology Engineering and Interdisciplinary Applications. Advanced Materials,1903787.
5. Kasap, S., Capper, P. (Eds.). (2017). Springer handbook of electronic and photonicmaterials. Springer.
6. Ahamed, E., Faruque, M. R. I., Mansor, M. F. B., & Islam, M. T. (2019). Polarization-dependent tunneled metamaterial structure with enhanced fields properties for X-bandapplication. Results in Physics, 15, 102530.
30

7. Landy, N. I., Sajuyigbe, S., Mock, J. J., Smith, D. R., & Padilla, W. J. (2008). Perfectmetamaterial absorber. Physical review letters, 100(20), 207402.
8. Singh, G., Marwaha, A. (2015). A review of metamaterials and its applications.9. Al-badri, K. S. L. (2018). Electromagnetic broad band absorber based on metamaterial
and lumped resistance. Journal of King Saud University-Science.10. Dincer, F. (2015). Electromagnetic energy harvesting application based on tunable
perfect metamaterial absorber. Journal of Electromagnetic Waves and Applications,29(18), 2444-2453.
11. Gunduz, O. T., & Sabah, C. (2016). Polarization angle independent perfect multibandmetamaterial absorber and energy harvesting application. Journal of ComputationalElectronics, 15(1), 228-238.
12. Dincer, F., Karaaslan, M., & Sabah, C. (2015). Design and analysis of perfectmetamaterial absorber in GHz and THz frequencies. Journal of Electromagnetic Wavesand Applications, 29(18), 2492-2500.
13. Karaaslan, M., Ba˘gmancı, M., Ünal, E., Akgol, O., & Sabah, C. (2017). Microwaveenergy harvesting based on metamaterial absorbers with multi-layered square split ringsfor wireless communications. Optics Communications, 392, 31-38.
14. Obaidullah, M., Esat, V., & Sabah, C. (2017). Thin film (6, 5) semiconducting single-walled carbon nanotube metamaterial absorber for photovoltaic applications. OpticalEngineering, 56(12), 127101.
15. Rufangura, P., & Sabah, C. (2015). Dual-band perfect metamaterial absorber for solarcell applications. Vacuum, 120, 68-74
31

CAM LAMİNAT ALÜMİNYUM TAKVİYELİ EPOKSİNİN (GLARE) ÖZEL GEOMETRİLİ MATKAPLARLA DELİNMESİ: DELAMİNASYON
FAKTÖRÜ ÜZERİNE BİR ÇALIŞMA
ALİ RİZA MOTORCUa, ERGÜN EKİCİa , ENSAR YILDIRIMb
aÇanakkale Onsekiz Mart Üniversitesi, Mühendislik Fakültesi, Endüstri Mühendisliği Bölümü, Çanakkale, TÜRKİYE.
bYıldız Kalıp San. ve Tic. A.S., İstanbul, TÜRKİYE.
Abstract
Kesici takım geometrisi, kompozit malzemelerin delinmesi sırasında ortaya çıkan delaminasyon oluşumu şeklindeki delik hasarını büyük ölçüde etkilemektedir. Bu çalışmada, cam laminatalüminyum takviyeli epoksinin (GLARE) delinmesinde matkap geometrisinin delik girişi delaminasyon faktörü (Df) üzerindeki etkisi araştırılmıştır. Bu çalışmanın amacı, GLARE’in delinmesi sırasında oluşan delaminasyon kusurlarına yönelik proses iyileştirmedir. Deneylerde üç farklı takım geometrisi, üç farklı kesme hızı (60, 78, 100 m/dak) ve üç farklı ilerleme miktarı (0.10, 0.14, 0.20 mm/dev) esas alınmıştır. Deney tasarımında ve optimum kontrol faktörlerinin belirlenmesinde Taguchi L27 ortogonal dizisi kullanılmıştır. Kontrol faktörlerinin delaminasyon faktörüne olan etkilerinin belirlenmesinde varyans analizi (ANOVA) uygulanmıştır. ANOVAsonuçlarına göre Df üzerinde en etkili kontrol faktörü %35.50 katkı oranı ile ilerleme miktarı olmuşken onu %21.49 katkı oranı ile kesme hızı takip etmiştir. Kesici takım geometrisinindelaminasyon faktörü üzerinde istatistiki olarak anlamlı bir etkisi (%7.18) olmamıştır. Minimumdelik girişi delaminasyon faktörü için kontrol faktörlerinin optimum seviyeleri (T2Vc1f1); 130°uç açısına sahip T2 takım, Vc:60 m/dak kesme hızı ve f=0.10 mm/dev ilerleme miktarı olarak belirlenmiştir. Bu çalışmada ek olarak; lineer regresyon analizi uygulanarak Df için tahminseldenklemler geliştirilmiş, denklemin korelasyon katsayısı (R2) 0.728 olarak hesaplanmıştır.
Anahtar Kelimeler: Cam laminat alüminyum takviyeli epoksi (GLARE), Delik delme, Kaplamasız karbür matkap, Delaminasyon faktörü, Taguchi metodu
1. GirişCam laminat alüminyum takviyeli epoksi (GLARE), parçaların ve yapıların imalatı söz konusuolduğunda özel dikkat gerektiren, değişen metal levha katmanlarından ve kompozitkatmanlardan oluşan hibrit bir malzemedir. GLARE için uygulanabilir üretim süreçleri sınırlıolmasına rağmen laminatın bileşenleri ve bileşimi nedeniyle üretim için yeni fırsatlarsunmaktadır. Geleneksel imalat prosesleri ile ilgili olarak, genel olarak fiber metal laminatlar(FML) için olanaklar sınırlıdır. Sınırlar, kısmen laminattaki bileşenlerin özelliklerine bağlıolarak, kısmen farklı hata modlarından kaynaklanmaktadır. İşleme proseslerinde GLARE'inişleme operasyonları sırasında kesici takımların aşınması cam elyafın aşındırıcı doğasındankaynaklanmaktadır. Bununla birlikte, bu üretim sorunları, GLARE'ler için üretim işlemlerinin
32

kullanımını kısıtlayabilse de, bu laminatların hava taşıtlarında uygulanması engellenmemektedir[1-4]. GLARE, mükemmel yorulma çatlağı direnci, yüksek darbe dayanımı, yüksek mukavemet-ağırlık oranı ve yüksek sertlik-ağırlık oranı nedeniyle gelişmiş bir uçak malzemesidir vehavacılık sektöründe büyük ilgi görmektedir [5-11]. GLARE’in işlenebilirliği bileşenlerinin belirgin şekilde farklı mekanik ve termal özellikleri nedeniyle oldukça kötüdür, bu da kabuledilebilir yüzey kalitesinde hasarsız delikler elde etmeyi zorlaştırır [6]. GLARE'ler büyükpaneller halinde üretilir ve genellikle perçinleme amacıyla delme işlemi kullanılarak montaj gerektirir. Delik açma, sıkı tolerans gereksinimlerini karşılaması gereken havacılık bileşenlerinin birleştirme ve montajında kritik bir işleme sürecidir [9-13]. Havacılık yapılarında, delme, birden fazla yapısal elemanın kalıcı olarak birleştirilmesini sağlayan birincil işlemlerden biridir veişleme sırasında bir malzemenin boyutsal kararlılığı malzeme seçiminde önemli bir faktördür [7]. GLARE’in delme işlemleri, bileşenlerinin, alüminyum alaşımının ve cam elyaf takviyeli polimerlerin (GFRP) delinmesinde kullanılanlardan farklı işleme parametrelerininoptimizasyonunu gerektirir [6, 10, 11].
Kompozit-metal yığınlarının delinmesi konusunda önemli miktarda araştırma yapılmış olsa da, havacılık yapılarında kullanılan GLARE’in işlenebilirliği konusunda sınırlı çalışma yapılmıştır [4, 5]. Park vd. tarafından yapılan çalışmada hibrit GLARE laminatın delik delme tekniği, ilerleme miktarı ve kesme hızının değişimine bağlı olarak itme kuvveti, tork, yüzey kalitesi vedelaminasyon değerlendirilmiştir. Karbür kesici takımın HSS-Co'ya kıyasla daha iyi delik kalitesi ve boyut toleransı sağladığı tespit edilmiştir. İlerleme miktarıyla karşılaştırıldığındakesme hızının delaminasyon üzerindeki etkisi nispeten daha önemsiz bulunmuştur [2]. GLARE fiber-metal laminatların delinmesi sırasında kriyojenik sıvı nitrojen soğutma ve minimum miktarda yağlama (MQL) uygulamanın etkisinin araştırıldığı çalışmada kesme kuvvetleri, yüzey pürüzlülüğü, kesici takım durumu ve delinmiş deliklerin kenarına yakın üst ve alt alüminyumlevhaların yüzeyinin işleme sonrası mikro sertliği incelenmiştir. MQL ve kriyojenik sıvı nitrojen soğutucuların kullanılması kesme kuvvetlerini artırmış; bununla birlikte, kuru delme ile karşılaştırıldığında kesici takımda işlenmiş deliklerin yüzey pürüzlülüğünü, yapışmaları ve talaş oluşumunu azaltmıştır [3]. Kriyojenik sıvı nitrojen ve minimum miktarda yağlama soğutucularının kullanılmasının GLARE 2B 11/10-0.4 laminatlarda açılan delik kalitesi üzerindeki etkisinin araştırıldığı diğer bir çalışmada delik kalitesi, üst ve alt alüminyum levhaların delik kenarlarındaki çapak oluşumu incelenerek ve nominal delik boyutu ve dairesellik sapması incelenerek değerlendirilmiştir. Sonuçlar, kriyojenik ve minimum miktarda yağlama soğutucularının kullanılmasının çıkış çapak oluşumunu önemli ölçüde azaltabileceğini göstermiştir [8]. İki GLARE sınıfı (2B ve 3) için delme parametrelerinin (devir sayısı ve ilerlememiktarı) delik kalitesi üzerindeki etkilerini analiz etmek için gerçekleştirilen deneysel bir çalışmadelaminasyon alanı, delik boyutu, dairesellik hatası, giriş ve çıkış çapakları, talaş oluşumlarını ve hasarın incelenmesini içermektedir [4]. Pawar vd. tarafından yapılan çalışmanın odak noktası, GLARE’in delinmesi sırasında delaminasyon ve çapak oluşumu üzerindeki kesme parametrelerinin ve takım geometrisinin göreceli etkisini ve kesme anlamaktır. 2 ağızlı (kanallı)matkabın kullanılan dört farklı geometri içerisinde en iyisi olduğu, sıfır delaminasyon ve kabuledilebilir çapak oluşumu sağladığı ve onu da 4 yüzlü matkapların izlediği görülmüştür. Fiber takviyeli plastik (FRP) kompozitlerin delinmesinde üstün olan geleneksel 3 kanallı ve 8 yüzlü matkaplar GLARE laminatlarının delinmesinde kötü performans göstermiştir. Delmeparametreleri analiz edildiğinde, ilerleme miktarının yine delaminasyon ve çapak oluşumunu kontrol etmede kesme hızında daha baskın bir role sahip olduğu görülmüştür [5]. İnce (~2,5 mm) GLARE laminatın işlenebilirliğini değerlendirmek üzere ilerleme miktarının ve devir sayısınınkesme kuvvetleri ve delik kalitesi üzerindeki etkisini analiz etmek için yapılan çalışmada delik
33

kalitesi (yüzey pürüzlülüğü, delik boyutu, dairesellik hatası, çapak oluşumu ve delaminasyon)değerlendirilmiştir. GLARE’in delme mekanizmasının anlaşılmasına yardımcı olmak içinABAQUS/Explicit kullanılarak GLARE laminatın delinmesinin üç boyutlu (3D) sonlu eleman(FE) modeli de geliştirilmiştir [6]. GLARE’in farklı matkap ucu geometrilerine sahipmatkaplarla delinmesinde kusursuz bir delme için matkap ucunun marjının etkisi analizedilmiştir. İtme kuvveti ölçümü ve delaminasyonla ilişkisi doğru takımın takım seçimini destekleyen araştırmanın önemli noktalarından biridir. Sonuçlar, laminatların işlenmesi içinkenar boşluğu içermeyen matkap uçlarının kullanımını desteklemiştir [7]. GLARE’in delinmesinde üç farklı matkap kaplamasının (TiAlN, TiN ve AlTiN/TiAlN) itme kuvveti, delik boyutu, dairesellik, silindiriklik ve dikeylik üzerine etkilerinin araştırıldığı çalışmada TiAlN kaplı matkaplar en yüksek itme kuvveti üretmiş iken TiN kaplı matkaplar ise girişte ve çıkıştaölçülen delik çapı arasında en düşük sapma ile delikler üretmiştir. TiAlN kaplı matkaplar, deliğinüst kısmında en yüksek dairesellik sağlamışlardır. Delik silindirikliği AlTiN/TiAlN ve TiNkaplamalı matkaplar kullanıldığında en iyi olmuştur [9]. Bu çalışmanın tamamlayıcısı olan diğer bir çalışmada yine aynı araştırmacılar tarafından TiAlN, AlTiN/TiAlN ve TiN olmak üzere üç tip kesici takım kaplamasının GLARE'de açılan deliklerin yüzey pürüzlülüğü ve çapak oluşumu üzerindeki etkileri araştırılmıştır. Sabit takım geometrisinde yapılan deneysel çalışma sonucundakesme hızının ve kesici takım kaplama türünün yüzey pürüzlülüğü üzerinde en önemli etkiyesahip olduğu yine takım kaplamasının çapak yüksekliği ve çapak kökü kalınlığı üzerinde en önemli etkiye sahip olduğunu tespit edilmiştir. Minimum pürüzlülük ve çapak oluşumunu TiN kaplı matkaplar sağlamıştır [10]. 6 mm çapında karbür TiAlN kaplı helisel matkaplarkullanılarak tek yönlü (UD) 2B ve 3. kalite GLARE kompozitler üzerinde yapılan çalışmadadelme parametrelerinin itme kuvveti, tork ve yüzey pürüzlülüğü üzerindeki etkileri araştırılırken delik kalitesi ve takım durumu optik mikroskopi teknikleri kullanılarak incelenmiştir. Çalışmada hem ilerleme miktarı hem de devir sayısının kesme kuvvetleri ve delik kalitesi üzerinde önemlietkilerinin olduğu görülmüştür [11]. Tyczynski vd. tarafından yapılan çalışmada ise CFRP, GFRP, GLARE-tipi kompozitlerin özellikleri dikkate alınarak düz olmayan yüzeylerde delme ve eğimli delme işlemlerinde onların işlenebilirliği analiz edilmiş ve farklı takım geometrileri bumalzemelerin belirtilen delme işlemlerinde delinebileceği görülmüştür [12].
Yüksek kaliteli delikler elde etmek ve işlenmiş bileşenin uzun vadeli yapısal bütünlüğünü tehlikeye atabilecek delaminasyon gibi kusurları en aza indirmek için delme parametrelerinin doğru seçimi çok önemlidir [10, 11]. GLARE laminatındaki her bir bileşen malzeme farklı bir kesme parametreleri seti gerektirdiğinden, çok katmanlı malzemeyi delerken optimum kesme parametrelerinin seçimi önemlidir [2]. Bu nedenle bu çalışmada GLARE’in özel geometrili takımlarla delinmesinde delme parametrelerinin delaminasyon faktörü üzerindeki etkileri araştırılmıştır. Bu deneysel çalışma sonuçlarının GLARE’in sınırlı işlenebilirlik veri tabanına katkı sağlayacağı düşünülmektedir.
2. Malzeme ve Metot2.1. İş Parçası, Kesici Takım ve Takım TezgâhıDeneysel çalışmada iş parçası olarak kullanılan GLARE malzeme üretiminde Fibermakkompozit firmasından temin edilen 300 gr/m2 cam elyaf prepreg ve korozyon dayanımı yüksek,kaynak kabiliyeti çok iyi, soğuk şekillendirme için uygun ve yorulma dayanımı yüksek olan 0.5mm kalınlığında 5754 alüminyum alaşımı kullanılmıştır. Her bir kompozit katmanı 3 kat prepregcam fiberden oluşmaktadır (Şekil 1b). Cam elyaf Al arayüzey özelliklerinin geliştirilmesi içinAl plakalar 400 mesh zımpara ile hazırlanmıştır. GLARE numune Şekil 1’de görüldüğü gibitoplamda dört karbon katmanı ve 3 Al katmanından hazırlanmış ve 15 tonluk pres altında 125C°
34

sıcaklıkta 1 saat kürlenmiştir (Şekil 1b ve c). 5 mm kalınlığında büyük levhalar şeklinde üretilen GLARE’den su jeti/tel erozyon ile 110x80x5 mm boyutlarında kesilen iş parçası malzemeleri delme deneylerinde kullanılmıştır (Şekil 1a). Bazı çalışmalar, istifleme sırasının delaminasyon büyümesi üzerinde önemli bir etkiye sahip olduğunu göstermiştir. Öyle ki, metal iş parçasını cam elyaf katmanının altına yerleştirmek (yani GLARE’in her iki yüzeyinde -üst ve alt yüzeyinde) kompozitin giriş ve çıkış delaminasyonunu azaltabilmektedir [3]. Her bir cam elyaf tabakasının üstündeki ve altındaki alüminyum levhalar, tabakalardaki delaminasyon ve hasarı azaltmaya yardımcı olan bir yedek levha görevi görmektedir [4]. Bu bağlamda GLARE’in üretiminde literatürde belirtilen bu öneriler dikkate alınmıştır.
a) b) C Şekil 1. GLARE malzemenin yapısı a) Numunenin üstten görünüşü b)Katman yapısı
c)Numunenin kesit görünüşü
GLARE’de liflerin varlığı, her durumda, işleme süreci için keskin takım uçlarını gerektirmektedir. GLARE için olduğu gibi cam elyaflar ve karbon elyaf bazlı laminatlar için deelyaflar oldukça aşındırıcıdır ve bu da kesici takımların önemli ölçüde aşınmasına neden olmaktadır. Bu durumlarda geleneksel takım malzemeleri (kaplamalı veya kaplamasız YüksekHızlı Çelik (HSS)) yeterli olamamaktadır. GLARE için sementit karbür (kaplamasız veyakaplamalı karbür) veya seramik takım malzemeleri gibi daha sert ve aşınmaya daha dayanıklı takım malzemeleri gereklidir [1, 5, 6].
Literatürde takım geometrisinin kesme kuvvetleri ve delik kalitesi üzerindeki etkisi de incelenmiş, ikiyüzlü matkapların delaminasyon ve çapak oluşumunu ortadan kaldırdığı ve diğer dört ve sekiz yüzlü matkaplardan daha iyi performans sergilediği tespit edilmiştir [3-6, 10]. Bu nedenle delik delme deneylerinde GLARE’in işlenmesine uygun 6.35 mm çapında Şekil 2'de teknik özellikleri verilen Sandvik Coromant ve Guhring firmalarına ait özel geometrili kaplamasız sementit karbür matkaplar kullanılmıştır. Sementit karbür matkaplar yüksek sıcaklık sertliği nedeniyle deneyler için matkap malzemesi olarak seçilmiştir. Ayrıca sementit karbürler, alüminyumun sebep olduğu adhesif aşınmaya ve cam elyafların sebep olduğu abrasif aşınmaya dayanmak için yüksek aşınma direncine sahiptirler. Havacılık endüstrilerinde, normalde 6–10 mm çapında matkaplar delme için kullanılmaktadır. Ayrıca literatür, matkap çapı ne kadar yüksekse keski kenarının daha büyük olduğunu ve dolayısıyla delaminasyonun o kadar büyük olduğunu göstermektedir [5]. Bu nedenle, mevcut çalışmada matkap çapı 6.35 mm (1/4 inç) ile sınırlandırılmıştır. Genel olarak, yüksek alaşımlı çelikler ve diğer daha sert ve daha sert metal alaşımları için 135°-140° daha yüksek bir uç açısı kullanılır. Daha yumuşak kompozitler için ise 95°-118° daha düşük uç açıları tercih edilir [5]. Bu çalışmada GLARE Al5754 Al alaşımı ve cam elyaf katmanlarından oluştuğu için deneylerde sırasıyla 130°, 135° ve 118° uç açısına sahip T1, T2 ve T3 kodlu matkaplar kullanılmıştır.
35

Takım geometrisi Takım Kodu Deney Kodu
860.1 NM H10F (Uç açısı 130°) T1
452.1 CM H10F (Uç açısı 135°) T2
DIN6539 (Uç açısı 118°) T3
Şekil 2. Takım geometrileri ve kodları.
Delme deneyleri, maksimum 6000 dev/dak ve 7.5 kW güce sahip Johnford VMC 850 marka CNC dik işleme merkezinde kuru delme şartlarında ve delikler boydan boya delinerek gerçekleştirilmiştir (Şekil 3).
Şekil 3. Delme deneyleri.
2.2. Delaminasyon Ölçümü Özel geometrilere sahip kaplamasız karbür matkaplarla GLARE iş parçası malzemesi üzerinde delinen deliklerdeki delaminasyonlar bilgisayar bağlantılı Dino Lite Pro AM4000 1.3 Mgp. optik mikroskop ile görüntülenerek (Şekil 4a), Dino Capture 2.0 programıyla ölçümleri yapılmıştır (Şekil 4b). Delik girişlerinde her deliğin giriş bölgesinden maksimum olduğu belirlenen 3 delaminasyon oluşum bölgesi belirlenerek ölçüm yapılmış ve delaminasyon faktörüne dönüştürülerek kaydedilmiştir. En büyük üç delaminasyon faktörünün ölçüm sonuçlarının aritmetik ortalaması alınarak çözümlemelerde kullanılmıştır.
36

a) b) Şekil 4. Delaminasyon faktörünün hesaplanması için delaminasyon ölçümleri. a)Optik
mikroskop, b)Hasar ölçüm yazılımı
2.3. Taguchi Metodu İle Deneysel Tasarım GLARE’in özel geometrili kesici takımlarla delinmesinde delik girişi delaminasyon faktörü üzerinde delme parametrelerinin etkilerini belirlemek amacıyla Taguchi Metodu kullanılmış veortogonal dizi olarak L27 (33) seçilmiştir [13]. Taguchi metodu süre ve maliyetin azaltılması içinetkili bir yöntem olup en iyi parametre değerleri sistematik olarak belirlenebilmektedir [13]. Bu çalışmada GLARE ince Al5754 Al alaşımı katmanlarından ve cam elyaf katmanlarından oluşmaktadır. Dolayısıyla kesme hızı ve ilerleme miktarı gibi delme parametrelerinin, tek tek malzemeler üzerinde kullanılanların ortalaması olması gerektiği düşünülmüştür. Alüminyumun delinmesi için genellikle yüksek kesme hızı ve yüksek ilerleme miktarı tavsiye edilirken cam elyafı delmek için yüksek kesme hızı ve düşük ilerleme miktarı tercih edilmektedir. Bu nedenle,hem Al5754 Al alaşımını hem de cam elyafı delmek için yüksek kesme hızı koşulu yaygındır [5]. Bu bilgiler çerçevesinde GLARE üzerinde yapılan ön deneyler, kesici takım firmalarının önerileri ve kesici takım-takım tezgâhının performansları göz önünde bulundurularak Tablo 1'de verilen delme parametrelerinin uygun seviyeleri belirlenmiştir.
Tablo 1. Delme parametreleri ve seviyeleri. Sembol Kontrol Faktörleri Birim Seviye 1 Seviye 2 Seviye 3 A Kesici Takım, (T) - T1 T2 T3 B Kesme Hızı, (Vc) m/dak 60 78 100 C İlerleme Miktarı, (f) mm/dev 0.10 0.14 0.20
GLARE'in delinmesinde delaminasyon faktörü değerlerinin en düşük olması istendiğinden bağımlı değişkenin kalite karakteristiği sinyal/gürültü (S/N) oranları dB cinsinden “Daha küçük daha iyi” yaklaşımına göre hesaplanmıştır [13]. Her bir kontrol faktör seviyelerinin Df üzerindeki etkileri S/N oranları kullanılarak analiz edilmiştir. Ayrıca, kontrol faktörlerinin ana etkileri % 95 güven seviyesinde gerçekleştirilen Varyans Analizi (ANOVA) ile belirlenmiştir. ANOVA analizlerinden anlamlı etkileri tespit edilen kontrol faktörlerinin optimal seviyeleri ile tahminsel optimal kalite karakteristiği (Tahminsel optimal delaminasyon faktörü; Df_opt) belirlenmiştir. Doğrulama deneyleri kalite karakteristiğini belirlemek için güven aralığı (CI) hesaplanmıştır [13]. TM ile elde edilen tahminsel değerlerle kıyaslamak ve TM'nin tahmin yeteneğini belirlemek amacıyla lineer regresyon analizi ile bir tahminsel denklem geliştirilmiştir.
37

3. Bulgular ve Tartışma3.1. GLARE’in Delinmesinde Delaminasyon OluşumuYapılan deneylerde GLARE malzemenin delik girişinde oluşan delaminasyonun görüntüleri Şekil 5'te sunulmuştur. GLARE’in kaplamasız karbür yeni takımlarla kısa süreli delme işlemlerinde en üst katmandaki cam elyaf tabakada delaminasyon oluşmuştur. Yükseksıcaklıklarda talaş ve lifler kesici takıma yapışarak laminat kenarlarına ve deliği yüzeylerine zorlanarak istenmeyen deformasyonlara ve delaminasyona yol açmıştır (Şekil 5b) [4-6]. Delik giriş yüzeyinde oluşan bu delaminasyonlar montaj problemi yaratacaktır.
a) b) Şekil 5. GLARE’in delinmesinde delaminasyon oluşu a)Deliklerin giriş yüzeyinde oluşan
delaminasyonlar b)Delaminasyon oluşumunun büyütülmüş görüntüsü (20 nolu deney)
3.1. İstatistiksel Analiz GLARE’in özel geometriye sahip kaplamasız karbür takımlarla delinmesinde elde edilmiş delaminasyon faktörü sonuçlarının aritmetik ortalaması (Df) Tablo 2'de sunulmuştur. GLARE’in Df ölçümlerinin aritmetik ortalamaları Minitab 16.1 paket programında çözümlenmiş, grafiklerin çiziminde ve kontrol faktörleri etkilerinin değerlendirilmesinde kullanılmıştır.
Tablo 2 ve Tablo 3’ten görüleceği üzere; 130° uç açısına sahip (860.1 NM H10F) T1 kodlu takımlarla delik delme delmede Df=1.337, 135° uç açısına sahip (452.1 CM H10F) T2 kodlu takımlarla Df=1.269 ve son olarak 118° uç açısına sahip (DIN6539) T3 kodlu takımlarla Df=1.307 olarak elde edilmiştir. Buradan; Buradan GLARE’in T2 takımlarla delinmesinde delaminasyon oluşumunun T1 takıma göre %5.35, T3 takıma göre %3.0 daha düşük olduğunu söylemek mümkündür. Yani, T2 takım kullanmak minimum delaminasyon oluşumu üzerinde daha etkili olmuştur. Tüm kontrol faktör seviyelerinin ortalama S/N oranı değerleri ve ortalama yanıt değerleri Tablo 3’te sunulmuştur. Sinyal değeri sistemin verdiği ve ölçülmek istenen gerçek değeri temsil ederken, gürültü faktörü ölçülen değer içerisindeki istenmeyen faktörlerin payını temsil etmektedir [13]. S/N oranı analizi, seçilen şartlar altında GLARE’in özel geometrili matkaplarla delinmesi işleminin doğası hakkında önemli bilgiler vermiştir [13]. Kontrol faktörlerinin her birinin farklı seviyelerinde hesaplanan en yüksek ve en düşük S/N oranı değerleri arasındaki farkların daha yüksek ya da az olması Df üzerindeki etkili faktörlerin belirlenmesinde kullanılmıştır [13]. Tablo 3’te "*" ile belirtildiği üzere, özel geometrili
38
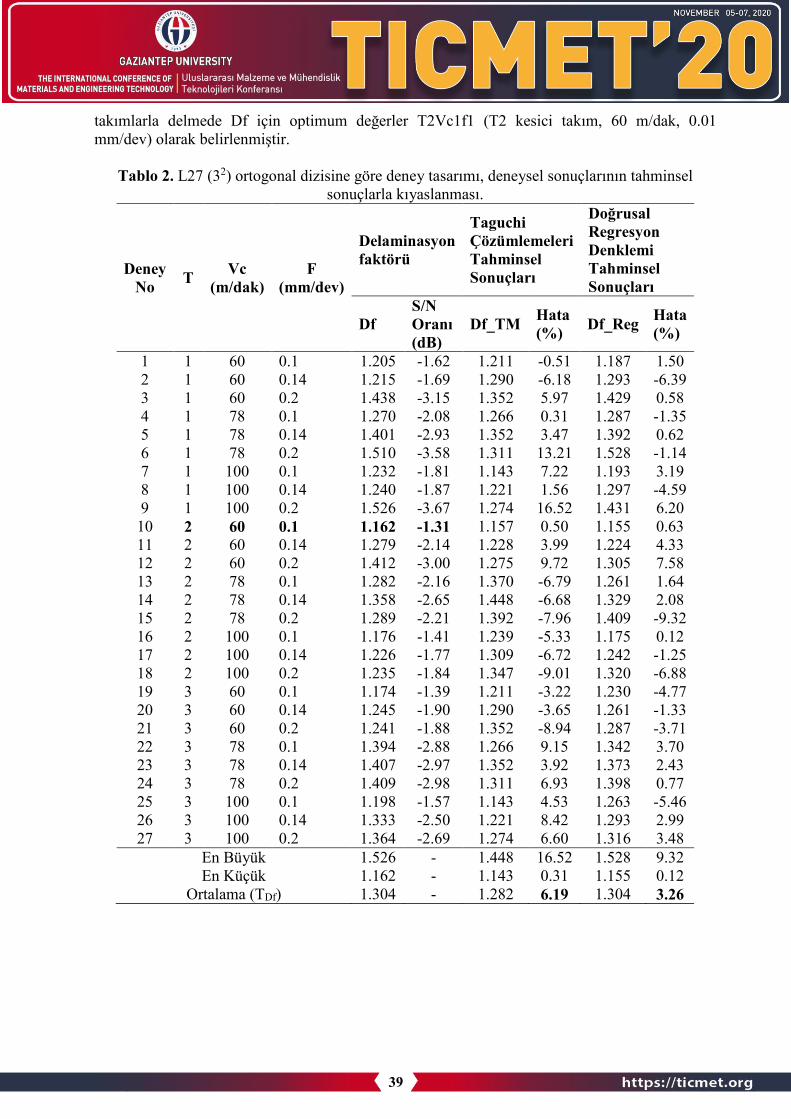
takımlarla delmede Df için optimum değerler T2Vc1f1 (T2 kesici takım, 60 m/dak, 0.01mm/dev) olarak belirlenmiştir.
Tablo 2. L27 (32) ortogonal dizisine göre deney tasarımı, deneysel sonuçlarının tahminsel sonuçlarla kıyaslanması.
Deney No T Vc
(m/dak) F
(mm/dev)
Delaminasyon faktörü
Taguchi Çözümlemeleri Tahminsel Sonuçları
Doğrusal Regresyon Denklemi Tahminsel Sonuçları
Df S/N Oranı (dB)
Df_TM Hata (%) Df_Reg Hata
(%)
1 1 60 0.1 1.205 -1.62 1.211 -0.51 1.187 1.502 1 60 0.14 1.215 -1.69 1.290 -6.18 1.293 -6.393 1 60 0.2 1.438 -3.15 1.352 5.97 1.429 0.584 1 78 0.1 1.270 -2.08 1.266 0.31 1.287 -1.355 1 78 0.14 1.401 -2.93 1.352 3.47 1.392 0.626 1 78 0.2 1.510 -3.58 1.311 13.21 1.528 -1.147 1 100 0.1 1.232 -1.81 1.143 7.22 1.193 3.198 1 100 0.14 1.240 -1.87 1.221 1.56 1.297 -4.599 1 100 0.2 1.526 -3.67 1.274 16.52 1.431 6.2010 2 60 0.1 1.162 -1.31 1.157 0.50 1.155 0.6311 2 60 0.14 1.279 -2.14 1.228 3.99 1.224 4.3312 2 60 0.2 1.412 -3.00 1.275 9.72 1.305 7.5813 2 78 0.1 1.282 -2.16 1.370 -6.79 1.261 1.6414 2 78 0.14 1.358 -2.65 1.448 -6.68 1.329 2.0815 2 78 0.2 1.289 -2.21 1.392 -7.96 1.409 -9.3216 2 100 0.1 1.176 -1.41 1.239 -5.33 1.175 0.1217 2 100 0.14 1.226 -1.77 1.309 -6.72 1.242 -1.2518 2 100 0.2 1.235 -1.84 1.347 -9.01 1.320 -6.8819 3 60 0.1 1.174 -1.39 1.211 -3.22 1.230 -4.7720 3 60 0.14 1.245 -1.90 1.290 -3.65 1.261 -1.3321 3 60 0.2 1.241 -1.88 1.352 -8.94 1.287 -3.7122 3 78 0.1 1.394 -2.88 1.266 9.15 1.342 3.7023 3 78 0.14 1.407 -2.97 1.352 3.92 1.373 2.4324 3 78 0.2 1.409 -2.98 1.311 6.93 1.398 0.7725 3 100 0.1 1.198 -1.57 1.143 4.53 1.263 -5.4626 3 100 0.14 1.333 -2.50 1.221 8.42 1.293 2.9927 3 100 0.2 1.364 -2.69 1.274 6.60 1.316 3.48
En Büyük 1.526 - 1.448 16.52 1.528 9.32En Küçük 1.162 - 1.143 0.31 1.155 0.12
Ortalama (TDf) 1.304 - 1.282 6.19 1.304 3.26
39

Tablo 3. Delaminasyon faktörü ve delaminasyon faktörünün sinyal-gürültü oranları için yanıt tablosu (Daha küçük daha iyi).
Seviye Df S/N_Df T Vc f T Vc f
1 1.337 1.263* 1.233* -2.489 -2.008* -1.803*2 1.269* 1.369 1.300 -2.053* -2.715 -2.2693 1.307 1.281 1.380 -2.305 -2.125 -2.776
Fark 0.069 0.105 0.148 0.436 0.707 0.973 Sıralama 3 2 1 3 2 1
*Optimum seviye
Kontrol faktörlerinin Df üzerindeki etkilerini belirten ana etki grafikleri Şekil 6a'da, Df için ana S/N oranı için ana etki grafikleri ise Şekil 6b’de sunulmuştur. Şekil 6a'da görüleceği üzere; özel geometriye sahip kaplamasız karbür matkaplarla delmede Df için kontrol faktörlerinin optimum seviyeleri Tablo 3a’daki verileri destekler şekilde; T2 takım (135° uç açısına sahip 452.1 CMH10F kodlu takım), Vc=60 m/dak, f=0.10 mm/dev şeklindedir. 135° uç açısına sahip T2 kesici takımla gerçekleştirilen delik delme operasyonlarında daha düşük delaminasyon faktörü elde edilmiş, kesme hızı ve ilerleme miktarının arttırılmasıyla delaminasyon faktörü değerleri artmıştır. Çünkü, daha yüksek ilerleme miktarı ve kesme hızlarında artan itme kuvveti ve tork daha fazla delaminasyon oluşumuna da sebep olmaktadır [5, 6, 13]. Kesme hızındaki artışla, delaminasyon faktörü önce artmış daha sonra azalmıştır ki bu sonuç Pawar vd’nin sonuçlarıyla uyumludur [5]. Daha yüksek hızda delaminasyon faktöründeki bu azalma epoksi matrisin ve alüminyumun artan termal yumuşamasına bağlı olabileceği düşünülmektedir [5].
a) b) Şekil 6. Ana etki grafikleri (Daha küçük daha iyi) a)Delaminasyon faktörü için, b) Delaminasyon
faktörü S/N oranı için
Seçilen performans/kalite karakteristiklerine kontrol faktörlerinin etkilerini belirlemek için L27 (33) ortogonal dizideki her bir deney için % 95 güven aralığında varyans analizi (ANOVA)yapılmıştır. Df için yapılan ANOVA sonuçları Tablo 4’te sunulmuştur. Df üzerinde en etkilifaktör %35.50 katkı oranıyla ilerleme miktarı olmuştur. İlerleme miktarını %31.49 katkı oranı ilekesme hızı takip etmiştir (Tablo 4). Kesici takımın (T) ve kontrol faktörlerinin etkileşimlerininDf üzerindeki etkileri istatistiki olarak (P<0.05 olduğu için) anlamlı olmamıştır. ANOVA’nınkorelasyon katsayısı 0.92 olarak hesaplanmıştır. Korelasyon katsayısının yüksek olması kontrolfaktörünün ve kontrol faktörlerinin Df üzerindeki % etkilerinin yüksek doğrulukla belirlenmişolduğunu göstermektedir. Giasin vd. tarafından yapılan çalışmada da GLARE’in 6 mm çapındave 140° uç açılı TiAlN kaplı sementit karbür helisel matkapla delinmesinde devir sayısı
40

(dolayısıyla kesme hızı) ve ilerleme miktarı delaminasyon üzerinde etkili parametreler olaraktespit edilmiş ve bu parametrelerin uygun kombinasyonlarında delme işlemi yaparken yüzeyde delaminasyon içermeyen delikler elde etmenin mümkün olabileceği belirtilmiştir [4, 6]. Pawar vd. tarafından yapılan çalışmada da bu çalışmada elde edilen sonuçları destekler şekilde GLARE’in delinmesinde delaminasyon üzerinde ilerleme miktarı kesme hızından daha etkiliolmuştur [5]. Giasin vd. tarafından yapılan çalışmada da ilerleme miktarı arttıkça delaminasyon artmış ve ilerleme miktarı, sıyrılma ve aşağı itme delaminasyonunu etkileyen en kritik parametreolarak tespit edilmiştir [6].
Tablo 4. Delaminasyon faktörü için varyans analizi.
Kaynak DoF Kareler Toplamı
Kareler Ortalaması F_oranı P % Katkı
T 2 0.8631 0.4316 3.59 0.077 7.18 Vc 2 2.5832 1.2916 10.75 0.005* 21.49 f 2 4.2664 2.1332 17.76 0.001* 35.50 T*Vc 4 1.1274 0.2818 2.35 0.142 9.38 T*f 4 1.6511 0.4128 3.44 0.065 13.74 Vc*f 4 0.5659 0.1415 1.18 0.390 4.71 Artık Hata 8 0.9611 0.1201 8.00
Toplam 26 12.0182 100.00 R2=%92.0, Ayarlı R2 = %74.0, Standart Sapma (S)=0.3466
TM'nin son adım olan doğrulama deneyleri kalite özelliklerini incelemek için yapılmaktadır [13]. Doğrulama deneylerinde kullanılan model kontrol faktörleri tarafından oluşturulan toplam etkiile tanımlanmaktadır. Bu model, her faktörün etkilerinin toplamına eşittir. Optimum seviyeler hata kayıpları göz önüne alınarak değerlendirilir [13]. Df için optimal tahminsel delaminasyon faktörleri Dfopt; Tablo 2’den hesaplanan delaminasyon faktörünün ortalaması (TDf), Tablo 4’te verilen ANOVA’dan etkili faktörler (P<0.05) ve yine Tablo 3'ten Df için kontrol faktörlerinin optimum kombinasyonları T2Vc1f1 dikkate alınarak sırasıyla Denklem 1'de verilen eşitliklehesaplanmıştır.
Df𝑜𝑜𝑜𝑜𝑜𝑜 = �Vc − 𝑇𝑇𝐷𝐷𝐷𝐷� + �f − 𝑇𝑇𝐷𝐷𝐷𝐷� + 𝑇𝑇𝐷𝐷𝐷𝐷 = (1.263 − 1.304) + (1.233 − 1.304) (1) +1.304 = 1.192
Bir sonraki adımda doğrulama deneyleriyle elde edilecek Df için güven aralığı (CI_Df) hesaplanmıştır. CI_Df, Taguchi metodundaki ilgili formülasyon ve denklemlerle 0.427 olarak hesaplanmıştır. % 95 güven seviyesinde doğrulama deneylerinde elde edilecek Df değerlerinin 1.192±0.427 tolerans ya da 0.765-1.619 aralığında olması beklenmiştir. Kontrol faktörlerinin T2Vc1f1 şeklinde belirlenen optimum seviyelerinin Tablo 3’teki 10 nolu deneyin parametre seviyeleri ile aynı olduğu görülmektedir. 10 nolu deneyin yapılmasıyla elde edilmiş delaminasyon faktörü Df=1.162 olup bu çalışmada yapılmış tüm deneyler içerisinde elde edilmiş en düşük Df değeridir. TM ile aynı delme şartlarında tahminsel delaminasyon faktörü değeri Df=1.211 olarak hesaplanmıştır (Tablo 5). Kontrol faktörlerinin optimum seviyesinde elde edilmiş bu değer güven aralığının hesaba katılmasıyla elde edilen üst sınır ve alt sınır delaminasyon faktörü değerleri içerisinde kalmaktadır. Bu nedenle, % 95 güven seviyesinde TM
41

kullanılarak Df için sistem optimizasyonu sağlanmıştır [13]. GLARE malzemenin seçilen kesme şartları aralığında delinmesinde genel olarak 1.304 mm ortalama değerinde delaminasyon faktörü değerleri elde edilebilmektedir. Ancak, bu çalışmada tespit edilen optimal kontrol faktörüseviyeleri ile delmede Df=1.211 delaminasyon faktörü değerleri elde edilerek delaminasyon faktörü azaltılarak delaminasyon az da olsa (yaklaşık % 7) iyileştirilmiştir.
Tablo 5. Df için doğrulama deneylerinin sonuçları.
3.2. Delaminasyon Faktörü İçin Geliştirilmiş Matematiksel ModelGLARE’in özel geometrili matkaplarla delinmesinde Df'yi tahmin etmek için Lineer Regresyon Analizi ile geliştirilen ve kontrol faktörlerinin ana etkilerini, etkileşimlerinin etkilerini vequadratik etkileri içeren tahminsel model Denklem 2’de sunulmuştur. Geliştirilen bu denklemde kesici takım (T) bu kontrol faktörünün seviyelerini gösteren kodlanmış değerler (1, 2 ve 3) kesme hızı (Vc) ve ilerleme miktarı (f) ise sayısal değerleri alınarak geliştirilmiştir. Kontrolfaktörlerinin farklı seviyelerinde tahminsel Df değerleri elde etmek için denklemde T yerine kontrol faktörlerinin seviyelerini gösteren 1, 2 ya da 3 değerleri konulmalıdır.
𝐷𝐷𝐷𝐷 = −0.554− 0.120𝑇𝑇 + 0.0393𝑉𝑉𝑉𝑉 + 4.50𝐷𝐷 + 0.000343𝑇𝑇 ∗ 𝑉𝑉𝑉𝑉 − 0.925𝑇𝑇 ∗ 𝐷𝐷 (2) −0.0011𝑉𝑉𝑉𝑉 ∗ 𝐷𝐷 + 0.0533𝑇𝑇2 − 0.000246𝑉𝑉𝑉𝑉2 − 3.6𝐷𝐷2
GLARE malzemenin özel geometrili takımlar ile delinmesinde Df'yi tahmin etmek içingeliştirilen denklemin korelasyon katsayısı (R2) 0.728 olarak hesaplanmıştır. Bu değer; %95güven aralığında geliştirilen denklemin yeterli olabileceğini göstermektedir.
4. SonuçlarGLARE’in özel geometrili takımlarla delinmesinde delme parametrelerinin delik girişidelaminasyon faktörü üzerinde etkilerinin araştırıldığı bu deneysel çalışmada şu sonuçlaraulaşılmıştır:
1. Özel geometrili takımlarla delmede delik girişlerinde işlemenin kalitesini yansıtandelaminasyon faktörü ortalaması 1.304 olarak hesaplanmıştır.
2. GLARE’in özel geometrili takımlarla delinmesinde 135° uç açısına sahip (452.1 CMH10F) T2 kodlu takımlar 130° uç açısına sahip (860.1 NM H10F) T1 kodlu takımlarkıyasla %5.35, 118° uç açısına sahip (DIN6539) T3 kodlu takımlara kıyasla %3.0 dahadüşük delaminasyon oluşumu sağlamışlardır.
4. Özel geometrili takımlarla delmede delaminasyon üzerinde istatistiki olarak (p<0.05) enetkili parametreler sırasıyla ilerleme miktarı (%35.50) ve kesme hızı (%21.49) olmuş ikenkesici takım geometrisinin (%7.18) istatistiki olarak anlamlı bir etkisi gözlemlenmemiştir.
5. GLARE’in delinmesinde minimum değerlerde deforme olmuş delik giriş yüzeyi eldeetmek için T2 kodlu takımlar, düşük kesme hızı ve düşük ilerleme miktarı tercihedilmelidir.
Df Doğrulama Deneyi
Optimum Df Deneysel Tahminsel ark
Seviye (10 nolu deney) T2Vc1f1 T2Vc1f1 - Df 1.162 1.211 0.049 Df için S/N oranı (dB) -1.31 -1.63 0.32
42

6. GLARE’in özel geometrili takımlarla ile delinmesinde delaminasyon faktörünü tahminetmek için geliştirilen tahminsel denklemin korelasyon katsayısı 0.728 olarakhesaplanmıştır. Korelasyon katsayıların yüksek çıkması geliştirilen denklemleringüvenilirliğini göstermektedir.
Bu çalışmanın en güçlü yönünü literatürde yapılan çalışmalar göz önünde bulunarak delik delmede delaminasyon oluşumu gibi delik kusurlarının oluşumunu sağlayacak uygun istif yapısına sahip GLARE’in üretilmiş olması ve yine bu kompozitin işlenmesine en uygun özelgeometrili takımların seçilmiş olmasıdır. Bu önerilerin göz önünde bulundurulmasına rağmenyine literatürde yapılan araştırmalara benzer şekilde bu çalışmada da sırasıyla ilerleme miktarı ve kesme hızının delaminasyon oluşumu üzerinde kesici takım geometrisinden daha etkili olması sonucuna ulaşılmasının GLARE’in işlenebilirlik veri tabanının kesinleşmesine ve gelişmesine katkı sağladığı düşünülmektedir.
Kaynaklar 1. Sinke, J. Manufacturing of GLARE Parts and Structures. Applied Composite Materials,
2003, 10(4-5):293-305.2. Park, S.Y., Choi, W.J., Choi, C.H., and Choi, H.S. Effect of drilling Parameters On Hole
Quality and Delamination of Hybrid GLARE Laminate. Composite Structures, 2018,185:684-698.
3. Giasin, K., Ayvar-Soberanis, S., and Hodzic, A. Evaluation of Cryogenic Cooling andMinimum Quantity Lubrication Effects On Machining GLARE Laminates Using Design ofExperiments. Journal of Cleaner Production, 2016, 135:533-548.
4. Giasin, K., and Ayvar-Soberanis, S. An Investigation of Burrs, Chip Formation, Hole Size,Circularity and Delamination During Drilling Operation of GLARE Using ANOVA.Composite Structures, 2017, 159:745-760.
5. Pawar, O.A., Gaikhe, Y.S., Tewari, A., Sundaram, R., and Joshi, S.S. Analysis of HoleQuality in Drilling GLARE Fiber Metal Laminates. Composite Structures, 2015, 123:350-365.
6. Giasin, K., Ayvar-Soberanis, S., French, T., and Phadnis, V. 3D Finite Element Modellingof Cutting Forces in Drilling Fibre Metal Laminates aand Experimental Hole QualityAnalysis. Applied Composite Materials, 2017, 24(1):113-137.
7. Thirukumaran, M., Jappes, J.W., Siva, I., Amico, S.C., and Davim, J.P. Investigation ofMargin Effect to Minimize Delamination During Drilling of Differently Stacked GFRP-Aluminum Fiber Metal Laminates (3/2 GLARE). Journal of Manufacturing TechnologyResearch, 2018, 10(1/2):17-27.
8. Giasin, K., Ayvar-Soberanis, S., and Hodzic, A. The Effects of Minimum QuantityLubrication and Cryogenic Liquid Nitrogen Cooling on Drilled Hole Quality in GLAREFibre Metal Laminates. Materials and Design, 2016, 89:996-1006.
9. Giasin, K., Hawxwell, J., Sinke, J., Dhakal, H., Köklü, U., and Brousseau, E. The Effect ofCutting Tool Coating on The Form and Dimensional Errors of Machined Holes in GLARE®Fibre Metal Laminates. The International Journal of Advanced Manufacturing Technology,2020, 107:2817-2832.
10. Giasin, K., Gorey, G., Byrne, C., Sinke, J., and Brousseau, E. Effect of MachiningParameters and Cutting Tool Coating on Hole Quality in Dry Drilling of Fibre MetalLaminates. Composite Structures, 2019, 212:159-174.
11. Giasin, K., Ayvar-Soberanis, S., and Hodzic, A. An Experimental Study on Drilling ofUnidirectional GLARE Fibre Metal Laminates. Composite Structures, 2015, 133:794-808.
43

12. Tyczynski, P., Lemanczyk, J., and Ostrowski, R. Drilling of CFRP, GFRP, GLARE TypeComposites. Aircraft Engineering and Aerospace Technology: An International Journal,2014, 86(4):312-322.
13. Bilge, T., Motorcu, A. R., and Ivanov, A. Evaluation of The Delamination Factor forDrilling of Compact Laminate Composite Material with Tungsten Carbide Tools.Pamukkale University Journal of Engineering Sciences, 2017, 23(4): 427-436.
44

CFRP/Al2024 METALİK YIĞINLARIN FARKLI GEOMETRİLİ MATKAPLARLA DELİNMESİNDE DELAMİNASYON FAKTÖRÜNÜN
OPTİMİZASYONU
ERGÜN EKİCİ1, ALİ RİZA MOTORCU1
Endüstri Mühendisliği Bölümü, Mühendislik Fakültesi, Çanakkale Onsekiz Mart Üniversitesi, Çanakkale, Türkiye.
Özet
Karbon fiber takviyeli polimer (CFRP)/Alüminyum yığın yapıları üzerinde delik delme, havacılık ve uzay parçalarının üretimlerinde önemli bir montaj sürecidir. Bununla birlikte,alüminyum ve CFRP'nin malzeme özelliklerindeki muazzam farklılıklar nedeniyle tek adımlı delmede kaliteli delikler elde etmek oldukça zorlu bir iştir. Bu çalışmada takım geometrisi vekesme parametrelerinin CFRP parçaların reddedilmesinde büyük önem arz eden delik giriş delaminasyon faktörü (Dfg) ve çıkış delaminasyon faktörü (Dfç) üzerindeki etkisi araştırılmıştır. Kontrol faktörleri olarak takım geometrisi, kesme hızı ve ilerleme miktarı esasalınmış, faktör etkileri varyans analizi (ANOVA) yardımıyla değerlendirilmiştir. Optimumparametrelerin belirlenmesinde Gri İlişkisel Analiz (GİA) kullanılmıştır. ANOVA sonuçlarından Dfg üzerinde en etkili parametre %64.88 katkı oranı ile kesme hızı olurken, onu etki bakımından %26.03 ile takım geometrisi ve %6.24 katkı oranı ile kesme hızı-takım geometrisi etkileşimi takip etmiştir. Benzer şekilde, Dfç üzerinde en etkili parametre %33.58 katkı oranı ile takım geometrisi olurken, onu etki bakımından %18.99 katkı oranı ile ilerleme miktarı-takım geometrisi etkileşimi ve %17.31 katkı oranı ile kesme hızı takip etmiştir. Dfg ve Dfç için işleme parametrelerinin optimum seviyeleri 50 m/dak kesme hızı, 0.06 mm/devilerleme miktarı ve T2 kodlu takım olarak belirlenmiştir.
Anahtar kelimeler: CFRP/Al2024 metalik yığınlar, Delaminasyon faktörü, Taguchi metodu, Gri İlişkisel Analiz (GİA).
1. GirişGünümüzde hafif ve yüksek mukavemetli malzemelere yönelik artan talep, kompozityapıların gelişimini tetiklemiştir. Yapısal malzemeler olarak kompozitler yapılarınmukavemetini ve performansını artırmak için metallerle birleştirilir ve karma bir montajoluşturulur [1]. CFRP kompozit malzemeler, özellikle kalın konfigürasyonlarda, gelişmişmetalik yapısal malzemelerden çok daha hafiftirler [2]. Cıvatalıma ve perçinleme, özelliklehavacılık malzemelerinde bakım faaliyetini kolaylaştırmak için gerçekleştirilen yaygınbirleştirme işlemleridir. Kompozitlerin geleneksel delinmesi, maliyet ve kalite açısındangeleneksel olmayan yöntemlerin aksine hala ucuz ve kabul edilebilir bir süreçtir. Bununlabirlikte, bağlantıların güvenilirliği ve kalitesi büyük ölçüde delik kalitesine bağlıdır [3,4].İşlenebilirlik özellikleri birbirinden tamamen farklı olan iki malzemenin (CFRP/metal)birlikte delinmesi için uygun kesici takımı seçmek ve optimum delme parametrelerinibelirlemek önemli bir husustur. Ancak, metal ve CFRP’nin malzeme özelliklerindekifarklılıklar tek seferde delik açmayı çok zorlaştırır [2]. Metal yapıda delik kalitesinin (yüzey
45

pürüzlülüğü, dairesellik, çapak oluşumu vb.) değerlendirilmesi yeterli iken CFRP’de ilave olarak delik giriş ve çıkış kısmında oluşan ve istenmeyen bir hasar türü olarak karşımıza çıkan delaminasyon faktörünün de dikkate alınması gerekir. Delme işleminin tipik olarak kompozitler üzerinde montajdan önce gerçekleştirilen son işlem olduğu gerçeği göz önüne alındığında, delaminasyon ve mikro çatlama gibi işleme kaynaklı kusurlar, kompozit performansını önemli ölçüde azaltır ve uçak endüstrisinde üretilen bileşenlerin yaklaşık %60'ının reddedilmesinden sorumludur [5,6]. Literatürde CFRP metalik yığınların delinmesinde kaplamalı ve kaplamasız takımlar [8, 9], elmas kaplı takımlar [10], tungsten karbür takımların yanında çok kristalli elmas (ÇKE) takımlar [11] araştırılırken takım geometrisi üzerine [12, 13, 14] ciddi araştırmalar yapılmış ve yapılmaya devam etmektedir. Kuo vd. metalik kompozit yığınların delinmesinde kesme hızı ve ilerleme miktarının delik yüzey bütünlüğüne etkisini araştırmışlardır [15]. Alonso vd. adım matkap geometrisi ve oluk sayısının CFRP/Ti6Al4V metalik yığınlarının delinmesine etkisini araştırmışlardır [16]. Benezech vd. metalik yığınların delinmesinde imalat hataları ve takım geometrisininoptimizasyonunu araştırmışlardır [17]. Jia vd. Ti/CFRP metalik yığının delinmesinde adım matkap geometrisinin delaminasyon hasarı ve çapak oluşumu üzerindeki etkisini araştırmışlardır [18]. Zitoune vd. CFRP/Al metalik yığınların delinmesini deneysel ve sayısalolarak inceledikleri çalışmalarında, işleme parametreleri, standart ve çift açılı takım geometrisinin kesme kuvveti, delik kalitesi ve CFRP/Al arayüzeyine etkisini araştırmışlardır[19]. Soo vd. CFRP/AA7010 metalik yığının kesme parametreleri ve takım geometrisine bağlı olarak delinmesinde takım aşınması, kesme kuvvetleri ve tork değerlerine göre delik kalitesi ve tamlığını araştırmışlardır. Yüksek ilerleme miktarlarında çalışırken delik girişindekidelaminasyon faktörünün % 23'e kadar arttığı belirtilmiştir [20]. Aydin ve Nalbant CFRP/Al-7075 istifli yapının 120º-130º-140º uç açılarına sahip kaplamasız karbür matkaplar ile delinebilirliğini araştırmışlardır. Delaminasyon değerlerinin nominal çap 5 mm olduğu gözönüne alındığında özellikle 40. deliğe kadar olan süreçte delaminasyon faktörünün 1.2’den küçük olarak elde edildiğini, artan delik sayısı neticesinde delaminasyon değerinin yükseldiğini buna karşın en düşük delaminasyonun 130° uç açılı matkapta oluştuğunubelirtmişlerdir [21]. Bu çalışmada, CFRP/Al2024 yığınların delinmesinde, CFRP bileşeninde delik girişi ve de delik çıkışındaki delaminasyon oluşumlarına takım geometrisi, kesme hızı ve ilerleme miktarının etkileri Taguchi Metodu yardımıyla değerlendirilmiştir. Delik giriş ve çıkış delaminasyon faktörünün minimizasyonu için delme parametrelerinin optimizasyonunda Gri İlişkisel Analiz Analiz (GİA) kullanılmıştır.
2. Malzeme ve metotCFRP kompozit numunenin üretiminde iki farklı dokuma (3K 245 gr/m2 ve 12K 450 gr/m2)karbon kumaş; en alt sıra 2 kat 245 gr/m², orta sıra 11 kat 450 gr/m² ve en üst 2 kat 245 gr/m²şeklinde kullanılmıştır. F-RES 11564/F-HARD 13486 kodlu epoksi reçine kullanılarak %64elyaf ve %36 reçine %ağırlık bileşiminde vakum infüzyon yöntemi ile üretilmiştir. Dahasonra CFRP plakalar 200x100x5 mm ölçülerinde kesilerek hazırlanmıştır. Deneylerde200x100x5 mm ölçülerinde Al2024 alüminyum alaşımı kullanılmıştır. Delik çıkışbölgesindeki delaminasyon ölçümlerinin yapılabilmesi için CFRP ve Al2024 plaklar cıvatalıbağlantı ile yığın haline getirilmiştir (Şekil 1).
Şekil 1. CFRP/Al2024 metalik yığın
46

Deneylerde Sandvik Coromant ve Gühring firmalarından temin edilen kodları ve resimleri Tablo 1’de sunulan üç farklı takım geometrisine sahip kaplamasız karbür matkaplar kullanılmıştır. T1 kodlu takım, 452.4-0635-034A0-CM H10F, pilot çapı 5.55 mm ana çapı6.35 mm ve 135° uç açılı kaplamasız kademeli karbür matkaptır. T2 kodlu takım, 452.1-0635-044A0-CM H10F ile tanımlanan 6.35 mm çapında 135°’lik uç açısı ve 20°’lik helis açısına sahip kaplamasız karbür matkap; T3 kodlu takım ise 6.35 mm çapında 140° uç açılı standart matkap ucudur. Takımlara ait ön ve üst görünüş resimleri Tablo 1’de sunulmuştur.
Tablo 1. Takım kodları ve geometrileri
T1
T2
T3
Delme deneyleri üç eksenli FALCO VMC 550 marka CNC dik işleme merkezinde gerçekleştirilmiştir (Şekil 2).
Şekil 2. Delme deneyleri
Kuru delme şartlarında boydan boya gerçekleştirilen deneylerde seçilen kontrol faktörleri ve faktör seviyeleri Tablo 2’de sunulmuştur.
Tablo 2. Kontrol Faktörleri ve Seviyeleri
Kod Faktörler Birim Seviyeler 1 2 3
A Kesme hızı m/dak 50 80 - B İlerleme miktarı mm/dev 0.06 0.096 0.15 C Takım geometrisi - T1 T2 T3
Delik giriş bölgesinde soyulma delaminasyonu ve delik çıkışında dışarı itme delaminasyonu fiber takviyeli polimer kompozitlerin delinmesinde karşılaşılan iki ana delaminasyon tipidir [22]. Dijital görüntü işleme, CFRP'deki geometrik hasarları analiz etmek için uygun ve yaygın olarak kullanılan bir tekniktir [23]. Delme deneyleri sonrası delik giriş ve çıkış delaminasyon ölçümleri Dino-Lite optik mikroskop yardımıyla gerçekleştirilmiştir. Delaminasyon faktörü,
47

maksimum hasar çapının (Dmax) delinmiş delik çapına (D) oranı şeklinde belirlenmiştir.CFRP/Al2024 metalik yığının kaplamasız karbür takımla delinmesinde takım geometrisi vedelme parametrelerinin etkilerinin en düşük delik giriş ve çıkış delaminasyon faktörüne etkilerini belirlemek amacıyla GİA kullanılmıştır.
3. Sonuçlar ve tartışma3.1. Taguchi çözümlemeleri CFRP/Al2024 metalik yığının takım geometrisi ve delme parametrelerine bağlı olarakdelinmesi sonrasında Dfg ve Dfç ortalamaları Minitab 16 programında çözümlenmiş ve çözümlemeye ait veriler Tablo 3’te sunulmuştur. Dfg ve Dfç en düşük değerler sırasıyla 1.0543 (Dfgmaks=1.2353 ve Dfgort=1.1278) ve 1.0418 (Dfçmaks=1.3845 ve Dfçort=1.1489)olarak elde edilmiştir.
Tablo 3. Giriş ve çıkış delaminasyon ölçüm sonuçları ve S/N oranları Deney
No Kontrol faktörleri Ölçüm sonuçları S/N oranları
Vc f T Dfg Dfç Dfg Dfç 1 50 0.06 T1 1.08651 1.074781 -0.72067 -0.62642 50 0.06 T2 1.054261 1.041758 -0.45896 -0.355343 50 0.06 T3 1.080731 1.139425 -0.67435 -1.133714 50 0.096 T1 1.10259 1.072835 -0.84828 -0.610665 50 0.096 T2 1.058532 1.054259 -0.49408 -0.458946 50 0.096 T3 1.087379 1.192235 -0.72762 -1.527247 50 0.15 T1 1.098662 1.086587 -0.81728 -0.721298 50 0.15 T2 1.061421 1.11261 -0.51775 -0.926869 50 0.15 T3 1.107566 1.245808 -0.88739 -1.9090210 80 0.06 T1 1.21811 1.384454 -1.71373 -2.8255711 80 0.06 T2 1.115436 1.071474 -0.9489 -0.5996312 80 0.06 T3 1.15181 1.220868 -1.22761 -1.7333813 80 0.096 T1 1.227886 1.160641 -1.78316 -1.2939614 80 0.096 T2 1.114847 1.108792 -0.9443 -0.89715 80 0.096 T3 1.183762 1.184528 -1.46529 -1.470916 80 0.15 T1 1.235333 1.136292 -1.83568 -1.109817 80 0.15 T2 1.139139 1.130174 -1.13154 -1.062918 80 0.15 T3 1.177076 1.263258 -1.41609 -2.02984
En büyük 1.2353 1.3845 En düşük 1.0543 1.0418 Ortalama 1.1278 1.1489
Dfg ve Dfç üzerinde kontrol faktörlerinin ana etkileri Şekil 3’te sunulmuştur. Dfg ve Dfç için kontrol faktörlerinin etkileri incelendiğinde; takım geometrisi ve kesme hızının benzer bir etki doğurduğu görülmüştür. Dfg üzerinde ilerleme miktarının belirgin bir etkisi görülmezken, ilerleme miktarı artışının çıkış delaminasyonu düşürdüğü görülmüştür. Şekil 3’te görüleceği üzere, seçilen kontrol faktörlerinden; kesme hızının birinci seviyesi (𝑉𝑉𝑐𝑐=50 m/dk), ilerleme miktarının birinci seviyesi (𝑓𝑓=0.06 mm/dev) ve takım geometrisinin ikinci seviyesinde (T2 kodlu takım) ile en düşük Dfg değerleri elde edilmiştir. Dfç için kesme hızının birinci seviyesinde (𝑉𝑉𝑐𝑐=50 m/dk), ilerleme miktarının ikinci seviyesinde (𝑓𝑓=0.096 mm/dev) ve takım geometrisinin ikinci seviyesinde (T2 kodlu takım) en düşük Dfç değerleri elde edilmiştir. Dfg ve Dfç için ana etki grafikleri sırasıyla Tablo 3 ve 4’te sunulmuştur.
48
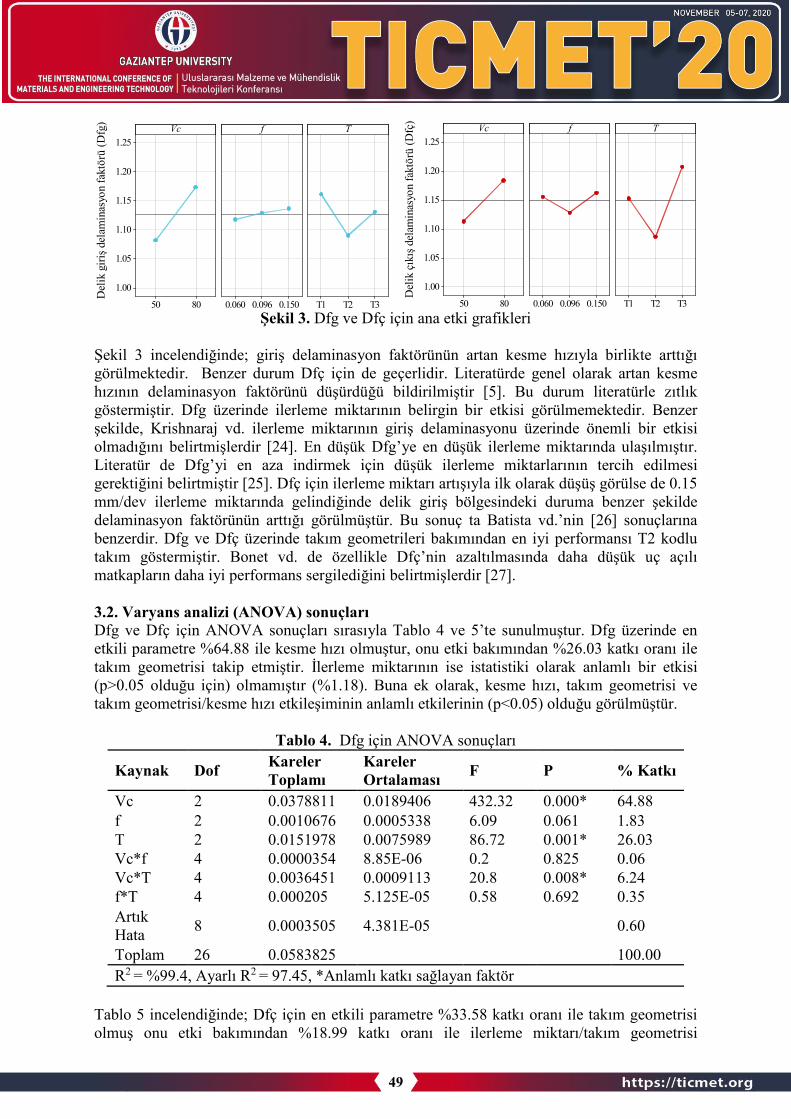
Şekil 3. Dfg ve Dfç için ana etki grafikleri
Şekil 3 incelendiğinde; giriş delaminasyon faktörünün artan kesme hızıyla birlikte arttığı görülmektedir. Benzer durum Dfç için de geçerlidir. Literatürde genel olarak artan kesme hızının delaminasyon faktörünü düşürdüğü bildirilmiştir [5]. Bu durum literatürle zıtlık göstermiştir. Dfg üzerinde ilerleme miktarının belirgin bir etkisi görülmemektedir. Benzerşekilde, Krishnaraj vd. ilerleme miktarının giriş delaminasyonu üzerinde önemli bir etkisi olmadığını belirtmişlerdir [24]. En düşük Dfg’ye en düşük ilerleme miktarında ulaşılmıştır.Literatür de Dfg’yi en aza indirmek için düşük ilerleme miktarlarının tercih edilmesi gerektiğini belirtmiştir [25]. Dfç için ilerleme miktarı artışıyla ilk olarak düşüş görülse de 0.15mm/dev ilerleme miktarında gelindiğinde delik giriş bölgesindeki duruma benzer şekilde delaminasyon faktörünün arttığı görülmüştür. Bu sonuç ta Batista vd.’nin [26] sonuçlarına benzerdir. Dfg ve Dfç üzerinde takım geometrileri bakımından en iyi performansı T2 kodlu takım göstermiştir. Bonet vd. de özellikle Dfç’nin azaltılmasında daha düşük uç açılı matkapların daha iyi performans sergilediğini belirtmişlerdir [27].
3.2. Varyans analizi (ANOVA) sonuçlarıDfg ve Dfç için ANOVA sonuçları sırasıyla Tablo 4 ve 5’te sunulmuştur. Dfg üzerinde en etkili parametre %64.88 ile kesme hızı olmuştur, onu etki bakımından %26.03 katkı oranı ile takım geometrisi takip etmiştir. İlerleme miktarının ise istatistiki olarak anlamlı bir etkisi (p>0.05 olduğu için) olmamıştır (%1.18). Buna ek olarak, kesme hızı, takım geometrisi ve takım geometrisi/kesme hızı etkileşiminin anlamlı etkilerinin (p<0.05) olduğu görülmüştür.
Tablo 4. Dfg için ANOVA sonuçları
Kaynak Dof Kareler Toplamı
Kareler Ortalaması F P % Katkı
Vc 2 0.0378811 0.0189406 432.32 0.000* 64.88 f 2 0.0010676 0.0005338 6.09 0.061 1.83 T 2 0.0151978 0.0075989 86.72 0.001* 26.03 Vc*f 4 0.0000354 8.85E-06 0.2 0.825 0.06 Vc*T 4 0.0036451 0.0009113 20.8 0.008* 6.24 f*T 4 0.000205 5.125E-05 0.58 0.692 0.35 Artık Hata 8 0.0003505 4.381E-05 0.60
Toplam 26 0.0583825 100.00 R2 = %99.4, Ayarlı R2 = 97.45, *Anlamlı katkı sağlayan faktör
Tablo 5 incelendiğinde; Dfç için en etkili parametre %33.58 katkı oranı ile takım geometrisi olmuş onu etki bakımından %18.99 katkı oranı ile ilerleme miktarı/takım geometrisi
8050
1.25
1.20
1.15
1.10
1.05
1.00
0.1500.0960.060 T3T2T1
Vc
Del
ik g
irişd
elam
inas
yon
fakt
örü
(Dfg
) f T
8050
1.25
1.20
1.15
1.10
1.05
1.00
0.1500.0960.060 T3T2T1
Vc
Del
ik ç
ıkış
del
amin
asyo
n fa
ktör
ü (D
fç)
f T
49

etkileşimi ve %17.31 katkı oranı ile kesme hızı takip etmiştir. Ayrıca, ANOVA sonuçlarından takım geometrisi ve kesme hızının istatistiki olarak anlamlı etkiye sahip olduğu görülmüştür.
Tablo 5. Dfç için ANOVA sonuçları
Kaynak Dof Kareler Toplamı
Kareler Ortalaması F P % Katkı
Vc 2 0.022769 0.0113845 8.12 0.046* 17.31 f 2 0.003765 0.0018825 0.67 0.560 2.86 T 2 0.044172 0.022086 7.88 0.041* 33.58 Vc*f 4 0.010965 0.0027413 1.96 0.256 8.34 Vc*T 4 0.013674 0.0034185 2.44 0.203 10.40 f*T 4 0.024981 0.0062453 2.23 0.228 18.99 Artık Hata 8 0.011212 0.0014015 8.52
Toplam 26 0.131538 100.00 R2 = %91.48, Ayarlı R2 = 63.77, *Anlamlı katkı sağlayan faktör
3.3. Gri ilişkisel analiz Taguchi yöntemi farklı parametrelerin, farklı seviyeleri arasından en iyi kombinasyonu saptamak için oldukça kullanışlı bir yöntemdir. Diğer yandan çalışmamızda olduğu gibi yanıtlar için optimum parametreler farklıdır. Bundan dolayı, çok kriterli optimizasyonyaklaşımı alternatif bir yöntem olarak kullanılmıştır. Mümkün olan en düşük Dfg ve Dfç aynı anda elde ederek çoklu performans özelliklerinin en üst düzeye çıkarılması gerekir. Deneyler sonrasında elde edilen veriler (Tablo 2) normalleştirilmiş ve gri ilişkisel katsayılar (GİK) vegri ilişkisel derece (GİD) hesaplanarak Tablo 6’da sunulmuştur.
Tablo 6. Normalize edilmiş sonuçlar, gri ilişkisel katsayı, gri ilişkisel derce ve sıralama. Deney No
Normalize edilmiş sonuçlar GİA katsayı GİA derece
GİA'ya göre en iyi sıralama Dfg Dfç Dfg Dfç
1 0.822 0.904 0.738 0.839 0.7881 4 2 1.000 1.000 1.000 1.000 1.0000 1 3 0.854 0.715 0.774 0.637 0.7055 8 4 0.733 0.909 0.652 0.847 0.7494 5 5 0.977 0.964 0.955 0.932 0.9438 2 6 0.817 0.561 0.732 0.532 0.6324 10 7 0.755 0.869 0.671 0.793 0.7319 6 8 0.961 0.793 0.927 0.708 0.8173 3 9 0.706 0.405 0.629 0.456 0.5430 12 10 0.095 0.000 0.356 0.333 0.3446 18 11 0.662 0.913 0.597 0.852 0.7246 7 12 0.461 0.477 0.481 0.489 0.4852 14 13 0.041 0.653 0.343 0.590 0.4666 16 14 0.665 0.805 0.599 0.719 0.6590 9 15 0.285 0.584 0.411 0.546 0.4785 15 16 0.000 0.724 0.333 0.645 0.4889 13 17 0.531 0.742 0.516 0.660 0.5879 11 18 0.322 0.354 0.424 0.436 0.4303 17
Gri ilişkisel derecenin 1 veya 1’e yakınlığı en iyi ideal işleme koşullarını temsil etmektedir. Tablo 6’da ideal işleme koşulları, GİD en yüksek değerine 1.000 ile 2 nolu deneyde (50 m/dak kesme hızı, 0.06 mm/dev ilerleme miktarı ve T2 kodlu takımla) ulaşılmıştır. GİD
50

sonuçları bakımından ideal yanıtları sağlayan deney sıralaması 2, 5 ve 8 nolu deney şeklindedir.
4. Sonuçlar CFRP/Al2024 metalik yığınların farklı takım geometrileri ve delme parametrelerine bağlı olarak delinmesi sonrasında aşağıdaki sonuçlara ulaşılmıştır;
1. Giriş ve çıkış delaminasyon faktörü için en düşük değerler sırasıyla 1.0543(Dfgmaks=1.2353 ve Dfg ort=1.1278) ve 1.0418 (Dfçmaks=1.3845 ve Dfçort=1.1489)olarak elde edilmiştir.
2. Artan kesme hızı Dfg ve Dfç’yi arttırmıştır. İlerleme miktarı Dfg’yi arttırırken Dfç ilkolarak azalmış en yüksek ilerleme miktarı değerinde tekrar yükselmiştir. Takımgeometrisi bakımından Dfg ve Dfç için benzer sonuçlar elde edilmiştir.
3. Dfg üzerinde en etkili parametre %64.88 katkı oranı ile kesme hızı olmuştur, on etkibakımından %26.03 katkı oranı ile takım geometrisi takip etmiştir. İlerleme miktarınınise ciddi bir etkisi (%1.18) olmamıştır.
4. Dfç için en etkili parametre %33.58 katkı oranı ile takım geometrisi olmuştur onu etkibakımından %18.99 katkı oranı ile ilerleme miktarı/takım geometrisi etkileşimi ve%17.31 katkı oranı ile kesme hızı takip etmiştir.
5. Minimum Dfg ve Dfç için optimum işleme parametreleri; 50 m/dak kesme hızı, 0.06mm/dev ilerleme miktarı ve T2 kodlu takım olarak belirlenmiştir.
Kaynaklar 1. Abrate, S, Machining of composites. In: Mallick PK, editor. Composites engineering
hand book.1997, 777–807.2. Zitoune, R, Krishnaraj, V, Collombet, F, Le, Roux, S, Experimental and numerical
analysis on drilling of carbon fibre reinforced plastic and aluminium stacks, CompositeStructures. 2016, 146, 148–58.
3. Park, KY, Choi, JH, Lee, DG, Delamination-free and high efficiency drilling of carbonfiber reinforced plastics, Journal of Composite Materials. 1995, 29, 1988–2002.
4. Tagliaferri, V, Caprino, G, Diterlizzi, A, Effect of drilling parameters on the finish andmechanical properties of GFRP composites. International Journal of Machine Tools andManufacture. 1990, 30, 77–84.
5. Khashaba, UA, Delamination in drilling GFR-thermoset composites. CompositeStructures. 2004, 63, 313–327.
6. Cheng, HH, Dharan, KH, Delamination during drilling in composite laminates, J Eng1990, 112(3), 236–9.
7. Alizadeh, Ashrafi, S, Sharif, S, Akhavan Farid, A, Yahya, MY, Performance evaluationof carbide tools in drilling CFRP-Al stacks Show less, Journal of Composite Materials.2013, 48, 2071-2084.
8. Montoya, M, Calamaz, M, Gehin D, Girot, F, Evaluation of the performance of coatedand uncoated carbide tools in drilling thick CFRP/aluminium alloy stacks, TheInternational Journal of Advanced Manufacturing Technology. 2013, 68, 2111–2120.
9. Ozden, I, Ghassemieh, E, Comparative study of tool life and hole quality in drilling ofCFRP/titanium stack using coated carbide drill, Machining Science and Technology.2013, 17, 380-409.
10. Wang, CY, Chen, YH, An, QL, Cai, XJ, Ming, WW, Chen, M, Drilling temperature andhole quality in drilling of CFRP/aluminum stacks using diamond coated drill,International Journal of Precision Engineering and Manufacturing. 2015, 16, 1689–169.
51

11. Kim, DW, Beal, A, Kwon, P, Effect of tool wear on hole quality in drilling of carbonfiber reinforced plastic-titanium stacks using tungsten carbide and PCD tools, ASME2015 International Manufacturing Science and Engineering Conference. Charlotte, NorthCarolina, USA, 2015, June 8–12,
12. Kuo, CL, Soo, SL, Aspinwall DK, Carr, C, Bradley, S, Saoubi, RM, Leahy, W,Development of single step drilling technology for multilayer metallic-composite stacksusing uncoated and PVD coated carbide tools, Journal of Manufacturing Processes. 2018,31, 286-300.
13. Sui, S, G, Sun, C, Zhu, Z, Guo, K, Sun, J, Experimental investigation on the performanceof novel double cone integrated tool in one-shot drilling of metal stacks, TheInternational Journal of Advanced Manufacturing Technology. 2020, 109, 523–534.
14. Zitoune, R, Alma, Bouacif, S, Vijayan, K, Francis, C, Design of double cone twist drillgeometry to improve the holes quality while drilling in multi-stack made of CFRP/Al,ASME 2014 International Mechanical Engineering Congress and Exposition. November14–20, 2014.
15. Kuo, CL, Soo, SL, Aspinwall, DK, Thomas, W, Bradley, S, Pearson, D, Saoubi, RM,Leahy, W, The Effect of Cutting Speed and Feed Rate on Hole Surface Integrity inSingle-shot Drilling of Metallic-Composite Stacks, Procedia CIRP. 2014, 13, 405-410.
16. Alonso, U, Calamaz, M, Girota, F, Iriondo, E, Influence of flute number and stepped bitgeometry when drilling CFRP/Ti6Al4V stacks, Journal of Manufacturing Processes.2019, 39, 356-370.
17. Benezech, L, Landon, Y, Rubio, W, Study of Manufacturing Defects and Tool GeometryOptimisation for Multi-Material Stack Drilling, Advanced Materials Research. 2011, 423,1-11.
18. Jia, ZY, Zhang, C, Wang, F, Chen, RC, An investigation of the effects of step drillgeometry on drilling induced delamination and burr of Ti/CFRP stacks, CompositeStructures. 2020, 235, 111786.
19. Zitoune, R, Krishnaraj, V, Collombet, F, Le Roux, S, Experimental and numericalanalysis on drilling of carbon fibre reinforced plastic and aluminium stacks, CompositeStructures. 2016, 146, 148–158.
20. Soo, SL, Abdelhafeez, AM, Li, M, Hood, R, Lim, CM, The drilling of carbon fibrecomposite–aluminium stacks and its effect on hole quality and integrity, Proceedings ofthe Institution of Mechanical Engineers, Part B: Journal of Engineering Manufacture.2019, 233, 1323-1331.
21. Aydin, E, Nalbant, M, CFRP/Al-7075 istifli delmede matkap uç açılarının delinebilirliküzerine etkisi, Journal of the Faculty of Engineering and Architecture of Gazi University.2020, 35:2, 917-931.
22. Rubio, CJ, Abrao, AM, Faria PE, et al Effects of high speed in the drilling of glass fibrereinforced plastic: evaluation of the delamination factor. International Journal of MachineTools and Manufacture. 2018, 48, 715–720.
23. Geier, N, Szalay, T, Takács, M, Analysis of thrust force and characteristics of uncutfibres at non-conventional oriented drilling of unidirectional carbon fibre-reinforcedplastic (UD-CFRP) composite laminates. The International Journal of AdvancedManufacturing Technology. 2019, 100, 3139–3154.
24. Krishnaraj, V, Prabukarthi, A, Ramanathan, A, Elanghovan, N, Senthil Kumar M,Zitoune R, et al. Optimization of machining parameters at high speed drilling of carbonfiber reinforced plastic (CFRP) laminates. Compos Part B Engineering. 2012, 43, 1791–9.
25. Grilo, TJ, Paulo, RMF, Silva, CRM, Davim, JP, Experimental delamination analyses ofCFRPs using different drill geometries, Composites: Part B. 2013, 45 1344–1350.
52

26. Batista, MF, Basso, I, Toti, FA, Rodrigues, AR, Tarpani, JR, Cryogenic drilling of carbonfibre reinforced thermoplastic and thermoset Polymers, Composite Structures. 2020, 251,112625.
27. Bonnet, C, Poulachon, G, Rech, J, Girard, Y, Costes, JP, CFRP drilling: Fundamentalstudy of local feed force and consequences on hole exit damage, International Journal ofMachine Tools & Manufacture. 2015, 94, 57–64.
53

Laser Polishing Applications on the Surface of the Ti-6Al-4V Part Produced by Additive Manufacturing
Safak NESLI*1, Oguzhan YILMAZ1
1 Advanced Manufacturing Technologies Research Group (AMTRG), Department of Mechanical Engineering, Faculty of Engineering, Gazi University, 06570, Ankara, Turkey
Abstract
Additive manufacturing (AM) is an innovative manufacturing method in order to produce highly complicated and intricate parts, which could not be possible to produce with traditionalmanufacturing methods. However, bad surface qualities of additive-manufactured parts cannot be accepted by the industries. Because of that reason, post-process applications are essential for these parts. This research work presents the fundamentals of the laser polishing (LP) process and the LP experiments on the additive manufactured part surfaces. In the LP process, a very thin layer of the rough surface is melted through the laser radiation and the surface roughness could be reduced with the redistribution of the re-melted layer. A Ti-6Al-4V part produced by electronbeam melting (EBM) was selected as the sample for the LP experiments. The results showed that LP can be successfully applied to the parts’ surfaces and the roughness could be significantly reduced by the process. The reduction in surface roughness has resulted that Sa values of the surface improved from 44,14 µm (as-built surface) to Sa = 4.40 µm (laser polished surface).
Keyword: Additive Manufacturing, Laser Polishing, Surface Roughness Reduction.
1. IntroductionAdditive manufacturing (AM) is an advance manufacturing process used to create three-dimensional structures in which material is placed on top of a preset structure [1]. Nowadays,AM is used in the production of prototypes as well as in the production of complex parts thatare difficult to produce with traditional methods [2]. Due to these advantages, it has become apreferred method especially in the field of space, aviation and biomedical. However, in orderfor these parts to be used in industries, they have to be post-processed because they have lowsurface quality. [3].
Laser polishing (LP) is an innovative part-finishing procedure that can be utilized to decrease the surface roughness by melting a thin layer of material on the part surface (Fig 1). LP includes melting a thin layer of the substrate, with surface tension causing the material to move from peaks to valleys. In laser polishing, the material is not removed but is moved as a molten pool. During the laser polishing process when the laser sends beams to the surface, it can be said that a significant portion of its energy will be absorbed into the workpiece, the rest will be reflected. The proportion of energy absorbed by the portion depends on the surface properties of the workpiece and the electromagnetic wave properties of the laser beam [4].
54

Figure 1: Schematic representation of the LP process.
Many studies in the literature have proven that LP significantly reduces the roughness of the surface of the part. Tian et.al. have used an EBM-Ti-6Al-4V part as a sample in order to investigate the effect of LP on the roughness reduction of AM parts. Their studies have shownthat the surface roughness can be reduced to below Sa = 0.51 µm [5]. Lamikiz et.al. haveworked on the laser polishing process for sintered metallic parts and they have concluded thatup to 80% reduction in the Ra parameter can be achieved successfully [6]. Mai et al. havestudied on the different process parameters such as laser output power, off-focus position, pulse frequency, scanning speed, and scanning strategy in order to investigate laser polishing of 304 stainless steel. The surface roughness could successfully be improved by %61.5 in their work [7]. Ma et.al. have studied on the capability of fibre laser in polishing rough surface of AM Ti-based alloys. Results of their researches showed that as-built Ti-based alloys with surface roughness more than 5 µm could be reduced to less than 1 µm through the laser polishing process [8].
The objective of the present work is to examine the effect of laser polishing on the surface properties such as topography and roughness, of EBM-Ti6Al4V part.
2. Experimental DetailsIn this work, the part was produced by the EBM method that used 45-100 µm Ti-6Al-4Vsuperalloy powder and the production parameters can be seen in Table 1. Figure 2 representsthe part produced with EBM in 30x10x10mm dimensions.
Figure 2: Ti-6Al-4V part produced by EBM method.
55

Table 1: EBM process parameters EBM Parameters Value Beam Power 1.5 kW Scan Speed 2 m/s Spot Size 280 µm Layer Thickness 50 µm Powder Particle Size 45-100 µm
Five different laser polishing processes were applied on the part surface, using the laser parameters given in Table 2. The surface roughness before and after LP was measured and inspected via a white-light interferometer Polytec TopMap Metro.Lab TMS 150 to assess thechanges induced by LP.
Table 2: LP process parameters
Exp. No
Hatch Spacing
(mm)
Scan Speed (mm/s)
Laser Power
(W)
Pulse Width
(s) 1 0.1 200 500 0,0008 2 0.07 200 500 0,0008 3 0.05 200 500 0,0008 4 0.05 200 500 0,0005 5 0.03 200 500 0,0005
3. Results and DiscussionOne of a challenging problem is high roughness values of the AM parts that need to be solved.In this work, a new polishing method, LP, was applied onto the surface of EBM-Ti6Al4Vsample.
Figure 3 represents the laser polished and as-built surfaces of the sample. While the first four laser polishing processes were carried out in 3x3mm areas, the 5th process was applied to a 1x3 area.
Figure 3: As-built and laser polished surfaces of AM part.
56

Surface roughness values can be numerically defined with the roughness parameters such as roughness average (Sa), root-mean-square roughness (Sq), [9]. As can be seen in Figure 3, the surface roughness has decreased significantly. Table 3 indicates the Sa and Sq values of the laser-polished areas and the as-built surface. The Sa and Sq values of the as-built area are 44.14 µm and 54.27 µm, respectively. While Sa values of laser-polished areas are 4.40 µm, 5.99 µm, 8.97 µm, 5.86 µm and 5.68 µm, respectively, Sq values are 5.28 µm, 7.68 µm, 9.78 µm, 7.32µm, 6.95 µm, respectively.
Table 3: Roughness values of LP and As-built surfaces. Exp. No
Sa (µm)
Sq (µm)
1 4.40 5.28 2 5.99 7.68 3 8.97 9.78 4 5.86 7.32 5 5.68 6.95
As-Built 44.14 54.27
Figure 4 shows the effect of scanning distance on roughness values (Sa, Sq) with reference to the first, second and third studies. It can be seen that the Sa and Sq values decrease with the increase of the hatch spacing.
Figure 4: The effect of hatch spacing on roughness values (Sa, Sq) with reference to the 1st, 2nd and 3rd experiments.
Figure 5 shows the effect of pulse width on roughness values (Sa, Sq) with reference to the 3rd and 4th experiments. It can be seen that the Sa and Sq values increase with the increase of the pulse width.
It can be observed that with the application of LP onto the surface of the part produced with EBM, the surface roughness was successfully improved and Sa values decreased from 44.14 µm to 4.40 µm. In this work, 90 % roughness reduction was successfully achieved in the surface roughness by applying LP.
57

Figure 5: The effect of pulse width on roughness values (Sa, Sq) with reference to the 3rd and 4th experiments.
4. Conclusion With the additive manufacturing method, it is expected that complex parts will take place more frequently in the industry. The laser polishing, which emerged as an alternative method to traditional methods, can be used to reduce the roughness of the surface of, especially complex parts.
In this work, laser polishing process was applied to the surface of the Ti-6Al-4V part producedby the EBM method, which is one of the additive manufacturing methods.Besides, the effect of hatch spacing and the pulse width on the surface roughness was studied in this research work.As a result of this research, the surface roughness of the AM part could be successfully reduced by 90 %.
5. AcknowledgementsThe authors would like to acknowledge ASELSAN A.S. for supplying the EBM specimens,IPG Photonics Eurasia for conducting laser polishing experiments, and of course IncekaralarA.S. for the surface inspections.
References 1. Gora WS, Tian YT, Cabo AP, Ardron M, Maier RRJ, Prangnell P, Weston NJ, Hand DP
(2016) Enhancing surface finish of additively manufactured titanium and cobalt chromeelements using laser based finishing. Physcs Proc 83:258-263.doi:10.1016/j.phpro.2016.08.021
2. Qian M, Xu W, Brandt M, Tang HP (2016) Additive manufacturing and postprocessing ofTi-6Al-4V for superior mechanical properties. Mrs Bull 41 (10):775-783.doi:10.1557/mrs.2016.215
3. Tian Y, Gora WS, Cabo AP, Parimi LL, Hand DP, Tammas-Williams S, Prangnell PB(2018) Material interactions in laser polishing powder bed additive manufactured Ti6Al4Vcomponents. Addit Manuf 20:11-22. doi:10.1016/j.addma.2017.12.010
58

4. Mohajerani S, Miller JD, Tutunea-Fatan OR, Bordatchev EV (2017) Thermo-PhysicalModelling of Track Width During Laser Polishing of H13 Tool Steel. ProcediaManufacturing 10:708-719. doi:10.1016/j.promfg.2017.07.026
5. Tian YT, Gora WS, Cabo AP, Parimi LL, Hand IDP, Tammas-Williams S, Prangnell PB(2018) Material interactions in laser polishing powder bed additive manufactured Ti6Al4Vcomponents. Addit Manuf 20:11-22. doi:10.1016/j.addma.2017.12.010
6. Lamikiz A, Sánchez JA, López de Lacalle LN, Arana JL (2007) Laser polishing of partsbuilt up by selective laser sintering. International Journal of Machine Tools andManufacture 47 (12-13):2040-2050. doi:10.1016/j.ijmachtools.2007.01.013
7. Mai TA, Lim GC (2004) Micromelting and its effects on surface topography and propertiesin laser polishing of stainless steel. J Laser Appl 16 (4):221-228. doi:Doi10.2351/1.1809637
8. Ma CP, Guan YC, Zhou W (2017) Laser polishing of additive manufactured Ti alloys. OptLaser Eng 93:171-177. doi:10.1016/j.optlaseng.2017.02.005
9. Afshari M (2016) Electrospun Nanofibers. In: Semnani D (ed) Geometricalcharacterization of electrospun nanofibers. 1st edn. Woodhead Publishing, Amsterdam, pp151-180
59

SINGLE BEAD PROPERTY OF SHORT FIBER CARBON REINFORCED ABS COMPOSITES PRODUCED WITH LARGE
SCALE ADDITIVE MANUFACTURING (LSAM)
OMER EYERCIOGLU*1, ENGIN TEK1, MEHMET ALADAG1
1 Gaziantep University, Engineering Faculty, Mechanical Engineering Department, Gaziantep, TURKEY
Abstract
This study presents an analysis of the mechanical behavior of different amounts of carbon fiber additive ABS composites produced by the large-scale additive manufacturing (LSAM) method. Additive manufacturing is distinguished from other manufacturing methods such as casting,molding, machining or etc. by its ability to obtain complex parts by this manufacturing method. Even it is desired to make rapid prototyping, due to the manufacturing time related to material deposition rate; it is not suitable for mass production. Also, the mechanical strength of produced parts is not adequate in terms of strength for the end-user. So, engineers made great efforts to overcome this problem, in particular, increasing the strength of produced parts with additive manufacturing technology. Adding some strengthen additives (carbon, fiberglass, etc.) into the material, therefore, significant having high strength materials would have been manufactured by this method. In order to validate enhanced material in terms of tensile and compression strength, flexural bending capacity, and non-supported bridging distance ability, many studies were carried out by researchers, however, these studies were generally carried out for small volume printers. Namely, there is a gap that must be filled in huge volume printing systems (LSAM) inview of these studies. Here, flexural capacity was investigated in a large-scale additive manufacturing system. Flexural tests were conducted following the ASTM standard of D790. In this study, In order to evaluate the flexural bending capacity of a single layer, four specimens areproduced from the direct extrusion system of LSAM.
Keywords: Large scale additive manufacturing, direct extrusion system, flexural bending test, carbon fiber abs.
1. IntroductionLarge scale additive manufacturing (LSAM) has become popular in recent years due to theadvantages of fast prototyping in the huge volume of parts and availability in differentcharacteristics of raw material [2]. The working principle of the LSAM system is similar to fuseddeposition modeling (FDM) printers. Namely, both technologies extrude hot thermoplasticmaterial along specific tool paths to generate three-dimensional shapes [2]. Traditionalcommercial printer types, fused deposition machines (FDM), are also very popular in the rapidprototyping of the small parts. However, these printers have some limitations in terms of printingtime, printing capacity, and cost [1]. In addition to this, used raw material flexibilities in terms ofmechanical characteristics are too narrow that it limits the part quality for end-users [4]. Thus,LSAM is needed in production with the additive manufacturing method [10]. In this area,
60
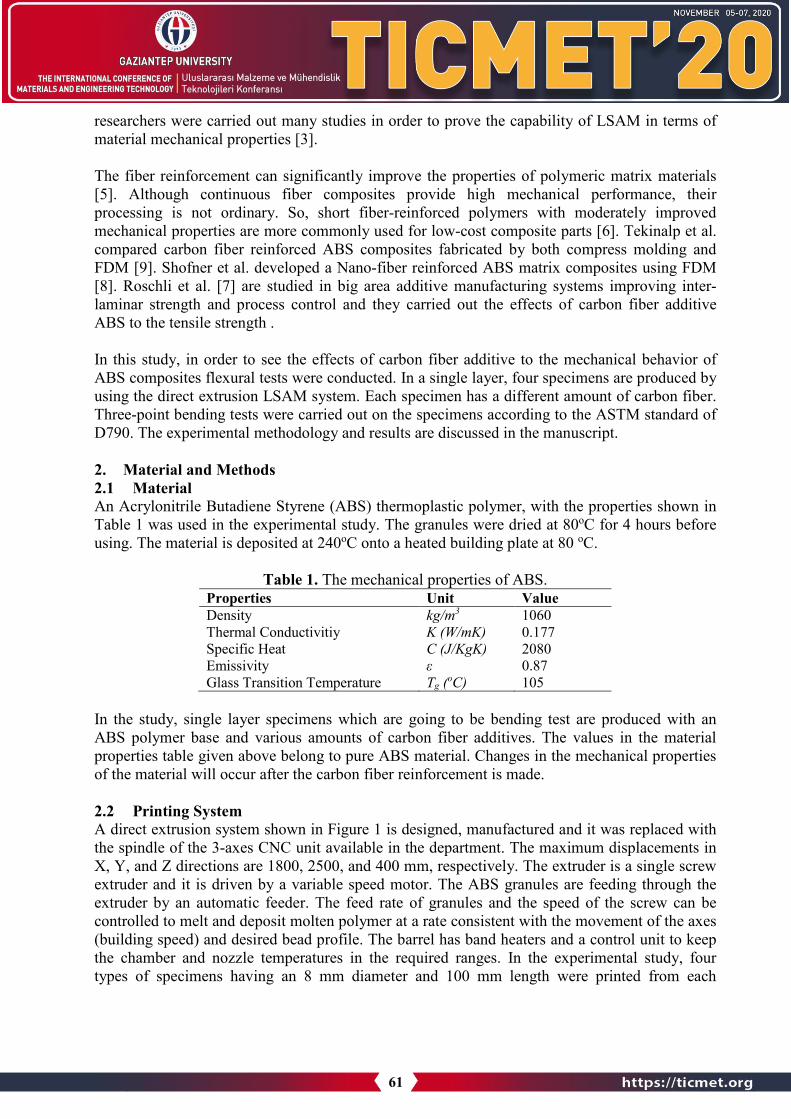
researchers were carried out many studies in order to prove the capability of LSAM in terms ofmaterial mechanical properties [3].
The fiber reinforcement can significantly improve the properties of polymeric matrix materials [5]. Although continuous fiber composites provide high mechanical performance, their processing is not ordinary. So, short fiber-reinforced polymers with moderately improved mechanical properties are more commonly used for low-cost composite parts [6]. Tekinalp et al.compared carbon fiber reinforced ABS composites fabricated by both compress molding and FDM [9]. Shofner et al. developed a Nano-fiber reinforced ABS matrix composites using FDM[8]. Roschli et al. [7] are studied in big area additive manufacturing systems improving inter-laminar strength and process control and they carried out the effects of carbon fiber additive ABS to the tensile strength .
In this study, in order to see the effects of carbon fiber additive to the mechanical behavior ofABS composites flexural tests were conducted. In a single layer, four specimens are produced by using the direct extrusion LSAM system. Each specimen has a different amount of carbon fiber. Three-point bending tests were carried out on the specimens according to the ASTM standard of D790. The experimental methodology and results are discussed in the manuscript.
2. Material and Methods 2.1 Material An Acrylonitrile Butadiene Styrene (ABS) thermoplastic polymer, with the properties shown in Table 1 was used in the experimental study. The granules were dried at 80oC for 4 hours before using. The material is deposited at 240oC onto a heated building plate at 80 oC.
Table 1. The mechanical properties of ABS. Properties Unit Value Density kg/m3 1060 Thermal Conductivitiy K (W/mK) 0.177 Specific Heat C (J/KgK) 2080 Emissivity ε 0.87 Glass Transition Temperature Tg (oC) 105
In the study, single layer specimens which are going to be bending test are produced with an ABS polymer base and various amounts of carbon fiber additives. The values in the material properties table given above belong to pure ABS material. Changes in the mechanical properties of the material will occur after the carbon fiber reinforcement is made.
2.2 Printing System A direct extrusion system shown in Figure 1 is designed, manufactured and it was replaced with the spindle of the 3-axes CNC unit available in the department. The maximum displacements in X, Y, and Z directions are 1800, 2500, and 400 mm, respectively. The extruder is a single screw extruder and it is driven by a variable speed motor. The ABS granules are feeding through the extruder by an automatic feeder. The feed rate of granules and the speed of the screw can be controlled to melt and deposit molten polymer at a rate consistent with the movement of the axes (building speed) and desired bead profile. The barrel has band heaters and a control unit to keep the chamber and nozzle temperatures in the required ranges. In the experimental study, four types of specimens having an 8 mm diameter and 100 mm length were printed from each
61
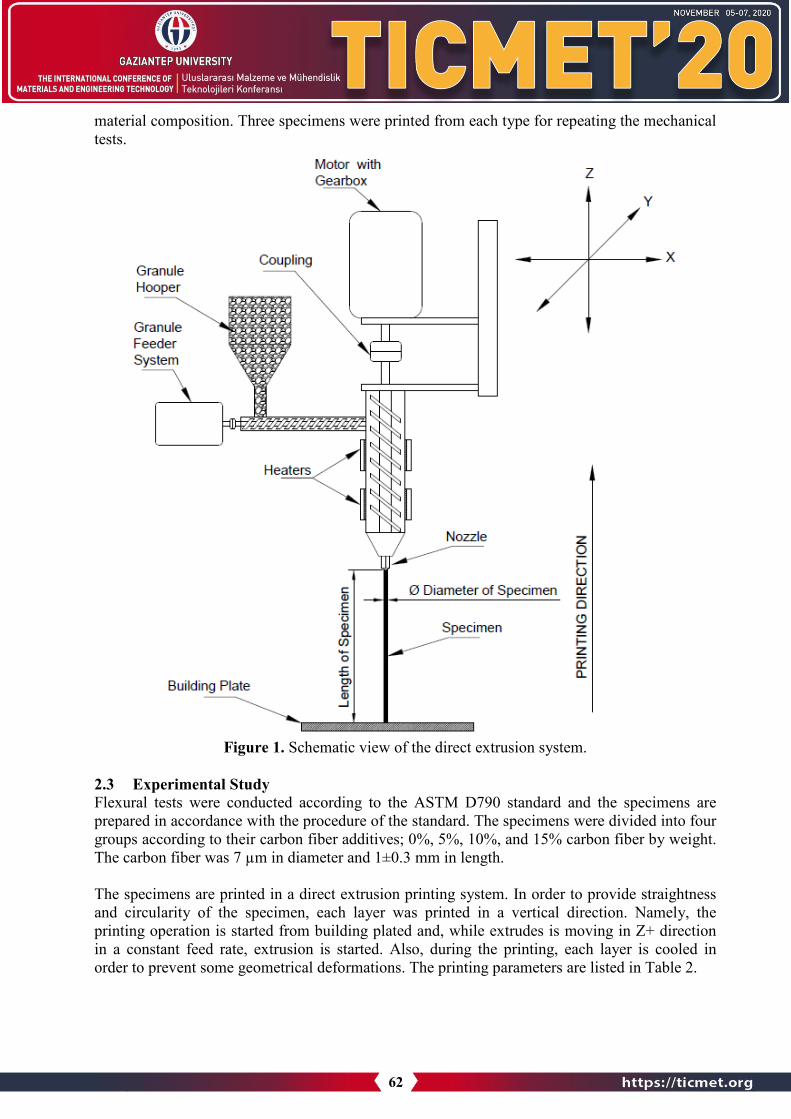
material composition. Three specimens were printed from each type for repeating the mechanical tests.
Figure 1. Schematic view of the direct extrusion system.
2.3 Experimental Study Flexural tests were conducted according to the ASTM D790 standard and the specimens are prepared in accordance with the procedure of the standard. The specimens were divided into four groups according to their carbon fiber additives; 0%, 5%, 10%, and 15% carbon fiber by weight. The carbon fiber was 7 µm in diameter and 1±0.3 mm in length.
The specimens are printed in a direct extrusion printing system. In order to provide straightness and circularity of the specimen, each layer was printed in a vertical direction. Namely, the printing operation is started from building plated and, while extrudes is moving in Z+ direction in a constant feed rate, extrusion is started. Also, during the printing, each layer is cooled in order to prevent some geometrical deformations. The printing parameters are listed in Table 2.
62

Table 2. Printing Parameters Feature Unit Value Printing Temperature oC 240 Deposition rate kg/hr 0.2 Z Axis Feed rate mm/min 180
Flexural bending tests were conducted in a Universal testing machine (SCHIMATZU) having three-point test fixtures such as specimen support and loading nose. A 4-point flexural bending test scheme is given in detail in Figure 2. Testing parameters were conducted according to ASTM D790 Standards. All of these parameters are defined software that controls the testing machine. Thus, the test machine gives the test results simultaneously.
Flexural strength Fs is calculated by software from peak load in the flexural test. Also, theformulation was given in below in order to calculate the flexural capacity (see Eq 1).
𝐹𝐹𝑠𝑠 = 𝑃𝑃𝑃𝑃𝜋𝜋𝑅𝑅3
(Eq. 1)
here, Fs is flexural capacity, P is peak load, L is span length of supports R is the radius of specimen. Span length was set according to ASTM D790 Standard and, support span-to-radius is set in ratio of 16:1.
Figure 2. 3-point bending test scheme
3. Results and DiscussionsIn this section, the experimental results carried out from a single layer bead which is conductedwith a 3-point flexural test were given. Also, a load-displacement table is given in order toevaluate the results clearly. In figure 3, the flexural bending capacity of each featured specimenwas plotted in terms of stress and strain. In this figure, the changes in the strains were asexpected, i.e. the ductility reduces with the amount of carbon fiber addition. The maximum strainis measured as 12% for the pure ABS (no carbon fiber). However, the bending capacities arechanging with the various amounts of carbon fiber. The maximum loads predicted for allspecimens are given in Table 3. The maximum flexural strength is 95.3 MPa for pure ABS, 116MPa for 5%, 91.6 MPa for 10% and 72.9 MPa for 15% carbon fiber added specimens.
63

Figure 3. Flexural bending capacity of each featured specimen
Table 3. Load – Displacement table.
Specimen Load (N)
Displacement (mm)
ABS with 0% Carbon fiber 93 16.95 ABS with 5% Carbon fiber 103 11.9 ABS with 10% Carbon fiber 81 10.05 ABS with 15% Carbon fiber 64 6.06
Also, in order to observe the carbon fibers orientation in the extruded bead, the specimen was examined under a microscope. Specimens were investigated in its longitudinal direction (direction of extrusion) and transverse direction (cross-section). In figure 4, the microscopic views of the 15% carbon fiber reinforced ABS bead in (a) the cross-sectional direction and (b) are the longitudinal direction. It can be seen from the figure that, the carbon fibers are oriented in the extrusion direction. A number of fibers may have been rotated due to forcing the flow through the nozzle inlet and shear rate.
(a) (b) Figure 4. The microscopic views of the 15% carbon fiber reinforced ABS bead in a) the cross-
sectional direction and b) are the longitudinal (extrusion) direction.
0153045607590
105120
0 1 2 3 4 5 6 7 8 9 10 11 12 13
Flex
ural
Str
ess (
Mpa
)
Strain (%)
ABS WITH 0 % CF ABS WITH 5 % CF ABS WITH 10 % CF ABS WITH 15 % CF
64

4. ConclusionsIn this study, in order to see the effects of carbon fiber additive to the mechanical behavior ofABS composites flexural tests were conducted. In a single layer, four specimens are produced by using the direct extrusion LSAM system. Each specimen has a different amount of carbon fiber. Three-point bending tests were carried out on the specimens according to the ASTM standard of D790. The followings may be concluded from the results of the study:
• The carbon fibers in the ABS matrix are properly oriented in the direction of extrusionduring LSAM process.
• The ductility of the extruded bead reduces with the increasing amount of carbon fiberaddition. Pure ABS has the maximum ductility.
• The maximum flexural stress is obtained for 5% carbon fiber reinforced specimen amongall specimens having various amounts (0%-15%) of carbon fibers.
• The reduction of flexural stress for further addition of carbon fibers (>%5) may comefrom the porosity formation, this is going to be inspected as the study is progressed.
Acknowledgement The authors would like to acknowledge the contributions of the Scientific Project Bureau (BAPYB) of The Gaziantep University.
References 1. Bhalodi, D., Zalavadiya, K., Gurrala, P.K.,: Influence of temperature on polymer parts
manufactured by fused deposition modeling process,. Journal of the Brazilian Society ofMechanical Sciences and Engineering, (2019) 41 (3), 113
2. Duty, C.E., Kunc, V., Compton, B., Post, B., Erdman, D., Smith, R., Lind, R., Lloyd, P.,Love, L.,: Structure and mechanical behavior of Big Area Additive Manufacturing (BAAM)materials,. Rapid Prototyping Journal, (2017) 23 (1), 181–189
3. Eyercioglu, O., Aladag, M., Aksoy, A., Gov, K.,: Determination of The Maximum BridgingDistance in Large Scale Additive Manufacturing,. In: 4th International Congress on 3dPrinting (Additive Manufacturing) Technologies and Digital Industry. pp. 40–48. , Antalya(2019)
4. Eyercioglu, O., Aladag, M., Sever, S.,: Temperature Evaluation and Bonding Quality ofLarge Scale Additive Manufacturing Thin Wall Parts,. Sigma Journal of Engineering andNatural Sciences, (2018) 36 (3), 645–654
5. Karsli, N.G., Aytac, A.,: Tensile and thermomechanical properties of short carbon fiberreinforced polyamide 6 composites,. Composites Part B: Engineering, (2013)
6. Ning, F., Cong, W., Qiu, J., Wei, J., Wang, S.,: Additive manufacturing of carbon fiberreinforced thermoplastic composites using fused deposition modeling,. Composites Part B:Engineering, (2015) 80 369–378
7. Roschli, A., Duty, C., Lindahl, J., Post, B.K., Chesser, P.C., Love, L.J., Gaul, K.T.,:Increasing interlaminar strength in large scale additive manufacturing,. Solid FreeformFabrication 2018: Proceedings of the 29th Annual International Solid Freeform FabricationSymposium - An Additive Manufacturing Conference, SFF 2018, (2020) 543–555
8. Shofner, M.L., Lozano, K., Rodríguez-Macías, F.J., Barrera, E. V.,: Nanofiber-reinforcedpolymers prepared by fused deposition modeling,. Journal of Applied Polymer Science,(2003)
65

9. Tekinalp, H.L., Kunc, V., Velez-Garcia, G.M., Duty, C.E., Love, L.J., Naskar, A.K., Blue,C.A., Ozcan, S.,: Highly oriented carbon fiber-polymer composites via additivemanufacturing,. Composites Science and Technology, (2014) 105 144–150
10. Yang, L., Anam, A.,: An investigation of standard test part design for additivemanufacturing,. International Solid Freeform Fabrication Symposium – An AdditiveManufacturing Conference, (2014) 901–922
66

OVERVIEW ON HIP JOINT FORGING TECHNOLOGY OF TI ALLOYS
OMER EYERCIOGLU, AHMAD LUTFI MANLA
Gaziantep University, Engineering Faculty, Mechanical Engineering Department, Gaziantep, TURKEY.
Abstract
This paper discusses the technology used in forging Ti alloy HIP implants, different tool systems, forging parameters, and material properties. The most advantage of closed die forging is the ability to obtain a near-net shape with higher accuracy of the forged part and fewer deformation steps. Titanium (Ti) and Ti alloys are used in the aerospace, chemical, and biomedical industries because of the biocompatibility corrosion resistance and mechanical properties, etc. Ti alloys such as Ti-6Al-4V and Ti-6Al-7Nb is now mainly used as biomedical. Plastic Deformation represented by forging is introduced in this paper as it can produce a variety of products in different shapes and sizes. The hip implants are designed to mimic the natural movement of the body. The primary differences between implants are their size and the material of the components. There are 5 types of hip implants: Metal-on-Polyethylene (MoP), Metal-on-Metal (MoM), Ceramic-on-Metal (CoM), Ceramic-on-Polyethylene (CoP), and Ceramic-on-Ceramic (CoC). The FE analyses of the static force for hip joint replacement indicated that Titanium alloys are the materials that provide sufficient mechanical strength for the stem and Ti6Al4V provided the best choice for the stem due to its highest resistance to deformation and strain. The effect of forging die on forging accuracy is examined using FE and indicated that the effect of die elasticity has a larger effect on thickness errors than thermal distortion.
Keywords: Plastic Deformation, Forging, Closed Die, Titanium, Biomedical Materials, HIP joint.
1. IntroductionHip implants are medical devices intended to restore mobility and relieve pain usually associatedwith arthritis and other hip diseases or injuries. Every hip implant system has unique devicedesign features such as size, shape, material, and dimensions. There are several factors that mayinfluence the outcome and longevity of a hip implant including the device design features,surgeon experience and implantation technique, and individual patient characteristics such asage, sex, weight, activity level and overall health.
Hip prostheses, or femoral stems, are the most heavily loaded implants in the human body. The neck of the hip implant (corresponding to the femoral head before the implant is fitted) must support extremely heavy loads, which can be up to several tons per cm² during certain walking and jumping movements.
The forging is a preferable production technique as the production process causes grain flow in the internal metal structure. This grain flow, which follows the profile of the implant, gives
67

greater fatigue resistance than any other production technique currently in existence on the market. It is therefore currently the preferred production technique for the femoral stem.
2. Hip Implant System During a total hip arthroplasty four parts are introduced to create a new hip. the four artificial components are: the acetabular component, a plastic liner, a femoral head and the femoral stem.
Figure 1 Components of hip replacement surgery. (A) The acetabulum, or socket of the ball and-socket joint, is reamed to receive the cup. (B) the cup. (C) the liner. (D) The ball, which is placed
on the stem. (E) the stem which is then inserted into (F) hollowed-out femur or thigh bone
1. Acetabular component (socket): The bowl-shaped piece that represents your new socket.This bowl or “cup” shaped piece is fit into your resurfaced socket. This piece is usually madeof metal but is occasionally made of ceramic or a combination of plastic and metal.
2. Acetabular liner: The plastic liner fits into the acetabular component and allows the femoralhead (ball) to glide easier and more naturally in the socket. This piece is usually made ofhigh-quality plastic.
3. Femoral head (ball): The ball that will fit directly into the new, plastic lined socket and isattached to the femoral stem. There are many shapes and sizes of “heads”. These are made ofdurable metal, plastic, ceramic, or a combination of materials.
4. Femoral stem: The stem attaches to the ball and supports the new hip joint. Usually, thismetal piece if porous, allowing for natural bone to grow and attach to this piece whichreplaces your femur.
2.1 Hip Implants System Materials Several materials were used for different parts of the hip implant system. trying to combine biocompatibility, fatigue resistance, stiffness, toughness, withstanding static and dynamic loads, and high resistance to mechanical and chemical wear. In most cases, the femoral stem component is built from titanium, titanium cobalt, stainless steel, cobalt-chromium alloys, or a titanium and cobalt mixed metal. The head, liner and acetabular parts can be made of either metal, plastic or ceramic, or a combination of the above. Standard Implant Component Materials are:
68

1. Metal on Metal (MOM)– This is when the socket and the ball components are all made ofmetal. The metal components can be a combination of metals like titanium, cobalt-chromiumalloys, or cobalt mixed metals.
2. Polyethylene and Metal on Polyethylene (MOP)– Polyethylene is a high-quality metal-freeplastic. The socket or acetabular liner is usually made of this plastic. In addition, othercomponents can be made of metal and covered with plastic. When a socket is plastic and theball is metal, this is considered MOP.
3. Ceramic on Metal (COM), Ceramic on Polyethylene (COP), Ceramic on Ceramic(COC)– Ceramic hips are less common. Ceramic material is often used in combination withspecial metal components or plastic components for those allergic to metals. Althoughceramic parts are durable, they have been more fragile than metal components. However, thisis changing. Today’s ceramic parts are argued to outlast metal part.
3. Materials Titanium alloys are divided into three major classes, based on the predominant allotropic form(s) present at room temperature:
• α/near-α alloys• α-β alloys• β/metastable β alloys
Alpha-beta titanium alloys represent the most widely used class of titanium alloys (with Ti-6Al-4V) being the most widely used of all titanium alloys) and contain sufficient β stabilizers to stabilize some of the β phase at room temperature. Alpha-beta titanium alloys are generally more readily forged than α alloys and are more difficult to forge than some β alloys. Typically, α-β alloys have intermediate-to-high strength with excellent fracture toughness and other fracture-related properties. Forging and TMP processes for α-β alloys are designed to develop optimalcombinations of strength, fracture toughness, and fatigue characteristics. [1]
Figure 2 Femoral Stem different design
69

3.1 Titanium Alloys for Femoral Stem partTitamium alloy Ti6Al4V (ISO 5832-3: 1996) is used worldwide in implants
Table 1 Chemical Composition of the Alloy Wt.% [2] Ti Al V Fe O
Balance 6 4 Max 0.25 Max 0.2
Table 2 Mechanical properties of Ti alloys versus human natural bone Material Material Properties
Density (g / cm3)
Compressive Strength (MPa)
Elastic Modulus (GPa)
Natural bone 1.8 – 2.1 130 – 180 3 - 20 Ti and Ti
alloys 4.4 – 4.5 590 – 1117 55 - 117
4. The Manufacturing of Total Hip Arthroplasty There are various manufacturing techniques for producing hip components. All these manufacturing processes produce different mechanical and electrochemical properties. The heat treatment further changes the electromechanical properties of the alloy and should be considered in the design of mating components and high weight-bearing implants. Implant designers and manufacturers should be conscious of the effects of heat treatment and various fabricating techniques.
4.1 Closed Die Forging The most used technique for the fabrication of femoral stem components is forging. forging is a process whereby a hot, predetermined billet of alloy is placed in a formed mold of the finished part and mechanically pressed into shape. The molds have two parts that enable placing the billet into the forming process. The drop forging process typically requires multiple stages to forge the billet into final form. Drop forging is favored for its enhancement to mechanical properties of the alloys and its moderate cost of production.
Figure 3 Stages of femoral stem forging process [5]
70
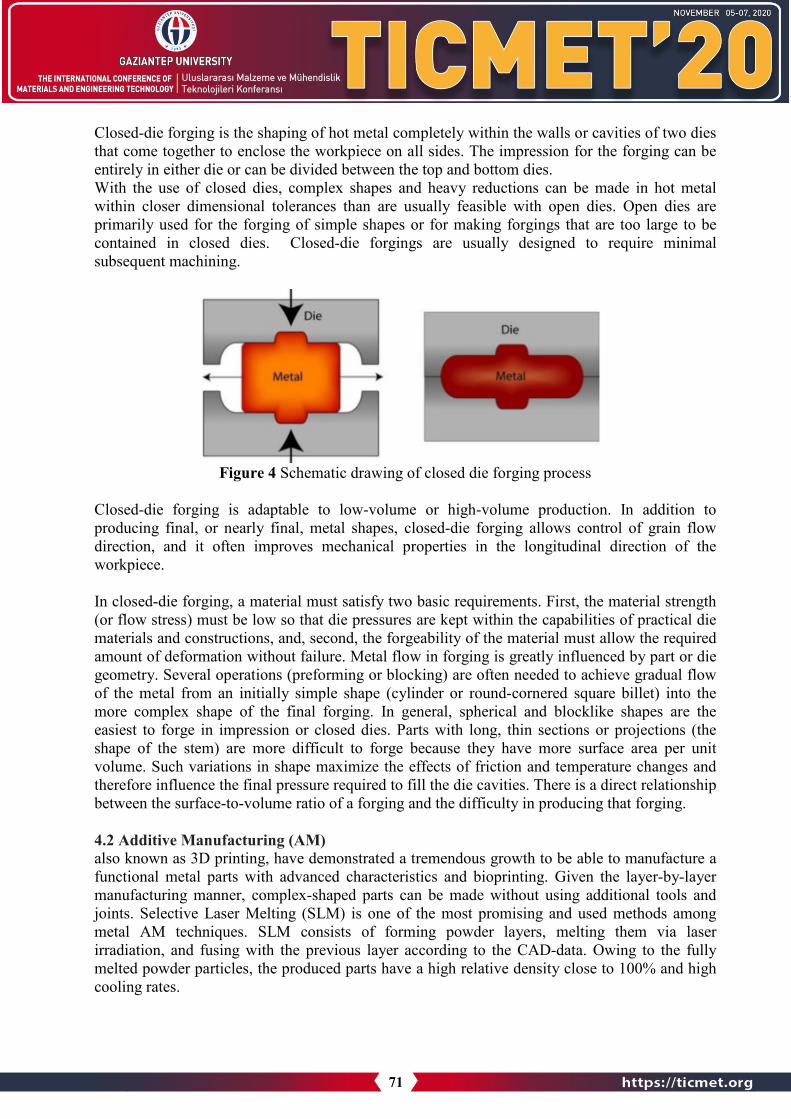
Closed-die forging is the shaping of hot metal completely within the walls or cavities of two diesthat come together to enclose the workpiece on all sides. The impression for the forging can be entirely in either die or can be divided between the top and bottom dies. With the use of closed dies, complex shapes and heavy reductions can be made in hot metalwithin closer dimensional tolerances than are usually feasible with open dies. Open dies are primarily used for the forging of simple shapes or for making forgings that are too large to be contained in closed dies. Closed-die forgings are usually designed to require minimalsubsequent machining.
Figure 4 Schematic drawing of closed die forging process
Closed-die forging is adaptable to low-volume or high-volume production. In addition to producing final, or nearly final, metal shapes, closed-die forging allows control of grain flow direction, and it often improves mechanical properties in the longitudinal direction of the workpiece.
In closed-die forging, a material must satisfy two basic requirements. First, the material strength (or flow stress) must be low so that die pressures are kept within the capabilities of practical diematerials and constructions, and, second, the forgeability of the material must allow the requiredamount of deformation without failure. Metal flow in forging is greatly influenced by part or die geometry. Several operations (preforming or blocking) are often needed to achieve gradual flow of the metal from an initially simple shape (cylinder or round-cornered square billet) into the more complex shape of the final forging. In general, spherical and blocklike shapes are the easiest to forge in impression or closed dies. Parts with long, thin sections or projections (the shape of the stem) are more difficult to forge because they have more surface area per unit volume. Such variations in shape maximize the effects of friction and temperature changes andtherefore influence the final pressure required to fill the die cavities. There is a direct relationshipbetween the surface-to-volume ratio of a forging and the difficulty in producing that forging.
4.2 Additive Manufacturing (AM) also known as 3D printing, have demonstrated a tremendous growth to be able to manufacture a functional metal parts with advanced characteristics and bioprinting. Given the layer-by-layer manufacturing manner, complex-shaped parts can be made without using additional tools and joints. Selective Laser Melting (SLM) is one of the most promising and used methods among metal AM techniques. SLM consists of forming powder layers, melting them via laser irradiation, and fusing with the previous layer according to the CAD-data. Owing to the fully melted powder particles, the produced parts have a high relative density close to 100% and high cooling rates.
71

4.3 Femoral Stem forging Production Steps the forging process parameters, often in combination with subsequent thermal treatments, are manipulated for each alloy type to achieve the desired final forging microstructure and mechanical properties
Table 3 Typical Fabrication Methods and Finishes for Ti6Al4V Femoral Stem [5] Production method Forging Applicable components
Stems (requires post-heat treatment) Cups
Surface finish 1. Wet blasting2. Coarse blasting3. Polished
Coatings 1. Hydroxyapatite2. Plasma sprayed3. Sintered particles
Finishing Laser marking
Figure 5 Typical Fabrication process of femoral stem
The predominant forms of forging stock used are billet (round, octagonal, rectangular, or square) and bar that has been fabricated by primary hot-working processes from titanium alloy ingot. Preheating for Forging: The heating of titanium alloys for forging is a crucial part of the forging process to contorl the metal temperature within the narrow temperature limits necessary for the successful forging of titanium alloys. The handbook [1] recommend forging temperature to be around 900 – 980 °C.
72

Figure 6 Effect of forging temperature on forging pressure for three titanium alloys and 4340 alloy steel [3]
Heating of Dies: Dies are always preheated in the closed-die conventional forging of titanium alloys, die temperature varying with the type of forging equipment used. Dies for titanium alloy forging are usually preheated in remote die heating systems. the Handbook [1] recommned die temperture to be around 300-600 °C. With some conventional forging processes, particularly the hydraulic press forging of titanium alloys, the temperature of the dies may increase during forging. Die damage may occur without appropriate cooling. Therefore, titanium alloy dies are often cooled during forging using wet steam, air, or occasionally water.
Trimming: trimming is an intermediate operation that is necessary for the successful fabrication of conventional titanium alloy forgings. The flash generated in most closed-die titanium alloy forging processes is removed by hot trimming, sawing, flame cutting, or machining, depending on the size, complexity, and production volume of the part being produced.
Heat Treatment. Most titanium alloy forgings are thermally treated after forging, with heat treatment processes ranging from simple stress-relief annealing to multiple-step processes of solution treating, quenching, aging, and/or annealing designed to modify the microstructure of the alloy to meet specific mechanical property criteria.
Inspection of titanium alloy forgings takes two forms: in-process inspection and final inspection. In-process inspection techniques, such as statistical process control and/or statistical quality control, are used to determine that the product being manufactured meets critical characteristics and that the forging processes are under control. Final inspection, including mechanical property testing, is used to verify that the completed forging product conforms to all drawing and specification criteria.
73
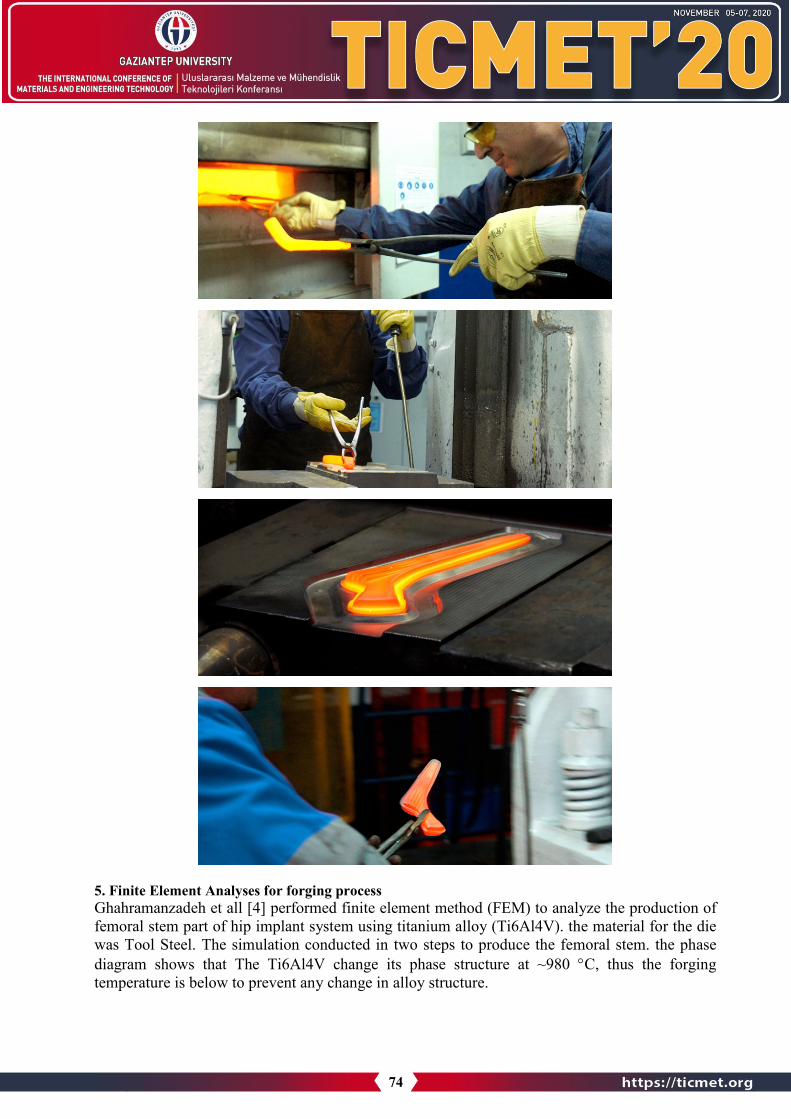
5. Finite Element Analyses for forging processGhahramanzadeh et all [4] performed finite element method (FEM) to analyze the production offemoral stem part of hip implant system using titanium alloy (Ti6Al4V). the material for the diewas Tool Steel. The simulation conducted in two steps to produce the femoral stem. the phasediagram shows that The Ti6Al4V change its phase structure at ~980 °C, thus the forgingtemperature is below to prevent any change in alloy structure.
74
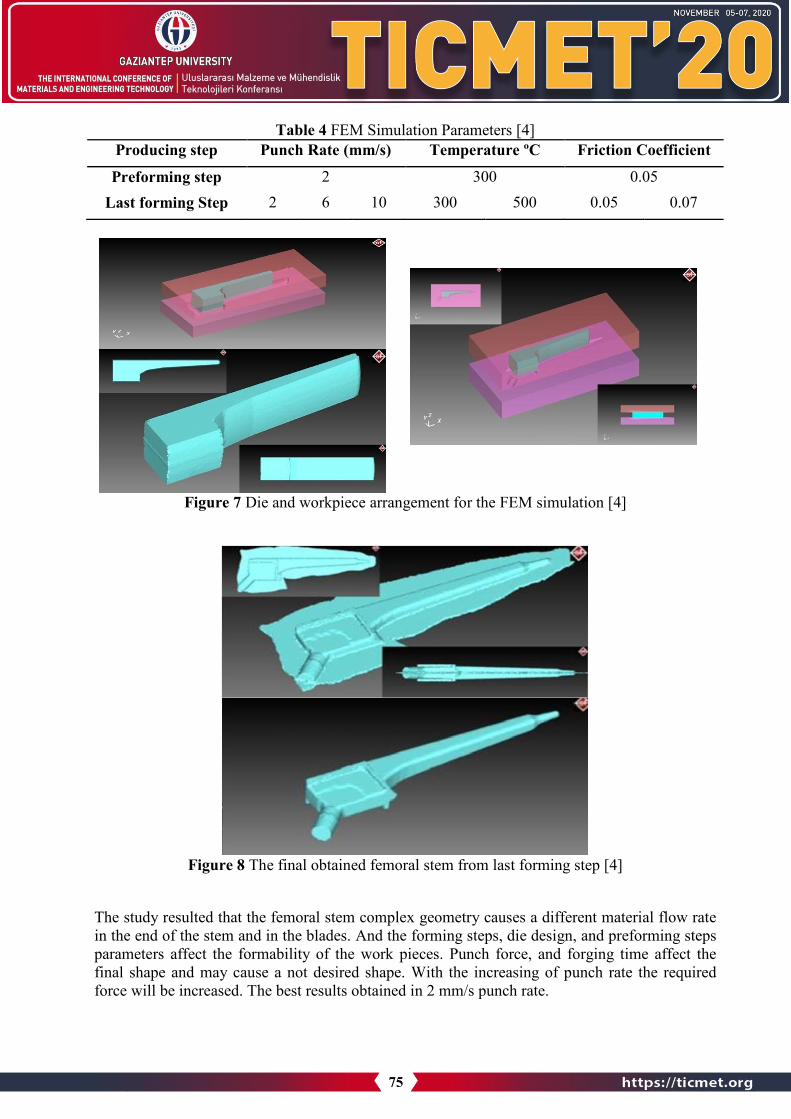
Table 4 FEM Simulation Parameters [4] Producing step Punch Rate (mm/s) Temperature ºC Friction Coefficient
Preforming step 2 300 0.05 Last forming Step 2 6 10 300 500 0.05 0.07
Figure 7 Die and workpiece arrangement for the FEM simulation [4]
Figure 8 The final obtained femoral stem from last forming step [4]
The study resulted that the femoral stem complex geometry causes a different material flow rate in the end of the stem and in the blades. And the forming steps, die design, and preforming steps parameters affect the formability of the work pieces. Punch force, and forging time affect the final shape and may cause a not desired shape. With the increasing of punch rate the required force will be increased. The best results obtained in 2 mm/s punch rate.
75

The stress is uniformly distributed on the workpiece that indicate a seamless material flow in the forming process. The corners and sharp edges have higher stress values. The results showed that forging at 500 °C provide better formability. The temperature is increased during the forging process up to 80% at 300 °C and up to 40% at 500 °C .
The drawbacks of this study is the use of rectangular preform as an initial part, basic design for the forging die. And the amount of flash, leading to the need of trimming and destortion of the material flow.
References 1. G.W. Kuhlman, Forging of Titanium Alloys. ASM Vol 14 Forming and Forging (589-628)2. R. Boyer, G. Welsch, and E. W. Collings, Materials Properties Handbook: Titanium Alloys,
ASM International, Materials Park, OH, 1994.3. A.M. Sabroff, F.W. Boulger, and H.J.Henning, Forging Materials and Practices, Reinhold,
19684. Ghahramanzadeh asl, Hojjat & Sezek, S. & Alsaran, Akgun. ANALYSIS OF HIP
PROSTHESIS PRODUCTION WITH FORGING USING THE FINITE ELEMENTMETHOD. Erzincan Üniversitesi Fen Bilimleri Enstitüsü Dergisi (2015). 8. 69.10.18185/eufbed.31555.
5. Timothy McTighe, Declan Brazil, and Warwick Bruce. Metallic Alloys in Total HipArthroplasty
6. M. Ali., O. Hakan., M. Taner., Investigation of Mechanical and Microstructural Propertiesof Ti-6Al-4V Alloy Depending on Hot Forging Process Parameters. InternationalConference on the Technology of Plasticity, ICTP 2017, Cambridge, UK.
76

BEHAVIOUR OF ALUMINUM ALLOYS UNDER THE NORMAL AND OBLIQUE BALLISTIC LOADS
MUHAMMET DENİZ *1, EYÜP YETER 1, MEHMET HANİFİ DOĞRU 2, EDİP ÖZTÜRK1
1 Gaziantep University, Aeronautics and Aerospace Faculty, Aircraft and Aerospace Engineering, Gaziantep, TURKEY.
2 Gaziantep University, Aeronautics and Aerospace Faculty, Pilotage Department, Gaziantep, TURKEY.
Abstract
Obliquity on ballistic loading is an important parameter and directly affects ballisticperformance, the residual velocity of the projectile, and ballistic energy absorption capacity of the target plates. In this study, the effects of ballistic loads on aluminum alloys are researchedunder the normal and oblique angle numerically. Three types of aluminum alloys are used as the material of the target plate, namely 7075 T6, 6061 T6, and 2024 T4. The used projectile is 50 calibers. The FEM models are obtained using ANSYS. 0°, 15°, 30°, and 45° oblique angles are used to compare normal ballistic impact and obliquity. 400 m/s initial projectile velocity is usedand full perforation of plates is obtained using suitable plate thickness to investigate directeffects of the oblique angles. It was shown that by increasing the oblique angle from 0° to 45°, the residual velocity of the projectile decrease. This means is that the energy absorption capacity of the target plate directly affected from an oblique angle and 7075 T6 has the highest ballistic performance.
Keyword: Ballistic, Oblique angle, Aluminum alloys.
1. IntroductionDamage resistance of target plates to the ballistic loads is an important design parameter whiledesigning the structures that will be subjected to these loads. The study of target plates under thenormal and oblique ballistic loads contribute to understandings of performance of the structuresthat are designed and produced using these plates and are subjected to the ballistic loads underthe different oblique angles. Obliquity on ballistic loading is also an important design parameterand directly affects ballistic performance, the residual velocity of the projectile, and ballisticenergy absorption capacity of the target plates. Aluminum alloys are a material chose either useddirectly a light-weight structure construction or used in fiber metal laminates (FML). Highvelocity impact damages are mainly studied as ballistic impact loading considering totally orpartial penetration of target plates using various projectiles. In ballistic studies, the ballistic limitof targets or effects of initial velocity or final velocity of the projectile after full or partialpenetration of targets has been considered.
There are many studies on the performance of target plates under the ballistic loads. In these studies either the design of projectiles to expose the high effects on the target plates or the design
77

of target plates to withstand these loads has been investigated experimentally or numerically.The ballistic characteristics of steel sheet for various projectile nose shapes were researched by Kpenyigba et al. [1]. Yeter [2] investigated the effects of normal ballistic loads on the Armox 500T and Aluminum 7075-T6 either single model of these materials or hybrid models of thesematerials. The ballistic impact performance of aluminum alloys and their hybrid models with Kevlar/Epoxy has been researched by Yeter [3], numerically. It was seen that hybrid models have shown some advantages. Subası et al. [4] studied the effects of various nose shapes of projectiles. Ballistic performance of aluminum 1100-H12 target plates under the differentoblique angles using different nose shaped investigated by Gupta et al. [5]. 0, 15, 30, and 45degrees oblique angles are used in the study. Senthil and Iqbal [6] studied the effect of projectile nose size on the ballistic resistance of 1100-H12 aluminum alloys. Zhou and Stronge [7] studied the ballistic characteristics of mono plates, double layer sheets, and sandwich panels with 0, 15, 30, and 45 degrees oblique angles. It was concluded that plates have shown the lowest ballisticlimit velocity at 30 and 45 degree oblique angles than normal. Mohammad et al. [8] investigatedballistic energy absorption of 1100-H12 aluminum plates under the 0°, 15°, and 30° oblique angles. It was shown that with the increase of the oblique angle, the ballistic limit velocity wasincreased. Experimental and numerical study was performed to investigate the ballistic performance of AA6070 aluminum plates by Holmen et al. [9]. Fawaz et al. [10] researched the behavior of ceramic composite armors under the normal and oblique impact loads. It was obtained that projectile erosion with obliquity is higher than normal loading. The residual tensile strength of carbon/epoxy composite plates was researched under the oblique impacts by Kristnama et al. [11].
In this study, the effects of ballistic loads on aluminum alloys are researched under the normal and oblique angle numerically. Three types of aluminum alloys are used as the material of the target plate, namely 7075 T6, 6061 T6, and 2024 T4. The used projectile is 50 calibers. TheFEM models are obtained using ANSYS. 0°, 15°, 30°, and 45° oblique angles are used. 400 m/s initial projectile velocity is used and full perforation of plates is obtained using suitable plate thickness to investigate direct effects of the oblique angles. Energy absorption of targets in each time interval of ballistic impact and residual velocity of projectiles were determined.
2. Materials and MethodsIn the study, effects of obliquity on 7075-T6, 6061-T6, and 2024-T4 aluminum alloys areinvestigated under the ballistic loads. Explicit FEA module of ANSYS is used. The usedprojectile is 50 caliber and its geometrical properties are given in the Figure 1 [3].
Figure 1. The projectile geometric information (dimensions in mm)
78

In the previous study of Yeter [3], the comparison of aluminum alloys are for their impactresistance has been done. Obliquity which directly affects the performance of the target and projectile has been investigated in this study. The material properties of Aluminum alloys used in the study are given in Table 1.
Table 1. Material parameters of Aluminum Alloys Parameter Value
Al 7075-T6 Al 6061-T6 Al 2024-T4 Density (kg m^-3) 2804 2703 2785 Specific Heat (J kg^-1 C^-1) 848 885 863 Initial Yield Stress Y (MPa) 420 290 260 Maximum Yield Stress Ymax (MPa) 810 680 760 Hardening Constant B 965 125 310 Hardening Exponent n 0.1 0.1 0.185 Derivative dG/dP G'P 1.741 1.8 1.8647 Derivative dG/dT G'T (Pa C^-1) -16450000 -17000000 -17620000Derivative dY/dP Y'P 0.02738 0.018908 0.01695 Melting Temperature Tmelt (C) 946.85 946.85 946.85 Gruneisen Coefficient 2.2 1.97 2.0 Parameter C1 (m s^-1) 5200 5240 5328 Parameter S1 1.36 1.40 1.338
The boundary conditions of models are given in Figure 2. During the analysis, the projectile is considered as rigid and an initial velocity of 400 m/s is applied as seen in Figure 2. The targetplate is fixed from all edges.
Figure 2. Target and projectile boundaries
3. Results and DiscussionFull penetration of target plates was done under the ballistic loads. The plate dimensions andthickness is taken as constant. The effects of obliquity have been researched. In figure 3, thevelocity change of the projectile is given for different aluminum types. As seen in this figure forall types of aluminum alloys the final velocity of the projectile decrease with the increase of theoblique angle.
79

(a)
(b)
(c) Figure 3. Projectile velocity reduction for the different aluminum alloys (a) Al 2024-T4, (b) Al 6061-T6
(c) Al 7075-T6.
320
330
340
350
360
370
380
390
400
410
0,00 0,05 0,10 0,15 0,20 0,25
Velo
city
(m/s
)
Time
AL 7075 T6- 0° AL 7075 T6-15°AL 7075 T6-30° AL 7075 T6-45°
320
330
340
350
360
370
380
390
400
410
0,00 0,05 0,10 0,15 0,20 0,25
Velo
city
(m/s
)
Time
AL 6061 T6- 0° AL 6061 T6-15°AL 6061 T6-30° AL 6061 T6-45°
320
330
340
350
360
370
380
390
400
410
0,00 0,05 0,10 0,15 0,20 0,25
Velo
city
(m/s
)
Time
AL 2024 T4- 0° AL 2024 T4-15°AL 2024 T4-30° AL 2024 T4-45°
80
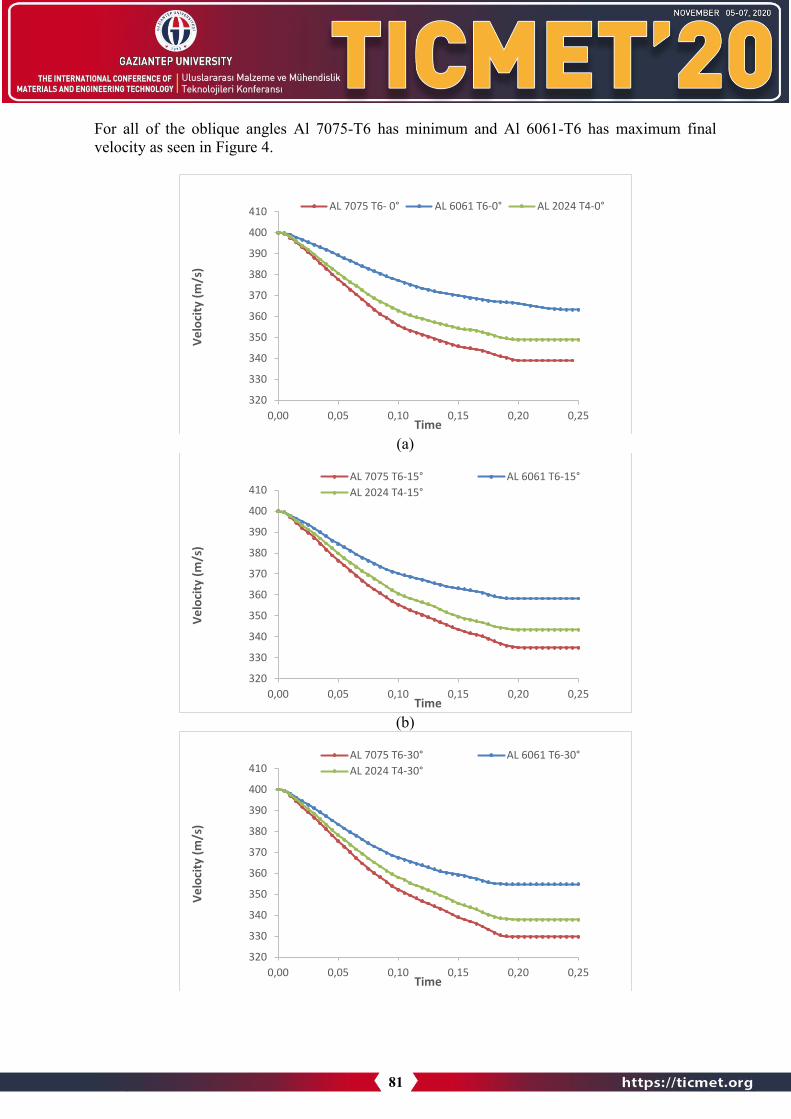
For all of the oblique angles Al 7075-T6 has minimum and Al 6061-T6 has maximum final velocity as seen in Figure 4.
(a)
(b)
320
330
340
350
360
370
380
390
400
410
0,00 0,05 0,10 0,15 0,20 0,25
Velo
city
(m/s
)
Time
AL 7075 T6- 0° AL 6061 T6-0° AL 2024 T4-0°
320
330
340
350
360
370
380
390
400
410
0,00 0,05 0,10 0,15 0,20 0,25
Velo
city
(m/s
)
Time
AL 7075 T6-15° AL 6061 T6-15°AL 2024 T4-15°
320
330
340
350
360
370
380
390
400
410
0,00 0,05 0,10 0,15 0,20 0,25
Velo
city
(m/s
)
Time
AL 7075 T6-30° AL 6061 T6-30°AL 2024 T4-30°
81

(c)
(d) Figure 4. Variation of Projectile velocity for different Oblique angle a) 0°, b)15°, c)30°, d) 45°.
Figure 5. Projectile propagation inside the target plate under the oblique angle..
320
330
340
350
360
370
380
390
400
410
0,00 0,05 0,10 0,15 0,20 0,25
Velo
city
(m/s
)
Time
AL 7075 T6-45° AL 6061 T6-45°AL 2024 T4-45°
t=0 ms t=0.015 ms t=0.020 ms t=0.025 ms t=0.030 ms t=0.040 ms
t=0.060 ms t=0.090 ms t=0.125 ms t=0.165 ms t=0.185 ms
t=0.205 ms t=0.215 ms
82

In Figure 5, the propagation of the projectile through the target plate is given. The damage of the target plate is started at 0.015 ms. The projectile starts to perforate in 0.025 ms. After 0.215ms the target plate is fully perforated.
Energy absorption of the target plate or in the other words the required energy that is needed total penetration of the target plate can be calculated using the following equation.
2 21 ( )2 i fE m V V= − (1)
Where; E= Energy needed full penetration of target (J); m= Projectile mass (kg); Vi= Initial velocity of the projectile (m/s); Vf= Final velocity of the projectile (m/s)
The final velocity comparison of Aluminum alloys with the increase of the oblique angle is given in Figure 6 and Table 2. For Al 2024-T4, when the oblique angle is increased 45° from 0°, the residual velocity is decreased to 332.51 m/s from 348.86 m/s. For Al 6061-T6, when the oblique angle is increased 45° from 0°, the residual velocity is decreased to 363.25 m/s from 350.03 m/s.And for Al 7075 T6, when the oblique angle is increased 45° from 0°, the residual velocity is decreased to 339 m/s from 322.34 m/s.
(a)
0; 348,86000
15; 343,36000
30; 337,89000
45; 332,51000
320
325
330
335
340
345
350
355
0 15 30 45
Resid
ual V
eloc
ity (m
/s)
Oblique Angle
Al 2024- T4
83

(b)
(c) Figure 6. Variation of Residual with Oblique angle (a) Al 2024-T4, (b) Al 6061-T6 (c) Al 7075-T6.
Absorbed energy comparison of Aluminum alloys with the increase of the oblique angle is given in Figure 7. For Al 2024-T4, when the oblique angle is increased 45° from 0°, the absorbed energy is increased to 1140.88 J from 883.79 J. For Al 6061-T6, when the oblique angle is increased 45° from 0°, the absorbed energy is increased to 864.92 J from 647.31 J. And for Al 7075 T6, when the oblique angle is increased 45° from 0°, the absorbed energy is increased to 1294.58 J from 1040.31 J. Also when different aluminum alloys are compared (Figure 8), Al 7075-T6 has the highest absorbed energy for the all oblique angles.
0; 363,25000 15; 358,36000
30; 354,83000
45; 350,03000
320
325
330
335
340
345
350
355
360
365
370
0 15 30 45
Resid
ual V
eloc
ity (m
/s)
Oblique Angle
Al 6061-T6
0; 339,000
15; 334,79000
30; 329,7000
45; 322,34000 320
322
324
326
328
330
332
334
336
338
340
0 15 30 45
Resid
ual V
eloc
ity (m
/s)
Oblique Angle
Al 7075-T6
84

Table 2 Residual velocities of Aluminum Alloys for different oblique angles
(a)
(b)
0; 883,79
15; 971,65
30; 1057,65
45; 1140,88
600
700
800
900
1000
1100
1200
0 15 30 45
Balli
stic
ene
rgy
abso
rptio
n (J
Oblique Angle
Al 2024-T4
0; 647,31
15; 728,74
30; 786,84
45; 864,92
600
650
700
750
800
850
900
0 15 30 45
Balli
stic
ene
rgy
abso
rptio
n (J
Oblique Angle
Al 6061-T6
Oblique Angle Material 0° 15° 30° 45° Al 2024-T4 348.86 343.36 337.89 332.51 Al 6061-T6 363.25 358.36 354.83 350.03 Al 7075-T6 339.49 334.79 329.7 322.34 *Vinitial=400 m/s
85

(c) Figure 7. Ballistic Energy absorption change with respect to Oblique angle (a) Al 2024-T4, (b)
Al 6061-T6 (c) Al 7075-T6.
Figure 8. Ballistic Energy absorption change with respect to Oblique angle (a) Al 2024-T4, (b) Al 6061-T6 (c) Al 7075-T6.
4. Conclusions:In this study, the effects of oblique angle on the ballistic impact resistance of aluminum alloyshave been investigated. It is seen that the oblique angle directly affects the ballistic impactperformance of plates. Considering these aluminum alloys, targets exhibited approximatelysimilar responses for all of the oblique angles.
The ballistic impact resistance or absorbed energy increased with the oblique angle increase. As being ballistic impact with normal angle (0°), the Al 7075 T6 has high ballistic impact strength than 6061 and 2024. For example ballistic energy absorption for 0° and 45°, there is nearly 5 % difference for Al 7075 T6. The absorbed energy of Al 7075 T6 nearly 10% higher than Al6061 T6 for 0° oblique angle.
0; 1040,3115; 1105,77
30; 1183,83
45; 1294,58
600
700
800
900
1000
1100
1200
1300
1400
0 15 30 45
Balli
stic
ene
rgy
abso
rptio
n (J
Oblique Angle
Al 7075-T6
600
700
800
900
1000
1100
1200
1300
1400
1 2 3
Balli
stic
ene
rgy
abso
rptio
n (J)
Material ( 1:Al 7075-T6, 2:Al6061-T6, 3:Al2024-T4)
0° 15° 30° 45°
86
References 1. Kpenyigba, K. M., Jankowiak, T., Rusinek, A., and Pesci, R. Influence of projectile shape
on dynamic behavior of steel sheet subjected to impact and perforation. Thin-WalledStructures, 2013, 6:93-104.
2. Yeter E. Damage resistance investigation of Armox 500T and Aluminum 7075-T6 platessubjected to drop-weight and ballistic impact loads. Sakarya University Journal of Science,2019, 23(6):1080-1095.
3. Yeter E . Investigation of Ballistic Impact Response of Aluminum Alloys Hybridized withKevlar/Epoxy Composites. Politeknik Dergisi. 2019, 22(1):219-227.
4. Subaşı M , Doğru M , Yeter E , Yılmaz N . Investigation Of The Bullet Impact EnergyPerformance According To Variable Tip Geometry. The International Journal of Materialsand Engineering Technology. 2020, 3(1):10-15.
5. Gupta, P. K., Iqbal, M. A., Mohammad, Z., Baqi, A., and Gupta, N. K. Energy absorption inthin metallic targets subjected to oblique projectile impact: A numerical study. Thin-WalledStructures, 2018, 126:58-67.
6. Senthil, K., and Iqbal, M. A. Effect of projectile diameter on ballistic resistance and failuremechanism of single and layered aluminum plates. Theoretical and Applied FractureMechanics, 2013, 67:53-64.
7. Zhou, D. W., and Stronge, W. J. Ballistic limit for oblique impact of thin sandwich panelsand spaced plates. International journal of impact engineering, 2008, 35(11): 1339-1354.
8. Mohammad, Z., Gupta, P. K., and Baqi, A. Experimental and numerical investigations onthe behavior of thin metallic plate targets subjected to ballistic impact. International Journalof Impact Engineering, 2020, 146:103717.
9. Holmen J. K., Johnsen J., Hopperstad O. S., and Børvik T. Influence of fragmentation on thecapacity of aluminum alloy plates subjected to ballistic impact. European Journal ofMechanics-A/Solids, 2016, 55:221-233.
10. Fawaz, Z., Zheng, W., and Behdinan, K. Numerical simulation of normal and obliqueballistic impact on ceramic composite armours. Composite Structures, 2004, 63(3-4): 387-395.
11. Kristnama, A. R., Xu, X., Nowell, D., Wisnom, M. R., & Hallett, S. R. Experimentalinvestigation of high velocity oblique impact and residual tensile strength of carbon/epoxylaminates. Composites Science and Technology, 2019, 182:107772.
87

MODELLING AND SIMULATION OF ELASTIC PENDULUM
EDIP OZTURK1, BURAK SAHIN2, KURSAD GOV1
1 Ress. Assist. Gaziantep University, Aeronautics and Aerospace Faculty, Aircraft and Aerospace Engineering Department, Gaziantep, TURKEY
2 Ress. Assist. Dr. Gaziantep University, Engineering Faculty, Mechanical Engineering Department, Gaziantep, TURKEY
Abstract
Elastic pendulum consists of a spring and a point mass which is attached to end of the spring.Main difference between flexible pendulum and simple pendulum is, flexible pendulum hasspring instead of rigid rod. The spring adds one more degree of freedom to system. Flexible pendulum is also called spring pendulum or swinging spring. Equation of motion which is describes dynamics of the system is derived by Lagrange method. Equation of motion of the system is a group of coupled nonlinear differential equation. This group includes two equations. These equations are solved by using Runge-Kutta numerical integration method in MATLAB.System is also modeled in MSC ADAMS which is dynamic analysis software, and simulated. At the end of the study MATLAB results and ADAMS results are compared.
Keyword: Elastic Pendulum, Dynamic Analysis, Dynamic System Modelling, Dynamic SystemSimulation
1. IntroductionElastic pendulum system is studied from many different point of view in literature. Springpendulum or elastic pendulum system performs oscillatory motion. Due to nature of oscillatorymotion, system components have motion frequencies. In spring pendulum case, spring andswinging mass at the end of the spring have oscillation frequencies. A phenomena which isknown as pulsation is a special case when it occurs if the ratio of spring frequency and swingingmass frequency is equal to 2. This special case is studied by Lynch and Houghton[1]. Parametricresonance concept is investigated by Duka and Duka[2]. They solve system equationsnumerically and also they present simple experimental setup for spring pendulum system. At theend of their study, they compare experimental results and numerical results. Cross investigatestwo different spring pendulum as experimentally. He considers horizontal and verticaloscillations[3]. Damping is not presented in many applications of the flexible pendulum. Digilovet al. consider damping in their study[4]. They also take into account mass lost rate in theirmodel and they validate their mathematical model with experimental data. Anicin et al. considermass spring system as a harmonic oscillator and they investigate stability of the system[5]. Inthis study, flexible pendulum equation of motions are derived by Lagrange method. Equations ofmotion of the system are two coupled nonlinear, partial differential equations. These equationsare solved by numerical integration method on MATLAB software. Then, system is modeled inMSC ADAMS which is engineering dynamic analysis software, and MATLAB and ADAMSresults are compared.
88
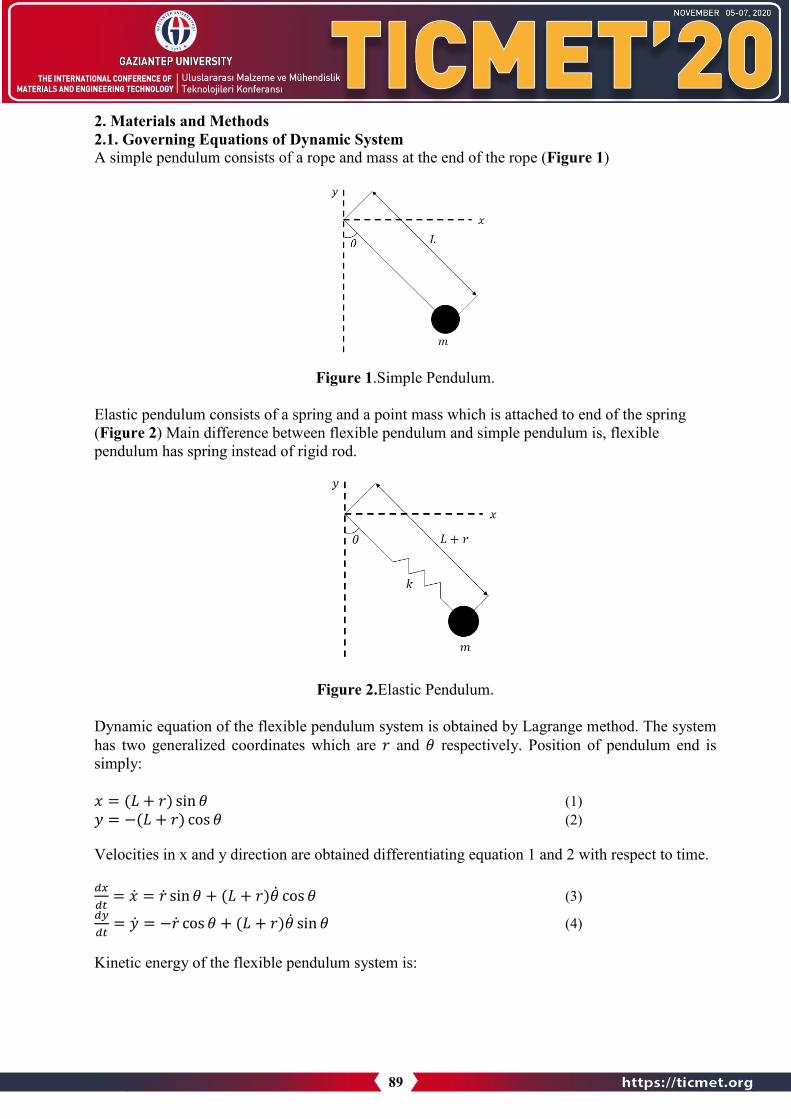
2. Materials and Methods 2.1. Governing Equations of Dynamic System A simple pendulum consists of a rope and mass at the end of the rope (Figure 1)
Figure 1.Simple Pendulum.
Elastic pendulum consists of a spring and a point mass which is attached to end of the spring (Figure 2) Main difference between flexible pendulum and simple pendulum is, flexible pendulum has spring instead of rigid rod.
Figure 2.Elastic Pendulum.
Dynamic equation of the flexible pendulum system is obtained by Lagrange method. The system has two generalized coordinates which are 𝑟𝑟 and 𝜃𝜃 respectively. Position of pendulum end is simply:
𝑥𝑥 = (𝐿𝐿 + 𝑟𝑟) sin 𝜃𝜃 (1) 𝑦𝑦 = −(𝐿𝐿 + 𝑟𝑟) cos 𝜃𝜃 (2)
Velocities in x and y direction are obtained differentiating equation 1 and 2 with respect to time.
𝑑𝑑𝑑𝑑𝑑𝑑𝑑𝑑
= �̇�𝑥 = �̇�𝑟 sin𝜃𝜃 + (𝐿𝐿 + 𝑟𝑟)�̇�𝜃 cos 𝜃𝜃 (3) 𝑑𝑑𝑑𝑑𝑑𝑑𝑑𝑑
= �̇�𝑦 = −�̇�𝑟 cos 𝜃𝜃 + (𝐿𝐿 + 𝑟𝑟)�̇�𝜃 sin 𝜃𝜃 (4)
Kinetic energy of the flexible pendulum system is:
89

𝑇𝑇 = 12𝑚𝑚𝑉𝑉2 (5)
𝑉𝑉2 = �̇�𝑥2 + �̇�𝑦2 (6) �̇�𝑥2 = �̇�𝑟2𝑠𝑠𝑠𝑠𝑠𝑠2𝜃𝜃 + (𝐿𝐿 + 𝑟𝑟)2�̇�𝜃2𝑐𝑐𝑐𝑐𝑠𝑠2𝜃𝜃 + 2�̇�𝑟�̇�𝜃(𝐿𝐿 + 𝑟𝑟) sin𝜃𝜃 cos𝜃𝜃 (7) �̇�𝑦2 = �̇�𝑟2𝑐𝑐𝑐𝑐𝑠𝑠2𝜃𝜃 + (𝐿𝐿 + 𝑟𝑟)2�̇�𝜃2𝑠𝑠𝑠𝑠𝑠𝑠2𝜃𝜃 − 2�̇�𝑟�̇�𝜃(𝐿𝐿 + 𝑟𝑟) sin𝜃𝜃 cos𝜃𝜃 (8) 𝑇𝑇 = 1
2𝑚𝑚𝑉𝑉2 = 1
2𝑚𝑚(�̇�𝑟2 + (𝐿𝐿 + 𝑟𝑟)2�̇�𝜃2) (9)
Potential energy of the system depends on spring elastic potential energy and mass potentialenergy due to gravity.
𝑃𝑃 = −𝑚𝑚𝑚𝑚𝑦𝑦 + 12𝑘𝑘𝑟𝑟2 = −𝑚𝑚𝑚𝑚(𝐿𝐿 + 𝑟𝑟) cos 𝜃𝜃 + 1
2𝑘𝑘𝑟𝑟2 (10)
Lagrange function is stated as difference between system total kinetic energy and total potential energy.
𝐿𝐿 = 𝑇𝑇 − 𝑃𝑃 = 12𝑚𝑚��̇�𝑟2 + (𝐿𝐿 + 𝑟𝑟)2�̇�𝜃2� + 𝑚𝑚𝑚𝑚(𝐿𝐿 + 𝑟𝑟) cos 𝜃𝜃 − 1
2𝑘𝑘𝑟𝑟2 (11)
Since system has two degree of freedom, two generalized coordinates are declared below in equation 12 and 13.
𝑞𝑞1 = 𝑟𝑟 (12) 𝑞𝑞2 = 𝜃𝜃 (13)
General form of the equation of Motion of the system is given in equation 14.
𝑑𝑑𝑑𝑑𝑑𝑑� 𝜕𝜕𝜕𝜕𝜕𝜕�̇�𝑞1� − 𝜕𝜕𝜕𝜕
𝜕𝜕𝑞𝑞1= 0 (14)
When calculations are proceeded from equation 14 to 19, final form of the equation of motion is achieved for one generalized coordinates.
𝜕𝜕𝜕𝜕𝜕𝜕�̇�𝑞1
= 𝑚𝑚�̇�𝑟 (15) 𝑑𝑑𝑑𝑑𝑑𝑑� 𝜕𝜕𝜕𝜕𝜕𝜕�̇�𝑞1
� = 𝑚𝑚�̈�𝑟 (16) 𝜕𝜕𝜕𝜕𝜕𝜕𝑞𝑞1
= 𝑚𝑚(𝐿𝐿 + 𝑟𝑟)�̇�𝜃2 + 𝑚𝑚𝑚𝑚 cos 𝜃𝜃 − 𝑘𝑘𝑟𝑟 (17)
𝑚𝑚�̈�𝑟 −𝑚𝑚(𝐿𝐿 + 𝑟𝑟)�̇�𝜃2 − 𝑚𝑚𝑚𝑚 cos 𝜃𝜃 + 𝑘𝑘𝑟𝑟 = 0 (18) �̈�𝑟 = (𝐿𝐿 + 𝑟𝑟)�̇�𝜃2 + 𝑚𝑚𝑐𝑐𝑐𝑐𝑠𝑠𝜃𝜃 − 𝑘𝑘
𝑚𝑚𝑟𝑟 (19)
If same procedure is applied for other generalized coordinate 𝜃𝜃, other equation of motion is obtained as follows.
𝑑𝑑𝑑𝑑𝑑𝑑� 𝜕𝜕𝜕𝜕𝜕𝜕�̇�𝑞2
� − 𝜕𝜕𝜕𝜕𝜕𝜕𝑞𝑞2
= 0 (20) 𝜕𝜕𝜕𝜕𝜕𝜕�̇�𝑞2
= 𝑚𝑚(𝐿𝐿 + 𝑟𝑟)2�̇�𝜃 (21)
90
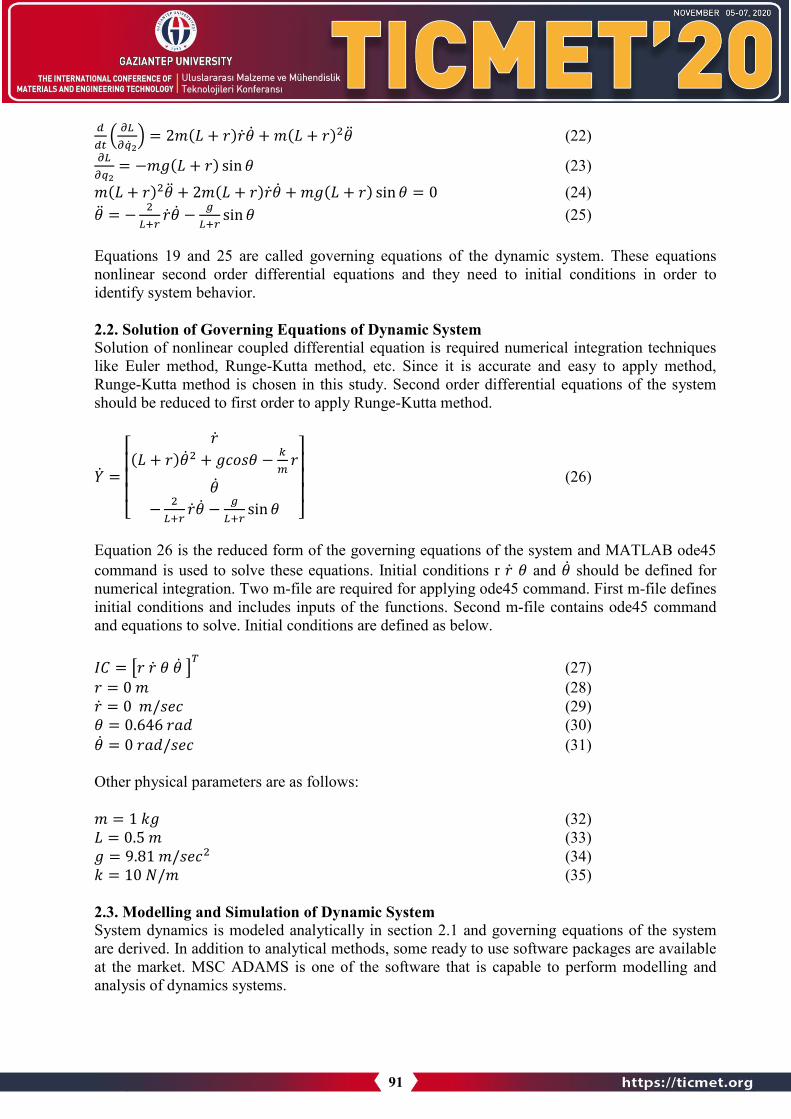
𝑑𝑑𝑑𝑑𝑑𝑑� 𝜕𝜕𝜕𝜕𝜕𝜕�̇�𝑞2
� = 2𝑚𝑚(𝐿𝐿 + 𝑟𝑟)�̇�𝑟�̇�𝜃 + 𝑚𝑚(𝐿𝐿 + 𝑟𝑟)2�̈�𝜃 (22) 𝜕𝜕𝜕𝜕𝜕𝜕𝑞𝑞2
= −𝑚𝑚𝑚𝑚(𝐿𝐿 + 𝑟𝑟) sin𝜃𝜃 (23)
𝑚𝑚(𝐿𝐿 + 𝑟𝑟)2�̈�𝜃 + 2𝑚𝑚(𝐿𝐿 + 𝑟𝑟)�̇�𝑟�̇�𝜃 + 𝑚𝑚𝑚𝑚(𝐿𝐿 + 𝑟𝑟) sin𝜃𝜃 = 0 (24) �̈�𝜃 = − 2
𝜕𝜕+𝑟𝑟�̇�𝑟�̇�𝜃 − 𝑔𝑔
𝜕𝜕+𝑟𝑟sin𝜃𝜃 (25)
Equations 19 and 25 are called governing equations of the dynamic system. These equations nonlinear second order differential equations and they need to initial conditions in order to identify system behavior.
2.2. Solution of Governing Equations of Dynamic System Solution of nonlinear coupled differential equation is required numerical integration techniques like Euler method, Runge-Kutta method, etc. Since it is accurate and easy to apply method, Runge-Kutta method is chosen in this study. Second order differential equations of the systemshould be reduced to first order to apply Runge-Kutta method.
�̇�𝑌 =
⎣⎢⎢⎢⎡
�̇�𝑟(𝐿𝐿 + 𝑟𝑟)�̇�𝜃2 + 𝑚𝑚𝑐𝑐𝑐𝑐𝑠𝑠𝜃𝜃 − 𝑘𝑘
𝑚𝑚𝑟𝑟
�̇�𝜃− 2
𝜕𝜕+𝑟𝑟�̇�𝑟�̇�𝜃 − 𝑔𝑔
𝜕𝜕+𝑟𝑟sin𝜃𝜃 ⎦
⎥⎥⎥⎤
(26)
Equation 26 is the reduced form of the governing equations of the system and MATLAB ode45 command is used to solve these equations. Initial conditions r �̇�𝑟 𝜃𝜃 and �̇�𝜃 should be defined for numerical integration. Two m-file are required for applying ode45 command. First m-file defines initial conditions and includes inputs of the functions. Second m-file contains ode45 command and equations to solve. Initial conditions are defined as below.
𝐼𝐼𝐼𝐼 = �𝑟𝑟 �̇�𝑟 𝜃𝜃 �̇�𝜃 �𝑇𝑇 (27)
𝑟𝑟 = 0 𝑚𝑚 (28) �̇�𝑟 = 0 𝑚𝑚/𝑠𝑠𝑠𝑠𝑐𝑐 (29) 𝜃𝜃 = 0.646 𝑟𝑟𝑟𝑟𝑟𝑟 (30) �̇�𝜃 = 0 𝑟𝑟𝑟𝑟𝑟𝑟/𝑠𝑠𝑠𝑠𝑐𝑐 (31)
Other physical parameters are as follows:
𝑚𝑚 = 1 𝑘𝑘𝑚𝑚 (32) 𝐿𝐿 = 0.5 𝑚𝑚 (33) 𝑚𝑚 = 9.81 𝑚𝑚/𝑠𝑠𝑠𝑠𝑐𝑐2 (34) 𝑘𝑘 = 10 𝑁𝑁/𝑚𝑚 (35)
2.3. Modelling and Simulation of Dynamic System System dynamics is modeled analytically in section 2.1 and governing equations of the system are derived. In addition to analytical methods, some ready to use software packages are available at the market. MSC ADAMS is one of the software that is capable to perform modelling and analysis of dynamics systems.
91

Figure 3. MSC ADAMS Model of Flexible Spring System
The system consists of a spring and a mass at the end of the spring (Figure 3). A fixed joint is assigned between mass and spring and a revolute joint is assigned between spring and ground to allow rotation.
Figure 4. Mass Properties Window.
Figure 5. Spring Properties Window
Mass is defined as 1 kg in mass property window and all inertias are assumed as zero (Figure 4). Spring constant is defined as 0.01 N/mm which is equal to 10 N/m and damping coefficient is entered as zero in order to simulate ideal spring (Figure 5).
92

Figure 6. Simulation Settings.
Simulation end time is chosen as 20 seconds and 20 seconds is divided to 100 steps (Figure 6).
3. Results and DiscussionEquation motions are equations which represent dynamic behavior of a system. Equations of motion of the system are derived in section 2.1. Runge-Kutta method is used to solve equations of motion after assigning initial conditions for dynamic system.
Figure 7. Spring Deflection during Simulation in MATLAB.
Maximum spring deflection is observed as 2.05 m and minimum spring deflection is observed as -0.08 m during 20 seconds in MATLAB (Figure 7).
93

Figure 8. Spring Deflection Velocity during Simulation in MATLAB.
Maximum spring deflection velocity is observed as 3.38 m/sec and minimum spring deflection velocity is observed as -3.38 m/sec during 20 seconds in MATLAB (Figure 8).
Figure 9. Pendulum Angular Position during Simulation in MATLAB. Maximum pendulum angular position is observed as 37 degrees and minimum pendulum angular position is observed as -37 degrees during 20 seconds in MATLAB (Figure 9).
Figure 10. Pendulum Angular Velocity during Simulation in MATLAB.
Maximum pendulum angular velocity is observed as 83 deg/sec and minimum pendulum angular velocity is observed as -83 deg/sec during 20 seconds in MATLAB (Figure 10).
94

Figure 11. Spring Deflection during Simulation in ADAMS.
Maximum spring deflection is observed as 2.05 m and minimum spring deflection is observed as -0.08 m during 20 seconds in ADAMS (Figure 11).
Figure 12. Spring Deflection Velocity during Simulation in ADAMS.
Maximum spring deflection velocity is observed as 3.38 m/sec and minimum spring deflection velocity is observed as -3.38 m/sec during 20 seconds in ADAMS (Figure 12).
Figure 13. Pendulum Angular Position during Simulation in ADAMS.
Maximum pendulum angular position is observed as 37 degrees and minimum pendulum angular position is observed as -37 degrees during 20 seconds in ADAMS (Figure 13).
Figure 14. Pendulum Angular Velocity during Simulation in MATLAB.
95

Maximum pendulum angular velocity is observed as 83 deg/sec and minimum pendulum angularvelocity is observed as -83 deg/sec during 20 seconds in ADAMS (Figure 14).
4. Conclusions In this study, flexible spring mass system is modeled by using analytical dynamics and governing equations are derived based on Lagrange dynamics besides system is modeled and simulated in engineering software. Differential equations of system of motions are solved numerically in MATLAB and results are presented in section 3. On the other hand, dynamic system is modeled and simulated in ADAMS. Method of modelling and simulation is presentedin section 2.3. and simulation results are presented in section 3. Despite solution methods are different, results are exactly coincided with each other. Some parameters like spring mass, spring damping coefficient and mass moment of inertia are neglected for easiness of the analysis. These parameters can be taken into account for further studies.
References
1. Lynch, P. and C. Houghton, Pulsation and precession of the resonant swinging spring.Physica D: Nonlinear Phenomena, 2004. 190(1-2): p. 38-62.
2. Duka, B. and R. Duka, On the elastic pendulum, parametric resonance and‘pumping’swings. European Journal of Physics, 2019. 40(2): p. 025005.
3. Cross, R., Experimental investigation of an elastic pendulum. European Journal of Physics,2017. 38(6): p. 065004.
4. Digilov, R.M., M. Reiner, and Z. Weizman, Damping in a variable mass on a springpendulum. American journal of physics, 2005. 73(10): p. 901-905.
5. Anicin, B., D. Davidovic, and V. Babovic, On the linear theory of the elastic pendulum.European journal of physics, 1993. 14(3): p. 132.
List of Symbols 𝑟𝑟: Spring deformation. �̇�𝑟: Spring deformation velocity. �̈�𝑟: Spring deformation acceleration. 𝜃𝜃: Pendulum angular position. �̇�𝜃: Pendulum angular velocity. �̈�𝜃: Pendulum angular acceleration. 𝑥𝑥: Position of the mass in coordinate x. �̇�𝑥: Velocity of the mass in coordinate x: 𝑦𝑦: Position of the mass in coordinate y. �̇�𝑦: Velocity of the mass in coordinate y: 𝑉𝑉: Velocity of the mass. 𝑚𝑚: Mass. 𝐿𝐿: Unstretched spring length. 𝑇𝑇: Kinetic energy of the system. 𝑃𝑃: Potential energy of the system. 𝑞𝑞1: First generalized coordinate. 𝑞𝑞2: Second generalized coordinate. 𝐿𝐿: Lagrange function of the system.
96

INVESTIGATION OF THE EFFECT OF PARAMETERS ON KERF ANGLE AND SURFACE QUALITY OF PLASMA ARC CUTTING
NECİP FAZIL YILMAZ *1, AHMET YAREN YAROĞLU 1, MAHMUT FURKAN KALKAN1, HALİL İBRAHİM KURT2
1Gaziantep University, Engineering Faculty, Mechanical Engineering Department, Gaziantep, TURKEY. 2Gaziantep University, Engineering Faculty, Metallurgical and Materials Engineering
Abstract
Plasma cutting is very important in terms of time and practicality, especially in companies that manufacture steel construction. Although plasma cutting processes are practical and facilitatingprocess. Kerf angle and poor surface quality are the main problems of this process. Kerf angle and poor surface quality cause extra labor and production costs. In this study, experiments werecarried out on 6-8-10-12 and 14 mm this S235JR steel plates which are the most common gradesteel in the market. The aim of this study is to determine the factors affecting surface quality and kerf angle by using certain parameters (ampere and arc voltage). According to the findingsobtained afterwards, it is planned to obtain an optimum range for each thickness value. It is predicted that the cuts performed within this optimum range will be more favorable in terms of kerf angle and surface quality.
Key Word: Plasma Cutting, Kerf Angle, Surface Quality, S235JR Steel
1. IntroductionGaseous material, which is an insulator under normal conditions, becomes conductive when itreceives the necessary amount of energy under the right conditions and the plasma is released.This released plasma is used in the industry widely for plasma cutting and welding for metallicmaterials[1,2].
Plasma arc cutting is a common and non-conventional process for electrically conductive materials. Plasma cutting systems were found by Union Carbide company during experimentations for increasing the efficiency of Tungsten Inert Gas welding method in 1950s [3]. With the widespread use of computer numerical control, plasma cutting technique has been rapidly accepted and used widely[4]. Plasma arc forms in the cutting torch. The energy from the arc ionizes some of the shear gas that is cross-transferred between the negative electrode and the workpiece and turns it into the plasma of the material[5]. During the plasma cutting process high temperature is generated. Therefore, metal body that is affected by the temperature is cut by melting quickly. The main reason why this process is widely used is its higher cutting speed and its affordability compared to other methods[6,7].
The width of the material removed during the cutting process is called a kerf. With the kerf emerging at an angle, there is a difference in the size of the material at the points where the plasma cuts[8]. As the thickness increases in the cuts made using the plasma arc cutting process,
97

the deterioration in surface quality increases and the kerf angle tends to increase[9]. As a result of this, the second process may be needed after the plasma cutting process. The parameters that affect this situation can be explained as the distance between the workpiece and the insert, the cutting quality, life and performance of the plasma cutting machine components[10].
In this study, samples of different thicknesses were cut by changing the ampere and voltagevalues. By looking at the hole diameters and the surface qualities of 6,8,10,12,14 mm thick specimens with holes in the middle, it is aimed to determine an optimum range where the minimum kerf angle and maximum surface quality are obtained for each thickness.
2. Materials and Methods In this study, 5 different thicknesses of 6-8-10-12-14 mm and S235JR (St37) quality hot rolledsteel sheet material was selected because S235JR is the most commonly used structural steel on industrial applications and because S235JR carbon steels are known for their easy machinability depending on their chemical components and mechanical properties. Chemical properties of the S235JR carbon steel is shown in Table 1.
Table 1. Chemical Properties of S235JR Steel C Mn P S Si N
0,17 1,4 0,04 0,04 - 0,012
All experiment samples drew with Autocad and transferred to CAM program of the CNC machine named AjanCam. Sheet materials of selected thickness and quality were cut there. AJAN HP 260A plasma arc cutting machine was used for cutting process. AJAN HP 260A PAC machine has shown in Figure 1. The dimensions of the machine were 12000x3000mm in X and Y directions.
Figure 1. AJAN 12000X6000mm 260A PAC Machine
98

The cutting process is completed in order to observe the results by changing the ampere and voltage values. Specimens were cleaned by alcohol before the plasma cutting process to prevent any moisture due to harmful interference to material during cutting process. Firstly, torch with80 ampere attached to the machine and all thickness values and all voltage values at 80 ampere were cut off. And then, same processes repeated for 130A and 260 A. Totally, 45 samples were cutted. The table of the parameter values of the cuts is shown at Table 2.
Table 2. Cutting parameters i.e. voltage and ampere, for each thicknesses 6MM 8MM 10MM 12MM 14MM
Ampere(A) 80 130 260 80 130 260 80 130 260 80 130 260 80 130 260 Voltage(V) 121 113 148 121 114 149 126 116 150 128 116 150 130 119 153
123 115 150 123 116 151 128 118 152 130 118 152 132 121 155 125 117 152 125 118 153 130 120 154 132 120 154 134 123 157
The cut samples have been scanned with CANON Imagerunner 2530i scanner to measure the input and the output diameters of cut holes. The scanning views have been converted to JPG format with 1:1 scale to be opened with Autocad. Measurements have made by using Autocad as can be seen in Figure 2 and diameters were measured.
Figure 2. Scanning views and measurements
99

Table 2. Experimental Results of Kerf Formation
Exp. t (mm)
Current (A)
Voltage (V)
İnput Dia. (mm)
Output Dia. (mm)
Kerf Angle (degree)
1 6 80 121 5.00 4.76 1.15 2 6 80 123 4.89 4.83 0.29 3 6 80 125 4.99 4.79 0.95 4 6 130 113 5.29 5.07 1.07 5 6 130 115 6.54 5.44 5.26 6 6 130 117 5.83 5.23 2.89 7 6 260 148 8.32 6.92 6.65 8 6 260 150 9.20 6.54 12.48 9 6 260 152 8.37 5.83 11.95 10 8 80 121 5.39 5.06 1.18 11 8 80 123 4.86 4.66 0.72 12 8 80 125 4.93 4.74 0.66 13 8 130 114 5.46 5.31 0.56 14 8 130 116 5.75 5.49 0.93 15 8 130 118 5.64 5.49 0.54 16 8 260 149 8.32 8.17 0.54 17 8 260 151 8.39 7.99 1.41 18 8 260 153 8.92 7.06 6.63 19 10 80 126 5.61 4.71 2.58 20 10 80 128 6.92 4.19 7.77 21 10 80 130 4.95 4.92 0.09 22 10 130 116 5.88 5.13 2.13 23 10 130 118 5.77 5.15 1.78 24 10 130 120 5.92 5.21 2.03 25 10 260 150 8.40 7.67 2.10 26 10 260 152 9.43 7.57 5.30 27 10 260 154 8.47 7.65 2.33 28 12 80 128 6.32 5.14 2.81 29 12 80 130 6.84 4.79 4.88 30 12 80 132 6.65 5.02 3.89 31 12 130 116 6.57 5.42 2.74 32 12 130 118 6.66 5.39 3.02 33 12 130 120 6.63 5.68 2.28 34 12 260 150 9.05 8.18 2.08 35 12 260 152 9.29 8.05 2.96 36 12 260 154 9.49 8.18 3.14 37 14 80 130 7.61 4.75 5.82 38 14 80 132 7.11 4.68 4.96 39 14 80 134 7.95 4.39 7.24 40 14 130 119 7.83 5.31 5.14 41 14 130 121 7.84 5.40 4.98 42 14 130 123 7.66 5.39 4.63 43 14 260 153 11.00 7.84 6.44 44 14 260 155 10.66 8.16 5.11 45 14 260 157 10.69 8.22 5.03
100

3. Results and DiscussionThe kerf values of the samples cut from 6, 8, 10, 12 and 14 mm thick S235JR material were examined with different parameters. A result table was created with the datas obtained. Input and output diameters and kerf angles relationships with different parameters are shown in Table 2. Inlet and outlet diameters of the holes on S235JR were investigated to observed effect of cut-off ampere and arc voltage. This parameter directly affects the kerf angle during plasma cuttingprocess. These all parameters were given with plate thicknesses to indicate the effect of these parameters on kerf angle. That was seen that the change of the arc voltage and cutting ampere of plasma cutting system shown different effects on different thickness. On the other hand, plasmacutting ampere has more significance than voltage for different thicknesses. It was observed that the volume of material melted during cutting increased with the increasing of plasma cutting ampere. It has been observed that the kerf angle increases as the ampere increases in low thickness materials. Specifically, using 260 amperes for specimens with 6 mm and 8 mm wall thickness, the kerf angle increases significantly. This varied depending on the voltage-ampere balance compared to kerf angles on higher thicknesses. Another issue that should be emphasized is that the higher the wall thickness, the more difficult the control of thee kerf angle. Most of the experiments in plasma cutting of hot rolled S235JR steels with a wall thickness of almost 6 mm and 8 mm was well seen in terms of kerf angle. Considering these kerf angles, it is seen that there is no need for a serious optimization process in these thicknesses. As long as the ampere level is increased at these thicknesses, the drilling process can be done by plasma cutting method without the need for a second process. In S235JR steels with a wall thickness of 14 mm, there was a significant increase in kerf rates. Cutting parameters should be adjusted well, especially in high thicknesses. Because, in steels with low thicknesses, the material melted from the surface cut during plasma cutting is removed more homogeneously and regularly by the effect of the protective gas used during the cutting of the material [11].
Figure 3. Scanning electron images of experimental no: 2
101
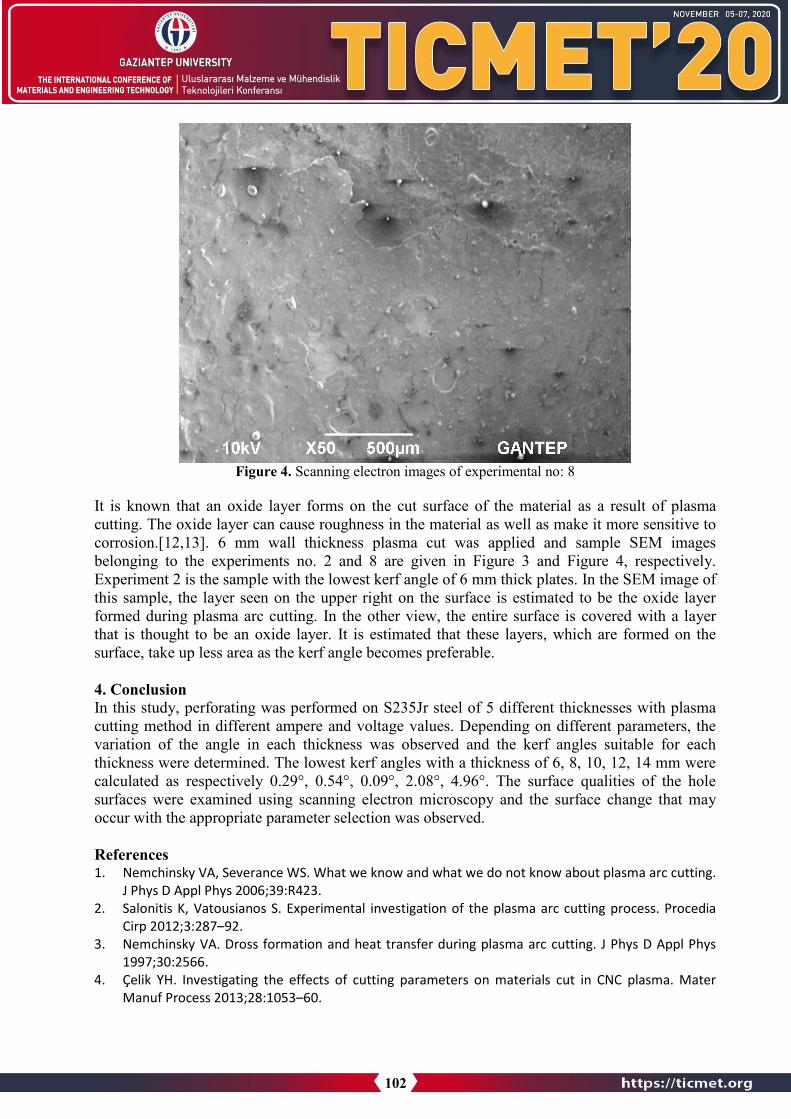
Figure 4. Scanning electron images of experimental no: 8
It is known that an oxide layer forms on the cut surface of the material as a result of plasma cutting. The oxide layer can cause roughness in the material as well as make it more sensitive to corrosion.[12,13]. 6 mm wall thickness plasma cut was applied and sample SEM imagesbelonging to the experiments no. 2 and 8 are given in Figure 3 and Figure 4, respectively.Experiment 2 is the sample with the lowest kerf angle of 6 mm thick plates. In the SEM image of this sample, the layer seen on the upper right on the surface is estimated to be the oxide layer formed during plasma arc cutting. In the other view, the entire surface is covered with a layer that is thought to be an oxide layer. It is estimated that these layers, which are formed on the surface, take up less area as the kerf angle becomes preferable.
4. ConclusionIn this study, perforating was performed on S235Jr steel of 5 different thicknesses with plasmacutting method in different ampere and voltage values. Depending on different parameters, thevariation of the angle in each thickness was observed and the kerf angles suitable for eachthickness were determined. The lowest kerf angles with a thickness of 6, 8, 10, 12, 14 mm werecalculated as respectively 0.29°, 0.54°, 0.09°, 2.08°, 4.96°. The surface qualities of the holesurfaces were examined using scanning electron microscopy and the surface change that mayoccur with the appropriate parameter selection was observed.
References 1. Nemchinsky VA, Severance WS. What we know and what we do not know about plasma arc cutting.
J Phys D Appl Phys 2006;39:R423.2. Salonitis K, Vatousianos S. Experimental investigation of the plasma arc cutting process. Procedia
Cirp 2012;3:287–92.3. Nemchinsky VA. Dross formation and heat transfer during plasma arc cutting. J Phys D Appl Phys
1997;30:2566.4. Çelik YH. Investigating the effects of cutting parameters on materials cut in CNC plasma. Mater
Manuf Process 2013;28:1053–60.
102

5. Ramakrishnan H, Balasundaram R, Ganesh N, Karthikeyan N. Experimental investigation of cutquality characteristics on SS321 using plasma arc cutting. J Brazilian Soc Mech Sci Eng 2018;40:60.
6. Hatala M, Zajac J, Čep R, Orlovský I. Research of the technological parameters importance forplasma arc thermal cutting. Appl. Mech. Mater., vol. 110, Trans Tech Publ; 2012, p. 3742–9.
7. Mousa M, LOLADZE T, SABASHVILI Z, KENCHIASHVILI N. Advantages of Plasma Cutting inSuperheated Water Vapor at Metallurgical Enterprises. J Tech Sci Technol 2014;3:5–8.
8. Dodun O, Bangu SI, Slătineanu L, Vasile M, Beşliu I, Coteaţă M. Kerf generation during the plasmacutting process. AIP Conf. Proc., vol. 1769, AIP Publishing LLC; 2016, p. 50008.
9. Agarwal PH, Patel KR. Optimizing plasma arc cutting parameters for structural steel using greyrelational analysis. Int J Eng Res Technol 2019;8:27–30.
10. Freton P, Gonzalez JJ, Gleizes A, Peyret FC, Caillibotte G, Delzenne M. Numerical and experimentalstudy of a plasma cutting torch. J Phys D Appl Phys 2001;35:115.
11. Chamarthi S, Reddy NS, Elipey MK, Reddy DVR. Investigation Analysis of Plasma arc cuttingParameters on the Unevenness surface of Hardox-400 material. Procedia Eng 2013;64:854–61.
12. Boselli M, Ceschini L, Colombo V, Ghedini E, Gherardi M, Rotundo F, et al. Experimentalinvestigation on the effects of the gas mixtures in plasma arc cutting of austenitic stainless steels.Proc ISPC 2009;19.
13. Rotundo F, Martini C, Chiavari C, Ceschini L, Concetti A, Ghedini E, et al. Plasma arc cutting:Microstructural modifications of hafnium cathodes during first cycles. Mater Chem Phys2012;134:858–66.
103

GEZER KÖPRÜLÜ VİNÇ KONSTRÜKSİYONUNUN ARI ALGORİTMASIKULLANILARAK OPTİMUM TASARIMI
SAMİ YEŞİLBEL1, MAHMUT ÇİMEN 2, METE KALYONCU3
1, 2 Sekizli Makina ve Vinç San. Tic. A. Ş., 42050 Konya / TURKEY 3 Konya Teknik Ü. Mühendislik ve Doğa Bil. Fak. Makina Mühendisliği Bölümü, 42250 Konya / TURKEY
Özet
Bu çalışmada, gezer köprülü bir vinç konstrüksiyonunun, istenen teknik ve fonksiyonelözellikleri yerine getirirken minimum ağırlığa sahip olabilmesi için, Arı Algoritması kullanılarakoptimum tasarımı gerçekleştirilmiştir. Köprülü vinçlerin kirişleri olan saç malzemeler kutu şekline getirilerek ve birbirlerine kaynak yapılarak imal edilmekte olup en büyük maliyet kalemleri kullanılan malzemenin miktarıdır. Bunun yanı sıra işletmeleri sırasında hareketlerini ve işletme maliyetlerini etkileyen en büyük etken de mekanik konstrüksiyonun ağırlığıdır. Bu sebeplerden dolayı aynı özelliklerdeki kaldırma işini yapacak olan köprülü vinç ağırlığının azolması, hem imalat maliyeti hem de işletme maliyetleri açısından çok önemlidir. Dolayısıyla vincin tasarımında amaç, sistemden minimum maliyetle maksimum performansın sağlamasıdır. Köprülü vincin konstrüksiyon tasarımında ağırlık, köprü aks açıklığı, çalışma sınıfı gibi değişken parametrelerin yanı sıra en aza indirgenmiş fire gibi kriterler de önemli olduğundan birçok parametreye göre en uygun seçimlerin yapılması zorunludur. Bu amaçla, Arı Algoritması kullanılarak yapılan örnek bir köprülü vinç konstrüksiyonu tasarımında, gerekli amaç fonksiyonuve kısıtlar tanımlanarak en uygun parametrelerin bulunması sağlanmıştır. Gerçekleştirilen buçalışma sayesinde ekonomik açıdan sağlanan kazançların yanı sıra; müşteri, işveren ve çalışanların tercih kısıtlarının karar ve tasarım sürecinde yer alabileceği, sistemde yer alan kaynakların kalitesinin yükseltilebileceği de etkin bir şekilde ortaya konmuştur.
Anahtar kelimeler: Optimizasyon, Arı Algoritması, mekanik konstrüksiyon tasarımı, gezer köprülü vinç, imalat maliyeti, yapısal analiz.
Abstract
OPTIMUM DESIGN OF GANTRY CRANE CONSTRUCTION USING THE BEES ALGORİTHM
The Bee Algorithm visualization optimum design has been implemented so that this overhead crane construction can have the minimum weight while fulfilling the technical and specifications. The sheet materials, which are the beams of bridge cranes, are produced by forming boxes and welding to each other, the largest item is the amount of material used. In addition, the major factor affecting the movements and operating costs during their operations is the mechanical construction. For these reasons, it is very important that the weight of the crane
104

that will do the lifting work with the same characteristics is low and the construction work is also outside the operation. Therefore, the purpose of the design of the crane is to provide maximum performance with minimum cost from the system. In the construction design of the bridge crane, it is necessary to make the most appropriate choices according to the important parameter, such as weight, bridge span, variable parameters of the working class, as well as minimized fire. In this type of displaying the Bee Algorithm, a sample bridge crane construction design, necessary and constraints were defined and the most appropriate parameters were provided. In addition to the earnings gained through this work carried out; It has been demonstrated in a way that preference buffers of customers, employers and employees can take place in the decision anddesign, and the quality of the resources in the system can be increased.
Keywords: Optimisation, The Bees Algorithm, mechanical construction design, gantry crane, manufacturing cost, structural analysis.
1. Giriş 1.1. Köprülü Vinçler Ağır yükleri kaldırma ve başka bir alana taşıma konusunda zaman zaman insan gücü doğalolarak yetersiz kalabiliyor. İşte bu gibi durumlarda tonlarca ağırlığın bir noktadan başka bir noktaya taşınmasında yardım alınabilecek en önemli araç, köprülü vinç gibi vinç çeşitleridir.Sıklıkla orta büyüklükteki atölyelerde kullanılan köprülü vinçlerin en önemli parçası kiriştir. İki duvar arasında yer alan güçlü ve sağlam kirişler vincin hareket kabiliyetini etkileyebilmektedir [1-12].
1.2. Köprülü Vinçlerin Konstrüksiyonu Ve Hesap EsaslarıKaldırma makineleri ve parçalarının konstrüksiyonunda, sistemin kullanım süresince istenen performansta görevini yerine getirmesi dikkate alınması gereken en önemli özelliktir. Bu amaç doğrultusunda ilk olarak dizaynı yapılacak olan kaldırma makinesinin ve parçalarının FEM ( Federation Europenne de la Manutention ) standardına [1] göre belirlenen çalışma grubu ve süresi belirlenmelidir. FEM standardına göre kaldırma makinelerinin sınıflandırılması 3 gruba göre yapılmıştır.-Kaldırma makinesi bütün olarak,-Özel ekipman ve mekanizmalar bütün olarak,-Yapısal ve mekanik parçalar.Bu sınıflandırma yapılırken 2 kriter esas alınmıştır. Bunlar;-Hesaba katılan parçaların toplam kullanım süresi,-Kanca yükü, yükleme veya herhangi bir parçadaki gerilim dağılımı
1.2.1. Yükleme Tiplerinin Sınıflandırılması Bir vincin konstrüksiyonunda DIN 15018 standardına göre yükleme belirlenmesidir. Bunlar; -Yüklemenin H ( ana yük ) hali-Yüklemenin HZ ( ana ve ek yükler ) hali-Yüklemenin HS ( ana ve özel yükler ) hali
1.2.2. Yükseltme katsayısının “ γc ” seçilmesi Kaldırma makinesinin çalışma tipine göre FEM ve DIN standartlarına uygun olarak çeşitli tablolar oluşturulmuştur. Yükseltme katsayısının kaldırma grubuna göre seçimi Tablo 1’de görülmektedir.
105
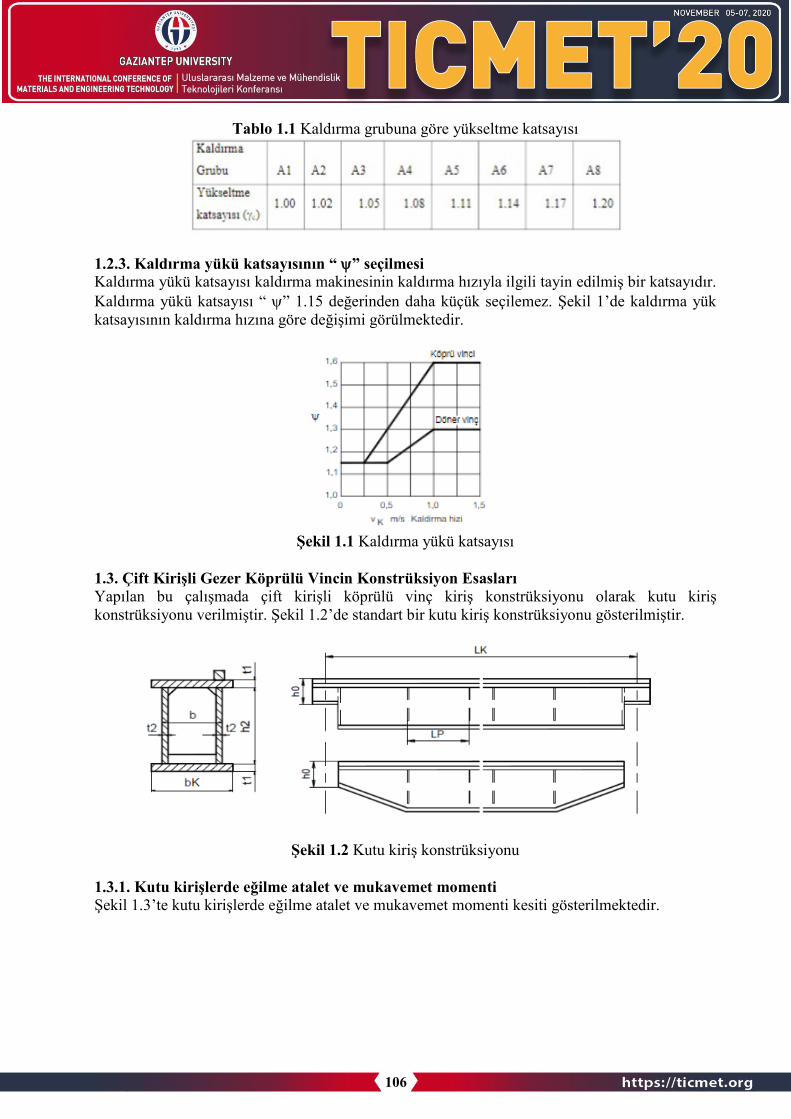
Tablo 1.1 Kaldırma grubuna göre yükseltme katsayısı
1.2.3. Kaldırma yükü katsayısının “ ψ” seçilmesi Kaldırma yükü katsayısı kaldırma makinesinin kaldırma hızıyla ilgili tayin edilmiş bir katsayıdır.Kaldırma yükü katsayısı “ ψ” 1.15 değerinden daha küçük seçilemez. Şekil 1’de kaldırma yükkatsayısının kaldırma hızına göre değişimi görülmektedir.
Şekil 1.1 Kaldırma yükü katsayısı
1.3. Çift Kirişli Gezer Köprülü Vincin Konstrüksiyon EsaslarıYapılan bu çalışmada çift kirişli köprülü vinç kiriş konstrüksiyonu olarak kutu kiriş konstrüksiyonu verilmiştir. Şekil 1.2’de standart bir kutu kiriş konstrüksiyonu gösterilmiştir.
Şekil 1.2 Kutu kiriş konstrüksiyonu
1.3.1. Kutu kirişlerde eğilme atalet ve mukavemet momenti Şekil 1.3’te kutu kirişlerde eğilme atalet ve mukavemet momenti kesiti gösterilmektedir.
106

Şekil 1.3 Kutu kirişlerde eğilme atalet ve mukavemet momenti kesiti
Kutu kirişlerde eğilme atalet momenti hesaplanırken ilk olarak tarafsız eksen veya kesit ağırlık merkezi bulunur.
Sistemin tarafsız ekseni bulunduktan sonra kiriş atalet momenti hesaplanır.
Ix atalet momenti;
( 1 ) Iy atalet momenti;
( 2 )
X-Eksenine göre mukavemet momenti " Wx "Hesaplarda maksimum gerilme kullanıldığından minimum mukavemet momentini hesaplamakgereklidir. Minimum mukavemet monmentide emax ve umax ile aşağıdaki şekilde hesaplanır.
( 3 )
1.3.2. Vinç Kirişinde Normal Gerilmeler ve Hesapları Vinç kirişinde meydana gelen normal gerilmeler H durumu dikkate alınarak hesaplanır. HS ve HZ hali için ek gerilmeler denklem ( 4 ) ifadesine ilave edilerek hesaplama yapılır.
( 4 ) ( 5 )
107
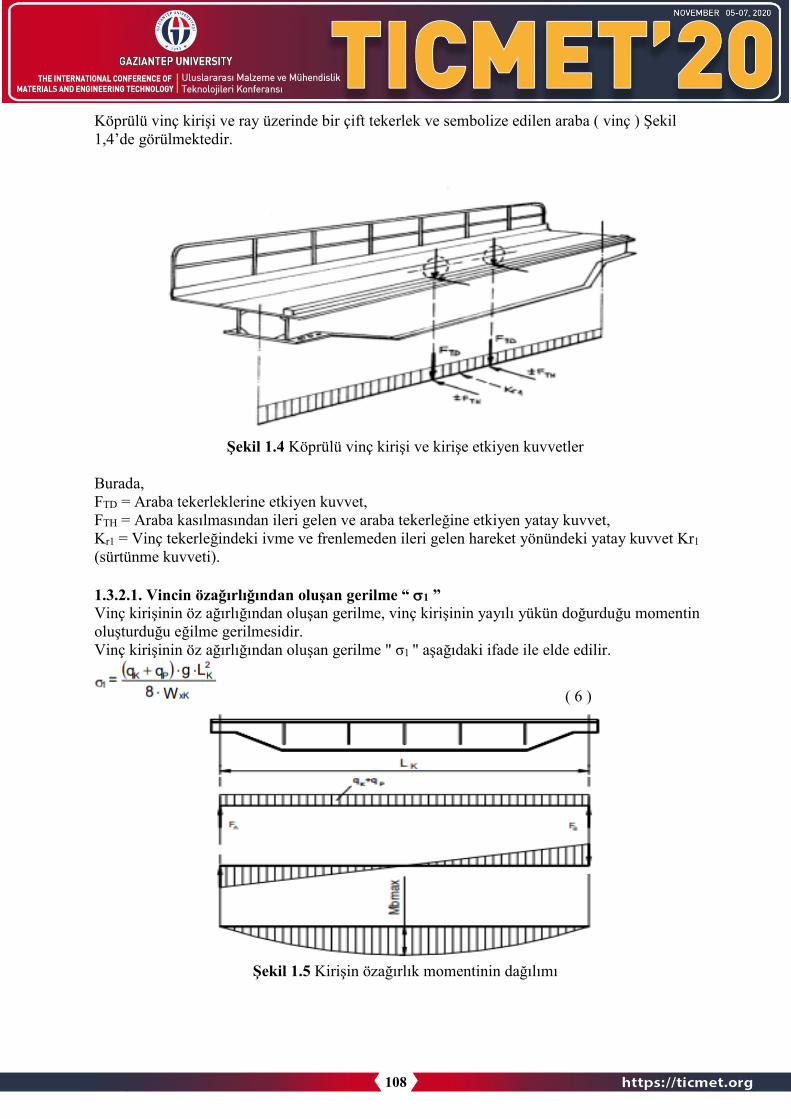
Köprülü vinç kirişi ve ray üzerinde bir çift tekerlek ve sembolize edilen araba ( vinç ) Şekil 1,4’de görülmektedir.
Şekil 1.4 Köprülü vinç kirişi ve kirişe etkiyen kuvvetler
Burada, FTD = Araba tekerleklerine etkiyen kuvvet, FTH = Araba kasılmasından ileri gelen ve araba tekerleğine etkiyen yatay kuvvet, Kr1 = Vinç tekerleğindeki ivme ve frenlemeden ileri gelen hareket yönündeki yatay kuvvet Kr1(sürtünme kuvveti).
1.3.2.1. Vincin özağırlığından oluşan gerilme “ σ1 ” Vinç kirişinin öz ağırlığından oluşan gerilme, vinç kirişinin yayılı yükün doğurduğu momentin oluşturduğu eğilme gerilmesidir. Vinç kirişinin öz ağırlığından oluşan gerilme " σ1 " aşağıdaki ifade ile elde edilir.
( 6 )
Şekil 1.5 Kirişin özağırlık momentinin dağılımı
108

1.3.2.2. Arabanın özağırlığından oluşan gerilme “ σ2 ” Arabanın öz ağırlığından oluşan gerilme, arabanın öz ağırlığının doğurduğu momentin oluşturduğu eğilme gerilmesidir.
( 7 )
Şekil 1.6 Arabanın öz ağırlık momentinin kirişteki dağılımı
1.3.2.3. Kaldırma yükünden oluşan gerilme “ σ3 ” Kaldırma yükünün ağırlık kuvvetinden ileri gelen gerilmedir.
( 8 )
Şekil 1.7 Kaldırma yükünün öz ağırlık momentinin kirişteki dağılımı
109

1.3.2.4. Atalet kuvvetlerinden oluşan gerilme “ σ4 ” Vinç kirişi ve arabanın kütlesinin doğurduğu atalet kuvvetinden oluşan gerilmeyi DIN 15018 e göre hesaplanan yatay kuvvetler ile hesaplanır.
( 9 )
Şekil 1.8 Kiriş üzerindeki atalet kuvvetleri
1.3.2.5. Araba kasılmasın sonucu oluşan gerilme “ σ5 ” Vinç kirişinde araba kasılmasından ileri gelen yatay kuvvetin " FATH " doğurduğu eğilme momentinden ileri gelen gerilmedir.
( 10 )
Şekil 1.9 Araba kasılması sonucu oluşan kuvvetler
1.3.3. Vinç Kirişindeki Kayma Gerilmesi “ τtop ” Vinç kirişindeki toplam kayma gerilmesi ( τtop ), iki ayrı tipteki kayma gerilmesi ( torsiyon ve kesme ) superpozisyonundan oluşur. Her iki gerilme halinde de hiperstatik bir durum vardır. Gerek burulma momentinden gerek kesme kuvvetinden ileri gelen kayma gerilmelerinin tam olarak belirlenmesi için kayma akımlarının hiperstatik momentlerinin ve kayma merkez noktasının bulunması gerekir. Ancak bu tip hesapla bulunan gerilmede bizim kullanacağımız daha basit yaklaşık bir hesaplama yöntemi ile bulunan gerilmeler arasında çok az fark vardır, ve bu farklar hesabın emniyeti bakımından önemlidir.
110

( 11 )
Burada, τt = Tekerlek kuvvetlerinden ileri gelen burulma gerilmesi, τk= Tekerlek kuvvetlerinden ileri gelen kesme gerilmesi.
1.3.3.1. Tekerlek kuvvetlerinden ileri gelen torsiyon gerilmesi “ τt ”Kirişte asimetrik olarak araba tekerleklerindeki dik ve yatay kuvvetlerden ileri gelen burulma momentinin doğurduğu torsiyon ( burulma ) gerilmesidir.
( 12 )
Şekil 1.10 Kiriş kesiti
1.3.3.2. Tekerlek kuvvetlerinden ileri gelen kesme gerilmesi “ τk ” Kesme gerilmesi veya kesme yükü, arabanın kendi ağırlık kaldırma yükünün ağırlık ve kirişin kendi ağırlık kuvvetlerinden ileri gelen gerilmedir.
( 13 )
Şekil 1.11 Kesme kuvvetlerinin kiriş üzerindeki dağılımı
111

1.4. Statik Kontrol İçin Emniyetli Mukavemet Değeri “ σEM” Statik kontrol için emniyet mukavemet değeri σEMTablo 2’de görülmektedir.
Tablo 1.2 Köprü malzemesi için emniyetli mukavemet değerleri
Kutu kiriş St 37 malzemesinden imal edilmektedir. St 37 için emniyet mukavemet değeri σEM=160 N / mm2dir. Bu değer çekme gerilmesi içindir. Bir kutu kirişte görülmüştür ki çekmekuvvetlerinden kaynaklanan hasar ve deformasyonlar basma kuvvetlerinin meydana getirdiğihasardan daha fazla olmaktadır. Bu yüzden genellikle hesaplamalarda statik kontrol için esasalınan gerilme emniyetli çekme gerilmesidir. Ancak yapılan hesaplarda kontrol açısından basma gerilmesinin de dikkate alınması hesabın doğruluğu açısından önemlidir. Tablo 1.2’den emniyetli basma mukavemet değeri σEM= 140 N / mm2dir.
1.5. Dinamik Kontrol İçin Emniyetli Mukavemet Değeri Malzemenin sürekli dinamik emniyetli mukavemet değeri daha çok sınır değerler oranı κ ile çentik etkisine bağlıdır. Sınır değerler oranı κ(kapa) şu şekilde bulunur;
( 14 )
Gerilmeler kuvvet ile doğru orantılı olduğundan, gerilmeler oranı yerine kuvvetoranı yazmakta bir sakınca yoktur. Sınır değerler oranı κ'nın hesaplanmasında kuvvetin değeri ve yönü göz önüne alınmalıdır.
112

Tablo 1.3 κ= -1 için malzemenin emniyetli mukavemet değerleri
2. Kiriş Kesitinin Matematiksel Modellemesi2.1. Amaç Fonksiyonu Bu çalışmada, gezer köprülü bir vinç konstrüksiyonunun, istenen teknik ve fonksiyonelözellikleri yerine getirirken minimum ağırlığa sahip olabilmesi için, Arı Algoritması [13-17] kullanılarak optimum tasarımı gerçekleştirilmiştir. Kiriş kesiti belirlenirken en hafif konstrüksiyonun, gerekli mukavemet değerlerini karşılaması gerekmektedir. Bunun içinde amacımız minimum kiriş kesit alanının elde edilmesi olacaktır.
Şekil 2.1.Kiriş kesiti parametreleri
113

Şekil 2.2. Amaç Fonksiyonu
Şekil 2.3. Giriş parametreleri ve sabit girdiler
114
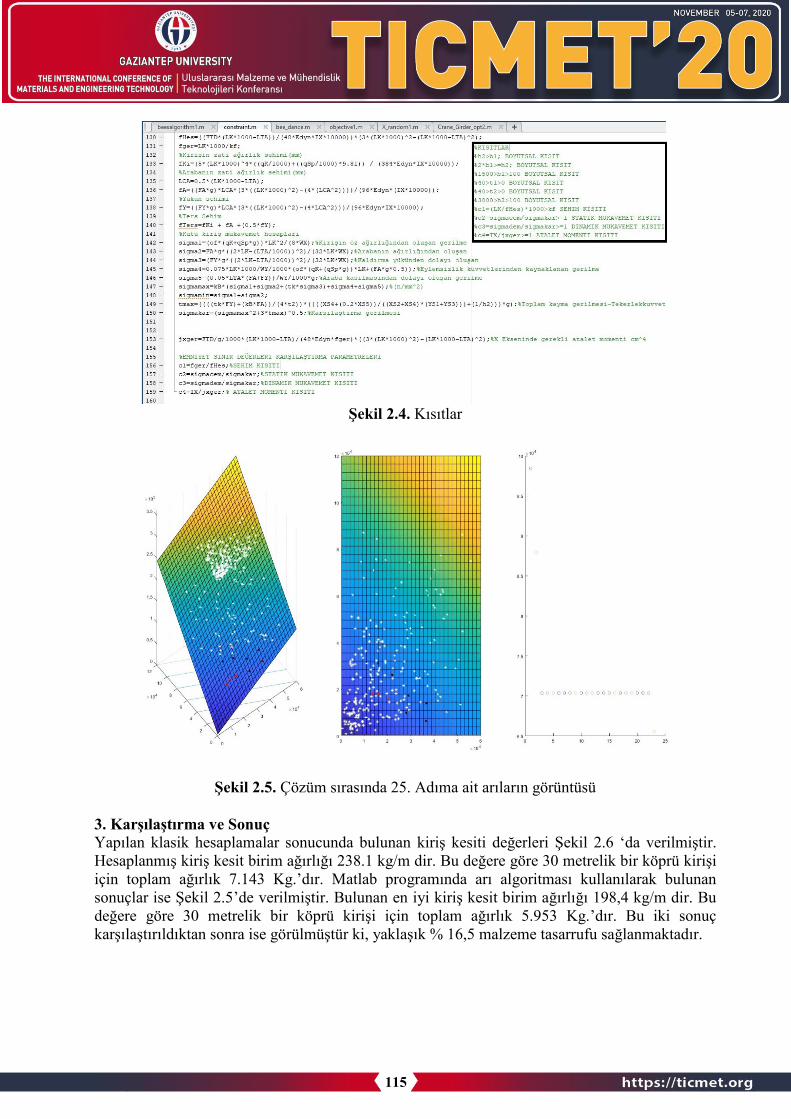
Şekil 2.4. Kısıtlar
Şekil 2.5. Çözüm sırasında 25. Adıma ait arıların görüntüsü
3. Karşılaştırma ve SonuçYapılan klasik hesaplamalar sonucunda bulunan kiriş kesiti değerleri Şekil 2.6 ‘da verilmiştir.Hesaplanmış kiriş kesit birim ağırlığı 238.1 kg/m dir. Bu değere göre 30 metrelik bir köprü kirişiiçin toplam ağırlık 7.143 Kg.’dır. Matlab programında arı algoritması kullanılarak bulunansonuçlar ise Şekil 2.5’de verilmiştir. Bulunan en iyi kiriş kesit birim ağırlığı 198,4 kg/m dir. Budeğere göre 30 metrelik bir köprü kirişi için toplam ağırlık 5.953 Kg.’dır. Bu iki sonuçkarşılaştırıldıktan sonra ise görülmüştür ki, yaklaşık % 16,5 malzeme tasarrufu sağlanmaktadır.
115
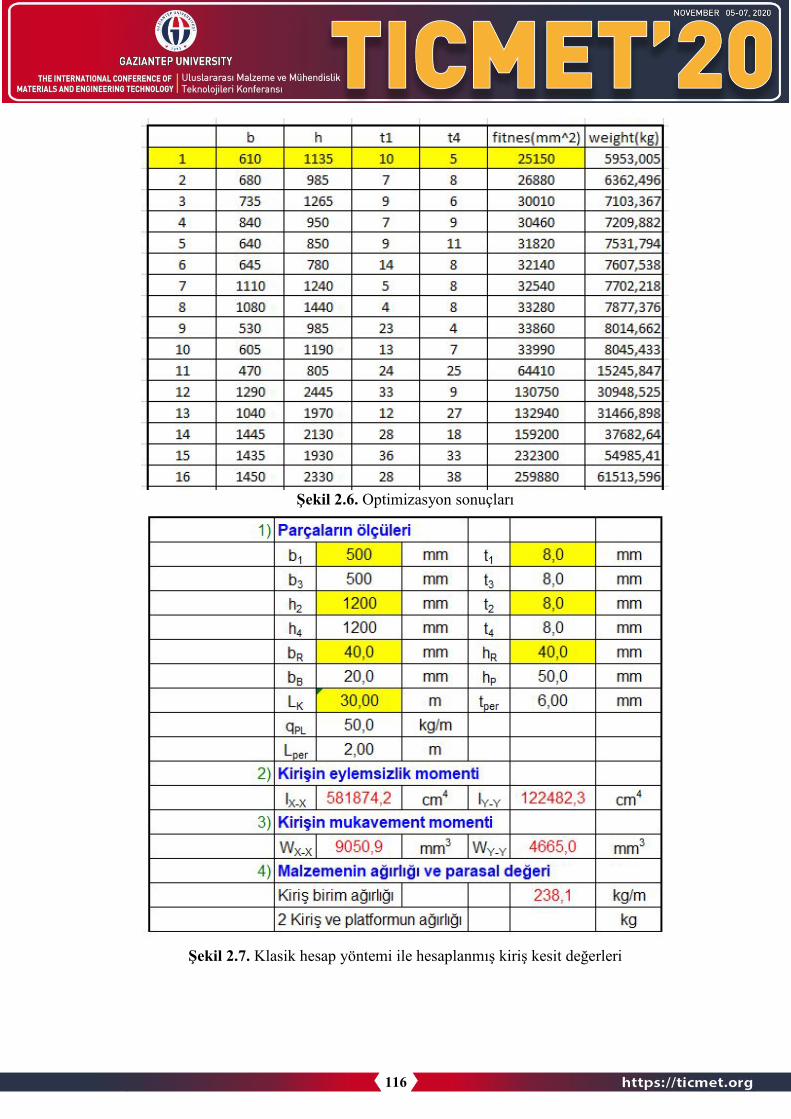
Şekil 2.6. Optimizasyon sonuçları
Şekil 2.7. Klasik hesap yöntemi ile hesaplanmış kiriş kesit değerleri
116

1. F.E.M., 1998. Rules For The Design Of Hoisting Appliances, Booklet 1 Federationeuropeenne de la Manutention.
2. C. Sun, J. Zeng, and J. Pan, “A Modified Particle Swarm Optimization with Feasibility-based Rules for ixedvariable
3. Optimization Problems”, International Journal of Innovative Computing, Information andControl, in press.
4. C. A. Coello Coello, “Theoretical and numerical constraint-handling techniques used withevolutionary algorithms: A survey of the state of the art”, Computer Methods in AppliedMechanics and Engineering, vol. 191, pp. 1245-1287, 2002.
5. Z. Michalewicz, “A survey of constraint handling techniques in evolutionary computationmethods”,Proceedings of the 4th Annual Conference on Evolutionary Programming, pp.135-155, 1995.
6. Kutay M.G., 1993. Gezerköprü Vinç Dolu Kiriş Hesapları, Almanya.7. DIN-15018 T1, 1993. Krane grundsảtze für stahltragwerke berechnung, Deutche Norm,
Germany.8. Çınar A., 1989, Bilgisayarla Köprülü Vinçlerde Optimum Kiriş Hesabı, Yıldız Üniversitesi,
Fen Bilimleri Enstitüsü.9. Aklın Ç., 2004, Kren Köprülerinin Katı Modellenmesi ve Sonlu Elemanlar Metodu ile
Analizi, ĐTÜ, Fen Bilimleri Enstitüsü.10. Erdik A., 2006, Portal Kren Gövdesinin Sonlu Elemanlarla Modellenmesi ve Statik Gerilme
Analizi, DTÜ, Fen Bilimleri Enstitüsü.11. Beer G. and Watson J.O., 1994. Introduction to Finite and Boundary Element Method for
Engineers, John Wiley.12. Knight C.E., 1993. The fınite element method in mechanical design, PWS- KENT
Publishing Company, Boston.13. Bilgic, H. H., Sen, M. A., & Kalyoncu, M. (2016). Tuning of LQR controller for an
experimental inverted pendulum system based on The Bees Algorithm. Journal ofVibroengineering, 18(6), 3684-3694.
14. Şen, M. A., Bilgiç, H. H., & Kalyoncu, M. (2016). Çift Ters Sarkaç Sisteminin Denge VeKonum Kontrolü için Arı Algoritması ile LQR Kontrolcü ParametrelerininTayini. Mühendis ve Makina, 57(679), 53-62.
15. Sen, M. A., & Kalyoncu, M. (2019). Grey Wolf Optimizer Based Tuning of a Hybrid LQR-PID Controller for Foot Trajectory Control of a Quadruped Robot. Gazi University Journalof Science, 32(2), 674-684.
16. Sen, M. A., & Kalyoncu, M. (2016). Optimal tuning of a LQR controller for an invertedpendulum using the Bees Algorithm. J Autom Control Eng, 4(5).
17. Fahmy, A. A., Kalyoncu, M., & Castellani, M. (2012). Automatic design of control systemsfor robot manipulators using the Bees Algorithm. Proceedings of the Institution ofMechanical Engineers, Part I: Journal of Systems and Control Engineering, 226(4), 497-508.
Referanslar
117

MODELLING AND SIMULATION OF SPHERICAL FLIGHT SIMULATOR UNDER STATIC LOADING
EDIP OZTURK1 BURAK SAHIN2 KURSAD GOV1
1 Gaziantep University, Aeronautics and Aerospace Faculty, Aircraft and Aerospace Engineering Department, Gaziantep, TURKEY.
2 Gaziantep University, Engineering Faculty, Mechanical Engineering Department, Gaziantep, TURKEY.
Abstract
Real flight trainings are expensive, time consuming and risky operations by its nature. Inaddition to these disadvantages, training some extreme issues such as; heavy weather conditions and aircraft failures are very difficult and dangerous. Solution of these mentioned problems is to simulate real flight conditions and flight environment by a machine called flight simulator.Simply, a flight simulator is a machine that recreates flying of an aircraft and aircraft environment artificially. Flight simulators are safe, relatively cheap and accessible machines. Inthis study, static analysis of two new designed flight simulator structures is examined. Three dimensional solid models of flight simulator are designed in SOLIDWORKS. Static analysis of model is performed by using numerical finite element analysis software ANSYS. Numerical analysis results are compared and discussed for the purpose of selection of proper design.
Keyword: Flight Simulator, Static Analysis, Finite Element Analysis, Numerical Analysis
1. IntroductionFlight simulator physical hardware is a mechanical machine that works under external andinertial loads. This machine usually has movable parts and joints. A set of analysis are essentialwhen it comes to a mechanical machine. Ozturk and Gov, performed kinematic analysis ofspherical flight simulator, they used rotation matrix method to obtain kinematic parameters ofsimulator analytically, and they validated analytical results with numerical analysis [1]. Sincespherical flight simulator has similar structure with gimbal like mechanical systems, they can betreated as gimbal in dynamical perspective. Usubamatov, derived mathematical model of asimilar structure and examined motion characteristics of the system. At the end of the study, hecollated mathematical results with experimental results [2]. Static structural analysis is alsoshould be considered for mechanisms and machines as well. Because, in kinematic and dynamicanalysis case, all parts of machine are assumed as they do not deform under applied loads. But,in real life applications, machine links and parts deform under loads. Therefore, deformations ofparts and stresses on parts have great importance and they are not negligible. Finite elementanalysis is strong tool for engineers to analyze stresses and deformations. Erklig and Yeter,studied finite element analysis of backhoe - loader arm and they optimized the structure in termsof strength [3]. Dogru, investigated deformation and stress values of a truck chassis underapplied loads by using finite element method [4]. ]. Gov et al. designed and manufactured aflight simulator which has structure as human gyroscope. They used servo motors to drive the
118
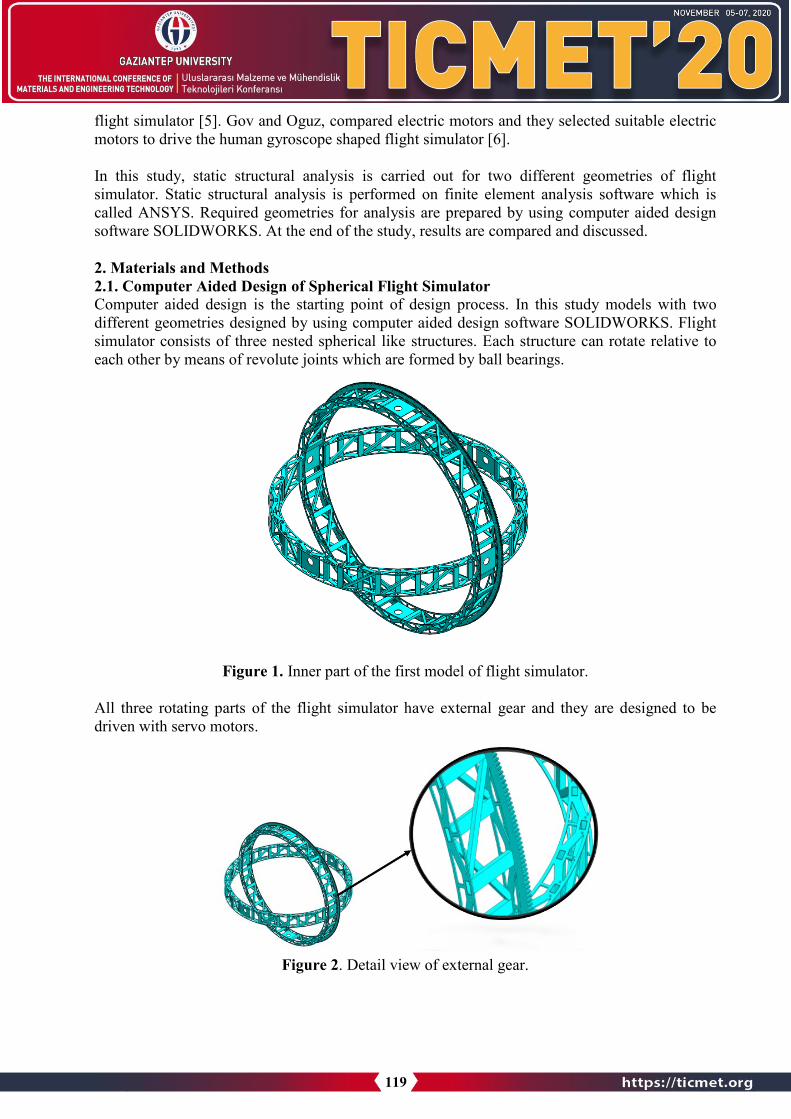
flight simulator [5]. Gov and Oguz, compared electric motors and they selected suitable electric motors to drive the human gyroscope shaped flight simulator [6].
In this study, static structural analysis is carried out for two different geometries of flight simulator. Static structural analysis is performed on finite element analysis software which is called ANSYS. Required geometries for analysis are prepared by using computer aided designsoftware SOLIDWORKS. At the end of the study, results are compared and discussed.
2. Materials and Methods 2.1. Computer Aided Design of Spherical Flight SimulatorComputer aided design is the starting point of design process. In this study models with twodifferent geometries designed by using computer aided design software SOLIDWORKS. Flight simulator consists of three nested spherical like structures. Each structure can rotate relative to each other by means of revolute joints which are formed by ball bearings.
Figure 1. Inner part of the first model of flight simulator.
All three rotating parts of the flight simulator have external gear and they are designed to be driven with servo motors.
Figure 2. Detail view of external gear.
119
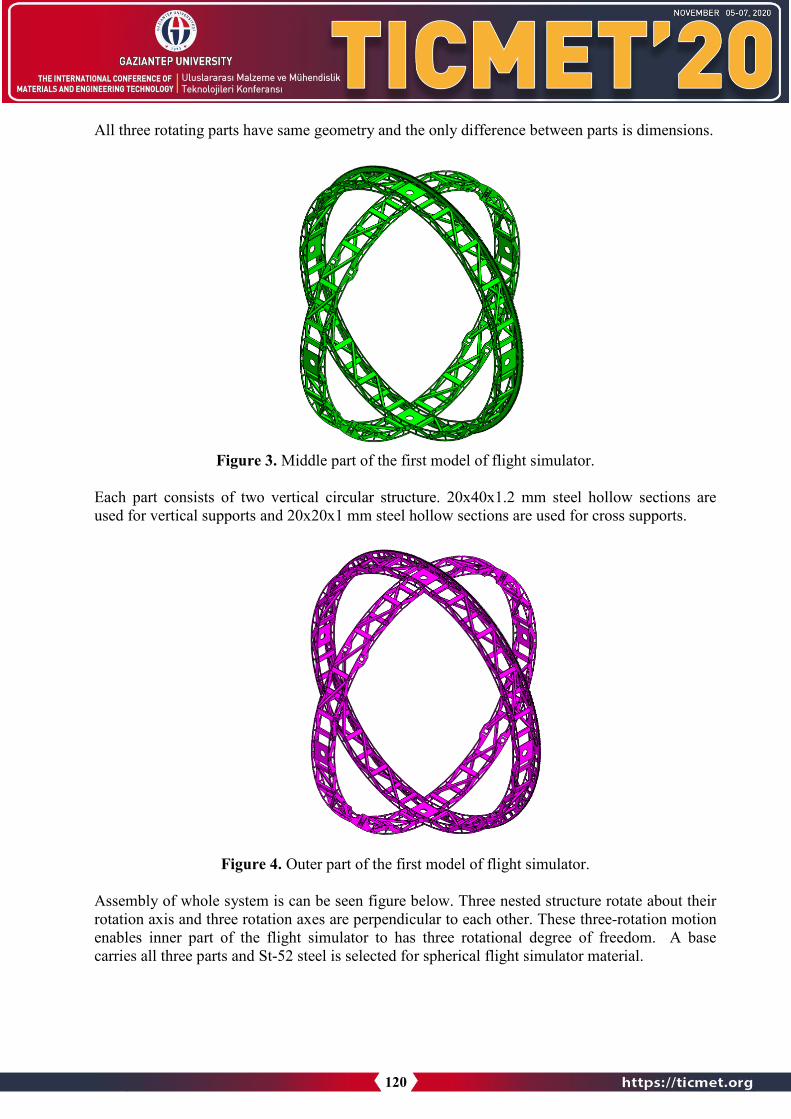
All three rotating parts have same geometry and the only difference between parts is dimensions.
Figure 3. Middle part of the first model of flight simulator.
Each part consists of two vertical circular structure. 20x40x1.2 mm steel hollow sections areused for vertical supports and 20x20x1 mm steel hollow sections are used for cross supports.
Figure 4. Outer part of the first model of flight simulator.
Assembly of whole system is can be seen figure below. Three nested structure rotate about their rotation axis and three rotation axes are perpendicular to each other. These three-rotation motion enables inner part of the flight simulator to has three rotational degree of freedom. A base carries all three parts and St-52 steel is selected for spherical flight simulator material.
120

Figure 5. Assembly of the first model of flight simulator.
Second model of the spherical flight simulator has same dimensions as the first model. But every rotating part of the simulator is covered with 1 mm thick sheet steel metal.
Figure 6. Inner part of the second model of flight simulator.
121

Since other parts of the simulator are same in terms of geometry, and only differences are dimensions and weight, middle part and outer part of the second model are not given as separately in figures.
Figure 7. Assembly of the second model of flight simulator.
Diameters of the spherical flight simulator and their masses are given in Table 1. below.
Table 1. Physical properties of the simulator parts.
2.2. Static Structural Analysis of Spherical Flight Simulator Flight simulator structure is subjected to payload in addition to its own weight.
Figure 8. Applied forces on inner part of the first model flight simulator.
122

This payload includes electrical and mechanical hardware and pilot weight. In this study payloadis determined as 250 kg. 250 kg payload and 90.97 kg inner part load are divided three equalforces and applied as in Figure 8.
Figure 9. Fixed support locations on inner part of the first model flight simulator.
Fixed supports are utilized as boundary condition to green colored mounts. Those mounts holds bearings for real life application.
Figure 10. Mesh view of inner part of the first model flight simulator.
123

After meshing operation in ANSYS, element number is obtained as 494571.
Figure 11. Deformed view of inner part of the first model flight simulator.
Deformation value is obtained as 3.65 mm for the inner part of the flight simulator.
Figure 12. Von-Mises stress for inner part of the first model flight simulator.
Stress value for the inner part of the flight simulator is obtained as 370 MPa.
124
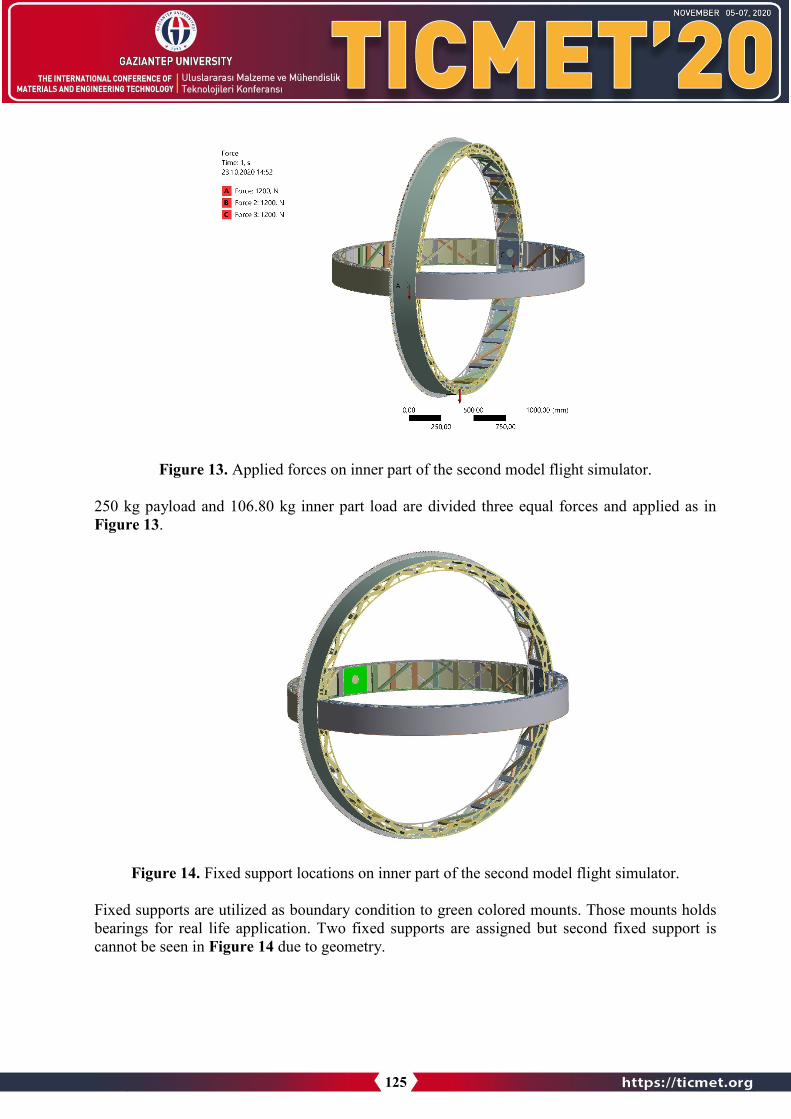
Figure 13. Applied forces on inner part of the second model flight simulator.
250 kg payload and 106.80 kg inner part load are divided three equal forces and applied as in Figure 13.
Figure 14. Fixed support locations on inner part of the second model flight simulator.
Fixed supports are utilized as boundary condition to green colored mounts. Those mounts holds bearings for real life application. Two fixed supports are assigned but second fixed support is cannot be seen in Figure 14 due to geometry.
125

Figure 15. Mesh view of inner part of the second model flight simulator.
After meshing operation in ANSYS, element number is obtained as 587555.
Figure 16. Deformed view of inner part of the second model flight simulator.
Deformation value is obtained as 2.72 mm for the inner part of the flight simulator.
126

Figure 17. Von-Mises stress for inner part of the second model flight simulator.
Stress value for the inner part of the flight simulator is obtained as 268 MPa. Since other parts of all of two flight simulators are same as geometrically, it is not necessary to add their solid models. In addition, applied load and fixed support locations, and their deformed shapes aresame as given figures. Therefore, analysis result and physical data of remain parts is given inresults and discussion section as tabulated.
3. Results and DiscussionIn this study, two flight simulator model with different geometries designed and numericalanalysis of two model is performed under static loading. Analysis results is given Table 2 below.
Table 2. Results for the first model flight simulator
Since outer part carries middle part and inner part in addition to its own weight, the biggest stress and deformation occurs on it.
Table 3. Results for the second model flight simulator
127

Analysis results can be observed in Table 3. Main difference between first model and second model is, parts form second model flight simulator are covered 1 mm thick steel sheet metal. Due to this covering operation, weight of every part is increased approximately by 17%. On the other hand, while weight increases, stress and deformation values decrease by 27%. Since, static analysis in ANSYS is based on numerical method, this methods can be contain some solutions error. Even so, it is a good starting point for real life applications.
References 1. E. ÖZTÜRK and K. GÖV, “Kinematic Analysis of 3 DOF Flight Simulator,” presented at
the The International Conference of Materials and Engineering Technologies , 2019.2. Usubamatov, R., Mathematical Model for Gyroscope’s Gimbal Motions.3. A. ERKLİĞ and E. YETER, “The Improvements of the Backhoe Loader Arms,” Modeling
and Numerical Simulation of Material Science, vol. 3, no. 4, pp. 142–148, Jan. 2013.4. M. H. DOĞRU, “Çoklu Yükleme Koşulları Altında Kamyon Şasisinin Topoloji
Optimizasyonu,” El-Cezeri Fen ve Mühendislik Dergisi, vol. 6, no. 3, pp. 856–867, Sep.2019.
5. Gov et al. Servo Motor Driven Human Gyroscope Structured Flight Simulator. In 5thInternational Conference on Advanced Technology&Sciences.2012.Istanbul.
6. Gov. K. Oguz. M. Human Gyroscope Control. In International Mechanical Engineering andTechnologies Conference. 2016. Istanbul.
128

ANALYSIS OF CONCEPT UNMANNED AERIAL VEHICLE IN TERMS OF WING ANGLE
RESUL DEMİR1 MEHMET HANİFİ DOĞRU2, EDİP ÖZTÜRK1
1 Gaziantep University, Aeronautics and Aerospace Faculty, Aerospace Engineering Department, Gaziantep, TURKEY
2 Gaziantep University, Aeronautics and Aerospace Faculty, Pilotage Department, Gaziantep, TURKEY
Abstract
This study includes the design, performance analysis and aerodynamic improvement of a mid-range tactical UAV inspired by flying fish (Exocoetidae). By designing a dihedral wing and a curved wingtip, the static stability of the UAV was increased and vortex concentrations thatcause friction were avoided. An aerodynamic body has been designed in accordance with the narrow and long torpedo shape of flying fish. With this design approach, the reference area across the flow has been lowered and wind resistance during flight has been reduced. In this way, maximum efficiency has been achieved in performance, speed and balance harmony. At the end of the study, the analyzes were carried out using the solidworks flow simulation part and the aerodynamic parameters were obtained in accordance with the purpose of the study.
Keywords: Unmanned Aerial Vehicle, Concept Design, Aerodynamic Analysis, Wing Angle
1. IntroductionFirst of all, before starting any design, one should have an idea of how exactly the process shouldbegin. Each expert can state that this process should be started by considering the requirementsof his / her field. For example, a designer thinks that the process starts with a new conceptairplane. An engineer knows that he cannot begin design without obtaining measurable data suchas estimated weight, length, payload capacity. When the process is looked at customer-oriented,the needs in the area where it will be used determine the starting point of the design. All of thesedefinitions are correct. In fact, design is a repetitive cycle.
If it is to be defined in general terms, the aircraft design process can be expressed as aircraft sizing, basic weight improvements, analysis, preliminary design and a more detailed optimization phase and needs determination, as shown in Figure 1. This process includes topics such as concept design, preliminary design and detailed design, as shown in Figure 2 [1].
Design for aircraft is an engineering effort to build flying vehicles, taking into account the relationship between the tasks, requirements and features defined to the aircraft. In the aircraft design process, weight, aerodynamics, aircraft structure / material, load carrying capacity for the defined mission, balance, control, propulsion systems, production and cost are the main issues [2].
129
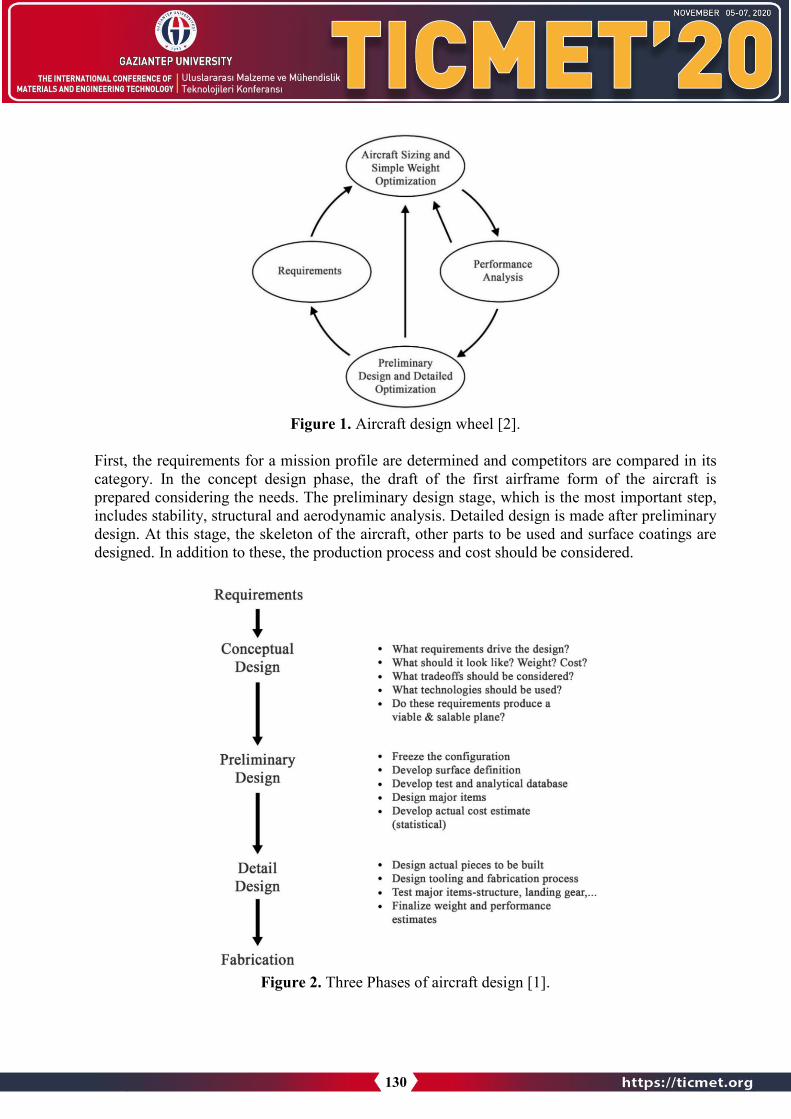
Figure 1. Aircraft design wheel [2].
First, the requirements for a mission profile are determined and competitors are compared in its category. In the concept design phase, the draft of the first airframe form of the aircraft is prepared considering the needs. The preliminary design stage, which is the most important step,includes stability, structural and aerodynamic analysis. Detailed design is made after preliminary design. At this stage, the skeleton of the aircraft, other parts to be used and surface coatings are designed. In addition to these, the production process and cost should be considered.
Figure 2. Three Phases of aircraft design [1].
130

In aviation, the angle between aircraft wings made with the horizontal plane is called dihedral. Ingliders that can fly without power supply, stable flight is provided by using dihedral angle. It wasdiscovered by George Cayley in 1809 to increase aerodynamics in aircraft [3]. The purpose ofthis type of wings is to give the aircraft static stability, that is, constant balance. Zero dihedral or anhedral wing is used in military combat aircraft, as it increases maneuverability. However, the use of such wings reduces the stability of the aircraft.
Wing types can be shaped differently according to different UAV types and the intended use ofthese UAVs, the desired performance and parameters. Many different parameters can be formed according to the location of the wing, the shape of the wing and the angle of attachment to the body.
An aircraft wing in motion in the air (as shown in Figure 3) generates drag and lift forces. Aerodynamic forces arise due to the relative motion between the airplane wing and the air. The wing profile causes pressure difference above and below the wing. Thus, a lifting force perpendicular to the flow direction occurs. Drag force occurs in the same direction as the flow direction. However, another aerodynamic force acting on aircraft is the thrust. Taking the weightinto consideration, flying vehicles are designed according to these forces [4].
Figure 3. Lift force, drag force and angle of attack [4].
Using the computational fluid dynamics method in the aircraft design process, the determination of aerodynamic concepts is faster and less costly with the use of CFD tools compared to wind tunnel research. As a result of the use of these tools, the performance of the designs has been increased.
Panagiotou and friends [5], presented the method of obtaining the appropriate solution for the airfoil in Medium-Altitude Long-Endurance (MALE) Unmanned Aerial Vehicles (UAV). After the conceptual and preliminary design processes, the same winglet design, which is part of the detailed design phase, was used at all wing angles (0°, 5°, 10°, 15°). Using CFD, the flow around the UAV was investigated at different wing angles. Flow velocities, vortex contours and pressure distribution images were presented as well as lift and drag coefficient charts.
Bravo-Mosquera and friends [6], made aerodynamic design of an unmanned aerial vehicle capable of surveillance to detect and transmit unusual activity in volcanoes. They calculated the
131

aerodynamic coefficients (CL and CD values) for the UAV with computational fluid dynamics (CFD) simulations.
Hui When Zhao and Cees Bil [7], used computational fluid dynamics to design and aerodynamic analysis of a VTOL ducted-fan UAV at different flow rates and angles of attack. Simulated using the CFD approach to access flow patterns and calculate aerodynamic coefficients at different flight phases.
The article discussed the conceptual, preliminary and detailed design stages of UAV designs, andthe calculation of requirements, performance, efficiency and aerodynamic coefficients. Solidworks Flow Simulation was used to calculate the aerodynamic coefficients of the designed UAV at different wing angles. As a result of aerodynamic analysis, as the angle of the wing with the horizontal plane increases, the drag force increases and the lift force decreases. Accordingly,while CD (drag coefficient) increased, CL (lift coefficient) decreased.
1.1. Aerodynamic Characteristics of Flying Fish First of all, the flying fish expression is the name given to all fish belonging to the Exocoetidae family. Flying fish have an aerodynamic structure in the form of a narrow and long torpedo designed to reduce friction in water and air. This allows flying fish to reach sufficient speedunderwater to break the surface resistance. The most distinctive feature of these fish swimming close to the water surface is that the fins on both sides are developed. They also have bifurcated tails and pelvic fins with the lower lobe longer than the upper lobe [8]. Morphometric parameters of flying fish are shown in Figure 4.
Figure 4. Definitions of the morphometric parameters [8]
132

As they exit the surface, they quickly move their underwater tails, pushing their bodies forward. This soaring or flying process, which starts underwater, begins with a great speed, with anaverage speed of 60 kilometers per hour. After they climb on the surface, they start to move through the air by opening their wide wing-like fins. At the point where it splashes, they can reach heights over 1.2 meters above the water surface and move 200 meters away [9]. In order to continue their gliding movements, they take off again with this thrust they create with their V-shaped tail every time they land on the water surface.
2. Materials and Methods 2.1. Numerical Analyses The concept UAV model was created in Solidworks. An asymmetrical Naca 63-412 airfoil (shown in Figure 5) was used in the design of the wing. The wing has variable chord length andspan length for each wing angle. The 3D design of the 15° dihedral wing UAV is as in Figure 6.
Figure 5. Naca 63-412 [10]
Figure 6. 3D rendering of the UAV (front perspective)
2.2. Mesh Generation Solidworks Flow Simulation, a CFD tool, was used for numerical calculations and aerodynamic analysis for the designed unmanned aerial vehicle and its configurations. After the 3D model was
133

created in the program, the mesh creation process was performed. The mesh model of the UAV wing is as shown in Figure 7 at each wing angle. Mesh settings were used on the model with the appropriate minimum gap size, correct curvature refinement level and minimum wall thickness [11]. The solution time of the program is largely related to the number of cells in the calculation area. While creating the mesh in Solidworks Flow Simulation, a compute volume divided into blocks was created using the finite volume method.
Figure 7. Mesh model of the UAV wing in all angles
2.3. Numerical Method and Boundary Conditions Solidworks Flow Analysis software based on finite volume method is used for numerical calculations. Gravity was neglected and pressure based and 20° temperature was chosen for analysis method. The density of the air is 1.19 kg/m3 and the free flow velocity is assumed to be 50 m/s. The flow type is chosen as laminar and turbulent. All the above parameters are applied for setting up simulations.
2.4. Analysis Results In this section, the lift and drag forces of the designed UAV wing are calculated using CFD analysis at different wing angles. Stattic pressure, velocity and vorticity results are as shown in Figure 8, Figure 9 and Figure 10 for the UAV wing at 0° angle.
134

Figure 8. Pressure (Pa) value of the wing at 0° angle
Figure 9. Velocity (m/s) value of the wing at 0° angle
135

Figure 10. Vorticity (1/s) value of the wing at 0° angle
Static pressure, velocity and vorticity results are as shown in Figure 11, Figure 12 and Figure 13 for the UAV wing at 5° angle.
Figure 11. Pressure (Pa) value of the wing at 5° angle
136

Figure 12. Velocity (m/s) value of the wing at 5° angle
Figure 13. Vorticity (1/s) value of the wing at 5° angle
Static pressure, velocity and vorticity results are as shown in Figure 14, Figure 15 and Figure 16 for the UAV wing at 10° angle.
137

Figure 14. Pressure (Pa) value of the wing at 10° angle
Figure 15. Velocity (m/s) value of the wing at 10° angle
138

Figure 16. Vorticity (1/s) value of the wing at 10° angle
Static pressure, velocity and vorticity results are as shown in Figure 17, Figure 18 and Figure 19 for the UAV wing 15° angle.
Figure 17. Pressure (Pa) value of the wing at 15° angle
139

Figure 18. Velocity (m/s) value of the wing at 15° angle
Figure 19. Vorticity (1/s) value of the wing at 15° angle
3. Results and DiscussionLift coefficient (CL) and drag coefficient (CD) values are as shown in Table 1, CL/CD ratios are asshown in Table 2 and lift force and drag force values are as shown in Table 3 respectively. Also,lift and drag force graphic is as shown in Figure 20 and the graph of CL/CD ratio is shown inFigure 21.
140

Table 1. CL and CD values according to wing angle
Wing Angle CL CD 0° 0.1833 0.0389 5° 0.1762 0.0392 10° 0.1771 0.0406 15° 0.1725 0.0419
Table 2. CL/CD ratio according to wing angle
Wing Angle CL/CD 0° 4.712 5° 4.495 10° 4.362 15° 4.117
Table 3. Drag and Lift Force according to wing angle
Wing Angle Drag Force (N) Lift Force (N) 0° 13.161 513.648 5° 13.208 491.667 10° 13.506 488.668 15° 13.677 466.496
Figure 20. Drag and Lift Force according to wing angle
0°
5°10°
15°
460
470
480
490
500
510
520
13,10 13,20 13,30 13,40 13,50 13,60 13,70 13,80
Lift
Forc
e (N
)
Drag Force (N)
141

Figure 21. CL/CD ratio according to wing angle
4. ConclusionsIn this study, concept UAV wing models at 0°, 5°, 10° and 15° angles were examined in terms of drag and lift force arising from aerodynamic forces, which are the most critical parameters at the design stage. Lift and drag forces on the three dimensional NACA 63-412 airfoil wing are analyzed at different wing angles.
When Figure 20 is examined, it is seen that the wing angle of 0° is more effective on the liftforce for the UAV. At 0° the wing is about 4.5% better than the wing at 5°, about 5% better thanthe wing at 10° and about 10% better than the wing at 15° in terms of the lift force.
Drag force is the critical parameter for fuel consumption in aircraft. When Figure 21 is examined, it is clear that the 0° wing is about 5% better than the 5° wing, 8% better than the 10° wing, and 14.5% better than the 15° wing.
Acknowledgments I would like to express my utmost gratitude to my supervisor Assoc. Prof. Dr. M. Hanifi DOĞRU for his guidance and encouragement during the study. I have been fortunate to have an advisor who broadens my mind and gives the freedom space to research on my own. I owe debt to him.
I would like to express my sincere appreciation to my cousin Medicine Doctor Dermatologist Kıvılcım Çınkır Özsaraç for her encouragement, support and advices during the study.
Lastly, I would like to express my deepest gratitude to my family for their support and continuous encouragement in the whole stages of the study. The study would not have been completed successfully without their support and understanding.
0°
5°
10°
15°
4,00
4,10
4,20
4,30
4,40
4,50
4,60
4,70
4,80
0 0,5 1 1,5 2 2,5 3 3,5 4 4,5
CL/
CD
Wing Angle
142

References 1. Raymer, D., Aircraft Design: A Conceptual Approach/Daniel P. Raymer. 1992.2. Turanoğuz, E.J.M.E.T.U., Ankara, Design of Medium Range Tactical UAV and
Improvement of Its Performance by Using Winglets. 2014.3. Dihedral. Available from: https://tr.wikipedia.org/wiki/Dihedral.4. Chitte, P., et al., Statistic and dynamic analysis of typical wing structure of aircraft using
Nastran. 2013. 2(7).5. Panagiotou, P., et al., Winglet design and optimization for a MALE UAV using CFD. 2014.
39: p. 190-205.6. Bravo-Mosquera, P.D., et al., Aerodynamic design analysis of a UAV for superficial
research of volcanic environments. 2017. 70: p. 600-614.7. Zhao, H. and C. Bil. Aerodynamic design and analysis of a vtol ducted-fan uav. in 26th
AIAA Applied Aerodynamics Conference. 2008.8. Park, H. and H.J.J.o.E.B. Choi, Aerodynamic characteristics of flying fish in gliding flight.
2010. 213(19): p. 3269-3279.9. National Geographic, Common Name: Flying Fish, Scientific Name: Exocoetidae. Available
from: https://www.nationalgeographic.com/animals/fish/group/flying-fish/.10. The Airfoiltools website. 2020; Available from:
http://www.airfoiltools.com/airfoil/details?airfoil=n63412-il.11. Matsson, J.E., An Introduction to SolidWorks Flow Simulation 2013. 2013: SDC
publications.
143

COMPUTER SIMULATION OF A NEW METHOD APPLIED TO PREVENT WELD DECAY IN TIG WELDING
MAHMUT FURKAN KALKAN1, MUSA YILMAZ 1, NECİP FAZIL YILMAZ*1
1Gaziantep University, Engineering Faculty, Mechanical Engineering Department, Gaziantep, TURKEY.
Abstract
AISI 304 steel is one of the most familiar steel type which is used especially as transition and cooling system pipes. However, the common problem of austenitic stainless steel is weld decay during TIG welding process. Different methods have been improved up to now. Nevertheless, these methods have some limitations. In this study, a new method was applied to prevent weld decay problem. This method was applied by passing water through the copper cylinder inside the stainless pipe during welding. This new method was simulated on austenitic stainless steels. At the end of the simulation, the cooling of the HAZ and weld area was being examined under the conditions of standard welding and new method applied. The penetration and temperaturedistribution of this method that prevents intergranular corrosion was also be investigated.
Key Words: Simufact Modelling, AISI 304 Steel, TIG Welding, Weld Decay, IntergranularCorrosion
1. IntroductionArc welding is frequently preferred in the manufacture of stainless steels used in products suchas pipes, vessels, chemical industrial equipment [1]. Austenitic stainless steels provide theaustenite phase and corrosion resistance at room temperature by containing nickel and chromiumelements[2,3]. Austenitic stainless steels can contain elements such as titanium, copper andnitrogen, especially chromium and nickel, in the alloy. Tungsten inert gas (TIG) welding is oneof the most common methods used in the manufacture of austenitic stainless steels. This weldingmethod stands out with its precise control of parameters, low cost and welding quality[4,5].
Although austenitic stainless steel products have extensive industrial area due to their welding and fabricating features, they endure from the temperature range that is 850°C to 450°C[6]. This type of steels can be effected by cooling rate especially higher carbon level austenitic stainless steels like AISI 304. This temperature range is critical for this steels. If austenitic stainless steels stay more than described by Parvathavarthini in this temperature range intergranular corrosion was detected on heat affected zones [7]. This intergranular corrosion can be named as weld decay[8]. This problem actualizes generally austenitic stainless steel weldments. Some solutions have been found to solve this weld decay problem in time. Heat treatment and using lower carbon austenitic stainless steel are most common preventing weld decay problem[9–11]. However, heat treatment is not practical in all cases as not all weldment geometries cannot fit heat treatment furnace. Also, the use of low carbon austenitic stainless steel is avoided as it results in a substantial price increase for the material.
144

A lot of investigations were conducted with new methods of protecting AISI 304 steels from weld decay problem in the literature. YILMAZ et al.[12] found probably the easiest method to reduce weld decay problem. They investigated cooling effect of copper cylinder on AISI 304pipes. That’s found that intergranular corrosion were reduced with increasing rate of cooling by copper cylinder. Additively when using water through inside copper cylinder during welding process, weld decay problem of AISI 304 after welding process was disappeared. Also, improvements on hoop tensile and hardness properties were found by using cooling with copper cylinder.
With the improving computer sciences, Finite Element Method (FEM) has become popular to simulate forming, welding and machining processes in recent decade. Using this method, estimate the thermal, material and mechanical effects of even complex parts depending on the simulations they are applied[13]. One of the most significant reasons for the widespread use ofFEM is a rapid industrial need to better investigate and compare with experiments productivity and quality and the influence of different process parameters[14]. In this FEM simulations of welding processes selection of process parameters must be chosen to match the experimental data. The heat source generated by the weld torch has great effect on the problems occur in the HAZ or residual stresses and distortions on the weldment[15]. Also, having a well joining quality of the welding specimen and simulating it is related to the heat source model. For this reason, there are many studies in the literature, especially on heat source model and temperature field. By using the double ellipsoidal heat source model by Goldak can be defined for conventional arc welding method[16].
This paper included the AISI 304 pipe TIG welding modelling. The new method applied to reduce weld decay problem model was created by using FEM. Standard welding method modelwas also prepared for comparing new method with standard welding. These two model were simulated by using Simufact Welding software. The temperature histories and penetrations ofthese models were represented
2. Finite Element AnalysisPipe welding process by TIG welding method was prepared on FEM model. This model wascreated with Simufact Welding 2020 software. A pipe has 3 mm thickness, 100 mm length andmaterial of pipe was selected from library of Simufact Welding as AISI 304. Table 1 presents theelement percentage on AISI 304 stainless steels. Pipe with 45-degree V-type groove was drawnby CAD software. Fine Hexehedral mesh was employed on thermal analysis to ensure accuracyof the thermal and mechanical results for finite element model. Figure 1 shows the meshcondition that was used during the welding simulation. The bearing condition was adopted bothof left and right side of workpiece in the simulation. This was necessary to protect weldmentfrom distortion.
Table 1 Chemical composition (wt.%) of base metal and filler wire used Element C Si Cr Ni Mn S Mo P V Cu Fe AISI 304 0.08 1 18-20 8-10 2 0.03 0.070 0.045 0.030 - Bal.
Specifying of weld pool is a complex and significant phenomenon. Double ellipsoid Goldak heat source model was used to define power distribution and weld pool of workpiece during arc welding method. Goldak’s heat source model was indicated in Figure 2. This model has two
145

different ellipsoids perpendicular to each other. In the geometry of the ellipsoids in this model, (cr) and (cf ) describe the heat area emitted by the welding torch on the rear and front sides. (b) gives the depth of heat source while (a) gives half of the weld pool width. Analytically the double ellipsoidal model used in the simulation to obtain sensitive results shown in equation (1). Heat flux was defined as 𝑞𝑞 at (x, y, z) coordinates at time t. lag factor and number of heat was described as 𝜏𝜏 and 𝑓𝑓𝑟𝑟,𝑓𝑓.
Figure 1. Meshed model of AISI 304 pipe
𝑞𝑞𝑟𝑟,𝑓𝑓(𝑥𝑥,𝑦𝑦, 𝑧𝑧, 𝑡𝑡) = 6√3 ∗ 𝑓𝑓𝑟𝑟,𝑓𝑓 ∗ 𝑄𝑄
𝑎𝑎 ∗ 𝑏𝑏 ∗ 𝑐𝑐𝑟𝑟,𝑓𝑓 ∗ 𝜋𝜋√𝜋𝜋∗ 𝑒𝑒−3∗
𝑥𝑥2𝑎𝑎2 ∗ 𝑒𝑒−3∗
𝑦𝑦2𝑏𝑏2 ∗ 𝑒𝑒
−3∗[𝑧𝑧+𝑣𝑣(𝜏𝜏−𝑡𝑡)]2
𝑐𝑐𝑟𝑟,𝑓𝑓2
1
Welding trajectory that is the path of heat source model to move along. Trajectory of the pipe was determined in accordance with the weld groove and mesh structure. The voltage and current determined as 25.2 V, and 68 A with transient power mode. Arc welding torch movement speed was 1.5 mm/s during welding simulation.
Figure 2. Goldak’ ellipsoid heat source model
The heat losses during simulation is explained by Newton's law and Stefan-Boltzmann law, respectively. Newton’s law of cooling is shown in Eq 1. Convective heat transfer was
146

determined according to convective heat transfer coefficient h and initial and final surface temperatures. Stefan-Boltzmann law describes the total energy due to radiation of a black body.Stefan-Boltzmann law is indicated in Eq 2. Its depend on temperature change of the surface, emissivity of material ε and Stefan-Boltzmann constant is σ (5.67*10-8 W/m2k4).
𝑄𝑄𝑐𝑐 − ℎ(𝑇𝑇2 − 𝑇𝑇1) = 0 2 𝑄𝑄𝑟𝑟 − εσ(𝑇𝑇2
4 − 𝑇𝑇14) = 0 3
It was mounted on the model by using the copper cylinder fix node shown in Figure 3. Water contact has been provided to the channels passing through the copper cylinder. Then, the heattransfer coefficients required to effect the cooling of the defined parts are defined. This model is a simulation of the method used to prevent weld decay during welding.
.
Figure 3. Meshed model of new method applied AISI 304
3. Results and DiscussionsPrevention of weld decay was achieved by using copper cylinder through which coolant fluid ispassed inside the work piece. The results were compared with standard welded austeniticstainless pipe. welding thermal simulation of austenitic stainless steel pipes were completed inSimufact Welding.
Temperature distribution of weldments were given in Figure 4. Cooling curve limits defines between 850°C to 450°C, since chromium ions precipitate with carbon ions on HAZ during this temperature range. This given temperature and time graph have a direct effect on the cooling curve in the source where the new method is used according to the standard welding. While the curve, which was normally welded, allowed the necessary time for chromium carbide precipitation, the second curve did not allow sufficient time for chromium carbide precipitation. According to this information, the positive effect of this method against welding decay has been determined. In this simulation, it has been determined that the cooling curve was be sufficiently accelerated by the active use of the new method.
147

Figure 4 Temperature distributions on HAZ of weldments
Penetration of weld regions were indicated in Figure 5. Penetration was shown with temperaturemap of welding zone. In the specified heat maps, the red regions show the molten metal during welding, while the yellow regions represent the regions under melting temperature. During simulation of welding, the melting spilled over a slightly larger area than the weld groove, and penetration was achieved at all wall thickness for standard welded model. It is noteworthy herethat the modeling is based on real data and the parameters used in the numerical analysis method are practically applicable. The penetration sample shown in Figure 5 (b) that was new method applied specimen did not reveal a significant difference from the standard welding method usedin Figure 5 (a). This demonstrates that this new method applied in terms of penetration has no adverse effects.
(a) (b) Figure 5. Temperature maps of (a) standard weld zone, (b) new method applied weld zone
4. ConclusionsSimulation of standard TIG welding and with applied new method on seamless AISI 304stainless steel pipes and have been developed in this paper. Temperature distributions on HAZwere measured during the simulation welding process. With the cooling applied during welding,a serious rapid cooling occurred in the HAZ region compared to the standard welding. However,despite the rapid cooling with the use of this method applied during welding, no significantdifference in weld penetration was observed. These numerically obtained data do not leaveenough time for chromium carbide precipitation that causes weld rot with the acceleration of thecooling of this new method applied.
148

References 1. Kim YS, Eagar TW. Analysis of metal transfer in gas metal arc welding. Weld JOURNAL-
NEW YORK- 1993;72:269-s.2. Chao Q, Cruz V, Thomas S, Birbilis N, Collins P, Taylor A, et al. On the enhanced
corrosion resistance of a selective laser melted austenitic stainless steel. Scr Mater2017;141:94–8.
3. Fossati A, Borgioli F, Galvanetto E, Bacci T. Corrosion resistance properties of glow-discharge nitrided AISI 316L austenitic stainless steel in NaCl solutions. Corros Sci2006;48:1513–27.
4. Bodkhe SC, Dolas DR. Optimization of activated tungsten inert gas welding of 304Laustenitic stainless steel. Procedia Manuf 2018;20:277–82.
5. Singh AK, Dey V, Rai RN. Techniques to improveweld penetration in TIG welding (Areview). Mater Today Proc 2017;4:1252–9.
6. Kina AY, Souza VM, Tavares SSM, Pardal JM, Souza JA. Microstructure and intergranularcorrosion resistance evaluation of AISI 304 steel for high temperature service. MaterCharact 2008;59:651–5.
7. Parvathavarthini N, Dayal RK, Seshadri SK, Gnanamoorthy JB. Continuous cooling and lowtemperature sensitization of AISI types 316 SS and 304 SS with different degrees of coldwork. J Nucl Mater 1989;168:83–96.
8. Gooch TG, Willingham DC. Weld decay in austenitic stainless steels 1975.9. Davis JR. Corrosion of weldments. ASM international; 2006.10. Pradhan SK, Bhuyan P, Mandal S. Individual and synergistic influences of microstructural
features on intergranular corrosion behavior in extra-low carbon type 304L austeniticstainless steel. Corros Sci 2018;139:319–32.
11. Choe HC, Kim KH, Moon KT. Effects of Heat Treatment on Intergranular Corrosion ofAISI 304 stainless steel. J Corros Sci Soc Korea 1992;21:239–48.
12. Yilmaz, N.F., Yilmaz M., Kalkan, M.F., Investigation of Carbide Precipitation of TIGWelded AISI 304 Pipes. 5. Int. Conf. Weld. Technol. Exhib., 2018.
13. Huebner KH, Dewhirst DL, Smith DE, Byrom TG. The finite element method for engineers.John Wiley & Sons; 2001.
15. Cho JR, Lee BY, Moon YH, Van Tyne CJ. Investigation of residual stress and post weldheat treatment of multi-pass welds by finite element method and experiments. J MaterProcess Technol 2004;155:1690–5.
15. Nezamdost MR, Esfahani MRN, Hashemi SH, Mirbozorgi SA. Investigation of temperatureand residual stresses field of submerged arc welding by finite element method andexperiments. Int J Adv Manuf Technol 2016;87:615–24.
16. Goldak J, Chakravarti A, Bibby M. A new finite element model for welding heat sources.Metall Trans B 1984;15:299–305.
149

PRODUCTION OF COPPER ADDED IRON MATRIX FUNCTIONAL GRADED MATERIALS BY POWDER METALLURGY METHOD AND
INVESTIGATION OF THEIR MECHANICAL PROPERTIES
Mehmet Yıldırım*1, Enver Atik2 1 Manisa Celal Bayar University, Engineering Faculty, Department of Mechanical Engineering, Manisa, Turkey 2 Manisa Celal Bayar University, Engineering Faculty, Department of Mechanical Engineering, Manisa, Turkey
Abstract
In this study, it is aimed to produce iron-based copper-doped functionally graded materials by powder metallurgy (T / M) method. Iron matrix layers containing different proportions of copperwere formed on Högenas ASC 100.29 iron powder, and it was compressed in a single actionpress under 600 MPa pressure. The obtained raw powder metal functionally graded materials aresintered at 1120 ° C. Three-point bending, hardness, density, electrical resistance measurements were made on the obtained materials and their microstructures were examined. Layered sintered materials with different proportions of copper powder added to iron-based powder metal parts were produced. It has been determined that as the copper ratio increases, the density of these pieces increases. In the three-point bending test of the samples containing Fe + (5 + 10 + 15)%Cu and Fe + (10 + 20 + 30)% Cu, the maximum tensile values and hardness values increased, according to these samples, samples containing Fe +% (15 + 30 + 45) Cu decreased.
Keyword: Functionally Graded Material, Powder Metallurgy, Sintering
1. IntroductionNowadays, in economic, environmental and technological developments, it is preferred to meetthe need for high-quality materials with gradual or variable structures as well as alloy andcomposite materials [1,2]. Functionally graded materials (FGM) produced for this purpose; It isan advanced class of materials produced by changing composition, microstructure and materialproperties throughout the volume in accordance with functional requirements [3]. Functionallygraded materials have the properties of both materials. Due to their gradual structure, theformation of cracks and fractures in the stress and stress regions can be reduced. Thus, thenegativities that may occur due to sudden changes between the two materials can be minimized[4, 5]. Examples of the production methods of functionally graded materials include powdermetallurgy, spin casting, tape casting, slip casting, gel casting, electrophoretic deposition,chemical solution deposition, laser deposition, directional solidification, sedimentation,electrochemical grading, spark plasma sintering and 3D printing [ 1.6]. Production offunctionally graded materials by powder metallurgy involves mixing powders, shaping andsintering. Powder metallurgy is widely used due to its features such as the production ofeconomical, quality and special parts [7-11]. Materials produced with iron-based powdermetallurgy are widely used in other sectors, especially in the automotive sector, due to theirsuperior physical and chemical properties [12-13]. There are many studies on the use of ferrous
150

metal in powder metallurgy [8, 11-20]. Copper has a wide range of uses such as electricity and electronics due to its properties such as good electrical conductivity and good thermalconductivity, good ductility, good corrosion resistance, cheap and easy to produce [21-24].
In this study, the interaction of iron powder and copper powder, one of the most common metals, was investigated as functionally graded material. Iron matrix layers containing different proportions of copper were formed on Högenas ASC 100.29 iron powder. These powder layerswere compressed under 600 MPa pressure in a single action press. Three-point bending, hardness, density and electrical resistance measurements were made and their microstructures were examined for samples made only of iron powder and other materials graded at different rates.
2. Materials and Methods 2.1. Material ASC 100.29 iron powder was used in this study. Chemical properties, physical properties and sieve analysis of the powder used are given in Table 1.
Table 1. Chemical, physical properties and sieve analysis of Högenas ASC 100.29 iron powder Chemical Properties (%) Physical Properties Dimensional
Analysis (%) C 0,5 Apparent
Density 2,42
g/cm3 45 μm˂ 23
O 0,7 45-150 μm 69
Cu 3 Flow 31s/50 g 150-180μm
8
Iron Balance ˃180 μm 0
The physical properties, chemical analysis and size analysis of the copper powder used are given in Table 2 and Figure 1.
Table 2. Physical properties and size analysis of Sentes-Bir 11000 coded copper powder EN 1044 AWS A 5.8 DIN 8513 Chemical Properties (%) CU102 B-Cu1 L-Cu Cu Sn Ni residual Melting temperature Grain Range >75 µm 99.95 - - - 1085°C
Figure 1. Particle size analysis of copper powder
151
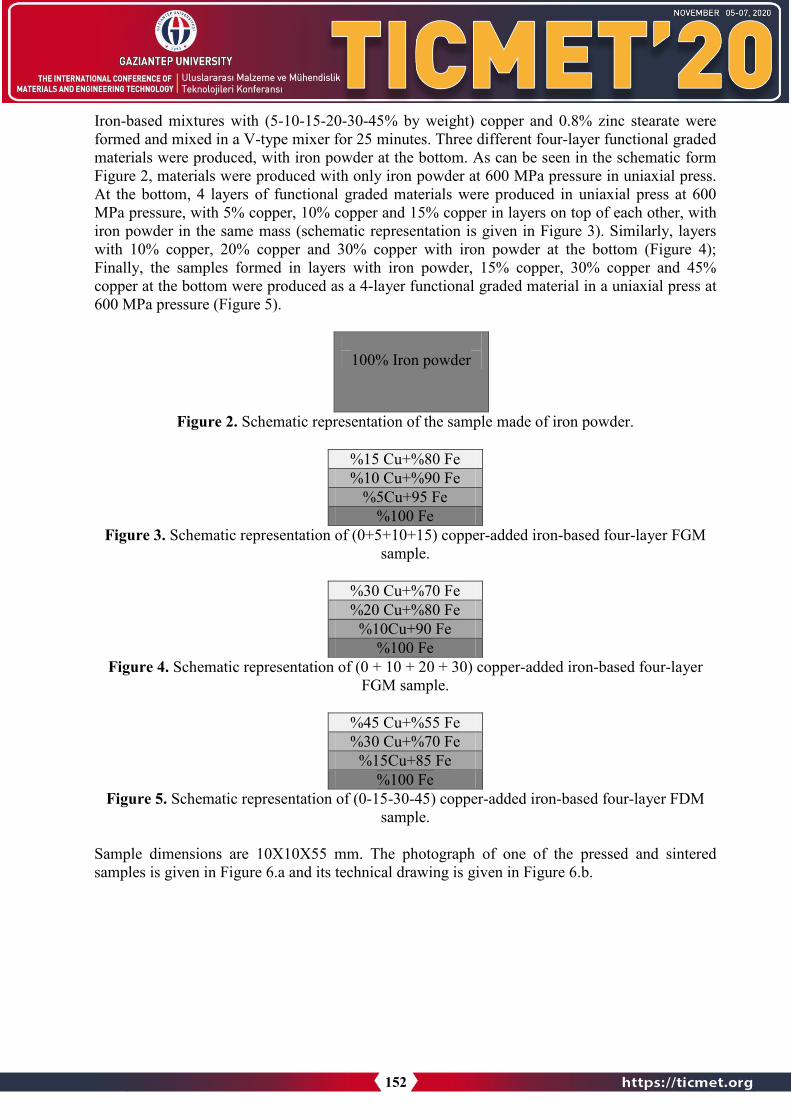
Iron-based mixtures with (5-10-15-20-30-45% by weight) copper and 0.8% zinc stearate were formed and mixed in a V-type mixer for 25 minutes. Three different four-layer functional graded materials were produced, with iron powder at the bottom. As can be seen in the schematic form Figure 2, materials were produced with only iron powder at 600 MPa pressure in uniaxial press. At the bottom, 4 layers of functional graded materials were produced in uniaxial press at 600 MPa pressure, with 5% copper, 10% copper and 15% copper in layers on top of each other, with iron powder in the same mass (schematic representation is given in Figure 3). Similarly, layerswith 10% copper, 20% copper and 30% copper with iron powder at the bottom (Figure 4); Finally, the samples formed in layers with iron powder, 15% copper, 30% copper and 45% copper at the bottom were produced as a 4-layer functional graded material in a uniaxial press at 600 MPa pressure (Figure 5).
100% Iron powder
Figure 2. Schematic representation of the sample made of iron powder.
%15 Cu+%80 Fe %10 Cu+%90 Fe
%5Cu+95 Fe %100 Fe
Figure 3. Schematic representation of (0+5+10+15) copper-added iron-based four-layer FGM sample.
%30 Cu+%70 Fe %20 Cu+%80 Fe
%10Cu+90 Fe %100 Fe
Figure 4. Schematic representation of (0 + 10 + 20 + 30) copper-added iron-based four-layer FGM sample.
%45 Cu+%55 Fe %30 Cu+%70 Fe
%15Cu+85 Fe %100 Fe
Figure 5. Schematic representation of (0-15-30-45) copper-added iron-based four-layer FDM sample.
Sample dimensions are 10X10X55 mm. The photograph of one of the pressed and sintered samples is given in Figure 6.a and its technical drawing is given in Figure 6.b.
152

Figure 6.a) Photograph of a sintered sample, b) Dimensions of the samples
The pressed samples were pre-sintered at 600 ° C for 30 minutes in argon environment andsintered at 1120 ° C for 30 minutes in argon environment to obtain functionally graded materials.The electrical resistances of the samples were measured with the Hioki 3541 Electrical Resistance Meter. Density measurements of the samples were measured with Archimedes Scale in accordance with ASTM B962-08 standard. Rockwell-B hardness measurements of the samples were carried out in BMS 200 RB brand device with 981 Newton force in accordance with ASTM E18-12 standard. Vickers hardness measurements of the samples were made in accordance with ASTM: E384-11e1 standard by applying a 50 g load for 10 seconds in the Future-Tech FM-700 micro hardness tester. Three point bending tests of the samples in Schimadzu brand Universal Tensile-Compression Test device are performed at max. 44 mm support distance and 10 mm / min compression speed. regression values were determined. Samples were cut with Struers Labotom-3 brand precision cutting device, then sanded with waterabrasives in different grain sizes, and then polished with 3 and 1 micron diamond solution on the felt. After the polishing process, the samples were etched in 3% Nital (3% Nitric Acid-97%Ethanol) solution, and the microstructure images were taken with Nicon Eclipse LV150 brand optical microscope. Images of the broken parts of the samples were taken at differentmagnifications in the Zeiss Brand Gemini 500 Model Scanning Electron Microscope in MCBÜDEFAM.
3. Results and DiscussionThe electrical resistance measurement results of the samples produced with layers consisting ofiron powder and iron + copper powder containing different amounts of copper are given inFigure 7.
Figure 7. Electrical resistance measurement results
0
0,5
1
1,5
2
2,5
%100 Iron Powder %(5+10+15) Cu+FePowder
%(10+20+30) Cu+FePowder
%(15+30+45) Cu+FePowder
Electric Resistance
153

The density values of these samples measured with Archimedes principle are given in Figure 8.
Figure 8. Density measurement results.
Rockwell B hardness measurement results are given in Figure 9.
Figure 9. Rockwell-B hardness measurement results (HRB)
Total copper powder ratios of functionally graded samples were calculated as 10%, 20% and 30%.
6,756,8
6,856,9
6,957
7,057,1
7,157,2
7,25
%100 Iron Powder %(5+10+15) Cu+FePowder
%(10+20+30) Cu+FePowder
%(15+30+45) Cu+FePowder
Density
0
10
20
30
40
50
60
70
80
0 5 10 15 20 30 45
Rockwell-B Hardness Results
%100 Iron Powder HRB %(5+10+15) Cu+Fe Powder HRB
%(10+20+30) Cu+Fe Powder HRB
154

Figure 10. Three Point Bend Test Results
The microstructure photographs of the broken surfaces of the samples formed in the three-point bending test are given in Figure 11.
Figure 11. Optical Microscope images of the broken surfaces of the samples: a) The sample produced from iron powder, b)% (0 + 5 + 10 + 15) of the copper added iron based FDM sample,
c)% (0 + 10 + 20 + 30)% copper added iron-based FGM sample, d) % (0 + 15 + 30 + 45)% copper-added iron-based FGM sample.
The optical microscope images taken by polishing the sections of the samples are given in Figure 12.
0100200300400500600700800900
1000
%100 Iron PowderMax. Stress MPa
%(5+10+15) Cu+FePowder Max. Stress
MPa
%(10+20+30) Cu+FePowder Max. Stress
MPa
%(15+30+45) Cu+FePowder Max. Stress
MPa.
Three Point Bending Test Results
155

Figure 12. Optical Microscope images of the sample sections: a) Sample made of iron powder, b)% (0 + 5 + 10 + 15)% (0 + 5 + 10 + 15)% Copper added iron based FGM sample, c)% (0 + 10 + 20 + 30) Copper added iron based FGM sample, d)% (0 + 15 + 30 + 45)% Copper added iron
based FGM sample.
SEM images of all samples are given in Figure 13-16.
Figure 13. SEM image of the sample containing 100% iron powder .
156
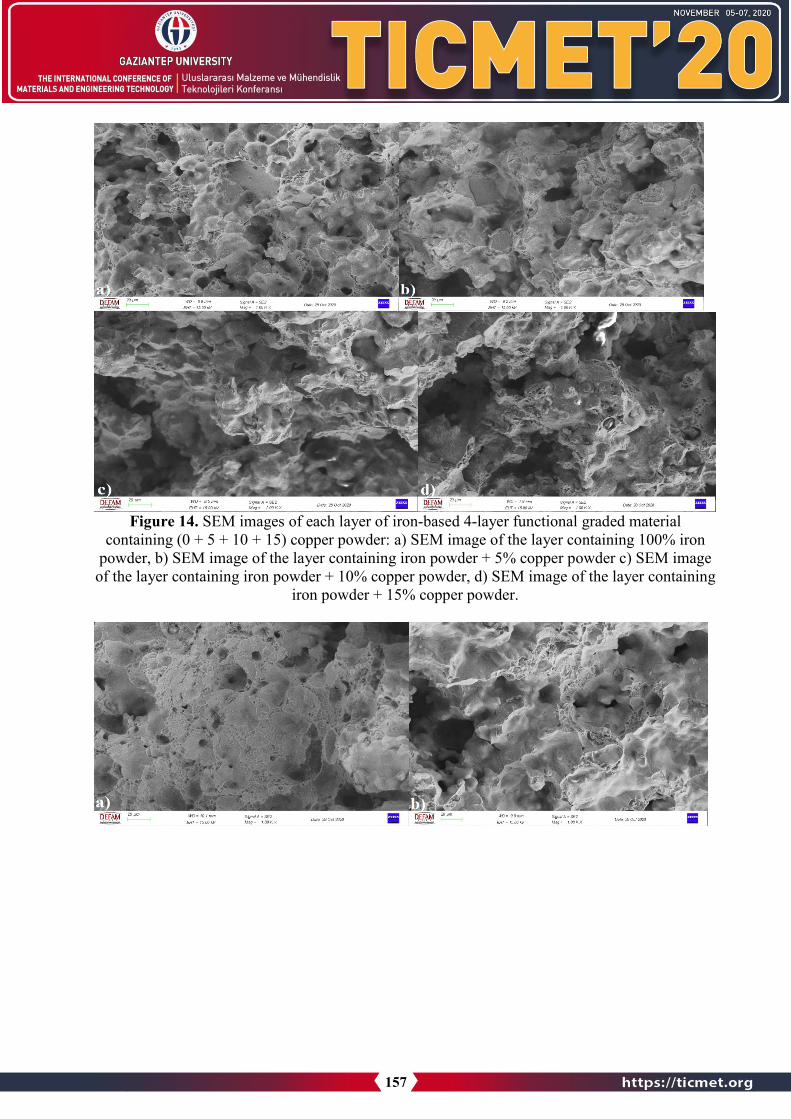
Figure 14. SEM images of each layer of iron-based 4-layer functional graded material containing (0 + 5 + 10 + 15) copper powder: a) SEM image of the layer containing 100% iron
powder, b) SEM image of the layer containing iron powder + 5% copper powder c) SEM image of the layer containing iron powder + 10% copper powder, d) SEM image of the layer containing
iron powder + 15% copper powder.
157
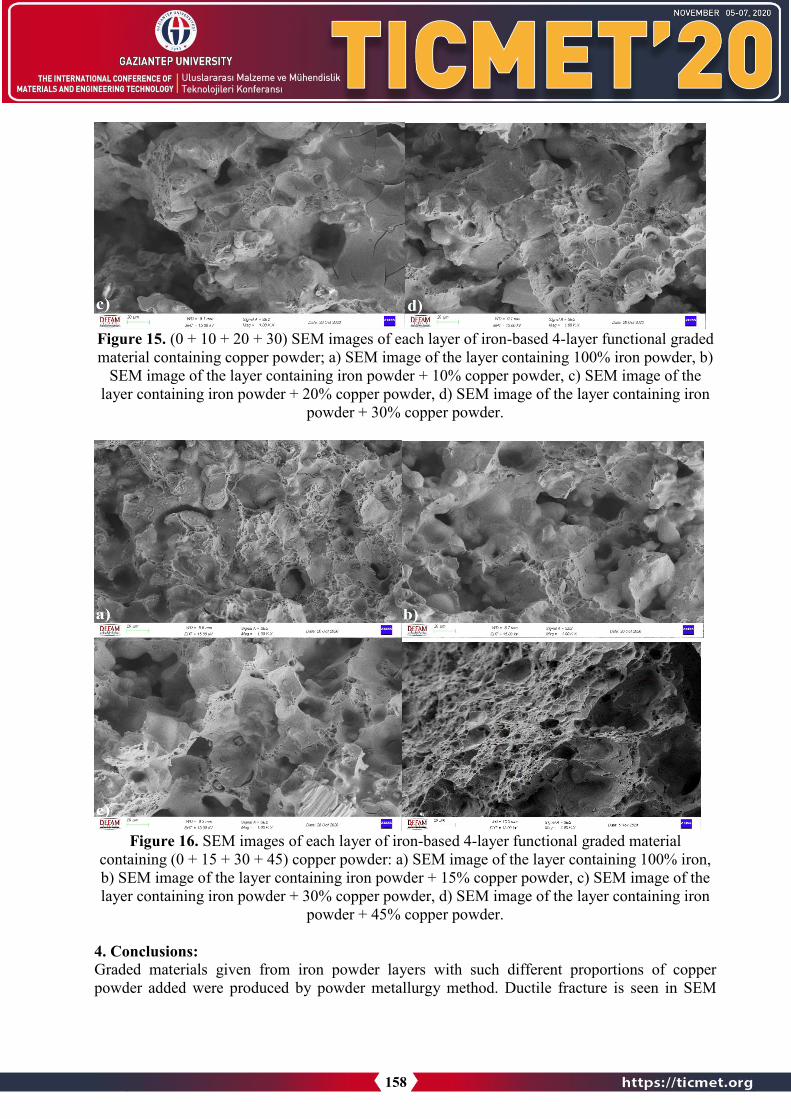
Figure 15. (0 + 10 + 20 + 30) SEM images of each layer of iron-based 4-layer functional graded material containing copper powder; a) SEM image of the layer containing 100% iron powder, b)
SEM image of the layer containing iron powder + 10% copper powder, c) SEM image of the layer containing iron powder + 20% copper powder, d) SEM image of the layer containing iron
powder + 30% copper powder.
Figure 16. SEM images of each layer of iron-based 4-layer functional graded material containing (0 + 15 + 30 + 45) copper powder: a) SEM image of the layer containing 100% iron, b) SEM image of the layer containing iron powder + 15% copper powder, c) SEM image of thelayer containing iron powder + 30% copper powder, d) SEM image of the layer containing iron
powder + 45% copper powder.
4. Conclusions:Graded materials given from iron powder layers with such different proportions of copperpowder added were produced by powder metallurgy method. Ductile fracture is seen in SEM
158

photographs of the fractured surfaces of the samples in the three point bending tests. It wasobserved that as the copper ratio increased, the electrical resistance decreased and the density increased. (5 + 10 + 15) % Cu + Fe in Rockwell B hardness structure and 3 point bending test results; It was observed that the strength and hardness values of the materials containing (10 + 20 + 30) % Cu + Fe increased. It was observed that these values decreased in those who used (15 + 30 + 45) % Cu + Fe.
References: 1. Naebe, M., Shirvanimoghaddam, K., Functionally graded materials: A review of fabrication
and properties, Applied Materials Today, 2016, 5, 223-245.2. Saleh, B., Jiang, J., et all., 30 Years of functionally graded materials: An overview of
manufacturing methods, Applications and Future Challenges, Composites Part B, 2020, 201,108376.
3. Loh, G.H., Pei, E., et all., An overview of functionally graded additive manufacturing,Additive Manufacturing, 2018, 23, 34-44.
4. Zhang, C., Chen, F., Additive manufacturing of functionally graded materials: A review,Materials Science & Engineering A, 2019, 764, 138209.
5. Gupta, A., Talha, M., Recent development in modeling and analysis of functionally gradedmaterials and structures, Progress in Aerospace Sciences, 2015, 79, 1-14.
6. Craveiro, F., Nazarian,S., et all., An automated system for 3D printing functionally gradedconcrete-based materials, Additive Manufacturing, 2020, 33, 101146
7. Chen, Y., Liou, F., Additive Manufacturing of Metal Functionally Graded Materials: AReview, Proceedings of the 29th Annual International Solid Freeform FabricationSymposium – An Additive Manufacturing Conference Reviewed Paper, 2018, 1215-1231.
8. Çivi, C., Tahralı, N., Atik, E., Reliability of mechanical properties of induction sintered ironbased powder metal parts, Materials & Design, 2014, 53, 383-397.
9. Erdem, M. A., Effect of C Content on Microstructure and Mechanical Properties of Nb-VAdded Microalloyed Steel Produced by Powder Metallurgy, European Journal of Scienceand Technology, 2016, 5(9), 44-47.
10. Gökçe, A., Development and Characterization of Mg-Sn Powder Metallurgy Alloy,Academic Platform Journal of Engineering and Science, 2020, 8(1), 112-119.
11. Atik, E., Çivi, C., Kökey, C., Eyici, G., Joining of Powder Metal Parts with Steel Parts byInduction Sintering Method, Çukurova University Journal of the Faculty of Engineering andArchitecture, 2016, 31(1), 117-122.
12. Yıldırım, M., Çelebi, A., The Effect of Silicon Carbide (SIC) Reinforcement on MechanicalProperties in Iron Based Powder Metal Composites, Hezarfen International Congress ofScience, Mathematics and Engineering, 2019, 639-653.
13. Çivi, C., Atik, E., Effect of the Sintering Temperature to Mechanical Properties of Fe BasedCopper and Graphite Containing Materials, CBU J. of Sci., 2017, 13(2), 467-472.
14. Casagrande Paim, T., et all., Evaluation of in vitro and in vivo biocompatibility of ironproduced by powder metallurgy, Materials Science and Engineering: C, 2020, 115, 111129
15. Gülsoy, H.Ö., Enhancing the wear properties of iron based powder metallurgy alloys byboron additions, Materials and Design, 2007, 28, 2255–2259
16. Tekeli, S., Güral, A., Dry sliding wear behaviour of heat treated iron based powdermetallurgy s teels with 0.3% Graphite + 2% Ni additions, Materials and Design, 2007, 28,1923–1927.
17. Mussatto, A., Evaluation via powder metallurgy of nano-reinforced iron powders developedfor selective laser melting applications, Materials & Design, 2019, 182, 108046
159

18. Tan, L., Wang, Z., Li, Y., Liu, Y., Liu, F., Strengthening the bimodal-grained powdermetallurgy ferritic steels with Cu addition by aging hardening, Materials Science andEngineering: A, 2021, 800, 140312
19. Çivi, C., Atik, E., The effect of inductive sintering to iron based powder metal parts, Journalof Alloys and Compounds, 2018, 753, 517-524.
20. Avşar, E., et all., “Joining of ıron based powder metallurgy parts with sintering”, J. Fac.Eng. Arch. Gazi Univ, 2010, 25(4), 713-718.
21. Güler, O., Varol, T., Alver, Ü., Çanakçı, A., The effect of flake-like morphology on thecoating properties of silver coated copper particles fabricated by electroless plating, Journalof Alloys and Compounds, 2019, 782, 679-688.
22. Ankit., Kumar, V., Mishra, A., Mohan, S., Singh K.K., Mohan, S., The effect of titaniumcarbide particles on microstructure and mechanical properties of copper/graphite compositesprepared by flake powder metallurgy route, Materials Today: Proceedings, 2020, 26, 1140–1144.
23. Varol, T., Çanakçı, A., The effect of type and ratio of reinforcement on the synthesis andcharacterization Cu-based nanocomposites by flake powder metallurgy, Journal of Alloysand Compounds, 2015, 649, 1066-1074.
24. Satishkumar, P., Mahesh, G., Meenokshi, R., Viyayan, S.N., Tribological characteristics ofpowder metallurgy processed Cu- WC/SiCmetal matrix composites, Materials Today,Proceedings, 2020, xxx, xxx.
160

INVESTIGATION OF MATERIAL SURFACE QUALITY IN DRY AND WATER-ASSISTED CUTTING WITH FIBER LASER
MUHAMMED PAKSOY 1, MAHMUT FURKAN KALKAN1, NECİP FAZIL YILMAZ *1, HAKAN ÇANDAR1
1 Gaziantep University, Engineering Faculty, Mechanical Engineering Department, Gaziantep, TURKEY.
Abstract
Laser cutting is one of most common process on sheet cutting applications. Fiber laser, a new generation laser type, benefits from many aspects in terms of high power solid state laser cuttingcompared to conventional CO2 lasers. Nevertheless, surface quality is an important problem in laser cutting process. In this study, fiber laser cutting operations with dry and water-assistedlayer conditions were performed on stainless steel and brass sheets. During flowing water layer cutting operations, better surface quality and less roughness were obtained. Heat effected zone was smaller than dry laser cutting.
Keyword: Laser Cutting, Fiber Laser, Surface Quality, Water Assisted Cutting
1. IntroductionLaser processing is an important special cutting technology. It has many advantages compared totraditional manufacturing processes and it is widely preferred in many industrial fields.In laser cutting technology, the cutting quality depends on laser properties, cutting parametersand thermo-physical properties of material. The laser parameters include its wavelength, mode ofoperation (continuous (CW) or pulsed) and laser spot size at the processed material. The processparameters contain cutting speed and assisted medium. The assist medium mostly used is eitherany inert gas such as N2 and Ar, or reactive gas like O2, popular in cutting ferrous materials. Thecutting quality depends on sheet thickness, thermal conductivity, density, specific heat andviscosity of melt [1].
In laser processing operations, generally thermal defects and burrs happen in the cutting surface for short duration of laser interaction as the process involves with intense heating of metal in a narrow area [2].
The main defects related to laser cutting are; large kerf, taper cut, high dross adhesion, poor cut surface and large heat affected zone (HAZ). Various scientific reports could be seen in previous studies on the laser cutting operation for different materials using different types of laser and its mode of operation to minimize these defects and surface quality [3].
Nowadays, many approaches of water assisted laser cutting have been executed by some researchers, such as under- water cutting [4], oxygen or gas assisted under water cutting [5] and
161

Figure 1. Experimental Setup
water micro-jet guided cutting [6]. Addition of water in laser cutting has been investigated to show many advantages over conventional gas assisted laser cutting. It provides more effective cooling of work-piece and ejection of material, quick removal of debris by water, occurring of less burr and smaller heat effected zone [7]. When water-assisted laser cutting is compared to conventional (gas assisted) dry cutting in laser operation, it is observed narrow kerf, lower cutting surface roughness, less dross and smaller HAZ compared with dry cutting [8].
2. Materials and MethodsA fiber laser having a power of 150 W is used in these experiments. Stainless steel and brass sheets which have thickness of 1 mm were firstly processed at dry condition in Figure 1. In the second cutting operations, water flow was sent onto cutting surface. Then circle shaped cutting operations were performed at wet condition. The all samples were examined by a Scanning Electron Microscope (SEM).
3. Results and DiscussionSamples were cut out from stainless steel and brass thin sheets which have 1 mm of thickness. Inorder to display the surface characteristic of the cutting surface, the cutting surface of theworkpieces were examined by using a scanning electron microscope. In two different conditionwere tried while the workpieces were cutting. Firstly, stainless steel and brass sheets were cutdirectly by fiber laser in dry condition. Then the other workpieces were replaced in a waterstream. The aim of the water stream was to observe the effect of a coolant on cutting area and tochange heat affected zone during cutting operation.
162
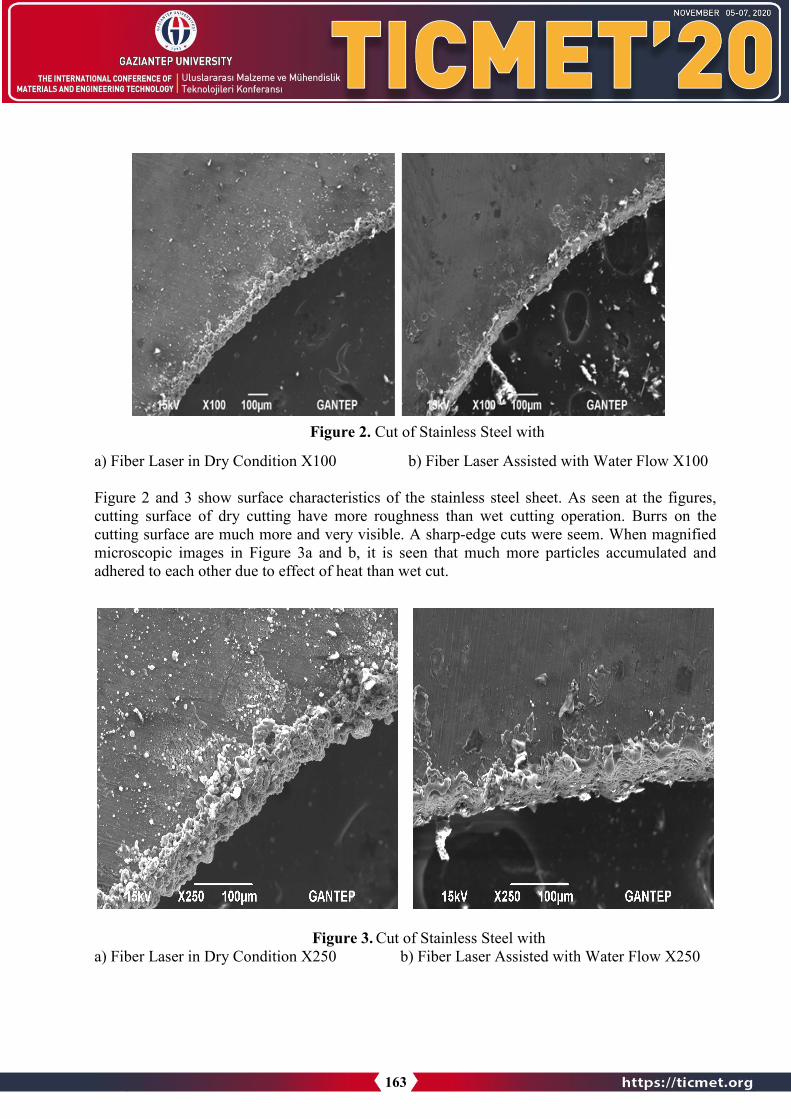
Figure 2. Cut of Stainless Steel with
a) Fiber Laser in Dry Condition X100 b) Fiber Laser Assisted with Water Flow X100
Figure 2 and 3 show surface characteristics of the stainless steel sheet. As seen at the figures, cutting surface of dry cutting have more roughness than wet cutting operation. Burrs on the cutting surface are much more and very visible. A sharp-edge cuts were seem. When magnified microscopic images in Figure 3a and b, it is seen that much more particles accumulated and adhered to each other due to effect of heat than wet cut.
Figure 3. Cut of Stainless Steel with a) Fiber Laser in Dry Condition X250 b) Fiber Laser Assisted with Water Flow X250
163

Cutting quality is low in dry cutting operation. Otherwise, in laser cutting assisted with water,the cutting surface has less roughness. The wet cut surface is clearer than dry laser cut. The cutting surface has a net shape. Dross amount is lower. When we compared two cutting operations, cooling effect of the water has an important contribution and advantage on lasercutting. Cooling with water prevents adhesion of the particles and provides clean and precision cut. Heat affected zone (HAZ) was reduced. As a result of this, cutting quality was improved.
Figure 4. Cut of Brass with
a) Fiber Laser in Dry Condition X100 b) Fiber Laser Assisted with Water Flow X100
Figure 5. Cut of Brass with
a) Fiber Laser in Dry Condition X250 b) Fiber Laser Assisted with Water Flow X250
164
Figure 4 and 5 presents the cutting of brass sheet with fiber laser processing in dry and assistedwater flow. In this experiment, the same procedures were applied as in stainless steel processing.When cut samples were examined under scanning electron microscope (SEM). In wet cutting,heat affected zone is narrow, less dross is observed. Dry laser cut surface has larger heat affected zone as seen similar in stainless steel cut. Also melted particles and burrs are accumulated on the cutting surface.
4. ConclusionsIn this study, cutting of stainless steel and brass sheets with a fiber laser were investigated. Dry and water assisted laser cutting were executed. Kerf characteristic, dross, heat affected zone and surface roughness of materials were displayed and compared. Microscopic images show thatwater has an enormous effect on the cutting surface quality and characteristics during laser cutting process. High precision cutting was obtained by assisting water. Water flow on workpieces reduced roughness, heat effected zone. Less burrs and dross were observed for both materials. An improvement is observed in cutting quality by using water. One step ahead of this study is how to design different water assisted laser cutting processes.
References 1. Yuvraj K. M., Suvradip M., Ashish K. N., An investigation on co-axial water-jet assisted
fiber laser cutting of metal sheets, Optics and Lasers in Engineering, Volume 77, 2016,Pages 203-218.
2. Suvradip M., Yuvraj K.M., Subhransu R., Shailesh K., Dinesh K. S., Ashish K., Development andparametric study of a water-jet assisted underwater laser cutting process, International Journalof Machine Tools and Manufacture, 2013, (68) 48-55.
3. Chaudhari P.,Patel D. M., Parametric effect of fiber laser cutting on surface roughness in5mm thick mild steel sheet (IS-2062). International Journal of Engineering Research andTechnology, 2012, (6)1–6.
4. Ikeda T., Ozawa K., Kutsuna M., Waterjet guided laser processing for wafer, Welding in World,2003, (47)3.
5. Sakka T., Iwanaga S., Ogata Y. H., Laser ablation at solid–liquid interfaces: an approachfrom optical emission spectra, The Journal of Chemical Physics 2009; 112(19), 8645–53.
6. Richerzhagen B., Chip singulation process with a water-jet guided laser, Solid StateTechnology, 2001, 44(4), 25–28.
7. Tangwarodomnukun V., Wang J., Huang C.Z., Zhu H.T., An investigation of hybrid laser waterjetablation of silicon substrate. Journal of Machine Tool Manufacturing, 2012, 56, 39-49.
8. Jarosz, K., Löschner, P., & Niesłony, P., Effect of cutting speed on surface quality and heat-affected zone in laser cutting of 316L stainless steel. Procedia Engineering, 2016, 149, 155-162.
165

THERMOMECHANICAL SIMULATION ANALYSIS OF INCONEL 718 ALLOY PARTS PRODUCED BY ADDITIVE MANUFACTURING
MUSTAFA KAS *1, OGUZHAN YILMAZ 1, CAN GULER1, TANER KARAGOZ2,3, METIN CALLI2,3
1Gazi University, Engineering Faculty, Mechanical Engineering Department, Ankara, Turkey 2Uludag University, Engineering Faculty, Mechanical Department, Bursa, Turkey
3Coskunöz Kalıp Makina A.S, Bursa, Turkey
Abstract
Additive manufacturing (AM) can be considered as new technology. It is suitable to build complex shaped parts and also repair damaged or worn ones. However, it comes with complexprocesses in order to produce the desired geometry. Due to the thermal cycle of AM process, residual stresses appear throughout the part which causes distortions on the geometry. These distortions affect the accuracy of the produced part compared to the designed model. In order to lower residual stresses which leads to lower distortions, process parameters should be optimized.As with all additive manufacturing methods, there are many factors that affect quality in theDED process. The most important parameters that affect the process are raw powder, gas, powder feed rate, laser power, spot size, and elapsed time between layers. The laser's scanning strategy and successive layer wait time between layers can control elapsed time between layers. Investigation of the temperature distribution of these parameters and their effects on mechanical properties were examined. This optimization process is to be made with simulations because of the reasons that experimental studies take longer times and not cost-effective. A wall structure geometry made from Inconel718 powder was investigated. Studies are indicating that parameter optimization has a crucial role in the quality of the part and the most appropriate process results have been discussed.
Keyword: Direct energy deposition, Toolpath generation, Thermomechanical simulation
1. IntroductionAdditive manufacturing is a recent manufacturing technology which enables producing complexshaped parts that cannot be produced with traditional manufacturing methods. Additivemanufacturing acquires the whole geometry with material addition layer by layer. Using thismethod, complex parts can be achieved and this allows them to make topology optimization ondesigns. Powder bed fusion, directed energy deposition and wire-arc additive manufacturing arethe three main subjects of this process. This paper will be focusing on directed energy deposition(DED) method. In DED, a nozzle and a laser attached 3-axis head and a substrate (build plate)are the main components as depicted in Figure 1. Powder flows through the nozzle andencounters with laser power which melts the powder and deposits on the table. This processrepeats layer by layer until the whole shape is obtained. The part that meant to be produced can
166

be made from completely same material or partly from different materials in order to achieve required specifications at different sections.
Figure 1. Schematic view of DED process [1]
Previous studies show that carefully prepared DED processes are able to build high-quality products that can be used in aerospace applications. For example, a combustion chamber of a helicopter engine (Figure 2) was built with laser metal deposition (LMD) method and the tests showed the part achieved %99.5 wall density across all sections. Dimensions were 90 mm height and 300 mm in diameter. With the high deposition rate advantage of DED, the part build-timeonly took 7.5 hours [2].
Figure 2. Combustion chamber of an Inconel 718 helicopter engine [2]
Apart from the manufacturing, DED is an important repair method for damaged or worn parts and this feature makes it valuable for the industry. High-cost parts such as blisks suffer from airfoil leading edge erosion. Instead of changing it, the repair process costs much lower and it prevents material waste (Figure 3) [3].
Figure 3. T700 blisk repair using LENS (URL3)
167
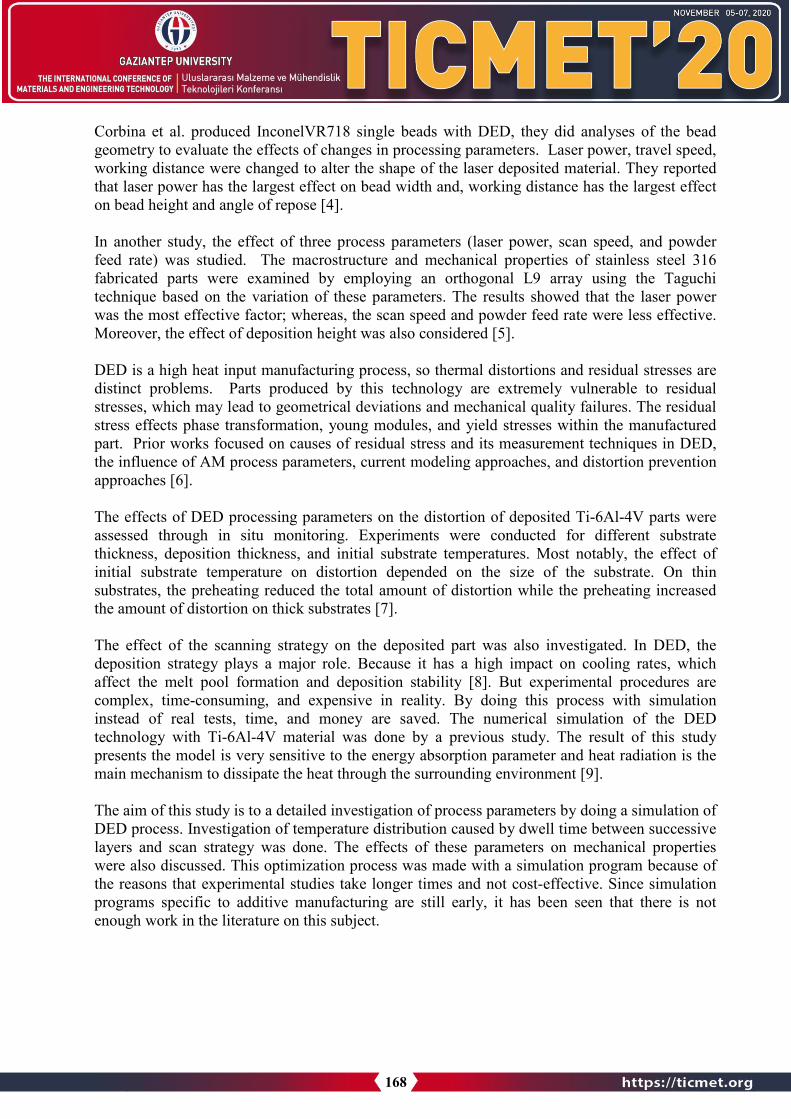
Corbina et al. produced InconelVR718 single beads with DED, they did analyses of the beadgeometry to evaluate the effects of changes in processing parameters. Laser power, travel speed, working distance were changed to alter the shape of the laser deposited material. They reported that laser power has the largest effect on bead width and, working distance has the largest effect on bead height and angle of repose [4].
In another study, the effect of three process parameters (laser power, scan speed, and powder feed rate) was studied. The macrostructure and mechanical properties of stainless steel 316 fabricated parts were examined by employing an orthogonal L9 array using the Taguchi technique based on the variation of these parameters. The results showed that the laser powerwas the most effective factor; whereas, the scan speed and powder feed rate were less effective. Moreover, the effect of deposition height was also considered [5].
DED is a high heat input manufacturing process, so thermal distortions and residual stresses are distinct problems. Parts produced by this technology are extremely vulnerable to residualstresses, which may lead to geometrical deviations and mechanical quality failures. The residual stress effects phase transformation, young modules, and yield stresses within the manufactured part. Prior works focused on causes of residual stress and its measurement techniques in DED, the influence of AM process parameters, current modeling approaches, and distortion prevention approaches [6].
The effects of DED processing parameters on the distortion of deposited Ti-6Al-4V parts were assessed through in situ monitoring. Experiments were conducted for different substrate thickness, deposition thickness, and initial substrate temperatures. Most notably, the effect of initial substrate temperature on distortion depended on the size of the substrate. On thin substrates, the preheating reduced the total amount of distortion while the preheating increased the amount of distortion on thick substrates [7].
The effect of the scanning strategy on the deposited part was also investigated. In DED, the deposition strategy plays a major role. Because it has a high impact on cooling rates, which affect the melt pool formation and deposition stability [8]. But experimental procedures are complex, time-consuming, and expensive in reality. By doing this process with simulation instead of real tests, time, and money are saved. The numerical simulation of the DED technology with Ti-6Al-4V material was done by a previous study. The result of this study presents the model is very sensitive to the energy absorption parameter and heat radiation is the main mechanism to dissipate the heat through the surrounding environment [9].
The aim of this study is to a detailed investigation of process parameters by doing a simulation of DED process. Investigation of temperature distribution caused by dwell time between successive layers and scan strategy was done. The effects of these parameters on mechanical properties were also discussed. This optimization process was made with a simulation program because of the reasons that experimental studies take longer times and not cost-effective. Since simulation programs specific to additive manufacturing are still early, it has been seen that there is not enough work in the literature on this subject.
168
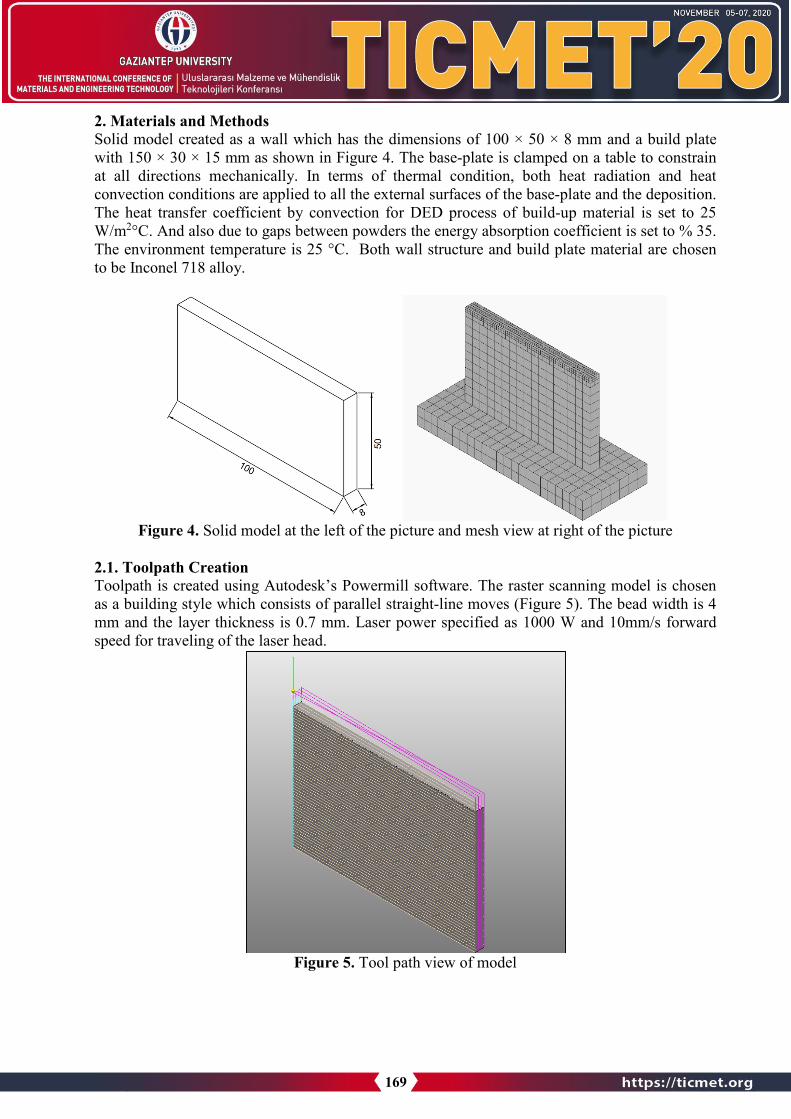
2. Materials and MethodsSolid model created as a wall which has the dimensions of 100 × 50 × 8 mm and a build plate with 150 × 30 × 15 mm as shown in Figure 4. The base-plate is clamped on a table to constrain at all directions mechanically. In terms of thermal condition, both heat radiation and heat convection conditions are applied to all the external surfaces of the base-plate and the deposition. The heat transfer coefficient by convection for DED process of build-up material is set to 25W/m2°C. And also due to gaps between powders the energy absorption coefficient is set to % 35. The environment temperature is 25 °C. Both wall structure and build plate material are chosen to be Inconel 718 alloy.
Figure 4. Solid model at the left of the picture and mesh view at right of the picture
2.1. Toolpath Creation Toolpath is created using Autodesk’s Powermill software. The raster scanning model is chosenas a building style which consists of parallel straight-line moves (Figure 5). The bead width is 4 mm and the layer thickness is 0.7 mm. Laser power specified as 1000 W and 10mm/s forward speed for traveling of the laser head.
Figure 5. Tool path view of model
169

2.2. SimulationIn order to obtain the geometry with the desired features, it is necessary to determine process parameters appropriately. Because each parameter must be optimized particularly, many changesneed to be done, and each change is made to assess the effects of parameters on part features. By producing a new part becomes both a very costly and long-lasting process. To prevent this situation, software that simulates the production process has been developed. In this way, beforethe parts are produced, the most optimized parameters are found by means of simulations, as a result of this optimization, the parts are produced and both the cost and the time spent are reduced. Netfabb Simulation Utility providing everything that is needed to run a process simulation and it is compatible with the Powermill software that is used to prepare the toolpath. Simulation has been made with the following parameters as given in Table 1.
Table 1. Input data for simulation Input Value Material Inconel 718 Absorption Efficiency %35 Build Plate 150 × 30 × 15 mm Convection Coefficient 25 (W/m2 °C) Ambient Temperature 25 °C Laser Power 1000
3. Results and DiscussionSimulation models can provide visually powerful tools that can easily process many complexgeometries and users will gain significant information to explore the process and design validation. It also used to find the optimal process parameter with a high level of mechanical properties. This approach has been taken aiming to improving mechanical properties of designwith changing time between layers with two scenarios; changing scan strategy and changing pulse time.
3.1. Comparison of uni-directional and bi-directional scan strategy Simulations have been run and compared two different scanning strategy, for a given process parameter. Figures 6-8, show respectively Cauchy stress, displacement, and temperature distribution for uni-directional and bi-directional scan strategy. Cauchy stress, which gives information about residual stress, decreased by 3 MPa in XX plane when the scanning strategy changed from bi-direction to uni-direction. In addition, as time is increased for scanning successive paths, the global temperature on the part decreased by 27 °C. Thermal distortion or displacement resulting from the decrease in temperature also decreased by 11%. The general reason for these situations is thought to be the decrease of the local temperature penetrating the model as a result of the increase in the waiting time between the scanning passes.
170

Figure 6. Cauchy Stress on XX Plane a) Uni-directional b) Bi-Directional
Figure 7. Maximum Displacement a) Uni-directional b) Bi-Directional
Figure 8. Maximum Temperature a) Uni-directional b) Bi-Directional
171

Table 2. Output data of simulation Output Uni-Directional Toolpath
Analysis Bi-Directional Toolpath Analysis
Cauchy Stress XX 642 MPa 654 MPa Cauchy Stress YY 252 MPa 271 MPa Cauchy Stress ZZ 425 MPa 434 MPa Cauchy Stress XY 333 MPa 293 MPa Cauchy Stress XZ 415 MPa 430 MPa Cauchy Stress YZ 320 MPa 320 MPa Displacement 0.48 mm 0.54 mm Temperature 820 °C 847 °C
Simulation results are given in Table 2. Uni-directional scan strategy gives better thermomechanical properties due to less temperature build-up effect. The uni-directional travel leads to additional cooling which prevents large heat accumulation and high stress/strain during the DED process. Depend on the deposition direction, the elapsed time between the laser paths, inherently dwell time for the solidification of the molten pool is changed. Residual stress can be reduced by controlling the interlayer cooling time. It can thus be concluded that longer interlayer cooling time not only produced less distortion but also lowered residual stress.
3.2. Comparison of bi-directional toolpath strategy with different pulse times Simulations have been run and compared two different pulse time, for a given process parameter.Figures 9-11, show respectively Cauchy stress, displacement, and temperature distribution for 60 s and 30 s pulse time. It is observed that Cauchy stress, which gives information about residualstress, decreased by 3 MPa in XX plane when the time given for the pass between the scanning paths was increased from the 30s to 60s. In addition, as the waiting time increased, the globaltemperature on the part decreased by 33°C. Thermal distortion or displacement resulting fromthe increase in temperature also decreased by 25%. The general reason for these situations is thought to be the decrease of the local temperature penetrating the model as a result of the increase in the waiting time between the scanning passes.
Figure 9. Cauchy Stress on XX Plane a) 60 second pulse time b) 30 second pulse time
172

Figure 10. Maximum displacement a) 60 second pulse time b) 30 second pulse time
Figure 11. Maximum Temperature a) 60 second pulse time b) 30 second pulse time
Simulation results are given in Table 3. 60s wait time gives better thermomechanical properties due to longer cooling rate. According to data acquired simulation results, it is observed that longer interlayer cooling time produces lower distortion and residual stress. Shortening the cooling can excessively increase the energy input into the system, particularly during continuous manufacturing. Overheating can consequently lead to undesirable remelting, poor surface finish, and poor dimensional tolerances in the final part.
Table 3. Output data of simulation Output Bi-Directional 60 seconds
wait Toolpath Analysis Bi-Directional 30 seconds wait Toolpath Analysis
Cauchy Stress XX 642 MPa 645 MPa Cauchy Stress YY 271 MPa 273 MPa Cauchy Stress ZZ 434 MPa 448 MPa Cauchy Stress XY 293 MPa 304 MPa Cauchy Stress XZ 430 MPa 438 MPa Cauchy Stress YZ 320 MPa 320 MPa Displacement 0.54 m 0.72 mm Temperature 847 °C 880 °C
173
4. ConclusionsIn
this study, a proper simulation model for DED process is built. The main idea of this
simulation is to effectively predict the temperature and mechanical strain. More specifically,
the
main findings of the research can be divided into two groups and listed as follows. At
first,
regarding the geometry of the deposited metal, the effect of scanning strategy, and secondly pulse time between layers.
• Changing scanning strategy from bi-directional to uni-directional, the maximum temperatureafter process decreased to from 847°C to 820°C and also amount of displacement is reduced0.06 mm.
• Changing pulse time when using same scanning strategy affects the mechanical propertieswhich were improved with increasing pulse time from 30 s to 60 s. Cauchy stress which givesinformation about residual stress decreased 14 MPa.
As a result of simulating two different scanning strategies, it was seen that the unidirectionalscanning strategy provides better thermomechanical properties. The thermal disturbances caused by the heating and cooling processes, as well as the shrinkage phenomena emerging during the sintering cycle of the powder material injected into the welding pool are capable of the possible quality defects of the manufactured part and the residual stresses generated by the production process.
Acknowledgments The
authors
would like to thank to TUBITAK, SMART EUREKA CLUSTER and EUREKA for
their support in the scope of the REMEDI research project. (Project no: Tübitak-Teydeb 9190007)
References 1.
URL1: Directed Energy Deposition (DED). Digital Alloys. https://www.digitalalloys.com/blog/directed-energy-deposition, 07.02 2020
2. URL 2: Hauser, C. Case Study: Laser Powder Metal Deposition Manufacturing of ComplexReal Parts. http://www.lortek.es/files/merlin/05-C_Hauser-TWI-Case-Study.pdf, 07.02.2020
3. URL 3: T700 blisk repair using LENS. OptomecLENS Blisk Repair Solution,http://www.optomec.com/wpcontent/uploads/2014/04/Optomec_LENS_Blisk_Repair_Datasheet.pdf, 07.02.2020
4. Corbina, D., Nassar, A., Reutzel E., Beese, A., Kistler, N., Effect of directed energydeposition processing parameters on laser deposited InconelVR718: External morphology,Journal of Laser Applications. 2007, 29, 2
5. Izadi, M., Farzaneh, A., Gibson, I., Rolfe, B., The Effect of Process Parameters andMechanical Properties of Direct Energy Deposited Stainless Steel 316, 28th AnnualInternational Solid Freeform Fabrication Symposium. August 7-9,2017, Austin, Texas,pp.1058-1067
6. Carpenter, K., Tabei, A., On Residual Stress Development, Prevention, and Compensationin Metal Additive Manufacturing, Materials. 2019, 13, 255
7. Corbina, D., Nassar, A., Reutzel E., Beese, A., Kistler, N., Allison, M., Michaleris, P.,Impact of Directed Energy Deposition Parameters On Mechanical Distortion of LaserDeposited, 26th Annual International Solid Freeform Fabrication Symposium. August 10-12,2015, Austin, Texas, pp. 670-679
174

8. Mazzucato, F., Aversa, A., Doglione, R., Valenta, A., and Lomvardi, M., Influence ofProcess Parameters and Deposition Strategy on Laser Metal Deposition of 316L Powder,Metals. 2019, 9(11), 1160
9. Chiumenti, M., Lin, X., Cerveral, M., Lei, W., Zheng, Y., Huang, W., Numerical simulationand experimental calibration of Additive Manufacturing by blown powder technology. PartI: thermal analysis, Rapid Prototyping Journal. 2017, 23(2), 448-463
175

VALIDATION OF MATERIAL MODEL AND MECHANISM OF MATERIAL REMOVAL IN ABRASIVE FLOW MACHINING
Adem Aksoy1* Omer Eyercioglu1, Kursad Gov2
1 Gaziantep University, Faculty of Engineering, Mechanical Engineering Department, Gaziantep, Turkey 2Gaziantep University, Faculty of Aeronautics and Astronautics, Aircraft and Aerospace Engineering
Department, Gaziantep, Turkey
ABSTRACT
Abrasive flow machining (AFM) is a non-traditional finishing method that is recently becoming popular. Increasing surface quality demands and developing manufacturing technologies need high cost and time. AFM process satisfies these demands in a short time period. In this study, a mathematical model for material removal for double-acting was presented. The material removals using 400 mesh size SiC abrasive for 20%, 40%, and 60% abrasive concentrations by weight were studied. The results of the experimental study thatwas previously done for Ti-6Al-4V alloy were compared with the results of the mathematical model presented in this study. The difference between the results of the presented model and experimental ones are very close to each other for all abrasive concentrations. By using the presented model, the AFM process parameters can be pre-determined according to the required final form.
Keywords: Abrasive Flow Machining, Surface finishing, surface cleaning, CFD modelling of AFM, AFM modelling
1. INTRODUCTIONAbrasive flow machining (AFM) is a non-traditional finishing method that is recentlybecoming popular. AFM method is successfully applied to medical, aircraft, aerospace, andother precision manufacturing areas. Increasing surface quality demands and developingmanufacturing technologies need high cost and time. AFM process satisfies these demands ina short time period. Complex shapes, holes, and surfaces can be easily by AFM method thanconventional methods.
The Abrasive Flow Machining process is performed by extrusion of the polymeric media between two reciprocating pistons in cylinders (Figure 1). The polymeric media contains abrasive particle, hydraulic oil, water, and a polymeric carrier. Media passes from the surface of the workpiece [1]. The surface is getting smoother and clean after AFM process. This process is effective for mostly the parts manufactured by wire electrical discharge machined (WEDM) surfaces [2].
Types of workpiece materials and material properties influence surface roughness after the process. The studies which are experienced on Ti-6Al-4V and AISI D2 hardened tool steel show that AFM process has better results on harder materials [3-4]. The residual asperities are getting smoother or entirely removed without any change in geometry by AFM method [5]. Viscosity, abrasive concentration, abrasive type, and mesh size are effective parameters in the
176

process. Abrasive media includes abrasive particles as silicon carbide (SiC) particles generally. Besides, aluminum oxide, boron carbide, or garnet is used as an abrasive particle. Astudy examined which is about AFM media parameters, the results showed that mediaviscosity is proportional to the abrasive concentration, the abrasive mesh size, and temperature. Viscosity is directly affected by the abrasive concentration and inversely affected the abrasive mesh and temperature. They also found that high viscosity provides a higher material removal rate (MRR) and better surface quality, i.e., less roughness [6].
Figure 1. Abrasive Flow Machine (AFM) model
Modeling is traditionally an effective method when designing and analyzing a product or a process and it is considered beneficial while designing improvements for increasing process performances. In the late 1980s, many efforts were done about a process mechanism and modeling of surface generation in the AFM operation [7]. The computational fluid dynamics (CFD) technique is one of the most popular approaches in the analysis of flow-based parameters and performances. Popular professional analysis tools including ANSYS FLUENT have been commonly used by various authors for analysis of manufacturing processes and their products [8].
Experimentations respecting modeling and simulation of the AFM process and its developments have also been reported [9]. Reports concluded that the characteristics of the flow properties along with experimental results on a simulation of media flow during the abrasive flow machining process. They used primary equations of the Maxwell model which define non-newtonian flow characteristics of the AFM media through the cylindrical workpiece. The interaction of abrasive particles and workpiece examined in a study that is applied to an analysis of finished surface and material removal [10]. They resulted that if the active number of abrasive grains per unit volume of media flow increases with percentage concentration of abrasives and reduction ratio, higher material removal and change in surface roughness can be reached. The ANSYS was used to develop the model of media flow during the AFM process and to evaluate the stresses and velocity distribution [11]. They developed a model for the media flow using FEM approach. Velocity contour and pressure contour distribution inside the workpiece can be obtained from CFD simulation. The velocity is
177
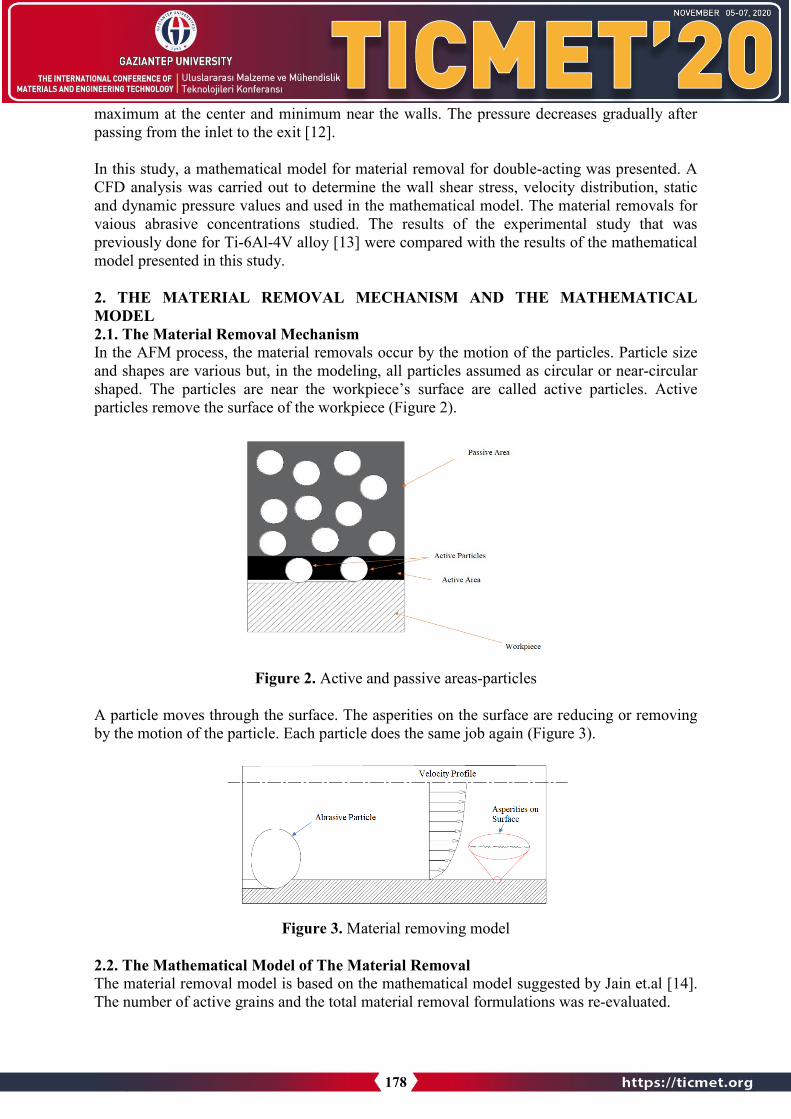
maximum at the center and minimum near the walls. The pressure decreases gradually after passing from the inlet to the exit [12].
In this study, a mathematical model for material removal for double-acting was presented. A CFD analysis was carried out to determine the wall shear stress, velocity distribution, static and dynamic pressure values and used in the mathematical model. The material removals for vaious abrasive concentrations studied. The results of the experimental study that was previously done for Ti-6Al-4V alloy [13] were compared with the results of the mathematical model presented in this study.
2. THE MATERIAL REMOVAL MECHANISM AND THE MATHEMATICAL MODEL 2.1. The Material Removal Mechanism In the AFM process, the material removals occur by the motion of the particles. Particle size and shapes are various but, in the modeling, all particles assumed as circular or near-circular shaped. The particles are near the workpiece’s surface are called active particles. Active particles remove the surface of the workpiece (Figure 2).
Figure 2. Active and passive areas-particles
A particle moves through the surface. The asperities on the surface are reducing or removing by the motion of the particle. Each particle does the same job again (Figure 3).
Figure 3. Material removing model
2.2. The Mathematical Model of The Material Removal The material removal model is based on the mathematical model suggested by Jain et.al [14]. The number of active grains and the total material removal formulations was re-evaluated.
178

Figure 4 (a) Scheme of a spherical grain (b) Simplified surface geometry
The force (F) acting on grain will produce it to pass through the surface as a Brinell ball acts as an indentation during the hardness test. When this grain is translated horizontally with a velocity, the plastically deformed zone beneath the surface will be inclined and give rise to upward flow thus forming a chip that is subsequently sheared from the surface. To obtain the actual diameter of abrasive from mesh size to millimeter
𝑑𝑑𝑔𝑔 = 28𝑀𝑀1,1 (1)
Indenting force F on a spherical grain of diameter (dg) is given by
𝐹𝐹 = 𝜎𝜎 𝜋𝜋𝜋𝜋𝑔𝑔2
4(2)
where σ is wall shear stress acting on one the grain. If ra is the radius of the projected area of indentation ∆A is the projected area, and Hw is the hardness of workpiece material, then
𝐹𝐹 = 𝐻𝐻𝑤𝑤∆𝐴𝐴 = 𝐻𝐻𝑤𝑤𝜋𝜋𝑟𝑟𝑎𝑎2 (3)
From the geometry of Fig. 4(a), radius, and depth of indentation (t) can be obtained as follows. From Eq. (3) radius of the projected area, a given as
𝑟𝑟𝑎𝑎 = � 𝐹𝐹𝑟𝑟𝐻𝐻𝑤𝑤𝜋𝜋
(4)
From the geometry of Fig. 4(b) by using the Pythagorean Theorem on ∆OAB the projected area ‘ra’ of the indent made is resulting from the depth of indentation (t)
𝑡𝑡 = 𝜋𝜋𝑔𝑔2− ��
𝜋𝜋𝑔𝑔2
4− 𝑟𝑟𝑎𝑎2� (5)
𝑟𝑟𝑎𝑎 = �𝑡𝑡�𝑑𝑑𝑔𝑔 − 𝑡𝑡� (6)
Substituting the value of ‘a’ from Eq. (4), into Eq. (5), depth of indentation (t)
179
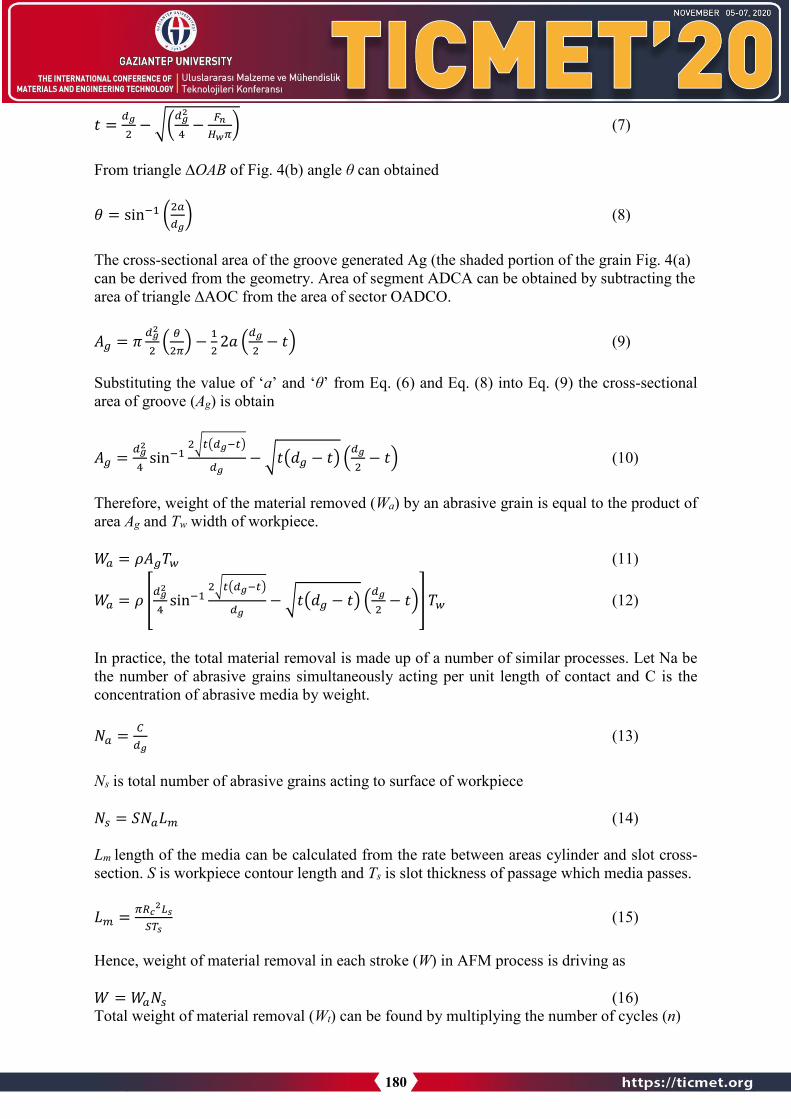
𝑡𝑡 = 𝜋𝜋𝑔𝑔2− ��
𝜋𝜋𝑔𝑔2
4− 𝐹𝐹𝑛𝑛
𝐻𝐻𝑤𝑤𝜋𝜋� (7)
From triangle ∆OAB of Fig. 4(b) angle θ can obtained
𝜃𝜃 = sin−1 �2𝑎𝑎𝜋𝜋𝑔𝑔� (8)
The cross-sectional area of the groove generated Ag (the shaded portion of the grain Fig. 4(a) can be derived from the geometry. Area of segment ADCA can be obtained by subtracting the area of triangle ∆AOC from the area of sector OADCO.
𝐴𝐴𝑔𝑔 = 𝜋𝜋 𝜋𝜋𝑔𝑔2
2� 𝜃𝜃2𝜋𝜋� − 1
22𝑎𝑎 �𝜋𝜋𝑔𝑔
2− 𝑡𝑡� (9)
Substituting the value of ‘a’ and ‘θ’ from Eq. (6) and Eq. (8) into Eq. (9) the cross-sectional area of groove (Ag) is obtain
𝐴𝐴𝑔𝑔 = 𝜋𝜋𝑔𝑔2
4sin−1
2�𝑡𝑡�𝜋𝜋𝑔𝑔−𝑡𝑡�
𝜋𝜋𝑔𝑔− �𝑡𝑡�𝑑𝑑𝑔𝑔 − 𝑡𝑡� �𝜋𝜋𝑔𝑔
2− 𝑡𝑡� (10)
Therefore, weight of the material removed (Wa) by an abrasive grain is equal to the product of area Ag and Tw width of workpiece.
𝑊𝑊𝑎𝑎 = 𝜌𝜌𝐴𝐴𝑔𝑔𝑇𝑇𝑤𝑤 (11)
𝑊𝑊𝑎𝑎 = 𝜌𝜌 �𝜋𝜋𝑔𝑔2
4sin−1
2�𝑡𝑡�𝜋𝜋𝑔𝑔−𝑡𝑡�
𝜋𝜋𝑔𝑔− �𝑡𝑡�𝑑𝑑𝑔𝑔 − 𝑡𝑡� �𝜋𝜋𝑔𝑔
2− 𝑡𝑡�� 𝑇𝑇𝑤𝑤 (12)
In practice, the total material removal is made up of a number of similar processes. Let Na be the number of abrasive grains simultaneously acting per unit length of contact and C is the concentration of abrasive media by weight.
𝑁𝑁𝑎𝑎 = 𝐶𝐶𝜋𝜋𝑔𝑔
(13)
Ns is total number of abrasive grains acting to surface of workpiece
𝑁𝑁𝑠𝑠 = 𝑆𝑆𝑁𝑁𝑎𝑎𝐿𝐿𝑚𝑚 (14)
Lm length of the media can be calculated from the rate between areas cylinder and slot cross-section. S is workpiece contour length and Ts is slot thickness of passage which media passes.
𝐿𝐿𝑚𝑚 = 𝜋𝜋𝑅𝑅𝑐𝑐2𝐿𝐿𝑠𝑠𝑆𝑆𝑇𝑇𝑠𝑠
(15)
Hence, weight of material removal in each stroke (W) in AFM process is driving as
𝑊𝑊 = 𝑊𝑊𝑎𝑎𝑁𝑁𝑠𝑠 (16) Total weight of material removal (Wt) can be found by multiplying the number of cycles (n)
180
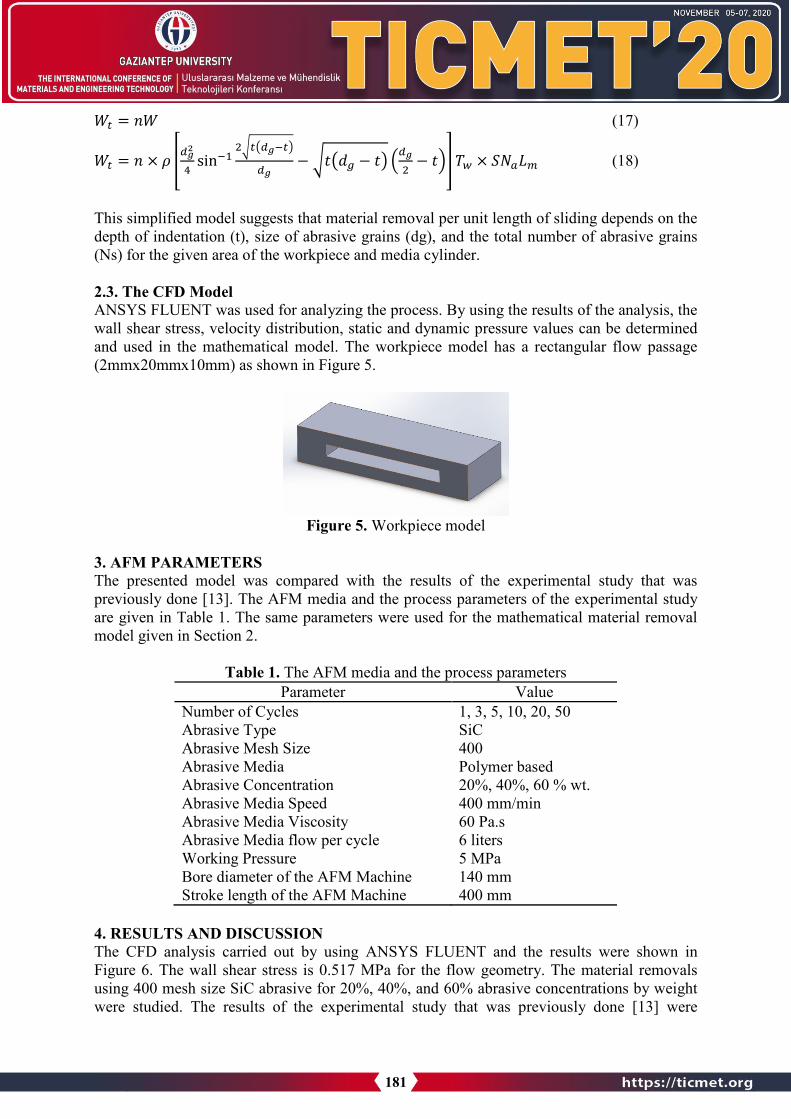
𝑊𝑊𝑡𝑡 = 𝑛𝑛𝑊𝑊 (17)
𝑊𝑊𝑡𝑡 = 𝑛𝑛 × 𝜌𝜌 �𝜋𝜋𝑔𝑔2
4sin−1
2�𝑡𝑡�𝜋𝜋𝑔𝑔−𝑡𝑡�
𝜋𝜋𝑔𝑔− �𝑡𝑡�𝑑𝑑𝑔𝑔 − 𝑡𝑡� �𝜋𝜋𝑔𝑔
2− 𝑡𝑡�� 𝑇𝑇𝑤𝑤 × 𝑆𝑆𝑁𝑁𝑎𝑎𝐿𝐿𝑚𝑚 (18)
This simplified model suggests that material removal per unit length of sliding depends on thedepth of indentation (t), size of abrasive grains (dg), and the total number of abrasive grains (Ns) for the given area of the workpiece and media cylinder.
2.3. The CFD Model ANSYS FLUENT was used for analyzing the process. By using the results of the analysis, the wall shear stress, velocity distribution, static and dynamic pressure values can be determined and used in the mathematical model. The workpiece model has a rectangular flow passage(2mmx20mmx10mm) as shown in Figure 5.
Figure 5. Workpiece model
3. AFM PARAMETERS The presented model was compared with the results of the experimental study that waspreviously done [13]. The AFM media and the process parameters of the experimental study are given in Table 1. The same parameters were used for the mathematical material removal model given in Section 2.
Table 1. The AFM media and the process parameters Parameter Value
Number of Cycles 1, 3, 5, 10, 20, 50 Abrasive Type SiC Abrasive Mesh Size 400 Abrasive Media Polymer based Abrasive Concentration 20%, 40%, 60 % wt. Abrasive Media Speed 400 mm/min Abrasive Media Viscosity 60 Pa.s Abrasive Media flow per cycle 6 liters Working Pressure 5 MPa Bore diameter of the AFM Machine 140 mm Stroke length of the AFM Machine 400 mm
4. RESULTS AND DISCUSSIONThe CFD analysis carried out by using ANSYS FLUENT and the results were shown inFigure 6. The wall shear stress is 0.517 MPa for the flow geometry. The material removalsusing 400 mesh size SiC abrasive for 20%, 40%, and 60% abrasive concentrations by weightwere studied. The results of the experimental study that was previously done [13] were
181

compared with the results of the mathematical model presented in this study. The comparison of the mathematical material removal and experimental can be seen in Figure 7 for various AFM cycles. The amount of material removal is increasing with the increasing abrasive concentration. It can be seen in the figures clearly, the difference between the results of the presented model and experimental ones are very close to each other for all abrasive concentrations. With a help of the presented model, material removal can be pre-determined before the AFM process. In the material model; viscosity of media, the hardness of workpiece material, area of the passage, abrasive grain size, and wall shear stress value are the main dependent values that affect the system. Therefore, the model needs to be verified for otherparameters (i.e. viscosity of media, the hardness of workpiece material, area of the passage,abrasive grain size) also.
(a)
(b)
(c) Figure 6. The results of CFD analysis a) velocity b) static pressure and c) wall shear stress
distributions.
182

(a)
(b)
(c) Figure 7. The material removal results predicted by the mathematical model and the
experimental study with respect to AFM cycles for a) 20% b) 40% and c) 60% abrasive concentrations.
5. CONCLUSIONSIn conclusion, the mathematical model which was derived to obtain material removal can besuccessfully used for the AFM process design. By using the presented model, the AFMprocess parameters can be pre-determined according to the required final form. The modelwas verified for different abrasive concentrations for a constant set of other AFM parameters.
1 3 5 10 20 50Model 0,0004573 0,001372 0,0022867 0,0045734 0,0091468 0,022867EXP 0,0005 0,0014 0,002 0,0045 0,009 0,025
0
0,02
0,04
0,06
0,08
Mat
eria
l rem
oval
(gr)
20% Concentration
1 3 5 10 20 50Model 0,0009147 0,002744 0,0045734 0,0091468 0,0182936 0,045734EXP 0,001 0,00275 0,0045 0,009 0,018 0,045
0
0,01
0,02
0,03
0,04
0,05
0,06
0,07
0,08
Mat
eria
l rem
oval
(gr)
40% Concentration
1 3 5 10 20 50Model 0,001372 0,0041161 0,0068601 0,0137202 0,0274404 0,068601EXP 0,0012 0,005 0,007 0,014 0,0275 0,07
0
0,02
0,04
0,06
0,08
Mat
eria
l rem
oval
(gr)
60% Concentration
183
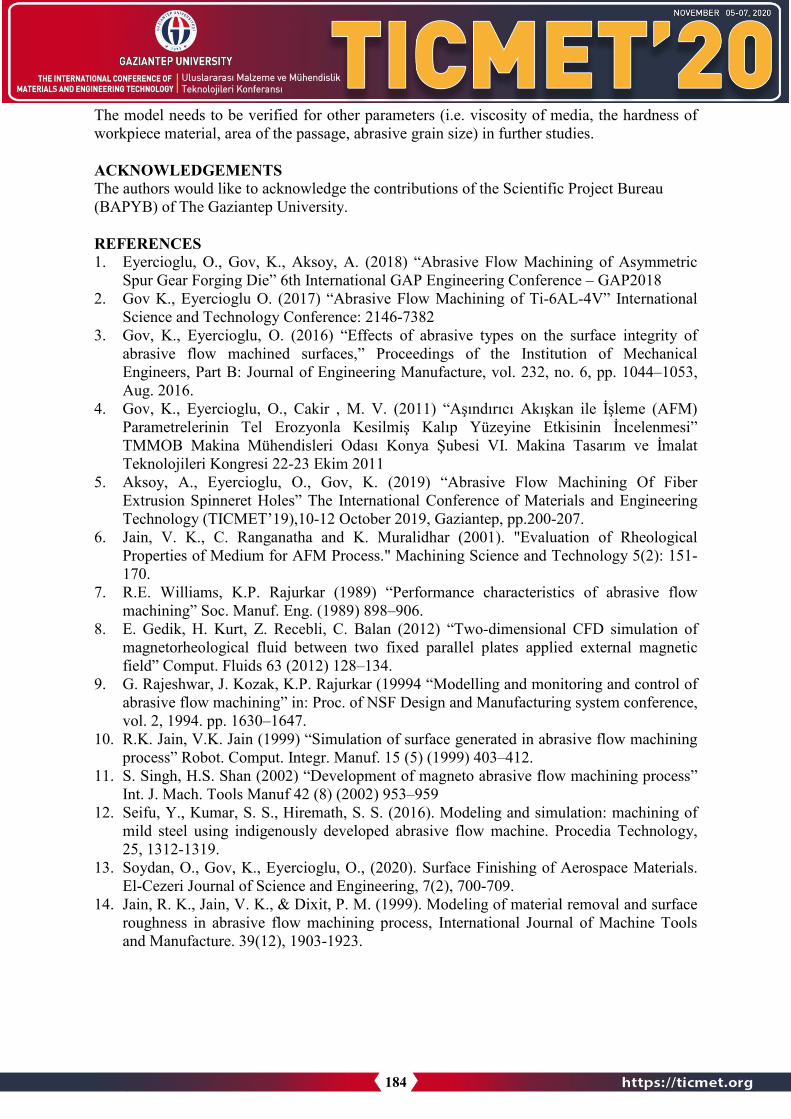
The model needs to be verified for other parameters (i.e. viscosity of media, the hardness of workpiece material, area of the passage, abrasive grain size) in further studies.
ACKNOWLEDGEMENTSThe authors would like to acknowledge the contributions of the Scientific Project Bureau (BAPYB) of The Gaziantep University.
REFERENCES 1. Eyercioglu, O., Gov, K., Aksoy, A. (2018) “Abrasive Flow Machining of Asymmetric
Spur Gear Forging Die” 6th International GAP Engineering Conference – GAP20182. Gov K., Eyercioglu O. (2017) “Abrasive Flow Machining of Ti-6AL-4V” International
Science and Technology Conference: 2146-73823. Gov, K., Eyercioglu, O. (2016) “Effects of abrasive types on the surface integrity of
abrasive flow machined surfaces,” Proceedings of the Institution of MechanicalEngineers, Part B: Journal of Engineering Manufacture, vol. 232, no. 6, pp. 1044–1053,Aug. 2016.
4. Gov, K., Eyercioglu, O., Cakir , M. V. (2011) “Aşındırıcı Akışkan ile İşleme (AFM)Parametrelerinin Tel Erozyonla Kesilmiş Kalıp Yüzeyine Etkisinin İncelenmesi”TMMOB Makina Mühendisleri Odası Konya Şubesi VI. Makina Tasarım ve İmalatTeknolojileri Kongresi 22-23 Ekim 2011
5. Aksoy, A., Eyercioglu, O., Gov, K. (2019) “Abrasive Flow Machining Of FiberExtrusion Spinneret Holes” The International Conference of Materials and EngineeringTechnology (TICMET’19),10-12 October 2019, Gaziantep, pp.200-207.
6. Jain, V. K., C. Ranganatha and K. Muralidhar (2001). "Evaluation of RheologicalProperties of Medium for AFM Process." Machining Science and Technology 5(2): 151-170.
7. R.E. Williams, K.P. Rajurkar (1989) “Performance characteristics of abrasive flowmachining” Soc. Manuf. Eng. (1989) 898–906.
8. E. Gedik, H. Kurt, Z. Recebli, C. Balan (2012) “Two-dimensional CFD simulation ofmagnetorheological fluid between two fixed parallel plates applied external magneticfield” Comput. Fluids 63 (2012) 128–134.
9. G. Rajeshwar, J. Kozak, K.P. Rajurkar (19994 “Modelling and monitoring and control ofabrasive flow machining” in: Proc. of NSF Design and Manufacturing system conference,vol. 2, 1994. pp. 1630–1647.
10. R.K. Jain, V.K. Jain (1999) “Simulation of surface generated in abrasive flow machiningprocess” Robot. Comput. Integr. Manuf. 15 (5) (1999) 403–412.
11. S. Singh, H.S. Shan (2002) “Development of magneto abrasive flow machining process”Int. J. Mach. Tools Manuf 42 (8) (2002) 953–959
12. Seifu, Y., Kumar, S. S., Hiremath, S. S. (2016). Modeling and simulation: machining ofmild steel using indigenously developed abrasive flow machine. Procedia Technology,25, 1312-1319.
13. Soydan, O., Gov, K., Eyercioglu, O., (2020). Surface Finishing of Aerospace Materials.El-Cezeri Journal of Science and Engineering, 7(2), 700-709.
14. Jain, R. K., Jain, V. K., & Dixit, P. M. (1999). Modeling of material removal and surfaceroughness in abrasive flow machining process, International Journal of Machine Toolsand Manufacture. 39(12), 1903-1923.
184

List of Symbols Ag Cross-sectional area of groove, mm2 C Concentration of abrasive media, % dg Diameter of abrasive grain, mm Hw Hardness of workpiece material, N/mm2 F Radial force applied to single abrasive grain, N Lm Length of media flow, mm Ls Stroke length, mm M Mesh size of abrasive grain N Number of cycles Na Number of abrasive grains acting per unit contact area of media
and workpiece Ns Number of abrasive grains passes in one cycle Rc Radius of media cylinder, mm S Contour length, mm T Depth of indentation of abrasive into workpiece material, m Ts Slot thickness, mm Tw Workpiece thickness, mm W Weight loss in one cycle, gr Wa Weight of material removed by one abrasive grain, gr Wt Total weight loss, gr Ρ Density of media, kg/mm3 Σ Radial wall shear stress, N/m2
185

A STUDY OF RESIDUAL STRESS MEASUREMENT OF AEROSPACE MATERIALS
BURAK SAHIN*1 KURSAD GOV2
1 Gaziantep University, Engineering Faculty, Mechanical Engineering Department, Gaziantep, TURKEY. 2 Gaziantep University, Aeronautics and Aerospace Faculty, Aircraft and Aerospace Engineering Department,
Gaziantep, TURKEY.
Abstract
Residual stress is created and retained within a body in the case of machining. It retains in and onthe body after machining. Also, it is created by heat treatment and misfits between different regions of the material, component or assembly. This stress adds to applied stress (as a result of external load) or subtracts from it. Therefore, when the effects of residual and applied stresses are added, unexpected failure occurs. This will cause undetected defects during service life of any components and a whole system. Aerospace applications are critical compared to any applications occurring on the earth land because of their nature. The occurrence of residual stress on aerospace applications and materials are very vital so the level and nature (tensile or compressive) of residual stress should be determined to make a reliable design for these kinds of implementations. These all makes the measurement of residual stress extremely significant for aerospace materials. This study focuses on the measurement of residual stresses occurs on aerospace materials and their effects on service life during operation.
Keyword: residual stress, applied stress, aerospace materials, aerospace applications, service life
1. IntroductionResidual stresses are those stresses which are retained within a body in the case of no load actingas a result of machining, heat treatment and misfits between different regions of the material,component or assembly. These stresses add to applied stress (as a result of external load) orsubtract from it. Therefore, when the effects of residual and applied stresses are added,unexpected failure occurs. This will cause undetected defects during service life of anycomponents and a whole system.
Residual stress is caused by almost every manufacturing process, especially by casting, welding and forming. Residual stress rises in the case of no external load and this makes its ignorance easy.
Overlooking this stress can cause failure of designed product because of its significant effcet on material strength, dimensional stability and fatigue life. Alone or with any stress caused by external loads, residual stress can cause partly or fully damage of aircrafts, ships, and other structures [1].
186
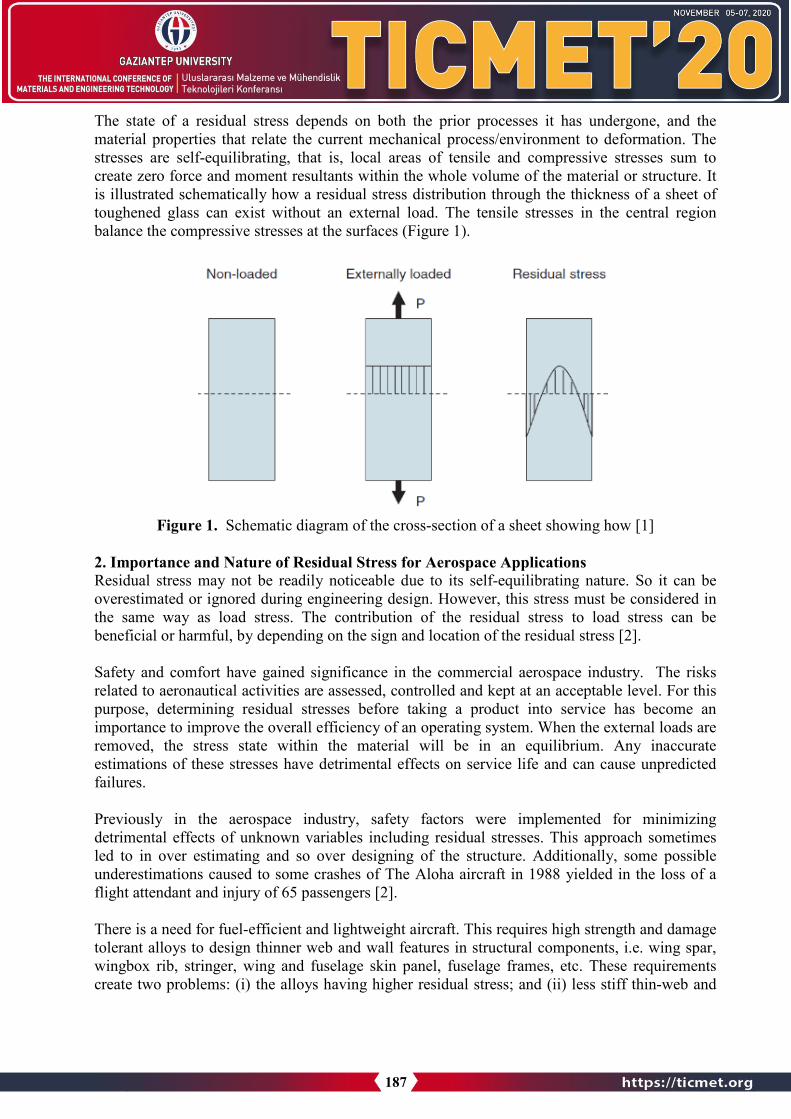
The state of a residual stress depends on both the prior processes it has undergone, and the material properties that relate the current mechanical process/environment to deformation. The stresses are self-equilibrating, that is, local areas of tensile and compressive stresses sum tocreate zero force and moment resultants within the whole volume of the material or structure. It is illustrated schematically how a residual stress distribution through the thickness of a sheet of toughened glass can exist without an external load. The tensile stresses in the central region balance the compressive stresses at the surfaces (Figure 1).
Figure 1. Schematic diagram of the cross-section of a sheet showing how [1]
2. Importance and Nature of Residual Stress for Aerospace Applications Residual stress may not be readily noticeable due to its self-equilibrating nature. So it can be overestimated or ignored during engineering design. However, this stress must be considered in the same way as load stress. The contribution of the residual stress to load stress can be beneficial or harmful, by depending on the sign and location of the residual stress [2].
Safety and comfort have gained significance in the commercial aerospace industry. The risks related to aeronautical activities are assessed, controlled and kept at an acceptable level. For this purpose, determining residual stresses before taking a product into service has become an importance to improve the overall efficiency of an operating system. When the external loads are removed, the stress state within the material will be in an equilibrium. Any inaccurate estimations of these stresses have detrimental effects on service life and can cause unpredicted failures.
Previously in the aerospace industry, safety factors were implemented for minimizing detrimental effects of unknown variables including residual stresses. This approach sometimes led to in over estimating and so over designing of the structure. Additionally, some possible underestimations caused to some crashes of The Aloha aircraft in 1988 yielded in the loss of a flight attendant and injury of 65 passengers [2].
There is a need for fuel-efficient and lightweight aircraft. This requires high strength and damage tolerant alloys to design thinner web and wall features in structural components, i.e. wing spar, wingbox rib, stringer, wing and fuselage skin panel, fuselage frames, etc. These requirements create two problems: (i) the alloys having higher residual stress; and (ii) less stiff thin-web and
187

thin-wall component to resist the bending moment caused by residual stress. There is strong relationship between residual stress and distortion and engineers must manage this to find a solution to the structural design, stress and manufacturing engineers by deriving a methodology.
3. Measurement Methods There are many methods to determine residual stresses including mechanical, magnetic, electrical, ultrasonic, thermoelastic, thermoplastic and diffraction methods [3]. All mechanical methods for residual stress measurement require measuring the deformation due to the release of residual stresses, which are then estimated by using an analysis based on linear elasticity. To the now, many measurement methods have been developed to measure the residual stresses within structures. There are many methods to determine residual stresses including mechanical, magnetic, electrical, ultrasonic, thermoelastic, thermoplastic and diffraction methods.
The measurement techniques are divided into three categories: destructive, semi-destructive, and nondestructive methods. Therefore, the use of a particular method depends on the availability ofnot only the means for releasing the stresses and recording the deformation but also the solution and computation for the configuration of the measurement [4].
Destructive testing methods remove the material by means of semi or fully destructive methods, and the residual stress is determined based on the displacement or strain there. As the earliest method for measurement of residual stress, the destructive testing method has been studied fordecades. Due to its high accuracy and practicability and relatively mature theory, it is widely used in practical applications.
Hole-drilling method is the most widely used residual stress measurement method now, because of its advantages of high accuracy, inexpensive equipment and semidestructive measurementapproach. After drilling a small hole in the workpiece plane with a residual stress, the stress near the hole is released and redistributed (Figure 2a). Related strain values are measured by using strain gauges and stress is determined based on stress strain relationship (Figure 2b).
The main principle of the ring-core method is similar to that of the hole-drilling method. A groove with diameter D is machined by a crown milling cutter, which releases the residual stress in the ring core (Figure 3). A strain gauge rosette is placed in the middle of the ring-core region, and the residual stress in the region is calculated. The ring-core method has a large strain release when the diameter D of the annular groove is small, and approximately 90% of the residual stress is released.
The slitting method is also similar to the hole-drilling method, but using a long slit rather than a hole. Strain gages are placed on the front or back surfaces, or both, and the relieved strains are measured as the slit is incrementally increased in depth using a thin saw, milling cutter or wire EDM (Figure 4).
The Contour Method is a technique to make full-field residual stress measurements. It is based on cutting through the specimen cross-section using a wire EDM, and measuring the surface height profiles of the cut surfaces using a coordinate measuring machine or a laser profilometer. The residual stresses shown in Figure 5(a) are released by the cut and cause the material surface to deform (pull inwards for tensile stresses, bulge outward for compressive stresses), as shown in Figure 5(b).
188

The originally existing residual stresses normal to the cut can be evaluated from finite element calculations by determining the stresses required to return the deformed surface shape to a flat plane. In practice, to avoid any effects of measurement asymmetry, the surfaces on both sides of the cut are measured and the average surface height map is used. The contour method is remarkable because it gives a 2D map of the residual stress distribution over the entire material cross-section.
Figure 2. Schematic diagram of strain gauge hole-drilling method [2]
Figure 3. Ring-core method
Figure 4. Slitting method
189

Figure 5. Contour method
On the other hand, non-destructive techniques do not cause any damage to the material and are based upon the monitoring of a physical property related to stress. These techniques are extremely beneficial in monitoring the health of a component in service. Either the measuring instrument must be portable and sufficiently compact to be brought to the component, or the component must be brought to the instrument.
Diffraction methods base on using the ability of electromagnetic radiation to measure thedistance between atomic planes in crystalline or polycrystalline, materials are exposed to external load; deformation and strain as a result of this load. The diffraction methods effectively measure a crystal inter-planar dimension that can be related to the magnitude and direction of the stress state existing within the material [1].
Diffraction techniques basically measure diffraction angle (θ) where a maximum diffracted intensity takes place when a crystalline sample is subjected to X-rays or neutrons. From this angle, interplanar spacing (d) of the diffraction planes can be obtained using Bragg’s law (λ = 2d·sinθ), where λ is a beam wavelength. If residual stresses occurs within the sample, then the d spacing will differ from that of an unstressed state. This difference is proportional to magnitude of the residual stress [5].
All diffraction methods to measure strain/stress is based on the same principles. Constructive interference of a wave scattered by a periodic array of atoms is used to measure the atomic spacing (Figure 7.a). The wavelength of the incident waves must be similar to the spacing of the atoms to observe constructive interference peaks in the scattered intensity. For most materials this limits the wavelengths that can be used to the X-ray region of the electromagnetic spectrum; typically photons with energies between 5−120 keV are used [1].
190

Figure 6. Radiation diffraction within a crystal structure d = spacing between lattice planes, θ = Bragg angle, and λ = wavelength of the radiation [1]
Figure 7. Schematic of diffraction emanating from an atomic array in an (a) unstrained state and (b) under tensile strain due to an applied load
The X-ray diffraction (XRD) techniques are capable of measuring the inter-atomic lattice spacing which indicates the strain in the irradiated area. The generally used X-ray wavelengths for stress measurement unable to penetrate deeply into materials. Typically, X-ray penetration is of the order of 25 µm and thus XRD is considered a surface stress measurement method. XRD have become the most widely used to evaluate residual stresses. The most widely applied magnetics residual stress measurement method applicable to ferromagnetic materials uses Magnetic Barkhausen Noise (MBN) analysis involves measuring the number and magnitude of abrupt magnetic re-orientations made by the magnetic domains.
191
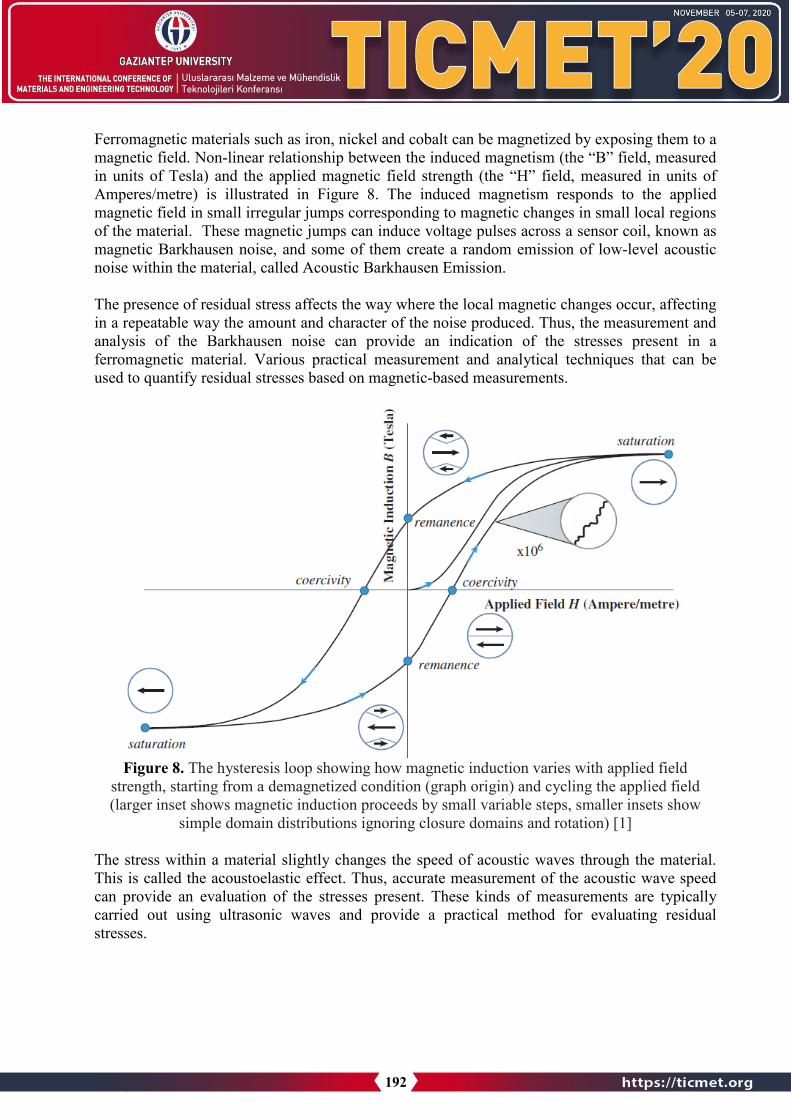
Ferromagnetic materials such as iron, nickel and cobalt can be magnetized by exposing them to a magnetic field. Non-linear relationship between the induced magnetism (the “B” field, measured in units of Tesla) and the applied magnetic field strength (the “H” field, measured in units ofAmperes/metre) is illustrated in Figure 8. The induced magnetism responds to the applied magnetic field in small irregular jumps corresponding to magnetic changes in small local regionsof the material. These magnetic jumps can induce voltage pulses across a sensor coil, known as magnetic Barkhausen noise, and some of them create a random emission of low-level acoustic noise within the material, called Acoustic Barkhausen Emission.
The presence of residual stress affects the way where the local magnetic changes occur, affecting in a repeatable way the amount and character of the noise produced. Thus, the measurement andanalysis of the Barkhausen noise can provide an indication of the stresses present in a ferromagnetic material. Various practical measurement and analytical techniques that can be used to quantify residual stresses based on magnetic-based measurements.
Figure 8. The hysteresis loop showing how magnetic induction varies with applied field strength, starting from a demagnetized condition (graph origin) and cycling the applied field (larger inset shows magnetic induction proceeds by small variable steps, smaller insets show
simple domain distributions ignoring closure domains and rotation) [1]
The stress within a material slightly changes the speed of acoustic waves through the material. This is called the acoustoelastic effect. Thus, accurate measurement of the acoustic wave speed can provide an evaluation of the stresses present. These kinds of measurements are typically carried out using ultrasonic waves and provide a practical method for evaluating residual stresses.
192

Ultrasonic stress measurement is accomplished using one of two common probe arrangements: the critically refracted longitudinal wave and the shear wave in birefringence mode. Important parameters in the stress measurement are the direction of the stress field being investigated and the particle motion and propagation path of the ultrasonic wave. The wave travels parallel to the surface of the specimen shown in Figure 9.a and has particle motion also parallel to the surface [1].
Figure 9. Particle motions and direction of wave travel for plane waves (a) LCR wave and (b) shear wave
Optical methods which are non-contacting provide full-field data for residual stress measurement. This makes optical methods less time consuming over other techniques. Several optical methods are available with its particular features. The major optical techniques in common use for measuring residual stresses are holographic interferometry/ESPI, Moir´e interferometry and digital image correlation.
Holographic interferometry provides quantitative information about small surface displacements (typically from about ten nanometres to ten microns. It is usually performed by illuminating a region of interest on a diffusely reflecting object with coherent light, generally from a low-power laser. Light is scattered from the object towards a location where a hologram is to be recorded, as shown in Figure 10 [6]. Moir´e interferometry is a technique to determine surface displacements with high sensitivity. A four-beam Moir´e interferometry setup is given in Figure 11. A crossline grating is applied to a region of interest, which must be flat in virtually all cases. Laser light B1 and B2 illuminate the grating, causing light to be diffracted in the z-direction [7].
Displacement of the surface and grating causes the diffracted light to interfere in the image plane of a recording device, producing a fringe pattern that can be related to in plane x-displacements Ux. Similarly, beams B3 and B4 form a fringe pattern related to the y-displacements Uy. The x-
193

direction pattern is recorded with light B3 and B4 blocked, and the y-pattern with light B1 andB2 blocked [8].
Figure 10. Holographic interferometry set-up [7]
Figure 11 Schematic of an experimental set-up for Moir´e interferometry [8]
4. ConclusionIn time, residual stress measurement has transitioned from destructive to non-destructivetechniques. Based on new physical principles, measurement methods have been developed byimproving the accuracy and efficiency of stress measurements. It is necessary to choose theappropriate measurement method according to the application.Aerospace applications are critical compared to any applications occurring on the earth landbecause of their nature. The occurrence of residual stress on aerospace applications and materialsare very vital so the level and nature (tensile or compressive) of residual stress should bedetermined to make a reliable design for these kinds of implementations. These all makes the
194

measurement of residual stress extremely significant for aerospace materials. This study focuses on the measurement of residual stresses occurs on aerospace materials and their effects on service life during operation.
Residual stress in tensile nature cause to shorten service life of elements so especially in aerospace applications, it is very significant to determine its nature and amount. This makes measurement methods very critical in engineering design for aerospace and any other critical applications.
Whereas destructive tests give chance to determine residual stress values on engineering and aerospace materials with destructed specimens, stress values can be determined by using non-destructive methods without any destruction and loss of service time. So destructive methods give opportunity to enhance current designs but prevent materials from service. On the otherhand, non-destructive methods can be performed for planned control during service.
Determination of residual stress is very significant to make a reliable, efficient and long-life design for aerospace applications regardless of using destructive or non-destructive methods. Measurements carried out for the purpose of evaluating the residual stress should be done to enhance current design or make a more reliable design for a new part. These measurements can also be compared and supported with finite element analysis and some simulation works.
References 1. Schajer, G. S., Practical Residual Stress Measurement Methods, 2013.2. Guo, J., Fu, H., Pan, B., Kang, R., Recent progress of residual stress measurement methods:
A review. 2019.3. Ma, K., Goetz, R., Srivatsa, S. K., Modelling of Residual Stress and Machining Distortion in
Aerospace Components, American Society for Metals (ASM) Handbook, 2010.4. Tiwari, S., Chatterjee, A., Basis functions for residual stresses, Applied Mathematics and
Computation, 2020.5. Schajer, G. S., Relaxation Methods for Measuring Residual Stresses: Techniques and
Opportunities, Experimental Mechanics 2010, 50(8):1117–1127.6. Maawad, E. K. S., Residual Stress Analysis and Fatigue Behaviour of Mechanically Surface
Treated Titanium Alloys, Vom Promotionsausschuss der Technischen Universität Clausthalim Jahr 2012 als Dissertation angenommene Arbeit), 2013.
7. Vandenrijt, J., Georges, M., Electronic Speckle Pattern Interferometry and DigitalHolographic Interferometry with Microbolometer Arrays at 10.6 μm, Appl Optics, 2010,49:5067–5075.
8. Post, D., Han, B., Moir´e Interferometry In: Sharpe, W. (ed) Handbook of ExperimentalSolid Mechanics. Springer: New York, 2008, pp. 627–653.
9. Han, B., Post, D., Ifju, P., Moir´e Interferometry for Engineering Mechanics: CurrentPractices and Future Developments, J Strain Anal Eng Des, 2001, 36:101–117.
195

ADDITIVE MANUFACTURING OF CONTINUOUS FİBER-REİNFORCED COMPOSITES WITH HIGH MECHANICAL
PROPERTIES FROM PLA THERMOPLASTIC RESIN BY FUSED DEPOSITION METHOD
Recep GÜMRÜK *1, Altuğ UŞUN1
1Department of Mechanical Engineering, Karadeniz Technical University, Trabzon, Turkey.
Abstract
In this study, it is aimed to produce continuous fiber-reinforced thermoplastic composites withfused deposition modelling (FDM) method based on three-dimensional printing technology and to examine their mechanical performance. For this purpose, PLA thermoplastic polymer wasused as a resin, and carbon fiber (3K) was preferred as fiber. First, continuous fiber-reinforced thermoplastic (CFRTP) filaments were produced for the printing of samples with the three-dimensional printer. For that, a novel filament production line was designed, which allowed more homogeneous wetting of the fiber bundles, ensuring a better mixture of fiber-polymer matrix. Filaments with a diameter of 0.6 mm were obtained, in which the fibers had ahomogeneous distribution in the resin and fiber ratio of 41% by volume was achieved. Fibers were also subjected to tensile testing, and tensile strength of 988 MPa was obtained, which is thehighest tensile strength value obtained for CFRTP filaments in the literature. At the second stage,CFRTP filaments and distinctive G-code was used in a custom 3D printer to produce both tensile and three-point bending test specimens. The specimens were also investigated with scanning electron microscope images to evaluate the porosity, impregnation, and the distribution of the fiber-polymer matrix. Test results showed much higher yield strength and elastic modulus valueswhen compared with pure specimens. This novel method shoved that better impregnation of the polymer can be enhanced to obtain better continuous fiber-reinforced composite printing, whichwill extend the applications of composite printing techniques.
Keyword: Additive Manufacturing, Polymer-matrix Composites, Continuous Fiber-reinforced Thermoplastic, Mechanical Properties
1. IntroductionContinuous fiber-reinforced thermoplastic (CFRTP) printing has been extensively researched inrecent years because of their higher mechanical values [1–3]. CFRTP also renders printingcomplex geometrical parts with low-cost production possible. Therefore, the CFRTP printingmethod has the potential of being widely used in aerospace, automotive, medical and similarindustries. Different methods were adopted in the literature to achieve CFRTP printing; many ofthem were based on two fundamental principles; in-nozzle impregnation [4,5] and the use of pre-preg filament [6,7].
196
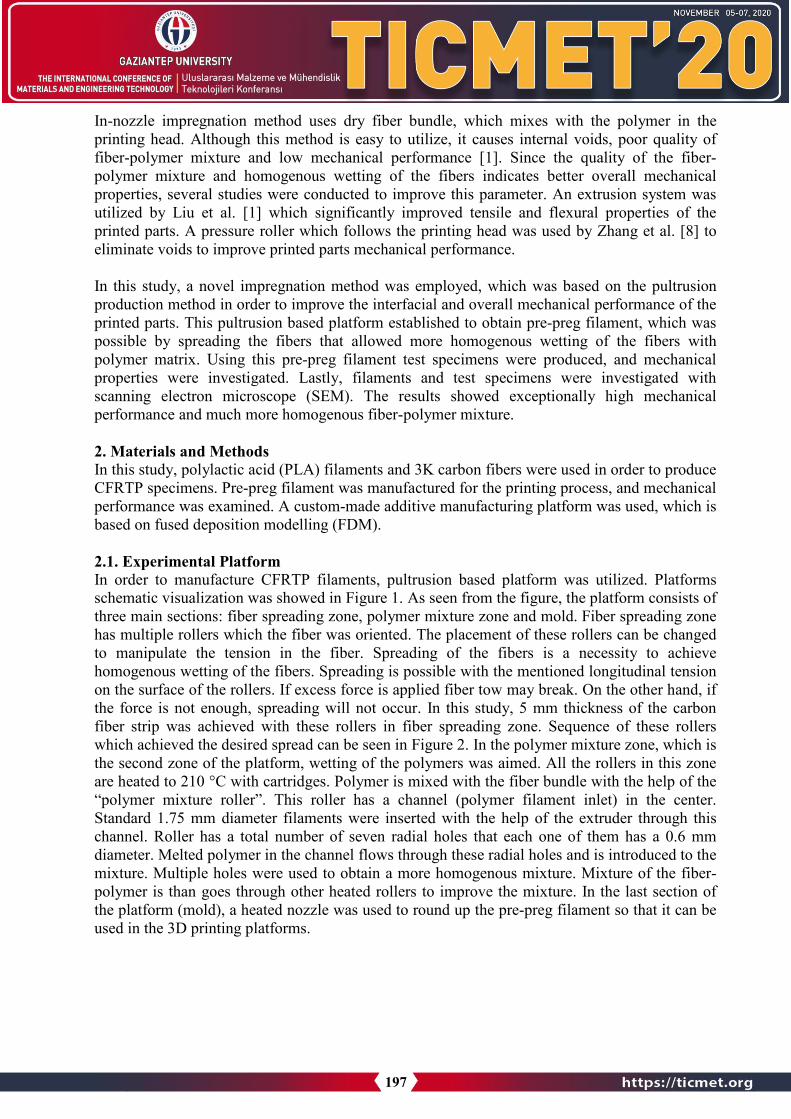
In-nozzle impregnation method uses dry fiber bundle, which mixes with the polymer in the printing head. Although this method is easy to utilize, it causes internal voids, poor quality offiber-polymer mixture and low mechanical performance [1]. Since the quality of the fiber-polymer mixture and homogenous wetting of the fibers indicates better overall mechanical properties, several studies were conducted to improve this parameter. An extrusion system was utilized by Liu et al. [1] which significantly improved tensile and flexural properties of the printed parts. A pressure roller which follows the printing head was used by Zhang et al. [8] to eliminate voids to improve printed parts mechanical performance.
In this study, a novel impregnation method was employed, which was based on the pultrusionproduction method in order to improve the interfacial and overall mechanical performance of the printed parts. This pultrusion based platform established to obtain pre-preg filament, which was possible by spreading the fibers that allowed more homogenous wetting of the fibers with polymer matrix. Using this pre-preg filament test specimens were produced, and mechanical properties were investigated. Lastly, filaments and test specimens were investigated with scanning electron microscope (SEM). The results showed exceptionally high mechanicalperformance and much more homogenous fiber-polymer mixture.
2. Materials and Methods In this study, polylactic acid (PLA) filaments and 3K carbon fibers were used in order to produceCFRTP specimens. Pre-preg filament was manufactured for the printing process, and mechanical performance was examined. A custom-made additive manufacturing platform was used, which is based on fused deposition modelling (FDM).
2.1. Experimental Platform In order to manufacture CFRTP filaments, pultrusion based platform was utilized. Platforms schematic visualization was showed in Figure 1. As seen from the figure, the platform consists of three main sections: fiber spreading zone, polymer mixture zone and mold. Fiber spreading zone has multiple rollers which the fiber was oriented. The placement of these rollers can be changed to manipulate the tension in the fiber. Spreading of the fibers is a necessity to achieve homogenous wetting of the fibers. Spreading is possible with the mentioned longitudinal tension on the surface of the rollers. If excess force is applied fiber tow may break. On the other hand, if the force is not enough, spreading will not occur. In this study, 5 mm thickness of the carbon fiber strip was achieved with these rollers in fiber spreading zone. Sequence of these rollers which achieved the desired spread can be seen in Figure 2. In the polymer mixture zone, which is the second zone of the platform, wetting of the polymers was aimed. All the rollers in this zone are heated to 210 °C with cartridges. Polymer is mixed with the fiber bundle with the help of the “polymer mixture roller”. This roller has a channel (polymer filament inlet) in the center. Standard 1.75 mm diameter filaments were inserted with the help of the extruder through this channel. Roller has a total number of seven radial holes that each one of them has a 0.6 mm diameter. Melted polymer in the channel flows through these radial holes and is introduced to the mixture. Multiple holes were used to obtain a more homogenous mixture. Mixture of the fiber-polymer is than goes through other heated rollers to improve the mixture. In the last section ofthe platform (mold), a heated nozzle was used to round up the pre-preg filament so that it can be used in the 3D printing platforms.
197

Figure 1. Schematic picture of the pultrusion-based system to be used in filament production by mixing polymer and fiber
Figure 2. Image of the CFRTP filament production line
Fiber ratios of the manufactured filaments was calculated by volume fraction. Calculation method of fiber ratio below is given down in the Equations 1-3. Single fiber strand has a 7 µm diameter. Since 3K fiber was used, fiber area is multiplied by 3000. Since the fiber volume is constant in the fiber, three different nozzle channel diameters were used in this study (0.6, 0.7 and 0.8 mm) to achieve different fiber ratios. Bigger channel allows more polymer in the
198

mixture, therefore lowering fiber ratio. Fiber ratios were calculated as %41, %30 and %23 for0.6, 0.7 and 0.8 nozzles respectively.
𝑇𝑇𝑇𝑇𝑇𝑇𝑇𝑇𝑇𝑇 𝐹𝐹𝐹𝐹𝐹𝐹𝐹𝐹𝐹𝐹 𝐴𝐴𝐹𝐹𝐹𝐹𝑇𝑇 = 3000 ×𝜋𝜋 × (𝐹𝐹𝐹𝐹𝐹𝐹𝐹𝐹𝐹𝐹 𝐷𝐷𝐹𝐹𝑇𝑇𝐷𝐷𝐹𝐹𝑇𝑇𝐹𝐹𝐹𝐹)2
4 (1)
𝑁𝑁𝑇𝑇𝑁𝑁𝑁𝑁𝑇𝑇𝐹𝐹 𝐴𝐴𝐹𝐹𝐹𝐹𝑇𝑇 = 𝜋𝜋 × (𝑁𝑁𝑇𝑇𝑁𝑁𝑁𝑁𝑇𝑇𝐹𝐹 𝐷𝐷𝐹𝐹𝑇𝑇𝐷𝐷𝐹𝐹𝑇𝑇𝐹𝐹𝐹𝐹)2
4 (2)
𝑉𝑉𝑇𝑇𝑇𝑇𝑉𝑉𝐷𝐷𝐹𝐹 𝐹𝐹𝐹𝐹𝑇𝑇𝐹𝐹𝑇𝑇𝐹𝐹𝑇𝑇𝐹𝐹 (%) = 𝑇𝑇𝑇𝑇𝑇𝑇𝑇𝑇𝑇𝑇 𝐹𝐹𝐹𝐹𝐹𝐹𝐹𝐹𝐹𝐹 𝐴𝐴𝐹𝐹𝐹𝐹𝑇𝑇𝑁𝑁𝑇𝑇𝑁𝑁𝑁𝑁𝑇𝑇𝐹𝐹 𝐴𝐴𝐹𝐹𝐹𝐹𝑇𝑇
× 100 (3)
The optical images of the produced filament was compared with commercially available MarkForged [9] pre-preg filaments in Figure 3. Specimens were embedded in cold mounting epoxy resin for optical image inspections. Surface of the specimens were grounded with fine silicon carbide (600-1200 grit). After that the specimen surface was finely polished with 0.01 µmalumina particle suspension. As can be seen from the figure, although 3K fiber is used, the mixture structure obtained is comparable with the MarkForged filament. Figure clearly shows some accumulations in the particular areas for both filaments. However, it appears that the polymer relatively wets all the fibers. As can be easily understood, the fibers will be wetted by more polymer during the re-crushing of the filament during printing.
Figure 3. Optical image of the cross-section of filaments; a) PLA-fiber mixture obtained in this study and b) MarkForged filament
2.2. CFTRP fabrication Fiber-reinforced pre-preg filament was used with a custom 3D printer (Figure 4a) in order to manufacture test specimens. Also, custom g-code was prepared to print whole test specimens without required any cutting. Therefore, the whole specimen is produced from a single continuous strand. Manufactured dimensions of the specimens were 140x15x2 mm for the tensile and 100x15x2 mm for the three-point bending. It is found out that standard nozzles tend to harm
199
the fibers while printing and sometimes causes fiber-polymer filament to stick to the sides of thenozzle clogging it. Therefore, a special nozzle with a straight feeding hole and rounded offsurfaces at the end was used. Nozzle temperature of 210 °C and a printing speed of 10 mm/s was used as manufacturing parameters. Different layer thicknesses were analyzed, and 0.25 mm layer thickness for 3K carbon fiber pre-preg filament was chosen. Images of the produced sampleswere shown in Figure 4.
(a) (b)
Figure 4. a) Custom 3D printer used for manufacturing of CFRTP filaments and b) Tensile test specimens
2.3. Tensile and Three-point Bending Tests In this study, mechanical testing can be divided into two sections as tensile and flexural testing. For tensile tests MTS Criterion Model 45 with a fully automated with 100kN capacity testing machine was used. Tensile tests were applied to both the specimens and the pre-preg filaments. Cutting, surface treatment, or other processes were not performed on the specimens.
In order to examine the flexural properties of specimens, three-point bending tests were conducted with the same testing machine used for tensile tests. Flexural specimens were produced according to ISO 14125 standard with the name “Fibre-reinforced plastic composites – determination of flexural properties”. 2 mm/min cross-head velocity was used to apply forces. Supports were positioned with 80 mm distance. Both tensile and three-point bending tests were repeated three times in order to confirm the repeatability of the results.
3. Results and DiscussionFirst of all, filaments with a variety of fiber ratios that were manufactured with CFRTP filamentproduction line were subjected to tensile testing. Three specimens for each fiber ratio were
200

tested, and standard deviations were calculated. Tensile strength of 988±67, 674±25 and 446±23 MPa was achieved for %41, %30 and %23 fiber ratios, respectively. These results show the effects of fiber ratios on mechanical properties.
Secondly printed rectangular specimens were subjected to tensile testing. Obtained stress-strain curve for %41 fiber ratio CFRTP tensile specimens were given in Figure 5a. As seen from the figure failure started to occur around 587 MPa. When compared with the studies of Tian et al. [4], Dou et al. [10] and Heidari-Rarani et al. [11] it can be seen that fiber ratios dominate themechanical properties. Zhang et al. [8] used a pressure roller in their study to further eliminatethe gaps occurs during printing. Although, even with this addition to the printing process, similar tensile properties were investigated. Fracture surface of the failed is showed in Figure 5b. It can be seen from the figure, failure occurs with the breaking off the single strands of fiber, resulting in some fiber pull-outs throughout the specimens’ cross-section. Similar failure can also be encountered in the literature with continuous fiber filament production [7,12].
(a) (b) Figure 5. Tensile test results; a) Stress-strain curves and b) image of the failed specimen
Flexural stress-strain curves obtained from three-point bending tests of CFRTP specimens with different fiber ratios were given in Figure 6. Flexural tests showed 267, 214 and 207 MPa flexural strength for %41, %30 and %23 fiber ratios, respectively. As can be seen from the figure, specimen with %41 fiber ratio showed much higher flexural modulus of elasticity and flexural strength when compared with other fiber ratios.
Although having similar tensile properties, three-point bending test results showed lower mechanical properties when compared with Zhang et al. [8]. Presumably, this difference occurs due to the pressure roller in the mentioned study. They were compressing the specimens while printing leads to meager void fraction in the interface of the specimen, which is much more dominant in parameter in flexural testing.
201

Figure 6. Stress-strain curves for CFRTP three-point bending tests
Table 1. A summary of three-point bending test results Nozzle
Diameter (mm)
Fiber Ratio (%)
Flexural Strength (MPa)
Increase in Flexural
Strength (%)
Flexural Modulus of Elasticity
(GPa)
Increase in Flexural Modulus of Elasticity
(%) 0.6 41 267.21 28.65* 40.70 90.72* 0.7 30 214.17 3.12* 29.95 40.35* 0.8 23 207.07 - 21.34 -
*The values were calculated by referencing the results regarding the %23 fiber ratio specimen
4. ConclusionsIn this study, a novel platform was produced inspired by pultrusion production method. With thisplatform, more homogenous pre-preg filaments were manufactured with %41, %30 and %23fiber ratios. Obtained filaments than were used on an FDM based additive manufacturingplatform. Mechanical properties of filaments and printed specimens were investigated withtensile and flexural testing. Superior mechanical properties were achieved for CFRTP specimensin both tensile and flexural properties when compared with pure specimens. From the tensiletests, 587 MPa tensile strength was achieved using 988 MPa filaments. Also, flexural propertiesfor different fiber ratios were investigated. It was found that the mechanical properties weredrastically affected by the carbon fiber context.
References 1. Liu T, Tian X, Zhang Y, Cao Y, Li D. High-pressure interfacial impregnation by micro-
screw in-situ extrusion for 3D printed continuous carbon fiber-reinforced nylon composites.Compos Part A Appl Sci Manuf 2020, 130:105770.
2. Matsuzaki R, Ueda M, Namiki M, Jeong TK, Asahara H, Horiguchi K, et al. Three-dimensional printing of continuous-fiber composites by in-nozzle impregnation. Sci Rep2016, 6:1–7.
3. Hao W, Liu Y, Zhou H, Chen H, Fang D. Preparation and characterization of 3D printedcontinuous carbon fiber-reinforced thermosetting composites. Polym Test 2018, 65:29–34.
202

4. Tian X, Liu T, Yang C, Wang Q, Li D. Interface and performance of 3D printed continuouscarbon fiber-reinforced PLA composites. Compos Part A Appl Sci Manuf 2016, 88:198–205.
5. Tian X, Liu T, Wang Q, Dilmurat A, Li D, Ziegmann G. Recycling and remanufacturing of3D printed continuous carbon fiber-reinforced PLA composites. J Clean Prod 2017,142:1609–18.
6. Melenka GW, Cheung BKO, Schofield JS, Dawson MR, Carey JP. Evaluation andprediction of the tensile properties of continuous fiber-reinforced 3D printed structures.Compos Struct 2016, 153:866–75.
7. Isobe T, Tanaka T, Nomura T, Yuasa R. Comparison of strength of 3D printing objectsusing short fiber and continuous long fiber. IOP Conf Ser Mater Sci Eng 2018, 406.
8. Zhang J, Zhou Z, Zhang F, Tan Y, Tu Y, Yang B. Performance of 3D-printed continuous-carbon-fiber-reinforced plastics with pressure. Materials (Basel) 2020, 13.
9. Markforged Carbon Fiber n.d. https://markforged.com/materials/continuous-fibers/continuous-carbon-fiber.
10. Dou H, Cheng Y, Ye W, Zhang D, Li J, Miao Z, et al. Effect of process parameters ontensile mechanical properties of 3D printing continuous carbon fiber-reinforced PLAcomposites. Materials (Basel) 2020, 13.
11. Heidari-Rarani M, Rafiee-Afarani M, Zahedi AM. Mechanical characterization of FDM 3Dprinting of continuous carbon fiber-reinforced PLA composites. Compos Part B Eng 2019,175:107147.
12. Kabir SMF, Mathur K, Seyam AFM. A critical review on 3D printed continuous fiber-reinforced composites: History, mechanism, materials and properties. Compos Struct 2020,232:111476.
203

Effect of Nano-Silica on the Impact Energy of Self-Compacting Geopolymer Concrete
Necip Altay Eren1, Abdulkadir Cevik1, Radhwan Alzeebaree3
1Gaziantep University, Engineering Faculty, Department of Civil Engineering, Gaziantep, Turkey 3Duhok Polytechnic University, Duhok, Iraq
Abstract
This study reports the effect of nano-silica (NS) on the impact strength of self-compacting geopolymer concrete (SCGC). During the production of SCGC mixes, the 100% of GGBFSwere used as a binder with constant Alkaline-Activator/Binder ratio of 0.5. The alkaline activator was consist of both sodium hydroxide solution (NaOH) and sodium silicate solution (Na2SiO3), and alkali activator ratio of 2.5 was chosen. Two SCGC beam samples with sizes of 50x10x10cm were produced with/out NS (0% and 2%) (GB and GBN) for the study. Moreover,the drop-weight test method was applied on the SCGC beam specimens to determine the effects of NS on the impact energy of SCGC beam specimens. The experimental study showed that the addition of NS improved the impact energy of the SCGC specimens.
Keywords: Self-compacting geopolymer concrete; nanosilica; drop-weigth test; impact energy
1.IntroductionThis study aimed to investigate the impact behaviors of SCGC structures with/out NS and, todetermine the impact energy and energy absorption capacities of these structures. In literature,there is little research on the effect of dynamic loads on the structure and structure elements.Impact loads are also among these dynamic loads. Impact loads are important according to theintended use of the structures [1]. Throughout any impact incident, structure must absorb a largeamount of energy in a short time. So, some damages to the structure can occur such as cracks orbreaks. They are depends on the energy absorption capacity of the structures [2]. Moreover,among the loads affecting concrete structures, the least known behavior loading is impactloading [3] and static methods do not use to estimate the behavior concrete structures underimpact loads [2]. Although studies are limited on the impact behavior of concrete, the number ofstudies using the drop-weight test to investigate the impact behavior of concrete has increased inrecent years [4]. Moreover, this research contributes the support efforts to reduce the utilizing ofcement as a binding material and thus diminish the liberation of CO2 in the ambiance as well ascontributing to the use of useless industrial by-products GGBFS and converting them into usefulmaterials, thus production an eco-friendly concrete.
2.Experimental Procedure:In the study, GGBFS and NS were used to produce the SCGC mixes. The chemical compositionsand physical characteristic of GGBFS and NS were shown in the table-1.
204

Table-1 Chemical & Physical Characteristic of NS and GGBFS Component CaO SiO2 Al2O3 Fe2O3 MgO SO3 K2O Na2O LOI SG BF (m2/kg) NS (%) - 99.8 - - - - - - <1.00 2.20 - GGBFS (%) 34.12 36.40 11.39 1.69 10.30 0.49 3.63 0.35 1.64 2.79 418
The crushed limestone coarse and fine aggregates were achieved from the original source utilized to produce the SCGC mixes. Table-2 presentes the physical properties and the sieveanalysis of aggregates.
Table-2 The Sieve Analysis & Physical Properties of Aggregates Sieve Size
(mm) 16 8 4 2 1 0.5 0.25 Fineness Modules
Specific Gravity
Absorption (%)
Fine Aggregate 100 100 100 67.3 39.9 28.4 16.4 2.57 2.45 1.5 Coarse 100 31.5 1 0.5 0.5 0.5 0.4 5.66 2.72 2.4
In the study, the amount of each component of SCGC mixes (weight per 1 m3 concrete) illustrates in the table-3 and figure-1 shows the SCGC production procedure
Table-3 Component of SCGC Mixes
Figure-1 SCGC Production Procedure
The drop-weight tests were carried out to determine the impact energy of SCGC beam specimens with/out NS. Moreover, the drop-weight test machine used in this study and its schematic representation are shown in the figure-2 and figure-3. The tests were done according to recommendatins of ACI Committee 544 and the test is made as repeated impacts to the same point [5].
In addition, the Model ICP 200C20 force sensor produced from PCB Group was used to obtain force-time data as shown in the figure-5 and two ICP 352C03 accelerometers produced from PCB Group were used to obtain the accelerometer-time data as shown in the figure-6.
Specimen Binder GGBFS NS Fine Coarse Na2SO3 Molarity SP EkstraAgg. Agg. +NaOH Water
kg/m3 kg/m3 kg/m3 kg/m3 kg/m3 kg/m3 % GB 500 500 0 860.07 738.12 250 12 7 10
GBN 500 490 10 858.49 736.76 250 12 7 10
205

Figure-3 Drop-Weigth Test Machine Figure-4 The Schematic Representation of Drop-Weigth Test Machine
Figure-5 ICP 200C20 Force Sensor Figure-6 ICP 352C03 Accelerometer
3. Impact Energy:The impact energy is given in the following equation:
Eimpact=m.g.h.N [6]
where, Eimpact = impact energy in Joule (J); m = mass of drop hammer = 28.5 kg; g = 9.81m/s2; h= releasing height of drop hammer = 10 cm; N = number of blows.
Table-8 Drop-Weight Tests Results
Specimen Drop Number
Impactor Weight
(kg)
Drop Height (cm)
Gravity (g) (m/s2)
Impact Energy
(J)
Ratio On Impact Energy
GB 2 28.5 10 9.81 55.917 1 GBN 7 28.5 10 9.81 195.7095 3.5
In this study, the results of drop-weight tests of two tested beam specimens are shown in the table-4. Moreover, the effect of NS on the impact energy is shown in the figure-7. According to the test results, it can be deduced that the precence of NS in the beams sicnificantly affected the
206
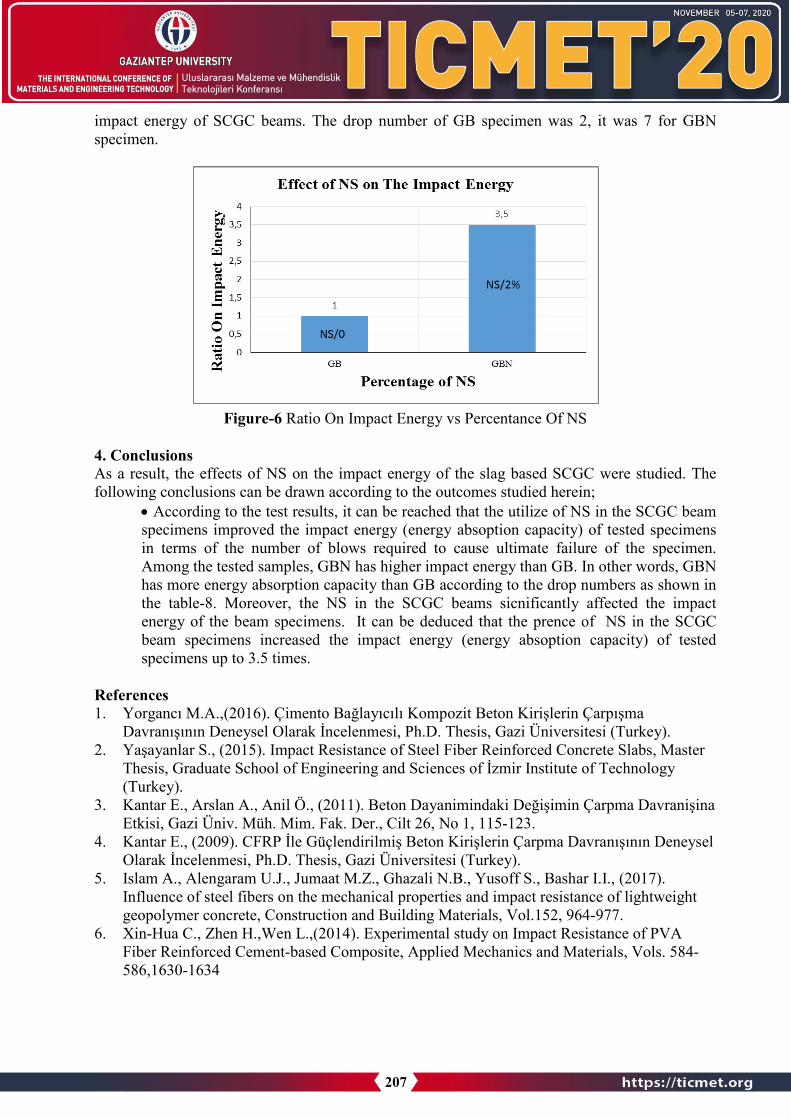
impact energy of SCGC beams. The drop number of GB specimen was 2, it was 7 for GBN specimen.
Figure-6 Ratio On Impact Energy vs Percentance Of NS
4. Conclusions As a result, the effects of NS on the impact energy of the slag based SCGC were studied. The following conclusions can be drawn according to the outcomes studied herein;
• According to the test results, it can be reached that the utilize of NS in the SCGC beamspecimens improved the impact energy (energy absoption capacity) of tested specimensin terms of the number of blows required to cause ultimate failure of the specimen.Among the tested samples, GBN has higher impact energy than GB. In other words, GBNhas more energy absorption capacity than GB according to the drop numbers as shown inthe table-8. Moreover, the NS in the SCGC beams sicnificantly affected the impactenergy of the beam specimens. It can be deduced that the prence of NS in the SCGCbeam specimens increased the impact energy (energy absoption capacity) of testedspecimens up to 3.5 times.
References 1. Yorgancı M.A.,(2016). Çimento Bağlayıcılı Kompozit Beton Kirişlerin Çarpışma
Davranışının Deneysel Olarak İncelenmesi, Ph.D. Thesis, Gazi Üniversitesi (Turkey).2. Yaşayanlar S., (2015). Impact Resistance of Steel Fiber Reinforced Concrete Slabs, Master
Thesis, Graduate School of Engineering and Sciences of İzmir Institute of Technology(Turkey).
3. Kantar E., Arslan A., Anil Ö., (2011). Beton Dayanimindaki Değişimin Çarpma DavranişinaEtkisi, Gazi Üniv. Müh. Mim. Fak. Der., Cilt 26, No 1, 115-123.
4. Kantar E., (2009). CFRP İle Güçlendirilmiş Beton Kirişlerin Çarpma Davranışının DeneyselOlarak İncelenmesi, Ph.D. Thesis, Gazi Üniversitesi (Turkey).
5. Islam A., Alengaram U.J., Jumaat M.Z., Ghazali N.B., Yusoff S., Bashar I.I., (2017).Influence of steel fibers on the mechanical properties and impact resistance of lightweightgeopolymer concrete, Construction and Building Materials, Vol.152, 964-977.
6. Xin-Hua C., Zhen H.,Wen L.,(2014). Experimental study on Impact Resistance of PVAFiber Reinforced Cement-based Composite, Applied Mechanics and Materials, Vols. 584-586,1630-1634
207

USE OF WASTE MATERIALS IN SOIL IMPROVEMENT
Aktan ÖZSOY1, Ali Fırat ÇABALAR1
Gaziantep University, Engineering Faculty, Department of Civil Engineering, Gaziantep, Turkey
Abstract
This study presents the use of a waste material, namely brick dust and rock powder, in geotechnical applications. A series of modified compaction testing results on the various mixtures of rock powder and brick dust prepared at the optimum water content. The samples prepared in the laboratory were the (i) %100 rock powder only, (ii) %70 rock powder and %30brick dust mixture, (iii) %50 rock powder and %50 brick dust mixture. It was observed that the maximum dry unit weight decreased, and the optimum water content increased with the increase of the brick dust ratio in the mixtures tested.
Keywords: Construction and Demolition Material, Soil Improvement
1. Introduction Industrialization, urbanization and rapid increase in the world population result in high amount of waste material produced in particularly urbanized areas across the world. Construction and demolition wastes including concrete, brick, ceramic, glass and asphalt are one of the most widely produced by the communities. For example, in just Australia, 8.7 million tons of concrete waste, 1.3 million brick waste, 3.3 million rock waste, 1 million tons of glass waste, 1.2 million tons of dragged asphalt waste were annually stockpiled in landfill areas [1-3]. Reuse of such waste materials is significantly important to save the raw material resources and maintain an environmentally friendly life.
Therefore, in this study, use of two different waste materials, which are brick dust and rock powder, has been evaluated in order to use of them in road pavement design projects. The study aims to present a series of modified compaction testing results to evaluate relations among the water content, unit weight, and contents of both materials rock powder and brick dust.
208

Figure 1. Examples of construction and demolition materials; crushed brick, dragged asphalt, and crushed concrete [4].
2. Materials and MethodsIn this study, rock powder (RP), a quarry waste material, and brick dust (BD), a constructiondemolition waste, were used at different mixture contents.
The rock powder generated by crushing massive rocks into smaller aggregates was obtained from the quarries in/around Gaziantep region in Turkey. Hence, geological composition of this material would be same as the geological formation in the region. The brick dust was manually produced by crushing the bricks, construction element, into fines by using roller. Both waste materials the brick dust and the rock powder was sieved through the 0.075 mm in order to make sure that all the grains were fine. Figure 2 presents the waste materials tested during the experimental studies.
This study was carried out by a series of laboratory compaction tests by following the standard test methods for laboratory compaction characteristics of soil using modified effort (2,700 kN-m/m3) designated in D 1557 - 12e1 [5].
209

Figure 2. Waste materials used in the experimental studies, (left) rock powder, (right) brick dust.
The fact is that modified compaction test is one of the widely used laboratory tests based on the principle of compressing a sample compacted in five equal layers into a mold of a specificvolume under a certain energy in order to remove the air inside of the sample. As a result of theexperiment, the optimum water content and the corresponding maximum amount of compacted sample are able to be determined.
Slightly different from the standard procedures followed in the present study, the experimental equipment consists of two polyvinyl chloride (PVC) parts, two metal connection clamps, a hammer and a metal mold fixing assembly. Two parts of PVC mold with a diameter of 43.2 mm and a height of 98.5 mm were fixed with a plastic clamp and then placed in the metal mold fixing assembly. Each sample was mixed up to reach a homogeneous mixture. Then the soil sample was compacted in to five equal layers in the plastic mold. A-31-stroke were applied on to each layer. After 5 layers were completed, the compressed sample was weighed and then some of the sample was taken and left in the oven at 105°C in order to measure the water content. By this way, compaction curves for each sample was obtained by linking about eight experimental points. Figure 3 shows the equipment and the components used during the experimental studies. In the sample preparation process, an about 700 g of dry material mixture was used for each test. A total of about six kg of material mixture was used for each experiment. The samples with RP only (100% RP and 0% BD) started to be tested at 8% water content of the total weight. The samples with both RP and BD at different contents (50% SP and 50% BD; 70% SP an 30% BD) started to be tested at 14% water content of total weight. Then, the water contents added to the samples increased by the end of the experiment with two percent additions. The unit weight was calculated by dividing the weight of the compacted wet sample by its volume. And then, dry unit weight was calculated from the formula given below.
γd =γm
1+�𝑊𝑊𝑊𝑊100�
(1)
The γd is described as maximum dry unit weight, the γm is the bulk density, and the wc is the moisture content.
210

Figure 3. The compaction equipment and the components (plastic mold, clamps, hammer) used during the experimental studies.
3. Results and DiscussionFigure 4 presents the dry unit weight versus water content relation for the samples 100% RP,70% RP and 30% BD, and 50% RP and 50% BD. It was observed that increase in the amount ofBD decreases the maximum dry unit weight and increases the optimum moisture content.Maximum dry unit weight of the RP samples only was found to be slightly above the 17.5kN/m3, and its corresponding water content value was about 16%.
Maximum dry unit weight of the 70% RP and 30% BD samples only was about 16.5 kN/m3, and its corresponding water content value was found to be about 17%. Similarly, maximum dry unit weight of the 50% RP and 50% BD samples only was about 16.2 kN/m3, and its corresponding water content value was found to be about 20%. As can be seen from the plot area the increase in optimum water content could be attributed to the increase in brick dust content in the samples. The authors interpretation is that this behaviour could be because of the clay content available in the brick dust. The decrease in the maximum dry unit weight was also attributed to the brick's being a material with less strength than stone powder. A similar response with brick dust addition in a soil sample was also observed in the studies by Aatheesan et al [6] and Arulrajah et al [7].
211

Figure 4. The compaction testing results.
References 1. S. Victoria, Victorian Recycling Industries Annual Report 2008-2009, ISSN 1836-9902, Victoria,
VIC, Melbourne, 2010.2. N.Kondamundi et al., Spent Coffee Grounds as A Versatile Source of Green Energy, Journal
Agricultural Food Chemistry, Vol. 56, pp. 11757-17760, 20083. D.Hoornweg and P.Bhada-Tata, What a waste: A Global Review of Solid Waste Management,
World Bank, 20124. Cabalar, A.F., Abdulnafaa, M.D., Karabash, Z., Influences of Various Construction and Demolition
Materials on the Behavior of a Clay, Environmental Earth Sciences, Vol. 75, Issue. 9,5. ASTM D1557-12e, Standard Test Methods for Laboratory Compaction Characteristics of Soil Using
Modified Effort (56,000 ft-lbf/ft3 (2,700 kN-m/m3))6. T.Aatheesan et al., Crushed Brick Blends With Crushed Rock for Pavement System, Waste and
Resource Management, Vol.163, No.1, pp. 29-35, 20107. A. Arulrajah, J. Piratheepan, M. W. Bo ve N. Sivakugan, Geotechnical characteristics of recycled
crushed brick blends for pavement sub-base applications, Canadian Geotechnical Journal , Vol. 49,no. 7, pp. 796-811, 2012.
14,50
15,00
15,50
16,00
16,50
17,00
17,50
18,00
7,00 12,00 17,00 22,00 27,00 32,00
Dry
Uni
t Wei
ght (
kN/m
3)
Water Content (%)
0% BD and 100% RP30% BD and 70% RP50% BD and 50% RP
212

GEOMETRIC OPTIMIZATION OF A RIGHT ANGLE BRACKET TO MAXIMIZE THE FATIGUE LIFE USING TAGUCHI METHOD
MEHMET SEFA GÜMÜŞ *1, METE KALYONCU 1, VEYSEL ALVER 2
1 Konya Technical University, Faculty of Engineering and Natural Science, Department of Mechanical Engineering, Konya, TURKIYE.
2 MPG Machinery Production Group Inc. Co., Konya, TURKIYE
Abstract
In this study, the geometry of a right angle bracket support is optimized using the Taguchimethod so as to increase the fatigue life. Four different dimensions of the support are stated asthe parameters of the Taguchi method. A right angle bracket is simulated by FEM. The randomvibration analyses are carried out for each group of parameters based on the Taguchi L9 Orthogonal Array. Dirlik formula is used in the frequency domain to calculate fatigue life. The fatigue life on the new model which is suggested by Taguchi to maximize fatigue life is verified. The life of the bracket is increased from 450 hours to 1578 hours thanks to the application of Taguchi’s Method. It is shown that this approach is very convenient in the determination of the geometry of the components which are exposed to random loading.
Keyword: Vibration Fatigue, Taguchi, Random Loading
1. Introduction
The components are designed considering their working environment. The geometry of the components is firstly determined by design limitations. In modern applications, it is not sufficient to design a component without considering the optimization in terms of lifetime, weight and ease of production. Generally, inspecting the stability of the design under static loads is not a difficult process. The fatigue failure must be considered when the load varies with the time. If the loading is a random vibration, the stresses on the component could be simulated by applying modal analysis and random vibration analysis. In a random vibration environment, the components are excited based on their mode shapes and natural frequencies. The mode shapes and the natural frequencies of the components basically depend on the geometry of the component. As a result, changing in the geometry results in a nonlinear change in the natural frequencies and the modes shapes of the component which has very significant effects on fatigue life in a random vibration environment. The geometrical optimization of components so as to maximize the fatigue life under random vibration environment is a crucial and complicated process.
Right angle brackets are widely used in the industry to attach components to the main body. In this study, the gusset geometry of a right angle bracket is optimized in order to increase in the
213

1
fatigue life of the bracket in the vibration environment. Taguchi's method has been previously applied to the fatigue analysis of right angle brackets in the study of Barea et al. [1]. They usedFindley’s critical-plane model to describe fatigue failure under multiaxial stress. In the geometricoptimization of a rectangular beam type load cell, Kalai and his friends are also applied the Taguchi method in their study [2]. Another use of the Taguchi method in fatigue analysis is about the effects of notch parameters on the life of super duplex stainless steel [3]. In this study,the Dirlik method is used to calculate the fatigue life in the frequency domain [4]. Dirlik methodis one of the preferred frequency-domain vibration fatigue methods thanks to its accuracy in the prediction of life. As it is aimed to carry out a quick optimization with a limited number ofiteration, the fatigue damage is calculated considering the uniaxial stresses. This time-saving optimization method could be easily used in the industry.
2. Model The dimensions of the right angle bracket are shown in Figure 1. There are four length parameters on the gusset of the bracket indicated as height, width, thickness, and tip in the figure. Taguchi L9 Orthogonal Array is applied considering 4 parameters with 3 levels of each parameter. The levels of each parameter are determined by the geometrical limitations as shown in Table 1. The material of the bracket is selected as AL6061-T6 because of the wide use in the aeronautic and the automotive industry [5].
Figure 1. Dimensions of the Right Angle Bracket
Sets of parameters suggested by Taguchi are modeled and simulated in ANSYS. Modal Analyses and Random Vibration Analyses are carried out for each set of parameters. The model is fixed at
214

the holes on the short edge of the bracket. A mass of 3 kg is distributed over the slot which is atthe end of the long edge of the bracket.
Table 1. Taguchi Variables and Their Levels
Variables Level 1 Level 2 Level 3 Height 10 mm 25 mm 40 mm Width 10 mm 55 mm 100 mm
Thickness 2 mm 9 mm 16 mm Tip 2 mm 5 mm 8 mm
A notch is added between the fixed holes of the bracket and the maximum height level of the gusset in order to have a control on the failure point. The random loading is applied to all fixedsupports as a white noise between 30Hz and 300Hz with a power of 0.05g2/Hz. The loading conditions are determined not only to avoid sudden damage for all runs but also to have a sufficient impact on the model to identify the geometries. It is observed that because the natural frequencies and the mode shapes are very different among the iterations, the point where the failure possibly occurs varies among the notch, the upper and the bottom point of the gusset. These points which are shown in Figure 2 are tracked during the simulations. Response Power Spectral Densities on these points are obtained in the simulation. Minitab software is used in order to analyze the Taguchi Orthogonal Array.
Figure 2. Monitored Points on the Model
215

3. Method Dirlik method is applied to calculate fatigue life by using RPSD data obtained in the analyses. Dirlik proposes to use the probability density as stated in Eq.1. The coefficients are calculated as shown in Eq.2-5 which are based on computer simulations of time series data. The spectral moments of Power Spectral Density indicated as m0, m1, m2, m4 are calculated by using Eq.6.
𝑝𝑝𝐷𝐷𝐷𝐷𝐷𝐷𝐷𝐷𝐷𝐷𝐷𝐷(𝑆𝑆) =1𝑍𝑍
�𝐷𝐷1𝑄𝑄𝑒𝑒−𝑍𝑍𝑄𝑄 𝑆𝑆 +
𝐷𝐷2𝑍𝑍𝑆𝑆𝑅𝑅2
𝑒𝑒−𝑍𝑍22𝑅𝑅2 𝑆𝑆2 + 𝐷𝐷3𝑍𝑍𝑒𝑒
−𝑍𝑍22 𝑆𝑆2� (1)
𝑍𝑍 =𝑆𝑆
�𝑚𝑚0 𝑥𝑥𝑚𝑚 =
𝑚𝑚1
𝑚𝑚0�𝑚𝑚2
𝑚𝑚4(2)
𝐷𝐷1 = 2�𝑥𝑥𝑚𝑚−𝑎𝑎22�1+𝑎𝑎22
𝐷𝐷2 = 1−𝑎𝑎2−𝐷𝐷1+𝐷𝐷12
1−𝑅𝑅(3)
𝐷𝐷3 = 1 −𝐷𝐷1 − 𝐷𝐷2 (4)
𝑅𝑅 =𝑎𝑎2 − 𝑥𝑥𝑚𝑚 − 𝐷𝐷12
1 − 𝑎𝑎2 − 𝐷𝐷1 + 𝐷𝐷12 𝑄𝑄 =
1.25(𝑎𝑎2 − 𝐷𝐷3 − 𝐷𝐷2𝑅𝑅)𝐷𝐷1
(5)
𝑚𝑚𝐷𝐷 = � 𝑓𝑓𝐷𝐷𝐺𝐺𝑋𝑋𝑋𝑋(𝑓𝑓)𝑑𝑑𝑓𝑓∞
0 (6)
The fatigue life is calculated by substituting the probability density in Eq.7. vp is the peak occurrence rate. 𝐶𝐶 and 𝑘𝑘 are the constant and the Basquin exponent of the S-N curve, respectively. A detailed explanation could be found in Mršnik’s review of Vibration Fatigue Theory [6].
𝐷𝐷 = �𝑛𝑛𝑁𝑁
= ��𝑣𝑣𝑝𝑝𝑇𝑇𝑓𝑓�𝑝𝑝(𝑆𝑆)𝑑𝑑𝑆𝑆
𝐶𝐶𝑆𝑆−𝐷𝐷= 1
∞
0
(7)
4. Results and DiscussionThe fatigue life of each run is calculated as shown in Table.2. The output of the Taguchi array isselected as the fatigue life. After the application of Taguchi, the most suitable levels for eachparameter are obtained as demonstrated in Figure 3. The best group of four parameters is foundby Taguchi’s method considering the maximum life. The height, the width, the thickness, and thetip are selected as 40mm, 10mm, 9mm, and, 2mm, respectively. A new model is created withproposed levels of the parameters. The fatigue life of suggested geometry is also tabulated at theend of Table 2.
216

Figure 3. Taguchi Results - Larger is Better
It could be observed that within the determined limits, an increase in the height of the gusset hasa positive impact on the fatigue life of the bracket, while an increase in the tip dimension results in a decrease in the life according to Taguchi. It is not possible to make any assessment for the thickness parameter because the effect of the thickness is not clear in Taguchi outputs. After the application of suggested levels of parameters, the life of the bracket increased more than 3.5 times. On the other hand, the impacts of these parameters are only valid for the specifiedgeometry and loading conditions. The natural frequencies and the mode shapes of the geometriesare the most influential criteria while calculating the fatigue life under random excitation. A change in some length parameters leads to stimulate new mode shapes that have considerable mass participation by shifting the natural frequencies, the stresses due to random loading could suddenly increase. If the geometry or the loading conditions change, the effects of the parameters must be reassessed and selected.
Table 2. Taguchi P=4, L=3 Orthogonal Array
Number Height Width Thickness Tip Fatigue Life (sec)
Fatigue Life (hour)
#1 1 1 1 1 7.91E+5 219.65 #2 1 2 2 2 3.47E+5 96.27 #3 1 3 3 3 4.06E+4 11.29 #4 2 1 2 3 7.40E+5 205.62 #5 2 2 3 1 6.91E+5 192.08 #6 2 3 1 2 1.82E+5 50.67 #7 3 1 3 2 9.88E+5 274.42 #8 3 2 1 3 3.56E+5 98.88 #9 3 3 2 1 1.62E+6 449.72
Taguchi Suggestion 3 1 2 1 5.68E+6 1578.08
217

5. Conclusion Determining the length of the four different dimensional parameters which has three levels causes to analyses of 81 different models. If the parameters of the geometry are increased, the number of possible combinations triples considering three levels for each parameter. It could be very time consuming to check all combinations of the geometry to find a convenient group of parameters. In order to avoid wasting time, it is very reasonable to check only some of the combinations of parameters by considering the Taguchi Method. The parameters could be increased depending on the geometry. In conclusion, using the Taguchi method in the first stages of design is very convenient and aquick way to optimize the dimensions of components that are subjected to random loadings.
Acknowledgments: The authors acknowledge to “MPG Machinery Production Group Inc. Co.” for the support in this study.
References
1. Barea R., Novoa S., Herrera F., Achiaga B., Candela N.. A geometrical robust design usingthe Taguchi method: application to a fatigue analysis of a right angle bracket. Dyna. 2018,85.205, (37-46).
2. Kalai D. M., Kamble V.A., Rathod A.M., Khot B. K.. Parametric Optimization ofRectengular Beam Type Load Cell Using Taguchi Method. International Journal ofComputer Engineering In Research Trends. 2016, 3.11, (596-601).
3. Kumar J. J., Diwakar G., Satyanarayana V. V.. TOPSIS – Taguchi Analysis of NotchParameters on the Fatigue Life of Super Duplex Stainless Steel. International Journal ofInnovative Technology and Exploring Engineering. 2019, 9.2.
4. Dirlik T. Application of computers in Fatigue Analysis. Ph.D. dissertation, Dept. Computer-Aided Eng., University of Warwick. 1985.
5. Selvakumar J., Mohangift M. D., Johnalexis S.. Experimental Investigation on Fatigue CurveParameters of 6061 T6 Aluminium Alloy. International Journal of Applied Engineering.2016, 11-3, (2108-2111).
6. Mršnik M., Slavič J., and Boltežar M.. Frequency-domain methods for a vibration-fatigue-life estimation–application to real data. International Journal of Fatigue. 2013, 47, (8-17).
218

ENERGY AND EXERGY ANALYSIS OF A FLUIDIZED BED SEWAGE SLUDGE INCINERATION PLANT
AYŞEGÜL ABUŞOĞLU *1, N. SUAT ATAY 2, ALPEREN TOZLU3
1 İstanbul Technical University, Mechanical Engineering Department, 34437 İstanbul, TURKEY 2 Ness Energy Consulting Engineering Ltd. Co., Gaziantep, TURKEY
3Bayburt University, Mechanical Engineering Department, 69000 Bayburt, TURKEY
Abstract This paper presents the thermodynamic analysis of an existing fluidized bed sewage sludge incineration plant (SSIP). Formulations and procedure for this analysis are provided and applied to the GASKI Fluidized bed SSIP installed in Gaziantep, Turkey. The total sewage sludge incineration capacity of the plant is 300 tons per day. The exergetic efficiency of the plant is determined to be 13.24%. The components with the highest amounts of exergy destruction in the process are identified and possibilities of improving them are discussed in order to increase the overall efficiency of the plant. The fluidized bed combustor which is necessary for heat supply is found to be the most exergy destructive component followed by economizer units, i.e. preheaters. Reduction of the exergy losses in the preheaters by subsequent feeding of the heat released into, e.g. district heating network will increase the exergetic efficiency of the complete process. Furthermore, it could be made use of the high temperature level of the process in the fluidized bed combustor for the generation of electric power by installing an ORC unit.
Keyword: Fluidized bed incineration, Sewage sludge, Energy, Exergy, Exergy destruction.
1. IntroductionThe history of sewage sludge incineration dates back to the 1930s, when the first sewage sludgeincineration plant started operating in the USA. However, incineration of wastewater sludge didnot become popular until the 1960s. Combustion efficiency of the first generation sewage sludgeincineration plants was quite low, they needed very high amounts of supplementary fuel and didnot have high drying efficiency. Today, the disposal of wastewater sludge, which is accepted asthe most important by-product of wastewater treatment plants, has also become one of the mostimportant environmental problems.
The sewage sludge combustion process is one of the remarkable disposal methods of municipal sewage sludge and many researchers have studied on it. In a comprehensive study on the incineration of sewage sludge [1], sludge stabilization methods, burning sludge with an auxiliary fuel, increasing efficiency by burning preheated sewage sludge were investigated. In a study [2] where the most efficient and optimum methods for energy recovery and for disposal of wastewater sludge were investigated, it was reported that the sludge incineration process was the most appropriate one among current scientific and engineering approaches. Once incineration was widely accepted as one of the most efficient disposal methods, many researchers have worked on this subject including fluidized bed sewage sludge incineration and energy recovery based on sludge combustion. [3-7]. Experimental searches investigating the combustion
219

efficiency of sewage sludge at different dryness rates were performed in sludge incineration plants consisting of medium to high capacities, eg 100 tons/day [8-9]. In a study focusing on possible environmental problems during the disposal of sewage sludge, it was reported thatemission values are very promising when a certain proportion of dried sludge is disposed of with a two-stage system, namely gasification and incineration [10]. Considering that not only the incineration process is environmentally sufficient for the disposal of sewage sludge, but also energy recovery is required, the researchers aimed to increase the total efficiency of the sludgecombustion process [11]. There are number of studies in the open literature examining power generation by hybrid, combined fermentation, and gasification. [12].
One of the earliest studies on the combustion of sewage sludge in fluidized bed incinerators was on the energy performance of an advanced fluidized bed sludge combustion system consisting of an independently controlled secondary vortex combustion chamber [13]. In an experimental study examining industrial fluidized bed sludge combustion plants, gases after combustion process were measured, and the levels of gases such as dioxins, which are extremely environmentally polluting and harmful to human health, were measured under different operating conditions. It was reported that the measured dioxin level at the boiler outlet was mainly affected by the combustion conditions [14]. Another study in which the parameters determining the design and operating conditions of sewage sludge incineration furnaces and the combustion process in these furnaces were examined and discussed within the framework of environmental pollutants, has been considered as one of the important studies conducted in this field [15]. The high pressure drop that occurs in fluidized bed sludge combustion boilers was tried to be improved in a study suggesting a design that improves heat and mass transfer [16]. In the open literature, there are studies on the use of sewage sludge incineration plants in combination with combined heat and power generation and energy and exergy-based analyzes of this integrated system [17-20]. In most of these studies, optimization of heat and power generation emerges as the most fundamental issue. On the other hand, the use of waste heatresulting from the burning of sewage sludge in district heating applications has become highly popular in recent years, especially in countries within the European Union. Thus, economic, and environmental analysis of the transporting hot water should be made depending on the regionalconditions. Drying the sewage sludge in incineration plants and using the remaining heat fordistrict heating applications are the most important issues for the effective and efficient disposal of sludge. In addition, the possibility of generating electricity at low temperature by using possible waste heat sources in the system also makes it attractive to use a system such as Organic Rankine Cycle.
In this paper, an actual sewage sludge incineration plant (SSIP) is considered. The scope and methodology of this study may help in tackling some of the difficulties associated with the flow scheme of the actual fluidized bed SSIPs. The use of second-law analysis based on exergy together with conventional energy analysis provides a more complete analysis of the system. Based on the open literature search, this study appears to be one of the systematic and comprehensive studies of thermodynamic analysis of a fluidized bed sewage sludge incineration system. First, the system and its main units are described. This is followed by the development of the analysis procedure for the system components based on both energy and exergy methods. The developed procedure is applied to an existing fluidized bed SSIP located in Gaziantep using its actual operational data.
220

2. Description of GASKI Fluidized Bed SSIP GASKİ fluidized bed SSIP is Turkey's first sewage sludge incineration facility and considering the infrastructure needs of the city of Gaziantep, it was commissioned in 2012 for the incineration of total 300 tons of sludge per day. Sewage sludges collected from the three advanced biological wastewater treatment systems of the city are first dried in the furnace and then burned in the fluidized bed incinerator resulting ash. The incinerator receives an average of 300 tons of sewage sludge with a dry matter content of 27% per day. In the facility, first, thermal drying is applied to the sewage sludge and the amount of dry matter in its content is increased to 40-50%. It has been reported by the facility management that the combustion efficiency reaches its highest value when the dry matter content of the sludge is between 50-60%. After the drying process, the sewage sludge is burned in a fluidized bed boiler and 10-12 tons of ash is produced per day while 850-900ºC of exhaust gas is released because of the combustion. The systemprovides the energy required to dry the sludge from this exhaust gas. In the facility, natural gas is used as auxiliary fuel until the boiler temperature reaches to 650ºC during the combustion, then,when the temperature reaches to 850-900ºC, it is possible to burn the sludge without the need for additional fuel. A flue gas purification system is used to prevent combustion gases from harming the environment. The final result of the sludge incineration process is ash with a dry matter content of 99%, in which the harmful pathogens inside have been destroyed by burning the sludge cake while its volume has been reduced by 90% and is completely harmless to the environment. An average of 12 tons of ash is produced every day at the facility and it is buried to the municipal solid waste land and eliminated. The process flow schematic of the facility is given in Fig.1 and the sub-components of the fluidized bed SSIP are listed in Table 1.
Figure 1. Process flow schematic of GASKI fluidized bed SSIP
221

Table 1. The sub-components of the fluidized bed SSIP Line No Component Name Quantity Unit Power
Cons. (kW) Flow Rate
(m3/h) 1 Fresh Air Supply Fan 1 75 30000 2 Fluidized Bed Combustor with Hot Oil Heat Exchanger*1 1 22700 - 3 Economizer 3 - - 4 Cyclone 1 - - 5 Dust Filter 1 - - 6 Ash Supply Fan 3 7.5 16000 7 Economizer Fan 1 7.5 16000 8 Dust Supply Fan 1 7.5 16000 9 Hot Oil Circulation Pump **2 3 75 22000 10 Mixer Pump (Drying Process) 1 3 - 11 Thermal Dryer 1 - - 12 Dryer Conveyor Motor 1 90 - 13 Sludge Feeding Pump 3 11 - 14 Oil Heat Exchanger 6 7.5 - 15 Condenser 1 - - 16 Condenser Suction Fan 1 11 - 17 Flue Gas Suction Fan 1 90 50000 18 Wet Chimney 1
3. Energy and Exergy Analysis of the Fluidized Bed SSIP The GASKI fluidized bed SSIP is divided into two sub-systems for a thermodynamic analysis in detail. The following assumptions are made for thermodynamic analysis:
• All subsystems in the fluidized bed SSIP operate in the steady-state conditions.• The values for the reference environment (dead state) temperature and pressure are taken
as 15°C and 1.01325 bar, respectively.• The kinetic and potential energy changes are negligible.• Standard flue gas (exhaust) is composed of Ar, CO2, H2O and N2 and the percentages of
the components are 0.82%, 9.50%, 19.19%, 70.49% respectively. Standard air iscomposed of Ar, CO2, H2O, N2, O2 and percentages of the components are 0.92%,0.03%, 1.01%, 77.29% and 20.75% respectively
The main energy and exergy relations are presented in more detail elsewhere [21-22]. For detailed energetic and exergetic analysis in this study, each subsystem of the fluidized bed SSIP is separated into its components. Mass, energy and exergy balances and various efficiencies are provided along with the schematic of that particular component where the flow streams based on the states in Fig. 1 are indicated in Tables 2 and 3.
4. Results and DiscussionEnergy and exergy analysis of the GASKI fluidized bed SSIP was performed using aneducational version of Cycle-Tempo software [23]. The temperature, pressure, and mass flowrate data and certain exergy evaluations of the plant according to the nomenclature shown inTables 2 and 3 are presented in Tables 4 and 5, respectively.
222

Table 2. Energy and exergy equations of the subcomponents of the 1st subsystem of the fluidized bed SSIP
FLU
IDIZ
ED B
ED
CO
MB
UST
OR
ṁ1 + ṁ7 + ṁ3 = ṁ4 + ṁ5
ṁ1 ∗ ℎ1 + ṁ7 ∗ ℎ7 + ṁ3 ∗ ℎ3 = ṁ4 ∗ ℎ4 + ṁ5 ∗ ℎ5
𝐸𝐸𝐸𝐸𝐷𝐷 = ṁ3 ∗ 𝛹𝛹3 + ṁ1 ∗ 𝛹𝛹1 + ṁ7 ∗ 𝛹𝛹7 − ṁ4 ∗ 𝛹𝛹4− ṁ5 ∗ 𝛹𝛹5
𝜀𝜀 =ṁ4 ∗ 𝛹𝛹4 + ṁ5 ∗ 𝛹𝛹5
ṁ3 ∗ 𝛹𝛹3 + ṁ1 ∗ 𝛹𝛹1 + ṁ7 ∗ 𝛹𝛹7
ECO
NO
MIZ
ER 1
ṁ7 = ṁ6, ṁ8 = ṁ5
ṁ5(ℎ5 − ℎ8) = ṁ7(ℎ7 − ℎ6)
𝐸𝐸𝐸𝐸𝐷𝐷 = ṁ5(𝛹𝛹5 − 𝛹𝛹8) −ṁ6(𝛹𝛹7 − 𝛹𝛹6)
𝜀𝜀 =ṁ5(𝛹𝛹5 − 𝛹𝛹8)ṁ6(𝛹𝛹7 − 𝛹𝛹6)
ECO
NO
MIZ
ER 2
ṁ8 = ṁ9, ṁ2 = ṁ6
ṁ6(ℎ6 − ℎ2) = ṁ9(ℎ8 − ℎ9)
𝐸𝐸𝐸𝐸𝐷𝐷 = ṁ8(𝛹𝛹8 − 𝛹𝛹9) −ṁ6(𝛹𝛹6 − 𝛹𝛹2)
𝜀𝜀 =ṁ6(𝛹𝛹6 − 𝛹𝛹2)ṁ8(𝛹𝛹8 − 𝛹𝛹9)
ECO
NO
MIZ
ER 3
ṁ10 = ṁ9, ṁ12 = ṁ11
ṁ10(ℎ9 − ℎ10) = ṁ11(ℎ12 − ℎ11)
𝐸𝐸𝐸𝐸𝐷𝐷 = ṁ9(𝛹𝛹9 − 𝛹𝛹10) −ṁ11(𝛹𝛹12 − 𝛹𝛹11)
𝜀𝜀 =ṁ11(𝛹𝛹12 − 𝛹𝛹11)ṁ9(𝛹𝛹9 − 𝛹𝛹10)
Table 3. Energy and exergy equations of the subcomponents of the 2nd subsystem of the fluidized bed SSIP
CY
CLO
NE
ṁ2 + ṁ10 = ṁ1
ṁ1 ∗ ℎ1 = ṁ2 ∗ ℎ2 + ṁ10 ∗ ℎ10
𝐸𝐸𝐸𝐸𝐷𝐷 = ṁ1 ∗ 𝛹𝛹1 − ṁ2 ∗ 𝛹𝛹2 − ṁ10 ∗ 𝛹𝛹10
𝜀𝜀 =ṁ2 ∗ 𝛹𝛹2 + ṁ10 ∗ 𝛹𝛹10
ṁ1 ∗ 𝛹𝛹1
DU
ST F
ILTE
R ṁ3 + ṁ8 = ṁ2
ṁ2 ∗ ℎ2 = ṁ3 ∗ ℎ3 + ṁ8 ∗ ℎ8
𝐸𝐸𝐸𝐸𝐷𝐷 = ṁ2 ∗ 𝛹𝛹2 − ṁ3 ∗ 𝛹𝛹3 − ṁ8 ∗ 𝛹𝛹8
𝜀𝜀 =ṁ3 ∗ 𝛹𝛹3 + ṁ8 ∗ 𝛹𝛹8
ṁ2 ∗ 𝛹𝛹2
223

ASH
FA
N
ṁ11 = ṁ10
Ẇ𝑓𝑓𝑓𝑓𝑓𝑓,𝑓𝑓𝑎𝑎𝑎𝑎𝑎𝑎𝑓𝑓𝑎𝑎 = ṁ11(ℎ11 − ℎ10)
Ẇ𝑓𝑓𝑓𝑓𝑓𝑓,𝑖𝑖𝑖𝑖𝑖𝑖𝑓𝑓𝑎𝑎𝑖𝑖𝑖𝑖𝑖𝑖𝑖𝑖𝑎𝑎 = ṁ11(𝛹𝛹11 − 𝛹𝛹10)
𝐸𝐸𝐸𝐸𝐷𝐷 = Ẇ𝑓𝑓𝑓𝑓𝑓𝑓,𝑓𝑓 −Ẇ𝑓𝑓𝑓𝑓𝑓𝑓,𝑖𝑖𝑖𝑖
𝜀𝜀 =Ẇ𝑓𝑓𝑓𝑓𝑓𝑓,𝑖𝑖𝑖𝑖
Ẇ𝑓𝑓𝑓𝑓𝑓𝑓,𝑓𝑓
DU
ST F
ILTE
R F
AN
ṁ8 = ṁ9
Ẇ𝑓𝑓𝑓𝑓𝑓𝑓,𝑓𝑓𝑎𝑎𝑎𝑎𝑎𝑎𝑓𝑓𝑎𝑎 = ṁ9(ℎ9 − ℎ8)
Ẇ𝑓𝑓𝑓𝑓𝑓𝑓,𝑖𝑖𝑖𝑖𝑖𝑖𝑓𝑓𝑎𝑎𝑖𝑖𝑖𝑖𝑖𝑖𝑖𝑖𝑎𝑎 = ṁ9(𝛹𝛹9 − 𝛹𝛹8)
𝐸𝐸𝐸𝐸𝐷𝐷 = Ẇ𝑓𝑓𝑓𝑓𝑓𝑓,𝑓𝑓 −Ẇ𝑓𝑓𝑓𝑓𝑓𝑓,𝑖𝑖𝑖𝑖
𝜀𝜀 =Ẇ𝑓𝑓𝑓𝑓𝑓𝑓,𝑖𝑖𝑖𝑖
Ẇ𝑓𝑓𝑓𝑓𝑓𝑓,𝑓𝑓
IND
UC
ED D
RA
FT
FAN
ṁ4 = ṁ3
Ẇ𝑓𝑓𝑓𝑓𝑓𝑓,𝑓𝑓 = ṁ4(ℎ4 − ℎ3)
Ẇ𝑓𝑓𝑓𝑓𝑓𝑓,𝑖𝑖𝑖𝑖 = ṁ4(𝛹𝛹4 − 𝛹𝛹3)
𝐸𝐸𝐸𝐸𝐷𝐷 = Ẇ𝑓𝑓𝑓𝑓𝑓𝑓,𝑓𝑓 −Ẇ𝑓𝑓𝑓𝑓𝑓𝑓,𝑖𝑖𝑖𝑖
𝜀𝜀 =Ẇ𝑓𝑓𝑓𝑓𝑓𝑓,𝑖𝑖𝑖𝑖
Ẇ𝑓𝑓𝑓𝑓𝑓𝑓,𝑓𝑓
WET
CH
IMN
EY
CO
OLE
R
ṁ7 = ṁ6, ṁ4 = ṁ5
ṁ4(ℎ4 − ℎ5) = ṁ7(ℎ6 − ℎ7)
𝐸𝐸𝐸𝐸𝐷𝐷 = ṁ4(𝛹𝛹4 − 𝛹𝛹5) −ṁ7(𝛹𝛹6 − 𝛹𝛹7)
𝜀𝜀 =ṁ7(𝛹𝛹6 − 𝛹𝛹7)ṁ4(𝛹𝛹4 − 𝛹𝛹5)
Table 4. The 1st subsystem of the fluidized bed SSIP data, thermodynamic properties, and exergies in the plant with respect to state points in Table 2
State Fluid P (bar) T (˚C) ṁ (kg/s) h (kJ/kg) s (kJ/kg*K) Ex (kj/kg) 1 Sludge 1.013 200.00 2.344 -12803.06 8.0141 6286.29 2 Air 1.100 24.00 3.549 -89.76 6.8726 7.09 3 Oil 1.013 200.00 5.555 253.07 0.6587 162.27 4 Oil 1.013 240.00 5.555 325.85 0.8062 192.52 5 Flue gas 1.013 994.00 5.893 -1820.24 8.9532 781.85 6 Air 1.095 538.00 3.549 450.28 7.9208 245.10 7 Air 1.013 669.00 3.549 597.37 8.1112 337.30 8 Flue gas 1.013 876.00 5.893 -1980.69 8.8203 659.69 9 Flue gas 1.012 628.78 5.893 -2305.95 8.5022 426.09
10 Flue gas 1.010 442.00 5.893 -2539.90 8.2124 275.64 11 Air 1.013 24.00 5.258 -89.76 6.8963 0.25 12 Air 1.013 279.95 5.258 172.46 7.5315 79.39
224

Table 5. The 2nd subsystem of the fluidized bed SSIP data, thermodynamic properties, and exergies in the plant with respect to state points in Table 3
State Fluid P (bar) T (˚C) ṁ (kg/s) h (kJ/kg) s (kJ/kg*K) Ex (kj/kg) 1 Flue gas 1.003 442.00 5.893 -2539.90 8.2145 257.92 2 Flue gas 1.003 222.00 5.186 -2801.26 7.7776 126.82 3 Flue gas 1.003 186.00 4.460 -2842.66 7.6918 111.00 4 Flue gas 1.077 196.29 4.460 -2830.87 7.6956 121.66 5 Flue gas 1.077 65.88 4.461 -3383.60 7.4850 91.25 6 Water 1.077 65,88 1.388 -15695.67 4.4163 10.75 7 Water 1.013 30.00 1.569 -15845.88 3.9487 0.17 8 Ash 1.006 154.00 0.726 -2879.17 7.6084 99.36 9 Ash 1.041 158.56 0.726 -2874.00 7.6102 104.00 10 Ash 1.003 154.00 0.707 -2879.17 7.6084 99.36 11 Ash 1.041 158.56 0.707 -2874.00 7.6102 104.00
Energy and exergy analyses results of the fluidized bed SSIP is given in Table 6.
Table 6. Energetic and exergetic analyses results for the components of both subsystems in the fluidized bed SSIP
Component name Energy Loss (kW) Exergy Destruction (kW) Exergetic Eff. (%) Fluidized Bed Comb. -17567.91 11156.69 33.72
Economizer 1 423.53 392.65 45.46 Economizer 2 0.12 531.98 61.36 Economizer 3 0.00 470.50 46.93
Cyclone 1595.28 793.59 47.79 Dust Filter 241.20 90.50 86.24 Ash Fan -3.66 -3.28 76.19
Dust Filter Fan -3.76 -3.37 76.19 Induced Draft Fan -52.56 -47.54 76.89
Wet Chimney Cooler -0.35 104.43 80.76
We note the followings from these results: • The combustion chamber including the fluidized bed combustor has the highest exergy
destruction which is nearly 11,157 kW of the SSIP. The exergetic efficiency of thiscomponent is 33.72%. Exergy destruction of combustion process is mainly due to theirreversibilities associated with chemical reactions as well as the heat transfer. Othercauses of exergy destruction in the fluidized bed combustor are friction and mixing.Some part of this destruction might be avoided by a more intensive preheating of thesludge and a reduction of air excess.
• The second highest exergy destruction in the plant is taken place in the cyclone. Thisapparatus is used as one of the separators in the plant and separates ashes from the fluegas. The cyclone has the exergy destruction amount of about 794 kW. The reason of it isdue to the separation process of ash from flue gas; while ash is separating from flue gas,it carries the exergy as heat transfer to surrounding.
• The third largest share of the total exergy destruction of the overall plant originates fromone of the economizers (Economizer-2) which is about 532 kW. The exergetic efficiencyof this second preheater is approximately 61%. Exergy destruction in a heat exchanger iscaused by heat transfer depends on both the temperature level of heat transfer and thetemperature difference between the material flows. Exergy destruction in the
225
Economizer-2 is caused by the relatively high mean temperature difference of about 250ºC. As a result, the temperature difference of the flows should be minimized to reduce exergy destruction. This can be achieved by two measures: increase of the heat transfer area and decrease of the airflow.
• The other two of the air preheaters (Economizer-1 and Economizer-3) have higheramounts of exergy destructions in the SSIP, approximately 393 and 471 kW,respectively. These high amount of exergy destructions are mainly due to the relativelyhigh temperature differences of the fluids.
• Contrary to the components described above, the product conditioning components play aminor role in exergy analysis. This is mainly due to the fact that they do not serve forenergy conversion, but for material separation. Exergy destruction in these components ismainly due to the friction. In the scrubber (wet chimney cooler), exergy destruction bymixing also has to be considered. Its share in exergy destruction, however, is small due tothe uniform temperature and pressure level.
• The overall exergetic efficiency calculated for the fluidized bed SSIP is 13.24%. Toincrease this value, measures should be taken in addition to the described reduction ofexergy destruction in the sub-components. Reduction of the exergy losses in thepreheaters by subsequent feeding of the heat released into, e.g. district heating networkwill increase the exergetic efficiency of the complete process. Furthermore, it could bemade use of the high temperature level of the process in the fluidized bed combustor forthe generation of electric power by installing an ORC unit.
5. ConclusionsThe procedure and formulations developed for energy and exergy evaluation are applied to anexisting fluidized bed sewage sludge incineration plant using actual plant data. The resultsprovide important information regarding exergetic performance of the entire plant and itssubcomponents through exergy destructions and exergy efficiencies. This identifies the sites withthe greater exergy destructions and consequently greater potential for improvements. Thecomponent with the highest share in the exergy destruction of the overall SSIP is the fluidizedbed combustor required for heat supply. Furthermore, the components of air preheater contributeto destroying the exergy of the overall system. As chemical reactions are always associated withexergy destruction, exergy destruction during combustion can be reduced to a limited extent onlyby preheating the sludge and reducing the excess air. However, these measures need to beadapted iteratively. Exergy destruction by heat transfer may be reduced by reducing the meantemperature difference between the material flows or by increasing the temperature of heattransfer. The mean temperature level in the air preheater may be reduced by a reduction of the airmass flow or an increase in heat transfer areas. The latter requires a more detailed analysis totrade-off between the investment costs and increase of efficiency.
Acknowledgement: The authors greatly appreciate the plant management and engineers of GASKI-SSIP for their cooperation throughout this study and supplying data for the plant.
226
References
1. Werther, J., Ogada, T., Sewage Sludge Combustion, Progress in Energy and CombustionScience. 1999, 25:55-116.
2. CChem, P., L., Hudson, J., A., Incineration – Is There a Case? Water and EnvironmentJournal. 2005, 19:286-295.
3. Flaga A., The aspects of sludge thermal utilization: Integration and optimization of urbansanitation systems, Wyd. Royal University of Technology (KTH), Sweden, Stockholm.Report No 11. ISBN 91-7283-664-4, 2003.
4. Khiari, B., Marias, F., Zagrouba, F., Vaxelaire J., Transient mathematical modelling of afluidized bed incinerator for sewage sludge, Journal of Cleaner Production. 2006, 16:178-191.
5. Yang, Y., B., Sliwinski, L., Sharifi, V., Swithenbank, J., Dynamic behavior of sewage sludgeincineration in a large – scale bubbling fluidized bed in relation to feeding – rate variations,Fuel. 2007, 87:1552-1563.
6. Murakami, T., Suzuki, Y., Nagasawa, H., Yamamoto, T., Koseki, T., Hirose, H., Okamoto,S., Combustion characteristics of sewage sludge in an incineration plant for energy recovery,Fuel Processing Technology. 2009, 90:778-783.
7. Werle, S., Wilk, R., K., A review of methods for the thermal utilization of sewage sludge:Polish perspective, Renewable Energy. 2010, 35:1914-1919.
8. Li, B., Wang, F., Chi, Y., Yan, J-H., Study on optimal energy efficiency of a sludge drying –incineration combined system, Journal of Material Cycles and Waste Management. 2014,16:684-692.
9. Li, S., Li, Y., Lu, Q., Zhu, J., Yao, Y., Bao, S., Integrated drying and incineration of wetsewage sludge in combined bubbling and circulating fluidized bed units, Waste Management.2014, 34:2561-2566.
10. Zhu, J-G., Yao, Y., Lu, Q-g., Gao, M., Ouyang, Z-Q., Experimental investigation ofgasification and incineration characteristics of dried sewage sludge in a circulating fluidizedbed, Fuel. 2015, 150:441-447.
11. Bianchini, A., Bonfiglioli L., Pellegrini, M., Saccani, C., Sewage sludge drying processintegration with a waste-to-energy power plant, Waste Management. 2015, 42:159-16.
12. Speidel, M., Kraaij, G., Wörner A., A new process concept for highly efficient conversion ofsewage sludge by combined fermentation and gasification and power generation in a hybridsystem consisting of a SOFC and a gas turbine, Energy Conversion and Management. 2015,98:259-267.
13. Watanbe, T., Asai, M., Kondo, T., Shimizu, M., Takeuchi, Y., Aramaki, H., Naito,Masanobu., An advanced fluidized-bed swirl incinerator for dioxin control during municipalwaste disposal, Chemosphere. 1996, 32:177-187.
14. Ishikawa, R., Buekens, A., Huang, H., Watanabe, K., Influence of combustion conditions ondioxin in an industrial-scale fluidized-bed incinerator: Experimental study and statisticalmodelling, Chemosphere. 1997, 35:465-477.
15. Caneghem, J., V., Brems, A., Lievens, P., Block, C., Billen, P., Vermeulen, I., Dewil, R.,Baeyens, J., Vandecasteele, C., Fluidized bed waste incinerators: Design operational andenvironmental issues, Progress in Energy and Combustion Science. 2012, 38:551-582.
16. Shukrie, A., Anuar, S., Alias, A., Heat transfer of alumina sands in a fuidized bed combusterwith novel circular edge segments air distribütör, Energy Procedia. 2015, 75:1752-1757.
227

17. Gao, P., Dai, Y., Tong, Y., Dong, P., Energy matching and optimization analysis of waste toenergy CHP (combined cooling, heating and power) system with exergy and energy level,Energy. 2015, 79:522-535.
18. Solheimslid, T., Harneshaug, H., K., Lümmen, N., Calculation of first-law and second-lawefficiency of a Norwegian combined heat and power facility driven by municipal wasteincineration – A case study, Energy Conversion and Management. 2015, 95:149-159.
19. Pan, M., Lu, F., Zhu, Y., Huang, G., Yin, J., Huang, F., Chen, G., Chen, Z., Thermodynamic,exergoeconomic and multi-objective optimization analysis of new ORC and heat pumpsystem for waste heat recovery in waste-to-energy combined heat and power plant, EnergyConversion and Management. 2020, 222: 113200.
20. Ameri, B., Hanini, S., Boumahdi, M., Influence of drying methods on the thermodynamicparameters, effective moisture diffusion and drying rate of wastewater sewage sludge,Renewable Energy. 2020, 147(1):1107-1119.
21. Abusoglu, A., Kanoglu, M., Exergetic and thermoeconomic analyses of diesel enginepowered cogeneration: Part 1 – Formulations, Applied Thermal Engineering. 2009, 29:234-41.
22. Abusoglu, A., Demir, S., Kanoglu, M., Thermodynamic analysis and assessment of amunicipal wastewater treatment system: A field study on sewage treatment, InternationalJournal of Exergy. 2013, 13(3):281-298.
23. http://www.asimptote.nl/software/cycle-tempo/ (Accessed on September 10, 2020).
228

A COMPARATIVE STUDY ON NUMERICAL AND EXPERIMENTAL ANALYSES OF A 3-D SPOUTED BED
EMRAH ÖZAHİ *1, ARİF ÇUTAY 2, ALPEREN TOZLU 3
1 Gaziantep University, Engineering Faculty, Mechanical Engineering Department, Gaziantep, TURKEY. 2 Adıyaman University, Engineering Faculty, Mechanical Engineering Department, Adıyaman, TURKEY.
3 Bayburt University, Engineering Faculty, Mechanical Engineering Department, Bayburt, TURKEY.
Abstract
In this study, a comparative study related with both numerical and experimental analyses on a typical 3-dimensional spouted bed was carried out. The numerical study was verified with theexperimental results in the related literature. The TFM approach was performed with kinetictheory of granular flow (KTGF) in order to define particle-particle collision in the numerical analysis of the spouted bed. Furthermore, gas phase was modelled by k-epsilon turbulence model. The results of this study are completely in acceptable range when we made an investigation in related literature for validation when compared with the existing studies in the corresponding literature (max. particle velocity deviation 26 %, max. voidage deviation 15 %). The study has novelty because of the conducted validation process in terms of both axial and radial particle velocity profiles. Consequently, it can be deduced that TFM is a reliable methodfor analyzing on any spouted beds and it can be used reliably for further studies.
Keywords: Spouted bed, CFD, numerical analysis, two fluid model, kinetic theory of granular flow.
1. IntroductionSpouted beds are multi-phase systems that enhanced form of solid-gas contact systems. Theyhave broad range of applications from drying systems to combustion mechanism. The air issupplied from center of the bed to induce upward motion of particles in these systems. Spoutformation has been achieved in the center of the bed due to permanent air supply from bottom ofthe bed. While air supply forms spout formation, particles has periodic motion from upward inthe center and downward in the annulus region. These processes cause unique properties thatresults effective heat and mass transfer by means of better mixings of particles. Numericalapproach has great importance of analysis of these systems. It gives valuable results parameterswithout big labor effort as compared to experimental studies. However, interacting two-phaseflow consists of many parameters that affect each other. For this reason, high capacitycomputational power is required to achieve reliable results. Two Fluid Model (TFM) orEulerian- Eulerian is relatively economical approach that consider gas-solid as interpenetratingcontinuum. It has lower CPU and memory requirement than other modelling approaches utilizedin analyzing multi-phase flows. Computational fluid dynamics has several advantages likesaving money and time and flexibility to change geometry and fluid dynamics parameters than
229

experimental studies. However, it should be always compared to corresponding experimentalresults for validation of numerical study. In this case study, model and flow parameters of Pianorasa [1] are utilized for validation of our numerical study. Modelling of spouted bed has many variables that affect the results of study in CFD. While computational studies are required ultimate correct choice of numerical parameters such as boundary condition, grid structure andflow physics, multi-phase flow needs extra attention to validate results against experiment.
2. Materials and Methods Simulations were performed utilizing 3-D spouted bed geometry and flow physics from experimental study of Pianorasa et al. as shown in Fig. 1. The width of the reactor was 0.152 m and the height was 0.9 m. The diameter and the density of the solid particles in the simulation were selected as 1.33 mm and 2485 kg/m3, respectively. Initially, volume fraction value of the solid bed was taken as 0.54 at 0.28 meter height and air was supplied as the fluidizier and entered through spouting orifice with a velocity of 52 m/s.
Figure 1. Bed geometry and numerical grid of spouted bed
2.1. Numerical Model The TFM approach treats gas and solid phases as interpenetrating continuum in the one type of Navier-Stokes equation. This equation was applied for modelling spouted bed. Each phase has their own conservation equation to model their fluid dynamic behavior. Besides, kinetic theory of granular flow (KTGF) is incorporated to TFM to define particle-particle collision in numerical analysis of spouted beds [2]. In addition to this, gas phase is modelled by k-epsilon turbulence
230

model. The main governing equations and constitutive equations for gas-solid flow in numerical analysis of spouted bed systems as listed below.
Governing Equations
The continuity equations for gas (g) and solid (s) phases can be written as:
0).()( =∇+ gvggggdtd ραρα (1)
0).()( =∇+ svssssdtd ραρα (2)
1=+ sg αα (3)
Momentum equations of gas and solid phase
gvsvgggggPgggvgvgggvggdtd
−++∇+∇−=∇+ ().()( βρατααραρα (4)
)().()( gvsvgssssPsssvsvsssvssdtd
−++∇+∇−=∇+ βρατααραρα (5)
( )
∇−
∇+∇= vI
ggvT
gvggg .32αµτ (6)
( ) vIssSsssvT
svsss .32( ∇
−+
∇+∇= µαλααµτ (7)
Granular temperature equations [3]
( ) ( ) ( ) Θ−Θ−Θ∇ΓΘ∇+∇+∇−=
Θ∇+Θ∂∂
SSssvssPIsssvssssstβγτραρα 3).(:.
23 (8)
Constitutive equations
Solid Pressure:
sg SSSeSSssssPS Θ++Θ= ,02)1(2 αρρα (9)
Solid shear viscosity: µµµµ frSkinScolSS ,,, ++= (10)
Collisional Viscosity [4]:
( )π
ραµ Θ+= SSSSSSSScolS egd 1
54
,02
, (11)
231
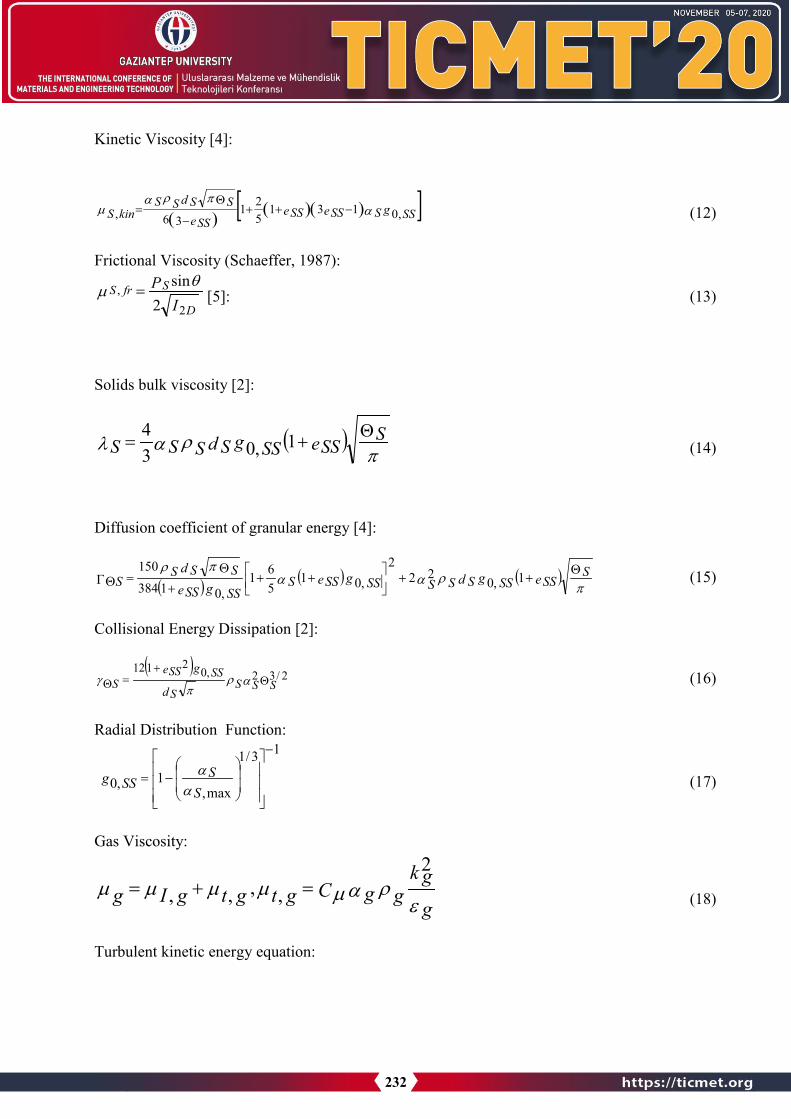
Kinetic Viscosity [4]:
( ) ( )( )[ ]g SSSeSSeSSeSS
Sd SS SkinS ,0131
521
36, απρα
µ −++−
Θ= (12)
Frictional Viscosity (Schaeffer, 1987):
D
SfrSI
P
2,
2sinθ
µ = [5]: (13)
Solids bulk viscosity [2]:
( )π
ραλΘ+= SeSSg SSd SSSS 1,03
4 (14)
Diffusion coefficient of granular energy [4]:
( ) ( ) ( )π
ρααπρ Θ
++
++
+Θ
=ΓΘSeSSg SSd SSSg SSeSSSg SSeSS
Sd SSS 1,0
222
,01561
,01384150
(15)
Collisional Energy Dissipation [2]:
( )Θ
+=Θ
2/32,02112
SSSd S
g SSeSSS αρ
πγ (16)
Radial Distribution Function: 13/1
max,1,0
−
−=
αα
SSg SS (17)
Gas Viscosity:
εραµµµµµ
g
k gggCgtgtgIg
2,,,, =+= (18)
Turbulent kinetic energy equation:
232
gkggggggkGggkk
gtggkgvgggkggdt
d,,),.().()( Π+−+∇=∇+ ραεραα
σ
µαραρα (19)
Turbulent kinetic energy dissipation rate equation:
gggggCG gkCgkg
gggt
gggvgggggdtd
,2,1),.().()( εραερεεε
αεσε
µαεραερα Π+
−+∇=∇+ (20)
v gTv gv ggtG gk ∇
∇+∇= :)(,, µ (21)
3.1,1,92.12,44.11,09.0 ===== σ εσεεµ kCCC (22)
2.2 Initial and boundary condition:Uniform air velocity was utilized for the gas phase at the inlet. Outlet boundary condition was assumed at atmospheric pressure conditions. No-slip boundary condition was adopted for solid and gas phase. 231105 elements was obtained as producing 5 mm hexahedral mesh structure as shown in Figure 1.
2.3 Solution Procedure: The equations defined in previous part were run in CFD package. Hydrodynamics of bed was studied to compare corresponding experimental paper. The pressure-velocity coupling was utilized to solve multi-phase flow at the scheme of SIMPLE algorithm. First order implicit was utilized for transient formulation to solve unsteady multi-phase flow. The simulation was carried out at first order upwind scheme for momentum, volume fraction and turbulence equations while second discretazion method used for pressure. The under-relaxation factors were chosen from 0.2 to 0.7 for solution control. Standart initialization was applied from all zones. After initialization, bed was patched up to a height of 0.28 m. Syamal O’brien and para drag model were performed by minimum fluidization velocity and void fraction of particles. Time step was set to 0.001 and convergence criterion was default values. Simulation was performed by using personel computer which had 12-core processor and 16 GB ram memory. Physicial and experimental parameters used in simulation were listed at Table 1.
233

Table 1. Numerical Setup
Parameter Value
Particle density, ρs (kg/m3) 2485 Gas density, ρg (kg/ m3) 1.225 Gas viscosity, µg (kg/m.s) Maximum solid volume fraction 0.54 Inlet spouting gas velocity (m/s) 52 Restitution coefficient of particles
0.93
Min. Fluidization velocity 0.672 Void fraction 0.415 Static bed height, Ho (mm) 280 Column diameter, DT (mm) 152 Inlet diameter, Do (mm) 19.1 Inclined angle (◦) 60 Bed height, H (mm) 900
3. Results and DiscussionThe propose of this work is to achieve validation of the numerical setup by acquiring convergence results agains experimental study. CFD simulation was performed without changing any physical parameters of the experimental setup of Pianorasa et al.[1]. Acceptability of the numerical studies depends on validation of the result with the corresponding experimental results. All parameters that utilized in the experiment were adapted to the numerical study asmuch as possible. The correct choice of numerical parameters affects dramatically validity of numerical results. Zhong et al. [6] proposed that the coefficient of restitution should be chosen as 0.93 to obtain results close to the same experimental results in analysis of spouted bed. This value was utilized in this numerical solution. This experiment has two suitable properties asparticle velocity and voidage throughout axial and radial distance. This outcome was provided by the computational running. The comparison of these appraoches was carried out graphically as below. The particle velocity has great importance while considering effectiveness of spoued bed design. Because it has great impact on heat and mass transfers efficiencies. Particle velocity should be kept safe range for controlling spouting behavior by obtaining maximum output at heat transfer mechanisms. Maximum relative deviation of particle velocity was found as 10.10 % through the axial direction in this study. The closest match for particle velocity was found between the experiment and the numerical results at 0.032 meter from spouting inlet orifice as 3.59 %. Therefore, the result of the numerical setup was acceptable range for particle velocity through axial direction as shown in Figure 2.
234

Figure 2. Particle velocity through axial direction
Voidage is another important parameter while analyzing spouted bed both experimentally andnumerically. Because it gives us valuable output about particle mixing which is strong aspect of spouted beds. Voidage profiles were illustrated through axial direction at Figure 3. It showed maximum deviation as 8 % from the experimental results at 0.054 meter from bottom side of the bed. The best match is obtained at 0.218 meter from inlet position. The numerical results gave better aprroximation at the cylindirical section of the bed while a bit larger deviation was observed at the conical section. Besides, the numerical results approved better balanced particle-air mixing at conical section of the bed. Altough validating numerical results is hard to takeconvergent results through axial direction, the numerical setup herein showed good congruence against the experimental data.
Figure 3. Voidage profile through axial direction
0,0000
0,2000
0,4000
0,6000
0,8000
1,0000
1,2000
0 50 100 150 200 250 300
Void
age
Axial distance (mm)
Comparision between experiment and numerical results
num
exp
235

Figure 4. Particle velocity through radial direction
Figure 5. Voidage profile through radial direction
Radial direction profiles of particle velocity are strong predictors of bed mixing. The reasonable results were observed between the numerical and the experimental setups through radial direction at 168 mm point. The maximum deviation is 8 % for particle velocity at center of the bed as shown in Figure 4. The better result was taken at closer region to the wall. Moreover, the best match was observed at the closest point of the wall at 14 mm from axis of the bed. The particle velocity showed that decreasing profile through radial direction approved by the experimental study. This situaton is expected at spouted bed since air is supplied from only one point for spouting. The voidage profile was shown through radial direction at Figure 5. The radial profiles of voidage give us idea percentage of particle and air. It is hard to find reasonable results in numerical simulation than experiment. Eye and camera contact shows more realistic
0,00
0,50
1,00
1,50
2,00
2,50
3,00
0 2 4 6 8 10 12 14Part
icle
Vel
ocity
(m/S
)
Radial distance (mm)
Comparision between experiment and numerical results at z=168 mm
num
exp
0,00000,10000,20000,30000,40000,50000,60000,70000,80000,90001,0000
0 10 20 30 40 50 60
Void
age
Radial distance (mm)
Comparision between experiment and numerical results at z=97 mm
num
exp
236

outcome while numerical simulation offers mathematical computation. For this reason, deviation can be more acceptable from experimental results for voidage profies. It was found that the maximum deviation is 24 % at 16 mm point for voidage. Except this one, the most divergent results were seen as 10 %. This outcome can be reading error in the frame of the experimentstudy. Because experimental results show great jump at this point despite of small differences of radial distances before and after. While the numerical results had higher values at the region close to the axis, the higher outcome was observed towards to the wall.
4. Conclusion Validation and verification of the numerical setup are mandatory processes to obtain reliableresults. Deviation of numerical analysis process depends on physics of problem. Easy-modelling process should be more close and exact match with corresponding experiment. However, some processes have many parameters and these paramaters affect other parameters. Simulation of spouted is one of them. In the related literature, there are some papers that find deviation ranges from 8 % to 26 %. For example; Zhong et al. [6] observed maximum mean deviation as up to 15 % analyzing spout-fluidized bed by using TFM approach. Moreover they observed 7.8 %overall deviation for particle velocity, while voidage deviated from experiments as 13.7 %. Besides, Wu et. al [7] found maximum deviation which had approximately 26 % for particle radial velocity profile at same numerical model. Besides these findings, herein the results of thisstudy are completely in acceptable range for validation when compared with the existing studiesin the corresponding literature. Moreover, experimental studies may have reading error as caused by experimentalist or device malfunction. This numerical study has an originality due to the validation for both axial and radial profiles when compared with the related experimental study.Consequently, TFM is powerful and reliable method for analyzing spouted bed. The conductednumerical setup can be used reliably for further studies.
References:
1. Pianorasa, L.D. Hydrodynamics Studies of Spouted Bed and Spout-fluid Beds. TheUniversity of British Columbia, 1996.
2. Lun, C. K. K., S. Br Savage, D. J. Jeffrey, N. Chepurniy. Kinetic theories for granularflow: inelastic particles in Couette flow and slightly inelastic particles in a generalflowfield. Journal of fluid mechanics, 1984, 140:223-256.
3. Ding, J., and Gidaspow, D. A bubbling fluidization model using kinetic theory ofgranular flow, AIChE Jour, 1990, 36:523–538.
4. Gidaspow, D., Bezburuah, R., Ding, J. Hydrodynamics of circulating fluidized beds:kinetic theory approach. Illinois Inst. of Tech., Chicago, IL (United States). Dept. ofChemical Engineering, 1991.
5. Schaeffer, D. G. Instability in the evolution equations describing incompressiblegranular flow. Journal of differential equations, 1987, 66(1):19-50.
6. Zhong, W., Zhang, M., Jin, B., & Yuan, Z. Flow behaviors of a large spout-fluid bed athigh pressure and temperature by 3D simulation with kinetic theory of granular flow.Powder technology, 2007, 175(2):90-103.
7. Wu, F., Zhang, X., Zhou, W., Ma, X.Numerical simulation and optimization ofhydrodynamics in a novel integral multi-jet spout-fluidized bed. Powder Technology,2018, 336:112-21.
237
INVESTIGATION ON THE EFFECT OF ECAP PROCESS FOR GRAPHENE REINFORCED COPPER MATRIX NANOCOMPOSITES
Öner Kağan Özer1,Hasan Safa1, Ömer Güler*1, Öyküm Başgöz1, Ertan Evin2
1Mersin University, Engineering Faculty, Metallurgical and Materials Engineering Department, Mersin, TURKEY 2 Malatya Tugut Ozal University, Malatya, Turkey
Abstract
Contrary classical materials, graphene has been studied numerous times by scientist since itsdiscovery, displays extraordinary extra features. Due to these extraordinary extra features, graphene has the potential to used in many area. Also graphene have been used as reinforcement material for aluminum, nickel, magnesium, zinc, copper and titanium or their alloys. In this study graphene has been used as reinforcement material for copper matrix and investigation on the effect ECAP process. The improvement in mechnical propertiy has been studied. Synthesizednanocomposite characterized via SEM.
Keywords: ECAP, Metal Matrix Composite, Graphene, Liquid Phase Exfoliation (LPE)
1.Introduction
Graphene is the mother of all allotropes formed by the sp2 hybridization of the carbon atom. In 2004, the first graphene was synthesized by British scientists Andrei Geim and Konstantin Novoselov.
Since the discovery of the graphene, its outstanding features have encouraged from researcher. Interesting features such as the highest known strength, high thermal and excellent electrical conductivity are promising for many applications [1-4]. Graphene has 5000 W/mK thermal conductivity at room temperature, 15000 cm2/Vs mobility and a large surface area about 2630 m2/g. Single layer graphene has 130 GPa tensile strength, 1000 GPa Young module, 97.7% optical transmittance and good chemical resistance [5]. Many production methods are available for the graphene. These include liquid phase exfoliation (LPE), chemical vapor deposition (CVD), epitaxial growth on silicon carbide substrate and ion implantation [3].
Copper is an important metal which has found in a reddish brown color that can take the desired shape for cold forming, which is important for the industry and has been used by people for nearly 7000 years [6].
Copper is a very important component of many industrially important minerals. Minerals that used in copper production in the world are constitutes about 50% of the chalcolite (Cu2S), 25% are chalcopyrite (CuFeS2), 15 % are oxide minerals, 6-7 % are native copper (natural) copper, 3 % are enargite (Cu3AsS4) make up 1 % of other sulfur minerals [7-9].
238

In the field of copper/Graphene Nanoplatelets (GNP) composite which is reinforced by graphene metal matrix composite, there is very little work. Addition of the graphene to the copper matrix as a reinforcement is expected to further advance mechanical, electrical and thermal performance. However, graphene nanoplates due to their Van der Waals bond strength create agglomeration during the manufacturing process. In addition, an effective interface bond cannot be obtained due to the poor relationship of graphene with copper. Therefore, in order to achievehigh performance, copper / graphene composites must meet two main requirements. These are homogeneous distribution of the graphene in the matrix and sufficient interface strength betweencopper and graphene. Agglomeration and structural destruction of the carbon filler usually occurs during the ball milling process of the stage a classical powder metallurgy method [10]. Copper/grahene composites has attracted attention due to the self-lubricating feature of graphene, it provides a high performance material widely used in many industrial applications such as brushes, contact strips and bearing materials. It has also been found that for graphene, composites are incorporated into copper, which reduces the mechanical properties (such as hardness and bending strength) of the composite to achieve lower friction and wear [11].
Metal matrix composites which are used as matrix materials various metal and metal alloy. The second phase (reinforcement) which is embedded in the metal-based matrix composites can be different geometrical shapes. Metal-matrix composites have superior properties compared to the non reinforcement materials. By combining the high elasticity modulus properties of the ceramics with the plastic deformation properties of the metal materials have been demonstratedadvance resistant wear and high tensile strength [12].
There are number of well-known methods to expose metallic samples to an applied load, including standard industrial metalworking processes of rolling or extrusion. However, all of these methods require a change in the physical dimensions of the material. In contrast, equal-channel angular pressing (ECAP) is different from these traditional procedures; because the section dimensions of the sample remain unchanged during the loading. Severe plastic deformation (SPD) has proven to be an effective method to produce ultra fine grained (UFG) metals with a grain size ranging from 10-1000 nm. Owing to ECAP, it can be subjected to severeplastic deformation (SPD) and grain refining up to the micrometer and even nanometer level. Sliding systems, shear models, total stress to be applied to the sample, mold geometry and press regimes are the main experimental factors affecting ECAP. These parameters play an important role in microstructural thinning during the pressing process. Because of mentioned situation extensive research has been done to create process parameters and routes [11].
In this study, graphene was chosen as reinforcement for copper matrix due to mentioned its unique properties. Copper matrix-graphene reinforced composites were produced by powder metallurgy method.
2. Experimental Procedure
2.1. Production of the Reinforced Materials
In this study graphene used as reinforced produced via liquid phase exfoliation (LPE) mehtod. For the production of graphene 0.7 g of graphite and sodium dodecyl sulfate (SDS) were sonicated in 100 ml of Dimethylformamide (DMF) for 2 hours with a 75% power. After this stage sonicated mixing was centrifuged at 6000 rpm for 3 hours. The product separated from the solvents used was washed. Later synthesized graphene was dried.
239

Figure 1. SEM image of the produced graphene layers
2.2. Production of the Graphene Reinforced-Copper Matrix- Composites Graphene produced in copper matrix was added in the study at a rate of 2% by weight. The rate of graphene determined in 45 grams of copper in 210 ml of ethanol was reinforced. The weighed powders were sonicated continuously in 105 ml ethanol. On the other hand, some of the sonicated solution is reinforced with copper in the magnetic stirrer. On the other hand, some ofthe sonicated solution is reinforced with copper in the magnetic stirrer. Meanwhile, alcoholremoval was carried out.
After these repeated processes, the powder composition was taken and thrown into the oven to dry completely. After making sure that the alcohol evaporated, mechanical alloying process was carried out on the "Retsch" brand device. The sample was grinded for 45 minutes at 170 rpmusing a 12mm and 50 mm diameter ball with 15: 1 powder ball ratio in a 250 ml capacity stainless steel grinding vessel. After grinding process, samples were obtained by pressing cold presses into powders at 500 Mpa pressure. “Protherm” brand horizontal furnace was used to sinter the samples. Sintering was carried out at 600 °C for 2 hours under the atmosphere ofArgon. For the sintered samples to reach full density, they were pressed cold again at 500 MPa and sintering was applied for 2 hours at 620 °C. In the ECAP transaction; process parameters such as die angles, pressing speed and temperature, process routes, back pressing and cross section of the material to be pressed.
In this study, the mold with channel angle=120° and corner angle= 20° was studied. Route BC is selected. Produced by powder metallurgy method and a pure copper 2% graphene reinforced matrix composite is applied to the ECAP process. It is aimed to reveal the changes in the properties of the material without changing the dimensions of 20 mm diameter materials. First, the mold was heated at 200 °C for 1 hour. Then, after placing the sample and heating it for a while, the ECAP process was carried out at a temperature of 120 °C and 200 °C. Then, after placing the sample and heating it for a while, the ECAP process was carried out at a temperature of 120 °C and 200 °C. Printed with a pressure of 100 MPa at 0.025 mm/sec and without any back pressure application. It was then left to cool naturally (Figure 2).
240

Figure 2. Sample after ECAP (b), sample before ECAP
The abrasion samples produced in this study were exposed to different loads (10N-20N-30N) atdetermined distances (50m-100m-150m) and specific wear rates were calculated according to the following equation (Eq. 1) [13].
𝑘𝑘 = �∆𝑉𝑉𝑃𝑃. 𝐿𝐿
� (1) For the Eq. 1 where k is the specific wear rate, ΔV is the volume change, P is the exposed loadand L is the path it takes. Abrasion test results of the samples are shown in Figure 3.
Figure 3. Abrasion test results of the samples for 50, 100 and 150m.
(a) (b)
50m 100m
150m
241

As expected the wear resistance of the samples has increased by applying the ECAP process this shown in the Figure 3. It is seen that the material loss is less in the after ECAP samples. It wasobserved that the wear rates of the samples increased with the increase in load. Figure 3 showed that the wear resistance increased for after of ECAP. The reason for the increase in wear resistance for after ECAP samples (Graphene reinforcement and ECAP) is considered to be the direction of graphenes in a certain direction [14].
4. Conclusion Micro and macro hardness tests were performed on composites with copper matrix graphene reinforcement before ECAP and after ECAP. For each sample, five hardness measurements were recorded and the hardness values averaged. If we consider the sample before ECAP given in Figure 2. An increase in micro hardness values with graphene reinforcement is observed. An increase in the micro hardness of the composite with graphene is expected. Because the elasticity module of graphene is about 1 TPa. The use of a material with such a high modulus of elasticity as a reinforcing material improved the strength of the composite.
Acknowledgments The authors would like to acknowledge the financial support of Mersin University Department of Scientific Research Projects (Project No: 2019-1-TP2-3468).
References 1. W. Gao, L.B. Alemany, L. Ci, And P.M. Ajayan, Nature chemistry, 1 (2009) 403-408.2. S. Garaj, W. Hubbard, J. Golovchenko, Applied Physics Letters, 97 (2010) 183103.3. S.Gayathri, P. Jayabal, M. Kottaisamy, V. Ramakrishnan, AIP Advances, 4 (2015) 027116.4. A. K. Geim, P. Kim, Scientific American, 298 (2008) 90-97.5. R. Hao, W. Qian, L. Zhang, Y. Hou, C. Commun, Chem Commun (Camb). 28 (2008) 6576-
6578.6. B. Richard, Newyork. (2001)7. S. Cankut, Ekstraktif Metalürji Uygulaması: Bakır, (1973)8. M. Gülfen, Kalkopirit Cevherindeki Bakırın Sülfürik Asit Çözeltisinde Çözünürlüğünün
İncelenmesi, Doktora Tezi, Sakarya Üniversitesi, Fen Bilimleri Enstirüsü, Sakarya (2002).9. C. Özorak, C. Bakır Yüzeyinde Üretilen Bakır Karbür Yüzey Kompozitlerinin Fiziksel,
Mekanik ve Korozyon Özelliklerinin Araştırılması, Kastamonu, Kastamonu Üniversitesi(2019)
10. N. Darsono,Appl. Surf. Sci., 254 (2008) 3412-3419.11. J. F. Li, L. Zhang, J. Xıao, K Zhou, Transactions of Nonferrous Metals Society of China,,
25(2015) 3354−3362.12. A. İ.Kaya, Putech & Composite Poliüretan ve Kompozit Sanayi Dergisi, 29 (2016) 38-45.13. Güler, Ö., & Katmer, H. (2020). Investigating the synergistic effect of CNT+ MLG hybrid
structure on copper matrix and electrical contact properties of the composite. The EuropeanPhysical Journal Plus, 135(3), 308.
14. Güler, Ö., & Bağcı, N. (2020). A short review on mechanical properties of graphenereinforced metal matrix composites. Journal of Materials Research and Technology, 9(3),6808-6833.
242

HARD ANODIC OXIDATION OF A356 ALUMINUM ALLOY
AZİZ BARIŞ BAŞYİĞİT *1, HALİL İBRAHİM KURT 2
1 Assistant Prof. Dr. Kırıkkale University, Engineering Faculty, Metallurgical and Materials Engineering Department, Kırıkkale, TURKEY.
2 Associate Prof. Dr. Gaziantep University, Engineering Faculty, Metallurgical and Materials Engineering Department, Gaziantep, TURKEY.
Abstract
ASTM A356 (ISO AlSi7Mg) aluminum alloys are widely used in automotive and aircraft industries but they are selected mainly as automobiles wheel rim materials. They are composed ofmagnesium and silicon elements for improving corrosion and strength properties. Wheel rim materials are often electroplated by rim paints for decorative views and durability considerations.
In this study; aluminum A356 alloy was coated by hard anodic oxidation method. 14 samples are machined by 4x20x20 mm in dimensions for anodic oxidation. Three different case depths are tried on samples. Micro-structural investigations, micro-hardness surveys and the case depths arethoroughly studied. The applicability of hard anodic oxidation method on wheel rim material A356 alloy is examined.
Keywords: Aluminum Alloys, Aluminum A356 Alloy, Hard Anodic oxidation
1. IntroductionASTM A356 (ISO; AlSi7Mg) alloy is favorably preferred in wheel rim industries as well asaircrafts, marine, pumps, machine parts, valves, automotive transmission cases, oil pans. Thesealloys are composed of basically silicon and magnesium alloying elements in order to improvecorrosion and strength properties. This specialty group of premium casting alloys have restrictedamounts of impurities and carefully controlled alloying elements for providing ductility,toughness, and tensile properties with difficult castability. They can be heat treated. They areclassified in four types of classes according to their strength values in case of applied heattreatments [1,2,3].Whether A356 aluminum alloy is used in wheel rim industries they are casted in moulds. Aftercasting and surface fine machining they are frequently coated by rim paints for nice looking andprolongation of service life.Wheel rims are often damaged by banquettes or sidewalks by driver faults in automobiles. Paintsof commercial wheel rims are not so strong to resist with these types of hard damages.Some classes of Aluminum alloys are strengthened by heat treating techniques like precipitationhardening but they are also surface treated by case coating and hardening applications mainly asanodic oxidation. Anodic oxidation is applied for decorative and hard surface layer needs.Aluminum alloys are protected against oxidation at ambient service conditions by decorativeanodic oxidation but they have been hard anodic oxidized for their wear resistance. Hard anodicoxidation is mainly applied approximately within 5 to 18 µm case depths generally in sulfuric acid
243

baths commercially [4]. In this study; samples are hard anodic oxidized by three different case depths as 45, 65 and 90 µm in values. Hence; the applicability of hard anodic oxidation on A356 alloy in order to resist such kinds of damages is thoroughly investigated.
2. Materials and Methods The experimental material was prepared from the original 13 inch aluminum wheel rim as given in Figure 1.a. The wheel rim was machined by band saw with coolant for preparing samples as seen in Figure 1.b.
(a) (b) Figure 1. (a) Wheel Rim (b) sample preparation
After samples are cut they were machined to 4x20x20mm in dimensions for hard anodic oxidation operation. 14 samples before hard anodic oxidation are given in Figure 2.
Figure 2. Samples before hard anodic oxidation
One of the samples representing the aluminum wheel rim material is analyzed for chemical composition by Amatex Spectromax argon spectrometer and the results are given in Table 1.
244
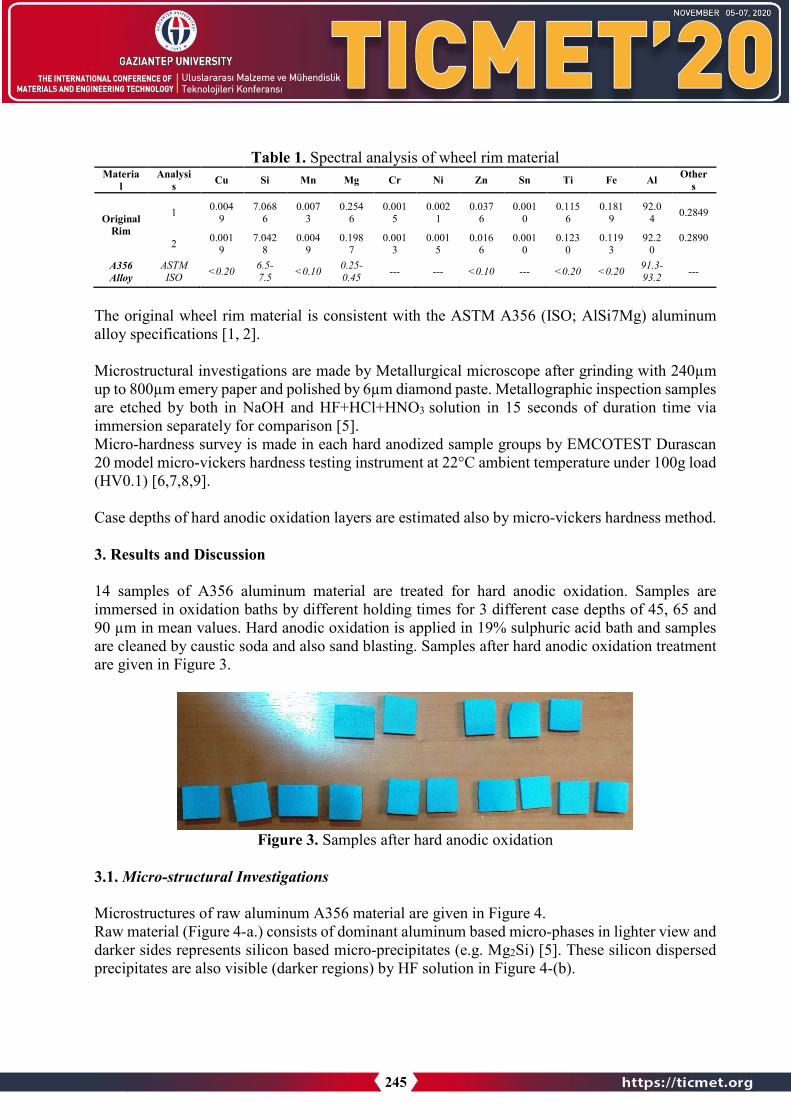
Table 1. Spectral analysis of wheel rim material Materia
l Analysi
s Cu Si Mn Mg Cr Ni Zn Sn Ti Fe Al Others
Original Rim
1 0.0049
7.0686
0.0073
0.2546
0.0015
0.0021
0.0376
0.0010
0.1156
0.1819
92.04 0.2849
2 0.0019
7.0428
0.0049
0.1987
0.0013
0.0015
0.0166
0.0010
0.1230
0.1193
92.20
0.2890
A356 Alloy
ASTM ISO <0.20 6.5-
7.5 <0.10 0.25-0.45 --- --- <0.10 --- <0.20 <0.20 91.3-
93.2 ---
The original wheel rim material is consistent with the ASTM A356 (ISO; AlSi7Mg) aluminum alloy specifications [1, 2].
Microstructural investigations are made by Metallurgical microscope after grinding with 240µm up to 800µm emery paper and polished by 6µm diamond paste. Metallographic inspection samples are etched by both in NaOH and HF+HCl+HNO3 solution in 15 seconds of duration time viaimmersion separately for comparison [5]. Micro-hardness survey is made in each hard anodized sample groups by EMCOTEST Durascan 20 model micro-vickers hardness testing instrument at 22°C ambient temperature under 100g load (HV0.1) [6,7,8,9].
Case depths of hard anodic oxidation layers are estimated also by micro-vickers hardness method.
3. Results and Discussion
14 samples of A356 aluminum material are treated for hard anodic oxidation. Samples are immersed in oxidation baths by different holding times for 3 different case depths of 45, 65 and 90 µm in mean values. Hard anodic oxidation is applied in 19% sulphuric acid bath and samplesare cleaned by caustic soda and also sand blasting. Samples after hard anodic oxidation treatmentare given in Figure 3.
Figure 3. Samples after hard anodic oxidation
3.1. Micro-structural Investigations
Microstructures of raw aluminum A356 material are given in Figure 4. Raw material (Figure 4-a.) consists of dominant aluminum based micro-phases in lighter view and darker sides represents silicon based micro-precipitates (e.g. Mg2Si) [5]. These silicon dispersed precipitates are also visible (darker regions) by HF solution in Figure 4-(b).
245

(a) (b) Figure 4. Micrograph of raw A356 alloy (a) -25% NaOH, 100X (b) HF+HCl+HNO3,100X
Microstructures of hard anodized samples are given in Figure 5.
Figure 5. Micrographs of hard anodic oxidized samples
The case depths are estimated by micro-structural views of metallurgical microscope gauge as given in Figure 5 and also confirmed from micro-vickers hardness differences of determined values.
3.2. Micro-hardness Test Results and Case Depths of Samples
Micro-vickers screen views of hard anodic oxidized samples are given in Figure 6 as examples. 3 different case depths of approximately 45, 65 and 90µm values are maintained. Case depths are measured according to micro-vickers hardness survey on samples as given in Table 2. The 3 distinct groups of hard anodic oxidized samples have approximately close values of surface micro-vickers hardness values among themselves. The case depths are determined quite different in consequence of different bath duration times. Base metal core hardness was determined as 60HV. The maximum case depth of all samples was recorded as 90µm.
246

Figure 6. Micro-vickers screen views of hard anodic oxidized samples
Table 2. Micro-vickers hardness survey of samples
Sample groups
Micro-vickers surface (case) hardness values (HV 0.1) Core
Hardnesses (Mean Values)
Case Depths (Mean Values)
Test 1 Test 2 Test 3
1 370 369 370 60 ≅45µm (370→228HV)
2 369 370 371
62 ≅65µm(371→227HV)
3 384 379 371 61 ≅90µm(384→269HV)
There has been made some studies about hard anodic oxidation on Aluminum alloys but case depths up to 90µm on A356 alloy is not studied [10,11,12].
4. Conclusions
Aluminum A356 wheel rim material is successfully hard anodic oxidized approximately up to 90µm in case depths.
The maximum surface hardness values of 384 HV0.1 is determined while the raw aluminum has exhibited 60 HV0.1 microvickers hardness.
The applicability of hard anodic oxidation on A356 aluminum alloy is accomplished. Consequently, prolonging the service life of wheel rim materials can be safely provided by hard anodic oxidation in this study.
Future study is to estimate the wear resistance of hard anodic oxidized A356 Aluminum alloys.
Acknowledgements: Authors express their thanks to MKEK Armament Factory Heat Treatment Department Staff Mr. Mehmet Kalkan for precious laboratory supports.
247

References:
1. Standard Specification for Aluminum-Alloy Sand Castings, ASTM B26/B26 M-18E1, ASTMInternational, 2018.
2. Aluminum and Aluminum Alloys-castings chemical composition and mechanical properties,BS EN 1706, 2010.
3. Properties and Selection, Non-ferrous alloys and special purpose materials, ASM InternationalASM Handbook Volume 2, 22- 618-627, 1990.
4. Surface Engineering, ASM Handbook Volume 5, 1416, 1994.5. Metallography and Microstructures, ASM Handbook Volume 9, 1691-1694, 1696, 2004.6. Metallic and other inorganic coatings - Vickers and Knoop micro-hardness tests, TS 6503 EN
ISO 4516, 2003.7. Metallic materials — Vickers hardness test — Part 1: Test method, ISO 6507-1:, 2018.8. Standard test methods for Vickers hardness and Knoop hardness of metallic materials, ASTM
E92, 2017.9. Standard test methods for micro-indentation hardness of materials, ASTM E384, 2017.10. Elkilany, HA et.al, Influence of Hard Anodizing on the Mechanical and Corrosion Properties
of Different Aluminum Alloys, , Metallography Microstructure and Analysis, Volume: 8 Issue:6 Pages: 861-870, DOI: 10.1007/s13632-019-00594-5, 2019.
11. Mahmoud, ERI et al., Characterizations of Cladded 6082-T6 Aluminum Alloy Through HardAnodizing, Science of Advanced Materials, Volume: 12 Issue: 7 Pages: 1034-1045, DOI:10.1166/sam.2020.3758, 2020.
12. Kwolek, P. et al, Tribological Properties of the Oxide Coatings Produced onto 6061-T6Aluminum Alloy in the Hard Anodizing Process, Journal of Materials Engineering andPerformance, Volume: 27 Issue: 7 Pages: 3268-3275, DOI: 10.1007/s11665-018-3421-8,2018.
248

ZINC BASED ALLOY OXIDE FORMED BY THERMAL OXIDATION FOR ENERGY MATERIALS
ABDULCABBAR YAVUZ
Metallurgical and Materials Engineering, Faculty of Engineering, Gaziantep University, Gaziantep, 27310, Turkey.
Abstract
An electrode was modified with Zn based alloy oxide by thermal oxidation of a zinc-copper alloy. The electrode was annealed at a temperature less than its melting point (450 °C) for a short time (60 minutes) in order to obtain zinc alloy oxide. The modified electrode was scanned between -0.8 V and -0.35 V in a KOH environment to elucidate its electrochemical performance. Different scan rates were applied to the electrode in the alkaline electrolyte. ZnCuOx electrode was scanned repetitively at the negative potential window in the alkaline bath. The capacitance retention of the electrode was more than 80% after 50 scans at the negative potential window. As the alloy oxide electrode was generally stable on the negative side, the zinc-based alloy heated at high temperature could be a negative electrode in an energy storage system. The reaction between the electrode and alkaline electrolyte was controlled by mass transfer as the reaction had a diffusional controlled mechanism. The areal capacitance of the zinc-based oxide electrode was more than 75 mC cm-2. Annealed zinc-based alloys could be formed on a bulk zinc alloy current collector for a supercapacitor application. This process is inexpensive, easy for the production of alloy-based oxide for energy storage devices.
Keywords: Alloy, Annealing, Zinc oxide, Thermal oxidation, Energy storage.
1. IntroductionEnergy storage is as important as energy production. Therefore, inexpensive materials andprocesses are required to use in energy storage devices [1]. Recently, flexible, environmentallyfriendly electrodes have been studied for energy storage devices as well [2]. Another importantpoint regarding energy storage systems is the stability of the electrodes such as chemical,electrochemical and mechanical stability of the electroactive materials [3]. Inexpensiveelectrodes that have a high charge-discharge rate were designed for batteries and supercapacitors[4]. Supercapacitors have been researched recently because they can have both high powerdensity with high energy density [5]. They could have low weight and be operated securely.Supercapacitors could be potentially used in portable electronic devices and hybrid vehicles [6].
Supercapacitors can be classified into two main categories depending on their charge storage mechanisms. They are an electrical double layer capacitor which is commonly written as EDLC [7] and pseudocapacitors [8]. Ions can react chemically with electrodes in pseudocapacitorswhile ions can adsorb on the surface of electrodes in EDLC systems. The reaction between theelectrolyte and electrode of pseudocapacitor is Faradaic (redox reaction). However, the reactionbetween the electrolyte and the EDLC electrode is non-Faradaic [9]. EDLC materials are
249

generally carbon-based and the materials of the pseudocapacitors can be transitional metal oxides/hydroxides or conducting polymers including polyaniline [10], PEDOT [11] and polythiophene [12].
The capacitance of EDLCs and pseudocapacitors can be increased by changing the surface morphology and coverage [13]. Ions of the electrolyte could easily enter into the surface of the electrodes. Otherwise, energy cannot be successfully stored between the electrode and electrolytes. The reaction between the electrode and the electrolyte has been studied widely to understand the mechanism and control the electrode design and electrolyte selections. Transition metal oxides/hydroxides have been synthesized with carbon-based material to increase specific capacitance, specific power, specific energy and charge-discharge rate by taking advantage of both Faradaic and non-Faradaic reaction. The using of both EDLC and pseudocapacitor electrodes form the third class of supercapacitor which is called hybrid supercapacitors.
The transition metal oxides/hydroxides have been studied for supercapacitor electrodes because they have different oxidation states for example the oxidation states of manganese are two, three, four and five [14]. The different oxidations states could cause redox reactions which is necessary for pseudocapacitors. The transition metal oxides/hydroxides could have high electronegativity.They can also be fabricated easily at a low cost and they could be environmentally friendly. Various transition metal oxides including cobalt [15], manganese [16], nickel [17], iron [18] and ruthenium [19] have been synthesized differently including sol-gel [20], electrochemical [21], chemical precipitation [22] and hydrothermal [23] methods to design electrodes for pseudocapacitors. In this study, the zinc-based alloy was thermally oxidized at 450 °C to obtain alloy oxide. The resultant electrode was cycled in an alkaline solution to examine its usability for an energy storage device. The rate-limiting reaction between the zinc based alloy oxide and KOH solution was studied. The stability of the film was examined by applying the repetitive cycling of the electrode in the electrolyte.
2. Materials and MethodsZn based alloy bulk material was rolled to reduce the thickness to 0.1 mm. The zinc was castwith copper to obtain the alloy. The alloy sheet was ground by 600 grit and 1500 grit sandpaperand the sheet was cut. The Zn based alloy was washed and then dried by hot air. Zn based alloywas thermally oxidized in a preheated furnace. The electrode was heated at 450 °C in a furnaceand heated up for 60 minutes. The electrodes were directly taken out. The surface was not treatedin any way after the electrodes were taken out from the furnace because the surface was the mainpart for energy storage devices. Zn-Cu based electrode was heated at high temperature to obtainZnCuOx. As the oxidation state and ratio of copper and zinc were not defined exactly, theelectrode after heat treatment was written as ZnCuOx in this work.
The modified electrode was immersed in KOH (1 mol/liter) solution to study its electrochemical behavior. A conventional three-electrode cell was used here for the cyclic voltammogram study. The working electrode was a heated Zn-Cu based electrode. The reference electrode was silver-silver chloride having a KCl solution (saturated). ZnCuOx electrode was washed with 1 M KOH solution to remove any impurity. Three electrodes (working, counter and reference electrodes) were immersed in the cycling solution at room conditions. The potential window was between -0.8 V and -0.35 V. ZnCuOx electrode was cycled in the alkaline bath at different scan rates. Each
250

scan rate was applied three times. The stability of the electrode was tested by repetitive cycling in the alkaline electrolyte at the scan rate of 100 mV s-1.
3. Results and DiscussionHeated ZnCuOx electrode was immersed in alkaline solution for cycling between -0.8 V and -0.35 V. Its cyclic voltammogram data depending on scan rate are shown in Figure 1a. Before conducting the experiments, the electrodes were cycling in alkaline media eight times to obtain a relatively stable electrode. The electrodes were cycled in KOH electrolyte three times at each scan rate to ensure the stability of the electrode in alkaline media. The second cycle of each scan rate was selected and is presented in Figure 1a. The current peak of the electrode increased uponincreasing the scan rate. As the charge is calculated by multiplying current with time, morecurrent should be passed in a short time to have the same amount of charge. Therefore, the current value was higher at the short timescale (higher scan rate) and the current peak values of the electrode decreased when the scan rate decreased from 100 to 5 mV s-1. As the ZnCuOxelectrode was electrochemically active at a negative potential (between -0.8 V and -0.35 V), the electrode could be used as a negative electrode in an energy storage device.
-0.8 -0.7 -0.6 -0.5 -0.4 -0.3-4
-2
0
2
4
6
curre
nt d
ensit
y / m
A cm
-2
potential / V
100 mV s-1
50 mV s-1
20 mV s-1
10 mV s-1
5 mV s-1
(a)
-0.8 -0.7 -0.6 -0.5 -0.4 -0.3
-4
-2
0
2
4
6 (b)
curre
nt d
ensit
y / A
cm
-2
potential / V
Figure 1. a) Cyclic voltammogram of Cu-Zn based bulk material heated at 450 °C for 60 minutes and transferred to 1 M KOH electrolyte for cycling at different scan rates. b) Cyclic voltammogram of the electrode mentioned in panel a and cycling repetitively at 50 mV s-1.
251

Repetitive cycling is an important parameter for rechargeable devices because this is related to the stability of the electrodes. Therefore, the electrode was cycled in the alkaline media more than 50 times and cyclic voltammogram responses of the electrode in KOH solution is presented in Figure 1b. This experiment was conducted after the electrode was cycled in KOH at differentscan rates (given in Figure 1a). Red arrows of the Figure 1b indicates how cyclic voltammogramresponses of the electrode was changed depending on repetitive scans. Figure 1b shows that the electrode was stable because cyclic voltammogram responses were not changed significantly.Therefore, zinc-based alloys could be heated at high temperature in order to obtain an electrodefor stable energy storage material. This method is inexpensive and easy to fabricate an electrode. For example, the copper foil was oxidized thermally to form a flexible modified electrode for an energy storage device by Lamberti et. al. [24]. This thermal oxidation method can be also applied to thin and flexible zinc-based current collectors to fabricate flexible modified electrodes for energy storage devices. This synthesis process is suitable for a large amount of modifiedelectrode production and the cost of the process can be significantly decreased as this process includes only heating in a furnace.
0.6 0.8 1.0 1.2 1.4 1.6 1.8 2.0 2.2
-0.2
0.0
0.2
0.4
0.6
0.8
slope: 0.46
log(
curre
nt p
eak
/ mA
cm-2)
log(scan rate / mV s-1)
Oxidation Reduction Linear Fit of cottrel F Linear Fit of cottrel G
slope: 0.41
Figure 2. logarithm of current peak value of ZnCuOx electrode cycling in alkaline media as a function of logarithm of scan rate. The data were taken from Figure 1a.
Cottrell Equation gives information regarding current change as a function of time for diffusion-controlled reaction [25]. Current peak values from cyclic voltammogram are directly proportional reciprocal of the square root of time for diffusional controlled reactions. If the logarithm of current and time is obtained, the slope of the logarithm of current peaks and reciprocal of the square root of time must be 0.5 for a reaction based on a diffusional controlled process. It is known that the scan rate (in mV s-1) is inversely proportional to time (in second). Therefore, the slope of the logarithm of the current peak and the square root of the scan rate must
252

be 0.5 for a diffusional controlled process. Figure 2 shows the logarithm of the current peak value of the ZnCuOx electrode as a function of the logarithm of the scan rate. The data given in Figure 2 were taken from the cyclic voltammogram of the electrode cycling in alkaline media at different scan rates presented in Figure 1a. Black and line of Figure 2 were drawn by using data of the oxidation and reduction line in Figure 1a, respectively. The slope calculated for oxidation and reduction peaks of the electrode was 0.41 and 0.46, respectively. Thus, the reaction mechanism between the ZnCuOx electrode and alkaline electrolyte could be considered as a diffusional controlled reaction.
0 20 40 60 80 1000
20
40
60
80
Spec
ific
capa
cita
nce
(mF
cm-2)
Scan rate (mV s-1)
Figure 3. The specific capacitance of the ZnCuOx electrode cycled in alkaline media as a function of the scan rate.
The specific capacitance of the ZnCuOx electrode was calculated and presented in Figure 3 as a function of the scan rate. The charge for the oxidation of the ZnCuOx electrode cycled in alkaline media was calculated. That charge was multiplied by time which was 4.5, 9, 22.5, 45 and 90 seconds for 100, 50, 20, 10 and 5 mV s-1. The potential window was 450 mV and the time to complete an oxidation reaction was calculated as explained in the previous sentence. The multiplication of time and charge equals current. The current calculated was divided by the scan rate to calculate the capacitance given in Figure 3. The capacitance was divided by area for presenting the areal capacitance of the ZnCuOx electrode cycled in the KOH electrolyte. The areal capacitance of the electrode decreased upon increasing the scan rate because electrolyte ions could not react properly with the modified electrode at a high scan rate.
It is known that specific capacitance and areal capacitance is proportional to charge value. The charge value of oxidation was used to calculate the areal capacitance given in this work. The charge value calculated from the oxidation half scan in the cyclic voltammogram graph as a function of scan number is presented in the black line of Figure 4. As the area of the cyclic voltammogram responses decreased upon increasing scan number, the capacitance value also decreased. The capacitance value of the electrode was around 5.5 mC and it decreased to 4.8 mC
253

after 50 cycles. The capacitance retention was calculated depending on this decrease. The capacitance retention as a function of the scan number is presented in the blue line of Figure 4. Capacitance retention can give information regarding the stability of an electrode which could be used in an energy storage device. The capacitance retention of the ZnCuOx electrode cycled in alkaline media was more than 80% after 50 cycles. Therefore, zinc metal which could be combined with other metals can be annealed at high temperature and the resulting electrodecould be used as an electrode in energy storage devices. The heating process is cheap and not difficult to produce an electrode for energy storage devices.
0 10 20 30 40 504.7
4.8
4.9
5.0
5.1
5.2
5.3
5.4
5.5
5.6
mC % retention
scan numbers
Cha
rge
(mC
)
0
20
40
60
80
100
% c
apac
itanc
e re
tent
ion
Figure 4. Charge change and capacitance retention of the ZnCuOx electrode cycled in alkaline media depending on scan numbers.
4. Conclusions: ZnCuOx electrode was obtained by heating a zinc-based alloy (with copper).The electrode was heated at 450 °C for 60 minutes in order to obtain zinc alloy oxide. Theresultant electrode was cycled in an alkaline bath from -0.8 V to -0.35 V at different scan rates.The current peaks of the film were higher at higher scan rates. The electrode was not removedfrom the bulk surface at a negative potential window suggesting that it can be a negativeelectrode in a pseudocapacitor device. As the repetitive cycling is can give information regardingthe stability of the electrodes, the ZnCuOx electrode was cycled in the KOH electrolyte morethan 50 times. The electrode could be conducted as stable because the difference between cyclicvoltammogram graphs of the electrode after each cycle was small. The rate-limiting reactionbetween ZnCuOx electrode and OH- based electrolyte was mainly mass transfer because thereaction mechanism was the diffusional controlled reaction. The specific capacitance of theZnCuOx electrode was more than 75 mC cm-2 at the scan rate of 5 mV s-1. The capacitanceretention of the modified electrode in the KOH electrolyte was more than 80% when cycled 50times at the negative potential. Zinc based alloys which were heated at high temperature could beused as a stable electrode in an energy storage device. The method shown in this study isinexpensive and it can be easily applied to fabricate an electrode for a supercapacitor. Thismethod also can be used to obtain a thin and flexible electrode for flexible energy storagedevices.
254

Acknowledgments: The author thanks to Gaziantep University Scientific Research Unit (MF.ALT.19.18) for providing funding. The author thanks also to M. Furkan Kalkan for heating the materials.
References 1. Wei L, Zeng L, Wu MC, Jiang HR, Zhao TS. An aqueous manganese-copper battery for
large-scale energy storage applications. J Power Sources. 2019;423:203–10.2. Li H, Tian H, Chang T-H, Zhang J, Koh SN, Wang X, et al. High-purity V2O5 nanosheets
synthesized from gasification waste: flexible energy storage devices and environmentalassessment. ACS Sustain Chem Eng. 2019;7(14):12474–84.
3. Avireddy H, Byles BW, Pinto D, Galindo JMD, Biendicho JJ, Wang X, et al. Stable high-voltage aqueous pseudocapacitive energy storage device with slow self-discharge. NanoEnergy. 2019;64:103961.
4. Urso M, Torrisi G, Boninelli S, Bongiorno C, Priolo F, Mirabella S. Ni (OH) 2@ Ni core-shell nanochains as low-cost high-rate performance electrode for energy storageapplications. Sci Rep. 2019;9(1):1–11.
5. Choi C, Ashby DS, Butts DM, DeBlock RH, Wei Q, Lau J, et al. Achieving high energydensity and high power density with pseudocapacitive materials. Nat Rev Mater. 2019;1–15.
6. Kouchachvili L, Yaïci W, Entchev E. Hybrid battery/supercapacitor energy storagesystem for the electric vehicles. J Power Sources. 2018;374:237–48.
7. Sanjaya N, Vidanapathirana KP, Perera KS. A natural rubber based electrolyte to be usedin EDLCs with Sri Lankan graphite. Mater Today Proc. 2019;
8. Liu T, Finn L, Yu M, Wang H, Zhai T, Lu X, et al. Polyaniline and polypyrrolepseudocapacitor electrodes with excellent cycling stability. Nano Lett. 2014;14(5):2522–7.
9. Lei C, Markoulidis F, Ashitaka Z, Lekakou C. Reduction of porous carbon/Al contactresistance for an electric double-layer capacitor (EDLC). Electrochim Acta. 2013;92:183–7.
10. Gupta V, Miura N. Electrochemically deposited polyaniline nanowire’s network a high-performance electrode material for redox supercapacitor. Electrochem Solid-State Lett.2005;8(12):A630–2.
11. Abas A, Sheng H, Ma Y, Zhang X, Wei Y, Su Q, et al. PEDOT: PSS coated CuOnanowire arrays grown on Cu foam for high-performance supercapacitor electrodes. JMater Sci Mater Electron. 2019;1–8.
12. Zhang H, Hu L, Tu J, Jiao S. Electrochemically assembling of polythiophene film in ionicliquids (ILs) microemulsions and its application in an electrochemical capacitor.Electrochim Acta. 2014;120:122–7.
13. Iro ZS, Subramani C, Dash SS. A brief review on electrode materials for supercapacitor.Int J Electrochem Sci. 2016;11(12):10628–43.
14. Metosen ANSBA, Pang SC, Chin SF. Nanostructured multilayer composite films ofmanganese dioxide/nickel/copper sulfide deposited on polyethylene terephthalatesupporting substrate. J Nanomater. 2015;16(1):131.
15. Chen W, Xia C, Alshareef HN. One-step electrodeposited nickel cobalt sulfide nanosheetarrays for high-performance asymmetric supercapacitors. ACS Nano. 2014;8(9):9531–41.
16. Wei W, Cui X, Chen W, Ivey DG. Manganese oxide-based materials as electrochemicalsupercapacitor electrodes. Chem Soc Rev. 2011;40(3):1697–721.
255

17. Zhang Y, Liu Y, Guo Y, Yeow YX, Duan H, Li H, et al. In situ preparation of flower-likeα-Ni (OH) 2 and NiO from nickel formate with excellent capacitive properties aselectrode materials for supercapacitors. Mater Chem Phys. 2015;151:160–6.
18. Guan C, Liu J, Wang Y, Mao L, Fan Z, Shen Z, et al. Iron oxide-decorated carbon forsupercapacitor anodes with ultrahigh energy density and outstanding cycling stability.ACS Nano. 2015;9(5):5198–207.
19. Algharaibeh Z, Liu X, Pickup PG. An asymmetric anthraquinone-modifiedcarbon/ruthenium oxide supercapacitor. J Power Sources. 2009;187(2):640–3.
20. Nayak S, Soam A, Nanda J, Mahender C, Singh M, Mohapatra D, et al. Sol–gelsynthesized BiFeO 3–Graphene nanocomposite as efficient electrode for supercapacitorapplication. J Mater Sci Mater Electron. 2018;29(11):9361–8.
21. Patake VD, Lokhande CD, Joo OS. Electrodeposited ruthenium oxide thin films forsupercapacitor: Effect of surface treatments. Appl Surf Sci. 2009;255(7):4192–6.
22. Zhou Y, Liu C, Li X, Sun L, Wu D, Li J, et al. Chemical precipitation synthesis of porousNi2P2O7 nanowires for supercapacitor. J Alloys Compd. 2019;790:36–41.
23. Guo M-X, Bian S-W, Shao F, Liu S, Peng Y-H. Hydrothermal synthesis andelectrochemical performance of MnO2/graphene/polyester composite electrode materialsfor flexible supercapacitors. Electrochim Acta [Internet]. 2016;209:486–97. Availablefrom: http://www.sciencedirect.com/science/article/pii/S0013468616311367
24. Lamberti A, Fontana M, Bianco S, Tresso E. Flexible solid-state CuxO-based pseudo-supercapacitor by thermal oxidation of copper foils. Int J Hydrogen Energy [Internet].2016;41(27):11700–8. Available from:http://www.sciencedirect.com/science/article/pii/S036031991530656X
25. Zhang L, Xu Z, He Z. Selective recovery of lead and zinc through controlling cathodicpotential in a bioelectrochemically-assisted electrodeposition system. J Hazard Mater[Internet]. 2020;386:121941. Available from:http://www.sciencedirect.com/science/article/pii/S0304389419318953
256

SYNTHESIZING AND WELDING OF ALUMINUM COMPOSITE
WAFA MELIK*1 , ZAKARIA BOUMERZOUG 1 , FABIENNE DELAUNOIS3
1 LMSM Laboratory, Biskra University,Science and technologies Faculty, Mechanical engineering Department, Biskra,ALGERIA.
2 Mons University, Polytechnic Faculty, Metallurgy Department, MONS, BELGIUM.
Abstract
In recent years, aluminum alloy-based metal matrix composites (MMC) are gaining importance in several aerospace and automobile applications. Aluminum 6061 has been used as matrix material owing to its excellent mechanical properties coupled with good formability. In the present investigation Al6061–SiCp composites was fabricated by powder metallurgy route with 7.5 and 13 wt. % of SiCp and sintered at 600°C during 2 h. The synthesis samples were welded in solid state by bonding diffusion at 520 °C during 3 h. The effect of SiCp amount on structural and mechanical properties of welded joint of Al matrix was investigated. The main techniques of characterization were optical and scanning electronic microscopy, X ray diffraction, and hardness measurements. We have found the effect of silicon carbide quantity on the hardness of the synthesized composite. The microstructure observations showed a homogeneous distribution of SiCp on the welded joint.
Keyword: Al matrix composite (AMCs), Silicon carbide SiC, Powder metallurgy, Bonding diffusion, Welded joint.
1. Introduction
Aluminum-based metal matrix composites (AMCs) are the most appropriate for automotive, thermalmanagement applications and aerospace industry, it isa new generation of engineering materials in which a strong ceramic reinforcement such as Al2O3and SiC are incorporated into a metal matrix to improve its propertiesincluding specific modulus, superior strength, excellentwear resistance, corrosion resistance, and high thermal conductivity,due to their better bonding between the matrix and reinforcement which forms uniform and compact grain boundaries[1−4]. Generally, powder metallurgy (PM) process is well known to be oneof excellent metal synthesis techniques for producing near net shapeproducts.One of the advantages of PM compared to casting is having better control on the microstructure,where better distribution of the reinforcement is possible in PM compacts and unique qualities which is the reason for its superior properties compared to other processes [5,6].
AMCs have become a major focus in industry for their excellent properties, Joining of AMCs is machining and welding process replacing conventional aluminum alloys with in many applications [7]. Welding processes are vital for the manufacture of a wide variety of products
257

[8]. It able to produce high quality jointsof Al-based MMCs of particular interest. Rotundo et al. [9] mentioned that the problemof the application of Al-based MMCs are thelow mechanical properties of the joint obtained with the traditional fusion welding techniques. these problems can be significantly reduced by the use ofsolid state joining techniques, such as diffusion welding.The main objective ofthis study is to explore the effect of SiCp percentage on the mechanicalproperties of welded joints by bonding diffusion of AA6061-SiCp composite.
2. Materials and Methods 2.1 Materials and specimen preparation The raw materials used in the present work to synthesize SiCp reinforced aluminum alloy metallic matrix composites were AA6061(63um) and SiC (50nm) powders, the composite was manufactured by means of powder metallurgical route with the following parameters: Silicon carbide (SiC) percentage was 7.5 and 13 wt. %, compacted under 10 tons and sintered at 600°C during 2 h. The chemical composition and optical photomicrograph of aluminum alloy AA6061are respectively presented in Table 1 and Figure 1.
Table 1. The chemical composition of AA6061alloy powder. Elements Si Fe Cu Mg Aluminum Wt.% 0.6 0.5 0.4 1 Balance
Figure 1. Optical photomicrograph of fabricated AA6061.
We noticed that just before diffusion bonding test, the cylindrical specimens fabricated by powder metallurgy were carried out carefully by grinding and cleaning by ultrasonic-cleaning in acetone for 10 min. When the both cleaned sides of the base metal are placed inside the metallic support, sufficient pressure is applied to fix the samples and encourage the diffusion mechanism. The bonding diffusion performed at 520°C for 3 h in argon and hydrogen atmosphere. To reveal microstructure and mechanical properties of the welded samples by bonding diffusion (BD),standard metallographic sample preparation procedure is achieved through mechanical grindingand polishing followed by chemical etching. The microstructure and the distribution of SiC in the profiles and weldswere observed using an optical microscope(HIROX Kh-8700) and a
258

scanning electron microscope (HITACHI SU8020)integrated with energy dispersive spectroscopy (EDS)detector,the acceleration voltage was set to 20.0 kV. X-ray diffraction patterns (XRD) were recorded using Panalytical X-ray diffractometer (BRUKER D-5000). The microhardness was measuredusing a microhardness tester (HM-200) at 0.05 HV.
3. Results and Discussion3.1 X-ray diffraction and microstructure The XRD patterns shown in Figure 2 indicate that the peaks of Al and SiC particles are obviously visible in both samples. No other phases are formed in the welded joint. This reveals that SiC particles did not react with the aluminum matrix to produce any other compounds. SEM micrographs of the welded samples of AA6061/SiC composite reinforced with different amount of 7.5 and 13 wt.% SiCp, fabricated by PM, are shown in Figure 3, SEM microstructures are followed by the EDS analysis in different areasof welded sample reinforced with 13wt.% SiC presented in Figure 4.SEM images reveals the distribution of SiC particles over the matrix alloy.The distribution of SiC particles is observed fairly homogeneously in the welded joint.There are no clusters or agglomeration of nanoparticles. With higher magnification, the particle distribution can beseen more clearly as in Figure 4(b), the EDS analysis confirm thehomogeneous distribution of SiCp in the matrix and in the joint.
From themicrostructures, it is clear that the diffusion process has been achieved in both cases of welding process, it can be clearlyseen the formation of new grains on the bonding line,the migration of particles into the diffusion joint was fast when compared with the samplescontained less amount of the reinforcement, So the addition of SiCp improve and encourage the movement of particles in welding process,this is an advantage for mechanical properties. Figure 3f shows micro-cracks at the end of the joint, holes at the interface, it was found to exhibit partially ductile and brittle mode of fracture. The diffusion welded joints shows grains and finer dimples which is due to the uniform deformation of the metal during joining. The same results were reported by Vigneshwara et al. [2], Hascalik et al. [10] and Rotundo et al. [11]. In addition, Feng et al. [12] stated that the SiC particles provided more nucleation sites for the new recrystallized grains by increasing local strain in the matrix and causing latticemisorientation. The particle splay an important role in controlling the recrystallized grain size byparticle stimulated nucleation. The resultant grain size will be directly related to the volume fraction and the diameter of particles.
259

Figure 2.The XRD of the welded samples.
Figure 3. SEM micrograph of weldmentwith different magnification; (a,b and c) with 7.5wt.%
SiC; (d,e and f) with 13wt.% SiC
a d
b e
c f
260

Figure 4.SEMelectron image and its EDS analysis of welded AA6061/SiCp composite.
3.2 Microhardness
The quality of the weld was assessed with Vicker microhardness measurement in transverse plane for AMCs welded by diffusion, from the centreof the weld to either side of the welds is spread as shown in the Figure 8.The microhardness values of AA6061- 13wt.% of SiCcomposite welded by diffusion are greater than the microhardness values of AA6061-7.5wt.% of SiC composite.
The microhardness near center of a weld was similar to that of the parent material, but it increased near the joint interface. A low hardness value at the weld center also indicated the absence of Al4C3 precipitates in that area, the XRD results confirm the absence of new phases in the composite. Mitul [13] reported that a higher SiC particle density would form high dislocation density in a smaller dendrite by residual strains due to thermal mismatch between the aluminum matrix and ceramic reinforcement, which in turn increased the matrix hardness and matrix strength at this location. Other reserchers [8,14] explained the hardening phenomenon by the mechanical properties of SiC particles, which are unbreakable dispersoid that definitely add to the hardness of the composite.
Zone 1
Zone 2 Zone 3
261

Figure 5. Vickers microhardness profiles across the weldments:
4. Conclusion The main importance of this study was focusing on the diffusion joining of syntheses AA6061-SiC nanocomposites by P/M process. The main highlights of this research can be summarized as follows:
The metal matrix nano-composites were fabricated by powder metallurgy method andsuccessfully joined using diffusion welding processes.
The XRD diffraction peaks of welded Al6061/SiCp composites confirm the presence of Aland SiC, no other phases are formed during welding.
Microstructural examinations revealed the uniform distribution of SiC particles in the basecomposite and in bonding joint.
The AA6061–SiC composite with 13 wt. % SiC has high microhardness compared with thecomposite reinforced with 7.5 wt.%.
Acknowledgments: The authors would like to thank WBI and MESRS of Algeria for their support. We thank also all the team of metallurgy service, university of Mons, for their technical support and encouragement.
References: 1. Mosleh-shirazi, S., Akhlaghi, F., and Dong-yang, L., Effect of SiC content on dry sliding
wear, corrosion and corrosive wear of Al/SiC nanocomposites, Transactions ofnonferrous metals society of China,2016,26(7):1801-1808.
2. Vigneshwara, M., Selvamania, S.T., Taruna, K., and Palanikumar, K., A novelapproach for joining armor grade AA7075 metal matrix nano composites using variouswelding processes, Materials today: proceedings, 2019, 16(2):1175–1181.
262

3. El-Kady, O., and Fathy, A., Effect of SiC particle size on the physical and mechanicalproperties of extruded Al matrix nanocomposites, Materials and design, 2014, 54:348–353,
4. Abd El-Aziz, K., Saber, D., and Sallam, H. E.M., Wear and corrosion behavior of Al–Simatrix composite reinforced with alumina, Journal of bio- and tribo-corrosion, 2015,1(5):1-10.
5. Penchal Reddy, M., Shakoor, R.A., Parande, G., Manakari, V., Ubaid, F., Mohamed,A.M.A., and Gupt, M., Enhanced performance of nano-sized SiC reinforced Al metalmatrix nanocomposites synthesized through microwave sintering and hot extrusiontechniques, Progress in natural science: materials international,2017, 27:606–614.
6. RahimianM., EhsaniN., Parvin N., and BaharvandiH.R., the effect of particle size,sintering temperature and sintering time on the properties of Al–Al2O3 composites, madeby powder metallurgy, Journal of materials processing technology,2009,209:5387–5393.
7. Kalaiselvan, K. Dinaharan, I. and Murugan, N. Characterization of friction stir weldedboron carbide particulate reinforced AA6061 aluminum alloy stir cast composite,Materials and design, Vol. 55, (2014) , pp.176–182.
8. Shankar,M. C. G., Jayashree,P. K., Sharma,S. S., Shetty, R., and Vinay,K., Qualityenhancement of TIG welded Al6061 SiCp composites by age hardeningprocess,International journal of automotive and mechanical engineering,2018, 15(3): 5573-5582.
9. Rotundo, F., Marconi, A., Morri, A. ,and Ceschini, A., Dissimilar linear friction weldingbetween a SiC particle reinforced aluminum composite and a monolithic aluminum alloy:microstructural, tensile and fatigue properties, Materials science andengineering A,2013,559:852–860.
10. Hascalik, A., and Orhan, N., Effect of particle size on the friction welding of Al2O3reinforced 6160 Al alloy composite and SAE 1020steel, Materials and design,2007,28(1):313-317.
11. Rotundo, F., Ceschini, L., Morri, A., Jun, T.S., and Korsunsky, A.M., Mechanical andmicrostructural characterization of 2124Al/25 vol.%SiCp joints obtained by linearfriction welding (LFW), Composites part A: Applied science and manufacturing,2010,41(9):1028-1037.
12. Feng, A.H., Xiao, B.L., and Ma, Z.Y., Effect of microstructural evolution on mechanicalproperties of friction stir welded AA2009/SiCp composite, Composites Science andTechnology, 2008, 68(9):2141–2148.
13. Kothari, M. A., and Hung,W. N.P., Suppressing aluminum carbide in welding aluminumsilicon carbide, composite, International journal of engineering materials andmanufacture, 2018, 3(1) :41-54.
14. Veeresh Kumar G.B., Rao C.S.P., Selvaraj N., Bhagyashekar M.S.,Studies on Al6061-SiC and Al7075-Al2O3. Journal of minerals and materials characterization andengineering, 2010, 9(1): 43-55.
263

ALÜMİNYUM MATRİSLİ KOMPOZİTLERDE ISIL İŞLEMİN AŞINMA AĞIRLIK KAYBINA ETKİSİ
Engin Ergül1, Halil İbrahim Kurt*2, Murat Oduncuoğlu3, Can Çivi4, Gökhan Eyici5
1 Dokuz Eylül Üniversitesi, İzmir Meslek Yüksekokulu, Makine ve Metal Teknolojileri Bölümü, Makine Programı, İzmir, 35380, TÜRKİYE.
2 Gaziantep Üniversitesi, Mühendislik Fakültesi, Metalurji ve Malzeme Mühendisliği Bölümü, 27310, Gaziantep, TÜRKİYE.
3 Gaziantep Üniversitesi, Teknik Bilimler Meslek Yüksekokulu, Bilgisayar Teknolojileri Programı, 27310, Gaziantep, TÜRKİYE.
4 Celal Bayar Üniversitesi, Mühendislik Fakültesi, Makine Mühendisliği Bölümü, Yunusemre, 45140, Manisa, TÜRKİYE.
5 Celal Bayar Üniversitesi, Mühendislik Fakültesi, Makine Mühendisliği Bölümü, Yunusemre, 45140, Manisa, TÜRKİYE.
Özet
Kompozit malzemeler, geleneksel malzemelere kıyasla yüksek özgül mukavemet ve esneklik modülüne sahiptir, bu nedenle son yıllarda bu tür malzemelere olan talep, özellikleri nedeniyle önemli ölçüde artmıştır. Bu malzemelerden üretilen makine bileşeninin ağırlığının azaltılabileceği anlamına gelir. Bu çalışmada, Al 2024 matris kompozit malzemelerin üretimindekokil kalıba döküm yöntemi kullanılmıştır. Numune üretiminde, ağırlıkça %50 MgO ve %50 MWCNT karıştırılmıştır ve matris malzemesine %0.2 oranında ilave edilmiştir. MgO/MWCNTkatkılı Al2024 kompozitlerinin aşınma davranışları bir disk üzerinde bilye aşınma test cihazı kullanılarak araştırıldı. Kompozit malzemelerin aşınma özellikleri üzerindeki etkileri, aşınmakütle kaybı belirlenerek araştırılmıştır. Aşınma testi parametreleri olarak 2N yük, 0,1m/s kayma hızı ve 1000 m mesafe seçilmiştir ve örneklerin aşınma yüzdesi miktarları incelenmiştir.Numunelerden bir tanesi 2 saat ısıl işleme tabi tutulmuştur. Isıl işlemli örnekler ile ısıl işlem uygulanmamış örnekler arasındaki ağırlık kaybı araştırılmıştır. Isıl işlemin örnekler üzerinde etkisi deneysel çalışma ile incelenmiştir.
Anahtar Kelimeler: Metal matris kompozit, Al 2024, Aşınma, Isıl işlem
1. GirişMetal matris kompozitler (MMC) [1-3], mukavemet, sertlik, aşınma direnci, korozyon direnci veyüksek elastik modül gibi özelliklerini iyileştirmek için bir metal matrise güçlü bir seramiktakviyenin dahil edildiği yeni nesil mühendislik malzemeleridir. MMC'ler, alaşımlarının metaliközelliklerini (süneklik ve tokluk), takviyelerin seramik özellikleriyle (yüksek mukavemet veyüksek modül) birleştirerek, kesme dayanımı, yüksek mukavemet ve daha yüksek servis sıcaklığıkapasitesine yol açar. Bu nedenle, bilimsel, teknolojik ve ticari öneme sahiptirler. Son yıllarda,geliştirilmiş özellikleri nedeniyle, MMC'ler uçak motorları gibi yüksek performanslıuygulamalar için ve son zamanlarda otomotiv endüstrisinde yaygın olarak kullanılmaktadır.
264

Al2O3 [4], SiC lifleri [5-7], karbon nanotüp (CNT) [8-12] ve MgO parçacıkları MMC'lerde en sık kullanılan takviyelerdir ve bu takviyelerin alüminyum alaşımlarına eklenmesi önemli miktarda araştırma çalışmasının konusu olmuştur. Al2O3, SiC, CNT ya da MgO ile güçlendirilmişalüminyum alaşımlı matris kompozitlerin otomotiv ve uçak endüstrilerinde uygulanması, malzemenin tribolojik özelliklerinin çok önemli olduğu pistonlar, silindir kafaları vb. için giderek artmaktadır. Bu nedenle, alüminyum matrisli kompozitlerin geliştirilmesi, çeşitli endüstrilerin gereksinimlerini karşılamada büyük bir öneme sahiptir. MMC'ler üretmek içinalaşım matrisine sert ikinci faz partiküllerinin dâhil edilmesinin de daha faydalı ve ekonomiktir.MMC'lerin artan kullanımı ve önemi nedeniyle, fabrikasyon teknikleri son birkaç yıldır sürekli gelişmektedir. Son zamanlarda MMC'lerin üretilmesi için çeşitli yöntemler mevcuttur. En yaygın kullanılan kompozit malzemeler arasında yer alan partikül takviyeli alüminyum alaşımkompozitler, döküm, eriyik işleme (sıvı faz işleme) ve toz metalurjisi (katı faz işleme) dahil olmak üzere çeşitli imalat prosesleriyle üretilebilir [13].
2. Malzeme ve Yöntem Bu çalışmada, alüminyum-bakır-magnezyum (Al 2024) [14,15] alaşımı matris malzemesi olarakkullanılmış olup, ağırlıkça %50 magnezyum oksit (MgO) ve %50 çoğul duvarlı karbon nanotüp (MWCNT) karışımı ağırlıkça %0,2 oranında matris malzemesine ilave edilmiş ve alüminyum matrisli hibrid kompozit karıştırma döküm yöntemiyle üretilmiştir. Güçlendirici MgO <40 nm boyutunda ve MWCNT ise 1,5 µm uzunluğunda ve 9,5 nm çapındadır.
Sertlik testi HRF olarak ve aşınma testleri oda sıcaklığında bir yağlayıcı olmadan, CSM Instruments marka cihazda ball-on-disk makinesi üzerinde gerçekleştirilmiştir. Aşınmadeneyinde 2 N yük, 0,1 m/s kayma hızı ve 1000 metre kayma mesafesi kullanılmıştır. Deneyler üç farklı malzeme üzerine uygulanmıştır. Bunlardan birincisi katkısız Al2024, ikincisi ağırlıkça%50 MgO ve %50 MWCNT karıştırılmıştır ve matris malzemesine %0.2 oranında ilave edilmş MgO/MWCNT katkılı Al2024 kompoziti ve son olarak üçüncüsü bu malzemeye 2 saat ısıl işlemuygulanmış örneklerden oluşmaktadır. Aşınma testlerinde üretilen malzemelerin ağırlık kaybı değerlendirilmiştir.
3. Bulgular ve TartışmaŞekil 1’de yapılan sertlik testine ait sonuçlar gösterilmiştir. Al 2024 matrisin sertlik değeri 62HRF, Al 2024 0.2 (%50 MgO+%50 CNT) kompozitin sertlik değeri 69 HRF ve Al 2024 0.2(%50 MgO+%50 CNT) 170 °C’de 2 saat ısıl işlem görmüş kompozitin sertlik değeri 65 HRFolarak tespit edilmiştir.
265

Şekil. 1 Matris ve kompozitin HRF sertlik değerleri
Şekil. 2 Aşınma deneylerine ait ağırlık kaybı
58
60
62
64
66
68
70
Sert
lik (H
RF)
Numune
0,0030
0,0031
0,0032
0,0033
0,0034
0,0035
0,0036
0,0037
0,0038
0,0039
0,0040
Ağırl
ık K
aybı
(gr)
Numune
266

Şekil 2’de 2N yük altında, 0,1m/s kayma hızında ve 1000 m mesafede gerçekleştirilen aşınma deneylerine ait ağırlık kaybı değerleri verilmiştir. Al 2024 matrisin ağırlık kaybı 0,0039 gr, Al2024 0.2 (%50 MgO+%50 CNT) kompozitin ağırlık kaybı 0,0037 gr ve Al 2024 0.2 (%50 MgO+%50 CNT) 170 °C’de 2 saat ısıl işlem görmüş kompozitin ağırlık kaybı 0,0033 olaraktespit edilmiştir. Aşınma deneylerine ait ağırlık kaybı sonuçları incelendiğinde Al2024 matris malzemesine 0.2 (%50 MgO+%50 CNT) ilavesi ile aşınmada ağırlık kaybı azaldığı görülmektedir. Bu kompozite 2 saat ısıl işlem uygulanması ile ağırlık kaybı 0,0033 olarak dahada azalmıştır.
4. Sonuçlar Bu çalışmada, karıştırma döküm yöntemiyle üretilen Al 2024 matrisin, Al 2024 0.2 (%50 MgO+%50 CNT) kompozitin ve Al 2024 0.2 (%50 MgO+%50 CNT) 170 °C’de 2 saat ısıl işlem görmüş kompozitin sertlik ve aşınma ağırlık kaybına uygulanan yükün etkisi araştırılmıştır.Deneyler sonucunda, malzemelerin sertliği güçlendirici karışımı ilavesi ile artmıştır. İlave edilen güçlendirici karışımı malzemenin aşınma ağırlık kaybına önemli ölçüde azaltmıştır. Sonuç olarakmatris malzemesinin katkılanması ve ısıl işlem uygulanması ile aşınma özelliklerinin iyileştirildiği söylenebilir.
Referanslar
1. N. Yuvaraj, S. Aravindan, and Vipin, “Comparison studies on mechanical and wearbehavior of fabricated aluminum surface nano composites by fusion and solid stateprocessing,” Surf. Coatings Technol., vol. 309, pp. 309–319, Jan. 2017, doi:10.1016/j.surfcoat.2016.11.076.
2. P. D. Srivyas and M. S. Charoo, “Role of Fabrication Route on the Mechanical andTribological Behavior of Aluminum Metal Matrix Composites - A Review,” in MaterialsToday: Proceedings, Jan. 2018, vol. 5, no. 9, pp. 20054–20069, doi:10.1016/j.matpr.2018.06.372.
3. P. Samal, P. R. Vundavilli, A. Meher, and M. M. Mahapatra, “Recent progress inaluminum metal matrix composites: A review on processing, mechanical and wearproperties,” Journal of Manufacturing Processes, vol. 59. Elsevier Ltd, pp. 131–152, Nov.01, 2020, doi: 10.1016/j.jmapro.2020.09.010.
4. X. S. Jiang, N. J. Wang, and D. G. Zhu, “Friction and wear properties of in-situsynthesized Al2O 3 reinforced aluminum composites,” Trans. Nonferrous Met. Soc.China (English Ed., vol. 24, no. 7, pp. 2352–2358, 2014, doi: 10.1016/S1003-6326(14)63356-2.
5. D. Zhang, K. Sugio, K. Sakai, H. Fukushima, and O. Yanagisawa, “Effect of volumefraction on the flow behavior of Al-SiC composites considering the spatial distribution ofdelaminated particles,” Mater. Trans., vol. 49, no. 3, pp. 661–670, Mar. 2008, doi:10.2320/matertrans.MER2007237.
6. S. Soltani, R. Azari Khosroshahi, R. Taherzadeh Mousavian, Z. Y. Jiang, A. FadaviBoostani, and D. Brabazon, “Stir casting process for manufacture of Al–SiC composites,”Rare Met., vol. 36, no. 7, pp. 581–590, Jul. 2017, doi: 10.1007/s12598-015-0565-7.
7. J. Kumar, D. Singh, and N. S. Kalsi, “Tribological, physical and microstructuralcharacterization of silicon carbide reinforced aluminium matrix composites: A review,” in
267

Materials Today: Proceedings, Jan. 2019, vol. 18, pp. 3218–3232, doi: 10.1016/j.matpr.2019.07.198.
8. C. F. Deng, D. Z. Wang, X. X. Zhang, and A. B. Li, “Processing and properties of carbonnanotubes reinforced aluminum composites,” Mater. Sci. Eng. A, vol. 444, no. 1, pp. 138–145, 2007, doi: 10.1016/j.msea.2006.08.057.
9. A. M. K. Esawi, K. Morsi, A. Sayed, A. A. Gawad, and P. Borah, “Fabrication andproperties of dispersed carbon nanotube-aluminum composites,” Mater. Sci. Eng. A, vol.508, no. 1–2, pp. 167–173, May 2009, doi: 10.1016/j.msea.2009.01.002.
10. H. Izadi and A. P. Gerlich, “Distribution and stability of carbon nanotubes during multi-pass friction stir processing of carbon nanotube/aluminum composites,” Carbon N. Y., vol.50, no. 12, pp. 4744–4749, Oct. 2012, doi: 10.1016/j.carbon.2012.06.012.
11. Q. Liu, L. Ke, F. Liu, C. Huang, and L. Xing, “Microstructure and mechanical property ofmulti-walled carbon nanotubes reinforced aluminum matrix composites fabricated byfriction stir processing,” Mater. Des., vol. 45, pp. 343–348, 2013, doi:10.1016/j.matdes.2012.08.036.
12. F. Mokdad, D. L. Chen, Z. Y. Liu, B. L. Xiao, D. R. Ni, and Z. Y. Ma, “Deformation andstrengthening mechanisms of a carbon nanotube reinforced aluminum composite,”Carbon N. Y., vol. 104, pp. 64–77, Aug. 2016, doi: 10.1016/j.carbon.2016.03.038.
13. M. Kok, “Production and mechanical properties of Al2O3 particle-reinforced 2024aluminium alloy composites,” J. Mater. Process. Technol., vol. 161, no. 3, pp. 381–387,Apr. 2005, doi: 10.1016/j.jmatprotec.2004.07.068.
14. M. Sameezadeh, M. Emamy, and H. Farhangi, “Effects of particulate reinforcement andheat treatment on the hardness and wear properties of AA 2024-MoSi2 nanocomposites,”Mater. Des., vol. 32, no. 4, pp. 2157–2164, Apr. 2011, doi: 10.1016/j.matdes.2010.11.037.
15. B. Rahimi, H. Khosravi, and M. Haddad-Sabzevar, “Microstructural characteristics andmechanical properties of Al-2024 alloy processed via a rheocasting route,” Int. J. Miner.Metall. Mater., vol. 22, no. 1, pp. 59–67, 2015, doi: 10.1007/s12613-015-1044-8.
268

INTERPRETATION OF PHOTOCATALYTIC PERFORMANCE AND PROTEIN ADSORBANCE OF POLYCAPROLACTONE -
POTASSIUM TITANATE HYBRIDS
TARIK NEYAL*1, DERYA KAPUSUZ 2, NECİP FAZIL YILMAZ1
1 Gaziantep University, Engineering Faculty, Mechanical Engineering Department, GAZIANTEP,TURKEY.
2 Gaziantep University, Engineering Faculty, Metallurgical and Materials Engineering Department,GAZIANTEP, TURKEY.
Abstract In the last decades, hybridizing various nanomaterials is a popular alternative to conventionalcomposite processing routes. The aim of this work is to synthesize a hybrid material made of potassium titanate (PT-K2O.nTiO2) and poly (-caprolactone) (PCL) and investigate their photocatalytic activity and protein adsorption. For this purpose, PCL/PT hybrids were preparedusing sol-gel method, followed by calcination treatment. Neat PT was synthesized by anidentical route and used as control. Scanning electron microscopy (SEM) technique was used to characterize the crystal structure and morphology. Methyl orange dye was used to investigate the photocatalytic behavior. Protein adsorbance tests were performed using bovine serumalbumin. Two different PCL/PT hybrids containing 2 and 5 wt. % PCL were prepared and compared to neat PT. In the overall, results revealed that after optimization of the composition, synthesized hybrids have potential to be used in biomedical applications where protein-implant interaction is of critical importance.
Keyword: Polycaprolactone, potassium titanate, sol-gel, serum albumin
1.IntroductionOwing to its superior properties, developing new composites based on titanium dioxide and itsderivatives have received much attention in biomedical applications. These materials findapplication especially in orthopedics and dental field owing to their favorable combination ofmechanical properties, corrosion resistance, biocompatibility and lack of inflammatoryresponse. Potassium titanate (PTs) is a large family of ceramics usually expressed as K2O.nTiO2where n=2, 4, 6, 8. [1] Until recently, they have shown remarkable strength and modulus withvarious functional properties. Depending on the value of n, they possess cage or tunnel typecrystal structures which provide them ion exchange capability or photocatalytic capabilities.[1]Moreover, when calcined at high temperatures (>700 C), they exhibit needle-like morphology.For instance, they have been used as opacifiers owing to their thermal stability, high-reflectionindex and negative temperature coefficient.[2] In addition, they were used as anodes in energystorage materials, or as super hydrophobic coatings.[3] Additionally, their photocatalyticcapability and biocompatibility opened them the door for use in biomedical applications. Theycould be fabricated using simple chemical methods and have been widely used for reinforcing
269
polymeric matrices. Most common and the simplest technique to produce PT is sol-gel method which allows synthesizing ceramic and/or glass materials at a relatively low temperature in a controlled manner.
One other advantage of sol-gel method is that it allows for hybridizing ceramics with polymersprior to turning of the liquid sol to a solid gel. One biocompatible polymer – Poly (- caprolactone) (PCL)- has proved its performance in biomedical applications. There are numerous studies involving the biomedical use of PCL in different shapes, forms and chemicalenvironments. PCL is a resorbable biomaterial with slow degradation rate, making it an ideal candidate for tissue engineering applications.[4] But it suffers from mechanical strength and durability and some critical bio-applications require mechanical durability. Therefore,hybridizing it with other bio-inert/active and mechanically durable materials is a promising approach to widen its utilization area in the biomedical field. Until now, PCL products – especially as scaffolds – could be produced using approaches such as electrospinning, freeze drying and solvent casting.[5] Sol-gel, on the other hand, was generally used to hybridize silicates with PCL.[6] In this work, sol-gel method was used to hybridize PCL with PT. The morphology of the obtained hybrids containing 2 and 5 wt. % PCL was compared to that of PT in calcined and uncalcined states. The photocatalytic behavior and protein adsorption of the hybrids were also tested. The hybrids did not exhibit photocatalytic capability; however, they were resistant to protein degradation.
2.Materials and Methods For the synthesis of PCL/PT hybrids, tetra ethyl orthotitanate (TEOT; Sigma-Aldrich 8.21083)and potassium methylate (PM, Sigma 292788) were used as the precursors. Ethanol (99 %, Sigma-Aldrich 32221) was used as the dispersing medium. Hydrochloric acid (HCl, Merck 100314) was used as the acid catalyst to accelerate the hydrolysis of TEOT. PCL (PolySciences 26289) pellets were used as-received.
For a typical synthesis, 6.9 g TEOT was first dispersed in 20 mL ethanol. After 5 min of stirring at ambient temperature, 2.03 g PM was added to this solution and stirred for 15 min. After that, PCL was added and dissolved in certain amounts. Then, to hydrolyze TEOT, 1.5 mL HCl solution (37%) was added dropwise to this mixture. Solution was kept at 40 C for 30 min under continuous stirring. Depending on their PCL content and pH, each sol gelled in a week and aged for two days resulting in formation of white-to-yellow particles after gentle crushing and grinding. As a following treatment, obtained particles were calcined at 500 C for 2 h.
Two types of hybrid particles containing different amounts of PCL were prepared and coded as PCL/PT-1 (2 wt. %) and PCL/PT-3 (5 wt. %). As control, pure PT was prepared using an identical procedure. Hybrids were characterized and compared to PT and their uncalcined states.
For characterization, scanning electron microscope (SEM) was used. For the determination of photocatalytic capability, methyl orange dye (MO 85%, Merck 114510) was used as the model molecule. For the determination of protein adsorption affinity bovine serum albumin (BSA- Sigma-Aldrich A3311) was used as the model protein.
For photocatalytic testing, typically 40 mg specimens were put in 50 mL MO solution at 7.5 g/mL concentration. Then, solutions were isolated from day light by keeping them under dark in
270

a UV-lamp (365 nm) equipped box. To provide adsorption-desorption equilibrium, specimenswere first stirred under dark for 30 min. Next, UV-light was switched-on and the solutions werestirred at room temperature under UV-light for certain times. 4 mL aliquots were taken from each solution after 1h, 2h, 3h and 4h. The behavior of degradation was observed by monitoring C/C0vs. time (C is the absorbance at 465 nm at time = t and C is the absorbance of pure MO solution at465 nm at time = 0).
3.Results and DiscussionIn Figure 1, SEM images of the PCL/PT hybrid particles are shown. As shown in Figure 1a-b, calcination did not change the morphology significantly. In PT structure, the size of particles was in nano-scale with very high agglomeration tendency. After calcination, the agglomeration behavior was more significant, with a slight increase in size. With the introduction of PCL to the structure and after calcining, the texture turned into a mixture of irregular bulk andagglomerated small particles. Increasing the PCL resulted in a softer texture.
Figure 1. SEM images of PT a) before, b) after calcination, PCL/PT-1 c) before, d) after calcination, PCL/PT-3 e) before, f) after calcination
271

In Figure 2, the MO degradation behavior of the PT and PCL/PT-3 particles after calcination are shown. Results indicated that particles before and after calcination, w/o PCL hybridization did not show photocatalytic activity against MO dye. Moreover, there were no surface adsorption under dark condition. On the contrary, the absorbance increased by increasing the duration of UV-light illumination possibly due to degradation of PCL species into the MO solution.
Figure 2. Photocatalytic degradation of a) PT b) PCL/PT-3 after calcination
To test the interaction of hybrid particles with proteins, a common blood protein; BSA was used as the model protein. In Figure 3, the BSA adsorption to calcined PCL/PT-3 particles is shown. The particles did not exhibit affinity to adsorb proteins up to 8 h.
Figure 3. Protein adsorbance of PCL/PT-3 up to 8 hr
272

4.Conclusions
PCL/PT hybrids were synthesized by sol-gel approach following a calcination treatment. Thehybrid particles did not exhibit a specific morphology. They also did not show photocatalytic capability. However, they did not adsorb blood proteins (BSA). The absence of the photocatalytic capability and also the irregular morphology of the particles were due to the amorphous structure caused by insufficient heating during calcination treatment. Increasing the PCL content led to softer texture. By optimization of the PCL content as well as the calcination procure, hybrid particles could be crystallized and used in biomedical applications wheremechanical performance, protein resistance and biocompatibility are simultaneously required.
References
1. T. Zaremba and D. Witkowska, “Methods of manufacturing of potassium titanate fibresand whiskers. A review,” Mater. Sci. Pol., vol. 28, no. 1, pp. 25–41, 2010.
2. S. Shang, Y. Wang, K. lok Chiu, and S. Jiang, “Solar heat shielding performance ofpotassium titanate whisker coated polypropylene fabric based on a bionic method,”Compos. Part B Eng., vol. 177, no. September, p. 107408, 2019, doi:10.1016/j.compositesb.2019.107408.
3. X. Zheng et al., “Understanding the structural and chemical evolution of layeredpotassium titanates for sodium ion batteries,” Energy Storage Mater., vol. 25, no. May,pp. 502–509, 2020, doi: 10.1016/j.ensm.2019.09.032.
4. “Vackova 2017 - Impact of particle morphology on structure, crystallization kinetics, andproperties of PCL composites with TiO2-based particles.pdf.” .
5. G. Yin, L. Zhang, Z. Zhou, and Q. Li, “Preparation and characterization of cross-linkedPCL porous membranes,” J. Polym. Res., vol. 23, no. 11, 2016, doi: 10.1007/s10965-016-1044-z.
6. D. Tian, P. Dubois, and R. Jerome, “A new poly(ε-caprolactone) containing hybridceramer prepared by the sol-gel process,” Polymer (Guildf)., vol. 37, no. 17, pp. 3983–3987, 1996, doi: 10.1016/0032-3861(96)00199-1.
273

A DAILY DIET PLANNING FOR DIABET PATIENTS
SERAP ULUSAM SEÇKİNER, ESRA CEYLAN
Gaziantep University, Engineering Faculty, Industrial Engineering Department, Gaziantep, TURKEY.
Abstract
A diabetic diet is an important treatment procedure for diabetic patients. Necessary nutrition should be consumed in proper sizes for long-life health. Existing menu planning showed thatthere is infancy in diabetic menu planning, current studies do not deal with carbohydrate consumption which is an essential factor for diabetic patients. In this study, an integer programming model has been constructed for diabetic menu planning according to the findingsfrom nutrition treatment recommendations and objective function minimizes the total carbohydrate consumption under some specific diabetic constraints. This study must be assumed as a preliminary work of diabetic menu planning to solve the problem via completing the necessary nutritions parameters.
Keyword: Diabet, Treatment, Nutrition, Integer Programming, Menu Planning
1. IntroductionThe number of people living with diabetes and the problems caused by diabetes is increasing.This situation creates a great economic burden due to the increase in the use of healthcareservices, loss of workforce, and the occurrence of complications such as kidney failure,blindness, cardiac problems in the long term. The cost of diabetes treatment corresponds to 12%of total health expenditures, and a large portion of this rate is associated with diseases caused bydiabetes [1]. The majority of countries spend between 5% and 20% of their total healthexpenditure on diabetes [2]. Of the financial costs related to diabetes, which were determined as327 billion dollars in 2017, 237 billion dollars are related only to medical expenses [3]. Nutritionis the most important step in diabetes. For this reason, diabetic patients need to have an easilyaccessible diet plan to reduce the burden of diabetes on the person and society.
In this study, an integer programming mathematical model has been proposed for a healthy and balanced diet which is one of the major factors for the quality of the diabetic life. There are many types of research about improving a diet from the perspective of healthy nutrition and also at a minimum cost. Typical diet problems are generally constructed as minimizing the cost while maximizing the nutritional requirements. Several publications propose solutions to the diet problem with mathematical programming. For example, Garille and Gass reviewed Stigler's diet problem, its impact on linear programming and operations research, and determined minimum cost diets using updated nutritional and cost data [4].
Reyhan, has proposed a plan on nutrients according to the values of energy and nutrients required by the soldiers under certain conditions with the linear programming method. In the
274

planning, winter and summer prices of foodstuffs were calculated and separate models were established for both seasons, and the menu was made to have a minimum cost. With this study, various menus such as cold climate menu, food menu, strong menu, submarine menu, prison menu, school menu, hospital menu were derived and it was concluded that the model could be away for the armed forces' nutritional problem [5].
Literature showed that there are many studies both worldwide and in Turkey for menu planning with mathematical modeling techniques but only two studies dealt with diabetic menu planning.The first of these studies is the study of Martin and John McCann [6]. They constructed a goal program to maximize the nutrition value of the foods. The other study is the model proposed by Kazan [7]. The objective of this study is to minimize the cost. It has been seen that none of these studies considered carbohydrates as an objective function whilst the importance of carbohydratesfor diabetic patients. Because carbohydrates affect the glucose level of the blood, minimizing the total carbohydrate consumption with necessary nutrition values is the objective of this study.
Mathematical models have been developed to shed light on solving complex problems, especially after the industrial revolution. Efforts to find solutions to problems with the help of mathematical models have brought up operational research. Directional action research, which is defined as finding the best solution by applying scientific methods, techniques, and tools to problems, is a science that leaves roots in teamwork. In this team, the operations analyst and the expert in the field in which the model will be created work together. The mathematical model ofmenu planning requires the cooperation of dietitians trained in menu planning and experts in operations [8].
The sections of this study are as follows; Section 2 presents the description of diabetics and a proposal for the mathematical model considering diabetic patients. In Section 3, the test problemresult has been discussed.
2. Materials and Methods2.1 Problem DescriptionDiabetes mellitus is a set of metabolic diseases characterized by hyperglycemia caused by theineffectiveness or defect in the release of the insulin hormone. The chronic hyperglycemia ofdiabetes causes long-term damage to different organs, especially the eye, kidney, nerve endings,heart, and vessels [9].To prevent acute complications of the disease and to reduce the risk oflong-term complications, the individual should undertake self-treatment care education andcontinuous medical treatment [10]. The treatment of this life-long disease is to provide theindividual with a change of lifestyle by first getting medical nutrition therapy and exercisehabits, to get support from medical treatment when necessary, and to enable the diabeticindividual to perform diabetes care on his own by teaching this discipline to the individual [11].
The world has been flooded with metabolic diseases triggered by the new lifestyle that emerged as a result of economic development. In parallel with these developments, the incidence of Type 2 Diabetes Mellitus has increased in all countries. This increase continues rapidly and shows a pandemic picture worldwide. According to the data published by the International Diabetes Federation in 2009, the number of people suffering from diabetes worldwide in 2010 is approximately 285 million, and it is predicted that this number will increase to approximately 439 million in 2030, with the highest increase in developed countries. The prevalence of diabetes in the adult population in Turkey in 1997 with TURDEP-II was 7,2% in 2010, reaching
275

TURDEP-II was observed that 13,7% percent of the work. It was found that the prevalence of impaired glucose tolerance increased from 6,7% in 1997 to 13,9% in 2010. Diabetes prevalence increased to 90% between the years 1997-2010 in Turkey has exceeded its targets for 2030 which is identified by the World Health Organization [12, 13].
2.2. Problem Environment and Definitions Diabetes Mellitus (DM) is a chronic metabolic disease characterized by hyperglycemia due to insulin secretion, insulin effect, or defects in both of these factors, in which the organism cannot make sufficient use of carbohydrates, fats, and proteins and requires continuous medical care. Continuous education of healthcare professionals and patients is essential to reduce the risk of acute complications and to prevent chronic (retinal, renal, neural, cardiac, and vascular) complications of the disease, which are expensive to treat in the long term [9, 10].
2.2.1. Physiopathology Insulin resistance: Glucose cannot be absorbed into the cell and used as energy due to problems with insulin use produced by the organism due to cell-receptor defect (post-receptor level) (there is intra-cell hypoglycemia). In peripheral tissues, especially muscle and fat tissue, the effect of insulin is insufficient and glucose intake decreases in muscle and fat cells [14].
The decrease in insulin secretion: Glucose production in the liver increases excessively because the pancreas does not release enough insulin in response to blood sugar levels. Therefore, the resulting insulin secretion defect and counter-insulin system hormones (cortisol, growth hormone, and adrenaline; The dawn phenomenon, which is more active in the morning, is responsible. Insulin resistance, which usually begins before type 2 diabetes, has dominated the table for many years, and a significant reduction in insulin secretion becomes apparent in the later stages of diabetes or intervening disease [14].
2.2.2. Epidemiology, Prevalence and Incidence Epidemiological studies showing the prevalence of diabetes are often based on age and self-declared diagnosis. In population studies, the differential diagnosis of diabetes, namely type 1 and type 2 DM patients, is difficult to differentiate. Information published by the International Diabetes Federation (IDF) contains the latest author views. Although it does not reflect the total prevalence, 85-95% of all adults are type 2 diabetes [15].
Between 2007 and 2025, it is predicted that the total age-adjusted prevalence will increase from 6% to 7,3% for type 2 diabetes and from 7,5% to 8% for Impaired Glucose Tolerance (IGT) in 18 years. Compared to 2007 and 2025, the absolute increase is that diabetes in the 20-79 age range from 246 million to 380 million; It indicates that the BGT will increase from 308 million to 418 million. The prevalence is highest in the Eastern Mediterranean, and the Middle East is followed by North and South America. This observation reflects the increasing life expectancy and the general aging of the North American population. The Western Pacific region, especially China, will show the biggest increase (50%) in 2005 with 100 million people. The most common diabetes is in the 40-59 age group. However, by 2025, it will be equivalent to 60-79 years old and will reach 166 and 164 million worldwide16. Comparative rates in the European region are 1,6% in Iceland and 7,9% in Germany and Austria. UK rate is 2,9% and the absolute rate is 4%, adjusted for age. It is assumed that in 2025 the adjusted rate will increase to 3,5% and the absolute rate to 4.6% (it will increase from 1.7 million people to 2.6 million) [17].
276

In 1997, the prevalence of diabetes in the adult population with turdep-II in Turkey was seen as 7.2% in 2010, while 13.7% of this rate reached TURDEP-II. The prevalence of impaired glucose tolerance was found to have increased from 6.7% in 1997 to 13.9% in 2010. For 12 years, the prevalence of diabetes in Turkey increased to 90% between 1997 and 2010 and exceeded its 2030 targets, the World Health Organization [18].
The international and the rural and urban epidemiologic research conducted prospectively PURE (Prospective Urban and Rural Epidemiological Study) study is based on 2009-2012 data for Turkey, one of every five people between 38-73 years of age is advanced diabetes, a third of this rate over sixty years It has been reported that blood sugar control is insufficient in 80% of diabetic patients. According to the research results; Turkey's average in 2009 was 13% in the incidence of diabetes has increased to 17,9% in 2012, and in our country in women compared to men, the incidence of diabetes is higher than 3% [19].
2.2.3. Type 2 DM Features These features can be described as follow;
• It usually occurs after the age of 30 and there is a strong genetic predisposition. Asgenetic density increases in the family, the risk of diabetes increases in later generations,and the disease begins to appear at an earlier age.• Patients are usually obese or overweight (BMI:> 25 kg / m2).• Patients are not initially prone to Diabetic Ketoacidosis (DKA). However, DKA can beseen in a long-term hyperglycemic course or later periods when cell reserve decreases.• Many patients do not have any initial symptoms. Some patients may also apply due toblurring of vision, numbness, and tingling of the hands and feet, foot pain, recurring yeastinfections or delay in wound healing [14].
2.2.4. Type 2 Diabetes Treatment -Medical TreatmentThe main purpose of diabetes treatment is to prevent the development of type 2 DM in high-riskindividuals and the most important point in the treatment of type 2 DM is the individualization oftreatment. The approach to the treatment of patients with type 2 diabetes has changed drasticallyin recent years. In this regard, international authorities publish up-to-date treatment algorithmsone after the other. Many of these algorithms are supported by evidence-based studies but arepredominantly based on expert opinions. While previous algorithms have highlighted loweringglycemic control targets, current algorithms have recommended individualization of glycemiccontrol targets by the patient's characteristics and initiating insulin and combination thetreatments earlier than traditional step therapy [10].
-Medical Nutrition Therapy (MNP) in DiabetesMedical Nutrition Therapy consists of four basic application steps:
• Evaluation: Individual evaluation of parameters such as anthropometric measurements,social life history, food consumption history, laboratory examinations, blood pressure,physical activity history, medical treatment, willingness to change lifestyle for therecommendations to be given to the diabetic individual.
• Nutritional diagnosis and target determination: Determining the nutritional diagnosis as aresult of evaluating the nutritional status of the individual and other parameters with thefood consumption history, determining the appropriate energy and macronutrient
277

requirement level for the individual. The diabetic individual and the dietitian together determine the achievable goals and specific applicable behaviors.
• Nutrition intervention, education: As a result of the evaluation, the nutritional diagnosisis determined, the existing problems related to nutritional behavior are determined.Nutritional diagnosis is determined as carbohydrate intake that is not suitable for theneeds, fat consumption is higher than the required levels, carbohydrate consumptionvaries from meal to meal, and excess consumption frequency of foods with a highglycemic index. The treatment goal varies from individual to individual. The goal forevery person with diabetes may not be to achieve blood sugar control. For someindividuals, the goal may be to maintain blood sugar control, while maintaining controlof the blood lipid profile may be to control body weight for another. To provide simpleand detailed training, one-on-one interviews are made with the person with diabetes.
• Follow-up: It is necessary to evaluate practices, compliance, and clinical results, toidentify existing problems and focus on their solutions. Food consumption, fasting, andpostprandial blood glucose monitoring results are evaluated together at this stage. Ifnecessary, mealtime and meal content are rescheduled according to current changes inmedical treatment [10].
For MNP to succeed, it is necessary to transfer the nutritional habits of the diabetic and the socioeconomic appropriate nutrition plan to the patient by supporting nutritional education, aswell as monitoring the behavior change in understanding the information given and converting itinto practice, and the solution of the problems should be provided with the patient. Here, the member of the diabetes team should play a guiding role, not a sanctioning one [10].
The effectiveness of MNP is evaluated within 6 weeks to 3 months after starting treatment. If a clinical improvement is detected in glycemic control at the end of the third month, the dieticianshould refer the patient to a physician for evaluation of medical treatment. The administration of MNP in an individual with diabetes who is diagnosed with diabetes and directed to a dietician includes 3-4 visits, each lasting 45-90 minutes, completed within 3-6. It continues with at least one annual consultation to support lifestyle changes and evaluate treatment.
-Macro Nutrients in Diabetes Treatment• Evidence suggests that there are no ideal ratios of energy from macronutrients for all peoplewith diabetes.• The distribution of macronutrients in individuals with diabetes is individualized based ontreatment goals, individual preferences, and current eating habits. 45-60% of total energy needscan be met from carbohydrates, 10-20% from proteins, 20-35% from fat. <7% of the energy canbe met from saturated fat, trans fat intake should be <1%.• The proportions of energy to be provided from carbohydrate, protein, and fat may varyaccording to metabolic goals and the preferences of the diabetic individual. It is not correct togive recommendations according to a standard distribution. However, providing <30% of theenergy from fat and <7% of saturated fat is effective in preventing cardiovascular diseases.• Very low carbohydrate diets are not recommended because they limit the consumption of toomany nutrients with vitamins, minerals, fiber, and energy sources [10].
278

2.2.5. Carbohydrates(CH) • The effect of type and amount of carbohydrate is important in MNP of diabetes [20]. Recent studies show that a high-carbohydrate diet (> 60%) increases blood lipids, especially triglycerides and glycemic response. • The dietary model required to be healthy should include foods with CH such as whole grains, fruits, vegetables, and low-fat milk.• In the treatment of diabetes, diets with low CH that keep the daily CH intake below 130 g are not recommended. • In individuals taking only MNP or using oral antidiabetic drugs or insulin with MNP, the intakeof CH should be distributed between meals and snacks and should not change from day to day but in similar amounts.• Monitoring of CH uptake, using CH counting, change lists, or experience-based computation,is the key to achieving glycemic control.• People with type 1 and type 2 diabetes who adjust their mealtime insulin by themselves or use an insulin pump should adjust their insulin dose according to their carbohydrate intake(carbohydrate-insulin ratio). For this, the individual should be given detailed nutrition training to calculate CH count (30-33) and CH/insulin ratio and insulin sensitivity factor, and the effect of carbohydrates on blood glucose should be explained by correlating individual blood glucose measurement results and food consumption records. • It should be emphasized to individuals who apply carbohydrate count as a meal planning method, that an increase in energy intake will cause an increase in weight, and that protein and fat consumption other than carbohydrates should not exceed the amounts given in the treatment. • Considering the glycemic index and glycemic load of CHs in addition to the daily total amount of CH taken may provide additional benefit in glycemic control. • Foods containing sucrose can be used in the meal plan in a way that the CH amount does notexceed 10% of the daily energy requirement instead of an equivalent food if it is added to themeal plan without a replacement, the dose of insulin should be adjusted. It should also beremembered that excessive energy intake should be avoided.• Fructose, which is found naturally in fruits, can provide better glycemic control compared toconsuming sucrose or starch at equivalent calories. As long as the consumption of fructose foundnaturally in fruits does not exceed 12% of the daily energy, it has no negative effect ontriglyceride levels.• Fiber consumption should be supported, but it is not necessary to advise individuals withdiabetes to consume more fiber than the recommended amounts (14 g / 1000 kcal/day, 7-13 gsoluble fiber) for the general population.• Individuals with diabetes should avoid or limit the consumption of beverages sweetened withsugar (calorie-containing sweeteners such as sucrose or high-fructose corn syrup) to reduce therisk of increased body weight and worsening of the cardiometabolic risk profile [10].2.2.6. Fat and cholesterolThe type and quantity of fat in the diet is of great importance for the development of metaboliccontrol and complications. Reducing saturated fat and cholesterol intake in the diet is of greatimportance in achieving the goal of keeping LDL cholesterol below 100 mg / dl [10].
• The evidence associated with the ideal total fat intake for a diabetic individual is controversial.Targets must be individualized.• The type of fat consumed is more important than the total amount of fat. Recommendations forsaturated fat intake, cholesterol, and trans fat are the same for non-diabetic populations.
279

• In individuals with type 2 diabetes, the Mediterranean diet, a diet rich in unsaturated fatty acids, can affect cardiovascular risk factors, and therefore a low-fat, high-carbohydrate diet may be recommended as an alternative. • It is recommended to increase foods containing long chain-3 fatty acids (EPA and DHA) and n-3 linolenic acid, it is recommended for individuals without diabetes, taking into account the beneficial effect on lipoproteins and their preventive effects on heart disease. • The evidence does not support the proposal for routine n-3 (EPA and DHA) supplementation for the prevention and treatment of cardiovascular events in individuals with diabetes. • Diabetic individuals are recommended to eat fish at least 2 times a week (2 servings) as recommended for individuals without diabetes. • Diabetic individuals with dyslipidemia, consuming 1,6-3 g / day herbal stanol or sterol may beeffective in taking total and LDL cholesterol levels.• Saturated fat intake should be limited to less than 7% of total calories.• Trans fat intake should be greatly reduced due to its effect on decreasing LDL-cholesterol leveland increasing HDL cholesterol level.• Cholesterol intake should be below 200 mg per day in individuals with diabetes.• Two or more servings of fish per week provide omega-3 (n-3) polyunsaturated fatty acids and this amount should be recommended.
2.2.7. Protein • Evidence regarding the recommendation of an idealized amount of protein intake is controversial as it is effective in the development/control of 1 or more than 1 cardiovascular risk indicator in individuals with diabetes (when there is no evidence of chronic kidney disease) and improves glycemic control. • Protein intake of <0,8-1,0 g / kg is not recommended in diabetic individuals and diabeticindividuals with diabetes-related kidney disease (persistent albuminuria ≥ 30 mg / 24 hours). Afurther reduction in protein intake does not change the course of the decrease in GFR, nor does itimprove cardiovascular risk indicators.• In individuals with type 2 diabetes, the digestion of proteins can increase insulin responsewithout increasing blood glucose concentration. Therefore, proteins should not be used in acutehypoglycemia or the treatment of nocturnal hypoglycemia.• High protein diets are not recommended for weight loss. The effect of protein intake of morethan 20% of energy on diabetes treatment and complications is unknown. These types of dietscan provide weight loss and increase glycemia in the short term. However, these benefits are notprovided in the long term. The increase in protein intake also increases saturated fat intake.• It is recommended that 15-20% of daily energy (0.8-1 g / kg/ day) is met from proteins in thegeneral society.• The effect of proteins on blood sugar levels in patients with type 1 diabetes is not clear.• There is insufficient evidence to support the use of cinnamon and other herbal supplements inthe treatment of diabetes [10].
-Micronutrients and Herbal Supplements in Diabetes Treatment• The dietician should ensure that the levels of vitamins and minerals recommended in the dietare met with the meal plan.• Unless there are signs of deficiency, there is no clear evidence to suggest vitamin and mineralsupplements to individuals with diabetes as in the general population.
280

• Routine supplementation of antioxidants such as Vitamins E, C, and Carotene is not recommended, since there is insufficient evidence regarding the safety and efficacy of its long-term use. • The benefits of supplementation of micronutrients such as calcium, magnesium, and vitamin D in diabetic individuals or obese individuals have not been proven and therefore notrecommended [10].
-Salt• The consumption of <2300 mg/day sodium (5800 mg table salt) recommended for the general population is also suitable for individuals with diabetes. • Additional reduction in sodium intake in diabetic individuals with hypertension should be madeaccording to the individual [21].
2.3. Nutritional Therapy in Type 2 DM • To improve glycemia, dyslipidemia, and BP values, people with type 2 diabetes should be supported to reduce their intake of energy, saturated and trans fats, cholesterol, and sodium, and to increase their physical activity.• Time of main and snacks and meal content should be similar from day to day.• PG monitoring can be used to determine whether adjustments to foods and meals are sufficientto achieve target blood glucose levels or if drug therapy needs to be combined with MNP.
2.4. Number and Distribution of MealsStudies show that people with diabetes can improve glycemic control through weight loss. The success of this improvement can be achieved by regulating food intake intervals. It has been shown that it is beneficial to distribute foods throughout the day instead of consuming 2-3 meals. Although insulin takes longer to lower blood glucose due to the delay in acute or 1st phase insulin release, sufficient insulin can be produced in individuals with type 2 diabetes. If meals are distributed at 4-5 hour intervals, pre-meal blood glucose values may be at acceptable levels to maximize endogenous insulin secretion. Frequent meals are more suitable for endogenous insulin production. Individual blood glucose monitoring helps determine the ideal meal interval and amount [16].
2.5. Meal Planning Methods Used in MNP People with diabetes are taught how to plan meals in nutrition education. For this, the dietician can use different methods and educational tools such as change lists, nutrition pyramid, plate model, 1st level of carbohydrate counting, taking into account the individual's lifestyle, education level, and application skills. The plate method is a method that is used visually to explain the principles of healthy nutrition, to limit carbohydrate intake, and to provide information in a short time. The plate model may be preferred in individuals with diabetes who have a high frequency of eating outside the home, have difficulty in applying other methods, have a low level of education, are found to have high protein and carbohydrate intake in food consumption, and are newly diagnosed with diabetes (see Figure 1) [10].
281

Figure 1. Plate Model
2.6. Nutrition Education of Individuals with Diabetes and Priority Issues in EducationThe current strategy in the treatment of chronic diseases is to educate the patient about the disease. Education of diabetic individuals in the early 1900s; he started by teaching patients to control their sugar in the urine. In 1918, Dr. Eliot P. Joslin's "Joslin Diabetes Handbook" is the first educational material prepared to help diabetic patients live with their illnesses. The first diabetes training program was implemented by Dr. Bu Portugal in Rome. In the following years, various studies were carried out on this issue. It has often been noted that educated diabetic individuals control their diabetes and have fewer complications. Diabetes training is carried out by a diabetes team. Diabetes centers should be developed to provide effective diabetes treatment and the diabetes team, individuals with diabetes, and their families should be trained [22]. Nutrition education of the diabetic individual should be given by an experienced diabetes dietician. The issues that a diabetes dietician should prioritize in education are listed below [10]. • Carbohydrate-containing foods, beverages, and endogenous/exogenous insulin are the maindeterminants of postprandial glucose control. It should be known that whole grains, starchyvegetables, fruit, milk, dairy products (except cheese), vegetables, and sugar containcarbohydrates.• When foods containing carbohydrates are to be consumed, consumption of high-fiber,nutritious carbohydrate foods should be preferred instead of processed/packaged foodscontaining salt, fat, sugar. These foods provide vitamins, minerals, and other healthy elements aswell as do not contain fat, sugar, and refined carbohydrates, and provide less energy.• Portion control should be recommended to reduce and manage body weight.• Drinks flavored with sugar and high fructose corn syrup should not be preferred.• Foods containing unsaturated fats (oils) should be preferred instead of foods containingsaturated fat and trans fat.
282

• To meet the protein requirement of animal origin, low-fat ones should be preferred instead ofthose with high-fat content.• Since the evidence is insufficient, vitamin and mineral supplements, herbal products, andcinnamon are not recommended for diabetes treatment.• Sodium intake should be 2300 mg per day.• Medical treatment should be associated with food intake.
2.7. Objective Function and Constraints In this study, considering above diabetic life conditions and requirements, an integer programming model has been proposed that objective function that minimizes total carbohydrateconsumption. The proposed model will schedule the foods among the defined menu list according to the objective function and the constraints.
The first step is constructing the menu list. To do this, the study of Koç [23] has been reviewed and the menu list of this study will be used with some changes and additive information. The first additive information will be determining some missing nutritive values for foods such ascarbohydrate values, saturated fat, fiber, and salt. It has been seen that the study of Koç [23] did not deal with these values which are very important for a diabetic diet. Also as can be seen in Section 2, fish is a very important food which should be included in a diabetic diet. The list of food will be given in their Turkish names as in stated in the study of Koç [23]. Each food will be coded. 54 meals and 10 breakfast meals from the study of Koç [23] will be used and two different fish meals will be added. In total 56 meals and 10 breakfast meals will be used as it can be seen in Table1.
Table1.Menu list Food Code Meal Food Size X1 Breakfast Egg 1 pcs X2 Breakfast White Cheese 30 gr X3 Breakfast Kashar Cheese 30 gr X4 Breakfast Olive 30 gr X5 Breakfast Butter 20 gr X6 Breakfast Margarine 20 gr X7 Breakfast Tea (Sugar free) 1 cup X8 Breakfast Milk (Sugar free) 1 cup X9 Breakfast Apple 1 pcs X10 Breakfast Orange 1 pcs X11 Soup Red Lentil 1 portion X12 Soup Yoghurt 1 portion X13 Soup Ezogelin 1 portion X14 Soup Green Lentil 1 portion X15 Soup Chicken Broth 1 portion X16 Soup Rice 1 portion X17 Soup Noodle 1 portion X18 Soup Tomatoes 1 portion X19 Soup Flour 1 portion X20 Meat Meals Meat Stew 1 portion
283
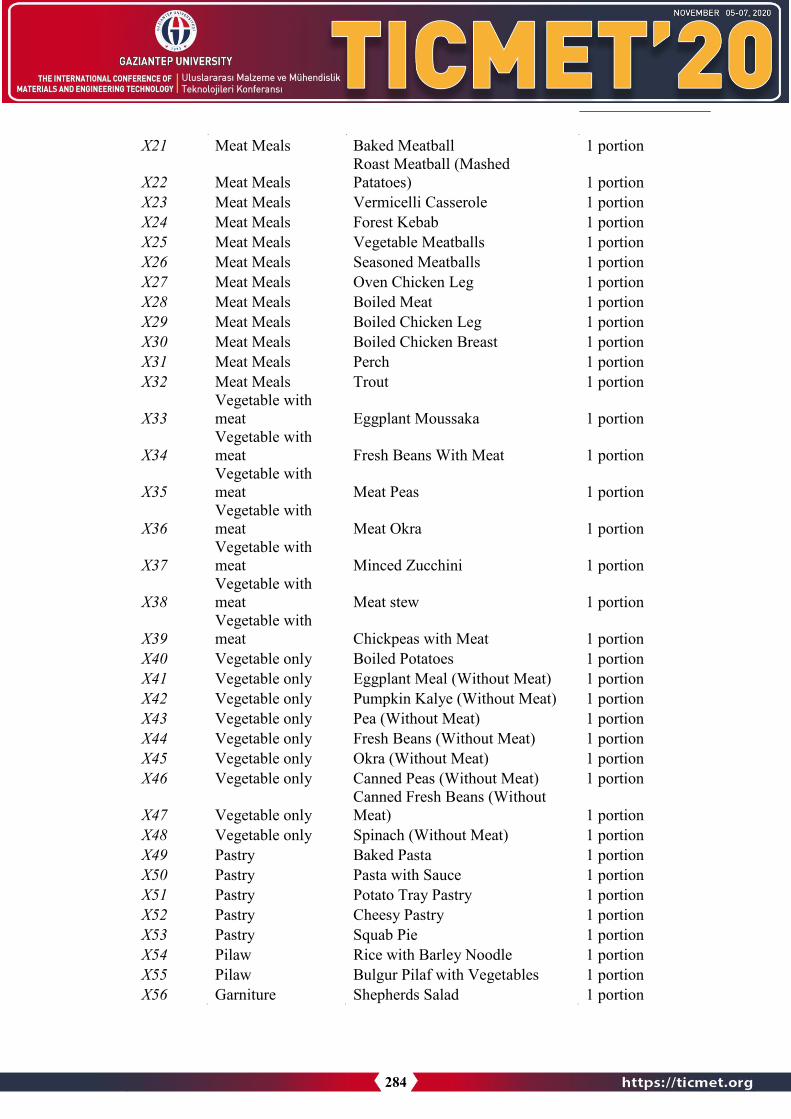
X21 Meat Meals Baked Meatball 1 portion
X22 Meat Meals Roast Meatball (Mashed Patatoes) 1 portion
X23 Meat Meals Vermicelli Casserole 1 portion X24 Meat Meals Forest Kebab 1 portion X25 Meat Meals Vegetable Meatballs 1 portion X26 Meat Meals Seasoned Meatballs 1 portion X27 Meat Meals Oven Chicken Leg 1 portion X28 Meat Meals Boiled Meat 1 portion X29 Meat Meals Boiled Chicken Leg 1 portion X30 Meat Meals Boiled Chicken Breast 1 portion X31 Meat Meals Perch 1 portion X32 Meat Meals Trout 1 portion
X33 Vegetable with meat Eggplant Moussaka 1 portion
X34 Vegetable with meat Fresh Beans With Meat 1 portion
X35 Vegetable with meat Meat Peas 1 portion
X36 Vegetable with meat Meat Okra 1 portion
X37 Vegetable with meat Minced Zucchini 1 portion
X38 Vegetable with meat Meat stew 1 portion
X39 Vegetable with meat Chickpeas with Meat 1 portion
X40 Vegetable only Boiled Potatoes 1 portion X41 Vegetable only Eggplant Meal (Without Meat) 1 portion X42 Vegetable only Pumpkin Kalye (Without Meat) 1 portion X43 Vegetable only Pea (Without Meat) 1 portion X44 Vegetable only Fresh Beans (Without Meat) 1 portion X45 Vegetable only Okra (Without Meat) 1 portion X46 Vegetable only Canned Peas (Without Meat) 1 portion
X47 Vegetable only Canned Fresh Beans (Without Meat) 1 portion
X48 Vegetable only Spinach (Without Meat) 1 portion X49 Pastry Baked Pasta 1 portion X50 Pastry Pasta with Sauce 1 portion X51 Pastry Potato Tray Pastry 1 portion X52 Pastry Cheesy Pastry 1 portion X53 Pastry Squab Pie 1 portion X54 Pilaw Rice with Barley Noodle 1 portion X55 Pilaw Bulgur Pilaf with Vegetables 1 portion X56 Garniture Shepherds Salad 1 portion
284

X57 Garniture Pickle 1 portion X58 Garniture Cacik 1 portion X59 Garniture Buttermilk 1 portion X60 Garniture Yoghurt 1 portion X61 Garniture Bowl Yoghurt 1 portion X62 Fruit Orange 1 portion X63 Fruit Apple 1 portion X64 Fruit Strawberry 1 portion X65 Fruit Plum 1 portion X66 Fruit Maltese Plum 1 portion
The constraints will be constructed according to the recommendations in Section 2. Theproposed menu should provide necessary nutritive values for a diabetic patient and also the
sequence will be ensured. The same food should not be on the same day or the same week.Nutritive constraints can be summarized as below;
• Daily carbohydrate should not be below 130 g.• Fiber consumption should be more than 14 g/day.• Energy from fructose from natural fruits should be below 12% daily calories.• Cholesterol intake should be below 200 mg/day• Energy from saturated fat should be below 7% daily calories.• At least two fish meals should be served per week.• Energy from protein should be below 15 % daily calories.• Sodium consumption should be below 2300 mg/day.• Vitamin consumption should be the same as the general population for diabetic
patients.
Menu constraints can be summarized as below; • The same main meal must be taken once a week. (Except for breakfast meal)• At least one meal must include soup (Except breakfast).• A vegetable meal should be served with a meat meal.• A pilaw should be served once a day(lunch or dinner).• Only fruit, milk, or yogurt should be taken in pre-meals. (Maximum 2 choices)• Two different pastry can not be served at the same meal.• Garnitures must be served at lunch and dinner• Pilaw and pastry can not be served at the same meal.
2.7.1.Mathematical Model Notation of the mathematical model is stated as below; i = food indices (i=1,…,66) j = meal (j=1,…,150) - 30 days* 5 meals k = day of the month (1,..,30) Decision Variables 𝑋𝑋𝑖𝑖𝑖𝑖 = 1 , if i. food at j. Meal, 0, if not i. food at j. meal Parameters E = daily energy requirement C = daily carbohydrate requirement
F = daily fiber requirement Fr = daily fructose sugar requirement
285

Y = daily fat requirement Sy = daily saturated fat requirement P = daily protein requirementS = daily salt requirement K = daily calcium requirement A = daily A vitamin requirement V = daily C vitamin requirement𝑒𝑒𝑖𝑖 = energy value of the i. food 𝑐𝑐𝑖𝑖 = carbohydrate value of the i. food. 𝑓𝑓 = fiber value of the i. Food
𝑓𝑓𝑓𝑓𝑖𝑖 = fructose value of the i. Food 𝑦𝑦𝑖𝑖 = fat value of the i. food 𝑠𝑠𝑦𝑦𝑖𝑖 = saturated fat value of the i. food 𝑝𝑝𝑖𝑖 = protein value of the i. Food 𝑠𝑠𝑖𝑖 = salt value of the i. food 𝑘𝑘𝑖𝑖 = calcium value of the i. food 𝑎𝑎𝑖𝑖 = vitamin A value of the i. food 𝑣𝑣𝑖𝑖 = vitamin C value of the i. food
Objective Function
𝑚𝑚𝑚𝑚𝑚𝑚 𝑧𝑧 = ��𝑐𝑐𝑖𝑖 ∗ 𝑥𝑥𝑖𝑖𝑖𝑖
150
𝑖𝑖=1
66
𝑖𝑖=1
(𝐸𝐸𝐸𝐸. 1)
Eq.1 is the objective function that aims to minimize the total carbohydrate consumption.
Constraints
��𝑒𝑒𝑖𝑖 ∗ 𝑥𝑥𝑖𝑖𝑖𝑖
𝑘𝑘+4
𝑖𝑖=𝑘𝑘
66
𝑖𝑖=1
≥ 𝐸𝐸; 𝑘𝑘 = 1,6,11,16,21,26 (𝐸𝐸𝐸𝐸. 2)
��𝑐𝑐𝑖𝑖 ∗ 𝑥𝑥𝑖𝑖𝑖𝑖
𝑘𝑘+4
𝑖𝑖=𝑘𝑘
66
𝑖𝑖=1
≥ 130; 𝑘𝑘 = 1,6,11,16,21,26 (𝐸𝐸𝐸𝐸. 3)
��𝑓𝑓𝑖𝑖 ∗ 𝑥𝑥𝑖𝑖𝑖𝑖
𝑘𝑘+4
𝑖𝑖=𝑘𝑘
66
𝑖𝑖=1
≥; 14; 𝑘𝑘 = 1,6,11,16,21,26 (𝐸𝐸𝐸𝐸. 4)
��𝑓𝑓𝑓𝑓𝑖𝑖 ∗ 𝑥𝑥𝑖𝑖𝑖𝑖
𝑘𝑘+4
𝑖𝑖=𝑘𝑘
66
𝑖𝑖=1
≤ 0,12 ∗ 𝐸𝐸; 𝑘𝑘 = 1,6,11,16,21,26 (𝐸𝐸𝐸𝐸. 5)
��𝑦𝑦𝑖𝑖 ∗ 𝑥𝑥𝑖𝑖𝑖𝑖
𝑘𝑘+4
𝑖𝑖=𝑘𝑘
66
𝑖𝑖=1
≤ 200; 𝑘𝑘 = 1,6,11,16,21,26 (𝐸𝐸𝐸𝐸. 6)
��𝑠𝑠𝑦𝑦𝑖𝑖 ∗ 𝑥𝑥𝑖𝑖𝑖𝑖
𝑘𝑘+4
𝑖𝑖=𝑘𝑘
66
𝑖𝑖=1
≤ 0,07 ∗ 𝐸𝐸; 𝑘𝑘 = 1,6,11,16,21,26 (𝐸𝐸𝐸𝐸. 7)
��𝑝𝑝𝑖𝑖 ∗ 𝑥𝑥𝑖𝑖𝑖𝑖
𝑘𝑘+4
𝑖𝑖=𝑘𝑘
66
𝑖𝑖=1
≤ 0,15 ∗ 𝐸𝐸; 𝑘𝑘 = 1,6,11,16,21,26 (𝐸𝐸𝐸𝐸. 8)
��𝑠𝑠𝑖𝑖 ∗ 𝑥𝑥𝑖𝑖𝑖𝑖
𝑘𝑘+4
𝑖𝑖=𝑘𝑘
66
𝑖𝑖=1
≤ 2300; 𝑘𝑘 = 1,6,11,16,21,26 (𝐸𝐸𝐸𝐸. 9)
��𝑘𝑘𝑖𝑖 ∗ 𝑥𝑥𝑖𝑖𝑖𝑖
𝑘𝑘+4
𝑖𝑖=𝑘𝑘
66
𝑖𝑖=1
≥ 𝐾𝐾; 𝑘𝑘 = 1,6,11,16,21,26 (𝐸𝐸𝐸𝐸. 10)
286

��𝑎𝑎𝑖𝑖 ∗ 𝑥𝑥𝑖𝑖𝑖𝑖
𝑘𝑘+4
𝑖𝑖=𝑘𝑘
66
𝑖𝑖=1
≥ 𝐴𝐴; 𝑘𝑘 = 1,6,11,16,21,26 (𝐸𝐸𝐸𝐸. 11)
��𝑣𝑣𝑖𝑖 ∗ 𝑥𝑥𝑖𝑖𝑖𝑖
𝑘𝑘+4
𝑖𝑖=𝑘𝑘
66
𝑖𝑖=1
≥ 𝑉𝑉; 𝑘𝑘 = 1,6,11,16,21,26 (𝐸𝐸𝐸𝐸. 12)
��𝑥𝑥𝑖𝑖𝑖𝑖
𝑘𝑘
𝑖𝑖=𝑘𝑘
10
𝑖𝑖=1
≤ 5; 𝑘𝑘 = 1,6,11,16,21,26, … , 146 (𝐸𝐸𝐸𝐸. 13)
�𝑥𝑥7𝑖𝑖 +𝑘𝑘
𝑖𝑖=𝑘𝑘
�𝑥𝑥8𝑖𝑖 = 1 ; 𝑘𝑘 = 1,6,11,16,21,26, … , 146 (𝐸𝐸𝐸𝐸. 14)𝑘𝑘
𝑖𝑖=𝑘𝑘
� (�𝑥𝑥𝑖𝑖𝑘𝑘 +�𝑥𝑥𝑖𝑖(𝑘𝑘+2))𝑘𝑘
𝑖𝑖=𝑘𝑘
𝑘𝑘
𝑖𝑖=𝑘𝑘
19
𝑖𝑖=11
= 1; 𝑘𝑘 = 3,8,13,19,24,30, … , 148 (𝐸𝐸𝐸𝐸. 15)
� (�𝑥𝑥𝑖𝑖𝑘𝑘 +�𝑥𝑥𝑖𝑖(𝑘𝑘+2))𝑘𝑘
𝑖𝑖=𝑘𝑘
𝑘𝑘
𝑖𝑖=𝑘𝑘
32
𝑖𝑖=21
+ � (�𝑥𝑥𝑖𝑖𝑘𝑘 +�𝑥𝑥𝑖𝑖(𝑘𝑘+2))𝑘𝑘
𝑖𝑖=𝑘𝑘
𝑘𝑘
𝑖𝑖=𝑘𝑘
48
𝑖𝑖=40
= 1;
𝑘𝑘 = 3,8,13,19,24,30, … , 148 (𝐸𝐸𝐸𝐸. 16)
�𝑥𝑥54𝑖𝑖 +𝑘𝑘
𝑖𝑖=𝑘𝑘
� 𝑥𝑥55𝑖𝑖 + �𝑥𝑥54(𝑖𝑖+2) + �𝑥𝑥55(𝑖𝑖+2) +𝑘𝑘
𝑖𝑖=𝑘𝑘
𝑘𝑘
𝑖𝑖=𝑘𝑘
= 1 ;
𝑘𝑘 = 3,8,13,19,24,30, … , 148 (𝐸𝐸𝐸𝐸. 17)
𝑘𝑘
𝑖𝑖=𝑘𝑘
�𝑥𝑥8𝑖𝑖 +𝑘𝑘
𝑖𝑖=𝑘𝑘
�𝑥𝑥60𝑖𝑖 𝑘𝑘
𝑖𝑖=𝑘𝑘
+ �𝑥𝑥61𝑖𝑖
𝑘𝑘
𝑖𝑖=𝑘𝑘
+ �𝑥𝑥62𝑖𝑖
𝑘𝑘
𝑖𝑖=𝑘𝑘
+ �𝑥𝑥63𝑖𝑖
𝑘𝑘
𝑖𝑖=𝑘𝑘
+ �𝑥𝑥64𝑖𝑖 + �𝑥𝑥65𝑖𝑖 + �𝑥𝑥66𝑖𝑖 = 2 ; 𝑘𝑘 = 2,7,12,17, … , 147 (𝐸𝐸𝐸𝐸. 18)𝑘𝑘
𝑖𝑖=𝑘𝑘
𝑘𝑘
𝑖𝑖=𝑘𝑘
𝑘𝑘
𝑖𝑖=𝑘𝑘
287

�𝑥𝑥8𝑖𝑖 +𝑘𝑘
𝑖𝑖=𝑘𝑘
�𝑥𝑥60𝑖𝑖
𝑘𝑘
𝑖𝑖=𝑘𝑘
+ �𝑥𝑥61𝑖𝑖
𝑘𝑘
𝑖𝑖=𝑘𝑘
+ �𝑥𝑥62𝑖𝑖
𝑘𝑘
𝑖𝑖=𝑘𝑘
+ �𝑥𝑥63𝑖𝑖
𝑘𝑘
𝑖𝑖=𝑘𝑘
+ �𝑥𝑥64𝑖𝑖 + �𝑥𝑥65𝑖𝑖 + �𝑥𝑥66𝑖𝑖 = 2 ; 𝑘𝑘 = 4,9,14,19, … , 149 (𝐸𝐸𝐸𝐸. 19)𝑘𝑘
𝑖𝑖=𝑘𝑘
𝑘𝑘
𝑖𝑖=𝑘𝑘
𝑘𝑘
𝑖𝑖=𝑘𝑘
� (�𝑥𝑥𝑖𝑖𝑘𝑘 +�𝑥𝑥𝑖𝑖(𝑘𝑘+2))𝑘𝑘
𝑖𝑖=𝑘𝑘
𝑘𝑘
𝑖𝑖=𝑘𝑘
53
𝑖𝑖=49
= 1; 𝑘𝑘 = 3,8,13,19,24,30, … , 148 (𝐸𝐸𝐸𝐸. 20)
� (�𝑥𝑥𝑖𝑖𝑘𝑘 +�𝑥𝑥𝑖𝑖(𝑘𝑘+2))𝑘𝑘
𝑖𝑖=𝑘𝑘
𝑘𝑘
𝑖𝑖=𝑘𝑘
61
𝑖𝑖=56
= 1; 𝑘𝑘 = 3,8,13,19,24,30, … , 148 (𝐸𝐸𝐸𝐸. 21)
� 𝑥𝑥𝑖𝑖𝑘𝑘 = 1 ; 𝑘𝑘 = 3,8,13,19,24,30, … , 148 (𝐸𝐸𝐸𝐸. 22)61
𝑖𝑖=54
� 𝑥𝑥𝑖𝑖𝑘𝑘 = 1 ; 𝑘𝑘 = 5,10,15,20,25,30, … , 150 (𝐸𝐸𝐸𝐸. 23)61
𝑖𝑖=54
� 𝑥𝑥𝑖𝑖𝑘𝑘 = 1 ; 𝑘𝑘 = 3,5,8,10,13,15,18,20,23,25 66
𝑖𝑖=11
(𝐸𝐸𝐸𝐸. 24)
� 𝑥𝑥𝑖𝑖𝑘𝑘 = 1 ; 𝑘𝑘 = 28,30,33,35,38,40,43,45,48,5066
𝑖𝑖=11
(𝐸𝐸𝐸𝐸. 25)
� 𝑥𝑥𝑖𝑖𝑘𝑘 = 1 ; 𝑘𝑘 = 53,55,58,60,63,65,68,70,73,75 66
𝑖𝑖=11
(𝐸𝐸𝐸𝐸. 26)
� 𝑥𝑥𝑖𝑖𝑘𝑘 = 1 ; 𝑘𝑘 = 78,80,83,85,88,90,93,95,98,100 66
𝑖𝑖=11
(𝐸𝐸𝐸𝐸. 27)
� 𝑥𝑥𝑖𝑖𝑘𝑘 = 1 ; 𝑘𝑘 = 103,105,108,110,113,115,118,120,122,125 (𝐸𝐸𝐸𝐸. 28) 66
𝑖𝑖=11
� 𝑥𝑥𝑖𝑖𝑘𝑘 = 1 ; 𝑘𝑘 = 127,130,132,135,137,140,142,145,147,149 66
𝑖𝑖=11
(𝐸𝐸𝐸𝐸. 29)
288

��𝑥𝑥𝑖𝑖𝑖𝑖
150
𝑖𝑖=1
66
𝑖𝑖=1
; 𝑏𝑏𝑚𝑚𝑚𝑚𝑎𝑎𝑓𝑓𝑦𝑦 (𝐸𝐸𝐸𝐸. 30)
Here, Eq.2-Eq.12 are the nutritive value constraints. Eq.13 allows at least 5 selection forbreakfast and Eq.14 ensures only 1 selection, tea, or milk. Eq.15 ensures the selection of a soup for each meal and Eq.16 ensures the selection of meat and vegetable for the same meal. Eq.17 provides pilaw selection for each meal. Eq.18 and 19 are the constraints for pre-meal selection between breakfast, lunch, and dinner. Eq.20 allows only 1 pastry selection for a meal while Eq.21 provides a garniture selection for each meal. Eq.23 and 24 constraints pastry and pilawselection for lunch and dinner at the same time. Eq.25-29 provides that the same food will be served once a week. Eq.30 provides the decision variables to be 0 or 1.
3. Results and DiscussionIn this study, diabetic diet planning with mixed-integer linear programming has been proposed. Firstly, a literature review for menu planning has been searched and it has been seen that diabetic menu mathematical modeling is a few in litearture. The current studies have considered cost minimization for daily diet menu instead of carbohydrate consumption.
Scientific findings for diabetics were very important to generate for minimizing total carbohydrate consumption. For testing the proposed model, we considered a test problem for the diabetic diet problem. As a result of the simple test problem, the daily total carbohydrate value has been determined as 37 grams with the determined restricted foods, and a daily diet list wascreated and optimum function value was obtained. Table 2 contains the data of the start menü.The proposed mathematical model was solved by GAMS 23.5 Software (CPLEX solver). In future of this work, real cases will be considered by enhancing the menu in question andproviding nutritious values. With the proposed mathematical model, it is expected that all kindsof menu planning can be solved not only for diabetic diets. Also, by adding cost constraints to the constraints, it can be made suitable for the structure of any model. In this way, lower-cost menus can be made, as well as higher-cost menus.
Table 2. Test Problem Results Test
Problem Results
Food Code Meal Food Size Breakfast Pre-meal Lunch Pre-
meal Dinner
X1 Breakfast Egg 1 pcs 1 1 1
X2 Breakfast White Cheese 30 gr 1
X3 Breakfast Olive 30 gr X4 Breakfast Butter 20 gr 1 1
X5 Breakfast Tea
(Without Sugar)
1 cup 1 1 1
X6 Breakfast Milk
(Without Sugar)
1 cup 1 1 1
X7 Breakfast Apple 1 pcs
289

X8 Soup Red lentil 1 portion 1
X9 Soup Yogurt 1 portion 1
X10 Meat Meals
Meat Stew 1 portion
Obj Function
Value 37
CPU Time 0.05sec (det. 0.23
ticks) Number of
meals 10
References 1. Öcal et al. (2018), The Economic Burden of Diabetes2. International Diabetes Federation (IDF) 2015 World Congress.3. ADA-American Diabetes Association. Diagnosis and classification of diabetes
mellitus.Diabetes Care. 2019.4. Garille, S. G., & Gass, S. I. (2001), Stigler's diet problem revisited. Operations Research, 1-
13.5. Reyhan, P., Dengeli ve Yeterli Beslenme Konusuna Hedef Programlama6. McCann-Rugg, M., White, G. P., & Endres, J. M. (1983). Using goal programming to
improve the calculation of diabetic diets. Computers & Operations Research, 365-373.7. Kazan, A.,, Eşit Öncelikli Hedef Programlama Modeli ile Bir Dengeli Beslenme
Probleminin Çözülmesi, Mevzuat Dergisi, 2011.8. Cinemre, N., Yöneylem Araştırması, İstanbul: Beta Basım Yayım Dağıtım Anonim Şirketi,
2003.9. ADA1-American Diabetes Association. Diagnosis and classification of diabetes
mellitus.Diabetes Care. 2015, 8-16.10. ADA2-American Diabetes Association. Standards of medical care in diabetes. Diabetes
Care.2015, 20-30.11. Bozkurt N, Akal Yıldız E. Diabetes Mellitus ve Beslenme Tedavisi. Diyet El Kitabı. Eds:
Baysal A, Aksoy M, Besler T, Bozkurt N, Keçecioğlu S, Kutluay Merdol T ve arkadaşları.Ankara, Hatiboğlu Yayınları, 2011.
12. Atmaca A. Diabetes Mellitus’un tanı ve izlem kriterleri. Deneysel ve Klinik Tıp Dergisi2012, 2-6.
13. Satman I, Tutuncu Y, Gedik S et al., And the TURDEP-II Study Group. Diabetes epidemicin Turkey: Results of the second population based survey of diabetes and risk characteristicsin Turkey (TURDEP-II). 47th EASD Annual Meeting, Lisbon (2011).
14. DMÇG-Diabetes Mellitus Çalışma Grubu. Diabetes Mellitus ve Komplikasyonlarının Tanı,Tedavi ve İzlem Kılavuzu. Ankara, Türkiye Endokrinoloji ve Metabolizma Derneği Yayını,2014.
15. Kahn CR, Weir GC, King GL, Jacobson AM, Moses AC, and Smith RJ. Joslin’s DiabetesMellitus. Boston, Joslin Diabetes Center, 2005.
16. Alphan E.T. Hastalıklarda Beslenme Tedavisi. Ankara, Hatiboğlu Yayınları, 2013.
290

17. Bilious R ve Donelly R. Diyabet El Kitabı. İstanbul, İstanbul Tıp Kitabevi, 2013.18. Satman I, Yılmaz T, Şengül A, Salman S, Salman F, Uygur S, et al., Population-based study
of diabetes and risk characteristics in Turkey: Results of the Turkish Diabetes EpidemiologyStudy (TURDEP), Diabetes Care, 2002.
19. Corsi et al., Prospective Urban Rural Epidemiology (PURE) study: Baseline characteristicsof the household sample and comparative analyses with national data in 17 countries.American Heart Jurnal, 2013, 636-646.
20. Dinnen MB, Gerich J, Rizza R. Carbohydrate metabolism in non-insulin-depent diabetesmellitus. N Eng J Med, 1992, 707-713.
21. Sacks FM, Svetkey LP, Vollmer WM, Appel LJ, Bray GA, Harsha D, Obarzanek E,22. Norris SL, Engellau MM, Venkat Narayan KM. Effectiveness of self-management training
in type 2 diabetes. Diabetes Care, 2001, 561-587.23. Koç, E., Etkileşimli 0-1 Tamsayılı Doğrusal Hedef Programlama ve Bir Diyet Probleminin
Çözümüne Uygulanması, Yüksek Lisans Tezi, Osmangazi Üniversitesi, Eskişehir, 2001.
291

THE CORROSION EFFECT of CuO and ZnO FORMATIONS ON BRASS SURFACE
ABDULCABBAR YAVUZ*1, NECİP FAZIL YILMAZ2, MAHMUT FURKAN KALKAN2
1 Department of Metallurgical and Materials Engineering, Engineering Faculty, Gaziantep University, Sehitkamil, 27310, Gaziantep, TURKEY.
2 Department of Mechanical Engineering, Engineering Faculty, Gaziantep University, Sehitkamil, 27310, Gaziantep, TURKEY.
Abstract
The elements on the bulk brass surface were oxidized at high temperatures (from 200 °C to 700 °C). Before the annealing process, the samples were cold rolled to reduce its thickness. The specimens were held under different temperatures in the furnace for the same duration (45 minutes). This paper examines the corrosion of brass having an oxide surface obtained by heat treatment. The corrosion rate experiments were conducted by the cyclic polarization method by means of a potentiostat. The corrosion test of the specimens was conducted by scanning the electrodes in saline water (3.5% NaCl solution) at the scan rate of 2 mV s-1. The corrosion behavior of the electrodes was investigated by two subsequent scans. The change of the heated brass surface occurring after the corrosions test were investigated. While the corrosion rate of the non-annealed brass electrode was similar to that of annealed specimens for the first scan, the corrosion rate of heat-treated specimens was dramatically decreased for the second scan. Pitting corrosion of non-heated brass and passivation behavior of heated brass electrodes were observed. Therefore, heat-treatment of brass can cause higher corrosion resistivity of the brass surface.
Keyword: copper oxide, brass alloy, corrosion, heat treatment.
1. IntroductionCorrosion is an important factor affecting both quality and economy all over the world. Thedecomposition of the material into atoms or increasing the oxidation state of metals/alloys as aresult of chemical reactions is called corrosion [1]. Corrosion is an oxidation process that occurswhen metals/alloys react with an oxidant such as oxygen that can be accelerated withtemperature [2]. Briefly, the corrosion of material occurs either by the transformation of themetal/alloy onto its surface with a higher oxidation state or ion into a solution (environment)[3,4]. The most common and known natural resistance of corrosion is the passive layer formationwhich is generally required process to avoid further corrosion. Passive film is an ultra-thin filmthat acts as a barrier against any reaction that may occur on the surface of a metal and can beformed spontaneously [5]. However, any metal which cannot have a passivating layer couldhamper rusting easily [6].
292

The widespread use of metals depends on their specific properties. Metals and alloys are selected depending on their properties including mechanical, electrical, thermal conductivity properties[7]. Additionally, corrosion resistance is an important parameter for materials selection [8]. More than Hundreds of copper alloys can be used in various applications and some of them can be coated or copper can be alloyed to avoid corrosion [9]. Two of the most common alloys are bronze and brass. Brass has a yellowish color depending on the zinc and copper ratio [10]. Dueto its flexibility and corrosion properties, brass is widely used especially in the marine field. Due to its use in the sea, brass is in constant danger of being sensitized to corrosion. Corrosion thatoccurs in the saltwater environment occurs faster than in the air environment [11,12].
Chloride ions can cause a serious risk of pitting corrosion, especially in materials that come intocontact with saltwater [13]. The main reason for zinc in brass is to increase its hardness, wear-resistance and strength. However, due to the inclusion of ZnO in the passive layer, brass could show lower pitting resistance than copper. Another important type of corrosion that occurs in brass is dezincification [14,15]. This is the result of selective corrosion of zinc, which is less noble than copper. As the zinc is exited from the brass lattice structure, voids are created and a porous Cu-structure remains. As a result, zinc can be removed from the brass faster than copper and leaves a porous, copper-rich and easily degradable metal on alloy surfaces [16]. This dezincification happens on all brass types, but some of them can higher kinetics and some of them can take a long duration [14]. It is known that the mechanical properties of copper alloyssuch as brass can be improved by heat treatment [17]. The annealing process can increase the hardness and toughness of such materials [18,19]. In this study, the effect of the heat treatment process on corrosion properties of brass samples was investigated. The corrosion resistivity of the bulk brass was not examined. The electrochemical behavior of the brass surface in the NaCl solution was elucidated. The electrochemical test was applied to the samples in the sodium chloride environment. Pitting corrosion and passivation behavior of non-heated and heated samples were examined. Linear sweep voltammetry was applied twice to non-annealed and annealed brass samples (heated at 200, 300, 400, 500 and 700 °C for 45 minutes).
2. Materials and Methods0.2 mm thick brass electrode consisting of 60% copper and 40% zinc mixture was prepared bythe rolling process. The cross-section of brass electrodes was respectively ground mechanicallywith 300, 600, 1000 grit SiC sandpapers. The brass electrodes were cut 1 cm in width. They werewashed with water and dried by hot air. The heat treatment process was applied to the brasselectrodes in a muffle furnace. Different temperatures were used to compare with the originalelectrode. The set temperature was 200, 300, 400, 500 and 700 °C. The duration of all brassheating was 45 minutes. Three samples were left in the furnace at each temperature to repeat thecorrosion experiments. AMETEK VERSASTAT 3-200 potentiostat was used for corrosionstudies and the cyclic polarization technique was applied at room temperature. The cyclingelectrolyte of 3.5% (by weight) NaCl in distilled water was prepared to be used in theexperiments shown in this study. 3.5% (by weight) NaCl solution can corrode a metal similar toseawater. A silver/silver chloride electrode (Ag/AgCl) was used to measure the potential of theelectrode. Before the corrosion tests, all samples were cleaned with distilled water. Corrosiontest scan was started at a potential which was -0.3 V less than open circuit potential. The vertexpotential of the electrode cycling in NaCl solution was +0.8 V. All potential presented in thisresearch was given against silver/silver chloride reference electrode having saturated potassium
293

chloride. Two cycles were applied to all measurements. The final potential of cycling was again the potential which was the value 0.3 V less than open circuit potential (from the left-hand side of open circuit potential). The scan rate for all brass electrodes was 2 mV/s because a higher scan rate is not useful to indicate the corrosion rate.
3. Results and DiscussionCold rolled brass electrode (60% Cu with 40% Zn) was heated in a muffle furnace. The furnace was preheated to 200, 300, 400, 500 and 700 °C. Brass electrodes were oxidized thermally in thefurnace for 45 minutes. As it was indicated that three samples were annealed in the furnace without opening its door. The electrodes were directly immersed in NaCl solution as a working electrode. Linear sweep voltammetry is normally used for the corrosion response of electrodes in the NaCl solution. However, in this study, a cyclic polarization was applied to observe the pitting behavior of the annealed brass. The Tafel plot obtained as a result of the cyclic polarization testof oxidized brass applied in NaCl corrosive environment is given in Figure 1a. During the cyclic polarization test, two consecutive cycles were performed for each sample. Figure 1(a) and Figure 1(b) show the Tafel plot of the first oxidation from negative to a positive direction. Figure 1(b) is the magnified version of Figure 1(a) in order to explore the Ecorr and Icorr values. Corrosion current density (Icorr) is obtained by the intersection of the anodic and cathodic branches of the polarization curves on the Tafel plot of the samples tested. In the same graph, the point obtainedby the extension of the anodic and cathodic branches through voltage axes is called the corrosion potential (Ecorr). The Ecorr and Icorr values obtained from Figure 1 are shown in Table 1.
-0.8 -0.6 -0.4 -0.2 0.0 0.2 0.4 0.6 0.8-9
-8
-7
-6
-5
-4
-3
-2
-1
log(
i / A
cm
-2)
E (V)
no heated 200 °C 300 °C 400 °C 500 °C 700 °C
a)
-0.40 -0.35 -0.30 -0.25 -0.20 -0.15 -0.10-9
-8
-7
-6
-5
-4
-3
log(
i / A
cm
-2)
E (V)
b)
Figure 1. Linear sweep voltammetry of brass heated at different temperatures and sweeping in 3.5% NaCl solution. These lines belong to the first cycles of the electrodes. The heating
temperature of the electrode is indicated in the figure.
While the corrosion potential of non-annealed brass was -0.18 V, it was generally decreased (going to more negative potential) upon increasing annealing temperature as observed in Figure 1. The corrosion potential of the electrode heated at 200, 300, 400, 500 °C was -0.196, -0.225, -0.235 and -0.318 V, respectively. The only exception which did not follow the decreasing trendwas the electrode heated at 700 °C. The corrosion potential of the brass heated at 700 °C was -
294

0.240 V. This could occur probably due to the oxidation state of the zinc and copper in the brass [20] for example copper become Cu2O and CuO at 300 °C and 600 °C [21]. The corrosion current value of the non-heated brass was 10-5.25 A cm-2 (5.6 µA cm-2). The corrosion current forthe electrodes annealed at 200, 300, 400, 500 and 700 °C was 10-5.25, 10-5.70, 10-6.10, 10-5.20, 10-5.60
and 10-5.83 A cm-2, respectively as presented in Table 1. They corresponded to 2.0 µA cm-2, 0.8 µA cm-2, 6.3 µA cm-2, 2.5 µA cm-2 and 1.5 µA cm-2. These results show that corrosion current which is directly proportional to corrosion rate did not change significantly because the corrosion current of the annealed brasses was generally close to that of non-annealed brass (5.6 µA cm-2). The corrosion rate of heated brass at 300 °C (0.8 µA cm-2) was seven times lower than that of unheated brass (5.6 µA cm-2). Therefore, corrosion resistance of annealed brass at 300 °C was found higher than the non-heat treated electrode surface. The corrosion resistance that occurs with the application of heat treatment at 300 °C is thought to be caused by the copper oxide formed on the surface. However, other temperatures can not significantly increase the corrosion resistivity of the brass electrode.
Table 1. Ecorr and icorr data measured from Tafel plot of first loop
Sample Ecorr (V) İcorr (A cm-2)
No heat -0.180 10-5.25
200 °C -0.196 10-5.70
300 °C -0.225 10-6.10
400 °C -0.235 10-5.20
500 °C -0.318 10-5.60
700 °C -0.240 10-4.83
When the Tafel curve of the first cycle was examined, it was observed that as the temperature applied to the electrodes in the furnace increases, the corrosion resistance did not change significantly. However, the brass electrode exposed to a temperature of 700 °C gave a curve whose corrosion potential was close to the corrosion potential of the electrode exposed to a temperature of 300 and 400 °C. It was estimated that this may occur due to the change in the structure of the material heated at a different temperature. The heated electrodes were scanned between a negative potential up to 0.8 V and their Tafel plots were presented in Figure 1. The same electrodes were not taken from the NaCl solution and they were again polarized between the same potential windows. The second sweeps of non-heated and heated specimens in NaCl solution are presented in Figure 2a. The closer look of the linear sweep voltammetry given in Figure 2(a) is shown in Figure 2(b). Corrosion currents and potentials of the electrodes are tabulated in Table 2.
The corrosion potential of the non-heated electrode cycled in NaCl solution for the second time was -0.083 V. The corrosion potential of the electrodes decreased significantly. It can be seen in
295

Figure 2 and Table 2 that the corrosion potential of the heated electrode in the NaCl bath for the second sweeping was not affected by the annealing temperature. The corrosion potential of brass electrodes heated at 200, 300, 400, 500 °C was around -0.2 V. The second corrosion current of the non-annealed electrode was 10-3.36 A cm-2 (436 µA cm-2). It was shown above that the first corrosion current of the non-treated electrode was 5.6 µA cm-2. Therefore, the corrosion rate ofthe non-annealed brass electrode increased 78 times from 5.6 µA cm-2 to 436 µA cm-2. This means that an electrode polarized in the NaCl pool can be 78 times more readily oxidized(corroded) in the second polarization. This behavior has been indicated for pitting corrosion of metals and alloys in the literature [22]. The corrosion current for the brasses heated at 200, 300, 400, 500 and 700 °C was 10-4.83, 10-4.90, 10-4.88, 10-4.45 and 10-4.32 A cm-2, respectively as given in Table 2. The corrosion current for these electrodes were respectively 14.8 µA cm-2,12.6 µA cm-2, 13.2 µA cm-2, 35.5 µA cm-2, and 47.9 µA cm-2. The corrosion rate of the electrodes swept for the second time was similar to that for the first time. Therefore, it could be concluded that the heatedelectrodes were passivated after the first polarization. The effect of temperature was not observed for the passivation of the electrodes. Heating at any temperature from 200 °C to 300 °C could create a passive layer on the bulk brass surface.
-0.8 -0.6 -0.4 -0.2 0.0 0.2 0.4 0.6 0.8 1.0
-7
-6
-5
-4
-3
-2
-1
log(
i /A
cm-2
)
E (V)
no heated 200 °C 300 °C 400 °C 500 °C 700 °C
a)
-0.40 -0.35 -0.30 -0.25 -0.20 -0.15 -0.10 -0.05 0.00
-7
-6
-5
-4
-3
-2
-1
log(
i / A
cm
-2)
E (V)
b)
Figure 2. Linear sweep voltammetry of brass heated at different temperatures and sweeping in 3.5% NaCl solution for the second time. The sweeping was conducted after all electrodes were
scanned (presented in Figure 1). The heating temperature of the electrode is indicated in the figure.
Unlike the first cycle, heating the electrodes directly affected the corrosion rates in the second cycle. It was observed that heating the electrode using a heat treatment furnace created a significant difference in corrosion resistance during the second cycle. The corrosion current density of the non-heated electrode was 35 times higher than that of heated at 300 °C brass. This shows that pitting corrosion is not significant in the heated brass and the passive layer of heated brass at 300 °C was found stronger than the original electrode surface. Copper oxide, which provides the passive layer formed by collecting brass electrodes, is thought to be more effective at annealing temperatures of 300 °C, 400 °C and 200 °C. Although the heating of the electrodes did not have a significant difference in the first corrosion cycled in the %3.5 NaCl bath, it was observed that it affected the formation of significant corrosion resistance in the next cycle due to the presence of a passive layer.
296

Figure 2 (a) shows the typical photo of the NaCl solution before and after linear sweep voltammetry of a heated brass. While the color of the NaCl solution was transparent, it was turned to yellow color after polarization presented in Figure 2. Figure 3(b) shows the photo ofthe heated brass electrode before and after being tested in NaCl electrolyte. The color change in the part immersed in liquid can be given as an example of dezincification. It can be deduced from its red color which is well known for copper. It was seen that the zinc atoms left from the surface when it was in the %3.5 NaCl environment and brass had a copper-rich region on the electrode area.
Table 2. Ecorr and icorr datas measured from Tafel plot of second loop
Sample Ecorr İcorr
No heat -0.083 10-3.36
200 °C -0.242 10-4.83
300 °C -0.251 10-4.90
400 °C -0.267 10-4.88
500 °C -0.232 10-4.45
700 °C -0.210 10-4.32
(a) (b)
Figure 3. a) Photos of 3.5% NaCl solution before polarization (left side) and after polarization (right side) of heated brass. b) Photos of heated bulk brass before polarization (left side) and after
polarization (right side) in 3.5% NaCl solution.
4. Conclusions: Cold rolled brass having 60% Cu with 40% Zn was annealed at 200, 300, 400,500 and 700 °C in a furnace for 45 minutes. The resultant electrodes were transferred to NaClelectrolyte for corrosion test. The test was conducted by sweeping voltage from a negative
297

potential to 0.8 V against silver/silver chloride electrode at the scan rate of 2 mV s-1. The Tafel plots of heated brass electrodes were obtained for two subsequent scans. Corrosion current density of unheated samples for the first scan was not changed dramatically when the annealing temperature increased. However, the corrosion potential of the heated brass decreases with increasing the temperature up to 500 °C. The corrosion potential of the brass annealed at 700 °C was similar to that at 300 °C probably because of a different form of oxidation at high temperatures. The corrosion resistivity of the non-annealed and annealed brasses was similar toeach other for the first scan as the corrosion current values of them were close to each other. However, the corrosion current of annealed samples was significantly decreased for the second scan. Therefore, the corrosion rate of the brass could be decreased significantly (around 50 times) by annealing. Additionally, the corrosion potential of heated brasses scanned for the second time in NaCl solution was similar to each other and did not depend on temperature. This occurred because unheated brass could have pitting corrosion and annealed brass can have apassive layer in NaCl solution. This situation was proved by the color change of the brasses and the electrolyte in which brasses were polarized.
Acknowledgments: This work was supported by Gaziantep University Scientific Research Unit (MF.ALT.19.18).
References:
1. Verma C, Ebenso EE, Quraishi MA. Ionic liquids as green and sustainable corrosioninhibitors for metals and alloys: an overview. J Mol Liq. 2017;233:403–14.
2. Güleryüz H, Çimenoğlu H. Effect of thermal oxidation on corrosion and corrosion–wearbehaviour of a Ti–6Al–4V alloy. Biomaterials. 2004;25(16):3325–33.
3. Indra A, Menezes PW, Zaharieva I, Baktash E, Pfrommer J, Schwarze M, et al. ActiveMixed‐Valent MnOx Water Oxidation Catalysts through Partial Oxidation (Corrosion) ofNanostructured MnO Particles. Angew Chemie Int Ed. 2013;52(50):13206–10.
4. Gu B, Luo J, Mao X. Hydrogen-facilitated anodic dissolution-type stress corrosioncracking of pipeline steels in near-neutral pH solution. Corrosion. 1999;55(1):96–106.
5. A titanium-doped SiOx passivation layer for greatly enhanced performance of a hematite-based photoelectrochemical system. Angew Chem, Int Ed [Internet]. 2016;55:9922.Available from: http://dx.doi.org/10.1002/anie.201603666
6. Kihira H, Ito S, Murata T. The behavior of phosphorous during passivation of weatheringsteel by protective patina formation. Corros Sci. 1990;31:383–8.
7. Jin K, Sales BC, Stocks GM, Samolyuk GD, Daene M, Weber WJ, et al. Tailoring thephysical properties of Ni-based single-phase equiatomic alloys by modifying the chemicalcomplexity. Sci Rep. 2016;6:20159.
8. Sandström R. An approach to systematic materials selection. Mater Des. 1985;6(6):328–38.
9. Chen S, Brown L, Levendorf M, Cai W, Ju S-Y, Edgeworth J, et al. Oxidation resistanceof graphene-coated Cu and Cu/Ni alloy. ACS Nano. 2011;5(2):1321–7.
10. Walter B. Process for manufacturing brass and bronze alloys containing lead. GooglePatents; 1957.
11. Ravichandran R, Rajendran N. Electrochemical behaviour of brass in artificial seawater:effect of organic inhibitors. Appl Surf Sci. 2005;241(3–4):449–58.
12. Santos CIS, Mendonça MH, Fonseca ITE. Corrosion of brass in natural and artificial
298
seawater. J Appl Electrochem. 2006;36(12):1353–9. 13. Ezuber H, El-Houd A, El-Shawesh F. A study on the corrosion behavior of aluminum
alloys in seawater. Mater Des. 2008;29(4):801–5.14. Polunin A V, Pchelnikov AP, Losev V V, Marshakov IK. Electrochemical studies of the
kinetics and mechanism of brass dezincification. Electrochim Acta. 1982;27(4):467–75.15. Sugawara H, Ebiko H. Dezincification of brass. Corros Sci. 1967;7(8):513–23.16. Karpagavalli R, Balasubramaniam R. Development of novel brasses to resist
dezincification. Corros Sci. 2007;49(3):963–79.17. Rojas-Rodríguez I, Lara-Guevara A, Salazar-Sicacha M, Mosquera-Mosquera JC, Robles-
Agudo M, Ramirez-Gutierrez C, et al. The Influence of the Precipitation Heat TreatmentTemperature on the Metallurgical, Microstructure, Thermal Properties, and Microhardnessof an Alpha Brass. Mater Sci Appl. 2018;9(4):440–54.
18. Loukus A, Loukus J. Heat Treatment Effects on the Mechanical Properties andMicrostructure of Preform-Based Squeeze Cast Aluminum Metal Matrix Composites. Int JMet. 2011;5(1):57–65.
19. Kim HS, Kim WY, Song KH. Effect of post-heat-treatment in ECAP processed Cu–40%Zn brass. J Alloys Compd. 2012;536:S200–3.
20. Kaur M, Muthe KP, Despande SK, Choudhury S, Singh JB, Verma N, et al. Growth andbranching of CuO nanowires by thermal oxidation of copper. J Cryst Growth.2006;289(2):670–5.
21. Balık M, Bulut V, Erdogan IY. Optical, structural and phase transition properties ofCu2O, CuO and Cu2O/CuO: Their photoelectrochemical sensor applications. Int JHydrogen Energy. 2019;44(34):18744–55.
22. Büyüksağiş A, Kayalı Y. Investigation of Corrosion Behaviours Hydroxyapatite (HAP)coated Ti6Al4V Implants by Using Electrochemical Deposition Method. Afyon KocatepeÜniversitesi Fen Ve Mühendislik Bilim Derg. 2018;18(3):807–19.
299

EFFECT OF CEMENT BASED GROUT ON DIFFERENT WATER/CEMENT RATIOS ON UNIT SOCKET RESISTANCE FOR
GAZİANTEP BASALT STONE
MUHAMMET ÇINAR 1, HASAN BOZKURT 2
1 Kahramanmaraş ,Sütçü İmam University , Civil Engineering, Kahramanmaraş, TURKEY. 2 Hasan Kalyoncu University, Civil Engineering, Gaziantep, TURKEY.
Abstract
The main purpose of this study is to investigate the relationship between unit perimeter friction and uniaxial compressive strength of basalt stone in Gaziantep and surrounding provinces. Basalt stone uniaxial compressive strength is expected to be significant differences in the ventilatingand smooth, experiments were carried out for different water-cement ratio conditions on samplestaken from different sites in Gaziantep. For Gaziantep basalt stone, especially in hollow rocks, much lower environmental friction and low assumptions were observed than the real situation. For this purpose, this research was needed. In this study, the resistance of grouts has been increased with changes in water-cement ratio, but no serious changes have been detected in unit perimeter friction. The reason for this can be said to be the low tensile strength of concrete. Gaziantep basalt stone was found to be nearly two times stronger than the ventilating stone even though the basalt stone is not close in both ventilating and smooth. As a reason for this, the friction resistance is low since the smooth and gapless carried without holes are high compressive strength and the surface area is smooth. In this study a linear correlation Gaziantep basalt transported unit will be recommended for use in skin friction estimate. Therefore, the lower limit of some methods used in this work would be safer for said design.
Key Words: Compressive Strength, Rock, Basalt, Socket Resistance
1. IntroductionGaziantep is a study on the basalt stone.The aim of the study is to investigate socket friction.Economical and safe design was aimed with the correct calculation of the socket resistance.Socket resistances were calculated experimentally. In the literature, a coefficient was determinedfor basalt stone, but this study was carried out by expecting this strength to differ in differentbasalt types. What could change the friction? It was thought that the surface area of basalt, thestrength of the grout, the roughness of the surface would be effective. As a matter of fact, suchdifferent results were obtained.The purpose of the study is to investigate socket friction.Asdescribed in the previous sections, the specific gravity of Basalt in this section is referred to byme as the required strength and pressure in the filler.Then, the test results were compared withdata from the available literature and comparisons were made on the basis of discussions.Furthermore, the skin resistance of Gaziantep basalts has been appreciated for estimating thesingle-axis compressive strength (qu) linear linkage of basalt (qs). Friction formed between
300
building materials and rocks is known to be a carrier value. It has been studied by researchers fora long time.The reason for this is the friction force between the building material and therock.For example rock bolts, rock sockets, piles, bored piles, etc.The lateral friction force has a bearing capacity.The bearing capacities of piles with rock sockets can be calculated by various empirical (experimental) methods. These methods were obtained by back analysis of pile loading experiments. Ground parameter rock free pressure, which is mostly taken into account strength, Pa is its value. Empirical methods generally take into account the environmental and lead capacity separately. The mechanism of movement on the embedded surface is complex. Cohesion and friction on the surface affect normal tension.There are several suggestions for determining a numerical value.One of them (Serrano & Olalla, 2004) created estimation intervals with empirical methods.A single-axis pressure test is performed to estimate the lateral friction value formed with pile-rock.Experimental and empirical methods are preferred because it is difficult and expensive to do in reality.There are many methods in the literature review.In researches, UCS directly affected the lateral friction, but in some methods the structure of the rock was not taken into account.It is not thought that the structure of the rock will seriously affect the lateral friction.Some techniques and formulas will be given below. (CFEM, 2006) in a well-known method is proposed:
2. Materials and Methods Basalt sample is needed in Gaziantep for the experiment. As a result of the researches, the regions to be sampled were decided. The blocks were taken from the Gaziantep Karataş and Yavuzeli regions. The samples were brought to 150 * 150 * 150 mm (WidthxLengthxHeight) sizes. A total of 24 samples were collected. This experimental study was carried out in thegeotechnical laboratory of Hasan Kalyoncu University. The first part of this study, samples were obtained from different regions of Gaziantep. The dimensions of the blocks were determined as15x15x15 cm (width-height-height). 24 samples were created while 12 of them were ventilating and 12 were smooth blocks.
Cylindrical samples were taken in the middle of the cubic blocks. Basalt samples were all tested according to the methods recommended in ISRM 2007.Thus, 0.01 Mpa precision UTEST UT 42000 having 0550 bp-type testing machine with a load capacity of each block (FIG 3.x). Examples of height / diameter ratio H / D = 150/60 = 2.50, respectively, and load speed ISRM (2007) from the range 0.7 to 1.0 MPa / s to 0.7 mPa / s was chosen. As a result, each smooth and porous uniaxial compressive strength was determined from each block.
The experiment consists of a total of 24 basalt stones. 12 samples are ventilating basalt and the other 12 samples are smooth basalt stones. Based with a water cement ratio of 50% was poured into the basalt numbered A and these were examined on the 3rd day, 7th day and 28th day and their pressure resistance. In the same process B samples, the water cement rate was applied as 60% and for each test day, the sample was poured into the core pit taken from a ventilating and smooth basalt and the sample has a 80% water cement rate. D samples have a 100% water cement ratio. Samples were taken from mortars for A, B, C and D samples and pressure resistance test was done on the 3rd day, 7th day and 28th day. Water cement ratios were 50%,60%,80% and 1. Based in these proportions were poured into smooth and porous basalts.
301

CEM II 42.5 cement class was used for concrete production and the characteristic compressive strength was determined according to ASTM C39 (ASTM, 2018) standard .Get the straight compressive strength of poured based. The upper and lower ends of the cylindrical based werecleaned with a suitable scraper before being tested to obtain a plane loading surface. At the end of the third day, uniaxial pressure test was applied to the grout and the sample. It was repeated within 7 and 28 days.
Cylindrical specimen, a sidewall thickness of 45 mm, NX-dimensional samples of holes = ICdiameter had been drilled and after the base D was filled 54.7 mm, the hole of the height (H = 150 mm) block.(Basalt = 54.7 mm) for the defense of the unit as the resistance of the blocks asshown in Figure 3.13 certain compression tester (UTEST UTS-0860) was applied.A loading piston is filled based core (DIC = 54.7 mm) slightly smaller diameter (DLP = 50mm) had(Figure 3.14), based connected to charging system kernel to load rock block axially without side friction.In addition, a rigid steel case with a hole in the central with a slightly wider dimeter from the base core (Dh = 65mm) was placed under the block to allow the displacement of the base cylinder in the basalt block to shift (as shown in Figure 11).It was made by (Tabur, 2019). Rigid steel box, the base of the basalt block during testing to maintain any action (widthxlength = 17x34cm) to the larger surface (widthxlength = 15x15cm) had.Unaxial loads, tenderness 0.001% were recorded with a 100 kN load capacity bore.During the tests underwent a displacement-controlled test system. To determine the proper substitution ratio of 0.001 - 0.1 mm / s test is performed on control blocks for the displacement changing ratio for both smooth and ventilating conditions.The resulting side abrasion values for the range of displacement rate tested in a very limited bandwidth (since ± 5%) changed, the displacement rate of 0.01 mm / s is selected.This ratio was considered reasonable to try and displacement time.Each side friction basalt units, the failure of the last load, the lack of immediate success was determined by dividing the internalbore of each inner bore surface contact area.View of the sample block test system.
3. Results and DiscussionAs described in the previous sections, the specific gravity of Basalt in this section is referred toby me as the required strength and pressure in the filler.Then, the test results were comparedwith data from the available literature and comparisons were made on the basis of discussions.Furthermore, the skin resistance of Gaziantep basalts has been appreciated for estimating thesingle-axis compressive strength (qu) linear linkage of basalt (qs).
3.1. Compressive Strength in Basalts As previously described, 24 cylindrical samples were obtained for the uniaxial pressure test. The test procedure, as discussed in the previous section ISRM (1981) were performed according to test procedures. 12 hole basalt stones and 12 smooth basalt stones were tested. The uniaxial compressive strength in basalt samples ranges from qu = 26.25 to 121.86 MPa. Reduction in the uniaxial compressive strength between Gaziantep basalt stone and smooth conditions of the hollow 21:54% - 51.15 acceptable ranges and the results averaged 37%. Results of experiments are given in Table. Examples photographs taken during experiments is given in Figure 4.1 and 4.2.
302

3.2 Unit Skin Resistance of Gaziantep Basalt The unit socket resistance between grout and Gaziantep basalt was worked by the experimental system established for this design, the information of which was given in the previous chapter of this study. 24 blocks were used in this study. The experiment consists of a total of 24 basalt stones.12 sample ventilating basalt and 12 other smooth basalt stones. The unit socket resistance of the samples were came by dividing the optimum axial load to the drilling core inner surfacearea of the blocks. As assumed in this first part of the work, the skin resistance of the smooth block unit is substantially reduced compared to that observed significant ventilating blocks. The unit skin resistance of smooth samples were varying in the range of qs = 0,99-1,16 MPa for a rock uniaxial compressive strength range of qu = 79,48-121,86 MPa. The experiment results have divulge that the unit socket resistance of the ventilating samples were in between qs = 0,99-1,11 MPa for a basalt rock uniaxial compressive strength range of qu = 26,25-40,66 MPa. The unit socket skin resistance of the smooth samples was observed to unchange remarkably as compared to that of ventilating samples. However, significant differences can be said that compared to the compressive strength
Despite the percentage landing in uniaxial compressive strength between ventilating and smoothdifferent water cement ratio conditions of Gaziantep basalt stone is in the 35.40 - 41.96 limitedband, the percentage decrease in unit socket skin resistance varies between 22.96 - 63.32%. This reality is attributed to changes in the drilling core inner surface structure of each sample tested. In the observations made, it has been observed that the water cement ratio does not directly affect the surface friction resistance, but it does not affect the compressive strength. The same no difference in the skin resistance was observed between the ventilating and smooth basalts, but compressive strength close to 2 times was determined. However, the socket skin resistance values obtained divulge an interesting behavior designated in detail in the following sections of this section. The socket skin resistance values achieved.
Table 3.1 UCS Results Sample
Pro. Sample
No qu
(Mpa) Sample
Pro. Sample
No qu
(Mpa)
Perforated
3 D
ays
A0 1,082
Smooth
3 D
ays
A3 1,074 B0 1,074 B3 1,064 C0 1,065 C3 1,061 D0 1,061 D3 1,058
7 D
ays
A1 1,088
7 D
ays
A4 1,085 B1 1,084 B4 1,083 C1 1,080 C4 1,075 D1 1,074 D4 1,067
28 D
ays
A2 1,092
28 D
ays
A5 1,089 B2 1,085 B5 1,081 C2 1,074 C5 1,071 D2 1,070 D5 1,064
303

Figure 3.1. Shown UCS in graph
Figure 3.2.UCS test after 3 days
R² = 0,0207R² = 0,0669
1,0401,0501,0601,0701,0801,0901,100
1 2 3 4 5 6 7 8 9 10 11 12
Uni
t Com
pres
sive
Stre
ngth
(MPa
)
Sample No.
All day Unit Skin Comp. Test
Perforated Basalts Smooth Basalts
Üs (Perforated Basalts) Üs (Smooth Basalts)
1,045
1,050
1,055
1,060
1,065
1,070
1,075
1,080
1,085
1 2 3 4
Uni
t Com
pres
sive
Stre
ngth
(MPa
)
Sample No.
3 days
Perforated Basalts Smooth Basalts
304

Figure 3.3.UCS test after 7 days
Figure 3.4.UCS test after 7 days
1,055
1,060
1,065
1,070
1,075
1,080
1,085
1,090
1 2 3 4
Uni
t Com
pres
sive
Stre
ngth
(MPa
)
Sample No.
7 day
Perforated Basalts Smooth Basalts
1,050
1,055
1,060
1,065
1,070
1,075
1,080
1,085
1,090
1,095
1 2 3 4
Uni
t Com
pres
sive
Stre
ngth
(MPa
)
Sample No.
28 day
Perforated Basalts Smooth Basalts
305

4. Conclusions: This experiment was performed on basalt stones are located in Gaziantep.Two types of basalt
stones were provided. One was a ventilating stone and the other was a smooth stone.Through the experiment, the unit skin friction of Gaziantep basalt was researched experimentally forventilating and smooth status and the outcomes were correlated with the independ compressive strength of the basalt block.
In order to direct the test program, 24 basalt blocks were procured from rocks different two sitesin Gaziantep. Each sample is divided into two as ventilating and smooth. They were infilled withbased in W / C (0.5-0.6-0.8-1.0) ratios.As a result, 24 independ compressive strength tests and 24skin friction resistance tests were carried out at the geotechnical laboratory of HKU besides the already defined ratio and concrete ucs tests.Different W / C ratios were selected for the experiment.When the water rate decreased, the workability decreased.However, grout resistance increased.Tensile strength was more important than compressive strength between grout andbasalt surface.The reason for choosing a different W / C ratio is that the grout is well placed and the pores are filled.Results It was found that W / C ratio is not very effective in unit skin resistance.W / C ratio should be selected according to the loads to be carried by the piles.It was determined that it did not affect the lateral friction.The reason for this is that there is no changein the surface structure of the grout.
Only compressive strength was affected.The strength of the ventilating basalt stones was foundto be lower than that of smooth 36.10 – 42.86% (≈40%). However, they still showed approximately equal unit friction resistance. It exceeded the predictions in the literature review.The reason for this can be said that the holes on the surface increase the friction coefficient.
The unit skin resistance of the basalt rock single axis was often associated with a relative compressive strength in the literature. Unit that provides a correlation between skin friction resistance and uniaxial compression strength in the linear part methods may be categorized. The results of this study were compared with both the linear correlation. The comparison by the linear relationships have divulge that the unit skin resistance of Gaziantep basalt was significantly low estimated by the linear correlations for ventilating rock. Otherwise a new linear correlation was recommed for Gaziantep ventilating basalt with a sensible correlation coefficient.
Consequently, in this study, the upper and lower limits values that can be used in calculating unit skin friction in Gaziantep basalt stone are determined.It is determined that uniaxial compressive strength depends on the condition of the surface. It is concluded that the structure and strength of the rock is important. It is sensible to use the lower bound solutions of Reese and O'neill, (1988) and this study.
References 1. AASHTO LRFD, (2007). American Association Of State Highway And Transportation
Officials Load And Resistance Factor Desing, Washington, D.C.: Bridge DesignSpecifications.6322-6425
306

2. CFEM, (2006). Canadian Foundation Engineering Manual. British Columbia: BitechPublishers Ltd. 56-83
3. ISRM, 1981. Rock Characterisation Testing And Monitoring., Oxford: Pergamon Press.4. Meigh, A. & Wolski, W., (1979). Design Parameters For Weak Rocks. %1 Proceeding Of
The 7th European Conference On Soil Mechanics And Foundation Engineering.: Brighton:British Geotechnical Society,59-79.
5. Reese, L. & O'neill, M., (1988). Drilled Shafts: Construction Procedures And DesignMethods, Washington, D.C.: Federal Highway Administration. 99-025.
6. Reynolds, R. & Kaderabek, T., (1981). Miami Limestone Foundation Design AndConstruction. New York: 859-872.
7. Rosenberg, P. & Journeaux, N., (1976). Friction And End Bearing Tests On Bedrock ForHigh Capacity Socket Design. Canadian Geotechnical Journal ; 13(3), 324-33.
8. Rowe, R. & Armitage, H., (1984). Design Of Piles Socketed into Weak Rock , London,Ontario, Canada: University Of Western Ontario.: Geotechnical Research Report.
9. Rowe, R. & Armitage, H., (1987). A Design Method For Drilled Piers İn Soft Rock.Canadian Geotechnical Journal; 24(1), 126-42.
10. Serrano, A. & Olalla, C., .(2004). Shaft Resistance Of A Pile Embedded in Rock.International Journal Of Rock Mechanics And Mining Sciences, 41(1), 21-35.
11. Shıru, S. Q., (2015). Experımental Investıgatıons Of The Permeabılıty Characterıstıcs Of SelfCompactıng Concrete Mıxes Made Wıth Varyıng Constıtuents,: Near East Unıversıty.
12. Tabur, I., (2019). An Experımental Study On Unıt Socket Resıstance Of GazıantepLımestone For Dry And Fully Saturated Condıtıons, Gaziantep: Hasan Kalyoncu UnıversıtyGraduate School Of Natural & Applıed Sciences.
13. Toktamış, D., Toktamış, H. & Yazıcı, A., (2017). Thermoluminescence Behavior Of BasalticRocks Collected in Southeastern Region Of Turkey. Applied Radiation And Isotopes,121,109-115.
14. Williams, A., Johnston, I. & Donald, I., (1980). Design Of Socketed Piles In WeakRock.Proceeding Of International Conference On Structural Foundations On Rock. , 148,327-47.
307
INVESTIGATION OF MAGNETIC PROPERTIES OF STRONTIUM HEXAFERRITE PRODUCED BY MECHANOCHEMICAL SYTHESIS
KÜRŞAT İÇİN 1, DAMLA DİLARA ÇAKIL 1, FURKAN ALPTEKİN *,1, SULTAN ÖZTÜRK 1
1 Karadeniz Technical University, Engineering Faculty, Metallurgical and Materials Engineering Department, Trabzon, TURKEY.
Abstract
In this study, we have produced strontium hexaferrite (SrFe12O19) magnets by mechanochemically synthesizing the mill scale which is the waste material from the hot rolling process of steel slabs and strontium carbonate (SrCO3) powders. The mechanochemical synthesis process was conducted via high energy ball milling process. The stoichiometric ratio (SrCO3/Fe2O3) was changed from 1:5.5 to 1:6.0 by 0.1 increments, and the influence of stoichiometric ratio was investigated with regards to phase structure and magnetic properties.The relationship between the magnetic performances and structures was well established throughVibrating Sample Magnetometry (VSM) measurements and Rietveld refinement analysis of powder X-ray diffraction data. The primary phase formed in powder structures for all the stoichiometric ratios was SrFe12O19 and the other phases of α-Fe2O3, SrO, and SrFe2O4 withvarying amount, depending on the stoichiometric ratios, were also obtained. The maximum magnetic properties were obtained with 1:6.0 SrCO3/Fe2O3 stoichiometric ratio. The coercivity (Hc), the saturated magnetic flux density (Bs), the residual magnetic flux density (Br), andmaximum energy product (BH)max values for 1:6.0 stoichiometric ratio were obtained as 3682 Oe, 506 mT, 311 mT, and 3.11 MGOe, respectively.
Keyword: Strontium hexaferrite, mechanochemical synthesis, SrFe12O19, magnetic properties
1. IntroductionM-type strontium hexaferrites (SrFe12O19) are important permanent magnetic materials due totheir good combination of high magnetic properties, favorable performance/cost ratio, chemicalstability, and relatively high Curie temperature (470 °C) [1-3]. They are extensively used invarious applications such as automotive, magneto-optic systems, power electronics,telecommunication sector, magnetic recording media, and microwave devices [4-7]. Due to theunique physical, thermal and biological properties of these magnets, their use is increasing dayby day [8-10]. Although the coercivity and maximum energy product properties of strontiumhexaferrites are inferior compared to rare-earth magnets, the low production costs make thesemagnets competitive with NdFeB magnets [11]. Among the commercially available permanentmagnets, the hexaferrites constitute approximately 85% of these products in the global magnet
308

market [6]. Also, the abundance and low costs of Sr and Fe components that make up the structure of strontium hexaferrite contributed to the widespread use of these magnets [12]. Strontium hexaferrite is prepared by mixing iron oxide (Fe2O3) and strontium carbonate (SrCO3) in certain proportions by the powder metallurgy method [13]. Iron oxide can be obtained from steelmaking factories quite inexpensive way. The upper layer of the steel slabs is oxidized by annealing process, and this layer can easily be removed from the material’s surface before the hot rolling. This oxide layer is called as “mill scale,” and it is accumulated as waste material from the hot rolling process lines of steel slabs [14, 15]. The mill scale is used in nonprofitable applications such as cement and asphalt production, brick making, and weight material forelevators. Due to the high Fe content [16], the mill scale can be considered as a valuable secondary raw material and can be used economically in the production of different magnetic materials [17-19]. This is important for the efficient use of economic resources by recycling and eliminating environmentally hazardous wastes. The mill scale contains wustite (FeO), magnetite(Fe3O4), and hematite (Fe2O3) phases in varying proportions. Of these, only Fe2O3 may be the most stable and useful phase in terms of magnetic properties for the hexaferrite magnet. The other phases of FeO and Fe3O4 can be transformed into the Fe2O3 phase before the mechanochemical synthesis process. For this purpose, the mill scale is subjected to heat treatment before the mechanochemical process, and the desired transformation of FeO and Fe3O4phases to Fe2O3 is carried out in this way [20]. The second component for strontium hexaferrite magnets is the strontium carbonate (SrCO3), which is used as Sr source. The SrCO3 is one of the most important commercial products of celestite ore (SrSO4), and the SrCO3 is obtained fromcelestite ore with either black ash or direct conversion (pyro/hydrometallurgy processes) methods [21, 22]. The strontium hexaferrite (SrFe12O19) can be produced by the mechanochemical synthesis of Fe2O3 and SrCO3 powders. Within the framework of the mechanochemical synthesis method, the high-energy ball milling process of the powder mixtureis carried out [23]. This process involves deformation, fracture, and cold welding of the particlesas a result of repeated collisions between the balls and powders. During the collision of particles, the phase transformation is carried out by mechanical energy without the need for high temperatures. The chemical reaction between the particles takes place due to the cold-welding mechanism, and the chemical reaction increases with decreasing particle size and increasing the specific surface area. As a result of these processes, the structural alterations which are of great interest in the development of new materials are realized. If this low-temperature reaction is not fully completed or the desired properties are not achieved, it can be solved by the proper heattreatment of powders following the mechanochemical synthesis process [24].
The scope of the present work consists of several partial tasks leading together to produce strontium hexaferrite magnets through the mechanochemical synthesis method and to increase their magnetic performances. The other important aim of the current study is to reduce the environmental impact of steel wastes by using mill scale as an iron source in strontium hexaferrite permanent magnet. In this context, the mill scale and strontium carbonate (SrCO3) powders were used as starting materials, and the mixtures of these materials for different stoichiometric ratios were prepared. The mechanochemical synthesis process via high energy ball milling was applied to powder mixture for 20 min, followed by annealing at 975 °C for 1 h. The effect of stoichiometric ratio on the magnetic properties was reported.
309

2. Materials and Methods The strontium carbonate (SrCO3) as Sr source and the mill scale (waste material in mild steelproduction) as Fe source were used to synthesize strontium hexaferrite (SrFe12O19) powders. Thecomposition of the mill scale comprised (wt%.) of 0.04 C, 0.1 Si, 0.4 Mn, 0.2 Cu, and Fe (bal).The process was first started by removing impurities from the mill scale. For this purpose, the mill scale was washed several times with distillated water and dried at 100 ºC for 8 h. The cleanmill scale was milled in a high-energy ball milling device with the parameters of 10:1 ball to powder ratio, 400 rpm rotational speed, and 2 h milling times to reduce the particle size before the mechanochemical synthesis. Following the ball milling process, the mill scale was annealedat 900 ºC for 1, 2, and 4 h in atmospheric conditions in order to transform the FeO and the Fe3O4phases to the Fe2O3. The stoichiometric amounts of Fe2O3 (converted from mill scale) and SrCO3were mixed and subjected to mechanochemical synthesis process via high-energy ball milling for 20 min to obtain strontium hexaferrite powder. In order to synthesize strontium hexaferrite, the SrCO3 and Fe2O3 powders were mixed in a stoichiometric ratio of 1:6 (SrCO3: Fe2O3 =1:6), according to the following equation: SrCO3 + 6Fe2O3 → SrFe12O19 + CO2 (1)
On the other hand, 1:6 ratio was changed between 1:5.5 and 1:6.0 with 0.1 increments to investigate the effect of stoichiometric ratio on the magnetic properties. The stoichiometric mixtures of about 20 g of the starting materials, SrCO3 and Fe2O3, 10 mm diameter balls made oftungsten carbide, and 2 ml process control agent of ethanol were loaded to 250 ml tungstencarbide milling jar. The process was carried out in air for 20 min, at room temperature, 10:1 ball to powder weight ratio, and at 400 rpm fixed rotating speed. After the high-energy ball milling process, the powders were annealed at 975 °C for 1 h to stabilize the crystalline structure, whichmay deteriorate during the mechanochemical synthesis process. The mean particle size measurements of SrCO3 and mill scale powders were carried out with a laser beam scattering particle size analyzer of Malvern Mastersizer 2000 E model. The crystalline phases of samples were identified by XRD measurements using a PANalytical X’pert Powder3 model X-ray diffractometer device with CuKα (λ =1.5418 Å) radiation at room temperature. The patterns were collected in the range of 20 ≤ 2θ ≤ 60° intervals with a step size of 0.013 degree and time per step of 200. Rietveld refinement analysis using High Score Plus software was performed to obtain the percentages of different phases of the powders. Differential thermal analysis (DTA) and thermal gravimetric analysis (TGA) were carried out to determine the phase transformation temperatures of powder mixtures of different stoichiometric ratios at the heating rate of 10 °C/min. The thermal analysis temperatures ranged from room temperature up to 1200 °C underair condition. The DTA and TGA analyses were performed by employing a Linseis PT1600 DSC/DTA/TG instrument. The morphologies of the powders were imaged using a Zeiss EVO LS10 scanning electron microscopy (SEM) device. Magnetization studies were carried out at room temperature using a LDJ Electronics 9600 vibrating sample magnetometer (VSM) device.
3. Results and DiscussionBefore the mechanochemical synthesis process, the morphology, the mean particle size, and thephase structure of the starting SrCO3 and mill scale powders were characterized, and theobtained results were given in Fig.1. The SEM morphology of the SrCO3 powders is ligamentshape. SrCO3 particles were agglomerated because of small size and large specific surface areaof the particles (Fig.1.a). The mill scale particles, which were subjected to ball-milling process at
310

400 rpm rotational speed for 2 h, showed a rounded morphology and mostly with the size of less than 1 µm (Fig.1.b). Like SrCO3 powders, all of the fine mill scale particles were agglomerated over coarse particles, and the clusters appeared much more crowded when compared with that of SrCO3 powders. Both of the SrCO3 and the mill scale powders displayed a log-normal size distribution behavior, and the mean particle sizes (d50) of SrCO3 and mill scale powders were measured as 3 μm and 2 μm, respectively (Fig.1.c, d). The X-ray diffraction pattern of as-obtained SrCO3 powders is shown in Fig. 1.e. As can be observed, all diffraction peaks of XRD pattern were indexed as pure SrCO3 phase [25]. The XRD pattern of mill scale material after 2 hball-milling is displayed in Fig. 1.f. Three different peaks of wustite (FeO) (ICSD 98-018-0972Fm-3m/225), magnetite (Fe3O4) (ICSD 98-024-9047 Fd-3m/227), and hematite (Fe2O3) (ICSD 98-006-6756 R-3c/167) were detected in the XRD pattern. Also, it is noticeable that the hematite phase (Fe2O3) shows high diffraction peaks, and the peak intensities of wustite (FeO) andmagnetite (Fe3O4) phases are relatively weak. At this point, it can be concluded that the primary phase in the mill scale material is hematite.
Figure 1 The SEM images of particle morphology of (a) SrCO3, and (b) mill scale powders after the ball-milling process for 2 h; powder size distribution of (c) SrCO3, and (d) mill scale; and
phase properties of (e) SrCO3 and (f) mill scale powders.
311

As presented in the XRD pattern (Fig. 1.f.), the non-heat-treated mill scale clearly shows the presence of hematite (Fe2O3), which is the primary phase with the highest intensity peak, magnetite (Fe3O4), and wustite (FeO) peaks. The FeO peaks were detected at 36.2°, 42.1°, and61.06° diffraction angles, while the Fe3O4 peaks were observed at 30°, 43°, and 56.9°. The main Fe2O3 peak was detected at 35.6° diffraction angle and (110) plane for the non-heat-treated millscale. In order for the reaction given in Eq. (1) to take place, the FeO and Fe3O4 must be entirely transformed to the hematite phase [17, 20, 26]. For this purpose, the mill scale sample was subjected to heat treatment processes under the oxidant atmosphere (air). On the other hand, the differential thermal analysis (DTA) was carried out before the heat treatment process todetermine the adequate annealing temperature, and the results are shown in Fig.2.
Figure 2 The DTA curve of the mill scale material.
Fig. 3.a presents the SEM image of the SrFe12O19 powders prepared with 1:6.0 SrCO3/Fe2O3 stoichiometric ratio, which was subjected to 20 min mechanochemical synthesis process. All of the particles displayed rounded morphology. The fragmentation of large particles resulted fine ones and they partially agglomerated. Similar results have also been obtained in some studies in the literature [13, 27, 28]. Most of the particles exhibited an average diameter of approximately 1 µm, and very few coarse particles of about 3 µm were observed in SEM image. Fig. 3.b is the particle size distribution graph of the SrFe12O19 powders obtained from the laser beam scattering particle size measurement. The particle size distribution of SrFe12O19 powders was partially modified from the initial particle size distributions of SrCO3 and Fe2O3 powders and mono-modal, and narrow size distribution was obtained. The mean particle sizes of (d50), (d10), and (d90) were measured as 1.55 μm, 1.03 μm, and 2.21 μm, respectively.
The X-ray diffraction patterns of strontium hexaferrite (SrFe12O19) powders with different stoichiometric ratios (SrCO3/Fe2O3) were shown in Fig. 4. The basic composition of strontium hexaferrite magnets consists of SrCO3 and Fe2O3 compounds, and the production of strontium
312

hexaferrite magnets requires a critical stoichiometric ratio between these two compounds. The SrCO3/Fe2O3 stoichiometric ratio is an important factor in terms of phase type and amount in the mixture. In case of deviation from the critical stoichiometric ratio, the impurity phases will be formed, and these phases can deteriorate the magnetic properties (saturation magnetization, coercivity, and remanent magnetization). As explained in the experimental section, the stoichiometric ratio (SrCO3/Fe2O3) was changed from 1:5.5 to 1:6.0 by 0.1 increments, in this study. In the production process the stoichiometric mixtures of SrCO3/Fe2O3 were subjected to mechanochemical synthesis process for 20 min. On the other hand, the preliminary experiments revealed that the mechanochemical synthesis process do not provide enough energy to complete the reaction given in Eq. (1), therefore a heat-treatment process is required to achieve the reaction. The heat-treatment was applied at the lowest possible temperature to avoid particle growth and possible contaminations. For these reasons, 975 °C was chosen as the heat-treatment temperature, based on the TG/DTA analyzes, to produce strontium hexaferrite powders. The heat-treatment process was carried out for 1 h in atmospheric conditions. The phase determination in the x-ray diffraction patterns was carried out by using the HighScore Plus software.
313

Figure 3 (a) The SEM image of particle morphology of strontium hexaferrite (SrFe12O19) powders after 20 min mechanochemical synthesis process, (b) The particle size distribution of
same powders.
The XRD patterns for the stoichiometric ratios from 1:5.5 to1:6.0 were shown in Fig. 4.a. When the diffraction pattern for the theoretical value of the 1:6.0 stoichiometric ratio is examined, it isseen that the formed primary phase is SrFe12O19 (ICSD #98-020-2518) with hexagonalmagnetoplumbite structure and space group of P63/mmc. Besides the SrFe12O19 phase, the second phase of α-Fe2O3 (ICSD #98-006-6756 R-3c/167) was formed in structure. The latticeparameters of the hexagonal SrFe12O19 and α-Fe2O3 phases can be calculated according to the following equation [29]:
4 sin2 θ λ2 = 4(h2 + hk + k2) 3a2 + l2 c2⁄⁄⁄ (2)
Where; a and c are the lattice parameters, θ the diffraction angle, λ the wavelength of the CuKαradiation, and (hkl) the crystal plane index.
The lattice parameters of the SrFe12O19 phase were calculated as a = b = 5.8798 Å, and c = 23.0634 Å. As the stoichiometric ratio decreases from 1:6.0 to 1:5.5, the SrFe12O19 phase ratio begins to decrease, and the third phase of SrO becomes visible at 2θ=46,7° diffraction angle. TheSrO phase has a cubic structure and 225/Fm-3m space group (ICSD #98-018-1061). Thediffraction intensity of each phase is proportional to its relative content in the Fe2O3 and SrFe12O19 mixture. The intensity ratios between reflections of (104) crystalline plane (2θ=33.2°) of Fe2O3 and (114) crystalline plane (2θ =34.3°) of SrFe12O19 were used to express the relative content of Fe2O3 and SrFe12O19 phases in samples. The SrFe12O19, Fe2O3, and SrO phase ratios for the 1:6.0 stoichiometric ratio were calculated as 84.3%, 15.7%, and 0%, respectively. With the decrease of the stoichiometric ratio from 1:6.0 downwards, the SrFe12O19, and the Fe2O3phases decrease monotonously, and the SrO phase ratio increases (Fig.4.b). For the 1:5.7 stoichiometric ratio, the SrFe12O19, Fe2O3, and SrO phase amount were analyzed as 82.0%, 13.2%, and 4.8%, respectively. The SrFe12O19, Fe2O3, and SrO phase ratios for the 1:5.5 stoichiometric ratio were obtained as 80.0%, 12.6%, and 7.4%, respectively. The increase for the diamagnetic SrO phase with decreasing the stoichiometric ratio from 1:6.0 to 1:5.5 is explainedby the excess SrCO3 remaining in the structure. Furthermore, the reasons for this increase can beunderstood by examining the DTA and TGA graphs (Fig. 5.a) obtained for pure SrCO3. As can be seen from the TGA curve, the temperature, at which the weight loss begins in SrCO3, is 767 °C. At this temperature, the crystalline structure change for SrCO3 occurs (α-SrCO3 → β-SrCO3). The α and β phase change (α → β) can be associated with the downward change of the TGAcurve after 767 °C. The SrO phase is formed with the calcination reaction of SrCO3 (SrCO3 → SrO + CO2) concurrently with α → β phase transformation at 767 °C temperature. The SrOphase ratio increases as the heat treatment temperature rises above 767 °C. The first endothermic peak at 971 °C indicates the crystalline structure transformation of SrCO3. At this temperature,the crystal structure of SrCO3 changes from α-SrCO3 rhombohedral to β-SrCO3 hexagonal [30, 31]. The second endothermic peak at 1145 °C shows the decomposition of β-SrCO3 into SrO and CO2 (SrCO3→SrO+CO2). On the other hand, SrO and SrFe12O19 phase ratios in the structure
314
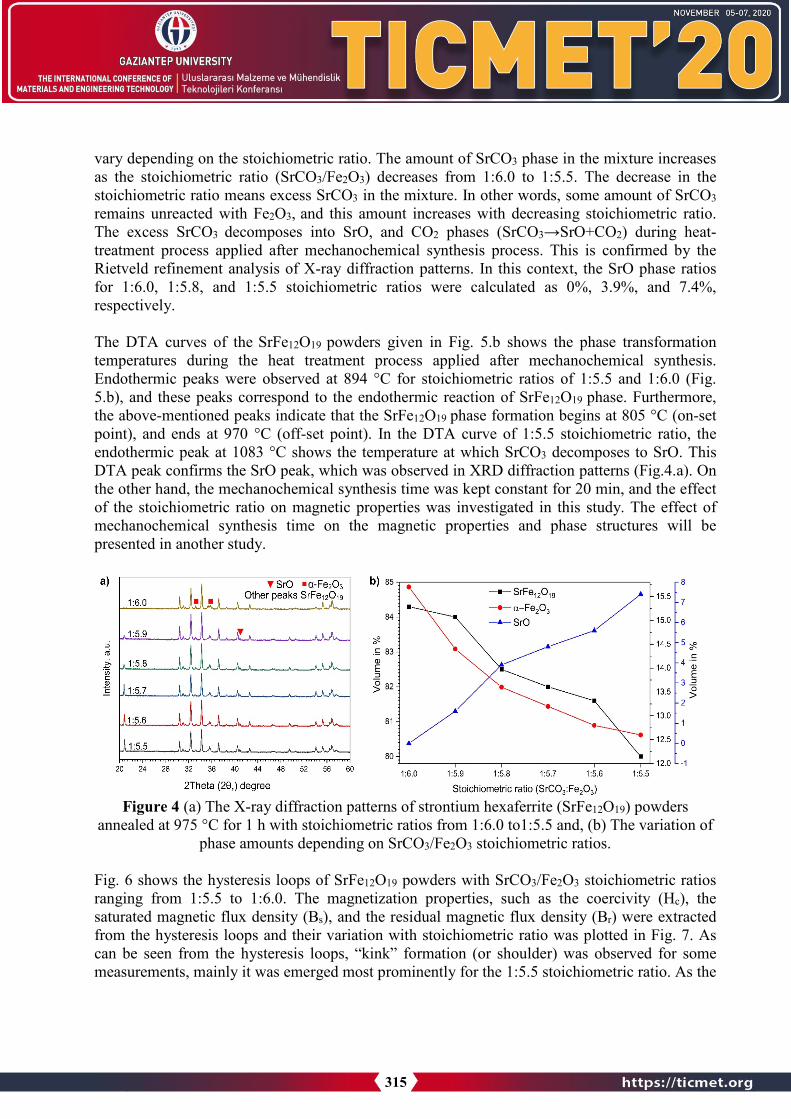
vary depending on the stoichiometric ratio. The amount of SrCO3 phase in the mixture increases as the stoichiometric ratio (SrCO3/Fe2O3) decreases from 1:6.0 to 1:5.5. The decrease in the stoichiometric ratio means excess SrCO3 in the mixture. In other words, some amount of SrCO3remains unreacted with Fe2O3, and this amount increases with decreasing stoichiometric ratio.The excess SrCO3 decomposes into SrO, and CO2 phases (SrCO3→SrO+CO2) during heat-treatment process applied after mechanochemical synthesis process. This is confirmed by the Rietveld refinement analysis of X-ray diffraction patterns. In this context, the SrO phase ratios for 1:6.0, 1:5.8, and 1:5.5 stoichiometric ratios were calculated as 0%, 3.9%, and 7.4%, respectively.
The DTA curves of the SrFe12O19 powders given in Fig. 5.b shows the phase transformation temperatures during the heat treatment process applied after mechanochemical synthesis. Endothermic peaks were observed at 894 °C for stoichiometric ratios of 1:5.5 and 1:6.0 (Fig.5.b), and these peaks correspond to the endothermic reaction of SrFe12O19 phase. Furthermore, the above-mentioned peaks indicate that the SrFe12O19 phase formation begins at 805 °C (on-set point), and ends at 970 °C (off-set point). In the DTA curve of 1:5.5 stoichiometric ratio, the endothermic peak at 1083 °C shows the temperature at which SrCO3 decomposes to SrO. This DTA peak confirms the SrO peak, which was observed in XRD diffraction patterns (Fig.4.a). On the other hand, the mechanochemical synthesis time was kept constant for 20 min, and the effect of the stoichiometric ratio on magnetic properties was investigated in this study. The effect of mechanochemical synthesis time on the magnetic properties and phase structures will be presented in another study.
Figure 4 (a) The X-ray diffraction patterns of strontium hexaferrite (SrFe12O19) powders annealed at 975 °C for 1 h with stoichiometric ratios from 1:6.0 to1:5.5 and, (b) The variation of
phase amounts depending on SrCO3/Fe2O3 stoichiometric ratios.
Fig. 6 shows the hysteresis loops of SrFe12O19 powders with SrCO3/Fe2O3 stoichiometric ratios ranging from 1:5.5 to 1:6.0. The magnetization properties, such as the coercivity (Hc), the saturated magnetic flux density (Bs), and the residual magnetic flux density (Br) were extracted from the hysteresis loops and their variation with stoichiometric ratio was plotted in Fig. 7. As can be seen from the hysteresis loops, “kink” formation (or shoulder) was observed for some measurements, mainly it was emerged most prominently for the 1:5.5 stoichiometric ratio. As the
315

stoichiometric ratio approached to 1:6.0, the kink formation in the hysteresis curves weakened.In the literature, it is reported that the kink in the hysteresis loops can be emerged due to the presence of α-Fe2O3 and SrO phases or the particle size differences [32]. Since the SrFe12O19 particles displayed a relatively homogeneous and narrow size distribution behavior after the mechanochemical synthesis process (see Fig.3.b), the kink formation can be attributed to the presence of α-Fe2O3 and SrO phases. Also, these experimental results are in very well agreement with diffraction patterns (Fig.4). The significant amount of α-Fe2O3 and SrO phases for 1:5.5 stoichiometric ratio and the samples close to this ratio explains the “kink” in the hysteresis loops. In case of decoupling between hard and soft magnetic phases, there can be a kink on the hysteresis curve according to literature [32]. In other words, the SrFe12O19 phase was diluted by the presence of non-magnetic α-Fe2O3 phase during the process. When these hysteresis loops are closely examined, it will be seen that the coercivity (Hc), the saturated magnetic flux density (Bs), and the residual magnetic flux density (Br) decreased as the stoichiometric ratio reduced from 1:6 down to 1:5.5. The coercivity (Hc) values for stoichiometric ratios of 1:6.0, 1:5.9, 1:5.8, 1:5.7, 1:5.6, and 1:5.5 were obtained as 3682, 3580, 3185, 2687, 2285 and 889 Oe, respectively.The residual magnetic flux density (Br) values for the same stoichiometric ratios were measured as 311, 263, 263, 256, 242, and 156 mT, respectively. A similar trend was observed with respect to saturated magnetic flux density (Bs). The Bs values of 506, 431, 431, 422, 410, and 345 mT were calculated for 1:6.0, 1:5.9, 1:5.8, 1:5.7, 1: 5.6, and 1:5.5 stoichiometry ratios, respectively (Fig.7). In terms of (BH)max, 3.11, 2.36, 2.35, 0.4, 0.4, and 0.35 MGOe values were measured for the same stoichiometric ratios. While the stoichiometric ratio decreases from 1:6 to 1:5.5, the increasing ratios of α-Fe2O3 and SrO phases in the structure explains the weakening magnetic properties. Similar results were reported in the literature [5, 13, 29, 33].
316

Figure 5 (a) DTA and TGA curves of pure SrCO3, (b) DTA curves of SrFe12O19 with 1:6.6, 1:6.0, and 1:5.5 stoichiometric ratios.
317

Figure 6 Magnetic hysteresis loops for SrFe12O19 powders with SrCO3/Fe2O3 stoichiometric ratios ranging from 1: 5.5 to 1: 6.0, subjected to mechanochemical synthesis process for 20 min,
and heat-treated at 975 °C for 1 h.
318

Figure 7 The dependence of the coercivity (Hc), the saturated magnetic flux density (Bs), and the residual magnetic flux density (Br) on SrCO3/Fe2O3 stoichiometric ratios.
4. Conclusions:In the present study, we have produced strontium hexaferrite magnets by mechanochemicallysynthesizing the mill scale and strontium carbonate (SrCO3) powders. The stoichiometric ratio(SrCO3/Fe2O3) was changed from 1:5.5 to 1:6.0 by 0.1 increments, and the effect ofstoichiometric ratio on the structural and magnetic properties was investigated. The obtainedresults were summarized as follows:1. The SEM image of the SrFe12O19 powders prepared with 1:6.0 SrCO3/Fe2O3 stoichiometricratio and 20 min mechanochemical synthesis process time displayed rounded morphology. Mostof the particles exhibited an average diameter of around 1 µm and very few coarse particles of 3µm were observed.2. The primary phase formed with mechanochemical synthesis process was hard magneticSrFe12O19 with hexagonal magnetoplumbite structure for all the stoichiometric ratios. Dependingon the stoichiometric ratios, the α-Fe2O3, SrO, and SrFe2O4 phases with varying ratios were alsoobtained.3. The maximum magnetic properties were obtained with 1:6.0 SrCO3/Fe2O3 stoichiometricratio. The coercivity (Hc), the saturated magnetic flux density (Bs), the residual magnetic fluxdensity (Br), and maximum energy product (BH)max values for 1:6.0 stoichiometric ratio wereobtained as 3682 Oe, 506 mT, 311 mT, and 3.11 MGOe, respectively.
Acknowledgments: This current study was financially supported by The Scientific and Technological Research Council of Turkey (TUBITAK) (Grand Nos. 119M111) and Karadeniz Technical University Scientific Research Project (Grand Nos. FDK-2018-7685, FYL-2018-7227, FBA-2019-8162).
319

References: 1. Grusková, A., et al., Optimization of Magnetic and Structural Properties of Sr Ferrite
Prepared by Low Temperature Combustion. Acta Physica Polonica A, 2008. 113(1): p. 557-560.
2. Pullar, R.C., Hexagonal ferrites: A review of the synthesis, properties and applications ofhexaferrite ceramics. Progress in Materials Science, 2012. 57(7): p. 1191-1334.
3. Idayanti, N. and A. Manaf, Investigation of Grain Exchange Interaction Effects on TheMagnetic Properties of Strontium Hexaferrite Magnets. KnE Engineering, 2019. 4(2): p. 223-234.
4. Fu, Y.-P., C.-H. Lin, and K.-Y. Pan, Strontium hexaferrite powders prepared by amicrowave-induced combustion process and some of their properties. Journal of Alloys andCompounds, 2003. 349(1): p. 228-231.
5. Ketov, S.V., et al., Structure and magnetic properties of nanocrystalline SrFe12O19 alloyproduced by high-energy ball milling and annealing. Journal of Magnetism and MagneticMaterials, 2006. 300(1): p. e479-e481.
6. Hessien, M.M., et al., Synthesis and magnetic properties of strontium hexaferrite fromcelestite ore. Journal of Alloys and Compounds, 2009. 476(1): p. 373-378.
7. Jean, M., et al., Synthesis and characterization of SrFe12O19 powder obtained byhydrothermal process. Journal of Alloys and Compounds, 2010. 496(1): p. 306-312.
8. Garehbaghi, S. and A. Kianvash, Effect of various parameters on the microstructure andmagnetic properties of sintered Sr-hexaferrite. Results in Physics, 2019. 12: p. 1559-1568.
9. Liu, B., et al., Controlling the composition and magnetic properties of nano-SrFe12O19powder synthesized from oily cold mill sludge by the citrate precursor method. Materials,2019. 12(8).
10. Liu, B., et al., Synthesis and properties of SrFe12O19 obtained by solid waste recycling ofoily cold rolling mill sludge. International Journal of Minerals, Metallurgy and Materials,2019. 26(5): p. 642-648.
11. Bohlender, C., et al., Phase formation, magnetic properties, and phase stability in reducingatmosphere of M-type strontium hexaferrite nanoparticles synthesized via a modified citrateprocess. Journal of Materials Science, 2019. 54(2): p. 1136-1146.
12. Sánchez-De Jesús, F., et al., Mechanosynthesis, crystal structure and magneticcharacterization of M-type SrFe12O19. Ceramics International, 2014. 40(3): p. 4033-4038.
13. Kiani, E., A.S.H. Rozatian, and M.H. Yousefi, Synthesis and characterization of SrFe12O19nanoparticles produced by a low-temperature solid-state reaction method. Journal ofMaterials Science: Materials in Electronics, 2013. 24(7): p. 2485-2492.
14. Umadevi, T., et al., Recycling of steel plant mill scale via iron ore sintering plant.Ironmaking & Steelmaking, 2012. 39(3): p. 222-227.
15. Khaerudini, D.S., et al., Preparation and Characterization of Mill Scale Industrial WasteReduced by Biomass-Based Carbon. Journal of Sustainable Metallurgy, 2019. 5(4): p. 510-518.
16. Gaballah, N., et al., Production of Iron from Mill Scale Industrial Waste via Hydrogen. OpenJournal of Inorganic Non-metallic Materials, 2013. 03.
17. Chien, Y.-T., H.-C. Pan, and Y.-C. Ko, Preparation and Properties of Barium Ferrite UsingHot-Rolled Mill Scale. Journal of the American Ceramic Society, 1989. 72(8): p. 1328-1332.
18. Woon, H.S., et al. The magnetic properties of mill scale-derived permanent magnet. inSAMM 2005: Regional Conference and Exhibition on Scientific and Analytical Methods in
320

Manufacturing. 2005. Malaysia: Asian Institute of Medicine, Science and Technology. Ahmed, Y.M.Z., et al., Nano-crystalline copper ferrites from secondary iron oxide (mill scale). Journal of Magnetism and Magnetic Materials, 2009. 321(3): p. 181-187.
19. Narayan, S.P. and O. Pandey, Preparation of strontium hexaferrite magnets from celestite andblue dust by mechanochemical route. Journal of Mining and Metallurgy, Section B :Metallurgy, 2008. 44(1): p. 91-99.
20. Sezer, R. and C. Arslan, Mechano-chemical conversion of celestite in highly concentratedsodium carbonate media. Physicochemical Problems of Mineral Processing, 2019. 55(2): p.324-335.
21. Setoudeh, N., N.J. Welham, and S.M. Azami, Dry mechanochemical conversion of SrSO4 toSrCO3. Journal of Alloys and Compounds, 2010. 492(1): p. 389-391.
22. Rojac, T. and M. Kosec, Mechanochemical synthesis of complex ceramic oxides, in High-Energy Ball Milling, M. Sopicka-Lizer, Editor. 2010, Woodhead Publishing. p. 113-148.
23. Baláž, P., Mechanochemistry in Nanoscience and Minerals Engineering. 2008: Springer-Verlag Berlin Heidelberg. 1-413.
24. Sezer, R., et al., Investigation of leaching characteristics of celestite concentrate in acidicmedia and SrCO3 production via precipitation. Journal of the Faculty of Engineering andArchitecture of Gazi University, 2019. 34(3): p. 1409-1416.
25. Hari, Z., et al., A study of mill scale derived hematite process for NiZn ferrite as EMIsuppressor in terms of magnetic properties. Journal of Engineering and Applied Sciences,2017. 12(17): p. 4426-4430.
26. Zi, Z.F., et al., Structural and magnetic properties of SrFe12O19 hexaferrite synthesized by amodified chemical co-precipitation method. Journal of Magnetism and Magnetic Materials,2008. 320(21): p. 2746-2751.
27. Winataputra, D.S., T.L. Ujiyanti, and W.A. Adi, The Structure, Magnetic and AbsorptionProperties of Zn-Ti Substituted Barium-Strontium Hexaferrite Prepared byMechanochemical Process. IOP Conference Series: Materials Science and Engineering,2017. 202: p. 012090.
28. Xu, Y.F., et al., Effects of vacancy and exchange-coupling between grains on magneticproperties of SrFe12O19 and α-Fe2O3 composites. Materials Research Bulletin, 2014. 57: p.13-18.
29. Arvanitidis, I., et al., The intrinsic thermal decomposition kinetics of SrCO3 by anonisothermal technique. Metallurgical and Materials Transactions B, 1997. 28(6): p. 1063-1068.
30. Ptáček, P., et al., The kinetics and mechanism of thermal decomposition of SrCO3polymorphs. Ceramics International, 2015. 41(1, Part A): p. 115-126.
31. Dilipan, A.R., et al., Microstructure and Magnetic Properties of Anisotropic StrontiumHexaferrite Powders. IEEE Transactions on Magnetics, 2019. 55(8): p. 1-5.
32. Tenorio Gonzalez, F.N., et al., Reducing the crystallite and particle size of SrFe12O19 withPVA by high energy ball milling. Journal of Alloys and Compounds, 2019. 771: p. 464-470.
321

MODELLING OF ENERGY EFFICIENCY IN ELECTRIC MOTORS USING THE FINITE-ELEMENT METHOD
NECİP FAZIL YILMAZ*1 , MUHAMMET YUSUF DULKADİR1 , MUSA YILMAZ1 , MAHMUT FURKAN KALKAN1
1Gaziantep University, Engineering Faculty, Mechanical Engineering Department, Gaziantep, TURKEY
Abstract Electric machines constitute a large portion of electricity consumption in industrial and daily life. Electrical steels, also known as silicon steel sheet, are widely used as core material for electrical machines such as electric motors, transformers and generators to improve their performance. It is important to increase the efficiency of these electric machine to reduce energy consumption. These are three main factors affecting the energy efficiency of transformers and electric motors such as mechanical losses, winding losses and iron losses. Silicon concentration of electrical steel plays a crucial role in energy efficiency such as increasing the electrical resistivity, decreasing the eddy current and hysteresis losses . In this study, a finite element model was created with computer software to observe the effect of silicon ratio on motor efficiency. Finite element model results showed that reduce to core loss was achieved by using silicon steel sheets which have different silicon ratio.
Key Words: Silicon Steel Sheet, Electric Motors, Eddy Current Losses, Energy Efficiency
1. IntroductionNowadays, electric motors are demand in most applications by people , such as electricvehicles, electrical appliances, aircraft engines and industrial machinery. The most commonof the electric motors are induction motors and these motors are frequently preferred forindustrial applications . Therefore, most of the electrical energy is consumed by inductionmotors . In order to reduce energy consumption globally, the efficiency of induction motorsshould be increased[1].
The losses in induction motors generally consist of three parts , such as mechanical losses , winding losses and core (iron) losses . Eddy current losses and hysteresis losses constitute iron losses. These losses are a type of loss that occurs depending on the material properties. While hysteresis losses are defined as a function of flux density, eddy current losses are defined as current circulation in stator and rotor laminations. These losses correspond to approximately 20-25% of the total losses in induction motors[2,3].
The magnetic properties of electrical steel sheets depend on thickness. Sheet thickness is an important parameter affecting iron losses because the thickness is a function of eddy current loss. As the laminated steel sheets get thinner, their eddy current losses decrease. The use of thinner sheet metal is a good method to reduce iron losses in induction motors[4].
In induction motors, non-grain oriented electrical steel (N-GOES) sheet are used in the stator and rotor core. It is known that the magnetic properties of non-grain oriented electrical steels used in electric motors are excellent[5,6]. One of the most important reasons for this is the
322

"Si" element in its chemical composition. The amount of silicon should be increased to reducecore (iron) losses in electrical steels because of the fact that the element of silicon plays anactive role in increasing the electrical resistivity. Although the increase of the ratio of siliconin silicon steel sheet improves some magnetic properties, this increase may negatively affect the magnetic saturation properties. The reason is that silicon is a nonmagnetic material [7].
The production of electrical steels consists of very detailed processes , such as continuous casting method, rolling, heat treatment and rolling . Moreover , these processes are very costly and much time is spent on electromagnetic calculations in induction motor applications. However , finite element method prevents these disadvantages. Because the finite element method is a numerical approach that solves complex problems by simplifying them. Ansys-Maxwell saves time and cost with finite element analysis. In this way, the designs and electromagnetic analysis of rotary electrical machines can be done very quickly.
In this study, 1.1 kW 3-phase induction motor is designed. Electric steels containing differentratios of silicon are used in the electric motor models . In addition, electromagnetic simulation of these models was carried out by Ansys-Maxwell commercial software.
2. Materials and Methods 2.1 Material Properties In this paper, 1.1 kW-2pole-3 phase a squirrel cage induction motor has been designed in the Ansys-RMxprt module. Non-grain oriented electrical steels with different silicon ratios wereused for the rotor and stator core and the motor efficiencies were compared. Later, maximum core losses from Ansys-Maxwell module are investigated by finite element analysis (FEA). The types of steel used and their chemical compositions are given in Table 1.
Table 1. Silicon ratio of some non-oriented electrical steel sheet [8] Grade C max. Mn max. P max. S max. Si Al M27 0.020 0.25 0.025 0.008 2.6-3.0 0.12-0.20 M36 0.025 0.25 0.025 0.008 2.2-2.8 0.10-0.20 M43 0.027 0.30 0.025 0.010 1.8-2.6 0.10-0.20
2.2 Finite Element Model In the current work , FEM utilized to simulate core losses model in the induction motor by commercial software ANSYS-Maxwell. Iron core material is altered both stator and rotor core in this FEM. Materials of both stator core and rotor core are changed. Other parameters used in induction motor design were kept constant as seen Table 2 and Table 3 . In the finite element analysis (FEA) , the rotor windings of the induction motor were selected as squirrel cage and made of cast copper.
Table 2. Specification of induction motor Items Specification No. of phases 3 No. of poles 2 Rated output power (kW) 1.1 Rated voltage (V) 380 Rated speed (rpm) 1500 Operating temprature (cel) 75 Frequency (Hz) 50
323

Both stator and rotor parts are heavily important for electric motors. It was observed that asthe stator the stationary part and as the rotor the rotating part in the Figure 2 . Therefore, the geometric design of these parts is an important parameter for converting electrical energy to mechanical energy . Geometric design values of stator and rotor parts are given in the Table 3.
Table 3. Geometric design value of stator and rotor parts Stator Rotor
Outer diameter (mm) 140 76 Inner diameter (mm) 78 32 Length (mm) 250 250 No. of slots 36 28 Stacking factor 0.95 0.95
(a)
(b) (c)
Figure 2. (a) General electric motor assembly [9] , (b) stator core , (c) rotor core
3. Result and DiscussionThe core losses and energy efficiencies of these designed and analyzed models are shown inTable 4. These electrical steels are manufactured in different chemical compositions and thesilicon ratio varies. The use of silicon in electrical steels is a good method to reduce eddy andhysteresis current losses as seen Figure 3. For this reason , it has been observed that core
324

losses decrease as the silicon ratio of electrical steels increases. However , if we compareM36-29g steel with M43-29g steel, the model using M43-29g (low silicon ratio than M36-29g steel) steel has higher efficiency. When the magnetic flux density exceeds the magnetic saturation point, the density of iron losses increases[7,10]. If the magnetic flux density isabove the saturation zone, the coils will be overloaded and serious heating problems occur. Moreover, this problem will increase other losses and will adversely affect mechanical performance. Finally , magnetic flux density distributions of electrical steels are seen in Figure 4 and M27-29g electrical steel is at the highest motor efficiency by not reaching magnetic saturation.
0 20 40 60 80 100 120 140 160 1800
2
4
6
8
10
12
14
16
18
20
22
Cor
e Lo
ss (W
)
Time (ms)
M27-29g M36-29g M43-29g
a)
0 20 40 60 80 100 120 140 160 1800
2
4
6
8
10
12
14
16
18
20
Hys
tere
sis
Loss
(W)
Time (ms)
M27-29g M36-29g M43-29g
b)
0 20 40 60 80 100 120 140 160 1800
1
2
3
4
5
6
Eddy
Cur
rent
Los
s (W
)
Time (ms)
M27-29g M36-29g M43-29g
c) Figure 3. Changes of (a) core losses, (b) hysteresis losses and (c) eddy current losses in
induction motors
It is seen in Figure 3 that eddy current and hysteresis losses decrease due to the increase in the amount of silicon in electrical steels.
325

Table 4. Results of FEA Materials Efficiency , % Max. Core Loss , W M27-29g 76.33 19.20 M36-29g 75.72 20.47 M43-29g 76.14 21.95
While iron losses decrease with increasing silicon ratio, silicon addition decreases magneticsaturation. For this reason, it has been observed that reducing core losses is not always a factor that increases electric motor efficiency.
a) Maximum Core Losses is 19.20 W b) Maximum Core Losses is 20.77 W
c) Maximum Core Losses is 21.95 W
Figure 4. Magnetic flux density distribution of rotor and stator core in the material; a) M27 b) M36 c) M43
4. ConclusionIn this study, a three-phase, 1.1 kW induction motor was designed in Ansys-RMxprt, and thenfinite element analysis was carried out for electromagnetic calculations in Ansys-Maxwell.
326

The optimization process includes the analysis of combinations of electric steels with different silicon ratio. The following conclusions were drawn in this study;
• The reduction of iron losses of induction motor is possible by increasing the siliconratio.
• Eddy current losses and hysteresis losses reduce the efficiency of electric motors.• The highest motor efficiency in the electrical steels used in the induction motor has
been achieved in the M27-29g electrical steel.•
References 1. K. J. Park, K. Kim, S. Lee, D.-H. Koo, K.-C. Ko, and J. Lee, “Optimal design of rotor slot
of three phase induction motor with die-cast copper rotor cage,” in 2008 InternationalConference on Electrical Machines and Systems, 2008, pp. 61–63.
2. R. Saidur, “A review on electrical motors energy use and energy savings,” Renew.Sustain. Energy Rev., vol. 14, no. 3, pp. 877–898, 2010.
3. J. Kartigeyan and M. Ramaswamy, “Effect of material properties on core loss in switchedreluctance motor using non-oriented electrical steels,” J. Magn., vol. 22, no. 1, pp. 93–99,2017.
4. M. Yabumoto, C. Kaido, T. Wakisaka, T. Kubota, and N. Suzuki, “Electrical steel sheetfor traction motor of hybrid/electric vehicles,” SHINNITTETSU GIHO, pp. 51–54, 2003.
5. W. J. Carr Jr and R. Smoluchowski, “The magnetostriction of single crystals of iron-silicon alloys,” Phys. Rev., vol. 83, no. 6, p. 1236, 1951.
6. M. Goertz, “Iron‐Silicon Alloys Heat Treated in a Magnetic Field,” J. Appl. Phys., vol.22, no. 7, pp. 964–965, 1951.
7. Y. Oda, M. Kohno, and A. Honda, “Recent development of non-oriented electrical steelsheet for automobile electrical devices,” J. Magn. Magn. Mater., vol. 320, no. 20, pp.2430–2435, 2008, doi: 10.1016/j.jmmm.2008.03.054.
8. S. K. Gupta et al., “Cold rolled non-oriented (CRNO) silicon steel production at RourkelaSteel Plant, SAIL.”
9. Tan-Kim, V. Lanfranchi, S. Vivier, J. Legranger, and F. Palleschi, “Vibro-acousticsimulation and optimization of a claw-pole alternator,” IEEE Trans. Ind. Appl., vol. 52,no. 5, pp. 3878–3885, 2016.
10. T. Vaimann, A. Belahcen, and A. Kallaste, “Changing of magnetic flux densitydistribution in a squirrel-cage induction motor with broken rotor bars,” Elektron. irElektrotechnika, vol. 20, no. 7, pp. 11–14, 2014.
327

EROSIVE WEAR PERFORMANCE of Ti6Al4V COATED with MICRO ARC OXIDATION and ELECTRO SPARK DEPOSITION
DOĞAN ACAR1, SALİM LEVENT AKTUĞ2, KEMAL KORKMAZ2, SALİH DURDU3,4, ÖMER NECATİ CORA*1
1 Karadeniz Technical University, Department of Mechanical Engineering, 61080, Trabzon, TURKEY. 2 Gebze Technical University, Department of Materials Science and Engineering, 41400, Gebze, TURKEY.
3 Giresun University, Department of Industrial Engineering, 28200, Giresun, TURKEY. 4 Giresun University, Department of Mechanical Engineering, 28200, Giresun, TURKEY.
Abstract
In this study, an aerospace grade Ti6Al4V alloy was coated by micro-arc oxidation (MAO) and electro spark deposition (ESD) methods in order to investigate their effect on solid particle erosion performance. The surface morphology and mechanical properties of coatings were characterized with SEM and nanoindentation, respectively. Solid particle erosion performance of uncoated and coated Ti6Al4V alloy was investigated by using an in-house developed tests system per ASTM G76-13 test standard. Effect of impact velocity (70 and 150 200 m/s) on erosive wear was examined using angular shaped SiC erodent particles (348 µm in average diameter). The SEM analyses indicated formation of cracks on coated surfaces after erosion tests. Both coatings’ surfaces were rough and porous due to the existence of plasma chemical reactions on micro discharge channels. Surface topography and crater depths were determined using a surface profilometer. Erosion rate was found to be increased with increasing impact velocity due to increasing kinetic energy of erodent particles. Both MAO and ESD coated samples showed worse erosion performance compared to base material Ti6Al4V considering volumetric and gravimetric wear rates.
Keyword: Micro-Arc Oxidation (MAO); Electro Spark Deposition (ESD), Titanium Alloys; Mechanical Properties, Solid Particle Erosion
1. IntroductionSolid particle erosion is a dynamic process which results with material removal from a targetsurface due to continuous impingement erodent solid particles. It is a lifetime limitingphenomenon which is also an economical burden as many industries including aerospace, oil andgas industry suffer from solid particle erosion [1,2].
The micro-arc oxidation (MAO), also known as plasma electrolytic oxidation (PEO), combines electrochemical oxidation and high voltage spark. This is an effective technique to deposit various functional hard and porous ceramic coatings on the surfaces of valve metals such as Al, Mg, Ti and their alloys [3,4]. The MAO coatings produced on Ti and its alloys resulted in high hardness, high adhesion strength on substrate and excellent wear resistance [4,5]. In another
328

study, an aluminum and oxide coating were applied on Ti6Al4V alloy by using electro-spark deposition (ESD) and micro-arc oxidation (MAO) methods. The ESD was carried out toaccumulate an Al on Ti6Al4V alloy at the first step. And then, oxide-based layer was fabricated to improve mechanical and tribological properties of Ti6Al4V alloy by MAO process at the second step.
There are numerous studies on solid particle erosion of Ti6Al4V alloy [6–12]. Avcu et al., investigated the effect of impinging angle and erodent size effect in order to characterize erosive behavior of Ti6Al4V [12]. They showed that Ti6Al4V presents a ductile material behavior and maximum erosion rate obtained at 30° impingement angle. Also, elevated temperature erosion resistance of Ti6Al4V was investigated [6]. Erosion rate for Ti6Al4V was escalated withincreasing temperature especially, between 600-800 °C. Ti6Al4V coated with TiN, was used to investigate the porous coating structure on erosive behavior [7]. Effect of Cr layer thickness on erosive wear behavior of TiAlSiN/Cr coated Ti6Al4V was investigated in another study [13]. And 21 nm thickness of Cr layer is found to be optimum for excellent erosion resistant.
Krishna et al, investigated the ceramic coatings produced through microarc oxidation method (MAO) [14]. It is stated that, in solid particle erosion performance, material removal is mostly related with unclosed discharge channels. In their another study Krishna et al. compared solid particle erosion behaviors of MAO coatings with hard-anodized coatings [15]. MAO coating showed better resistance than both hard-anodized coating and bare alloy. However, solid particle erosion rate is much more than MAO and bare alloy. Electro spark deposition (ESD) is another surface modification method to resist solid particle erosion. WC coating fabricated via ESD isexplored for solid particle erosion performance and compared with WC-Co coatings’ one by Roy [16]. Solid particle erosion resistance is enhanced by WC coatings and WC coatings showed a brittle response. However, studies on solid particle erosion behavior of MAO and ESD coatingsapplied to Ti6Al4V are limited. In this study, MAO and ESD coatings on Ti6Al4V were investigated to reveal possible improvement in solid particle erosion performance.
2. Materials and MethodsIn the current study, Ti6Al4V alloy, (0.67 mm in thickness) manufactured per AerospaceMaterials Standard (AMS4911F&H, ASTM B205-90 GRD5) was used as a base material. Inorder to enhance solid particle erosion response, Ti6Al4V was coated with micro-arc oxidationand electro spark deposition methods. Prior to coating processes, surfaces of Ti6Al4V to becoated were grinded with sandpapers up to 1200 grit. After that, the surface of titanium sheetswas cleaned in an ultrasonic bath. Then, pure Al was deposited on a Ti6Al4V alloy through theESD (electro spark deposition) process. A special ESD device was utilized at the first step. TheESD coating system was described in detail in authors’ previous studies [17,18]. The ESDprocess was performed using a hand-held applicator under constant temperature and in unipolarmode. In the system, the voltage dropped at the inter electrode gap and the amount of electricitywas kept constant. Besides ESD, Ti6Al4V substrates were coated by MAO process. The MAOwith the application of bipolar impulses was used for the fabrication of oxide layer on Ti6Al4Valloy as the second step. Electrolyte solution was prepared by mixing NaAlO2 (#CAS: 1138-49-1Sigma Aldrich) and KOH (#CAS: 1310-58-3 VWR Chemicals) in distilled water. A Ti6Al4Valloy and a stainless-steel container were served as an anode and cathode, respectively. Thetreatment time was 10 min, and the current density was 0.25 A/cm2 through the MAO process.
329
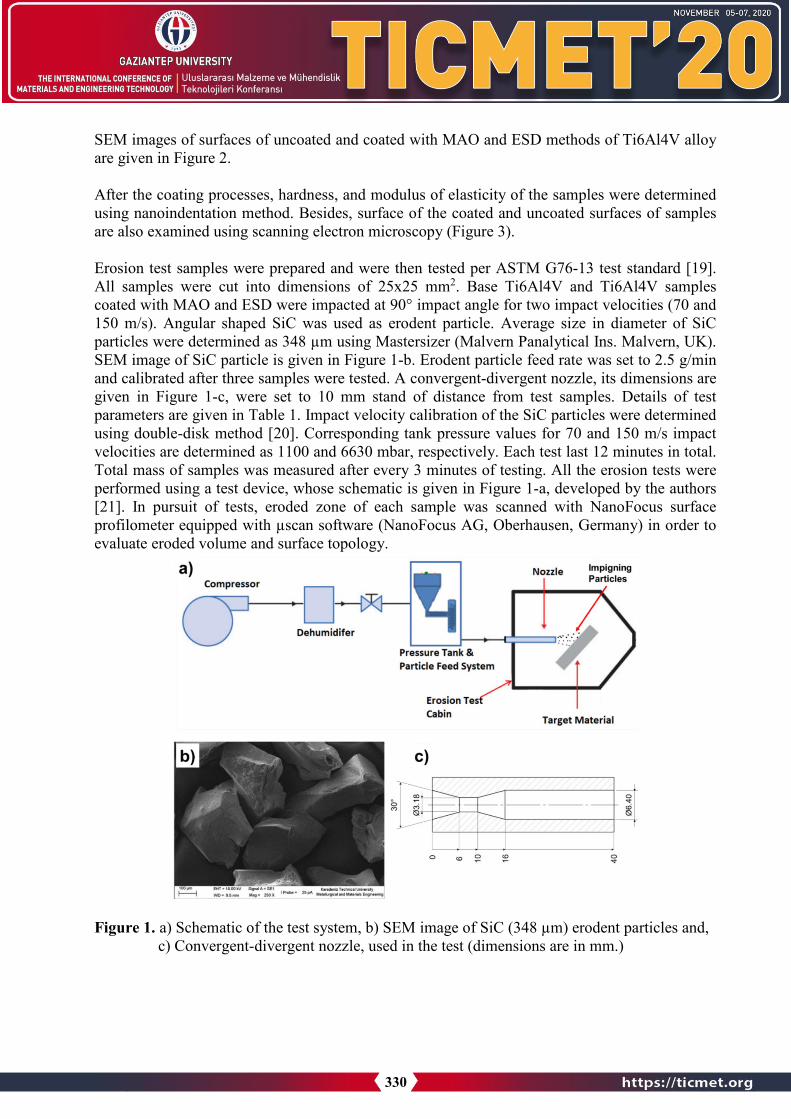
SEM images of surfaces of uncoated and coated with MAO and ESD methods of Ti6Al4V alloy are given in Figure 2.
After the coating processes, hardness, and modulus of elasticity of the samples were determined using nanoindentation method. Besides, surface of the coated and uncoated surfaces of samples are also examined using scanning electron microscopy (Figure 3).
Erosion test samples were prepared and were then tested per ASTM G76-13 test standard [19]. All samples were cut into dimensions of 25x25 mm2. Base Ti6Al4V and Ti6Al4V samples coated with MAO and ESD were impacted at 90° impact angle for two impact velocities (70 and 150 m/s). Angular shaped SiC was used as erodent particle. Average size in diameter of SiC particles were determined as 348 µm using Mastersizer (Malvern Panalytical Ins. Malvern, UK). SEM image of SiC particle is given in Figure 1-b. Erodent particle feed rate was set to 2.5 g/min and calibrated after three samples were tested. A convergent-divergent nozzle, its dimensions are given in Figure 1-c, were set to 10 mm stand of distance from test samples. Details of test parameters are given in Table 1. Impact velocity calibration of the SiC particles were determined using double-disk method [20]. Corresponding tank pressure values for 70 and 150 m/s impact velocities are determined as 1100 and 6630 mbar, respectively. Each test last 12 minutes in total. Total mass of samples was measured after every 3 minutes of testing. All the erosion tests were performed using a test device, whose schematic is given in Figure 1-a, developed by the authors[21]. In pursuit of tests, eroded zone of each sample was scanned with NanoFocus surface profilometer equipped with µscan software (NanoFocus AG, Oberhausen, Germany) in order to evaluate eroded volume and surface topology.
Figure 1. a) Schematic of the test system, b) SEM image of SiC (348 µm) erodent particles and, c) Convergent-divergent nozzle, used in the test (dimensions are in mm.)
330

Table 1. Erosion test parameters Test Materials Ti6Al4V , Ti6Al4V+MAO ,Ti6Al4V+ESD
Impact Velocity 70 m/s , 150 m/s
Impact Angle 90°
Erodent Type Silicon Carbide (SiC)
Erodent Size 348 µm
Nozzle Stand of Distance 10 mm
Test Standard ASTM G76-13
3. Results and DiscussionAs the hardness plays critical role in wear behavior, nanoindentation measurements were performed on coated samples in order to evaluate the hardness and modulus of elasticity of MAOand ESD coated Ti6Al4V samples. 10 mN load was applied to the samples for at least 5 times repetition for each coated sample. Hardness values of MAO and ESD 0.6 GPa and 1.7 GPa for MAO and ESD coated samples, respectively. Modulus of elasticity values were measured as 10 GPa and 35 GPa for MAO and ESD coatings, respectively. Coated and uncoated surface of Ti6Al4V samples were also examined with scanning electron microscopy. Obtained SEMimages of the coated and uncoated surfaces of Ti6Al4V samples are given in Figure 2. Examining Figure 2-b, a porous structure and minor cracks are observed on surface of the MAO coated Ti6Al4V. Besides surface cracks and a very rough surface was observed for ESD coated Ti6Al4V (Figure 2-c).
Figure 2. SEM images of sample surfaces, a) Ti6Al4V, b) Ti6Al4V+MAO, c) Ti6Al4V+ESD
331

Mass loss measurement were carried out with a precision scale after every three minutes of erosion testing (in total 12 min. for a test sample) and were recorded. Calculated mass lossvalues of tested samples were depicted in Figure 3. Examining Figure 3, it is observed that Ti-MAO samples showed the worst erosion performance when mass loss is considered. Besides, increasing impact velocity resulted in mass loss increase.
Eroded surfaces of Ti6Al4V, Ti6Al4V+MAO, Ti6Al4V+ESD samples were scanned with Nanofocus surface profilometer. Scanned surface images and corresponding surface topographies at 70 and 150 m/s are given in Figure 4. Scales on the right side of the topographsshow that crater depths increase with increasing impact velocity. In Figure 4-b, c, it is observed that MAO coating around the erosion zone also crumbled. This crumbling of is the reason why the mass loss, shown in Figure 3, is more than ESD coated sample and Ti6Al4V. Thus, mass loss is a misleading criterion to evaluate solid particle erosion wear. Therefore, width-depth profilesfrom the cross section in the deepest point of the craters occurred on the eroded surface were extracted. After that, these width-depth profiles were overlayed to each other for different test samples for 70 and 150 m/s impact velocities (Figure 5). Increasing impact velocity form 70 m/s to 150 m/s yielded about six times deeper erosion craters. However, the crater widths for all tested samples uncoated or coated remain almost same. As for volumetric erosion evaluation, the erosion trend is a little different than mass loss trend. In this case, Ti6Al4V+ESD eroded more than both Ti6Al4V+MAO and Ti6Al4V. In any case, coated Ti6Al4V samples did not yield better erosion performance contrary to expectations. As a result, Ti6Al4V showed best solid particle erosion when both volumetric and mass loss values are taken into account.
Figure 3. Erosion amount of tested samples at different impact velocities wrt mass loss
332

Figure 4. Surface topographies of tested samples, at 70 m/s a) Ti6Al4V, b) Ti6Al4V +MAO, c) Ti6Al4V +ESD, and at 150 m/s d) Ti6Al4V, e) Ti6Al4V+MAO, f) Ti6Al4V+ESD
Figure 5. Profile curves for the cross-section of eroded surfaces of the samples tested at their deepest point, a) 70 m/s, b) 150 m/s
333

4. ConclusionsIn this study, Ti6Al4V was coated with oxide layer and aluminum using micro-arc oxidation (MAO) and electro spark deposition (ESD) methods, respectively. The coated and uncoated Ti6Al4V samples were subjected to solid particle erosion tests at 70 and 150 m/s impact velocities and 90° impact angle. SEM observations on the samples revealed a porous structureand cracks on the surface of Ti6Al4V+MAO samples. Also, a rough surface along with crackswere observed on the Ti6Al4V+ESD samples. In erosion tests, increasing impact velocity led to increased amount of erosion. Considering the mass loss values, Ti6Al4V+MAO samples showed worst erosion performance at both impact velocity values. On the other hand, Ti6Al4V+ESD samples were eroded more compared to Ti6Al4V and Ti6Al4V+MAO samples when volumetric loss is taken into consideration.
References
1. M. Parsi, K. Najmi, F. Najafifard, S. Hassani, B.S. McLaury, S.A. Shirazi, A comprehensivereview of solid particle erosion modeling for oil and gas wells and pipelines applications, J.Nat. Gas Sci. Eng. 21 (2014) 850–873. https://doi.org/10.1016/j.jngse.2014.10.001.
2. G.F. Schmitt, Liquid and Solid Particle Erosion. Technical Report, (1979).3. S. Durdu, Ö.F. Deniz, I. Kutbay, M. Usta, Characterization and formation of hydroxyapatite
on Ti6Al4V coated by plasma electrolytic oxidation, J. Alloys Compd. 551 (2013) 422–429.https://doi.org/https://doi.org/10.1016/j.jallcom.2012.11.024.
4. S. Durdu, S. Bayramoğlu, A. Demirtaş, M. Usta, A.H. Üçışık, Characterization of AZ31 MgAlloy coated by plasma electrolytic oxidation, Vacuum. 88 (2013) 130–133.https://doi.org/10.1016/j.vacuum.2012.01.009.
5. A.L. Yerokhin, X. Nie, A. Leyland, A. Matthews, S.J. Dowey, Plasma electrolysis forsurface engineering, Surf. Coatings Technol. 122 (1999) 73–93.https://doi.org/https://doi.org/10.1016/S0257-8972(99)00441-7.
6. J. Zhou, S. Bahadur, Erosion-corrosion of Ti-6Al-4V in elevated temperature airenvironment, Wear. 186–187 (1995) 332–339. https://doi.org/10.1016/0043-1648(95)07161-X.
7. H. Proudhon, J. Savkova, S. Basseville, V. Guipont, M. Jeandin, G. Cailletaud, Experimentaland numerical wear studies of porous Reactive Plasma Sprayed Ti–6Al–4V/TiN compositecoating, Wear. 311 (2014) 159–166.https://doi.org/https://doi.org/10.1016/j.wear.2014.01.012.
8. N. Kumar, M. Shukla, Finite element analysis of multi-particle impact on erosion in abrasivewater jet machining of titanium alloy, J. Comput. Appl. Math. 236 (2012) 4600–4610.https://doi.org/10.1016/j.cam.2012.04.022.
9. N. Kamkar, F. Bridier, P. Bocher, P. Jedrzejowski, Water droplet erosion mechanisms inrolled Ti–6Al–4V, Wear. 301 (2013) 442–448.https://doi.org/https://doi.org/10.1016/j.wear.2013.01.005.
10. I. Farina, F. Fabbrocino, F. Colangelo, L. Feo, F. Fraternali, Surface roughness effects on thereinforcement of cement mortars through 3D printed metallic fibers, Compos. Part B Eng. 99(2016) 305–311. https://doi.org/https://doi.org/10.1016/j.compositesb.2016.05.055.
11. M. Takaffoli, M. Papini, Material deformation and removal due to single particle impacts onductile materials using smoothed particle hydrodynamics, Wear. 274–275 (2012) 50–59.https://doi.org/10.1016/j.wear.2011.08.012.
334

12. E. Avcu, S. Fidan, Y. Yildiran, T. Sinmazçelik, Solid particle erosion behaviour of Ti6Al4Valloy, Tribol. - Mater. Surfaces Interfaces. 7 (2013) 201–210.https://doi.org/10.1179/1751584X13Y.0000000043.
13. J. Gu, L. Li, M. Ai, Y. Xu, Y. Xu, G. Li, D. Deng, H. Peng, S. Luo, P. Zhang, Improvementof solid particle erosion and corrosion resistance using TiAlSiN/Cr multilayer coatings, Surf.Coatings Technol. 402 (2020) 126270. https://doi.org/10.1016/j.surfcoat.2020.126270.
14. L. Rama Krishna, K.R.C. Somaraju, G. Sundararajan, The tribological performance of ultra-hard ceramic composite coatings obtained through microarc oxidation, Surf. CoatingsTechnol. 163–164 (2003) 484–490. https://doi.org/10.1016/S0257-8972(02)00646-1.
15. L.R. Krishna, A.S. Purnima, G. Sundararajan, A comparative study of tribological behaviorof microarc oxidation and hard-anodized coatings, Wear. 261 (2006) 1095–1101.https://doi.org/10.1016/j.wear.2006.02.002.
16. M. Roy, Solid Particle Erosion Behavior of WC Coating Obtained by ElectrosparkTechnique and Detonation Spraying, Tribol. Trans. 57 (2014) 1028–1036.https://doi.org/10.1080/10402004.2014.911397.
17. A. V Ribalko, K. Korkmaz, O. Sahin, Intensification of the anodic erosion in electrosparkalloying by the employment of pulse group, Surf. Coatings Technol. 202 (2008) 3591–3599.https://doi.org/https://doi.org/10.1016/j.surfcoat.2007.12.037.
18. S. Durdu, S.L. Aktuğ, K. Korkmaz, Characterization and mechanical properties of the duplexcoatings produced on steel by electro-spark deposition and micro-arc oxidation, Surf.Coatings Technol. 236 (2013) 303–308.https://doi.org/https://doi.org/10.1016/j.surfcoat.2013.10.004.
19. Astm, ASTM G76-07, Standard Test Method for Conducting Erosion Tests by Solid ParticleImpingement Using Gas Jets, West Conshohocken, PA, 2013.https://doi.org/10.1520/G0076-07.2.
20. A.W. Ruff, L.K. Ives, Measurement of solid particle velocity in erosive wear, Wear. 35(1975) 195–199.
21. D. Acar, D. Meriç, H. Sofuoğlu, R. Gümrük, Ö.N. Cora, H. Gedikli, Helikopter Pali AşinmaKalkaninda Meydana Gelen Kati Parçacik Erozyonunun İncelenmesi İçin Bir Test DüzeneğiTasarim Ve İmalati, in: VI. Ulus. Havacılık Ve Uzay Konf., Kocaeli, Türkiye, 2016: pp. 1–13.
335

ZnO NANOSTRUCTURE REINFORCED DENTAL COMPOSITES
ILKNUR TAS*1, DERYA KAPUSUZ1
1Gaziantep University, Engineering Faculty, Metallurgical and Materials Engineering Department, Gaziantep, TURKEY
Abstract Zinc oxide (ZnO) nanostructures are widely used materials in electronic, energy and biomedical applications. Until today, they have been used in solar cells, biomedical devices, as photo-detectors, nanogenerators and sensors owing to their superior properties such as high surface area, good mechanical strength, photocatalytic and antibacterial capabilities. In this study, ZnOnanostructures were synthesized in several solvents/additives including water, chloroform, ethylene glycol, PEG, CTAB and urea using solvothermal and sol-gel methods. Obtainednanostructures were characterized using X-ray diffraction (XRD) and scanning electronmicroscopy (SEM). Dental resins made of diurethane dimethacrylate (UDMA) and triethylene glycol dimethacrylate (TEGDMA) co-polymers were reinforced with ZLH/ZnO at 2, 4 and 8 wt. %. The structural and functional properties of nanocomposites were analyzed. Water sorption (WS) and solubility of composites were tested based on ISO 4049 standard. Their Vickers microhardness number (VHN) was measured by applying 1 kgf for 40 s. The photocatalytic performance was tested using methyl orange dye as a model pollutant. 8 wt. % ZLH/ZnO nanostructure reinforcement resulted in the least water sorption with moderate solubility. VHNslightly varied with ZLH/ZnO reinforcement. Highest VHN was obtained by 4 wt. % reinforcement. Photocatalytic measurements demonstrated that ZLH/ZnO nanostructures did not provide remarkable photocatalytic capability but decreased the blood protein affinity of UDMA-TEGDMA co-polymers.
Keyword: Zinc Oxide, Dental, Composite, Solvothermal, Sol-Gel, Methacrylate
1. Introduction
In recent years, reinforcing dental resins with various inorganic nanoparticles have become the most popular approach to develop functional composites with prolonged service life [1]. Nanoparticles not only provided high interaction surface area leading to enhanced mechanical properties but also, they could provide additional properties to dental fillings such as self-cleaning and antibacterial[2]. However, usable reinforcing materials were limited in number, since aesthetic appearance has been a necessity in dental composites. The dark color prevented the use of strong, covalently bonded ceramics like Si3N4, SiC fillers [3]. Therefore, to resemble the natural tooth structure, white-to-yellow particulate ceramics such as Titania (TiO2) and zinc oxide (ZnO) have become the leading choices for research and application. Previous studies showed that TiO2 and ZnO possessed remarkable photocatalytic activity which could provide
336

self-cleaning capability and antibacterial activity to the polymeric matrices they were incorporated. Moreover, they could be formed at various nano-morphologies which can also provide enhanced mechanical interlocking upon polymerization of the resins. These materials could be obtained by solvothermal and sol-gel processes [4-5].
Specifically, zinc oxide (ZnO) nanoparticles have shown remarkable potential for use in dentalindustry simultaneously to improve mechanical resistance and provide antibacterial activity tocomposite fillers [6].When nano-ZnO structures were dispersed in dental resins, large interaction area formed between nanostructure and resin. This interaction improved hardness, toughness and other mechanical properties of the dental composites [7]. However, despite the remarkable advantage of using nano-size fillers, increasing the nano-ZnO reinforcement led to formation of aggregates acting as crack initiation regions in the matrix [8]. For this reason, it is critically important to investigate the effect of ZnO nano-morphologies by controlling the method, type and amount of the solvents, surfactants and additives used.
Among different processing methods, sol-gel has been one of the leading, owing to its simple but controllable reaction steps. Various parameters such as pH, reaction temperature and precursor type have been shown to be effective on the size and morphology of ZnO particles [9]. Inaddition to sol-gel method, various different solvothermal approaches have been used to synthesize ZnO with different size and morphologies. Various type of solvent, surfactants and organic substances were added into the solution. For instance, many researchers had studiedproduction ways of ZnO nanoparticles via solvothermal method using tetrahydrofuran (THF) andEtOH as solvent, respectively [11-12]. Polyethylene glycol (PEG) and cetyl trimethylammonium bromide (CTAB) were also commonly used additives in hydrothermal studies [13-15]. Usui et al. observed nanosheets when CTAB added in solution which includes zinc sulfate heptahydrate and sodium hydroxide. As a result of this study, rose-like and hexagonal-shaped rod morphologies formed as the amount of CTAB molar ratio was increased from 0.5 to 1 and 1.5 [16-17]. It was shown that PEG influenced the growth mechanism of ZnO nuclei. Using PEG, different ZnO morphologies were synthesized including 1-D nanorods, solid nanocones, microspheres and multilayered nanosheets [18-19]. Zhang and Yuan et al. made self-assembled monocrystalline ZnO nanorod bundles and ZnO micronuts [20-21].
In addition to PEG and CTAB, urea was a common, organic low-cost additive that was used to produce various types of ZnO nanostructures [22]. In this work, three different types of ZnO nanostructures were prepared: i) Nanosheets, ii) nanofibers and iii) rose-like nanoparticles. Due to its high interaction surface area, nanosheets were chosen to reinforce diurethane dimethacrylate (UDMA) and triethylene glycol dimethacrylate (TEGDMA) co-polymer matrix up to 8 wt. %. Structural properties, photocatalytic performance and protein adsorption behavior of dental composites were tested and reported.
2. Materials and Methods
Materials
In all particle synthesis reactions, zinc acetate dihydrate (ZAD; Zn(CH3COO)2.2H2O; %, Sigma-Aldrich 98 %379786) was used as the Zn source. Sodium hydroxide (NaOH; 98 %; Isolab969.113) was used as a catalyst. Ethanol (C2H5OH, 99.9%, Sigma-Aldrich 32205) was used as a reagent. Deionized water (RNAse free, Human ) were used as solvent and the
337

dispersing medium. Urea and poly ethylene glycol 400 (H(OCH2CH2)nOH; %, Sigma-Aldrich8074851000) were used as additives. Cetyl trimethyl ammonium bromide (CH3(CH2)15N(Br)(CH3)3, Sigma-Aldrich H5882) was used as surfactant. Diurethane dimethacrylate (UDMA, Sigma-Aldrich 436909) and triethylene glycol dimethacrylate (TEGDMA, Sigma-Aldrich 261548) co-polymers were used as dental resins. Camphorquinone (CQ, Sigma-Aldrich 124893) was used as an initiator. 2-(N,N-dimethylamino) ethyl methacrylate was used as an activator (DMAEMA, Sigma-Aldrich 234907). Methyl orange (MO 85%, Merck 114510) dye was used to investigate the photocatalytic capability. Phosphate buffered saline tablet (Sigma-Aldrich; 1002948998) and bovine serum albumin (BSA Sigma-Aldrich A3311) were used to investigate protein adsorbance behavior.
Synthesis of particles
In sol-gel reaction, 2 g ZAD was dissolved in 15 mL DI water. Subsequently, 8 g NaOH was dissolved in 10 mL DI water and each solution were stirred on a magnetic stirrer for 5 minutes. After that, the solution containing NaOH was poured into ZAD solution and stirred additionally for 5 minutes. Lastly 100 mL EtOH was added dropwise and the solution was heated to 75°C. Then the precipitates were then kept in furnace at 85°C overnight. The sample was referred as A-1.
For the synthesis of particles using hydrothermal method, 2 mmol of ZAD was dissolved in 15 mL DI water, then 10 mmol urea was added and the solution was continuously stirred at ambientconditions. When the mixture reached homogeneous state, it was transferred into hydrothermal reactor and reacted for 5 h at 120 °C. The sample was coded as A-2. For the preparation of another hydrothermal solution, 2 mmol of ZAD was dissolved in 15 mL DI water, then 6 mmol urea was added into the solution. After stirring for 10 minutes, 4 mmol CTAB and 4 mmol PEGwas added subsequently and stirred additionally for 15 minutes. The solution was transferred to the reactor and reacted kept at 120 °C for 5 h. The sample was coded as A-3. After the hydrothermal reactions were completed, each precipitate was centrifuged using DI water andEtOH for several times, then dried at 90°C.
Production of ZnO reinforced UDMA-TEGDMA Composites
For a typical composite production, UDMA was first mixed with TEGDMA at 1:1 weight ratio, at ambient temperature. The monomer mixture was transparent and homogeneous after 5 minutes of stirring. Then, sol-gel derived ZnO precipitates (A-1) were dispersed in the mixture at 2, 4 and 8 wt. %, then stirred at 1500 rpm. Lastly, CQ and DMAEMA were added at 0.03 and 0.04 wt. %, respectively and stirred for 5 minutes additionally. After obtaining a homogenous composite mixture, they were transferred into molds made of silicone rubber and polymerized. UltraDent Valo LED light was used to cure the samples for 40 s from their top surfaces.
Characterization and Testing
Precipitates were analyzed using Bruker D8 Advance X-ray diffractometer. Samples were scanned at 2°/min scan rate in 20°–60° 2-theta range using monochromatic Cu-Kα radiation at 40 kV. The morphologies of ZnO nanostructures were investigated using by FEI Nova Nano SEM 430 electron microscope typically at 20 kV voltage. 1 kg force was applied on the top and bottom surfaces of the specimens for 40s using Vickers Microhardness tester (AOB systems) to
338

examine the microhardness of ZnO nanosheet (A-1) reinforced composite. Prior to measurement, composite surfaces were polished using 600 and 2000 grid SiC paper, respectively.
ISO 4049 standard measurement was applied on the composites to test water sorption (WS) and solubility (S) of composites. Disk-shaped test specimens were washed by ethanol and their dry weights were measured (m1). Each disk was kept in ultra-pure water at 37°C for 3 weeks. Afterthis time, specimens were separated from water, gently dried with a tissue paper and their dry weights were measured (m2). After, specimens were kept under vacuum in a desiccator for 20 days and their dry weights were measured (m3) again. WS and S values were calculated by formulas (1) and (2);
𝑊𝑊𝑊𝑊(𝑔𝑔𝑐𝑐𝑐𝑐
) = 𝑚𝑚2−𝑚𝑚3𝑉𝑉
(1)
𝑊𝑊(𝑔𝑔𝑐𝑐𝑐𝑐
) = 𝑚𝑚2−𝑚𝑚3𝑉𝑉
(2)
Three specimens were tested for each composite formulation. For photocatalytic testing,typically specimens were put in100 mL glass beakers filled with 50 mL MO solution. After, solutions were isolated from day light by keeping them under dark in a UV-lamp (365 nm) equipped box. The distance between solution surface and UV-light was adjusted to 40 cm. To provide adsorption-desorption equilibrium, specimens were first stirred under dark for 30 min.Next, UV-light was switched on and the solutions were stirred at room temperature for certain times. 4 mL aliquots were taken from each solution after 1h, 2h, 3h and 4h. The maximumabsorbance (λmax) of MO is at 465 nm [23]. The concentration of native MO solution was 5 mg/L. The behavior of degradation was observed by monitoring C/C0 vs. time (C is the absorbance at 465 nm at time = t and C is the absorbance of pure MO solution at 465 nm at time = 0).
Protein adsorbance of particles and composites were tested using aqueous BSA solution at 1.330 mg/L. The maximum absorbance (λmax) of BSA is at 278 nm [24].The test was applied on nano-sheets and nano-fibers (A-1, A-3) and 2, 4, 8 wt. % nano-sheet reinforced composites. 50 mL of BSA solution was added in 100 mL glass beaker. Then, 0.90 g of particles was added. 4 mL solution was taken from beaker by a syringe at particular time (1h, 3h, 5h and 24 h). Identical procedures of MO/BSA adsorption tests were applied on composites. Composites with identical surface area and weight were put into MO/BSA solutions at the same concentration and kept for 24 h.
3. Results and Discussion
Characterization and testing of particles
In Figure 1, the XRD spectra of the obtained particles (A1-A3) are shown. The XRD spectrum of nanosheets (A1) indicated remarkable formation of zinc layered hydroxide (ZLH) with some amount of ZnO. The major peak at 2𝜃𝜃 = 9.0° together with small peaks at 11.63, 12.76, 17.07, 18.30, 19.09, 22.61, 23.57, 30.16, 33.16, 34,30, 35.62, 38.08, 39.92, 40.10, 41.55, 46.58 48.22 and 53.57° corresponded to monoclinic ZLH structure [25].The XRD spectrum of A-2 particles showed major diffraction peaks at 12.13, 14.22, 15.10, 18.34, 20.53, 21.26, 22.30, 22.87, 24.60,
339
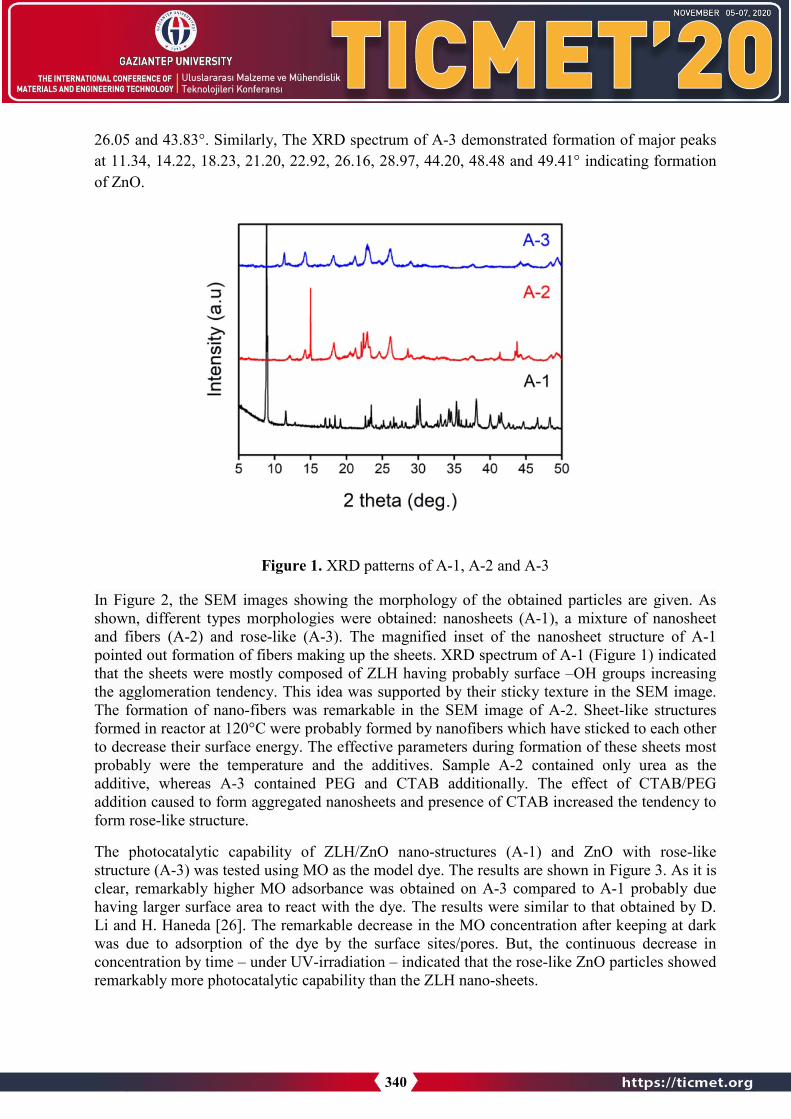
26.05 and 43.83°. Similarly, The XRD spectrum of A-3 demonstrated formation of major peaksat 11.34, 14.22, 18.23, 21.20, 22.92, 26.16, 28.97, 44.20, 48.48 and 49.41° indicating formation of ZnO.
Figure 1. XRD patterns of A-1, A-2 and A-3
In Figure 2, the SEM images showing the morphology of the obtained particles are given. As shown, different types morphologies were obtained: nanosheets (A-1), a mixture of nanosheet and fibers (A-2) and rose-like (A-3). The magnified inset of the nanosheet structure of A-1 pointed out formation of fibers making up the sheets. XRD spectrum of A-1 (Figure 1) indicated that the sheets were mostly composed of ZLH having probably surface –OH groups increasing the agglomeration tendency. This idea was supported by their sticky texture in the SEM image. The formation of nano-fibers was remarkable in the SEM image of A-2. Sheet-like structures formed in reactor at 120°C were probably formed by nanofibers which have sticked to each other to decrease their surface energy. The effective parameters during formation of these sheets most probably were the temperature and the additives. Sample A-2 contained only urea as the additive, whereas A-3 contained PEG and CTAB additionally. The effect of CTAB/PEG addition caused to form aggregated nanosheets and presence of CTAB increased the tendency to form rose-like structure.
The photocatalytic capability of ZLH/ZnO nano-structures (A-1) and ZnO with rose-like structure (A-3) was tested using MO as the model dye. The results are shown in Figure 3. As it is clear, remarkably higher MO adsorbance was obtained on A-3 compared to A-1 probably due having larger surface area to react with the dye. The results were similar to that obtained by D. Li and H. Haneda [26]. The remarkable decrease in the MO concentration after keeping at dark was due to adsorption of the dye by the surface sites/pores. But, the continuous decrease in concentration by time – under UV-irradiation – indicated that the rose-like ZnO particles showed remarkably more photocatalytic capability than the ZLH nano-sheets.
340

Figure 2. SEM images of a) A-1, b) A-2 and c) A-3
Figure 3. MO dye adsorption of a) ZLH nano-sheets and b) rose-like ZnO particles.
341

Using a similar approach, BSA protein adsorbance of the nano-sheets and rose-like ZnOparticles was tested. The results are displayed in Figure 4. None of the particles showed tendency to attract proteins; the absorbance at 280 nm did not decrease by time. On the contrary, the lightabsorbance in the UV-spectrum (200-320 nm) increased due to release of additional species to the solution.
Figure 4. Protein adsorbance of A-1 and A-3 up to 24h
Characterization and testing of composites:
The characterization results and photocatalytic degradation tests demonstrated that A-1 nano-sheets provided less photocatalytic capability under dark and after UV-irradiation. The sheets composed less surface defects/pores but -OH groups which resulted in not only little or no protein adsorbance but also high surface area to react with a surrounding polymer matrix. Therefore, A-1 nanosheets were chosen to be reinforced in dental resins, in which degradation resistance and mechanical interlocking at the matrix-filler interface was critically important.
In Figure 5, the water sorption and solubilities of 2 wt. %, 4 wt. % and 8 wt. % A-1 reinforced (A-1; ZnO/ZLH nanosheets) composites are shown. Results showed that increasing of A-1 content, sorption of water and solubility increased. It was possibly because of the -OH functionalization and correspondingly, the agglomeration tendency of ZLH nanosheets increasing in the UDMA-TEGDMA matrix. After reaching 4 wt. %, sorption behavior altered. Both the water sorption and solubility were lower than 2-4 wt. % reinforced composites. The reason behind this behavior could be related to the formation of a ZnO/ZLH nanosheet network inside the matrix. Their microhardness values were similar to that of unreinforced UDMA-TEGDMA resin. But the highest average VHN was observed after 4 wt. % reinforcement.
342
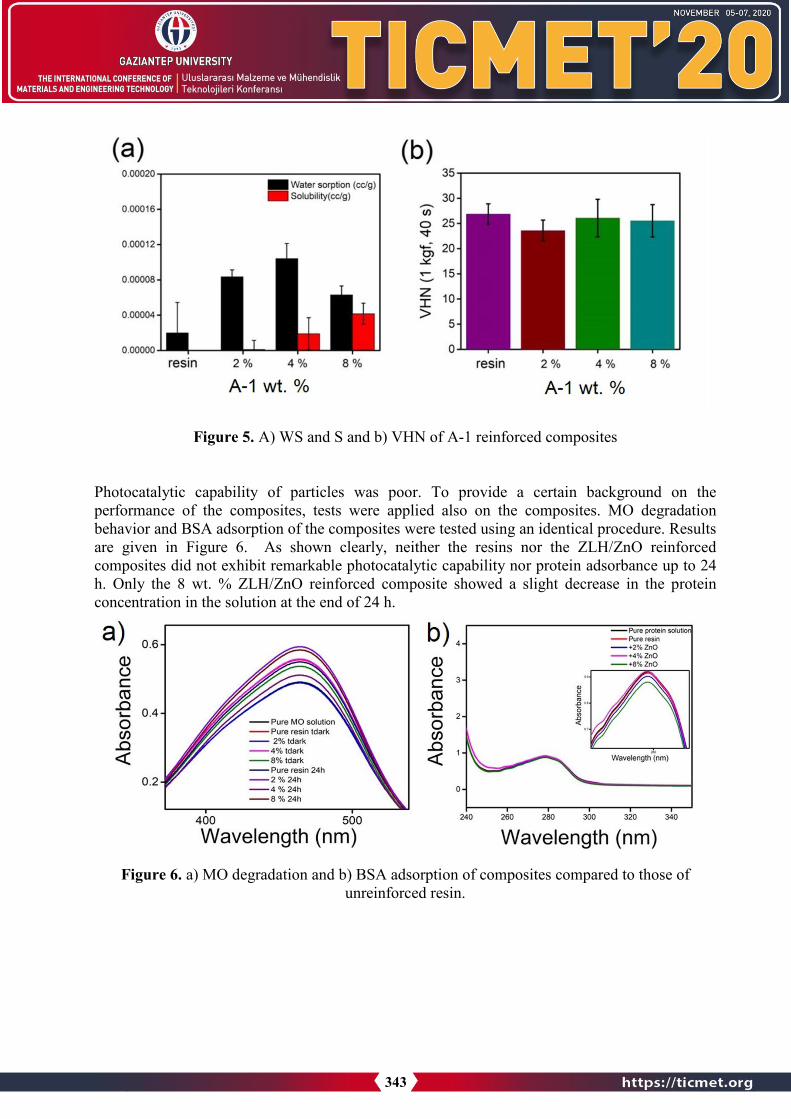
Figure 5. A) WS and S and b) VHN of A-1 reinforced composites
Photocatalytic capability of particles was poor. To provide a certain background on the performance of the composites, tests were applied also on the composites. MO degradation behavior and BSA adsorption of the composites were tested using an identical procedure. Results are given in Figure 6. As shown clearly, neither the resins nor the ZLH/ZnO reinforced composites did not exhibit remarkable photocatalytic capability nor protein adsorbance up to 24 h. Only the 8 wt. % ZLH/ZnO reinforced composite showed a slight decrease in the proteinconcentration in the solution at the end of 24 h.
Figure 6. a) MO degradation and b) BSA adsorption of composites compared to those of unreinforced resin.
343

4. Conclusions
Results indicated that using a sol-gel approach, ZLH/ZnO nanosheets and using a hydrothermalapproach containing CTAB/PEG additives, rose-like ZnO particles could be obtained at moderate reaction temperatures. Since the amount of ZLH nano-sheets in A-1 was higher than crystallized ZnO, did not show photocatalytic capability. However, increasing their concentration in the resin matrix resulted in increased VHN with almost no protein attraction.Results indicate that, after optimization of the structural properties and their amount, thesematerials can act as promising alternatives to current resin fillers which require decreased protein affinity with increased mechanical performance.
Acknowledgments:Authors would like to thank TUBITAK for partially funding the work under the Project Number118M195.
References: 1. Chen, M-H. "Update on dental nanocomposites." Journal of dental research 89.6 (2010): 549-
560.2. Dhoke, Shailesh K., Rohit Bhandari, and A. S. Khanna. "Effect of nano-ZnO addition on the
silicone-modified alkyd-based waterborne coatings on its mechanical and heat-resistanceproperties." Progress in Organic Coatings 64.1 (2009): 39-46.
3. Ardu, S., Gutemberg, D., Krejci, I., Feilzer, A. J., Di Bella, E., & Dietschi, D. (2011).Influence of water sorption on resin composite color and color variation amongst variouscomposite brands with identical shade code: an in vitro evaluation. Journal of dentistry, 39,e37-e44.
4. Wirunmongkol, Thanakorn, O. Narongchai, and SorapongPavasupree. "Simple hydrothermalpreparation of zinc oxide powders using Thai autoclave unit." Energy Procedia 34 (2013):801-807.
5. Lu, Chung-Hsin, and Chi-Hsien Yeh. "Influence of hydrothermal conditions on themorphology and particle size of zinc oxide powder." Ceramics International 26.4 (2000):351-357.
6. Hojati, Sara Tavassoli, et al. "Antibacterial, physical and mechanical properties of flowableresin composites containing zinc oxide nanoparticles." Dental materials 29.5 (2013): 495-505.
7. Huang, K. S., Nien, Y. H., Chen, J. S., Shieh, T. R., & Chen, J. W. (2006). Synthesis andproperties of epoxy/TiO2 composite materials. Polymer composites, 27(2), 195-200.
8. Huneau, Bertrand, et al. "Fatigue crack initiation in a carbon black–filled naturalrubber." Rubber Chemistry and Technology 89.1 (2016): 126-141.
9. Wahab, Rizwan, et al. "The role of pH variation on the growth of zinc oxidenanostructures." Applied Surface Science 255.9 (2009): 4891-4896.
344
10. Li, Wen‐Jun, Er‐Wei Shi, and Tsuguo Fukuda. "Particle size of powders under hydrothermalconditions." Crystal Research and Technology: Journal of Experimental and IndustrialCrystallography 38.10 (2003): 847-858.
11. Xu, Linping, et al. "ZnO with different morphologies synthesized by solvothermal methodsfor enhanced photocatalytic activity." Chemistry of Materials 21.13 (2009): 2875-2885.
12. Yiamsawas, Doungporn, Kanittha Boonpavanitchakul, and Wiyong Kangwansupamonkon."Preparation of ZnO nanostructures by solvothermal method." Journal of Microscopy societyof Thailand 23.1 (2009): 75-78.
13. Zhang, Hui, et al. "Synthesis of flower-like ZnO nanostructures by an organic-freehydrothermal process." Nanotechnology 15.5 (2004): 622.
14. Zhao, M.; Wu, D.; Chang, J.; Bai, Z.; Jiang, K. Synthesis of cup-like ZnO microcrystals via aCTAB-assisted hydrothermal route. Mater. Chem. Phys. 2009, 117, 422–424.
15. Feng, Y.; Zhang, M.; Guo, M.; Wang, X. Studies on the PEG-assisted hydrothermalsynthesis and growth mechanism of ZnO microrod and mesoporous microsphere arrays onthe substrate. Cryst. Growth Des. 2010, 10, 1500–1507.
16. Usui, H. The effect of surfactants on the morphology and optical properties of precipitatedwurtzite ZnO. Mater. Lett. 2009, 63, 1489–1492.
17. Ramimoghadam, Donya, MohdZobir Bin Hussein, and Yun Hin Taufiq-Yap. "The effect ofsodium dodecyl sulfate (SDS) and cetyltrimethylammonium bromide (CTAB) on theproperties of ZnO synthesized by hydrothermal method." International journal of molecularsciences 13.10 (2012): 13275-13293.
18. Zhou, Xingfu, et al. "Mechanistic investigations of PEG-directed assembly of one-dimensional ZnO nanostructures." The Journal of Physical Chemistry B 110.51 (2006):25734-25739.
19. Zhou, X. F.; Hu, Z. L.; Fan, Y. Q.; Chen, S.; Ding, W. P.; Xu, N. P. J. Phys. Chem. C 2008,112, 11722–11728
20. Zeng, Yi, et al. "Synthesis and ethanol sensing properties of self-assembled monocrystallineZnO nanorod bundles by poly (ethylene glycol)-assisted hydrothermal process." The Journalof Physical Chemistry C 113.9 (2009): 3442-3448.
21. Shi, Xixi, et al. "Zn (II)-PEG 300 globules as soft template for the synthesis of hexagonalZnO micronuts by the hydrothermal reaction method." Langmuir 25.10 (2009): 5940-5948.
22. Khoshhesab, Zahra Monsef, Mohammad Sarfaraz, and Zari Houshyar. "Influences of Ureaon Preparation of Zinc Oxide Nanostructures Through Chemical Precipitation in AmmoniumHydrogencarbonate Solution." Synthesis and Reactivity in Inorganic, Metal-Organic, andNano-Metal Chemistry 42.10 (2012): 1363-1368.
23. He, Qiaohong, and Hengwu Chen. "Flow injection spectrophotometric determination ofanionic surfactants using methyl orange as chromogenic reagent." Fresenius' journal ofanalytical chemistry 367.3 (2000): 270-274.
24. Singh, Suman, et al. "Conjugation of nano and quantum materials with bovine serumalbumin (BSA) to study their biological potential." Journal of luminescence 141 (2013): 53-59.
345

25. Saifullah, Bullo, et al. "Development of a highly biocompatible antituberculosis nanodeliveryformulation based on para-aminosalicylic acid—zinc layered hydroxidenanocomposites." The Scientific World Journal 2014 (2014).
26. Li, Di, and Hajime Haneda. "Morphologies of zinc oxide particles and their effects onphotocatalysis." Chemosphere 51.2 (2003): 129-137.
346

STRUCTURE AND PROPERTIES OF CuAl10Ni5Fe4 ALLOY POWDERS PRODUCED BY MELT SPINNING COMPARED WITH INGOT
SEFA EMRE SÜNBÜL 1,2, KÜRŞAT İÇİN 1, ABDURRAHİM METOĞLU 3, DAMLA DİLARA ÇAKIL 1, FURKAN ALPTEKİN *,1, SULTAN ÖZTÜRK 1
1 Karadeniz Technical University, Engineering Faculty, Metallurgical and Materials Engineering Department, Trabzon, TURKEY.
2 Gaziantep University, Engineering Faculty, Metallurgical and Materials Department, Gaziantep, TURKEY. 3 Kartek Metalurji, Has Industry Area, İstanbul, TURKEY.
Abstract
In the present study, CuAl10Ni5Fe4 (wt.% Al-10, Ni-5, Fe-4.8, Mn-1.5, and Cu-balance) alloy powders were successfully produced using the planar flow casting method, known as the continuous ribbon production process. To this goal, the smooth type of wheel surface waschanged with a textured one, and the liquid metal was atomized by means of teeth formed on the wheel surface. The microstructures, phase properties, and thermal properties of as-cast CuAl10Ni5Fe4 alloy and produced powders were characterized using SEM and XRD techniques. The microstructures of CuAl10Ni5Fe4 alloy powders produced by the textured wheel involved Widmanstatten α, proeutectoid α, and β′ martensite phases. The microstructure ofthe powders, in case of the textured wheel, consisted of β′ martensite, which resides inside the colonies, and the proeutectoid α phase at the colony boundaries.
Keyword: Melt spinning, nickel aluminum bronze, CuAl10Ni5Fe4, copper aluminum alloy, rapid solidification, powder production
1. IntroductionCuAl10Ni5Fe4, which is known nickel-aluminum bronze (NAB), is a copper-based alloy thatcontains 9–12 wt.% aluminum, up to 6 wt.% of nickel and iron elements [1-3]. It has thecombination of outstanding mechanical, excellent machinability, and castability, which makethem good candidates for many application areas [4, 5]. In this context, the nickel-aluminumbronzes are widely used in chemical plants, marine industries, architecture and oil sectors,aviation, and bearing systems. During the marine applications such as ship propellers, pumps,underwater fasteners, marine engine shafts, ship valves and fittings, pump shafts, and seawaterpumps, the nickel-aluminum bronze exhibits exceptional resistance to seawater corrosion [5-7].Also, many engineering parts such as various gears, parts of bearings, dies and valves,engineering tools, bushings, guide plates, etc. are made of this alloy [8]. Each element in nickelaluminum bronze adds different properties to the alloy. Increasing aluminum content provideshigher strength and enhances casting and hot-working properties [9, 10]. While iron alters themicrostructure by acting as a grain refiner and increases tensile strength, nickel improvescorrosion resistance [4].
347
The cast microstructure of CuAl10Ni5Fe4 alloy presents a mixture of Cu-rich α solid solution (FCC crystal structure), β solid solution (BCC crystal structure), and intermetallic κ phases [11-14]. Under equilibrium conditions, the β phase is initially shaped in the transformation process from the liquid state to solid-state, and it is considered as a high-temperature solid phase [13]. In the continuation of the cooling process, the α phase is formed from the β phase around 1030 ºC [15]. The α phase represents the matrix structure and has coarse grains with a Widmanstätten morphology [16]. In addition to α and β phases, several types of inter-metallic kappa phases (κ) are formed in the microstructure at various temperatures. These intermetallic phases mostly consist of Fe, Al, and Ni elements and are classified as κI, κII, κIII, and κIV [17]. The κI consists of Fe rich Fe3Al phase with DO3 cubic structure and exhibits large dendrite-shape particle microstructure. The κII phase has a similar composition and structure with κI phase and displaysdendritic rosette-shaped particle morphology. The NiAl-based intermetallic κIII phase has a cubic (bcc) B2 crystal structure with finger-like eutectoid morphology. The Fe3Al κIV phase has the highest Fe content among the κ phases and appears plate-like small precipitates uniformly distributed within the α-matrix [9, 11]. Given the fact that the mechanical and tribological properties of any alloy depend on the type, amount, and morphology of the phases, as well as the sizes of precipitates, the coarse-grained (α phase) microstructure of the NAB alloy leads to decreased mechanical properties [10, 16]. Although the subsequent heat treatments, such as solid solution and aging, control the sizes and distribution properties of the precipitates, the segregated cast structure of the alloy limits its broad applications. Instead of β→α transformation, happening in slow cooling conditions, the β phase may undergo a martensitic transformation, and the β’ martensite phase can be obtained, depending on the cooling rate [7]. The β’ martensite is a very hard and brittle phase and enhances the strength and tribological properties of the alloy [18, 19]. The rapid solidification process of planar flow casting (PFC) was found to be an effective way to get finer microstructure and a right combination of mechanicaland tribological properties. The fine microstructure, reduced levels of segregation, higher mutualsolubility in the solid-state, and in some cases, the formation of metastable crystalline and amorphous phases are some of the advantages of the planar flow casting process [20]. In the PFCmethod, the molten metal is fed from the crucible through a slit nozzle by applying inert gas pressure on a rotating chill-wheel made of copper [21, 22]. The liquid metal is accumulated as melt puddle as soon as it comes into contact with the wheel surface, and it is dragged out as a thin layer and rapidly solidifies in the form of a continuous ribbon or ribbon-like product [23, 24]. If the wheel surface is roughened or textured, a stable liquid metal layer is not formed, andthe liquid metal is disintegrated into small droplets by the centrifugal force of the wheel. In otherwords, the centrifugal atomization mechanism takes place, and powder material, instead of continuous ribbon is produced as a result of this process [25]. To the best of the authors' knowledge, the powder production studies by using the textured wheel in the PFC method have not been reported in the literature.
In this study, different from conventional PFC method, which generates continuous ribbons, the production of CuAl10Ni5Fe4 alloy powders with the same method was successfully carried out. To this goal, the smooth type of wheel surface was changed with a textured one, and the liquid metal was atomized by means of teeth formed on the wheel surface. The cooling effect of the wheel on the structural and physical properties of the rapidly solidified powders was determined.
348
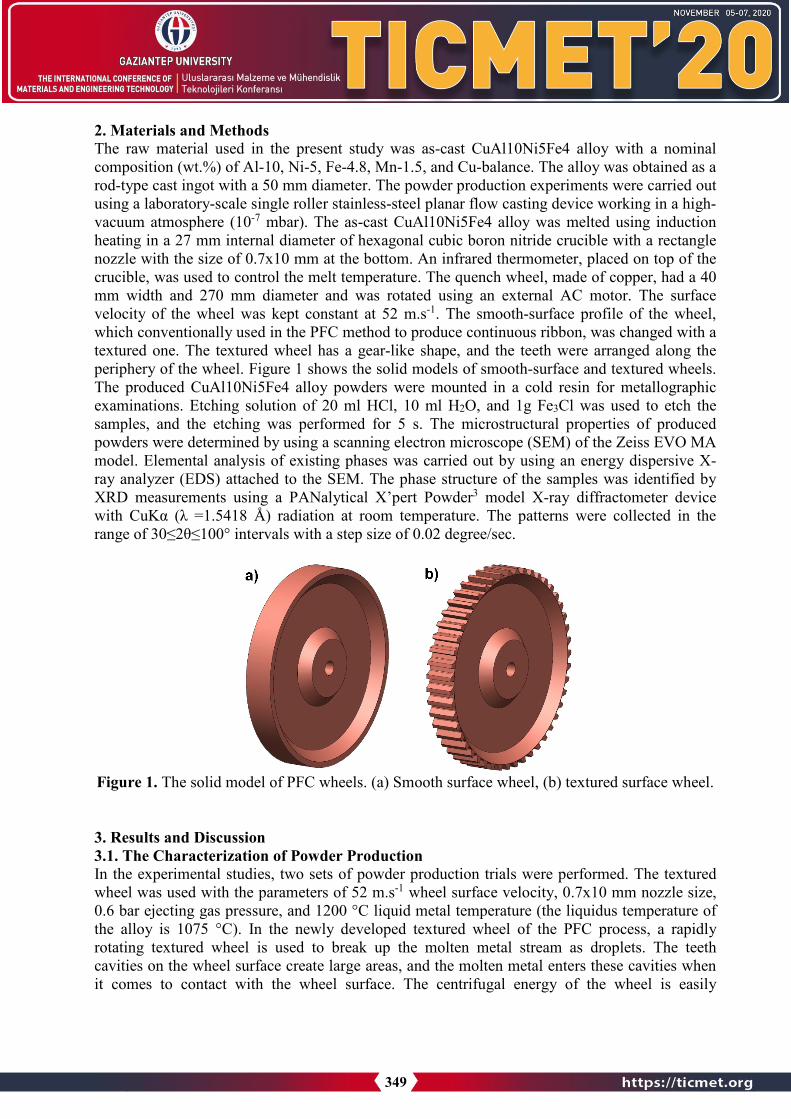
2. Materials and Methods The raw material used in the present study was as-cast CuAl10Ni5Fe4 alloy with a nominal composition (wt.%) of Al-10, Ni-5, Fe-4.8, Mn-1.5, and Cu-balance. The alloy was obtained as a rod-type cast ingot with a 50 mm diameter. The powder production experiments were carried out using a laboratory-scale single roller stainless-steel planar flow casting device working in a high-vacuum atmosphere (10-7 mbar). The as-cast CuAl10Ni5Fe4 alloy was melted using induction heating in a 27 mm internal diameter of hexagonal cubic boron nitride crucible with a rectangle nozzle with the size of 0.7x10 mm at the bottom. An infrared thermometer, placed on top of the crucible, was used to control the melt temperature. The quench wheel, made of copper, had a 40 mm width and 270 mm diameter and was rotated using an external AC motor. The surface velocity of the wheel was kept constant at 52 m.s-1. The smooth-surface profile of the wheel, which conventionally used in the PFC method to produce continuous ribbon, was changed with a textured one. The textured wheel has a gear-like shape, and the teeth were arranged along the periphery of the wheel. Figure 1 shows the solid models of smooth-surface and textured wheels. The produced CuAl10Ni5Fe4 alloy powders were mounted in a cold resin for metallographic examinations. Etching solution of 20 ml HCl, 10 ml H2O, and 1g Fe3Cl was used to etch the samples, and the etching was performed for 5 s. The microstructural properties of produced powders were determined by using a scanning electron microscope (SEM) of the Zeiss EVO MA model. Elemental analysis of existing phases was carried out by using an energy dispersive X-ray analyzer (EDS) attached to the SEM. The phase structure of the samples was identified by XRD measurements using a PANalytical X’pert Powder3 model X-ray diffractometer device with CuKα (λ =1.5418 Å) radiation at room temperature. The patterns were collected in the range of 30≤2θ≤100° intervals with a step size of 0.02 degree/sec.
Figure 1. The solid model of PFC wheels. (a) Smooth surface wheel, (b) textured surface wheel.
3. Results and Discussion3.1. The Characterization of Powder ProductionIn the experimental studies, two sets of powder production trials were performed. The texturedwheel was used with the parameters of 52 m.s-1 wheel surface velocity, 0.7x10 mm nozzle size,0.6 bar ejecting gas pressure, and 1200 °C liquid metal temperature (the liquidus temperature ofthe alloy is 1075 °C). In the newly developed textured wheel of the PFC process, a rapidlyrotating textured wheel is used to break up the molten metal stream as droplets. The teethcavities on the wheel surface create large areas, and the molten metal enters these cavities whenit comes to contact with the wheel surface. The centrifugal energy of the wheel is easily
349

transferred to the molten metal, and consequently, the atomization takes place by the mechanism of strong adherence of the molten metal to the wheel surface. Break-up stages of the molten metal stream into fragments, ligaments, and subsequently, to solid powders were modelled in Figure 2. When the molten metal comes into contact with the rotating wheel surface, it is primarily broken up as liquid metal fragments with the kinetic energy of teeth on the wheel surface (stage 1 and stage 2). As the fragments fly in the air, they evolve to ligaments with thesubsequent disintegration step (stage 3), and finally, the ligaments contract into spherical particles before solidification (stage 4) [26, 27].
Figure 2. The model of the break-up process of liquid metal streams into droplets by the textured wheel in the PFC method.
The morphological SEM images of produced powders for different sieve fractions and the powder size distribution graphics were presented in Figure 3. The powder size distribution graphics were created with the Image J software analysis program. As can be seen from the figure, the sieve fractions exhibited a unimodal particle size distribution behavior. The produced powders displayed a spherical morphology, irrespective of particle size. In addition to spherical powders, a tiny amount of ligament shaped powders was also obtained. Since the particle size was relatively large, the agglomeration of fine particles due to a strong cohesive force between powders was not observed to occur. However, as the powder size increases, small satellite particles were seen to adhere to the surface of large particles. The satelliteization phenomena are known as the adherence of small powders over larger ones. The satellites were produced by impingement of solidified fine particles over the coarse molten or semi-molten particles during the flight period of the atomized particles in the air. Since larger particles need more time to solidify, the already solidified finer particles easily stick to the surface of large particles, which are in the semi-solid or mushy state [28].
350
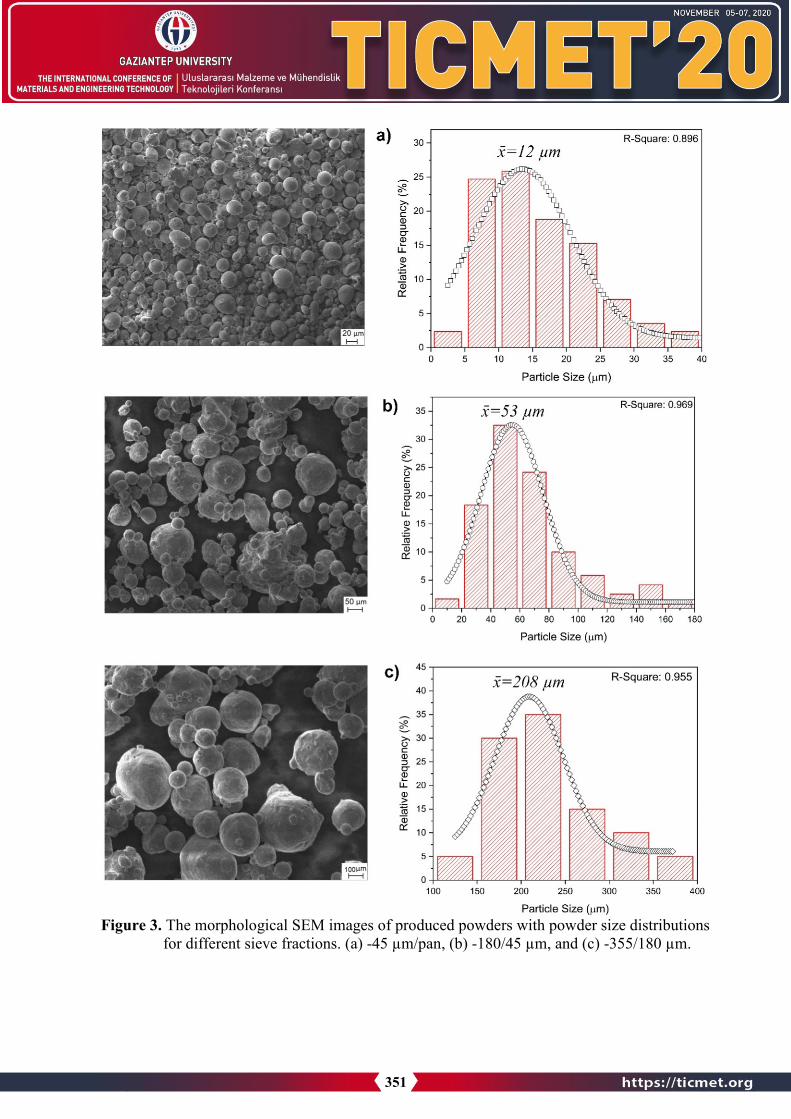
Figure 3. The morphological SEM images of produced powders with powder size distributions for different sieve fractions. (a) -45 µm/pan, (b) -180/45 µm, and (c) -355/180 µm.
351

3.2. Structural Characterization of Ingot and Powder CuAl10Ni5Fe4 Alloy The Cu-Al alloys containing higher than 9.4% Al solidify as single-phase of β, which has a body-centered cubic crystal structure. With the slow cooling conditions, Cu-rich α solid solution is formed from the β phase. As the temperature decreases further, the residual β phase experiences eutectoid reaction (β → α+γ) at 570 ℃ and the room temperature microstructure of the alloy consists of α+γ phases. The γ phase adversely affects the mechanical and corrosive properties of the alloy. New alloying elements such as Ni and Fe are added to the Cu-Al alloy toprevent the forming of the γ phase. It has been demonstrated that Ni and Fe elements expand theα phase field and ensures the precipitation of intermetallic κ phases, which improve the mechanical and corrosive properties of the alloy [29]. The SEM microstructure of as-cast CuAl10Ni5Fe4 alloy, as well as the EDS analyzes of each phase, were presented in Figure 4. Ascan be seen from the figure, the as-cast microstructure of the alloy consists of light grey α-Cu phase, which has FCC crystal structure, and the intermetallic precipitates (κ phases), which are a combination of Fe3Al and NiAl phases. The β phase was not observed at room temperature microstructure. The relatively slow cooling of the alloy was reflected by the coarse microstructure, and the β’ martensite phase was not observed. The κ phases had differentmorphologies and were located differently in the α-copper matrix microstructure. As stated in the literature, the κ phases increase the mechanical strength of the CuAl10Ni5Fe4 alloy without a decrease in ductility [30]. Among the κ phases, the globular type of κıı intermetallic particles wasclearly seen in the microstructure and unevenly distributed at the α-Cu matrix phase. Asignificant amount of lamellar type κııı precipitates which were described as being nickel-rich phase (based on NiAl) and considered to be eutectoid reaction product, were distinguished in the SEM microstructure. Fine precipitates of κıv intermetallics, which have the highest Fe content among the κ phases and distributed within the α phase, were also identified in the as-cast structure of the alloy. This phase appears in a smaller quantity. From the SEM microstructure, itcan be easily noted that the κıı particles are significantly larger than κıv. This is explained interms of growth temperature differences in both phases. As stated in the literature [2, 13, 14], the precipitation start temperatures of κıı, and κıv phases were specified as 900 °C and 850 °C, respectively. Since the κıı phase is formed at a higher temperature, there will be much moresolute atoms (such as Al, Fe, and Ni) available in the growth of the κıı phase than there will be for κıv phase. This leads the κıı grains to be larger than κıv grains.
The presence of intermetallic kappa (κ) phases in the as-cast structure of the CuAl10Ni5Fe4 alloy is shown in Figure 4 by EDS analysis. The elemental compositions of α, κıı, κııı, and κıv phases, established in the literature, were given in Table 1. Also, the corresponding EDS analysis results of the same phases obtained in this study were presented in Table 1. for comparison purposes. The results confirm the presence of the α, κıı, κııı, and κıv phases in the microstructure of as-cast CuAl10Ni5Fe4 alloy. As evidenced in Table 1, it is found that the α phase yielded a composition (wt%) of 83.9 Cu, 8.32 Al, 3.28 Fe, and 2.16 Ni. The nominal composition of the α phase established in the literature (wt%) [1, 31] was 85.40 Cu, 8.30 Al, 2.70 Fe, and 2.50 Ni. The content of the α-Cu phase given in the literature corresponds approximately to the experimental values found in this study. Also, the experimental results for κıı, κııı, κıv phases were found very close to those given in the literature. For example, the Cu, Al, Fe, and Ni compositions (wt.%) for κııı phase were obtained as 27.28, 18.90, 22.93, and 2.51, respectively. In literature, the Cu, Al, Fe, and Ni percentages for κııı phase were established as 26.00, 18.00, 22.00, and 32.00, respectively. On the other hand, Mn appears in all EDS results because Mn exists in the as-cast
352

alloy. However, the content of Mn is a small amount (1.5 wt.%); therefore, the content of Mn was not taken into consideration in the evaluation of the phases.
Figure 4. The SEM microstructure of as-cast CuAl10Ni5Fe4 alloy with EDS analysis of each phase.
353

Table.1. Comparison of experimentally obtained phase contents with the values established in the literature for the CuAl10Ni5Fe4 alloy.
Phases Cu Al Fe Ni Mn References
Ingot α 85.4±4 8.3±1.7 2.7±2 2.5±1.4 1.4±0.1 [1, 31]
83.97±2.5 8.32±0.5 3.28±0.5 2.16±0.3 1.41±0.2 Experimentally obtained
κII 21±5 19±3 32±3 27±4 2.2±0.6 [1, 31]
27.73±13.4 19.98±0.5 32.38±1.9 16.89±5.8 3.02±0.6 Experimentally obtained
κIII 26±4 18±6 22±0.7 32±2 2±0.3 [1, 31]
27.28±1.2 18.90±0.7 22.93±0.8 27.51±1.5 3.38±0.3 Experimentally obtained
κIV 13±1 20±3 62±4 4±1 1.5±0.3 [1, 31]
10.92±0.8 18.02±0.5 63.53±2.1 5.35±0.5 2.18±0.4 Experimentally obtained
Rapidly solidified powders
Martensite β’ 78.4 10.6 4.0 5.8 1.2 [32]
79.38±2.5 7.12±0.4 4.88±0.3 5.68±0.4 2.94±0.3 Experimentally obtained
α 84.2 7.5 3.6 3.7 1.0 [32]
Proeutectoid 83.6±2.9 7.14±0.5 4.07±0.5 4.88±0.3 0.23±0.1 Experimentally obtained
Widmanstatten 83.44±4.1 7.23±0.7 3.57±0.4 4.11±0.4 1.65±0.3 Experimentally obtained
The SEM microstructures of CuAl10Ni5Fe4 alloy powders produced by the textured wheel with the magnified images of selected areas were presented in Figure 5. As can be seen, there are three distinctly different phases of Widmanstatten α, proeutectoid α, and β′ martensite. Any type of κ phase was not detected in the microstructures of the powders. It seems that the rapid solidification of powders with the PFC method suppressed the precipitation of any type of κ phase. When compared with the as-cast form, it can be seen that quite different microstructures were obtained. In this context, the overall microstructures of the powders were finer, and the high cooling rate of the PFC method led to the development of fine-grained Widmanstatten α and β′ martensite phases. The Widmanstatten α phase can be observed in coarse grains, the proeutectoid α exhibits a continuous form, and β′ martensite shows small size grains. Both proeutectoid α and Widmanstatten α phases display light grey color. The β′ martensitic platelets can be observed in darker regions. The Widmanstatten α and β′ grains are surrounded by larger entities called colonies. The colonies were hexagonally shaped, and their size increased with increasing particle size. The average colony sizes for 70 µm, 124 µm, and 241 µm powders were measured as 8 µm, 19 µm, and 30 µm, respectively. The colony boundaries were formed by the proeutectoid α phase with its continuous form. The morphology of the Widmanstatten α platelets exhibits lath (long and thin plates) and needle-like (lenticular) or plate-like appearances, and they significantly coarsened with increasing particle size. The thickness of the Widmanstatten α
354

platelets was measured as 0.24 µm, 0.65 µm, and 1.02 µm for 70 µm, 124 µm and 241 µm size powders, respectively. Furthermore, in some powders, the Widmanstatten α grains inside the colonies are established side by side and aligned parallel to one another. However, in most colonies, these α grains are oriented in different directions. The thickness and length of the β′ martensite grains were found to be very small when compared to the Widmanstatten α and proeutectoid α grains.
Figure 5. The SEM microstructures of different sizes of CuAl10Ni5Fe4 alloy powders produced by the textured wheel; on the left cross-section microstructures; on the right, the magnified
images of white rectangle areas.
The elemental distributions of the proeutectoid α, β′ martensite, and Widmanstatten α phases were identified by virtue of EDS analysis, and the results were given in Figure 6. Also, the obtained results were displayed in Table 1, together with the values established in the literature
355

for comparison purposes. As illustrated in Figure 6, the EDS analysis of the proeutectoid α phase yielded a composition (wt.%) of 83.60 Cu, 7.14 Al, 4.07 Fe, and 4.88 Ni. In the literature, the proeutectoid α phase composition was given as 84.20 Cu, 7.50 A1, 3.60 Fe, and 3.70 Ni. Whencompared with those given in the literature, the experimentally found values verify the presence of the proeutectoid α phase. For the β′ martensite phase, the similar results were obtained. As shown in Figure 6, the EDS of the β′ martensite phase consisted (wt.%) of 79.38 Cu, 7.12 A1, 4.88 Fe, and 5.68 Ni. The values given in the literature for the same phase were as follows: 78.40 Cu, 10.6 A1, 4.00 Fe, and 5.80 Ni. The very close results confirm the presence of the β′ martensite phase in the microstructure.
Figure 6. EDS analysis of CuAl10Ni5Fe4 alloy powders produced by textured wheel.
3.3. XRD Studies of Ingot and Powders CuAl10Ni5Fe4 Alloy Figure 7 shows the XRD pattern of as-cast CuAl10Ni5Fe4 alloy obtained at room temperature.. From the XRD results, the peaks present in the structure were identified as the α-Cu solid solution (matrix phase), and intermetallic κıı, κııı, κıv precipitates. This result is consistent with the SEM given in Figure 4. The high-indexed α-Cu peaks were detected at (2θ) 42.97º, 49.98º, 73.26º, 88.58º, 93.63º diffraction angles, and corresponding (hkl) (111), (020), (021), (131), and (222) planes, respectively. The intermetallic κıı, κııı, κıv phases were detected at seven differentpeaks, and the diffraction angles of these peaks were found very close to each other. Both the α-Cu and intermetallic κ phases exhibited a cubic crystal structure. The crystal size of α-Cu and κphases, based on the cubic crystal structure, was determined according to the following equation[21]
1𝑑𝑑2
=ℎ2 + 𝑘𝑘2 + 𝑙𝑙2
𝑎𝑎2(1)
356

Where d is the space between the planes, (hkl) are Miller indexes, and a is the lattice parameter. From this equation, the crystal size of α-Cu, κıı, κııı, and κıv phases were obtained as 17.2 nm, 89.7 nm, 20.2 nm, and 29.9 nm, respectively.
Figure 7. XRD patterns of as-cast CuAl10Ni5Fe4 alloy.
Figure 8 illustrates the XRD patterns of CuAl10Ni5Fe4 alloy powders produced by textured wheels. When considering Figure 8, the XRD results confirm that textured wheel powders have the presence of β’ martensite phase with maximum diffraction peaks and the α-Cu phase peaks. The β’ martensite has an 18 R1 monocyclic crystal structure, while the α-Cu phase is tetragonal structure. We can conclude that the existence of maximum β’ diffraction peaks confirms that the microstructure of powders overwhelmingly consists of the martensite phase. In this sense, the obtained XRD results were found to be consistent with the SEM microstructures given in Figure 6. On the other hand, the intermetallic κ phase peaks, which were present in the as-castmicrostructure of the alloy, were not detected in the XRD patterns of powders.Based on the tetragonal crystal structure of α-Cu phase for textured wheel powders werecalculated by using the following equation:
1𝑑𝑑2
=ℎ2 + 𝑘𝑘2
𝑎𝑎2+𝑙𝑙2
𝑐𝑐2(2)
Where d is the space between the planes, (hkl) are Miller indexes, (a and c) are the axis lengths. Compared with the as-cast structure, it has been observed that the properties of the powders obtained with the use of the PFC method have changed significantly. It is well known that among the rapid solidification techniques, the PFC process is one of the most prominent methods that can significantly modify the materials’ structure. The formation of novel metastable
357

crystalline phases, excellent homogeneity of microstructure due to the extremely low level of segregation, refinement of microstructure such as the size and shape of grains, and the shape and location of the phases present are some of the advantages achieved by the PFC method. The crystal size of the α-Cu phase for as-cast CuAl10Ni5Fe4 alloy was found to be 17.2 nm, and it decreased to 15.3 nm for powders produced by textured wheel.
Figure 8. XRD patterns of CuAl10Ni5Fe4 alloy powders produced by textured wheel.
4. Conclusions: Rapidly solidified CuAl10Ni5Fe4 alloy powders have been produced by using the planar flow casting (PFC) method. To this goal, the smooth type of wheel surface was changed with a textured one, and the liquid metal was atomized by means of teeth formed on the wheel surface. The morphology, phase structure, and thermal properties of produced powders were investigated.Also, the textured wheel got finer microstructure of the alloy. The outcomes of the investigation can be summarized as follows: 1. Produced powders exhibited a spherical morphology, irrespective of particle size. Since the
particle size was relatively large, the agglomeration of fine particles due to a strong, cohesiveforce between powders was not observed to occur. As powders get larger, small satelliteparticles were seen to adhere to the surface of large particles.
2. The shape and size of the powders produced using the textured wheel in PFC cannot becontrolled.
3. The as-cast microstructure of the CuAl10Ni5Fe4 alloy consisted of α matrix phase, andintermetallic precipitates of κıı, κııı, and κıv phases. The presence of α and κ phases wasconfirmed by EDS analyses.
4. The SEM microstructures of CuAl10Ni5Fe4 alloy powders produced by the textured wheelinvolved Widmanstatten α, proeutectoid α, and β′ martensite phases. The precipitation of anytype of κ phase was suppressed by the rapid solidification, and these phases were not detectedin the microstructures of powders.
5. Textured wheel causes a much finer microstructure. The microstructure of the powdersconsisted of β′ martensite, which resides inside the colonies, and the proeutectoid α phase atthe colony boundaries. The presence of α and β′ phases was confirmed by XRD analyses.
Acknowledgments: This present study was financially supported by The Scientific and Technological Research Council of Turkey (TUBITAK) (Grand Nos. #115M113).
358

References: 1. Hasan, F., et al., The morphology, crystallography, and chemistry of phases in as-cast nickel-
aluminum bronze. Metallurgical Transactions A, 1982. 13(8): p. 1337-1345.2. Yaseen, M.K., et al., Effect of Heat Treatment on Tribological Characteristics of
CuAl10Ni5Fe4 Nickel Aluminum Bronze. Key Engineering Materials, 2018. 778: p. 61-67.3. Heydarzadeh Sohi, M., et al., Liquid phase surface alloying of a nickel aluminum bronze
alloy with titanium. Surface and Coatings Technology, 2017. 325: p. 617-626.4. Nascimento, M.S., et al., Effects of Thermal Variables of Solidification on the
Microstructure, Hardness, and Microhardness of Cu-Al-Ni-Fe Alloys. Materials (Basel,Switzerland), 2019. 12(8): p. 1267.
5. Lv, Y., et al., Effect of post heat treatment on the microstructure and microhardness offriction stir processed NiAl bronze (NAB) alloy. Metals, 2015. 5(3): p. 1695-1703.
6. Huttunen-Saarivirta, E., et al., Tribocorrosion behaviour of aluminium bronze in 3.5 wt.%NaCl solution. Corrosion Science, 2018. 144: p. 207-223.
7. Brona, M.L.A.J.M.T., Influence of Heat treatment on the microstructure and mechanicalproperties of Aluminium bronze. Materials and Technology, 2014. 48(4): p. 599-604.
8. Shi, Z., et al., Unlubricated rolling-sliding wear mechanisms of complex aluminium bronzeagainst steel. Wear, 1996. 193(2): p. 235-241.
9. Wharton, J.A., et al., The corrosion of nickel–aluminium bronze in seawater. CorrosionScience, 2005. 47(12): p. 3336-3367.
10. Koçak, T.Ü., T. Özeren, and C.F. Arısoy. Effect of Ti Addition on Microstructure,Mechanical Properties and Wear Behavior of a Nickel Aluminum Bronze. in 19thInternational Metallurgy & Materials Congress. 2018. İstanbul, Turkey.
11. Nová, I., J. Machuta, and L. Raur, The influence of microalloying on the thermal treatment ofaluminum bronzes. Manufacturing Technology, 2017. 17(5): p. 797-804.
12. Anene, F.A., N.E. Nwankwo, and V.U. Nwoke, Effect of dopant and heat treatment on themicrostructure and mechanical properties of Nickel-Aluminum bronze. Metallurgical andMaterials Engineering, 2019. 25(2): p. 147-162.
13. Küçükömeroğlu, T., et al., Microstructural and Mechanical Properties of Friction StirWelded Nickel-Aluminum Bronze (NAB) Alloy. Journal of Materials Engineering andPerformance, 2016. 25(1): p. 320-326.
14. Zhao, B., et al., The grain refinement mechanisms of various phases in shot-peened Nickel-Aluminum bronze (NAB) alloy. Materials Characterization, 2018. 144: p. 77-85.
15. Lloyd, D.M., G.W. Lorimer, and N. Ridley, Characterization of phases in a nickel-aluminium bronze. Metals Technology, 1980. 7(1): p. 114-119.
16. Ni, D.R., et al., Inhomogeneous microstructure and mechanical properties of friction stirprocessed NiAl bronze. Materials Science and Engineering: A, 2009. 524(1): p. 119-128.
17. Pisarek, B., Model of Cu-Al-Fe-Ni Bronze Crystallization. Archives of Foundry Engineering,2013. 13(3): p. 72-79.
18. Brezina, P., Heat treatment of complex aluminium bronzes. International Metals Reviews,1982. 27(1): p. 77-120.
19. Ajeel, S., R. Yaseen, and A. Eqal, Microstructure And Mechanical Properties ofHomogenized Stir Casting Aluminum Bronze Alloys. Al-Qadisiyah Journal for EngineeringSciences, 2018. 11(3): p. 345-356.
20. Jassim, A.K. and A.S. Hammood, Single Roll Melt Spinning Technique Applied as aSustainable Forming Process to Produce Very Thin Ribbons of 5052 and 5083 Al-Mg AlloysDirectly from Liquid State. Procedia CIRP, 2016. 40: p. 133-137.
359

21. Öztürk, S., et al., Effect of heat treatment process on the structural and soft magneticproperties of Fe38Co38Mo8B15Cu ribbons. Journal of Non-Crystalline Solids, 2020. 527: p.119745.
22. Gögebakan, M., et al., Rapidly solidified Al–6.5 wt.% Ni alloy. Journal of MaterialsProcessing Technology, 2003. 142(1): p. 87-92.
23. Wilde, P.D. and E.F. Matthys, Experimental invstigation of the planar flow casting process:development and free surface characteristics of the solidification puddle. Materials Scienceand Engineering: A, 1992. 150(2): p. 237-247.
24. Öztürk, S., et al., Surface and structural characterization of amorphous Fe,Co-based melt-spun ribbons subjected to heat treatment processes. Journal of Non-Crystalline Solids, 2019.522: p. 119592.
25. Öztürk, S., et al., The Role of Wheel Surface Quality on Structural and Hard MagneticProperties of Nd–Fe–B Permanent Magnet Powders. Journal of Superconductivity andNovel Magnetism, 2018. 31(9): p. 3025-3041.
26. Lawley, A., Atomization of Specialty Alloy Powders. JOM, 1981. 33(1): p. 13-18.27. Li, H. and X. Deng, Prediction of powder particle size during centrifugal atomisation using
a rotating disk. Science and Technology of Advanced Materials, 2007. 8(4): p. 264-270.28. Gao, C.-f., et al., Characterization of spherical AlSi10Mg powder produced by double-nozzle
gas atomization using different parameters. Transactions of Nonferrous Metals Society ofChina, 2019. 29(2): p. 374-384.
29. Cuevas, A.M., Microstructure Characterization of Friction-stir Processed Nickel-AluminumBronze Through Orientation Imaging Microscopy, in Naval Postgraduate School. 2002,University of California: Los Angeles.
30. Barabash, V., A. Pokrovsky, and S. Fabritsiev, The effect of low-dose neutron irradiation onmechanical properties, electrical resistivity and fracture of NiAl bronze for ITER. Journal ofNuclear Materials, 2007. 367-370: p. 1305-1311.
31. Culpan, E.A. and G. Rose, Microstructural characterization of cast nickel aluminium bronze.Journal of Materials Science, 1978. 13(8): p. 1647-1657.
32. Howell, P.R., On The Phases, Microconstituents and Microstructures in Nickel-AluminumBronzes. 2000, Department of Materials Science and Engineering: McLean, Virginia, USA.p. 1-75.
360

SINTERING OF IRON POWDERS BY RESISTANCE HEATING TECHNIQUE
Adem KURT1, Fahrettin ATAR1
1Gazi University, Faculty of Technology, Metallurgy and Materials Engineering, Ankara, TURKEY
Abstract
In this study, powder metal samples of 15x15x4 mm dimensions of Fe powders were produced at different pressures (650,850,1050 MPa) and were sintered in atmospheric environment with the help of resistance sintering method applied for the first time using electric resistance welding.The sintered densities and green densities of the powder metal samples were determined and their sinterability in the unprotected environment was examined. In addition, the effects of electric resistance heating technique on sintering were investigated by performing hardness analysis and microscopic examination of sintered samples.
Keywords: Electric Resistance Spot Welding, Powder Metallurgy, Sintering
1. Introduction Powder metallurgy is the process of pressing very small particles together and binding them intoa whole. Nowadays, when cost and quality are the target, part production with powder metal techniques is becoming increasingly important. Importance of powder metallurgy; It is due to the fact that parts that are difficult or impossible to shape by casting, machining or plasticdeformation can be produced easily and economically in mass production by this method [1].
Although small pieces produced by powder metallurgy were found in Egypt in 3000 BC, its first important use was in 1920 as the production of tungsten-carbide cutting tools. After the Second World War, it took its place in technology as a new part production technique in modern terms. With the powder metal technique, some pieces with a maximum weight of 45 kg and a length of 500 mm can be produced. 70% of powder metallurgy products are used in the automotive industry, 12% in construction machinery, 5% in agricultural equipment and 13% in existing tools. However, its use in the production of aircraft industry, high-tech composites, electronic components, magnetic materials and cutting tools used in machining is rapidly increasing. The powder metal market in the world is growing 12% a year. The most commonly used metal powder is iron powder with 85%. Copper alloys come in second with 6-7% [2]. This production method, pure metals, alloys, carbon, ceramics and plastic materials in the form of fine particles are formed under pressure by mixing with each other. Then these parts are sintered at a temperature below the melting temperature of the main component, creating a strong bond between the contact surfaces of the particles to achieve the desired properties.
Powder metallurgy is well suited for mass production of small, complex and dimensionally sensitive parts. Material loss is very low. In this method, there are no melting losses, close
361
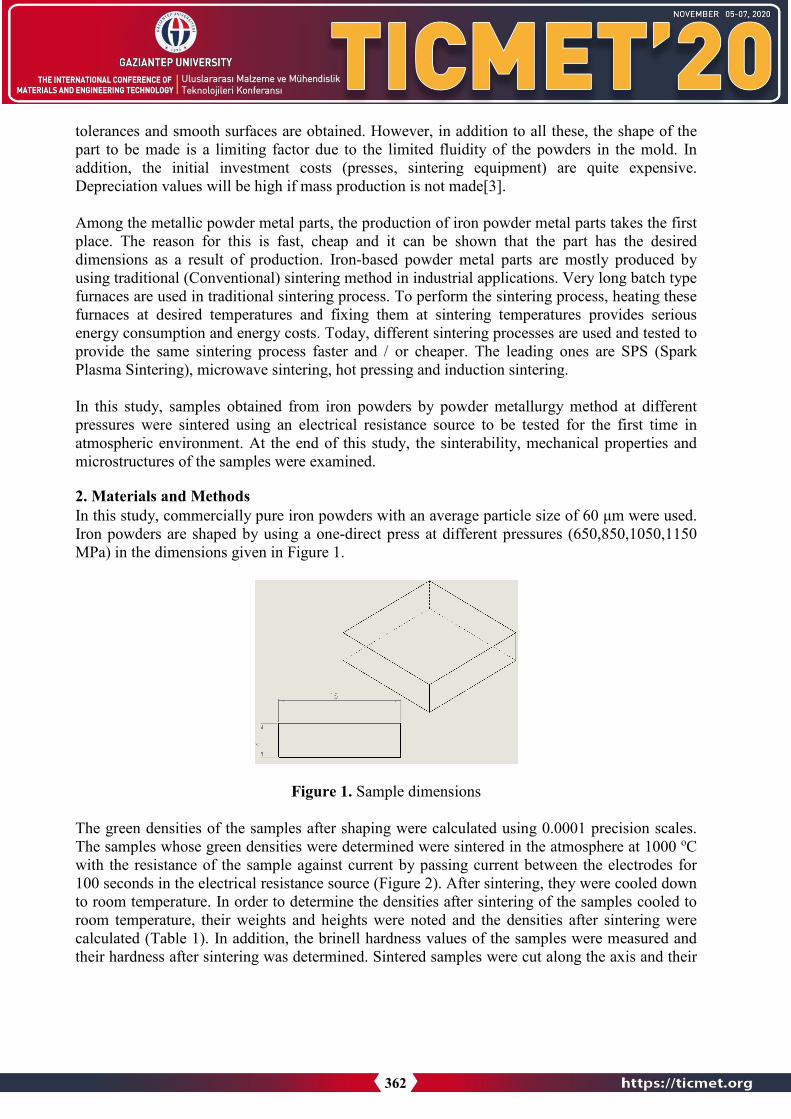
tolerances and smooth surfaces are obtained. However, in addition to all these, the shape of the part to be made is a limiting factor due to the limited fluidity of the powders in the mold. In addition, the initial investment costs (presses, sintering equipment) are quite expensive. Depreciation values will be high if mass production is not made[3].
Among the metallic powder metal parts, the production of iron powder metal parts takes the first place. The reason for this is fast, cheap and it can be shown that the part has the desired dimensions as a result of production. Iron-based powder metal parts are mostly produced by using traditional (Conventional) sintering method in industrial applications. Very long batch type furnaces are used in traditional sintering process. To perform the sintering process, heating these furnaces at desired temperatures and fixing them at sintering temperatures provides serious energy consumption and energy costs. Today, different sintering processes are used and tested to provide the same sintering process faster and / or cheaper. The leading ones are SPS (SparkPlasma Sintering), microwave sintering, hot pressing and induction sintering.
In this study, samples obtained from iron powders by powder metallurgy method at different pressures were sintered using an electrical resistance source to be tested for the first time in atmospheric environment. At the end of this study, the sinterability, mechanical properties and microstructures of the samples were examined.
2. Materials and Methods In this study, commercially pure iron powders with an average particle size of 60 μm were used. Iron powders are shaped by using a one-direct press at different pressures (650,850,1050,1150 MPa) in the dimensions given in Figure 1.
Figure 1. Sample dimensions
The green densities of the samples after shaping were calculated using 0.0001 precision scales. The samples whose green densities were determined were sintered in the atmosphere at 1000 oC with the resistance of the sample against current by passing current between the electrodes for 100 seconds in the electrical resistance source (Figure 2). After sintering, they were cooled down to room temperature. In order to determine the densities after sintering of the samples cooled to room temperature, their weights and heights were noted and the densities after sintering were calculated (Table 1). In addition, the brinell hardness values of the samples were measured and their hardness after sintering was determined. Sintered samples were cut along the axis and their
362

sinterability was evaluated by taking microstructure photographs from the relevant places for microstructure studies.
Figure 2. Electrical resistance welding
3. Results and Discussion3.1 Evaluation of Density and Microstructures The green and sintered densities given in Table 1 were obtained in this study, which was conducted to investigate the sinterability of samples pressed at different pressures by using an electric spot welding machine with electrical resistance heating technique.
Table 1. Green and sintered density of samples sintered at different pressures.
As can be seen in Table 1., both green densities and sintered densities increased with increasing pressing pressure. Green density at 650 C, average 88.39% It is seen that the green density increased by 2.23% to 94.5% when the pressure increased from 850 MPa to 1050 MPa, while it increased by 92.27% to 3.88% at 850 MPa. Concerning increasing pressure, it is not linear, and the rate of condensation naturally decreases at high pressures. Looking at sintered densities, for
363

650 MPa, sintered density increased by 2.78% to 91.17%, at 850 MP by 3.84% from 92.27% to 96.11%, at 1050MPa by 3,51% from 94,5% to 98,01%. Graphs of increase in green and sintereddensity are given in Figure 3.
Figure 3. Green and sintered densities of samples sintered with resistance heating technique
In addition, the green densities increased from 650 MPa, the lowest pressing pressure, to 1050 MPa, the highest pressure, by 6.11%, while the sintered densities increased 6.84% from the lowest pressure, 650 MPa, to the highest pressure, 1050 MPa. The fact that the rates of increase in green and sintered densities are close to each other shows that the processes are suitable.However, while there are difficulties in reaching densities above 95% sintered densities in powder metal samples, it can be regarded as the success of this technique in sintering that it reaches 98% densities in electrical resistance heating sintering technique. The reason for the high densities here can be explained by the fact that the electrically conductive electrode jaws behaviour like a hot pressure sintering process during resistance heating.The microstructures of the samples pressed and sintered at different pressures are given in Figure 4. As can be seen from the microstructures, two different grain structures were obtained forsamples at each pressing pressure. One of them is named as the main metal and the other isnamed as under the electrode.
Looking at the microstructures given in Figure 4, it is seen that the microstructures given for different pressure values have almost no porosity. Especially in the areas under the resistance electrodes, no pores are observed and grain coarsening is also very clear.
Especially in the samples sintered at high pressures, the regions under the resistance electrode were coarser. The reason for this is that it creates a driving force in grain coarsening during sintering, as the grain internal stresses are high at high pressures.
81%
84%
87%
90%
94%
97%
100%
650 Mpa 850 Mpa 1050 Mpa
Desn
sity
Pressure
Green Density Sintered Density
364

a) 650 MPa, x100 Base metal b) 650 MPa, x100 Resistance contact point
c) 850 MPa, x100 Base metal d) 850 MPa, x100 Resistance contact point
e) 1050 MPa, x100 Base metal f) 1050 MPa, x100 Resistance contact point
Figure 4 Microstructures of sintered samples
3.2 Evaluation of hardness The hardness values of all three samples pressed at different pressures were taken from the outer edges of the samples, under the point resistance electrodes and from different points. The data obtained are given in Table 2.
365

Table 2 Hardness test results
As can be seen from the table, the hardness of the regions other than resistance heating, which is called base metal, was measured approximately similar for each pressure value. In fact, the hardness was expected to be higher in samples pressed at high pressures, but it is understood that all samples showed approximately the same hardness value with sintering. However, there was an increase in the hardness of places below the point of resistance. The reason for this can be explained as the pressure applied to create resistance causes an increase in hardness by making hot pressing effect on the samples.
The following results were obtained in this study, which was conducted to investigate the sinterability with the electrical resistance heating technique;
1) It has been observed that powder metal samples can be sintered in an unprotectedenvironment with the electrical resistance heating technique.
2) It has been observed that samples with high density values such as 98% can be obtainedby sintering in an unprotected atmosphere.
3) It was observed that the grain structures of the samples formed different grain structuresin the lower parts of the resistance electrodes and in the other parts of the sample, whilethe regions under the resistance electrodes consisted of coarser structures.
4) It was observed that the hardness values were different under the resistance electrodesand in other parts of the samples, and it was observed that the base metal was harder.
4. Referances
1. Anonim (1984) Metals Handbook, 9. baskı, Cilt 7, Powder Metallurgy A. S. M.2. Çiğdem, M. (1998) İmal Usulleri, Yıldız Üniversitesi İstanbul.3. Kurt, A. Gülenç, B. Türker, M. I. Ulusal Toz Metalurjisi Konferansı, Gazi Üniversitesi,
Ankara, 595-602.4. Randal, M. G. (1989) Powder Metallurgy Science, Princeton.5. Sands, R. L (1966) Powder Metallurgy, Practice and Application, George Newnes Ltd.,
Londra.
366

A STUDY OF NUMERICAL ANALYSIS ON ARC STUD WELDING
NECİP FAZIL YILMAZ*1, SEVAL POLAT1, MAHMUT FURKAN KALKAN1, MUSA YILMAZ1
1Gaziantep University, Engineering Faculty, Mechanical Engineering Department, Gaziantep, TURKEY
Abstract
The general definition of arc stud welding can be explained to weld metal studs to plates. In arcstud welding, the tip of the stud and the base metal is melted by the applied pressure of the stud gun. This process suitable for welding of the small and large diameter of studs to metal plates.Many types of materials can be welded by using arc stud welding. Arc stud welding has a very important process in steel construction, the automotive industry and steam boiler construction. Itis of great importance to be able to quickly determine the welding properties in order to determine the optimum production times during production and to eliminate the effects of possible errors. In this study simulation analysis was carried out and effecting parameters werevisualized.
Keywords: Simufact Modeling, Stud welding, AISI 304 Steel
1. Introduction Stud weld joining provides ease of use in many industries; it is used in steel construction and all manufacturing and construction production[1]. Arc stud welding (ASW) technology provideseconomical and easy application with high production speed[1,2]. It has low heat input, there is no loss of strength in the material, no deformation in heat effected zone (HAZ), no deterioration in studs, high quality welding connections and suitable for standard welding with different properties[3]. The advantage that distinguishes ASW from other standard welding methods is that it does not heat metals to the melting point as in traditional welding techniques, so it doesnot create a mechanical behavior disorder and excessive temperature change in the material[4]. In ASW, it is important to weld metals to the base metal at a temperature below their melting temperature. Studs or similar rods made of various metals and alloys are used for heating[1,5].
In ASW method; the heat required for the joining process is generated by an electric arc to melt a certain area. Required parameters are time, plunge distance and lift distance and amper. These parameters are important to obtain a reasonable resource. ASW parameters are workpiece, welding current, welding time and shielding gas. The ASW process has basic conditions such as creating the welding temperature with the help of the arc between the parts to be welded and bringing the parts together with sufficient pressure when the melting temperature occurs[6–8]. The working principle of ASW is summarized in Figure 1.
Weld deterioration may occur in the weld due to the expansion and contraction of the weld metal. Physical and mechanical factors deform the weld base metal and the base metal. Expansion and contraction occurs in the weld metal due to heat and post-weld cooling with the
367

increase in the weld zone, while the weld metal pushes and pulls the adjacent metal. This phenomenon is called distortion. Weld penetration is defined as the distance the fusion linetravels below the welded metal surface[10,11].
Figure 1. Arc welding application steps [9]
In this study, simulation and modeling of arc stud welding of AISI 304 stainless steels arestudied. The effect of stud type affecting the welding quality was investigated by FEM method. Two different stud tip angles were determined and the effect of stud type on weld penetration was observed. It was aimed to prevent wasted welding time with FEM modeling.
2. Materials and MethodsIn this study, welding process of stainless steel using the ASW method was simulated. Table 1and Table 2 represent the chemical specification of the AISI 304. Stud and plate geometries weredrawn with CAD software. Two different stud tip angles were selected as 0° and 170°. Thesestud samples and plate are shown in Figure 2. The geometries used in this study were preferredas 60 mm length and 6 mm diameter for stud and 60 mm long, 50 mm wide ad 5 mm thick forbase plate.
Figure 2. Schematic representation of a) base plate b) stud with flat end tip c) stud with conical end tip (170°)
368
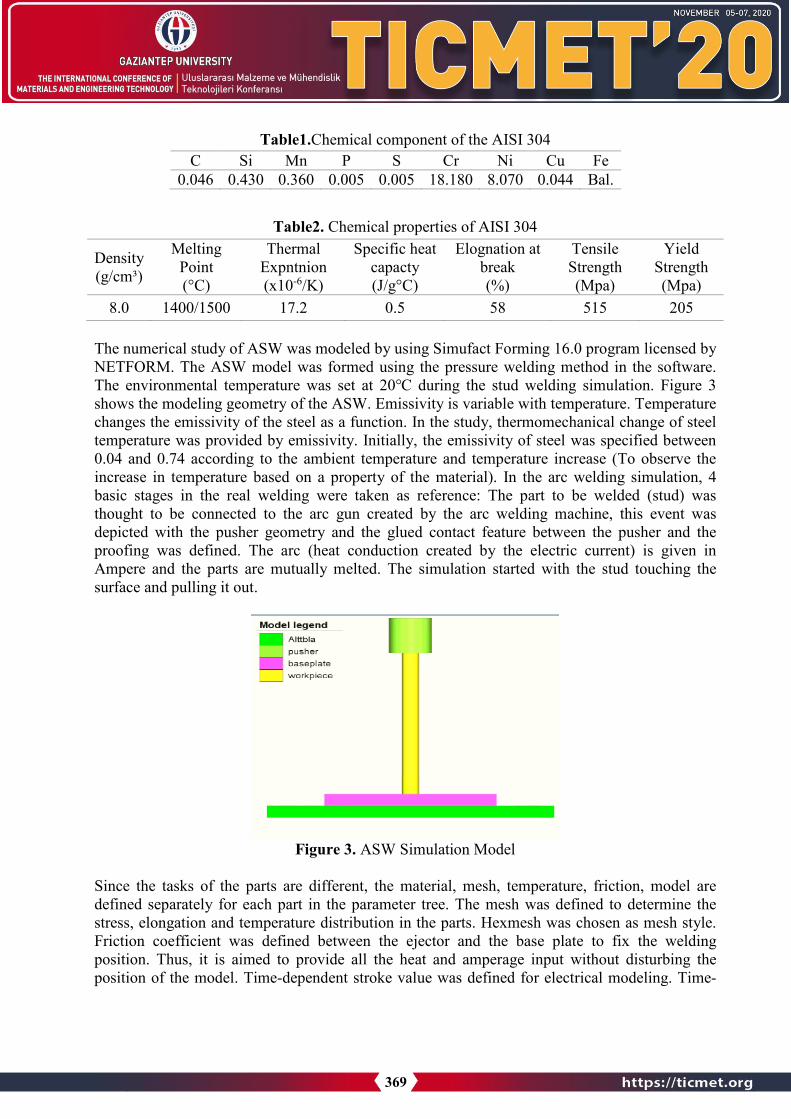
Table1.Chemical component of the AISI 304
Table2. Chemical properties of AISI 304
The numerical study of ASW was modeled by using Simufact Forming 16.0 program licensed by NETFORM. The ASW model was formed using the pressure welding method in the software. The environmental temperature was set at 20℃ during the stud welding simulation. Figure 3 shows the modeling geometry of the ASW. Emissivity is variable with temperature. Temperature changes the emissivity of the steel as a function. In the study, thermomechanical change of steel temperature was provided by emissivity. Initially, the emissivity of steel was specified between 0.04 and 0.74 according to the ambient temperature and temperature increase (To observe the increase in temperature based on a property of the material). In the arc welding simulation, 4 basic stages in the real welding were taken as reference: The part to be welded (stud) was thought to be connected to the arc gun created by the arc welding machine, this event wasdepicted with the pusher geometry and the glued contact feature between the pusher and the proofing was defined. The arc (heat conduction created by the electric current) is given in Ampere and the parts are mutually melted. The simulation started with the stud touching the surface and pulling it out.
Figure 3. ASW Simulation Model
Since the tasks of the parts are different, the material, mesh, temperature, friction, model are defined separately for each part in the parameter tree. The mesh was defined to determine the stress, elongation and temperature distribution in the parts. Hexmesh was chosen as mesh style. Friction coefficient was defined between the ejector and the base plate to fix the welding position. Thus, it is aimed to provide all the heat and amperage input without disturbing the position of the model. Time-dependent stroke value was defined for electrical modeling. Time-
C Si Mn P S Cr Ni Cu Fe 0.046 0.430 0.360 0.005 0.005 18.180 8.070 0.044 Bal.
Density (g/cm³)
Melting Point (°C)
Thermal Expntnion (x10-6/K)
Specific heat capacty (J/g°C)
Elognation at break (%)
Tensile Strength (Mpa)
Yield Strength (Mpa)
8.0 1400/1500 17.2 0.5 58 515 205
369

Stroke feature was simulated per unit time with the current affecting the material. Ampere was entered depending on time.When melting started on the stud and the surface to be joined, welding was performed by applying pressure (time-stroke with Pusher feature).
3. Result and Discussion
a) b)
c) d)
e) f)
Figure 4. Images from simulation model; a) flat end tip model b) conical end tip model c)material flow of flat end tip model
d) material flow of conical end tip model e) temperature distribution of flat end tip modelf) crossectional view of temperature distribution for conical end tip model
370
Model views and results of welded arc stud welding simulation were shown in Figure 4. Figure 4 (a) and (b) was given to display end tip of the stud models. In arc stud welding simulation, themodels of the molten material flow to the flat end and the conical end was indicated in Figure 4(c) and (d), respectively. It was determined that material flow occurs in a wider area and deepens on the base plate in the use of straight-ended studs. In the conical-end tip sample, it was observed that it occurred at much lower speeds on the base plate. Based on Figure 4 (e) and (f), it wasthought that the reason for this information in the molten metal flow is the effect of the temperature reached in the arc stud welding model of the flat end type stud.
This given temperature distribution also represents the penetration in models with arc stud welding method. Although that was spread over a wider area in the molter material flow on flatend tip arc stud model, the penetration area where the melting point was reached was seen in a much thinner and larger area. In the other case, it was observed that it has a better combination of both the stud and the base plate. This was presumed to be due to the fact that the materialmovement provided the same movement in the main plate, where the stud starting from the conical end of the stud with the conical end tip stud was inserted.
4. Conclusion In this study, analysis feasibility with Simufact Forming 16.0 version was investigated by using numerical data of Stud Arc Welding. In the simulation, welding modeling of AISI 304 flat-section studs, 6 mm diameter, 60 mm long stud and 6 mm diameter, 60 mm long studs with a 10° conical end were performed on the ASISI 304 60x50x5 mm base plate and the welding HAZ regions and results were compared. The simulation result was successful and it was seen that different tip type of studs could be simulated. It has been concluded that the tip types of stud affect penetration and this process could be simulated by using finite element method.
References 1. Jesudoss Hynes NR, Nagaraj P, Jennifa Sujana JA. Investigation on joining of aluminum and
mild steel by friction stud welding. Mater Manuf Process 2012;27:1409–13.2. Başyiğit AB, Kurt A. Investigation of the weld properties of dissimilar s32205 duplex
stainless steel with aisi 304 steel joints produced by arc stud welding. Metals (Basel)2017;7:77.
3. Talaş Ş, Doğan M, Çakmakkaya M, Kurt A. The effect of voltage on the arc stud welding ofmicrowave sintered Fe+ Al powder mixture. Mater Res 2014;17:632–7.
4. Cary HB. Modern Welding Technology 5/e. Ind Robot An Int J 2004.5. Abbas EN, Omran S, Alali M, Abass MH, Abood AN. Dissimilar welding of AISI 309
stainless steel to AISI 1020 carbon steel using arc stud welding. 2018 Int. Conf. Adv. Sci.Eng., IEEE; 2018, p. 462–7.
6. Samardžić I, Kladarić I, Klarić Š. THE INFLUENCE OF WELDING PARAMETERS ONWELD CHARACTERISTICS IN ELECTRIC ARC STUD WELDING. Metalurgija2009;48.
7. Bargani MG, Ghaini FM, Mazroi A. The effect of an Al tip in arc stud welding on theproperties of the welded joint. Weld J 2016.
8. GHOLAM M. The effect Arc Stud Welding mechanical properties of shear n.d.9. American Welding Society. Welding Handbook - Welding Science and Technology. 2001.
371

10. Soltanzadeh H, Hildebrand J, Kraus M, Asadi M. Modelling of a stud arc welding joint fortemperature field, Microstructure Evolution and residual stress. Press. Vessel. Pip. Conf., vol.50435, American Society of Mechanical Engineers; 2016, p. V06BT06A002.
11. Hildebrand J, Soltanzadeh H. A review on assessment of fatigue strength in welded studs. IntJ Steel Struct 2014;14:421–38.
372

INVESTIGATION OF THE HEAT AFFECTED ZONE BY THERMAL
CYCLE SIMULATION TECHNIQUE
ZAKARIA BOUMERZOUG*1, FABIENNE DELAUNOIS2, OUALID BEZIOU3, INES HAMDI4
1,3 Biskra University, Mechanical engineering department, LMSM Laboratory, Biskra, ALGERIA 2 University of Mons, Metallurgy Department,Mons, BELGIUM
4 Biskra University, Chemical engineering department, LMSM Laboratory, Biskra, ALGERIA
Abstract Heat generated during welding induces an important temperature gradient in and around the welded area. In arc welding process, three main different zones were recorded in welded joint: fusion zone, heat affected zone. The objective of this paper is to present the thermal cycle simulation technique and its utility for the study of the heat affected zone. Rapid heating andcooling treatment were applied in specific simulation equipment. The most published research works about the use of the thermal cycle simulation for understanding the heat affected zone are presented. A case study is also presented. We have showed the importance of this technique forthe investigation of the HAZ.
Keyword: Heat affected zone, Therman cycle simulation, Steel, Microstructures.
1. IntroductionWelding is a process of joining materials into one piece. Heat generated during welding inducesan important temperature gradient in and around the welded area. Three main different zoneswere observed in welded joint: fusion zone (FZ), heat affected zone (HAZ), and base metal(BM). The HAZ is a region between the FZ and BM which is thermally affected by the weldingtreatment. HAZ is that portion of the base metal whose mechanical properties and microstructurehave been altered by the heat of welding. The HAZ is subjected to a thermal cycle (suddenheating followed by rapid cooling) in which all temperatures from the melting range of the steeldown to comparatively much lower temperatures are involved and HAZ therefore consists of aseries of graded structures ringing the weld bead. HAZ, usually contains a variety ofmicrostructures. The knowledge of a whole area and of subareas of the HAZ is important frompractical point of view, since, as reported in [1], fine-grained HAZ is in a critical place in termsof creep strength and thermal fatigue.
The main difficulty associated with welding is the prevention of unexpected deterioration of properties as a result of the microstructure evolutions which reduce the resistance to brittle fracture in the heat-affected zone (HAZ) [2]. Properties of the HAZ are different from those of the base material. It has been concluded that by improving the microstructure of the HAZ, can
373

the properties of the welded joint be improved. For example, excessive heat input could result ina wide HAZ with low impact strength [3]. The HAZ is responsible of the microstructural andmechanical changes of the welded joint, due to the heat generated during welding process and,usually, because of large grain size, ductility and toughness of this area is poor, being the heatinput the most important factor among those who affect HAZ [4].
According to the literature, the HAZ is the most problematic area in the high strength steelsweld. For this reason, many research works investigated this critical zone in welded joint. However, the investigation of the HAZ in the real welded joint is not easy, because it is not possible to obtain an appropriate specimen at very narrow locations in the HAZ [5,6]. To evaluate the HAZ’s properties, thermal cycle simulation is one the best approaches for the investigation of HAZ. It gives more information about changes in the temperature and different microstructures obtained in HAZ caused by welding [7]. In addition, weld thermal cycle simulation can be used for optimizing the welding technology since it enables some mechanical testing for properties that cannot be made on real welded joints because of small width of HAZ[8]. For example, in our previous contribution to the understanding of the differentmicrostructures in welded joints of Inc 738 LC superalloy using the thermal cycle simulation [9],we found that the obtained microstructures by thermal cycle simulation of welding correspond to those observed in the same zone of the real welded joint realized by TIG welding. In addition, in our recent work [10], we found that HAZ in 2014 aluminum alloy, investigated by a thermal cycle simulation, is not a homogeneous zone but it is composed with different subzones. Theobjective of this paper is to present some published research works about the use of the thermalcycle simulation for understanding the heat affected zone. The thermal cycle simulationtechnique is also presented with a real application on X70 steel.
2. Thermal Cycle Simulation TechniqueSimulator tests Smitweld TCS 1405 is presented in Figure 1. This device allows studying themicrostructural variations appearing during heat treatments in metal alloys, in particular duringwelding. The power sources are provided by electro resistance and electro induction thatfacilitate and control heating rates. Figure 2 illustrates the applied heating and cooling cycle. Thefirst step of the cycle consists of a rapid heating (from To to Tm) followed by the cooling step(from Tm to ambient temperature). The heating takes place by the Joule effect (from 0 to 1300C, linearly), the cooling by water. The heating speed is fast (100 K/s), and the cooling speed isalso fast. The thermocouple is a Chrome/Alumel was used to measure the temperature of thespecimen during the thermal cycle. This element is fixed in the central point of the standardizedtest specimen ( 100 x 10 x 12 mm ) (Figure 3). The selected specimen for this experience is X70steel. The Smitweld TCS1405 simulator is equipped to carry out computer-controlledtemperature cycles that consist of a rapid heating followed by a cooling treatment. The heattreated specimens by the Smitweld thermal cycle simulator were polished and etched by Nital toreveal the microstructure. The etched specimens were observed by optical microscopy.
374

Figure 1. Smitweld thermal cycle simulator.
Figure 2. The applied thermal cycle on specimen.
375

Figure 3. Fixing of the thermocouple on the standardized test specimen. 3. Case study In this part of this work, an investigation by thermal cycle simulation of X70 steel is presented. As an example, Figure 4 shows the heating effect on X70 steel during one thermal cycle from 25C to 1200 ⁰C. By increasing the temperature, the appearance of the specimen changes to the red color. However, the opposite behavior of the specimen can be observed in figure 5 during the cooling process.
25 ⁰C
376

Figure 4. Effect of heat treatment on specimen of X70 steel during heating from 25 to 1200 ⁰C
1200 ⁰C
377

Figure 5. Thermal behavior of the specimen of X70 steel during cooling process from 1200 to 25 °C.
This thermal cycle is repeated and applied for other specimens at different temperatures to simulate the temperature distribution in HAZ. In our case, we have chosen four temperatures (600, 800, 1000 and 1200 °C), which correspond to four thermal cycles. Figure 6 shows macro views of the specimens of X70 steel after different thermal cycle (600, 800, 1000 and 1200 °C), with their microstructures. The effect of heating temperature on the microstructure can be observed.
25 ⁰C
378

Figure 6. View of specimens of X70 steel after different thermal cycle (600, 800, 1000 and 1200 °C ) with their microstructures.
The optical observations of these heat treated specimens have revealed a change in the microsturture. The microstructure of the base metal ( Fig.7) changes after each thermal cycle (Fig.6). The grains size and the pearlite distribution change from the base metal to the heat treated at 1200 °C. Lamellar pearlite was observed by increasing the temperature. From these microstructural observations, each microstructure can be attributed to a specific sub-zone in HAZ.
379

.
Figure 7. Microstructure of the base metal ( X70 steel ).
According to some published works [5,8] and to our previous investigations [9-11], the thermalcycle simulation technique gives more details about the microstructure of the HAZ. For example, Hamdi et al.[11], steel has been investigated the heat affected zone (HAZ) in X60 by thermalcycle simulation. They found that the HAZ in welded X60 steel is formed with different sub-zones, and each zone has its own microstructure; i.e., as it has been reported, the HAZ is not homogenous, but different sub-zones can be distinguished [12, 13]. This result is confirmed in the present case study.
However, it is important to indicate that the HAZ is often the cause of future damage of many devices in which welding technology was applied for their repair. In order to reduce the negative effect of the HAZ on welded joint, some heat treatments can be proposed such as annealing treatment after welding process [14].
5. ConclusionHeat affected zone in welded joint is an area in which some structural changes in the weldedmaterial take place as the result of experienced temperature. The investigation of the HAZ in thereal welded joint is not easy. The use of the thermal cycle simulation technique is the appropriatesolution. This technique is based on a rapid heating followed by a cooling treatment of the basemetal. This technique has been applied for some metallic materials such steel and aluminumalloy. A case study is presented by the application of this technique in X70 steel. We haveshowed that the heat affected zone of welded joint is not homogenous zone.
50μm ▬▬
380

References 1. Dzidowski, E.S., and Banach, J. Working conditions and the potential damage of energy
pipelines with respect to welding technology [in Polish]. Proceedings of 1-st scientific-technical conference PIRE -98, 1998, 57-62.
2. Abson D.J., Tkach, Y., Hadley, I., Wright, and V.S., Burdekin, F.M. A review of postweldheat treatment code exemptions. Weld J, 2006, 85: 63–69.
3. Gunaraj, V. and Murugan, N. Prediction of Heat affected zone characteristics in submergedarc welding of structural steel pipes. Welding research, 2002 :94-98.
4. Moghaddam M.A., Golmezergi R., and Kolahan F. Multi-variable measurements andoptimization of GMAW parameters forAPI-X42 steel alloy using a hybrid BPNN-PSOapproach. Measurement, 2016, 92: 279-287.
5. Samardžić I, Stoić A, Kozak D, Kladaric I, Dunđer M. Application of Weld Thermal CycleSimulator in Manufacturing Engineering, J. of Manufac. and Indust. Eng. 2013, 12: 7–11.
6. Dunder M., Vuherer T., and Kladaric I. Weldability Investigation of TStE 420 after WeldThermal Cycle Simulation, Strojarstvo, 2010, 52, 97–104.
7. Górka, J., Janicki, D., Fidali, M., and Jamrozik, W. Thermographic assessment of the HAZProperties and structure of thermomechanically treated steel, Int J Thermophys,2017: 38-183.
8. Dunđer, M., Samardžić, I., and Vuherer, T. Weldability Investigation Steel P91 by WeldThermal Cycle Simulation, Metalurgija, 2015, 54: 539–542.
9. Boumerzoug, Z., and Cherif, S. (2017), Thermal cycle simulation of welding process in Inc738 LC superalloy, K. Eng. mater.,2017, 735: 75-79.
10. Raouache, E., Boumerzoug, Z., Delaunois; F., and Khalfallah, F. Investigation by ThermalCycle Simulation of Heat Affected Zone in Welded AA2014 Aluminum Alloy. Res DevMaterial Sci. 2020, 13(3). RDMS.000812.
11. Hamdi, I, Boumerzoug, Z., and Delaunois, F., Simulation of Heat Affected Zone in X60Steel , Insights Min Sci technol., 2020, 2(2): 52-57.
12. Łomozik, M. The effect of repeated thermal cycles of welding on the plastic properties andstructure of the heat affected zone of 13HMF steel after the operation longer than 130,000hours [in Polish], Energetyka, 2007,Thematic Issue 14: 64-68.
13. Łomozik, M. Microscopic analysis of the influence of multiple thermal cycles of welding onbreaking work and hardness of the simulated HAZ zone for P91 steel [in Polish], Energetyka,2008,Thematic Issue 18, 68-71.
14. Śloderbach, Z. and Pająk, J. determination of ranges of components of heat affected zoneincluding changes of structure, Archives of Metallurgy and Materials, 2015, 60, I 4.
381

EFFECTS OF BLEND RATIO AND SPINNING TECHNOLOGY ON TRIBOLOGICAL PROPERTIES OF POLYESTER-REGENERATED
CELLULOSIC FIBER BLENDED YARNS
GONCA BALCI KILIC1, GAYE KAYA2, HATİCE NİDA CİVAN *3, HATİCE KÜBRA KAYNAK4, OSMAN YAYLA2
1 Dokuz Eylül University, Faculty of Engineering, Textile Engineering Department, İzmir, TURKEY. 2 Kahramanmaraş Sütçü İmam University, Faculty of Engineering and Architecture, Textile Engineering
Department, Kahramanmaraş, TURKEY. 3Selçuk İplik Industry and Trade Co. Inc. Research and Development Center, Gaziantep, TURKEY.
4 Gaziantep University, Faculty of Engineering, Textile Engineering Department, Gaziantep, TURKEY.
Abstract
Polyester is one of the most widely used chemical fibers in the yarn production due to some superior properties such as high strength, good durability and light weight. Moreover, regenerated cellulosic fibers, which have arisen as an alternative of natural fibers, still maintain popularity today. For this reason, the production of regenerated cellulosic fiber-polyester blended yarns with different spinning technologies is increasing day by day. The tribological propertiesof the yarns, which are greatly influenced by blend ratio and spinning technology, affect the physical, mechanical and surface properties of yarns and therefore the characteristics of fabrics produced from these yarns. In this respect, the aim of the study is to investigate the effects of blend ratio and spinning technology on tribological properties of regenerated cellulosic fiber-polyester blended yarns. Furthermore, unevenness, imperfections, hairiness and mechanical properties were investigated and correlations between frictional properties and other propertieswere analyzed. In the scope of this study, frictional properties of yarns were examined by using 100% regenerated cellulosic fiber, 67/33%, 50/50% and 33/67% regenerated cellulosic fiber-polyester blends. Tencel, Modal, bamboo and viscose fibers were used as regenerated cellulosic component of blended yarns and 20 tex yarns were produced by ring, open-end or rotor and vortex spinning technologies. Yarn-to-metal, yarn-to-ceramic and yarn-to-yarn friction tests were performed by using Lawson Hemphill CTT Dynamic Friction Tester with a constant input tension of 10 mN/tex. Unevenness, hairiness and imperfections values of yarns were measured by using Uster Tester 5. Evaluation of the effect of spinning system shows that open-end rotor yarns have the highest yarn-to-yarn friction, unevenness and imperfections values whereasvortex yarns have the highest yarn-to-material friction values, in general. Increasing ratio of polyester fiber content in the yarn structure does not cause systematic change in yarn friction, hairiness and imperfections. Furthermore, correlation analysis showed that there is positive correlation (significant at 0.01 level) between yarn-to-yarn friction and unevenness and imperfections.
Keyword: yarn friction, polyester, regenerated cellulosic fiber, ring, open-end rotor, vortex, yarn unevenness, blended yarn
382

1. Introduction In the past decades, polyester fibers have been widely used in yarn and fabric production as they have some highlighted properties such as high elasticity and strength, durability, resistance to stretch, high abrasion resistance, wrinkle resistant and easy care [1] (p. 105), [2-3]. While these fibers can be used 100% in yarn production, their blends with various fibers can widely also be used. Polyester-regenerated cellulosic fiber blends are the most commonly used blend type. Regenerated cellulosic fibers, which have arisen as an alternative of natural fibers still has maintained its popularity today. The purpose of using regenerated cellulosic fibers and polyesterfibers in the blended yarn structure is to benefit from the superior properties of both components. With these blends, it is utilized from the strength and durability properties of polyester fiber, and the soft feeling, similarity to natural fibers, comfort, hydrophilicity properties of regenerated cellulosic fibers. Today, polyester-regenerated fiber blended yarns with different blend ratios are produced in different spinning technologies. Ring, OE-rotor and vortex spinning technologies are among the most widely used spinning technologies in the production of blended yarns. Yarns produced with different spinning technologies differ in terms of tribological properties as well asother structural and mechanical properties.
Tribology is defined as the science which focuses on friction, wear and lubrication of interacting surfaces in relative motion and of related subjects and practices. Tribology, which is derived from the Greek word, tribos -meaning rubbing- is a relatively new field of science. Hovewer, interest in the constituent parts of tribology, such as friction, is believed to be older than recorded history [4-6] (p. 1). Frictional properties of textile surfaces are important for all textile productsfrom fiber to fabric as the effects on production processes, properties, and performance of the final product [7]. Yarn friction determines yarn behaviour during the many processes and it is more important than the speed of machine during the processes [8]. Moreover, yarn friction affects the yarn hairiness, bending, stretching and tribological properties of fabrics such as pilling formation, friction behaviour and abrasion resistance. Yarn friction is related to bothsurface properties and bulk properties of yarns. The factors can be divided into four main groups: fiber parameters, yarn structural and bulk parameters, operational parameters, finishes. Fibermaterial, structural, surface and bulk properties of fibers are fiber parameters that directly affect the yarn friction. Under the heading of yarn structural ve bulk properties, structural properties of yarns (linear density and twist ratio), spinning technology, unevenness and imperfections can belisted [9]. When the literature is analyzed, it is seen that there are many studies examining theeffect of spinning technology and blend ratio on various yarn properties [10-17], however, the number of studies examining the effects on yarn tribological properties is relatively few [7, 18-19].
In this study, it was aimed to investigate the effects of blend ratio and spinning technology on tribological properties of regenerated cellulosic fiber-polyester blended yarns. For this purpose, 100% regenerated cellulosic fiber, 67%-33%, 50%-50% and 33%-67% regenerated cellulosic fiber (Tencel, Modal, bamboo and viscose)-polyester yarns were produced by three different spinning technologies: ring, open-end rotor and vortex. In the scope of the study, unevenness, imperfections, hairiness and mechanical properties were also investigated and correlations between frictional properties and other yarn properties were analyzed.
383

2. Materials and Methods In the study, forty-eight different types of yarns, which were produced by conventional ring, OE-rotor and vortex spinning technologies, were used to achieve experimental study. Properties of the yarns are given in Table 1. The linear densities of all yarns are 25 tex.
Table 1. Yarns used in experimental study Material Yarn
no Spinning
technology Yarn
no Spinning
technology Yarn
no Spinning
technology 100% Tencel (T) R1
Rin
g
O1
Ope
n-en
d ro
tor
V1
Vor
tex
100% Modal (M) R2 O2 V2 100% Viskon (CV) R3 O3 V3 100% Bamboo (B) R4 O4 V4
33%T-67%PET R5 O5 V5 50%T-50%PET R6 O6 V6 67%T-33%PET R7 O7 V7 33%M-67%PET R8 O8 V8 50%M-50%PET R9 O9 V9 67%M-33%PET R10 O10 V10 33%CV-67%PET R11 O11 V11 50%CV-50%PET R12 O12 V12 67%CV-33%PET R13 O13 V13 33%B-67%PET R14 O14 V14 50%B-50%PET R15 O15 V15 67%B-33%PET R16 O16 V16
Yarn-to-yarn, yarn-to-metal and yarn-to-ceramic friction coefficient were tested by Lawson Hemphill CTT Dynamic Friction Tester by using constant input tension of 10 mN/tex. While yarn-to-material (yarn-to-metal and yarn-to-ceramic) friction tests were performed according to Capstan method with 100 m/min test speed, yarn-to-yarn friction tests were performed according to twisted-strand method with 20 m/min test speed (Figure 1). Yarn-to-metal and yarn-to-ceramic frictions coefficient were calculated with Equation 1 (Capstan formula) and yarn-to-yarn friction coefficients were calculated with using Equation 2:
2 1ln( / )T Tµθ
= (1)
2 1ln( / )4 ( 0.5)sin / 2
T Tn
µπ β
=−
(2)
where, T2 is output tension, T1 is input tension and which is equal to 200 mN, θ is the cumulative wrap angle (radian), β is 35º (lower apex angle between two yarns) and n is the number of wraps (n=3) (Figure 1).
Unevenness, imperfections and hairiness properties of yarns were measured by Uster Tester 5 at 400 m/min test speed. Breaking force and elongation values of yarns were measured by using an Uster Tensojet and every test was performed at 400 m/min test speed and 500 mm gauge length.
384

Figure 1. Yarn position during yarn friction tests a: yarn-to-material, b: yarn-to-yarn [20]
3. Results and DiscussionIn accordance with the experimental plan, yarn-to-metal friction, yarn-to-ceramic friction, yarn-to-yarn friction, unevenness and imperfections, hairiness and mechanical properties of the regenerated cellulosic fiber-polyester blended yarns were measured and the results were evaluated in 95 % confidence interval (α=0.05) using IBM SPSS 24.0 statistical software by applying variance analysis. Besides, relationships between tribological properties of yarns andother yarn properties were investigated.
3.1 Tribological properties Mean values of yarn-to-metal, yarn-to-ceramic and yarn-to-yarn friction coefficients of regenerated cellulosic fiber-polyester blended yarns are given in Figure 2 as line graphs.
When a general evaluation is made for yarn-to-material friction considering the effect of spinning technology, it is seen that vortex yarns have the highest yarn-to-metal and yarn-to-ceramic friction coefficient values, while OE-rotor yarns have the lowest friction coefficient values. On the other hand, it is observed that OE-rotor yarns have the highest yarn-to-yarn friction coefficients and ring yarns have the lowest values. In order to explain these results, the surface morphology of the yarns should be taken into consideration. For yarn-to-material friction, it is an expected result that the friction coefficient is the highest in vortex yarns with the effect of the helical wrapper fibers wound on parallel fibers in the yarn center. In ring yarns, because of the fibers follow a helical path, surface morphology has a character which can make stick-slip motion on metal or ceramic friction surface. However, this effect is not as strong as in vortex yarns. On the other hand, OE-rotor yarns have the lowest yarn-to-material friction coefficient due to their twist irregularity and more rigid structure compared to ring yarns. When an evaluation is made in terms of yarn-to-yarn friction, it can be said that they have closer results since the surface morphologies of ring yarns and vortex yarns are similar. There are regular helical fiber structures on the outer surface of both yarns, they cause slide easily over each other like worm screw, and low friction force occurs when they come into contact during the test. As the ring yarns are closer to the ideal yarn structure, the friction force is lower than vortex yarns’. On the other hand, when the surface morphology of OE-rotor yarns is examined, this effect cannot be seen due to the effect of both uneven twist distribution and irregular wrapper fibers,
385

and therefore the yarn-to-yarn friction force is the highest. When a general evaluation is made for the yarns used in the study, it is seen that the highest variation for friction coefficients belongs to the vortex yarns and metal friction surface. Increasing ratio of polyester or regenerated fiber content in the yarn structure did not cause systematic change in yarn friction coefficient values. Since friction is a very complex concept, many parameters such as friction between fibers, fiber-to-surface friction in the spinning process, static electricity, technologies used for forming yarn in different structures are effective simultaneously and it makes difficult to observe systematic changes in yarn friction. According to the ANOVA results, the effects of blend ratio and spinning technology is statistically significant for yarn friction for all surfaces (p=0.00).
Figure 2. Friction coefficients of regenerated cellulosic fiber-polyester blended yarns
386

3.2 Unevenness and imperfections Mean values of unevenness (CVm %), imperfection index (IPI) (/km), thin places (-50% /km) and thick places (+50% /km) are given in Table 2. When a general evaluation is made in terms of spinning technologies and blend ratios, it is seen that the effects of both parameters are statistically significant on yarn unevenness and imperfection index. The highest unevenness and imperfection index values belong to OE-rotor yarns, in general. There is no systematical changedepending on blend ratio like the one in yarn friction. On the other hand, for OE-rotor yarns, it is observed that imperfection index values have noticeable decrease with the increasing ratio ofregenerated cellulosic fiber in the yarn structure.
Table 2. Mean values of unevenness, IPI (/km), thin places (-50% /km) and thick places (+50% /km)
Material Unevenness (CVm%) Imperfection index
(IPI) Thin places (-50%) Thick places (-50%)
Ring OE-Rotor
Vortex Ring OE-
Rotor Vorte
x Ring OE-Rotor
Vortex Ring OE-
Rotor Vorte
x 33%T-67%PET 12.44 13.26 12.93 144.5 115.0 73.5 1.00 5.50 3.00 38.00 20.50 19.50 50%T-50%PET 12.27 13.69 13.03 104.0 164.5 62.5 0.00 11.00 6.00 28.50 21.50 12.00 67%T-33%PET 12.18 14.04 13.06 110.5 131.0 43.5 1.00 13.50 7.50 31.50 30.50 11.00 100% Tencel 12.69 12.52 12.90 216.5 50.5 94.0 1.00 0.50 3.50 63.50 6.00 18.50
33%M-67%PET 11.19 15.34 12.33 25.0 263.0 13.0 0.00 54.00 6.00 6.50 74.50 3.00 50%M-50%PET 10.89 14.75 11.97 30.0 204.0 12.5 0.00 31.00 2.50 8.00 51.00 3.00 67%M-33%PET 10.91 14.64 12.23 31.5 176.0 19.5 0.50 24.00 2.00 8.00 45.50 7.00 100% Modal 10.58 14.09 12.06 34.5 92.0 18.0 0.00 10.50 1.50 6.00 25.00 4.50
33%CV-67%PET 11.34 15.23 13.59 14.0 323.5 36.0 0.50 45.00 22.50 4.00 72.50 10.00 50%CV-50%PET 11.13 15.10 13.09 15.5 253.5 31.0 0.50 33.50 11.50 5.00 77.00 14.50 67%CV-33%PET 11.01 15.20 13.04 8.5 245.5 22.5 0.00 29.00 9.50 2.50 81.00 9.00 100% Viscose 10.81 14.06 13.28 22.0 132.5 30.0 0.00 14.00 10.50 4.00 35.50 10.00
33%B-67%PET 10.91 14.94 12.83 15.0 288.0 24.5 0.00 32.00 10.00 3.50 53.50 6.50 50%B-50%PET 10.80 14.65 12.65 22.0 232.5 19.0 0.00 23.00 6.00 4.00 49.50 5.50 67%B-33%PET 10.87 15.27 12.50 25.5 228.0 28.5 0.00 30.50 8.00 5.00 55.00 8.00 100% Bamboo 10.86 14.13 12.29 42.0 121.0 20.5 0.00 13.00 2.00 10.50 27.00 8.50
3.3 Hairiness The mean values of hairiness (H) are shown in Figure 3. H value means the total length of protruding hairs (cm) along 1 centimeter of yarn. ANOVA results showed that the effects of blend ratio and spinning technology on yarn hairiness is statistically significant (p≤0.05). It is seen that yarn hairiness increases with the increasing ratio of regenerated fiber content in the yarn structure. In addition, vortex yarns have the lowest hairiness values while ring yarns have the highest values, in general.
387

Figure 3. Hairiness (H) values of regenerated cellulosic fiber-polyester blended yarns
3.4 Mechanical properties The mean values of yarn strength (Rkm - kgf*Nm) and breaking elongation (%) of yarns are given in Figure 4. ANOVA results showed that the effects of blend ratio and spinning technology is statistically important for yarn strength values (p≤0.05). When an evaluation in terms of spinning technology is done, it can be seen that the yarn strength values of ring yarns, which are closest to ideal yarn structure, have the highest values for all blend ratios, while OE-rotor yarns have the lowest values. In addition, it is observed that the yarn strength decreases as the amount of regenerated cellulosic fiber in the blended yarn increases.
Figure 4. Yarn strength (Rkm) and breaking elongation (%) values of regenerated cellulosic fiber-polyester blended yarns
388

3.5 Relationships between tribological properties of yarns and other yarn properties In this section, the relationships between tribological properties and other yarn properties of regenerated cellulosic fiber-polyester blended yarns were investigated by using correlation analysis. Pearson correlation coefficients are given in Table 3.
Table 3. Pearson correlation coefficients of tribological properties of yarns and other yarn properties
Relationships Pearson correlation coefficients
Yarn-to-metal and yarn-to-ceramic friction coefficients 0.966** Yarn-to-metal and yarn-to-yarn friction coefficients -0.108Yarn-to-ceramic and yarn-to-yarn friction coefficients -0.158Yarn-to-metal friction coefficient and unevenness (CVm) -0.447**Yarn-to-ceramic friction coefficient and unevenness (CVm) -0.448**Yarn-to-yarn friction coefficient and unevenness (CVm) 0.641**Yarn-to-metal friction coefficient and imperfection index (IPI) -0.638**Yarn-to-ceramic friction coefficient and imperfection index (IPI) -0.639**Yarn-to-yarn friction coefficient and imperfection index (IPI) 0.428**Yarn-to-metal friction coefficient and hairiness (H) -0.192Yarn-to-ceramic friction coefficient and hairiness (H) -0.216Yarn-to-yarn friction coefficient and hairiness (H) -0.356***Correlation is significant at the 0.01 level (2-tailed). *Correlation is significant at the 0.05 level (2-tailed).
As a result of statistical analysis, it is seen that there is a strong positive correlation between yarn-to-metal and yarn-to-ceramic friction coefficients. Therefore, it is possible to say that the yarns have similar friction behaviors for metal and ceramic surfaces used in testing instrument. On the other hand, the relationships between yarn-to-material (both of metal and ceramic) and yarn-to-yarn friction coefficients are not statistically significant. In other words, the behavior of yarns during their relative motion with harder surfaces such as metal and ceramic is quite different from the behavior that when they interact with each other in relative motion. When the relationships between the tribological properties of yarns and other yarn properties are examined, although there is a strong positive relationship between yarn-to-yarn friction and CVm and IPI, there is a negative relationship between yarn-to-material friction and these parameters. This is one of the most important evidence that yarns show a very different character during their movement on different surfaces. In addition, since the yarns are in contact with each other during the yarn-to-yarn friction, the sliding of the yarns over each other becomes difficult due to the contact of the imperfections creates additional friction force. However, it is thought that the possibility of imperfections can decrease the touching surface area between the yarn and material, positive relation between yarn-to-material friction and imperfections cannot be found.
4. Conclusions
The aim of the study is to analyze the effects of blend ratio and spinning technology on tribological properties of yarns. Moreover, unevenness, imperfections, hairiness and mechanical
389

properties were also investigated and relationships between frictional properties and other yarn properties were analyzed. Polyester and recently widely used regenerated cellulosic fibers (Tencel, Modal, viscose and bamboo) were chosen as materials for the study. 100% regenerated cellulosic fiber, 67%-33%, 50%-50% and 33%-67% regenerated cellulosic fiber-polyester yarns were produced by ring, open-end rotor and vortex spinning technologies. When a general evaluation is made for tribological properties, unevenness, imperfections, hairiness and breaking strength considering the effect of blend ratio and spinning technology, it is seen that the effects of both parameters are statistically significant. The highest values of friction coefficient for yarn-to-material friction belong to vortex yarns, while the highest values for yarn-to-yarn friction belong to OE-rotor yarns. Furthermore, there is no systematical change in yarn friction depending on blend ratio. For unevenness and imperfections, the highest values belong to OE-rotor yarns, in general and blend ratio does not cause systematic change like yarn friction.Correlation analysis showed that there is strong positive correlation between yarn-to-yarn friction and unevenness and imperfections. Furthermore, there is no correlation between yarn-to-material (both of metal and ceramic) and yarn-to-yarn friction coefficients.
References
1. Deopura, B.L., and Padaki, N.V. Synthetic Textile Fibres: Polyamide, Polyester and AramidFibres. In Textiles and Fashion, Materials, Design and Technology. Edited by Sinclair, N.Cambridge: Woodhead Publishing. 2014.
2. Pongsathit, S., Chen, S., Rwei, S., and Pattamaprom C. Eco-friendly High-performanceCoating for Polyester Fabric. Journal of Applied Polymer Science, 2019,136 (39): 48002.
3. Li, Y., Chen, D., Cheng, X., Gao, F., Yang, X., Mi, Y., Zhou. Q., Lan, S., and Cao, Z.Mechanistic Investigation on Moisture-induced Softening of Poly(vinyl acetate)-stiffenedPolyester Fabrics. Journal of Applied Polymer Science, 2020, (online published).
4. Sahoo, P. Engineering Tribology. New Delphi: PHI Learning Private Limited. 2011.5. Bhushan, B. Principles and Applications of Tribology. New York: John Wiley & Sons.
2013.6. Williams, J. Engineering Tribology. Cambridge: Cambridge University Press. 2005.7. Balci Kilic, G., and Sülar, V. Frictional Properties of Cotton-Tencel Yarns Spun in Different
Spinning Systems. Textile Research Journal, 2012, 82(8): (755-765).8. Koo, Y., and Kim, H. Friction of Cotton Yarn in Relation to Fluff Formation on Circular
Knitting Machines. Textile Research Journal, 2002,72(1): (17–20).9. Hong, J., and Jayaraman, S. Friction in Textiles. Textile Progress, Volume: 34 (1/2). Oxford,
UK: The Textile Institute. 2003.10. Tyagi, G.K., Goyal, A., and Chattopadhyay, R. Physical Characteristics of Tencel-polyester
and Tencel-cotton Yarns Produced on Ring, Rotor and Air-jet Spinning Machines. IndianJournal of Fibre & Textile Research, 2013, 38(3): (230-236)
11. Kilic, M., and Okur, A. The Properties of Cotton-Tencel and Cotton-Promodal BlendedYarns Spun in Different Spinning Systems. Textile Research Journal, 2011,81(2): (156–172).
12. Tyagi, G.K., Goyal, A., and Chattopadhyay, R. Low-stress and Recovery Characteristics ofTencel Blended Ring, Rotor and MJS Yarns. Indian Journal of Fibre & Textile Research,2013, 38(4): (331-339)
13. Huh, Y. Analyzing Structural and Physical Properties of Ring, Rotor, and Friction SpunYarns. Textile Research Journal, 2002, 72(2): 156-163.
390

14. Yayla, O., Kaya, G. and Kaynak, H.K. Comparison of Melange Yarn Properties Produced byUsing Different Spinning Systems. 3rd International Mediterranean Science and EngineeringCongress (IMSEC 2018), 2018, 826-832.
15. Canoglu, S. and Tanir, S.K. Studies on Yarn Hairiness of Polyester/Cotton Blended Ring-Spun Yarns Made from Different Blend Ratios. Textile Research Journal, 2009, 79(3): 235-242.
16. Topalbekiroglu, M., Hosrafoglu Coruh, E., İnce, M.E., Kaynak, H.K. The Influence of FiberBlend Ratios on Yarn Quality Values for Cotton/polyester and Cotton/acrylic O.E. RotorYarns. The Journal of Textile and Apparel, 2007, 17(2): 104-109.
17. Erdumlu, N., Ozipek, B., Oztuna, A.S., and Cetinkaya, S. Investigation of Vortex Spun YarnProperties in Comparison with Conventional Ring and Open-end Rotor Spun Yarns. TextileResearch Journal, 2009, 79(7): 585-595.
18. Chattopadhyay, R., Banerjee S. The Frictional Behaviour of Ring-, Rotor-, and Friction-spunYarn. Journal of Textile Institute, 1996, 87(1): 59-67.
19. Ghosh, A., Patanaik, A., Anandjiwala, R.D., and Rengasamy, R.S. A study on dynamicfriction of different spun yarns. Journal of Applied Polymer Science, 2008, 108(5): 3233-3238.
20. Lawson Hemphill CTT Yarn Friction Tester User Manual. Massachusetts: Lawson Hemphill.2009.
391

INVESTIGATION OF THE EFFECT OF DIFFERENT BASIS WEIGHT, BLEND RATIO, AND PATTERN ON PHYSICAL AND MECHANICAL
PROPERTIES OF WET WIPES
EBRU ÇELIKTEN*1, EYÜP ALI SATIL1, YUNUS AYCAN1, TÜLIN KAYA NACARKAHYA1
1Selçuk İplik Industry and Trade Co. Inc. Research and Development Center, Gaziantep, Turkey.
Abstract
Worldwide, nonwoven textile materials have attention especially through disposable products. In recent years, disposable products are great importance in terms of hygiene. One of the most useful disposable product is wet wipes. Wet wipes which are used almost everywhere in daily life have different patterns and different fiber composition. Generally the first thing that has the attention of the users is the smell of the wet wipes. On the other hand, thickness, bulkiness, softness and weight are other important properties by the users.
In this study, different samples from polyester and viscose fibers were produced with different blend ratio (80/20 and 70/30) by the hydroentanglement bonding technique to be used as wet wipes. Besides, samples were produced three different basis weight (35, 45, 55 g/m2) and twodifferent patterns (plain and dot) to compare the physical and mechanical properties. Physical properties, such as thickness and basis weight and mechanical properties, such as breaking strength and elongation at break properties (both in wet and dry) were measured. In addition, liquid absorption of wipes were tested. Lastly, all of the test results obtained at the end of the study were evaluated statistically.Key Words: Spunlace, disposable product, wet wipe, pattern, liquid absorption.
1. IntroductionIn recent years, disposable products have started to take place more and more in our daily lives.The disposable products which are generally used medical, hygiene, personal care and etc [1]. Ingeneral, wipes (personal care, household and industrial) which are increased 12.3% of the totalEuropean nonwovens production tones 2019 [2]. Nonwoven production technology has lowproduction cost and high production capacity [3]. Different nonwoven production technologieshave been used for manufacturing wipes. But generally, hydroentanglement nonwovenproduction technology as known spunlaced are manufactured as wipe products [1,4]. Thehydroentanglement nonwoven production stages have web formation (carding), entanglement,water jet circulation and drying [5]. Nonwoven wipe products are manufactured from natural(viscose, cotton, rayon, etc.) and synthetic fibers (polyester, polypropylene, polyamide, etc.) orcombinations of these fibers [1, 4, 6].
Soukupova et al.[1] reported the physical, mechanical and liquid absorption properties of wipe products consisting of flax, viscose and polyester fibers. They were concluded that flax fibers can be successfully utilized for developing household wipes due to their good absorption characteristics and higher tensile strength and satisfactory durability. Pulan et al. [6] investigated
392

the physical, mechanical and liquid transport properties of wipe fabrics consisting of lyocell, viscose and polyester fibers. Wet wipes were produced by spraying with natural based liquid contents (combinations of rose water and olive oil with different functional components). Main liquid absorption and transfer characteristics (drop, wicking, absorption capacity, absorption time, drying, and shelf life tests) were affect homogeneous distribution of the liquid content andshelf lives which differ according to fabric and liquid content properties. As a result of thisstudy, sodium alginate increased the shelf lives of the wet wipes. Değirmenci and Çoruh, [4] also revealed that the dry and wet breaking strengths of standard/recycled and plain/patternedsamples with basis weight variation. As a result, it has been concluded that the use of recycle products can be produced in viscose / polyester with patterned form as disposable wet wipes by increasing the basis weight.
Within the scope of this study, wipe samples from polyester and viscose fibers were produced with different blend ratio (80/20 and 70/30) and three different basis weight (35, 45, 55 g/m2) and two different patterns (plain and dot) to compare the physical, mechanical and liquid absorption properties. Physical properties, such as mass per unit area and thickness were measured. The breaking strength and elongation at break properties in the machine and cross-machine directions (both in the dry and wet) were measured. The liquid absorption capacity andliquid absorption time of the wipes were tested. Besides, all of the results were evaluated statistically by 2017 IBM SPSS packet program. According to the statistical test result, pattern, composition rate and basis weight (gsm) have a statistically significant effect on especially liquid absorption capacity properties.
2. Materials and Methods In this study, all wipe samples were produced hydroentangled nonwoven production technology.Fiber properties are shown in Table 1 and wipe sample properties are given in Table 2.
Table 1. Physical properties of fibers Fiber Type
Fineness (dtex)
Length (mm)
Strength (cN/tex)
Elongation (%)
Polyester (PES) 1.68 38 60.8 17.4 Viscose (CV) 1.70 40 22.4 20.1
Table 2. Sample properties Sample No Pattern Composition Ratio Basis Weight (g/m2)
S1 Plain 80% PES / 20% CV 35 S2 Plain 80% PES / 20% CV 45 S3 Plain 80% PES / 20% CV 55 S4 Plain 70% PES / 30% CV 35 S5 Plain 70% PES / 30% CV 45 S6 Plain 70% PES / 30% CV 55 S7 Dot 80% PES / 20% CV 35 S8 Dot 80% PES / 20% CV 45 S9 Dot 80% PES / 20% CV 55 S10 Dot 70% PES / 30% CV 35 S11 Dot 70% PES / 30% CV 45 S12 Dot 70% PES / 30% CV 55
393

All samples were conditioned at 20±2°C and 65±4 relative humidity. The basis weight samples were measured by the digital precision scale according to NWSP 130.1 test standard and thickness of the samples were measured by means of the digital thickness according to NWSP 120.1 test standards. All sample tests were repeated 10 times and calculated average values of the results.
The breaking strength and elongation of the samples were prepared 30*5 cm both machine andcross direction and performed to determine with Zwick / Roell Z01.0 strength tester according to NWSP 100.4 test standard with 200 mm measurement distance and 500 mm/min measurement speed under load of 1 kN. And also the sample tests were repeated 10 times in both dry and wetstates.
The liquid absorption capacity and time were measured according to NWSP 10.01 test standard.The samples were prepared 10*10 cm and measured dry weights. Then the samples were immersed in water using a grid system (12*12 cm) and kept for 1 minute, 2 cm below the liquid surface. The sample was taken out of the water with a pair of tweezers and left vertically for 2 minutes to remove the free water and measured wet weights. Then, the liquid absorption capacity was determined from the difference between the dry and wet weights of the samples.
For statistical analysis, IBM SPSS Statistics, 2017 package program was used for ANOVA (analysis of variance) at 0.05 significance level in order to compare if there was statistically significant effect of the production parameters as blend ratio (80/20, 70/30), basis weight (35, 45,55 g/m2) and pattern (plain, dot) on the physical, mechanical and liquid absorption properties.
3. Results and Discussion3.1. Basis Weight and ThicknessThe basis weight and the fabric thickness values were given in Table 3. The thickness can becontrolled by water jet pressure in the hydroentanglement techniques.
Table 3. Physical properties of samples Sample No Basis Weight (g/m2) Thickness (mm) S1 36.1 0.57 S2 44.6 0.54 S3 54.0 0.65 S4 36.4 0.57 S5 44.2 0.59 S6 54.8 0.69 S7 34.9 0.69 S8 45.3 0.76 S9 55.0 0.86 S10 38.5 0.65 S11 43.6 0.68 S12 58.6 0.86
394

3.2. Breaking Strength and Elongation at Break The breaking strength and elongation at break properties were analyzed for all samples both of machine direction (MD) and cross direction (CD) with dry and wet states. The breaking strength test results of all samples both machine and cross direction are shown that in the Figure 1 and 2. Generally, the the breaking strength values in the machine direction has higher than the cross direction. The reason for this is the hydroentangling nonwoven production technology in which the production is carried out parallel-lapping technique.
Figure 1. Breaking strength (MD-machine direction) of samples
Figure 2. Breaking strength (CD-cross direction) of samples
When the compared of breaking strength of results according to the sample patterns, generally it is seen that dot pattern are generally higher values in machine direction both dry and wet states (Figure 1). This is due to the fact that, it is caused by the formation of more knots and high fiber density while giving a dot pattern to the fabric. On the other hand, the cross direction of breaking
0
30
60
90
120
150
35 g/m² 45 g/m² 55 g/m² 35 g/m² 45 g/m² 55 g/m² 35 g/m² 45 g/m² 55 g/m² 35 g/m² 45 g/m² 55 g/m²
%80 PES/%20 CV-PLAIN %70 PES/%30 CV-PLAIN %80 PES/%20 CV-DOTS %70 PES/%30 CV-DOTS
Brea
king
Stre
ngth
-M
D (N
)
DRY - MD WET - MD
0
30
60
90
120
150
35 g/m² 45 g/m² 55 g/m² 35 g/m² 45 g/m² 55 g/m² 35 g/m² 45 g/m² 55 g/m² 35 g/m² 45 g/m² 55 g/m²
%80 PES/%20 CV-PLAIN %70 PES/%30 CV-PLAIN %80 PES/%20 CV-DOTS %70 PES/%30 CV-DOTS
Brea
king
Stre
ngth
-C
D (N
)
DRY - CD WET - CD
395

strength values are very close between plain and dot pattern because of parallel-lapping technique (Figure 2).
The breaking strength test results of the samples in dry state shown that the higher polyester fibercontent, the higher the breaking strength of the samples for all the types of blend and patterns. The reason for this is the polyester fiber tensile strength value has higher than viscose fiber(Table 1). On the other hand, generally the wet breaking strength was lower than dry states for machine direction of the samples. Because the viscose fibers have low breaking strength values when wet. Soukupova et al. [1] reported the wet tensile strength of viscose fibers is lower than the dry tensile strength. Pulan et al. [6] stated that when the polyester fiber content increase the breaking strength values also increase.
When the increase of basis weight, the amount of fiber increases per unit area in both machine and cross direction (also dry and wet states). Accordingly, the breaking strength values are also increase. Değirmenci and Çoruh [4] reported that as the basis weight increases, the breaking strength values also increases both directions and states.
Elongation test results of all samples both machine and cross direction are shown that in the Figure 3 and 4.
Figure 3. Elongation at break (MD-machine direction) of samples
Generally, the elongation values obtained in the machine direction are close to each other in dry and wet states. Soukupova et al. [1] stated that the elongation of the samples in dry state was slightly higher in both directions.
It is seen that, the plain pattern samples have higher elongation values. Besides, the cross direction values has higher than machine direction because of parallel-lapping technique. This is due to the fiber distribution is paralleling. In the literature, Satıl et al. [7] stated that their study has achieve similar results.
And also, microscope views support this situation (Figure 5). Figure 5 show the microscopic view of the samples (PES 80% / CV 20%). It is clearly seen that the plain and dots pattern views
0
30
60
90
120
150
180
35 g/m² 45 g/m² 55 g/m² 35 g/m² 45 g/m² 55 g/m² 35 g/m² 45 g/m² 55 g/m² 35 g/m² 45 g/m² 55 g/m²
%80 PES/%20 CV-PLAIN
%70 PES/%30 CV-PLAIN
%80 PES/%20 CV-DOTS %70 PES/%30 CV-DOTS
Elon
gatio
n -M
D (%
)
DRY - MD WET - MD
396
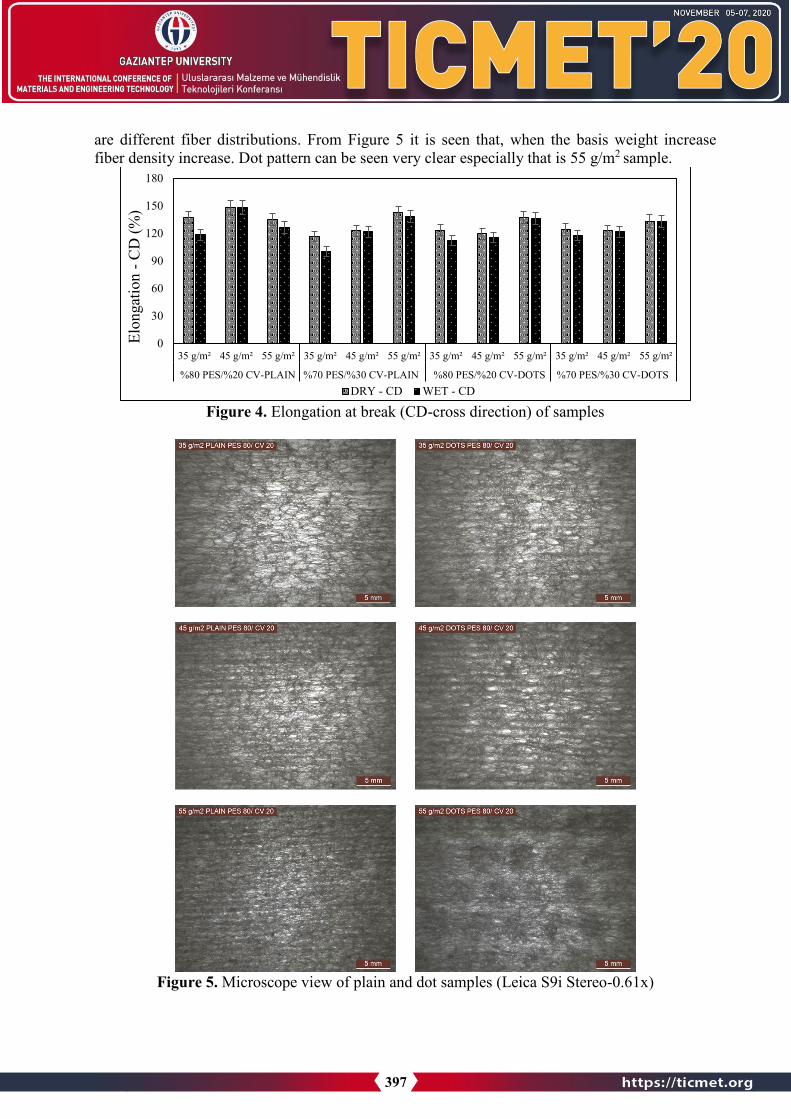
are different fiber distributions. From Figure 5 it is seen that, when the basis weight increase fiber density increase. Dot pattern can be seen very clear especially that is 55 g/m2 sample.
Figure 4. Elongation at break (CD-cross direction) of samples
Figure 5. Microscope view of plain and dot samples (Leica S9i Stereo-0.61x)
0
30
60
90
120
150
180
35 g/m² 45 g/m² 55 g/m² 35 g/m² 45 g/m² 55 g/m² 35 g/m² 45 g/m² 55 g/m² 35 g/m² 45 g/m² 55 g/m²
%80 PES/%20 CV-PLAIN %70 PES/%30 CV-PLAIN %80 PES/%20 CV-DOTS %70 PES/%30 CV-DOTS
Elon
gatio
n -C
D (%
)
DRY - CD WET - CD
397

3.3. Liquid Absorption Capacity and TimeThe liquid absorption capacity and time test results are shown in Figure 6. The liquid absorption capacity of the sample is affected by the porosity of the samples and the affinity of the fibers to a liquid [1].
From figure 6, it is clearly seen that viscose fiber rate increase from 20% to 30%, liquid absorption capacity also increase in plain pattern samples. Pulan et al. [6] stated that when the cellulosic fiber content increase the absorption capacity also obtained high values. However, dotpattern samples have different results. Contrary to expectations, when the polyester fiber ratio increase, the liquid absorption capacity increases in the dot pattern structure. These results are due to the thickness, fiber distribution and bonding point (Figure 5). Besides, Satıl et al [7] stated that, the fibers of the liquid fill the gaps in the nonwoven fabric structure, allowing the liquid tobe absorbed. Moreover, Çinçik [8] reported, as the polyester fiber ratio increases the liquid absorption capacity also increase because of lower density and higher porosity.
Figure 6. Liquid absorption capacity and time of samples
Other important parameter is basis weight. Contrary to expectations, when the basis weight increase liquid absorption capacity values decrease (Figure 6). The main reason of this is the change of porosity in the nonwoven structure due to thickness. The fabric thickness can be change according to basis weight, pattern, fiber distribution and so. Therefore the capillarity and porosity of the structure is also changed. The porosity influence liquid absorption properties. Civan et al. [9] reported that, the porosity of the nonwoven fabric structure has not only basis weight but also fabric thickness. When the increase of the fabric weight the fabric structure becomes more compact. So, the porosity is expected to decrease. On the other hand, the liquid absorption time values are close among all of the samples.
1315
1096980
1454
1240
952
1477
12971184 1159
1049 1036
43 3
5
34
3 3
5
3 3,50
2
0
5
10
15
20
0
250
500
750
1000
1250
1500
1750
2000
35 g/m² 45 g/m² 55 g/m² 35 g/m² 45 g/m² 55 g/m² 35 g/m² 45 g/m² 55 g/m² 35 g/m² 45 g/m² 55 g/m²
%80 PES/%20 CV-PLAIN %70 PES/%30 CV-PLAIN %80 PES/%20 CV-DOTS %70 PES/%30 CV-DOTS
Liqu
id A
bsor
btio
n Ti
me
(sec
)
Liqu
id A
bsor
btio
n C
apac
ity (%
)
Liquid Absorbtion Capacity, % Water Absorbency Time, sec
398

Table 4 illustrates the multiple comparison ANOVA results.
Table 4. Multivariate analysis of variance (ANOVA) result
Source Type III Sum
of Squares df Mean Square F Sig.
Partial Eta
Squared Corrected Model
Basis Weight 3804,036a 4 951,009 394,004 0,000 0,966 Thickness ,572b 4 0,143 60,444 0,000 0,815 Breaking Strength Dry-MD 29868,360c 4 7467,090 139,841 0,000 0,910 Elongation Dry-MD 1052,842d 4 263,211 40,163 0,000 0,745 Breaking Strength Dry-CD 2212,863e 4 553,216 41,870 0,000 0,753 Elongation Dry-CD 4282,756f 4 1070,689 24,003 0,000 0,636 Breaking Strength Wet-MD 21311,704g 4 5327,926 75,902 0,000 0,847 Elongation Wet-MD 1540,040h 4 385,010 51,698 0,000 0,790 Breaking Strength Wet-CD 1711,165i 4 427,791 32,994 0,000 0,706 Elongation Wet-CD 7966,358j 4 1991,589 31,241 0,000 0,694 Water Absorbency Rate 1739003,975k 4 434750,994 436,021 0,000 0,969 Water Absorbency Time 5,200l 4 1,300 3,449 0,014 0,201
Intercept Basis Weight 123769,500 1 123769,500 51277,785 0,000 0,999 Thickness 26,627 1 26,627 11249,990 0,000 0,995 Breaking Strength Dry-MD 476137,945 1 476137,945 8916,943 0,000 0,994 Elongation Dry-MD 75622,100 1 75622,100 11539,022 0,000 0,995 Breaking Strength Dry-CD 50147,286 1 50147,286 3795,346 0,000 0,986 Elongation Dry-CD 1017773,504 1 1017773,504 22816,966 0,000 0,998 Breaking Strength Wet-MD 407385,600 1 407385,600 5803,640 0,000 0,991 Elongation Wet-MD 88373,788 1 88373,788 11866,544 0,000 0,995 Breaking Strength Wet-CD 45567,704 1 45567,704 3514,519 0,000 0,985 Elongation Wet-CD 923105,681 1 923105,681 14480,454 0,000 0,996 Water Absorbency Rate 94834593,902 1 94834593,902 95111,619 0,000 0,999 Water Absorbency Time 680,067 1 680,067 1804,035 0,000 0,970
Pattern Basis Weight 7,994 1 7,994 3,312 0,074 0,057 Thickness 0,257 1 0,257 108,760 0,000 0,664 Breaking Strength Dry-MD 509,425 1 509,425 9,540 0,003 0,148 Elongation Dry-MD 135,300 1 135,300 20,645 0,000 0,273 Breaking Strength Dry-CD 11,008 1 11,008 0,833 0,365 0,015 Elongation Dry-CD 552,673 1 552,673 12,390 0,001 0,184 Breaking Strength Wet-MD 575,361 1 575,361 8,197 0,006 0,130 Elongation Wet-MD 270,937 1 270,937 36,381 0,000 0,398 Breaking Strength Wet-CD 0,241 1 0,241 0,019 0,892 0,000 Elongation Wet-CD 144,771 1 144,771 2,271 0,138 0,040 Water Absorbency Rate 437905,637 1 437905,637 439,185 0,000 0,889 Water Absorbency Time 1,067 1 1,067 2,830 0,098 0,049
Composition Basis Weight 9,680 1 9,680 4,010 0,050 0,068 Thickness 0,007 1 0,007 2,795 0,100 0,048 Breaking Strength Dry-MD 91,835 1 91,835 1,720 0,195 0,030 Elongation Dry-MD 33,301 1 33,301 5,081 0,028 0,085 Breaking Strength Dry-CD 10,837 1 10,837 0,820 0,369 0,015 Elongation Dry-CD 443,360 1 443,360 9,939 0,003 0,153 Breaking Strength Wet-MD 447,174 1 447,174 6,370 0,015 0,104 Elongation Wet-MD 146,328 1 146,328 19,648 0,000 0,263 Breaking Strength Wet-CD 0,864 1 0,864 0,067 0,797 0,001 Elongation Wet-CD 248,067 1 248,067 3,891 0,054 0,066 Water Absorbency Rate 96543,968 1 96543,968 96,826 0,000 0,638 Water Absorbency Time 0,000 1 0,000 0,000 1,000 0,000
399

Basis Weight Basis Weight 3786,362 2 1893,181 784,346 0,000 0,966 Thickness 0,308 2 0,154 65,111 0,000 0,703 Breaking Strength Dry-MD 29267,100 2 14633,550 274,052 0,000 0,909 Elongation Dry-MD 884,240 2 442,120 67,462 0,000 0,710 Breaking Strength Dry-CD 2191,017 2 1095,509 82,912 0,000 0,751 Elongation Dry-CD 3286,722 2 1643,361 36,842 0,000 0,573 Breaking Strength Wet-MD 20289,169 2 10144,585 144,520 0,000 0,840 Elongation Wet-MD 1122,774 2 561,387 75,381 0,000 0,733 Breaking Strength Wet-CD 1710,060 2 855,030 65,946 0,000 0,706 Elongation Wet-CD 7573,520 2 3786,760 59,402 0,000 0,684 Water Absorbency Rate 1204554,370 2 602277,185 604,037 0,000 0,956 Water Absorbency Time 4,133 2 2,067 5,482 0,007 0,166
Error Basis Weight 132,754 55 2,414 Thickness 0,130 55 0,002 Breaking Strength Dry-MD 2936,835 55 53,397 Elongation Dry-MD 360,448 55 6,554 Breaking Strength Dry-CD 726,706 55 13,213 Elongation Dry-CD 2453,330 55 44,606 Breaking Strength Wet-MD 3860,716 55 70,195 Elongation Wet-MD 409,602 55 7,447 Breaking Strength Wet-CD 713,106 55 12,966 Elongation Wet-CD 3506,162 55 63,748 Water Absorbency Rate 54839,805 55 997,087 Water Absorbency Time 20,733 55 0,377
Total Basis Weight 127706,290 60 Thickness 27,329 60 Breaking Strength Dry-MD 508943,140 60 Elongation Dry-MD 77035,390 60 Breaking Strength Dry-CD 53086,855 60 Elongation Dry-CD 1024509,590 60 Breaking Strength Wet-MD 432558,020 60 Elongation Wet-MD 90323,430 60 Breaking Strength Wet-CD 47991,975 60 Elongation Wet-CD 934578,200 60 Water Absorbency Rate 96628437,682 60 Water Absorbency Time 706,000 60
Corrected Total
Basis Weight 3936,790 59 Thickness 0,702 59 Breaking Strength Dry-MD 32805,195 59 Elongation Dry-MD 1413,290 59 Breaking Strength Dry-CD 2939,569 59 Elongation Dry-CD 6736,086 59 Breaking Strength Wet-MD 25172,420 59 Elongation Wet-MD 1949,642 59 Breaking Strength Wet-CD 2424,271 59 Elongation Wet-CD 11472,519 59 Water Absorbency Rate 1793843,780 59 Water Absorbency Time 25,933 59
According the ANOVA test results (confidence range 95%), it was found that, different pattern has a statistically significant effect on breaking strength (dry-MD) (p=0.003), elongation (dry-MD and dry-CD) (p=0.000 and p=0.001), and liquid absorption capacity (p=0.000). Besides, composition rate has a statistically significant effect on breaking strength (wet-MD) (p=0.015), elongation (dry-CD and wet-MD) (p=0.003 and p=0.000), and liquid absorption capacity (p=0.000). On the other hand, different basis weight (g/m2) have statistically influenced the
400

breaking strength and elongation (p=0.000) both direction (MD, CD) and states (dry, wet), liquid absorption capacity and time (p=0.000 and p=0.007).
4. ConclusionsThe disposable products have more interested in recent years. However, there are very few resources about pattern and composition of wipes. Moreover, there has been no systematic study the effect of different basis weight, blend ratio, and pattern on the breaking strength, elongationand liquid absorption capacity of commercially produced disposable wipes.
In this study, different basis weights, fiber compositions and patterns are viewed on hydroentanglement nonvowen product to see the effects on the breaking strength and elongation at break, liquid absorption capacity and liquid absorption time. As a result of this study, it is seen that the breaking strength values in the machine direction has higher than the cross direction. The reason for this is the hydroentangling nonwoven production technology in which the production is carried out parallel-lapping technique. When the increase of basis weight, the amount of fiberincreases per unit area in both machine and cross direction (also dry and wet states). Accordingly, the breaking strength values are also increase. On the other hand, the elongation values obtained in the machine direction are close to each other in dry and wet states. In addition to this, cellulosic content directly and positively affects the liquid absorption capacity in plain pattern. However, liquid absorption capacity values of dot pattern samples have converse results because of the thickness, porosity and bonding point.
References 1. Soukupova, V, Boguslavsky, L., and Anandjiwala, D, R., Studies on the Properties of
Biodegradable Wipes made by the Hydroentanglement Bonding Technique, Textile ResearchJournal, 2007, 77(5): 301–311.
2. EDANA, Nonwoven Statistics, 2019.3. Noelle, F. Eco-Friendly Hydroentangled Biodegradable Nonwovens, Nonwovens World,
2006, 67.4. Değirmenci, Z., and Çoruh, E., Investigating the Effects of Weight Variation and Patterning
on Strength of Nonwoven Products, Textile and Apparel, 2018, 28(4).5. Elsharkawy, M., Hydro-entaglement Bonding Process for Production of Nonwoven Fabric
Lap Lambert Academic Publishing, 2016.6. Pulan, S., Kaplan, S. ve Ulusoy, S., Sıvı Absorbsiyon ve Transfer Özelliklerinin İncelenmesi,
Journal of Textiles and Engineer, 2015, 22 (100); 13-24.7. Satıl, A. E., Yayla, O., Çelikten, E., Gür, Y., Elma, K. S., Nohut, S. ve Daşdemir, M., Su Jeti
İle Oluşturulmuş Nonwoven Kumaşların Yapısının Fiziksel Ve Mekaniksel ÖzelliklereEtkisinin Araştırılması, Ulusal Çukurova Tekstil Kongresi (UÇTEK), 2019, 112-118.
8. Çinçik, E., Iğneleme Yöntemiyle Üretilen Polyester/Viskon Karişimli Dokusuz YüzeyÖzelliklerinin Deneysel ve Istatistiksel Analizi, PhD Thesis, Çukurova University,Natural&Applied Sciences, Textile Engineering Department, 2010.
9. Civan, N. H., Uslu, Y., Mumcu, S. H., Gültekin, E. and Nohut, S., Spunlace NonwovenKumaşlarda Görüntü İşleme Tekniği İle Gözenek Yapısının İncelenmesi ve Bazı KumaşFiziksel Özelliklerinin İlişkilendirilmesi, Ulusal Çukurova Tekstil Kongresi Uçtek, 2019,128-134.
401
Optimization of Yarn Quality Parameters of Hemp Fiber Blended Yarns Produced By Ring Spinning System
Eyüp Ali Satıl*1, Ebru Çelikten1, Kubilay Özden1, Tülin Kaya Nacarkahya1
Selçuk İplik Industry and Trade Co. Inc. Research and Development Center, Gaziantep, Turkey.
Abstract
Hemp fiber, which is in the biodegradable fiber class, has attracted attention especially by yarn manufacturers in recent years due to some of its properties. The main reason of this interest is the high level of environmental concerns. Compared to cotton which is the most widely used natural fiber in the world and all synthetic fibers, hemp fibers attract attention with their superior ecological (environmental) properties and organic textile production potential. In addition, the use of hemp fiber provides extra features to textile products. Some of these features are high strength properties, high moisture absorption.
In this study, it is aimed to investigate the effects of yarn quality parameters of hemp blended yarn samples which produced by ring spinning system, systematically. For this purpose, cellulosic fibers (cotton, viscose and lyocell) were blended with hemp fiber in different blend ratios (90/10, 80/20 and 70/30) and two different yarn count Ne 20/1 and Ne 24/1 in ring spun yarn samples were produced. In this way 18 different yarn samples were obtained. Besides, an optimization model was developed to determine the blend ratio, fiber type and yarn count for the best response variables of yarn quality parameters (yarn strength, elongation, unevenness, hairiness and IPI ındex). According to ANOVA results and experimental observations, it is obtained that, the blend ratio, fiber type and yarn count were statistically significant effect ofyarn quality parameters but some parameters have not a significant effect all of the variables. Onthe other hand, the optimization result were selected lyocell/hemp (90/10) with Ne 20/1 yarn count.
Key Words: Multi-response optimization, hemp fiber, ring spinning system, yarn quality parameters.
1.IntroductionIn recent years, the interest in textile products produced from hemp fibers is rapidly increasing.The environmental concerns is the main reason for this interest. Hemp is naturally one of themost ecological, the strongest and stiffest available natural fibers [1].
Hongjie et al. [2] reported that the application and usage areas of hemp fibers. They published a research paper that includes the historical development of hemp fiber, its comfort and mechanical properties, chemical structure and annual production capacity. Researches show that hemp fiber is the oldest textile fiber used throughout history. It has been shown to increase day by day thanks to some good properties such as, anti ultraviolet, antibacterial health care properties, odor removal and high wear resistance provided by the areas of use. It has been stated that the main reason for the increase the use of hemp fiber is 100 % biodegradable material.
402

Manaia et al. [1] published a research article on the use of hemp fiber in the textile industry. In the study, it is stated that hemp fiber is preferred in the textile industry due to its low density,high specific strength and stiffness properties. It has also been reported that the natural structure of hemp fiber is suitable for finishing. In addition, hemp fiber was compared with othercellulosic based fibers and it was stated that it has the highest cellulose rate (p-74) in its structure. For this reason, it has been reported that hemp fiber can be used as a natural and biodegradable raw material in the yarn spinning system after some bleaching process.
Zhang, H. et al. [3] investigated the effect of the blend ratio of yarn samples containing hemp and polyester fibers on the yarn performance properties. According to the results obtained, it shown that as the hemp fiber ratio increase, the yarn unevenness values also increase.
Kozłowski et al. [4] investigated that hemp fibers can be successfully spun in the rotor spinning system. For this purpose, hemp fiber prepared with different pre-treatment processes, and then the hemp yarn production was carried out by using the closest cotton yarn spinning production parameters. According to the data obtained, successful results were achieved after the hemp fiber was passed through the fiber opening process and conditioned with a certain condition. For this purpose, it was observed that the yarn spinning quality increased after conditioning for 4 days in 70% relative humidity at 26-28 °C. In this way, the most efficient working parameters of thehemp fiber has also been determined in the rotor spinning system.
In the scope of this study, it is aimed to investigate the effects of yarn quality parameters of hemp blended yarn samples which produced by ring spinning system, systematically. For thispurpose, cellulosic fibers (cotton, viscose, lyocell) were blended with hemp fiber in differentblend ratios (90/10, 80/20, 70/30) and two different yarn count Ne 20/1 and Ne 24/1 in ring spun yarn samples were produced. Besides, an ANOVA statistical analysis and optimization modelwas developed to determine the blend ratio, fiber type and yarn count for the best response variables of yarn properties (yarn strength, elongation unevenness, hairiness and IPI).
2.Material and MethodIn this study, blends of cotton, viscose, lyocell and hemp fibers were used for the production ofring spun yarn samples. The physical properties of fibers used in this study are given in Table 1.
Table 1. Physical properties of fibers Fiber Types Fiber Fineness [dtex] Length
[mm] Strength[cN/tex] Elongation[%]
Hemp 3,16 65-75 35-70 - Cotton 1,8 32 32 7,4 Viscose 1,2 38 25 19 Lyocell 1,3 38 36-40 13
Other cellulosic fibers (cotton, viscose, lyocell) were blended with hemp fiber in different blend ratios (90/10, 80/20, 70/30) as shown in Table 2 and two different yarn count Ne 20/1 and Ne 24/1 in ring spun yarn samples were produced. Besides, the production parameters of ring spinning system are given in Table 3.
403

Table 2. Blend ratios of yarn samples Sample Number Fiber Types Yarn Count Blend Ratios
1
Cotton/Hemp
Ne 24/1 %90 /%10
2 %80 /%20 3 %70 /%30 4
Ne 20/1 %90 /%10
5 %80 /%20 6 %70 /%30 7
Viscose/Hemp
Ne 24/1 %90 /%10
8 %80 /%20 9 %70 /%30
10 Ne 20/1
%90 /%10 11 %80 /%20 12 %70 /%30 13
Lyocell/Hemp
Ne 24/1 %90 /%10
14 %80 /%20 15 %70 /%30 16
Ne 20/1 %90 /%10
17 %80 /%20 18 %70 /%30
Table 3. Production parameter of yarn samples
All yarn and fabric samples were conditioned in the standard atmospheric conditions of 20 ± 2 °C and relative humidity of 65 ± 4% before testing. Yarn samples were tested for the following properties; unevenness (U%) and Coefficient of mass variation (CVm%) according to standard of ISO 16549:2004, hairiness (Uster H) according to standard of ASTM D1425/D1425M – 14, breaking strength (kgf*Nm) and elongation (%) according to the standard of EN ISO 2062 by using Uster Tester 5 and Uster Tensojet respectively.
3.Results and DiscussionIn this study, cellulosic fibers (cotton, viscose, lyocell) were blended with hemp fiber in differentblend ratios (90/10, 80/20, 70/30) and two different yarn count Ne 20/1 and Ne 24/1 in ring spunyarn samples were produced systematically by using ring spinning system. The average values ofall yarn sample test results are indicated in Table 4.
Table 4. Test results of yarn samples Sample Number
Fiber Type Yarn Count
Blend Ratio
Unevenness %
IPI Hairiness Yarn Elongation
%
Yarn Strength (kgf*Nm)
1 Cotton/Hemp Ne 24/1
%90 /%10 15,05 4497,60 5,18 5,22 16,60 2 %80 /%20 20,03 9552,70 5,65 4,63 15,26 3 %70 /%30 24,73 16557,80 6,18 4,40 12,61
Spindle Speed(rpm)
Twist (T/M) Twist Factor (α)
Yarn Count 20/1 24/1 20/1 24/1 20/1 24/1 Cotton / Hemp 12,500 13,000 900 1000 5,1 5,19 Viscose / Hemp 14,000 14,000 760 860 4,31 4,31 Lyocell / Hemp 14,000 14,000 760 860 4,31 4,31
404

4 Ne 20/1
%90 /%10 14,58 3402,30 5,35 6,38 17,41 5 %80 /%20 19,04 7985,00 6,09 5,85 16,50 6 %70 /%30 23,89 14329,20 6,33 5,24 13,78 7
Viscose/Hemp
Ne 24/1 %90 /%10 13,17 4050,10 4,94 8,72 14,41
8 %80 /%20 18,21 9181,30 5,20 6,99 12,54 9 %70 /%30 23,91 14451,40 5,65 6,26 10,43
10 Ne 20/1
%90 /%10 12,51 3071,30 4,71 13,78 17,38 11 %80 /%20 17,45 7874,20 5,34 11,40 14,17 12 %70 /%30 22,00 13479,00 5,62 10,87 12,40 13
Lyocell/Hemp
Ne 24/1 %90 /%10 14,10 5022,50 5,58 9,38 25,31
14 %80 /%20 19,27 10255,00 5,62 7,69 21,95 15 %70 /%30 24,56 16901,00 6,04 6,20 17,02 16
Ne 20/1 %90 /%10 13,09 4028,90 5,71 9,56 26,71
17 %80 /%20 18,64 9087,70 5,99 8,11 22,44 18 %70 /%30 24,14 15872,60 6,16 7,18 18,68
3.1.Yarn Strength Yarn strength results are shown in Figure 1 for different blends of yarn samples produced by ring yarn spinning systems. As seen from Figure 1, generally when the hemp fiber ratio increases, the yarn strength values decrease. The main reason for this, the hemp fiber has a stiffer and irregular fiber variation compared to other natural fibers. Also, unlike other fibers, hemp fiber is a stemfiber and the fiber variation (short, long, thick, stiff, etc.) makes it difficult to control the yarn spinning system.
The highest yarn strength values were obtained from lyocell/hemp blended yarn samples. It is due to the fact that Lyocell fibers have higher specific strength (36-40 cN/tex) compared to othercellulosic fibers (cotton and viscose).
Figure 1. Strength of the yarn samples
405

According the ANOVA results (confidence range 95%), it was found that fiber type and blend ratios have statistically significant effect on the yarn strength (Table 5). It is seen from Table 5, that the p-value of the model is smaller than 0.05. This means that this model is proper forANOVA and optimization. It can also be concluded from Table 2 that, the effects of fiber type (p = 0.0057) and blend ratio (p = 0.0198) on yarn strength are statistically significant. Also, the fiber type has more important effect on yarn strength with a higher F Value (10.65). On the other hand, Linear model was chosen as the proper model for ANOVA and optimization process with 0,4867 Adjusted R2 and 0,3175 Predicted R2 (Table 6). This model can be used to navigate the design space.
Table 5. ANOVA results of yarn strength Source Sum of
Squares df Mean
Square F-value p-value
Model 197,32 3 65,77 6,37 0,0060 significant A-Blend (fiber type)
109,93 1 109,93 10,65 0,0057
B-Yarn count 16,00 1 16,00 1,55 0,2335 C-Blend Ratio 71,39 1 71,39 6,92 0,0198 Residual 144,48 14 10,32 Cor Total 341,80 17
Table 6. Model selection values for strength Source Sequential
p-valueStd. Dev. Adjusted R² Predicted R² PRESS
Linear 0,0060 3,21 0,4867 0,3175 233,28 Suggested 2FI 0,6186 3,35 0,4407 0,0753 316,05 Quadratic < 0.0001 0,7781 0,9699 0,9218 26,73 Aliased
3.2.Yarn Elongation
Figure 2. Elongation of the yarn samples
406

In the literature study, it has been explained that the elongation of hemp fiber (3.2%) is lowercompared to other fibers [6]. Therefore, the elongation values decrease as the increase in hemp fiber ratio in the yarn structure (Figure 2). In addition, as the yarn count decrease, the yarn elongation values also decrease. In the ring spinning system, thin and equal-length fibers areplaced homogeneously in the yarn structure and provide a more smooth twist of the yarn. On the other hand, the highest elongation values were obtained from viscose/hemp blended yarn samples in 20/1 Ne yarn count. It is known that the elongation values of cellulosic fibers are low in nature. It was determined in the literature study that, the elongation values of viscose fibers were higher than lyocell fibers [7].
ANOVA results (confidence range 95%), it was found that fiber type and yarn count havestatistically significant effect on yarn elongation (Table 7). It can be seen that in Table 7, the effects of fiber type (p = 0.0408) and blend ratio (p = 0.0300) on the elongation of all yarnsamples are statistically significant.
Table 7. ANOVA results of yarn elongation Source Sum of
Squares df Mean
Square F-value p-value
Model 53,18 3 17,73 4,64 0,0187 significant A-Blend (fiber type)
19,41 1 19,41 5,08 0,0408
B-Yarn count 22,27 1 22,27 5,83 0,0300 C-Blend Ratio 11,51 1 11,51 3,01 0,1046 Residual 53,48 14 3,82 Cor Total 106,66 17
Linear model was chosen as the proper model for ANOVA and optimization process with 0,3911 Adjusted R2 and 0,1995 Predicted R2 (Table 8). This model can be used to navigate the design space.
Table 8. Model selection values for elongotion Source Sequential
p-value Std. Dev. Adjusted R²
Predicted R² PRESS
Linear 0,0187 1,95 0,3911 0,1995 85,38 Suggested 2FI 0,8513 2,13 0,2768 -0,1582 123,5 Quadratic 0,0046 1,29 0,7330 0,4822 55,22 Aliased
3.3.Unevenness The unevenness values of the yarn samples are shown in Figure 3. It is clearly seen that, generally when the hemp fiber ratio increases, the unevenness values also increase. This is due to the fact that, hemp fiber has more fiber variation (thin, thick, long, short, hard, etc.) compared to other natural fibers (cotton, viscose and lyocell) because it is a stem (bast) origin fiber. Zhang et al. [3], they found that unevenness increased as the increase in the ratio of hemp fiber in polyester/hemp blended yarn samples.
ANOVA results for investigating the effects of fiber type, blend ratio and yarn count on the unevenness of all yarn samples are shown in Table 9. It is seen from Table 2, the effects of blend ratio (p < 0.0001) and yarn count (p = 0.0457) on unevenness of yarn samples are statistically significant. Also, the blend ratio has more important effect on yarn unevenness with a higher F
407

Value (69.65). The statistically significant p-value (p = 0,0384) of the term AC indicates animportant interaction between fiber type and blend ratio.
Figure 3. Unevenness of the yarn samples
Table 9. ANOVA results of yarn unevenness Source Sum of Squares df Mean Square F-value p-value
Model 273,19 6 45,53 14,39 0,0001 significant A-Blend (fiber type) 2,79 1 2,79 0,8831 0,3675 B-Yarn count 16,06 1 16,06 5,08 0,0457 C-Blend Ratio 220,33 1 220,33 69,65 < 0.0001 AB 7,60 1 7,60 2,40 0,1494 AC 17,49 1 17,49 5,53 0,0384 BC 8,91 1 8,91 2,82 0,1215 Residual 34,80 11 3,16 Cor Total 307,99 17
Linear model was chosen as the proper model for ANOVA and optimization process with 0,7287 Adjusted R2 and 0,5874 Predicted R2 (Table 10). This model can be used to navigate the design space.
Table 10. Model selection values for unevenness Source Sequential
p-value Std. Dev. Adjusted R² Predicted R² PRESS
Linear < 0.0001 2,22 0,7287 0,5874 127,07 Suggested 2FI 0,0502 1,78 0,8254 0,5604 135,4 Suggested Quadratic 0,6061 1,86 0,8091 0,4369 173,44 Aliased
408
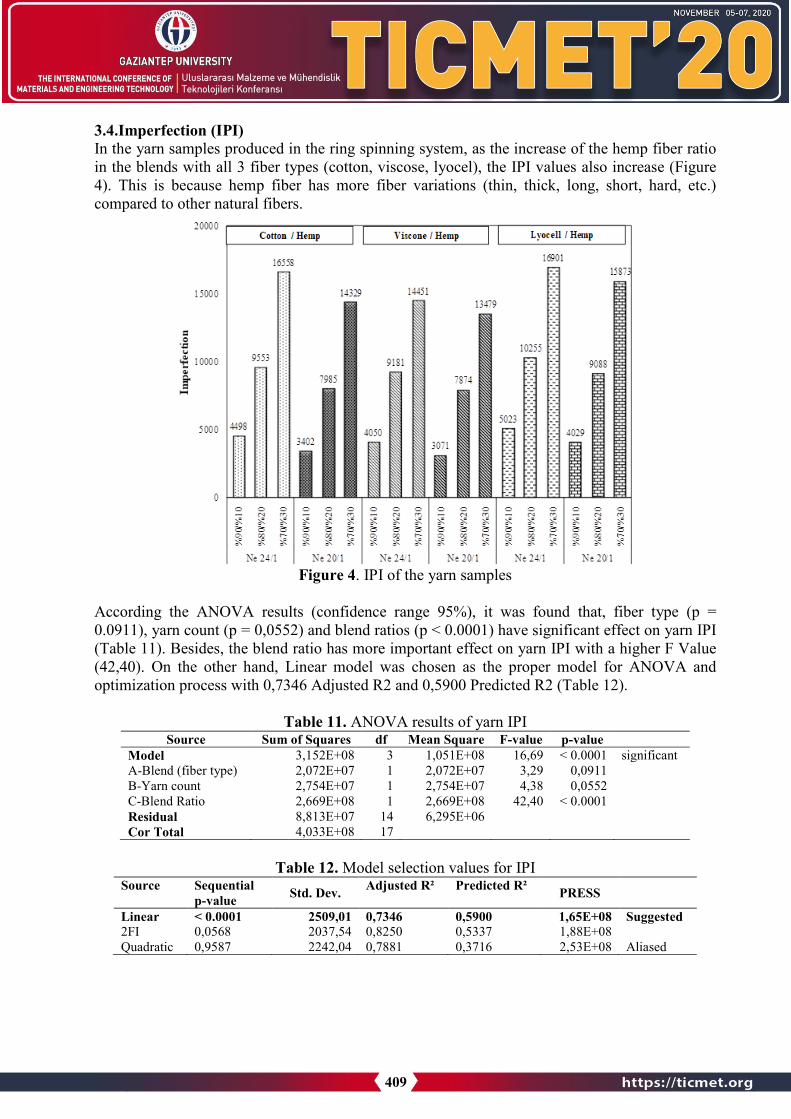
3.4.Imperfection (IPI) In the yarn samples produced in the ring spinning system, as the increase of the hemp fiber ratio in the blends with all 3 fiber types (cotton, viscose, lyocel), the IPI values also increase (Figure 4). This is because hemp fiber has more fiber variations (thin, thick, long, short, hard, etc.)compared to other natural fibers.
Figure 4. IPI of the yarn samples
According the ANOVA results (confidence range 95%), it was found that, fiber type (p = 0.0911), yarn count (p = 0,0552) and blend ratios (p < 0.0001) have significant effect on yarn IPI (Table 11). Besides, the blend ratio has more important effect on yarn IPI with a higher F Value (42,40). On the other hand, Linear model was chosen as the proper model for ANOVA and optimization process with 0,7346 Adjusted R2 and 0,5900 Predicted R2 (Table 12).
Table 11. ANOVA results of yarn IPI Source Sum of Squares df Mean Square F-value p-value
Model 3,152E+08 3 1,051E+08 16,69 < 0.0001 significant A-Blend (fiber type) 2,072E+07 1 2,072E+07 3,29 0,0911 B-Yarn count 2,754E+07 1 2,754E+07 4,38 0,0552 C-Blend Ratio 2,669E+08 1 2,669E+08 42,40 < 0.0001 Residual 8,813E+07 14 6,295E+06 Cor Total 4,033E+08 17
Table 12. Model selection values for IPI Source Sequential
p-value Std. Dev. Adjusted R² Predicted R² PRESS
Linear < 0.0001 2509,01 0,7346 0,5900 1,65E+08 Suggested 2FI 0,0568 2037,54 0,8250 0,5337 1,88E+08 Quadratic 0,9587 2242,04 0,7881 0,3716 2,53E+08 Aliased
409

3.5.Hairiness Another important parameter for good yarn quality is hairiness. The importance of hairiness value can be change according to the usage area. For example, if the usage area is winter cloth, it can be more hairy yarn or the usage area is spring cloth, it must be low hairiness properties. From Figure 5, it is clearly seen that, generally when the hemp fiber ratio increases, the hairiness values also increase.
Figure 5. Hairiness of the yarn samples ANOVA results (confidence range 95%) was shown that just blend ratio has a significant effect on yarn hairiness but the fiber type and yarn count have not statistically significant effect (Table 13).
Table 13. ANOVA results of yarn hairiness
Source Sum of Squares df Mean
Square F-value p-value
Model 1,18 3 0,3945 3,04 0,0641 not significant
A-Blend (fiber type) 0,1408 1 0,1408 1,09 0,3151
B-Yarn count 0,0044 1 0,0044 0,0336 0,8573 C-Blend Ratio 1,04 1 1,04 8,00 0,0134
Residual 1,82 14 0,1297 Cor Total 3,00 17
Linear model was chosen as the proper model for ANOVA and optimization process with 0,2648 Adjusted R2 and 0,0136 Predicted R2 (Table 14). This model can be used to navigate the design space.
410

Table 14. Model selection values for hairiness Source Sequential
p-value Std. Dev. Adjusted R² Predicted R² PRESS
Linear 0,0641 0,3602 0,2648 0,0136 2,96 Suggested 2FI 0,8620 0,3933 0,1232 -0,4829 4,45 Quadratic 0,0142 0,271 0,5839 -0,0157 3,05 Aliased
3.6.Optimization Results In this study, it is aimed to investigate an optimization model for hemp blended yarn samples. Fiber type, blend ratio and yarn count were chosen as process variables. The aim of this is todetermine the values of these process variables for maximizing the yarn strength, elongation, and minimizing uneveness, hairiness and IPI. The goal, limit, weight and importance levels ofprocess and response variables must be determined for the optimization process. The importance level, lower and upper limit values of the process and response variables can be seen that in Table 15.
Table 15. Values of process and response variables for the optimization process Name Goal Lower
Limit Upper Limit
Lower Weight
Upper Weight
Importance
A:Blend (fiber type)
is in range 1 3 1 1 3
B:Yarn count is in range 20 24 1 1 3 C:Blend Ratio is in range 4 6 1 1 3 Yarn Strength maximize 10,43 26,71 1 1 5 Yarn Elongation maximize 4,4 13,78 1 1 4 Unevenness minimize 12,51 24,73 1 1 5 IPI minimize 3071 16901 1 1 4 Hairiness minimize 4,71 6,18 1 1 3
Design Expert program (12.0 Version) gives the results of numerical optimization process after determining the desired goal and limit values. The results of the numerical optimization process for all yarn samples are given in Table 16. Table 16 shows the overall desirability values of the multi-response optimization process.
Table 16 also shows the obtained response variables of yarn strength, elongation, uneveness, hairiness and IPI values for each desirability value. Additionally, Table 16 exhibits the optimum the fiber type, blend ratio and yarn count values to obtain these response variables. The first line of Table 16 for all yarn samples gives the best result of the optimization process. This line clarify the highest values of yarn strength (23,588 kgf*Nm) and elongation (11,085 %), the lowest values of yarn uneveness (13,713 %), hairiness (5,405) and IPI (4175,944) values as desired at the beginning of the optimization process. Additionally, the required Lyocel / Hemp fiber blend, yarn count Ne 20/1 and blend ratio 90/10 % for this result can be obtained from this table. As seen from Table 16 that, good overall desirability value of 0,790 is achieved.
Figures 6-10 exhibit the response surface plots for optimization of the strength, elongation, unevenness, hairiness and IPI all of the yarn samples, respectively. It is seen from Figure 6 that the highest strength value of 26,7 is obtained with Lyocell / Hemp (90/10%) in Ne 20/1 yarn count. As seen from Figure 7, the maximum elongation value of 13,8 is obtained with Viscose /
411

Hemp (90/10%) in Ne 20/1 yarn count. From Figure 8-10 respectively, the lowest unevenness, hairiness and IPI values of 12.5, 4.7 and 3071 is obtained with Viscose / Hemp (90/10) in Ne 20/1 yarn count.
Table 16. The results of numerical optimization process Number Blend
(fiber type)
Yarn Count
Blend Ratio
Yarn Strength
Yarn Elongation
Unevenness Hairiness IPI Desirability
1 3,000 20,000 4,000 23,588 11,085 13,713 5,405 4175,944 0,790 2 2,993 20,000 4,000 23,566 11,076 13,714 5,404 4166,461 0,790 3 2,985 20,000 4,000 23,543 11,067 13,716 5,404 4156,623 0,790 4 3,000 20,046 4,000 23,566 11,060 13,696 5,405 4204,501 0,790 5 3,000 20,065 4,000 23,557 11,049 13,690 5,405 4216,342 0,789 6 2,977 20,000 4,000 23,519 11,056 13,718 5,403 4145,790 0,789 7 3,000 20,091 4,001 23,543 11,034 13,683 5,405 4235,301 0,788 8 2,966 20,000 4,000 23,485 11,042 13,720 5,402 4131,162 0,788 9 3,000 20,000 4,009 23,567 11,077 13,756 5,408 4217,349 0,788
10 3,000 20,128 4,000 23,528 11,014 13,667 5,404 4254,899 0,788 11 3,000 20,004 4,011 23,560 11,073 13,765 5,408 4229,685 0,788 12 2,964 20,029 4,000 23,466 11,024 13,710 5,401 4146,752 0,788 13 2,950 20,000 4,000 23,437 11,022 13,723 5,400 4110,347 0,787 14 3,000 20,186 4,000 23,500 10,982 13,647 5,404 4290,817 0,787 15 3,000 20,200 4,000 23,494 10,974 13,642 5,404 4299,686 0,786 16 2,933 20,000 4,000 23,384 10,999 13,726 5,398 4087,270 0,786 17 3,000 20,216 4,000 23,486 10,965 13,636 5,404 4309,406 0,786 18 2,912 20,000 4,000 23,322 10,973 13,731 5,396 4060,448 0,785 19 3,000 20,100 4,014 23,507 11,016 13,746 5,409 4303,427 0,785 20 3,000 20,285 4,000 23,453 10,926 13,611 5,403 4352,545 0,785
*Cotton/Hemp = 1, Viscose/Hemp = 2, Lyocell/Hemp = 3, 90/10 = 4, 80/20 = 5, 70/30 = 6
412

Figure 6. Response surface plot for optimization of yarn strength
Figure 7. Response surface plot for optimization of yarn elongation
Figure 8. Response surface plot for optimization of yarn unevenness
413

Figure 9. Response surface plot for optimization of yarn hairiness
Figure 10. Response surface plot for optimization of yarn IPI
414
4.Conclusion Hemp is naturally one of the most ecologically friendly, the strongest and stiffest available natural fibers. In recent years, this fiber has attention especially by yarn manufacturers in recent years due to some of its properties. In the literature, there is no systematical experimental study about hemp fibers. Therefore, this study is aimed to investigate the effects of yarn quality parameters of hemp blended yarn samples which produced by ring spinning system, systematically. For this purpose, cellulosic fibers (cotton, viscose, lyocell) were blended with hemp fiber in different blend ratios (90/10, 80/20, 70/30) and two different yarn count Ne 20/1 and Ne 24/1 in ring spun yarn samples were produced. Besides, an optimization model was developed to determine the blend ratio, fiber type and yarn count for the best response variablesof yarn properties (yarn strength, elongation, unevenness, hairiness, IPI). ANOVA results and experimental observations, it is obtained that, the blend ratio, fiber type and yarn count were significant effect of yarn quality parameters but some parameter (fiber type and yarn count) have not significant effect all of the variables.
According to the results of this study, hemp fiber ratio is important effect for yarn quality. On the other hand, other natural fiber type is also influence the yarn quality. Especially, lyocell/hemp blended yarn has good strength properties because of lyocell fiber. Besides, the results obtainedthat the optimized process result were selected lyocell/hemp (90/10%) with Ne 20/1 yarn count.
References
1. Manaia, J. P., Manaia, A. T., and Rodriges, L. Industrial Hemp Fibers: An Overview. Fibers.2016, 7(12), 106.
2. Zhang, H., Zhong, Z., & Feng, L. Advances in the performance and application of hempfiber. International Journal of Simulation Systems, Science & Technology, 2016, 17(9), 1-18.
3. Zhang, H., Zhang, J., and Gao, Y, Study on the relationship between blending ratio andperformance of hemp/polyester yarn. Journal of Natural Fibers. 2014, 11(2), 136-143.
4. Kozłowski, R., Czaplicki, Z., Zaręba, S., & Mańkowski, J, Rotor cotton yarns with thecontent of enzymatically modified hemp fibers. Journal of Natural Fibers. 2013, 10(1), 1-13.
5. Kim, H. A., & Kim, S. J., Hand and wear comfort of knitted fabrics made of hemp/Tencelyarns applicable to garment. Fibers and Polymers. 2018, 19(7), 1539-1547.
6. Yeliz, U., The Influence of Fibrilation on the Strength Values and Elongation of theRejenerated Cellulosic Fibres. Uludağ University Journal of The Faculty of Engineering.2010, 15(1).
415

VORTEKS EĞİRME SİSTEMİNDE FARKLI ÖZ VE SARGI LİFLERİNİN KULLANILMASIYLA ELDE EDİLEN İPLİKLERİN KALİTE
PARAMETRELERİNİN İNCELENMESİ
Kubilay Özden *1, Eyüp Ali Satıl1, Hadi Samet Mumcu1, Hatice Nida Civan1, Tülin Kaya Nacarkahya1
1Selçuk İplik San. ve Tic. A.Ş., Ar-Ge Merkezi, Gaziantep, Türkiye.
Özet
Tekstil endüstrisinde alternatif ürünlerin elde edilebilmesi amacıyla, çeşitli lifler ve teknikler kullanılarak farklı yapılarda ipliklerin üretilmesine yönelik pek çok çalışma yürütülmektedir. Son yıllarda büyük ilgi gören özlü iplik üretimi bu çalışmalar arasında yer almaktadır. Bu kapsamda, farklı özellikteki bileşenin özelliklerinden aynı anda, optimum ölçüde yararlanabilmek için farklı çekirdek (öz) ve özü kaplayan (sargı) lif içeren özlü iplik üretimi gerçekleştirilmektedir. Özlü iplik üretimleri literatürde genellikle ring ve rotor iplik eğirme sistemleri kullanılarak geliştirilmektedir. Ring ve rotor iplik eğirme sistemleri, vorteks iplik eğirme sistemine göre daha düşük üretim hızına ve daha fazla iplik üretim aşamalarına (fitil ve bobinleme işlemi) sahip olması nedeniyle son yıllarda vorteks iplik üretim sistemlerine talebi arttırmıştır. Bunun yanı vorteks iplik eğirme sisteminde özlü iplik üretimi sırasında öz kısımda kullanılan iplik büküm almamakta ve kesikli lifler etrafına sarılmaktadır. Bu çalışmada, vorteks iplik eğirme sisteminde üretilen, özlü iplik üretim aparatları aracılığı ile Ne 16/1 ve Ne 28/1 inceliğe sahip 7 farklı özlü iplik numune üretimleri gerçekleştirilmiştir. Gerçekleştirilen özlü iplik numune üretimlerinde, öz kısmında 3 farklı filament ( Polivinil Alkol (PVA), Tekstürüze Filament Polyester, Viskon (CV)) ve sargı kısmında 3 farklı lif şeridi (Viskon, Polyester ve Polyester/Viskon (65/35)) kullanılmıştır. Vorteks iplik eğirme teknolojisi kullanılarak geliştirilen özlü ipliklerin kopma mukavemeti, kopma uzaması, düzgünsüzlük, hata indeksi (IPI) ve tüylülük testleri gerçekleştirilerek, elde edilen iplik test sonuçları %95 güven aralığında istatistiksel olarak değerlendirilmiştir.
Anahtar Kelimeler: Özlü İplik, Vorteks, PVA, Tekstürize Filament Polyester
1. GirişÖzlü iplik iki farklı özellikteki bileşenin özelliklerinden aynı anda optimum ölçüdeyararlanabilmek için geliştirilmiş çekirdek (öz) ve özü kaplayan (sargı) liflerden oluşan birkompozit iplik yapısıdır. Özlü iplikler, aynı merkezli iki lif demetinden oluşan bir yapıya sahipolmakla birlikte bu lif demetlerinden ilki, ipliğe fonksiyonel özellik katmak için kullanılan veiplik merkezinde bulunan öz, diğer lif demeti ise daha çok konfor özelliğinden dolayı kullanılansargı dış tabakasıdır. Genellikle ipliklerin özünde sürekli (filament), sargı kısmında ise kaplamagörevi gören kesikli lifler (staple) kullanılmaktadır [1,2]. Vorteks iplik üretim sistemikullanılarak elde edilen iplik, orta kısımda yer alan merkez lifleri ve bu liflerin bir aradatutulmasını sağlayan sarım liflerinden oluşan bir yapıya sahiptir. İplik oluşumu sırasında, liflerin
416

iplik oluşum bölgesine giren ön kısımları, hava jetinin etkisiyle büküm alırlar ve merkez liflerini oluştururlar. Liflerin arka uçları ise merkez liflerinin etrafında sarım oluştururlar. İdealde, vorteks iplikte liflerin öncelikle merkez lifi olarak davrandığı ve daha sonra diğer ucunun ise sarım lifi şeklinde helisel olarak merkez liflerini sardığı belirtilmektedir [1,3,4].
Vorteks iplik eğirme sisteminde özlü iplik üretimi için ülkemizde yaygın ticari üretimbulunmamaktadır. Vorteks iplik eğirme sistemi, özlü ipliklerin yaygın olarak üretildiği ring eğirme sistemine göre fitil aşamasının ve bobinleme işleminin elimine edilmesi ve ring iplikeğirme sistemine göre daha yüksek üretim hızına çıkabilmesi avantajlarından dolayı daha düşük üretim maliyetine sahiptir.
Bu çalışma kapsamında Vorteks iplik üretim (MVS 870) eğirme sisteminde öz kısmında polivinil alkol, tekstürize filament polyester iplik ve vorteks viskon iplikleri kullanılmıştır. Sargı kısmında ise polyester, viskon ve bunların karışımı olan cer şeritleri iplik eğirme makinesinebeslenmiştir. Farklı öz ve sargı lifleri kullanılarak özlü iplik üretimi gerçekleştirilmiştir.Düzgünsüzlük, CVm, tüylülük, uzama ve mukavemet testleri gerçekleştirilmiştir, elde edilen sonuçlar istatistiksel olarak değerlendirilmiştir.
2. Materyal ve Yöntem 2.1. Özlü iplik numune üretimiÇalışma kapsamında, vorteks iplik eğirme sisteminde özlü iplik numune üretimi için kullanılansargı liflerinin hammadde özellikleri Tablo 1’de verilmiştir.
Tablo 1. Sargı lifi hammadde özellikleri Lif Özellikleri Polyester (PES) Viskon(CV) Lif İnceliği (dtex) 1,64 1,30 Lif Uzunluğu (mm) 38,0 32,0 Yoğunluk (g/cm3) 1,33 – 1,38 1,50 – 1,52 Mukavemet (cN/tex) 50,3 28,0 Uzama (%) 32,0 19,0
Vorteks iplik eğirme sisteminde özlü iplik üretimi gerçekleştirilirken öz kısımda, 73,8 dtex (Ne 80/1) Polivinil Alkol (PVA) (Tm=90°C), (100dtex/36f) tekstürize filament polyester iplik (siyah ve ekru) ve 118 dtex (Ne 50/1) viskon iplikler kullanılırken sargı lifi olarak, %100 polyester (ekru), %100 viskon (ekru) ve %65/35 polyester/viskon (ekru) kullanılmıştır. Toplam 7 adet numune özlü iplik üretimi gerçekleştirilmiştir. Tablo 2’de numune olarak üretilen özlü ipliklerin üretim özellikleri verilmiştir.
Tablo 2. Üretilen özlü iplikler Deneme Numarası
İplik Numarası
Öz Sargı Lifi Karışım Oranı (%)
1 Ne16/1 73,8 dtex PVA CV 20/80 2 Ne 28/1 73,8 dtex PVA CV 35/65 3 Ne 28/1 73,8 dtex PVA PES 35/65 4 Ne 28/1 73,8 dtex PVA PES/CV 35/65 5 Ne 28/1 100dtex/36f PES (ekru) CV 45/55 6 Ne 28/1 100dtex/36f PES (siyah) CV 45/55 7 Ne 28/1 118 dtex CV CV 25/75
417
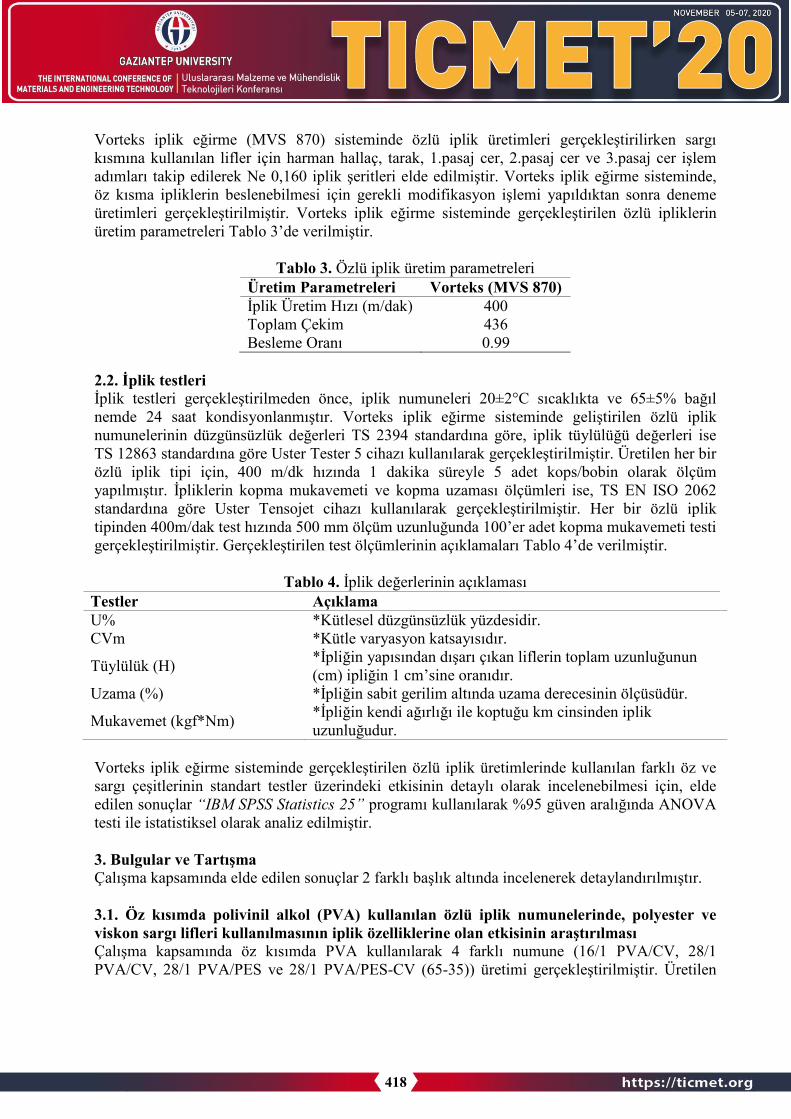
Vorteks iplik eğirme (MVS 870) sisteminde özlü iplik üretimleri gerçekleştirilirken sargıkısmına kullanılan lifler için harman hallaç, tarak, 1.pasaj cer, 2.pasaj cer ve 3.pasaj cer işlem adımları takip edilerek Ne 0,160 iplik şeritleri elde edilmiştir. Vorteks iplik eğirme sisteminde, öz kısma ipliklerin beslenebilmesi için gerekli modifikasyon işlemi yapıldıktan sonra deneme üretimleri gerçekleştirilmiştir. Vorteks iplik eğirme sisteminde gerçekleştirilen özlü ipliklerinüretim parametreleri Tablo 3’de verilmiştir.
Tablo 3. Özlü iplik üretim parametreleri Üretim Parametreleri Vorteks (MVS 870) İplik Üretim Hızı (m/dak) 400 Toplam Çekim 436 Besleme Oranı 0.99
2.2. İplik testleri İplik testleri gerçekleştirilmeden önce, iplik numuneleri 20±2°C sıcaklıkta ve 65±5% bağıl nemde 24 saat kondisyonlanmıştır. Vorteks iplik eğirme sisteminde geliştirilen özlü iplik numunelerinin düzgünsüzlük değerleri TS 2394 standardına göre, iplik tüylülüğü değerleri ise TS 12863 standardına göre Uster Tester 5 cihazı kullanılarak gerçekleştirilmiştir. Üretilen her bir özlü iplik tipi için, 400 m/dk hızında 1 dakika süreyle 5 adet kops/bobin olarak ölçümyapılmıştır. İpliklerin kopma mukavemeti ve kopma uzaması ölçümleri ise, TS EN ISO 2062 standardına göre Uster Tensojet cihazı kullanılarak gerçekleştirilmiştir. Her bir özlü ipliktipinden 400m/dak test hızında 500 mm ölçüm uzunluğunda 100’er adet kopma mukavemeti testi gerçekleştirilmiştir. Gerçekleştirilen test ölçümlerinin açıklamaları Tablo 4’de verilmiştir.
Tablo 4. İplik değerlerinin açıklaması Testler Açıklama U% *Kütlesel düzgünsüzlük yüzdesidir.CVm *Kütle varyasyon katsayısıdır.
Tüylülük (H) *İpliğin yapısından dışarı çıkan liflerin toplam uzunluğunun(cm) ipliğin 1 cm’sine oranıdır.
Uzama (%) *İpliğin sabit gerilim altında uzama derecesinin ölçüsüdür.
Mukavemet (kgf*Nm) *İpliğin kendi ağırlığı ile koptuğu km cinsinden iplikuzunluğudur.
Vorteks iplik eğirme sisteminde gerçekleştirilen özlü iplik üretimlerinde kullanılan farklı öz ve sargı çeşitlerinin standart testler üzerindeki etkisinin detaylı olarak incelenebilmesi için, elde edilen sonuçlar “IBM SPSS Statistics 25” programı kullanılarak %95 güven aralığında ANOVA testi ile istatistiksel olarak analiz edilmiştir.
3. Bulgular ve TartışmaÇalışma kapsamında elde edilen sonuçlar 2 farklı başlık altında incelenerek detaylandırılmıştır.
3.1. Öz kısımda polivinil alkol (PVA) kullanılan özlü iplik numunelerinde, polyester ve viskon sargı lifleri kullanılmasının iplik özelliklerine olan etkisinin araştırılması Çalışma kapsamında öz kısımda PVA kullanılarak 4 farklı numune (16/1 PVA/CV, 28/1 PVA/CV, 28/1 PVA/PES ve 28/1 PVA/PES-CV (65-35)) üretimi gerçekleştirilmiştir. Üretilen
418

numunelerde iplik numarasının iplik özelliklerine etkisi ve farklı sargı lifi (CV, PES ve PES/CV (65/35)) karışımlarının iplik özelliklerine etkisi incelenmiştir. Bu kapsamda geliştirilennumunelerin düzgünsüzlük, CVm, tüylülük (H), uzama ve mukavemet test sonuçları incelenmiş ve istatistiksel analizi gerçekleştirilmiştir. Şekil 1’de numunelerin düzgünsüzlük ve CVm test sonuçları verilmiştir.
Şekil 1. Düzgünsüzlük ve CVm test sonuçları
İplik numunelerin düzgünsüzlük test sonuçları incelendiğinde; öz kısımda aynı kalınlıkta PVA iplik kullanılmasına rağmen, iplik numarası azaltıkça düzgünsüzlük değerinin de azaldığı görülmektedir. Bunun sonucu, sargı lifinde kullanılan lif miktarının artmasından kaynaklandığı düşünülmektedir. Sargı lifleri vorteks iplik eğirme sisteminde hava yardımıyla merkezde konumlandırılan öz ipliğin etrafına sarılmaktadır. Sargı lifi miktarı arttıkça liflerin birbiri içerisine geçme oranı artmıştır ve düzgünsüzlük değerleri azalmıştır. Yılmaz ve ark. (2016) yaptıkları çalışmada farklı iplik numarasında üretilen ipliklerin düzgünsüzlük, tüylülük, uzama ve mukavemet değerlerini incelemişlerdir. Elde ettikleri sonuçlara göre; farklı iplik numarasında üretilen ipliklerde, iplik numarası kalınlaştıkça düzgünsüzlük değerlerinin iyileştiği görülmüştür [5]. Aynı iplik numarasında öz kısımda PVA kullanılan denemelerin düzgünsüzlük değerleri incelendiğinde ise; polyester oranı arttıkça düzgünsüzlük değerlerinin arttığı görülmektedir. Bunun nedeni viskon lifinin sahip olduğu sarmal yapıdan kaynaklanmaktadır. Sargı lifi olarak kullanılan viskon lifi, öz kısımda konumlandırılan öz ipliğe, sahip olduğu sarmal yapı özelliği sayesinde daha kolay sarmalanmaktadır [6]. Öz kısımda PVA içeren iplik numunelerinin CVm değerleri incelendiğinde ise; iplik numarası azaldıkça kütle varyasyonunun da azaldığı görülmektedir. Gerçekleştirilen literatür taramalarında benzer sonuçlara rastlanmıştır. Yapılan çalışmalarda; iplik inceldikçe ipliklerin düzgünsüzlük ve CVm değerlerinin kötüleştiği görülmektedir. İplik inceldikçe (yapıya katılan lif miktarı azaldıkça) uniform bir yapı elde etmenin zorlaştığı olarak gösterilmiştir [5,7,8]. Aynı iplik numarasında farklı sargı lifleri kullanılarak geliştirilen numunelerde ise viskon oranı arttıkça CVm değerleri azalmaktadır. Tyagi ve ark. (2004) tarafından yapılan çalışma da vorteks ipliklerde selülozik lif içeriği arttıkça
0
8
16
24
PVA/CV16/1
PVA/CV28/1
PVA/PES28/1
PVA/PES-CV28/1
Düz
güns
üzlü
k -C
Vm
(%)
Numune (Öz/Sargı Lifi)
U%
CVm
419

CVm değerlerinin arttığı görülmektedir. Bunun nedeni ise; viskon lifinin eğilme ve bükülme direncinin yüksek olmasından kaynaklandığı belirtilmiştir [9]. Şekil 2’de öz kısımda PVA içeren numunelerin tüylülük test sonuçları verilmiştir.
Şekil 2. Tüylülük test sonuçları
Farklı iplik numaralarında üretilen numunelerde iplik numarası arttıkça tüylülük değerinin azaldığı görülmektedir. Alay, S. ve Göktepe, F. [10] yaptıkları çalışmada farklı iplik eğirmesistemleri (ring ve open-end) kullanılarak üretilen ipliklerin tüylülük değerlerini incelediklerinde benzer şekilde iplik lineer yoğunluğu arttıkça tüylülük değerlerinin azaldığı sonucunavarmışlardır. Aynı iplik numarasına sahip, farklı sargı lifi kullanılarak üretilen özlü ipliknumunelerinde ise; sargı kısmında kullanılan polyester lifi oranının artmasının tüylülükdeğerlerini arttırdığı görülmektedir.Öz kısımda PVA içeren numunelerin uzama ve mukavemet sonuçları sırasıyla Şekil 3 ve Şekil 4’de verilmiştir.
Şekil 3. Uzama test sonuçları
0
2
4
6
8
PVA/CV16/1
PVA/CV28/1
PVA/PES28/1
PVA/PES-CV28/1
Tüy
lülü
k (H
)
Numune (Öz/Sargı Lifi)
0
5
10
15
20
PVA/CV16/1
PVA/CV28/1
PVA/PES28/1
PVA/PES-CV28/1
Uza
ma
(%)
Numune (Öz/Sargı Lifi)
420

Şekil 4. Mukavemet test sonuçları
Uzama ve mukavemet sonuçları incelendiğinde; polyester lifi, viskon lifinden daha yüksek uzama ve mukavemet değerine sahip olmasına rağmen sargı lifinde viskon lifi içeren özlü ipliknumunelerinin daha yüksek uzama ve mukavemet değerlerine sahip olduğu görülmektedir. Şekil 7’de gösterilen öz kısmında PVA iplik bulunan özlü ipliklerin mikroskop görüntüleri de bunu destekler niteliktedir. Şekil 5’de numunelerin kesit görüntüleri verilmiştir.
Şekil 5. (A) 73,8dtex PVA/CV 55x İplik kesit görüntüsü, (B) 73,8dtex PVA/CV 55x iplik kesit görüntüsü, (C) 73,8dtex PVA/PES 55x İplik kesit görüntüsü, 73,8 dtex PVA/PES-CV 55x İplik
kesit görüntüsü
Öz kısımda PVA kullanılan özlü iplik numunelerinde, polyester ve viskon sargı lifleri kullanılmasının iplik özelliklerine olan etkisi istatiksel olarak incelenmiştir (Bkz. Tablo 5). Elde edilen sonuçlara göre, iplik numarası Ne 16/1 ve Ne 28/1 Ne özlü ipliklerin düzgünsüzlük
0
8
16
24
32
PVA/CV16/1
PVA/CV28/1
PVA/PES28/1
PVA/PES-CV28/1
Muk
avem
et (k
gf*N
m)
Numune (Öz/Sargı Lifi)
421

(0,000), CVm (0,000), tüylülük (0,000) ve mukavemet (0,026) değerleri üzerinde anlamlı, uzama (0,651) değeri üzerinde anlamsız bir etkisinin olduğu sonucuna varılmıştır. Karışım oranlarının özlü ipliklerde düzgünsüzlük (0,000), CVm (0,000), tüylülük (0,000), uzama (0,000) ve mukavemet (0,007) değerleri üzerinde anlamlı bir etkisinin olduğu sonucuna varılmıştır.
Tablo 5. İplik özelliklerinin çoklu karşılaştırma tablosu
Kaynak Bağımlı Değişken
Tip III Kareler Toplamı df
Kareler Ortalaması F Sig.
Etki Düzeyi
Düzeltilmiş Model
U% 8,790a 3 2,930 2003,504 0,000 0,999 CVm 15,974b 3 5,325 3925,986 0,000 0,999 H 1,374c 3 0,458 3664,800 0,000 0,999 Uzama (%) 93,473d 3 31,158 79,479 0,000 0,968 Mukavemet (kgf*Nm) 14,683e 3 4,894 6,573 0,015 0,711
Kesişim U% 436,480 1 436,480 298447,934 0,000 1,000 CVm 699,948 1 699,948 516090,694 0,000 1,000 H 100,860 1 100,860 806880,000 0,000 1,000 Uzama (%) 804,115 1 804,115 2051,184 0,000 0,996 Mukavemet (kgf*Nm) 2342,943 1 2342,943 3146,448 0,000 0,997
İplik no U% 4,673 1 4,673 3195,103 0,000 0,998 CVm 8,178 1 8,178 6030,111 0,000 0,999 H 0,012 1 0,012 97,200 0,000 0,924 Uzama (%) 0,086 1 0,086 0,220 0,651 0,027 Mukavemet (kgf*Nm)
5,558 1 5,558 7,465 0,026 0,483
Karışım U% 0,176 2 0,088 60,222 0,000 0,938 CVm 0,431 2 0,215 158,728 0,000 0,975 H 1,172 2 0,586 4687,200 0,000 0,999 Uzama (%) 60,411 2 30,205 77,049 0,000 0,951 Mukavemet (kgf*Nm) 14,508 2 7,254 9,742 0,007 0,709
Hata U% 0,012 8 0,001 CVm 0,011 8 0,001 H 0,001 8 0,000 Uzama (%) 3,136 8 0,392 Mukavemet (kgf*Nm) 5,957 8 0,745
Toplam U% 964,134 12 CVm 1551,317 12 H 191,460 12 Uzama (%) 1946,196 12 Mukavemet (kgf*Nm) 5139,568 12
Düzeltilmiş Toplam
U% 8,802 11 CVm 15,985 11 H 1,375 11 Uzama (%) 96,609 11 Mukavemet (kgf*Nm) 20,640 11
422
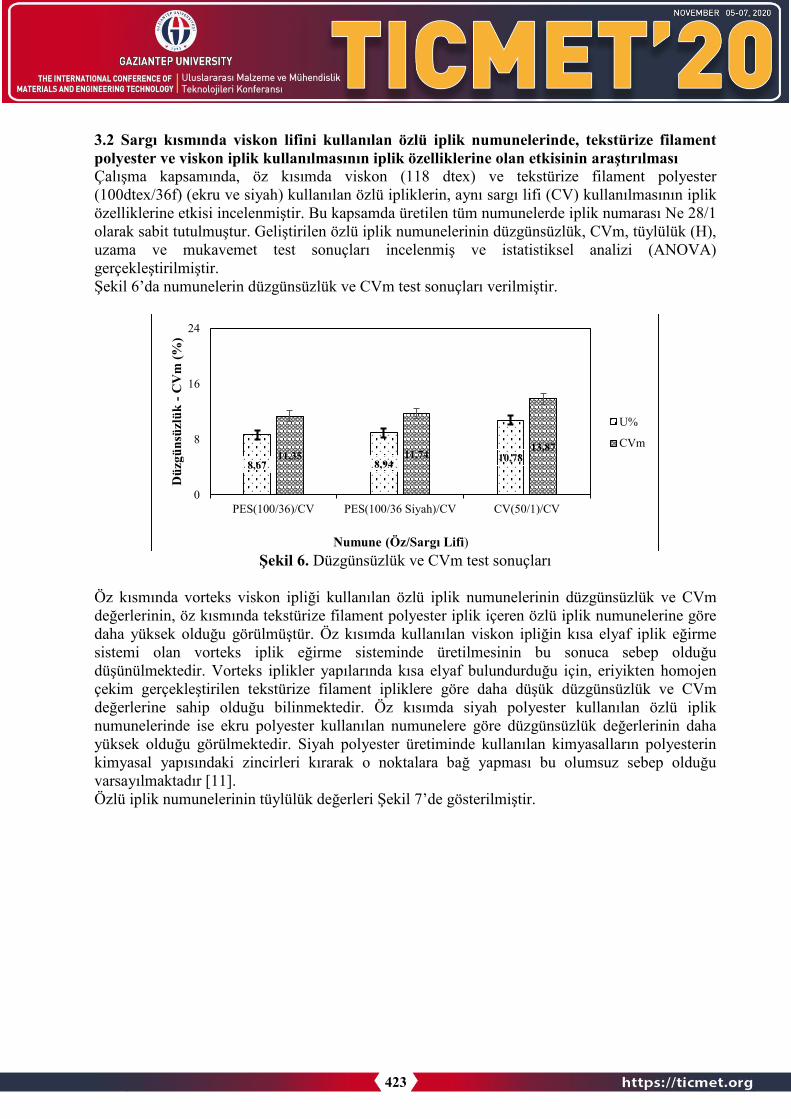
3.2 Sargı kısmında viskon lifini kullanılan özlü iplik numunelerinde, tekstürize filament polyester ve viskon iplik kullanılmasının iplik özelliklerine olan etkisinin araştırılmasıÇalışma kapsamında, öz kısımda viskon (118 dtex) ve tekstürize filament polyester (100dtex/36f) (ekru ve siyah) kullanılan özlü ipliklerin, aynı sargı lifi (CV) kullanılmasının ipliközelliklerine etkisi incelenmiştir. Bu kapsamda üretilen tüm numunelerde iplik numarası Ne 28/1 olarak sabit tutulmuştur. Geliştirilen özlü iplik numunelerinin düzgünsüzlük, CVm, tüylülük (H),uzama ve mukavemet test sonuçları incelenmiş ve istatistiksel analizi (ANOVA) gerçekleştirilmiştir.Şekil 6’da numunelerin düzgünsüzlük ve CVm test sonuçları verilmiştir.
Şekil 6. Düzgünsüzlük ve CVm test sonuçları
Öz kısmında vorteks viskon ipliği kullanılan özlü iplik numunelerinin düzgünsüzlük ve CVm değerlerinin, öz kısmında tekstürize filament polyester iplik içeren özlü iplik numunelerine göre daha yüksek olduğu görülmüştür. Öz kısımda kullanılan viskon ipliğin kısa elyaf iplik eğirme sistemi olan vorteks iplik eğirme sisteminde üretilmesinin bu sonuca sebep olduğu düşünülmektedir. Vorteks iplikler yapılarında kısa elyaf bulundurduğu için, eriyikten homojen çekim gerçekleştirilen tekstürize filament ipliklere göre daha düşük düzgünsüzlük ve CVm değerlerine sahip olduğu bilinmektedir. Öz kısımda siyah polyester kullanılan özlü iplik numunelerinde ise ekru polyester kullanılan numunelere göre düzgünsüzlük değerlerinin daha yüksek olduğu görülmektedir. Siyah polyester üretiminde kullanılan kimyasalların polyesterin kimyasal yapısındaki zincirleri kırarak o noktalara bağ yapması bu olumsuz sebep olduğu varsayılmaktadır [11]. Özlü iplik numunelerinin tüylülük değerleri Şekil 7’de gösterilmiştir.
8,67 8,94 10,7811,35 11,7413,87
0
8
16
24
PES(100/36)/CV PES(100/36 Siyah)/CV CV(50/1)/CV
Düz
güns
üzlü
k -C
Vm
(%)
Numune (Öz/Sargı Lifi)
U%
CVm
423

Şekil 7. Tüylülük test sonuçları
Öz kısımda tekstürize filament polyester içeren özlü iplik numunelerinin tüylülük değerleriincelendiğinde; siyah tekstürize filament polyester iplik içeren özlü iplik numunelerinin, ekrutekstürize filament polyester içeren özlü ipliklere göre tüylülük değerlerinin düşük olduğu görülmektedir. Yıldırım ve diğ [11] siyah tekstürize filament polyesterin üretimi sırasında kullanılan kimyasalların polyesterin polimer yapısının ayrılmasına sebep olduğunu belirtmişlerdir. Tüylülük üzerinde olumsuz etki yaptığı varsayılmaktadır. Sargı lifinde viskon lifi kullanılan özlü iplik numunelerinin uzama ve mukavemet değerleri Şekil 8 ve Şekil 9’de gösterilmiştir.
Şekil 8. Uzama test sonuçları
3,402,24
3,69
0
2
4
6
8
PES(100/36)/CV PES(100/36 Siyah)/CV CV(50/1)/CV
Tüy
lülü
k (H
)
Numune (Öz/Sargı Lifi)
16,4814,85
8,55
0
5
10
15
20
PES(100/36)/CV PES(100/36 Siyah)/CV CV(50/1)/CV
Uza
ma
(%)
Numune (Öz/Sargı Lifi)
424

Şekil 9. Mukavemet test sonuçları
Özlü iplik numunelerinin uzama ve mukavemet değerleri incelendiğinde; öz kısımda kullanılanviskon ipliği ve sargı kısmında kullanılan viskon lifi ile üretilen özlü iplik numunesinin en düşük uzama ve mukavemet değerlerine sahip olduğu görülmektedir. Bu iplik yapısının tamamında kısa lif kullanılmasından dolayı beklenen bir sonuçtur. Öz kısmında ekru ve siyah tekstürize filament polyester kullanılan numuneler kıyaslandığında ise; siyah tekstürize filament içeren numunelerin ekru numunelere göre daha düşük uzama ve mukavemet değerlerine sahip olduğu görülmektedir. Bu da yine boya moleküllerinin polimer zincirini ayırarak yeni bağ oluşturmasından kaynaklandığı düşünülmektedir. Şekil 10’de numunelerin kesit görüntüleriverilmiştir.
Şekil 10. (A) 100dtex/36f PES/CV 55x İplik Kesit Görüntüsü, (B) 100dtex/36f PES/CV 55x Siyah İplik Kesit Görüntüsü, (C) 118 dtex CV/CV
Tablo 6. İplik özelliklerinin çoklu karşılaştırma tablosu
Kaynak Bağımlı Değişken
Tip III Kareler Toplamı df
Kareler Ortalaması F Sig.
Etki Düzeyi
Düzeltilmiş Model
U% 7,624a 2 3,812 2365,952 0,000 0,999 CVm 11,039b 2 5,520 914,867 0,000 0,997 H 3,532c 2 1,766 17661,000 0,000 1,000 Uzama (%) 407,578d 2 203,789 644,222 0,000 0,995 Mukavemet (kgf*Nm) 449,893e 2 224,946 273,974 0,000 0,989
Kesişim U% 803,912 1 803,912 498979,559 0,000 1,000
27,8924,56
11,51
0
10
20
30
40
PES(100/36)/CV PES(100/36 Siyah)/CV CV(50/1)/CV
Muk
avem
et (k
gf*N
m)
Numune (Öz/Sargı Lifi)
425

CVm 1366,042 1 1366,042 226415,735 0,000 1,000 H 87,049 1 87,049 870489,000 0,000 1,000 Uzama (%) 626,501 1 626,501 1980,509 0,000 0,997 Mukavemet (kgf*Nm) 4089,603 1 4089,603 4980,942 0,000 0,999
Karışım U% 7,624 2 3,812 2365,952 0,000 0,999 CVm 11,039 2 5,520 914,867 0,000 0,997 H 3,532 2 1,766 17661,000 0,000 1,000 Uzama (%) 407,578 2 203,789 644,222 0,000 0,995 Mukavemet (kgf*Nm) 449,893 2 224,946 273,974 0,000 0,989
Hata U% 0,010 6 0,002 CVm 0,036 6 0,006 H 0,001 6 0,000 Uzama (%) 1,898 6 0,316 Mukavemet (kgf*Nm) 4,926 6 0,821
Toplam U% 811,545 9 CVm 1377,117 9 H 90,582 9 Uzama (%) 1035,977 9 Mukavemet (kgf*Nm) 4544,422 9
Düzeltilmiş Toplam
U% 7,633 8 CVm 11,076 8 H 3,533 8 Uzama (%) 409,476 8 Mukavemet (kgf*Nm) 454,819 8
Tablo 6’da testi gerçekleştirilen iplik değerlerinin sonuçlarının değerlendirilmesi amacıyla SPSS paket program kullanılarak %95 güven aralığında analizleri yapılmıştır. Elde edilen sonuçlara göre, iplik numarası Ne 28/1 özlü iplik karışım oranlarının özlü ipliklerde düzgünsüzlük (0,000), CVm (0,000), tüylülük (0,000), uzama (0,000) ve mukavemet (0,000) değerleri üzerinde anlamlı bir etkisinin olduğu sonucuna varılmıştır.
4. Sonuçlar
Öz kısımda polivinil alkol kullanılan özlü iplik numunelerinde, polyester ve viskon sargı lifleri kullanılmasının iplik özelliklerine olan etkisinin araştırılması
• Özlü ipliğin öz kısmında aynı özelliklere sahip PVA iplik kullanılmasına rağmen ipliknumarasının kalınlaştığında düzgünsüzlük kalite parametresinin azaldığı sonucunavarılmıştır.
• Sargı kısımda kullanılan lif miktarının artışına bağlı olarak iplik hacimliliği artmış bunabağlı olarak CVm değerleri düşmüştür.
• Tüylülük kalite parametresinde ise, iplik numarasının artmasıyla ve sargı kısmındakullanılan polyester lif miktarının artışıyla birlikte tüylülük değerlerinin arttığıgözlemlenmiştir.
• Uzama ve mukavemet kalite değerleri incelendiğinde sargı kısmında kullanılan polyesterelyafının viskon elyafına göre daha yüksek uzama ve mukavemet değerlerine sahipolmasına rağmen sargı kısmında viskon içeren özlü ipliklerin daha yüksek uzama vemukavemet kalite değerlerine sahip olduğu tespit edilmiştir.
426

Sargı kısmında viskon lifi kullanılan özlü iplik numunelerinde, tekstürize filament polyester ve viskon iplik kullanılmasının iplik özelliklerine olan etkisinin araştırılması
• Öz kısımda 50/1 Ne vorteks üretim hattında üretilmiş viskon ipliği kullanılan özlüipliklerde düzgünsüzlük, CVm, tüylülük kalite değerlerinin yüksek, uzama vemukavemet kalite parametrelerinin düşük olduğu sonuçları elde edilmiştir.
• Öz kısımda siyah tekstürize filament polyester kullanılan özlü iplik numunelerindedüzgünsüzlük ve CVm kalite değerlerinin yüksek olduğu sonuçlarına varılmıştır.
• Öz kısımda siyah tekstürize filament polyester kullanılan özlü iplik numunelerindetüylülük, uzama ve mukavemet kalite değerlerinin, ekru tekstürize filament polyesterözlü iplik numunelerine göre daha düşük olduğu sonuçları elde edilmiştir.
Bu çalışmanın, vorteks iplik eğirme sistemlerinde üretilen iplikler ile farklı kullanım alanlarına (takım elbise gibi dokuma veya bayan örme dış giyim vb. ) sahip kumaşların üretilmesine ışık tutacağı düşünülmektedir.
Kaynakça1. Vuruşkan, D., Sargı Lifi ve Öz Materyalinin Çift Özlü İpliklerin Kalite Özelliklerine Etkileri,
Tekstil ve Mühendis, 2019, 26(115).2. Rahman, A., Rashid, K.M.M., Shawpon, S.R., Rahman, A. ve Siddiqui, N., Effect of Core
Draft on The Properties of Core Spun Yarn, Bangladesh University of Textiles, 2013.3. Örtlek, H. G., Influence of Selected Process Variables on the Mechanical Properties of Core-
Spun Vortex Yarns Containing Elastane, Fibres and Textiles, 2006, (42-43).4. Örtlek, H. G. ve Babaarslan, O., Spandex (lycra) içerikli core-spun ipliklerin (pes/viskon)
tüylülük özelliklerinin incelenmesi, Uludağ Üniversitesi Mühendislik-Mimarlık FakültesiDergisi, 2003, (79-93).
5. Yılmaz, D. ve Kayabaşı, G., Lif Türü ve İplik İnceliğinin Vortex İplik Özelliklerine Etkisininİncelenmesi, Süleyman Demirel Üniversitesi Fen Bilimleri Enstitüsü Dergisi, 2016, 20(2),(244-253).
6. Özgüney, A. T., Bahtiyari, M. İ., Körlü, E. A. ve Bahar, M., Viskon Liflerinin FizikselÖzellikleri ve Makromolekülerüstü Yapısı, Tekstil ve Konfeksiyon, 2006, 16(2), (100-104).
7. Erdumlu, N., Özipek, B., Öztuna, A.S ve Çetinkaya, S. Investigation of Vortex Spun YarnProperties in Comparison with Conventional Ring and Open‐End Rotor Spun Yarns. TextileResearch Journal, 2009, 7, (585-595).
8. Erdumlu, N., An Approach to Investigate the Spinnability of Fine Count Yarns on VortexSpinning System. Istanbul Technical University, 2011.
9. Tyagi, G.K., Sharma, D. ve Salhotra, K.R., Process‐Structure‐Property Relationship OfPolyester‐Cotton MVS Yarns: Part Influence Of Processing Variables On Yarn StructuralParameters, Indian Journal of Fibre & Textile Research, 2004, 290, (419-428).
10. Göktepe, F. ve Alay, S. Farklı İplik Tüylülüğü Test Cihazlarından Elde Edilen SonuçlarınKarşılaştırılması, Süleyman Demirel Üniversitesi Fen Bilimleri Enstitüsü Dergisi, 2006,10(3), (422-427).
11. Yıldırım, F.F., Avinç, O.O. ve Yavaş, A., Poli (Trimetilen Tereftalat) Lifleri Bölüm 2:Terbiye İşlemleri, Tekstil ve Mühendis, 2012, 19(88).
427

DESIGN OF NOVEL COMPACT THREE-ROVING SPINNING TECHNOLOGY
MURAT DEMIR*1, MUSA KILIÇ1, SERDAR SAYIN2, ZEKI KIRAL3, FURKAN BALDUK4, KIYMET KUBRA DENGE4
1Dokuz Eylül University, Engineering Faculty, Dept. of Textile Engineering, İzmir, TURKEY 2Dokuz Eylül University, The Graduate School of Natural and Applied Sciences, Dept. of Mechatronics
Engineering, İzmir, TURKEY 3Dokuz Eylül University, Engineering Faculty, Dept. of Mechanical Engineering, İzmir, TURKEY
4KİPAŞ Mensucat R&D Center, Kahramanmaraş, TURKEY
Abstract
The importance of producing yarn in different structures and reducing production costs hasdramatically increased in recent years. Many alternative spinning technologies were introducedto achieve these goals. Some of these technologies rely on completely innovative working principles while some of them improved from existing technologies with some modifications. Siro-spun and compact technologies were developed from conventional technology with some modifications and can be counted as the most successful derivative spinning systems in terms of usage rate. This study focuses on the design of compact three-roving spinning technology thatprovides the produce three-roving yarns in a single process. Three-roving yarn can be counted as an economic alternative of three-plied yarns by eliminating the doubling and twisting machine from the production process. Besides, the composite structure of three-roving yarns thatcontaining three-different raw material in a single yarn structure might provide the use of these yarns for specific purposes. As the new technology inspired by siro-spun and compact spinning technologies, auxiliary parts of both technologies were redesigned. In order to feed three-roving into the drafting zone simultaneously and control roving-space, three-roving funnel and three-grooved delivery cylinder were designed. Furthermore, air-suction guide and suction inserts of compact spinning technology were designed to create a condensing zone for individual rovings. All auxiliary parts were designed to be compatible with 3D printers and all parts were assembled on pneumatic compact technology. Eventually, a novel compact three-roving yarn production system that enables to produce of three-roving yarn was introduced.
Keyword: three-roving yarn, spinning technology, composite yarn, twist spinning, compact spinning
1. IntroductionDerivative spinning technologies are an effective way to meet market demand that producingyarn in different structures and more economic way. Using existing technologies to developalternative spinning technologies provides the rapid adoption and easiness of usage. Siro-spunand compact spinning technologies are the derivative spinning technologies that developed fromconventional spinning technology. Some auxiliary parts are added to conventional technology
428

for the development of both technologies and due to some superior yarn properties, they had a rapid market share. In the working principle of siro-spun, roving funnel and delivery cylinder are added on the ring spinning and two individual rovings are fed into the drafting zone. In this way,two-plied yarn structure is produced in a single process and better yarn properties are obtainedthan conventional methods. The basic principle of compact spinning is to reduce the spinning triangle with negative air-pressure to provide to join more fibers in the yarn structure. Currently,compact spinning that create negative air pressure in a different principle exist in the market, and roller-type and lattice apron are the most commonly used compact technologies.
Superior yarn properties of siro-spun and compact spinning are supported by the studies in the literature. In the studies that compare siro-spun and conventional yarns showed that siro-spun yarns have better hairiness, imperfections, and mechanical properties than conventional yarns [1-2]. In some studies, production parameters of siro-spun were investigated and researches pointed out that roving space is the most significant parameter that affects yarn quality [3-4-5]. Comparing compact and conventional technologies also showed that taking advantage of using negative air pressure positively affect yarn properties [6-7]. It is also shown that auxiliary parts that used for compact spinning affect the condensing zone as well as the yarn properties [8-9].
Three-roving yarns have recently been the focus of many research either being an economic alternative of three-plied yarn with similar structure or composite structure that enables to contain different raw materials in a single structure. Studies for the three-roving yarn showed that staple core yarns can be produced with this technology using fibers in different cut lengths and fineness. It is also shown that three-components of the spinning triangle could cause more than one yarn formation point and it affects yarn properties. In the studies that compare three-plied and three-roving yarn structures also showed that three-roving yarns have better hairiness values and similar mechanical properties with three-plied yarns but imperfections andunevenness values should be improved [12-13-14].
This study aims to design compact three-roving yarn spinning technology to produce three-roving yarn in better quality. For this novel technology, feeding three-rovings into the drafting zone at the same time and creating a separate condensing zone for each of the roving are two major goals for a successful production. To achieve these goals, the first three-roving funnel and three-grooved delivery cylinder were designed as inspired by siro-spun technology. Then, auxiliary parts of pneumatic compact spinning were designed to create a separate condensing zone for individual rovings. All of the designed new auxiliary parts were mounted on the pneumatic compact spinning and compact three-roving spinning technology is presented.
2. MethodsNewly designed auxiliary parts of compact three-roving spinning can be categorized into twogroups. In the first group, three-grooved delivery cylinder and three-roving funnel are designedto feed rovings into the drafting zone and control the roving space. In the second group, air-suction guides and suction inserts of pneumatic compact spinning were resigned to create aseparate condensing zone for each of the rovings. In pneumatic compact spinning technologywith perforated drum, both of the designed parts are assembled on the inner and outer surfaces ofthe perforated drum. Therefore, the boundary of the condensing zone is defined with the air-holes on the perforated drum and it is 12 mm. In order to achieve better-condensing effectswithin the limited zone for three-of the rovings, different structures of the air-suction guide and
429

suction inserts were designed. All new auxiliary parts were designed with Solidworks softwareand compatible with 3D printer.
2.1 Three-roving funnel The roving funnel is placed before the drafting zone and controls the roving movement into the drafting zone. For the system that aims to feed three-rovings into the drafting zone, a three-roving funnel was designed (Figure 1).
Figure 1. Designed and 3D printed three-roving funnel
2.2. Three-grooved delivery cylinder The delivery cylinder is placed before the main drafting zone in siro-spun technology and control roving space. For the compact three-roving spinning technology with the similar principle of siro-spun, a three-grooved delivery cylinder was designed (Figure 2). In order to keep three rovings within the limited condensing zone of 12 mm, the roving space was set as 3mm.
Figure 2. Designed and 3D printed three-grooved delivery cylinder
2.3 Air-suction Guides The air-suction guide is one of the most significant parts that affect the condensing zone. In pneumatic compact spinning technology, air first goes through the air-suction guide and it diverts the air around the fiber bundle. Since the air-slots on the suction-guides directly affect the
430

condensing zone, different structures of air-suction guides were designed within the scope of the study (Figure 3). In the designing process of suction guides, length, the structure of air-entrance slots, and the geometry of the condensing zone were changed. After all, three different structures of air-suction guides were introduced.
Figure 3. Different structures of designed and 3D printed air-suction guides
2.4 Suction-insert
The suction insert is placed on the inner surface of the perforated drum and air follows the geometry of the slot after goes through the holes on the perforated drum. for the compact three-roving spinning three slots suction inserts were designed. Since the geometry of air slots is effective on the condensing of fibers, different structures were designed (Figure 4). In the first design, air-slots are in a straight structure. In the second design, narrowed air slots were designed.
Figure 4. Different structures of designed and 3D printed suction-inserts
431

2.5 Compact three-roving spinning technology For compact three-roving spinning, newly designed auxiliary parts within the scope of the study were assembled on the pneumatic compact technology with the perforated drum (Figure 5). Three-grooved delivery cylinder was assembled before the drafting zone to feed three rovingsinto the drafting zone. three-grooved delivery cylinder was placed before the main drafting areato control roving space. Air-suction guides and suction inserts were placed on the inner and outersurface of the perforated drum to create condensing zone for individual rovings.
Figure 5. Compact three-roving spinning technology
3. ConclusionsIn the scope of the study, a spinning technology was designed to produce compact three-rovingyarn. As this technology can be counted as a derivative form of siro-spun and compact spinningtechnologies, new auxiliary parts of both technologies were redesigned. Compact three-rovingspinning technology was introduced by assembling newly designed parts. This new technologyenjoys the advantages of feeding three-rovings into the drafting zone and compacting the fiberbundle before the yarn formation point. In this way, it was assumed to produce three roving yarnin better quality and increase the competitiveness of three-roving yarn against the similarstructure of three-plied yarns. Besides, the composite structure of the three-roving yarn mightprovide a specific usage area for these yarns. In the future studies, properties of compact three-roving yarn will be compared with three-plied, compact and compact-siro-spun yarns.
Acknowledgement This study is supported by The Scientific and Technological Research Council of Turkey- TEYDEB 1505 University-Industry Collaboration Grant Programme with the project number 5160091and accompanied with KİPAŞ Mensucat R&D center.
432
References
1. Yıldız B.S., Kilic, M.. An Investigation on Properties of Siro-spun Yarns. Annals ofUniversity Oradea Fasciles of Textile and Leatherwork. 2017, vol:18:131-136.
2. Soltani P. & Johari, M.S. A study on siro-, solo-, compact-, and conventional ring-spunyarns. Part I: structural and migratory properties of the yarns, Journal of The TextileInstitute, 2012, 103:6, 622-628, DOI: 10.1080/00405000.2011.595567
3. Cheng, K.P.S & Sun M.N. Effect of Strand Spacing and Twist Multiplier on Cotton Siro-Spun Yarn. Textile Research Journal , 1998, vol: (68).
4. Miao,M., Cai, Z., Zhang, Y. Influence of Machine Variables on Two-strand YarnSpinning Geometry. Textile Research Journal, 1993 vol: 63 (2):116-120.
5. Emanuel A., Plate, D. Alternative Approach to Two-Fold Weaving Yarn, Part II. TheTheoretical Model. Journal of The Textile Institute, 1982, vol (73), pp.108-116.
6. Altaş, S. & Kadoğlu, H. Comparison of Conventional Ring, Mechanical Compact andPneumatic Compact Yarn Spinning Systems. Journal of Engineered Fibers and Fabrics,2012, vol 7(1).
7. Basal, G. & Oxenham, W. Comparison of Properties and Structures of Compact andConventional Spun Yarns Textile Research Journal, ,2006, Vol 76(7): 567–575 DOI:10.1177/0040517506065591
8. Su X, Gao W, Liu X. Numerical simulation of flow field in complete condensingspinning: effects of suction unit and guiding device. J Text Inst, 2016, 107(7): 811-824.
9. Su X, Gao W, Liu X, Xie C, Xu, B. Numerical Simulation of a Three-dimensional FlowField in Compact Spinning with a Perforated Drum: Effect of a guiding device. Text ResJ, 2013; 83(19): 2093-2108.
10. Matsumoto Y, Kimura H, Yamamoto T, Matsuoko T, Fukushima K. Characteristics ofNovel Triplet Spun Yarns made from Fibers of Differing Fineness. Text Res J 2009; 79(10): 947-952.
11. Matsumoto M, Matsumoto Y, Kanai H, Wakako L, Fukushima K. Construction of TwinStaple-core Spun Yarn with two Points of Yarn Formation in One Twisting Process. TextRes J,2014; 84(17):1858–1866.
12. Demir, M. and Kilic, M. Investigating Possibilities of Three-Strand Yarn Production.Fibres and Textiles 2017; 24(1) : 30-35.
13. Demir, M. An Investigation on Production Possibilities of Three-Roving SewingThreads, Master Thesis, Dokuz Eylul University, Turkey, 2017.
14. Demir M, Kilic M. A modified Twist spinning-three-roving Yarn Spinning. In:International Conference TexTeh IX Advanced Textiles for a Better World. Bucharest,Romania, 24-25 October 2019.
433

FİTİL KULLANIMI İLE ÜRETİLEN İKİ İPLİK VE ÜÇ İPLİK ÖRME KUMAŞLARIN HAVA GEÇİRGENLİĞİNİN İNCELENMESİ
Mustafa Gürkan BEKAR1, Hatice Kübra KAYNAK2, Yasemin KORKMAZ1
1 Kahramanmaraş Sütçü İmam Üniversitesi, Tekstil Mühendisliği Bölümü, Kahramanmaraş/TÜRKİYE
Gaziantep Üniversitesi, Tekstil Mühendisliği Bölümü, Gaziantep/ TÜRKİYE
Özet
Bu çalışma kapsamında, kalın ve hacimli yapıları sebebiyle özellikle kışlık günlük giysilerde ve spor giysilerinde kullanılan iki iplik ve üç iplik örme kumaşlar için, yenilikçi bir kumaş yapısı sunulmuştur. Bu kapsamda, iki iplik ve üç iplik örme kumaş yapılarında astar ipliği olarak kullanılan kalın iplikler yerine, ring iplik eğirme sisteminin ara mamulü olan fitil malzemesikullanılmıştır. Ancak, bu yenilikçi kumaş yapısının sağladığı kullanım performansının mevcut ikameleri ile karşılaştırılması önem arz etmektedir. İki ve üç iplik örme kumaşların en çok tercih edildiği son kullanım alanı günlük giysiler ve spor giysiler için en çok talep edilen performansözelliği ise, kalın ve hacimli yapıdaki bu kumaşların sağlayacağı nefes alabilirlik performansıdır.Bu çalışma kapsamında, nefes alabilirlik özelliğinin tespiti için mevcut yöntem ile üretilen veastar ipliği olarak fitil kullanımıyla üretilen iki iplik ve üç iplik kumaşların hava geçirgenliğiperformansları incelenerek karşılaştırılmıştır. Çalışma sonucunda üç iplik kumaşlarda astaripliği yerine fitil malzemesinin kullanımı hava geçirgenliğinde bir değişikliğe neden olmazken iki iplik kumaş yapısında, önemli derecede düşüş görülmüştür.
Anahtar Kelimeler: iki iplik örme kumaş, üç iplik örme kumaş, hava geçirgenliği, nefes alabilirlik
INVESTIGATION OF THE AIR PERMEABILITY OF TWO THREAD AND THREE THREAD FLEECE KNITTED FABRICS PRODUCED BY ROVING STRAND
Abstract
In this study, an innovative fabric structure is submitted for two thread and three thread fleecy fabrics which are generally used for casual and sportswear due to their high thickness value and high loft structure. In this point of view, roving strand is used instead of coarse fleece yarn for two thread and three thread fleecy fabrics. Besides, it is so important to figure out the performance properties of the novel fabric structure in comparison to available counterparts. The foremost property of the high loft two thread and three thread fleece fabrics is the breathability owing to the end use of casual wear and sportswear. In this study, the air permeability property of the novel and available two thread and three thread fleecy fabric samples are investigated and compared. Consequently, the air permeability results are similar for three thread fleecy fabric samples, whereas a considerable decrease is observed for the novel type two thread fleecy fabric sample.
Keywords: two thread fleecy fabric, three thread fleecy fabric, air permeability, breathability
434

1. Giriş
İki ve üç iplik örme kumaşlar; tek plakalı yuvarlak örgü makinelerinde üretilen kalın ve hacimli örme kumaş yapılarıdır. Bu kumaş yapılarında kumaşın ön yüzünde görünür halde bulunan zemin ipliğinin yanı sıra kumaşın arka yüzünde kumaşa hacim ve kalınlık katmak amacıyla kullanılan astar iplikleri bulunmaktadır. Astar ipliği olarak genellikle kalın iplikler tercih edilmektedir. İki iplik ve üç iplik örme kumaş yapılarının şematik görünümü Şekil 1 ve Şekil 2’de verilmiştir.
Şekil 1. İki iplik kumaş yapısı [1]
Şekil 2. Üç iplik kumaş yapısı [1]
İki iplik ve üç iplik örme kumaşlar üzerine yapılan çalışmalar incelendiğinde, literatürde birçok araştırmacının yıkama sonrası boyutsal dayanım, may dönmesi ve çarpılma gibi özellikler üzerine çalıştıkları görülmektedir. Saha ve arkadaşları iki iplik kumaş yapısında boya alımının kumaşın birim ağırlık, ışık haslığı, yıkama haslığı, sürtme haslığı, ter haslığı, su haslığı, may dönmesi ve yıkamaya karşı boyutsal dayanım özelliklerine etkilerini incelemişlerdir. Yapılan çalışmada boya alımının artmasıyla, birim ağırlığın arttığını ve ışık haslığının iyileştiğini, may dönmesinin azaldığını, ter ve su haslığının değişmediğini, yıkama ve sürtme haslığının ve boyutsal dayanımın kötüleştiğini ifade etmişlerdir [2]. Rassel ve Hoque, %100 pamuk üç iplik örme kumaşların boyutsal dayanım, may dönmesi ve patlama mukavemeti özellikleri üzerine yaptıkları çalışmada, zemin ipliği sabit kalmak şartı ile bağlantı ve astar olarak farklı numaralarda iplik kullanımının etkilerini incelemişlerdir. Çalışma sonucunda bağlantı ipliğinin may dönmesi üzerinde oldukça etkili olduğunu ve daha kalın ipliklerin kullanılmasıyla may dönmesi değerlerinin düştüğünü bildirmişlerdir. İlaveten bağlantı ipliğinin kalınlaşmasıyla en ve boy yönündeki çekme değerlerinin azaldığını tespit etmişlerdir. Bağlantı ve astar ipliği olarak
435

daha kalın ipliklerin kullanılmasıyla patlama mukavemeti değerinde artış saptamışlardır [3]. Fouda iki iplik bitim işlemi görmüş ve şardonlanmış kumaşlarda kullanılan astar ipliği numarasının ve büküm faktörünün, kumaşın yıkama sonrası boyutsal dayanım, may dönmesi, aşınma dayanımı, patlama mukavemeti ve ısıl iletkenlik, su buharı geçirgenliği ve hava geçirgenliği gibi konfor özelliklerine etkilerini incelemiştir. Astar ipliği olarak daha kalın ipliklerin kullanılmasıyla boyutsal dayanımın iyileştiğini ve may dönmesinin azaldığını bildirmiştir. Isıl konfor açısından değerlendirildiğinde, daha kalın ipliklerin kullanılmasıyla, havageçirgenliğinin ve su buharı geçirgenliğinin düştüğünü ve ısıl iletkenliğin arttığını belirtmiştir. İlaveten daha kalın astar ipliklerinin kullanılmasıyla daha yüksek mukavemet ve daha iyi aşınma dayanımı elde edildiğini tespit etmiştir [4]. Demirhan ve Meriç farklı oranlarda polyester içeren üç iplik kumaşların yıkama ve kurutma sonrası boyutsal dayanım performanslarını incelemişlerdir. Çalışmada, %33, %30 ve %20 oranlarında polyester içeren, üç iplik örme kumaşların ardışık üç yıkama sonrası boyutsal dayanım özellikleri incelenmiştir. Yapılan testlersonucunda polyester içeriği arttıkça çekme değerlerinin azaldığı görülmüştür [5]. Değirmenci ve Çelik, denim görünümüne ulaşabilmek için iki iplik kumaş yapısında zemin ipliğinde %100pamuk, indigo boya ile boyanmış iplik ve astar olarak pamuk, modal, viskon, polyester, tencel, bambu, polyester-pamuk (65-35), polyester-viskon (65-35) ve pamuk-modal ipliklerkullanmışlardır. Çalışma sonucunda, astar ipliğinde polyester lif karışımlı iplik kullanılmasıyla yıkamaya karşı boyutsal dayanım özelliğinin iyileştiği bildirilmiştir [6]. Shahbaz ve arkadaşları, iplik numarası, bükümü ve ilmek uzunluğu gibi bazı değişkenlerin iki ve üç iplik örme kumaşların çekmesi üzerindeki etkilerini incelemişlerdir. Çalışma sonucunda, bu değişkenlerin uygun kombinasyonu ile en ve boy çekmelerinin kontrol edilebileceğini bildirmişlerdir [7]. Özcan ve Candan, üç iplik örme kumaşlarda, ilmek uzunluğu ve iplik cinsinin üç iplik örme kumaşların 5 ev tipi yıkama ve kurutma sonrası boyutsal dayanım ve çarpılma özelliklerineetkilerini incelemişlerdir. İlaveten, yıkama öncesinde ve sonrasında kumaşların patlama mukavemeti, aşınma ve boncuklanma dayanımlarını araştırmışlardır. Çalışma sonucundapolyester-pamuk karışımı kullanılmasıyla kumaşların boyutsal dayanım, boncuklanma dayanımı ve patlama mukavemeti özelliklerinin iyileştiği bildirilmiştir. İlaveten, yıkama sonrasında kumaşlarda meydana gelen çekmenin kumaşa daha sıkı bir yapı kazandırdığı ve böylelikle dahayüksek patlama mukavemeti ve daha yüksek aşınma dayanımı sağladığı bildirilmiştir [8].
Diğer yandan, iki iplik ve üç iplik örme kumaş yapılarının genellikle günlük giysilerde ve spor giysilerinde kullanılması sebebiyle, literatürde bazı araştırmacıların bu kumaş yapılarının ısıl konfor ve nem yönetimi özellikleri üzerinde çalıştıkları görülmektedir. Saha ve arkadaşları üç iplik kumaş yapısında polyester kullanımının kumaşın ısıl konfor özelliklerine etkilerini incelemişlerdir. Elde edilen hava geçirgenliği, su buharı geçirgenliği ve ısıl iletkenlik test sonuçlarına göre yazlık kullanımlarda %100 pamuk ve kışlık kullanımlarda ise %80-20 pamuk-polyester karışımlı üç iplik kumaş kullanımının ısıl konfor açısından uygun olacağını bildirmişlerdir [9]. Badr ve Nahrawy, üç iplik kumaşlarda zemin ve astar ipliği cinsinin kumaşın nem yönetimi özelliklerine etkilerini incelemişlerdir. Bu amaçla zemin ve astar ipliğinde farklı konfigürasyonlarda, %100 tencel, bambu ve pamuk ipliklerini kullandıkları üç iplik kumaşlarda, boyama sonrası renk farkı, su buharı geçirgenliği, su emiciliği, nem alımı, hava geçirgenliği ve kuruma zamanı özelliklerini incelemişlerdir. Tencel kullanılan kumaşlarda bambu ve pamuk lifine göre daha yüksek su buharı geçirgenliği değerleri elde etmişlerdir. Zemin ve astar ipliklerinin her ikisinde tencel ve bambu kullanılmasıyla daha yüksek hava geçirgenliği değerleri elde edilmiştir. Su emiciliği tespiti için yapılan batma süresi ölçümünde zemin ve astar
436

ipliklerinin her ikisinde bambu ve tencel kullanılmasıyla en düşük batma süreleri tespit edilmiştir. Çalışma sonucunda, daha iyi bir kullanıcı konforu için zemin ve astar ipliklerinin herikisinde rejenere selüloz ipliklerin kullanımının uygun olduğunu bildirmişlerdir [10]. Güneşoğlu ve arkadaşları, zemin ve astar ipliklerinde kullanılan lif cinsinin ve kumaşlara uygulanan şardonlama işleminin iki iplik kumaşların ısıl soğurganlık özelliği üzerine etkileriniincelemişlerdir. Bu amaçla %100 pamuk ve polyester-pamuk karışımlı iplikleri zemin ve astar ipliği olarak iki iplik kumaş yapısında farklı konfigürasyonlarda kullanmışlardır. Elde edilenkumaş numunelerine kuru ve ıslak halde ısıl soğurganlık testi uygulamışlardır. Yapılan çalışma sonucunda şardonlama işleminin kumaşın ısıl soğurganlık özelliği üzerine etkisi önemlibulunmuş ancak şardonlanmış kumaşlarda astar ipliğinde kullanılan lif cinsinin ısıl soğurganlık üzerinde etkisiz olduğu bildirilmiştir [11].
Diğer yandan, İslam ve arkadaşlarının üç iplik kumaşların arka yüzünde meydana gelensürtünme sonucunda lif kaybının araştırılması üzerine yapılan bir çalışmada kullanılan lif tipininaşınma dayanımına etkisi araştırılmıştır. Çalışma sonucunda, pamuk, viskon-polyester-pamuk ve polyester olmak üzere üç farklı kumaş yapısı kullanılmıştır. Kumaşlar boyanmış ancak şardonuygulanmamıştır. Çalışma sonucunda polyester kumaş numunesinde daha yüksek aşınma dayanımı tespit edilmiştir [12].
Literatürde iki iplik ve üç iplik kumaşlar üzerine yapılan çalışmalar incelendiğinde, bu çalışmaların genel olarak, daha yüksek kumaş kullanım performansı elde etmek amacıyla üretim ve hammadde parametrelerinin incelenmesi üzerine yapıldığı görülmektedir. Literatürdeki çalışmalardan farklı olarak, bu çalışma kapsamında, iki iplik ve üç iplik örme kumaşlarda,kumaşın arka yüzünde kullanılan astar ipliği yerine fitil malzemesi beslenerek, yenilikçi birkumaş yapısı oluşturulmuştur. Bilindiği üzere, tekstil işletmelerinin rekabet şartları gittikçezorlaşmaktadır. Bundan dolayı, pazara farklı ürünler sunabilmek her geçen gün çok daha önemli hale gelmektedir. İki iplik ve üç iplik örme kumaşlar için tasarlanan bu yenilikçi kumaşyapısında, astar ipliği yerine fitil malzemesi kullanılmıştır. Sonrasında bu örme kumaşnumunelerinin kullanım esnasında sunacağı nefes alabilirlik özelliğinin incelenmesi amacıylahalihazırda mevcut ikameleri ile karşılaştırmalı olarak hava geçirgenliği özellikleri incelenmiştir.
2. Materyal ve MetotÇalışma kapsamında iki iplik ve üç iplik kumaş numunelerinde astar ipliği yerine kullanılacakfitil malzemesi %100 pamuktan üretilmiştir. Bu amaçla kullanılan pamuk lifinin özellikleri UsterHVI cihazı ile ölçülmüş ve elde edilen değerler Tablo 1’de verilmiştir.
Tablo 1. Fitil üretiminde kullanılan pamuk lifinin özellikleri Lif Özellikleri Değerler
Elyaf inceliği, Micronaire 3,86 UHML, mm 27,78 İplik eğirme indeksi 119 Olgunluk 0,86 Kısa elyaf indeksi (SFI) 8,7 Mukavemet, g/tex 30,4 Uzama, % 6,5
437

Çalışma kapsamında, örme kumaşlarda astar ipliği yerine kullanılan %100 pamuk lifinden üretilmiş fitil malzemesinin üretimi için öncelikle 0,1 Ne tarak şeridi üretilmiştir. Sonrasında, birinci pasaj cerde 0,120 Ne cer şeridi üretilmiştir. İkinci pasaj cerde ise bir sonraki üretim aşamasında Ne 3/1 fitil üretebilmek amacıyla 0,160 Ne incelikte cer şeridi üretilmiştir. Fitilüretim aşamasında ise 160 T/M büküm ile, Ne 3/1 fitil üretimi gerçekleştirilmiştir. Üretilen fitil malzemesi tek plakalı yuvarlak örgü makinesinde iki iplik ve üç iplik kumaş üretiminde astaripliği yerine kullanılmıştır. Astar ipliği yerine fitil malzemesi kullanılmasıyla üretilen vehalihazırdaki mevcut kumaşların fotoğraflanan arka yüzey görünümleri Şekil 3’te verilmiştir.
Şekil 3. Fitil malzemesi kullanılarak elde edilen kumaşın arka yüzey görünümü (solda), astar ipliği kullanılan kumaşın arka yüzey görünümü (sağda)
İki iplik kumaş numunesi 34 pus, 10 fein ve 48 sistem konvansiyonel bir örgü makinesi kullanılarak, 3/1 diyagonal yapıda üretilmiştir. İki iplik kumaş numunesinde %100 pamuk, Ne 30/1 iplik numarasında iki adet penye ring ipliğinin zemin ipliği olarak beslenmesi ve astar ipliği olarak Ne 3/1 fitil kullanılmasıyla üretim yapılmıştır. Karşılaştırma amacıyla bu numune ile aynı üretim şartlarında ve aynı zemin ipliğinin kullanıldığı yapıda, sadece astar kısmında %100 pamuk telefinden Ne 7/1 iplik numarasında iki adet O.E. rotor ipliği beslenerek iki iplik kumaş için kontrol numunesi üretilmiştir.
Tablo 2. Numune kumaşların yapısal özellikleri Numune Özellik
Kumaş kalınlığı (mm)
Kumaş gramajı (g/m²)
Çubuk sayısı (adet/cm)
İlmek sayısı (adet/cm)
Astarı fitilli iki iplik
2,03 469 7 11
Astarı iplikli iki iplik
1,99 438 7 12
Astarı fitilli üç iplik
2,88 606 7 13
Astarı iplikli üç iplik
2,03 579 7 14
438

Üç iplik kumaş numunesi, 32 pus, 13 fein ve 96 sistem konvansiyonel bir örgü makinesi kullanılarak 3/1 diyagonal yapıda üretilmiştir. Üç iplik kumaş numunesinde zemin ve bağlantı ipliği olarak %100 pamuk, Ne 30/1 penye ring ipliği ve astar ipliği yerine Ne 3/1 fitilkullanılmasıyla üretim yapılmıştır. Karşılaştırma amacıyla bu numune ile aynı üretim şartlarında ve aynı zemin ipliğinin kullanıldığı yapıda sadece astar kısmında %100 pamuk telefinden Ne 4/1 rotor ipliği kullanılarak üç iplik kumaş için kontrol numunesi üretilmiştir. Daha sonra kumaşnumuneleri aynı şartlar altında boyanmıştır. Kumaş numunelerinin arka yüzüne şardon işlemi uygulanmamıştır. Numune kumaşların ilmek sıklığı [13], gramaj [14] ve kalınlık [15] özellikleri Tablo 2’de verilmiştir. Numune kumaşların fotoğraflanan ön ve arka yüzey görünümleri Şekil 4’te verilmiştir.
Numune Ön yüz Arka yüz
Astarı fitilli iki iplik
Astarı iplikli iki iplik
Astarı fitilli üç iplik
Astarı iplikli üç iplik
Şekil 4. Numune kumaşların yüzey görünümleri
439

Elde edilen numunelerin hava geçirgenliği özellikleri SDL Atlas dijital hava geçirgenliği cihazı ile ölçülmüştür [16]. Test 100 Pa basınç farkında, 20 cm² test başlığı ile her bir numuneden 10 ölçüm alınarak yapılmıştır.
3. Sonuçlar Hava geçirgenliği, sabit basınç farkında, kumaşın belirli bir yüzey alanından geçen havanın akış hızı olarak tanımlanabilir. Giysiden beklenen konfor özelliklerinden bir tanesi terlemeden kaynaklanan su buharının giysinin iç kısmından dışına doğru transfer edilebilmesi, diğer bir ifadeyle iyi seviyede nefes alabilir olmasıdır. İyi seviyede hava geçirgenliği sağlayabilen bir kumaşın aynı zamanda iyi derecede nefes alabilir olması beklenir. Bu nedenle, hava geçirgenliğikonfor açısından nefes alabilirliğin bir ifadesi olarak değerlendirilebilir. Bu çalışma kapsamında, astar ipliği yerine fitil malzemesi kullanılarak üretilen numune kumaşların hava geçirgenliği test sonuçları halihazırda mevcut ikameleri ile karşılaştırmalı olarak Şekil 5’te verilmiştir.
Şekil 5. Numune kumaşların karşılaştırmalı hava geçirgenliği test sonuçları
Hava, kumaş yapısı içerisinde iplikler arasında ve lifler arasında bulunan boşluklardan geçer. Dolayısıyla kumaş yapısında iplikler arasındaki ve lifler arasındaki boşlukların fazla olmasına sebep olan yapısal nedenler kumaşta hava geçirgenliğini arttırır. Diğer yandan, hava kumaşın bir yüzünden diğer yüzüne geçerken kumaşın kalınlığı kadar yol kat eder. Hava geçişi esnasında, havanın kat etmesi gereken mesafenin uzun olması yani kumaş kalınlığının fazla olması, havanın karşılaştığı engel sayısının fazla olmasına, geçiş esnasında havanın sahip olduğu kinetik enerjinin azalmasına ve hava geçiş hızının düşmesine neden olur. Bu nedenle, ilmek ve çubuk sıklığının artması iplikler arası boşlukları azaltarak hava geçirgenliğinin düşmesine sebep olur. Kumaş kalınlığının artması havanın kat edeceği mesafeyi arttıracağından hava geçirgenliğini düşürür. Kumaş gramajının artması ise, kumaş yapısındaki tekstil malzemesinin miktarını yani
İki iplik Üç iplikFitilli 189,1 190,2İplikli 324,5 187,6
0
50
100
150
200
250
300
350mm/sn
Hava geçirgenliği
440

havanın kumaştan geçişi esnasında karşılaşacağı engel sayısını arttıracağından havageçirgenliğini düşürür.
İki iplik kumaş numunelerine ait hava geçirgenliği değerleri incelendiğinde, astar ipliği yerine fitil malzemesinin kullanıldığı kumaş numunesinde, astarında iplik kullanılan numuneye göre oldukça düşük hava geçirgenliği değerleri elde edildiği görülmektedir. İki iplik kumaşnumunelerinin yapısal özellikleri değerlendirildiğinde, kumaş kalınlığı ve ilmek-çubuk sayısı değerlerinin hemen hemen aynı olduğu, kumaş gramajı açısından ise fitil malzemesi kullanılannumunenin daha yüksek değere sahip olduğu görülmektedir. Gramajı yüksek olan fitil kullanılannumunenin daha düşük hava geçirgenliğine sahip olması beklenen bir durumdur.
Üç iplik kumaş numunelerine ait sonuçlar incelendiğinde, hava geçirgenliği değerlerinin birbirine oldukça yakın olduğu görülmektedir. Yapısal özellikler açısından ise, numunelerinilmek ve çubuk sayısının hemen hemen eşit olduğu fakat fitil kullanılan numunenin kalınlık ve gramaj değerlerinin diğer numuneden yüksek olduğu görülmektedir. Ancak numunenin kalınlıkve gramaj değerinin yüksek olması hava geçirgenlik değerinde bir azalmaya neden olmamıştır.Bu durumun, kumaştan hava geçişi esnasında, hava geçirgenliği üzerinde etkili olan iplik hareketliliğinden kaynaklandığı düşünülmektedir. Kumaş yapısından hava geçişi esnasında, hava kumaş yapısındaki ipliklerin ve liflerin hareket etmesine neden olur. Üç iplik kumaşlar, iki iplikkumaşlardan farklı olarak yapılarında bağlantı ipliğine sahiptirler. Bağlantı iplikleri bilindiği gibi üç iplik kumaş yapısının iki iplik kumaş yapısına göre, esnekliği daha düşük ve daha dengeli bir yapıya sahip olmasına neden olur. Üç iplik kumaş yapısında iplik hareketliliğinin az olmasının kalınlık ve gramaj farklılığının kumaşın hava geçirgenliğinde yarattığı etkiyi dengelediği düşünülmektedir.
4. TartışmaBu çalışma kapsamında, iki iplik ve üç iplik kumaş yapısında astar ipliği yerine fitil malzemesikullanılmasıyla yenilikçi bir iki iplik ve üç iplik örme kumaş yapısı elde edilmesi amaçlanmıştır.İki iplik ve üç iplik örme kumaşların genellikle günlük giysilerde ve spor giysilerindekullanılması sebebiyle, elde edilen yenilikçi kumaş yapılarında konfor açısından havageçirgenliği özelliği incelenmiştir. Elde edilen sonuçlar, iki iplik kumaş yapısında fitilkullanılmasıyla hava geçirgenliğinin önemli derecede düştüğü ancak üç iplik numunelerdefarklılık olmadığını göstermektedir. Bu nedenle, üç iplik kumaş yapısında astar ipliği yerine fitilkullanılmasının, iki iplik kumaşa göre konfor açısından daha uygun olacağı kanaati oluşmuştur.
Kaynaklar 1. https://www.promodoro-shop.de/frontend_10/index.cfm?SEI_ID=_dsp_qualitaet&sKZ_Sprache=E2. Saha, J., Siddiquee A.A., Dey, S.C., Effect of shade% on gsm, spirality, shrinkage and colorfastness properties of the weft knitted two thread fleece fabrics, 2012, Journal of Science andTechnology, 2(2): 167-174.3. Rassel, M.A., Hoque, M.M.U. An Investigation into the Dimensional Stability of 100%Cotton Fleece Knit Fabric, Journal of ELT and Education, 2019, 2(2): 41-47.4. Foudaa, A.E., Effect of backed yarn characteristics on two thread fleece knitted fabricproperties, Indian Journal of Fibre & Textile Research, 2018, 43: 247-251.
441

5. Demirhan, F., Meriç, B., Örme kumaş ve giysilerde yıkama ve kurutma sonrası boyutdeğişimlerinin incelenmesi, Pamukkale Üniversitesi Mühendislik Bilimleri Dergisi, 2005, 11 (3)381-390.6. Değirmenci, Z., Çelik, N., An investigation on the influence of laundering on the dimensionalstability of the denim-like knitted fabrics, TEKSTİL ve KONFEKSİYON, 2014, 24(4):363-370.7. Shahbaz, B., Jamil, N.A., Rafi, S., Shrinkage control of fleece knit fabrics by some yarn andknitting variables, Pakistan Journal of Applied Sciences, 2002, 2(77): 715-718.8. Özcan , G. Candan, C., Properties of Three-Thread Fleece Fabrics, Textile Res. J., 2005,75(2), 129–133.9. Saha, P.K., Haque, A., Islam, T., Paul, D., Saha, J.K., A Study on Thermal Comfort Feeling Properties of 60%/40% and 80%/20% Cotton/Polyester and 100% Cotton Fleece, J Textile Sci & Fashion Tech, 2019, 4(3):1-5. 10. Badr, A.A., Nahrawy, A.E., Moisture properties of raised 3-thread fleece fabric knitted withdifferent face and fleecy yarns, Alexandria Engineering Journal, 2016, 55, 2881–2892. 11. Gunesoglu, S., Meric, B., Gunesoglu, C., Thermal Contact Properties of 2-Yarn Fleece Knitted Fabrics, FIBRES & TEXTILES in Eastern Europe April / June 2005, Vol. 13, No. 2 (50), 46-50.12. Islam, A., Rahman, S., Haque, F., Figure out the weight loss percentage of three thread fleece fabric composed of different fibres for abrasion on the technical back side, International Journal of Scientific and Research Publications, 2015, 5(9):1-5. 13. TS EN 14971: 2013. Tekstil-Örülmüş Kumaşlar-Birim Uzunluk ve Birim Alan Başına Örgü İlmeği Sayısının Tayini. 14. TS EN 12127: 1999. Tekstil-Kumaşlar-Küçük Numuneler Kullanarak Birim Alan Başına Kütlenin Tayini. 15. TS 7128 EN ISO 5084: 1998. Tekstil-Tekstil ve Tekstil Mamullerinin Kalınlık Tayini.16. TS 391 EN ISO 9237 Tekstil -Kumaşlarda hava geçirgenliğinin tayini
442

POLYESTER HAV İPLİKLERİNDE FİLAMENT İNCELİĞİNİN HALILARDA STATİK YÜKLEME SONRASI REZİLYANS
PERFORMANSINA ETKİSİNİN İNCELENMESİ
Gülbin FİDAN1, Yasemin KORKMAZ2, Halil İbrahim ÇELİK3
1Gaziantep Üniversitesi, Naci Topçuoğlu Meslek Yüksekokulu, Gaziantep, TÜRKİYE 2 Kahramanmaraş Sütçü İmam Üniversitesi, Mühendislik Mimarlık Fakültesi, Tekstil Mühendisliği Bölümü,
Kahramanmaraş, TÜRKİYE 3 Gaziantep Üniversitesi, Mühendislik Fakültesi, Tekstil Mühendisliği Bölümü, Gaziantep, TÜRKİYE
Özet
Polyester lifi tekstil endüstrisinde en fazla kullanılan sentetik liflerin başında gelmektedir. Halı üretiminde hav ipliği olarak en çok kullanılan akrilik ve polipropilen gibi sentetik liflerin yanında polyester lifi de kendine önemli bir yer bulmuştur. Polyester elyafının sahip olduğu yüksek mukavemet, halıdaki mukavemet ve aşınma dayanımını da arttırmaktadır. Bu durum, polyester elyafının halı sektöründe kendine yer bulmasını kolaylaştırmaktadır. Filament inceliği, dolayısıyla iplik içerisindeki filament sayısı, iplik mukavemetine ve elastikiyetine etki eden en önemli parametrelerinden birisidir. Bu bağlamda farklı filament inceliklerinde üretilen hav ipliklerinin göstereceği rezilyans performansının da farklı olması beklenmektedir.
Bu çalışmada, farklı filament inceliklerine sahip polyester hav ipliklerinden üretilen halıların kısa süreli statik yükleme sonrası rezilyans performanslarının incelenmesi amaçlanmıştır. Hav ipliği numuneleri; 384, 576 ve 768 filament sayılarında, 1200 denye polyesterden üretilmiştir. Halı numuneleri wilton tipi yüz-yüze dokuma metodu ile üretilmiştir. Test sonuçları istatistiksel olarak analiz edilerek, filament inceliğinin statik yükleme sonrasında rezilyans performansı üzerinde anlamlı bir etkiye sahip olduğu belirlenmiştir.
Anahtar Kelimeler: Filament inceliği, polyester, kısa süreli statik yükleme, rezilyans, halı.
INVESTIGATION OF THE EFFECT OF FILAMENT FINENESS ON POLYESTER PILE YARNS ON RESILIENCE PERFORMANCE AFTER
STATIC LOADING IN CARPETS
Abstract
Polyester fiber is one of the most used synthetic fibers in the textile industry. In addition to synthetic fibers such as acrylic and polypropylene, which are mostly used as pile yarn in carpet production, polyester fiber has also found an important place for itself. The high strength of polyester fiber also increases the strength and abrasion resistance of the carpet. This situation makes it easier for polyester fiber to find a place in the carpet industry. Filament fineness, thus the number of filaments in the yarn, is one of the most important parameters affecting the yarn
443

strength and elasticity. So it is expected that the resilience performance of pile yarns produced with different filament fineness will be different.
In this study, it was aimed to investigate the resilience performance of carpets produced from polyester pile yarns with different filament fineness after short-term static loading. 1200 denier polyester pile yarn samples were produced with 384, 576 and 768 filament numbers. Carpet samples were produced with face to face wilton weaving type. The test results were analyzed statistically and it was determined that the filament fineness has a significant effect on the resilience performance after static loading.
Keywords: Filament fineness, polyester, short-term static loading, resilience, carpet
1.Giriş Makine halısı üretiminde, hav ipliğinde yaygın olarak kullanılan lifler, akrilik, polipropilen,poliamid, yün, polyester lifleridir. Yün lifinin yüksek kalitesine rağmen fiyatının çok yüksekolması, akrilik lifinin yüne bir alternatif olarak makine halıcılığında kullanımını arttırmıştır. Yün ve akrilik liflerinde yaşanan tüylenme, alerji riski gibi problemler, polipropilen lifini düşük maliyeti, düşük yoğunluğu, güvelenmeye karşı dayanımı gibi özellikleriyle ön plana çıkarmış ve yaygın bir biçimde kullanılmasına yol açmıştır. Akrilik ve polipropilen günümüzde makine halıcılığı sektöründe yaygın olarak kullanılan liflerin başında gelmektedir. Polyester lifleri ise makine halıcılığında kullanımı gittikçe artan liflerden biridir.
Tekstil endüstrisinde yaygın kullanılan sentetik lif olan polyesterin stapel ve filament formunda kullanım alanı oldukça geniştir. Filament iplikler birçok giysilik (bay, bayan), mekan kumaşı, teknik/endüstriyel ürünler, perdelik kumaş, vb. ürünlerin üretiminde kullanılmaktadır [1]. Halı sektöründe de artan bir kullanım alanına ulaşmaktadır. Halı üretiminde hav ipliği olarak en çok kullanılan akrilik ve polipropilen gibi sentetik liflerin yanında ve BCF, tekstüre gibi farklı türevleri ile polyester lifi halı hav ipliği olarak kendine kullanım alanı bulmuştur. Polyester elyafının halı üretiminde kullanılmasının amaçlarından biri de lifin yüksek mukavemeti nedeniyle, halıdaki mukavemeti ve aşınma dayanımını arttırmaktır. Ayrıca dokuma işlemi sırasında iplik kopuşlarının azalması ve daha yüksek verimlilikte çalışılması mümkündür. Bu durum da polyester elyafının halı sektöründe kendine yer bulmasını kolaylaştırmaktadır.
Üretilen nihai ürünün özellikleri, yapısını oluşturan ipliklerin özelliklerinden etkilenir. Bu noktada iplik lineer yoğunluğu, kesit şekli, filament inceliği, kesitteki filament sayısı gibi faktörler oluşturdukları kumaş özelliklerini direk olarak etkilemektedir. Literatürde iplik kesitindeki filament sayısının iplik ve kumaş üzerine etkisine yönelik çalışmalar mevcuttur [2-8]. Özkan ve Babaarslan iplik kesitindeki filament sayısının filament ve tekstüre ipliklerin özellikleri üzerine etkisini araştırmışlardır. Yapılan çalışma sonunda iplik kesitinde artan filament sayısının, iplik mukavemet, uzama, krimp ve sıcakta çekme özellikleri üzerinde istatistiksel olarak anlamlı etkiye sahip olduğu sonucuna varılmıştır [2]. Özkan yaptığı çalışmada filament kesit şeklinin, sayısının ve lineer yoğunluğunun POY ve tekstüre iplik özellikleri üzerinde etkisi olduğu belirtilmiştir [3]. Aydoğdu ve Yılmaz, viskoz, pamuk ve pamuk/tencel elyafları ile öz olarak X55 ve PBT filamentleri ile 3 farklı dual-core iplik üretimi gerçekleştirmiştir. Bu ipliklerden kumaş üretimi yapılarak iplik ve kumaş özellikleri üzerinde iplik inceliğinin etkisinin olduğu sonucuna ulaşmışlardır [8]. Korkmaz ve Dalcı yaptıkları
444

çalışmada akrilik lifi kullanılarak üretilen halı numuneleri üzerinde kısa ve uzun süreli statik yükleme sonrasında rezilyans etkilerini incelemişlerdir [9]. Çelik yaptığı çalışmada lif lineer yoğunluğunun akrilik lifi ile üretilen halıların performansı üzerindeki etkisini incelemiştir. İnce liflerle üretilen halı numunelerinde yüksek rezilyans ve uzun süreli statik yükleme sonrasında düşük kalınlık kaybı görürken kaba liflerle üretilen numunelerde dinamik yükleme sonrasında endüşük kalınlık kaybı ve yüksek rezilyans davranışı tespit etmiştir [10]. Çelik ve Kaynak yaptıkları çalışmada filament inceliğinin ve hav yüksekliğinin halı numunelerinde ses absorbsiyonu üzerindeki etkisini incelemişlerdir. Hav yüksekliğinin daha fazla olduğu ve filament inceliğinin düşük olduğu durumda, halı numunelerinde ses absorbsiyon özelliğinin dahaiyi bir davranış gösterdiği sonucuna ulaşmışlardır [11].
Filament inceliği, dolayısıyla iplik içerisindeki filament sayısı, iplik mukavemetine veelastikiyetine etki eden en önemli parametrelerinden birisidir. Bu bağlamda farklı filament inceliklerinde üretilen hav ipliklerinin göstereceği rezilyans performansının da farklı olması beklenmektedir. Bu çalışmada farklı filament sayılarında üretilen polyester hav ipliklerinin kısa süreli statik yükleme sonrasında kalınlık kaybı ve rezilyans performanslarının incelenmesi amaçlanmıştır.
2. Materyal ve Metot Yapılan çalışma kapsamında kullanılan yalancı büküm tekstüre polyester ipliklerinin özellikleri Tablo 1’de gösterilmiştir. Hav ipliği numuneleri; 384, 576 ve 768 filament sayılarında, 1200 denye lineer yoğunluğa sahip yalancı büküm tekstüre ipliklerdir. Tekstüre işleminde friksiyon diskleri olarak poliüretan disk tipi, disk kombinasyonu olarak da 1+6+1 kombinasyonukullanılmıştır.
Tablo 1. Yalancı büküm tekstüre polyester iplik özellikleri.
Lineer Yoğunluk, dtex Filament Sayısı Filament İnceliği, Dpf
1333 384 3,13 1333 576 2,08 1333 768 1,56
Tablo 2’de özellikleri gösterilen halı numuneleri; 143 atkı/10cm sıklığında, 1/1 örgü yapısında, Wilton tipi yüz-yüze dokuma metodu ile üretilmiştir. Üretimi gerçekleştirilen halı numunelerinde sadece hav ipliği filament inceliğinin halıdaki statik yükleme sonrası rezilyans performansına etkilerinin incelenebilmesi için halı üretim parametreleri sabit tutulmuştur.
Tablo 2. Halı numuneleri özellikleri.
Doku tipi
Atkı sıklığı,
atkı/10cm
Atkı ipliği Dolgu
çözgüsü
Zemin çözgüsü
Hav ipliği
Hav yüksekliği,
mm 1/1 V 143 22/1 lbs 1600 denye 800 denye 384 f 12 1/1 V 143 22/1 lbs 1600 denye 800 denye 576 f 12 1/1 V 143 22/1 lbs 1600 denye 800 denye 768 f 12
445

Halı üretimi sonrasında numunelere uygulanacak kısa süreli statik yükleme sonrasında halı numunelerindeki rezilyans davranışlarının incelenebilmesi için, halı numuneleri 24 saat standart laboratuvar koşullarında (20 ± 2 ° C ve % 65 ± 4) kondisyonlanmıştır [12]. Kısa süreli statik yüklemeden sonra kalınlık azalması tayini, bir iskemle ayağının kısa sürede yaptığı basıncınbenzeri yüklemeden sonra görülen kalınlık azalmasının tespiti ile ilgilidir. Her bir halıdan alınan 25 cm x 25 cm boyutlarında en az 5 numunenin ilk kalınlıkları TS 3374 standardına uygun olarak SDL Atlas Digital Thickness Gauge cihazı kullanılarak 2 kPa basınç altında ölçülmektedir [13]. Daha sonra, TS 3378 standardına uygun bir düzenek ile numuneler üzerine 2 saat süre ile 220 kPa basınç uygulanmaktadır. Statik yükleme süresi sonunda yük altından çıkarılan numunelerin kalınlıkları 15, 30 ve 60 dakikalık dinlenme sürelerinden sonra 2kPa basınç altında yine SDL Atlas Digital Thickness Gauge cihazı ile ölçülmüştür [14]. 2 saat basınç altındasıkıştırma ve 15, 30, 60 dakikalık dinlenme sonrası, halı numunelerinin kalınlık kaybı ve rezilyans yüzdeleri aşağıda verilen formüller doğrultusunda hesaplanmıştır [10].
Kalınlık Kaybı (%) = ℎ₀−ℎ𝑦𝑦 ℎ₀
x 100 (1)
Rezilyans (%) = ℎ𝑟𝑟−ℎ𝑦𝑦ℎ₀−ℎ𝑦𝑦 x 100 (2)
h₀: ilk kalınlık (mm)hy: 2 saat süre ile 220 kPa basınç sonrası kalınlık (mm)hr: dinlenme sonrası kalınlık (mm)hr15: 15 dakika dinlenme sonrası kalınlık (mm) hr30: 30 dakika dinlenme sonrası kalınlık (mm) hr60: 60 dakika dinlenme sonrası kalınlık (mm)
Filament inceliğinin statik yükleme sonrasında gösterdiği rezilyans performansı üzerinde anlamlı bir etkiye sahip olup olmadığını belirlemek amacıyla SPSS 21 paket programı kullanılarak %95 güven aralığında tek yönlü varyans analizi (ANOVA) yapılmıştır.
3.Bulgular ve TartışmaTablo 3’te halı numunelerine ait ilk kalınlık, 2 saatlik yüklemeden hemen sonraki kalınlık ve 15,30, 60 dakikalık bekleme sürelerinin sonunda ölçülen kalınlıklar ve kalınlık kaybı yüzdelerisunulmuştur.
446

0
5
10
15
20
25
30
35
2 saatlik yükleme 15 dak dinlenme 30 dak dinlenme 60 dak dinlenme
(%)
rezilyans periyodu
Kalınlık Kaybı
384 f
576 f
768 f
Tablo 3. Halı numuneleri % kalınlık kaybı sonuçları.
Filament sayısı
Ortalama kalınlık değerleri (mm)
Kalınlık Kaybı (%)
384 f
h0 7,91 0,00 hy 6,00 24,15
hr15 6,44 18,58 hr30 6,64 16,06 hr60 6,78 14,29
576 f
h0 7,68 0,00 hy 6,02 21,61
hr15 6,57 14,45 hr30 6,66 13,28 hr60 6,74 12,24
768 f
h0 7,56 0,00 hy 5,56 26,46
hr15 6,15 18,65 hr30 6,26 17,20 hr60 6,38 15,61
Şekil 1’de halı numunelerine ait 2 saatlik yük altında bekleme sonrası ve 15, 30, 60 dakika dinlenme sonrası % kalınlık kaybı değerleri görülmektedir.
Şekil 1. Halı numunelerinin % kalınlık kaybı değerleri
447

0
5
10
15
20
25
30
35
40
45
50
15 dak dinlenme 30 dak dinlenme 60 dak dinlenme
(%)
Rezilyans
384 f
576 f
768 f
Şekil 1’de görüldüğü üzere, yapılan çalışmalar sonucunda 384, 576 ve 768 filament sayısına ait halı numunelerinde, kısa süreli statik yüklemeden sonra kalınlık azalması en fazla 768 filamentsayısına ait numunelerde görülmektedir. En düşük kalınlık kaybı ise 576 filament sayısına ait halı numunelerinde tespit edilmiştir. 15, 30 ve 60 dakikalık bekleme sonrasında halı numunelerinden alınan sonuçlar 2 saatlik yük altında bekleme sonrasındaki sonuçlarla paralellik göstermiştir. 384 filament ve 768 filament sayılarında en fazla kalınlık kaybı görülürken endüşük kalınlık kaybı 576 filament sayısındaki halı numunelerinde görülmektedir. Tüm numunelerde yük altından kaldırıldıktan sonra dinlenme süresi boyunca artan oranda bir kalınlık kaybı azalması görülmektedir. Tüm numuneler için yük kaldırıldıktan sonra ilk 15 dakikalık dinleme süresi sonrasında diğer dinlenme sürelerine göre daha fazla oranda kalınlık kaybıazalması olduğu görülmektedir. 30 ve 60 dakikalık dinlenme sürelerinden sonra yine kalınlık kaybı olduğu ancak bir birine yakın oranlarda olduğu görülmektedir.
Şekil 2. Halı numunelerinin % rezilyans değerleri
Şekil 2’de halı numunelerine ait 15, 30 ve 60 dakika dinlenme sonrası % rezilyans değerleri görülmektedir. Kalınlık kaybı değerlerine (Şekil 1) paralel olarak, kısa süreli statik yükleme sonrasında 15, 30 ve 60 dakika dinleme süreleri sonunda en iyi rezilyans performansı 576 filament sayısı ait halı numunelerinde elde edilmiştir. En düşük rezilyans performansları ise 384 filament sayısı ile elde edilmiştir. Numunelerin rezilyans değerlerinin dinleme süreleri sonunda birbirine yaklaştığı görülmektedir. Bu yüzden 60 dakika dinleme süresi sonunda her üç numuneden elde edilen rezilyans değerlerinin diğer 15 ve 30 dakika sonrası değerlere göre daha yakın olduğu görülmektedir.
Tablo 4’te halı numunelerinin rezilyans değerlerine ait tek yönlü varyans analiz sonuçları görülmektedir.
448
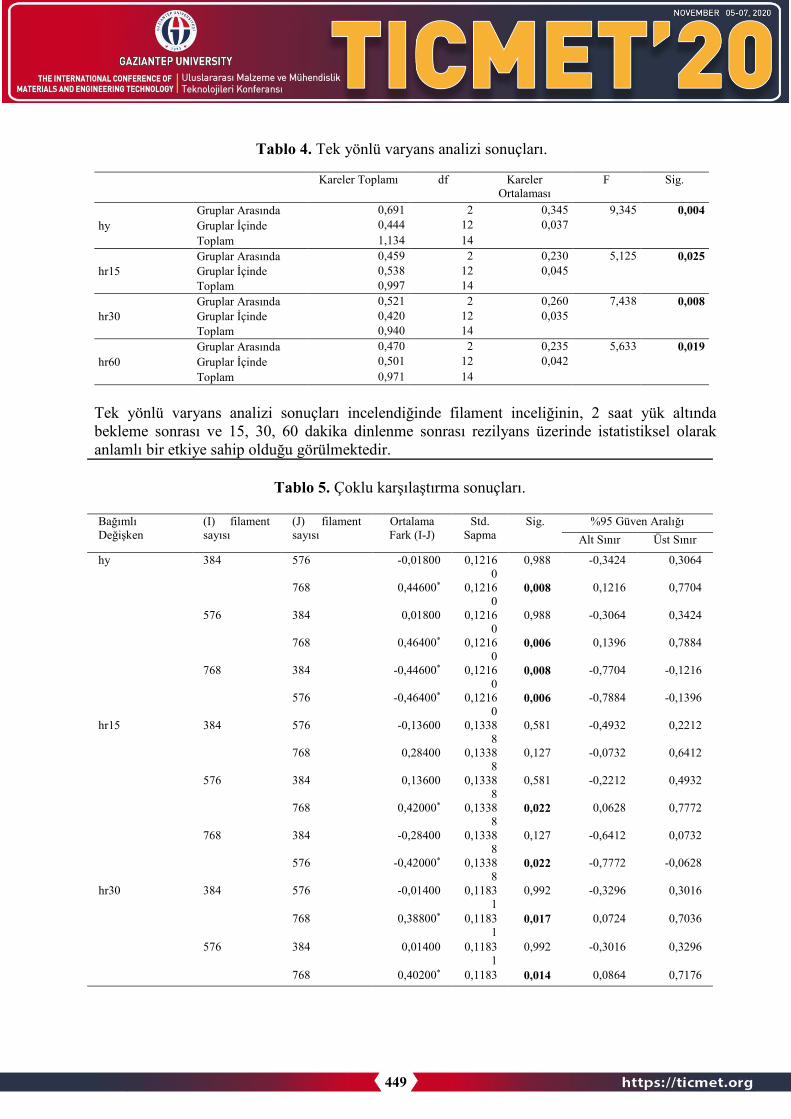
Tablo 4. Tek yönlü varyans analizi sonuçları.
Kareler Toplamı df Kareler Ortalaması
F Sig.
hy Gruplar Arasında 0,691 2 0,345 9,345 0,004 Gruplar İçinde 0,444 12 0,037 Toplam 1,134 14
hr15 Gruplar Arasında 0,459 2 0,230 5,125 0,025 Gruplar İçinde 0,538 12 0,045 Toplam 0,997 14
hr30 Gruplar Arasında 0,521 2 0,260 7,438 0,008 Gruplar İçinde 0,420 12 0,035 Toplam 0,940 14
hr60 Gruplar Arasında 0,470 2 0,235 5,633 0,019 Gruplar İçinde 0,501 12 0,042 Toplam 0,971 14
Tek yönlü varyans analizi sonuçları incelendiğinde filament inceliğinin, 2 saat yük altındabekleme sonrası ve 15, 30, 60 dakika dinlenme sonrası rezilyans üzerinde istatistiksel olarak anlamlı bir etkiye sahip olduğu görülmektedir.
Tablo 5. Çoklu karşılaştırma sonuçları.
Bağımlı Değişken
(I) filamentsayısı
(J) filamentsayısı
Ortalama Fark (I-J)
Std. Sapma
Sig. %95 Güven Aralığı Alt Sınır Üst Sınır
hy 384 576 -0,01800 0,12160
0,988 -0,3424 0,3064
768 0,44600* 0,12160
0,008 0,1216 0,7704
576 384 0,01800 0,12160
0,988 -0,3064 0,3424
768 0,46400* 0,12160
0,006 0,1396 0,7884
768 384 -0,44600* 0,12160
0,008 -0,7704 -0,1216
576 -0,46400* 0,12160
0,006 -0,7884 -0,1396
hr15 384 576 -0,13600 0,13388
0,581 -0,4932 0,2212
768 0,28400 0,13388
0,127 -0,0732 0,6412
576 384 0,13600 0,13388
0,581 -0,2212 0,4932
768 0,42000* 0,13388
0,022 0,0628 0,7772
768 384 -0,28400 0,13388
0,127 -0,6412 0,0732
576 -0,42000* 0,13388
0,022 -0,7772 -0,0628
hr30 384 576 -0,01400 0,11831
0,992 -0,3296 0,3016
768 0,38800* 0,11831
0,017 0,0724 0,7036
576 384 0,01400 0,11831
0,992 -0,3016 0,3296
768 0,40200* 0,1183 0,014 0,0864 0,7176
449

1 768 384 -0,38800* 0,1183
1 0,017 -0,7036 -0,0724
576 -0,40200* 0,11831
0,014 -0,7176 -0,0864
hr60 384 576 0,04000 0,12921
0,949 -0,3047 0,3847
768 0,39400* 0,12921
0,025 0,0493 0,7387
576 384 -0,04000 0,12921
0,949 -0,3847 0,3047
768 0,35400* 0,12921
0,044 0,0093 0,6987
768 384 -0,39400* 0,12921
0,025 -0,7387 -0,0493
576 -0,35400* 0,12921
0,044 -0,6987 -0,0093
*0rtalama fark 0,05 seviyede anlamlıdır.
Tablo 5’te rezilyans değerlerine ait çoklu karşılaştırma sonuçları görülmektedir. Bu sonuçlaragöre; 15 dakika dinleme süresi dışında diğer ölçümlerdeki rezilyans değerlerinde 768 filamentsayısı ile diğer iki filament sayıları;384 ve 576 arasında anlamlı fark olduğu sonucuna varılmıştır. Diğer taraftan, 15 dakika dinleme süresi sonrası rezilyans değerleri karşılaştırıldığında sadece 768 filament sayısı ile 576 filament sayıları arasında anlamlı fark olduğu görülmektedir.
4.Sonuçlar Farklı filament inceliklerine sahip polyester hav ipliklerinden mamul halı numunelerinin kısa süreli yükleme sonrası rezilyans performansları değerlendirilmiştir. Elde edilen test sonuçlarına göre kısa süreli statik yükleme sonrasında kalınlık azalmasının en fazla 768 filament sayısına aitnumunelerde olduğu görülmüştür. En düşük kalınlık kaybı ise 576 filament sayısına ait halı numunelerinde tespit edilmiştir. Aynı şekilde, 576 filament sayısında hav ipliği ile diğer numunelere göre daha yüksek rezilyans performansı elde edilmiştir. Diğer filament sayıları; 768 ve 384 bir birlerine yakın rezilyans performansı göstermiştir.
Yapılan tek yönlü varyans analizi sonrasında filament inceliğinin 2 saat yükleme sonrası ve dinlenme süreleri sonrasındaki kalınlık kaybı üzerinde anlamlı bir etkisinin olduğu tespit edilmiştir. Çoklu karşılaştırma sonuçlarına göre 768 filament sayısı ile diğer iki filament sayıları;384 ve 576 arasında anlamlı fark olduğu görülürken, 576 ve 384 filament sayıları arasında anlamlı fark olmadığı görülmektedir. Üç farklı filament sayısı ile üretilen numunelerde optimum rezilyans davranışının 576 filament sayısına ait halı numunelerinde olduğu sonucuna varılmıştır.
Referanslar:
1. Demir, A. Sentetik Elyaf Bilgisi, Filament İplikler ve Üretim Yöntemleri, Sentetik Filamentİplik Üretim ve Tekstüre Teknolojileri, Şan Ofset, İstanbul, 19-20, 2006.
2. Özkan, S., ve Babaarslan, O., İplik Kesitindeki Filament Sayısının Filament ve Tekstüreİpliklerin Özellikleri Üzerindeki Etkisi, Tekstil ve Konfeksiyon. 2010, 20(1): 17-22.
3. Özkan, S., Filament Kesit Şeklinin, Sayısının ve Lineer Yoğunluğunun POY ve Tekstüreİplik Özelliklerine Etkisi, Yüksek Lisans Tezi, Çukurova Üniversitesi, Fen Bilimleri
450
Enstitüsü, Tekstil Mühendisliği Ana Bilim Dalı, Adana, 2008. 4. Akıncı, F.C., Kaynak, H.K. ve Korkmaz, Y., Filament İnceliği ve Atkı Sıklığının
Mikrofilament Dokuma Kumaşlarda Geçirgenlik Özelliklerine Etkileri, Tekstil ve Mühendis.2018, 25(111): 234-240.
5. Kaynak, H.K. ve Babaarslan, O., Filament İnceliğinin Mikrolif Örgü Spor GiysiliklerinPerformans Özelliklerine Etkisinin Araştırılması, Tekstil ve Mühendis. 2010, 17(78): 20-24.
6. Babaarslan, O., Telli, A. ve Karaduman, S., Mikrofilament İplik Yapılarının Denim KumaşPerformans Özellikleri Üzerine Etkisi, Tekstil ve Mühendis. 2015, 22(99): 7-14.
7. Zarrebini, M., Mahmoudi, M. R., El-Bakary, M. A., El-Dessouky, H. M. and Lawrence, C.A., The Influence of Fiber Fineness on Physical Characteristics of Staple PolypropyleneFibers Spun at Different Pumping Speeds, Journal of Applied Polymer Science. 2010, 115:2892–2897.
8. Aydoğdu, S. H. Ç. and Yılmaz, D., Effect Of Yarn Fineness and Core/Sheath Fibre Types OnThe Physical Properties Of Dual-Core Yarns And Fabrıcs, Cellulose Chemistry andTechnology. 2020, 54(3-4): 381-394.
9. Korkmaz, Y. ve Dalcı, S., Resilience Behaviors Of Woven Acrylic Carpets Under Short-And Long-Term Static Loading, The Journal of The Textile Institute. 2010, 101(3): 236–241.
10. Çelik, H. İ., Effects of Fiber Linear Density on Acrylic Carpet Performance, Journal ofEngineered Fibers and Fabrics. 2017, 12(1), 1-11.
11. Çelik, H. İ. ve Kaynak, H.K., Effect Of Pile Yarn Filament Fıneness and Pile Height OnSound Absorption Characterıstıcs Of Carpets, 16th AUTEX World Textile Conference 2016,June 8–10, 2016, Ljubljana, SLOVENIA.
12. BS EN ISO 139:2005+A1:2011- Textiles- Standard atmospheres for conditioning andtesting.
13. TS 3374 ISO 1765: Tekstil yer döşemeleri - Makina yapısı - Kalınlık tayini.14. TS 3378: Tekstil yer döşemeleri-Makina yapısı-Orta ölçüde, kısa süreli statik yüklemeden
sonra kalınlık azalması tayini.
451

KOMPOZİT MALZEMELERDE OLUŞTURULAN YAPAY KUSURLARIN ULTRASONİK C-TARAMA TEKNİKLERI İLE TAHRİBATSIZ MUAYENESİ
BURAK ÖZTAŞ *1, HALİL İBRAHİM ÇELİK2, YASEMİN KORKMAZ 1
1 Kahramanmaraş Sütçü İmam Üniversitesi, Mühendislik Mimarlık Fakültesi, Tekstil Mühendisliği Bölümü, Kahramanmaraş, TÜRKİYE
2 Gaziantep Üniversitesi, Mühendislik Fakültesi, Tekstil Mühendisliği Bölümü, Gaziantep, TÜRKİYE
Özet
Bu çalışmada, oluşturulan yapay kusurların, izini sürmek amacıyla kompozit malzemelerintahribatsız muayenesi için pratik ultrasonik C-tarama teknikleri geliştirilmeye çalışılmıştır. 8 katkarbon kumaştan oluşan kompozit yapıda iki farklı tabakaya yapay hasarlı bölgeler yerleştirilerek numuneler üretilmiştir. Numuneler matris malzeme olarak epoksi kullanılarak vakum infizyon yöntemi ile üretilmiştir. Üretilen bu numuneler özel olarak tasarlanmış sistemde su içerisinde, daldırma tipi 3 MHz frekansa sahip problar ile doğrudan geçişli ultrasonik test (TTU) yöntemine göre muayene yapılmıştır. Elde edilen veriler özel yazılım vasıtasıyla C-Tarama görüntüsüne dönüştürülmüştür. Sonuç olarak; numunelerin içerinde bulunan yapay kusurların konumu ve şekli uygulanan görüntü işleme algoritması ile yüksek doğruluk oranlarında net bir şekilde tespit edilmiştir.
Anahtar Kelimeler: Tahribatsız muayene, Kompozit, C-tarama, Görüntü işleme
Abstract
In this study, practical ultrasonic C-scanning techniques have been developed for the non-destructive testing and tracing of the artificial defects created in composite materials. The samples composed of 8-layer carbon fabrics were produced by inserting artificial defects into two different layers. The samples were produced with infusion method by using epoxy as matrix material. These produced samples were tested in a specially designed system in water with immersion-type probes with a frequency of 3 MHz, using Thru-Transmission Ultrasound (TTU) test method. The obtained values were converted to C-Scan image via special software. As a result, the position and the size of the artificial defects inside the samples were clearly inspected by using applied image processing algorithm with high accuracy.
Key Words: Non-destructive test, Composite, C-Scan, Image processing
1.GirişKompozit malzemeler, birçok malzemeden daha maliyetli olmasına rağmen yüksekmukavemetleri ve yük taşıma kapasiteleri sayesinde son yıllarda mühendislik uygulamalarında
452

yaygın olarak tercih edilmektedirler. Kompozit malzemeler özellikle havacılık ve savunmasanayi uygulamalarında giderek artan oranda kullanılmakta; bu alanda ki inovasyon çalışmaları her geçen gün ilerleyerek devam etmektedir. Kullandıkları alanlar nedeniyle kompozit malzemelerdeki hasarın belirlenmesi büyük önem arz etmektedir.
Kompozit malzemelerdeki sıkça rastlanan hasarlar (delaminasyon, çatlak vb.) zamanla yapının sağlamlığını ve mukavemetini azaltarak kullanım sırasında çalışma verimini ve güvenliğini düşürmüş olur. Hasar, yapının malzeme, geometri veya sınır koşullarındaki değişikliklerden kaynaklanır. Yapıların çalışma koşullarında meydana gelebilecek hasarlara karşı önlem alınmazsa bu hasarlar zamanla büyük felaketlere neden olabilmektedir. Hasarlar çoğunlukla lamine kompozit malzemeler için imalat prosedürü sırasında meydana gelmektedir [1].
Malzemenin özelliklerini incelemenin tahribatlı ve tahribatsız birçok yolu vardır. Tahribatlı muayenelerde malzemenin zarar görmesi, testin uzun zaman alması, her malzemede kullanılamaması ve ekonomik olmaması nedeniyle ortaya çıkan zorunlu durumlar dışında fazla kullanılmaz. Bunun yerine günümüzde daha hassas ve ekonomik olan tahribatsız muayeneyöntemleri tercih edilmektedir.
Kompozit malzeme muayenelerinde tahribatsız muayene yöntemleri arasında en çok tercih edilen yöntem "Ultrasonik Test" tekniğidir [2]. Geçmişi çok uzun olmamakla birlikte ultrasonik muayene yönteminin gelişimi hızlı olmuş ve günümüzde kullanılan en önemli tahribatsızmuayene yöntemi haline gelmiştir. Ultrasonik yöntem, ses dalgalarının malzemenin içinden geçerken parçacıklarla etkileşerek yüksek frekanslarda sönümlenmesi, saçılması ve yansıması olgusuna dayanmaktadır [3]. Yüzey hasarının tespitinde en yaygın kullanılan ultrasonik yöntem, "pulse-eko" yöntemidir. Bu yöntem genellikle kusurların yeri ve kalınlık ölçümleri için kullanılır. Kompozit yapı incelemesi için kullanılan başlıca test tekniklerinden biri ultrasonik "C-tarama" tekniğidir. Bu uygulama, yayılan/alınan dalga zayıflamasının ve bir uçuş haritasınınzamanının düzlemsel görüntülerini verir [4]. Ultrasonik C-tarama, kanıtlanmış güvenilirlikleyüksek doğrulukta görüntü ölçümü sağlar. C-tarama tekniği ile elde edilen görüntü, malzeme üzerindeki hasarın yeri hakkında kapsamlı bilgi verir. C-taramada, kusur derinliği normalde kaydedilmez, ancak belirli bir taramada kapsanan test parçası içindeki derinliklerin (geçişlerin) aralığını sınırlandırarak nispeten doğru bir tahmin yapılabilir.
Literatürde, karbon/epoksi kompozitler başta olmak üzere birçok kompozit malzemenin incelenmesinde ultrasonik C-tarama tekniğinin kullanıldığı görülmektedir. Ancak alınan görüntülerde gürültünün fazla olması nedeniyle çözünürlük ve görüntü kalitesi çok düşüktür. Yapısal iç hasarın önceden tespiti üretilen kompozitlerin sağlamlığı hakkında daha iyi bir fikir verebilmesi amacıyla çalışmamızda doğrudan geçişli ultrasonik test (TTU) yöntemi ile farklı bir algoritma geliştirilerek gürültünün azaltılması ve hasarlı alanın net bir şekilde görüntülenmesi amaçlanmıştır.
2.Materyal ve Metot
2.1.Üretim Bu çalışmada, takviye malzemesi olarak 2/2 dimi doku yapısına sahip, 245 g/m2 gramajlı karbon kumaş kullanılarak kompozit numuneler üretilmiştir. Elde edilen numuneler 150 mm×120 mm olacak şekilde 8 kat kesilmiştir. Yapay hasar oluşturmak amacı ile Şekil 1'de görüldüğü gibi 2
453
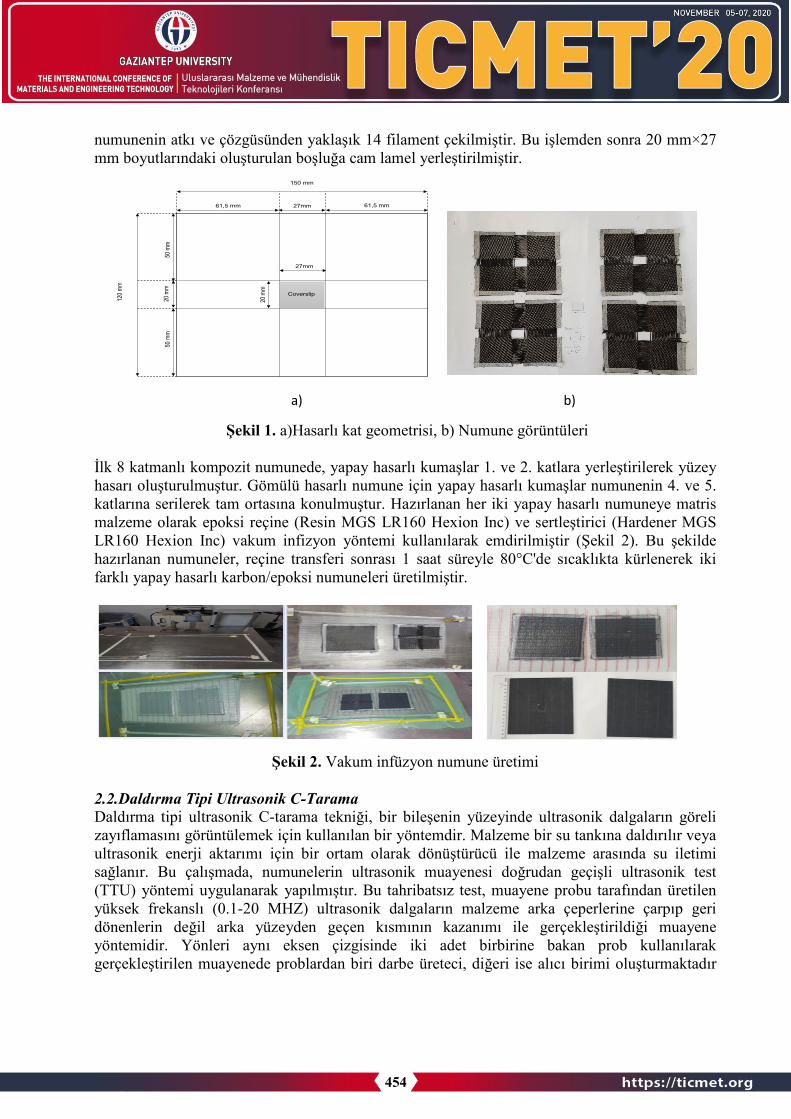
numunenin atkı ve çözgüsünden yaklaşık 14 filament çekilmiştir. Bu işlemden sonra 20 mm×27 mm boyutlarındaki oluşturulan boşluğa cam lamel yerleştirilmiştir.
a) b)
Şekil 1. a)Hasarlı kat geometrisi, b) Numune görüntüleri
İlk 8 katmanlı kompozit numunede, yapay hasarlı kumaşlar 1. ve 2. katlara yerleştirilerek yüzey hasarı oluşturulmuştur. Gömülü hasarlı numune için yapay hasarlı kumaşlar numunenin 4. ve 5. katlarına serilerek tam ortasına konulmuştur. Hazırlanan her iki yapay hasarlı numuneye matris malzeme olarak epoksi reçine (Resin MGS LR160 Hexion Inc) ve sertleştirici (Hardener MGS LR160 Hexion Inc) vakum infizyon yöntemi kullanılarak emdirilmiştir (Şekil 2). Bu şekilde hazırlanan numuneler, reçine transferi sonrası 1 saat süreyle 80°C'de sıcaklıkta kürlenerek iki farklı yapay hasarlı karbon/epoksi numuneleri üretilmiştir.
Şekil 2. Vakum infüzyon numune üretimi
2.2.Daldırma Tipi Ultrasonik C-Tarama Daldırma tipi ultrasonik C-tarama tekniği, bir bileşenin yüzeyinde ultrasonik dalgaların göreli zayıflamasını görüntülemek için kullanılan bir yöntemdir. Malzeme bir su tankına daldırılır veya ultrasonik enerji aktarımı için bir ortam olarak dönüştürücü ile malzeme arasında su iletimi sağlanır. Bu çalışmada, numunelerin ultrasonik muayenesi doğrudan geçişli ultrasonik test (TTU) yöntemi uygulanarak yapılmıştır. Bu tahribatsız test, muayene probu tarafından üretilen yüksek frekanslı (0.1-20 MHZ) ultrasonik dalgaların malzeme arka çeperlerine çarpıp geri dönenlerin değil arka yüzeyden geçen kısmının kazanımı ile gerçekleştirildiği muayene yöntemidir. Yönleri aynı eksen çizgisinde iki adet birbirine bakan prob kullanılarak gerçekleştirilen muayenede problardan biri darbe üreteci, diğeri ise alıcı birimi oluşturmaktadır
120 m
m
150 mm
27mm61,5 mm 61,5 mm
20 m
m50
mm
50 m
m
20 m
m27mm
Coverslip
454

[5]. Bu yöntemde elle muayene gerçekleştirmek zordur ve genellikle otomatikleştirilmiş sistemlerde kullanılmaktadır.
Bu çalışmada kullanılan US100 cihazı bilgisayar kontrollü olup kademeli motor sürücüleri ile donatılmış otomatik bir daldırma sistemidir (Şekil 3). Su tankına yerleştirilen numunelerden, 3 MHz frekansa sahip daldırma tipi problar ile veri toplanmıştır. Numunelerden sistemde taranmışilk görüntüler elde edilmiştir. Ara yüzden alınan gri görüntü formatındaki ilk görüntüler görüntü işleme algoritmaları ile düzenlemiştir.
Şekil 3. US100 Daldırma Tipi Ultrasonik Test Cihazı
3. Bulgular ve TartışmaGeri yansıyan darbelerin genliği malzeme içerisinden geçerek karşıya ulaşan sinyalleringenliğinden azdır. Sinyal saçılımının yüksek ve hataların büyük olduğu durumlarda genellikledoğrudan geçişli ultrasonik test (TTU) yöntemi kullanılır. Bu nedenle TTU ile gerçekleştirilentestte daha az zayıflamış sinyaller alıcı proba ulaşır. Bu çalışmada, karbon kompozitmalzemelerdeki kusurları tespit etmek için Ultrasonik C-tarama yönteminin etkinliği araştırılmış,hasaların farklı katlara yerleştirildiği numuneler üretilmiştir. Üretilen numunelere yerleştirilenyapay kusurlar aynı boyutta ve aynı kalınlıktadır. Ölçümü yapılan numunelerden elde edilensinyaller gri seviye görüntülere dönüştürülmüştür (Şekil 4.a, Şekil 5.a,). Gri seviye görüntülereuygulanan gürültü temizleme filtreleri ile görüntü iyileştirilmiştir (Şekil 4.b, Şekil 5.b). Eldeedilen filtrelenmiş görüntülere RGB renk uzayında dönüştürülerek (Şekil 4.c, Şekil 5.c) hatalıbölgenin daha net görünmesi sağlanmıştır. Son olarak filtrelenmiş görüntü ikili görüntüye (Şekil4.d, Şekil 5.d) dönüştürülerek hasarlı bölgenin siyah diğer bölgelerin beyaz olarak işaretlenmesisağlanmıştır.
50cm
DC Motorlar
Sınır Şalterleri
Problar
Numune
Boşaltma Vanası
Su Seviye Sınırı
Pulser/Reciever
455

a) b) c) d) Şekil 4. Yüzey hasarlı kompozitin (a) ham, (b) filtrelenmiş, (c) RGB formatına çevrilmiş
renklendirilmiş, (d) binary formatına çevrilmiş görüntüleri
a) b) c) d) Şekil 5. Gömülü hasarlı kompozitin (a) ham, (b) filtrelenmiş, (c) RGB formatına çevrilmiş
renklendirilmiş, (d) binary formatına çevrilmiş görüntüleri
Ultrasonik tahribatsız muayene sonrası önce hem yüzey (1 ve 2. kat) hem de gömülü (4 ve 5. kat) yapay kusurların konumunu cihazdan alınan ham görüntülerle tanımlanmıştır. Daha sonra bu görüntülere uygulanan Gausian görüntü işleme filtresi ile geçişler yumuşatılmıştır. Üçüncü aşamada elde edilen bu görüntüler RGB formatına dönüştürülerek renk haritası belirlenmiştir. Hasar görüntüsünün netliği uygulanan binary formatına dönüştürülerek elde edilmiştir. Yüzey hasarlı numunenin muayenesi sonrası elde edilen görüntüde cam lamel üzerine gelen epoksinin dağılması sonucu hasar etrafında ‘’koyu noktalar’’ oluşmuştur. Diğer hasarlı numunede buna rastlanmamış, hasar daha net olarak görülmüştür. Hassas ölçüm sayesinde her iki tip numunede de liflerin yönü, lif gözenekleri, epoksi dağılımı ve filament çekimi sonrası oluşan boşluklar gözlemlenmiştir. Görüntü işleme algoritmaları ile hasar daha da belirginleştirilmiş, binary formatı hasar detaylarının incelenmesine fırsat sunmuştur.
Benzer bir çalışmada 2 farklı malzeme (karbon/epoksi, cam/polyester) ile ürettikleri kompozitlerin belirlenen katmanlarında çeşitli şekil ve boyutlarda yapay hasarlar oluşturulmuştur. Hasiotis ve arkadaşları [6] 5 MHz problar ile pulse-eko yöntemi kullanarak karbon/epoksi kompozitlerdeki yapay hasarları gözlemlemeye çalışmışlardır. Papa ve ark.,[7] farklı tipte kompozitlerde (epoksi ve vinil ester reçinede CFRP, GFRP ve BFRP) farklı test koşulları ve farklı enerji seviyelerinde hasar tespiti için, 5 MHz phassed array tipi problarla pulse-eko yöntemi kullanılarak ultrasonik ölçüm yapılmıştır. Hasarı daha belirgin ve
456
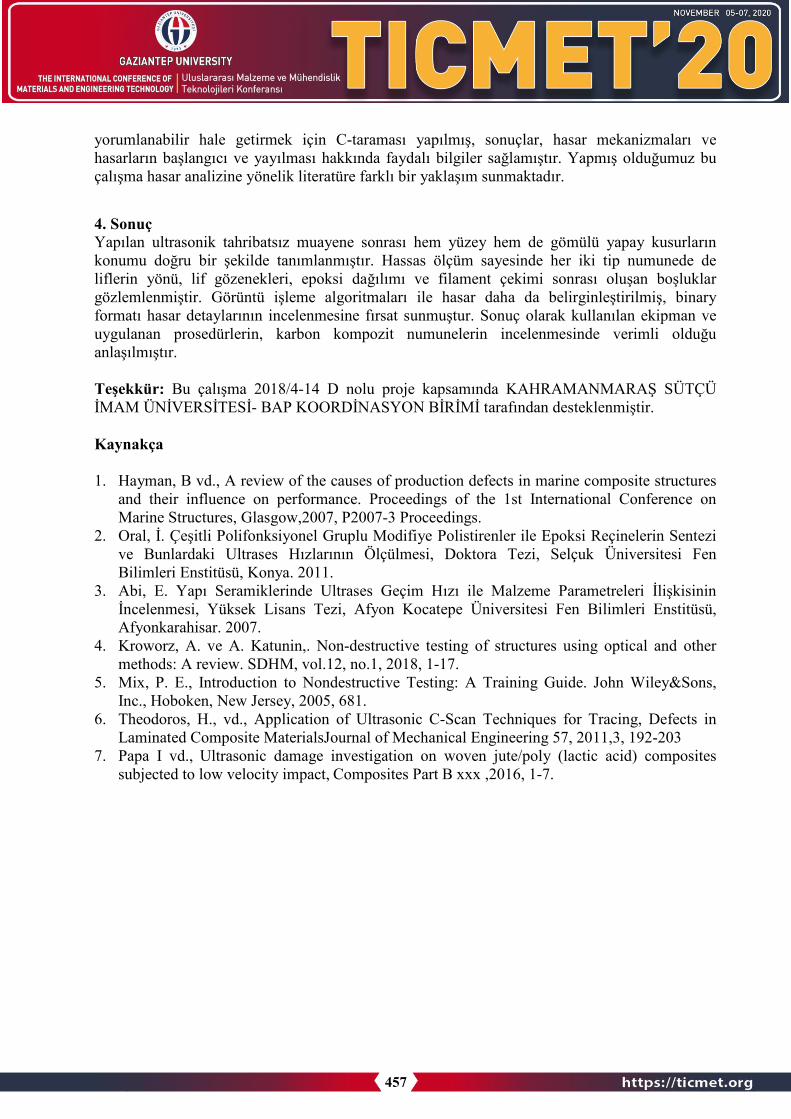
yorumlanabilir hale getirmek için C-taraması yapılmış, sonuçlar, hasar mekanizmaları ve hasarların başlangıcı ve yayılması hakkında faydalı bilgiler sağlamıştır. Yapmış olduğumuz bu çalışma hasar analizine yönelik literatüre farklı bir yaklaşım sunmaktadır.
4. Sonuç Yapılan ultrasonik tahribatsız muayene sonrası hem yüzey hem de gömülü yapay kusurların konumu doğru bir şekilde tanımlanmıştır. Hassas ölçüm sayesinde her iki tip numunede de liflerin yönü, lif gözenekleri, epoksi dağılımı ve filament çekimi sonrası oluşan boşluklar gözlemlenmiştir. Görüntü işleme algoritmaları ile hasar daha da belirginleştirilmiş, binary formatı hasar detaylarının incelenmesine fırsat sunmuştur. Sonuç olarak kullanılan ekipman ve uygulanan prosedürlerin, karbon kompozit numunelerin incelenmesinde verimli olduğu anlaşılmıştır.
Teşekkür: Bu çalışma 2018/4-14 D nolu proje kapsamında KAHRAMANMARAŞ SÜTÇÜİMAM ÜNİVERSİTESİ- BAP KOORDİNASYON BİRİMİ tarafından desteklenmiştir.
Kaynakça
1. Hayman, B vd., A review of the causes of production defects in marine composite structuresand their influence on performance. Proceedings of the 1st International Conference onMarine Structures, Glasgow,2007, P2007-3 Proceedings.
2. Oral, İ. Çeşitli Polifonksiyonel Gruplu Modifiye Polistirenler ile Epoksi Reçinelerin Sentezive Bunlardaki Ultrases Hızlarının Ölçülmesi, Doktora Tezi, Selçuk Üniversitesi FenBilimleri Enstitüsü, Konya. 2011.
3. Abi, E. Yapı Seramiklerinde Ultrases Geçim Hızı ile Malzeme Parametreleri İlişkisininİncelenmesi, Yüksek Lisans Tezi, Afyon Kocatepe Üniversitesi Fen Bilimleri Enstitüsü,Afyonkarahisar. 2007.
4. Kroworz, A. ve A. Katunin,. Non-destructive testing of structures using optical and othermethods: A review. SDHM, vol.12, no.1, 2018, 1-17.
5. Mix, P. E., Introduction to Nondestructive Testing: A Training Guide. John Wiley&Sons,Inc., Hoboken, New Jersey, 2005, 681.
6. Theodoros, H., vd., Application of Ultrasonic C-Scan Techniques for Tracing, Defects inLaminated Composite MaterialsJournal of Mechanical Engineering 57, 2011,3, 192-203
7. Papa I vd., Ultrasonic damage investigation on woven jute/poly (lactic acid) compositessubjected to low velocity impact, Composites Part B xxx ,2016, 1-7.
457

KOMPLEKS KOASERVASYON YÖNTEMİ İLE OKALİPTÜS YAĞI İÇEREN MİKROKAPSÜLLER GELİŞTİRİLMESİ VE TEKSTİL
YÜZEYLERİNE UYGULANMASI
ZEYNEP HAYTA BAŞKAN1, GAYE KAYA1
1 Kahramanmaraş Sütçü İmam Üniversitesi, Mühendislik ve Mimarlık Fakültesi, Tekstil Mühendisliği Bölümü, Kahramanmaraş, TÜRKİYE
Özet
Mikrokapsülasyon tekniğinin tekstil yüzeylerinde kullanılması son yıllarda artan bir ilgiyesahiptir. Bu sayede, fonksiyonel tekstil yüzeyleri üretilmesine yönelik çalışmalar da hızkazanmıştır. Bu çalışmada, antibakteriyel ve sinek/böcek kovucu özellikleriyle bilinen okaliptüs yağı içeren mikrokapsüller, kompleks koaservasyon yöntemi ile üretilmiştir. Mikrokapsüllerin uygulama alanının tekstil yüzeyi olması ve insan cildine teması söz konusu olduğundan, toksik olmaması gerekmektedir. Bu nedenle, okaliptüs yağı içeren mikrokapsül üretimi için doğal polimer sistemi olan jelatin-arap zamkı ile glioksal ve glutaraldehit olmak üzere iki farklı çaprazbağlayıcı kullanılmıştır. Mikrokapsüllerin kimyasal yapısı Fourier dönüşümü kızılötesispektroskopi (FTIR) ile incelenmiştir. Optik mikroskop kullanılarak, mikrokapsüllerin parçacık/boyut dağılımları belirlenmiştir. İki farklı çapraz bağlayıcı kullanılarak geliştirilenmikrokapsüller, %100 polipropilen meltblown dokusuz yüzeye uygulanarak taramalı elektron mikroskobu (SEM) ile görüntü analizi gerçekleştirilmiştir.
Keyword: Mikrokapsülasyon, Kompleks koaservasyon, Okaliptüs yağı, Fonksiyonel tekstiller.
Abstract
There is an increasing interest on the use of microcapsulation technique on textile surfaces in recent years. In this way, efforts to produce functional textile surfaces have gathered speed. In this study, microcapsules containing eucalyptus oil which is known for its antibacterial and insect repellent properties were produced by the complex coacervation method. Since the application area of microcapsules is a textile surface which is in contact with human skin, it should be non-toxic. Therefore, a gelatin-gum arabic natural polymer system and two different crosslinkers as glyoxal and glutaraldehyde are used for the production of microcapsules containing eucalyptus oil. The chemical structure of microcapsules was investigated by Fourier Transform Infrared spectroscopy (FTIR). Particle/size distributions of microcapsules were determined using an optical microscope. Microcapsules developed using two different crosslinkers were applied to a 100% polypropylene meltblown nonwoven fabric and image analysis was performed by Scanning Electron Microscopy (SEM).
Keywords: Microcapsulation, Complex coacervation, Eucalyptus oil, Functional textiles.
458

1. Giriş
Teknik tekstiller son yıllarda önemli ölçüde dikkat çekiyor olsa da liflerin, ipliklerin ve kumaşların, giysilik ve döşemelik harici kullanımı çok eski tarihlere dayanmaktadır. Dokuma kumaş ve ağların Roma döneminde yol yapımında ve bataklık alanların stabilizasyonunda kullanıldığına dair kanıtlar vardır [1]. Bu bağlamda teknik tekstil çok eskilerden beri var olmasına rağmen son yıllarda özellikle tek kullanımlık tekstil yüzeylerine ihtiyacın da artmasıyla tekstil sektöründe kendine ayrı bir yer edindi diyebiliriz. Gelişmiş ülkelerde teknik tekstilin pazarpayı son yıllarda oldukça artış göstermiştir. Avrupa birliği ülkelerindeki toplam tekstil üretimin %22’sini teknik tekstiller oluşturmaktadır [2].
Son yıllarda, teknik ve fonksiyonel tekstil yüzeylerinin üretilmesi amacıyla kullanılanmikrokapsülasyon teknolojisi, gıda, tarım, tıp, ilaç ve kozmetik gibi birçok sektörde yaygın bir kullanıma sahiptir. Mikrokapsülasyon çalışmaları genel olarak, kapsüllenen materyalin stabilitesini arttırmayı ya da toksisitesini azaltmayı hedeflemektedir. Literatürde birçok mikrokapsülasyon yöntemi bulunmaktadır. Uygulanacak mikrokapsülasyon tekniği belirlenirken, çekirdek maddenin yapısı, hedeflenen kapsül boyutları ve duvar malzemesi parametreleri dikkate alınmalıdır [3].
Mikrokapsül içeren ve ticari olarak başarılı olan ilk ürün karbonsuz kopya kâğıdıdır. Basınca duyarlı boya mikrokapsüllerini üretmek için orijinal mikrokapsülleme tekniği, Green veSchleicher tarafından 1950’lerde kullanılmış ve makromoleküler koaservasyon olarak adlandırılmıştır. Koaservasyon, bir çözeltide tamamen çözünmüş halde bulunan makromoleküllerden bir kısmının desolvasyonuyla ortaya çıkan makromoleküllerin toplanmasıdır [4]. Koaservasyon (faz ayrımı) yöntemi, basit koservasyon ve komplekskoaservasyon olmak üzere iki farklı yöntemi içinde barındırmaktadır. Basit koaservasyonda faz ayrımı, alkol veya tuz ilavesi, sıcaklıktaki değişiklik veya Ph’daki değişiklik ile indüklenir.Kompleks koaservasyonda faz ayrımı ise, anyon-katyon etkileşimiyle bir koaservat fazın oluşmasına yol açan, zıt yüklü bir polimerin, polimer çözeltisine ilavesiyle oluşur. Bu faz ayırma işlemi, polimer çözeltisi içinde dağılmış katı veya sıvı parçacıkları içine almak için kullanılabilir.Kapsülleme işlemi Şekil 1’de gösterilen aşamalardan oluşmaktadır [5].
Şekil 1. Koservasyon tekniğiyle mikroenkapsulasyonun şematik gösterimi, a) çözeltideki katı ya da sıvı partiküller, b) faz ayrılma reaksiyonunun indüklenmesi, c) partikül yüzeylerinde mikro-
kabarcıkların oluşması, d) mikro-kabarcıkların çekirdeği çevreleyen bir zara (membrana) dönüşmesi [5].
459

Burada, faz ayrılması üç aşamadan oluşmaktadır:
1) Birincil duvar polimer çözeltisi, yukarıda belirtilen yöntemlerden biri ile uyarılır.Böylece, polimer açısından zengin bir sıvı faz (koaservat faz), polimer açısından zenginolmayan bir sıvı faz ve bir katı veya sıvı partiküllerden oluşan bir faz olmak üzere 3 fazlıbir sistem oluşur. Bu süspansiyon veya emülsiyon genellikle sürekli çalkalama ilesağlanır.
2) Polimer açısından zengin faz, dağılmış olan katı veya sıvı parçacıklarının yüzeyleriarasında mikro-kabarcıklar olarak birikmektedir. Bu mikro-kabarcıklar daha sonrabirleşerek bir zar (membran) oluşturur.
3) Polimer membran, termal çözündürme, desolvasyon ya da kimyasal yöntemlerlesertleştirilir [5].
Tekstil yüzeylerine mikrokapsülasyon uygulamalarında genel olarak amaçlanan fonksiyonel özellik antibakteriyellik, faz değiştiren malzemeler veya ilaç salınımına yöneliktir. Bu amaçla literatürde birçok farklı yağın çekirdek malzeme olarak kullanıldığı çok sayıda mikrokapsülasyon çalışması bulunmaktadır [6-10].
Okaliptüs uçucu yağı, değişik okaliptüs türlerinin yapraklarından su buharı distilasyonu ile elde edilen yağdır. Aromatik, kafura benzer kokuda, açık sarı renkte, ferahlatıcı ve yakıcı tattadır. Yağ büyük oranda (en az %70) 1,8-sineol (okaliptol), α-pinen, çok az fellandren ve diğerterpenleri içerir. Suda çok az, alkolde %70 oranında çözünür [11]. Sineolce zengin okaliptüs yağının bazı kullanım alanları verilmiştir Tablo 1’de verilmiştir [12].
Tablo 1. Okaliptüs uçucu yağı kullanım alanları [12].
Cilt Yanıklar, yakı, kesik, uçuk, böcek sokmaları, bit deri enfeksiyonları, yaralarda, yakılarda ve böcek uzaklaştırıcılarda
Dolaşım, Kaslar ve Eklemler
Adale ağrıları, dolaşım yetersizliği, romatoid artrit, burkulmalar
Solunum Sistemi Astım, bronşit, soğuk algınlığı, öksürük, sinüzit, boğaz enfeksiyonları
Ürojenital Sistem Sistit, lökore Bağışıklık Sistemi Su çiçeği, soğuk algınlığı, nezle, kızamık
Sinir Sistemi Asteni, baş ağrısı, nevralji
Okaliptüs uçucu yağı, genel olarak antibakteriyel aktivitesi için kullanılmakta, gram-pozitif bakterilerin, gram-negatif bakterilere göre okaliptüs yağının antibakteriyel aktivitesine daha duyarlı olduğu bilinmektedir [13]. Ancak, okaliptüs yağının kullanım ömrü, bileşenlerinin etkinliğini azaltan reaktivitesi ve uçuculuğu nedeniyle sınırlıdır. Okaliptüs yağının mikrokapsüllenmesi, bu sorunların üstesinden gelmek için potansiyel bir yöntem olarak görülmektedir [14].
460

Bu çalışmada, okaliptüs yağı içeren mikrokapsüller, kompleks koaservasyon yöntemi ile üretilmiştir. Mikrokapsül üretimi için doğal polimer sistemi olan jelatin-arap zamkı ile glioksalve glutaraldehit olmak üzere iki farklı çapraz bağlayıcı kullanılmıştır. Mikrokapsüller, %100Polipropilen meltblown dokusuz yüzeye uygulanmıştır. Mikrokapsüllerin kimyasal yapısı FTIR ile incelenmiştir. Optik mikroskop kullanılarak, mikrokapsüllerin parçacık/boyut dağılımlarıbelirlenmiş ve mikrokapsül uygulanan kumaşların görüntü analizi SEM ile yapılmıştır.
2. Materyal ve Metot
Deneysel çalışmada, mikrokapsül üretiminde yağ olarak okaliptüs uçucu yağı, polimer maddesi olarak toz jelatin ve arap zamkı, çapraz bağlayıcı olarak glutaraldehit (%25, Merck) ve glioksal(%40, Chempure) kullanılmıştır. pH ayarlamak amacıyla ise asetik asit (%99,8, Sigma) ve sodyum hidroksit (%99, Merck) kullanılmıştır. Mikrokapsül üretimi için kompleks koaservasyonyöntemi kullanılmıştır.
Kompleks koaservasyon yönteminde zıt yüklere sahip iki polielektrolit polimer kullanılmaktadır.Polianyon polimer olarak arap zamkı, polikatyon polimer olarak jelatin kullanılmıştır. Böylece jelatin(+)/arap zamkı(-) polimer kompleksinden oluşan duvar yapı oluşturulmuştur [15].
Mikrokapsülasyonun ilk aşamasında, çekirdek materyali olan okaliptüs uçucu yağı ile 1:1 orandasulu çözeltileri hazırlanmış (50-60 C°) arap zamkı ve jelatin sulu çözeltileri mekanik karıştırıcı kullanılarak (Isolab Laborgerate Gmbh, Almanya) 400 rpm’de karıştırılmıştır. Asetik asit ilavesiyle pH 4-4,5 aralığına ayarlanmış (polimerlerin elektrolit olduğu pH) ve polianyon-polikatyon kompleks oluşumu başlatılarak karıştırmaya devam edilmiştir. Daha sonra, sodyumhidroksit ilave edilerek pH 9’a ayarlanmıştır. Böylece, kompleks oluşumu durdurulmuş ve karışımın 5 C°’ye soğutulması sağlanmıştır. İki farklı çapraz bağlayıcı kullanılacağı için karışım 2’ye ayrıldıktan sonra, çapraz bağlayıcı glutaraldehit ve çapraz bağlayıcı glioksal ilavesi yapılarak mikrokapsüllerin stabil hale gelmesi sağlanmıştır. Mikrokapsüller 4 C° de 6 saat dinlendirilmiştir. Mikrokapsüllerde duvar/çekirdek oranı 1:5 olarak uygulanmıştır.
Üretilen mikrokapsüllerin morfolojileri optik mikroskop (BAB Bs200Doc, Türkiye) ile incelenmiştir ve mikrokapsüllerin mikroskobik görüntüleri üzerinden parçacıkların boyutları ölçülmüştür (BAB BS200 Pro). Çalışmada üretilen mikrokapsüller 30 g/m2 %100 polipropilenden üretilmiş meltblown yüzeye emdirme metodu ile uygulanmıştır. Numuneler, oda sıcaklığında (20 C°±2) 8 saat süre ile kurutulmuştur. Mikrokapsüllerin kimyasal yapıları FT-IR spektroskopisi (Perkin Elmer Frontier FT-IR Spektrofotometre (Spektrum 400), ABD) ile incelenmiş ve mikrokapsül çekirdek ve duvar materyalleri olan okaliptüs uçucu yağı, arap zamkı ve jelatinin FT-IR spektrumları ile karşılaştırmalı analiz yapılmıştır. Mikrokapsül uygulanmış yüzeylerdeki mikrokapsül varlığı optik mikroskop (BAB Bs200Doc, Türkiye) ve SEM (Zeiss Evo® LS10, Almanya) analizi ile tespit edilmiştir.
461
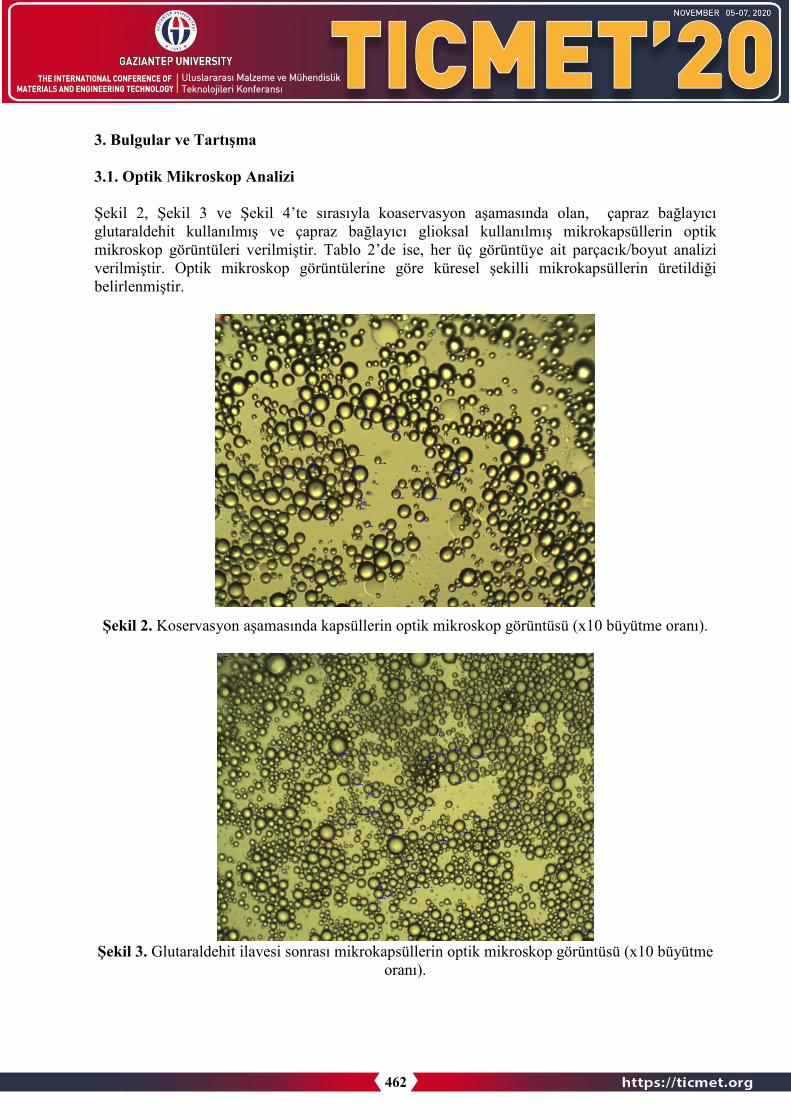
3. Bulgular ve Tartışma
3.1. Optik Mikroskop Analizi
Şekil 2, Şekil 3 ve Şekil 4’te sırasıyla koaservasyon aşamasında olan, çapraz bağlayıcı glutaraldehit kullanılmış ve çapraz bağlayıcı glioksal kullanılmış mikrokapsüllerin optik mikroskop görüntüleri verilmiştir. Tablo 2’de ise, her üç görüntüye ait parçacık/boyut analizi verilmiştir. Optik mikroskop görüntülerine göre küresel şekilli mikrokapsüllerin üretildiği belirlenmiştir.
Şekil 2. Koservasyon aşamasında kapsüllerin optik mikroskop görüntüsü (x10 büyütme oranı).
Şekil 3. Glutaraldehit ilavesi sonrası mikrokapsüllerin optik mikroskop görüntüsü (x10 büyütme oranı).
462
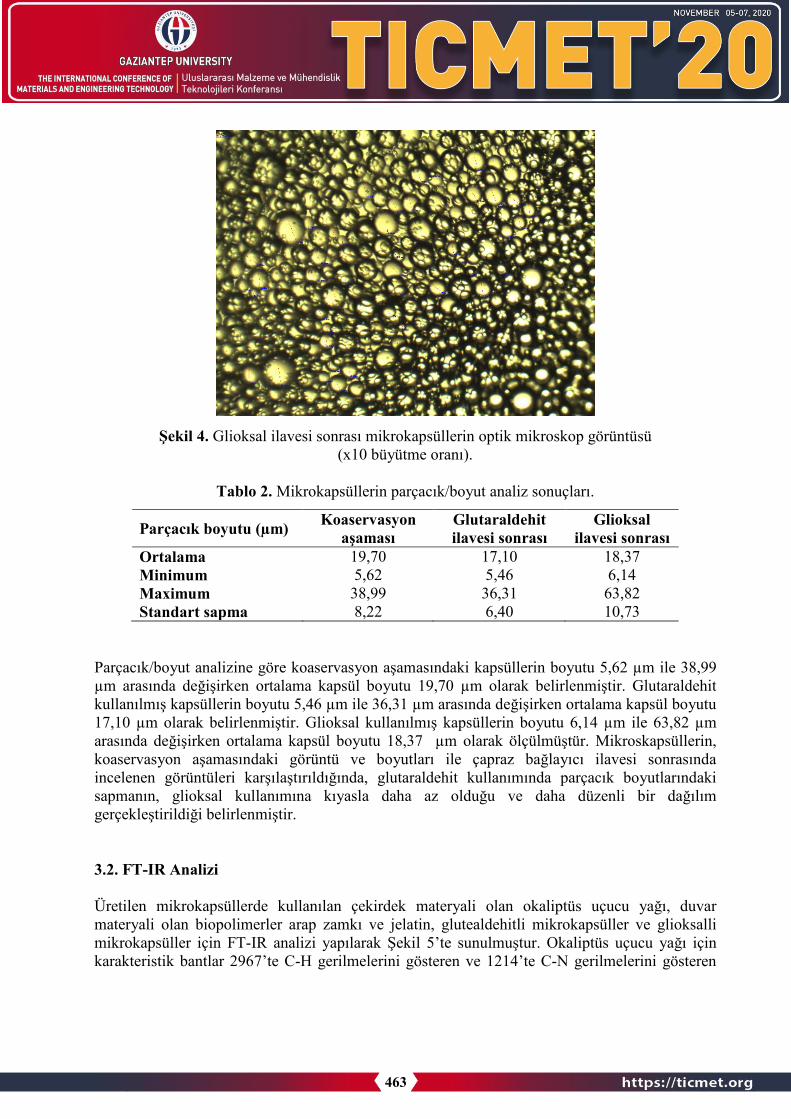
Şekil 4. Glioksal ilavesi sonrası mikrokapsüllerin optik mikroskop görüntüsü (x10 büyütme oranı).
Tablo 2. Mikrokapsüllerin parçacık/boyut analiz sonuçları.
Parçacık boyutu (µm) Koaservasyon aşaması
Glutaraldehit ilavesi sonrası
Glioksal ilavesi sonrası
Ortalama 19,70 17,10 18,37 Minimum 5,62 5,46 6,14 Maximum 38,99 36,31 63,82 Standart sapma 8,22 6,40 10,73
Parçacık/boyut analizine göre koaservasyon aşamasındaki kapsüllerin boyutu 5,62 µm ile 38,99 µm arasında değişirken ortalama kapsül boyutu 19,70 µm olarak belirlenmiştir. Glutaraldehit kullanılmış kapsüllerin boyutu 5,46 µm ile 36,31 µm arasında değişirken ortalama kapsül boyutu 17,10 µm olarak belirlenmiştir. Glioksal kullanılmış kapsüllerin boyutu 6,14 µm ile 63,82 µm arasında değişirken ortalama kapsül boyutu 18,37 µm olarak ölçülmüştür. Mikroskapsüllerin, koaservasyon aşamasındaki görüntü ve boyutları ile çapraz bağlayıcı ilavesi sonrasında incelenen görüntüleri karşılaştırıldığında, glutaraldehit kullanımında parçacık boyutlarındaki sapmanın, glioksal kullanımına kıyasla daha az olduğu ve daha düzenli bir dağılım gerçekleştirildiği belirlenmiştir.
3.2. FT-IR Analizi
Üretilen mikrokapsüllerde kullanılan çekirdek materyali olan okaliptüs uçucu yağı, duvar materyali olan biopolimerler arap zamkı ve jelatin, glutealdehitli mikrokapsüller ve glioksalli mikrokapsüller için FT-IR analizi yapılarak Şekil 5’te sunulmuştur. Okaliptüs uçucu yağı için karakteristik bantlar 2967’te C-H gerilmelerini gösteren ve 1214’te C-N gerilmelerini gösteren
463
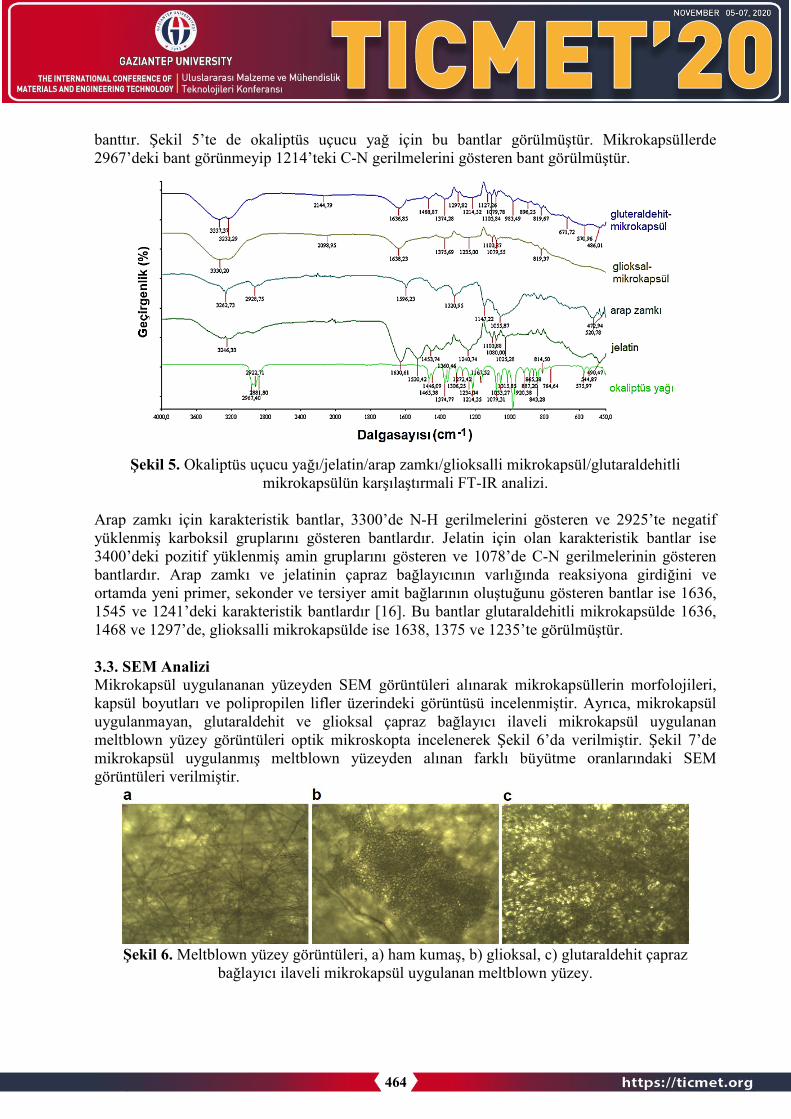
banttır. Şekil 5’te de okaliptüs uçucu yağ için bu bantlar görülmüştür. Mikrokapsüllerde 2967’deki bant görünmeyip 1214’teki C-N gerilmelerini gösteren bant görülmüştür.
Şekil 5. Okaliptüs uçucu yağı/jelatin/arap zamkı/glioksalli mikrokapsül/glutaraldehitli mikrokapsülün karşılaştırmali FT-IR analizi.
Arap zamkı için karakteristik bantlar, 3300’de N-H gerilmelerini gösteren ve 2925’te negatif yüklenmiş karboksil gruplarını gösteren bantlardır. Jelatin için olan karakteristik bantlar ise 3400’deki pozitif yüklenmiş amin gruplarını gösteren ve 1078’de C-N gerilmelerinin gösteren bantlardır. Arap zamkı ve jelatinin çapraz bağlayıcının varlığında reaksiyona girdiğini ve ortamda yeni primer, sekonder ve tersiyer amit bağlarının oluştuğunu gösteren bantlar ise 1636, 1545 ve 1241’deki karakteristik bantlardır [16]. Bu bantlar glutaraldehitli mikrokapsülde 1636, 1468 ve 1297’de, glioksalli mikrokapsülde ise 1638, 1375 ve 1235’te görülmüştür.
3.3. SEM Analizi Mikrokapsül uygulananan yüzeyden SEM görüntüleri alınarak mikrokapsüllerin morfolojileri, kapsül boyutları ve polipropilen lifler üzerindeki görüntüsü incelenmiştir. Ayrıca, mikrokapsül uygulanmayan, glutaraldehit ve glioksal çapraz bağlayıcı ilaveli mikrokapsül uygulanan meltblown yüzey görüntüleri optik mikroskopta incelenerek Şekil 6’da verilmiştir. Şekil 7’de mikrokapsül uygulanmış meltblown yüzeyden alınan farklı büyütme oranlarındaki SEM görüntüleri verilmiştir.
Şekil 6. Meltblown yüzey görüntüleri, a) ham kumaş, b) glioksal, c) glutaraldehit çapraz bağlayıcı ilaveli mikrokapsül uygulanan meltblown yüzey.
464
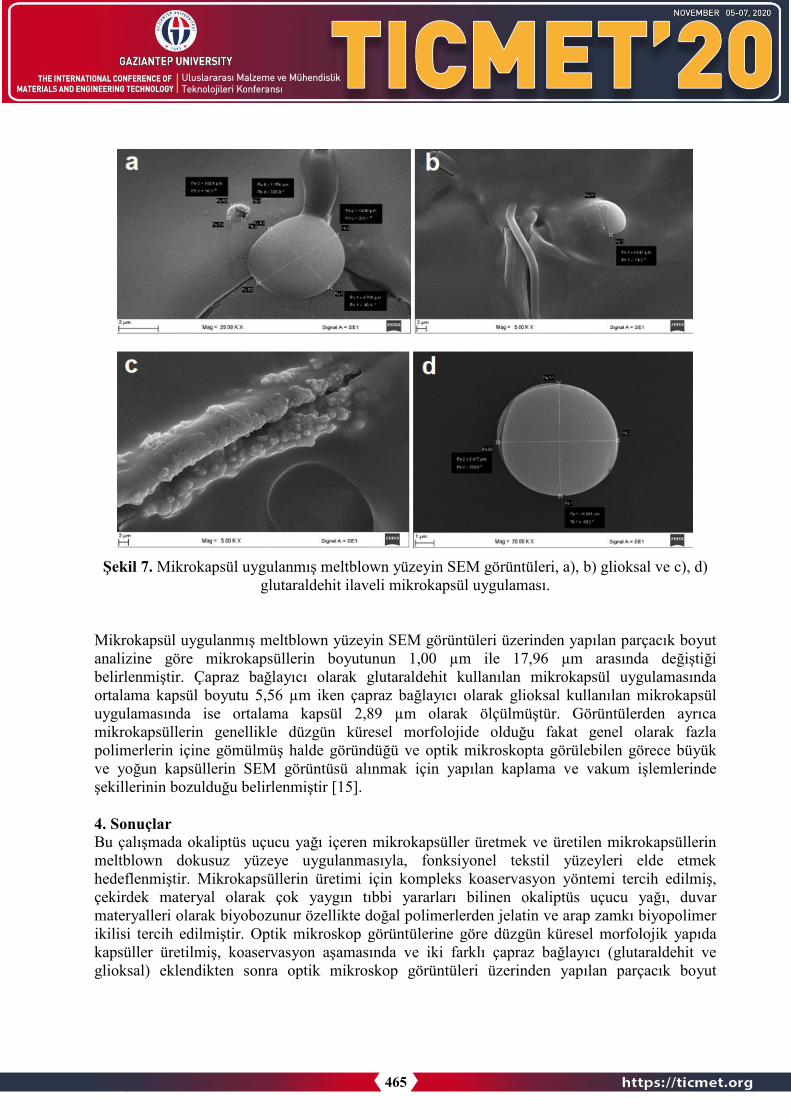
Şekil 7. Mikrokapsül uygulanmış meltblown yüzeyin SEM görüntüleri, a), b) glioksal ve c), d) glutaraldehit ilaveli mikrokapsül uygulaması.
Mikrokapsül uygulanmış meltblown yüzeyin SEM görüntüleri üzerinden yapılan parçacık boyut analizine göre mikrokapsüllerin boyutunun 1,00 µm ile 17,96 µm arasında değiştiği belirlenmiştir. Çapraz bağlayıcı olarak glutaraldehit kullanılan mikrokapsül uygulamasında ortalama kapsül boyutu 5,56 µm iken çapraz bağlayıcı olarak glioksal kullanılan mikrokapsül uygulamasında ise ortalama kapsül 2,89 µm olarak ölçülmüştür. Görüntülerden ayrıca mikrokapsüllerin genellikle düzgün küresel morfolojide olduğu fakat genel olarak fazla polimerlerin içine gömülmüş halde göründüğü ve optik mikroskopta görülebilen görece büyük ve yoğun kapsüllerin SEM görüntüsü alınmak için yapılan kaplama ve vakum işlemlerinde şekillerinin bozulduğu belirlenmiştir [15].
4. SonuçlarBu çalışmada okaliptüs uçucu yağı içeren mikrokapsüller üretmek ve üretilen mikrokapsüllerinmeltblown dokusuz yüzeye uygulanmasıyla, fonksiyonel tekstil yüzeyleri elde etmekhedeflenmiştir. Mikrokapsüllerin üretimi için kompleks koaservasyon yöntemi tercih edilmiş,çekirdek materyal olarak çok yaygın tıbbi yararları bilinen okaliptüs uçucu yağı, duvarmateryalleri olarak biyobozunur özellikte doğal polimerlerden jelatin ve arap zamkı biyopolimerikilisi tercih edilmiştir. Optik mikroskop görüntülerine göre düzgün küresel morfolojik yapıdakapsüller üretilmiş, koaservasyon aşamasında ve iki farklı çapraz bağlayıcı (glutaraldehit veglioksal) eklendikten sonra optik mikroskop görüntüleri üzerinden yapılan parçacık boyut
465

analizlerine göre kapsüllerin boyutlarını koruduğu sonucuna varılmıştır. Üretilen mikrokapsüller ile birlikte çekirdek materyali olan okaliptüs uçucu yağı ve duvar materyalleri olan jelatin ve arap zamkı polimer ikilisine FT-IR analizi yapılmıştır. Mikrokapsüllerde, arap zamkı ve jelatin ikilisinin reaksiyona girerek duvar oluşturduğunun kanıtı niteliğinde görülen primer, sekonder vetersiyer amit bağlarının varlığını gösteren bantlar FT-IR grafiğinde tespit edilmiştir [16]. Üretilen mikrokapsüller emdirme metodu ile meltblown dokusuz yüzeye uygulanmış, optik mikroskop ve SEM görüntüleri incelenerek bu görüntüler üzerinden parçacık boyut analizi yapılmıştır. Optik mikroskop görüntülerinde mikrokapsüllerin meltblown yüzey üzerinde daha yoğun bir biçimde görüldüğü belirlenmiştir. SEM analizine göre, meltblown yüzeydeki lifler üzerinde bulunan mikrokapsüllerin, genellikle etraflarında bulunan fazladan polimere gömülmüş halde olduğutespit edilmiştir. SEM görüntülerine göre yapılan parçacık boyut analizi optik mikroskopla uyuşmamaktadır ve bunun sebebinin SEM analizi sırasındaki numunelere uygulanan kaplama ve vakum işlemleri olduğu sonucuna varılmıştır. Antibakteriyel ve sinek/böcek kovucu özellikleriyle bilinen okaliptüs yağı içeren mikrokapsüllerin, kullanım alanından beklenenözelliklere uygun olarak birçok farklı tekstil yüzeyine uygulanması mümkündür. Bu sayede, fonksiyonel tekstil yüzeyleri geliştirilerek farklı tüketici isteklerine cevap verebilecek nitelikteyeni ürünlerin geliştirilmesi kaçınılmazdır. İleriki çalışmalarda, bu çalışma kapsamında üretilen okaliptüs yağı içeren mikrokapsüllerin, uygulandığı %100 polipropilen meltblown yüzeylerin yaygın kullanım alanı olan cerrahi/koruyucu maske orta katmanındaki antibakteriyel/antiviral özellikleri belirlenerek kontrollü koku salınımına dair araştırmalar gerçekleştirilecektir.
Kaynaklar
1. Horrocks, A.R., Anands, C. Teknik Tekstiller El Kitabı, İstanbul: Türk Tekstil Vakfı. 1997.2. Web Sitesi: https://www.corlutso.org.tr/uploads/docs/teknik_tekstiller_sektoru.pdf (Erişim
tarihi: 20.10.2020)3. Ghosh, S.K. Functional Coatings by Polymer Microencapsulation: A General Perspective,
Weinheim: WILEY-VCH Verlag GmbH & Co. KGaA. 2006.4. Benita, S. Microencapsulation Methods and Industrial Applications, Florida: CRC Press,
1996.5. Bezerra, F.M., Lis, M., Carmona, O.G., Carmona, C.G., Moisés, M.P., Zanin, G.M., Moraes,
F.F. Assessment of the Delivery of Citronella Oil Frommicrocapsules Supportedon WoolFabrics. Powder Technology, 2019, 343: 775–782.
6. Li, J., Zhu, X., Wang, H. et al. Synthesis and Properties of Multifunctional MicroencapsulatedPhase Change Material for Intelligent Textiles. Journal of Material Science, 2020, DOI:10.1007/s10853-020-05399-4.
7. Tyurin, I.N., Getmantseva, V.V., Andreeva, E.G. Analysis of Innovative Technologies ofThermoregulating Textile Materials. Fibre Chemistry, 2018, 50: 1–9.
8. Zhang, H., Liu, X., Song, G., Yang, H. Effects of Microencapsulated Phase Change Materialson the Thermal Behavior of Multilayer Thermal Protective Clothing. The Journal of TheTextile Institute, 2020, DOI: 10.1080/00405000.2020.1832363
9. Beşen, B.S., Balcı, O., Güneşoğlu, C., Orhan, M., Somuncuoğlu, E.İ., Tatlı, İ.İ. ObtainingMedical Textiles Including Microcapsules of the Ozonated Vegetable Oils. Fibers andPolymers, 2017, 18: 1079–1090.
466

10. Teixeira, C.S.N.R., Martins, I.M.D., Mata, V.L.G., Barreiro, M.F.F., Rodrigues, A.E.Characterization and evaluation of commercial fragrance microcapsules for textileapplication. The Journal of The Textile Institute, 2012, 103:3, 269-282.
11. Reynolds, J.E.F. Martindale the Extra Pharmacopeia, 28’th Ed., London: The PharmaceuticalPress, 1982.
12. Lawless, J. The Encyclopaedia of Essential Oils, England: Element Books, 1992.13. Gilles, M., Zhao, J., An, M., Agboola, S. Chemical Composition and Antimicrobial
Properties of Essential Oils of Three Australian Eucalyptus Species. Food Chemistry, 2010,119(2): 731–737.
14. Chang, C. P., Dobashi, T. Preparation of Alginate Complex Capsules Containing EucalyptusEssential Oil And its Controlled Release. Colloids and Surfaces B: Biointerfaces, 2003, 32:257–262.
15. Cengiz, Ö.F, Erkale, İ., Özkayalar, S., Alay-Aksoy S., Boyacı B. Nano Çinko OksitTakviyeli Jelatin/Arap Zamkı ve Kitosan/Arap Zamkından Üretilen ve N-Oktadekan İçerenMikrokapsüllerin Karakterizasyonu ve Tekstil Uygulaması, Tekstil ve Mühendis, 2018,25(110): 86-95.
16. Wang, B., Vongsvivut, J., Adhikari, B., Barrow, C.J. Microencapsulation of Tuna OilFortified with the Multiple Lipophilic Ingredients Vitamins A, D3, E, K2, Curcumin andCoenzyme Q10. Journal of Functional Foods, 2015, 19: 893–901.
467

TEKSTİLDE ÜRÜN TASARIMINDA SÜRDÜRÜLEBİLİRLİK YAKLAŞIMI
(SUSTAINABILITY APPROACH IN PRODUCT DESIGN IN TEXTILE)
SEDA YAPICI SUNAÇ *1, ZÜLEYHA DEĞİRMENCİ 2
1Gaziantep Üniversitesi, Mühendislik Fakültesi, Ürün geliştirme ve Tasarım Mühendisliği, Gaziantep, TÜRKİYE 21Gaziantep Üniversitesi, Mühendislik Fakültesi, Tekstil Mühendisliği, Gaziantep, TÜRKİYE
Abstract
Product life cycles have shortened with constantly changing and developing technologies, consequently consumption has increased.With the increase in consumption, a serious waste loadhas been occured as a result of the waste generated during production and the disposal of the materials that have been used as garbage.Even if recycling used products is a beneficial practice to reduce environmental impact, it may not be possible to recycle and reuse every product.Therefore, considering the product life cycle, sustainable product design suitable forrecycling becomes more and more important every day.In this study ; A literature review will beconducted on the relationship between product design and sustainability in textile. In addition, information on new product design approaches and product life cycles will be given.
Keywords : Product Desıgn, Sustainability,Textile Wastes, Textile industry, Recycling
Özet
Sürekli değişen ve gelişen teknolojilerle birlikte ürün kullanım süreleri kısalmış dolayısı ile tüketim miktarı artmıştır. Tüketimin artması ile birlikte hem üretim esnasında açığa çıkan atıklar hem de ürün kullanımı tamamlanmış malzemelerin doğaya bırakılması ile ciddi bir atık yükü oluşmaktadır. Çevreye olan etkilerin azaltılması için kullanılmış ürünleri geri dönüştürme faydalı bir uygulama olsa da her ürünün geri dönüştürülerek yeniden kullanılması mümkün olmayabilmektedir. Bu nedenle, ürün yaşam döngüsü düşünülerek geri dönüştürülmeye uygun sürdürülebilir ürün tasarımı önem kazanmaktadır. Bu çalışmada ; tekstilde ürün tasarımı ve sürdürülebilirlik ilişkisi ile ilgili literatür taraması yapılacak ayrıca yeni ürün tasarım yaklaşımları ve ürün yaşam döngüleri ile ilgili bilgiler verilecektir.
Anahtar Kelimeler: Ürün Tasarımı, Sürdürülebilirlik, Tekstil Atıkları, Tekstil sektörü, Geri Dönüşüm,
1.Girişİnsanın temel ihtiyaçlarından biri olan giyinme ile birlikte öne çıkan tekstil ürünleri teknolojininde gelişmesi ile birlikte sağlık, elektronik, inşaat gibi alanlarda kullanılarak dünya endüstrisindegeniş bir yer edinmiştir. Bunların yanında hızlı moda kavramının ortaya çıkması ile birliktetekstil ürünlerinin ortalama ömürleri kısalarak tüketim miktarları oldukça yükselmiştir. 2019 yılı
468

itibarı ile dünyada yaklaşık 108 milyon ton elyaf tüketimi olmuştur ve 26 milyon tonu pamuk elyafı olarak kullanılmıştır (1). Bunların yanında kullanılan pamuk elyaf oranı 2019 yılı itibarı ile dünyadaki toplam elyaf tüketimin sadece %25 i kadardır (2). Bu durum sentetik veya yapay elyaf oranındaki tüketimin ne kadar yüksek olduğunu göstermektedir.AR-GE ve ÜR-GE faaliyetlerinin de gelişmesi ile birlikte dikkat çekici, insan hayatını kolaylaştıran ve giyilebilir teknolojik ürünler ile tekstil, moda ve teknoloji kavramları iç içegeçip farklı bir talep döngüsü yaratmıştır. Ürünlerin ömürleri sadece moda ve tekstilin gelişipfarklılaşması ile değil teknolojinin gelişmesi ile de tüketilir hale gelmiştir. Tekstil ürünlerinden beklenen performans özelliklerinin sağlanması için üretim esnasında kullanılan materyaller de değişmiş bu nedenle farklı atık yükleri oluşmaya başlamıştır. Hammadde üretimi, endüstriyel üretim ve kullanım sonrası ortaya çıkan bu atıkların doğaya bırakılması ile oluşan kirlilik dünyave canlılar için ciddi tehlikeler oluşturmaktadır.
2.Tekstilde Ürün TasarımıTasarım kavramı; bir fikrin, tasarımı yapan kişi tarafından belirlenen materyallerin kullanılarakbiçim haline getirilmesidir. Endüstriyel tasarımda ise fonksiyonellik kavramı ön plana çıkmaktadır (3). Tekstilde ürün tasarımı ise moda kavramının da bu temel olgularla birleşmesi ilehem kişisel beğenilerin olduğu hem de fonksiyonellik içeren bir olgu haline getirmiştir. Tekstil malzemelerinin temel olarak elyaftan son ürüne kadar olan üretim aşamaları aşağıdaki gibidir (4). • Elyaf temini: Tekstil malzemelerinin üretiminin ilk adımı olarak tasarlanan ürüne uygunolarak doğal veya yapay elyaflar temin edilir.• Elyaf hazırlanması; Tasarlanan ürüne uygun olarak seçilen elyaf uygulanacak işleme göre hazırlanır. Doğal elyaflar açık elyaf haline getirilir. Sentetik elyaf kesikli ise açık elyafhaline getirme işlemi uygulanır. Karışım yapılacak ise bu aşamada uygun proseslerde istenen oranlarda elyaf karışımı sağlanır. • İplik Üretimi: Hazırlanan elyaf ile üretimi yapılacak ürüne uygun olan iplik üretmemetodu (ring, airjet, open end) ile iplik üretimi sağlanır.• Ham kumaş üretimi: Tasarlanan ürüne uygun olarak kumaş üretimi yapılır (Dokuma,örme,tafting,iğneleme).• Mamül kumaş Üretimi: Üretilen ham kumaşa gerekli veya istenen özelliklerkazandırılmak üzere kimyasal ve fiziksel bitim işlemleri uygulanarak mamul kumaş eldeedilir.(Ram,sanfor,boyama,apreleme vb.)• Terbiye işlemleri; Terbiye işlemleri tasarlanan ürün özelliklerine göre elyaf, iplik veyaham kumaş aşamalarında uygulanabilir. Bu işlemler; Ön terbiye, boyama, bitim işlemleri,yıkama vb. işlemleri kapsar.
Tekstil ürünlerinin üretilmesinde doğal liflerin yanı sıra sentetik ürünlerinde kullanılması ile birlikte ürünün hammaddesinden son ürün aşamasına kadar faklı tasarımlar yapmak mümkün hale gelmiştir. Ayrıca yapılan elyaf karışımları, seçilen üretim prosesleri ve uygulan terbiye işlemleri ile farklı ürünler üretilebilmektedir. Bunların dışında teknolojik gelişmelerle elektronik ürünlerin de tekstil materyallerine entegre edilmesi tekstilde ürün yelpazesini daha da genişletmiştir. Bu durum göz önüne alındığında yeni geliştirilecek ürünlerin sürdürülebilirlik yöntemleri kullanılarak tasarlanması önemli hale gelmiştir.
469

3.Tekstilde Sürdürülebilirlik Yaklaşımı ve ÖnemiDünya nüfusunun artışıyla ve endüstriyel gelişmeler ile birlikte üretim ve dolayısı ile tüketim artmış sonuç olarak çevre kirliliği, küresel ısınma ve su gibi doğal kaynakların azalması gibi olumsuz durumlar ile karşılaşılmıştır. Bu durumların ortaya çıkması ile sürdürülebilirlik kavramının ortaya çıkmasını sağlamıştır. Sürdürülebilirlik, yenilenemez kaynakların gelecek kuşaklara aktarılabilmesi, kullanımının sınırlandırılması ve ekosistem üzerinde olumsuz etkilerini azaltacak şekilde kullanılması olarak tanımlanabilir. (Ercoşkun & Karaaslan, 2009) Sürdürülebilirlik ilk olarak 1712 ‘de ortaya çıkmış olsa da 1972 yılında İsveç Birleşmiş Milletlerİnsan Çevresi Konferansında önem kazanmıştır (5). Küresel Sürdürülebilirlik kavramı ise ilkolarak 1992 de Birleşmiş Milletler Çevre ve Kalkınma Konferansı’nda gündeme gelmiştir. Dahasonra farkındalığın artması ile 1996 yılında uluslararası çalışmaları izlemek ve uygulamak adına‘’Birleşmiş Milletler Sürdürülebilir Kalkınma Komisyonu’’ kurulmuştur (6). • 1972 -Stockholm Konferansı• 1987 -Ortak Geleceğimiz Raporu• 1992 -Rio Zirvesi• 1996 - Habitat II Zirvesi• 1997 -Rio+5 Zirvesi• 2002- Johannesburg Zirvesi
Tekstil endüstrisinde yaşanan gelişmeler, üretim kapasitelerinin artması, hızlı moda kavramı,tüketimin çoğalması ile çevreye olan zararlı etkiler artmıştır. Tekstilde Sürdürülebilirlik diğer endüstrilerde de olduğu gibi sosyal, çevresel ve ekonomik işleyişlerin tüm canlıları ve ekosistemi olumsuz olarak etkilememesi üzerine kurulmuştur. Genel olarak açıklanacak olur ise;sürdürülebilirlik kavramı içerinde yer alan bazı unsurlar aşağıdaki gibidir;
• Daha az enerji tüketimi,• Daha az su tüketimi,• Daha az hava kirliliği etkisi,• Daha az zararlı kimyasal madde kullanımı,• Daha iyi koşullarda personel çalıştırma,• İnsan haklarını gözetme,• Kaynakların doğru kullanımı,
Son yıllarda giderek popüler hale gelen sürdürülebilirlik, firmalar tarafından ciddi bir pazarlama öğesi haline gelmiştir. Bu pazarlama stratejileri bazen çevreyi koruma ilkelerinin önüne geçebilmektedir. Firmalar sürdürülebilir olduklarını göstermek adına kendi bünyelerinde bazı kontrol mekanizmaları oluşturur ve bunları pazarlama öğesi olarak kullanır. Örnek olarak; sertifikalandırma sistemleri, atık yönetimi, organik veya daha az zararlı üretim teknikleri sayılabilir.
470

3.1Tekstilde Atıklar Tekstilde hammadde üretimi, endüstriyel ürün üretimi esnasında ciddi atık yükleri oluşmaktadır.Bunların dışında kullanım sonrası ürünlerde atık olarak doğaya bırakılarak yüksek bir tahribata neden olabilmektedir. Tüketimin artması ile birlikte ambalaj atıkları da eklenince atık yüküekosistem için önüne geçilmesi gereken bir sorun haline dönüşmüştür. Kullanılan tekstil materyallerinin sentetik elyaf ağırlıklı olduğu düşünülürse doğada kaybolma süreleri oldukçafazla olduğu ve yüzlerce yıl sürdüğü bilinmektedir. Doğal elyaf olarak özellikle pamuk elyafı kullanılan ürünlerinde geri dönüştürülerek kullanılması sağlanmalıdır. Pamuk elyafı üretimi sırasında kullanılan su ve kimyasal malzemelerin doğaya bıraktıkları tahribatın önüne geçmek bile sürdürülebilirlik açısından önemli faydalar sağlayacaktır. Tekstil Geri Dönüşüm (Council forTextile Recycling)’ e göre tekstil atıkları aşağıdaki gibi ikiye ayrılmaktadır (7). • Tüketim öncesi tekstil atıkları• Tüketim sonrası tekstil atıkları
3.2Tekstil atık işleme stratejileriTekstil atık işleme stratejileri ise üç gruba ayrılmaktadır. Bu stratejilerin temel amacı kullanılanürünleri en yüksek fayda ile kullanmaktır.
3.2.1Geri Dönüştürme (Recycling) Tekstilde geri dönüştürme kullanılmış veya yanlış üretilmiş atık haline gelen tekstil ürünlerininkimyasal veya fiziksel proseslerden geçirilerek yeniden elyaf formu kazandırılıp kullanılması olarak tanımlanabilmektedir. Tekstil atıklarında geri dönüşüm temel olarak 4 farklı yolla sağlanır(8). • Atık ürünün orijinal haline geri dönüşmesi,• Atığın dönüştürülerek farklı bir alanda kullanılması,• Atığın gazlara veya basit kimyasallara dönüştürülmesi,• Atığın (katı) yakılması sonucu ısı eldesi.
3.2.2 Yeniden Kullanım (Reuse) Tekstilde yeniden kullanım, ürünün genellikle aynı amaçla ürün üzerinde değişiklik yapılarak ya da yapılmadan tekrar kullanılmasıdır. Örnek olarak ikinci el tekstil ürünleri gösterilebilir. (9) . Sanayileşmeden önce tüketim ürünlerine bu kadar kolay ve ucuz yolla ulaşmak mümkün olmadığı dönemlerde yeniden kullanım zorunluluk olduğu için yaygındı ama zamanla önemini kaybetti. (10). Yeniden kullanım son dönemlerde ekolojik dengenin bozulmaya başlamasının farkına varılması ile sürdürülebilirlik yönteminin uygulanmasında tekrar önemini kazanmıştır. Ellen Macarthur Vakfı tarafından hazırlanan rapora göre 2050 yılında 150 milyon tondan fazla giyim ürünü çöplere atılacağı tahmin edilmektedir (11).
3.2.3. Azaltma (Reduce) Tekstilde sürdürülebilirlik açısından azaltma ile çalışma kavramı genel olarak ürünü olabildiğince kullanım ömrünü uzatarak hem üretimi hem de tüketimi en aza indirme olarak tanımlanabilir. Daha az ürün tüketimi daha az üretime dolayısı ile hem üretim esnasında çıkan atıkların azalmasına hem de uzun ömürlü kullanım ile daha az kullanım sonrası atık oluşmasını sağlayacaktır (12). Bunların yanında ürünleri tasarlarken alınacak bazı teknik önlemler ve kalite çalışmaları ile ürün performansları iyileştirilerek kullanım süreleri uzatılabilir.
471
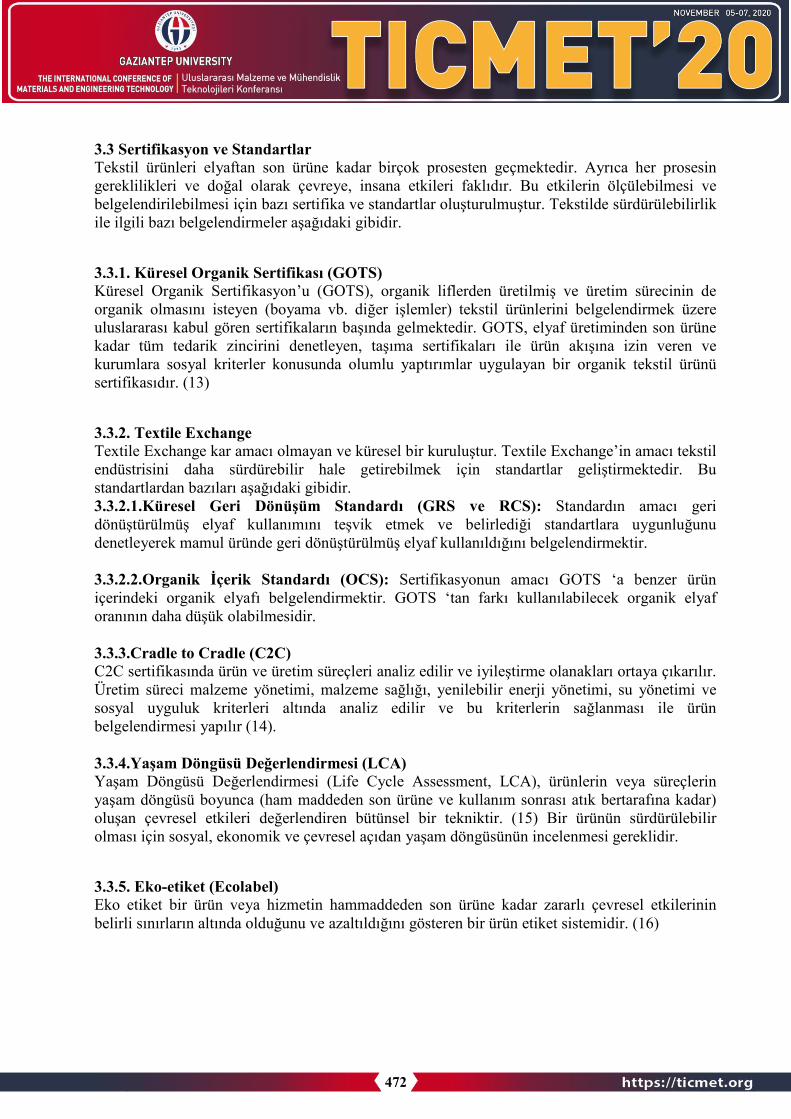
3.3 Sertifikasyon ve Standartlar Tekstil ürünleri elyaftan son ürüne kadar birçok prosesten geçmektedir. Ayrıca her prosesin gereklilikleri ve doğal olarak çevreye, insana etkileri faklıdır. Bu etkilerin ölçülebilmesi vebelgelendirilebilmesi için bazı sertifika ve standartlar oluşturulmuştur. Tekstilde sürdürülebilirlik ile ilgili bazı belgelendirmeler aşağıdaki gibidir.
3.3.1. Küresel Organik Sertifikası (GOTS) Küresel Organik Sertifikasyon’u (GOTS), organik liflerden üretilmiş ve üretim sürecinin de organik olmasını isteyen (boyama vb. diğer işlemler) tekstil ürünlerini belgelendirmek üzere uluslararası kabul gören sertifikaların başında gelmektedir. GOTS, elyaf üretiminden son ürünekadar tüm tedarik zincirini denetleyen, taşıma sertifikaları ile ürün akışına izin veren ve kurumlara sosyal kriterler konusunda olumlu yaptırımlar uygulayan bir organik tekstil ürünü sertifikasıdır. (13)
3.3.2. Textile Exchange Textile Exchange kar amacı olmayan ve küresel bir kuruluştur. Textile Exchange’in amacı tekstil endüstrisini daha sürdürebilir hale getirebilmek için standartlar geliştirmektedir. Bu standartlardan bazıları aşağıdaki gibidir.3.3.2.1.Küresel Geri Dönüşüm Standardı (GRS ve RCS): Standardın amacı geri dönüştürülmüş elyaf kullanımını teşvik etmek ve belirlediği standartlara uygunluğunudenetleyerek mamul üründe geri dönüştürülmüş elyaf kullanıldığını belgelendirmektir.
3.3.2.2.Organik İçerik Standardı (OCS): Sertifikasyonun amacı GOTS ‘a benzer ürün içerindeki organik elyafı belgelendirmektir. GOTS ‘tan farkı kullanılabilecek organik elyaf oranının daha düşük olabilmesidir.
3.3.3.Cradle to Cradle (C2C) C2C sertifikasında ürün ve üretim süreçleri analiz edilir ve iyileştirme olanakları ortaya çıkarılır. Üretim süreci malzeme yönetimi, malzeme sağlığı, yenilebilir enerji yönetimi, su yönetimi ve sosyal uyguluk kriterleri altında analiz edilir ve bu kriterlerin sağlanması ile ürün belgelendirmesi yapılır (14).
3.3.4.Yaşam Döngüsü Değerlendirmesi (LCA) Yaşam Döngüsü Değerlendirmesi (Life Cycle Assessment, LCA), ürünlerin veya süreçlerin yaşam döngüsü boyunca (ham maddeden son ürüne ve kullanım sonrası atık bertarafına kadar) oluşan çevresel etkileri değerlendiren bütünsel bir tekniktir. (15) Bir ürünün sürdürülebilir olması için sosyal, ekonomik ve çevresel açıdan yaşam döngüsünün incelenmesi gereklidir.
3.3.5. Eko-etiket (Ecolabel) Eko etiket bir ürün veya hizmetin hammaddeden son ürüne kadar zararlı çevresel etkilerinin belirli sınırların altında olduğunu ve azaltıldığını gösteren bir ürün etiket sistemidir. (16)
472

3.3.6.Sürdürülebilir Hazır Giyim Koalisyonu (SAC-Higg Index) Sürdürülebilir hazır giyim koalisyonu’nun amacı Higg Index adı altında belirledikleri standartlar ile tekstil sektöründeki firmaların çevresel ve sosyal etkilerini en aza indirmektir. Koalisyon üyeleri arasında akademik kuruluşlar, tekstil firmaları, devlet kurumları ve ticari birlikler olabilir.
3.3.7.Eko- Teks (Oeko-Tex) Eko-teks standardı esas olarak üretilmiş tekstil ürününün tamamen zararsız olduğunu ve belirli testlerden geçtiğini belirtir. Bir tekstil ürünü STANDARD 100 etiketini taşıyorsa, bu ürünün herbileşeninin, yani her iplik, düğme ve diğer aksesuarların zararlı maddeler için test edilmiştir.
3.3.7.1.Step by Oeko-Tex Step sertifikası, sürdürülebilir tekstil ve deri Üretimi anlamına gelir ve tekstil ve deri endüstrisindeki üretim tesisleri için modüler bir sertifikasyon sistemidir. Step serifikasının amacı, uzun vadede çevre dostu üretim süreçleri uygulamak, sağlığı ve güvenliği iyileştirmek veüretim tesislerinde sosyal açıdan sorumlu çalışma koşullarını teşvik etmektir.
4. Dünyada Uygulanan Sürdürülebilir Tekstil Uygulamalarına Örnekler Günümüz tekstil pazarında rekabetin atışıyla beraber sürdürülebilirlik çalışmaları özellikle büyükmarkalar için önemli bir pazarlama stratejisi haline dönüşmüştür. Ürün çeşitliliği artması ile birlikte tüketiciler birçok konuda daha seçici davranmaktadır. Önceleri organik ürünler daha çok tercih edilirken son zamanlarda sürdürülebilirliğe genel bakış ile çevreye olan zararlı etkiler, üretici firmaların çalışanlarının refahı, sosyal sorumluluklar gibi birçok parametreye dikkatedilmeye başlanmıştır. Aşağıda bazı firmaların örnek uygulamaları bulunmaktadır.
• Dünyada önemli bir elyaf üreticisi olan Lenzing Grubu, çevre dostu ve yenilikçiteknolojilerle özel elyaflar üretiyor, sektörün sürdürülebilir elyaf üretimi konusundabilinçlenmesine katkı sağlamaya çalışıyor. Örneğin; EcoVero, Lenzing’in çevreye duyarlıürünlerinden biri, elyaflar sürdürülebilir ormanlık alanlardaki ağaçlardan elde ediliyor.
• IKEA, ürünleri ve üretim süreçleri ile insanlar, toplum ve dünya için pozitif etkiyaratmayı hedefliyor. IKEA’nın bu süreçte üstlendiği bir diğer rol ise sürdürülebilir tüketimbilincinin gelişmesine katkı sağlamak ve 2030 yılına kadar sadece yenilenebilir ve geridönüştürülmüş malzemeler kullanmayı hedefliyor.
• Stella McCartney sürdürülebilir modaya öncülük eden bir marka. Ünlü markanınİlkbaharYaz 2019 koleksiyonunun yüzde 70’inden fazlası sürdürülebilir malzemelerdenüretilmiştir. Stella McCartney’ye göre modanın geleceği için atıkları azaltmak ve gibi geridönüştürülmüş malzemeleri kullanmak atılması gereken önemli adımlardır.
• Patagonia, temel hedefleri arasından daha az tüketim ve daha uzun süre kullanım yeralmaktadır. Sürdürülebilirlik çalışmalarını başlatan firmalarından başında gelmektedir.Patagonia, 2011 yılında yayınladığı reklamda ‘’Gerek olmadıkça bu ceketi almayın’’ yazısıoldukça dikkat çekmiştir.
473

• Nike, Flyknit teknolojisi ile oldukça dikkat çekiyor en son 2020 yılında ürettiği Nike Air VaporMax ayakkabılarının ağırlığının en az %50 ağırlığını geri dönüştürlmüş malzemeleroluşturuyor. Örme kumaşlarında, ayakkabılarında Flyknit teknolojisi kullanmaktadırlar. 2010 yılında FIFA için ürettikleri spor giysileri de üretirken geri dönüştürülmüş materyaller kullanarak sürdürülebilir ürünler üretmişlerdir.
5.SonuçDünyada petrol ürünlerinden sonra doğaya en çok atık bırakan ve zarar veren endüstrinin tekstil ve hazır giyim endüstrisi olduğu bilinmektedir (17). Hızla artan nüfus, tüketimin artması, teknolojinin gelişmesi ile çok çabuk değişen trendler ekosisteme bırakılan atık yükününartmasına neden olmaktadır. Yapılan tahminlere göre 2050 yılında şu anki nüfusun yaklaşık yüzde 30 fazlası insan yaşayacak ve dolayısı ile daha fazla üretim ve daha fazla atık oluşacak bu yüzden, günümüzde bilinçsizce kullanılan doğal kaynaklar tükenme tehlikesi ile karşı karşıyakalacaktır. Dünya büyüme, kıtlık, kentleşme gibi sorunlar ile yüzleşirken düşük karbonlu ve sıfır atıklı şehirlerin, geliştirilip, sürekliliğinin sağlanmasından biyolojik kapasite, ekosistem, yaşam tarzları ve geçim kaynaklarının iyileştirip yönetilmesi için altyapı oluşturulması kaçınılmaz hale gelmiştir. Bu yaklaşım içerisinde günümüzde tekstil endüstrisi açısından sürdürülebilirlik üretim stratejilerinin önüne geçtiği söylenebilir. Eğer sürdürülebilirlik yaklaşımı devamlı bir kültür haline gelmez sadece pazarlama stratejisi olarak kullanılır ise ilerleyen yıllarda yaşamak, beslenmek, kaynak bulmak en büyük sorunlar haline gelecektir. Diğer tüm endüstrilerde olduğugibi tekstil içinde ürünün doğduğu aşama olan tasarım aşamasında sürdürülebilirlik olgusu dikkate alınarak ürün tasarlaması yapılması ilerleyen dönemlerde atık yönetimi, geri dönüştürmegibi faaliyetlerin daha sağlıklı uygulanmasını sağlayacaktır.
Kaynakça 1. 2019 YILI PAMUK RAPORU. ANKARA : ICAC, 2020.2. Garside, M. Global fiber consumption distribution by fiber type 2019. s.l. : Statista, 2020.3. Turhan, Senem. Sürdürülebilir Kalkınmada Endüstriyel. Ankara : Orta Doğu Teknik
Üniversitesi.4. Hatch, Kathryn L. Textile science. United States : West Publishing Co., 2017.5. Tekstil ve Modada Sürdürülebilirlik. CAN, Özgün ve AYVAZ, Kartal Murat. 2017,
Academia Journal of Social Sciences, s. 110-119.6. Özdem, Zeynep. EV TEKSTİLİ SEKTÖRÜNDE SÜRDÜRÜLEBİLİR TASARIM. İstanbul :
İstanbul Aydın Üniversitesi, 2020.7. Cuc, S. ve Vidovic, M. Environmental Sustainability through. s.l. : OPERATIONS AND
SUPPLY CHAIN MANAGEMENT, 2011.8. Wang, Y. Recycling in Textile. Cambridge : Woodhead Publishing , 2006.9. Environmental impact of textile reuse and recycling . Sandin, Gustav ve Peters, Greg M.
2018, Journal of Cleaner Production, s. 353-365.10. 10. Reuse and Recycling of Clothing and Textiles. Ekström, Karin M. ve Salomonson,
Nicklas . 2014, Journal of Macromarketing.11. Foundation, Ellen Macarthur. A NEW TEXTILES ECONOMY. s.l. : Ellen Macarthur
Foundation, 2017.12. Mulla, Sajid Shabbir. Textile Learner Web sitesi. [Çevrimiçi] [Alıntı Tarihi: 15 10 2020.]
https://textilelearner.blogspot.com/2019/02/3-rs-of-sustainability-in-textiles.html.
474
13. The Standard. global-standad Web Sitesi. [Çevrimiçi] [Alıntı Tarihi: 15 10 2020.]https://www.global-standard.org/the-standard.html.
14. C2C Web Sitesi. [Çevrimiçi] [Alıntı Tarihi: 16 10 2020.] https://www.c2ccertified.org/.15. YAŞAM DÖNGÜSÜ DEĞERLENDİRMESİ VE SÜRDÜRÜLEBİLİRLİK İLİŞKİSİ
BAĞLAMINDA SOSYAL YAŞAM DÖNGÜSÜ DEĞERLENDİRMESİNİN (S-LCA) YERİ.ÖZDEMİR, Alp. 2019, Eskişehir Technical University Journal of Science and TechnologyB- Theoretical Sciences, s. 166-183.
16. Third-Party Certification, Sponsorship, and Consumers’ Ecolabel Use. Darnall, Nicole, Ji,Hyunjung ve Va´zquez-Brus, Diego A. . 2016, Journal of Bussines Ethics, s. 953-969.
17. Global Fashion Industry Statistics. Fashionunited Web sitesi. [Çevrimiçi] 2020. [AlıntıTarihi: 14 10 2020.] https://fashionunited.com/.
18. ECOLOGICAL AND TECHNOLOGICAL CITIES OF THE FUTURE. Ercoşkun, ÖzgeYalçıner ve Karaaslan, Şule . 2009, YTÜ Arch. Fac. E-Journal.
475
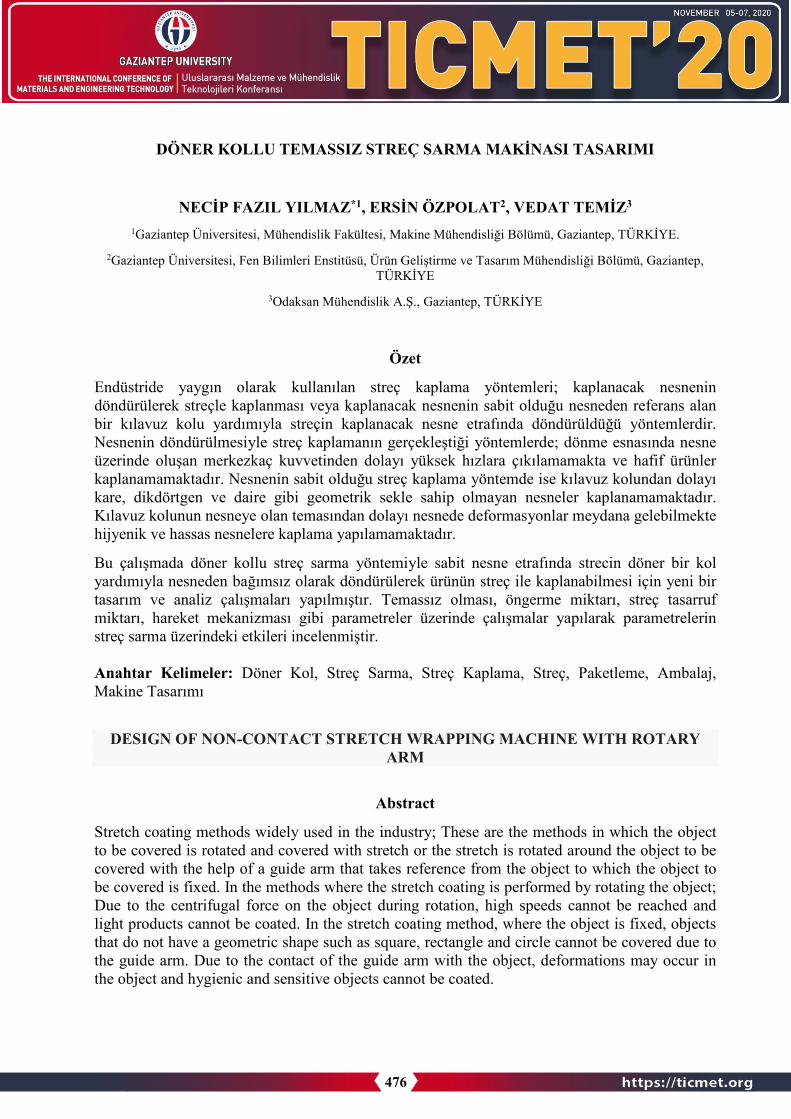
DÖNER KOLLU TEMASSIZ STREÇ SARMA MAKİNASI TASARIMI
NECİP FAZIL YILMAZ*1, ERSİN ÖZPOLAT2, VEDAT TEMİZ3
1Gaziantep Üniversitesi, Mühendislik Fakültesi, Makine Mühendisliği Bölümü, Gaziantep, TÜRKİYE. 2Gaziantep Üniversitesi, Fen Bilimleri Enstitüsü, Ürün Geliştirme ve Tasarım Mühendisliği Bölümü, Gaziantep,
TÜRKİYE 3Odaksan Mühendislik A.Ş., Gaziantep, TÜRKİYE
Özet
Endüstride yaygın olarak kullanılan streç kaplama yöntemleri; kaplanacak nesnenin döndürülerek streçle kaplanması veya kaplanacak nesnenin sabit olduğu nesneden referans alan bir kılavuz kolu yardımıyla streçin kaplanacak nesne etrafında döndürüldüğü yöntemlerdir. Nesnenin döndürülmesiyle streç kaplamanın gerçekleştiği yöntemlerde; dönme esnasında nesne üzerinde oluşan merkezkaç kuvvetinden dolayı yüksek hızlara çıkılamamakta ve hafif ürünlerkaplanamamaktadır. Nesnenin sabit olduğu streç kaplama yöntemde ise kılavuz kolundan dolayıkare, dikdörtgen ve daire gibi geometrik sekle sahip olmayan nesneler kaplanamamaktadır. Kılavuz kolunun nesneye olan temasından dolayı nesnede deformasyonlar meydana gelebilmekte hijyenik ve hassas nesnelere kaplama yapılamamaktadır.
Bu çalışmada döner kollu streç sarma yöntemiyle sabit nesne etrafında strecin döner bir kol yardımıyla nesneden bağımsız olarak döndürülerek ürünün streç ile kaplanabilmesi için yeni bir tasarım ve analiz çalışmaları yapılmıştır. Temassız olması, öngerme miktarı, streç tasarruf miktarı, hareket mekanizması gibi parametreler üzerinde çalışmalar yapılarak parametrelerin streç sarma üzerindeki etkileri incelenmiştir.
Anahtar Kelimeler: Döner Kol, Streç Sarma, Streç Kaplama, Streç, Paketleme, Ambalaj, Makine Tasarımı
DESIGN OF NON-CONTACT STRETCH WRAPPING MACHINE WITH ROTARY ARM
Abstract
Stretch coating methods widely used in the industry; These are the methods in which the object to be covered is rotated and covered with stretch or the stretch is rotated around the object to be covered with the help of a guide arm that takes reference from the object to which the object to be covered is fixed. In the methods where the stretch coating is performed by rotating the object; Due to the centrifugal force on the object during rotation, high speeds cannot be reached and light products cannot be coated. In the stretch coating method, where the object is fixed, objects that do not have a geometric shape such as square, rectangle and circle cannot be covered due to the guide arm. Due to the contact of the guide arm with the object, deformations may occur in the object and hygienic and sensitive objects cannot be coated.
476

In this study, a new design and analysis studies were carried out in order to cover the product with stretch by rotating the stretch around the fixed object independently from the object with the rotating arm stretch wrapping method. The effects of the parameters on stretch wrapping wereinvestigated by studying parameters such as non-contact, the amount of prestressing, the amount of stretch saving, and the movement mechanism.
Key Word: Revolving Sleeve, Stretch Wrapping, Stretch Coating, Stretch, Packaging, Packaging, Machine Design
1.Giriş
Paketleme ve / veya paletleme tekniğinde, bir "streç sarma" tekniği kullanılarak tek teknesnelerin paketlendiği ve / veya çok sayıda nesnenin bir araya toplandığı veya paletlendiği bilinmektedir. [1]
Nesnelerin nakliyesi ve depolanmasında, nesneleri hem korumak hem de emniyete almak için plastik streç film kullanılabilir. Plastik streç film kullanımının avantajları çoktur. Streç film sıkı bir sargı üretir ve sarılmış yüke hava, aşınma, delinme ve benzerlerinden kaynaklanan hasarlardan koruma sağlar. Plastik streç film nispeten düşük maliyetlidir ve yapıştırıcıların,klipslerin veya diğer tutturucuların kullanılmasını gerektirmez. Bu nedenle plastik streç film kullanımı hem malzeme hem de işçilik maliyetlerini düşürebilir. [2]
Plastik streç film uygulamak için çeşitli yöntemler ve makineler geliştirilmiştir. Bu yöntemlerdenmanuel elle sarım yöntemi; Streç rulosunun bir aparat ya da direk olarak insan tarafından nesne etrafında döndürülmesiyle streç sarma işleminin gerçekleştiği yöntemdir. Bu yöntemde streçüzerinden ön germe yapılamadığından nesne olması gerekenden daha fazla streçle sarılmaktadır. Paletin alt kısımları ergonomik olarak zor sarılmaktadır ve sarımı yapan kişide meslekhastalıklarına neden olmaktadır. Üst kısımlara sarım ise yükseklik nedeniyle daha da zor olmaktadır. Sarım süresi gerekenden daha uzun sürmektedir. Streç üzerinde ön germe yapılamadığı için taşıma sırasında sarılan nesnenin formunda bozulmalar ve dağılmalar meydanagelebilmektedir. Yapılan sarımın kalitesi personele göre değişiklik göstermektedir. Yüksekpersonel ve strec maliyetleri ortaya çıkmaktadır. Bu yöntemlerden bir diğeri olan tablalı makina ile sarım yönteminde ise; Streç sarma işlemi nesnenin makine üzerindeki bulunan döner tabla tarafından sabit bir hızla dönderilmesiyle gerçekleştiği sistemlerdir.[9] Bu sistem ağır nesneleri sarmak için avantajlıdır, Hafif nesnelerde merkezkaç kuvvetinden dolayı devrilme olasılığıvardır, Forklift ya da transpaletle nesnenin tabla üzerine konulup alınması gerekir, Sarılmamışnesnenin makinaya forklift yada transpaletle sevkiyatı nedeniyle nesnenin devrilmesi, dağılması gibi olumsuzlar ortaya çıkmaktadır. Merkezkaç kuvvetinden dolayı yüksek sarım hızlarınaçıkılamamakta bu nedenle de sarım süresi artmaktadır.
Mobil makine ile streç sarma işleminde ise; sarılacak nesnenin sabit olduğu makinanın nesne etrafında sabit hızla döndürülmesiyle streç sarma işleminin gerçekleştiği sistemlerdir. Bu sistemde kılavuz kolu ürüne sürekli temas ederek dönmek zorundadır, hafif ve hijyenik ürünler için ürüne temas edilmesi istenmeyen bir özelliktir kılavuz kolunun hassas ürünlerin sarılması sırasında ürüne zarar verme riski bulunmaktadır. Kılavuz kolu nedeniyle kare, dikdörtgen ve daire gibi geometrik şekle sahip olmayan ürünler sarılamamaktadır.
477

Yukarıda avantajları ve dezavantajları belirtilen yöntem ve makinaların hepsi nesneden bağımsız olarak sarım yapamamaktadır. Bu çalışmada ise; döner kollu streç sarma yöntemiyle sabit nesne etrafında streçin döner bir kol yardımıyla nesneden bağımsız olarak döndürülerek ürünün streç ile kaplanabilmesi için yeni bir tasarım ve analiz çalışmaları yapılmıştır. Temassız olması, öngerme miktarı, streç tasarruf miktarı, hareket mekanizması gibi parametreler üzerinde çalışmalar yapılarak parametrelerin streç sarma üzerindeki etkileri incelenmiştir [5].
2.Döner Kollu Temassız Streç Sarma Makinası TasarımıDöner kollu temassız streç sarma makinası şekil 1 de gösterildiği gibi taşıyıcı dikey kolon,taşıyıcı yatay kolon, döner dikey kol, döner yatay kol, üst baskı, ön germe ünitesi, otomatikkesme ve yapıştırma ünitesi olmak üzere sekiz ana bölümden oluşacak şekilde tasarlanmıştır [6-8]. Bu çalışmada yatay ve dikey taşıyıcı kolonlar makinenin hareketi sırasında gerekli rijitligi sağlayacak şekilde tasarlanmıştır. Döner yatay kol ise nesneye temas etmeden ve nesnenin şeklinden bağımsız olarak strec ön germe ünitesinin nesne etrafında dairesel hareketini sağlayacak şekilde tasarlanmıştır. Döner yatay kol şekil 2. de gösterildiği gibi döner kol motoru ve buna bağlı olan döner yatay kol motor dişlisinden aldığı hareketle kendi üzerinde bağlı olan döner dikey kol ile birlikte nesne etrafında dairesel ve nesneden bağımsız olarak hareket edebileceği düşünülmüştür. Bu hareket sırasında olabilecek olumsuzluklara karşı (sarım sırasında palet üzerinden nesne düşmesi, sarım alanına olası nesne veya cisimlerin girmesi gibi) kendi üzerinde bulunan alan tarana sensörlüyle sürekli olarak tarama yapılarak herhangi bir olumsuzlukta hareketin ani olarak durdurulması hedeflenmiştir.
Sekil 1. Döner kollu temassız streç sarma makinesinin genel görünümü
Döner dikey kol öngerme ünitesinin arabasının yukarı ve aşağı hareketini sağlayabilecek şekilde, öngerme ünitesinin arabasına tekerleklerine uygun şekilde kanallı tasarlanmıştır. Öngerme
478

ünitesi dikey hareket arabası Şekil 2 de gösterildiği gibi döner dikey kol üzerinde bulunan öngerme ünitesi dikey hareket motoru ve buna bağlı zincir dişlinin kendi ekseninde dönmesiyle kendisine bağlı zincir yardımıyla aşağı ve yukarı hareket edebilecek şekilde düşünülmüştür.
Sekil 2. Döner kol mekanizması
Makine üzerinde bulunan üst baskı özellikle hafif ürünlerin sarılması sırasında yüksek sarım hızından kaynaklanan olumsuzlukları (ürün devrilmesi gibi) gidermek için tasarlanmış olup sarım sırasından ürünün rijit bir yapıda kalması amaçlanmıştır. Şekil 3 de gösterildiği gibi mekanizma üzerine bağlı motor ve buna bağlı kasnak ve kayışla baskı yukarı aşağı hareketedebilmektedir. Baskı miktarı mekanizma üzerinde bulunan sensör ve yayla otomatik olarak ayarlanabileceği düşünülmektedir.
Sekil 3. Üst baskı aparatı
479
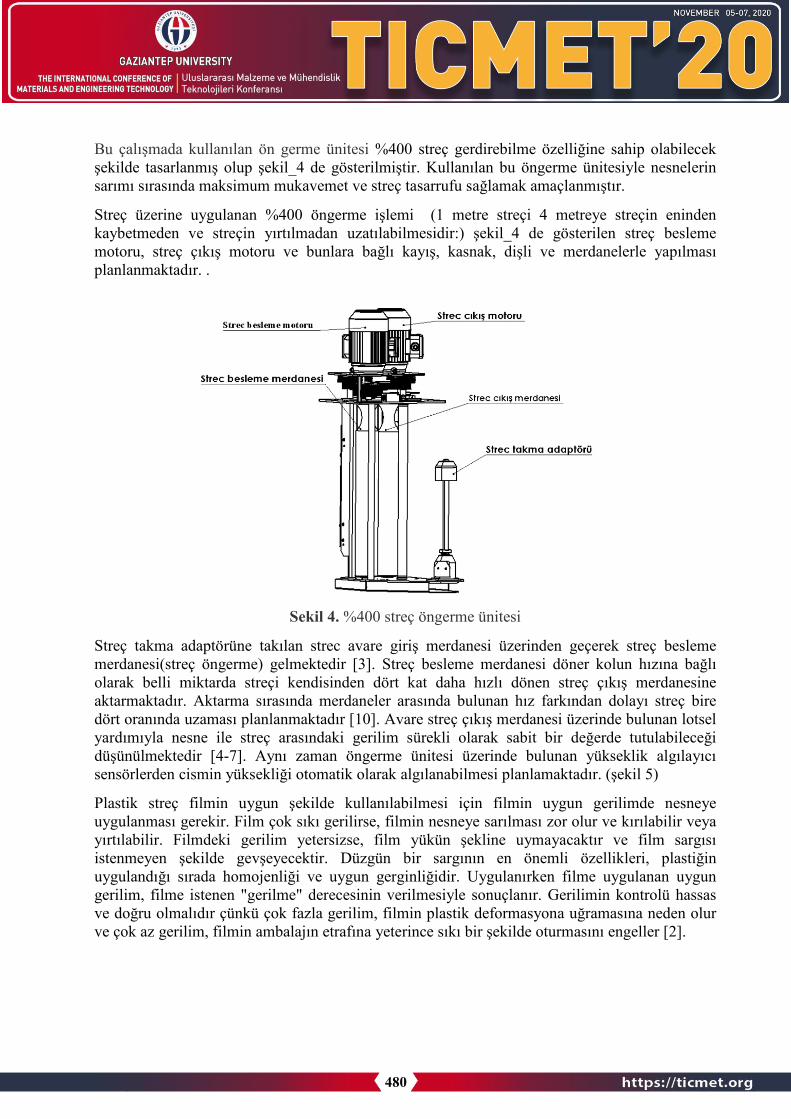
Bu çalışmada kullanılan ön germe ünitesi %400 streç gerdirebilme özelliğine sahip olabilecekşekilde tasarlanmış olup şekil_4 de gösterilmiştir. Kullanılan bu öngerme ünitesiyle nesnelerin sarımı sırasında maksimum mukavemet ve streç tasarrufu sağlamak amaçlanmıştır.
Streç üzerine uygulanan %400 öngerme işlemi (1 metre streçi 4 metreye streçin eninden kaybetmeden ve streçin yırtılmadan uzatılabilmesidir:) şekil_4 de gösterilen streç besleme motoru, streç çıkış motoru ve bunlara bağlı kayış, kasnak, dişli ve merdanelerle yapılması planlanmaktadır. .
Sekil 4. %400 streç öngerme ünitesi
Streç takma adaptörüne takılan strec avare giriş merdanesi üzerinden geçerek streç besleme merdanesi(streç öngerme) gelmektedir [3]. Streç besleme merdanesi döner kolun hızına bağlı olarak belli miktarda streçi kendisinden dört kat daha hızlı dönen streç çıkış merdanesine aktarmaktadır. Aktarma sırasında merdaneler arasında bulunan hız farkından dolayı streç bire dört oranında uzaması planlanmaktadır [10]. Avare streç çıkış merdanesi üzerinde bulunan lotsel yardımıyla nesne ile streç arasındaki gerilim sürekli olarak sabit bir değerde tutulabileceği düşünülmektedir [4-7]. Aynı zaman öngerme ünitesi üzerinde bulunan yükseklik algılayıcı sensörlerden cismin yüksekliği otomatik olarak algılanabilmesi planlamaktadır. (şekil 5)
Plastik streç filmin uygun şekilde kullanılabilmesi için filmin uygun gerilimde nesneye uygulanması gerekir. Film çok sıkı gerilirse, filmin nesneye sarılması zor olur ve kırılabilir veya yırtılabilir. Filmdeki gerilim yetersizse, film yükün şekline uymayacaktır ve film sargısı istenmeyen şekilde gevşeyecektir. Düzgün bir sargının en önemli özellikleri, plastiğin uygulandığı sırada homojenliği ve uygun gerginliğidir. Uygulanırken filme uygulanan uygun gerilim, filme istenen "gerilme" derecesinin verilmesiyle sonuçlanır. Gerilimin kontrolü hassas ve doğru olmalıdır çünkü çok fazla gerilim, filmin plastik deformasyona uğramasına neden olur ve çok az gerilim, filmin ambalajın etrafına yeterince sıkı bir şekilde oturmasını engeller [2].
480
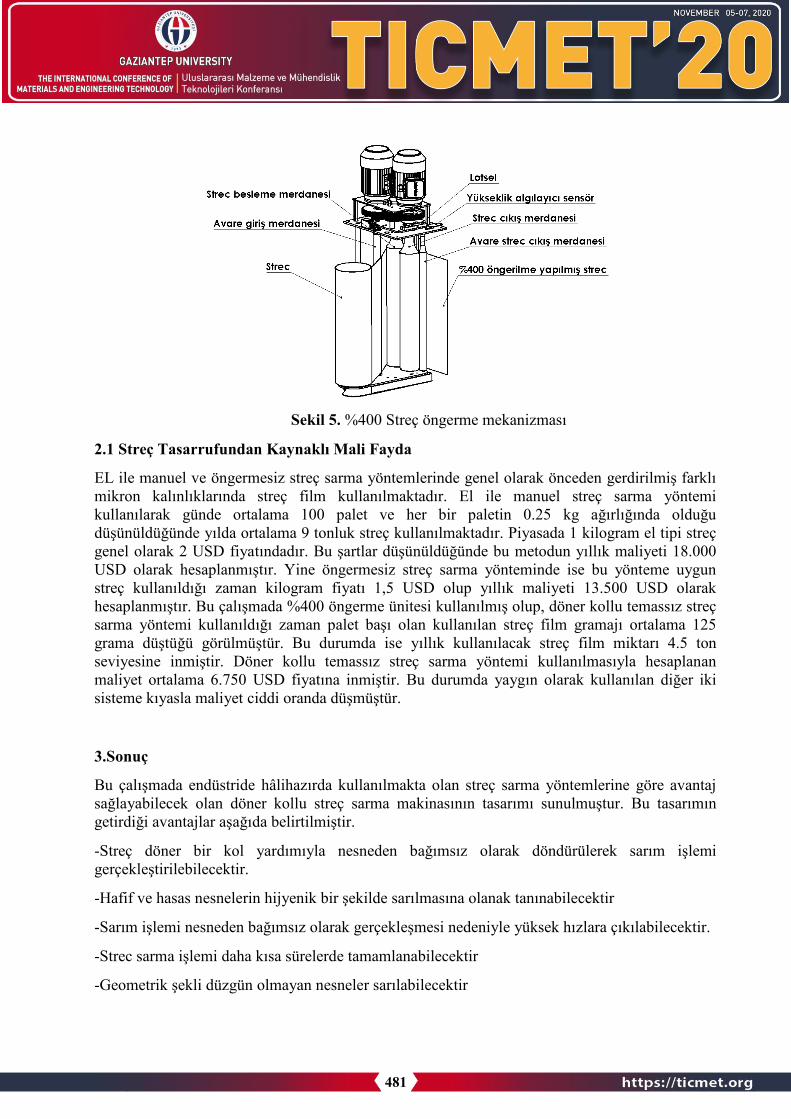
Sekil 5. %400 Streç öngerme mekanizması
2.1 Streç Tasarrufundan Kaynaklı Mali Fayda
EL ile manuel ve öngermesiz streç sarma yöntemlerinde genel olarak önceden gerdirilmiş farklımikron kalınlıklarında streç film kullanılmaktadır. El ile manuel streç sarma yöntemi kullanılarak günde ortalama 100 palet ve her bir paletin 0.25 kg ağırlığında olduğudüşünüldüğünde yılda ortalama 9 tonluk streç kullanılmaktadır. Piyasada 1 kilogram el tipi streç genel olarak 2 USD fiyatındadır. Bu şartlar düşünüldüğünde bu metodun yıllık maliyeti 18.000 USD olarak hesaplanmıştır. Yine öngermesiz streç sarma yönteminde ise bu yönteme uygunstreç kullanıldığı zaman kilogram fiyatı 1,5 USD olup yıllık maliyeti 13.500 USD olarak hesaplanmıştır. Bu çalışmada %400 öngerme ünitesi kullanılmış olup, döner kollu temassız streç sarma yöntemi kullanıldığı zaman palet başı olan kullanılan streç film gramajı ortalama 125 grama düştüğü görülmüştür. Bu durumda ise yıllık kullanılacak streç film miktarı 4.5 tonseviyesine inmiştir. Döner kollu temassız streç sarma yöntemi kullanılmasıyla hesaplananmaliyet ortalama 6.750 USD fiyatına inmiştir. Bu durumda yaygın olarak kullanılan diğer iki sisteme kıyasla maliyet ciddi oranda düşmüştür.
3.Sonuç
Bu çalışmada endüstride hâlihazırda kullanılmakta olan streç sarma yöntemlerine göre avantaj sağlayabilecek olan döner kollu streç sarma makinasının tasarımı sunulmuştur. Bu tasarımın getirdiği avantajlar aşağıda belirtilmiştir.
-Streç döner bir kol yardımıyla nesneden bağımsız olarak döndürülerek sarım işlemigerçekleştirilebilecektir.
-Hafif ve hasas nesnelerin hijyenik bir şekilde sarılmasına olanak tanınabilecektir
-Sarım işlemi nesneden bağımsız olarak gerçekleşmesi nedeniyle yüksek hızlara çıkılabilecektir.
-Strec sarma işlemi daha kısa sürelerde tamamlanabilecektir
-Geometrik şekli düzgün olmayan nesneler sarılabilecektir
481

-Makina üzerine akuple edilen kesme ve yapıştırma modülleriyle strec sarma işlemi baştan sona el değmeden yapılabilecektir
-Makina üzerinde kullanılan strec ön germe sistemiyle %50 kadar strec tasarrufu sağlanabilecektir.
Kaynaklar
1. US5569693A- High stretch film for pallet wrapping- Google Patents.2. US4706442A - Stretch film wrapping device - Google Patents3. US5414979A - Stretch wrapping apparatus - Google Patents4. US45144955A - Feedback controlled stretch wrapping apparatus and process - Google
Patents5. US4590746A - Constant tension stretch wrapping machine- Google Patents6. US430326A - Stretch wrapping apparatus with mechanical closure- Google Patents7. US4387548A - Power assisted roller-stretch wrapping process- Google Patents8. US5765344A - Stretch wrapping film cut-off system- Google Patents9. US6370839B1 - Stretch wrapping machine- Google Patents10. US4302920A - Film web drive stretch wrapping apparatus and process- Google Patents
KISA ÖZGEÇMİŞLER
Necip Fazıl Yılmaz – Prof.Dr. Necip Fazıl Yılmaz 1970 yılında Kahramanmaraş’ın Elbistan İlçesinde doğdu. İlk, Orta ve Lise öğrenimini Gaziantep’te tamamladı. Orta Doğu Teknik Üniversitesi Gaziantep Mühendislik Fakültesi Makine Mühendisliği Bölümünden 1991 yılında mezun oldu. 1996 yılında Yüksek Lisansını ve 2002 yılında Doktorasını Gaziantep Üniversitesi Makine Mühendisliği Bölümünde tamamladı. YÖK-Dünya Bankası bursuyla 1993-1994 yılları arasında İngiltere-Manchester şehrinde 7 ay süreyle eğitim gördü. 1992-2003 yılları arasında Çukurova Üniversitesi Osmaniye Meslek Yüksekokulunda Öğretim Görevlisi olarak görev yaptı. 2003 yılında Gaziantep Üniversitesi Makine Mühendisliği Bölümünde Yrd.Doç. olarak başladığıgörevine 2015 yılında Doç. Dr. ve 2020 yılında Prof. Dr. olarak devam etmektedir.
Ersin Özpolat – Ersin Özpolat 1987 yılında Gaziantep’te doğdu ilkokul, ortaokul ve lise eğitimini Gaziantepte tamamladı. Pamukkale Üniversitesi makine mühendisliği bölümünden 2011 yılında mezun oldu.2012 yılında Odaksan Mühendislik A.Ş firmasında ARGE mühendisi olarak görevine başlamış olup halen devam etmektedir.2019 yılında Gaziantep Üniversitesi ürün geliştirme ve tasarım mühendisliği bölümünde yüksek lisan eğitimine başlamış olup devam etmektedir.
Vedat temiz - Vedat Temiz 1979 yılında Gaziantep te doğdu, İlkokul, ortaokul ve Lise eğitimini Gaziantep te tamamladı. Fırat Üniversitesi elektrik elektronik mühendisliği bölümünden 2003 yılında mezun oldu. Altı yıl özel sektörde Ar-ge mühendisi olarak çalıştı. 2011 yılında Odaksan Müh. A.Ş yi kurdu ve hala devam etmektedir. Hasan kalyoncu üniversitesinde Elektronik haberleşme mühendisliği bölümünde Yüksek lisans eğitimini sürdürmektedir
482

A LITERATURE REVIEW OF HYBRID WIRE-ARC ADDITIVE MANUFACTURING WAAM TECHNOLOGY
M.BAKIR AFFAN1, OMER EYERCİOGLU1
1University of Gaziantep, Faculty of Engineering, Mechanical Engineering Department, Gaziantep, TURKEY
Abstract
The brand new Hybrid Manufacturing technologies is providing much more capability to improve and facilitate the manufacturing of metallic parts that requires special standards, complex shape and higher specifications that can’t be easily manufactured by convectionalmanners of manufacturing or it’s very expensive and time consuming to manufacture these parts using the conventional method at high production rate. The combination of more than one manufacturing technologies in one manufacturing method is called Hybrid Manufacturing Technology. Furthermore, when we combine one of the additive manufacturing with another one or more manufacturing process the resulted process is called Hybrid Additive Manufacturing process. One of the most widely used processes of hybrid additive manufacturing is HybridWire-Arc Additive Manufacturing process which is our main subject that is covered throughoutthis article. This technology uses wire-arc additive manufacturing WAAM as one of the processes combined together within the scope of the hybrid system. In this article we are going to know more about the hybrid system in manufacturing and about the additive manufacturing technologies in brief. Moreover, within the scope of this article we will learn more aboutWAAM technology in terms of the classification of this method, the types of materials used for it, the defect that may take place in the part during the usage of this technology and the methods and techniques used in order to improve the final product.
Keywords: Hybrid Manufacturing, Additive Manufacturing [AM], Wire-Arc Additive Manufacturing [WAAM], Hybrid Wire-Arc Additive Manufacturing
1. INTRODUCTIONIn today’s production there is a growing need for individual manufacturing processes. due tocomplex product geometries and difficult to manufacture materials conventional manufacturingtechnologies are brought to their limits. Also the demand for higher productivity, that is shortermanufacturing times and lower costs, defines the request for new technologies. One solution isthe use of hybrid additive manufacturing technologies which lead to more opportunities inbuilding the production environment. The technological approach that employs wire arc additivemanufacturing in a hybrid process has the superiority over other hybrid processes that utilizeother additive manufacturing methods because the hybrid system that uses WAAM has thecapability to produce near-net shaped metallic parts. This technique is well suited formanufacturing parts of high deposition rate and large volumes. Wire arc additive manufacturing(WAAM) is a metal additive manufacturing process where a metal wire and electrical arc
483

welding is utilized along with a special type of gas normally argon gas to melt the wire and thencool and turn it into a certain shape to finally produce the desired metallic component. This typeof manufacturing is usually a Computer Aided Manufacturing CAM where a computer or a special controlling unite is dedicated to control the metal deposition machine. The computer controls driving unites which are step motors to control the metal deposition within thetransitional and rotational movement dimensions. The welding torch builds the desired component layer by layer until it finally produces a metallic component with the desired shape and parameters. This manufacturing process is relatively modern and it has been attracting industrial companies and manufacturers attention because of being more economical and costs less money than other types of manufacturing. Furthermore, it facilitates the manufacturing of the components that has shapes with geometrical complexity and large dimensions. Despite the importance which this new technology recently has acquired in the industrial sector, there are still some obstacles to overcome such as the final shape surface non-uniformity which needs a further mechanical operation to enhance the surface finish of the component.
2. Hybrid Additive Manufacturing System Once the manufacturers desire to manufacture and produce metallic products that require highaccuracy with more complex specifications than convectional parts, it’s usually recommended to utilize multiple manufacturing processes one by one. The combination of these manufacturing processes together is called as “ Hybrid Manufacturing System”. There have been several studies that have compared different definitions and classifications of hybrid processes [1-2-3]. Researchers have extensively focused on ‘hybrid machining’ where more than one distinctmachining process (e.g., milling, boring, drilling, etc.) has been employed to remove materialand generate the required part [4-5-6]. The definition of a ‘hybrid process’ has varied based on the material used (such as composite products) [7] , the combination of more than one ‘active principle’ (such as laser assisted turning/ milling) [1-8] , the combination of different energy forms [6], etc. The hybrid system that we cover in this paper is the integration between Additive Manufacturing and Subtractive Manufacturing Systems which is “ Hybrid Additive Manufacturing System”. This combination of both of those manufacturing processes can eliminate the limitations of individual processes and aggregate their advantages simultaneously.In the case of hybrid additive manufacturing, there is a comprehensive review of multiple techniques such as melting of deposited material at different heat conditions, mixing of different materials during deposition, deposition of discrete materials, etc. [1] . Much of the work in this area has focused on directed energy metal deposition processes such as wire welding using metal inert gas, metal active gas [9-10]. and laser melting due to the relative ease of integration [11-12]. These hybrid systems are formulated by typically retrofitting 3-axis platforms (ball screw/ lead screw, etc.) in a CNC machining center by adding the deposition head into the machine volume. In such processes, hybrid manufacturing is achieved by alternating between additive and subtractive methods after every few layers. Machining is performed after deposition or formation of relatively thick layers followed by subsequent addition and subtraction steps until the finalpart is created. The major challenge of integrating AM and subtractive machining in the currenthybrid methods is the need for a ‘hybrid process-planning’ protocol for post-processing of AMthat accounts for the varying processing nature of AM (material shrinkage, layer thickness, orientation, etc.), machining (tool design, machining allowance, etc.) and part specific attributes (critical features and tolerance requirements) [13].
484

Figure 1. Shows the production of a simple part using (wire arc welding manufacturing) to build the body and (milling process) to improve the finish surface making Hybrid Wire-Arc Additive
Manufacturing System
Figure 2. The combining of additive and subtractive manufacturing processes consisting hybrid additive manufacturing system
3. Additive ManufacturingAdditive Manufacturing AM derived from topography and photo sculpture about 150 years ago[14].AM is also termed as additive layer manufacturing, rapid prototyping, 3D printing, etc.There is no consistent view for the classification of AM technologies. One common method is toclassify AM by the initial form of its material, which can be divided into: liquid-based, solid-based, and powder based [15-16]. Another way is to classify AM by material types, such asmetal material and polymer material [17]. In this article we concentrate on just wire-arc additivemanufacturing WAAM process.
485

Figure 3. The classification of AM processes according to the raw material used[18-19]
4. Wire-Arc Additive Manufacturing (WAAM) ProcessWire arc additive manufacturing (WAAM) is a wire-based DED approach that uses an electricalarc as a source of fusion to melt the wire feedstock and deposit a part preform, layer by layer.Use of an electrical arc as a fusion source provides a number of processing advantages,compared to electron beam and laser which are the alternative sources of fusion in DED outlinedin the “Standard Guide for DED of Metals,” part of the ASTM F3187 - 16 standard series [20-21]. the WAAM process is superior to other AM techniques regarding the manufacturing timeand deposition rate, power efficiency, and investment cost [22]. Research presents that WAAMcan reduce the cost by 62.5% and the wastage material by 90% for complex Ti-6Al-4V partscompared with the conventional process. It also shows that WAAM combined with conventionalmanufacturing process can decrease cost and lead time significantly [23].
486

Figure 4. This figure shows the principal components of WAAM process
5. WAAM Process Classification To establish the capability of WAAM for producing parts of a particular material, the materialcharacterisation is required. Primary process selections at this stage include the weldingtechnology, welding process parameters, shield gas, wire, substrate, and motion system. [21]. Here we have the main classification of WAAM processes according to the welding technology that will be employed in WAAM as follows :
5.1. Gas Metal Arc Welding (GMAW) WAAM System GMAW is a welding process in which an electric arc forms between a consumable wire electrode and the workpiece metal. The wire is usually perpendicular to the substrate. For a single-wire process, there is no limitation imposed on movement during deposition by the need to rotate the torch. Various transfer modes can be used in GMAW, such as spray and pulsed-spray. Cold metal transfer (CMT), as a modified GMAW variant based on the controlled dip transfer mode, has been widely used for WAAM due to its high deposition rate with low heat input. Tandem GMAW, a twin-wire process, was recently reported for creating metallic objects with high deposition rates, as shown in Fig. 5. Although it has been stated that the tandem system has the potential to produce intermetallic alloy as well as the gradient materials, to date there are no reports of this in the literature. To increase the deposition rate and material efficiency, a double electrode GMAW using GTAW torch to provide the bypass current was developed as shown in Fig. 6. It was reported that the coefficient of materials utilization increased more than 10% using DE-GMAW for depositing thin-wall parts within a certain range of bypass current. Note that for any wire-arc system with more than one electrode or wire, the torch must be aligned with the direction of travel, imposing a significant additional constraint on the path planning algorithm.[24]
487

Figure 5. Schematic of twin-wire welding torch for WAAM24
Figure 6. Schematic diagram of double electrode GMAW-based AM system24
5.2. Gas Tungsten Arc Welding (GTAW) WAAM System GTAW uses a non-consumable tungsten electrode in combination with a separately-fed wire to produce the weld deposit, as shown in Fig. 7. During the deposition process, wire feed orientation influences material transfer and the quality for the deposit. Back feeding, side feeding, and front feeding can be used. Front feeding is normally implemented for Ti-based and Fe-based AM. A mathematical model has been developed to optimise the wire feed direction and position for improved deposition accuracy. Increasing arc length was accompanied by an equal increase in the distance between the shielding nozzle and the workpiece. A gas lens is used to generate laminar flow of shielding gas to reduce oxidation. A trailing shielding device is usually used to prevent oxidation during the WAAM of titanium alloys on open air. Twin-wire GTAW-based WAAM has been developed to produce intermetallic and functionally graded materials. Two different wires from separate wire-feed systems are fed into a single melt pool to form objects. The composition of different materials can be controlled through separately adjusting the
488

wire-feed rates. Preheating and trailing gas shielding may be used to control the inter pass temperature and to prevent oxidation, respectively.[24]
Figure 7: Illustration of GTAW torch24
5.3. Plasma Arc Welding (PAW) WAAM System PAW as a method for the AM of metallic materials has also been widely investigated. Arc energy density in plasma welding can reach three times that of GTAW, causing less weld distortion and smaller welds with higher welding speeds. [24].
Table 1: shows the features of every WAAM process25
489

6. Utilized Metallic Materials in (WAAM)WAAM processes use commercially available wires which are produced for the welding industry and available in spooled form and in a wide range of alloys as feedstock materials.[25] Those alloys are as following:
6.1. Titanium alloys Titanium alloys have been widely studied for application of additive manufacturing in aerospace components due to their high strength-toweight ratio and inherently high material cost. There are increasing demands for more efficient and lower cost alternatives to the conventional subtractive manufacturing methods, which suffer very low fly-tobuy ratios for many component designs. [25].
6.2. Aluminum alloys and steel Although fabrication trials for many different series of aluminum alloys, including Al-Cu (2xxx) , Al-Si (4xxx) ,and Al-Mg (5xxx) have been successfully carried out, the commercial value of WAAM is mainly justifiable for large and complex thin walled structures, since cost of manufacturing small and simple aluminum alloy components using conventional machining processes is low. Using WAAM to fabricate steel is unpopular for the same reason although it is the most commonly used engineering material. Another reason for the poor commercial application of WAAM in aluminum is that some series of aluminum alloys, such as Al 7xxx and 6xxx, are challenging to weld due to turbulent melt pool and weld defects, which frequently occur during the deposition process. In general, as-deposited additively manufactured aluminum alloy parts have inferior mechanical properties compared to those machined from billet material. In order to achieve higher tensile strength, most of the as-deposited aluminum parts undergopost-process heat treatment to refine the microstructure. [25].
6.3. Nickel-based superalloys Nickel-based superalloys are the second most popular material studied by the additive manufacturing research community after titanium alloys, mainly due to their high strengths at elevated temperatures and high fabrication cost using traditional methods. Nickel-based superalloys are widely applied in aerospace, aeronautical, petrochemical, chemical and marine industries due to their outstanding strength and oxidation resistance at temperatures above 550 °C. To date, various Nickel-based superalloys, including Inconel 718 and Inconel 625 alloy have been studied after WAAM processing. [25].
6.4. Other metals Other metals have also been investigated for potential fabrication using WAAM, such as magnesium alloy AZ31 for automotive applications , Fe/Al intermetallic compounds and Al/Ti , compounds, as well as bimetallic steel/nickel and steel/bronze parts for the aeronautic industry. [25].
7. Most common defects in WAAM materialsAlthough the mechanical properties of components fabricated by WAAM are in many casescomparable to those of their conventionally processed counterparts, there are however some AMprocessing defects that must be addressed for critical applications. Porosity, high residual stresslevels, and cracking, must be avoided, particularly for parts exposed to extreme environmentswhere these defects lead to failure modes such as high temperature fatigue. Defects in WAAMcan occur for various reasons, such as poor programming strategy, unstable weld pool dynamics
490

due to poor parameter setup, thermal deformation associated with heat accumulation, environmental influence (such as gas contamination) and other machine malfunctions.[25]. Table 2 shows the tendency of various materials used in WAAM to get defects.
7.1. Deformation and residual stress Like other additive manufacturing process, distortion and residual stress are inherent to the WAAM process and it is impossible to completely avoid its generation. The residual stress canlead to distortion of the part, loss of geometric tolerance, delamination of layers during deposition, as well as deterioration of fatigue performance and fracture resistance of the additively manufactured components. Various types of deformation appear in WAAM fabricated parts, including longitudinal and transvers shrinkage, bending distortion, angular distortion androtational distortion. The distortions are caused by thermal expansion and shrinkage of the part during repeated melting and cooling processes, which is particularly an issue for large thin walled structures. Residual stress is the stress that remains in the material when all external loading forces are removed. If the residual stress is sufficiently high, it can be a critical influential factor in the mechanical properties and fatigue performance of the fabricated component. If the residual stress exceeds the local UTS of the material, cracking will take place, while if it is higher than the local YS but lower than UTS, warping or plastic deformation will occur.[25]. The methodology to avoid and control distortion and residual stresses will be mentioned in section 9 of this article.
7.2. Porosity Porosity is another common defect in WAAM processing that needs to be minimized due toadverse effects on mechanical properties. Firstly, porosity will lead to a component with low mechanical strength by damage from micro-cracks, and secondly, it usually brings low fatigue property to deposition via spatially with different size and shape distribution. In general, this type of defects are mainly classified as either raw material-induced or process-induced.[25]. The WAAM raw material, including as-received wire and substrate, often has a degree of surface contamination, such as moisture, grease and other hydrocarbon compounds that may be difficult to completely remove. These contaminants can be easily absorbed into the molten pool andsubsequently generate porosity after solidification.[25]. Process-induced porosity is usually non-spherical, and mainly caused by poor path planning or an unstable deposition process. When the deposition path is complex or the manufacturing process is changeable, insufficient fusion or spatter ejection is easily produced, creating gaps or voids in these influenced regions.[25]. To control porosity, the following methods can be adopted: (1) an AC GMAW-based process or CMT-PADV based process (cold metal transfer pulsed advanced, a controlled short-circuiting GMAW transfer process) is preferred, especially for aluminum. (2) the highest quality shielding gas, tight gas seals, non-organic piping and short pipe lengths are highly recommended. (3) the wire and substrate surfaces are as clean as possible before fabrication. (4) high quality feedstock should be used. (5) the deposited bead shape needs to be optimized. (6) the thermal profile during processing should be monitored and controlled. (7) post-deposition treatment, such as interpass rolling can be applied.[25].
7.3. Crack and delamination Similar to residual stress and deformation, cracking and delamination not only involves the thermal signature of the manufacturing process, but also relates to the material characteristics of the deposit. Ordinarily, the crack is categorised as either a solidification crack or grain boundary crack within the WAAM component. The former type of crack depends mainly on the
491

solidification nature of the material and is usually caused by the obstruction of solidified grain flow or high strain in the melt pool. Grain boundary cracking often generates along the grain boundaries due to the differences between boundary morphology and potential precipitate formation or dissolution . Delamination or separation of adjacent layers takes place due to incomplete melting or insufficient re-melting of the underlying solid between layers. Generally, this deficiency is visible and cannot be repaired by post-process treatment. In order to prevent this defect, preprocess treatment such as preheating of the substrate needs to be considered. To control crack defects, corresponding measures can be taken as follows: (1) Mixed wires andoptimization of their compositions; (2) Decrease the cooling rate during the deposition process (3) Other measures to improve strength rather than solution treatment.[25].
Table 2: shows the tendency of defects in WAAM materials 25
8. WAAM Products’ Quality Improvement TechniquesGenerally, WAAM parts require post-process treatment to improve material properties, reducesurface roughness and porosity, and remove residual stress and distortions. By appropriateapplication of post process, the majority of issues that influence deposition quality can bemitigated or eliminated. The most common post-processes are the following:
8.1. Post-process heat treatment Post-process heat treatment is widely used in WAAM to reduce residual stress, enhance material strength and as a method of hardness control. The selection of a suitable heat treatment process depends on the target material, additive manufacturing methods, working temperature and heat treatment conditions. If the heat treatment state is set incorrectly, the probability of cracking will increase under mechanical loading, as the combination of existing residual stress with load stress exceeds the material’s design limitation.[25].
8.2. Interpass cold rolling Rolling of the weld bead between each deposited layer has been shown to reduce residual stresses and distortion. Interpass cold rolling not only lowers residual stress, but also brings more homogeneous material properties. In the WAAM process, the thermal gradient with deposition layers and alternate re-heating and re-cooling process result in the target part having anisotropic
492

microstructural evolution and mechanical properties. The cold rolling technique significantly reduces microstructural anisotropy through plastically deforming the deposition. [25].
Figure 8 : Schematic diagram of WAAM with cold rolling process25
8.3. Interpass cooling This process may potentially reduce residual stress and distortion, although this aspect has not been investigated. Figure 11 presents the schematic diagram of a WAAM system with interpass cooling. The moveable gas nozzle, which supplies argon, nitrogen or CO2 gas, is used to provide active, or forced, cooling on the fabricated part during and/or after deposition of each layer.Using such rapid cooling, the in-situ layer temperature and heat cycle can be controlled within a range to obtain the desired microstructure and mechanical properties.
Figure 9 : shows schematic diagram of the combined WAAM gas cooling process25
8.4. Peening and ultrasonic impact treatment Peening and ultrasonic impact treatments (UIT) have been used in welding applications to reduce local residual stress and improve weld mechanical properties. Both techniques are cold mechanical treatments that impact the weld surface using high energy media to release tensile stress by imposing compressive stress at the treatment surface. Usually, the mechanical peening process produces compressive stresses at a limited depth below the component surface, such as around 1–2 mm in carbon steels . Ultrasonic impact treatment produces grain refinement and randomizes orientation, thus contributing to mechanical strength improvement. The ultrasonic impact treatment is limited by penetration depth, which is up to 60 μm below surface. Therefore, although both techniques are good post-process treatments, they have negligible effect on internal residual stresses of large metal part fabricated using WAAM.[25].
493

9. Conclusion In this article, we have illustrated the concept of the hybrid manufacturing and hybrid additive manufacturing then we explained the difference between them. We also discussed wire-arc additive manufacturing WAAM processes classification according to its welding technology. Inaddition, we mentioned about the defects that may take place during WAAM process and the tendency of WAAM deposited material to develop process defects. Therefore, we also mentioned the most commonly used manners in order to repair those defect and the precautions that should be taken into account before depositing the material to avoid or minimally reduce the defects developed inside the product’s shape. WAAM is a new promising manufacturing technology that is expected to replace several old convectional manufacturing techniques. However, although it has been developing quickly and being a very interesting topic for researchers to deal with, it’s still under research and development stage.
References 1. Zhu Z, Dhokia V, Nassehi A and Newman ST. A review of hybrid manufacturing
processes—state of the art and future perspectives. International Journal of ComputerIntegrated Manufacturing 2013; 26 (7): 596-615.
2. Klocke F, Wegner H, Roderburg A and Nau B. Ramp-up of hybrid manufacturingtechnologies. In: Proc. of 43rd CIRP Conference on Manufacturing Systems 2010.
3. Nau B, Roderburg A and Klocke F. Ramp-up of hybrid manufacturing technologies. CIRP-Journal of Manufacturing Science and Technology 2011.
4. Rajurkar KP, Zhu D, McGeough JA, Kozak J and De Silva A. New developments in electro-chemical machining. CIRP Annals- Manufacturing technology 1999.
5. Aspinwall DK, Dewes RC, Burrows JM, and Paul MA. Hybrid high speed machining (hsm):System design and experimental results for grinding/hsm and edm/hsm. CIRP Annals-Manufacturing Technology 2001.
6. Menzies I and Koshy P. Assessment of abrasion-assisted material removal in wire edm.CIRP AnnalsManufacturing technology 2008.
7. Roderburg A, Gerhardt K, Hinke C, Park HS, Buchholz S and Klocke F. Designmethodology for innovative hybrid manufacturing technologies. In: Proc. of the 17thInternational Conference on Concurrent Enterprising 2011.
8. Dandekar CR, Shin YC and Barnes J. Machinability improvement of titanium alloy (ti-6al-4v) via lam and hybrid machining. International Journal of Machine Tools and Manufacture2010.
9. Akula S and Karunakaran KP. Hybrid adaptive layer manufacturing: an intelligent art ofdirect metal rapid tooling process. Robotics and Computer Integrated Manufacturing 2006.
10. Karunakaran KP, Suryakumar S, Pushpa V and Akula S. Low cost integration of additiveand subtractive processes for hybrid layered manufacturing. Robotics and Computer-Integrated Manufacturing 2010.
11. Jeng JY and Lin MC. Mold fabrication and modification using hybrid processes of selectivelaser cladding and milling. Journal of Materials Processing Technology, 2001.
12. Amine TA, Sparks TE and Liou F. A strategy for fabricating complex structures via a hybridmanufacturing process. In: Proc. of 22nd Solid Freeform Fabrication symposium, 2011.
13. AIMS- a Metal Additive-Hybrid Manufacturing System: System Architecture and AttributesGuha Manogharan , Richard Wysk , Ola Harrysson and Ronald Aman , 43rd Proceedings ofthe North American Manufacturing Research, 2015.
494

14. Bourella, D. L., Beaman, J. J., Jr. and Leub M. C. and Rosenc D. W. (2009), "A BriefHistory of Additive Manufacturing and the 2009 Roadmap for Additive Manufacturing:Looking Back and Looking Ahead", RapidTech.
15. Kruth, J. -., Leu, M. C. and Nakagawa, T. (1998), "Progress in additive manufacturing andrapid prototyping", CIRP Annals - Manufacturing Technology, vol. 47.
16. Chua, C.K., Leong, K.F. and Lim, C.S. (2003), Rapid prototyping: principles andapplications in manufacturing (2nd ed), World Scientific Publishing Co. Pte. Ltd, NewYork.
17. Levy, G. N., Schindel, R. and Kruth, J. P. (2003), "RAPID MANUFACTURING ANDRAPID TOOLING WITH LAYER MANUFACTURING (LM) TECHNOLOGIES, STATEOF THE ART AND FUTURE PERSPECTIVES".
18. Huang SH, Liu P, Mokasdar A, et al. Additive manufacturing and its societal impact: aliterature review. Int J Adv Manuf Tech 2013; 67: 1191–1203.
19. Bikas H, Stavropoulos P and Chryssolouris G. Additive manufacturing methods andmodelling approaches: a critical review. Int J Adv Manuf Tech, 2016; 83: 389–405.
20. ASTM F3187-16, Standard Guide for Directed Energy Deposition of Metals, ASTMInternational, West Conshohocken, PA, 2016.
21. C.R. Cunningham, J.M. Flynn, A. Shokrani, V. Dhokia, S.T. Newman, Invited reviewarticle: Strategies and processes for high quality wire arc additive manufacturing AdditiveManufacturing 22 (2018) 672–686.
22. Williams, S.W., Martina, F., Addison, A.C., Ding, J., Pardal, G., Colegrove, P., 2016. Wire+ arc additive manufacturing. J. Mater. Sci. Technol.
23. Shettigar, K. B. (2010), Feature Based Model for RUAM Cost Modelling and ComparativeCost Analysis. M.Sc. Thesis in School of Applied Sciences (SAS), Cranfield University,Cranfield.
24. C.R. Cunningham, J.M. Flynn, A. Shokrani, V. Dhokia, S.T. Newman, Invited reviewarticle: Strategies and processes for high quality wire arc additive manufacturing AdditiveManufacturing 22 (2018) 672–686.
25. Bintao Wua, Zengxi Pana, Donghong Dingb, Dominic Cuiuria, Huijun Lia, Jing Xua, JohnNorrish, A review of the wire arc additive manufacturing of metals: properties, defects andquality improvement, Journal of Manufacturing Processes 35 (2018) 127–139.
495

ZINC OXIDE BASED METAMATERIAL ABSORBER FOR SOLAR CELL APPLICATIONS
HÜSEYİN KORKMAZ1, UĞUR CEM HASAR1 1Gaziantep University, Engineering Faculty, Department of Electrical and Electronics
Engineering, Gaziantep, Turkey
Abstract
Solar cells do not have the ability to absorb the majority of the solar radiation that is coming towards them. We designed and simulated Zinc Oxide (ZnO) based metamaterial absorber in the visible and ultraviolet frequency region. The proposed design reached a maximum 99.7% absorption rate due to dielectric layer material and proper geometrical arrangement. Also, the proposed design provides wide band and independency polarization under normal incidence, so proposed design is a good candidate for solar cell applications.
Keywords: Metamaterial absorber, Solar cell, Wide band absorption, Zinc Oxide.
1. Introduction
Rapid progress of the technology in the 21.century has increased need for energy. This idea is emphasise by researchers, institutions and many goverments [1]. Solar cells have not yet reached a sufficient level of efficiency. The reasons are can be listed as short electromagnetic wave radiation with high energy losses, long electromagnetic wave radiation with low energy losses, reflection and shadow effect losses,etc. Because of this reasons solar cells do not sufficiently absorb solar radiation coming towards them [2]. Metamaterial absorber for solarcell absorbs the rays of sun and produces more energy for increase efficiency of solar cell. Also it is important for ratio of absorption which material is used in the absorber. In the literature, Rufangura et al. used Gallium arsenide (GaAs) dielectric layer under circular ring resonator with top grapheme monolayer sheet and analyzed metamaterial absorber in 500-70 THz frequency band [3]. Obaidullah et al. used a single wall carbon nanotube (SWNT’s) as dielectric layer with aluminum top resonator and aluminum ground plate, analyzed metamaterial absorber for solar cells in visible and ultraviolet frequency region [4].
To our best knowledge, Zinc Oxide (ZnO) absorbers have been applied to optimize maximum absorption level of solar cells [5][6]. In this study, we investigated and analyzed Reference 4 to obtain same results with original paper. After obtain same result with Reference 4, we changed dielectric layer to obtain better results than original paper. We designed a new metamaterial absorber for solar cell with Zinc Oxide sandwiched between an aliminum top resonator and an aliminum ground metalic plate. The optical properties of the new structure has been simulated in 350-1000 THz frequency region. According to simulation results, proposed design provide 95% and above absorption with wide band in between 350-896 THz. Also proposed design that we simulated achieved 99.7% maximum absorption at 604 THz.
496

2. Design and Analysis
The proposed Zinc Oxide based metamaterial absorber unit cell consist of three basic parts: aluminum resonator at the top of the structure, aluminum metalic bottom ground plate and Zinc Oxide as a dielectric layer in between metalic top resonator and bottom ground plate as shown in Figure 1.
Figure 1. Perspective view of unit cell
The Zinc Oxide layer with thickness ‘’d’’ is coupled with aluminum bottom ground plate with thickness ‘’h’’ and the aluminum metalic top resonators with thickness ‘’t’’ in order to enhancethe resonance frequencies. Aluminum is selected for low skin depth, low cost, resistance to high temprature, have ability to reflect in high frequency radiations [7]. The dimensional characteristic of the proposed and previous study design is given in Table 1. The maximum absorption achieved due to arrangement, orientation and geometric configuration of resonatorsin the proposed design. The resonator geometric configuration consist of the four identical strips and a central patch which located in the middle of the four strips. The lateral dimension of the structure ( h+ d+ t) must be less than the wave lenght of the incident radiations [8].
Table 1. Geometrical dimensions of the proposed absorber design.
Parameter Value (nm) This study — Previous Study
Explanation
a d h l t w x
50---50 40---100 50---50 80---80 20---20 50---50
400---400
Length of central patch Thickness of dielectric layer Thickness of Aliminum plate
Length of strips Thickness of resonators
Width of resonators Peridiocity of structure
The simulation for the oriented Zinc Oxide based metamaterial absorber is operated with full wave electromagnetic software established on Finite Integration Technique (FIT) with
497

frequency domain solver. The proposed design operated at frequency ranging from 350 THz to 1000 THz. The direction of incident electromagnetic radiations is E-field along x-direction andH-field along y-direction and both E-field and H-field propagate paralel to the structure plan.In addition, wave vector (k) is perpendicular to the absorber [9], the boundary conditions selected periodic in both x- and y- plane and open add space in the z-plane.
3. Results and Discussion
The optical absorption depends on its reflection and transmission coefficient that can be formulated as A=1-R-T. The bottom aluminum metalic plate behaves like a mirror and blockstransmission [10]. We observed that transmission plots of design is almost zero, so we assumedthat A=1-R for our design to calculate absorption. We taked free-space impedance as 377 Ω is match with impedance of proposed design. This calculation and simulation process results in achieving the minimum reflection rate which leads to higher absorption in the frequency range of interest.
Figure 2. Absorption and reflection plots of the proposed and previous study absorber design in 350 THz to 1000 THz frequency region.
Strong coupling of each strip resonators and central patch with Zinc Oxide and aluminum layer are provided electromagnetic response of wide band absorption. Simulation results for absorption and reflection in frequency ranging from 350 THz to 1000 THz for this study and previous study is shown in Figure 2. We can observe from the Figure 2, proposed design has wider absorption band. According to simulation results, proposed design provide 95% and above absorption rate between 350-896 THz. Proposed design that we simulated achieved 99.7% (near unity) maximum absorption at 604 THz. Previous study design provide 95% and above absorption rate between 421-873 THz and achieved 99.2% maximum absorption at 627 THz.
3.1. Polarization and Incident Angle Analysis
In order to further analysis absorption behavior of proposed design regarding the radiation sources, numerical simulations under different incident angles for transverse electric (TE),
498
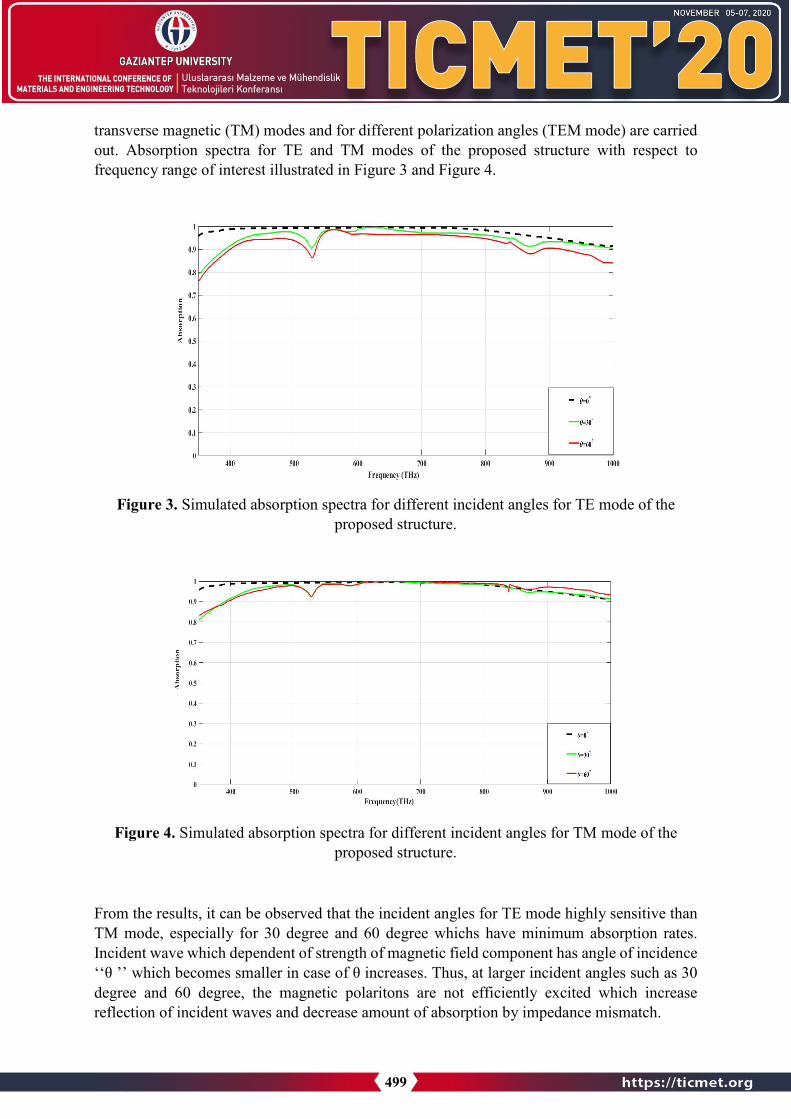
transverse magnetic (TM) modes and for different polarization angles (TEM mode) are carriedout. Absorption spectra for TE and TM modes of the proposed structure with respect to frequency range of interest illustrated in Figure 3 and Figure 4.
Figure 3. Simulated absorption spectra for different incident angles for TE mode of the proposed structure.
Figure 4. Simulated absorption spectra for different incident angles for TM mode of the proposed structure.
From the results, it can be observed that the incident angles for TE mode highly sensitive than TM mode, especially for 30 degree and 60 degree whichs have minimum absorption rates. Incident wave which dependent of strength of magnetic field component has angle of incidence ‘‘θ ’’ which becomes smaller in case of θ increases. Thus, at larger incident angles such as 30 degree and 60 degree, the magnetic polaritons are not efficiently excited which increase reflection of incident waves and decrease amount of absorption by impedance mismatch.
499

Due to high symmetric characteristics of the design, proposed absorber provides polarization independency under polarization angles (TEM mode of proposed design) from 0 degree to 90 as shown in Figure 5. In this way, it can be expressed that proposed Zinc Oxide basedmetamaterial absorber have ability to keep absorbance high without considering the polarization angles, so proposed design is a good candidate for solar cells.
Figure 5. Simulated absorption spectra for different polarization angles at normal incidence (TEM mode of proposed design).
Figure 6. Simulated absorption spectra for TE, TM and TEM mode of previous study design [4].
500

Simulated absorption spectra for TE, TM and TEM modes of previous study design are shownin Figure 6. Previous study design is also provides polarization independency under polarization angles but its absorption (95% and above) band is narrower than proposed design. We can observe from the Figure 6, TE and TM plots of proposed design provides high absorption when we compare with TE and TM plots of previous study.
4. Conclusion
In this study, design and simulation of Zinc Oxide based metamaterial has been investigatedand compared with previous study. Results of simulation analyzed for understand physicsbehind absorption. Geometric parameters study is done to show importance of geometric configuration of materials. Absorption behavior of proposed design regarding the radiation sources are studied. In addition numerical simulation under different angles for (TE) and (TM) modes are done. Transverse Electric (TE), Transverse magnetic (TM), Transverse Electromagnetic (TEM) modes, absorption and reflection plots are compared with previous study. We indicated that Zinc Oxide based metamaterial absorber provide high absorption rate and wide band absorption. From the results of numerical simulation for different polarization angles (TEM) mode, we demonstrate that proposed design provide polarization anglesindependency and can be good candidate for solar cells.
Acknowledgments
I would like to thank my wife Asiye KORKMAZ for reviewing text language of this study. I am thankful to Nahide KORKMAZ for edit text and figures of the study. I would like to express my gratitude to Salih KORKMAZ who helped me for graphic interpretation in my study.
References
1. Read, S., Lindhult, E., & Mashayekhi, A. (2016). The Inefficiencies of EnergyEfficiency: Reviewing the Strategic Role of Energy Efficiency and its Effectiveness inAlleviating Climate Change. Journal of Settlements and Spatial Planning, 2016(Spec. Iss. 5),77-87.
2. Sahin, G. (2016). Effect of wavelength on the electrical parameters of a vertical paralleljunction silicon solar cell illuminated by its rear side in frequency domain. Results in physics,6, 107-111.
3. Rufangura, P., Sabah, C. (2017). Graphene-based wideband metamaterial absorber forsolar cells application. Journal of Nanophotonics, 11(3), 036008.
4. Obaidullah, M., Esat, V., Sabah, C. (2017). Thin film (6, 5) semiconducting single-walled carbon nanotube metamaterial absorber for photovoltaic applications. OpticalEngineering, 56(12), 127101.
501

5. Sun, X. W., & Kwok, H. S. (1999). Optical properties of epitaxially grown zinc oxidefilms on sapphire by pulsed laser deposition. Journal of applied physics, 86(1), 408-411.
6. Kim, K. H., Park, K. C., & Ma, D. Y. (1997). Structural, electrical and optical propertiesof aluminum doped zinc oxide films prepared by radio frequency magnetron sputtering. Journal of Applied Physics, 81(12), 7764-7772.
7. Mulla, B., Sabah, C. (2015). Perfect metamaterial absorber design for solar cellapplications. Waves in Random and Complex Media, 25(3), 382-392.
8. Ustunsoy, M. P., Sabah, C. (2016). Dual-band high-frequency metamaterial absorber based on patch resonator for solar cell applications and its enhancement with graphene layers. Journal of Alloys and Compounds, 687, 514-520.
9. Zouaghi, W., Voß, D., Gorath, M., Nicoloso, N., & Roskos, H. G. (2015). How good would the conductivity of graphene have to be to make single-layer-graphene metamaterials for terahertz frequencies feasible?. Carbon, 94, 301-308.
10. Rufangura, P., Sabah, C. (2016). Design and characterization of a dual-band perfect metamaterial absorber for solar cell applications. Journal of Alloys and Compounds, 671, 43-50.
502

AĞIR VASITA HAVA KOMPRESÖRLERİNDE PİSTON
SEGMANLARINDAN YAĞ VERME PROBLEMLERİNİN RASTGELE
ORMAN ALGORİTMASI İLE TAHMİNİ
Emre GÜL *1, Mete KALYONCU** 2, Gökselhan KULA*** 1
1 Yıldız Pul Otomotiv Motor Parçaları Sanayi A.Ş., Konya / TÜRKİYE 2 Konya Teknik Üniversitesi, Mühendislik ve Doğa Bil. Fak., Makina Mühendisliği Bölümü, Konya / TÜRKİYE
*[email protected], **[email protected], ***[email protected]
Özet
Ağır vasıta araçlar için önemli bir bileşen olan hava kompresörleri aracın yolda güvenli
hareketini sağlayan fren, süspansiyon ve debriyaj sistemleri için gerekli havanın
basınçlandırılarak tanklara depo edilmesini sağlamaktadırlar. Kompresör, çalışma şartları ve
düzenli servis bakım periyoduna bağlı olarak, bazen hava tanklarına ve oradan fren sistemi
elemanlarına yağ taşınımı gerçekleşebilmektedir. Bu istenmeyen durum ise aracın hava ile
çalışan aksamlarının çalışma verimliliğini azaltmakta, hatta arızalanmasına sebep
olabilmektedir. Ana sanayi üreticilerinin servis kitapçıklarında belirtilen aşırı yükte çalışma
durumu, giriş hattının bakımsız ve deforme olması sonucu görülen piston segman-gömlek
aşınması gibi durumların arıza gerçekleştiği anda bilinmesi oldukça önemlidir. Böylelikle
zamanında tanı konularak, cüzi ücretlerle gerekli servis bakımların yapılmasına katkı
sağlamaktadır. Ortaya konulan bu çalışmada, kompresörlerde meydana gelebilecek bu derece
önemli durumların önceden belirlenmesinde Rastgele Orman Algoritması’nın sınıflandırma
performansı ve algoritmanın hiç tanımadığı verilerde tahmin yeteneği incelenmiştir.
Anahtar Kelimeler: Ağır Vasıta Hava Kompresörü, Rastgele Orman Algoritması, Makine
Öğrenmesi, Piston Segmanı Aşınması, Yağ Verme.
Abstract
Compressor is an important component for heavy vehicles that ensure the safe movement of the
vehicle on the road for the air required for brake, suspension and clutch systems is pressurized
and stored in tanks. According to the working conditions of the compressor and regular service
maintenance period, oil can be carried to the air tanks and from there to the brake system
elements. This unexpected situation reduces the working efficiency of the parts of the vehicle
driven by pressurized air and even causes malfunction. It is important to consider that conditions
such as operating overload specified in the service manuals of the original equipment
manufacturer or piston ring-liner wear in case of maintenance and deformation of the inlet line.
In this way, it contributes to the necessary service maintenance with a low fee by making a
timely diagnosis. In this study, the classification performance of the random forest algorithm and
its ability to predict in the data that the algorithm does not recognize was examined in the
prediction of such important situations that may occur in compressors.
Keyword: Air Compressor, Random Forest Algorithm, Machine Learning, Piston-rings
Wearing, Oil Carry.
503

1. Giriş
Günümüz koşullarında gelişen teknoloji sayesinde algılayıcılar ile veri toplama ve bu verilere
dayalı çalışmalar artmıştır. Bu çalışmalar ile birlikte sistemlerden sensörler aracılığı ile okunan
değerler anlamlandırılarak, elde edilen sonuçlar üzerine değerlendirmeler yapılmaktadır.
Ağır vasıta araçların uzun yol sürüşlerinde emniyetli hareket etmesine destek sağlayan pistonlu
kompresörler, gazların hacmini azaltarak, gazların sıkıştırılabilirliği sayesinde basıncını arttıran
birer mekanik alettir [1]. Hava kompresörleri, ortamdan emdiği havayı, barındırdığı mekanizma
ve valf sistemleri ile basınçlandırarak, havanın tanka depo edilmesinde görev almaktadırlar. Ağır
vasıtalarda 159 cm3 ile 800 cm3 aralığında 1,5 m3/dk hava seviyelerine yaklaşabilmektedir.
İhtiyaç yükleme durumlarına göre tek ya da çift silindirli olarak tasarlanmaktadırlar [2]. Genel
olarak bir pistonlu kompresöre ait alt parçalar Şekil 1’de gösterilmiştir. Her bir bileşenin adı ise
Tablo 1.’de verilmiştir.
Şekil 1. Çift Silindirli ve Su Soğutmalı Kompresör Patlatılmış Görünümü [1]
Ağır vasıtalarda hava kompresörleri bağlantı yönünden çeşitlilik gösterse de barındırdığı valf
sistemleri benzerdir. Kasnaklı ve manyetik kavramalı kompresörler daha çok traktör ve iş
makinelerinde tercih edilirken, kayış ile kullanıldıkları için yüksek devirler ve aşırı yükte kayış
kaçırma problemi olacağından küçük hacimli kompresörlerde tercih edilmektedir. Dişli bağlantılı
ve pnömatik kavramalı kompresörler kamyon, tır gibi vasıtalarda, elektrikli ve vidalı tip
504

kompresörler ise şehir içi otobüs gibi vasıtalarda tercih edilmektedir. Şekil 2.’de tek silindirli
kompresör ve pnömatik devresi verilmiştir.
Tablo 1. Kompresör Parçaları[1].
Parça No Parça İsmi Parça No Parça İsmi
1 Üst Kapak 11 Perno
2 NBR Contalar 12 Emniyet Segmanı
3 Ara Plaka 13 Biyel Kolu
4 Çıkış Portları 14 Gövde
5 Valf Pleyt 15 Burç
6 By-Pass Valfleri 16 Krank Mili
7 Giriş Valfi 17 Rulman
8 Sıyırıcı Segmanlar 18 O-ring
9 Yağ Segmanı 19 Somun
10 Piston 20 Karter Tapası
Şekil 2. Tek Silindirli Kompresör ve Pnömatik Devresi [3]
Yıldız Pul Otomotiv Motor Parçaları Sanayi A.Ş. Ar-Ge teknik servis birimi tarafından kayıt
altına alınan 2018 ve 2019 yıllarında gerçekleşen kompresör arızalarının analizi yapıldığında, en
sık rastlanılan kullanıcı kaynaklı kompresör arızasının düşük kalitede giriş havası ile beslenmesi
sonucu aşınan piston segmanları kaynaklı yağ verme olduğu görülmüştür.
505

1.1. Hava Kompresörü Piston Segmanlarından Yağ Verme
Hava kompresörlerinin, ana sanayi kompresör üreticilerin arıza giderme kılavuzlarında %25
yükte çalışacak şekilde tasarlandıklarından bahsedilmiştir [4]. Kompresörler çalışma sırasında az
da olsa bir miktar yağ vermektedirler. Kompresörün %25’inden fazla yükte çalıştığı durumlarda
sıcaklığa bağlı olarak zamanla silindir kapağı hava çıkış portunda kurum şeklinde beliren karbon
birikintilerine sebep olmaktadır.
Şekil 3. Toz Partiküllerinin Emilimi Sonucunda Segman ve Gömlekte Yaşanan Aşınma [5]
Bu taşınan yağ miktarında görülen artışın önemli bir sebebi segmanlarda ve gömlekte
aşınmaların gerçekleşmesidir. Aracın hava filtresi ya da hava giriş hortumlarının zedelenmesi
gibi durumlarında oluşan yırtık ve çatlaklardan toz partikülleri giriş yapar. Toz partikülleri
yüksek basınç esnasında segman ile gömlek arasında zımpara görevi görerek aşınmalara sebep
olur. Toz emilimi sonucunda silindir gömleği ile piston segmanı arasında oluşan boşluktan
kompresörün kartere hava üfürmesine ve karterdeki yağın hava çıkış portundan tanka doğru
ilerlemesine yani yağ verme durumuna sebep olmaktadır. Gül ve Kalyoncu’nun 2020 yılında
yapmış oldukları çalışmada aşınmanın gömlek üst ölü noktasında çapta 0.1mm iken, alt ölü
noktasında çapta 0.05mm aralığında değiştiğinden bahsedilmiştir. Piston segmanlarında ise
segman kalınlığının yaklaşık 3mm’lerden, 2.30mm’lere kadar indiği görsel olarak gösterilmiştir
[5]. Şekil 3.’de toz partiküllerinin emilimi sonucunda piston segmanı ile gömlekte yaşanan
aşınma görseli verilmiştir.
1.2. Rastgele Orman Algoritması
Rastgele Orman Algoritması, çok farklı disiplinlere hitap etmesi sebebiyle farklı alanlarda
çalışan araştırmacıların dikkatini üzerine çekmektedir ve en başarılı sınıflandırma
506

yöntemlerinden biri olarak bilinmektedir. Ağaç tipi sınıflandırıcılar topluluğu olarak
adlandırılabilirler [6].
Rastgele Orman Algoritması’nı genel anlamıyla açıklamak gerekirse; algoritma birden fazla
karar ağacını oluşturur ve onları daha doğru ve istikrarlı bir tahmin elde etmek için birleştirir.
Algoritma ağaçları büyütürken, modele ek rastgelelik katıyor. Bir düğümü parçalara ayırırken
rastgele bir özellik alt kümesinden en iyi özelliği aramaktadır. Rastgele bir ormanın iki ağaç gibi
görünmesi Şekil 4.’te verilmiştir [7].
Şekil 4. Rastgele Ormanın İki Ağaç Gibi Görülmesi [7]
Her bir veri seti orijinal veri setinden yer değiştirmeli olarak üretilirken, rastgele özellik seçimi
kullanılarak ağaçların geliştirilmesi sağlanır ve yeni geliştirilen ağaçlar budanmaz. Çok hızlı
olması, aşırı uyuma karşı dayanıklı olması ve istenilen ağaç adeti ile çalışması Rastgele Orman
Algoritması’nın özelliklerindendir [6]. Şekil 5.’te Rastgele Orman Algoritması’nın akış şeması
verilmiştir.
2. Materyal ve Metot
Ağır vasıta hava kompresörünün ömür testlerinin gerçekleştirilebilmesi için firma bünyesinde
test düzeneği oluşturulmuştur. Oluşturulan test düzeneğine ait şema Şekil 6.’da gösterilmiştir.
Aydıner ve ark. 2019 yılında gerçekleştirdikleri çalışmada ana sanayi üretimi hava
kompresörünün performans testlerini gerçekleştirmiş ve test cihazının kullanıldığı üretici firmaya
ait kompresör performans verileri ile kıyaslanmasını yapmışlardır. Bu sayede test düzeneğinin
doğrulaması yapılmıştır [9]. Gül ve arkadaşlarının 2019 yılında yaptıkları çalışmada ise yaygın
görülen hava kompresörü arızalarından bahsedilmiş ve performans değerleri aynı test
düzeneğinde belirlenmiştir [10]. 2020 yılında yapmış oldukları çalışmada ise aynı veriler ile K-
En Yakın Komşu Algoritması sınıflandırma performansı incelenmiştir [5]. Veri toplama ve kayıt
yazılımı olarak Dewesoft kontrolcüsü ve Dewesoft x2 yazılımı kullanılmıştır. Kayıt altına alınan
veriler yazılım ile Excel formatına dönüştürüldükten sonra etiket değerleri eklenerek, Python
programının okuyabileceği .csv formatında kayıt edilmiştir.
507

Şekil 5. Algoritmanın akış şeması [8]
Şekil 6. Hava Kompresörü Test Düzeneği [5]
508

Deneyler 636 cm3 hacimli, çift silindirli ve su soğutmalı kompresörde gerçekleştirilmiştir.
Kompresör dişli tahrikli olmakla birlikte motor yağı ile yağlanmakta, radyatörden gelen soğutma
suyunun kompresör silinir kapağında dolaşımı ile soğutma işlemi yapılmaktadır. Şekil 7.’de ağır
vasıtalarda yaygın olarak kullanılan çift silindirli bir hava fren kompresörü gösterilmiştir.
Şekil 7. Ağır Vasıta Hava Kompresörü [1]
2.1. Veri Hazırlama
Dewesoft yazılımı ile sensörler aracılığıyla toplamda 6498 veri kayıt altına alınmıştır.
Veriler %80 eğitim ve %20 test verisi olarak rastgele bir biçimde iki gruba ayrılmıştır. Çalışma
durumlarının etiket değerleri Tablo 2.’de gösterilmiştir.
Tablo 2. Çalışma Durumlarının Etiket Değerleri.
Giriş Parametrelerine Etiketlenmiş Çıkış Parametreleri
Normal Koşullarda Çalışma Durumu 0
Tahliye Arızası Durumu (%40 Sürekli Yükte Çalışma) 1
Yağ Verme (Taşınımı) Durumu 2; 3; 4
Tablo 3.’te piston segmanlarının aşınma değerleri ve çalışma durumlarına etiketlendiği değerler
gösterilmektedir.
Tablo 3. Silindir Gömleği ile Piston Segmanları Arasındaki Boşluğa Bağlı Çalışma
Durumlarının Düzenlenmesi.
Çalışma
Durumu
Durum
Numarası
Silindir
Gömleği
Çapı (mm)
Piston
Çapı
(mm)
Piston
Segmanı
Çapı (mm)
Piston
Segmanlarının
Aşınma
Durumları
2.Durum Ø85.05 Ø85 Ø85
3. Durum Ø85.25 Ø85.25 Ø85
4. Durum Ø85.50 Ø85.50 Ø85
509

Şekil 8.’de kullanılan 11 adet parametre ve bu parametrelerin min.-mak. değerleri gösterilerek,
tahmini bakım için alt yapı oluşturulmuştur.
Şekil 8. Tahmini Bakım Alt Yapısının Oluşturulması
3. Bulgular
Ağaçların derinliğinin ayarlanması için hiper parametresi grid search ile optimize edilmiştir.
Şekil 9.’da Rastgele Orman Algoritması parametrelerinin hava kompresörü verilerinde doğruluk
sonuçlarının incelenerek optimize edilmesi sağlanmıştır. Ağaç derinliği arttıkça eğitim ve test
verilerinin doğru tahmin edilme oranı artmıştır. Eğitim ve test verileri doğru tahmin oranının eşit
seviyede artması aşırı öğrenme durumunun gerçekleşmediğini göstermiştir. Modelde
kullanılacak karar ağacı, maksimum özellik sayısı, bir yaprak düğümünde olması gereken
minimum örnek sayısı, bir iç düğümü ayırmak için gereken minimum örnek sayısının optimize
edilmesi düşünülmüştür.
Test edilen hiperparametreler için en iyi sonucu veren optimum değerler bulunmuş ve aşağıda
paylaşılmıştır:
Maksimum derinlik (max_depth ): 12
Karar ağacı sayısı (n_estimators ): 50
Maksimum özellik sayısı (max_features ): 8
Bir yaprak düğümünde olması gereken minimum örnek sayısı (min_samples_leaf ): 10
Bir iç düğümü ayırmak için gereken minimum örnek sayısı (min_samples_split ): 50
Optimum değerler 10 kat çapraz doğrulamaya tabi tutulmuş ve modelin %99.98 başarılı
olduğunu göstermiştir. Şekil 10.’da oluşturulan algoritmanın test verileri kullanılarak
karmaşıklık matrisi oluşturulmuştur.
510

511
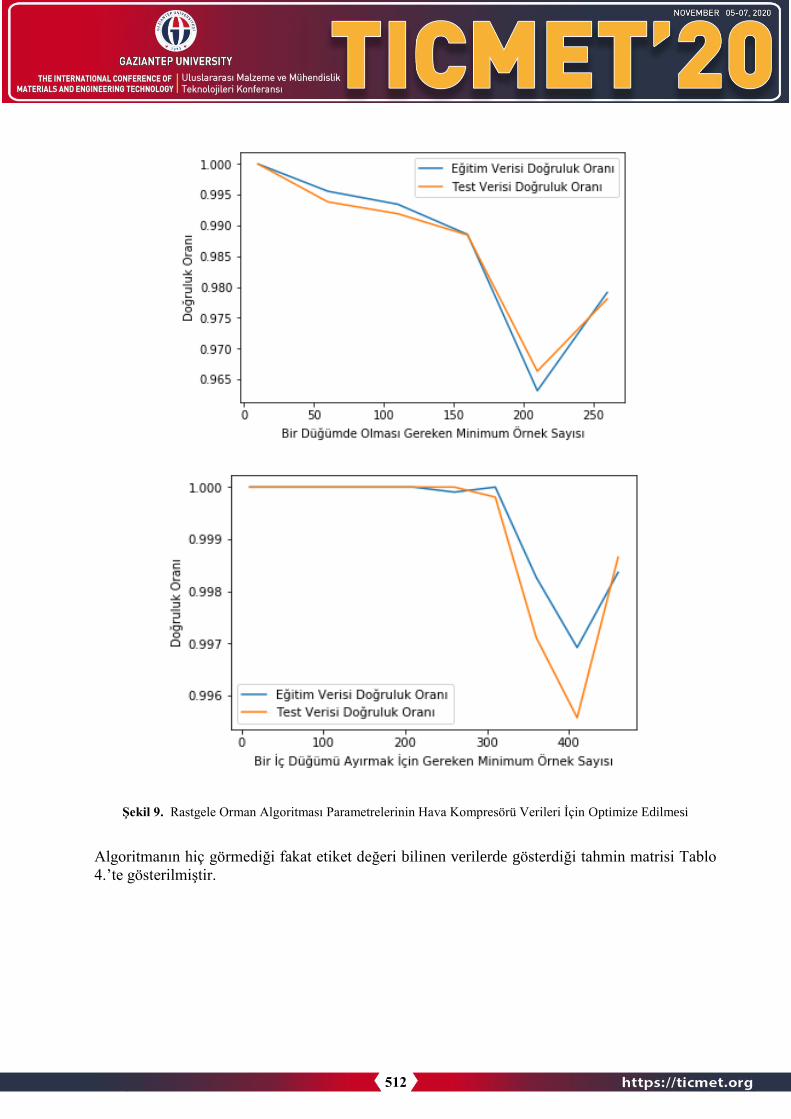
Şekil 9. Rastgele Orman Algoritması Parametrelerinin Hava Kompresörü Verileri İçin Optimize Edilmesi
Algoritmanın hiç görmediği fakat etiket değeri bilinen verilerde gösterdiği tahmin matrisi Tablo
4.’te gösterilmiştir.
512

Şekil 10. Karmaşıklık Matrisi
Tablo 4. Etiket Değeri Bilinen Verilerde Algoritma Tahmin Matrisi.
Hed
ef S
ınıf
0.Durum 1.00 0.00 0.00 0.00 0.00
1.Durum 0.05 0.06 0.08 0.81 0.00
2.Durum 0.00 0.00 1.00 0.00 0.00
3.Durum 0.00 0.00 0.00 1.00 0.00
4.Durum 0.00 0.00 0.00 0.00 1.00
0.Durum 1.Durum 2.Durum 3.Durum 4.Durum
Çıktı Sınıf
4. Sonuçlar
Mekanik makinelerin zamanla artan bakım ve değişim ücretleri bu çalışmanın gerçekleşmesi için
sebep teşkil etmiştir. Gerçekleştirilen bu çalışma ile Rastgele Orman Algoritması’nın ağır vasıta
hava kompresörü verilerine göre optimize edilmesi sağlanmıştır. Algoritmanın eğitimi için 5198
adet veri, test edilmesi için 1300 adet veri kullanılmıştır. Her veri 11 parametreden oluşmaktadır.
Optimum parametre değerleri ile 10 kat çapraz doğrulama işlemi yapılarak %99.98’lik başarı
elde edilmiştir.
Çalışma durumlarına göre karmaşıklık matrisi incelenmiş ve test verilerinde hatalı tahminin söz
konusu olmadığı görülmüştür. Algoritmanın hiç görmediği fakat etiket değeri bilinen verilerde
gösterdiği tahmin matrisi incelenmiş ve algoritma 1. numaralı durumu, 3. numaralı durum olarak
513

görerek yanlış tahmin yapmıştır. Veri sayısının artması algoritmanın daha kararlı ve yüzdelik
oranda daha doğru kararlar verebileceğini göstermiştir.
Gül ve Kalyoncu’nun 2020 yılında yaptıkları çalışmada K-En Yakın Komşu Algoritması’nda
aynı veriler denenmiş ve manhattan uzaklık ölçüsünün diğer uzaklık ölçülerine göre başarılı
olduğu gözlemlenmiştir [5]. K-En Yakın Komşu Algoritması manhattan ölçüsü ile Rastgele
Orman Algoritması’nın kıyaslanması yapıldığı durumda 1 numaralı durumu manhattan ölçüsü
%50 ihtimalle doğru ya da yanlış tahmin ederken, Rastgele Orman Algoritması 3 numaralı
durum olarak kabul etmiş ve yanlış tahminde bulunmuştur. Bu durum verilerin birbirine çok
benzediği ve karar mekanizmasının yanlış tahminleme yapabileceğini ortaya koymaktadır.
Teşekkür Bu çalışmanın gerçekleşmesinde verdikleri destekten dolayı Yıldız Pul Otomotiv Motor
Parçaları Sanayi A.Ş. firması ve Ar-Ge Merkezi çalışma arkadaşlarımıza teşekkür ederiz.
Kaynaklar 1. Kula, G., Ağır Hizmet Tipi Araçlardaki Hava Fren Kompresörü ve Hava Hattının Yeni Teknolojiye
Entegresinin Araştırılması. (Yüksek Lisans Tezi, Danışman Prof. Dr. Murat CİNİVİZ), Selçuk Üniversitesi
Fen Bilimleri Enstitüsü, 2020.
2. Ünüvar, E., Gül, E., Aydıner, M. Ş., Kalyoncu, M., Investigation Of The Effect Of Intake And Exhaust
Valve Dimensions On Performance For Heavy Duty Vehicle Air Compressors. Paper Presented At The
The Internatıonal Alumınıum-Themed Engıneerıng And Natural Scıences Conference “IATENS”
Seydişehir / Konya, 2019, 04-06 October.
3. Kaplan, S., Ağır Vasıta Havalı Fren Sistemleri, Standard Testleri ve Güvenlik Kriterleri Yönünden
Değerlendirilmesi. (Yüksek Lisans Tezi), Gazi Üniversitesi Fen Bilimleri Enstitüsü, 2014.
4. Anonymous, Bendix 720cc Twin Cylinder Compressor For International Maxxforce Big Bore Engines,
SD-01-3131. Service Data, 2010.
5. Gül, E, Kalyoncu, M., Ağır Vasıta Hava Kompresörü Piston Segmanı Aşınması Durumlarında K-En Yakın
Komşu Algoritmasının Sınıflandırma Performansının İncelenmesi. Avrupa Bilim ve Teknoloji Dergisi,
2020, 78-90, DOI: 10.31590/ejosat.802958
6. Akar, Ö., & Güngör, O., Rastgele Orman Algoritması kullanılarak çok bantlı görüntülerin sınıflandırılması,
2012.
7. Anonim, Rastgele Orman(Random Forest) Algoritması. Retrieved from
https://devhunteryz.wordpress.com/2018/09/20/rastgele-ormanrandom-forest-algoritmasi/, 2020. [Ziyaret
Tarihi: 12.01.2020]
8. Peker, M., Özkaraca, O., Kesimal, B. J. B. T. D., Enerji Tasarruflu Bina Tasarımı İçin Isıtma ve Soğutma
Yüklerini Regresyon Tabanlı Makine Öğrenmesi Algoritmaları ile Modelleme. 2017, 10(4), 443-449.
9. Aydıner, M. Ş., Ünüvar, E., Kalyoncu, M., Bir Ağır Vasıta Hava Kompresörünün Performansının Deneysel
olarak İncelenmesi, International Symposium on Automotive Science and Technology, ISASTECH, 2019.
10. Gül, E., Ünüvar, E., Kalyoncu, M., Ağır Vasıta Hava Kompresörü Arızaları ve Performansa Etkilerinin
Deneysel İncelenmesi, The International Symposium on Automotive Science and Technology, 2019.
514

MODELING AND OPTIMUM PARAMETERS OF CO2 LASER MIG
HYBRID WELDING PROCES
RECEP TÜRKOĞLU *1, LEVENT AYDIN 2, ELİF GÜLTÜRK3
1 İzmir Katip Çelebi University,Faculty of Architecture and Engineering, Mechanical
Engineering, İzmir, TURKEY. 2 İzmir Katip Çelebi University,Faculty of Architecture and Engineering, Mechanical
Engineering, İzmir, TURKEY. 3 Kocaeli University, Engineering Faculty, Mechanical Engineering, Kocaeli, TURKEY.
Abstract
In engineering applications, the welding process is vitally important for many industrial areas.
Generally, Hybrid Laser-MIG Welding (HLAW) is a preferred process in shipbuilding, road
transport, rail transport, oil and gas. Principally, the quality of Hybrid Laser-MIG welding is
dominantly determined by some welding criteria and also plays an essential role in the
characterization of their mechanical properties. In this study, the effect of HLAW process
parameters (power, torch angle, the distance between laser and welding torch, focal distance from
workpiece surface) on weld quality and depth of weld penetration responses were investigated.
Mathematical models were developed for optimization and prediction of depth of weld
penetration. Also, a multiple non-linear regression analysis was applied to construct relationships
between welding process parameters and weld penetration in HLAW. Firstly, a mathematical
model was developed to predict section weld penetration. The mathematical model for estimating
the HLAW phenomenon was found to be able to accurately predict the process as a result of
multiple regression analysis. In the optimization step, "Random Search" methods were used. As a
result of the work done, the optimum deep weld penetration was gained. The results showed that
welding penetration increased with decreasing the torch angle.
Keywords: Hybrid Laser-MIG welding(HLAW), Stochastic Optimization Method, Neuro-
Regression Approach, Torch Angle.
1. Introduction
Recently, Hybrid Laser–MIG Welding becomes frequently used production operations with a wide
range of applications requiring high precision in railway, maritime, bridges, construction sector,
automotive, aviation, etc. The MIG welding process is an extremely complex phenomenon that
has high temperatures and causes severe distortions and permanent stresses. Laser welding is a
non-contact high energy beam. A laser-supported welding process can be used for situations where
other welding methods are not used because the laser can stabilize the arc. HLAW, which allows
the combination of a laser beam and an electric arc, can produce welds with many technical
advantages compared to those made using only one laser. The main advantages of this process are
i) higher speeds, ii) deeper welding penetration, iii)better weld lead surface, iv)low distortion and
greater tolerance to fit-up, and v) a clear improvement of joining process reliability [1-3]. As the
two approaches are combined in a single process, a good welding quality can be obtained only by
finding suitable process parameters and controlling them. The parameters of each welding can be
515

adjusted according to the wanted conditions of the process. There are many individual and
combined welding process parameters such as laser power, arc power, focal point position, focal
length, torch angle and direction, electrode position, the distance between two processes, wire feed
rate, welding position, and welding speed. The selection of proper welding parameters is essential
to obtain optimum welding penetration [4]. In most of the applications and research discussed the
effect of different welding parameters on welding penetration, weld shape, and welding efficiency
in laser hybrid arc welding. Qin et al.(2007) investigated the effect of hybrid laser welding
parameters on welding shape defined by welding penetration depth, and weld width. The results
showed that laser energy is the main factor affecting weld penetration and increases weld speed.
The weld width is also mainly dependent on the welding arc at a specific welding speed. Besides,
this study revealed that an optimum laser-arc distance and laser focus location are required for
deeper penetration [5]. While the laser arc distance is too short, it reduces the penetration of the
laser beam due to the melted drops blocking the laser [6], on the other hand, the thermal efficiency
of the welding process decreased at a higher laser-arc distance [7]. The increase in laser power
leads to an improvement in the overall power of the heat sources and the coupling effect between
the laser and the arc, which means increased weld penetration [5, 8, 9]. On the other hand, the
downward flow of high-temperature melt is accelerated [10, 11]. Generally, the desired penetration
of welding parameters is determined by experience or based on a handbook. However, it is not
possible to ensure that weld processing parameters are used for the desired optimum weld
penetration in a given welding process and environment. Optimization of parameters plays a very
important role in providing output characteristics such as weld strength, penetration depth, and
weld part geometry in the design of all complex systems and engineering structures. Several
statistical studies have been conducted using analysis of variance (ANOVA) in the experimental
data set to find the effect of different welding parameters on the welding quality in hybrid CO2
Laser-MIG welding [12, 13]. Casalino [14] utilized the regression analysis to determine the
dominated contributions and relations among the operation parameters of CO2 laser-MIG welding.
According to results, an increasing in laser power cause deeper weld penetration. Ghosal and Chaki
[15] introduced an ANN–Quasi-Newton optimization hybrid model for CO2 laser–MIG welding
of 5005 Al-Mg alloy. The objective function is penetration depth, the design variables are i)power,
ii)focal distance from the workpiece surface, iii) torch angle and iv)the distance between the laser
and the welding torch. They found that ANN–GA approach has produced optimum results
compared to ANN–SA and ANN–Quasi-Newton models [16]. All of these studies use only one or
two regression models on welding quality modeling and optimization and generally coefficient of
determination (R2) value of the model was only calculated. However, the high R2 value is not
sufficient to define all the process.
In this study, two types (conventional linear, and rational-linear) of multiple regression models
were used and adjusted, training and testing coefficient of determinations also calculated besides
R2 value for each model. The mathematical model of HLAW including input parameters and
welded geometry were given. A stochastic optimization algorithm “Random Search” (RS) was
used to investigate the effects of laser–MIG hybrid welding input parameters on weld penetration.
This study aims to determine the optimum welding torch angle (A) providing maximum
penetration.
2. Materials and Methods
2.1. Experimental Details
In Figure 1, a schematic representation of the experimental setup is given. Basically, laser – MIG
hybrid welding quality is strongly characterized by welding penetration with various quality
characteristics. There are four significant parameters of a Hybrid laser-MIG welding setup. These
516

are the focal distance from the workpiece surface (F in mm), torch angle (A in deg.), the distance
between the laser and the welding torch (S in mm), and power (P in W) [14]. The measured weld
penetration depths for different input parameters are given in Table 1.
Figure 1. Schematic representation of the experimental welding setup [14].
Various quality characteristics of welding were calculated under the maximum welding
penetration condition. In order to solve these problems, an objective function belonging to the
penetration of welding has been created. In the solution process of the optimization problems, a
stochastic algorithm the RS was used.
Table 1. Experimental data [15].
Experiment
Number
Inputs data Output data
S (mm) P(W) F(mm) A(deg) D(mm)
1 5 1200 0 60 2.63
2 20 1050 3.5 60 1.66
3 10 1200 0 45 2.78
4 5 900 0 60 2.06
5 20 900 2.5 60 1.46
6 5 900 2.5 60 2.52
7 20 1050 0 60 1.59
8 5 1050 3.5 60 3.21
9 5 1200 2.5 60 3.17
10 20 1050 2.5 60 1.63
11 10 1050 0 45 2.35
12 5 900 3.5 60 2.8
13 20 900 3.5 60 1.32
14 20 900 0 60 1.61
15 20 1200 2.5 60 1.71
16 20 1200 0 60 1.65
17 5 1200 3.5 60 3.26
18 5 1050 2.5 60 3.07
19 20 1200 3.5 60 1.85
20 5 1050 0 60 2.52
517

2.2. Regression analysis
In this study, two regression models were preferred because of the complexity of the problem.
Model validation or comparison is an important implementation of regression analysis. To reach
a curve that fits well between the model and experimental data of a system, it is one of the best
indicators of the success of a mathematical model. However, a good fit is not always proof that
the model is correct. It is important to be careful at this stage to make sense of the work done. The
estimation of parameters is a direct result of regression. Mathematica’s “FindFit” solver is selected
to reach appropriate regression models [17].
After the modeling step, the coefficient of determination “𝑅2" is calculated to see the accuracy of
the model results. 𝑅2 can be calculated as in the following equation [18].
𝑅2 = 1 −𝑆𝑆𝐸
𝑆𝑆𝑇(1)
Eq.(1) contains the sum of square errors (SSE) and the total sum of squares (SST) which are
determined before the calculation of 𝑅2 . Eqs. (2) and (3) represent the formulation of them.
𝑆𝑆𝐸 = ∑ (𝑓𝑖 − 𝑓𝑖′)2𝑛
𝑖=1 (2)
𝑆𝑆𝑇 = ∑ (𝑓𝑖 − 𝑓̅)2𝑛𝑖=1 (3)
Where 𝑓𝑖 is the 𝑖𝑡ℎ experimental value, 𝑓𝑖′ is 𝑖𝑡ℎ result obtained from the regression model, and
𝑓i̅s the mean value of 𝑓𝑖 [18].
By examing the literature studies in modeling and optimization of the cutting process, it is seen
that the researchers usually take one or two different regression models and their goal is just to
determine 𝑅2 for the experimental data even though, determination of high 𝑅2 value is not enough
for identified physical phenomena. In other words, high 𝑅2 values are not always good and low
𝑅2 values are not always bad for the real systems [19]. For this reason, adjusted 𝑅2 must be
calculated in order to make a meaningful test to the fitted model. Equation 4 represents
𝑅𝑎𝑑𝑗𝑢𝑠𝑡𝑒𝑑2 [18].
𝑅𝑎𝑑𝑗𝑢𝑠𝑡𝑒𝑑2 = 1 − (1 − 𝑅2)
(𝑛−1)
(𝑛−𝑘−1)(4)
Where n defines the number of experiments and the number of design variables is denoted by k. It
is understood from Equation 4, 𝑅𝑎𝑑𝑗𝑢𝑠𝑡𝑒𝑑2 will be smaller or equal to 𝑅2 . The difference between
them, depends on the number of experiments for the same independent design variables. If the
number of data is increased, the difference between them will decrease, so it is important to get
accurate results.
2.3. Neuro Regression Approach
Based on the neuro-regression approach, 80% and 20% of the experimental data given in Table 1
were randomly separated as training and testing parts, respectively. First, the training process was
performed by using conventional regression analysis based on the ordinary least square method.
The second step was to check the prediction capability of the training model on the test data [20].
518

It was seen that the training model’s prediction was in good agreement with the actual output
response (depth of weld penetration).
2.4. Optimization
There are many optimization algorithms to solve engineering design problems. These can be
classified as traditional and non-traditional methods [21]. Nontraditional methods use stochastic
processes and intuitively based search techniques to achieve the results and generate approximate
solutions. No need for derivative knowledge, and because of its advantages such as the ease of
adaptation to the full number of programming, the ability to go to conclusions from both sets of
discrete and continuous solutions, they are preferred in engineering optimization problem-solving.
In this study, Random Search (RS) method was used to solve the optimization problem.
Table 2. Forms of different multiple regression models [19].
Model Name Nomenclature Formula
Multiple Linear L 𝑌 = 𝑎0 + 𝑎1 ∗ 𝑑 + 𝑎2 ∗ 𝑠
Multiple Linear
Rational LR 𝑌 = (𝑎0 + 𝑎1 ∗ 𝑑 + 𝑎2 ∗ 𝑠)/(𝑏0 + 𝑏1 ∗ 𝑑 + 𝑏2 ∗ 𝑠)
2.4.1. Single Objective Optimization
Single objective optimization is the case where there is one objective function that is wanted to
minimize or maximize. This optimization approach includes design variables and constraints.
Problems solved with a one-objective optimization approach are described in the following way.
Minimize or Maximize f (θ1, θ2….. θn)
Subjected to
h1(θ1, θ2….. θn) ≥ 0 ;i = 1,2,…,r
g1(θ1, θ2….. θn)= 0 ; j =1,2,…,m
θL ≤ (θ1, θ2….. θn)≤ θU
Here, f is the objective function, θ1, θ2….. θn are the design variables, h1 and g1 are inequality and
equality constraints. Lower and upper bounds of the problem are denoted by θL and θU,
respectively.
2.4.2. Multi-Objective Optimization
A multi-objective optimization problem can be expressed as follows.
Minimize or Maximize {f1 (θ1, θ2….. θn), f2 (θ1, θ2….. θn), f3 (θ1, θ2….. θn),… ft (θ1, θ2….. θn)}
Subjected to
h1(θ1, θ2….. θn) ≥ 0 ;i = 1,2,…,r
g1(θ1, θ2….. θn)= 0 ; j =1,2,…,m
θL ≤ (θ1, θ2….. θn)≤ θU
519

2.4.3 Random Search Algorithm
One of the efficient stochastic based optimization algorithms is Random Search (RS). In this
algorithm, two sequential steps (scale, transform) are applied to the resulting values in the first
step. They are vital to produce good proximity to the distribution. The main advantage of the RS
algorithm is the ability to achieve general optimality for non-convex, differentiable functions,
including continuous and discrete domains. The implementation of the RS method to complicated
design problems is relatively simple. In general, RS algorithms are known to be "powerful" and
perform well because they quickly result in poorly structured global optimization problems. Figure
2 shows a flow chart containing the basic working principles of the method.
Figure 2. Flowchart of RS algorithm [22]
2.5. Mathematical Optimization Problem Definition
The data and parameters were defined by selecting from the reference study[15]. The weld
penetration, mechanical properties depend on geometrical parameters and processing parameters.
Independently controlled process parameters that affect weld penetration and quality of weld
penetration, are (a) focal distance (F in mm) from workpiece surface, (b) torch angle (A in deg.),(c)
distance between laser and welding torch (S in mm), (d) power (P in W). The definition of the
optimization problem is presented in Table 3.
3. Results and discussion
Various regression models for weld penetration have been tested with the calculation of the
coefficient of determinations. According to Table 4, First-order multiple linear regression(FOL)
model was not found to be appropriate due to low 𝑅𝑎𝑑𝑗𝑢𝑠𝑡𝑒𝑑2 value for experimental data at the end
of all calculations by Mathematica. The first multiple linear rational regression(FOLR) was to be
appropriate due to the minimum differences between R²and 𝑅𝑎𝑑𝑗𝑢𝑠𝑡𝑒𝑑2 values. For this model,
𝑅𝑡𝑟𝑎𝑖𝑛𝑖𝑛𝑔2 and 𝑅𝑡𝑒𝑠𝑡𝑖𝑛𝑔
2 values were calculated. The training process was performed to determine
the error between the experimental and predicted values of the model. The testing process gives
520

insight into the predictive ability of the model. It is found that the FOLR regression model is to be
a realistic objective function.
Table 3. Definition of the optimization problem.
Objective Function Design Variables Constraints
Maximization of weld
penetration (D)
Focal Distance (F)
Torch Angle (A) Laser-arc distance (S)
Power (P)
Table 4. Evaluated R²and 𝑅𝑎𝑑𝑗𝑢𝑠𝑡𝑒𝑑2 values of the different regression model
Model R² 𝑹𝒂𝒅𝒋𝒖𝒔𝒕𝒆𝒅𝟐 𝑹𝒕𝒓𝒂𝒊𝒏𝒊𝒏𝒈
𝟐 𝑹𝒕𝒆𝒔𝒕𝒊𝒏𝒈𝟐
FOL 0.92 0.82 - -
FOLR 0.98 0.94 0.99 0.85
Torch angle is a direct factor in all dimensional changes that occur in penetration as shown in
Table 5. Welding penetration is increased by approximately 10-25% with decreasing the torch
angle in the three different powers and focal distance and laser-arc distance. This increase is
especially high when the power, laser-arc distance, focal distance are 1200W, 20mm, and 3.5mm,
respectively. On the other hand, the lowest penetration values are observed under these conditions.
This may be related to the increase in the distance between the laser and the arc. Studies have
shown that increased power and focal distance has a positive effect on weld penetration. Also, the
laser distance is too long or short to reduce the weld penetration because of insufficient thermal
efficiency or blocking the laser by the melted drops, respectively [6, 7]. In cases where the focal
length is 0, the power, the arc, and laser arc distance are the lowest, the penetration values are close
to the penetration obtained at higher power and focal length.
It was reported that i) weld penetration increases with the variation of electrode’s angle up to 50
degrees, ii) The gas flow along the welding direction, which can be controlled by the arc torch,
deflects the plasma caused by the laser. Moreover, when CO2 lasers are applied, the absorption of
the laser beam diminishes. Hereby, the electrode’s angle is frequently selected about 40-50
degrees. [23]
Results of the Random Search optimization operations are represented in Table 6. We reached the
optimized result by Mathematica. The optimum weld depth has been found to be D = 5.76 mm at
F = 3,5 mm A = 45 ° P = 1200W and S = 5 mm welding conditions. On the other hand, the highest
experimental value for the penetration depth of the weld was found to be 3.26 under the conditions
F = 3.5 mm, A = 60°, S = 5 mm P = 1200W in experimental data. This means that changing the
torch angle from 60° to 45°, increase penetration depth of the weld from 3.26 mm to 5.76 mm
521

Table 5. Effect of different torch angle and input parameters on depth of weld penetration
Depth of
weld
penetration
(mm)
Laser-arc
distance
(mm)
Power
(W)
Focal
Distance
(mm)
Torch
Angle
(°)
2.478 5 900 0 45
2.060 5 900 0 60
2.691 10 1050 2.5 45
2.448 10 1050 2.5 60
2.339 20 1200 3.5 45
1.85 20 1200 3.5 60 .
Table 6. Optimization results based on RS method for the penetration depth of weld (D).
Optimization
Method Response
Optimal
Value
(mm)
Focal
Distance
(mm)
Torch
Angle
(°)
Laser –arc
distance
(mm)
Power
(W)
Random
Search
Welding
penetration
(D)
5.76 3.5 45 5 1200
4. Conclusions:
In this study, the effect of the torch angle of the HLAW process on weld quality and depth of weld
penetration responses were investigated. Mathematical models were developed for optimization
and prediction of depth of weld penetration. It was succeeded in associating with the presented
model, experiments of premade test conditions, weld penetration, and torch angle. This study
proposed that different regression models can identify engineering problems, besides stochastic
optimization method can also be utilized to obtain the maximum depth of weld penetration.
Different regression models with measured values and closed-up of results optimized by the
Random Search optimization method. This includes finding the coefficients of the regression
model and checking(predicting) the availability of the regression model with
R², 𝑅𝑎𝑑𝑗𝑢𝑠𝑡𝑒𝑑2 , 𝑅𝑡𝑟𝑎𝑖𝑛𝑖𝑛𝑔
2 , 𝑅𝑡𝑒𝑠𝑡𝑖𝑛𝑔2 . After these operations, one optimization algorithm (Random
Search Method) has been applied systematically to the maximum depth of weld penetration
parameter design problem for different torch angles. As a result it can be said that welding
penetration is increased by approximately 10-25% with decreasing the torch angle in all
dimensional change. Moreover, the value of weld penetration was one of the most important output
(depth of weld penetration) factors determining the mechanical properties of the welding seam.
When the value of weld penetration was increased, many mechanical properties of welding seam
were also improved at that value but welding seams occurred excessive penetration. It is also a
cost-enhancing element considering today's manufacturing conditions. For this reason, it is
necessary to optimize the welding input parameters (back width, back height, front width, the front
height of weld pool geometry) to obtain the most ideal weld penetration.
522

References:
[1] Duley, W.W. Laser Welding. New York: Wiley. 1999.
[2] Hügel, H., C. Schinzel. Handbook of Laser Technology and Applications. Applications, Part
D, Welding. Edited by C.E. Webb and Julian D.C. Jones, Bristol: Institute of Physics. 2004.
[3] Seyffarth, P., Krivtsun, I.V. Laser-arc Processes and Their Applications in Welding and
Material Treatment. London: Taylor & Francis. 2002.
[4] Kah, P. Overvıew Of The Exploratıon Status Of Laser-Arc Hybrıd Weldıng Processes.
Reviews on Advanced Materials Science. 2012, 30:112-132.
[5] Qin, G.L., Lei, Z., Lin, S.Y. Effects of Nd:YAG laserzpulsed MAG arc hybrid welding
parameters on its weld shape. Science and Technology of Welding & Joining. 2007, 12(1):79-86.
[6] Shuangyu, L., Fengde , L., Hong, Z., Yan, Shi. Analysis of droplet transfer mode and forming
process of weld bead in CO2 laser-MAG hybrid welding process. Optics & Laser Technology.
2012, 44(4):1019-1025.
[7] Zhang, L.J., Ning J., Zhang, X.J., Zhang, G.F., Zhang, J.X. Single pass hybrid laser–MIG
welding of 4-mm thick copper without preheating.Material and Desing. 2015, 74:1-18.
[8] Zhang, L.J., Bai, Q.L., Ning, J., Wang, A., Yang, J.N., Yin, X.Q., Zhang, J.X. A comparative
study on the microstructure and properties of copper joint between MIG welding and laser-MIG
hybrid welding. Materials & Design. 2016, 110:35-50.
[9] Cai, C., Feng, J., Li, L., Chen, Y. Influence of laser on the droplet behavior in short circuiting,
globular, and spray modes of hybrid fiber laser-MIG welding. Optics & Laser Technology. 2016,
83:108-118.
[10] Pang, S., Chen, X., Zhou, J., Shao, X., Wang, C. 3D transient multiphase model for keyhole,
vapor plume, and weld pool dynamics in laser welding including the ambient pressure effect.
Optics and Lasers in Engineering. 2015, 74:47-58.
[11] Zhang, L., Gao, X., Sun, M., Zhang, J. Weld outline comparison between various pulsed
Nd:YAG laser welding and pulsed Nd:YAG laser–TIG arc welding. The International Journal of
Advanced Manufacturing Technology. 2014, 75(1–4):153–160.
[12] Ancona, A., Sibillano, T., Tricarico. L., Spina, R., Lugar’a PM, Basile. G., Schiavone, S.
Comparison of two different nozzles for laser beam welding of AA5083 aluminium alloy.Journal
of Materials Processing Technology. 2005, 164–165:971–977.
[13] Tani, G., Campana, G., Fortunato, A., Ascari, A. The influence of shielding gas in hybrid
LASER–MIG welding. Applied surface science. 2007, 253:8050–8053.
[14]Casalino, G. Statistical analysis of MIG-laser CO2 hybrid welding of Al–Mg alloy. Journal of
Materials Processing Technology. 2007, 191:106-110.
[15] Ghosal S, Chaki S. Estimation and optimization of depth of penetration in hybrid CO2
LASER-MIG welding using ANN-optimization hybrid model. The International Journal of
Advanced Manufacturing Technology. 2010, 47:1149- 57.
[16] Chaki, S., Shanmugarajan, B., Ghosal S., Padmanabhamd, G. Application of integrated soft
computing techniques for optimisationof hybrid CO2laser–MIG welding process. Applied Soft
Computing. 2015, 30:365-374.
[17] Avaliable in Wolfram Mathematica.
[18] Fang, H., Rais-Rohani, M., Liu, Z., Horstemeyer, M.F. A Comparative Study of
Metamodeling Methods for Multiobjective Crashworthiness Optimization. Computers &
Structures. 2005, 83: 2121-2136.
[19] Öztürk, S., Aydin, L., Çelik. E. A Comprehensive Study on Slicing Processes Optimization
of Silicon Ingot for Photovoltaic Applications. Solar Energy. 2018, 161: 109-124.
523

[20] Polatoglu, I., Aydin, L., Nevruz, B.C., Ozer, S. A Novel Approach for the Optimal Design of
a Biosensor. Analytical Letters. https://doi.org/10.1080/00032719.2019.1709075
[21] Silva, S.P., Ribeiro Filho, S.L.M., Brandao, L.C. Particle Swarm Optimization for Achieving
the Minimum Profile Error in Honing Process. Precision Engineering. 2014, 38: 759-768.
[22] Aydin, L., Artem, H.S., Oterkus, S. (Editors). Designing Engineering Structures Using
Stochastic Optimization Methods. CRC Press Taylor & Francis Group. 2020
[23] Avaliable in https://www.twi-global.com/technical-knowledge/job-knowledge/equipment-
for-mig-welding-015.
524

EFFECT OF BUILD ORIENTATION ON MECHANICAL PROPERTIES
OF ADDITIVELY MANUFACTURED Ti-6Al-4V PARTS
AKIN DAĞKOLU 1, 2, AHMET ALPTUĞ TANRIKULU2, HAKAN YAVAŞ2 and
OĞUZHAN YILMAZ *1
1 Advanced Manufacturing Technologies Research Group (AMTRG), Faculty of Engineering,
Department of Mechanical Engineering, Gazi University, 06570, Maltepe, Ankara, TURKEY. 2 Turkish Aerospace Industries Inc., Kahramankazan, Ankara, TURKEY.
Abstract
Additive manufacturing (AM) has been preferred by aerospace industry over to traditional
manufacturing methods day by day. The most influential factors are design versatility, reduction
in lead time and manufacturing costs. Although AM is regarded as an alternative manufacturing
method, qualification of mechanical and structural properties of aerospace parts are very crucial.
In this study, mechanical tests were conducted on standard test coupons made by one of the
mostly used aerospace alloys, Ti-6Al-4V using laser based powder bed fusion process (L-PBFP).
The test specimens were produced in two different built orientations in EOSINT M280 L-PBFP
machine then they were heat-treated for further stress relief according to engineering standards.
Standard mechanical tests such as tensile, notched impact, fatigue and hardness tests were
conducted in order to determine the mechanical properties of the specimens. It was observed that,
Ti-6Al-4V samples produced with L-PBFP have 8,6% higher tensile strength with a mean value
of 1032 MPa, 4% more hardness with a mean value of Vickers 362, and 84% higher energy
absorption with a mean value of 33 J and %22 lower fatigue strength compared to the Ti-6Al-4V
samples produced by conventional methods. The results have also shown that the horizontally
manufactured L-PBFP specimens have %3 percent higher tensile strength with 1047 MPa
compared to vertical ones with 1017 MPa, horizontal specimens have %9,7 higher energy
absorption with 34J compared to vertical specimens with 31J.
Keyword: Additive manufacturing, Selective laser melting, Ti-6Al-4V, Mechanical properties,
Aerospace applications
525

1. Introduction
One of the most important features of additive manufacturing is recognized as design freedom.
With applications such as topology, shape, size and topography optimization, the ability to design
parts that have improved mechanical properties with reduced weight and lower buy-to-fly ratio
have made the use of metal additive manufacturing processes in aviation and space applications
[1], [2]. However, in aerospace applications, it is crucial to know the material properties accurately
and to develop designs according to these properties, especially for parts exposed to fatigue
loadings [3]. Due to the risks of discontinuity and uncertainty that additive manufacturing
processes might have and the effects of both production parameters and post-processing on the
material properties, knowing the mechanical behavior of additively manufactured parts per
production is critical. Literature researches showed many mechanical and metallurgical
characterizations of additively manufactured parts with different materials and processes. Mower
et.al [4] studied the mechanical behavior of L-PBFP manufactured Ti-6Al-4V, Al-Si-10Mg and
316L stainless steel by their tensile and fatigue properties. Nicoletto et.al [5] worked on the tensile
and fatigue properties of L-PBFP manufactured Ti-6Al-4V with different heat treatment and
surface finishing operations. Haar et.al [6] worked on tensile properties of Ti-6Al-4V parts
manufactured by L-PBFP. They investigated the tensile strength with microstructural properties.
Zhao et.al [7] studied the change of microstructure of L-PBFP manufactured Ti-6Al-4V parts with
different heat treatment temperatures. Thöne et.al [8] investigated tensile properties and residual
stresses of L-PBFP manufactured Ti-6Al-4V parts with different heat treatment applications.
However, these studies differ from the aspects of the manufacturing machine, manufacturing
parameters and applied post processes as mentioned above. This study aims to do weight
optimization for a specific flight-critical aviation part produced via laser based powder bed fusion
process (L-PBFP), and to conduct mechanical tests and measurements in order to qualify the L-
PBFP manufactured part to obey aerospace standards.
2. Materials and Methods
Ti-6Al-4V powder was used in the L-PBFP manufacturing of the test specimens. This alloy is
consisted of two-phase α+β, where aluminum works as the alpha stabilizer and vanadium as the
beta stabilizer [9]. Chemical properties of the L-PBFP powder used in this study is given in Table
1.
Table 1. Chemical properties of Ti-6Al-4V powder [10]
Element Al V O N C H Fe
5,5-6,75
wt.-%
3,5-4,5
wt.-%
2000
ppm
500
ppm
800
ppm
150
ppm
3000
ppm
Manufacturing
In manufacturing of the parts, EOSINT M280 direct metal laser sintering (DMLS) machine is
used. All of the test specimens were manufactured with the constant processing parameters which
are given in Table 2. This parameter set is defined as optimum manufacturing parameters by
machine manufacturer EOS. Physical and mechanical properties of the parts manufactured by
specified machine in this study is given by the EOS GmbH in Table 3.
526

Table 2. Processing Parameters
Laser Power (W) Scanning Speed
(mm/s)
Hatch Distance
(mm)
Layer Thickness
(mm)
170 1250 0,015 0,03
Table 3. Mechanical and Physical Properties of Parts
As Built Heat Treated
Tensile strength
horizontal direction (XY) typ. 1230 ±50 MPa typ. 1050 ±20 MPa, min. 930MPa
vertical direction (Z) typ. 1200 ±50 MPa typ. 1060 ±20 MPa, min. 930 MPa
Yield strength
horizontal direction (XY) typ. 1060 ±50 MPa typ. 1000 ±20 MPa, min. 860 MPa
vertical direction (Z) typ. 1070 ±50 MPa typ. 1000 ±20 MPa, min. 860 MPa
Elongation at break
horizontal direction (XY) typ. 10 ±2 % typ. 14 ±1 %, min. 10%
vertical direction (Z) typ. 11 ±3 % typ. 15 ±1 %, min. 10%
Modulus of elasticity
horizontal direction (XY) typ. 110 ±10 GPa typ. 116 ±10 GPa
vertical direction (Z) typ. 110 ±10 GPa typ. 114 ±10 GPa
Hardness typ. 320 ±12 HV5
Density 4,41 g/cm3
Test specimens are manufactured with 2 different orientations as horizontal and vertical direction
and 5 parts are manufactured in each orientation for test results’ consistency. Manufactured parts
can be seen in Figure 1.
Figure 1. Manufactured specimens on the manufacturing table
527

Heat Treatment
After manufacturing process, heat treatment is applied for stress relieve. Manufactured parts heat
treated with the manufacturing table without being cut from it to prevent residual stress caused
deformation. Heat treatment process is applied under Argon atmosphere to prevent oxidation of
the parts. All the parts are heated to 800oC and held for 2 hours and then furnace cooled to the
room temperature. Heat treated parts cut from the manufacturing table via wire electrical discharge
machining (Wire EDM).
Mechanical Testing
Tensile and fatigue testing specimens’ surfaces are finished and tests are conducted according to
ASTM E8 and ASTM E466 standards respectively. Tensile properties studied using Universal
testing machine with 0,06 mm/mm/s strain rate with ASTM E8 Specimen 3 type samples. Impact
tests conducted according to ASTM E23 standard and Charpy method with Brooks pendulum
impact testing device. Fatigue testing is conducted with Shimadzu EHF-LV020K2-020 fatigue and
endurance testing machine. Fatigue tests carried out with R=-1 fully reversed loading ratio with
40 Hz speed. Fatigue loadings are determined as 600, 500, 400 and 300 MPa and applied to
specimens of both manufacturing directions. Hardness tests are carried through with Vickers
harness testing device. Hardness measurements are taken from both near edge and center of the
face of cubic samples.
3. Results and Discussion
Tensile testing results of horizontally and vertically manufactured specimens are given in Figure
2 and Figure 3 respectively. Acquired tensile strength results showed very little variation within
the same manufacturing direction. Mean tensile strengths of the specimens are calculated as 1047
MPa in horizontal direction and 1017 MPa in vertical direction.
Figure 2. Tensile testing results of horizontally manufactured specimens
528

Figure 3. Tensile testing results of vertically manufactured specimens
The fact that the tensile strength in the horizontal direction is higher than the tensile strength in the
vertical direction reflects the anisotropic properties expected to be found in additively
manufactured parts. This anisotropic mechanical behavior can be caused by interlayer melt pool
boundaries that occur while layer by layer melting process. Comparison between the mean tensile
properties of additively manufactured specimens, catalog values and conventionally manufactured
specimens is showed in Figure 4. This comparison of tensile properties showed that additively
manufactured specimens have better tensile properties than the conventionally manufactured parts
and obtained test values differ slightly from the catalog values.
Figure 4. Comparison between tensile properties.
Charpy impact testing results are given in Table 4. Test results showed that horizontally
manufactured specimens have similar energy absorption properties in itself while the vertically
Horizontal Direction Vertical Direction
Catalog Value 1050 1060
Additive
Manufacturing1047 1017
Conventional
Manufacturing950 950
0
200
400
600
800
1000
1200
Tensile Testing
529

manufactured specimens are less self-consistent and have lower energy absorption capability than
the horizontal specimens. This phenomenon can be seen in Figure 5. This deficiency of energy
absorption in vertical specimens can be explained with matching of the hitting direction of the
hammer and the crack propagation direction between the manufacturing layers.
Table 4. Charpy impact test results
Sample
No Sample Type
Absorbed Energy
(J)
1 Horizontal-Notch on top 34,0
2 Horizontal-Notch on top 36,0
3 Horizontal-Notch on top 31,0
4 Horizontal-Notch on top 30,8
5 Horizontal-Notch on top 35,0
6 Horizontal-Notch on side 33,8
7 Horizontal-Notch on side 34,0
8 Horizontal-Notch on side 38,0
9 Horizontal-Notch on side 34,2
10 Horizontal-Notch on side 29,8
11 Vertical 50,0
12 Vertical 37,8
13 Vertical 17,0
14 Vertical 19,0
15 Vertical -
Figure 5. Charpy impact test results
Hardness measurements are taken from the top surface of the cube specimens. Measurements are
taken from points with different distances from the edge of the part. Vickers hardness readings and
their equivalents in Rockwell scale are given in Table 5. Obtained results showed that L-PBFP
manufactured parts tend to have greater hardness values compared to conventionally manufactured
530

parts. Increased hardness is thought to be caused by rapid cooling in L-PBFP manufacturing
process.
Table 5. Hardness test results
Measurement
No. HV L1 L2 HRC
1 347 101.77 104.96 35.2
2 363 100.49 101.54 37.0
3 361 101.23 101.6 36.7
4 360 100.56 102.53 36.6
5 362 100.42 102.09 36.8
6 374 99.7 99.41 38.2
7 366 101.57 99.62 37.3
8 369 99.59 100.91 37.6
9 367 99.34 101.74 37.4
10 360 100 102.05 36.6
Heat treatment after L-PBF process tends to reduce differences in the mechanical properties
between horizontally and vertically manufactured parts [11]. For this reason and because hardness
is not the driving mechanical property for the L-PBF process’ intended usage in this study,
directional hardness properties are not investigated in this work.
Figure 6. Vickers hardness comparison
Fatigue tests are conducted with a fully reversible loading ratio and results are given in Table 6.
At testing with 300 MPa stress value both vertically and horizontally manufactured specimens
reached the stress life of 107 cycles. To increase the reliability of the tests, made sure two
specimens of each manufacturing orientation is reached 107 stress cycles.
Vickers Hardness
Catalog Value 320
Conventional Material 349
Test Results 362
290
300
310
320
330
340
350
360
370
Hardness Test
Catalog Value Conventional Material Test Results
531

Table 6. Fatigue test results
No
Manufacturing
Orientation
Stress
(MPa)
Number of
cycles to failure
1 Vertical 600 79157
2 Vertical 500 1312223
3 Vertical 400 5618465
4 Vertical 300 10000000
5 Vertical 300 10000000
6 Horizontal 600 255029
7 Horizontal 500 1066223
8 Horizontal 400 5843216
9 Horizontal 300 10000000
10 Horizontal 300 10000000
Difference of fatigue properties between the manufacturing orientations of the specimens is found
insignificant. The reason behind these results can be explained with the dominance of surface
roughness on fatigue properties of parts. S-N curves of the parts by build orientation is given in
Figure 7.
Figure 7. S-N curves of vertical and horizontal specimens
532

4. Conclusions
In the study mechanical tests were conducted to be used for evaluating the compliance of a flight
critical aviation part designed to be produced via L-PBFP method to obey aviation and space
standards. The anisotropic mechanical properties depending on the build orientation that may
occur in the L-PBFP were investigated. Tensile strength of the parts produced with L-PBFP was
found higher than the conventional material and the change of tensile properties due to the build
orientation is less than expected due to the applied heat treatment. It has been observed that the
parts produced with L-PBFP have higher hardness than conventional parts. Increased hardness in
the L-PBFP parts is thought to be caused by precipitation of Ti3Al in rapid cooling of the material
[12]. Fatigue endurance strength of L-PBFP parts is found to be lower than the conventional Ti-
6Al-4V alloys. Further investigation of the fracture surfaces of fatigue specimens is needed for the
determination of the cause of decrease in fatigue properties, as it will show the cause of crack
initiation. As a result, it has been found that the mechanical properties of a flight critical aviation
part can be achieved via L-PBFP manufacturing.
Acknowledgments: The authors acknowledge funding from the project of Rotating Wing
Technology Center under Turkish Aerospace Industries.
References
1. Kamal M, Rizza G (2019) Design for metal additive manufacturing for aerospace
applications. In: Additive Manufacturing for the Aerospace Industry. Elsevier, pp 67–86
2. Gasman L (2019) Additive aerospace considered as a business. In: Additive Manufacturing
for the Aerospace Industry. Elsevier, pp 327–340
3. Froes F, Boyer R, Dutta B (2019) Introduction to aerospace materials requirements and the
role of additive manufacturing. In: Additive Manufacturing for the Aerospace Industry.
Elsevier, pp 1–6
4. Mower TM, Long MJ (2016) Mechanical behavior of additive manufactured, powder-bed
laser-fused materials. Mater Sci Eng A 651:198–213.
https://doi.org/10.1016/j.msea.2015.10.068
5. Nicoletto G, Maisano S, Antolotti M, Dall’aglio F (2017) Influence of post fabrication heat
treatments on the fatigue behavior of Ti-6Al-4V produced by selective laser melting.
Procedia Struct Integr 7:133–140. https://doi.org/10.1016/j.prostr.2017.11.070
6. Ter Haar GM, Becker TH (2018) Selective laser melting produced Ti-6Al-4V: Post-process
heat treatments to achieve superior tensile properties. Materials (Basel) 11:.
https://doi.org/10.3390/ma11010146
7. Zhao ZY, Li L, Bai PK, et al (2018) The heat treatment influence on the microstructure and
hardness of TC4 titanium alloy manufactured via selective laser melting. Materials (Basel)
11:. https://doi.org/10.3390/ma11081318
8. Thöne M, Leuders S, Riemer A, et al (2012) Influence of heat-treatment on selective laser
melting products - E.g. Ti6al4v. 23rd Annu Int Solid Free Fabr Symp - An Addit Manuf
Conf SFF 2012 492–498
9. Mierzejewska ZA, Hudák R, Sidun J (2019) Mechanical properties and microstructure of
DMLS Ti6Al4V alloy dedicated to biomedical applications. Materials (Basel) 12:.
https://doi.org/10.3390/ma12010176
10. Systems EO (2011) Material data sheet EOS Titanium Ti64 Material data sheet Technical
data
11. Guzanová A, Ižaríková G, Brezinová J, et al (2017) Influence of build orientation, heat
treatment, and laser power on the hardness of Ti6Al4V manufactured using the DMLS
533

process. Metals (Basel) 7:. https://doi.org/10.3390/met7080318
12. Thijs L, Verhaeghe F, Craeghs T, et al (2010) A study of the microstructural evolution
during selective laser melting of Ti-6Al-4V. Acta Mater 58:3303–3312.
https://doi.org/10.1016/j.actamat.2010.02.004
534

USING HARD TEMPLATE SYNTHESIZED HOLLOW SILICA
NANOSPHERES VIA ECONOMIC METHOD
EDA DEMIR1, ÖMER GÜLER*1, ÖYKÜM BAŞGÖZ1, KAZIM BUĞRA GÜRBÜZ1,
SEVAL HALE GÜLER1
1Mersin University, Engineering Faculty, Metallurgical and Materials Engineering Department, Mersin, TURKEY
Abstract
Hollow silica nanosphere is a special type of new inorganic material which is attracted attention
of scientists. This material exhibits unique properties such as low density, large surface area,
excellent loading capacity. Scientists have advanced many methods to produce the hollow silica
nanosphere with narrow size distribution, saving the time and for huge production. The hollow
silica nanosphere was synthesized via templating method in this study with narrow size
distribution and for th huge production. To understand the surface and interior structures of the
samples used XRD, TEM and FT-IR to characterize. The results showed that hollow SiO2
nanosphere was synthesized succesfully.
Keywords: Silica, Hollow Nanosphere, Hard Templating Method, Polystyrene
1. Introduction
Thanks to its unique properties (such as low density, large surface area, excellent loading
capacity, high permeability) and innovative structures, hollow inorganic materials have been
studied by scientists and have been cathed attention scientists to use in various application areas
(catalysis, optics and electronics, waste removal and controlled release system) [1-6]. The empty
field gives these materials many good features such as low density, wide specific surface area,
improved optical performance. Inorganic materials include silica materials, which are important
in sensors, drug delivery systems, energy storage, optics, catalysts and so on practical
applications. They come into prominence due to having many advantages such as adjustable pore
structure, non-toxicity, high biocompatibility and mechanical stability [7].
For the synthesized of hollow nanospheres, the templating method, emulsion processes and self-
assembly methods have been used. Among these methods, templating method which used hard
templates or soft templates have been used commonly. Soft templates method have some
disadvantages like irregular appearance, wide particle size distribution, poor structural stability
and monodispersity [6].
Hard templates (such as polymer latexes, inorganic nanospheres, carbon nanospheres and
metallic components) have more advantageous method because they can be prepared in a wide
range of sizes and narrow size distribution [8].
535

Polymer latex particles are excellent candidates they are available for uniform sizes to produce
hollow silica [9-11]. Its dimensions and surface properties can be easily adjusted during
polymerization. Once the silica shell has been formed, these stencils can be removed by
calcination or dissolution. In particular, polystyrene (PS) beads and their derivatives have been
attracted for their economy and rigidity. Tan et al. synthesized hollow silica spheres with narrow
diameter distributions ranging from 350 nm to 450 nm using PS as template. Polystyrene cores
were synthesized by emulsion polymerization and finally removed by thermal decomposition.
Polyvinylpyrrolidone (PVP), which stabilizes the PS surface, facilitates the build-up of silica,
because only positively charged PS spheres interlock silica particles on its surface. The amount
of TEOS can control the thickness of the hollow silica shell.
In a typical procedure most of the time was, the template was coated via controlling surface
depositon of pre-cursor. The other option for the typical procedure the template via surface
chemical reactions utilizing functional groups on the templates to create core-shell composites.
After this process, the templates was removed by chemical etching in a suitable ether to form
hollow nanospheres or by calcination under high temperatures in the air atmosphere [12].
In this study hollow silica nanosphere was synthesized via templating method. This method can
be controlled the production to be more easily and feasibly to huge fabrication that have been
needed by industry.
2. Experimental Procedure
2.1. Materials
Styrene (St.) (Sigma Aldrich, > 99%), potassium persulfate (KPS) (Sigma Aldirch),
polyvinylpyrrolidone (PVP) (Merck), absolute ethanol (EtOH) (Merck, > 99.8%-), ammonium
hydroxide solution (NH4OH) (30 % wt.-Carlo Erba), tetraethyl orthosilicate (TEOS) (Merck)
were used in this work and distilled water was used during the synthesis.
2.2. Production Method
5 g of St. and 0.025 g PVP were added to 45 g of distilled water in a 250 mL erlenmeyer flask
and the mixing was magnetically stirred at 350 rpm for 15 minutes. Afterwards, 0.05 g KPS
dissolved in 5 g water to obtained diluted KPS aqueous solution. This aqueous solution was
added to the styrene/distilled water and was magnetically stirred (70 C, for 24 hours). Then it
was cooled to room temperature. At this stage obtained PVP-Stabilized Polystyrene Templates.
Coating the polystyrene templates with silica (SiO2) at the second stage. 190 g EtOH was added
to before mixing. This mixing was magnetically stirred for 15 minutes before 3 mL of NH4OH
was added. To coating the polystyrene templates with silica used TEOS as silica source. For the
coating prepared 20 ml TEOS solution (10 ml of TEOS in 10 ml EtOH). Then the solution was
slowly added to the mixture drop by drop.
The silica-coated PS templates were centrifuged at 6000 rpm for 40 minutes with distilled water
and EtOH mixture. The samples were calculated at 600 C for 5 hours in air atmosphere.
Schematic diagram is given in Figure 1.
536

Figure 1. Schematic diagram of the hollow silica nanospheres.
2.3. Characterization
The morphology of the synthesized hollow silica nanosphere was characterized using a
transmission electron microscope (TEM)(JEOL-JEM 2100F) and scanning electron microscope
(SEM)(Zeiss-Supra 55). The synthesized hollow silica nanosphere was characterized by X-ray
diffraction (XRD)(PANalytical-Empyrean).
3. Result and Discussion
Figure 2.a and 2.b have been demonstrated which TEM image of the synthesized hollow silica
nanosphere with an average diameter 400 nm. TEM image have been showed homogenous
distribution.
Figure 2.c have been demonstrated that XRD pattern of the hollow silica nanosphere. It is
amorphous. The pattern of the hollow silica nanosphere that peak appeared at 2=22.0 and this
peak is a typical peak encouraging that the synthesized was SiO2. The amorphous structure
brought to hollow silica spehere loose and permeable silica shells [13].
Figure 2.d have been demonstrated FT-IR spectra. The broad absorption peak at 1082 cm−1 was
showed Si-O-Si a symmetric stretching. The peak at 801 cm−1 was belonged to symmetric
stretching vibration of Si-O [14].
a
Hollow SiO2 nanosphere
b
b
537

Figure 2. TEM image (a), SEM image (b), XRD pattern(c), FT-IR spectra (d) of the hollow
silica nanosphere.
4. Conclusion
In this study have been reported synthesized of hollow silica nanosphere via templating method.
TEM, XRD and FT-IR results have been demonstrated succesfully. The hollow silica nanosphere
has average diameter 400 nm.
Acknowledgments
The authors would like to acknowledge the financial support of Mersin University Department of
Scientific Research Projects (Project No: 2020-1-TP2-3871).
References
1. X. W. Lou, Archer, LA & Yang, Z. Advanced Mater, 20 (2008) 3987-4019.
2. J. Hu, M. Chen, X. Fang, L. Wu, Chemical Society Reviews, 40 (2011), 5472-5491.
3. X.F. Guo, Y.S. Kim, G.J. Kim, The Journal of Physical Chemistry C, 113 (2009), 8313-
8319.
4. Z. Deng, M. Chen, G. Gu, L. Wu, The journal of physical chemistry B, 112 (2008), 16-22.
5. Y. Wang, C. Tang, Q. Deng, C. Liang, Ng, D. H. Kwong, Langmuir, 26 (2010), 14830-
14834.
6. Y. Bao, C. Shi, T. Wang, X. Li, J. Ma, Microporous and Mesoporous Materials, 227 (2016),
121-136.
7. G. Du, Y. Şarkı, N. Li, X. Lijian, C. Tong, Y. Feng, Colloids and Surfaces A:
Physicochemical and Engineering Aspects, 575 (2019), 129-139.
8. 8] X. Fu, X. He, Y. Wang, Colloids and Surfaces A: Physicochemical and Engineering
Aspects, 380 (2011), 241-249.
9. Z. Chen, S. Li, F. Xue, G. Sun, C. Luo, J. Chen Colloids and Surfaces A: Physicochemical
and Engineering Aspects, 355 (2010), 45-52.
10. S. Huang, X. Yu, Y. Dong, L. Li, X. Guo Colloids and Surfaces A: Physicochemical and
Engineering Aspects, 415 (2012), 22-30.
11. C. Ge, D. Zhang, A. Wang, H. Yin, M. Ren, Y. Liu, Journal of Physics and Chemistry of
Solids,70 (2009), 1432-1437.
12. C. Chen, L. Zhang, M. Li, A. Tian, C. Wang, S. Fu, Journal of Saudi Chemical Society, 22
(2018), 644-653.
13. J. Hu, M. Chen, X. Fang, L. Wu, Chemical Society Reviews, 40 (2011), 5472-5491.
cb
d
14. Y. Bao, T. Wang, Q. Kang, C. Shi, J. Ma, Scientific Reports, 7 (2017), 46638.
538

ABSTRACT PAPERS
PERFORMANCE OF METALS CERAMIC AND CARBON BASED
NANOFLUID IN NUCLEATE POOL BOILING HEAT TRANSFER
SHOUKAT ALIM KHAN1, MUAMMER KOC1, SAMI G AL GHAMDI1
1Hamad Bin Khalifa University, Qatar
Abstract
Nucleate pool boiling heat transfer (NBHT) is a phase change heat transfer technique, widely
used for thermal management of applications with high heat flux in a confined space such as
aerospace, nuclear power plant, high power electronics and concentrated photovoltaics. This
study presents the performance and detail analysis of nanofluid over a microporous surface.
Three different; carbon, metal and ceramic based nanofluid were tested in NBHT experiments.
The performance of graphene, Cu and alumina nanofluid were tested over the plain and
microporous surfaces. Three different concentration of 0.01%, 0.001% and 0.0001% were used
for the performance analysis. In all three cases, the deposition of nanofluid over micro-porous
was observed. The results have shown a decrease in NBHT performance for micro-surfaces for
nanofluid as compared to de-ionized (DI) water as working fluid. In all three cases, the heat
transfer coefficient (HTC) and Critical Heat flux (CHF) is calculated. The decrease in HTC is
reported for all the three fluid. However, metals and ceramic nanofluid resulted in an increase
in CHF, with an increase in concentration. Compared to metals and graphene nanofluid ceramic
nanofluid resulted in better performance with least deposition on micro-surface and lower
decrease in HTC. Graphene nanofluid made a hard coating over the surface and hence blocked
the micro-pores. This resulted in lower NBHT performance for the higher concentration of
graphene nanofluid. SEM, wettability and surface roughness characterization was performed
for the detailed analysis of the resulted surface.
Keywords : Thermal management, Nucleate boiling, Heat transfer, High power electronics,
heat pipes, Critical heat flux.
539
PRODUCTION OF METAL OXIDE NANOSTRUCTURES AS
ELECTRODES FOR LITHIUM ION BATTERIES
EVREN EGESOY1, OZLEM KAP1, MESUT ER2, AHMET ATAC3, NESRİN
HORZUM POLAT1
1Izmir Katip Celebi University, Turkey 2Tubitak Marmara Research Center Energy Institute, Turkey
3Manisa Celal Bayar University, Turkey
Abstract
Today, nanotechnology is used in numerous systems as well as in the battery systems.
Herewith, it is also actively used in the production of cost-effective new generation batteries
with a long lifespan and high energy density. The battery systems are one of the oldest methods
for storing electrical energy in chemical form. With the rechargeable lithium-ion battery
systems obtained by the development of these batteries has become a requirement due to the
increased portable energy demand in systems such as electric cars, heavy military vehicles,
mobile phones, laptops, and various portable small home appliances. Thereby, both the need
for portable energy will be met and will be preferred by environmentally conscious consumers
and designers due to the low level of CO2 gas emitted.
In this study, we have obtained metal oxide nanostructures as a result of thermal decomposition
using metal precursors (copper nitrate hemipentahydrate (Cu(NO3)2·2.5H2O), nickel acetate
tetrahydrate (Ni(CH3COO)2·4H2O), and zinc acetate dihydrate (Zn(CH3COO)2·2H2O)). The
calcination of the metal salts was carried out at 400 °C for 5h in air with a heating rate of 10
⁰C/min to produce copper(II) oxide (CuO), zinc(II) oxide (ZnO), and nickel(II) oxide (NiO)
nanostructures. The morphology, structure, and magnetic property of the synthesized
nanostructured metal oxides were characterized by XRD, TGA, SEM techniques. Depending
on the types of metal precursors in the calcination step, larger-sized CuO microparticles
nanostructures (~ 300 nm length and ~ 80 nm width) resulting
The use of new generation lithium-ion batteries with higher energy density and longer service
life will be examined by using CuO, NiO, and ZnO as electrode materials for LIBs. The battery
performance will be examined of the metal oxide materials with parameters such as the cycle
capacity, number of cycles, and cycle rate, and the results will be evaluated based on their
efficiency and stability. It is aimed at the use of lithium-ion batteries that would be formed with
these metal oxide nanoparticles which have high theoretical performance as an anode/cathode
material, will be improved for future electronic devices.
Keywords: Anode, Calcination, Cathode, Electrode, Lithium-ion Battery, CuO, ZnO,
Nanoparticles
540

SN IV PORPHYRINS FOR PHOTODYNAMIC THERAPY PROGRESS
TO DATE AND FUTURE PERSPECTIVES
JOHN MACK1, BALAJI BABU1, SOMILA DINGISWAYO1, RODAH SOY1,
MAURICIO BAPTISTA2, THIAGO TASSO3, TEBELLO NYOKONG1
1Rhodes University, South Africa 2University Of Sao Paulo, Brazil
3Federal University Of Juiz De Fora, Brazil
Abstract
In recent years, considerable progress has been made in preparing Sn(IV) complexes of
porphyrin dyes and porphyrin analogues that are suitable for use as photosentizer dyes in
photodynamic therapy [1-7]. Axial ligation results in low levels of aggregation, while the
Sn(IV) ion promotes intersystem crossing resulting in relatively high singlet oxygen quantum
yields through a heavy atom effect. The goal in many of these projects is to prepare dyes that
can be readily conjugated to nanoparticles to enhance their delivery and selective accumulation
in nanoparticles. Relatively low IC50 values have been obtained during in vitro studies against
MCF-7 breast cancer cells. Future directions with this research will be described.
Keywords: porphyrins,PDT,singlet oxygen,TD-DFT,photophysics
541

EXPERIMENTAL AND THEORETICAL EXAMINATION OF
MATERIAL PROPERTIES OF LIGAMENT STRUCTURE
ISMAİL HAKKİ KORKMAZ
Erzurum Technical University, Turkey
Abstract
Ligament structures are joint structures that anatomically define the limits of joint range of
motion and have uniaxial loading capacity. The ability of ligaments to withstand loading
depends on the size, shape and type of loading of the ligament. Ligaments, which have a fibrous
structure consisting of fibrils, have the property of visco-elastic material. It is very difficult to
create both experimental tests and mathematical models of this material property, which
includes the change over time for ligaments. For this reason, hyperelastic material properties
are used for these structures in finite element based studies.
In this study, the uniaxial tensile test was performed for the anterior cruciate ligament of sheep
and the stress-strain curve of the ligament structure was obtained. Finite element analysis was
performed under the same boundary conditions using the experimental data obtained. Neo-
Hookean model was used as a hyperelastic material model in the analyzes. Tests and analyzes
were evaluated comparatively and modeling of ligament structures in finite element analysis
was discussed.
Keywords: Ligament,viscoelastic,hyperelastic,finite element,experimental validation
542

OBTAINING THE ADDITIVE MANUFACTURING PROCESS
PARAMETERS USING RESPONSE SURFACE BASED
OPTIMIZATION METHOD
FAHRI MURAT1, IRFAN KAYMAZ1, ABDULLAH TAHIR SENSOY2, ISMAIL
HAKKI KORKMAZ1
1Erzurum Technical University, Turkey 2Samsun University, Turkey
Abstract
The Selective Laser Melting (SLM) process is an Additive Manufacturing (AM) process by
which powder materials are selectively melted with laser beam. Parts produced with SLM are
expected to have mechanically suitable properties according to the usage conditions. Some of
the most important factors affecting these properties are production parameters. It is possible to
produce parts with the desired properties by controlling the production parameters. In this study,
some of the most important process parameters such as laser power, layer thickness, scanning
speed and build orientation were selected as input parameters, and their effects on the
mechanical properties of the produced part were investigated. Central Composite Design
(CCD) was selected for the experimental design, and a mathematical model was created
between the production parameters and the mechanical properties of the manufactured parts.
With the use of the obtained model, the optimum values for the production parameters to obtain
the maximum elasticity module have been determined using the derivative based optimization
method.
Keywords: Additive manufacturing ,Ti6Al4V,Mechanical properties,Optimization
543

HIJYEN URUNLERINDE KULLANIMA UYGUN POLIOLEFIN VE
AMORF POLYALFAOLEFIN APAO BAZLI SICAKTA ERIYEN
BASINCA DUYARLI VE DARBEYI ABSORPLAYABILEN TUTKAL
GELISTIRILMESI
CELAL SOYLEMEZ
Ar-Ge Merkezi – Altunkaya Şirketler Grubu
Abstract
Projemiz, hijyen sektöründe kullanılan kauçuk bazlı sıcak eriyik tutkala alternatif olarak
poliolefin ve Amorfpolyalfaolefin bazlı sıcak eriyik tutkalın geliştirmesini konu edinmektedir.
Bebek bezlerinin üretimi ciddi anlamda hassas olduğu için çalışma esnasında yaşanabilecek
darbeler, basınçlar ve benzeri şeyler, ürünün kalitesini değiştirebilmektedir. Geliştirdiğimiz
tutkal ile ürünün yapısı korunmaktadır. Ayrıca normalde tüketilen miktarın yaklaşık %30 daha
azını kullanarak ekonomik yönden de fayda sağlanmış olunacaktır.
Tutkal üretimi için Ceketli reaktör ve soğutmalı paketleme ünitelerinden oluşan teknolojik bir
alt yapı gerektirmektedir. Bu kapsamda pilot reaktör ve soğutma ünitelerimiz ile pilot ölçekte
üretim yapılabilmiştir.
Türkiyede sıcak eriyik üretimi yapan pek çok firma vardır. Fakat bu firmaların çoğu hijyen
sektöründe kullanılan sıcak eriyik tutkala hitap etmemektedir.
Türkiye de hijyen sektörü için tutkal üreten üç global firma vardır. Bunlar Henkel, Bento-Nitto
ve Organik kimya firmalarıdır. Üretimi Türkiye’de yapılmış olsa da para akışı yine de yurt
dışına akmaktadır. Bu kapsamda projemizin yerli ve milli kaynaklar ile başarıya ulaşabileceğini
ve katma değeri Yüksek ürünler elde etmeyi planlamaktayız. Bu şekilde İthalatın önüne geçerek
ihraç edecek ürün üretmiş olacağız.
Keywords: Poliolefin, Amorf Polialfaolefin, Sıcak eriyik tutkal
544
COMPARATIVE ANALYSIS OF THE SERVICES PROVIDED BY GSM
OPERATORS WITH MOBILE INTERNET IN TURKEY
BUSRA SAVCILI1, ALPTEKIN DURMUSOGLU1
1Gaziantep University, Turkey
Abstract
Mobile operators have focused their efforts, infrastructure investments, tariffs and
advertisements on the improvement of mobile data rates and services like video streaming,
online video games and instant messaging with the introduction of 4.5G. Mobile services
provided by mobile operators are influenced by various factors like the regional coverage of
the operator, usage traffic, time and weather conditions. As a result, there may be differences
between the quality of mobile services that the operators offer to their customers and those that
the customers can actually access. The service sector's exposure to global competition has
increased expectations on service quality and customer satisfaction. In our study, The effects
of the services provided within the scope of mobile internet belonging to the operators operating
in the GSM sector on customer satisfaction and the services that users can experience will be
compared. in Turkey. In the light of the stated issues, the study titled "Comparative Analysis of
The Services Provided By GSM Operators With Mobile Internet in Turkey " is intended to
provide researchers and practitioners with a different perspective.
Keywords: Mobile Services, Customer Experience,Competitor Analysis,GSM
Operators,Mobile Internet Service
545

USING PSF METHOD TO FIND EXOPLANET CANDIDATES AROUND
FAINT STARS
KAAN KAPLAN
Gaziantep University, Turkey
Abstract
More than four thousand transiting planets orbiting around their parent stars have been
discovered by Kepler/K2 since 2009. Most of the time aperture photometry has been used to
find these exoplanets. However, this method was not sufficient to find sources nearby the faint
host star. Another method that is point-spread function (PSF) neighbor subtraction method was
used to find exoplanet candidates around these stars. In this work my aim was to search for
exoplanet candidates. I present my analysis of Kepler/K2 Campaign 0 data in open clusters M
35 and NGC 2158. Basically, four key ingredients: image reconstruction, accurate PSF for the
each full frame image, high-angular-resolution input star list obtained by Asiago Schmidt
telescope and PSF neighbor subtraction method were used. Thanks to these ingredients the light
curves of all stars in the high-angular-resolution input catalog using PSF and aperture
photometry with apertures (1-, 3-, 5-, 10-pixels radius) was extracted. All light curves were
cleaned from the related to inaccurate K2 pointing.
I selected photometric method that indicates the best photometric precision. 1-pixel and PSF
photometry performs better than the 3-, 5-, 10-pixels size aperture photometry for the faint stars
(Kp > 15.5) in particular crowded regions. To find an exoplanet candidate, I have detrended
light curves, flattened them and clipped outliers. I computed the periodograms, normalized
them and obtained the periods with the highest signal-to-noise ratio for each light curve.
Keywords: methods: data analysis,planet detection,open clusters: m35 and ngc2158,
Technique:planetary transit
546

CRITICAL REVIEW ON 3DP CONCRETE TRENDS NEEDS AND
RESEARCH RECOMMENDATIONS
ANS AL RASHID1, SHOUKAT ALIM KHAN1, SAMI G AL GHAMDHI1,
MUAMMER KOC1
1Hamad Bin Khalifa University, Qatar
Abstract
The construction sector is a significant and leading contributor to greenhouse gas emissions
among different industrial sectors. Besides, risks involved in construction sites have been a
prime concern for searching for safe and eco-friendly construction techniques. 3D concrete
printing (3DCP) was introduced a couple of decades now, which suggested the automated
fabrication of structures. There has been an increasing interest of researchers to explore
processes and materials for digital construction. Although several on-site and off-site projects
and real building structures have been built through 3DCP, there are still limitations to its
utilization. Conventionally designed structures and construction materials are not suitable for
3DCP due to different process requirements. The unavailability of 3DCP codes and standards
also add up to the constraints. Researchers need to re-think how structures should be designed
to assist 3DCP; furthermore, biomimicry could be beneficial to achieve this milestone as few
attempts are reported. Optimization of process controls for a specific material is vital; therefore,
guidelines on process parameters for most commonly used construction materials is desired.
Novel and sustainable materials must be explored and tested to lower the GHG emissions
associated with this sector. In a nutshell, synergic efforts should be made by process engineers,
material scientists, and designers to play an individual role to achieve 3DCP benefits at full.
Keywords: Additive manufacturing, 3d printing, construction, infrastructure
547

548

1
The International Conference of Materials and Engineering Technology (TICMET’20)
-------------------------------------------------------------------------- November 05-07, 2020 Gaziantep/TURKEY