Private Market Financing for - Developing Countries - IMF ...
92
-
Upload
khangminh22 -
Category
Documents
-
view
1 -
download
0
Transcript of Private Market Financing for - Developing Countries - IMF ...


WORLD ECONOMIC AND FINANCIAL SURVEYS
Private Market Financing for
Developing Countries
Prepared by a Staff Team in thePolicy Development and Review Department
Steven DunawayRobert Rennhack
Brian AitkenGeorge Anayiotos
David AndrewsJahangir Aziz
Juan Jose Fernandez-AnsolaShogo Ishii
Thomas LaursenPaul MylonasSusan Prowse
Alejandro SantosAnne Jansen
Jolanda HeemskerkLouis Pauly
INTERNATIONAL MONETARY FUNDWashington, DC
March 1995
©International Monetary Fund. Not for Redistribution

© 1995 International Monetary Fund
Charts and Cover Design: IMF Graphics Section
ISBN 1-55775-456-XISSN 0258-7440
Price: US$20.00(US$12.00 to full-time faculty members and
students and universities and colleges)
Please send orders to:International Monetary Fund, Publication Services
700 19th Street, N.W., Washington, D.C. 20431, U.S.A.Tel: (202) 623-7430 Telefax: (202) 623-7201
recycled paper
©International Monetary Fund. Not for Redistribution

Contents
Page
Preface vii
I. Overview and Current Issues 1Progress with Commercial Bank Debt Restructuring 1
Recent Experience 1Prospects 2
Private Financial Flows 2Recent Experience 2Durability of Market Re-Entry and Pricing of Risk 2
II. Commercial Bank Debt Restructuring 5Overview 5Recent Bank Packages 5Debt-Conversion Activity 10Secondary Market Developments 11
III. Recent Developments in Private Market Financing 13Bonds 13Bond Pricing 17Equities 21Commercial Bank Lending 25Other Issues 28
IV. Institutional and Regulatory Framework for Developing Country Financing 31Reform of Regulatory Structures 31Expanding the Investor Base 32Regulatory Harmonization 33Regulatory Changes in Creditor Countries 34
Securities Markets 34Provisioning Standards 34
V. Foreign Direct Investment 35Recent Trends in Direct Investment 35Behavior of Foreign Direct Investment Transactions in a Crisis 36
Statistical Appendix 41
Bibliography 81
Tables
II. 1. Commercial Bank Debt- and Debt-Service-Reduction Operations 1987-July 1994 6
2. Bank Menu Choices in Debt-Restructuring Packages 7
©International Monetary Fund. Not for Redistribution

CONTENTS
Page
II. 3. Buy-Back Equivalent Prices in Debt- and Debt-ServiceReduction Operations 8
4. Debt Conversions 11III. 5. International Bond Issues by Developing Countries and Regions 15
6. Credit Ratings of Developing Country Borrowers 187. International Equity Issues by Developing Countries and Regions 248. Terms of Long-Term Bank Credit Commitments 289. Total Returns on Equity in Selected Emerging Market Countries:
Before and After Opening to Foreign Investors 3010. U.S. Net Purchases of Foreign Equity in Selected Countries:
Before and After Opening to Foreign Investors 30
AppendixAl. Chronology of Bank Debt Restructurings and Bank Financial Packages,
1984-July 1994 41A2. Amounts of Medium- and Long-Term Bank Debt Restructured 42A3. Terms and Conditions of Bank Debt Restructurings and Financial
Packages, July 1989-July 1994 43A4. Debt and Debt-Service Reduction in Commercial Bank Agreements
1987-July 1994 50A5. International Bond Issues by Developing Countries and Regions,
by Type of Borrower 60A6. Yield Spread at Launch for Unenhanced Bond Issues by Developing
Countries and Regions 62A7. Maturing Bonds of Developing Countries by Regions 64A8. International Bond Issues by Developing Countries by Currency of
Denomination 65A9. Enhancements of International Bond Issues by Developing Countries 66
A10. Granger Causality Tests on Daily Data of Brady Par Bond Prices 67Al l . Granger Causality Tests on Daily Data of Sovereign Eurobond Prices 68A12. Emerging Markets Mutual Funds 69A13. Net Bond and Equity Purchases by Emerging Markets Mutual Funds 70A14. Issues of Closed End Funds Targeting Emerging Markets in
Developing Countries and Regions 71A15. Bank Credit Commitments by Country or Region of Destination 72A16. Terms on Syndicated Bank Credits for Selected Developing Countries
and Regions 73A17. Correlation Among Total Returns on Bonds for Selected Countries 74A18. Correlation Among Secondary Market Prices of Brady Bonds 75A19. Correlation Among Total Returns on Equity for Selected Countries 77A20. Provisioning Regulations Against Claims on Developing Countries 78A21. Net Foreign Direct Investment Flows to Developing Countries 80
ChartsI. 1
II.III.
2.3.4.5.
Selected Developments in Secondary Market Prices DuringNegotiations of Bank Restructuring Packages 3
Maturing Bonds of Developing Countries 4Secondary Market Prices of Bank Claims on Selected Countries 12Private Market Financing to Developing Countries 13Yield Spreads at Launch for Unenhanced Bond Issues by Developing
Countries 14Secondary Market Yield Spreads on U.S. Dollar Denominated Bonds by
Selected Developing Countries 14
IV
6.
©International Monetary Fund. Not for Redistribution

Contents
Page
7. Comparison of Yields of Sovereign Bonds to Yields on U.S. CorporateBonds 20
8. Comparison of Sovereign Bond Spreads 219. Comparison of Movements in Spreads and Economic Variables for
Mexico and Venezuela 2210. Comparison of Movements in Spreads and Economic Variables for
Hungary and Turkey 2311. Emerging Market Mutual Funds 2512. Share Price Indices for Selected Markets in Latin America 2613. Share Price Indices for Selected Markets in Asia 2714. Weekly Volatility of Total Returns on Bonds and Equities for
Selected Countries 29V. 15. Net Foreign Direct Investment to Developing Countries 36
16. Composition of Net Private Capital Flows 37
The following symbols have been used throughout this paper:
. . . to indicate that data are not available.
— to indicate that the figure is zero or less than half the final digit shown, or that the item does notexist;
between years or months (e.g., 1992-93 or January-June) to indicate the years or months covered,including the beginning and ending years or months;
/ between years (e.g., 1992/93) to indicate a crop or fiscal (financial) year.
"Billion" means a thousand million.
Minor discrepancies between constituent figures and totals are due to rounding.
The term "country," as used in this paper, does not in all cases refer to a territorial entity that is a stateas understood by international law and practice; the term also covers some territorial entities that are notstates, but for which statistical data are maintained and provided internationally on a separate and inde-pendent basis.
V
©International Monetary Fund. Not for Redistribution

This page intentionally left blank
©International Monetary Fund. Not for Redistribution

Preface
This study was prepared in the Policy Development and Review Department of theInternational Monetary Fund, under the direction of Steven Dunaway, Chief of the Debt andProgram Financing Issues Division, with Robert Rennhack, Deputy Chief of the division. Itsauthors are Brian Aitken, George Anayiotos, David Andrews, Jahangir Aziz, Juan Jose Fer-nandez-Ansola, Shogo Ishii, Thomas Laursen, Paul Mylonas, Susan Prowse, and AlejandroSantos, economists in the division; Anne Jansen, research officer in the division; and JolandaHeemskerk, an intern at the IMF during the summer of 1994. The study updates informationand analyses contained in Private Market Financing for Developing Countries, World Eco-nomic and Financial Surveys (Washington: IMF, December 1993).
The work benefited from comments by staff in other departments of the IMF and by mem-bers of the Executive Board. Opinions expressed, however, are those of the authors and donot necessarily represent the view of the IMF or its Executive Directors. The study was com-pleted in October 1994 and reflects developments to that time.
Louis Pauly prepared the text for publication. The authors are also grateful to DelreneAlvis, Lucia Buono, Ida Jenkins, and Anne-Barbara Hyde for their valuable word-processingservices. Juanita Roushdy of the External Relations Department, gave the manuscript a finaledit and coordinated production.
VII
©International Monetary Fund. Not for Redistribution

This page intentionally left blank
©International Monetary Fund. Not for Redistribution

IOverview and Current Issues
ver the period since the end of 1992, steadyprogress has been achieved toward resolving the
commercial bank debt problems of middle-incomecountries.1 By the end of 1994, most of the majordebtor countries in this group will have completedrestructurings of their bank debt. At the same time, anumber of developing countries—including some ofthe former major debtors—have expanded their accessto spontaneous private financing, as investor interest indeveloping country bonds and equities broadened sig-nificantly. The markets for these securities ran intosubstantial turbulence at times during the first half of1994, however, reflecting higher interest rates in inter-national markets prompted by the tightening of mone-tary conditions in the United States and by adversedevelopments in some developing countries.
Progress with Commercial Bank DebtRestructuring
Recent ExperienceOver the past year, Brazil, Bulgaria, the Dominican
Republic, Jordan, Poland, Sao Tome and Principe, andZambia completed bank-debt-restructuring packageswith support from the Fund, the World Bank, and bilat-eral official agencies. Ecuador also is expected to com-plete an arrangement with its bank creditors before theend of 1994. By that time, a total of 21 countries willhave concluded bank debt- and debt-service-reductionoperations. Debt worth approximately $170 billion willhave been restructured, representing roughly 75 per-cent of bank debt outstanding at the end of 1989 for thegroup of heavily indebted developing countries (TableAl). Panama and Peru are the most heavily indebtedmiddle-income countries that have not yet regularizedrelations with their commercial bank creditors; both areengaged in negotiating restructuring agreements.
South Africa continued to address its external debtproblems through a rescheduling of obligations tocommercial banks. Agreement on a fourth and finalarrangement following the 1985 payment "standstill"was reached in September 1993. In the case of Russia,
'For earlier periods, see Collyns and others (1993, 1992, and1991). For information on official financial flows to developingcountries, see Kuhn and others (1994).
talks have focused on rescheduling its stock of bankdebt and capitalizing a declining share of interestarrears. A preliminary agreement was reached in July1993, but its implementation was delayed pending res-olution of issues regarding Russia's waiving sovereignimmunity and designation of the official agency thatwould be the signatory to the agreement. These issueswere resolved in September 1994, and the agreement isto come into effect by the end of the year, after Russiamakes a previously agreed payment of $500 millionwith respect to past due 1993 interest obligations.
A growing number of low-income countries also aremaking efforts to resolve their debt problems, oftenaided by the resources of the debt reduction facility forcountries of the International Development Associa-tion (IDA). Progress for most, however, remains slow.With the backing of IDA resources and assistance fromofficial bilateral sources, debt buy-backs have beenconcluded by Bolivia, Guyana, Mozambique, Niger,Sao Tome and Principe, Uganda, and Zambia. Prelimi-nary discussions on similar operations are under waywith several other countries.
Further innovations in debt operations have occurredover the past year. Bulgaria's discount bond, for exam-ple, involves a much steeper discount than has been thecase in previous debt packages. In addition, Poland'sagreement provided for some debt reduction for inter-est arrears and did not include interest collateral. Pack-ages now generally include limits on the use of certainoptions or explicit rebalancing clauses to providecountries with more certainty as to the up-front costs ofan operation and the profile of debt-service relief ulti-mately provided. The Fund and the World Bank havealso shown increased flexibility in the use of their ownresources by eliminating the segmentation provisionsin their guidelines governing support for bank debtoperations.
Over the past year, bank debt operations for Braziland Jordan were financed entirely by the debtor coun-tries themselves. While not directly involved in thesedeals, the international financial institutions have pro-vided some indirect support. The bank deal with Jor-dan was predicated on the existence of a Fundarrangement with the country. In the case of Brazil, thecountry's stabilization program, which was expected tobe monitored by the Fund, and continuing discussionson a Fund arrangement were considered sufficientassurance to enable completion of negotiations withcreditors.
1
O
©International Monetary Fund. Not for Redistribution

I OVERVIEW AND CURRENT ISSUES
Prospects
Notwithstanding recent progress, certain develop-ments appear likely to make future negotiationsbetween indebted developing countries and the holdersof their commercial bank obligations more complex.Nonbank investors now have purchased significantamounts of bank debt in the secondary market. Diffi-culties in persuading them to accept certain aspects ofthe debt packages negotiated by bank advisory com-mittees have contributed to delays in completing somerecent restructuring operations. Negotiating commit-tees in the future will have to take better account of thediverse interests of these investors.
Another possible complication arises from the mar-ket impact of speculation that a country will concludea debt- and debt-service-reduction operation. Forexample, so-called pre-Brady speculation has con-tributed to the run-up in the secondary market pricesfor the bank debt of Panama and Peru. In recent years,such price run-ups have tended to be earlier and largerthan was the case for countries that concluded debtpackages in 1989 and 1990 (Chart 1). As a conse-quence, secondary market prices may not always fullyreflect a country's medium-term capacity to service itsdebt and the up-front costs of completing a debt-restructuring agreement may be bid up significantly.The potential effects of such speculation will need tobe taken into consideration in negotiating the terms ofbank packages in the remaining cases.
While most of the major baric debt cases have beenresolved, attention still needs to be focused on theproblems of low-income countries. In many of thesecountries, the process of debt restructuring has beendelayed owing to economic and political difficulties.Although the amounts owed by these countries aresmall compared with the debt of the large middle-income debtor countries, individual debt burdens formany are severe. In some cases in the past, commercialbanks have accepted steep discounts on these debts,particularly when they had no significant longer-termbusiness interests and had already made provisions forlosses. Additional flexibility will be needed in thefuture. There will also be a continuing substantial needfor concessional assistance to finance debt operations.For some low-income countries, the total amount ofassistance required to buy back bank debt, even at verysteep discounts, is likely to be relatively large.Resources from the debt reduction facility for IDAcountries and from other official agencies may not besufficient. In such cases, it may not be enough to orga-nize simple buy-backs of commercial bank debt.Instead, more complex operations may have to be con-sidered that reduce up-front costs but still provide debtand debt-service reduction in line with a country's pay-ments capacity over the medium term. Such dealsmight involve options that include larger discounts ondiscount bonds, par bonds bearing lower interest rates,
more favorable treatment of past due interest, and lessthan full collateralization of principal.
Private Financial Flows
Recent ExperienceThe resurgence in private market financing to devel-
oping countries that began in the late 1980s continuedduring 1993 as both portfolio flows and net foreigndirect investment rose sharply.2 The strong expansionin international bond and stock placements was fueledin large part by a broadening of the investor base toinclude a wider group of institutional investors.3
Medium- and long-term commercial bank lending,however, remained limited. Moreover, while total pri-vate market financing for developing countries as agroup increased strongly in 1993, much of these flowscontinued to go to a small number of countries, pri-marily in Asia and Latin America.
Toward the end of 1993 and in early 1994, spreadson bonds narrowed appreciably, and demand for devel-oping country bonds, as well as equities, began to falldramatically. This coincided with increases in U.S.interest rates and adverse developments in several bor-rowing countries. In addition, highly leveraged'inves-tors were reported to have liquidated their positions indeveloping country securities in an effort to meet mar-gin requirements or to take profits. The slide in demandfor these bonds and equities continued through April1994, before recovering moderately in May and June.
While countries with weaker economic performanceexperienced cutbacks in market access somewhat ear-lier than others, financing flows to all developingcountries, including those in Asia and stronger per-formers in Latin America, fell to very low levels byApril 1994. Both issuers and purchasers pulled backsharply in the wake of overall market uncertainties.Bonds placed after February 1994 tended to be fromonly the better credit risks and to carry floating interestrates and shorter maturities. While highly leveragedinvestors unwound most of their positions, it appearsthat institutional investors generally maintained theirholdings, even if they curtailed their demand for newbond and equity issues.
Durability of Market Re-Entryand Pricing of Risk
The increase in private financing to developingcountries over the past few years and the market's abil-
2International bond and equity flows amounted to $71 billion in1993 ($33 billion in 1992); net foreign direct investment flowsamounted to $58 billion in 1993 ($39 billion in 1992). Direct pur-chases of equity and bonds by nonresidents in local markets are notincluded because of the lack of sufficient data.
3The expansion of the investor base is discussed further in Gold-stein and others (1994).
2
©International Monetary Fund. Not for Redistribution

Private Financial Flows
Chart 1. Selected Developments in Secondary Market Prices DuringNegotiations of Bank Restructuring Packages
Sources: Salomon Brothers; ANZ Grindlays Bank; and IMF staff estimates.'Per unit of claim.
ity to rebound from a moderate correction in 1992engendered optimism about the sustainability of theprocess of market re-entry.4 While the sharp correctionin early 1994 raised fresh doubts, the emergence of a
4The 1992 market correction is described in Goldstein and others(1993).
3
recovery later in the year reinforced that optimism. Asnoted in previous reports in this series, three conditionsappear basic to sustaining private flows to developingcountries: an expanded investor base, appropriate pric-ing and assessment of risk, and continued implementa-tion of sound policies that help match future debt-servicing requirements to payments capacity. Progresscontinues to be made along these lines.
©International Monetary Fund. Not for Redistribution

I OVERVIEW AND CURRENT ISSUES
Chart 2. Maturing Bonds of Developing Countries(In millions of U.S. dollars)
Sources: International Financing Review; EuroWeek; and IMF staffestimates.
The expansion of the investor base in 1993 was partof a trend toward the globalization of portfolios. Rela-tive stability of the investor base in 1994, despite themarket correction, has been encouraging. As newinvestor groups come into the market, flows and pricesof developing country securities could nevertheless besubject to considerable volatility, especially if newinvestors have poorer information and different liquid-ity preferences than existing investors. Although anumber of developing countries have experiencedincreased volatility in security prices following theopening of local stock markets to foreign investors, adiversified and stable investor base can be expectedover time to promote reduced fluctuations in assetprices, particularly as information becomes morewidely disseminated.
The sharp run-up in the prices of developing countrysecurities in late 1993 and early 1994 raises questionsabout the pricing of risk. It appears that the marketranks countries in a manner that is broadly consistentwith their recent economic performance and immedi-ate prospects. It is unclear, however, whether investorsdifferentiate carefully among different borrowers. Ingeneral, and as would be expected, issuers from coun-tries that previously rescheduled their debt tend to payhigher spreads, while those from countries withstronger growth and better inflation performance tendto pay lower ones. Beyond such broad differentiations,however, the market may be slow to make finer dis-tinctions. For example, yield spreads on bonds ofcountries that ran into difficulties in late 1993 wereslow to react to the deterioration in their economic per-formance until it was widely recognized; at that point,the response was quite significant. Investors also havebeen attracted to developing country securities becausereturns historically have not closely tracked pricedevelopments in industrial country financial markets.Under these circumstances, the diversification of port-folios by including developing country securities couldraise the portfolios' expected returns for a given levelof risk. Experience during the market turbulence in1994, however, suggests that asset returns of develop-ing and industrial countries tend to become moreclosely related in turbulent periods.
To maintain market access on reasonable terms,countries need consistently to implement strongmacroeconomic and structural policy programs. Main-tenance of such programs is likely to be particularlyimportant in the period ahead, given the high degree ofuncertainty with regard to interest rate movements inthe industrial countries. Developing countries are alsonow entering a period of rising debt amortization as thebullet repayments on bonds issued earlier this decadeare beginning to fall due (Chart 2). The increasing inte-gration of international financial markets also meansthat interest rates and equity prices in developing coun-
tries will become more sensitive to developments inasset prices in the major industrial countries. A moreopen international environment will have to be takeninto consideration by developing countries in deter-mining the appropriate stances of monetary, fiscal, andexchange rate policies. While at times it might appeartempting to supplement such policies with capital con-trols, such actions would ultimately tend to be counter-productive. To provide a basis for sustained portfoliocapital flows, continued efforts are also needed tostrengthen financial markets in developing countries.Structural reforms to increase market transparency andreduce transaction costs and risks are important in fos-tering investor confidence. Intermediation of capitalflows through the banking system points as well to theneed for adequate banking regulation and supervision.
Developing countries can improve the mix of exter-nal financing by taking steps to remove obstacles tonon-debt-creating capital flows. In recent years, inter-national equity placements and direct purchases ofequities by foreigners in domestic stock markets haverisen sharply. At the same time, there has also been asurge in foreign direct investment inflows. These flowsgenerally entail longer-term commitments on the partof foreign investors. Nevertheless, foreign directinvestment flows, taking into account reinvested andrepatriated earnings, also exhibit some of the samecharacteristics as other flows during periods of domes-tic macroeconomic instability. While investment posi-tions are rarely liquidated rapidly, the totality oftransactions associated with foreign direct investmentmay give rise to net outflows of funds.
4
©International Monetary Fund. Not for Redistribution

IICommercial Bank Debt Restructuring
Overview
rogress has been made by a number of the heavilyindebted middle-income developing countries in
regularizing their relations with commercial bank cred-itors. To many observers, the conclusion of the Brazil-ian debt package in April 1994 is seen as marking theend of the debt crisis that began in August 1982 whenMexico announced its inability to service its externalobligations to commercial creditors. Along with Brazil,Bulgaria, the Dominican Republic, Jordan, Poland,Sao Tome and Principe, and Zambia completed debt-and debt-service-reduction operations or comprehen-sive debt buy-backs over the past year. Ecuador and itsbank creditors also reached agreement, and the restruc-turing package is scheduled to be completed before theend of 1994. By that time, 21 countries will have con-cluded debt- and debt-service-reduction operationsrestructuring $170 billion of original commercial bankclaims (Tables 1 and A2), or 75 percent of commercialbank debt owed by heavily indebted developing coun-tries at the end of 1989.5 Debt reduction achieved willamount to an estimated $76 billion at a cost of about$25 billion.
Allocations to the different options available in bankpackages have varied depending (among other things)on explicit limits imposed by debtor countries, oninterest rate developments following the issuance ofterm sheets, on creditors' perceptions of country credi-tor risks, and on the prospect of capital gains (Tables 2and A3). In general, packages have been cost-effectivein that the cost per unit of debt reduction obtained hasbeen broadly in line with prices prevailing in the sec-ondary market at the time agreements in principle werereached (Tables 3 and A4).
Following the trend of previous years, debt conver-sion activity was less buoyant in 1993. This partlyreflected a shift in emphasis in the privatization pro-gram in Argentina, which accounted for about half ofdebt conversions in 1992, as priority shifted fromreducing foreign commercial bank debt to reducingforeign currency denominated domestic debt instru-
ments. In addition, the decline in debt conversionsreflected the rise in secondary market prices for thedebt of many countries and the reduced scale of privat-izations, owing to countries having substantially com-pleted their schemes.
Recent Bank Packages
While Argentina's debt- and debt-service-reductionpackage closed on April 7, 1993, about 6 percent of eli-gible principal (amounting to $19.4 billion) and 100percent of past due interest ($8.6 billion) wereexchanged at a later date because of reconciliationproblems. All collateral and guarantees (totaling $3.1billion), however, were deposited with the collateralagent (the Federal Reserve Bank of New York), and thedownpayment on past due interest ($0.7 billion) andthe bonds related to unreconciled debts were depositedwith the escrow agent (the Bank of England) on theclosing date. Reconciliation of the remaining principalwas completed on September 27, 1993, and the releaseof bonds covering past due interest and the corre-sponding cash payments was made in four tranches:the first on October 29, 1993 (83 percent); the secondon December 29, 1993 (14 percent); the third on Feb-ruary 28, 1994 (3 percent); and the fourth and last onApril 28, 1994 (negligible amounts).
Brazil completed one of the largest and most com-plex debt- and debt-service-reduction operations onApril 15, 1994. Completion of the deal came almosttwo years after the agreement in principle was reached,following four extensions of the closing date. Since anarrangement with the Fund was not likely to be ineffect at closing (this had been a condition in the termsheet), a waiver from bank creditors had to berequested. This waiver was granted on March 24,1994. The process was also delayed because of prob-lems in obtaining full creditor participation.6
The deal restructured $40.6 billion in eligible princi-pal and $6.0 billion in past due interest. Out of a menuof six options, only five were actually used. Creditorsaccepted the May 1993 limits suggested by the author-ities on the amount of debt allocated to the par and new
5 A further 10 percent of the stock of commercial bank debt out-standing in 1989 has been extinguished through debt conversionsand other mechanisms. Of the remaining debt that has not beenrestructured, Peru and Panama account for more than 20 percent,and four low-income countries (Cameroon, Congo, Cote d'lvoire,and Nicaragua) account for another 17 percent.
6In the end, one major creditor, a large nonbank investor holdingroughly $1.4 billion of Brazil's debt, refused to participate in thedeal. That creditor subsequently filed a law suit in the United Statesto force payment of past due interest on Brazil's original debt andto accelerate payments of principal arrears.
5
P
©International Monetary Fund. Not for Redistribution

COMMERCIAL BANK DEBT RESTRUCTURING
Table 1. Commercial Bank Debt- and Debt-Service-Reduction Operations, 1987-July 19941
(In millions of U.S. dollars)
Argentina (1992)Bolivia
(1987)(1993)
Brazil (1992)Bulgaria (1993)Chile (1988)Costa Rica (1989)Dominican Republic (1993)Ecuador(1994)6
Guyana (1992)Jordan (1993)Mexico
(1988)(1989)
Mozambique (1991)Niger(1991)Nigeria (1991)Philippines
(1989)(1992)
Poland (1994)Sao Tome and PrincipeUganda (1993)Uruguay (1991)Venezuela (1990)Zambia (1994)
Total
DebtRestructuredUnder DDSR
Operation3
(1)
19,397643473170
40,6006,186
4391,456
7764,520
69736
51,9023,671
48,231124111
5,8115,8121,3394,4739,918
10152
1,60819,700
200
170,170
Debt
Buy-back(2)
—331253
78—
798439991272
—69——
—124111
3,3902,6021,3391,2632,454
10152633
1,411200
13,986
Debt
reductionDiscountexchange4
(3)
2,35623218250
4,9741,865
—177
1,180—84
7,9531,1156,838
————
—2,401
———
511—
21,733
and Debt-Service
Debt-servicePrincipal
collateralizedpar bond4
(4)
Reduction (DDSR)2
reduction
Otherpar bond4
(5)
Prepaymentsthrough
collateral-ization
(6) 0
(Concluded agreements)
4,29129
293,996
—
——
826—
1116,484
6,484——
651516
516779
——
1602,012
—
19,855
——
337421
__101—————
————
116
11672———
471__
1,519
2,73920
713
3,891443
__3663
595—
1177,777
5557,222
——
352467
467602——95
1,639—
18,835
Totalr)=(2)+. .+(6)
9,386612442170
13,1983,527
4391,128
5112,600
69312
23,1731,670
20,544124111
4,3933,7011,3392,3626,309
10152888
6,043200
75,927
Total Debt andDebt-Service
Reduction/Debt
Restructured(7)/(l)
48.495.293.5
100.032.557.0
100.077.565.857.5
100.042.544.645.542.6
100.0100.075.663.7
100.052.863.6
100.0100.055.230.7
100.0
44.6
Cost ofDebt
Reduction5
3,059613526
3,900652248196149583
10118
7,677555
7,1221223
1,7081,795
6701,1251,866
118
4632,585
22
25,146
Source: IMF staff estimates.'Debt and debt-service reduction are estimated by comparing the present value of the old debt with the present value of the new claim, and adjusting for
prepayments made by the debtor. The methodology is described in detail in Annex I of Private Market Financing for Developing Countries (Washington:International Monetary Fund, December 1992). The amounts of debt reduction contained in this table exclude debt extinguished through debt conversions.
2The figure for debt-service reduction represents the expected present value of the reduction in future interest payments arising from the below-marketfixed interest rate path on the new instruments relative to expected future market rates. The calculation is based on the estimated term structure of interestrates at the time of agreement in principle.
3Includes debt restructured under new money options for Mexico (1989), Uruguay (1991), Venezuela (1989), and the Philippines (1992); the Philippines'(1989) new money option was not tied to a specific value of existing debt.
4Excludes prepayment of principal and interest through guarantees.5Cost at the time of operation's closing. Includes principal and interest guarantees, buy-back costs, and for Venezuela, resources used to provide
comparable collateral for bonds issued prior to 1990. Excludes cash downpayments related to past due interest.6Closing of the operation has been delayed and is expected to take place in the first quarter of 1995.
money options and the minimum allocation for the dis-count bond. The final allocation was (1) 35 percent forthe discount bond; (2) 32 percent for the par bond; (3)22 percent for the capitalization bond with temporaryinterest reduction; (4) 6 percent for the new moneyoption; and (5) 5 percent for the front-loaded interestreduction bond (FLIRB). No allocation was made tothe restructuring option.
The cost of the enhancements required for the oper-ation is estimated at $3.9 billion, of which $2.8 billionin collaterals was delivered at closing, with the rest to
be phased in over a two-year period in four semiannualinstallments. Phase-in bonds and partly collateralizedbonds were issued at closing and were to be exchangedfor fully collateralized instruments over the next twoyears.7 The Bank for International Settlements is ser-ving as the collateral agent. Financing for the operationcomes from $0.4 billion collected in the new money
7These phase-in and partly collateralized bonds apply only to thepar and discount bond options. The FLIRBs were fully collateral-ized at closing, and the other options did not require collateral.
6
©International Monetary Fund. Not for Redistribution

Overview
Table 2. Bank Menu Choices in Debt-Restructuring Packages(In percent of total eligible bank debt)
ArgentinaBoliviaBrazilBulgariaCosta Rica
Dominican RepublicEcuadorJordanMexicoNigeria
Philippines (1989)1
Philippines (1992)PolandUruguayVenezuela
Total2
Debt Reduction
Buy-back
46—1363
35
——62
100282539
7
8
Discountexchange
34353560—
65583343—
—54—
9
34
Debt-Service
Principalcollateralized
parexchanges
661932——
42674738
42183338
39
Reduction
Other parexchanges
52737
——
17
—15
5
NewMoney
—6
——
11—
134
2831
9
OtherNon-Debt- andDebt-Service-
ReductionOptions
_22——
——
—
——
5
Sources: National authorities; and IMF staff estimates.]The agreement included new money but was not tied to a specific amount of eligible debt.2Weighted average.
option and from Brazil's own resources. Zero-couponU.S. Treasury securities used as collateral for the dealwere purchased by Brazil in the secondary market.
In one of the fastest completions of a menu-baseddebt- and debt-service-reduction operation, Jordanconcluded a deal with its banks on December 23, 1993,two weeks after the formal signing of the agreementand less than six months after reaching an agreement inprinciple. The package covered eligible principal of$740 million and past due interest of $120 million.Following considerable official buy-backs in the sec-ondary market before the commitment date (about 12percent of the total bank debt outstanding), the finalallocation of eligible principal was (1) 67 percent forthe par bond; (2) 33 percent for the discount bond; and(3) negligible amounts for the (below-market price)buy-back. The $150 million cost of the operationincluded $29 million for cash payments on past dueinterest. Financing was covered entirely by the coun-try's own resources.
Bulgaria reached an agreement in principle with itscommercial bank creditors on November 24, 1993. Aterm sheet was distributed to banks on March 11, 1994,and the package was completed on July 29, 1994. Eli-gible principal amounted to $6.2 billion, including $1.9billion in short-term debt. The menu consisted of threeoptions: (1) a 50 percent discount exchange; (2) aFLIRB; and (3) a buy-back at 25 3/16 cents on the dollarper unit of claim. Partial interest payments were re-sumed shortly after the agreement in principle was
reached. Retroactive to March 1993, the rate paid was5 percent of amounts due, or roughly $30 million aquarter.
The discount bond involves a 30-year bullet repay-ment and bears an interest rate of % over the Londoninterbank offered rate (LIBOR). The principal is fullycollateralized, and there is a 12-month rolling interestguarantee at 7 percent. The FLIRB carries an 18-yearmaturity with eight years of grace. The interest ratestarts at 2 percent in the first year and increases in stepseach year, reaching 3 percent by year seven; subse-quently, it reverts to a market rate of % over LIBORuntil maturity. There is no principal guarantee, but thebond has a 12-month rolling interest guarantee at 2.6percent (for the seven years of interest reduction), cap-italizing earned income until it reaches 3 percent.Equal amortization payments are due semiannually.Special issues of discount and FLIRB bonds will bemade to cover 30 percent of the short-term debt allo-cated to the different options. These bonds carry aninterest rate 1/2 of 1 percent higher than that on bondsexchanged for medium- and long-term debt. Somedebt reduction on past due interest is achieved througha lowering of the interest rate for capitalization pur-poses. The package also includes a value recoveryclause on the discount bonds linked to the overall per-formance of the Bulgarian economy.
The term sheet limited the allocation for the FLIRBsto 30 percent. Rebalancing was not needed by the com-mitment date (May 18, 1994), since the allocation was
7
©International Monetary Fund. Not for Redistribution

COMMERCIAL BANK DEBT RESTRUCTURING
Table 3. Buy-Back Equivalent Prices in Debt- and Debt-Service-Reduction Operations1
(In percent of face value)
ArgentinaBrazilBulgariaCosta Rica2
Dominican Republic
EcuadorJordanMexico2
Nigeria2
Philippines (1989)
Philippines (1992)PolandUruguay2
Venezuela2
Total4
Debt
Buy-back
251625
39
4050
52415645
41
ReductionDiscountexchange
252618—28
192533——
14—35
27
Debt-Service Reduction
Principalcollateralized
parexchange
3236—
—
29413936—
45224538
36
Other parexchanges
198
2 9 3
—
—
—
28——25
21
Overallpackage
3030181826
2435363950
48255338
33
SecondaryMarket Price
at Time ofAgreementin Principle
3735271923
2339444050
53395446
37
Source: IMF staff estimates.'The buy-back equivalent price for a debt exchange is the total value of enhancements as a proportion of the total reduction in claims
payable to banks, including effective prepayments through collateralization, evaluated at prevailing interest rates at time of agreement inprinciple. This is the price at which the debt reduction achieved through a debt exchange is equivalent to the debt reduction under a buy-backat this price.
2The calculations include estimates of value recovery clauses.3Weighted average of the buy-back equivalent price of the series A par bond (33 cents), the series B par bond (0 cents), and the series A
past due interest bond (119 cents).4Weighted average.
(1) 60 percent for the discount bond; (2) 27 percent forthe FLIRB; and (3) 13 percent for the buy-back. Inter-est arrears estimated at about $1.9 billion wereincluded in the operation. A cash payment of 3 percentwas made, with remaining amounts (other thanamounts purchased in connection with the buy-backoption) rescheduled in the form of a 17-year uncollat-eralized bond bearing a market interest rate of % overLIBOR and a grace period of seven years. Amortiza-tion is in semiannual installments on a back-loadedschedule. The cost of the operation was $716 million,which was initially financed by the country's ownresources. However, after the closing of the operation,Bulgaria requested and received additional financialassistance from the Fund and the World Bank in sup-port of the debt- and debt-service-reduction operation.
On February 14, 1994, the Dominican Republic for-mally signed an agreement to restructure $1.1 billionof its commercial bank debt, including interest arrearsof $320 million. The operation closed on August 31,1994. After an initial allocation failed to provide the 50percent debt reduction included in the term sheet, cred-itors were asked to rebalance their commitments. Thefinal allocation on eligible principal was 65 percent tothe discount exchange, 35 percent to the buy-back, andno allocation to the FLIRB. The up-front cost of the
operation was about $190 million, financed entirely bythe country's own resources.
A highly innovative and somewhat controversialagreement in principle was reached between Polandand its bank advisory committee on March 10, 1994.The larger-than-anticipated debt reduction entailed inthe agreement produced a significant decline in theprice of Polish debt in the secondary market after theannouncement. The agreement restructured $12.7 bil-lion, comprising virtually all of Poland's outstandingcommercial bank debt. A term sheet was distributed tobanks on May 23, 1994, and commitments were dueon June 29, 1994. That date was subsequentlyextended to improve chances that approval of a waiverfor a buy-back would be received from creditors hold-ing 95 percent of the debt. That figure was achieved,and the deal was completed on October 27, 1994. Eli-gible principal amounted to $9.9 billion, of which $1.1billion was short term. The menu for eligible principalincluded six options, four for medium- and long-termdebt and two for short-term debt. The options formedium- and long-term principal were (1) a buy-backat 41 cents on the dollar per unit of claim; (2) a 45 per-cent discount bond exchange; (3) a below-marketinterest rate par exchange; and (4) a new moneyoption, whereby in exchange for 35 percent of new
8
II
©International Monetary Fund. Not for Redistribution

Overview
money, old claims are rescheduled on somewhat morefavorable terms than in the other options. The optionsfor short-term principal were (1) a buy-back at 38 centson the dollar per unit of claim and (2) a below-marketinterest rate par bond exchange, with an interest rateprofile marginally higher than that for the par bondexchange for medium- and long-term principal.
The discount bond in the Polish package involved a30-year bullet repayment bearing a market interest rateof % over LIBOR. Principal was fully collateralized.The par bond also involved a 30-year bullet repaymentcarrying a prearranged interest rate profile starting at2.75 percent in year one, rising in increments to 5 per-cent in year twenty-one, and remaining at that levelthereafter. The interest rate profile on the short-termpar exchange was somewhat higher, in that the interestrate rises at a somewhat faster rate after year one. Bothpar bonds included full principal collateral. The newmoney option involved the exchange at par of up to 5percent of eligible principal for a debt conversionbond, with the creditor providing $35 in new moneyfor each $100 in debt tendered. The 25-year debt con-version bond had no principal collateral and carried asub-market interest rate starting at 4.5 percent in yearone, increasing to 7.5 percent in year eleven and there-after. This was an innovative feature of the package; inthe past, these types of bonds involved no debt- ordebt- service reduction. This bond has a grace periodof 20 years with equal semiannual amortization pay-ments. The 15-year new money bond also has no prin-cipal collateral. It carries a market rate of % overLIBOR, a grace period of ten years, and an even amor-tization schedule. None of the bonds in the package iscovered by interest guarantees.
Bank creditors allocated their medium- and long-term debt as follows: (1) 24.6 percent to the buy-back;(2) 60.8 percent to the discount exchange; (3) 10.3 per-cent to the par exchange; and (4) 4.4 percent to the newmoney option. Allocation of the short-term debt was asfollows: (1) 26.1 percent to the buy-back and (2) 73.9percent to the par exchange.
In the Polish package, past due interest of $3.5 bil-lion was effectively subject to debt and debt-servicereduction. Debt reduction of about 15 percent wasobtained by reducing the capitalization rate on interestarrears. Debt-service reduction was also obtainedthrough a below-market interest rate for the associatedbond. In theory, there were five modalities for dealingwith past due interest, two for interest arrears on short-term principal and three for interest arrears onmedium- and long-term principal. The options forshort-term interest arrears are exactly the same as theoptions for short-term principal. The three options forinterest arrears on medium- and long-term principalincluded (1) a cash payment corresponding to 85 per-cent of interest due in December 1989 to regularizeprevious anomalies and catch up on payments of inter-est due on medium- and long-term principal accruingsince May 1993 (about $160 million); (2) a buy-back
at the same price as medium- and long-term principal;and (3) a bond covering past due interest at below-market rates. The latter bond has a 20-year term and isuncollateralized; it carries an interest rate that starts at3.25 in year one and rises to 7 percent in year nine andthereafter. The amortization schedule on these bondsprovides for eight years grace followed by back-loadedsemiannual payments. Starting in March 1994, partialinterest payments on medium- and long-term principalwere increased to 30 percent of interest due. The finalagreement did not include a rebalancing clause, exceptfor the limit of 5 percent of eligible principal on thenew money option and an undetermined maximum onthe buy-back in the event that insufficient financingwas available. There was no currency option or valuerecovery clause. Implementation of a debt-conversionprogram is expected. The cost of the operation was$2.1 billion, financed with resources from the Fund,the World Bank, the new money option, and Poland'sown contribution.
Ecuador reached an agreement in principle with itsbank advisory committee on May 2, 1994, to restruc-ture debt amounting to $7.4 billion. A termsheet wascirculated to banks on June 14, 1994. The menu ofoptions for eligible principal, amounting to $4.5 bil-lion, includes (1) a 45 percent discount exchange; and(2) a par exchange at a submarket interest rate. The dis-count bond has a 30-year term with a bullet repayment;it bears a market interest rate of % over LIBOR andincludes full principal collateral and a 12-monthrolling interest guarantee at 7 percent. The par bondalso involves a 30-year bullet repayment; it bears apredetermined below-market interest rate profile start-ing at 3 percent in year one, increasing to 5 percent byyear eleven, and remaining at that rate for the balanceof the bond's maturity. As with the discount bond, theprincipal of the par bond is fully collateralized, but the12-month interest guarantee was fixed at 3.75 percentin year one, with income earnings capitalizing until 5percent is achieved. The termsheet does not includeany mandatory allocation or rebalancing clauses. Italso does not include a currency option or a valuerecovery clause. Creditors have chosen to allocate 58percent of their exposure to the discount exchange and42 percent to the par exchange.
Interest arrears on Ecuador's bank debt is estimatedat $2.9 billion. Implicitly, this estimate involves somedebt forgiveness, because past due interest is calcu-lated from the end of October 1986 to the end ofDecember 1993 at three-month LIBOR plus 13/1instead of the interest rates on the original loan agree-ments.8 From January 1994 through the closing date,interest will accrue at a 4 percent fixed rate. The agree-ment calls for interest arrears to be treated separatelythrough (1) a cash payment of $75 million; (2)issuance of a 10-year uncollateralized interest equal-
8Original contractual interest rates on Ecuador's debt were gen-erally higher, with some loans priced at LIBOR plus 2%.
9
©International Monetary Fund. Not for Redistribution

II COMMERCIAL BANK DEBT RESTRUCTURING
ization bond for $191 million to regularize previousdiscriminatory payments to creditors; and (3) a 20-yearuncollateralized past due interest bond bearing a mar-ket interest rate of % over LIBOR and a ten-year graceperiod. The amortization schedule on the latter bondconsists of back-loaded semiannual payments. ThePDI bond also introduces the innovation of having theoption to capitalize a declining fraction of interest duein the first six years. Partial interest payments wereresumed in May 1994 at a rate of $5 million a month(retroactive to January 1994). The up-front cost of theoperation has been estimated at about $658 million.Financing is expected to come from the Fund, theWorld Bank, official bilateral sources, and the coun-try's own resources. The deal is scheduled to close inDecember 1994.
Sao Tome and Principe concluded a comprehensivebuy-back of commercial bank debt covering $10.1 mil-lion of claims (about 87 percent of eligible debt) at 10cents on the dollar in August 1994. The $1.0 millioncost of the buy-back was entirely financed by the DebtReduction Facility for IDA countries.
Zambia completed a comprehensive buy-back at 11cents per dollar of principal and past due interest intwo transactions, the first on July 26, and the secondon September 14, 1994. Eligible principal coveredamounted to about $200 million (about 79 percent ofeligible debt) and included commercial bank debt, aswell as trade and supplier credits. The cost of the oper-ation thus far has been roughly $25 million, financedby a $13 million grant from the debt reduction facilityfor IDA countries and grants from Germany, theNetherlands, Sweden, and Switzerland. Further buy-backs could take place by the end of 1994, which is theexpiry date for Zambia's grant facility to finance theoperation. An innovation in this buy-back operation isthat, due to initially low levels of creditor participation,the operation has taken place in several tranches,instead of the usual single transaction.
South Africa agreed on a fourth and final reschedul-ing arrangement with its commercial banks at the endof September 1993. The arrangement, which becameeffective at the beginning of 1994, rescheduled thosedebts (some $5 billion) that were still subject to the"standstill" on repayments imposed in 1985. Thearrangement involved a cash payment of 10 percent ofoutstanding debt, with the remainder being resched-uled for eight years on a graduated schedule. Interestmargins were to be negotiated between South Africandebtors and foreign creditors, with margins in excessof 2.5 percent over the relevant base rate requiringapproval by the authorities under exchange controlarrangements.
A rescheduling agreement between Gabon and itscommercial bank creditors was signed on May 26,1994 and became effective on July 1, 1994. The agree-ment covers the principal on debts contracted beforeSeptember 1986 (which amounts to $100 million).These debts are rescheduled for ten years with 2 1/2 years
of grace. Interest arrears accumulated since 1986 (esti-mated at $50 million) were also rescheduled but atshorter maturities. This operation covered most of thecountry's commercial bank debt.
On July 30, 1993, a preliminary rescheduling agree-ment was reached between Russia and its bank credi-tors. This agreement rescheduled the entire stock ofpre-cutoff date debt with a ten-year maturity and afive-year grace period. Russia agreed to pay $500 mil-lion toward interest accrued but unpaid through the endof 1993. Remaining interest arrears were expected tobe rescheduled on the same terms as pre-cutoff dateprincipal. In the event, Russia did not make paymentson interest, and the agreement did not come into effect.Major stumbling blocks included the Russian authori-ties' refusal to waive sovereign immunity and ques-tions regarding which official Russian agency shouldsign the agreement. These issues were finally resolvedin October 1994, and the agreement was scheduled tocome into effect by the end of 1994, following Russianpayment of $500 million on past due interest in 1993,as was previously agreed.
Debt-Conversion ActivityAfter reaching a peak in 1990, debt conversions fell
over the last three years. In 1993, debt conversionswere at their lowest level since the outbreak of the debtcrisis over a decade ago (Table 4). High debt prices inthe secondary market, regularization of relations withcommercial bank creditors, and advances alreadymade in most privatization programs were responsiblefor declining conversion activity.
Argentina, which accounted for two thirds of con-version activity in 1992, shifted its privatization pro-gram to encourage exchanges involving foreigncurrency denominated domestic debt. With buoyantequity markets worldwide, Argentina also elected toprivatize part of the state oil company, YacimientosPetroliferos Fiscales (YPF), through an internationalshare placement, rather than by means of conversionsmade with commercial bank debt. Despite these devel-opments, Argentina still accounted for about one fourthof total bank debt conversions in 1993. While involv-ing only small amounts, debt conversions more thandoubled in Brazil during 1993, reflecting some pickupin interest by foreign investors in the country's privati-zation program. Debt conversion activity in Chile fellby one fourth during 1993, with the high price of com-mercial bank debt in the secondary market continuingto curtail demand for debt conversions under the for-mal mechanisms. All conversion activity took placethrough "informal" schemes, under which residentsretire their debt to the Central Bank by delivery ofChilean debt acquired in the secondary market.
Among other countries, conversions in the Philip-pines declined by about 15 percent as investors' inter-est dropped and debt prices edged up. Activity wasnegligible in Mexico and Nigeria owing to the suspen-
10
©International Monetary Fund. Not for Redistribution

Secondary Market Developments
Table 4. Debt(In millions of U.S.
ArgentinaBrazilChileCosta RicaEcuador
HondurasJamaicaMexicoNigeriaPhilippines
TanzaniaUruguayVenezuelaYugoslavia
Total
Conversions1
dollars)
1987
3361,979
89127
91
1,680
450
__———
4,671
1988
1,1462,0962,940
44261
149
l,0563
40931
_
6050
135
8,782
1989
1,534946
2,76712432
3523
532257630
_
27544
1,369
8,820
1990
6,464283
1,0961745
3322
221217378
114
595681
10,067
1991
13268
8282
20
5236
1,956119489
2144
343631
4,741
1992
2,8252
95385—50
3914
344122379
3334
148
4,468
1993
371219298—
2
_
3—35
349
524887
1,464
First Quarter1994
530
2——
——
—
37
Sources: Central Bank of Argentina; Central Bank of Brazil; Central Bank of Chile; Ministry of Finance of Mexico; Central Bank of thePhilippines; Bank of Jamaica; Central Bank of Venezuela; and IMF staff estimates.
'Face value of debt converted under official ongoing schemes. Figures do not include large-scale, one-off cash buy-backs and debtexchanges.
2Excludes $0.3 billion from the privatization of the state power company deposited in a trust fund for later debt conversion as well as $0.5billion in foreign currency bonds of the Argentine Government (BOCONES) retired with the privatization of the state gas and power companies.
3Does not include an estimated $6-8 billion related to payment at a discount of private-sector debt following the August 1987 signing ofan agreement to restructure debt of the foreign exchange risk coverage trust fund (FICORCA).
sion of conversion programs. In Venezuela, politicaland financial uncertainties were factors behind a fur-ther reduction in conversion activity in 1993.
Secondary Market Developments
After remaining stable in the first quarter of 1993,secondary market prices for bank claims and Bradybonds rose sharply later in the year and into early 1994(Chart 3). The weighted average of prices for claims on15 heavily indebted countries peaked in January 1994at about 70 cents on the dollar (compared with 51 centsin December 1992), its highest level in the last sevenyears. The strength in secondary market pricesreflected improving economic situations in majordeveloping countries and greater investor interest inemerging market securities. Subsequently, prices fellsharply in response to higher interest rates in the UnitedStates and market reactions to adverse economic andpolitical developments in some major countries. More-over, during the 1993 run-up in prices, some investorgroups built up some highly leveraged positions; theirsubsequent need to unwind these positions added to thedrop in debt prices during the first half of the year. Bythe end of June 1994, the weighted average price forthe 15 countries had fallen to 58 cents on the dollar.
The stripped price of Argentina's restructured bankclaims rose by 82 percent in 1993, reaching about 80
cents on the dollar by the end of the year.9 Completionof the debt- and debt-service-reduction operation, goodeconomic prospects, the privatization of the largestpublic enterprise (YPF), and Congressional approvalof the social security reform accounted for the solidperformance of Argentine debt prices. By the end ofJune 1994, the price of Argentine claims had declinedin line with overall market developments to 62 centson the dollar.
Following market trends, the price of claims onBrazil also performed well in 1993. Debt pricesclimbed by 62 percent in 1993, reaching about 50 centson the dollar by the end of the year, despite politicaluncertainties and difficulties in completing the debtdeal. By the end of June 1994, the price of Brazilianclaims had fallen back to 41 cents on the dollar. InMexico, while the stripped price of its claims did notchange much over the first three quarters of 1993,prices jumped in the last quarter by about one third fol-lowing the approval of the North American Free TradeAgreement. By year end, Mexican Brady bonds weretrading at almost 90 cents on the dollar. Concernsresulting from an uprising in Chiapas and the assassi-nation of the leading presidential candidate, togetherwith the tightening of monetary policy in the United
9The stripped price is a measure of country risk. It is the ratio ofthe market value of unguaranteed payments to the present value ofsuch payments discounted at a risk-free interest rate.
11
©International Monetary Fund. Not for Redistribution

II COMMERCIAL BANK DEBT RESTRUCTURING
Chart 3. Secondary Market Prices of Bank Claimson Selected Countries(In percent of face value)
Sources: Salomon Brothers; and ANZ Grindlays Bank.
States, led by June 1994 to a decline in the strippedprice of Mexican bonds to 73 cents. The stripped priceson Venezuela's debt increased by about one fourth toreach about 69 cents on the dollar at the end of 1993,despite political uncertainties. Concerns about thehealth of the banking system in the wake of the failureof a major bank and more generally about the country'seconomy, contributed to a sharp decline in Venezuelanclaims in the first half of 1994. By June, they hadfallen to 42 cents on the dollar.
In 1993 and early 1994, considerable price specula-tion accompanied reports that various countries weremaking progress in their discussions with commercial
banks on restructuring agreements. In the case ofEcuador, the price of its debt (including past due inter-est) increased by 84 percent in 1993 to reach a level ofabout 53 cents on the dollar at the end of the year. ForPeru, expectations of a debt-conversion programlinked to privatization ran prices up sharply; the priceof Peruvian claims (including past due interest) rose byabout 250 percent in 1993 and closed the year at 69cents on the dollar. In both cases, prices slid in the firsthalf of 1994, falling to 40 cents and 48 cents, respec-tively, by the end of June.
Price developments on Eastern European countries'debt resembled the behavior of debt prices for otherindebted countries. Prices of claims on Eastern Euro-pean countries increased by about 150 percent to reachalmost 50 cents on the dollar by the end of 1993,before declining by one third in the first half of 1994.The announcement of Bulgaria`s agreement in princi-ple with commercial banks in November 1993 pro-duced a 50 percent increase in the price of its claims toabout 44 cents on the dollar; it fell to 33 cents by theend of June 1994. Expectations of a bank debt agree-ment for Poland contributed to a rise in the price ofPolish debt, which peaked at 51 cents on the dollar inJanuary 1994. It then dropped in line with the generalfall in debt prices; the decline accelerated followingthe announcement of the restructuring agreement inMarch 1994. After falling to 32 cents, it recovered to35 cents by the end of June.
There were indications of significant growth in thevolume of debt instruments trading in the secondarymarket during 1993. These instruments continue to berelatively liquid, as reflected in relatively tight bid-askspreads. Market analysts estimate that trading volumereached nearly $2 trillion in 1993.10 For short periodsof time during the turbulence in bond markets duringthe first half of 1994, however, trading was reported tohave slowed appreciably, with bid-ask spreads widen-ing and dealers at times being reluctant to quote prices.
10The Emerging Markets Traders Association (EMTA) estimatedvolume at $733.7 billion in 1992. EMTA is planning to implementa computerized trade-clearing system to verify bond and loantrades. The system is expected to be in place by January 1995 andwill provide uniform pricing as well as daily volume information,thus reducing transaction costs, contentious trade disputes, and thepossibility of error arising from manual processing.
12
©International Monetary Fund. Not for Redistribution

IllRecent Developments in Private MarketFinancing
rivate market financial flows to developing coun-tries increased significantly in 1992 and 1993
(Chart 4). Bond and equity flows accounted for muchof the increase. The rapid expansion was mirrored in abroadening of the range of developing country borrow-ers attracting international investors, although portfolioflows continued to be concentrated in a few key coun-tries in Asia and Latin America. In contrast, medium-and long-term bank lending to developing countriesremained moderate; banks did demonstrate renewedinterest in such lending, but on a highly selective basis.
In 1994, the situation changed dramatically. Withhigher U.S. interest rates, as well as unfavorable eco-nomic and political developments in some major bor-rowing countries, bond and equity issuance bydeveloping countries plummeted between Februaryand April 1994. A modest recovery came in the follow-ing months, but new flows remained vulnerable, espe-cially because of the uncertain course of U.S. interestrates. Despite the market correction, however, portfo-lio flows to developing countries in the first half of1994 were still significantly higher than levelsrecorded in the early 1990s.
Bonds
country bond placements also increased from $111million in 1992 to $125 million in the first half of1993, and to $135 million in the second half of theyear. In particular, there were a number of sizableissues by borrowers in Latin America.
In the first half of 1994, volatile market conditionsled to a sharp decline in the volume of internationalbond issuance by developing countries. Bonds worth$26.1 billion were issued, most in the beginning of theyear and in June. Beginning in February, as bondyields rose throughout the world, both issuers andinvestors pulled back. For the first half of 1994 as awhole, the developing country share of total interna-tional bond issues fell to 12 percent. The decline wasparticularly notable for countries in Europe and LatinAmerica.
The terms on new issues for many developing coun-try borrowers improved throughout 1993 and into early1994. The average yield spread fell from 288 basispoints in the first quarter of 1993 to a low of 187 basis
Chart 4. Private Market Financing to DevelopingCountries(In millions of U.S. dollars)
Bond placements by developing country borrowersreached $59.4 billion in 1993, more than twice theamount placed in 1992 (Tables 5 and A5).11 There wasa strong acceleration in bond issuance in the final quar-ter of 1993; bonds issued in that quarter amounted to$23.7 billion, almost equal to total issuance activity in1992. This surge reflected a decline in U.S. interestrates combined with relatively high returns in emerg-ing markets. Both factors encouraged a broader rangeof mainstream institutional investors to participatemore actively in these markets. The continued imple-mentation of prudent macroeconomic policies andstructural adjustments in borrowing countries alsoimproved investors' confidence. In relative terms,developing countries continued to increase their shareof total international bond issuance from 7.1 percent in1992 to 12.4 percent in 1993, and to 20.1 percent in thefourth quarter of 1993. The average size of developing
"Includes reported private placements and notes issued underthe Euro-medium-term note programs. The figures differ fromOECD estimates, which have a narrower coverage.
Sources: International Financing Review; OECD; and IMF staffestimates.
1Medium- and long-term bank loan commitments only.
13
P
©International Monetary Fund. Not for Redistribution

RECENT DEVELOPMENTS IN PRIVATE MARKET FINANCING
Chart 5. Yield Spreads at Launch for Unenhanced Chart 6. Secondary Market Yield Spreads on U.S.Bond Issues by Developing Countries1 Dollar Denominated Bonds by Selected Developing(In basis points) Countries
(In basis points)
Sources: International Financing Review; and Financial Times.1Reflect weighted averages.
points in the first quarter of 1994 (Chart 5).12 The aver-age spread widened sharply in the second quarter of1994 to 259 basis points. This increase occurreddespite the fact that bonds during this period wereissued primarily by borrowers with higher credit rat-ings and carried shorter maturities. The weighted aver-age maturity of bonds issued shortened to 6.3 years inthe first half of 1994, after lengthening from 5.4 yearsin the first quarter of 1993 to 7.2 years in the finalquarter of the year. Yield spreads in the secondary mar-ket for developing country bonds followed a similarpattern; notable increases were observed for bondsissued by Argentina, Brazil, Hungary, Mexico, Turkey,and Venezuela (Chart 6). A tightening of market condi-tions was also reflected in a sharp decline in secondarymarket prices for Brady bonds.
Yield spreads continued to vary considerably amongcountries. While borrowers without records of debt-servicing difficulties commanded lower spreads, mar-ket re-entrants were typically faced with spreads ofover 200 basis points in 1993 and the first half of 1994.Moreover, the spread for public sector borrowers con-tinued to be substantially lower than that for privatesector borrowers (Table A6). Reflecting the uncertainpath of U.S. interest rates, there was also renewedinterest in new issues bearing floating rates. In the first
12 throughout this chapter, yield spreads refer to the differencebetween the yield on a bond at the time of issuance and the yield onU.S. Treasury securities of comparable maturity or other compara-ble government securities if the bond is issued in other currencies.The U.S. Treasury security and other comparable governmentsecurities are used as a proxy for a risk-free return.
Source: Reuters.
half of 1994, floating rate notes accounted for some 20percent of total new issues, up from 8 percent in 1993.
Most of the recent bond issuance by developingcountries represents net capital inflows. Maturingdeveloping country bonds amounted to only $6.3 bil-lion in the period from 1991 to 1993, compared withtotal bond issues worth $96 billion. As of the end ofJune 1994, the total outstanding stock of internationalbonds issued by developing countries is estimated tostand at $117.5 billion, 42 percent of which wasaccounted for by private sector borrowers. Amortiza-tion payments on this stock of debt will rise sharply inthe next few years from an estimated $7.1 billion in1994 to a peak of $21 billion in 1998, as bullet repay-ments on bonds placed in the early 1990s fall due(Table A7).13 Payments are particularly concentrated ina few Western Hemisphere and Asian countries.
Although the range of borrowers continued to widenin 1993, developing country bond issuers remainedconcentrated in a few countries in Latin America, Asia,
13These estimates can vary somewhat depending upon whetherbondholders decide to take early redemption options for somebonds.
14
III
©International Monetary Fund. Not for Redistribution

Bonds
Table 5. International Bond Issues by Developing Countries and Regions1
(In millions of U.S. dollars)
Developing countries
AfricaCongoSouth AfricaTunisia
AsiaChinaHong KongIndiaIndonesiaKoreaMacaoMalaysiaPakistanPhilippinesSingaporeTaiwan Province of ChinaThailand
EuropeCzech RepublicCzechoslovakia, formerHungarySlovak RepublicTurkey
Middle EastIsrael
Western HemisphereArgentinaBarbadosBoliviaBrazilChileColombiaCosta RicaGuatemalaMexicoPanamaPeruTrinidad and TobagoUruguayVenezuela
Memorandum itemsIssues under EMTN programs
ArgentinaBoliviaBrazilColombiaKoreaMexicoPhilippinesThailandVenezuela
Total bond issues ininternational bond markets
Shares of developing countriesin global issuance
1991
12,838
236—
236—
3,000115100227369
2,012
————
16017
1,960—
2771,186
—497
400400
7,242795
——
1,837200
—3,782
50——
578
375———
375—
—
297,588
4.3
1992
23,780
725—
725—
5,9171,359
185
4943,208
————60
610
4,561—
1291,242
—3,190
—
12,5771,570
——
3,655120
—6,100
100100932
1,21540
110
665—
400
333,694
7.1
1993
59,437
—
—
20,4013,0475,887
546485
5,864
954—
1,293—79
2,247
9,638697
—4,796
2403,9052,0022,002
27,3966,233
——
6,679433566
6010,783
30125140
2,348
3,713930
422100177
1,741150194—
480,997
12.4
I
10,109
—
—
2,230406657
30671
——
170——
296
2,863375—
1,363—
1,1251,0001,0004,017
335——
1,327—
—2,205
———
150
607—
62
545—
—
139,867
7.2
1993II
12,117
—
—
3,200651
—
—1,343
500—
175—36
495
1,257——
279—
978
—
7,559606
——
1,635333325
—4,136
——
140385
39350
110509390—
—
107,050
(In percent)
11.3
III
13,492
—
—
3,4811,209
69265—
725
——
190—43
557
1,988322—
1,280240145
1,0021,0027,0221,852
——
1,583—50
601,851
———
1,626
1,439450
10050
646—
194—
116,253
11.6
IV
23,719
—
—
11,391681
4,538481455
3,125
454—
758——
899
3,530——
1,873—
1,657
—
8,7983,440
• —
—
2,134100191
—2,591
3025—
187
1,274430
—150
84460150
—
117,827
20.1
I
17,668
877600
277
7,6451,5001,305
439699
1,273
230—
154—
3181,728
875——6921
785
1,9581,9586,3131,460
—10
1,095—
25050—
3,307
40—
100—
384—1035
189150———
139,820
12.6
1994II
8,443
_—
—
5,465872550195750580155735
45555
86558384
439250
—189——
—
2,539907
20—
100—83
—1,390
40———
695300
——
—395———
77,881
10.8
Sources: IMF staff estimates based on Euroweek, Financial Times, International Financing Review, Financial Market Trends, FinancialStatistics Monthly, and Organization for Economic Cooperation and Development.
'Including note issues under Euro medium-term notes (EMTN) programs.
15
©International Monetary Fund. Not for Redistribution

RECENT DEVELOPMENTS IN PRIVATE MARKET FINANCING
and Europe. Latin American borrowers had the largestshare until they were surpassed by Asian borrowers inthe final quarter of 1993. Bond issues by Latin Ameri-can borrowers doubled to $27.4 billion in 1993,accounting for 46 percent of total issues by developingcountries. That figure declined in the first half of 1994to $8.9 billion, or 34 percent of total issues by devel-oping countries.
Mexico continued to be the leading borrower, rais-ing $10.8 billion in 1993 and $4.7 billion in the firsthalf of 1994. An increasing number of companiesplaced bonds, including several private and publicbanks. Moreover, a few firms floated quite sizableindividual issues during this period, including $1 bil-lion issues by CEMEX (Mexico's largest cement pro-ducer) in May 1993 and BANCOMEXT in January 1994.Mexican entities also opened up new currency sectors,with Mexico's launching of Latin America's first"Samurai" issue since the debt crisis, BANAMEX issuinga Mexican peso-denominated Eurobond, and NAFINSA(a Mexican development bank) placing a "Dragon"bond, marking the first time that a Latin Americannoninvestment grade borrower has been able to issuein that market.
Borrowers in Argentina quadrupled their bond issuesto $6.2 billion in 1993 and raised $2.4 billion in thefirst half of 1994. There were a number of new devel-opments. A $1 billion global sovereign bond wasissued in December 1993 at a spread of 280 basispoints, the first global bond ever issued by a develop-ing country borrower.14 In addition, the first significantconvertible bond by a private telephone companybased in a developing country was placed in March1994. Brazil also increased its bond issuance signifi-cantly in 1993, notwithstanding continued uncertaintyabout the course of its economic policies. All Brazilianbonds were issued by nonsovereign borrowers andincluded the first Euro-yen issue by a Latin Americanentity at a spread of 416 basis points. Venezuelan enti-ties also increased their borrowing activity in 1993;among others, a $1 billion bond was issued by PDVAmerica (a state oil company) at a spread of 210-218basis points, and the first intraregional bond was issuedsimultaneously in Colombia and Luxembourg. Mainlyreflecting the concerns of investors about the country'seconomic situation; however, no international bondswere placed by Venezuelan borrowers during the firsthalf of 1994.
In general, the range of Latin American borrowers inthe international bond market continued to broaden.Colombia, Guatemala, and Peru, and more recently
14Global bonds are issued simultaneously in several major inter-national markets and allow issuers to tap into broader demand andobtain lower rates than those available in a single market. Somemarket participants estimated that Argentina was able to reduce theinterest rate on the funds raised through the global issue by asmuch as 30 basis points.
Barbados, Bolivia, and Costa Rica, tapped the marketfor the first time in many years. Spreads ranged from215 basis points for Colombia to over 700 basis pointsfor Peru. At the same time, recent market re-entrantssuch as Chile, Trinidad and Tobago, and Uruguaymaintained their presence in the market.
Asian borrowers tripled their international bondissues to $20.4 billion in 1993. They also raised $13billion through this channel in the first half of 1994,despite overall market turbulence. As a result, theirshare in the total bond issues by developing countriesrose from 34 percent in 1993 to 50 percent in the firsthalf of 1994. The stock market booms in the region in1993 also led to a strong increase in convertible bondissues; of total bonds issued, the share of convertiblesrose from 18 percent in 1992 to 30 percent in 1993before falling in the first half of 1994. Hong Kongemerged as the leading borrower in Asia, followed byKorea. Together, these two countries accounted formore than half of the bonds placed by Asian entities in1993. The People's Republic of China also signifi-cantly increased its recourse to the international bondmarket. To facilitate market entry for Chinese enter-prises, after a six-year absence, the Governmententered the market directly in 1993 and placed threeissues intended to establish a benchmark for Chinarisk. In February 1994, the Government issued a 10-year, $1 billion global bond, which was priced at an 85basis point spread; the issue was predominantly pur-chased by U.S. investors. In 1993, India, Malaysia, andthe Philippines also tapped the international bond mar-ket for the first time in several years. Pakistan andMacao entered the market in the first half of 1994.Concerned about the country's overall debt profile,however, the Indian authorities moved in May 1994 torestrict convertible bond issues, except for companiesusing proceeds to restructure existing external debt.
European developing countries continued to step uptheir recourse to the international bond market in 1993,where they raised $9.6 billion. In the first half of 1994,however, bond issuance activity dropped dramatically,largely reflecting reduced placements by Hungary andTurkey. With increasing market concerns about eco-nomic conditions in these two countries, bond issuesby Hungary fell from $4.8 billion in 1993 to less than$0.3 billion in the first half of 1994, while issues byTurkey declined from $3.9 billion to $0.8 billion. TheCzech Republic and the Slovak Republic maintainedaccess to the market in the first half of 1994.
In the rest of the developing countries, only a hand-ful of borrowers have tapped the international bondmarket. Israel raised $2 billion in 1993 and another$2 billion in the first half of 1994 on exceptionallyfavorable terms because of guarantees provided by theU.S. Agency for International Development. In Africa,the Congo launched a $600 million ten-year bond, withinterest payments secured by oil receivables and prin-cipal collateralized by U.S. Treasury bonds. In addi-
16
©International Monetary Fund. Not for Redistribution
III

Bond Pricing
tion, the Central Bank of Tunisia issued the first Samu-rai bond by an African country; the bond was launchedwith a spread of 221 basis points above the yield of arisk-free yen bond of comparable maturity.
Among developing country bond issuers, privatesector borrowers scaled back their internationalissuance activity in the first half of 1994, following thedoubling in volume that occurred in 1993. As a result,their share in total bonds issued by developing countryborrowers declined from 45 percent in 1993 to 26 per-cent in the first half of 1994. The lower issuance activ-ity was partly due to the sharp contraction inconvertible bond issues by entities in Hong Kong,which were adversely affected by a decline in stockprices. Bond issues by sovereign borrowers, whichtripled in 1993, declined in the first half of 1994, buttheir share of total bond issues rose from 27 percent to50 percent. Lower issuance by sovereign borrowerswas mainly accounted for by Hungary and Turkey.
Most bonds issued by developing countries contin-ued to be denominated in U.S. dollars, yen, anddeutsche mark. Bond issues in U.S. dollars accountedfor 74 percent of the total in 1993 and 81 percent in thefirst half of 1994 (Table A8). This high share partlyreflected both the greater appetite of U.S. investors forhigh-yielding, subinvestment grade securities and theimpact of relatively low U.S. interest rates. Also facili-tating bond issues in the U.S. market is Rule 144a,which exempts private placements from the disclosurerequirements of the Securities and Exchange Commis-sion (SEC) and permits qualified institutional buyers totrade privately placed securities without waiting theusually stipulated two-year holding period. In 1993,several borrowers in Hungary, Korea, and Mexicotapped the Yankee bond market for the first time.15
While the yen sector remained the second largest cur-rency sector for bonds issued by developing countryborrowers, its share declined from 13 percent in 1993to 10 percent in the first half of 1994. Deutsche markbond issues, principally by European and Latin Amer-ican borrowers, were subdued in 1993 and in the firsthalf of 1994.
Following the market turbulence in early 1994,developing country borrowers increased the use ofcredit enhancement techniques, such as bond-equityconversion options, collateralization, and put options(Table A9). The most widely used enhancement tech-nique was the bond-equity conversion option, espe-cially in Asia where convertible bonds accounted formore than half of bond issues in the first half of 1994.Put options were the second most widely used tech-nique; Latin American issuers were the principal users,possibly reflecting uncertainties about economicprospects in the region.
The expansion of the investor base was accompa-nied by an increase in the number of countries assignedcredit ratings by major rating agencies (Table 6). Dur-ing 1993 and the first half of 1994, Argentina, thePhilippines, the Slovak Republic, Trinidad andTobago, and Uruguay received initial subinvestment-grade ratings from the major U.S. credit rating agen-cies. Initial investment-grade ratings were alsoassigned to Colombia and Taiwan Province of China.In addition, Chile received an investment-grade ratingfrom Moody's in February 1994, making it the onlyLatin American country to have received such a ratingby the two major U.S. rating agencies. In March 1993,the Czech Republic became the only developing coun-try in Europe with an investment-grade rating, and thisrating subsequently was upgraded in May 1994. Otherinvestment-grade countries receiving upgraded ratingsduring 1993 and the first half of 1994 included Chile,China, Israel, Malaysia, and Singapore. Owing to dete-riorating economic conditions, conversely, Turkey wasdowngraded to a subinvestment grade rating in January1994, and its rating was reduced further a few monthslater. The major rating agencies also downgradedVenezuela in March and April 1994.
Bond Pricing
The rapid increase in the prices of developing coun-try bonds during 1993 raises some questions as towhether the markets were adequately pricing the riskof these securities. Moreover, the markets have attimes appeared to react slowly to changes in economicconditions in a country.16 In pricing bonds, the marketsare reported to use two basic approaches. Risk may bepriced on a relative basis, with bond yields set in rela-tion to some benchmark issue or to the securities ofother issuers judged to be of roughly comparable risk.Alternatively, market participants may attempt directlyto assess risk using a scoring system based on a set ofeconomic and political factors. Such scoring systemsmay vary widely in terms of their level of quantifica-tion, the factors considered, and the relative impor-tance assigned to individual factors over time. Allinvolve a high degree of judgment.
Observers suggest that Mexican bonds are fre-quently used as a benchmark, since Mexico is gener-ally viewed as one of the best credit risks among thosedeveloping countries that previously rescheduled debtsto private foreign creditors. To test this proposition,Granger causality tests were run on daily bond pricesfor sovereign issues by Argentina, Brazil, Hungary,Nigeria, the Philippines, Turkey, and Venezuela. The
15The Yankee bond market is the domestic U.S. market for U.S.dollar-denominated bonds issued by nonresident entities. Yankeeissues are subject to SEC registration and disclosure requirements.
l6Simple auto-regression tests of market efficiency were run onthe prices of U.S. dollar-denominated sovereign bonds ofArgentina, Brazil, Hungary, Mexico, Nigeria, the Philippines,Turkey, and Venezuela. In all cases, these tests suggest that themarkets are inefficient.
17
©International Monetary Fund. Not for Redistribution

RECENT DEVELOPMENTS IN PRIVATE MARKET FINANCING
Table 6. Credit Ratings of Developing Country Borrowers1
Moody'sRating
S&PRating
Recent Changes
Singapore
Taiwan Province of China
Korea
Thailand
Malaysia
Hong Kong
China
Aa2
Aa3
Al
A2
A2
A3
A3
AA+
AA+
A+
A-
A
A
BBB
Chile Baa2
Trinidad and Tobago Ba2
Turkey Ba3
Argentina B1(Par discounts and bonds)
Brazil B2
BBB+
Israel
Czech Republic
Indonesia
India
Colombia
Hungary
Uruguay
NR
Baa2
Baa3
Ba2
Bal
Bal
Bal
BBB+
NR
BBB-
BB+
BBB-
BB+
BB+
NR
Venezuela(Conversion bonds)(Par and discount bonds)
Mexico(Par and discount bonds)
Slovak Republic
Philippines
Ba2Ba2Ba3
Ba2Ba3
NR
Ba3
BB-NRNR
BB+BB+
BB-
B B -
B+
BB-B2
NR
Moody's upgraded rating from Aa3 in May 1994.
Moody's assigned an Aa3 rating in March 1994.
Moody's upgraded rating from A3 in March 1993.
S&P (Standard & Poor's) assigned its BBB rating in February 1992, while Moody'sassigned its rating A3 in September 1993.
Moody's assigned a Baa2 first-time investment rating in February 1994.S&P upgraded from BBB in December 1993.
S&P upgraded sovereign rating from BBB in September 1993.
Moody's upgraded rating from Baa3 in May 1994.
S&P assigned first-time rating in July 1992.
S&P and Moody's assigned first-time ratings in July and August 1993, respectively.
Moody's and S&P assigned ratings in October 1993 and February 1994,respectively.
Moody's assigned first-time rating in February 1993.
S&P downgraded its ratings in March 1994, whileMoody's downgraded its rating in April 1994.
S&P assigned first-time rating in July 1992.
S&P assigned its first-time rating in February 1994.
First-time ratings assigned in July 1993. S&P revised outlook to positive fromstable in October 1994.
S&P and Moody's downgraded the ratings below investment grade in January 1994and March 1994, respectively, and downgraded several more times thereafter.
S&P assigned first-time rating in August 1993.
Sources: Financial Times; International Financing Review; and Salomon Brothers.1Ranked in descending order according to rating. Ratings by Standard and Poor's and Moody's Investor Service. The ratings are ranked
from highest to lowest as follows:
Investment gradeNoninvestment gradeDefault grade
Moody's
Aaa, Aa, A, BaaBa, BCaa, Ca, C, D
S&P
AAA, AA+, AA, AA- A+, A, A-, BBB+, BBB, BBB-BB+, BB, BB-, B+, B, B-CCC+, CCC, CCC-, CC, C
In addition, numbers from 1 (highest) to 3 are often attached to differentiate borrowers within a given grade.
18
III
©International Monetary Fund. Not for Redistribution

Bond Pricing
tests used the price of the Mexican par bond as thebenchmark for Brady bonds and the price of a Mexicannew issue as the benchmark for Eurobonds. The resultssuggest that movements in the price of the Mexican parbond precede price movements in the par bonds ofArgentina, Brazil, and the Philippines (Table A10).The price movements of the Mexican par bond, how-ever, did not precede movements in either the prices ofthe Venezuelan or Nigerian par bonds, a result thatcould reflect country-specific factors.17 Price move-ments in the Mexican Eurobonds were found to pre-cede changes in the prices of most of the Eurobondsissued by the other countries sampled (Table Al l ) .
The pricing of a bond should be in line with that ofother bonds considered by the market as roughly com-parable in terms of risk. The relationship betweenprices on U.S. corporate bonds and on bond issuesfrom developing country sovereign borrowers with thesame credit rating can provide some indication of howthe markets view developing country risk (Chart 7).Deviations in the pricing of the two types of bonds,however, represent either mispricing of the riskiness ofdeveloping country bonds or market perceptions thatsuch bonds are in fact riskier than their U.S. corporatecounterparts (i.e., in the market's view, the rating agen-cies' ratings of developing country bonds are not accu-rate). IMF staff analysis indicates that Mexican andPhilippine par bond prices and Hungarian and TurkishEurobond prices do roughly track the prices of compa-rably rated U.S. corporate bonds, although prices forthe latter two bonds are more volatile.18 Argentinaappears to have undergone a sharp reappraisal by themarket of its creditworthiness in late 1992, and itsyield steadily approached that of the comparable U.S.corporates, until early 1994. In the case of Venezuela,market perceptions of its creditworthiness may haveadjusted much faster than the country's credit rating.The markets appear to have incorporated anotherdowngrading into their pricing of Venezuelan bondsafter the major credit rating agencies placed Venezuelaon a credit watch. The market also appears to considerthe unrated Brazilian and Nigerian par bonds as theequivalent of bonds rated below Caa.
The scoring systems used by market participantsattempt more systematically to consider country-specific factors in bond pricing. Countries are ranked
17In both countries, there was substantial deterioration in economicconditions and some political instability over the period tested.
18Since monthly price indices for subinvestment-grade U.S. cor-porates comprise only bonds with seven-year maturities, the analy-sis was conducted using Brady par bonds for the countries that haveissued these securities. These bonds have remaining maturities of 25years or more. A relatively constant differential between the pricesof Brady bonds and U.S. corporate securities would largely repre-sent a yield curve effect arising from the difference in the maturitiesof these two sets of bonds. For the Eurobonds analyzed, an adjust-ment had to be made to the prices of the developing sovereignbonds to factor in the effect of a declining yield curve as these secu-rities moved closer to maturity.
on the basis of a number of political and economicvariables, and these rankings are used to assess thespread between the yield on a developing country bondand that on a "risk-free" bond. Factors often consid-ered include (1) political conditions (e.g., the govern-ment's commitment to economic reform, its ability toimplement policies, and popular support); (2) macro-economic conditions (especially inflation, growthprospects, and fiscal policy); (3) structural reform; and(4) the country's balance of payments position andprospects. Data for the period 1989 to 1994 generallysupport the view that the market applies an ordinalranking of developing country sovereign bonds in linewith underlying economic fundamentals.19 Among theLatin American Brady par bonds, Mexico carries thelowest spread, followed by Argentina, Venezuela, andBrazil (Chart 8). The markets considered Venezuela abetter risk than Mexico prior to 1991, but since thenVenezuela's spread has increased to approach that ofBrazil. In contrast, the premium above Mexico paid byArgentina has declined steadily. The Philippines hasalso paid a spread higher than Mexico, and Nigeria'sspread has been above that of the Philippines. Overtime, though, the Philippine premium has narrowed,while Nigeria's spread has widened, reflecting differ-ences in the relative economic performance of the twocountries. Data from representative Eurobond issuespresent a more or less similar picture, taking intoaccount the different duration and liquidity characteris-tics of the bonds.20
The movement in the secondary market spreads overtime suggests a rough relationship with a country's rateof inflation and its level of foreign assets, perhapsbecause of the frequency of the availability of thisinformation. For example, a very simple examinationof the data reveals that the steady downward trend inthe spread on Mexican bonds appears to have coin-cided with a period of declining inflation and risingforeign assets (Chart 9). The recent widening of thespread on Venezuela's bonds roughly coincided with adrop in net foreign assets and lagged a deterioration ininflation performance. The spread on Turkish bondsfell to less than 200 basis points by February 1994,before rising precipitously in March 1994; this turn-around took place five months after gross official
19Unpublished work by William Cline at the Institute for Inter-national Economics has found on the basis of pooled cross-sec-tional data that countries that previously restructured bank debt andthose with higher inflation and lower export or per capita GDPgrowth tend to have higher spreads on their new bonds. Prelimi-nary regression analysis by IMF staff relating movements overtime of country bond spreads to various indicators of economicfundamentals, however, did not produce significant results, in partowing to the limited time period for which data are available.
20 A notable exception is the Venezuelan Eurobond. The lack ofresponse in the yield spread for this bond to the deterioration in thecountry's recent economic performance may reflect the fact thatthe issuer of the bond is the state-owned oil company, which maybe considered a better credit risk because of its external assets.
19
©International Monetary Fund. Not for Redistribution

RECENT DEVELOPMENTS IN PRIVATE MARKET FINANCING
Chart 7. Comparison of Yields of Sovereign Bonds with Yields on U.S.Corporate Bonds(In percentage points)
20
III
©International Monetary Fund. Not for Redistribution
Sources: Moody's; Reuters; and Salomon Brothers.1Venezuela placed on watch list by Moody's.2Venezuela downgRADED BY mOODY'S TO BA3.
3Turkey Placed on watch list.
4Turkey downgraded by Moody's to Ba1.5Turkey downgraded by Moody's to Ba3.

Equities
reserves began to fall but roughly coincided with areported surge in inflation (Chart 10). In the case ofHungary, the bond spread fell by roughly 200 basispoints between September and December 1993; it thenbegan to increase in early 1994, as foreign reserveassets declined and inflation turned up.
Equities
In contrast to bonds, the growth of equity place-ments in the international capital market moderated in1993, after expanding sevenfold between 1990 and1992 (Table 7). Issuance activity did pick up, however,in the final quarter of 1993, reflecting buoyant stockmarkets in Asia and Latin America. Internationalequity placements by developing countries increasedby 28 percent to $11.9 billion in 1993, but their sharein total international equity placements declined to 23percent from 41 percent in 1992. In the first half of1994, developing country equity issues declined onlymoderately to $6.9 million from $7.7 billion in the sec-ond half of 1993. The lower issuance activity wasaccompanied by a general decline in share prices inmajor developing country stock markets.
Most international equity placements have beenaccounted for by Latin American and Asian compa-nies. Latin American companies raised $5.7 billion inthe international equity market in 1993 and $2.1 billionin the first half of 1994. Argentina emerged as the lead-ing Latin American issuer, with issues increasing from$0.4 billion in 1992 to $2.8 billion in 1993. Issuesoccurred mainly through the vehicle of Americandepositary receipts (ADRs)21 and were predominantlyaccounted for by the privatization of YacimientosPetroliferos Fiscales (a state-owned oil and gas com-pany) which raised $2.4 billion. Equity issues by Mex-ican companies declined from $3.1 billion in 1992 to$2.5 billion in 1993, partly because of uncertainty overapproval of the North American Free Trade Agree-ment. Following approval, Mexican companies raised$1.7 billion in the final quarter of the year, mainlythrough ADR and global depositary receipt (GDR)programs;22 this included an $822 million GDR offer-ing by Grupo Televisa. Companies in Bolivia, Colom-bia, and Peru entered the market for the first time in1993, together raising $127 million.
Asian companies raised $5.7 billion in 1993 and$3.8 billion in the first half of 1994. In 1993, compa-nies from China were the leading issuers, raising $1.9billion, or double the amount raised in 1992. In addi-tion to "B" shares listed in Shanghai and Shenzhen and
21 An ADR is a U.S. dollar-denominated equity-based instrumentbacked by shares in a foreign company held in trust. ADRs aretraded like the underlying shares of stock on major U.S. exchangesor in the over-the-counter market.
22A GDR is similar to an ADR, but it is issued and traded inter-nationally.
Sources: Reuters; Salomon Brothers; and IMF staff estimates.
reserved for foreign investors, Chinese companies inJuly 1993 began issuing shares listed on the HongKong Stock Exchange, so-called H shares. Other majordevelopments included the first global equity place-ment by a Chinese company in July 1993 that com-bined ADRs and H shares, and the first equityplacement in August 1993 by a private Chinese com-pany on the Hong Kong Stock Exchange. Indian com-panies stepped up equity placements, raising over $1billion in early 1994, compared with $0.3 billion in1993, as they shifted away from convertible bonds totake advantage of the premium provided by a stockmarket boom. In light of the subsequent weakness inmarkets worldwide, however, Indian equity place-ments declined significantly. Indonesian entities, fortheir part, accelerated their equity issuance until March1994, when the authorities moved to stem capitalinflows. During the same period, a company in SriLanka entered the international equity market for thefirst time through GDRs, and entities from Bangladeshtapped the international equity market through smallissues denominated in local currency.
21
Chart 8.Comparision of Sovereign Bond Spreads(In basis points)
©International Monetary Fund. Not for Redistribution

RECENT DEVELOPMENTS IN PRIVATE MARKET FINANCING
Chart 9. Comparison of Movements in Spreads and Economic Variables forMexico and Venezuela
Sources: Reuters; Salomon Brothers; and IMF staff estimates.
22
III
©International Monetary Fund. Not for Redistribution

Equities
Chart 10. Comparison of Movements in Spreads and Economic Variablesfor Hungary and Turkey
Sources: Reuters; Salomon Brothers; and IMF staff estimates.
23
©International Monetary Fund. Not for Redistribution

RECENT DEVELOPMENTS IN PRIVATE MARKET FINANCING
Table 7. International Equity Issues by Developing Countries and Regions(In millions of U.S. dollars)
Developing countries
AfricaGhanaMoroccoSouth Africa
AsiaBangladeshChinaHong KongIndiaIndonesiaKoreaMalaysiaPakistanPhilippinesSingaporeSri LankaTaiwan Province of ChinaThailand
EuropeHungaryPolandTurkey
Middle EastIsrael
Western HemisphereArgentinaBoliviaBrazilChileColombiaMexicoPanamaPeruVenezuela
Total equity issues ininternational equitymarket
Share of developing countriesin global issuance
1991
5,436
143
143
1,022—11
140
167200
—11
159125
—209
9191
—
6060
4,120356
—
3,764
—
15,548
35.0
1992
9,259
270—
270
4,732—
1,0491,250
240262150382
48392272
543145
6733
34
127127
4,063372
133129
3,05888—
283
22,632
40.9
1993
11,865
8—
8—
5,67319
1,9081,264
331604328—
564
613
72466
20217
1184
257257
5,7252,793
10—
27191
2,493
2642
51,654
23.0
I
1,000
_—
—
6533
115374
7428—
—41
—18
22
—
3838
307———
27280
—
4,300
(In
23.3
1993
II
3,200
_
—
84715
343—
67150—
5—
171
7224
2871
20
22
2,3042,095
—114
95
—
8,554
percent)
37.2
III
2,351
_
—
1,244—
550250137263
—
44—
——
—
—
189189
917380
—94
443
—
15,863
14.8
IV
5,312
8
8—
2,927—
900640194200150—
19401
—424
1729
164
88
2,197318
10—6364
1,674
2642
22,937
23.2
I
3,823
_
—
2,313—
36472
1,160342150—
27037—
116
330—
330
44
1,176197
30096
583
—
12,900
29.6
1994
II
3,090
466398
68
1,5283
247—
420—
209—49——
219380
150150
—
2020
927380
—7182
346
48—
15,600
19.8
Sources: IMF staff estimates based on Euroweek, Financial Times, International Financing Review (IFR), and IFR Equibase.
International equity issues by companies in the restof the developing world remained limited, with theexception of Turkey and Ghana. In the first half of1994, a Turkish automobile company (TOFAS) raised$330 million through ADRs and GDRs. Ashanti Gold-fields (a gold-mining company) in Ghana raised $398million through GDRs. Companies from Morocco andPoland entered the market for the first time in 1993with small issues.
Over the past few years, direct equity purchases byinternational investors on local exchanges havebecome another important source of equity inflows forseveral developing countries. Although comprehensivestatistics are not available, fragmentary informationsuggests that the direct purchases of equities have beenquite sizable. In addition, mutual funds have becomeincreasingly important sources of equity flows todeveloping countries. The number of so-called emerg-
24
III
©International Monetary Fund. Not for Redistribution

Commercial Bank Lending
ing market mutual equity funds increased from 91 in1988 to 465 in 1992 and 573 in 1993. Total net assetsin these funds rose from about $6.0 billion in 1988 to$81.5 billion in 1993 (Chart 11 and Table A12).23 Thesignificant rise in the net asset position of emergingmarket mutual funds in 1993 largely reflected a sharprun-up in share prices in developing countries. Theoverall price index compiled by the InternationalFinance Corporation (IFC) for developing countrystocks that foreign investors are allowed to purchase(referred to as the investable index) rose by 75 percentin 1993 (Charts 12 and 13). Share prices in some Asianmarkets more than doubled during that year. Adjustingfor these share-price increases, net purchases of devel-oping country equities by emerging market mutualfunds (including purchases of equities issued in inter-national capital markets) can be approximated.24
Mutual fund purchases of developing country equitiesare estimated to be $12.6 billion in 1993, comparedwith $8.4 billion in 1992 (Table A13). Issuance ofclosed end emerging market mutual funds accountedfor $2.0 billion of the total in 1993 (Table A14).
Despite a sharp drop in stock prices, the number ofemerging market mutual equity funds increased bymore than 90 in the first quarter of 1994, probablyreflecting the time lag involved in establishing thesefunds. The net asset value of all funds increased byabout $9 billion, despite the large decline in shareprices that occurred during that quarter. Data on open-end emerging market mutual funds domiciled outsidethe United States, however, suggest that the growth ofemerging markets funds slowed considerably in thesecond quarter of the year. Issuance of shares in closedend emerging markets mutual funds also declinedsharply from $4.2 billion in the first quarter of 1994 to$0.5 billion in the second quarter.
Mutual funds targeting Asian developing countriesaccounted for over 50 percent of total net assets inemerging market funds during 1993. Although globalmutual funds have recently expanded considerably, itis reported that their investments have also been con-centrated on Asian equities. Mutual funds designatedfor Latin American countries accounted for only 12
23Emerging market mutual funds' investment in developingcountry bonds has been limited. In 1993, net assets of fixed incomefunds amounted to only $8.5 billion. These figures are based oninformation provided by Emerging Market Funds Research, Inc.,and Lipper Analytical Services, Inc. Since funds that have investedless than 60 percent of their portfolio in emerging markets are notincluded, developing country assets purchased by mutual fundsmay be understated. On the other hand, to the extent that emergingmarket mutual funds usually hold part of their assets in cash ordeveloping country assets, the net asset value of these funds mayoverstate actual investment in emerging markets securities.
24Net equity purchases are estimated by deflating changes in thenet assets of each regional fund by the corresponding IFCinvestable share price index. The estimates are subject to a widemargin of error, especially because the country weights used for theIFC's regional and global indices may differ from the country com-position of the equities held by the funds.
Chart 11. Emerging Market Mutual Funds(In billions of U.S. dollars)
Sources: Emerging Market Funds Research, Inc; and LipperAnalytical Services, Inc.
'Net flows to developing countries are estimated by deflatingchanges in net assets of funds by IFC investable share price indices.
percent of the total net assets in emerging marketfunds.
Commercial Bank Lending
Banks began to show a renewed interest in lendingto developing countries in 1993. In contrast to portfo-lio flows, however, the increase in medium- and long-term bank lending was modest. Medium- andlong-term bank commitments to developing countriesincreased by 7 percent to $21 billion during the year(Table A15).25 Banks in general, however, shortenedmaturities, raised spreads, and continued to use a vari-ety of risk-reducing techniques like asset securitiza-
25As the total for 1992 was affected by a large credit to SaudiArabia, the underlying growth was probably higher. The figureexcludes loans guaranteed by export credit agencies.
25
©International Monetary Fund. Not for Redistribution

RECENT DEVELOPMENTS IN PRIVATE MARKET FINANCING
Chart 12. Share Price Indices for Selected Markets In Latin America(IFC Weekly Investable Price Indices, December 1988 = 100; in U.S. dollars)
Source: IFC Emerging Markets Data Base.1 Argentina, Brazil, Chile, Colombia, Mexico, and Venezuela.
tion. The weighted average maturity of uninsured bankcredits to developing countries declined from 6.7 yearsin 1992 to 5.5 years in 1993 (Table 8) and the weightedaverage spread over the LIBOR rose from 86 basispoints in 1992 to 106 basis points in 1993. In the firsthalf of 1994, the weighted average maturity increasedto 6.8 years, and the spread narrowed to 99 basispoints. But actual spreads varied considerably amongdeveloping countries ranging from 60 to 70 basis
points for borrowers in Korea and Malaysia to 300basis points for borrowers in India and Mexico (TableA16). The U.S. dollar continued to be the most impor-tant currency of denomination, accounting for over 80percent of total syndicated loans to developing coun-tries in 1993.
The bulk of syndicated bank loans continued to bedirected toward Asia, although lending to Latin Amer-ica increased significantly in 1993. After having
26
III
©International Monetary Fund. Not for Redistribution

Commercial Bank Lending
Chart 13. Share Price Indices for Selected Markets In Asia(IFC Weekly Investable Price Indices, December 1988 = 100; in U.S. dollars)
Source: IFC Emerging Markets Data Base.1India, Indonesia, Korea, Malaysia, Pakistan, the Philippines, Taiwan Province of China, and Thailand.
declined in 1992, uninsured medium- and long-termbank loan commitments to Asian borrowers increasedto $15.7 billion in 1993. China continued to be thelargest Asian borrower, receiving loans totaling $3.6billion in 1993. It was followed by Thailand ($3.4 bil-lion), Hong Kong ($2.0 billion), Korea and Indonesia($1.9 billion each), and Malaysia ($1.6 billion). In thefirst half of 1994, loan commitments to Asia amountedto $9.2 billion, including $3.7 billion to Thailand.
Other noteworthy developments included the first sov-ereign loan to Indonesia since 1991 ($400 million) anda $1.2 billion loan to a petroleum company in Thai-land, the largest single borrowing in the Asian marketin the past five years.
In Latin America, uninsured medium- and long-termbank loan commitments increased from $0.9 billion in1992 to $2.2 billion in 1993. Venezuela increased bankborrowing to $0.8 billion in 1993, partly owing to
27
©International Monetary Fund. Not for Redistribution

RECENT DEVELOPMENTS IN PRIVATE MARKET FINANCING
Table 8. Terms of Long-Term Bank Credit Commitments1
Average maturity (in years)OECD countriesEastern EuropeDeveloping countriesOther
Average spread (basis points)OECD countriesEastern EuropeDeveloping countriesOther
Memorandum items (in percent)Six-month Eurodollar
interbank rate (average)U.S. prime rate (average)
1989
6.25.88.37.38.8
5654496832
9.2710.92
1990
6.85.8
11.99.87.7
5451506666
8.3510.01
1991
5.45.1
7.63.5
7980
7571
6.088.46
1992
5.75.7
6.76.9
8586
8660
3.906.25
1993
5.54.4
5.55.3
8177
10683
3.416.00
Jan.-June1994
5.85.7
6.85.0
8279
9935
4.316.46
Sources: Organization for Economic Cooperation and Development (OECD), Financial Market Trends; and IMF, International FinancialStatistics (for Eurodollar and prime rates).
'The country classification and loan coverage are those used by the OECD.
loans raised by public sector oil exporters. Argentinareceived $0.4 billion in commitments for the first timein the 1990s, while Brazil, Chile, and Mexico main-tained access to bank credits on the order of $0.2-0.4billion. In the first half of 1994, however, bank loancommitments to Latin American borrowers declinedsharply to only $0.2 billion.
New commitments to developing countries inEurope remained subdued, amounting to $2.6 billion in1993 and $0.6 billion in the first half of 1994. Thosecommitments were confined to a handful of countries.Turkey continued to be the major borrower, receivingnew commitments of $1.9 billion in 1993; however,banks in 1994 became more cautious in light of thecountry's economic difficulties. Bank loan commit-ments to other European countries remained small,although several countries made their debut in theinternational credit markets, including the CzechRepublic and Slovenia. A widely publicized DM 1.4billion cofinancing facility for the Czech Republic'sSkoda Automodilova was canceled in September 1993,as its German parent revised its international invest-ment activity. New bank commitments to the MiddleEast increased to $1.3 billion in the first half of 1994,compared with $0.4 billion in 1993, while bank lend-ing to Africa remained almost nonexistent.
Other Issues
The strong growth in demand for developing coun-try securities in 1993 occurred even though theseassets were generally riskier than their counterparts indeveloped financial markets. Returns on equities insome developing countries have been significantlymore volatile than those in the United States. Similarly,
returns on selected developing country bonds havetended to be more volatile than returns on comparableU.S. Treasury bonds (Chart 14). Despite the higher riskinherent in developing country equities, investorssought the significantly higher returns offered by theseassets and increasingly perceived that these wouldoffer good opportunities for risk diversification.
The evidence shows that equity returns in manydeveloping countries have low or negative correlationswith equity returns in the United States and other devel-oped financial markets and that returns among manydeveloping country equities are relatively uncorre-lated.26 This pattern of correlations suggests that theexpected return of a portfolio can be increased for agiven level of risk by adding developing country equi-ties, even though these assets are riskier on averagethan equities in industrial country markets.27 Totalreturns on developing country bonds (both Brady bondsand new issues) have also been relatively uncorrelatedwith the total return on comparable U.S. Treasurybonds and among themselves (Tables A17 and A18).
These historical correlations change over time andare not a certain guide to future relationships betweenreturns on industrial and developing country securities.
26International Finance Corporation (1994b).27Consider an example of two very risky assets with the same
average return, but that always move in the opposite direction, thatis, their returns are perfectly negatively correlated. A portfoliodivided equally between these two assets would in principleinvolve no risk, as the movements in the two asset returns wouldalways offset each other. Thus, a portfolio composed of both assetswould yield the same expected return, while involving less riskthan a portfolio consisting entirely of either one of the assets. Thesepoints have been applied to portfolios with emerging marketsassets in a number of research papers, such as Campbell (1993).
28
III
©International Monetary Fund. Not for Redistribution
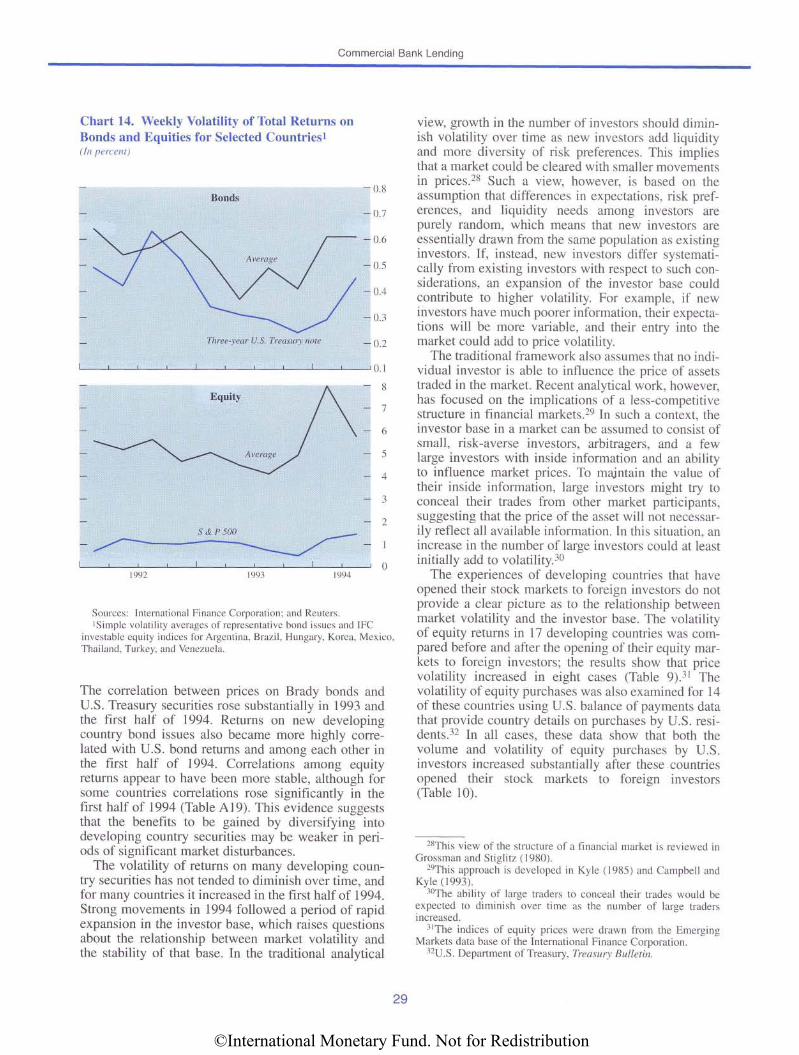
Commercial Bank Lending
Chart 14. Weekly Volatility of Total Returns onBonds and Equities for Selected Countries1
(In percent)
Sources: International Finance Corporation; and Reuters.'Simple volatility averages of representative bond issues and IFC
investable equity indices for Argentina, Brazil, Hungary, Korea, MexicoThailand, Turkey, and Venezuela.
The correlation between prices on Brady bonds andU.S. Treasury securities rose substantially in 1993 andthe first half of 1994. Returns on new developingcountry bond issues also became more highly corre-lated with U.S. bond returns and among each other inthe first half of 1994. Correlations among equityreturns appear to have been more stable, although forsome countries correlations rose significantly in thefirst half of 1994 (Table A19). This evidence suggeststhat the benefits to be gained by diversifying intodeveloping country securities may be weaker in peri-ods of significant market disturbances.
The volatility of returns on many developing coun-try securities has not tended to diminish over time, andfor many countries it increased in the first half of 1994.Strong movements in 1994 followed a period of rapidexpansion in the investor base, which raises questionsabout the relationship between market volatility andthe stability of that base. In the traditional analytical
view, growth in the number of investors should dimin-ish volatility over time as new investors add liquidityand more diversity of risk preferences. This impliesthat a market could be cleared with smaller movementsin prices.28 Such a view, however, is based on theassumption that differences in expectations, risk pref-erences, and liquidity needs among investors arepurely random, which means that new investors areessentially drawn from the same population as existinginvestors. If, instead, new investors differ systemati-cally from existing investors with respect to such con-siderations, an expansion of the investor base couldcontribute to higher volatility. For example, if newinvestors have much poorer information, their expecta-tions will be more variable, and their entry into themarket could add to price volatility.
The traditional framework also assumes that no indi-vidual investor is able to influence the price of assetstraded in the market. Recent analytical work, however,has focused on the implications of a less-competitivestructure in financial markets.29 In such a context, theinvestor base in a market can be assumed to consist ofsmall, risk-averse investors, arbitragers, and a fewlarge investors with inside information and an abilityto influence market prices. To maintain the value oftheir inside information, large investors might try toconceal their trades from other market participants,suggesting that the price of the asset will not necessar-ily reflect all available information. In this situation, anincrease in the number of large investors could at leastinitially add to volatility.30
The experiences of developing countries that haveopened their stock markets to foreign investors do notprovide a clear picture as to the relationship betweenmarket volatility and the investor base. The volatilityof equity returns in 17 developing countries was com-pared before and after the opening of their equity mar-kets to foreign investors; the results show that pricevolatility increased in eight cases (Table 9).31 Thevolatility of equity purchases was also examined for 14of these countries using U.S. balance of payments datathat provide country details on purchases by U.S. resi-dents.32 In all cases, these data show that both thevolume and volatility of equity purchases by U.S.investors increased substantially after these countriesopened their stock markets to foreign investors(Table 10).
28This view of the structure of a financial market is reviewed inGrossman and Stiglitz (1980).
29This approach is developed in Kyle (1985) and Campbell andKyle (1993).
30The ability of large traders to conceal their trades would beexpected to diminish over time as the number of large tradersincreased.
31'The indices of equity prices were drawn from the EmergingMarkets data base of the International Finance Corporation.
32U.S. Department of Treasury, Treasury Bulletin.
29
©International Monetary Fund. Not for Redistribution

RECENT DEVELOPMENTS IN PRIVATE MARKET FINANCING
Table 9. Total Returns on Equity in Selected Emerging Market Countries:Before and After Opening to Foreign Investors1
(In percent at annual rate)
GreecePortugalTurkeyJordan
ArgentinaBrazilChileColombiaMexicoVenezuela
IndiaKoreaMalaysiaPakistanPhilippinesTaiwan Province of ChinaThailand
Mean
1.7107.152.410.6
63.913.933.532.124.0
6.3
19.220.812.112.376.952.920.6
Before
Volatility2
28.372.879.516.4
102.656.541.921.947.040.6
25.930.631.610.538.354.323.9
Mean
29.45.6
47.611.6
61.875.142.367.245.252.8
21.88.8
25.146.423.014.429.0
After
Volatility2
45.624.971.718.6
63.659.825.842.427.349.2
34.628.523.935.836.550.431.5
Source: IFC Emerging Markets data base.'Time period is 1976, quarter I to 1994, quarter II. The actual dates of opening to foreign investors are
as follows: Greece—December 1988; Portugal—December 1988; Turkey—August 1989; J o r d a n -December 1988; Argentina—October 1991; Brazil—May 1991; Chile—December 1988; Colombia-February 1991; Mexico—May 1989; Venezuela—January 1990; India—November 1992; Korea—January 1992; Malaysia—December 1988; Pakistan—February 1991; Philippines—October 1989;Taiwan Province of China—January 1991; Thailand—December 1988. For analytical purposes, and tocapture the fluctuations in the market caused by changes in investor expectations, the opening date wastaken to be four months prior to the actual date.
2Volatility is measured by the standard deviation of the percent change in the IFC total return indices.
Table 10. U.S. Net Purchases of Foreign Equity in Selected Countries:Before and After Opening to Foreign Investors(In millions of U.S. dollars)
GreecePortugal
ArgentinaBrazilChileMexicoVenezuela
IndiaKoreaMalaysiaPhilippinesTaiwan Province of ChinaThailand
Mean
-0.41.8
-1.250.7
2.624.4-0.5
0.82.7
13.13.8
-4.215.6
Before
Volatility1
4.53.2
12.271.9
9.926.5
3.0
2.116.316.314.412.613.7
Mean
41.358.6
1,037.81,165.9
114.32,283.5
1.5
149.7817.9275.8
94.327.729.1
After
Volatility1
20.044.8
496.6403.4
73.81,331.2
66.2
99.8502.9162.757.334.448.9
Source: U.S. Treasury, Treasury Bulletin.'Measured by the standard deviation.
30
III
©International Monetary Fund. Not for Redistribution

E
IVInstitutional and Regulatory Framework forDeveloping Country Financing
Efforts by many developing countries to establishreliable domestic capital markets have played an
important role in attracting foreign capital. This sectionreviews recent measures adopted to improve the insti-tutional setting of those markets, to harmonize regula-tions, and to broaden investor bases at home andabroad. It also reviews recent changes in regulations increditor countries affecting the access of developingcountries to international capital markets.
Reform of Regulatory StructuresOver the last year, many emerging market countries
have taken steps to improve the quality of regulation intheir capital markets. Mexico introduced thoroughgo-ing reforms in 1993. New measures strengthened thesupervisory authority of the Comision Nacional deValores, improved the institutional structure of thestock market, and formalized automated trading.Uruguay is taking similar steps to regulate its capitalmarkets and create an independent securities regulator,which will take over functions currently exercised bythe central bank. In February 1994, Poland introduceda new securities law to govern the over-the-countersecurities market.
Russia has some 80 small stock exchanges dispersedthroughout the country, and most trading is conductedover the counter. In a recent survey, about half of thecountry's privatized enterprises envisaged raising cap-ital with new share issues in 1994 (and from July 1,1994, all shares are to be sold for cash rather thanvouchers). The country's recently formed Commissionon Securities and Stock Exchanges is now responsiblefor unifying all state agencies under a single entity anddeveloping regulations. The Commission is currentlydrafting legislation to create a single independent reg-ulatory body that will have jurisdiction over such mat-ters as disclosure requirements and clearing andsettlement systems.
Following an overhaul of China's regulatory frame-work in early 1993, a number of further revisions weremade over the last year. A permanent National Securi-ties Law, however, has yet to be ratified by the Peo-ple's Congress.33 In an effort to restrict the rising
"Early in 1993, the State Council Securities Policy Commissionassumed chief responsibility for regulation and surveillance forChina's securities markets. Temporary regulations were introducedgoverning the domestic market ("A" shares and bonds) and Hong
incidence of informal curb markets, the authoritieshave made it mandatory for all shares to be issued andtraded through state-run securities firms. Following theclosure of a large black market exchange, Chengdu, insouthwestern China's Sichuan province, is currentlyseeking to establish China's third stock exchange afterShenzhen and Shanghai. Efforts to increase the listingsand quality of "B" shares, and thereby to attract moreforeign investors, are being taken across theexchanges. The Shenzhen Stock Exchange, for exam-ple, recently introduced a number of measures aimedat improving disclosure, regulation, and accountingstandards applying to "B" shares.
Many countries over the last year have taken actionsto improve disclosure, listing, and accounting stan-dards, which make local capital markets more trans-parent and promote investor confidence. Introduced inDecember 1993, Venezuela's Comision Nacional deValores issued regulations to harmonize the financialstatements of companies listed on the country's stockexchanges and to clarify the responsibilities of auditorsin the preparation of financial reports. Peru's Bolsa deValores de Lima now requires that all listed companiesdisclose complete financial information for parentcompanies. In Malaysia, all listed companies now haveto establish audit committees, which review internalaccounting controls, supervise external financialreporting, and assure accurate financial disclosure.
Deficiencies in investor protection can seriouslyundermine investor confidence in emerging markets.34
As markets mature and develop in sophistication,countries have increasingly recognized the need, inparticular, to improve the enforcement of measures tolimit and oversee insider trading. From the beginningof 1994, for example, the Securities Board of India(SEBI) has introduced a series of legislative measuresspecifically aimed at tightening investor protection.These include regulating all transactions betweenclients and brokers and permitting the SEBI to inspect
Kong flotations ("H" shares). As yet, China's "B" shares for for-eign investors, listed on the Shanghai and Shenzhen exchanges, donot necessarily receive the same level of protection. For furtherinformation of developments of China's capital markets, see Gold-stein and others (1994).
34According to the IFC, of 22 emerging markets, only 6 haveinvestor protection laws of internationally acceptable quality. SeeInternational Finance Corporation (1994b).
31
©International Monetary Fund. Not for Redistribution

IV INSTITUTIONAL AND REGULATORY FRAMEWORK
the books of debenture trusts. The SEBI has also beenempowered to prosecute companies whose prospec-tuses misrepresent the facts. Further plans includerequiring disclosure on a continuous basis and improv-ing transparency through screen-based trading andinternationally acceptable custodial and depository ser-vices. In Malaysia, the Kuala Lumpur Stock Exchangerecently introduced new minimum standards of con-duct for member brokerage firms to ensure equalopportunities and information for all clients. Peruintroduced a new insider trading law at the end of 1993that specifically forbade the use of preferential infor-mation. In Chile, insider trading was more clearlydefined and made punishable by law in January 1994.Plans by Chile's Superintendencia de Valores ySeguros to improve market surveillance, including theexpansion of electronic monitoring capacity, willstrengthen enforcement. Similar changes to Mexico'sNational Securities Law late in 1993 included muchstricter legislative criteria and penalties on the misuseof insider information. Finally, Poland's new securitieslaw, among other things, establishes strict penalties forsecurities offenses, including the falsifying of informa-tion in prospectuses.
Steps also continue to be taken to improve clearanceand settlement procedures in emerging markets as wellas to enhance overall trading systems. The efficiencyof such systems can help to promote rapid marketdevelopment, and several countries are moving towardfully electronic systems. Well-developed procedureshelp to ensure effective surveillance and regulatorycontrol, promote investor confidence, and facilitatecross-border securities transactions. Chile, for exam-ple, has recently established a centralized clearinghouse and depository, which was expected to be fullyoperational for equity-fixed income and money markettrading by the end of 1994. Venezuela is presently for-mulating plans for a similar depository. Currently, thecustodial function is decentralized, with asset titlesheld by the transfer agent, brokerage house, custodianbank, or final investors. Over the last year, Mexico'snational securities depository (S.D. INDEVAL) has beenauthorized to provide simultaneous payment and secu-rities delivery, as well as direct securities clearanceservices in ADR-related operations. These modifica-tions are specifically aimed at providing efficient trad-ing and liquidation, and overcoming differences insettlement periods across international markets. Hav-ing commenced electronic trading in 1991, Singa-pore's stock exchange is expected to have acompletely electronic settlement system this year. Aspart of Indonesia's plans to improve settlement proce-dures and strengthen enforcement capabilities,Jakarta's stock exchange intends to replace manualtrading with computerized trading in mid-1994. Dur-ing 1994, Hungary established a fully operationalclearing house and share depository, which hasreduced settlement time.
Expanding the Investor Base
Several countries have established new securitiesmarkets where none previously existed. At the begin-ning of 1994, Zambia formalized a securities regula-tory regime, with oversight power invested in aSecurities and Exchange Commission. This permittedthe opening of the country's first stock exchange,which commenced operations in Lusaka in February.Nepal also opened its first stock exchange in January1994, and 62 firms listed their shares. Nicaragua isexpected to open a securities exchange, which will bethe prime vehicle for the privatization of state assets.
In an effort to provide smaller companies with easieraccess to investable funds, a number of countries haverecently established second-tier markets characterizedby less stringent listing and disclosure requirements.This has the benefit of providing a phased movementto full public listing; it also assists in longer-termefforts to deepen markets. Recent changes to Mexico'sSecurities Law, for example, defined a second marketwith more lenient regulatory and disclosure require-ments. Similarly, Brazil released draft regulations inFebruary 1994 for a special over-the-counter market tohandle smaller companies. In the Czech Republic,while listed companies on the Prague Stock Exchangemust provide quarterly as well as annual financialreports and are required to promptly report substantiveevents affecting the value of their shares, unlisted buttradable companies face more lenient disclosurerequirements.
Many developing countries with advancing capitalmarkets have also expanded their efforts to widen theproduct range of assets available and to liberalizeinvestors' access. Colombia recently modified rules toallow small and medium-sized investors access tosecuritized bond issues. In tandem, new legislationpermitted both the state oil company and other publicsector entities to issue securitized debt related to infra-structure projects; securitization of real estate assetshas also been allowed. Under Venezuela's new bankinglaw, banks can now diversify into securities other thantraditional instruments like certificates of deposit.Thailand recently relaxed its restrictions on providentfunds to enable them to invest in unsecured instru-ments. Similarly, Chile has permitted pension funds toinvest in nonrated company shares, derivatives, andforeign securities; securitized paper has also beenexpanded to include home mortgages.
The creation of credit rating agencies can also helpto expand the investor base by standardizing andimproving the quality of available information. Severalcountries, therefore, allow foreign credit agencies toparticipate in joint ventures in their domestic marketsto help develop credit criteria that conform to interna-tional standards. Over the last year, a number of coun-tries have also introduced domestic rating agencies.Chile recently modified the role of the National Rat-
32
©International Monetary Fund. Not for Redistribution

Regulatory Harmonization
ings Commission (NRC) to preclude it from making itsown evaluations but to extend its authority to overseethe work of private agencies. Peru recently set up a riskclassification commission to develop a credit ratingsystem in line with international standards. Under thecurrent stock market code and new legislation relatingto recently formed pension funds, the Peruvian author-ities have specified that all institutional investors mustoperate within such a system. In early 1994,Venezuela's CNV established regulations for newcredit risk agencies, the first of which opened inMarch. Colombia also opened its first risk-ratingagency (under foreign ownership) in late 1993.
Several countries have made it easier for foreignbrokers to operate in domestic markets, often in part-nership with domestic companies. Such measurespotentially have the virtues of facilitating the transferof valuable information technology and of providing auseful degree of comfort for new foreign investors. Inan effort to enhance market competition, the Securityand Exchange Commission in Taiwan Province ofChina reduced capital requirements for foreign broker-age firms and brought them into line with domestichouses.35 In April 1994, Thailand allowed foreign bro-kerage firms to purchase up to 49 percent of the sharesof Thai securities firms. In March 1994, Russia grantedthe first securities license to a foreign-owned invest-ment institution. Similarly, Poland is scheduled toallow foreign brokers to set up offices.
In the course of market development, a greater vari-ety of instruments become available to investors. Thisallows them to diversify their portfolio and hedge pos-sible risks more effectively. Derivative instruments,including futures, options, and warrants, greatlyenhance flexibility. To make effective use of suchinstruments, however, markets need adequate liquidityin underlying assets. Well-functioning regulatorystructures and clearing-and-settlement systems also areessential. Without adequate liquidity and regulatoryoversight, the premature introduction of such instru-ments can increase the risk of destabilizing fledglingdomestic securities markets and undermining the localbanking system. With such factors in mind, TaiwanProvince of China is currently in the final phase of athree-stage program to establish a domestic futuresmarket; operations are scheduled to begin in late 1994.Thailand recently commissioned a feasibility study onthe establishment of a similar market; the study isaimed particularly at specifying necessary regulatorystructures, capital adequacy requirements, and productranges. Hong Kong is expected to open an optionsmarket in late 1994 in line with continuing efforts toexpand the availability of financial derivatives. Like-wise, in October 1993, Mexico approved the trading of
inflation-linked options based on government securi-ties linked to the consumer price index. Finally, in Feb-ruary 1994, Venezuela issued regulations to governnew markets for options and futures.
Regulatory Harmonization
During the past few years, countries have beencooperating more intensively on capital market regula-tory issues. Such efforts tend to accelerate as domesticmarkets become more mature. Countries with rela-tively advanced markets commonly see greater inte-gration as a way of improving their global competitivepositions. Regulatory harmonization, however, canalso strengthen emerging markets.36
A recent study by the Development Committee ofthe International Organization of Securities Commis-sion surveyed securities regulatory commissions of 23developing countries and found that nearly all weremoving toward harmonizing procedures, regulatoryrequirements, and accounting standards.37 Many arealso removing restrictions on the sale of local securi-ties abroad and foreign securities in local markets. Onthe basis of this survey, three goals were set: (1) to pro-mote the provision of reliable information on changesand improvements in international regulatory proce-dures and accounting standards; (2) to stimulate theinterest of members in lifting restrictions on the place-ment of local securities in foreign markets and foreignsecurities in local markets; and (3) to organize regionalassociations that will help overcome difficulties com-monly faced in emerging markets.
Consistent with the latter goal, a number of coun-tries in Latin America passed legislation over the lastyear providing for the approval of cross-border listingswith nearby countries. The MERCOSUR group of coun-tries (Argentina, Brazil, Paraguay, and Uruguay), forexample, had passed legislation by early 1994 to allowthe trading of stocks and bonds across one another'smarkets. Colombia recently approved the listing of for-eign companies on its domestic market, provided cer-tain listing and disclosure requirements were met. Italso broadened the scope for domestic companies tomake public offerings abroad. Separately, Argentina isconsidering granting Mexican companies access to itslocal capital market. Mexico's new National SecuritiesMarket Law established an international trading sec-tion on the Mexican exchange and allowed a recentlycreated central depository institute (INDEVAL) to serveas custodian for foreign securities. This enables localbrokers to complete transactions in foreign securitiesfor their clients. In an analogous effort to promoteinterregional investment as well as to facilitate privati-
35Foreign brokers have been allowed to operate in TaiwanProvince of China since early 1993, but only one full branch has infact opened.
36For further information on the integration of capital markets indeveloping countries with those in the rest of the world, see Gold-stein and others (1993).
37International Organization of Securities Commissions (1993).
33
©International Monetary Fund. Not for Redistribution

IV INSTITUTIONAL AND REGULATORY FRAMEWORK
zation, the stock exchanges of Bahrain, Jordan,Kuwait, Oman, Morocco, and Tunisia were expectedto be linked by September 1994; the Arab MonetaryFund was providing assistance. Similarly, the HongKong Stock Exchange announced its intention to focuson attracting equity placements by foreign countries(particularly China).
In order to promote information sharing and advancetoward market integration, a number of countries haverecently negotiated memoranda of understanding withone another. In Latin America, all countries havesigned memoranda with at least one other country,often a regional partner. In March 1994, for example,the Venezuelan and Colombian securities commissionssigned a memorandum of understanding to formalizecooperation on the exchange of information aboutchanges in regulatory and judicial issues, technicalassistance, and investor protection. One purpose of theagreement is to combat money laundering. In early1994, the London Stock Exchange and the ShanghaiSecurities Exchange also signed a memorandum ofunderstanding to promote technical cooperation andlay foundations for the joint listing and trading of secu-rities. In addition, Brazil's Bolsa de Mercadorias andFuturos and the New York Mercantile Exchangesigned a memorandum of understanding to share infor-mation on regulatory and technical issues.
Regulatory Changes in Creditor Countries
Securities Markets
In November 1993, the U.S. Securities and ExchangeCommission (SEC) adopted measures to simplify thelisting of foreign companies in U.S. markets. The newmeasures include recognition of international account-ing standards, easier registration procedures, and reduc-ing the required reporting history from three years to 12months. They also narrow the size requirement for apublic flotation from $300 million to $75 million. Overthe last year, the SEC has also assigned "recognizedcustodian status" to a number of emerging markets.This allows the foreign custodian to handle securitiesdeposited by American investors, which simplifiesclearance and settlement procedures. To a large extent,this recognition reflects improvements in the institu-tional environment in several developing countries,including Mexico and Thailand. In a similar vein, dur-ing the last year, the SEC accorded "ready market sta-tus" to Mexican Government debt instrumentsdenominated in pesos, including treasury certificates
(CETES), inflation-adjusted bonds (ADJUSTABONOS), andlong-term instruments (BONDES). This modificationallows U.S. securities firms to assign only a 7 percentcapital charge against the asset, in contrast to the 100percent charge required previously.
In analogous moves, the Australian Stock Exchangerecently proposed to establish a separate "Asian mar-ket" trading board in order to attract listings fromChina and other Asian countries. At present, around 14Chinese companies have expressed an interest alongwith a number of firms from Korea, Malaysia, and Sin-gapore. It is expected that by the end of 1994 up to 10companies could be listed. Asian companies intendingto list would have to comply with the same require-ments that apply to domestic firms, including abidingby international auditing standards and submittingsemiannual reports.
Provisioning Standards
Over the past several years, nearly all creditor coun-tries have modified their provisioning requirements forcommercial banks in light of the improving prospectsof many developing countries.38 Although this trend inpart reflects the stronger capitalization of creditorbanks, it is also based on the enhanced creditworthi-ness of certain indebted countries. Sound macroeco-nomic policies, the effective restructuring of existingcommercial bank debt, and the restoration of access tothe international capital markets, all underlay the trend.
Provisioning requirements now tend to be muchmore responsive to variations in creditworthiness. Forexample, changes introduced by Belgium and Switzer-land in 1993 replaced flat cover ratios of 60 percentand 65 percent, respectively, with a graded system thatassesses debt-servicing capacity and a range of macro-economic and political factors. In most countries, aver-age provisioning to cover exposure to developingcountries has declined. In Japan, however, where bankprovisioning is relatively low by international stan-dards, a reduction in developing country exposure hashelped to raise the average level of provisioning. Inaddition, an increase in provisioning by German banksover the last few years reflects proportionately higherexposure to Eastern Europe and the countries of theformer Soviet Union (Table A20).
38For further information on regulatory practices in creditorcountries as well as procedures by which developing countries may"graduate" from the need for creditor banks to make provisions,see Collyns and others (1992 and 1993).
34
©International Monetary Fund. Not for Redistribution

VForeign Direct Investment
long with the rise in portfolio capital inflows,developing countries have experienced a surge in
foreign direct investment inflows during the 1990s.Like portfolio capital, these inflows have gone to a rel-atively small number of countries in Latin America andAsia. Their sharp rise is in part explained by factorsthat are likely to exert an influence over a limitedperiod of time, such as the privatization of governmentassets or the rebalancing of asset holdings in responseto economic reforms in developing countries.Although foreign direct investment is often perceivedas a relatively stable source of financing, a review ofexperience in the 1980s of a sample of highly indebteddeveloping countries suggests a more cautious view.When balance of payments difficulties are encoun-tered, the net impact of all transactions associated withforeign direct investment (including both current andcapital account transactions) may serve to exacerbateexternal imbalances.
Recent Trends in Direct Investment
Since the mid-1970s, when only modest flows wererecorded, net inflows of foreign direct investment todeveloping countries have risen rapidly.39 Neverthe-less, there have been substantial fluctuations aroundthis upward trend (Table A21 and Chart 15). For exam-ple, a surge in inflows has occurred since 1990. Overthe period 1991-93, cumulative net inflows amountedto $134 billion. In real terms, net foreign direct invest-ment flows to developing countries in the early 1990swere almost two and a half times their average level inthe 1980s.
The surge in foreign direct investment is notable notonly for its size, but also for its coincidence with thegrowth of other private capital flows. The rate ofincrease in net foreign direct investment in developingcountries since 1990 has been comparable with that ofportfolio flows. This simultaneous upturn in bothdirect and portfolio inflows contrasts sharply with pre-vious experiences of private capital surges to develop-ing countries. For example, bond financing wasdominant in the 1920s and 1930s, but defaults duringthe interwar period led in the first twenty years of the
postwar period to foreign direct investment replacingbonds as the primary form of capital inflow. A newsurge in portfolio flows, specifically in the form ofbank lending, began in the 1960s and peaked in theearly 1980s, but it was accompanied by a steep declinein foreign direct investment flows.40
Although many countries have experiencedincreases in direct investment inflows, as was the casewith previous surges, the latest upturn has been con-centrated in only a few countries. Three countries—Brazil, Indonesia, and Mexico—accounted for over 60percent of all foreign direct investment flows to devel-oping countries between 1971 and 1981.41 At the endof the 1980s, 63 percent of the total stock of foreigndirect investment in developing countries was held infive countries—Brazil, China, Egypt, Malaysia, andMexico. In contrast, the five developing countries withthe most external debt—Argentina, Brazil, India,Indonesia, and Mexico—accounted for only 33 percentof the total stock of debt.42 Between 1990 and 1993,the bulk of foreign direct investment flows went to tworegions: Latin America and Asia.
In Latin America, the total inflow doubled after1990. It reached $14 billion in 1992 before decliningmodestly to around $13 billion in 1993. Over thisperiod, average annual inflows were two to three timeshigher than in the 1980s. Two thirds of the total foreigndirect investment inflow to Latin America during theperiod went to Mexico and Argentina, with Chile,Venezuela, Brazil, and Colombia accounting for alarge share of the remainder. Developing countries inAsia received an estimated $66 billion in foreign directinvestment inflows in 1991-93, roughly half of thetotal flow to developing countries. China was by farthe largest recipient, accounting for more than 40 per-cent of the inflows to Asia. Malaysia and Singaporewere also major recipients of foreign direct investment,but at less than half of the level of flows to China. Inthe case of Malaysia, this represented a substantialpickup in inflows, while for Singapore it represented arelatively steady inflow of investment. Thailand andIndonesia also saw sizable foreign direct investmentinflows over the period. Inflows to the economies intransition in Central and Eastern Europe also rosesharply over the period 1991-93, amounting to
39Net foreign direct investment inflows are defined as foreigndirect investment capital inflows less capital outflows for directinvestments abroad by domestic residents.
40See Cardoso and Dornbusch (1988).41 Edwards (1990).42Claessens(1993).
35
A
©International Monetary Fund. Not for Redistribution

V FOREIGN DIRECT INVESTMENT
Chart 15. Net Foreign Direct Investment toDeveloping Countries(In billions of U.S. dollars)
Source: World Economic Outlook data base.
approximately 10 percent of total foreign direct invest-ment inflows to developing countries. Finally, annualflows to Africa were largely unchanged in 1991-93,with almost all of the funds going to Nigeria and SouthAfrica.
The nature of and motivation for foreign directinvestment suggest that longer-term considerationsplay a role in explaining these flows. As a result, directinvestment might be expected to exhibit greater stabil-ity than other types of private capital flows.43 More-over, there are factors at work in the global economy,such as growing trade, greater market homogeneity,and improved communications technology, that shouldprovide long-term impetus for increased flows of for-eign direct investment.44 While all of this may be truein general, the recent experience of developing coun-tries may be explained by a number of factors that canbe expected to have an impact over a more limitedperiod of time.
Far-reaching economic reforms—including theremoval of legal restrictions on capital movements andon nonresident holdings of domestic assets—haveeliminated many of the barriers that formerly acted todeter foreign direct investment. At the same time, thealleviation of debt burdens has sharply lessened risksfor all would-be investors.45 Thus, the response of for-eign direct investment to these changes may to anextent represent a stock adjustment—implying a one-time rebalancing of the pattern of corporate asset hold-ings in response to policy changes in host countries.
43SeeLizondo(1991).44See Graham and Krugman (1993).45Dooley (1986).
Foreign direct investment related to privatization hasalso been an important factor in the recent upturn, par-ticularly in flows to Latin America. The potential forfurther foreign direct investment inflows from new pri-vatizations, however, will inevitably depend on thesize of the remaining stock of public sector assets thatcan be earmarked for sale. In general, the pace of thistype of inflow can be expected to slow as countriesnear the end of their privatization programs. There maybe further inflows related to the restructuring of newlyprivatized enterprises, but these are not likely to con-tinue on the scale of the initial inflows associated withthe sale of the enterprises.
Beyond such specific factors, general economicexpansion in the largest recipient countries also con-tributed to the recent surge in foreign direct invest-ment. Domestic growth not only provides foreignfirms with enhanced investment opportunities, it alsoprovides a pool of funds for reinvestment. In partbecause enterprises typically view such internally gen-erated resources as cheaper than funds raised in thecapital market, reinvested earnings now account for alarge proportion of total foreign direct investment cap-ital flows. Reinvested earnings, nonetheless, appear tomove procyclically; a slowdown in economic growthhas a dampening effect.
Behavior of Foreign Direct InvestmentTransactions in a Crisis
Foreign direct investment capital flows have beenviewed as potentially providing a more stable form offinancing for economic development, as well as a sub-stitute for reduced flows of commercial bank financ-ing.46 An important question remains, however, aboutthe behavior of such flows when a country encountersbalance of payments difficulties.47 It is widely arguedthat the longer-term motivations for foreign directinvestment, together with the substantial costs usuallyentailed in liquidating fixed assets, would result inthese flows being less responsive to adverse short-runmacroeconomic developments.
The stability of foreign direct investment capitalflows during crisis periods would, indeed, appear to belargely confirmed by a review of balance of paymentsdata reported to the IMF.48 Chart 16 shows the compo-
46See, for example, Goldsbrough (1986) and Cardoso and Dorn-busch (1988) for discussion of these issues.
47See Claessens, Dooley, and Warner (1993); the authors findthat broadly speaking foreign investment is no less volatile on ayear-on-year basis for a given country than other capital flows.
48These data conceptually include reinvested earnings of domes-tic affiliates of foreign firms. In practice, however, the recording ofreinvested earnings is incomplete in many developing countries.Foreign direct investment statistics are usually compiled by thecentral bank using actual cross-border flows and generally fail toadequately capture the reinvested portion of domestic affiliates'earnings.
36
©International Monetary Fund. Not for Redistribution

Foreign Direct Investment Transactions
sition of total net private capital flows to six heavilyindebted countries that experienced external paymentsdifficulties during the 1980s.49 The data are expressedin real terms, deflating U.S. dollar values by an indexof the unit price of exports for industrial countries.While small in magnitude compared with other privateshort- and long-term flows, net foreign direct invest-ment capital flows were relatively stable throughoutthe debt crisis. Moreover, after rising substantially inthe late 1970s, those flows returned to previous levelsin the 1980s. Throughout the period, inflows of foreigndirect investment were recorded, while sizable out-flows of other forms of investment occurred in themid-1980s.
Focusing solely on recorded capital flows, however,may not fully capture the influence of foreign directinvestment on a country's external position. Whetherforeign direct investment contributes to or alleviates abalance of payments "shock" depends on the behaviorof the net flow resulting from both current and capitalaccount transactions between a domestic affiliate andits foreign parent. Conceptually, all earnings from affil-iated companies are assumed to accrue to their foreignparents and are included in current account transac-tions; the portion of earnings that is reinvested by theforeign parents in their affiliates is recorded as aninflow in the host country's capital account. Thus, thenet impact of foreign direct investment transactions ismeasured by associated capital inflows (comprisingboth reinvested earnings and "new" investment flows)less total earnings of foreign-owned companies. Thereis an a priori reason to expect that, in addition to thestability of inflows through the capital account, foreigndirect investment may also exert a stabilizing influenceduring a crisis through its effects on the currentaccount. Current account outflows in the form of repa-triated earnings may be expected to decline during acrisis, since the crisis is likely to reduce the total earn-ings of foreign-owned companies.
To capture fully the influence of foreign directinvestment transactions on a country's external posi-tion, it is important that the data accurately record totalearnings and total capital flows (i.e., reinvested earn-ings are fully accounted for). Given uncertainties aboutthe coverage of balance of payments data in manycountries, U.S. data on U.S. direct investment abroadhave been used to examine the overall balance of pay-ments effects of foreign direct investment transactionsfor the six heavily indebted countries discussedabove.50 While the U.S. data capture only the activityof U.S. firms, they have the advantage of including all
Chart 16. Composition of Net Private Capital Flows1
(In billions of 1985 U.S. dollars)
49Argentina, Brazil, Chile, Mexico, the Philippines, andVenezuela.
50U.S. Department of Commerce, Survey of Current Business,various issues. All data have been converted into 1985 U.S. dollarsusing an index of the unit value of industrial country exports. Earn-ings data and repatriated earnings data are expressed net of with-
Sources: IMF, International Financial Statistics; World EconomicOutlook; and IMF staff estimates.
1Argentina, Brazil, Chile, Mexico, the Philippines, and Venezuela.Excludes errors and omissions.
components of direct investment and, thus, may bettercapture short-run changes in the behavior of foreigninvestors. The data are also likely to be broadly repre-sentative, owing to the fact that U.S. companiesaccount for roughly half of the foreign investment inthe group of six heavily indebted developing countries.
For U.S. affiliates, total earnings fell when externalpayments difficulties of the host countries becamemore severe. These affiliates, however, responded tothe crisis by reducing reinvested earnings by more thanthe decline in total earnings. Repatriated earnings,thus, remained relatively stable, and actually increasedthroughout the period. In 1983, repatriated earningsexceeded income, generating negative reinvested earn-ings (i.e., a reduction in the assets of the U.S. affiliatesin these countries).
The sharp drop in reinvested earnings during the cri-sis was accompanied by a decline in flows of other for-eign direct investment capital to the six countries. Withthe more complete coverage of reinvested earnings inthe U.S. data, it appears that there was substantiallymore volatility in foreign direct investment inflowsduring the debt crisis than is suggested by the balanceof payments data for the six countries. Moreover, theforeign direct investment capital inflows shown in theU.S. data appear to have behaved in a manner gener-ally consistent with domestic investment as a whole inthe host countries. For the group of countries surveyed,
holding taxes and include interest received from loans. Beginningin 1981, earnings and reinvested earnings data exclude increases inthe dollar value of stocks either through exchange rate changes orthrough capital gains or losses.
37
©International Monetary Fund. Not for Redistribution

V FOREIGN DIRECT INVESTMENT
domestic investment fell from 24 percent of GDP in1981 to 18 percent of GDP in 1985, reflecting pooroutput performance, low profitability, and an unstablefinancial environment. Net resource transfers back tothe parents increased sharply beginning in 1983 andcontinued until 1991. Over the period 1983-89, thesetransfers averaged around 7 percent per year ofthe total stock of U.S. direct investment in the sixcountries.
This analysis contrasts with the perception thatdirect investment flows may help stabilize the balanceof payments during a crisis. The persistence of largenet resource transfers associated with foreign directinvestment out of the six countries sampled here may
be related to the balance of payments difficulties thesecountries encountered. In common with all other exter-nal creditors, foreign investors faced the risk that theunallocated loss implied by these debt-service difficul-ties could fall on them, and they appear to have beenreluctant to commit to new investment until expectedlosses to creditors declined, as signaled by increases inthe secondary market value of debt.51 The recent surgein direct investment inflows into these countries haslargely corresponded with a return to creditworthinessand renewed access to foreign capital markets ingeneral.
51Dooley (1986).
38
©International Monetary Fund. Not for Redistribution

Statistical Appendix
©International Monetary Fund. Not for Redistribution

This page intentionally left blank
©International Monetary Fund. Not for Redistribution

Statistical Appendix
Table Al. Chronology of Bank Debt Restructurings and Bank Financial Packages, 1984-July 1994
1984Brazil: January2
Chile: January, June, and NovemberSierra Leone: JanuaryGuyana: January, July (deferment)Nicaragua: February (deferment)Peru: February3
Senegal: FebruaryNiger: MarchMexico: April (new financing only)Sudan: April (modification of 1981
agreement)Yugoslavia: MayJamaica: JuneZaire: June (deferment)Poland: July2
Madagascar: OctoberLiberia: December3
Zambia: December3
1985Cote d'lvoire: March2
Mexico: March, AugustCosta Rica: May2
Senegal: MayPhilippines: May2
Zaire: May (deferment)Guyana: July (deferment)Argentina: August2
Jamaica: SeptemberPanama: October2
Sudan: October (modification of 1981agreement)
Chile: November2
Colombia: December4
Ecuador: December2
Madagascar: December(modification of 1984 agreement)
Yugoslavia: December
1986Dominican Republic: FebruaryMorocco: FebruaryVenezuela: FebruarySouth Africa: March (standstill)Niger: AprilZaire: May (deferment)Brazil: July
AlbaniaCongoCote d'lvoire
Agreement classified by month of signature1
Uruguay: JulyPoland: September2
Romania: SeptemberCongo: October2,3
Cote d'lvoire: December
1987South Africa: MarchMexico: March (public sector debt)2,
August (private sector debt)Jamaica: MayMozambique: May3
Zaire: May (deferment)Chile: JuneHonduras: June3
Madagascar: June (modification of1985 agreement)
Argentina: August2
Morocco: SeptemberRomania: September (modification of
1986 agreement)Bolivia: November (amendment to
1981 agreement)Nigeria: November2' 3
Venezuela: NovemberGabon: December5
Philippines: December
1988Gambia, The: FebruaryChile: August (amendment to 1987
agreement)3
Uruguay: March (modification of 1986agreement)
Cote d'lvoire: April2' 3
Guinea: AprilTogo: MayPoland: JulyYugoslavia: September2
Malawi: OctoberBrazil: November2
1989Nigeria: AprilZaire: June (deferment)Poland: June (deferment)3
South Africa: OctoberHonduras: August3
Under negotiation
Nicaragua Russia
Niger: October3
Trinidad and Tobago: December
1990Philippines: February2
Mexico: February2
Madagascar: AprilBulgaria: April (standstill)3
Costa Rica: MayJamaica: JuneMorocco: SeptemberSenegal: SeptemberChile: December (amendments to
previous agreements)Venezuela: December2
1991Colombia: April5
Niger: AprilUruguay: January2
Brazil: May6
U.S.S.R., former: December(deferment)
Mozambique: DecemberNigeria: December
1992Algeria: MarchGabon: MayPhilippines: July2
Guyana: NovemberArgentina: December
1993Uganda: FebruaryBolivia: MarchRussia: July3
South Africa: SeptemberBrazil: November2
Jordan: December
1994Dominican Republic: FebruaryGabon: MayBulgaria: JuneZambia: JulyPoland: September2
Ecuador: October
Panama Sao Tome and PrincipePeru Sierra Leone
Tanzania
Sources: Restructuring agreements.Note: "Restructuring" covers rescheduling and also certain refinancing operations.Agreement either signed or reached in principle (if signature has not yet taken place); not all signed agreements have become effective.2The restructuring agreement includes new financing.3Agreed in principle or tentative agreement with banks' Steering Committees.4Refinancing agreement.5A separate club deal for new financing was arranged at the same time.6 Preliminary agreement on interest arrears.
41
©International Monetary Fund. Not for Redistribution

STATISTICAL APPENDIX
Table A2. Amounts of Medium- and Long-Term Bank Debt Restructured1
(In millions of U.S. dollars; by year of agreement in principle)
1986 1987 1988 1989 1990 1991 1992 1993
First Half
1994
ArgentinaBoliviaBrazilBulgariaChile
CongoCosta RicaCote d'lvoireDominican
RepublicEcuador
GabonGambia, TheGuineaGuyanaHonduras
JamaicaJordanMadagascarMalawiMexico
MoroccoMozambiqueNicaraguaNigerNigeria
PanamaPeruPhilippinesPolandRomania
RussiaSenegalSierra LeoneSouth AfricaSudan
TogoTrinidad and
TobagoUgandaUruguayVenezuela
YugoslaviaZaireZambia
Total9
6,6715
217
691 2
(65)8
60,525
2532
(57)8
43/7002
2,174
524,250
— 9,0102
1,970 8,4112
800 —
(13,600)8 l l ,900 2
l ,7702
20,3382
29,5002 —4733,4 _— 61,0002
5,9022 —
391943
2482
2852
2,2112
(61)8
87,221
7,100
27,9803
1703'4
46,6003
l,8006
l ,5703
157
1322
352 —3,6713 48,2313
5,8242
332
21
3,150
— 8,666
— 1,1003,7
939
8573
7,1177
1507
1244,9
5,8119
781 1,3399 4,4733
(351)8 — — 12,6697
37
8,000
24,0007
— 5,000
492
4702
6,8952
80,155
(61)8
50,714
l,6083
19,7003
27,987
1534 '9 —
17,776 74,843 40,276
4147
20,350
Sources: Restructuring agreements; and IMF staff estimates.1including short-term debt converted into long-term debt and debt exchanges involving interest or principal reduction. Amounts represent
face value of old claims restructured; includes past due interest where applicable.2Multiyear rescheduling agreement (MYRA) entailing the restructuring of all eligible debt outstanding as of a certain date.3Financing packages involving debt and debt-service reduction.4Excludes past due interest.5Excluding $9.6 billion in deferments corresponding to maturities due in 1986.6Amendments to previous restructuring agreements.7Estimates of eligible debt.8Deferment agreement.9Face value of debt extinguished in buy-back.10Agreements in 1985 and 1987 modified debt-service profiles on debt rescheduled under the 1984 agreements; the amounts involved are
not shown because repayments made during 1985-87 have not been identified.
42
©International Monetary Fund. Not for Redistribution

Tab
le A
3. T
erm
s an
d C
ondi
tion
s of
Ban
k D
ebt
Res
truc
turi
ngs
and
Fin
anci
al P
acka
ges,
198
9-Ju
ly 1
9941
Cou
ntry
, D
ate
of A
gree
men
t,an
d T
ype
of D
ebt
Res
ched
uled
B
asis
Am
ount
Pro
vide
d
(In
mill
ions
of
U.S
. do
llars
)
Gra
ceP
erio
d M
atur
ity
(In
year
s,
unle
ssot
herw
ise
note
d)
Inte
rest
Rat
e
(In
perc
ent
spre
adov
er
LIB
OR
/U.S
.pr
ime,
un
less
othe
rwis
e no
ted)
Arg
enti
na
Pre
lim
inar
y ag
reem
ent
on A
pril
7,
1992
;te
rm s
heet
Jun
e 23
, 19
92;
fina
l ag
reem
ent
Dec
embe
r 6,
199
2 an
d cl
osin
g of
agr
eem
ent
for
prin
cipa
l on
Apr
il 7
, 19
93
Col
late
rali
zed
debt
exc
hang
e
Bol
ivia
Agr
eem
ent
in p
rinc
iple
of
Apr
il 1
992;
ter
m s
heet
July
10,
199
2; f
inal
agr
eem
ent
Mar
ch
30,
1993
and
clos
ing
of a
gree
men
t on
May
19,
199
3
Wai
ver
to a
llow
deb
t bu
y-ba
ck a
nd^e
xcha
nges
Bra
zil
Pre
lim
inar
y ag
reem
ent
on J
uly
8, 1
992;
ter
msh
eet
Sep
tem
ber
22,
1992
; fi
nal
agre
emen
tN
ovem
ber
29,
1993
and
clo
sing
of
agre
emen
tA
pril
15,
199
4
New
mon
ey b
onds
Res
truc
turi
ng l
oan
Cap
ital
izat
ion
bond
Deb
t re
duct
ion
(see
Tab
le A
4)
Deb
t re
duct
ion
(see
Tab
le A
4)
Old
deb
t (e
qual
to
5.5
tim
es t
he n
ewm
oney
pro
vide
d) t
o be
exc
hang
ed a
t pa
rfo
r ne
w n
onco
llat
eral
ized
bon
ds.
Dif
fere
nce
betw
een
inte
rest
rat
e in
yea
rs1-
6 an
d L
IBO
R p
lus
% t
o be
cap
ital
ized
.
Dif
fere
nce
betw
een
inte
rest
rat
e in
yea
rs1-
6 an
d 8
perc
ent
to b
e ca
pita
lize
d.B
ack-
load
ed a
mor
tiza
tion
sch
edul
e.
10 10
15 20 20
Yea
rs 1
-2:
4 pe
rcen
tY
ears
3-4
: 4.
5 pe
rcen
tY
ears
5-6
: 5
perc
ent
Yea
rs 7
-20:
%
Yea
rs 1
-2:
4 pe
rcen
tY
ears
3-4
: 4.
5 pe
rcen
tY
ears
5-6
: 5
perc
ent
Yea
rs 7
-20:
8 p
erce
nt
Col
late
rali
zed
debt
exc
hang
es
Deb
t re
duct
ion
(see
Tab
le A
4)
7/8
7
©In
tern
atio
nal M
onet
ary
Fund
. Not
for R
edis
tribu
tion

Tab
le A
3 (c
ontin
ued)
Cou
ntry
, D
ate
of A
gree
men
t,an
d T
ype
of D
ebt
Res
ched
uled
B
asis
Am
ount
Pro
vide
d
(In
mill
ions
of
U.S
. do
llars
)
Gra
ceP
erio
d M
atur
ity
(In
year
s,
unle
ssot
herw
ise
note
d)
Inte
rest
Rat
e
(In
perc
ent
spre
adov
er
LIB
OR
/U.S
.pr
ime,
un
less
othe
rwis
e no
ted)
Bu
lgar
iaA
gree
men
t in
pri
ncip
le o
n N
ovem
ber
24,
1993
;te
rm s
heet
Mar
ch 1
1, 1
994;
fin
al a
gree
men
ton
Jun
e 29
, 19
94
Col
late
rali
zed
debt
exc
hang
e
Cos
ta R
ica
Pre
lim
inar
y ag
reem
ent
on N
ovem
ber
16,
1989
;fi
nal
agre
emen
t on
May
21,
199
0
Dom
inic
an R
epu
bli
cP
reli
min
ary
agre
emen
t on
May
3,
1993
;te
rm s
heet
Aug
ust
6, 1
993;
fin
al a
gree
men
ton
Feb
ruar
y 14
, 19
94
Col
late
rali
zed
debt
exc
hang
e
Ecu
ador
Agr
eem
ent
in p
rinc
iple
on
May
2,
1994
;te
rm s
heet
Jun
e 14
, 19
94
Col
late
rali
zed
debt
exc
hang
e
Gab
onA
gree
men
t in
pri
ncip
le o
n D
ecem
ber
11, 1
991;
fina
l ag
reem
ent
on M
ay 1
2, 1
992
Res
ched
ulin
g of
pri
ncip
al d
ueJa
nuar
y 1,
198
9-D
ecem
ber
31,
1992
Gu
yan
aA
gree
men
t on
ter
m s
heet
on
Aug
ust
27,
1992
;fi
nal
agre
emen
t on
Nov
embe
r 24
, 19
92
Deb
t re
duct
ion
(see
Tab
le A
4)
Deb
t re
duct
ion
(see
Tab
le A
4)
Deb
t re
duct
ion
(Tab
le A
4)
Deb
t re
duct
ion
(see
Tab
le A
4)
100
perc
ent
of p
rinc
ipal
Deb
t re
duct
ion
(see
Tab
le A
4)
157
133
7/8
©In
tern
atio
nal M
onet
ary
Fund
. Not
for R
edis
tribu
tion

Hon
du
ras
Agr
eem
ents
of
Aug
ust
17,1
989
Bil
ater
al c
once
ssio
nal
resc
hedu
ling
of
debt
to L
loyd
s B
ank
Pri
ncip
al o
utst
andi
ng a
t en
d of
Oct
ober
19
89
Inte
rest
arr
ears
at
end
of O
ctob
er
1989
Bil
ater
al c
once
ssio
nal
resc
hedu
ling
of
debt
to B
ank
of A
mer
ica
Pri
ncip
al o
utst
andi
ngIn
tere
st a
rrea
rs a
s of
end
of
Oct
ober
19
89
Jam
aica
Agr
eem
ent
on J
une
26,
1990
Ref
inan
cing
of
debt
pre
viou
sly
resc
hedu
led
in 1
987
Tra
nche
AT
ranc
he B
Jord
anA
gree
men
t in
pri
ncip
le o
n N
ovem
ber
20,
1989
Res
truc
turi
ng o
f m
ediu
m-
term
loa
nsm
atur
ing
betw
een
Janu
ary
1, 1
989—
June
30
, 19
91N
ew m
ediu
m-t
erm
mon
ey f
acil
ity
Pre
lim
inar
y ag
reem
ent
on J
une
30,
1993
;te
rm s
heet
Aug
ust
20,
1993
; fin
al a
gree
men
tD
ecem
ber
10,
1993
and
clo
sing
of
agre
emen
tD
ecem
ber
23,
1993
100
perc
ent
100
perc
ent
100
perc
ent
100
perc
ent
462
222'4
472
17
4
7 7 10
20 20 20 20
6.25
per
cent
fixe
d ra
te3
6.25
per
cent
fixe
d ra
te3
6.5
perc
ent
4 pe
rcen
t fi
xed
rate
100
perc
ent
of p
rinc
ipal
100
perc
ent
of p
rinc
ipal
144
188
100
perc
ent
of p
rinc
ipal
New
mon
ey58
0 50
10 1
/214
1/2
11 1
/23
Col
late
rali
zed
debt
exc
hang
e
Mad
agas
car
Agr
eem
ent
in p
rinc
iple
in
Oct
ober
198
9 an
dsi
gned
on
Apr
il 1
0, 1
990
Res
ched
ulin
g
Deb
t re
duct
ion
(see
Tab
le A
4)
100
perc
ent
of p
rinc
ipal
fal
ling
due
on D
ecem
ber
15,
1989
and
50
perc
ent
of p
rinc
ipal
fal
ling
due
in 1
990-
93
21.1
2/3 8 5 3
13/16 49% 49% 49%
97/8
-131
/2
©In
tern
atio
nal M
onet
ary
Fund
. Not
for R
edis
tribu
tion

Tab
le A
3 (c
ontin
ued)
Cou
ntry
, D
ate
of A
gree
men
t,an
d T
ype
of D
ebt
Res
ched
uled
B
asis
Am
ount
Pro
vide
d
(In
mill
ions
of
U.S
. do
llars
)
Gra
ceP
erio
d M
atur
ity
(In
year
s,
unle
ssot
herw
ise
note
d)
Inte
rest
Rat
e
(In
perc
ent
spre
adov
er
LIB
OR
/U.S
.pr
ime,
un
less
othe
rwis
e no
ted)
Mex
ico
Agr
eem
ent
on F
ebru
ary
4, 1
990
New
mon
ey f
acili
tyC
olla
tera
lize
d de
bt e
xcha
nges
Res
truc
turi
ng o
f m
atur
itie
s of
eli
gibl
e de
btno
t su
bjec
t to
deb
t an
d de
bt-s
ervi
cere
duct
ion
Mor
occo
Agr
eem
ent
in p
rinc
iple
of
Apr
il 1
990;
fina
l ag
reem
ent
of S
epte
mbe
r 19
90R
estr
uctu
ring
of
the
enti
re d
ebt
outs
tand
ing
at e
nd o
f 19
89D
ebt
buy-
back
s au
thor
ized
Moz
amb
iqu
eA
gree
men
t in
pri
ncip
le o
n N
ovem
ber
1, 1
991;
oper
atio
n co
mpl
eted
Dec
embe
r 27
, 19
91W
aive
rs t
o al
low
deb
t bu
y-ba
ck
Nig
er Agr
eem
ent
in p
rinc
iple
on
Janu
ary
14, 1
991;
oper
atio
n co
mpl
eted
Mar
ch 8
, 19
91W
aive
rs t
o al
low
deb
t bu
y-ba
ck
Nig
eria
Agr
eem
ent
in p
rinc
iple
of
Sep
tem
ber
1988
;fi
nal
agre
emen
t of
Apr
il 19
89R
estr
uctu
ring
of
debt
out
stan
ding
at
end
of 1
987
Not
pre
viou
sly
resc
hedu
led
med
ium
-ter
mde
bt
New
mon
eyD
ebt
redu
ctio
n (s
ee T
able
A4)
100
perc
ent
of p
rinc
ipal
l,09
05
6,40
0
15 15
100
perc
ent
of p
re-c
utof
f de
bt
3,15
0 7-
10
15-2
0
Deb
t re
duct
ion
(see
Tab
le A
4)
Deb
t re
duct
ion
(see
Tab
le A
4)
100
perc
ent
of p
rinc
ipal
1,
256
20
7 7
3
13-16
21.1
21.1 7/8
©In
tern
atio
nal M
onet
ary
Fund
. Not
for R
edis
tribu
tion

Nig
eria
(c
ontin
ued)
Deb
t co
vere
d by
the
Nov
embe
r 19
87re
sche
duli
ng a
gree
men
tD
ebt
(let
ters
of
cred
it)
cove
red
by t
heN
ovem
ber
1987
ref
inan
cing
agr
eem
ent
Agr
eem
ent
in p
rinc
iple
of
Mar
ch 1
991;
fina
l ag
reem
ent
Dec
embe
r 20
, 19
91 a
ndcl
osin
g of
agr
eem
ent
on J
anua
ry 2
1,19
92N
ew m
oney
bon
d ex
chan
ge
Buy
-bac
k an
d de
bt e
xcha
nge
Ph
ilip
pin
esA
gree
men
t in
pri
ncip
le o
f O
ctob
er 1
989;
fina
l ag
reem
ent
of F
ebru
ary
1990
:N
ew m
oney
bon
ds o
r lo
ans7
Res
ched
ulin
g of
mat
urit
ies
falli
ng d
uein
199
0-93
Cha
nge
in s
prea
d on
pre
viou
sly
rest
ruct
ured
deb
tW
aive
rs t
o al
low
deb
t bu
y-ba
cks
and
exch
ange
s
Pre
lim
inar
y ag
reem
ent
of A
ugus
t 19
91; t
erm
shee
t F
ebru
ary
1992
, fin
al a
gree
men
tJu
ly 2
4, 1
992
and
clos
ing
of a
gree
men
ton
Dec
embe
r 1,
199
2N
ew m
oney
bon
ds
Col
late
rali
zed
debt
exc
hang
es
Pol
and
Agr
eem
ent
in p
rinc
iple
of
June
16,
198
9D
efer
men
t of
am
orti
zati
on p
aym
ents
fal
ling
due
betw
een
May
198
9 an
d D
ecem
ber
1990
9
100
perc
ent
of p
rinc
ipal
Arr
ears
on
inte
rest
, fe
es,
and
com
mis
sion
s on
let
ters
of
cred
it10
0 pe
rcen
t
1,63
52,
448
4906
3 3 —
20 15 3 N
on-i
nter
est-
bear
ing
Ban
ks w
ould
pro
vide
new
mon
ey i
nan
am
ount
equ
ival
ent
to 2
0 pe
rcen
tof
deb
ts e
xcha
nged
for
non
coll
ater
aliz
edne
w b
onds
.D
ebt
redu
ctio
n (s
ee T
able
A4)
New
mon
ey
100
perc
ent
of p
rinc
ipal
Deb
t re
duct
ion
(see
Tab
le A
4)
15
710
781
Unc
hang
ed
15 15
Old
deb
t (e
qual
to
four
tim
es t
he
1398
new
mon
ey p
rovi
ded)
to
be e
xcha
nged
at p
ar b
ond
for
new
non
coll
ater
aliz
ed b
onds
.D
ebt
redu
ctio
n (s
ee T
able
A4)
100
perc
ent
206
17
Unc
hang
ed
7 8 8 13-16
13-16
13-1617/8 13/16
513
/16
©In
tern
atio
nal M
onet
ary
Fund
. Not
for R
edis
tribu
tion

Tab
le A
3 (c
ontin
ued)
Cou
ntry
, D
ate
of A
gree
men
t,an
d T
ype
of D
ebt
Res
ched
uled
B
asis
Am
ount
Pro
vide
dG
race
Per
iod
Mat
urit
y In
tere
st R
ate
Pol
and
(con
tinue
d)A
gree
men
t in
pri
ncip
le o
f O
ctob
er 1
989
Res
ched
ulin
g of
int
eres
t fa
lling
due
in t
he f
ourt
h qu
arte
r of
198
910
Agr
eem
ent
in p
rinc
iple
on
Mar
ch
10,
1994
;te
rm s
heet
May
23
, 19
94N
ew m
oney
bon
ds
Col
late
rali
zed
debt
exc
hang
e
Ru
ssia
Agr
eem
ent
in p
rinc
iple
of
July
30,
199
3R
esch
edul
ing
of e
xist
ing
stoc
k of
deb
t an
din
tere
st a
rrea
rs
Sen
egal
Agr
eem
ent
of S
epte
mbe
r 19
90
Sou
th A
fric
aD
ebt
arra
ngem
ent
of S
epte
mbe
r 27
, 19
93R
esch
edul
ing
of s
hort
and
med
ium
-ter
m d
ebt
subj
ect
to S
epte
mbe
r 19
85 s
tand
stil
lan
d fa
lling
due
at
expi
rati
onof
thi
rd i
nter
im a
rran
gem
ent
Tri
nida
d an
d T
obag
oA
gree
men
t in
pri
ncip
le o
f N
ovem
ber
1988
;fi
nal
agre
emen
t D
ecem
ber
1989
Med
ium
- an
d lo
ng-t
erm
mat
urit
ies
falli
ng d
ueS
epte
mbe
r 1,
198
8-A
ugus
t 31
, 19
92
Uga
nd
aF
inal
agr
eem
ent:
Feb
ruar
y 26
, 19
93
85 p
erce
nt
(In
mill
ions
of
U.S
. do
llars
)
145
(In
year
s,
unle
ssot
herw
ise
note
d)
(In
perc
ent
spre
adov
er
LIB
OR
/U.S
.pr
ime,
un
less
othe
rwis
e no
ted)
New
mon
ey b
onds
to
be p
rovi
ded
corr
espo
ndin
g to
35
perc
ent
ofde
bt a
lloc
ated
to
debt
con
vers
ion
bond
s (s
ee T
able
A
4)D
ebt
redu
ctio
n (s
ee T
able
A4)
100
perc
ent
of p
rinc
ipal
100
perc
ent
of i
nter
est
arre
ars
24,0
00
3,00
0
10 5 5
15 15 10af
ter
cash
pay
men
ts o
f $5
00 m
illi
on
100
perc
ent
of p
rinc
ipal
37
5,00
0 1
1/8
100
perc
ent
of p
rinc
ipal
Deb
t re
duct
ion
(Tab
le A
4)
446
12 1
/2
/2 41/82
897/813/1
6
13/16
©In
tern
atio
nal M
onet
ary
Fund
. Not
for R
edis
tribu
tion

Uru
guay
Agr
eem
ent
in p
rinc
iple
of
Nov
embe
r 19
90;
fina
l ag
reem
ent
Janu
ary
1991
New
Mon
ey B
ond
Exc
hang
e
Buy
-bac
k an
d de
bt e
xcha
nge
20 p
erce
nt i
ncre
ase
in e
xpos
ure
via
purc
hase
of
new
bon
ds w
ould
enti
tle
bank
s to
exc
hang
e at
par
old
debt
for
non
coll
ater
aliz
ed"d
ebt-
conv
ersi
on n
otes
."D
ebt
redu
ctio
n (s
ee T
able
A4)
89
15
1.0
Ven
ezue
laA
gree
men
t in
pri
ncip
le o
n M
arch
20,
199
0;fi
nal
term
she
et o
f Ju
ne
25,
1990
;fi
nal
agre
emen
t on
Dec
embe
r 5,
199
0N
ew m
oney
bon
d ex
chan
ge
Col
late
rali
zed
debt
exc
hang
es
Old
deb
t (e
qual
to
five
tim
esth
e ne
w m
oney
pro
vide
d) t
o be
exch
ange
d at
par
for
new
,no
ncol
late
rali
zed
bond
s.D
ebt
redu
ctio
n (s
ee T
able
A4)
1,19
7 15
1
and
Zam
bia
Agr
eem
ent
in p
rinc
iple
, Ju
ly 1
, 19
94
Deb
t re
duct
ion
(see
Tab
le A
4)
Sou
rces
: R
estr
uctu
ring
agr
eem
ents
; an
d IM
F st
aff
esti
mat
es.
'Arr
ange
men
ts a
ppro
ved
in p
rinc
iple
bef
ore
Janu
ary
1, 1
989
are
repo
rted
in
prev
ious
bac
kgro
und
pape
rs.
2Vol
unta
ry a
mor
tiza
tion
pay
men
ts m
ade
duri
ng t
he g
race
per
iod
wou
ld b
e m
atch
ed o
n a
1:1
basi
s by
deb
t fo
rgiv
enes
s (e
quiv
alen
t to
a b
uy-b
ack
opti
on a
t 50
ce
nts
on t
he d
olla
r).
inte
rest
rat
e w
ould
be
incr
ease
d by
a m
axim
um o
f 3
perc
enta
ge p
oint
s if
GD
P gr
owth
exc
eeds
a t
hres
hold
rat
e.4S
even
ty p
erce
nt o
f th
ese
arre
ars
wer
e fo
rgiv
en i
n 19
90 u
pon
dow
n-pa
ymen
t eq
ual
to 5
per
cent
of
thes
e ar
rear
s. B
egin
ning
at
the
end
of 1
990
and
prov
ided
tha
t H
ondu
ras
rem
aine
dcu
rren
t on
int
eres
t du
e on
all
resc
hedu
led
amou
nts
unde
r th
e ag
reem
ent,
the
cred
itor
ban
k w
ould
fur
ther
for
give
int
eres
t ar
rear
s by
a y
earl
y am
ount
equ
al t
o 5
perc
ent
of t
he a
rrea
rsou
tsta
ndin
g at
the
end
of
Oct
ober
198
9.5N
ew m
oney
opt
ions
inc
lude
med
ium
-ter
m l
oan,
new
mon
ey b
onds
, on
-len
ding
fac
ility
, an
d m
ediu
m-t
erm
tra
de f
acili
ty.
As
of t
he e
nd o
f M
arch
199
2, $
952
mil
lion
had
bee
n di
sbur
sed.
incl
ud
es $
112
mil
lion
of
prev
ious
ly c
apit
aliz
ed i
nter
est
arre
ars
on l
ette
rs o
f cr
edit
.7A
llow
ance
for
re-
lend
ing
for
up t
o 36
6 da
ys o
f up
to
20
perc
ent
of t
he n
ew m
oney
on
a re
volv
ing
basi
s, o
f w
hich
one
hal
f w
ould
be
avai
labl
e in
any
one
cal
enda
r ye
ar a
nd o
ne h
alf
wou
ld b
e av
aila
ble
to t
he p
riva
te s
ecto
r.8C
omm
itte
d to
the
new
mon
ey o
ptio
n at
the
end
of
June
199
2, w
ith
95 p
erce
nt o
f el
igib
le d
ebt
tend
ered
und
er t
he p
acka
ge.
9Pay
men
t w
as t
o be
def
erre
d un
til
Dec
embe
r 30
, 19
91.
Alt
erna
tive
ly,
bank
s w
ould
rec
eive
pay
men
ts a
ccor
ding
to
the
orig
inal
sch
edul
e in
ret
urn
for
an e
qual
inc
reas
e in
the
sho
rt-t
erm
revo
lvin
g tr
ade
faci
lity.
10P
aym
ent
was
def
erre
d un
til
the
seco
nd q
uart
er o
f 19
90.
nT
he
inte
rest
rat
e of
LIB
OR
plu
s 7/8
appl
ies
to t
he n
ew m
oney
bon
ds i
ssue
d by
the
cen
tral
ban
k (a
s op
pose
d to
bon
ds i
ssue
d by
Ven
ezue
la).
7 77/81
1
©In
tern
atio
nal M
onet
ary
Fund
. Not
for R
edis
tribu
tion

Tab
le A
4. D
ebt
and
Deb
t-Se
rvic
e R
educ
tion
in
Com
mer
cial
Ban
k A
gree
men
ts,
1987
-Jul
y 19
94(B
y ye
ar o
f agr
eem
ent
in p
rinc
iple
)
Fac
e V
alue
of
Deb
tto
Com
mer
cial
Ban
ks
Ret
ired
Is
sued
R
esou
rces
Use
d T
erm
sE
nhan
cem
ents
for
New
Ins
trum
ents
Sp
ecia
l F
eatu
res
Arg
enti
na
(198
7)N
onco
llat
eral
ized
deb
t ex
chan
gew
ith
inte
rest
red
ucti
on
Arg
enti
na
(199
2)P
rinc
ipal
red
ucti
on
(In
mill
ions
of
U.S
. do
llars
)
15
15
6,66
3 4,
331
Inte
rest
red
ucti
on
12,7
34
12,7
34
Bol
ivia
(19
87)
Cas
h bu
y-ba
ck
Col
late
rali
zed
debt
exc
hang
ew
ith
prin
cipa
l re
duct
ion
Deb
t fo
rgiv
enes
s
253
204 16
3,05
9' (
incl
udin
gre
sour
ces
from
IMF,
Wor
ld B
ank,
Inte
r-A
mer
ican
Dev
elop
men
tB
ank,
Exi
mba
nkJa
pan,
and
Arg
enti
na's
ow
nre
sour
ces)
28 (
bila
tera
l do
na-
tion
s)
7 (b
ilat
eral
don
a-ti
ons)
Old
cla
ims
exch
ange
d at
par
for
new
exi
t bo
nds
wit
h a
25-y
ear
mat
urit
y (1
2 ye
ars'
gra
ce)
and
4pe
rcen
t fi
xed
rate
.
Old
cla
ims
exch
ange
d fo
r ne
wbo
nds,
wit
h a
30-y
ear
bull
etm
atur
ity
and
inte
rest
at
LIB
OR
plus
13/1
6, at
pre
nego
tiat
edex
chan
ge r
atio
of
1:0.
65.
Old
cla
ims
exch
ange
d at
par
for
new
bon
ds w
ith
a 30
-yea
r bu
llet
mat
urit
y an
d in
tere
st i
ncre
asin
ggr
adua
lly
from
4 p
erce
nt i
n ye
aron
e, t
o 6
perc
ent
in y
ear
seve
n,an
d re
mai
ning
at
that
lev
el u
ntil
mat
urit
y.
At
prea
nnou
nced
pri
ce o
f 11
cent
s on
the
dol
lar.
Old
cla
ims
exch
ange
d fo
r ne
wze
ro-c
oupo
n 25
-yea
r bo
nd c
ar-
ryin
g 9.
25 p
erce
nt y
ield
at
apr
eann
ounc
ed e
xcha
nge
rati
o of
1:0.
11.
Pri
ncip
al f
ully
coll
ater
aliz
ed a
nd12
-mon
th r
olli
ngin
tere
st g
uara
ntee
base
d on
8 p
erce
ntra
te.
Pri
ncip
al f
ully
coll
ater
aliz
ed a
nd12
-mon
th r
olli
ngin
tere
st g
uara
ntee
base
d on
6 p
erce
ntra
te.
Pri
ncip
al a
nd i
nter
-es
t fu
lly c
olla
tera
l-iz
ed.
New
bon
ds e
xclu
ded
from
fu
ture
new
mon
ey b
ase.
Par
t of
pas
t du
e in
tere
st s
ettl
ed a
tcl
osin
g da
te (
thro
ugh
cash
pay
-m
ents
of
$700
mil
lion
). T
he b
al-
ance
ref
inan
ced
(3 y
ears
' gra
ce)
bear
ing
inte
rest
of
LIB
OR
plu
s%
an
d al
l se
mia
nnua
l am
orti
za-
tion
pay
men
ts r
isin
g fr
om
1 pe
r-ce
nt o
f th
e or
igin
al f
ace
valu
e in
paym
ents
1-7
, 5
perc
ent
in p
ay-
men
t 8,
and
8 p
erce
nt i
npa
ymen
ts 9
-19.
Inte
rest
due
red
uced
to
resp
ecti
vem
onth
ly L
IBO
R t
hrou
gh e
nd o
f19
91,
and
to 4
per
cent
the
reaf
ter.
Bon
ds e
ligi
ble
for
debt
conv
ersi
on.
Pas
t du
e in
tere
st c
ance
led
unde
ral
l op
tion
s. N
ew b
onds
eli
gibl
efo
r de
bt c
onve
rsio
n.
Incl
udes
$0.
6 m
illi
on o
f de
bt-f
or-
natu
re s
wap
.
22
©In
tern
atio
nal M
onet
ary
Fund
. Not
for R
edis
tribu
tion

Bol
ivia
(19
92)
Cas
h bu
y-ba
ck
78
Inte
rest
red
ucti
on
33
33
Pri
ncip
al r
educ
tion
60
10
Bra
zil
(198
8)N
onco
llat
eral
ized
deb
t ex
chan
ge
1,10
0 1,
100
wit
h in
tere
st r
educ
tion
27 (
incl
udin
gre
sour
ces
from
IDA
deb
t-re
duct
ion
faci
l-ity
and
gra
nts
from
the
Uni
ted
Sta
tes,
Sw
eden
,Sw
itze
rlan
d,an
d th
e N
ethe
r-la
nds)
At
prea
nnou
nced
pri
ce o
f 16
cent
s on
the
dol
lar.
Old
cla
ims
exch
ange
d at
par
for
non-
inte
rest
-bea
ring
new
bon
dsw
ith
a 30
-yea
r bu
llet
mat
urit
y.
Old
cla
ims
exch
ange
d fo
r ne
wsh
ort-
term
bon
ds a
t pr
eneg
oti-
ated
exc
hang
e ra
tio
of 1
:0.1
6
Old
cla
ims
exch
ange
d at
par
for
new
exi
t bo
nds
wit
h a
25-y
ear
mat
urit
y (1
0 ye
ars'
gra
ce)
and
6pe
rcen
t fi
xed
rate
.
Pri
ncip
al f
ully
coll
ater
aliz
ed.
Pas
t du
e in
tere
st c
ance
led
unde
ral
l op
tion
s.
Val
ue r
ecov
ery
clau
se b
ased
on
the
wor
ld p
rice
of
tin.
Upo
nm
atur
ity,
bon
ds e
xcha
nged
int
oas
sets
den
omin
ated
in
dom
esti
ccu
rren
cy a
t pr
eneg
otia
ted
rati
o of
1:1.
5 fo
r ap
prov
ed i
nves
tmen
t in
spec
ial
proj
ects
.
New
bon
ds e
xclu
ded
from
fu
ture
new
mon
ey b
ase.
Eli
gibl
e fo
rde
bt-e
quit
y co
nver
sion
pro
gram
.
Bra
zil
(199
2)P
rinc
ipal
red
ucti
on
14,2
10
9,23
7
Inte
rest
red
ucti
on
12,9
92
12,9
92
Tem
pora
ry i
nter
est
redu
ctio
n 2,
030
2,03
0
2,80
0 (o
wn
reso
urce
s an
dab
out
400
of n
ewm
oney
). A
ddi-
tion
al 9
00 a
re t
obe
del
iver
ed i
n th
ene
xt t
wo
year
s.
Old
cla
ims
exch
ange
d fo
r ne
wbo
nds
with
a 3
0-ye
ar b
ulle
tm
atur
ity
and
inte
rest
at
LIB
OR
plus
13/1
6 at
pren
egot
iate
dex
chan
ge r
atio
of
1:0.
65.
Old
cla
im e
xcha
nged
at
par
for
new
bon
ds w
ith
a 30
-yea
r bu
llet
mat
urit
y an
d in
tere
st i
ncre
asin
ggr
adua
lly
from
4 p
erce
nt i
n ye
aron
e, t
o 6
perc
ent
in y
ear
seve
n,an
d re
mai
ning
at
that
lev
el u
ntil
mat
urit
y.
Old
cla
im e
xcha
nged
at
par
for
new
bon
ds w
ith
a 15
-yea
r m
atu-
rity
(9
year
s' g
race
) an
d an
inte
rest
rat
e of
4 p
erce
nt i
n th
eye
ars
1-2,
4.5
per
cent
in
year
s3-
4, 5
per
cent
in
year
s 5-
6, a
ndL
IBO
R p
lus 1
3/16
from
yea
rs 7
to
15.
Pri
ncip
al f
ully
coll
ater
aliz
ed a
nd12
-mon
th r
olli
ngin
tere
st g
uara
ntee
.
Pri
ncip
al f
ully
coll
ater
aliz
ed a
nd12
-mon
th r
olli
ngin
tere
st g
uara
ntee
.
Tw
elve
-mon
thro
llin
g in
tere
st g
uar-
ante
e fo
r th
e fi
rst
six
year
s.
Cas
h pa
ymen
t of
$2.
0 bi
llio
n pa
iddu
ring
May
-Dec
embe
r 19
91.
The
pas
t du
e in
tere
st r
emai
ning
at
end
of 1
990
conv
erte
d in
to a
10-y
ear
bond
(3
year
s' g
race
) at
LIB
OR
plu
s 13/
16. In
tere
st d
ue i
n19
92-9
3 re
duce
d to
4 p
erce
nt.
Rem
aini
ng p
ast
due
inte
rest
acc
u-m
ulat
ed i
n 19
91 a
nd 1
992
is c
on-
vert
ed i
nto
12-y
ear
bond
s (3
year
s' g
race
) at
LIB
OR
plu
s 13
/16;
sem
iann
ual
amor
tiza
tion
pay
-m
ents
of
1 pe
rcen
t of
ori
gina
lpr
inci
pal
for
paym
ents
1-7
, 5
perc
ent
for
paym
ent
8, a
nd 8
per
-ce
nt b
onds
eli
gibl
e fo
r de
bt c
on-
vers
ions
for
pay
men
ts 9
-19.
©In
tern
atio
nal M
onet
ary
Fund
. Not
for R
edis
tribu
tion

Tab
le A
4 (c
ontin
ued)
Fac
e V
alue
of
Deb
tto
Com
mer
cial
Ban
ks
Ret
ired
Is
sued
R
esou
rces
Use
d T
erm
sE
nhan
cem
ents
for
New
Ins
trum
ents
Sp
ecia
l F
eatu
res
(In
mill
ions
of
U.S
. do
llars
)
Bu
lgar
ia (
1993
)C
ash
buy-
back
Pri
ncip
al r
educ
tion
Tem
pora
ry i
nter
est
redu
ctio
n
798
3,73
0
1,65
8
1,86
5
1,65
8
6522(e
xpec
ted
toco
me
from
IM
F,W
orld
Ban
k, a
ndow
n re
sour
ces)
.
Chi
le (
1988
)C
ash
buy-
back
43
9 24
8 (o
wn
reso
urce
s)
At
prea
nnou
nced
pri
ce o
f25
.187
5 ce
nts
on t
he d
olla
r.
Old
cla
ims
exch
ange
d fo
r ne
wbo
nds,
wit
h a
30-y
ear
bull
etm
atur
ity
and
inte
rest
at
LIB
OR
plus
13/1
6, at
pre
nego
tiat
edex
chan
ge r
atio
of
1:0.
50.
Old
cla
ims
exch
ange
d at
par
for
new
bon
ds w
ith
an 1
8-ye
arm
atur
ity
(7 y
ears
' gra
ce)
and
anin
tere
st r
ate
of 2
per
cent
in
year
s 1-
2, 2
.25
perc
ent
in y
ears
3-4,
2.5
per
cent
in
year
5,
2.75
perc
ent
in y
ear
6, 3
per
cent
in
year
7,
and
LIB
OR
plu
s 13
$299
mil
lion
bou
ght
back
in
Nov
embe
r 19
88 a
t av
erag
e pr
ice
of 5
6 ce
nts
on t
he d
olla
r; $
140
mil
lion
bou
ght
back
in
Nov
em-
ber
1989
at
aver
age
pric
e of
58
cent
s on
the
dol
lar.
Pri
ce d
eter
-m
ined
in
Dut
ch a
ucti
on.
Pri
ncip
al f
ully
coll
ater
aliz
ed a
nd12
-mon
th r
olli
ngin
tere
st.
Tw
elve
-mon
thro
llin
g in
tere
st g
uar-
ante
e fo
r th
e fi
rst
seve
n ye
ars.
Buy
-bac
k pr
ice
appl
ies
to p
rinc
i-pa
l an
d in
tere
st a
rrea
rs s
epar
atel
y.
At
clos
ing,
3 p
erce
nt o
f pa
st d
uein
tere
st w
ill
be s
ettl
ed t
hrou
ghca
sh p
aym
ents
. T
he b
alan
ce w
ill
be r
efin
ance
d as
an
unco
llat
eral
-iz
ed 1
7-ye
ar b
ond
(7 y
ears
'gr
ace)
bea
ring
int
eres
t of
LIB
OR
plus
% a
nd s
emia
nnua
l am
orti
za-
tion
pay
men
ts r
isin
g fr
om 1
per
-ce
nt o
f th
e or
igin
al f
ace
valu
e in
paym
ents
1-6
to
3 pe
rcen
t in
pay
-m
ents
7-1
1, t
o 6
perc
ent
in p
ay-
men
ts 1
2-16
and
to
9.8
perc
ent
inpa
ymen
ts 1
7-21
. V
alue
rec
over
ycl
ause
bas
ed o
n G
DP
perf
or-
man
ce.
Pac
kage
inc
lude
s sh
ort-
term
deb
t. A
spe
cial
iss
ue o
fdi
scou
nt a
nd t
empo
rary
int
eres
tre
duct
ion
bond
s w
ill
be m
ade
for
30 p
erce
nt o
f th
e sh
ort-
term
deb
tal
loca
ted
to t
hese
opt
ions
at
anin
tere
st r
ate 1
/2 of
1 p
erce
nt h
ighe
r.T
he p
acka
ge i
nclu
des
a cu
rren
cyop
tion
for
deu
tsch
e m
ark.
Agr
ee-
men
t li
mit
s al
loca
tion
for
tem
po-
rary
int
eres
t re
duct
ion
bond
s to
30 p
erce
nt.
Res
ourc
es u
sed
for
buy-
back
ssu
bjec
t to
agg
rega
te l
imit
of
$500
mil
lion
; de
bt t
o be
ext
ingu
ishe
dsu
bjec
t to
agg
rega
te c
eili
ng o
f $2
bill
ion.
fro
m y
ears
8 t
o 18
.
©In
tern
atio
nal M
onet
ary
Fund
. Not
for R
edis
tribu
tion

Cos
ta R
ica
(198
9)C
ash
buy-
back
Col
late
rali
zed
debt
exc
hang
ew
ith
inte
rest
red
ucti
on
991
290
290
Non
coll
ater
aliz
ed d
ebt
exch
ange
wit
h in
tere
st r
educ
tion
289
289
1963 (
from
bil
at-
eral
and
mul
tila
t-er
al s
ourc
es a
ndC
osta
Ric
a's
own
rese
rves
)
Dom
inic
an R
epu
bli
c (1
993)
Cas
h bu
y-ba
ck
Pri
ncip
al r
educ
tion
272
505
328
Tem
pora
ry i
nter
est
redu
ctio
n
149
(ow
nre
sour
ces)
At
prea
nnou
nced
pri
ce o
f 16
cent
s on
the
dol
lar.
(a)
Old
deb
t ex
chan
ged
at p
arfo
r ne
w 2
0-ye
ar b
ond
(10
year
s'gr
ace)
car
ryin
g 6.
25 p
erce
ntfi
xed,
neg
otia
ted
rate
.
(b)
Pas
t du
e in
tere
st,
afte
r 20
perc
ent
cash
dow
npay
men
t,ex
chan
ged
at p
ar f
or a
new
clai
m w
ith
a 15
-yea
r m
atur
ity
(no
grac
e pe
riod
) an
d L
IBO
Rpl
us 1
3/16
.
(c)
Old
cla
ims
(inc
ludi
ng p
ast
due
inte
rest
) ex
chan
ged
at p
arfo
r a
new
25-
year
bon
d (1
5ye
ars'
gra
ce)
carr
ying
6.2
5 pe
r-ce
nt f
ixed
, ne
goti
ated
rat
e.
(d)
Pas
t du
e in
tere
st,
afte
r a
20pe
rcen
t ca
sh d
ownp
aym
ent,
exch
ange
d at
par
for
a n
ewcl
aim
wit
h a
15-y
ear
mat
urit
y(n
o gr
ace
peri
od)
and
LIB
OR
plus
13/
16.
At
prea
nnou
nced
pri
ce o
f 25
cent
s on
the
dol
lar.
Old
cla
ims
exch
ange
d fo
r ne
wbo
nds
wit
h 30
-yea
r bu
llet
mat
u-ri
ty a
nd i
nter
est
at L
IBO
R p
lus
% a
t pr
eneg
otia
ted
exch
ange
rate
of
1:0.
65.
Old
cla
ims
exch
ange
d at
par
for
new
bon
ds w
ith
an 1
8-ye
arm
atur
ity
(9 y
ears
' gra
ce)
wit
heq
ual
sem
iann
ual
inst
allm
ents
afte
r gr
ace
and
an i
nter
est
rate
of 3
per
cent
in
year
s 1-
2, 3
.5pe
rcen
t in
yea
rs 3
-4,
4 pe
rcen
tin
yea
rs 5
-6,
and
LIB
OR
plu
s%
fro
m y
ears
7 t
o 18
.
(a)
Eig
htee
n-m
onth
inte
rest
gua
rant
ee(e
xces
s en
hanc
e-m
ent
fund
s to
be
appl
ied
to i
ncre
ase
cove
rage
up
to 1
8m
onth
s).
(b)
Thi
rty-
six
mon
thin
tere
st g
uara
ntee
.
Pri
ncip
al f
ully
coll
ater
aliz
ed a
nd9-
mon
th r
olli
ngin
tere
st g
uara
ntee
(to
be c
apit
aliz
edun
til
12 m
onth
s).
Incl
udes
$22
3 m
illi
on o
f pa
st d
uein
tere
st.
(a)
and
(b)
avai
labl
e on
ly t
oba
nks
tend
erin
g at
lea
st 6
0 pe
r-ce
nt o
f th
eir
expo
sure
to
the
buy-
back
opt
ion.
Val
ue r
ecov
ery
clau
se l
inke
d to
GD
P gr
owth
.C
onve
rted
pas
t du
e in
tere
steq
uale
d $5
3 m
illi
on.
(c)
and
(d)
opti
onal
to
bank
s te
n-de
ring
les
s th
an 6
0 pe
rcen
t of
thei
r ex
posu
re (
incl
udin
g pa
st d
uein
tere
st)
to t
he b
uy-b
ack
opti
on.
Con
vert
ed p
ast
due
inte
rest
equa
led
$61
mil
lion
.
(a),
(b)
, (c
), a
nd (
d):
new
bon
dsel
igib
le f
or d
ebt-
equi
ty c
onve
r-si
on p
rogr
am.
Val
ue r
ecov
ery
clau
se a
ctiv
ated
if
GD
P ex
ceed
s 19
89 G
DP
by 1
20pe
rcen
t in
rea
l te
rms.
Buy
-bac
k pr
ice
appl
ies
to p
rinc
i-pa
l an
d in
tere
st a
rrea
rs s
epar
atel
y.
At
clos
ing,
12.
5 pe
rcen
t of
rem
aini
ng p
ast
due
inte
rest
will
be s
ettl
ed t
hrou
gh c
ash
paym
ents
.T
he b
alan
ce w
ill
be r
efin
ance
d as
unco
llat
eral
ized
15-
year
bon
ds(3
yea
rs' g
race
) be
arin
g in
tere
stof
LIB
OR
plu
s %
and
sem
i-an
nual
am
orti
zati
on p
aym
ents
ris
-in
g fr
om 1
per
cent
of
the
orig
inal
face
val
ue i
n pa
ymen
ts 1
-7 a
ndeq
ual
inst
allm
ents
the
reaf
ter.
Agr
eem
ent
incl
uded
a "
pull
-ba
ck"
clau
se i
f ba
nks'
all
ocat
ion
does
not
yie
ld a
t le
ast
50 p
erce
ntde
bt r
educ
tion
.
©In
tern
atio
nal M
onet
ary
Fund
. Not
for R
edis
tribu
tion

Tab
le A
4 (c
ontin
ued)
Fac
e V
alue
of
Deb
tto
Com
mer
cial
Ban
ks
Ret
ired
Is
sued
R
esou
rces
Use
d T
erm
sE
nhan
cem
ents
for
New
Ins
trum
ents
S
peci
al F
eatu
res
(In
mill
ions
of
U.S
. do
llars
)
Ecu
ador
(199
4)P
rinc
ipal
red
ucti
on
Inte
rest
red
ucti
on
2,62
1
1,89
8
1,44
2
Gu
yan
a (1
992)
Cas
h bu
y-ba
ck
Jord
an (
1993
)C
ash
buy-
back
Pri
ncip
al r
educ
tion
5834 e
xpec
ted
toco
me
from
IM
F,W
orld
Ban
k, o
ffi-
cial
sou
rces
, an
dow
n re
sour
ces)
69
10 (
fully
fi
nanc
edby
ID
A d
ebt-
redu
ctio
n fa
cili
ty)
158
1185 (o
wn
reso
urce
s)
Old
cla
ims
exch
ange
d fo
r ne
wbo
nds
wit
h 30
-yea
r bu
llet
mat
u-ri
ty a
nd i
nter
est
at L
IBO
R p
lus
% a
t pr
eneg
otia
ted
exch
ange
rati
o of
1:0
.55.
Old
cla
ims
exch
ange
d at
par
for
new
bon
ds w
ith
30-y
ear
bull
etm
atur
ity
and
inte
rest
inc
reas
ing
grad
uall
y fr
om 3
per
cent
in
year
1 to
5 p
erce
nt i
n ye
ar 1
1, a
ndre
mai
ning
at
that
lev
el u
ntil
mat
urit
y.
At
prea
nnou
nced
pri
ce o
f 14
.5ce
nts
on t
he d
olla
r.
At
prea
nnou
nced
pri
ce o
f 39
cent
s on
the
dol
lar.
Old
cla
ims
exch
ange
d fo
r ne
wbo
nds
wit
h a
30-y
ear
bull
etm
atur
ity
and
inte
rest
at
LIB
OR
plus
% a
t pr
eneg
otia
ted
exch
ange
rat
io o
f 1:
0.65
.
Pri
ncip
al f
ully
coll
ater
aliz
ed a
nd12
-mon
th r
olli
ngin
tere
st g
uara
ntee
base
d on
7 p
erce
nt.
Pri
ncip
al f
ully
coll
ater
aliz
ed a
nd12
-mon
th r
olli
ngin
tere
st g
uara
ntee
at
3.75
per
cent
(to
be
capi
tali
zed
unti
l it
reac
hes
5 pe
rcen
t).
Pri
ncip
al f
ully
coll
ater
aliz
ed a
nd 6
-m
onth
rol
ling
int
er-
est
guar
ante
e ba
sed
on 8
per
cent
.
Part
of
past
due
int
eres
t se
ttle
dbe
fore
clo
sing
(th
roug
h ca
sh p
ay-
men
t of
$75
mil
lion
). T
he b
alan
cew
ill
be r
efin
ance
d as
an
unco
llat
-er
aliz
ed 2
0-ye
ar b
ond
(10
year
s'gr
ace)
bea
ring
int
eres
t of
LIB
OR
plus
% a
nd s
emia
nnua
l am
orti
za-
tion
pay
men
ts r
isin
g fr
om 2
.5 p
er-
cent
of
the
orig
inal
fac
e va
lue
inpa
ymen
ts 1
-6 t
o 4
perc
ent
in p
ay-
men
ts 7
-12,
to
6.78
per
cent
in
paym
ents
13
-21.
The
pas
t du
ein
tere
st b
ond
will
hav
e th
e op
tion
to c
apit
aliz
e in
tere
st d
ue i
n ex
cess
of t
he f
ollo
win
g ra
tes
duri
ng t
hefi
rst
6 ye
ars
of t
he b
ond:
3 p
er-
cent
in
year
s 1-
2, 3
.25
perc
ent
inye
ars
3-4,
and
3.7
5 pe
rcen
t in
year
s 5-
6. A
n un
coll
ater
aliz
ed 1
0-ye
ar i
nter
est
equa
liza
tion
bon
d fo
r$1
91 m
illi
on w
ill b
e is
sued
to
regu
lari
ze p
rese
ntly
dis
crim
ina-
tory
pay
men
ts t
o cr
edit
ors.
Exc
lude
s ex
port
cre
dit
debt
. B
uy-
back
pri
ce a
ppli
ed t
o pr
inci
pal,
past
due
int
eres
t ($
23.5
mil
lion
)ca
ncel
ed.
Buy
-bac
k pr
ice
appl
ies
to p
rinc
i-pa
l an
d in
tere
st a
rrea
rs s
epar
atel
y.
At
clos
ing,
50
perc
ent
of p
ast
due
inte
rest
ass
ocia
ted
wit
h th
e di
s-co
unt
exch
ange
and
10
perc
ent
ofpa
st d
ue i
nter
est
asso
ciat
ed w
ith
the
par
exch
ange
wil
l be
set
tled
thro
ugh
cash
pay
men
ts.
The
bal
-an
ce w
ill
be r
efin
ance
d as
unc
ol-
late
rali
zed
12-y
ear
bond
(3
year
s'gr
ace)
bea
ring
int
eres
t of
LIB
OR
plus
% a
nd e
qual
sem
iann
ual
inst
allm
ents
aft
er g
race
.
1.89
8
243
©In
tern
atio
nal M
onet
ary
Fund
. Not
for R
edis
tribu
tion

Inte
rest
red
ucti
on
493
Mex
ico
(198
8)C
olla
tera
lize
d de
bt e
xcha
nge
wit
h pr
inci
pal
redu
ctio
n
Mex
cio(
1989
)C
olla
tera
lize
d de
bt e
xcha
nge
wit
h pr
inci
pal
redu
ctio
n
Inte
rest
red
ucti
on
Moz
amb
iqu
e (1
991)
Cas
h bu
y-ba
ck
3,67
1 2,
556
20,5
46
13,3
546
22,4
27
22,4
27
124
Nig
er(1
991)
Pri
ncip
al r
educ
tion
11
1
Inte
rest
red
ucti
on
555
(ow
nre
sour
ces)
7,12
2 (i
nclu
ding
reso
urce
s fr
omIM
F an
d W
orld
Ban
k)
12 (
incl
udin
gre
sour
ces
from
IDA
deb
t-re
duc-
tion
faci
lity
and
Fre
nch,
Sw
iss,
Sw
edis
h, a
ndD
utch
gra
nts)
23 (
incl
udin
gre
sour
ces
from
IDA
deb
t-re
duc-
tion
fac
ility
and
Fre
nch
and
Sw
iss
gran
ts)
Old
cla
ims
exch
ange
d at
par
for
new
bon
ds w
ith
a 30
-yea
r bu
llet
mat
urit
y an
d in
tere
st i
ncre
asin
ggr
adua
lly
star
ting
at
4 pe
rcen
t in
year
s 1-
4, 5
per
cent
in
year
5,
5.5
perc
ent
in y
ear
6 an
d 6
per-
cent
fro
m y
ears
7 t
o 30
.
Old
cla
ims
exch
ange
d fo
r ne
wbo
nd w
ith
20-y
ear
bull
et m
atu-
rity
and
LIB
OR
plu
s 1 5/8
; ave
r-ag
e ex
chan
ge r
atio
1:
0.7
(det
erm
ined
in
Dut
ch a
ucti
on).
Old
cla
ims
exch
ange
d fo
r ne
wbo
nd w
ith
30-y
ear
bull
et m
atu-
rity
and
LIB
OR
plu
s 13
/16;
exch
ange
rat
io 1
:0.6
5 (n
egot
i-at
ed).
Old
cla
ims
exch
ange
d at
par
for
new
bon
d w
ith
30-y
ear
bull
etm
atur
ity
and
6.25
per
cent
fix
ed,
nego
tiat
ed i
nter
est
rate
.
At
a pr
eann
ounc
ed p
rice
of
10ce
nts
on t
he d
olla
r.
Old
cla
ims
exch
ange
d fo
r ne
w60
-day
not
es w
ith
face
val
ueeq
uiva
lent
to
18 p
erce
nt o
f ou
t-st
andi
ng f
ace
valu
e of
pri
ncip
al.
Old
cla
ims
exch
ange
d at
par
for
21-y
ear
non-
inte
rest
-bea
ring
note
s.
Pri
ncip
al f
ully
coll
ater
aliz
ed a
nd 6
-m
onth
rol
ling
int
er-
est
guar
ante
e ba
sed
on 6
per
cent
.
Pri
ncip
al f
ully
coll
ater
aliz
ed.
Pri
ncip
al f
ully
coll
ater
aliz
ed a
nd18
-mon
th r
olli
ngin
tere
st g
uara
ntee
Sam
e as
abo
ve
Pri
ncip
al f
ully
gua
r-an
teed
by
BC
EA
O.
Pri
ncip
al f
ully
col
-la
tera
lize
d by
zer
oco
upon
bon
ds p
ur-
chas
ed b
y th
eB
CE
AO
.
Inte
rest
due
aft
er M
arch
199
1 an
dun
til
the
clos
ing
date
red
uced
to
an i
nter
est
rate
of
4 pe
rcen
t.
New
bon
ds e
xclu
ded
from
fut
ure
new
mon
ey b
ase.
Rec
over
y cl
ause
in
case
rea
l oi
lpr
ices
exc
eed
thre
shol
d re
al p
rice
of $
14 a
bar
rel.
New
bon
dsex
clud
ed f
rom
fut
ure
new
mon
eyba
se a
nd e
ligi
ble
for
debt
-equ
ity
conv
ersi
on.
Buy
-bac
k pr
ice
appl
ied
to p
rinc
i-pa
l, pa
st d
ue i
nter
est
canc
eled
.
Buy
-bac
k pr
ice
appl
ied
to p
rinc
i-pa
l, pa
st d
ue i
nter
est
canc
eled
.O
pera
tion
has
bee
n st
ruct
ured
as
a no
vati
on,
that
is,
the
exc
hang
eof
a n
ew o
blig
atio
n fo
r an
old
obli
gati
on t
o av
oid
seek
ing
wai
vers
fro
m c
erta
in p
rovi
sion
sin
exi
stin
g lo
an c
ontr
acts
.
493
©In
tern
atio
nal M
onet
ary
Fund
. Not
for R
edis
tribu
tion

Tab
le A
4 (c
ontin
ued)
Fac
e V
alue
of
Deb
tto
Com
mer
cial
Ban
ks
Ret
ired
Is
sued
R
esou
rces
Use
d T
erm
sE
nhan
cem
ents
for
New
Ins
trum
ents
Sp
ecia
l F
eatu
res
(In
mill
ions
of
U.S
. do
llars
)
Nig
eria
(19
91)
Cas
h bu
y-ba
ck
Inte
rest
red
ucti
on
3,39
0
2,04
8
1,35
6
2,04
8
Ph
ilip
pin
es (
1989
)C
ash
buy-
back
Ph
ilip
pin
es (
1992
)C
ash
buy-
back
Tem
pora
ry i
nter
est
redu
ctio
n
1,33
9
1,26
3
757
757
Pri
ncip
al c
olla
tera
lize
d in
tere
stre
duct
ion
1,89
4 1,
894
l,70
87 (ow
nre
sour
ces)
670
(inc
ludi
ngre
sour
ces
from
IMF
and
Wor
ldB
ank)
.
1,12
5 (i
nclu
ding
reso
urce
s fr
omIM
F, W
orld
Ban
k,E
xim
bank
Jap
an,
and
the
Phi
lip-
pine
s' o
wn
reso
urce
s)
At
prea
nnou
nced
pri
ce o
f 40
cent
s on
the
dol
lar.
Old
cla
ims
exch
ange
d at
par
for
new
reg
iste
red
bond
s w
ith
a 30
-ye
ar b
ulle
t m
atur
ity
and
a fi
xed
inte
rest
rat
e of
5.5
per
cent
for
3ye
ars
and
6.25
per
cent
the
re-
afte
r.
At
prea
nnou
nced
pri
ce o
f 50
cent
s on
the
dol
lar.
At
a pr
eann
ounc
ed p
rice
of
52ce
nts
on t
he d
olla
r.
Old
cla
ims
exch
ange
d at
par
for
new
bon
ds w
ith
15-y
ear
mat
u-ri
ty (
7 ye
ars'
gra
ce)
and
anin
tere
st r
ate
of 4
per
cent
in
the
firs
t tw
o ye
ars,
5 p
erce
nt i
nye
ars
3-5,
6 p
erce
nt i
n ye
ar 6
,an
d L
IBO
R p
lus
% f
rom
yea
r 7
onw
ard.
Old
cla
ims
exch
ange
d at
par
for
new
bon
ds w
ith
a 25
-yea
r bu
llet
mat
urit
y an
d an
int
eres
t ra
te t
hat
grad
uall
y ri
ses
from
4.2
5 pe
r-ce
nt i
n th
e fi
rst
year
to
6.5
per-
cent
in
the
sixt
h ye
ar a
ndre
mai
ns a
t th
at l
evel
unt
ilm
atur
ity.
Pri
ncip
al f
ully
col
-la
tera
lize
d by
U.S
.T
reas
ury
bond
s w
ith
a 12
-mon
th r
olli
ngin
tere
st g
uara
ntee
,ba
sed
on r
ate
of 6
.25
perc
ent.
Tw
elve
-mon
thro
llin
g in
tere
st g
uar-
ante
e ba
sed
on a
6pe
rcen
t an
nual
rat
efo
r th
e fi
rst
six
year
s.
Pri
ncip
al f
ully
coll
ater
aliz
ed a
nd14
mon
ths'
rol
ling
inte
rest
gua
rant
eeba
sed
on a
rat
e of
6.5
perc
ent.
All
pas
t du
e in
tere
st c
lear
ed p
rior
to c
losi
ng d
ate.
Rec
over
y cl
ause
in t
he e
vent
tha
t oi
l pr
ices
exc
eed
thre
shol
d of
$28
a b
arre
l in
199
6,ad
just
ed f
or i
nfla
tion
th
erea
fter
.N
ew b
onds
eli
gibl
e fo
r de
bt c
on-
vers
ions
.
Incl
uded
wai
ver
for
seco
nd r
ound
of b
uy-b
acks
.
©In
tern
atio
nal M
onet
ary
Fund
. Not
for R
edis
tribu
tion

Pol
and
(199
4)C
ash
buy-
back
Pri
ncip
al r
educ
tion
Inte
rest
red
ucti
on
2,45
4
5,33
6
1,74
3
2,93
5
1,74
3
Non
coll
ater
aliz
ed d
ebt
exch
ange
wit
h in
tere
st r
educ
tion
386
386
Uga
nd
a (1
993)
Cas
h bu
y-ba
ck
153
1,86
68 (ex
pect
edto
com
e fr
om I
MF,
Wor
ld B
ank,
off
i-ci
al s
ourc
es,
and
own
reso
urce
s)
18 (
incl
udin
gre
sour
ces
from
IDA
deb
t-re
duc-
tion
fac
ility
and
gran
ts f
rom
the
Net
herl
ands
,S
wit
zerl
and,
Ger
-m
any,
and
the
EC
)
At
prea
nnou
nced
pri
ce o
f 41
cent
s on
the
dol
lar
for
med
ium
-an
d lo
ng-t
erm
deb
t an
d 38
cen
tson
the
dol
lar
for
shor
t-te
rmde
bt.
Old
cla
ims
exch
ange
d fo
r ne
wbo
nds
wit
h a
30-y
ear
bull
etm
atur
ity
and
inte
rest
at
LIB
OR
plus
% a
t pr
eneg
otia
ted
exch
ange
rat
io o
f 1:
0.55
.
Old
cla
ims
exch
ange
d at
par
for
new
bon
ds w
ith
a 30
-yea
r bu
llet
mat
urit
y an
d in
tere
st i
ncre
asin
ggr
adua
lly
from
2.7
5 pe
rcen
t in
year
1 to
5 p
erce
nt f
rom
yea
r 21
onw
ard.
Old
cla
ims
exch
ange
d at
par
for
debt
con
vers
ion
bond
s w
ith
25-y
ear
mat
urit
y (2
0 ye
ars'
grac
e) a
nd i
nter
est
incr
easi
nggr
adua
lly
from
4.5
per
cent
in
year
1 to
7.5
per
cent
fro
m y
ear
11 a
nd r
emai
ning
at
that
lev
elun
til
mat
urit
y.
At
prea
nnou
nced
pri
ce o
f 12
cent
s on
the
dol
lar.
Pri
ncip
al f
ully
coll
ater
aliz
ed;
noin
tere
st c
olla
tera
l.
Pri
ncip
al f
ully
coll
ater
aliz
ed;
noin
tere
st c
olla
tera
l.
Sep
arat
e pa
r bo
nds
wit
h sl
ight
lydi
ffer
ent
inte
rest
pro
file
for
med
ium
- an
d lo
ng-t
erm
and
sho
rt-
term
deb
t. P
aym
ent
of 8
5 pe
rcen
tof
int
eres
t du
e in
Dec
embe
r 19
89an
d 30
per
cent
of
inte
rest
due
accr
uing
fro
m M
ay 1
993
expe
cted
befo
re c
losi
ng. T
he b
alan
ce w
ill
besu
bjec
t to
deb
t-se
rvic
e re
duct
ion
thro
ugh
an u
ncol
late
rali
zed
20-
year
bon
d (7
-yea
rs' g
race
) be
arin
gan
int
eres
t ra
te g
radu
ally
inc
reas
-in
g fr
om 3
.25
perc
ent
in y
ear
1 to
7 pe
rcen
t in
yea
r 9
and
rem
aini
ngat
tha
t le
vel
unti
l m
atur
ity.
Am
orti
-za
tion
pay
men
ts a
re s
emia
nnua
lri
sing
fro
m 1
per
cent
of
the
orig
i-na
l fa
ce v
alue
in
paym
ents
1-3
to
2 pe
rcen
t in
pay
men
ts 4
-6,
to 3
perc
ent
in p
aym
ents
7-1
7, t
o 5
perc
ent
in p
aym
ents
18-
23,
to 7
perc
ent
in p
aym
ents
24-
27.
Buy
-bac
k pr
ice
appl
ied
to p
rinc
i-pa
l, pa
st d
ue i
nter
est
canc
eled
.
©In
tern
atio
nal M
onet
ary
Fund
. Not
for R
edis
tribu
tion

Tab
le A
4 (c
ontin
ued)
Fac
e V
alue
of
Deb
tto
Com
mer
cial
Ban
ks
Ret
ired
Issu
edR
esou
rces
Use
dT
erm
sE
nhan
cem
ents
for
New
Ins
trum
ents
Spec
ial
Fea
ture
s
(In
mill
ions
of
U.S
. do
llars
)
Uru
guay
(19
91)
Cas
h bu
y-ba
ck
633
Inte
rest
red
ucti
on
530
530
Ven
ezue
la (
1990
)C
olla
tera
lize
d de
bt e
xcha
nges
Pri
ncip
al r
educ
tion
1,
411
647
Pri
ncip
al r
educ
tion
1,
808
1,26
5
Inte
rest
red
ucti
on
7,45
0 7,
450
Tem
pora
ry i
nter
est
redu
ctio
n 3,
018
3,01
8
463
(inc
ludi
ngre
sour
ces
from
the
IDB
)
2,58
5 (i
nclu
ding
reso
urce
s fr
omIM
F an
d W
orld
Ban
k)
At
prea
nnou
nced
pri
ce o
f 56
cent
s on
the
dol
lar.
Old
cla
ims
exch
ange
d at
par
for
new
bon
ds w
ith
a 30
-yea
r bu
llet
mat
urit
y an
d a
fixe
d in
tere
st r
ate
of 6
.75
perc
ent.
Old
cla
ims
exch
ange
d fo
r ne
wth
ree-
mon
th n
otes
wit
h pr
esen
tva
lue
equa
l to
45
perc
ent
offa
ce v
alue
of
old
clai
ms.
Old
cla
ims
exch
ange
d fo
r ne
wbo
nd w
ith
30-y
ear
mat
urit
y an
dL
IBO
R p
lus
% a
t pr
eneg
otia
ted
exch
ange
rat
io o
f 1:
0.70
.
Old
cla
ims
exch
ange
d at
par
for
new
bon
d w
ith
30-y
ear
mat
urit
yan
d fi
xed
inte
rest
rat
e of
6.7
5pe
rcen
t.
Old
cla
ims
exch
ange
d fo
r ne
wbo
nd w
ith
17-y
ear
mat
urit
y an
din
tere
st r
ate
of 5
per
cent
in
year
s 1-
2, 6
per
cent
in
year
s3-
4, 7
per
cent
in
year
fiv
e, a
ndL
IBO
R p
lus 7
/8 o
f 1 p
erce
ntth
erea
fter
.
Pri
ncip
al f
ully
col
-la
tera
lize
d an
d an
18-m
onth
rol
ling
inte
rest
gua
rant
ee.
Fac
e va
lue
of n
otes
fully
col
late
rali
zed
by s
hort
-ter
m U
.S.
Tre
asur
y se
curi
ties
.
Pri
ncip
al f
ully
coll
ater
aliz
ed a
nd14
-mon
th r
olli
ngin
tere
st g
uara
ntee
.
Prin
cipa
l fu
llyco
llat
eral
ized
and
14-m
onth
rol
ling
inte
rest
gua
rant
ee.
Tw
elve
-mon
thro
llin
g-in
tere
st g
uar-
ante
e fo
r th
e fi
rst
five
yea
rs.
Val
ue r
ecov
ery
clau
se a
llow
ing
for
larg
er p
aym
ents
in
the
even
tof
a f
avor
able
per
form
ance
of
anin
dex
of U
rugu
ay's
ter
ms
oftr
ade.
Eli
gibl
e fo
r de
bt-e
quit
y co
nver
-si
on.
Incl
udes
war
rant
s to
be
trig
gere
d in
cas
e oi
l pr
ices
exc
eed
thre
shol
d pr
ice
of $
26 a
bar
rel
in19
96,
adju
sted
for
inf
latio
n th
ere-
afte
r th
roug
h 20
20.
Eli
gibl
e fo
r de
bt-e
quit
yco
nver
sion
.
Zam
bia
(19
94)
200
22 (
incl
udin
gre
sour
ces
from
IDA
deb
t-re
duc-
tion
faci
lity
and
gran
ts f
rom
Ger
-m
any,
the
Net
her-
land
s, S
wed
en,
and
Sw
itze
rlan
d)
At
a pr
eann
ounc
ed p
rice
of
11ce
nts
on t
he d
olla
r.B
uy-b
ack
pric
e ap
plie
d to
pri
nci-
pal,
past
due
int
eres
t ca
ncel
ed.
©In
tern
atio
nal M
onet
ary
Fund
. Not
for R
edis
tribu
tion

Sou
rces
: D
ebt-
rest
ruct
urin
g ag
reem
ents
; an
d IM
F st
aff
esti
mat
es.
Not
e:
BC
EA
O =
Ban
que
Cen
tral
e de
s E
tats
de
L'A
friq
ue d
e L
'Oue
st;
IDA
= I
nter
nati
onal
Dev
elop
men
t A
ssoc
iati
on;
IDB
= I
nter
-Am
eric
an D
evel
opm
ent
Ban
k.'E
xclu
des
$700
mil
lion
in
dow
npay
men
t on
pas
t du
e in
tere
st.
2Exc
lude
s $6
4 m
illi
on i
n do
wnp
aym
ent
on p
ast
due
inte
rest
.3E
xclu
des
$29
mil
lion
in
dow
npay
men
t on
pas
t du
e in
tere
st.
4Exc
lude
s $7
5 m
illi
on i
n in
tere
st e
qual
izat
ion
paym
ents
.5E
xclu
des
$29
mil
lion
in
dow
npay
men
t on
pas
t du
e in
tere
st.
incl
ud
es $
2,44
7 m
illi
on o
f de
bt o
f do
mes
tic
com
mer
cial
ban
ks,
for
whi
ch n
o en
hanc
emen
ts w
ere
prov
ided
(th
e G
urri
a bo
nds)
.7E
xclu
des
$373
mil
lion
of
cash
pay
men
ts t
o cl
ear
all
inte
rest
arr
ears
.8E
xclu
des
$158
mil
lion
in
catc
h-up
and
dow
npay
men
t on
pas
t du
e in
tere
st.
©In
tern
atio
nal M
onet
ary
Fund
. Not
for R
edis
tribu
tion

STATISTICAL APPENDIX
Table A5. International Bond Issues by Developing Countries and Regions, by Type of Borrower(In millions of U.S. dollars)
Sovereign borrowersArgentinaBarbadosChileChinaColombiaCongoCzech RepublicCzechoslovakia, formerHungaryIsraelMexicoPhilippinesSlovak RepublicSouth AfricaThailandTrinidad and TobagoTunisiaTurkeyUruguayVenezuela
Other public sectorAlgeriaArgentinaBrazilChinaColombiaCosta RicaCzech RepublicCzechoslovakia, formerGuatemalaHong KongHungaryIndiaIndonesiaKoreaMacaoMalaysiaMexicoPhilippinesSlovak RepublicSouth AfricaThailandTurkeyVenezuela
1990
1,520—
———
887—40——
——
593——
3,55189—
——
—375
——
27380
755
—1,851
———
—127
1991
4,189500
200
——
2771,186
400620——
236
——
497—
273
3,827——
1,341115—
—
——
227
705
—1,192
——
17—
230
1992
5,490425
120
———
1,242—
377——
318300100—
2,508100—
8,054——
1,3201,359
—
—114
——
2501,742
—1,432
——
408
572857
1993
16,3782,111
582216—
697216
4,7332,002
352150240
343125—
3,725100
1,003
16,441—
3501,8372,443
250
—
6010263
3,987
9544,401
615—
250130
1,000
First Half
1993
6,502256
125—
375—
1,5801,000
259150—
149——
2,053100455
7,186—
150940
1,157150
—
—63
1,340
5002,462
175——
250—
1994
6,852657
20
1,823250
———
2581,958
——
189—
277720100—
6,185—
100350548
—50
250
——
100179437155600
3,24015421
—
60
©International Monetary Fund. Not for Redistribution

Statistical Appendix
Table A5 (concluded)
Private sectorArgentinaBoliviaBrazilChileChinaColombiaCzechoslovakia, formerHong KongIndiaIndonesiaKoreaMalaysiaMexicoPakistanPanamaPeruPhilippinesSingaporeTaiwan Province of ChinaThailandTurkeyUruguayVenezuela
Total
Memorandum itemsShare in total issues by developing
countries and regions (in percent)Sovereign issuesOther public issuesPrivate sector issues
1990
1,26321
—
—66
350—
586
—105—
——
135
6,335
24.056.119.9
1991
4,823295
496—
—100
3691,307
—1,971
—50
——
160———75
12,838
32.629.837.6
1992
10,2381,145
2,335
185
2431,466
—4,292
——60
312111—75
23,780
23.133.943.1
1993
26,6183,772
4,842433
23100
5,785546485
1,877—
6,030
30528
—79
1,6545040
345
59,437
27.627.744.8
First
1993
8,538535
2,022333
50
657
30674
—3,620
—
20—36
392504080
22,226
29.332.338.4
Half
1994
13,0741,610
10845
83
1,855534
1,2701,415
3651,457
45
80555
86876
1,92365——
26,111
26.223.750.1
Sources: IMF staff estimates based on International Financing Review, Euroweek, and Financial Times.
61
©International Monetary Fund. Not for Redistribution

Tab
le A
6.
Yie
ld S
prea
d at
Lau
nch
for
Une
nhan
ced
Bon
d Is
sues
by
Dev
elop
ing
Cou
ntri
es a
nd R
egio
ns1
(In
basi
s po
ints
)
1993
1994
1990
1991
1992
1993
I
II
III
IV
I
H_
248
223
223
134
180
—
255
280
120
220
450
_
89
88
94
98
215
—
126
148
184
255
223
238
200
226
—
149
—
344
—
74
—
54
480
_
_
—
221
196
221
179
196
228
230
—
355
482
428
284
245
r public
sector
250
373
232
179
199
187
200
148
177
162
Algeria
540
446
465
518
528
390
413
407
—
145
395
Sov
erei
gn b
orro
wer
Arg
enti
naB
arba
dos
Chi
leC
hina
Col
ombi
aC
zech
Rep
ubli
cC
zech
oslo
vaki
a, f
orm
erH
unga
ryM
exic
oP
hili
ppin
esS
lova
k R
epub
lic
Sou
th A
fric
aT
hail
and
Tri
nida
d an
d T
obag
oT
unis
iaT
urke
yU
rugu
ayV
enez
uela
Oth
er p
ubli
c se
ctor
Alg
eria
Arg
enti
naB
razi
lC
hina
Col
ombi
aC
osta
Ric
aC
zech
Rep
ubli
cC
zech
oslo
vaki
a, f
orm
erG
uate
mal
aH
unga
ryIn
dia
Indo
nesi
aK
orea
Mal
aysi
aM
exic
oP
hili
ppin
esS
lova
k R
epub
lic
Sou
th A
fric
aT
hail
and
Tur
key
Ven
ezue
la
151 — — 133
— — — 166
— — 250
100
— — 96 — 127
— 366 — — — 260
261
456
150
281
249
201
190
— 234
222
294
150
240
215
198
100
565
207
275
230
269
00 OO
178
230 — 235
189
320
344 67
480
193
228
236 — — 270
240
208
320 57 — 205
— 446
110
— — — 129 89 205 — 159
242
440
465 82 217
605
324 83 96 192
250 40 205
440
518 57 — 82 190
— 43
— 528 64 218
324 86 100
182
310 38
— 390 98 — 605 89 213
265
413
108
215 — — 81 91 187
217
205
140
158 67
247
205
192
190
182
213
187
154
126
178
250
325
275
263
212
212
158
333
120
©In
tern
atio
nal M
onet
ary
Fund
. Not
for R
edis
tribu
tion

Pri
vate
sec
tor
Arg
enti
naB
oliv
iaB
razi
lC
hile
Col
ombi
aC
zech
oslo
vaki
a, f
orm
erH
ong
Kon
gIn
dia
Indo
nesi
aK
orea
Mex
ico
Pan
ama
Peru
Phi
lipp
ines
Tha
ilan
dT
urke
yU
rugu
ayV
enez
uela
Tot
al
650
730 — — — — — — — 613 — — — — — 693
245
493
447
530 — — — — — 533 24 — — — — — 362
346
376
419
516 — 300
180
116
377 — — 43 250 — 375
282
348
397
505
194
310
118
110
410 87 358
706
375 60 — 300
469
259
424
623
642 —_
— 133
— 500 86
413 — — — 250 — — 288
370
533
563
210
320 — — 76 347 — — 58 — — 450
274
339
371 — 473 — 300 83 110
— 90 365 — 375 — — — 516
249
315
371
425
170
— 126
— 405 92 331
706 — 75 — — 468
243
256
310
428
386 — — — — 68 253 — 680 — 127 — — — 187
337
411 — 465
641 — 115
— 467 69 430 — — 340 94 — — — 259
Sou
rces
: IM
F st
aff
esti
mat
es b
ased
on
Inte
rnat
iona
l F
inan
cing
Rev
iew
, E
urow
eek,
and
Fin
anci
al
Tim
es.
'Yie
ld s
prea
d m
easu
red
as t
he d
iffe
renc
e be
twee
n th
e bo
nd y
ield
at
issu
e an
d th
e pr
evai
ling
yie
ld f
or i
ndus
tria
l co
untr
y go
vern
men
t bo
nds
in t
he s
ame
curr
ency
and
of
com
para
ble
mat
urit
y. A
ll f
igur
es a
re w
eigh
ted
aver
ages
.
©In
tern
atio
nal M
onet
ary
Fund
. Not
for R
edis
tribu
tion

Tab
le A
7. M
atur
ing
Bon
ds o
f D
evel
opin
g C
ount
ries
and
Reg
ions
(In
mill
ions
of
U.S
. do
llars
)
Africa
Asia Ch
ina
Hong
Kon
gKorea
Thailand
Europe
Hungary
Turkey
Middle East
Western Hemisphere
Argentina
Brazil
Mexi
co
Total
1993 — 123 80 66 66 879
2,995
812
1,026
1,122
4,063
1994 159
578
378
200
1,160
4,947
435
2,381
1,986
7,045
1995 89
1,674
249
259
947
1,490
318
782 —
7,588
1,082
3,037
2,555
10,841
1996 236
3,451
398
710
1,535
79
2,629
1,138
1,015
160
9,421
1,730
2,559
3,451
15,897
1997 602
4,021
808 80
1,447
405
2,236
355
1,783
—
7,060
885
820
4,523
13,919
1998 —
6,887
1,658
1,893
2,219
574
2,875
1,097
1,658
352
10,590
2,100
1,566
5,753
20,704
1999 123
4,267
915
227
1,517
479
3,458
1,837
1,371
122
3,062
425
157
2,355
11,032
2000 —
4,064
198
2,194
818
149
2,916
1,399
1,075
340
3,058
960
100
1,437
10,378
2001 —
2,845
143
908
155
519
903
300
602 —
1,760
590
1,070
5,508
2002 —
1,325
50 750
340
875
443
432 —
1,035
350
485
3,235
2003 —
6,192
820
1,150
1,550
1,322
3,062
1,974
1,089
—
3,756
1,450
400
1,123
13,282
2004 877
2,629
1,000
364
935
402
288
117
2,035
350
1,435
6,060
2005-2007
—
1,021
786 — — —
1,021
Sou
rces
: In
tern
atio
nal
Fin
anci
ng R
evie
w;
Eur
owee
k;
and
IMF
staf
f es
tim
ates
.
©In
tern
atio
nal M
onet
ary
Fund
. Not
for R
edis
tribu
tion

Statistical Appendix
Table A8. International Bond Issues by Developing Countries by Currency of Denomination(In millions of U.S. dollars)
U.S. dollarAfrican borrowersAsian borrowersEuropean borrowersLatin American borrowersMiddle Eastern borrowers
Deutsche markAfrican borrowersAsian borrowersEuropean borrowersLatin American borrowers
YenAfrican borrowersAsian borrowersEuropean borrowersLatin American borrowers
European currency unit (ECU)African borrowersAsian borrowersEuropean borrowersLatin American borrowers
Other currenciesAsian borrowersEuropean borrowersLatin American borrowers
Total
Memorandum itemsShare in total issues by
developing countriesU.S. dollarsDeutsche markYenECUOther
Share in total issues in globalbond market
U.S. dollarsDeutsche markYenECUOther
1990
3,890—
960550
2,380—
1,69389
283983337
450—
259190—
127
127——
175127——
6,335
6127
723
328
149
38
1991
8,755—
1,683300
6,372400
1,618236
96961326
1,458—
1,001457
—
423
242181
585—
242181
12,838
68131135
307
141140
1992
16,991—
4,1431,014
11,834—
2,013408125
1,063417
3,554—
1,3062,247
—
630630
186126
593—
186126
23,780
718
1532
3911137
34
1993
44,192—
16,7001,395
24,0952,002
4,521
—3,2851,236
7,965—
3,0994,078
787
——
2,759———
59,437
(In percent)
748
1335
3613121138
First
1993
16,796—
4,301575
10,9201,000
1,699
—1,370
329
3,118—
1,0092,108
—
——
614220
67328
22,226
758
14
3
351312
140
Half
1994
21,207600
9,943336
8,3701,958
688
206—
482
2,692277
1,694720
—
——
1,5241,266
258—
26,111
813
10—
6
377
132
41
Sources: IMF staff estimates based on International Financing Review, Euroweek, and Financial Times.
65
©International Monetary Fund. Not for Redistribution

STATISTICAL APPENDIX
Table A9. Enhancements of International Bond Issues by Developing Countries1
(Number of issues featuring enhancements in percent of total issues by region)
AfricaSecured
AsiaConvertiblePut optionWarrant
EuropeGuaranteedSecuredPut option
Middle EastGuaranteed
Western HemisphereConvertibleGuaranteedSecuredPut optionWarrant
All developing countriesConvertibleGuaranteedSecuredPut optionWarrant
Memorandum itemsAmount raised through enhanced instruments
(in percent of total)
All developing countriesAfricaAsia 7EuropeMiddle EastWestern Hemisphere
1990
_
—
1818——
77
—
_
—
413
2813—
2762
146
—
31—3911—59
1991
_
—
5656
4—
—
100100
22
814—
3320
149
—
31—18—
10034
1992
_
—
382525
6
14—
59
_
—
1811
108
—
22717
121
20—35
8—26
1993
_
—
484120
1
3—
3—
100100
121
471
251423
111
21—19
1100
12
First
1993
_
—
362323—
7—
7—
100100
122
461
20733
101
16—50
1100
13
Half
1994
5050
655634—
13—13—
100100
168
35
—
4836
33
22—
4368
510023
Sources: IMF staff estimates based on International Financing Review, Euroweek, and Financial Times.1 Totals by region may be smaller than the sum of their components because some issues feature multiple enhancements.
66
©International Monetary Fund. Not for Redistribution

Statistical Appendix
Table A10. Granger Causality Tests on Daily Data of Brady Par Bond Prices1
DependentVariable
Argentina
Brazil
Venezuela
Philippines
Nigeria
Mexico
Source: Reuters Data Base.Note: * denotes that coefficients are statistically significant at a 5 percent level; ** denotes that coefficients are statistically significant at
a 1 percent level.'The following regression was tried for different lags (i.e., different values of k). If Granger causality was found for k > 1, only the value
for k - 1 is reported here:
IndependentVariable
Mexico
Mexico
Mexico
Mexico
Mexico
ArgentinaBrazilVenezuelaPhilippinesNigeria
Coefficientfor
IndependentVariable (Bi()
0.0276
0.0499
-0.0022
0.0173
0.0056
-0.0088-0.00530.0034
-0.00470.0021
T-Value
2.2250
2.2753
-0.6335
3.7506
1.6855
-1.4816-0.80100.9191
-1.12910.4741
(*)
(*)
(**)
Sample Period
01/02/91-06/20/94
07/30/93-06/20/94
01/02/91-06/20/94
01/02/91-06/20/94
01/02/91-06/20/94
01/02/91-06/20/9407/30/93-06/20/9401/02/91-06/20/9401/02/91-06/20/9401/02/91-06/20/94
where if /3; = 0 (/ = 1,2,3, . . . , k), xt fails to cause yt.
67
©International Monetary Fund. Not for Redistribution

STATISTICAL APPENDIX
Table All . Granger Causality Tests on Daily Data of Sovereign Eurobond Prices1
DependentVariable
IndependentVariable
Coefficientfor
IndependentVariable (fi{) T-Value Sample Period
Argentina (1)(2)
Brazil (1)(2)
Venezuela (1)(2)(3)
Philippines (1)
(2)
Turkey (1)
Hungary (1)
Mexico (1)
Mexico (1)
Mexico (1)
Mexico (1)
Mexico (1)
Mexico (1)
Mexico (1)
Argentina (1)(2)
Brazil (1)(2)
Venezuela (1)(2)(3)
Philippines (1)(2)
Turkey (1)Hungary (1)
-0.00420.0118
0.00410.0107
0.03390.02790.1271
0.01290.0808
0.0234
0.0653
0.0121-0.0016-0.0023-0.0035-0.00090.00130.0016
-0.0065-0.00280.0059
-0.0039
-1.41891.8193
1.54293.1970
3.33073.39782.1626
2.53203.7377
3.6438
5.3052
2.8046-0.6937-1.2590-0.7198-0.13390.50370.6114
-1.3571-0.3609
1.6003-1.4616
(**)
(**)(**)(*)
(*)(**)
(**)
(**)
(**)
09/13/91-10/06/9309/30/92-06/24/94
05/22/92-06/24/9409/18/91-06/24/94
03/09/93-06/24/9408/23/91-06/24/9411/14/91-06/24/94
02/23/93-06/24/9407/22/93-06/24/94
07/31/90-06/24/94
06/21/91-06/24/94
09/13/91-10/06/9309/30/92-06/24/9405/22/92-06/24/9409/18/91-06/24/9403/09/93-06/24/9408/23/91-06/24/9411/14/91-06/24/9402/23/93-06/24/9407/22/93-06/24/9407/31/90-06/24/9406/21/91-06/24/94
Source: Reuters Data Base.Note: * denotes that coefficients are statistically significant at a 5 percent level; :
a 1 percent level.'The following regression was tried for different lags (i.e., different values of k).
for k = 1 is reported here:
* denotes that coefficients are statistically significant at
If Granger causality was found for k > 1, only the value
where if pj = 0 (/ = 1,2,3, . . . , k ) , xt fails to cause yt.
68
©International Monetary Fund. Not for Redistribution

Tab
le A
12.
Em
ergi
ng M
arke
ts M
utua
l Fu
nds
(Net
ass
ets
in m
illio
ns o
f U
.S.
dolla
rs)
Eq
uit
ies
Glo
bal
Asi
a Reg
iona
lC
hina
Hon
g K
ong
Indi
aIn
done
sia
Kor
eaM
alay
sia
and
Sin
gapo
reP
akis
tan
Phi
lipp
ines
Sri
Lan
kaT
aiw
an P
rovi
nce
of C
hina
Tha
ilan
dV
iet
Nam
Lat
in A
mer
ica
Reg
iona
lA
rgen
tina
Bra
zil
Chi
leC
olom
bia
Mex
ico
Per
u
Eur
ope
Reg
iona
lT
urke
y
Afr
ica
Bon
ds Tot
al f
unds
Net
asse
ts
5,85
7
900
4,43
71,
750 47 270 35 990 75 — 45 — 80 845 — 520 — — 220 — — 300 — — — — 275
6,13
2
1988
Num
ber
of f
unds
91 15 72 35 2 3 1 10 3—
3— 4 11 — 4 — — 3—
1— _ — — —
1989
Net
asse
ts
9,97
5
1,35
0
7,43
53,
100 50 300
260
1,21
524
0 — 280 — 600
1,39
0 — 985
175 — 320
160
330 — 205 90 115
— 500
10,4
75
Num
ber
of f
unds
142 18 112 50 2 4 7 13 7 — 7
— 4 18 — 9 2—
3 2 2—
3 2 1
—
Net
asse
ts
13,3
20
2,30
0
9,24
04,
000 60 830
525
1,20
550
5 — 240 — 475
1,40
0 —
1,45
538
0 — 165
380
530 — 325
210
115
— 900
14,2
20
1990
Num
ber
of f
unds
225 29 174 75 3 6 18 17 17 —8
— 5 25 — 16 5—
3 4 4 — 6 4 2
—
1991
Net
asse
ts
19,1
80
3,75
0
11,5
755,
350
110
970
400
1,31
060
0 65 290 — 890
1,58
0 10
3,52
51,
510
115
380
740
780 — 330
240 90 —
1,70
0
20,8
80
Num
ber
of f
unds
290 39 211 92 4 6 18 24 17 2 8
— 13 261
33 18 2 4 4 5 — 7 5 2
—
1992
Net
asse
ts
29,5
35
7,75
0
16,8
238,
000
1,30
034
81,
090
440
1,71
064
5 65 350 — 925
1,92
0 30
4,51
72,
000
105
485
850 17
1,04
0 20
430
350 80 15
3,75
0
33,2
85
Num
ber
of f
unds
465 78 312
115 34 19 7 21 38 23 3 9 — 15 26 2 64 40 2 8 4 1 8 1 10 8 2 1
1993
Net
asse
ts
73,0
43
24,7
50
38,4
6521
,500
3,22
059
12,
055
860
3,42
01,
039
310
670 30
1,86
02,
860 50
9,06
85,
200
170
625
1,11
5 631,
865 30
715
570
145 45
8,50
0
81,5
43
Num
ber
of f
unds
573
108
372
130
48 20 13 22 56 21 6 10 1 16 26 3 78 53 3 8 4 1 8 1 13 11 2 2
Sou
rces
: E
mer
ging
Mar
ket
Fun
ds R
esea
rch,
Inc
; an
d L
ippe
r A
naly
tica
l S
ervi
ces,
Inc
.
©In
tern
atio
nal M
onet
ary
Fund
. Not
for R
edis
tribu
tion

STATISTICAL APPENDIX
Table A13. Net Bond and Equity Purchases by Emerging Markets Mutual Funds1
(In millions of U.S. dollars)
Equities
Global
AsiaRegionalChinaHong KongIndiaIndonesiaKoreaMalaysia and SingaporePakistanPhilippinesSri LankaTaiwan Province of ChinaThailandViet Nam
Latin AmericaRegionalArgentinaBrazilChileColombiaMexicoPeru
EuropeRegionalTurkey
Africa
Bonds
Total funds
1989
784
-32
620317-14
—24
13216092
131—
-78-145
—
120106—50
118
-154—
755322
—
784
1990
6,464
1,076
4,6321,976
26—
412285407331
302—
368525—
652185'—
244124
99—
103102
1
—
400
6,864
1991
2,511
457
1,79887640—
2146352
5425
-6 9—
427-64
9
57267
21- 6 0-13
-158—
19914158
—
323
2,834
1992
8,448
3,908
3,385- 1,577
1,016271-77
30342-64
343
—388
-15016
738446
28108
712
11720
393313
80
24
827
9,275
1993
12,615
6,372
4,9493,075
857-74563-35
1,131-140
95-84
1790
-540- 4
1,4031,320
- 6-149
- 425
2135
-115-81-33
6
248
12,864
Sources: Emerging Market Funds Research, Inc.; Lipper Analytical Services, Inc.; and IMF staff estimates.1Estimated by deflating changes in the stock of fund net assets by IFC investable share prices indices for equities and by the J.R Morgan
Eurobond price index for bonds.
70
©International Monetary Fund. Not for Redistribution

Statistical Appendix
Table A14. Issues of Closed(In millions of U.S. dollars)
Developing countries
Global funds
AfricaMulticountrySpecific country
MauritiusSouth Africa
AsiaMulticountrySpecific country or region
ChinaIndiaIndonesiaKoreaMalaysiaPakistanPhilippinesSingaporeSri LankaTaiwan Province of ChinaThailandViet Nam
EuropeMulticountrySpecific country
BulgariaCzechoslovakiaHungaryPolandTurkey
Middle EastEgyptIsrael
Western HemisphereMulticountrySpecific country
ArgentinaBrazilChileMexicoVenezuela
Memorandum itemsEquity fundsFixed income funds
End Funds
1989
1,859
76
_——
—
1,417487930
168199—
150—
253—
56105—
13645
136—
80
56
_——
230178230
——
230
—
Targeting
1990
3,482
36
_——
—
1,895602
1,294
105312478292
———
107—
976841135—
100
35
_——
575203372
——
180192—
Emerging
1991
1,193
253
_——
—
213—
213
140—23——
40
10
———
—
—
_——
727440288
56—
132100
Markets in
1992
1,421
137
_————
87022
848646
170—
6——
26
—
122—
122—312269—
_——
293181112—
112
——
Developing Countries
1993
4,151
2,669
16——16—
1,373566806456
110—
178——
62
3232——
—
—
5050—
1010———
—
2,0752,076
and Regions
1994
I
4,246
1,042
369302
66
66
2,095651
1,444192
1,138———
——5064
—
312312——
—
—
146—
146
283283———
—
4,098148
II
510
106
_——
—
122—
122
122———————
—
———
—
—
_——
282282———
—
381129
Source: Lipper Analytical Services, Inc.
71
©International Monetary Fund. Not for Redistribution

STATISTICAL APPENDIX
Table A15. Bank Credit Commitments by Country or Region of Destination1
(In billions of U.S. dollars)
Developing countries
AfricaAlgeriaAngolaCote d'lvoireGhanaMoroccoNigeriaSouth AfricaTunisiaZimbabweOther
AsiaChinaHong KongIndiaIndonesiaKoreaMalaysiaPakistanPhilippinesSingaporeTaiwan Province of ChinaThailandViet NamOther
EuropeBulgariaCzech RepublicHungarySlovak RepublicTurkeyU.S.S.R., formerOther
Middle EastBahrainEgyptKuwaitJordanSaudi ArabiaOther
Western HemisphereArgentinaBrazilChileColombiaMexicoUruguayVenezuelaBanking centers (Cayman
and Bahamas)Other
Memorandum itemsTotal bank credit commitmentsShare of bank credit commitments
to developing countries in total(in percent)
1990
24.6
0.6——
0.10.1—
—
0.4
13.41.51.10.73.92.00.50.40.70.30.81.3—0.2.
4.9
——1.83.00.1
1.71.6—
0.10.1
4.0—
0.3—1.6—1.4
—0.7
124.5
19.8
1991
28.5
0.20.1—
0.1
—
—0.1—
14.62.30.7—5.03.50.20.1—0.40.71.6—0.3
1.9
0.1—1.6—0.2
10.70.4—5.5
4.50.3
1.0—
—0.20.60.1—
—0.1
116.0
24.6
1992
18.5
0.6—0.3
0.1
——0.1
0.1
11.92.71.00.21.81.81.2
—0.40.82.0——
2.1
0.2—1.8—0.1
3.00.1—
2.9—
0.9—0.20.4—0.2—
0.2
——
117.9
15.7
1993
21.2
0.2——
—
——0.10.1—
15.73.62.0—1.91.91.6
—0.40.93.4——
2.6
0.20.30.11.9——
0.40.1—
0.20.1
2.20.40.20.30.10.4—0.8
0.1—
136.7
15.5
First Half1993
11.2
0.1——
—
—
0.1
—
8.72.61.2—0.71.20.8
—0.40.31.4—0.1
1.4
0.20.1—1.0—0.1
0.30.1—
0.2—
0.7—
0.10.4—0.2
——
74.1
15.2
1994
11.4
0.1———0.1
——0.1
—
9.21.90.60.11.60.81.7
——
2.3—0.2
0.6
—0.2—0.2—0.2
1.30.5—
0.20.6
0.2—
0.1—0.1——
——
54.8
20.7
Source: Organization for Economic Cooperation and Development, Financial Statistics Monthly.'Covers only medium- and long-term loans that are not insured by export credit agencies and includes offshore banking centers.
72
©International Monetary Fund. Not for Redistribution

Tab
le A
16.
Ter
ms
on S
yndi
cate
d B
ank
Cre
dits
for
Sel
ecte
d D
evel
opin
g C
ount
ries
and
Reg
ions
1
1990
Mat
urit
y S
prea
d M
atur
ity
1991
Spr
ead
1992
Mat
urit
y S
prea
d
1993
Mat
urit
y S
prea
d
Jan.
-Jun
e
Mat
urit
y
1993
Spr
ead
Jan.
-Jun
e
Mat
urit
y
1994
Spr
ead
Afr
ica
Alg
eria
Tun
isia
Zim
babw
e
Asi
a Chi
naH
ong
Kon
gIn
dia
Indo
nesi
aK
orea
Mal
aysi
aP
akis
tan
Sin
gapo
reT
aiw
an P
rovi
nce
of C
hina
Tha
ilan
d
Eur
ope
Hun
gary
2
Tur
key2
Mid
dle
Eas
tB
ahra
inK
uwai
tSa
udi
Ara
bia
Wes
tern
Hem
isph
ere
Chi
leC
olom
bia
Mex
ico
Uru
guay
Ven
ezue
la
10.8
5.3
9.1
10.5
10.2
13.3
13.0
9.3
61 52 32 76 48 58 100 34
(In
year
s)
(In
basi
s (I
n ye
ars)
poin
ts)
7.0
1.0
9.3
7.8
9.5
1.0
3.8
2.3
7.8
6.0
2.4
4.8
5.0
3.0
12.8
13.0
8.8
8.0
2.2
8.6
14.4
54 82 65 43
(In
basi
spo
ints
)
75 85 114 66 67 102 90 134 93 78 138 85 67 50 38 150
(In ye
ars)
4.0 1.0
7.5
6.5
4.6
5.7
5.5
9.9
2.4
5.3
6.1
2.9
2.0
9.0
1.0
1.2
(In
basi
spo
ints
)
101 85 111 96 100
134 68 78 104 82 134
133 75 38 75 134
(In ye
ars)
(I
n ba
sis
poin
ts)
6.0 1.0
7.9
7.8
5.0
3.0
4.0
6.4
3.6
5.1
8.3
2.7
4.2
6.7
6.5
126 95 96 69 260
157 66 57 110
104
102
200 94 125
300
223
(In years)
(In basis
points)
6.0
7.5
9.2
3.7
4.8
7.8
5.3
4.3
4.8
9.9
2.8
6.7
126
300
174
(In
year
s)
(In
basi
spo
ints
)
99 53 155 64 60 1.25
101 99 266 90
7.7
6.4
2.2
4.2
6.0
10.9 3.0
5.0
4.7
5.3
2.0
5.8
3.0
98 58 140
126 78 93 125
100 98 172 65 99 100
6.0
250
Sou
rces
: O
rgan
izat
ion
for
Eco
nom
ic C
oope
rati
on a
nd D
evel
opm
ent
(OE
CD
); a
nd E
urom
oney
Loa
nwar
e.'E
xclu
des
conc
erte
d co
mm
itm
ents
.2B
ased
on
Eur
omon
ey L
oanw
are
for
1992
-Jun
e 19
94.
8998
8.8
8.8
999.
98.
8
©In
tern
atio
nal M
onet
ary
Fund
. Not
for R
edis
tribu
tion

STATISTICAL APPENDIX
Table A17. Correlation Among Total Returns on Bonds for Selected Countries
United StatesHungaryTurkeyVenezuelaBrazilArgentinaMexicoThailand
United StatesHungaryTurkeyVenezuelaBrazilArgentinaMexicoThailand
United States
1.000.250.650.480.19
—0.660.94
United States
1.000.960.950.740.510.800.880.98
Hungary
1.000.160.320.27
-0.060.650.33
Hungary
1.000.880.670.610.920.980.96
Turkey
1.00-0.03-0.29
0.160.440.65
Turkey
1.000.600.240.670.780.92
April 1992-December 1993Venezuela
1.000.35
-0.030.710.48
January-JuneVenezuela
1.000.590.460.600.64
Brazil
1.00-0.24
0.330.16
1994Brazil
1.000.750.680.56
Argentina
1.000.090.01
Argentina
1.000.960.88
Mexico
1.000.72
Mexico
1.000.90
Thailand
1.00
Thailand
1.00
Sources: Reuters News Service; and Bloomberg Business News.
74
©International Monetary Fund. Not for Redistribution

Tab
le A
18.
Cor
rela
tion
Am
ong
Seco
ndar
y M
arke
t P
rice
s of
Bra
dy B
onds
Arg
entin
aB
razi
lB
ulga
ria
Ecu
ador
Mex
ico
Mor
occo
Nig
eria
Pan
ama
Per
uP
hili
ppin
esP
olan
dR
ussi
aV
enez
uela
Thi
rty-
year
U.S
.T
reas
ury
bond
Arg
enti
naB
razi
lB
ulga
ria
Ecu
ador
Mex
ico
Mor
occo
Nig
eria
Pan
ama
Per
uP
hili
ppin
esP
olan
dR
ussi
aV
enez
uela
Thi
rty-
year
U.S
.T
reas
ury
bond
Arg
enti
na
1.00
0.47
0.27
0.60
0.50
0.70
0.72
0.77
0.14
0.30
0.61
0.07
0.31
0.06
Arg
enti
na
1.00
0.97
0.92
0.87
0.98
0.98
0.96
0.90
0.96
0.97
0.94
0.95
0.94
0.88
Bra
zil
1.00
1.65
-0.1
4-0
.24
-0.0
70.
720.
20-0
.26
-0.5
2-0
.15
0.74
0.12
-0.6
8
Bra
zil
1.00
0.91
0.82
0.93
0.98
0.92
0.82
0.92
0.91
0.90
0.93
0.95
0.87
Bul
gari
a
1.00
-0.0
5-0
.12
-0.2
00.
510.
17-0
.43
-0.3
6-0
.20
0.54
0.50
-0.4
5
Bul
gari
a
1.00
0.94
0.93
0.91
0.88
0.92
0.97
0.90
0.98
0.94
0.85
0.73
Ecu
ador
1.00
0.80
0.86
0.14
0.64
0.50
0.82
0.73
-0.4
80.
41
0.53
Ecu
ador
1.00
0.89
0.82
0.85
0.96
0.96
0.86
0.93
0.90
0.76
0.58
Mex
ico
1.00
0.75
0.10
0.51
0.28
0.79
0.73
-0.5
30.
53
0.73
Mex
ico
1.00
0.95
0.95
0.92
0.96
0.94
0.95
0.95
0.89
0.85
Feb
ruar
y-D
ecem
ber
Mor
occo
1.00
0.22
0.76
0.53
0.74
0.85
-0.4
80.
18
0.55
Nig
eria
1.00
0.35
-0.1
3-0
.21
0.03
0.55
0.34
-0.4
0
Janu
ary-
Dec
embe
r
Mor
occo
1.00
0.93
0.83
0.93
0.93
0.91
0.94
0.96
0.90
Nig
eria
1.00
0.89
0.93
0.94
0.89
0.94
0.87
0.85
1992
Pan
ama
1.00
0.14
0.45
0.78
-0.2
60.
28
0.35
1993
Pan
ama
1.00
0.96
0.89
0.94
0.91
0.75
0.63
Per
u
1.00
0.62
0.23
-0.3
1-0
.28
0.27
Per
u
1.00
0.94
0.98
0.96
0.86
0.75
Phi
lipp
ines
1.00
0.64
-0.6
60.
25
0.75
Phi
lipp
ines
1.00
0.91
0.89
0.91
0.84
Pol
and
1.00
-0.6
30.
16
0.67
Pol
and
1.00
0.94
0.85
0.76
Rus
sia
1.00
-0.0
1
-0.8
8
Rus
sia
1.00
0.86
0.81
Ven
ezue
la
1.00
0.21
Ven
ezue
la
1.00
0.87
©In
tern
atio
nal M
onet
ary
Fund
. Not
for R
edis
tribu
tion

Tab
le A
18 (
conc
lude
d)
Arg
entin
aB
razi
lB
ulga
riaE
cuad
orM
exic
oM
oroc
coN
iger
iaPa
nam
aPe
ruPh
ilipp
ines
Pola
ndR
ussi
aV
enez
uela
Thi
rty-y
ear U
.S.
Tre
asur
y bo
nd
Arg
entin
a
1.00
0.87
0.84
0.90
0.98
0.90
0.98
0.85
0.94
0.98
0.97
0.11
0.97
0.95
Bra
zil
1.00
0.95
0.86
0.91
0.64
0.89
0.86
0.91
0.88
0.83
0.68
0.85
0.94
Bul
garia
1.00
0.76
0.87
0.58
0.83
0.77
0.82
0.83
0.77
0.65
0.80
0.89
Ecu
ador
1.00
0.91
0.87
0.92
0.93
0.95
0.89
0.92
0.75
0.89
0.86
Mex
ico
1.00
0.84
0.97
0.85
0.95
0.96
0.95
0.86
0.97
0.97
Febr
uary
-Dec
embe
rM
oroc
co
1.00
0.86
0.82
0.86
0.88
0.92
0.77
0.86
0.76
Nig
eria
1.00
0.83
0.95
0.97
0.96
0.86
0.92
0.96
1992
Pana
ma
1.00
0.94
0.86
0.86
0.60
0.78
0.83
Peru
1.00
0.95
0.94
0.79
0.92
0.93
Phili
ppin
es
1.00
0.95
0.83
0.96
0.95
Pola
nd
1.00
0.87
0.96
0.90
Rus
sia
1.00
-0.0
1
0.80
Ven
ezue
la
1.00
0.94
Sour
ce:
Salo
mon
Bro
ther
s.
©In
tern
atio
nal M
onet
ary
Fund
. Not
for R
edis
tribu
tion

Statistical Appendix
Table A19. Correlation Among Total Returns on Equity for Selected Countries
BrazilMexicoArgentinaVenezuelaThailandMalaysiaTurkeyUnited StatesUnited KingdomJapan
BrazilMexicoArgentinaVenezuelaThailandMalaysiaTurkeyUnited StatesUnited KingdomJapan
Brazil
1.000.170.390.27
-0.12-0.08
0.100.640.140.20
Brazil
1.000.430.310.37
-0.64-0.74
0.060.760.690.88
Mexico
1.000.42
-0.060.300.40
-0.420.290.56
-0.11
Mexico
1.000.960.180.40
-0.340.070.400.740.17
Argentina
1.00-0.03
0.230.14
-0.070.270.49
—
Argentina
1.000.350.46
-0.18-0.08
0.290.730.12
January 1992-December
Venezuela
1.000.040.260.280.22
-0.24-0.10
Venezuela
1.00-0.23-0.07-0.32
0.340.390.51
Thailand
1.000.520.05
-0.100.27
-0.04
Malaysia
1.000.15
-0.130.330.20
January-June 1994
Thailand
1.000.430.18
-0.30-0.12-0.72
Malaysia
1.00-0.03-0.45-0.18-0.37
1993
Turkey
1.00-0.07-0.21
0.17
Turkey
1.000.62
-0.070.13
United States
1.000.350.14
United States
1.000.540.78
United Kingdom
1.000.19
United Kingdom
1.000.67
Japan
1.00
Japan
1.00
Source: IFC Emerging Markets data base.
77
©International Monetary Fund. Not for Redistribution

Tab
le A
20.
Prov
isio
ning
Reg
ulat
ions
Aga
inst
Cla
ims
on D
evel
opin
g C
ount
ries
Cou
ntry
Bel
gium
Can
ada
Fra
nce
Japa
n
Net
herl
ands
Sw
itze
rlan
d
Pro
visi
onin
gR
egul
atio
nsP
roce
ss f
orG
radu
atio
n
Act
ual
Ran
ge o
fP
rovi
sion
ing1
(End
of
1992
)
Tra
de/I
nter
bank
Cla
ims
Gua
rant
eed
OE
CD
Exp
ort
Cre
dit
Age
ncy
Col
late
rali
zed
Cla
ims2
Sub
part
icip
atio
nof
Off
icia
l A
genc
y/IF
Is
Man
dato
ry:
20,
30, 5
0,an
d 60
per
cent
on
4gr
oups
of
coun
trie
s.
Man
dato
ry:
Min
imum
35
perc
ent
to46
cou
ntri
es.
Man
dato
ry:
Ave
rage
55 p
erce
nt t
o ab
out
80co
untr
ies.
7
Vol
unta
ry.8
Indi
cati
ve:
30 p
erce
nt t
oun
disc
lose
d ba
sket
of
coun
trie
s.10
Man
dato
ry:
10-9
0 pe
rcen
t ag
ains
tap
prox
imat
ely
45co
untr
ies.
Indi
cati
ve:
5-10
0 pe
rcen
t ag
ains
tap
prox
imat
ely
90co
untr
ies.
Pro
visi
onin
g le
vels
revi
ewed
sem
i-an
nual
ly.
Cou
ntry
rem
oved
afte
r la
pse
of 5
yea
rssi
nce
prev
ious
resc
hedu
ling
.4
Cou
ntry
con
side
red
for
rem
oval
fro
mba
sket
if
bank
s co
n-si
sten
tly
redu
ce p
ro-
visi
onin
g fo
r th
eco
untr
y.
Not
app
lica
ble.
Cou
ntry
rem
oved
from
bas
ket
afte
r 5
year
s ha
ve l
apse
dsi
nce
prev
ious
resc
hedu
ling
.
Pro
visi
onin
g le
vels
revi
ewed
sem
i-an
nual
ly.
55-6
0 pe
rcen
t
50-6
3 pe
rcen
t5
37-6
8 pe
rcen
t
73-9
0 pe
rcen
t
30-3
5 pe
rcen
t
60
perc
ent
60-9
0 pe
rcen
t
Tra
de c
redi
ts t
o li
mit
of
12 m
onth
s' e
xpos
ure
base
(pro
visi
onin
g re
quir
ed o
nno
nper
form
ing
trad
e cr
ed-
its w
ith
arre
ars
of m
ore
than
six
mon
ths)
.
No
spec
ific
gui
danc
e on
allo
cati
on o
f pr
ovis
ioni
ngby
typ
e of
cre
dit.
Exp
osur
e ba
se i
nclu
des
shor
t-te
rm i
nter
bank
clai
ms
but
excl
udes
sho
rt-
term
tra
de c
redi
ts a
ndth
ose
guar
ante
ed b
yO
EC
D e
xpor
t cr
edit
agen
cies
.
Cas
e by
cas
e.9
No
spec
ific
gui
danc
e on
allo
cati
on o
f pr
ovis
ioni
ngby
typ
e of
cre
dit.
Exp
osur
e ba
se e
xclu
des
clai
ms
for
whi
ch a
guar
ante
e ha
s be
enob
tain
ed.
Ban
ks m
ay i
ndiv
idua
lly
deci
de o
n th
e le
vel
of p
ro-
visi
ons
for
shor
t-te
rmcr
edit
.
Tha
t pa
rt o
f th
ecl
aim
whi
ch i
sle
gall
y se
cure
d by
aca
sh d
epos
it,
orse
curi
ties
iss
ued,
is
exem
pted
.
Exc
lusi
on f
or O
EC
Dgo
vern
men
t se
curi
-ti
es u
sed
as c
olla
t-er
al o
n pr
inci
pal.
6
For
col
late
rali
zed
prin
cipa
l, pr
ovis
ion-
ing
cons
ider
edun
war
rant
ed.
Cas
e by
cas
e.9
Pre
sent
val
ue o
f co
l-la
tera
l on
int
eres
t or
prin
cipa
l ta
ken
into
cons
ider
atio
n.
Cer
tain
col
late
ral-
ized
cre
dit
isex
clud
ed.
For
col
late
rali
zed
prin
cipa
l, pr
ovis
ion-
ing
cons
ider
edun
war
rant
ed.
Cou
ntry
Dis
crim
i-na
tion
3
Par
tici
pati
on i
n "B
" Y
eslo
ans
of t
he I
FC a
nd i
nco
fina
ncin
g tr
ansa
c-ti
ons
of t
he E
BR
D i
sex
empt
ed.
No
spec
ific
gui
danc
e.
No
On
a se
lect
ive
basi
s,
No
som
e lo
ans
wit
h su
b-pa
rtic
ipat
ion
are
excl
uded
for
pro
visi
on-
ing
purp
oses
.
Cas
e by
cas
e.9
Yes
9
No
spec
ific
gui
danc
e.
No
Som
e co
fina
ncin
g Y
escl
aim
s w
ith
cert
ain
mul
tila
tera
l an
dre
gion
al d
evel
opm
ent
bank
s ex
clud
ed.
Cas
e by
cas
e.
Yes
Ger
man
y
©In
tern
atio
nal M
onet
ary
Fund
. Not
for R
edis
tribu
tion

Uni
ted
Kin
gdom
Uni
ted
Stat
es
Indi
cati
ve:
Ban
k of
Eng
land
guid
elin
e; 5
-100
perc
ent
on a
ppro
xi-
mat
ely
55 c
ount
ries
.11
Indi
cati
ve/M
anda
tory
:O
n lo
ans
that
are
eva
lu-
ated
val
ue i
mpa
ired
.
The
mat
rix
allo
ws
for
regu
lar
re-a
sses
s-m
ent,
whi
ch c
an l
ead
to l
ower
rec
om-
men
ded
prov
isio
ning
rang
e.
The
IC
ER
C m
eets
thre
e ti
mes
a y
ear
tore
view
cou
ntry
ran
k-in
gs a
nd s
tatu
s of
valu
e-im
pair
edco
untr
ies.
49-8
0 pe
rcen
t
24-6
0 pe
rcen
t
If a
cre
dit
is c
onsi
dere
d to
have
a h
ighe
r pr
obab
ilit
yof
rep
aym
ent,
nota
bly
inth
e ca
se o
f sh
ort-
term
cred
its
and
inte
rban
kcl
aim
s, t
hese
are
tre
ated
mor
e fa
vora
bly
or c
an b
eex
clud
ed a
ltog
ethe
r fr
omth
e ca
lcul
ated
exp
osur
eba
se.
Pro
visi
onin
g is
req
uire
don
all
loan
s ex
cept
perf
orm
ing
trad
e an
din
terb
ank
cred
its.
Cas
e by
cas
e.
Col
late
rali
zed
prin
-ci
pal
is f
acto
red
into
calc
ulat
ion
for
rese
rve
requ
irem
ent.
Som
e lo
ans
wit
hsu
bpar
tici
pati
on a
reex
clud
ed f
or p
rovi
sion
-in
g pu
rpos
es.
Yes
Con
side
red
on a
cas
e-by
-cas
e ba
sis.
Yes
Sou
rces
: N
atio
nal
Aut
hori
ties
; pr
ess
repo
rts;
and
Wor
ld B
ank
Tec
hnic
al P
aper
No.
158
.N
ote:
IC
ER
C =
Int
erag
ency
Cou
ntry
Exp
osur
e R
evie
w C
omm
itte
e; I
FC
= I
nter
nati
onal
Fin
ance
Cor
pora
tion
; E
BR
D =
Eur
opea
n B
ank
for
Rec
onst
ruct
ion
and
Dev
elop
men
t.1In
per
cent
of
rele
vant
exp
osur
e; n
umbe
rs i
ndic
ate
rang
e fo
r m
ajor
ban
ks.
2Ind
icat
es u
nder
wha
t ci
rcum
stan
ces
the
asse
ssm
ent
of e
xpos
ure
is a
djus
ted
for
coll
ater
aliz
ed c
laim
s fo
r pr
ovis
ioni
ng p
urpo
ses.
3Ind
icat
es w
hich
reg
ulat
ory
auth
orit
ies
asse
ss t
he e
xpos
ure
base
by
indi
vidu
al c
ount
ry p
erfo
rman
ce.
4The
tim
e pe
riod
can
be
redu
ced
to t
wo
year
s if
the
cou
ntry
can
dem
onst
rate
an
abil
ity
to r
aise
new
fun
ds o
n a
volu
ntar
y un
secu
red
basi
s on
the
int
erna
tion
al c
apit
al m
arke
ts.
5Bas
ed o
n en
d-of
-199
3 da
ta.
6A o
ne-f
or-o
ne a
djus
tmen
t is
mad
e (i
.e.,
if c
olla
tera
l on
ly p
arti
ally
cov
ers
asse
t, th
e un
cove
red
port
ion
is f
acto
red
into
the
cal
cula
tion
for
tot
al e
xpos
ure
requ
irin
g pr
ovis
ioni
ng).
7Man
dato
ry t
arge
t is
set
by
indu
stry
ave
rage
of
prev
ious
fis
cal
year
.8A
dequ
acy
judg
ed a
gain
st i
ndus
try
aver
age.
9Ban
ks i
ndiv
idua
lly
dete
rmin
e th
e re
quir
emen
t fo
r pr
ovis
ions
in
liai
son
wit
h th
eir
exte
rnal
aud
itor
s.
In t
his
cont
ext,
allo
wan
ce c
an b
e m
ade
by c
redi
t ty
pe a
nd b
y co
untr
y ri
sk.
10U
ntil
Mar
ch 1
991,
the
25 p
erce
nt l
evel
rep
rese
nted
a m
axim
um
stat
utor
y ca
p.
Alt
houg
h th
is i
s no
lon
ger
the
case
, th
e le
vel
is s
et t
o pr
ovid
e an
ind
icat
ive
guid
elin
e.11
The
Ban
k of
Eng
land
doe
s no
t in
stru
ct p
rovi
sion
ing
agai
nst
a se
t lis
t of
cou
ntri
es;
this
is
left
up
to i
ndiv
idua
l ba
nks
to d
eter
min
e us
ing
the
Ban
k's
mat
rix
crit
eria
.
©In
tern
atio
nal M
onet
ary
Fund
. Not
for R
edis
tribu
tion

STATISTICAL APPENDIX
Table A21. Net Foreign Direct Investment Flows to Developing Countries(In billions of U.S. dollars)
Developing countries1
AfricaAlgeriaBotswanaCameroonGabonMoroccoNigeriaSouth AfricaTunisiaOther
AsiaChinaIndiaIndonesiaKoreaMalaysiaMyanmarPakistanPapua New GuineaPhilippinesSingaporeSri LankaThailandOther
EuropeU.S.S.R., formerCzechoslovakia, formerHungaryPolandRomaniaTurkeyOther
Latin AmericaArgentinaBoliviaBrazilChileColombiaCosta RicaDominican RepublicEcuadorGuatemalaJamaicaMexicoParaguayPeruTrinidad and TobagoVenezuelaOther
Middle EastEgyptUnited Arab EmiratesYemen, Republic ofOther
1988
19.2
1.1—
—0.40.10.40.10.1—
10.52.30.30.60.70.7—
0.20.11.03.5—1.0—
0.90.5
—
0.4—
6.91.1
2.90.10.20.10.10.10.1—1.7——
0.10.10.2
-0.21.10.2
-0.3-1.2
1989
21.5
2.8—0.1——0.22.4
-0.40.10.2
10.72.60.30.70.51.7—0.20.20.81.9—1.70.1
0.9-0.3
0.30.2
0.70.1
6.41.0
0.70.30.50.10.20.10.10.12.6—
0.10.10.20.3
0.71.20.2
-0.2-0.5
1990
23.5
1.2—0.1—
-0.10.20.6
-0.10.20.3
13.82.70.41.2
-0.12.30.20.20.10.53.9—2.20.1
0.8-0.7
0.20.3
0.70.3
7.11.9
0.20.60.50.10.10.10.10.12.50.1—
0.10.50.2
0.60.70.2
-0.2-0.1
1991
33.8
1.2-0.1
—-0.2
0.40.6—
0.20.3
15.43.70.21.5
-0.24.00.20.30.20.73.2—1.40.1
3.2
0.61.50.1
0.80.2
10.92.40.1—0.50.40.20.10.10.10.14.80.10.10.21.60.3
3.10.30.20.32.3
1992
44.4
1.1—0.10.1—0.50.8
-0.90.20.2
20.67.10.31.7
-0.34.50.10.30.20.74.3—1.50.1
5.11.11.11.50.30.10.80.2
14.24.20.11.30.60.70.20.20.10.10.15.40.10.10.20.50.3
3.40.40.20.72.1
Est.
1993
55.5
1.50.10.10.1
-0.30.50.6—0.20.2
30.317.00.62.0
-0.34.30.30.30.10.64.00.11.20.1
6.71.80.92.30.60.10.90.1
12.83.30.1—1.40.80.10.10.50.10.14.90.10.50.30.10.3
4.50.50.20.73.0
Est.
1991-93
134.0
3.8—0.20.2
-0.51.42.0
-0.90.60.7
66.327.8
1.15.2
-0.812.80.60.90.52.0
11.50.14.10.3
15.02.92.65.31.00.22.50.5
37.99.90.31.32.51.90.50.40.70.30.3
15.10.30.70.72.20.9
11.01.20.61.77.4
Source: IMF, World Economic Outlook.1 Taiwan Province of China is excluded from this group because it has become a significant provider of foreign direct investment in recent
years.
80
©International Monetary Fund. Not for Redistribution

Bibliography
Campbell, H., "Portfolio Enhancement Using Emerging Marketsas Conditioning Information," paper presented at WorldBank Symposium on Portfolio Investment in DevelopingCountries, Washington, D.C., September 1993.
Campbell, J.Y., and A.S. Kyle, "Smart Money, Noise Trading,and Stock Price Behavior," Review of Economic Studies,Vol. 60 (January 1993), pp. 1-34.
Cardoso, E., and R. Dornbusch, "Foreign Private CapitalFlows" in Handbook of Development Economics, Vol. 2,ed. by Hollis Chenery and T.N. Srinivasan (Amsterdam;New York: North-Holland, 1988).
Claessens, S, "Alternative Forms of External Finance: A Sur-vey," World Bank Research Observer, Vol. 8 (January1993), pp. 91-117.
, M. Dooley, and A. Warner, "Portfolio Capital Flows: Hotor Cool?" World Bank Discussion Paper, August 27,1993.
Collyns, Charles, and others, Private Market Financing forDeveloping Countries (Washington: International Mone-tary Fund, 1993, 1992, and 1991).
Dooley, Michael, "An Analysis of the Debt Crisis," IMF Work-ing Paper, WP/86/14 (Washington: International Mone-tary Fund, 1986).
Edwards, Sebastian, "Capital Flows, Foreign Direct Investment,and Debt-Equity Swaps in Developing Countries,"National Bureau of Economic Research Working Paper,No. 3497 (October 1990).
Goldsbrough, David J., "Investment Trends and Prospects: TheLink with Bank Lending" in Investing in Development:New Roles for Private Capital, ed. by Theodore T. Moranand others (New Brunswick, Connecticut: TransactionBooks, 1986)
Goldstein, Morris, and M. Mussa, "The Integration of WorldCapital Markets," IMF Working Paper, WP/93/95 (Wash-ington: International Monetary Fund, 1993).
Goldstein, Morris, and others, International Capital MarketsPart II, Systemic Issues in International Finance (Wash-ington: International Monetary Fund, August 1993).
, International Capital Markets: Developments, Prospects,and Key Policy Issues (Washington: International Mone-tary Fund, 1994).
Graham, Edward M., and Paul R. Krugman, "The Surge in For-eign Direct Investment in the 1980s" in Foreign DirectInvestment, ed. by Kenneth Froot (Chicago: University ofChicago Press, 1993).
Grossman, S. J., and J.E. Stiglitz, "On the Impossibility of Infor-mationally Efficient Markets," American EconomicReview, Vol. 70 (1980).
International Finance Corporation (1994a), Emerging MarketsFactbook (Washington: IFC, 1994).
(1994b), Quarterly Review of Emerging Markets, (FirstQuarter 1994).
International Organization of Securities Commissions (IOSCO),Report of the Development Committee on International-ization (Montreal: IOSCO, October 1993).
Kuhn, Michael G., and others, Official Financing for Develop-ing Countries (Washington: International MonetaryFund, April 1994).
Kyle, Albert S., "Continuous Auctions and Insider Trading,"Econometrica, Vol. 53 (November 1985), pp. 1315-35.
Lizondo, Saul, "Foreign Direct Investment," in Determinantsand Systemic Consequences of International CapitalFlows, IMF Occasional Paper, No. 77 (Washington:International Monetary Fund, 1991), pp. 68-82.
U.S. Department of Commerce, Survey of Current Business,Bureau of Economic Analysis (Washington, variousissues).
U.S. Treasury Department, Treasury Bulletin (Washington, var-ious issues.)
81
©International Monetary Fund. Not for Redistribution

This page intentionally left blank
©International Monetary Fund. Not for Redistribution

World Economic and Financial SurveysThis series (ISSN 0258-7440) contains biannual, annual, and periodic studies covering monetary and financial issues of importance to theglobal economy. The core elements of the series are the World Economic Outlook report, usually published in May and October, and the an-nual report on International Capital Markets. Other studies assess international trade policy, private market and official financing for de-veloping countries, exchange and payments systems, export credit policies, and issues raised in the World Economic Outlook.
World Economic Outlook: A Survey by the Staff of theInternational Monetary Fund
The World Economic Outlook, published twice a year in English,French, Spanish, and Arabic, presents IMF staff economists' analy-ses of global economic developments during the near and mediumterm. Chapters give an overview of the world economy; consider is-sues affecting industrial countries, developing countries, andeconomies in transition to the market; and address topics of press-ing current interest.ISSN 0256-6877.$34.00 (academic rate: $23.00; paper).1994 (May). ISBN 1-55775-381-4. Stock #WEO-194.1994 (Oct.). ISBN 1-55775-385-7. Stock #WEO-294.
International Capital Markets: Developments,Prospects, and Policy Issuesby an IMF Staff Team led by Morris Goldstein andDavid Folkerts-Landau
This annual report reviews developments in international capitalmarkets, including recent bond market turbulence and the role ofhedge funds, supervision of banks and nonbanks and the regulationof derivatives, structural changes in government securities markets,recent developments in private market financing for developingcountries, and the role of capital markets in financing Chineseenterprises.$20.00 (academic rate: $12.00; paper).1994. ISBN 1-55775-426-8. Stock #WEO-694.1993. Part I: Exchange Rate Management and International Capital Flows, byMorris Goldstein, David Folkerts-Landau, Peter Garber, Liliana Rojas-Suarez, andMichael Spencer.ISBN 1-55775-290-7. Stock #WEO-693.1993. Part II: Systemic Issues in International Finance, by an IMF Staff Team led byMorris Goldstein and David Folkerts-Landau.ISBN 1-55775-335-0. Stock #WEO-1293.
Staff Studies for the World Economic Outlookby the IMF's Research Department
These studies, supporting analyses and scenarios of the World Eco-nomic Outlook, provide a detailed examination of theory and evi-dence on major issues currently affecting the global economy.$20.00 (academic rate: $12.00; paper).1993. ISBN 1-55775-337-7. Stock #WEO-393.
Developments in International Exchange andPayments Systemsby a Staff Team from the IMF's Exchangeand Trade Relations Department
The global trend toward liberalization in countries' internationalpayments and transfer systems has been most dramatic in centraland Eastern Europe. But developing countries in general havebrought their exchange systems more in line with market principles
and moved toward more flexible exchange rate arrangements, whileindustrial countries have moved toward more pegged arrangements.$20.00 (academic rate: $12.00; paper).
1992. ISBN 1-55775-233-8. Stock #WEO-892.
Private Market Financing for Developing Countriesby a Staff Team from the IMF's Policy Development andReview Department
This study surveys recent trends in private market financing fordeveloping countries, including flows to developing countriesthrough banking and securities markets; the restoration of access tovoluntary market financing for some developing countries; and thestatus of commercial bank debt in low-income countries.$20.00 (academic rate: $12.00; paper).
1995. ISBN 1-55775-456-X. Stock #WEO-995.1993. ISBN 1-55775-361-X. Stock #WEO-993.
International Trade Policiesby a Staff Team led by Naheed Kirmani
The study reviews major issues and developments in trade and theirimplications for the work of the IMF. Volume I, The UruguayRound and Beyond: Principal Issues, gives and overview of theprincipal issues and developments in the world trading system.Volume II, The Uruguay Round and Beyond: Background Papers,presents detailed background papers on selected trade and trade-related issues. This study updates previous studies published underthe title Issues and Developments in International Trade Policy.$20.00 (academic rate: $12.00; paper).
1994. Volume I. The Uruguay Round and Beyond: Principal IssuesISBN 1-55775-469-1. Stock'#WEO-1094.1994. Volume II. The Uruguay Round and Beyond: Background PapersISBN 1-55775-457-8. Stock #WEO-1494.1992. ISBN 1-55775-311-1. Stock #WEO-1092.
Official Financing for Developing Countriesby a Staff Team from the IMF's Policy Development and ReviewDepartment led by Michael Kuhn
This study provides information on official financing for develop-ing countries, with the focus on low- and lower-middle-incomecountries. It updates and replaces Multilateral Official DebtRescheduling: Recent Experience and reviews developments in di-rect financing by official and multilateral sources.$20.00 (academic rate: $12.00; paper)
1994. ISBN 1-55775-378-4. Stock #WEO-1394.
Officially Supported Export Credits: RecentDevelopments and Prospectsby Michael G. Kuhn, Balazs Horvath, Christopher J. Jarvis
This study examines export credit and cover policies in the tenmajor industrial countries.$20.00 (academic rate: $12.00; paper).
1995. ISBN 1-55775-448-9. Stock #WEO-595.
Available by series subscription or single title (including back issues); academic rate available only to full-time university faculty and students.
Please send orders and inquiries to:International Monetary Fund, Publication Services, 700 19th Street, N.W.
Washington, D.C. 20431, U.S.A.Tel.: (202) 623-7430 Telefax: (202) 623-7201
Internet: publicatuon imf.org
©International Monetary Fund. Not for Redistribution