Financing Global Health 2019
180
Financing Global Health 2019 Tracking Health Spending in a Time of Crisis healthdata.org
-
Upload
khangminh22 -
Category
Documents
-
view
1 -
download
0
Transcript of Financing Global Health 2019

Financing Global Health 2019Tracking Health Spending in a Time of Crisis
healthdata.org


Financing Global Health 2019Tracking Health Spending in a Time of Crisis
INSTITUTE FOR HEALTH METRICS AND EVALUATIONUNIVERSITY OF WASHINGTON

2 | FINANCING GLOBAL HEALTH 2019
This report was prepared by the Institute for Health Metrics and Evaluation (IHME) through core funding from the Bill & Melinda Gates Foundation. The views expressed are those of the authors.
The contents of this publication may be reproduced and redistributed in whole or in part, provided the intended use is for noncommercial purposes, the contents are not altered, and full acknowledgment is given to IHME.
This work is licensed under the Creative Commons Attribution-NonCommercial-NoDerivs 4.0 Unported License. To view a copy of this license, please visit https://creativecommons.org/licenses/by-nc-nd/4.0/. For any usage that falls outside of these license restrictions, please contact IHME Global Engagement at [email protected].
Citation: Institute for Health Metrics and Evaluation (IHME). Financing Global Health 2019: Tracking Health Spending in a Time of Crisis. Seattle, WA: IHME, 2020.
Institute for Health Metrics and Evaluation2301 Fifth Ave., Suite 600Seattle, WA 98121USAwww.healthdata.org
To request copies of this report, please contact IHME:Telephone: +1-206-897-2800Fax: +1-206-897-2899Email: [email protected]
Printed in the United States of America
ISBN 978-0-9976462-8-3
© 2020 Institute for Health Metrics and Evaluation

3
ContentsAcronyms .................................................................................................................... 7
Acknowledgments .................................................................................................... 8
About IHME ............................................................................................................... 9
Call for collaborators ................................................................................................ 9
Executive summary.................................................................................................11
Introduction .............................................................................................................43
What’s new in FGH 2019 .............................................................................................. 45
Health spending and the Sustainable Development Goals ..................................... 47
Part One: Overview ...............................................................................................57
Total health spending ..................................................................................................... 57
Development assistance for health .............................................................................. 61
Part Two: Disease-specific spending ...................................................................81
HIV/AIDS .................................................................................................................... 83
Malaria ............................................................................................................................... 88
Tuberculosis ...................................................................................................................... 91
Part Three: Future health spending .....................................................................99
Projections of future health spending, 2018–2030 ................................................... 99
Meeting the Sustainable Development Goals and challenges ahead .................102
Part Four: Global health financing profiles ......................................................105
Conclusion ..............................................................................................................143
References ...............................................................................................................147
Annex 1: Methods .................................................................................................151
Annex 2: Tabulated data ......................................................................................157

4 | FINANCING GLOBAL HEALTH 2019
FiguresFigure 1 Health spending by source of financing, 1995–2017 .............................................................................................. 47
Figure 2 Annualized rate of change in health spending per person by income group, 1995–2017 .............................. 48
Figure 3 Annualized rate of change in health spending per person by GBD super-region, 1995–2017 ...................... 49
Figure 4 Health spending, population, and disability-adjusted life years by World Bank income group, 2017 ........ 50
Figure 5 The share of health spending by source and GDP per person, 2017 ....................................................................52
Figure 6 Changes in health spending per person and universal health service coverage, 2000–2017 ....................... 54
Figure 7 Government and prepaid private health spending as a share of total health spending, 2017 ........................55
Figure 8 Flows of health spending from financing source to World Bank income groups and GBD super-regions, 2015–2017 ........................................................................................................................................................................60
Figure 9 Development assistance for health sources, channels of assistance, implementing institutions ................ 62
Figure 10 Development assistance for health by source of funding, 1990–2019................................................................ 63
Figure 11 Annualized rate of change in development assistance for health disbursed by source, 2000–2015 and 2015–2019 ........................................................................................................................................................................64
Figure 12 Development assistance for health by channel of assistance, 1990–2019 ......................................................... 65
Figure 13 Annualized rate of change in development assistance for health disbursed by channel, 2000–2015 and 2015–2019 ........................................................................................................................................................................66
Figure 14 Development assistance for health systems strengthening and sector-wide approaches by channel of assistance, 1990–2019 ................................................................................................................................................... 67
Figure 15 Development assistance for health systems strengthening by health focus area, 1990–2019 ...................... 68
Figure 16 Flows of development assistance for health from source to channel to health focus area, 1990–2019 ...... 70
Figure 17 Development assistance for health by health focus area, 1990–2019 ..................................................................71
Figure 18 Development assistance for health by health focus area and program area, 2000–2019* ................................................... 72
Figure 19 Annualized rate of change in development assistance for health disbursed, by health focus area, 2000–2015 and 2015–2019* .................................................................................................................................................................................................................................................................. 73
Figure 20 The share of development assistance for health allocated by health focus area, 1990–2019..........................75
Figure 21 Development assistance for health by recipient GBD super-region, 1990–2019.............................................. 76
Figure 22 Top 20 countries by average development assistance for health received from 2015 to 2017, and their corresponding 2017 burden of disease ...................................................................................................................... 79
Figure 23 The share of HIV/AIDS, malaria, and tuberculosis spending allocated by government, development assistance for health, and out-of-pocket sources, 2000–2017 ............................................................................. 82
Figure 24 HIV/AIDS spending by financing source in World Bank low- and middle-income countries, 2000–2017, HIV/AIDS spending by financing source and GBD super-region across World Bank low- and middle-income countries, 2017, and Annualized rate of change in HIV/AIDS incidence and annualized rate of change in HIV/AIDS spending per person across World Bank low- and middle-income countries, 2000–2017....................................................................................................................................................................... 84
Figure 25 HIV/AIDS spending in low- and middle-income countries by income group, 2000–2017 ............................85
FIGurEs | 5
Figure 26 HIV/AIDS spending in low- and middle-income countries by financing source and spending category over time, 2000–2017 ....................................................................................................................................................85
Figure 27 Development assistance for HIV/AIDS by channel of assistance, 1990–2019.................................................. 86
Figure 28 Development assistance for HIV/AIDS by program area, 1990–2019................................................................ 87
Figure 29 Malaria spending by financing source in World Bank low- and middle-income countries, 2000–2017, Malaria spending by financing source and GBD super-region across malaria-endemic, low- and middle-income countries, 2017, and Annualized rate of change in malaria incidence and annualized rate of change in malaria spending per person across malaria-endemic, low- and middle-income countries, 2000–2017....................................................................................................................................................................... 89
Figure 30 Development assistance for health for malaria by channel of assistance, 1990–2019 ....................................90
Figure 31 Tuberculosis spending by source and function, 2000–2017 ................................................................................ 92
Figure 32 Tuberculosis spending by financing source in World Bank low- and middle-income countries, 2000–2017, Tuberculosis spending by financing source and GBD super-regions across World Bank low- and middle-income countries, 2017, and Annualized rate of change in tuberculosis incidence and annualized rate of change in tuberculosis spending per person across World Bank low- and middle-income countries, 2000–2017....................................................................................................................................................................... 94
Figure 33 Dominating financing source for total spending on tuberculosis in low- and middle-income countries, 2017 ................................................................................................................................................................................... 95
Figure 34 Development assistance for tuberculosis by channel of assistance, 1990–2019 ..............................................96
Figure 35 Development assistance for tuberculosis by program area, 1990–2019 ............................................................ 97
Figure 36 Future spending scenarios by GBD super-region, 1995–2030 ...........................................................................100
Figure 37 Share of projected increases due to each funding source by GBD super-region, 2017–2030 ......................101

6 | FINANCING GLOBAL HEALTH 2019
Tables & BoxesTable 1 Total health spending and health spending by source, 2017 .........58
box 1 Published papers .................................................................................... 44
box 2 Health financing terms defined .......................................................... 46
box 3 Sustainable Development Goal 3 targets and indicators ............................51
box 4 Development assistance for health terms defined .......................... 63
box 5 Notified and non-notified tuberculosis cases ...................................91

TABLEs & BOXEs, ACrONyms | 7
AcronymsaDb Asian Development Bank afDb African Development Bank CePi Coalition for Epidemic Preparedness Innovations CHoiCe Choosing Interventions that are Cost Effective (WHO)DaH Development assistance for health DalYs Disability-adjusted life years gbD Global Burden of Diseases, Injuries, and Risk Factors Study gDP Gross domestic product gNi Gross national income HlPF High-Level Political Forum on Sustainable Development (UN)HSS Health systems strengthening ibrD International Bank for Reconstruction and DevelopmentiDa International Development Association iDb Inter-American Development Bank iHMe Institute for Health Metrics and Evaluation MDgs Millennium Development GoalsNCDs Non-communicable diseases Ngos Non-governmental organizations NTP National Tuberculosis ProgrammeoeCD Organisation for Economic Co-operation and DevelopmentPaHo Pan American Health Organization PePFar United States President’s Emergency Plan for AIDS Relief PMi United States President’s Malaria Initiative SDgs Sustainable Development Goals SWaps Sector-wide approaches uHC Universal health coverage ui Uncertainty interval uK United Kingdom uN United Nations uNaiDS Joint United Nations Programme on HIV/AIDS uNFPa United Nations Population Fund uNiCeF United Nations Children’s Fund uS United States uSaiD United States Agency for International Development WHo World Health Organization

8 | FINANCING GLOBAL HEALTH 2019
AcknowledgmentsWe extend our deepest appreciation to past authors of this report for developing and refining the analytical foundation upon which this work is based. We would like to acknowledge the staff members of the numerous development agencies, public-private partnerships, international organiza-tions, non-governmental organizations, and foundations who responded to our data requests and questions. We greatly appreciate their time and assistance.
The interpretation of the findings benefitted greatly from the contribu-tions of Erika Larson of the University of California, San Francisco, Rachel Nugent of RTI International, Jennifer Kates and Adam Wexler of the Kaiser Family Foundation, and Howard Friedman of UNFPA.
The analysis of development assistance for health and other sources of health spending as presented in Chapters 1, 2, and 3, and the future projec-tion models in Chapter 4 draw on data and analysis presented in two papers published this year: “Health sector spending and spending on HIV/AIDS, tuberculosis, and malaria, and development assistance for health: progress towards Sustainable Development Goal 3” in The Lancet, and “Tracking total spending on tuberculosis by source and function in 135 low-income and middle-income countries, 2000–17: a financial modelling study” in The Lancet Infectious Diseases. We also thank the 2018 Global Burden of Disease Health Financing Collaborator Network for feedback on data, methods, and preliminary results.
We would also like to acknowledge the efforts of the IHME community, which contributed greatly to the production of this year’s report. In partic-ular, we thank IHME’s Board for their continued leadership and Hmwe Kyu for her expertise on tuberculosis, Adrienne Chew and Rebecca Sirull for editing, Joan Williams for production oversight and publication manage-ment, and Michaela Loeffler and Annika Newell for design. Finally, we would like to extend our gratitude to the Gates Foundation for generously funding IHME and for its consistent support of this research and report.
research team:
aNgela e. MiCaH, PHD
JoSePH l. DieleMaN, PHD
KeViN F. o’rourKe, MFa
STeVeN D. baCHMeier, MS
abigail CHaPiN, ba
iaN e. CogSWell, bS
SaWYer W. CroSbY, ba
braNDoN CuNNiNgHaM, Ma
aNToN C. Harle, ba
eMilie r. MaDDiSoN, bS
MoDHuriMa MoiTra, MPH
CHriSToPHer J.l. MurraY, MD, DPHil
MaiTreYi SaHu, MPH
MaTTHeW T. SCHNeiDer, MPH
KYle e. SiMPSoN, bS
HaYleY N. STuTZMaN, ba
YaNFaNg Su, SCD
golSuM TSaKaloS, MS
raHul r. ZeNDe, bS
biaNCa S. ZlaVog, bS

ACKNOWLEDGmENTs, ABOuT IHmE, CALL FOr COLLABOrATOrs | 9
About IHME The Institute for Health Metrics and Evaluation (IHME) is an independent global health research organization at the University of Washington School of Medicine that provides rigorous and comparable measurement of the world’s most important health problems and evaluates the strategies used to address them. IHME makes this information widely available so that policymakers have the evidence they need to make informed decisions about how to allocate resources to improve population health. For more information about IHME and its work, please visit www.healthdata.org.
Call for collaboratorsIn addition to conducting the Financing Global Health (FGH) study, IHME coordinates the Global Burden of Diseases, Injuries, and Risk Factors (GBD) Study, a comprehensive effort to measure epidemiological levels and trends worldwide. (More information on GBD is available at http://www.healthdata. org/gbd.) The GBD study relies on a worldwide network of more than 5,000 collaborators in over 150 countries. Current collaborator areas of expertise include epidemiology, public health, demography, statistics, and other related fields. IHME has expanded the scope of GBD to encompass quantifi-cation of health resource flows, health system attributes, and the performance of health systems. To that end, IHME is seeking GBD collabora-tors who are experts in health financing and health systems. GBD collaborators – many of whom have co-authored GBD or FGH publications – provide timely feedback related to the interpretation of GBD and FGH results, data sources, and methodological approaches pertaining to their areas of expertise. We invite researchers and analysts with expertise in health financing to join the GBD collaborator network. Potential collabora-tors may apply at http://www.healthdata.org/gbd/call-for-collaborators.


EXECuTIvE summAry | 11
Executive summaryThis edition of the Institute for Health Metrics and Evaluation’s annual Financing Global Health report, the 11th in the series, provides up-to-date estimates of domestic spending on health, development assistance for health, spending for HIV/AIDS, tuberculosis, and malaria, as well as projec-tions of future health spending. Our health spending tracking and estimates show patterns between income groups and regions over time, highlight variations in how much each country spends on health, and identify where more resources are needed most.
In particular, Financing Global Health 2019 examines spending related to the 2030 Sustainable Development Goals (SDGs), with a focus on SDG 3. As part of our analysis, we compare progress made so far in the SDG era with growth seen during the Millennium Development Goal (MDG) period. For example, at the start of the MDG era in 2000, total development assistance for health (DAH) was an estimated $12.4 billion. Four years later, in 2004, total DAH had risen to $18.8 billion, an increase of 51.6%. In contrast, when the SDGs were adopted in 2015, total DAH was an estimated $37.9 billion; in 2019, it was an estimated $40.6 billion, growth of 7.1%.
This year’s edition of Financing Global Health also explores spending related to pandemic preparedness, a topic whose importance the ongoing COVID-19 pandemic has starkly highlighted. In 2019, development assis-tance for pandemic preparedness was estimated to be $374 million, less than 1% of total 2019 DAH (which itself was only about 0.5% of global spending on health). Though DAH for pandemic preparedness has grown faster than overall DAH over the past decade, there remains an urgent need to better understand ways to support pandemic preparedness and systems capable of mitigating or preventing pandemics like COVID-19.
The total health spending estimates in Financing Global Health 2019 cover 195 countries from 1995 to 2017. For DAH, we present estimates from 1990 to 2019 for 135 low- and middle-income countries. And our future health spending scenarios span the period 2018 to 2050 for 195 countries.
Overall, global health spending has increased over the last year, reaching $7.9 trillion (95% uncertainty interval 7.8–8.0)* in 2017, the most recent year for which total health spending data are available. By type of spending, the 2017 total breaks down as follows:
• $4.8 trillion (4.7–4.9), or 60.7%, government health spending • $1.6 trillion (1.6–1.7), or 20.6%, prepaid private spending• $1.5 trillion (1.4–1.5), or 18.5%, out-of-pocket spending • $40.6 billion, or 0.5%, donor financing
That same year, global population was an estimated 7.6 billion people, 49.0% of whom (3.7 billion) lived in one of the 78 low-income or lower- middle-income countries. The global commitment of DAH, even if DAH constitutes only 0.5% of global spending on health, is of utmost importance to those countries that depend on it. In addition, DAH can be a catalytic investment by focusing on activities or populations that might not
* Our modeled estimates for total health spending and HIV/AIDS, malaria, and tuberculosis health spending are presented with uncertainty intervals. Our estimates of DAH are generally not modeled and do not include uncertainty intervals. Unless otherwise indicated, all estimates are reported in 2019 inflation-adjusted US dollars.

12 | FINANCING GLOBAL HEALTH 2019
otherwise receive attention or resources. Total DAH in 2019 was estimated to be $39.8 billion, slightly up from 2018. Since 2010, DAH has increased 15.3%, from an estimated $35.2 billion to $40.6 billion.
These findings further inform what we already know about the health financing transition: as countries experience economic growth, some develop strong domestic health financing systems and are able to transition away from DAH and out-of-pocket spending (which carries the risk of catastrophic household spending), and toward prepaid forms of spending in the form of government programs and insurance. But some countries can get “stuck” during this transition: after outgrowing DAH eligibility, in the absence of robust government and prepaid spending, countries can become reliant on out-of-pocket payments. Transitioning away from this “missing middle” can be difficult. To ensure that the poorest are not left behind, and to guarantee health coverage and well-being for all, the global health community should continue to watch how countries transition toward self-sufficient health systems.
By World Bank income group, DAH is most relied upon in low-income countries (27.7% [26.4–29.0] of 2017 health spending), while out-of-pocket spending is most relied upon for financing health care in lower-middle- income countries (55.0% [50.6–59.9] of 2017 health spending). Government and prepaid private spending are most prevalent in high-income countries (86.0% [85.7–86.2] of 2017 health spending).
Moving toward universal health coverage is important for achieving many of the SDGs, particularly Goal 3. This goal, which aims to “ensure healthy lives and promote well-being for all at all ages,” is broadly reliant on access to care and medicine, as well as health-related financial risk protec-tion. Moreover, many of the other SDGs are linked to Goal 3: sustainable cities and communities (Goal 11) and peace, justice, and strong institutions (Goal 16) rely on – and in turn promote – healthy societies.
Our disease-specific analyses highlight patterns in spending for HIV/AIDS, malaria, and tuberculosis; the section devoted to tuberculosis highlights new estimates of total spending on this disease. In addition to providing comparable estimates for diseases covered by SDG target 3.3, our report’s section on tuberculosis presents a disaggregation of the funding picture for tuberculosis around the world.
In 2017, a total of $20.2 billion (17.0–25.0) went to HIV/AIDS in low- and middle-income countries: $9.7 billion (6.9–13.3) in government spending, $589.4 million (214.9–1,347.9) in out-of-pocket spending, $395.8 million (93.2–1,166.8) in prepaid private spending, and $9.6 billion in donor financing. South Africa ($2.2 billion [1.8–2.6]), Brazil ($1.7 billion [1.0–2.9]), and China ($1.3 billion [0.8–2.0]) were the top three countries for overall HIV/AIDS spending in 2017. As for 2019 DAH, $9.5 billion in development assistance for health went to support HIV/AIDS treatment and prevention. Since 2010, great strides have been made in the fight against HIV/AIDS: according to the Global Burden of Disease 2017 study, in 2000 there were 1.65 million global deaths from HIV/AIDS (for a rate of 24 per 100,000). In 2017, the number of global HIV/AIDS deaths had decreased to 0.95 million (12 per 100,000).

EXECuTIvE summAry | 13
Global malaria rates have dropped since 2000, but the disease still causes a great deal of burden, particularly in sub-Saharan Africa. A total of $5.1 billion (4.9–5.4) was spent on malaria in 2017 in the 106 countries where malaria has been endemic since 2000: $1.6 billion (1.5–1.8) in government spending, $822.6 million (660.4–1,046.9) in out-of-pocket spending, $169.9 million (161.0–179.8) in prepaid private spending, and $2.5 billion in donor financing. Nigeria ($704.6 million [543.8–928.1]), India ($210.1 million [166.2–266.7]), and the Democratic Republic of the Congo ($196.4 million [164.6–247.7]) were the top three countries for 2017 malaria spending. Total development assistance for malaria in 2019 came to $2.3 billion, an increase of 9.5% over the 2018 total.
In 2017, $10.9 billion (10.3–11.8) was spent on tuberculosis in low- and middle-income countries: $6.9 billion (6.5–7.5) in government spending, $2.1 billion (1.6–2.7) in out-of-pocket spending, $225.0 million (184.1–280.7) in prepaid private spending, and $1.7 billion in donor financing. Russia ($2.1 billion [1.8–2.5]), India ($1.9 billion [1.4–2.5]), and China ($1.1 billion [0.8–1.4]) were the top three countries for overall tuberculosis spending in 2017. Since 2000, tuberculosis-related DAH has grown tremendously. Where funding for tuberculosis once stood at $140.3 million (1.1% of total DAH in 2000), in 2019 it is now $1.7 billion – an increase of 1,085.5%.
As in years past, Financing Global Health 2019 includes estimates of future health spending from 2018 through 2050 to help funders and policymakers plan ahead, although these estimates were made before the full extent of the global economic crisis caused by COVID-19 had been realized. We estimate global health spending will grow to $11.0 trillion (10.7–11.2) by 2030 and $16.7 trillion (16.0–17.4) by 2050. Global disparities may remain, however: spending in high-income countries is projected to grow to $8.2 trillion (8.1–8.4) by 2030 and $11.0 trillion (10.6–11.5) by 2050. Low-income spending, on the other hand, will grow from $26.1 billion (24.9 –27.4) in 2017 (0.4% of 2017 high-income spending) to $43.2 billion (40.4–46.2) in 2030 (0.5% of high-income spending in 2030), and $95.5 billion (87.0–104.5) in 2050 (0.9% of high-income spending in 2050).
additional Financing Global Health 2019 highlights include:
• Disease-specific estimates related to SDG 3 indicators. Specifically, we focus on three health focus areas – HIV/AIDS, tuberculosis, and malaria – and the SDG 3 targets and indicators associated with those diseases.
• Updated estimates of global health spending, now through 2017, and updated estimates of contributions to DAH, now through 2019.
• An examination of SDG- versus MDG-era spending increases. To date, there has been a modest ramping-up of additional sources since the kickoff of the SDGs in 2015, compared to growth seen during the first years of the MDG era.
• Estimates of spending to support pandemic preparedness, and discussion of the effect the ongoing COVID-19 pandemic could have on meeting the SDGs and support for global health spending broadly.
• Updated estimates of future health spending through 2030, with projections to 2050 included in the Annex.


执行摘要 | 15
执行摘要
本版卫生计量与评估研究所的年度《全球卫生筹资》报告是该系列的第11期,其
中提供有关国内卫生支出、卫生发展援助、艾滋病毒感染/艾滋病、肺结核和疟疾
支出的最新估算,以及对未来卫生支出的预测。我们的卫生支出跟踪和估算显示
不同时间段内收入群体和地区之间的模式,突出显示每个国家/地区在卫生方面的
支出差异,并确定最需要进一步投入资源的地方。
特别是,《2019年全球卫生筹资》报告包括与2030年可持续发展目标(SDG)
有关的支出信息,重点是第3个目标。作为分析的一部分,我们将迄今为止针对
可持续发展目标取得的进展与推出千年发展目标(MDG)后的增长情况进行了
比较。例如,在2000年千年发展目标开始之初,卫生发展援助(DAH)总额估
计为124亿美元。四年后(2004年),卫生发展援助(DAH)总额增加到188亿美元,增长了51.6%。相比之下,2015年采纳可持续发展目标时,卫生发展
援助(DAH)总额估计为379亿美元。2019年,估计为406亿美元,增长7.1%。
今年的《全球卫生筹资》报告还探讨了与传染病大流行防备相关的支出,仍在
持续的COVID-19疫情突出显示了这一主题的重要性。2019年,用于传染病大流
行防备的发展援助估计为3.74亿美元,不到2019年卫生发展援助(DAH)总额的
1%(后者本身仅占全球卫生支出的0.5%)。尽管在过去十年中,用于传染病大
流行防备的卫生发展援助(DAH)的增长速度超过了卫生发展援助(DAH)的整
体增长速度,但仍然迫切需要更好地了解支持传染病大流行防备的方法以及能够
消除或预防COVID-19等大流行的体系。
《2019年全球卫生筹资》报告中包括了195个国家/地区在1995年至2017年的
卫生总支出估算。对于卫生发展援助(DAH),我们针对135个低收入和中等收
入国家/地区提供了1990年至2019年的估计值。我们未来的卫生支出情景包括195个国家/地区在2018年至2050年的卫生支出。
总体而言,全球卫生支出在过去一年中有所增加,2017年达到了7.9万亿
美元(95%不确定性区间为7.8-8.0)*,这是可获得卫生总支出数据的最新
年份。按支出类型划分,2017年总支出细分如下:
• 4.8万亿美元(4.7–4.9),即60.7%为政府卫生支出
• 1.5万亿美元(1.4-1.5),即18.5%为自付费用
• 1.6万亿美元(1.6–1.7),即20.6%为预付私人保险支出
• 406亿美元,即0.5%为捐助者融资
同年,全球人口估计为76亿,其中49.0%(37亿)生活在78个低收入或中低收
入国家/地区。即使卫生发展援助(DAH)仅占全球卫生支出的0.5%,全球对卫
生发展援助(DAH)的承诺对依赖它的国家/地区也至关重要。此外,卫生发展
援助(DAH)可以通过重点关注原本可能不会受到关注或获得资源的活动或人群
来促进投资。2019年卫生发展援助(DAH)总额比我们对2018年398亿美元的估
计额略有增加。自2010年以来,卫生发展援助(DAH)增长了15.3%,估计从
352亿美元增长到406亿美元(以通胀调整后的2019年美元计算)。
这些结果进一步证明了我们对卫生筹资过渡模式的现有了解:即随着国家/地区
的发展,一些国家/地区发展了强大的国内卫生筹资体系,能够逐步摆脱对卫生发
展援助(DAH)和自付费用(这有带来灾难性家庭支出的风险)的需求,并转向
以政府计划和保险为主的预付款形式。
但一些国家/地区在过渡期间可能会“陷入困境”:他们不再具有获得卫生发展
援助(DAH)的资格,但因缺乏强大的政府和预付支出,而导致依赖自付费用。
摆脱这种“中间状态”可能很困难。为确保不让最贫穷的人群落在后面,并确保
* 我们对卫生总支出以及艾滋病毒感染/艾滋病、
疟疾和肺结核卫生支出的建模估算以不确定性区
间给出。我们在估算卫生发展援助(DAH)时,
通常不建模,也不包括不确定性区间。除非另有
说明,否则所有估算均按2019年通胀调整后的美
元报告。

16 | FINANCING GLOBAL HEALTH 2019
所有人都拥有健康保险和安康,全球卫生界应继续关注各国如何向自给自足的卫
生系统过渡。
根据世界银行收入组别分类,低收入国家最依赖卫生发展援助(DAH)
(2017年卫生支出的27.7%[26.4–29.0]),而在中低收入国家,卫生筹资最依
赖自付费用(2017年卫生支出的55.0%[50.6-59.9])。在高收入国家,政府和预
付私人保险支出最为普遍(2017年卫生支出的86.0%[85.7-86.2])。
迈向全民健康保险对于实现许多可持续发展目标,特别是第3个目标至关重
要。该目标旨在“确保所有年龄段的人都享有健康的生活并促进安康”,它广泛
依赖于获得医疗服务和药物的能力以及与健康相关的财务风险保护。此外,其
他许多可持续发展目标与第3个目标相关:可持续城市和社区(第11个目标)以
及和平、正义和强大的机构(第16个目标)也依赖于健康的社会并进而对其加
以促进。
我们针对特定疾病的分析突出显示了艾滋病毒感染/艾滋病、疟疾和肺结核支出
的模式,其中专门介绍肺结核的部分重点介绍了对肺结核总支出的新估算。除了
提供可持续发展目标(SDG)3.3节所涵盖的疾病的可比估算之外,报告的肺结
核部分中还提供了全球肺结核资金来源的分类。
2017年,用于艾滋病毒感染/艾滋病的资金总计202亿美元(17.0–25.0):
政府支出为97亿美元(6.9-13.3),自付费用为5.894亿美元(214.9-1347.9),
预付私人保险支出为3.958亿美元(93.2-1166.8),捐助者融资为96亿美元。
南非(22亿美元[1.8-2.6])、巴西(17亿美元[1.0-2.9])和中国(13亿美元
[0.8-2.0])是2017年艾滋病毒感染/艾滋病总支出最高的三个国家。2019年,卫
生发展援助(DAH)中有95亿美元用于支持艾滋病毒感染/艾滋病的治疗和预
防。自2010年以来,在防治艾滋病毒感染/艾滋病方面取得了长足的进步:根据
《2017年全球疾病负担》研究,2000年全球有165万人死于艾滋病毒感染/艾滋
病(每10万人中有24人)。2017年,全球艾滋病毒感染/艾滋病死亡人数降至
95万(每10万人中有12人)。
自2000年以来,全球疟疾发病率有所下降,但该疾病仍造成了沉重负担,
尤其是在撒哈拉以南非洲地区。2017年,疟疾支出总计51亿美元(4.9-5.4):
政府支出为16亿美元(1.5–1.8),自付费用为8.226亿美元(660.4–1046.9),
预付私人保险支出为1.699亿美元(161.0–179.8),捐赠者融资为25亿美元。
尼日利亚(7.046亿美元[543.8–928.1])、印度(2.101亿美元[166.2–266.7])和刚果民主共和国(1.964亿美元[164.6–247.7])是2017年疟疾支出最高的三个
国家。2019年用于疟疾的发展援助总额达到23亿美元,比2018年增加9.5%。
2017年,肺结核支出为109亿美元(10.3-11.8):政府支出为69亿美元
(6.5-7.5),自付费用为21亿美元(1.6-2.7),预付私人保险支出为2.25亿美
元(184.1-280.7),捐助者融资为17亿美元。俄罗斯(21亿美元[1.8-2.5])、
印度(19亿美元[1.4-2.5])和中国(11亿美元[0.8-1.4])是2017年肺结核总
支出最高的三个国家。自2000年以来,与结核相关的卫生发展援助(DAH)
有了巨大的增长。2000年,肺结核支出为1.403亿美元(占2000年卫生发展援
助(DAH)总额的1.1%),而在2019年,肺结核支出达到17亿美元,增长了
1085.5%。
与往年一样,《2019年全球卫生筹资》报告包括对2018年至2050年未来卫生
支出的估计,以帮助资助者和政策制定者提前计划。我们估计,到2030年,全球
卫生支出将增长到11.0万亿美元(10.7-11.2),到2050年将增长到16.7万亿美元
(16.0-17.4)。然而,全球可能仍然存在差距:到2030年,高收入国家支出预计将
增长到8.2万亿美元(8.1-8.4),到2050年将增长到11.0万亿美元(10.6-11.5)。
对于低收入国家,2017年支出为261亿美元(24.9–27.4)(占2017年高收入国家
支出的0.4%),2030年将增长到432亿美元(40.4–46.2)(占2030年高收入国家
支出的0.5%),2050年将增长到955亿美元(87.0–104.5)(占2050年高收入国
执行摘要 | 17
家支出的0.9%)。
《2019年全球卫生筹资》报告的其他重点包括:• 与第3个可持续发展目标指标相关的特定疾病的估算。具体来说,我们专注
于三个卫生重点领域(艾滋病毒感染/艾滋病、肺结核和疟疾)以及与这些
疾病相关的第3个可持续发展目标和指标。
• 截止到2017年的最新全球卫生支出估算,以及截止到2019年的最新卫生发
展援助(DAH)估算。
• 针对可持续发展目标与千年发展目标期间支出增加情况的分析。迄今为止,
与推出千年发展目标后最初几年的增长情况相比,自2015年推出可持续发
展目标以来,资金增长好于既往增长情况。
• 对用于支持大流行防备的最新支出估算,并讨论仍在持续的COVID-19大流
行对实现可持续发展目标的潜在影响以及对全球卫生支出的广泛支持。
• 截 止 2 0 3 0年 的 未 来 卫 生 支 出 的 最 新 估 算 , 包 括 截 止 2 0 5 0年 的 预 测
(见附件)。


Итоговый отчет | 19
Итоговый отчетВ данном издании отчета Института показателей и оценки здоровья «Финансирование сферы всемирного здравоохранения», который является 11-м по счету, приведены актуальные данные оценок внутренних расходов на здравоохранение и содействие его развитию, данные расходов на борьбу с ВИЧ / СПИДом, туберкулезом и малярией, а также прогнозы расходов на здравоохранение в будущем. Наши механизмы наблюдения и оценки расходов на здравоохранение позволяют в динамике отследить закономерности по категориям доходов и регионам, выделить различия в суммах средств, которые каждая страна выделяет на здравоохранение, и определить районы, наиболее нуждающиеся в ресурсах.
В частности, в отчете «Финансирование сферы всемирного здравоохранения за 2019 год» рассматриваются расходы, связанные с целями в области устойчивого развития (ЦУР) на период до 2030 года, с упором на ЦУР №3. В рамках нашего анализа мы сравниваем прогресс, достигнутый до настоящего времени в эпоху ЦУР, с ростом, который наблюдался в период достижения целей развития, изложенных в «Декларации тысячелетия» (ЦРТ). Например, в начале эпохи ЦРТ в 2000 году общая сумма расходов на содействие развитию здравоохранения (СРЗ) оценивалась в 12,4 млрд долларов. Четыре года спустя, в 2004 году, общая сумма расходов на СРЗ выросла до 18,8 млрд долларов, увеличившись на 51,6 %. Для сравнения, когда в 2015 году были приняты ЦУР, общая сумма расходов на СРЗ составляла, по оценкам, 37,9 млрд долларов, а в 2019 году — 40,6 млрд долларов, увеличившись на 7,1 %.
В этом году в издании «Финансирование сферы всемирной охраны здоровья» также рассматриваются расходы, связанные с подготовкой к пандемии — темой, важность которой резко возросла в связи с продолжающейся эпидемией COVID-19. В 2019 году сумма расходов на содействие развитию готовности к пандемии оценивалась в 374 млн долларов, что составляет менее 1 % от общей суммы СРЗ за 2019 год (которая сама по себе составляла лишь около 0,5 % мировых расходов на здравоохранение). Хотя сумма расходов на СРЗ для обеспечения готовности к пандемии росла быстрее, чем общий уровень СРЗ за последнее десятилетие, остается острая необходимость улучшить понимание способов поддержания готовности к пандемии и систем, способных минимизировать угрозы или предотвращать пандемии, такие как COVID-19.
Общая сумма оценки расходов на здравоохранение в отчете «Финансирование сферы всемирного здравоохранения за 2019 год» основана на данных 195 стран с 1995 по 2017 год. Для СРЗ приведены оценки с 1990 по 2019 год для 135 стран с низким и средним уровнем дохода. Также приведены варианты прогноза расходов на здравоохранение на период с 2018 по 2050 год для 195 стран.
В целом, за последний год глобальные расходы на здравоохранение
* Наши смоделированные оценки общих расходов на здравоохранение и расходов на борьбу с ВИЧ / СПИДом, малярией и туберкулезом представлены с интервалами неопределенности. Наши оценки СРЗ обычно не моделируются и не включают интервалы неопределенности. Если не указано иное, все оценки приводятся в долларах США с поправкой на инфляцию по состоянию на 2019 год.
20 | FINANCING GLOBAL HEALTH 2019
увеличились, достигнув 7,9 трлн долларов (7,8–8,0 при интервале неопределенности 95 %)* в 2017 году, последнем, за который имеются данные об общих суммах расходов на здравоохранение. По видам расходы за 2017 год можно распределить следующим образом:
• 4,8 трлн долл. (4,7–4,9) или 60,7 % — государственные расходы на здравоохранение
• 1,5 трлн долл. (1,4–1,5) или 18,5 % — личные расходы • 1,6 трлн долл. (1,6–1,7) или 20,6 % — предварительно оплаченные
расходы частного сектора • 40,6 млрд долл. или 0,5 % — донорское финансирование
В том же году население планеты составляло 7,6 миллиарда человек, 49,0 % (3,7 миллиарда) из которых проживали в одной из 78 стран с доходом низкого или ниже среднего уровня. Всемирная приверженность СРЗ, даже если сумма на него составляет всего 0,5 % мировых расходов на здравоохранение, имеет огромное значение для стран, которые зависят от этого содействия. Кроме того, СРЗ может стать катализатором инвестиций, так как сосредоточивается на видах деятельности или группах населения, которые иначе не получили бы внимания или ресурсов. Общая сумма расходов на СРЗ в 2019 году немного выросла по сравнению с оценкой за 2018 год, которая составляла 39,8 млрд долларов. С 2010 года сумма расходов на СРЗ увеличилась на 15,3 % с 35,2 до 40,6 млрд долларов (в долларах США с поправкой на инфляцию по состоянию на 2019 год).
Результаты этих исследований дополнительно подтверждают то, что уже и так известно о переходном периоде в сфере финансирования здравоохранения: по мере того, как в странах наблюдается экономический рост, некоторые из них разрабатывают прочные внутренние системы финансирования здравоохранения и могут переходить от СРЗ и личных расходов (что несет в себе риск значительных расходов из бюджета семей) на предварительно оплаченные формы расходов в виде государственных программ и страхования.
Однако некоторые страны могут «застрять» в таком переходном периоде — более не соответствуя критериям получения средств на СРЗ и при отсутствии устойчивого государственного и предварительно оплаченного финансирования, их системы могут стать зависимыми от личных платежей населения. Дальнейший переход от этой точки может быть затруднен. Чтобы гарантировать, что самые бедные слои населения не останутся без медицинского обслуживания, и обеспечить доступ к нему и благополучие для всех людей, мировое сообщество специалистов здравоохранения должно продолжать следить за тем, как такие страны переходят к независимым системам.
Согласно классификации стран по уровню доходов, используемой Всемирным банком, на СРЗ больше всего полагаются страны с низким уровнем дохода (27,7 % [26,4–29,0] от расходов на здравоохранение за 2017 год), в то время как на финансирование здравоохранения из личных средств больше всего полагаются в странах с уровнем дохода ниже среднего (55,0 % [50,6–59,9] от расходов на здравоохранение за 2017 год). Государственные и предварительно оплаченные расходы частного сектора наиболее распространены в странах с высоким уровнем дохода (86,0 %
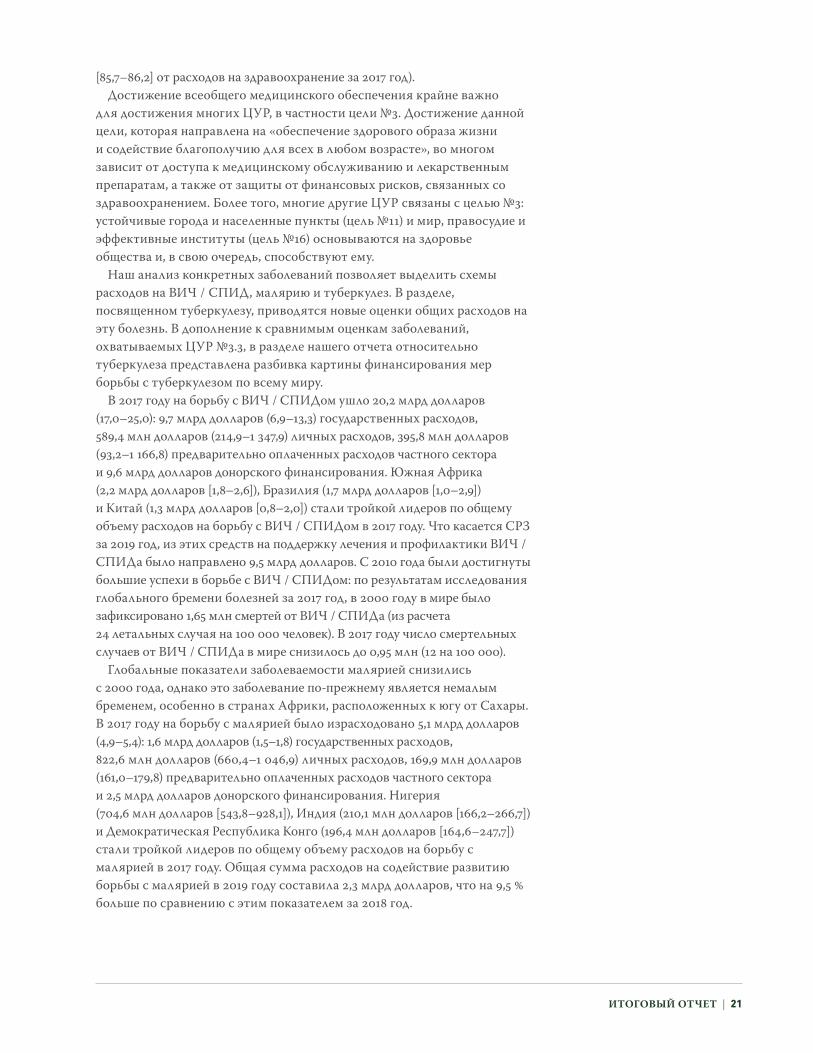
Итоговый отчет | 21
[85,7–86,2] от расходов на здравоохранение за 2017 год).Достижение всеобщего медицинского обеспечения крайне важно
для достижения многих ЦУР, в частности цели №3. Достижение данной цели, которая направлена на «обеспечение здорового образа жизни и содействие благополучию для всех в любом возрасте», во многом зависит от доступа к медицинскому обслуживанию и лекарственным препаратам, а также от защиты от финансовых рисков, связанных со здравоохранением. Более того, многие другие ЦУР связаны с целью №3: устойчивые города и населенные пункты (цель №11) и мир, правосудие и эффективные институты (цель №16) основываются на здоровье общества и, в свою очередь, способствуют ему.
Наш анализ конкретных заболеваний позволяет выделить схемы расходов на ВИЧ / СПИД, малярию и туберкулез. В разделе, посвященном туберкулезу, приводятся новые оценки общих расходов на эту болезнь. В дополнение к сравнимым оценкам заболеваний, охватываемых ЦУР №3.3, в разделе нашего отчета относительно туберкулеза представлена разбивка картины финансирования мер борьбы с туберкулезом по всему миру.
В 2017 году на борьбу с ВИЧ / СПИДом ушло 20,2 млрд долларов (17,0–25,0): 9,7 млрд долларов (6,9–13,3) государственных расходов, 589,4 млн долларов (214,9–1 347,9) личных расходов, 395,8 млн долларов (93,2–1 166,8) предварительно оплаченных расходов частного сектора и 9,6 млрд долларов донорского финансирования. Южная Африка (2,2 млрд долларов [1,8–2,6]), Бразилия (1,7 млрд долларов [1,0–2,9]) и Китай (1,3 млрд долларов [0,8–2,0]) стали тройкой лидеров по общему объему расходов на борьбу с ВИЧ / СПИДом в 2017 году. Что касается СРЗ за 2019 год, из этих средств на поддержку лечения и профилактики ВИЧ / СПИДа было направлено 9,5 млрд долларов. С 2010 года были достигнуты большие успехи в борьбе с ВИЧ / СПИДом: по результатам исследования глобального бремени болезней за 2017 год, в 2000 году в мире было зафиксировано 1,65 млн смертей от ВИЧ / СПИДа (из расчета 24 летальных случая на 100 000 человек). В 2017 году число смертельных случаев от ВИЧ / СПИДа в мире снизилось до 0,95 млн (12 на 100 000).
Глобальные показатели заболеваемости малярией снизились с 2000 года, однако это заболевание по-прежнему является немалым бременем, особенно в странах Африки, расположенных к югу от Сахары. В 2017 году на борьбу с малярией было израсходовано 5,1 млрд долларов (4,9–5,4): 1,6 млрд долларов (1,5–1,8) государственных расходов, 822,6 млн долларов (660,4–1 046,9) личных расходов, 169,9 млн долларов (161,0–179,8) предварительно оплаченных расходов частного сектора и 2,5 млрд долларов донорского финансирования. Нигерия (704,6 млн долларов [543,8–928,1]), Индия (210,1 млн долларов [166,2–266,7]) и Демократическая Республика Конго (196,4 млн долларов [164,6–247,7]) стали тройкой лидеров по общему объему расходов на борьбу с малярией в 2017 году. Общая сумма расходов на содействие развитию борьбы с малярией в 2019 году составила 2,3 млрд долларов, что на 9,5 % больше по сравнению с этим показателем за 2018 год.

22 | FINANCING GLOBAL HEALTH 2019
В 2017 году на борьбу с туберкулезом было потрачено 10,9 млрд долларов (10,3–11,8): 6,9 млрд долларов (6,5–7,5) государственных расходов, 2,1 млрд долларов (1,6–2,7) личных расходов, 225,0 млн долларов (184,1–280,7) предварительно оплаченных расходов частного сектора и 1,7 млрд долларов донорского финансирования. Россия (2,1 млрд долларов [1,8-2,5]), Индия (1,9 млрд долларов [1,4-2,5]) и Китай (1,1 млрд долларов [0,8-1,4]) стали тройкой лидеров по общему объему расходов на борьбу с туберкулезом в 2017 году. С 2000 года сумма расходов на СРЗ для борьбы с туберкулезом значительно выросла. Если финансирование борьбы с туберкулезом в свое время составляло 140,3 млн долларов (1,1 % от общей суммы расходов на СРЗ в 2000 году), то в 2019 году оно составляет 1,7 млрд долларов, что на 1 085,5 % больше.
Как и в прошлые годы, отчет «Финансирование сферы всемирного здравоохранения за 2019 год» включает в себя оценки предстоящих расходов на здравоохранение с 2018 по 2050 год, что позволяет облегчить инвесторам и лицам, определяющим политику здравоохранения, процесс планирования расходов. По нашим оценкам, к 2030 году глобальные расходы на здравоохранение вырастут до 11,0 триллионов долларов (10,7–11,2), а к 2050 году — до 16,7 триллионов долларов (16,0–17,4). Однако могут сохраняться глобальные диспропорции: по прогнозам, к 2030 году расходы в странах с высоким уровнем дохода вырастут до 8,2 триллионов долларов (8,1–8,4), а к 2050 году —до 11,0 триллионов долларов (10,6–11,5). С другой стороны расходы в странах с низким уровнем дохода вырастут с 26,1 млрд долларов (24,9–27,4) в 2017 году (0,4 % от расходов стран с высоким уровнем дохода на 2017 год) до 43,2 млрд долларов (40,4–46,2) в 2030 году (0,5 % от расходов стран с высоким уровнем дохода в 2030 году) и до 95,5 млрд долларов (87,0–104,5) в 2050 году (0,9 % от расходов стран с высоким уровнем дохода в 2050 году).
Другие ключевые аспекты отчета «Финансирование сферы всемирного здравоохранения за 2019 год»:
• Оценки данных по конкретным заболеваниям, связанные с показателями ЦУР №3. В частности, наше внимание сосредотачивается на трех целях медицинского обслуживания — ВИЧ / СПИД, туберкулез и малярия — и целях и показателях ЦУР №3, связанных с этими заболеваниями.
• Обновленные оценки глобальных расходов на здравоохранение вплоть до 2017 года и обновленные оценки отчислений на СРЗ вплоть до 2019 года.
• Анализ увеличения расходов на ЦУР по сравнению с эпохой ЦРТ. На сегодняшний день с момента принятия ЦУР в 2015 году наблюдается умеренное увеличение дополнительных источников по сравнению с ростом, наблюдавшимся в первые годы эпохи ЦРТ.
• Актуальные оценки расходов на поддержание готовности к пандемии и обсуждение влияния продолжающейся пандемии COVID-19 на достижение ЦУР и поддержку глобальных расходов на здравоохранение в целом.
• Обновленные оценки предстоящих расходов на здравоохранение до 2030 года с прогнозом до 2050 года приведены в приложении.

Итоговый отчет | 23


résumé ANALyTIquE | 25
Résumé analytiqueCette édition du rapport annuel Financing Global Health de l’Institute for Health Metrics and Evaluation, le 11e de la série, fournit des estimations récentes relatives aux dépenses nationales de santé, à l’aide au développement en matière de santé, aux dépenses liées au VIH/SIDA, à la tuberculose et au paludisme, ainsi que des projections quant aux dépenses de santé futures. Notre suivi des dépenses de santé et nos estimations indiquent les tendances au fil du temps entre les groupes et les régions en termes de revenus, font ressortir des variations au niveau des dépenses de santé de chaque pays et identifient là où le besoin en ressources est le plus important.
En particulier, Financing Global Health 2019 examine les dépenses liées aux objectifs de développement durable (ODD) à l’horizon 2030, notamment l’ODD 3. Dans le cadre de notre analyse, nous comparons les progrès réalisés jusqu’ici à l’ère des ODD avec la croissance constatée pendant la période des objectifs du Millénaire pour le développement (OMD). Par exemple, au début de l’ère des OMD en 2000, l’aide au développement en matière de santé (ADS) totale se serait élevée à 12,4 milliards de dollars. Quatre ans plus tard, en 2004, l’ADS totale atteignait 18,8 milliards de dollars, soit une augmentation de 51,6 %. En revanche, lorsque les ODD ont été adoptés en 2015, l’ADS totale était estimée à 37,9 milliards de dollars ; en 2019, elle serait passée à 40,6 milliards de dollars, soit une croissance de 7,1 %.
L’édition du rapport Financing Global Health de cette année explore aussi les dépenses liées à la préparation aux pandémies, un sujet dont l’importance a été tristement mise en exergue par l’épidémie de COVID-19 en cours. En 2019, l’aide au développement en matière de préparation aux pandémies était estimée à 374 millions de dollars, soit moins de 1 % de l’ADS totale en 2019 (qui elle-même ne représentait qu’environ 0,5 % des dépenses de santé globales). Bien que l’ADS en matière de préparation aux pandémies ait connu une croissance plus rapide que l’ADS totale au cours de la dernière décennie, il demeure urgent de mieux comprendre comment soutenir la préparation aux pandémies et les systèmes capables d’atténuer ou de prévenir les pandémies comme celle de COVID-19.
Les dépenses totales de santé estimées dans le rapport Financing Global Health 2019 portent sur 195 pays entre 1995 et 2017. En ce qui concerne l’ADS, les estimations couvrent la période de 1990 à 2019 dans 135 pays à faible revenu et à revenu intermédiaire. Nos scénarios d’évolution des dépenses de santé couvrent la période de 2018 à 2050 dans 195 pays.
Dans l’ensemble, les dépenses mondiales de santé ont augmenté au cours de l’année dernière, atteignant 7,9 billions de dollars (intervalle de confiance à 95 % compris entre 7,8 et 8,0)* en 2017, année la plus récente pour laquelle nous disposons de données sur les dépenses totales de santé. Par type de dépenses, la ventilation des dépenses totales pour 2017 est la suivante :
• 4,8 billions de dollars (4,7 – 4,9), soit 60,7 %, dépenses publiques de santé • 1,5 billion de dollars (1,4 – 1,5), soit 18,5 %, financement direct par les patients • 1,6 billion de dollars (1,6 – 1,7), soit 20,6 %, dépenses privées prépayées • 40,6 milliards, soit 0,5 %, prise en charge des donateurs
* Nos estimations modélisées pour l’ensemble des dépenses de santé et le VIH/SIDA, le paludisme et la tuberculose sont présentées avec des fourchettes d’incertitude. Nos estimations relatives à l’ADS ne sont en général pas modélisées et ne comprennent aucune fourchette d’incertitude. Sauf indications contraires, toutes les estimations sont exprimées en dollars É.-U. ajustés en fonction du taux d’inflation de 2019.

26 | FINANCING GLOBAL HEALTH 2019
La même année, la population mondiale était estimée à 7,6 milliards de personnes, dont 49,0 % (3,7 milliards) vivaient dans un des 78 pays à faible revenu ou à revenu intermédiaire. L’engagement mondial de l’ADS, même si l’ADS ne représente que 0,5 % des dépenses mondiales de santé, est de la plus haute importance pour les pays qui en dépendent. En outre, l’ADS peut être un investissement à effet catalyseur du fait de l’accent mis sur les activités ou populations qui, sinon, ne recevraient peut-être pas l’attention ou les ressources nécessaires. L’ADS totale en 2019 était légèrement en hausse par rapport à notre estimation de 2018, qui était de 39,8 milliards de dollars. Depuis 2010, l’ADS a augmenté de 15,3 %, passant de 35,2 milliards de dollars à 40,6 milliards de dollars (estimations mesurées en dollars É.-U. ajustés en fonction du taux d’inflation de 2019).
Ces observations confirment par ailleurs ce que nous avions déjà constaté en ce qui concerne les transformations dans le financement de la santé : à mesure que leur économie se développe, certains pays parviennent à renforcer leurs systèmes nationaux de financement de la santé et à réduire progressivement leur dépendance envers l’ADS et le financement direct par les patients (qui comporte le risque de dépenses catastrophiques pour les ménages), pour se tourner vers un système de dépenses prépayées sous forme de programmes publics et d’assurance.
Certains pays « s’enlisent » cependant pendant cette période de transition : une fois qu’ils n’ont plus droit à l’ADS et en l’absence d’un gouvernement solide et d’un système de dépenses prépayées, ils peuvent devenir dépendants du financement direct par les patients. Il peut leur être difficile de réduire leur dépendance envers ce « chaînon manquant ». Pour s’assurer que les pays les plus défavorisés ne restent pas à la traîne et pour garantir une protection en matière de santé et le bien-être pour tous, la communauté sanitaire internationale doit continuer de suivre la manière dont les pays s’orientent progressivement vers des systèmes de santé autonomes.
Par groupe de revenu de la Banque mondiale, l’ADS est la source de financement des dépenses de santé à laquelle les pays à faible revenu ont eu le plus recours (27,7 % [26,4 – 29,0] des dépenses de santé en 2017), tandis que le financement direct par les patients est la forme de financement des soins de santé privilégiée dans les pays à revenu intermédiaire de la tranche inférieure (55,0 % [50,6 – 59,9] des dépenses de santé en 2017). Les dépenses publiques et les dépenses privées prépayées sont plus répandues dans les pays à revenu élevé (86,0 % [85,7 – 86,2] des dépenses de santé en 2017).
Il est important d’adopter un système de couverture sanitaire universelle pour réaliser de nombreux ODD, notamment l’objectif 3. Cet objectif, qui vise à « donner aux individus les moyens de vivre une vie saine et promouvoir le bien-être à tous les âges », repose largement sur l’accès aux soins et aux médicaments, ainsi que sur la protection contre les risques financiers en matière de santé. Par ailleurs, un grand nombre des autres ODD sont liés à l’objectif 3 : villes et communautés durables (objectif 11) et paix, justice et institutions efficaces (objectif 16) s’appuient sur des sociétés saines et, à leur tour les favorisent.

résumé ANALyTIquE | 27
Nos analyses portant sur des maladies spécifiques mettent en lumière les tendances relatives aux dépenses consacrées au VIH/SIDA, au paludisme et à la tuberculose ; la section portant sur la tuberculose souligne de nouvelles estimations des dépenses totales pour cette maladie. Outre des estimations comparables sur les maladies couvertes par l’ODD 3.3, la section de notre rapport sur la tuberculose présente une situation de financement fractionnée en ce qui concerne la tuberculose dans le monde.
En 2017, un total de 20,2 milliards de dollars (17,0 – 25,0) a été consacré au VIH/SIDA : 9,7 milliards de dollars (6,9 – 13,3) de dépenses publiques, 589,4 millions de dollars (214,9 – 1 347,9) de financement direct par les patients, 395,8 millions de dollars (93,2 – 1 166,8) de dépenses privées prépayées et 9,6 milliards de dollars de prise en charge des donateurs. L’Afrique du Sud (2,2 milliards de dollars [1,8 – 2,6]), le Brésil (1,7 milliard de dollars [1,0 – 2,9]) et la Chine (1,3 milliard de dollars [0,8 – 2,0]) étaient les trois premiers pays en termes de dépenses globales liées au VIH/SIDA en 2017. En ce qui concerne l’ADS en 2019, 9,5 milliards de dollars de l’aide au développement en matière de santé ont été consacrés au traitement et à la prévention du VIH/SIDA. Depuis 2010, de grands progrès ont été réalisés dans la lutte contre le VIH/SIDA : selon l’étude de 2017 sur la charge mondiale de morbidité, 1,65 million de décès dans le monde étaient attribués au VIH/SIDA en 2000 (soit un taux de 24 pour 100 000). En 2017, le nombre de décès liés au VIH/SIDA dans le monde est passé à 0,95 million (12 pour 100 000).
Les taux mondiaux de paludisme ont chuté depuis 2000 mais la maladie représente toujours un fardeau important, notamment en Afrique sub-saharienne. Des dépenses totales de 5,1 milliards de dollars (4,9 – 5,4) ont été consacrées au paludisme en 2017 : 1,6 milliard de dollars (1,5 – 1,8) de dépenses publiques, 822,6 millions de dollars (660,4 – 1 046,9) de financement direct par les patients, 169,9 millions de dollars (161,0 – 179,8) de dépenses privées prépayées et 2,5 milliards de dollars de prise en charge des donateurs. Le Nigeria (704,6 millions de dollars [543,8 – 928,1]), l’Inde (210,1 millions de dollars [166,2 – 266,7]) et la République démocratique du Congo (196,4 millions de dollars [164,6 – 247,7]) étaient les trois premiers pays en termes de dépenses liées au paludisme en 2017. L’aide totale au développement pour le paludisme en 2019 s’est élevée à 2,3 milliards de dollars, une augmentation de 9,5 % par rapport au total de 2018.
En 2017, 10,9 milliards de dollars (10,3 – 11,8) ont été consacrés à la tuberculose : 6,9 milliards de dollars (6,5 – 7,5) de dépenses publiques, 2,1 milliards de dollars (1,6 – 2,7) de financement direct par les patients, 225,0 millions de dollars (184,1 – 280,7) de dépenses privées prépayées et 1,7 milliard de dollars de prise en charge des donateurs. La Russie (2,1 milliards de dollars [1,8 – 2,5]), l’Inde (1,9 milliard de dollars [1,4 – 2,5]) et la Chine (1,1 milliard de dollars [0,8 – 1,4]) étaient les trois premiers pays en termes de dépenses globales liées à la tuberculose en 2017. Depuis 2000, l’ODD liée à la tuberculose a connu une croissance phénoménale. Alors que le financement de la tuberculose s’élevait jadis à 140,3 millions de dollars (1,1 % de l’ODD totale en 2000), il représentait désormais, en 2019, 1,7 milliard de dollars, soit une augmentation de 1 085,5 %.

28 | FINANCING GLOBAL HEALTH 2019
Comme les années précédentes, le rapport Financing Global Health 2019 présente des estimations de dépenses futures sur la période comprise entre 2018 et 2050, afin d’aider les organismes de financement et les responsables de la santé à faire des prévisions. Nous estimons que les dépenses de santé mondiales passeront à 11,0 billions de dollars (10,7 – 11,2) en 2030 et à 16,7 billions de dollars (16,0 – 17,4) en 2050. Des écarts subsistent sur le plan international mais les dépenses dans les pays à revenu élevé devraient passer à 8,2 billions de dollars (8,1 – 8,4) d’ici 2030 et à 11,0 billions de dollars (10,6 – 11,5) d’ici 2050. Les dépenses dans les pays à faible revenu, d’autre part, passeront de 26,1 milliards de dollars (24,9 – 27,4) en 2017 (0,4 % des dépenses dans les pays à revenu élevé en 2017) à 43,2 milliards de dollars (40,4 – 46,2) en 2030 (0,5 % des dépenses dans les pays à revenu élevé en 2030) et à 95,5 milliards de dollars (87,0 – 104,5) en 2050 (0,9 % des dépenses dans les pays à revenu élevé en 2050).
autres faits saillants du rapport Financing Global Health 2019 :
• Estimations relatives à des maladies spécifiques liées aux indicateurs de l’ODD 3. Plus précisément, nous nous sommes centrés sur trois domaines stratégiques relatifs à la santé – le VIH/SIDA, la tuberculose et le paludisme – et sur les cibles et indicateurs de l’ODD 3 associés à ces maladies.
• Estimations récentes des dépenses mondiales de santé, désormais jusqu’en 2017, et estimations récentes des contributions à l’ADS, désormais jusqu’en 2019.
• Comparaison de l’augmentation des dépenses à l’ère des ODD et à l’ère des OMD. À ce jour, on assiste à une légère augmentation de sources supplémentaires depuis le lancement des ODD en 2015, par rapport à la croissance observée pendant les premières années de l’ère des OMD.
• Estimations récentes des dépenses relatives à la préparation aux pandémies et discussion sur l’effet que la pandémie de COVID-19 en cours pourrait avoir sur la réalisation des ODD et le soutien global en faveur des dépenses mondiales de santé.
• Estimations récentes des dépenses de santé futures jusqu’en 2030, et prévisions jusqu’en 2050 incluses en annexe.

résumé ANALyTIquE | 29


rEsumEN EjECuTIvO | 31
Resumen ejecutivoEn esta edición del informe anual Financiación de la salud en el mundo del Institute for Health Metrics and Evaluation (Instituto de Métricas y Evaluación de la Salud), la undécima de la serie, se presentan estimaciones actualizadas del gasto nacional en materia de salud, la asistencia para el desarrollo de la salud y el gasto destinado al VIH/SIDA, tuberculosis y malaria, además de las previsiones futuras de gasto sanitario. Nuestras estimaciones y seguimiento del gasto sanitario muestran patrones entre grupos de ingresos y regiones a lo largo del tiempo, destacan variaciones en la cantidad que cada país gasta en salud e identifican las áreas donde más recursos se necesitan.
En concreto, el informe Financiación de la salud en el mundo 2019 estudia el gasto en relación con los Objetivos de Desarrollo Sostenible 2030 (ODS), con énfasis en el ODS 3. En nuestro análisis, comparamos el progreso realizado hasta la fecha en el marco de los ODS con el crecimiento experimentado durante el período de los Objetivos de Desarrollo del Milenio (ODM). Por ejemplo, en los primeros tiempos de los ODM en 2000, la asistencia total para el desarrollo de la salud (ADS) se estimaba en 12 400 millones de dólares. Cuatro años más tarde, en 2004, la ADS total se había incrementado a 18 800 millones de dólares, un aumento del 51,6 %. En contraposición, cuando se adoptaron los ODS en 2015, la ADS total se estimó en 37 900 millones; en 2019, la cifra estimada era de 40 600 millones, un incremento del 7,1 %.
Este año, el informe Financiación de la salud en el mundo se adentra también en el estado de preparación ante una pandemia, un tema importante que la epidemia actual del COVID-19 ha puesto crudamente de relieve. En 2019, la asistencia al desarrollo para la preparación ante una pandemia se calculó en unos 374 millones de dólares, menos de un 1 % de la ADS total de 2019 (que en sí misma representaba tan solo un 0,5 % del gasto mundial en materia de salud). Aunque es cierto que la ADS destinada a la preparación ante una pandemia ha crecido más rápido que la ADS general a lo largo de la última década, persiste la necesidad imperiosa de conocer mejor las formas que nos ayudarán a prepararnos ante una pandemia y apoyar los sistemas capaces de paliar o prevenir pandemias como la del COVID-19.
Las estimaciones de gasto total en salud que figuran en el informe Financiación de la salud en el mundo 2019 presentan datos de 195 países de 1995 a 2017. En el caso de la ADS, presentamos estimaciones de 1990 a 2019 para 135 países en el rango de ingresos bajos y medios. Por otro lado, nuestros escenarios de gasto sanitario para el futuro abarcan el período de 2018 a 2050 para un total de 195 países.
A nivel global, el gasto mundial en salud ha aumentado en el último año, alcanzando los 7,9 billones de dólares (con un intervalo de incertidumbre del 95 % de 7,8-8,0)* en 2017, el año más reciente para el que existen datos sobre el gasto total en salud. Según el tipo de gasto, las cifras desglosadas de 2017 son las siguientes:
• 4,8 billones de dólares (4,7-4,9), o un 60,7 %, gasto público en salud • 1,5 billones (1,4-1,5), o un 18,5 %, gasto directo • 1,6 billones (1,6-1,7), o un 20,6 %, gasto privado de prepago
* Nuestros modelos de estimaciones de gasto sanitario total y de gasto sanitario destinado a VIH/SIDA, malaria y tuberculosis se presentan con intervalos de incertidumbre. Nuestras estimaciones de ADS por lo general no se basan en modelos y no incluyen intervalos de incertidumbre. A menos que se indique lo contrario, todas las estimaciones se presentan en dólares estadounidenses con ajuste a la inflación de 2019.

32 | FINANCING GLOBAL HEALTH 2019
• 40 600 millones de dólares, o un 0,5 %, financiación a través de donaciones
Ese mismo año, las estimaciones de población mundial eran de 7600 millones de personas, de las que un 49 % (3700 millones) vivía en uno de los 78 países con ingresos bajos o medios. La asignación mundial de ADS, aunque la ADS apenas represente un 0,5 % del gasto mundial en salud, es de vital importancia para aquellos países que dependen de ella. Asimismo, la ADS puede ser una inversión que actúe como catalizador al centrarse en actividades o poblaciones que de otro modo no recibirían atención o recursos. En 2019, la ADS total experimentó un ligero aumento en comparación con nuestra estimación de 2018, que fue de 39 800 millones de dólares. Desde 2010, la ADS ha aumentado un 15,3 %, de alrededor de 35 200 a 40 600 millones de dólares (cálculos realizados en dólares estadounidenses con ajuste a la inflación de 2019).
Estos datos ilustran aún más lo que ya sabemos acerca de la evolución de la financiación sanitaria: a medida que los países experimentan un crecimiento, algunos de ellos desarrollan sólidos sistemas nacionales de financiación sanitaria y logran abandonar la dependencia de la ADS y el gasto directo (que conlleva el riesgo de un gasto familiar de consecuencias catastróficas) y evolucionar hacia formas de gasto en la modalidad de prepago que se traducen en programas y seguros gubernamentales.
Sin embargo, algunos países pueden quedar «atrapados» durante esta transición: al haber dejado de cumplir las condiciones de elegibilidad para la ADS y no contar con un gasto público o programas de prepago contundentes, estos países acaban dependiendo de los pagos directos. Pasar de este «nivel intermedio» puede resultar complicado. Para garantizar que los más desfavorecidos no queden desprotegidos y asegurar la cobertura sanitaria y el bienestar de todos, la comunidad sanitaria mundial debe seguir vigilando la manera en que los países lograr avanzar hasta conseguir sistemas sanitarios autosuficientes.
Por grupos de ingresos del Banco Mundial, existe una mayor dependencia de la ADS entre los países con ingresos bajos (27,7 % [26,4-29,0] del gasto sanitario en 2017), mientras que la dependencia del gasto directo para la financiación de la atención sanitaria es mayor entre los países con ingresos bajos-medios (55 % [50,6-59,9] del gasto sanitario en 2017). El gasto público y el privado de prepago están más extendidos en los países con ingresos altos (86 % [85,7-86,2] del gasto sanitario en 2017).
Avanzar hacia la cobertura sanitaria universal es importante para lograr muchas de las metas de los ODS, sobre todo el objetivo n.º 3. Este objetivo, que pretende «garantizar una vida sana y promover el bienestar para todos en todas las edades», depende en gran medida del acceso a la atención sanitaria y medicamentos, así como de la protección contra los riesgos financieros relacionados con la salud. Además, muchos de los otros ODS están relacionados con el objetivo n.º 3: ciudades y comunidades sostenibles (objetivo n.º 11), y paz, justicia e instituciones sólidas (objetivo n.º 16) se cimientan sobre —y a la vez fomentan— sociedades saludables.
Nuestros análisis enfocados en enfermedades específicas destacan patrones de gasto destinado al VIH/SIDA, la malaria y tuberculosis; el apartado dedicado a la tuberculosis señala nuevas estimaciones de gasto

rEsumEN EjECuTIvO | 33
total en esta enfermedad. Además de presentar estimaciones comparativas de las enfermedades analizadas en el ODS 3.3, el apartado de nuestro informe sobre tuberculosis presenta un desglose del panorama de la financiación para la tuberculosis en todo el mundo.
En 2017, se dedicó un total de 20 200 millones de dólares (17 000-25 000) al VIH/SIDA: 9700 millones de dólares (6900-13 300) de gasto público, 589,4 millones (214,9-1347,9) en gasto directo, 395,8 millones (93,2-1166,8) en gasto privado de prepago y 9600 millones en financiación a través de donaciones. Sudáfrica (2200 millones de dólares [1800-2600]), Brasil (1700 millones de dólares [1000-2900]) y China (1300 millones de dólares [800-2000]) fueron los tres países con mayor gasto en VIH/SIDA en 2017. En cuanto a la ADS en 2019, 9500 millones de dólares en asistencia para el desarrollo de la salud se destinaron al apoyo de tratamientos y prevención del VIH/SIDA. Desde 2010 se han realizado grandes avances en la lucha contra el VIH/SIDA: según el estudio sobre Carga mundial de morbilidad de 2017, en 2000 se produjeron 1 650 000 muertes relacionadas con el VIH/SIDA (un índice de 24 por cada 100 000 personas). En 2017, la cifra mundial de muertes a consecuencia del VIH/SIDA descendió a 950 000 (12 por cada 100 000 personas).
Los índices de malaria van en descenso desde el año 2000, pero esta enfermedad aún tiene una alta carga de morbilidad, en particular en el África subsahariana. En 2017 el gasto total destinado a la malaria fue de 5100 millones de dólares (4900-5400): 1600 millones de dólares (1500-1800) de gasto público, 822,6 millones (660,4-1046,9) en gasto directo, 169,9 millones (161-179,8) en gasto privado de prepago y 2500 millones en financiación a través de donaciones. Nigeria (704,6 millones de dólares [543,8-928,1]), India (210,1 millones de dólares [166,2-266,7]) y República Democrática del Congo (196,4 millones de dólares [164,6-247,7]) fueron los tres países con mayor gasto destinado a la malaria en 2017. La asistencia total al desarrollo para la malaria en 2019 alcanzó la cifra de 2300 millones de dólares, lo que supone un aumento del 9,5 % con respecto al total de 2018.
En 2017 se gastaron 10 900 millones de dólares (10 300-11 800) en tuberculosis: 6900 millones de dólares (6500-7500) de gasto público, 2100 millones (1600-2700) de gasto directo, 225 millones (184,1-280,7) de gasto privado de prepago y 1700 millones en financiación a través de donaciones. Rusia (2100 millones de dólares [1800-2500]), la India (1900 millones de dólares [1400-2500]) y China (1100 millones de dólares [800-1400]) fueron los tres países con mayor gasto destinado a la tuberculosis en 2017. Desde el año 2000, la ADS para tuberculosis ha aumentado formidablemente. Mientras que en su día los fondos destinados a la tuberculosis ascendieron a 140,3 millones de dólares (un 1,1 % de la ADS total de 2000), en 2019 esta cifra se sitúa en 1700 millones de dólares, es decir, un aumento del 1085,5 %.
Al igual que en años anteriores, el informe Financiación de la salud en el mundo 2019 incluye estimaciones del gasto futuro en salud desde 2018 a 2050 con el objetivo de ayudar a las entidades financiadoras y a los legisladores a planificar con antelación. Se calcula que el gasto sanitario mundial aumentará hasta los 11 billones de dólares (10,7-11,2) en 2030 y hasta los 16,7 billones de dólares (16-17,4) para 2050. No obstante, es posible que continúen las disparidades entre los países: se prevé que el gasto en los países de ingresos

34 | FINANCING GLOBAL HEALTH 2019
altos aumente hasta los 8,2 billones de dólares (8,1-8,4) en 2030 y hasta los 11 billones de dólares (10,6-11,5) para 2050. Por otro lado, el gasto en los países con bajos ingresos aumentará de 26 100 millones de dólares (24 900-27 400) en 2017 (0,4 % del gasto de los países con altos ingresos en 2017) a 43 200 millones de dólares (40 400-46 200) en 2030 (0,5 % del gasto de los países con altos ingresos en 2030) y hasta 95 500 millones de dólares (87 000-104 500) en 2050 (0,9 % de los países con altos ingresos en 2050).
otros puntos destacados del informe Financiación de la salud en el mundo 2019 son los siguientes:
• Estimaciones específicas para determinadas enfermedades relacionadas con los indicadores de ODS 3. En concreto, nos centramos en tres áreas prioritarias de salud: VIH/SIDA, tuberculosis y malaria, y en las metas y los indicadores de ODS 3 asociados a dichas enfermedades.
• Estimaciones actualizadas del gasto mundial en materia de salud, hasta 2017, y estimaciones actualizadas de contribuciones a la ADS, hasta 2019.
• Un estudio de los aumentos del gasto en el período de los ODS en comparación con el de los ODM. Hasta hoy, se ha constatado un aumento moderado de nuevas fuentes desde la puesta en marcha de los ODS en 2015, comparado con el crecimiento observado en los primeros años de los ODM.
• Estimaciones actualizadas del gasto en apoyo de la preparación ante pandemias y un debate sobre el efecto que la pandemia actual del COVID-19 podría tener sobre el cumplimiento de los ODS y sobre el apoyo al gasto mundial en materia de salud en general.
• En el anexo se incluyen las estimaciones actualizadas sobre el gasto futuro en materia de salud hasta 2030, con proyecciones hasta 2050.

rEsumEN EjECuTIvO | 35


37 | يذيفنتلا صخلملا
التنفيذي الملخص يقدم هذا اإلصدار، الحادي عشر من سلسلة تقرير تمويل قطاع الصحة العالمي الصادر عن معهد القياسات الصحية والتقييم، تقديرات حديثة لحجم اإلنفاق المحلي على الصحة والمساعدة اإلنمائية
الصحية واإلنفاق الخاص بمكافحة فيروس نقص المناعة البشرية/اإليدز والسل والمالريا، باإلضافة إلى توقعات لحجم اإلنفاق الصحي في المستقبل. وعمليات الرصد والتقديرات التي نوفرها
لحجم اإلنفاق الصحي توضح األنماط التي توجد بين فئات الدخل والمناطق بمرور الزمن، وتلقي الضوء على التفاوتات في مقدار إنفاق كل بلد على الصحة، وتحدد الجوانب ذات الحاجة األمس إلى
مزيد من الموارد.يدرس تقرير تمويل قطاع الصحة العالمي لعام 2019 على وجه التحديد اإلنفاق المرتبط
بأهداف التنمية المستدامة لعام SDGs( 2030( ، مع التركيز على هدف SDG الثالث. وكجزء من تحليلنا، فإننا نقارن بين التقدم المحرز حتى اآلن في فترة هدف التنمية المستدامة وبين النمو المالحظ أثناء فترة الهدف اإلنمائي لأللفية )MDG(. فعلى سبيل المثال، في بداية فترة الهدف
ر إجمالي المساعدة اإلنمائية الصحية )DAH( بقيمة 12.4 مليار اإلنمائي لأللفية عام 2000، قددوالر. وبعد 4 أعوام، في عام 2004، ارتفع إجمالي المساعدة اإلنمائية الصحية إلى 18.8 مليار
ر دوالر، بزيادة قدرها 51.6%. وفي المقابل، عندما تم تبني أهداف التنمية المستدامة عام 2015، قد إجمالي المساعدة اإلنمائية الصحية بقيمة
ا معدل نمو قدره %7.1. 37.9 مليار دوالر؛ بينما بلغ 40.6 مليار دوالر في عام 2019 محققيبحث إصدار هذا العام من تقرير تمويل قطاع الصحة العالمي أيضا حجم اإلنفاق المرتبط
COVID- بالتأهب للجوائح، وهو الموضوع الذي برزت أهميته بوضوح جراء االنتشار الحالي لوباء19. في عام 2019، قدرت المساعدة اإلنمائية للتأهب للجوائح بقيمة 374 مليون دوالر، وهو ما
يمثل أقل من نسبة 1% من إجمالي المساعدة اإلنمائية الصحية لعام 2019 )التي بلغت بحد ذاتها نحو 0.5% فقط من حجم اإلنفاق العالمي على قطاع الصحة(. وبالرغم من أن المساعدة اإلنمائية الصحية المخصصة للتأهب للجوائح قد حققت معدل نمو أسرع من المساعدة اإلنمائية الصحية
الكلية خالل العقد الماضي، تظل هناك حاجة ملحة إلى استيعاب أفضل لطرق دعم التأهب للجوائح والمنظومات القادرة على تخفيف جوائح مثل COVID-19 أو منعها.
إن تقديرات اإلنفاق الصحي اإلجمالية الواردة في تقرير تمويل قطاع الصحة العالمي لعام 2019 دا من عام 1995 وحتى عام 2017. وفيما يتعلق بالمساعدة اإلنمائية الصحية، فإننا تغطي 195 بلنوفر تقديرات من عام 1990 حتى 2019 لعدد 135 من البلدان منخفضة الدخل ومتوسطة الدخل. أما السيناريوهات التي نتوقعها لحجم اإلنفاق الصحي في المستقبل، فتشمل الفترة من 2018 إلى
دا. 2050 إلجمالي 195 بل بشكل عام، ازداد حجم اإلنفاق الصحي العالمي على مدار العام الماضي، حيث وصل إلى
7.9 تريليون دوالر )7.8–8 بفاصل عدم تأكد 95%(* في عام 2017، وهو أحدث عام تتوفر له بيانات ا لنوع اإلنفاق، يمكن تقسيم إجمالي اإلنفاق خالل عام 2017 بشأن إجمالي اإلنفاق الصحي. ووفق
على النحو التالي:
4.8 تريليون دوالر )4.7–4.9(، أو 60.7%، إنفاق حكومي على الصحة • 1.5 تريليون دوالر )1.4-1.5(، أو 18.5%، إنفاق شخصي على الصحة • ا • 1.6 تريليون دوالر )1.6-1.7(، أو 20.6%، إنفاق خاص مدفوع مسبق40.6 مليار دوالر، أو 0.5%، تمويل من جهات مانحة•
ر عدد سكان العالم بنحو 7.6 مليار نسمة، من بينهم 49% )3.7 مليار( كانوا وفي العام نفسه، قددا منخفضة الدخل أو ذات الدخل األقل من المتوسط. يعد االلتزام ـ78 بل يعيشون في واحد من ال
ل 0.5% فقط من اإلنفاق العالمي على العالمي بالمساعدة اإلنمائية الصحية، حتى إن كانت تشكالصحة، أمرا ذا أهمية قصوى بالنسبة للبلدان التي تعتمد على هذه المساعدة. وباإلضافة إلى ذلك،
ا عن طريق التركيز على األنشطة يمكن أن تمثل المساعدة اإلنمائية الصحية استثمارا تحفيزيأو الفئات التي قد ال تحظى باالهتمام أو الموارد بصورة أخرى. ارتفع إجمالي المساعدة اإلنمائية الصحية في عام 2019 بصورة طفيفة عن تقديرنا لعام 2018، الذي بلغ 39.8 مليار دوالر. ومنذ
* تقديراتنا المنمذجة إلجمالي اإلنفاق الصحي واإلنفاق الصحي المخصص لمكافحة فيروس نقص المناعة البشرية/اإليدز والمالريا ومرض السل مقدمة بفواصل عدم تأكد. أما
تقديراتنا للمساعدة اإلنمائية الصحية، فهي ليست منمذجة بصورة عامة وال تتضمن فواصل عدم تأكد. ما لم تتم
اإلشارة إلى خالف ذلك، فإن جميع التقديرات مقدمة بالدوالر األمريكي المعدل حسب التضخم في عام 2019.
38 | FINANCING GLOBAL HEALTH 2019
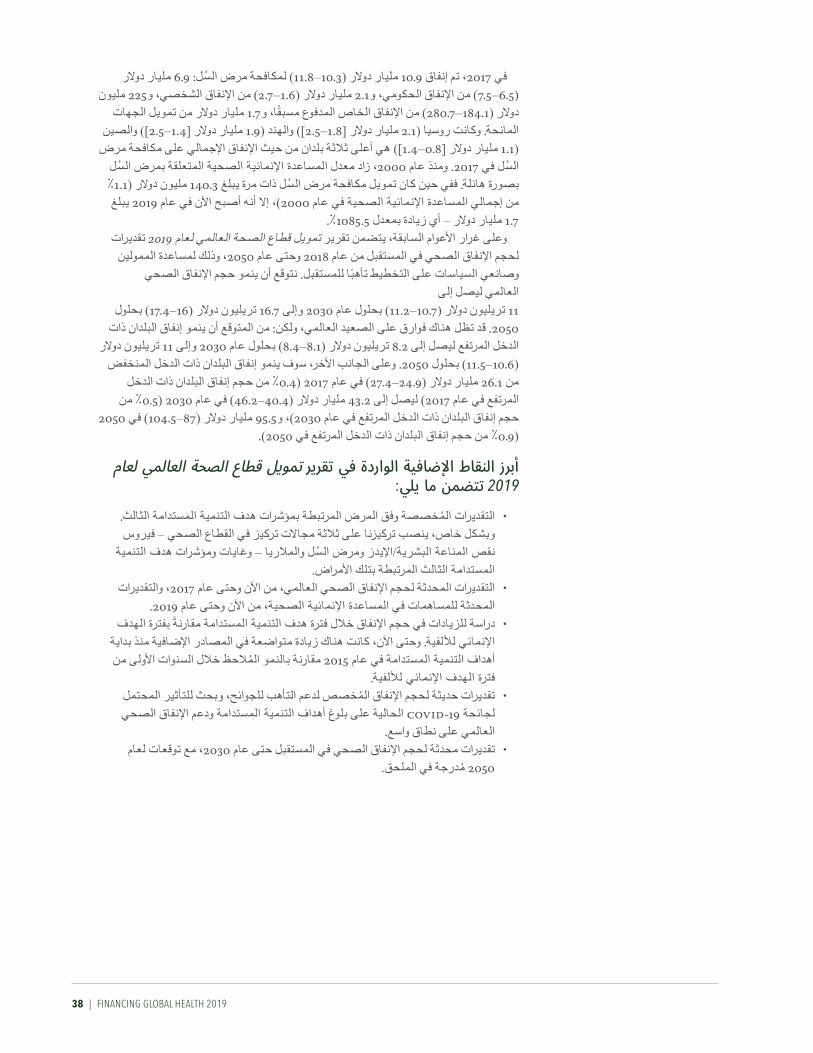
في 2017، تم إنفاق 10.9 مليار دوالر )10.3–11.8( لمكافحة مرض السل: 6.9 مليار دوالر )6.5–7.5( من اإلنفاق الحكومي، و2.1 مليار دوالر )1.6–2.7( من اإلنفاق الشخصي، و225 مليون
ا، و1.7 مليار دوالر من تمويل الجهات دوالر )184.1–280.7( من اإلنفاق الخاص المدفوع مسبقالمانحة. وكانت روسيا )2.1 مليار دوالر ]1.8–2.5[( والهند )1.9 مليار دوالر ]1.4–2.5[( والصين
)1.1 مليار دوالر ]0.8–1.4[( هي أعلى ثالثة بلدان من حيث اإلنفاق اإلجمالي على مكافحة مرض السل في 2017. ومنذ عام 2000، زاد معدل المساعدة اإلنمائية الصحية المتعلقة بمرض السل بصورة هائلة. ففي حين كان تمويل مكافحة مرض السل ذات مرة يبلغ 140.3 مليون دوالر )%1.1 من إجمالي المساعدة اإلنمائية الصحية في عام 2000(، إال أنه أصبح اآلن في عام 2019 يبلغ
1.7 مليار دوالر – أي زيادة بمعدل %1085.5.وعلى غرار األعوام السابقة، يتضمن تقرير تمويل قطاع الصحة العالمي لعام 2019 تقديرات
لحجم اإلنفاق الصحي في المستقبل من عام 2018 وحتى عام 2050، وذلك لمساعدة الممولين ا للمستقبل. نتوقع أن ينمو حجم اإلنفاق الصحي وصانعي السياسات على التخطيط تأهب
العالمي ليصل إلى 11 تريليون دوالر )10.7–11.2( بحلول عام 2030 وإلى 16.7 تريليون دوالر )16–17.4( بحلول
2050. قد تظل هناك فوارق على الصعيد العالمي، ولكن: من المتوقع أن ينمو إنفاق البلدان ذات الدخل المرتفع ليصل إلى 8.2 تريليون دوالر )8.1–8.4( بحلول عام 2030 وإلى 11 تريليون دوالر
)10.6–11.5( بحلول 2050. وعلى الجانب اآلخر، سوف ينمو إنفاق البلدان ذات الدخل المنخفض من 26.1 مليار دوالر )24.9–27.4( في عام 2017 )0.4% من حجم إنفاق البلدان ذات الدخل
المرتفع في عام 2017( ليصل إلى 43.2 مليار دوالر )40.4–46.2( في عام 2030 )0.5% من حجم إنفاق البلدان ذات الدخل المرتفع في عام 2030(، و95.5 مليار دوالر )87–104.5( في 2050
)0.9% من حجم إنفاق البلدان ذات الدخل المرتفع في 2050(.
أبرز النقاط اإلضافية الواردة في تقرير تمويل قطاع الصحة العالمي لعام
2019 تتضمن ما يلي:
التقديرات المخصصة وفق المرض المرتبطة بمؤشرات هدف التنمية المستدامة الثالث. وبشكل خاص، ينصب تركيزنا على ثالثة مجاالت تركيز في القطاع الصحي – فيروس
نقص المناعة البشرية/اإليدز ومرض السل والمالريا – وغايات ومؤشرات هدف التنمية المستدامة الثالث المرتبطة بتلك األمراض.
التقديرات المحدثة لحجم اإلنفاق الصحي العالمي، من اآلن وحتى عام 2017، والتقديرات المحدثة للمساهمات في المساعدة اإلنمائية الصحية، من اآلن وحتى عام 2019.
دراسة للزيادات في حجم اإلنفاق خالل فترة هدف التنمية المستدامة مقارنة بفترة الهدف اإلنمائي لأللفية. وحتى اآلن، كانت هناك زيادة متواضعة في المصادر اإلضافية منذ بداية أهداف التنمية المستدامة في عام 2015 مقارنة بالنمو المالحظ خالل السنوات األولى من
فترة الهدف اإلنمائي لأللفية. تقديرات حديثة لحجم اإلنفاق المخصص لدعم التأهب للجوائح، وبحث للتأثير المحتمل
لجائحة COVID-19 الحالية على بلوغ أهداف التنمية المستدامة ودعم اإلنفاق الصحي العالمي على نطاق واسع.
تقديرات محدثة لحجم اإلنفاق الصحي في المستقبل حتى عام 2030، مع توقعات لعام 2050 مدرجة في الملحق.

39 | يذيفنتلا صخلملا
عام 2010، زادت المساعدة اإلنمائية الصحية بنسبة 15.3% من نحو 35.2 مليار دوالر إلى 40.6 رة بالدوالر األمريكي المعدل حسب التضخم في عام 2019(. مليار دوالر )مقد
توفر هذه النتائج مزيدا من المعلومات بشأن ما نعرفه بالفعل عن التحول التمويلي الصحي: مع نمو البلدان، يتمكن بعضها من وضع منظومات تمويل محلية قوية لقطاع الصحة وتكون قادرة
على التحول بعيدا عن المساعدة اإلنمائية الصحية واإلنفاق الشخصي )الذي ينطوي على خطر ا في صورة البرامج الحكومية والتأمين. اإلنفاق األسري الكارثي( ونحو أشكال اإلنفاق المدفوع مسبق
ولكن بعض البلدان قد "تتعثر" خالل هذا التحول: بعد تحقيق نمو يتجاوز متطلبات األهلية ا، للمساعدة اإلنمائية الصحية، وفي غياب األشكال القوية من اإلنفاق الحكومي والمدفوع مسبق
قد تصبح البلدان معتمدة على المدفوعات الشخصية. وقد يكون التحول بعيدا عن مرحلة "الوسط ا. للتأكد من عدم إهمال الفئات األشد فقرا، ولضمان توفير التغطية الصحية المفقود" هذه أمرا صعبوالعافية للجميع، ينبغي أن يواصل المجتمع الصحي العالمي رصد الكيفية التي تتحول بها البلدان
ا. نحو المنظومات الصحية المكتفية ذاتيبل البنك الدولي، فإن البلدان منخفضة الدخل هي األكثر اعتمادا حسب فئة الدخل المصنفة من قعلى المساعدة اإلنمائية الصحية )27.7% ] 26.4–29[ من حجم اإلنفاق الصحي في عام 2017(،
بينما يتم االعتماد على اإلنفاق الشخصي بالصورة األكبر لتمويل الرعاية الصحية في البلدان ذات الدخل األقل من المتوسط )55% ]50.6–59.9[ من حجم اإلنفاق الصحي في عام 2017(.
ا هما األكثر انتشارا في البلدان في حين يكون اإلنفاق الحكومي واإلنفاق الخاص المدفوع مسبق مرتفعة الدخل
)86% ]85.7–86.2[ من حجم اإلنفاق الصحي في عام 2017(.يعد السعي نحو توفير تغطية صحية شاملة أمرا مهما لتحقيق العديد من أهداف التنمية
المستدامة، وال سيما الهدف الثالث. وبشكل عام، يعتمد هذا الهدف، الذي يرمي إلى "ضمان تمتع الجميع بأنماط عيش صحية وبالعافية في جميع األعمار"، على الوصول إلى الرعاية والدواء،
باإلضافة إلى الحماية من المخاطر المالية المتعلقة بالصحة. وفضال عن ذلك، فإن العديد من أهداف التنمية المستدامة األخرى ترتبط بالهدف الثالث: مدن ومجتمعات محلية مستدامة )الهدف
11( والسالم والعدل والمؤسسات القوية )الهدف 16(، فهي تعتمد على – وبالتالي تعزز – وجود المجتمعات الصحية.
تبرز تحليالتنا المخصصة وفق المرض أنماط اإلنفاق الخاصة بمكافحة فيروس نقص المناعة البشرية/اإليدز والمالريا والسل؛ بينما يسلط القسم المخصص لمرض السل الضوء على التقديرات
الجديدة إلجمالي اإلنفاق على هذا المرض. وباإلضافة إلى توفير تقديرات مشابهة لألمراض التي ا لحالة ي ا تفصيل يغطيها هدف التنمية المستدامة 3.3، فإن قسم مرض السل في تقريرنا يقدم بيان
التمويل المخصص لمكافحة مرض السل في جميع أنحاء العالم. في 2017، تم إنفاق 20.2 مليار دوالر إجماال )17–25( لمكافحة فيروس نقص المناعة البشرية/اإليدز: 9.7 مليار دوالر )6.9–13.3( من اإلنفاق الحكومي، و589.4 مليون دوالر
)214.9–1347.9( من اإلنفاق الشخصي، و395.8 مليون دوالر )93.2–1166.8( من اإلنفاق ا، و9.6 مليار دوالر من تمويل الجهات المانحة. وكانت جنوب إفريقيا )2.2 الخاص المدفوع مسبق
مليار دوالر ]1.8–2.6[( والبرازيل )1.7 مليار دوالر ]1–2.9[( والصين )1.3 مليار دوالر ]0.8–2[( هي أعلى ثالثة بلدان من حيث اإلنفاق اإلجمالي على مكافحة فيروس نقص المناعة البشرية/
اإليدز في عام 2017. أما بالنسبة للمساعدة اإلنمائية الصحية لعام 2019، فقد تم تخصيص 9.5 مليار دوالر منها لدعم عالج فيروس نقص المناعة البشرية/اإليدز والوقاية منه. ومنذ عام 2010، ا لدراسة عبء المرض تم قطع أشواط كبيرة في مكافحة فيروس نقص المناعة البشرية/اإليدز: وفقا بسبب فيروس نقص المناعة البشرية/ العالمي لعام 2017، تم رصد 1.65 مليون حالة وفاة عالمي
اإليدز )بمعدل يبلغ 24 حالة وفاة من كل 100000 مصاب( في عام 2000. وفي عام 2017، انخفضت حاالت الوفاة بسبب فيروس نقص المناعة البشرية/اإليدز على الصعيد العالمي إلى
0.95 مليون )12 حالة وفاة من كل 100000 مصاب(.ا كبيرا، انخفضت معدالت اإلصابة بالمالريا منذ عام 2000، ولكن ال يزال المرض يسبب عبئ
وتحديدا في الدول اإلفريقية التي تقع جنوب الصحراء الكبرى. تم إنفاق 5.1 مليار دوالر )4.9–5.4( إجماال لمكافحة المالريا في عام 2017: 1.6 مليار دوالر )1.5–1.8( من اإلنفاق الحكومي،
و822.6 مليون دوالر )660.4–1046.9( من اإلنفاق الشخصي، و169.9 مليون دوالر ا، و2.5 مليار دوالر من تمويل الجهات المانحة. )161–179.8( من اإلنفاق الخاص المدفوع مسبق

40 | FINANCING GLOBAL HEALTH 2019
وكانت نيجيريا )704.6 مليون دوالر ]543.8–928.1[( والهند )210.1 مليون دوالر ]–266.7166.2[( وجمهورية الكونغو الديمقراطية )196.4 مليون دوالر ]164.6–247.7[( هي أعلى ثالثة
بلدان من حيث اإلنفاق على مكافحة المالريا في عام 2017. ووصل إجمالي المساعدة اإلنمائية لمكافحة المالريا في عام 2019 إلى 2.3 مليار دوالر، بزيادة تبلغ 9.5% عن إجمالي المساعدة
في عام 2018.

41 | يذيفنتلا صخلملا


INTrODuCTION | 43
IntroductionThe Institute for Health Metrics and Evaluation is pleased to present Financing Global Health 2019, the 11th in the series to track global health spending. This year we include a broad set of health spending estimates, comprising total health spending (i.e., viewing the entire health sector as one) and more in-depth analyses of DAH, including tracking for each major donor, channel of assistance, health focus area, and recipient; and total spending on three key health focus areas – HIV/AIDS, tuberculosis, and malaria. We also estimate health spending into the future, to help policy-makers and related stakeholders plan for coming transitions and challenges.
The end of 2019 brought with it the enormous challenges posed by the COVID-19 pandemic. Since the start of the epidemic, which the World Health Organization declared a pandemic on March 11, 2020, there has been an ever-rising number of cases and deaths worldwide.1 Shocks to the global economy have been severe: In January and February 2020, China’s industrial production and retail sales declined 13.5% and 20.5%, respectively, much more than analysts had predicted.2 And stock markets, driven by global closures and lockdown, have tumbled dramatically since the epi-demic went worldwide.
Moreover, COVID-19 has strained health systems around the world. In addition to the acute challenges posed by the pandemic, it remains unclear how the COVID-19 pandemic will impact DAH going forward, as many high-income countries are projected to experience large economic impacts, not to mention losses of life. If DAH declines as a result of COVID-19 fallout, how will the treatment and mitigation of DAH-dependent health focus areas be affected? Could COVID-19 have widespread effects, leading to increased burden of otherwise unrelated diseases as a result of shifting funding priorities?
The COVID-19 pandemic underscores a number of issues related to funding for pandemic preparedness. First is the relatively small amount of DAH directed toward pandemic preparedness. For example, in 2019, DAH specifically directed at pandemic preparedness was 0.9% of overall DAH, while all health systems strengthening constituted 13.8%. There is also the question of which countries should fund pandemic preparedness; should global health security be funded only by those countries that can afford it?
Ultimately, staving off global pandemics requires robust public health systems, which in turn require robust public financing. In the absence of adequate government spending, donor support – and therefore global cooperation – is key. By shedding light on the interconnected and interde-pendent nature of global health financing, Financing Global Health 2019 helps policymakers and decision-makers better understand and answer these sorts of complex questions.
In the introduction of this report we provide a broad overview of total health spending for 195 countries, from 1995 to 2017, as well as introduce what is new in this report. We also begin to explore the underlying theme of Financing Global Health 2019, examining health spending trends through

44 | FINANCING GLOBAL HEALTH 2019
the frame of Sustainable Development Goal 3. Adopted following the end of the Millennium Development Goal (MDG) era in 2015, as part of the 2030
Agenda for Sustainable Development, the Sustainable Development Goals (SDGs) are the core of a plan to, according to the United Nations, provide “a shared blueprint for peace and prosperity for people and the planet, now and into the future.” The SDGs comprise 17 goals that are “our shared vision of humanity and a social contract between the world’s leaders and the people,” said then-UN Secretary-General Ban Ki-moon when the 2030 Agenda was adopted. While many of the 17 goals are indirectly related to improving the world’s health – such as SDG 2, “Zero Hunger,” SDG 6, “Clean Water and Sanitation,” and SDG 13, “Climate Action” – SDG 3, which aims to “ensure healthy lives and promote well-being for all at all ages,” tackles improving the world’s health directly.
Following this, Part One of the report delves into two types of spending: total health spending and DAH. In Part Two of Financing Global Health 2019, we present updated estimates for HIV/AIDS and malaria spending, as we have in previous years. This year we are also pleased to present for the first time detailed separate tuberculosis estimates. Doing so allows us to highlight a curable disease that continues to cause significant global burden, especially in low- and middle-income countries, while providing estimates related to SDG target 3.3.*
Part Three of Financing Global Health 2019 includes projections of spending from 2018 to 2030, and includes further exploration of SDG 3 progress and challenges to date.
And finally, Part Four, which is also new in Financing Global Health 2019, contains detailed profiles of funding sources and channels of DAH, and analyses of key health focus areas. Stakeholders can refer to the profiles at a glance for easily accessible information and data on a range of funding streams and conditions. In addition to being available as a section of Financing Global Health 2019, the profiles can be accessed individually on healthdata.org.
Box 1 Published papers
The work presented in Financing Global Health 2019 draws in part on two peer-reviewed research articles published on April 23, 2020.
• Health sector spending and spending on HIV/AIDS, tuberculosis, and malaria, and development assistance for health: progress towards Sustainable Development Goal 3
• Tracking total spending on tuberculosis by source and function in 135 low-income and middle- income countries, 2000–17: a financial modelling study
* SDG 3.3 reads: “By 2030, end the epidemics of AIDS, tuberculosis, malaria and neglected tropical diseases and combat hepatitis, water-borne diseases and other communicable diseases.”

INTrODuCTION | 45
What’s new in FGH 2019 This edition of Financing Global Health introduces a number of novel data sources, analyses, and sections. The report has been published annually since 2010, and with every iteration we seek to improve upon the previous year’s work. Here’s what’s new in Financing Global Health 2019:
• A focus on Sustainable Development Goal 3The broad theme of Financing Global Health 2019 is estimating spending related to the SDGs, which have a target date of 2030. In particular, our estimates track spending toward the targets for Sustainable Development Goal 3, the goal explicitly devoted to improving health and well-being. Our work is most applicable to 13 related targets and 26 indicators associated with SDG 3.
• Tuberculosis spending estimatesFor the first time, Financing Global Health includes a separate section on tuberculosis spending. In addition to providing comparable esti-mates for diseases covered by SDG target 3.3, the focus on tuberculosis sheds light on a curable disease that contributes to significant suffering in low- and middle-income countries.
• Updated future health spending projections to 2030 and 2050Financing Global Health 2019 includes updated spending projections to 2030 (the SDG target date) and 2050. Our work explores trends in future health spending for 195 countries, assuming historical spending patterns and relationships persist. We also examine health spending scenarios were governments to raise – or lower – their resource commitments for health.
• Up-to-date pandemic preparedness estimates and analysisOur DAH estimates include up-to-date pandemic preparedness esti-mates. In 2019, roughly 1% of DAH was spent on health systems strengthening for pandemic preparedness. The COVID-19 pandemic highlights the need for additional spending on pandemic preparedness, and the importance of global cooperation to prevent and mitigate future crises.
• Global health financing profilesAnother new addition to Financing Global Health 2019 (and the series as a whole) is the global health financing profiles. Stakeholders can refer to the global health financing profiles at a glance for easily accessible information and data on a range of funding streams and conditions. As well as being available as a section of Financing Global Health 2019, these can be accessed individually on healthdata.org.
In addition to the report updates, the online Financing Global Health data visualization available at http://www.healthdata.org/results/data- visualizations has been updated with total spending numbers through 2017 (including tuberculosis-specific estimates), DAH estimates through 2019, and health spending projections to 2050. All the estimates analyzed and described in this report are publicly available for download at http://ghdx.healthdata.org/.
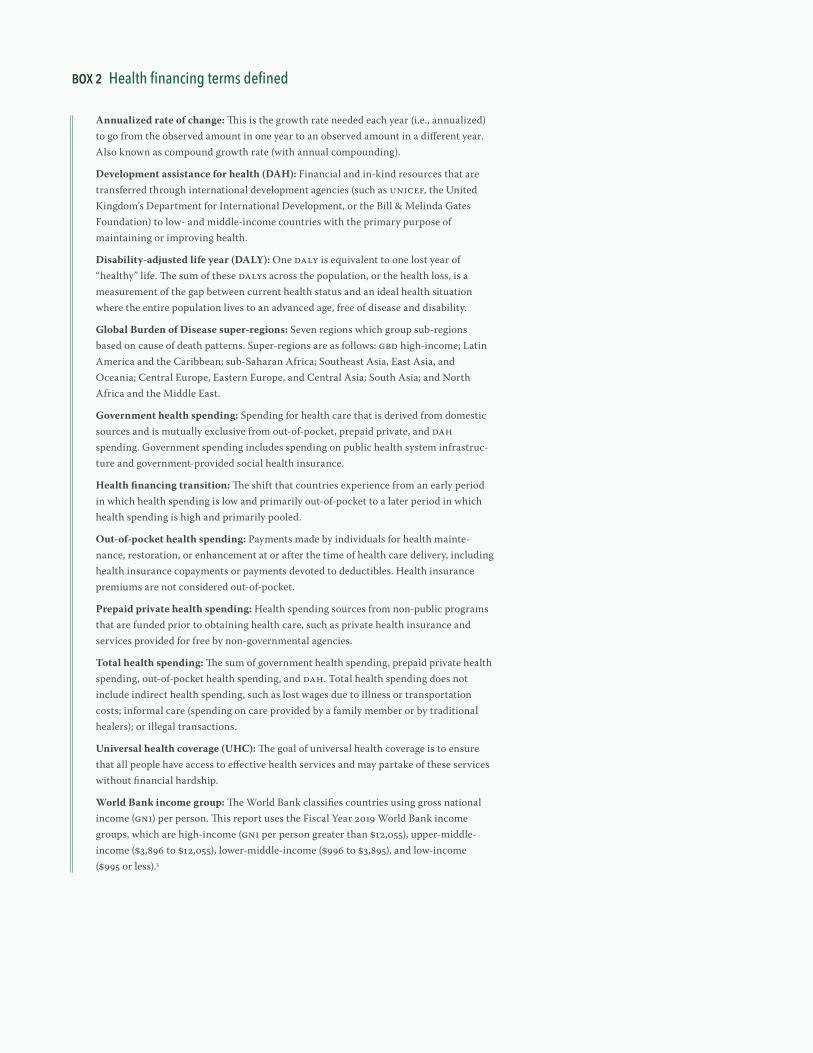
46 | FINANCING GLOBAL HEALTH 2019
Box 2 Health financing terms defined
Annualized rate of change: This is the growth rate needed each year (i.e., annualized) to go from the observed amount in one year to an observed amount in a different year. Also known as compound growth rate (with annual compounding).
Development assistance for health (DAH): Financial and in-kind resources that are transferred through international development agencies (such as UNICEF, the United Kingdom’s Department for International Development, or the Bill & Melinda Gates Foundation) to low- and middle-income countries with the primary purpose of maintaining or improving health.
Disability-adjusted life year (DALY): One DALY is equivalent to one lost year of “healthy” life. The sum of these DALYs across the population, or the health loss, is a measurement of the gap between current health status and an ideal health situation where the entire population lives to an advanced age, free of disease and disability.
Global Burden of Disease super-regions: Seven regions which group sub-regions based on cause of death patterns. Super-regions are as follows: GBD high-income; Latin America and the Caribbean; sub-Saharan Africa; Southeast Asia, East Asia, and Oceania; Central Europe, Eastern Europe, and Central Asia; South Asia; and North Africa and the Middle East.
Government health spending: Spending for health care that is derived from domestic sources and is mutually exclusive from out-of-pocket, prepaid private, and DAH spending. Government spending includes spending on public health system infrastruc-ture and government-provided social health insurance.
Health financing transition: The shift that countries experience from an early period in which health spending is low and primarily out-of-pocket to a later period in which health spending is high and primarily pooled.
Out-of-pocket health spending: Payments made by individuals for health mainte-nance, restoration, or enhancement at or after the time of health care delivery, including health insurance copayments or payments devoted to deductibles. Health insurance premiums are not considered out-of-pocket.
Prepaid private health spending: Health spending sources from non-public programs that are funded prior to obtaining health care, such as private health insurance and services provided for free by non-governmental agencies.
Total health spending: The sum of government health spending, prepaid private health spending, out-of-pocket health spending, and DAH. Total health spending does not include indirect health spending, such as lost wages due to illness or transportation costs; informal care (spending on care provided by a family member or by traditional healers); or illegal transactions.
Universal health coverage (UHC): The goal of universal health coverage is to ensure that all people have access to effective health services and may partake of these services without financial hardship.
World Bank income group: The World Bank classifies countries using gross national income (GNI) per person. This report uses the Fiscal Year 2019 World Bank income groups, which are high-income (GNI per person greater than $12,055), upper-middle- income ($3,896 to $12,055), lower-middle-income ($996 to $3,895), and low-income ($995 or less).3

INTrODuCTION | 47
Health spending and the Sustainable Development Goals
Total health spending*
Total global health spending reached $7.9 trillion (7.8–8.0) in 2017, the most recent year for which data were available.** This represents a 3.0% (1.4–4.8) increase over the 2016 estimate. The United States, with $3.3 trillion (3.3–3.4) in total health spending in 2017, remains the leading spender globally. Across all countries, health spending makes up 9.7% (9.6–9.8) of the global economy, a substantial increase from 1995, when it was 8.1% (8.0–8.2). Increases in global spending on health and the major fraction of the global economy that falls within the health sector are a critical reminder of the importance of understanding health financing globally, as well as transitions that tend to occur as low- and middle-income countries become wealthier.
Figure 1 shows the absolute amount total global health spending has grown between 1995 and 2017, with spending disaggregated into four key sources: DAH, prepaid private health spending, out-of-pocket spending, and government health spending. DAH is support provided through major development agencies to improve and maintain health in low- and middle- income countries. Prepaid private spending covers health spending on private insurance premiums and through domestic non-governmental organizations. Out-of-pocket spending includes all health spending that is not paid in advance. Finally, government health spending is defined as
2017
Billi
ons o
f 201
9 uS
dol
lars
0
2,000
4,000
6,000
8,000
1998
1995
2012
1996
1997
1999
2000
2001
2002
2003
2004
2005
2006
2007
2008
2009
2010
2011
2013
2014
2015
2016
Development assistance for healthPrepaid private health spendingOut-of-pocket health spendingGovernment health spending
Figure 1 Health spending by source of financing, 1995–2017
* Unless otherwise indicated, the source for all figures is the Financing Global Health Database 2019. ** Our modeled estimates for total health spending and HIV/AIDS, malaria, and tuberculosis health spending are presented with uncertainty intervals. Our estimates of DAH are generally not modeled and do not include uncertainty intervals. Unless otherwise indicated, all estimates are reported in 2019 inflation-adjusted US dollars. Estimates in 2019 purchasing- power parity-adjusted dollars are available at http://ghdx.healthdata.org/.

48 | FINANCING GLOBAL HEALTH 2019
spending on health from all levels of government, in public and private facilities.
While government health spending has during this period remained the leading source of health spending, the degree to which government health spending dominates the total spending picture has shifted. For example, in 1995, government health spending made up 58.8% (58.1–59.5) of total spending, whereas in 2017 it made up 60.7% (60.2–61.2). Since 1995, all other forms of spending have also changed; prepaid private health spending went from 21.3% (20.6–22.0) in 1995 to 20.6% (20.2–21.0) in 2017; out-of-pocket spending went from 19.7% (19.3–20.2) in 1995 to 18.5% (18.0–19.1) in 2017; and DAH increased from 0.1% (0.1–0.1) of total spending on health in 1995 to 0.2% (0.2–0.2) in 2017.
Figures 2 and 3 show how spending sources break down by income group and Global Burden of Disease super-region, respectively, between 1995 and 2017. Highlights include the increase in prepaid private spending per person in high-income countries (up 3.0% [2.8–3.2]) during this period, the growth of government spending per person in upper-middle-income countries (up 6.1% [5.7–6.5]), and the increase in DAH in low-income countries (up 7.2%). Outside of DAH, low-income countries saw low growth in per person health spending in other areas between 1995 and 2017: total health spending grew 1.4% (1.1–1.7); government spending 0.4% (-0.2 to 1.0), prepaid private spending 2.3% (0.8–4.0), and out-of-pocket spending 0.0% (-0.5 to 0.6).
By GBD super-region, the Latin America and Caribbean super-region saw a decrease in DAH during this period (down 1.8%), while sub-Saharan Africa saw the largest increase in DAH between 1995 and 2017 (7.6%).
Figure 2 Annualized rate of change in health spending per person by income group, 1995–2017
low-income
lower-middle-income
upper-middle-income
High-income
global
-2 -1 0 1 2 3 4 5 6 7 8 9 10
Annualized rate of change (%) 1995−2017
Total health spending per personGovernment health spending per person
Prepaid private health spending per personOut-of-pocket health spending per personDevelopment assistance for health spending per person
Black lines represent 95% uncertainty intervals.

INTrODuCTION | 49
Finally, Figure 4 compares spending, population, and DALYs across income groups. Most health spending (80.1% [79.2–80.9]) takes place in high-income countries, while the least (0.3% [0.3–0.3]) occurs in low-income countries. As shown in the second bar, 15.8% of the global population lives in a high-income country, while 35.2%, 39.8%, and 9.2% live in upper-middle-, lower-middle-, and low-income countries, respectively. And as shown in the figure’s third bar, the proportion of DALYs, or years of healthy life lost due to more than 350 diseases and injuries per the Global Burden of Disease 2017 study, was highest in lower-middle-income countries (43.6% [42.9–44.4]), with upper-middle-income countries seeing 29.7% (29.1–30.3) of DALYs, low-income countries 13.2% (12.7–13.8), and high-income coun-tries 13.4% (12.9–14.0) of total DALYs.
This figure highlights the enormous inequality in health spending and access to health care seen across the world; that most health spending is concentrated in high-income countries, which comprise the smallest
Annualized rate of change (%) 1995−2017
Sub-Saharan africa
Southeast asia, east asia, and oceania
South asia
North africa and Middle east
latin america and Caribbean
gbD high-income
Central europe, eastern europe, and Central asia
-2 -1 0 1 2 3 4 5 6 7 8 9 10
Total health spending per personGovernment health spending per person
Prepaid private health spending per personOut-of-pocket health spending per personDevelopment assistance for health spending per person
Black lines represent 95% uncertainty intervals.
Figure 3 Annualized rate of change in health spending per person by GBD super-region, 1995–2017

50 | FINANCING GLOBAL HEALTH 2019
Perc
ent o
f tot
al
0
20
40
60
80
100
Health spending Population Disability-adjusted life years
High-income countriesUpper-middle-income countriesLower-middle-income countriesLow-income countries
Source: Financing Global Health Database 2019 and gbd 2017 study
Figure 4 Health spending, population, and disability-adjusted life years by World bank income group, 2017
percentage of the world population, is critically important for what it suggests about access to health services. In addition, it is important to note that the Financing Global Health project does not track within-country health spending disparities – all of our tracking is at the national level. Even in the absence of these data, huge inequalities across countries and income groups are apparent.
Sustainable Development Goal 3 – which seeks to improve the health and well-being of people around the world – comprises 13 related targets and 26 indicators associated with those targets. SDG 3’s targets range from the micro and cause-focused – “by 2030, reduce by one-third premature mortality from non-communicable diseases through prevention and treatment and promote mental health and well-being” (3.4) – to broader targets, such as “substantially [reducing] the number of deaths and illnesses from hazardous chemicals and air, water, and soil pollution and contamina-tion” by 2030 (3.9) – that, though achieving them will unquestionably improve health outcomes, are not necessarily health-specific. Our work was therefore focused on evaluating the financing toward a subset of SDG 3 targets and indicators. Box 3 explores the SDG 3 targets and indicators relevant to Financing Global Health 2019.
Figure 5, which compares health spending allocated by source to GDP per person in 2017, shows DAH, out-of-pocket spending, prepaid private spending, and government health spending as percentages of overall country health spending; the figure illustrates how health spending tends to evolve as GDP increases. This is the “health financing transition,” in which countries, in many cases, move away from out-of-pocket spending and DAH

INTrODuCTION | 51
Box 3 Sustainable Development goal 3 targets and indicators4
Targets Indicators
3.1 by 2030, reduce the global maternal mortality ratio to less than 70 per 100,000 live births
3.1.1 Maternal mortality ratio
3.1.2 Proportion of births attended by skilled health personnel
3.2 by 2030, end preventable deaths of newborns and children under 5 years of age, with all countries aiming to reduce neonatal mortality to at least as low as 12 per 1,000 live births and under-5 mortality to at least as low as 25 per 1,000 live births
3.2.1 under-5 mortality rate
3.2.2 Neonatal mortality rate
3.3 by 2030, end the epidemics of aiDS, tuberculosis, malaria and neglected tropical diseases and combat hepatitis, water-borne diseases and other communicable diseases
3.3.1 Number of new HiV infections per 1,000 uninfected population, by sex, age, and key populations
3.3.2 Tuberculosis incidence per 1,000 population
3.3.3 Malaria incidence per 1,000 population
3.3.4 Hepatitis b incidence per 100,000 population
3.3.5 Number of people requiring interventions against neglected tropical diseases
3.4 by 2030, reduce by one-third premature mortality from non-communicable diseases through prevention and treatment and promote mental health and well-being
3.4.1 Mortality rate attributed to cardiovascular disease, cancer, diabetes or chronic respiratory disease
3.4.2 Suicide mortality rate
3.5 Strengthen the prevention and treatment of substance abuse, including narcotic drug abuse and harmful use of alcohol
3.5.1 Coverage of treatment interventions (pharmacological, psychosocial and rehabilitation and aftercare services) for substance use disorders
3.5.2 Harmful use of alcohol, defined according to the national context as alcohol per capita consumption (aged 15 years and older) within a calendar year in litres of pure alcohol
3.6 by 2020, halve the number of global deaths and injuries from road traffic accidents
3.6.1 Death rate due to road traffic injuries
3.7 by 2030, ensure universal access to sexual and reproductive health-care services, including for family planning, information and education, and the integration of reproductive health into national strategies and programmes
3.7.1 Proportion of women of reproductive age (aged 15-49 years) who have their need for family planning satisfied with modern methods
3.7.2 adolescent birth rate (aged 10-14 years; aged 15-19 years) per 1,000 women in that age group
3.8 Achieve universal health coverage, including financial risk protection, access to quality essential health-care services and access to safe, effective, quality and affordable essential medicines and vaccines for all
3.8.1 Coverage of essential health services (defined as the average coverage of essen-tial services based on tracer interventions that include reproductive, maternal, newborn and child health, infectious diseases, non-communicable diseases and service capacity and access, among the general and the most disadvantaged population)
3.8.2 Proportion of population with large household expenditures on health as a share of total household expenditure or income
3.9 by 2030, substantially reduce the number of deaths and illnesses from hazardous chemicals and air, water and soil pollution and contamination
3.9.1 Mortality rate attributed to household and ambient air pollution
3.9.2 Mortality rate attributed to unsafe water, unsafe sanitation and lack of hygiene (exposure to unsafe Water, Sanitation and Hygiene for all (WaSH) services)
3.9.3 Mortality rate attributed to unintentional poisoning
3.A Strengthen the implementation of the World Health organization Framework Convention on Tobacco Control in all countries, as appropriate
3.A.1 age-standardized prevalence of current tobacco use among persons aged 15 years and older
3.B Support the research and development of vaccines and medicines for the communicable and non-communicable diseases that primarily affect developing countries, provide access to affordable essential medicines and vaccines, in accordance with the Doha Declaration on the TriPS agreement and Public Health, which affirms the right of developing countries to use to the full the provisions in the agreement on Trade-related aspects of Intellectual Property Rights regarding flexibilities to protect public health, and, in particular, provide access to medicines for all
3.B.1 Proportion of the population with access to affordable medicines and vaccines on a sustainable basis
3.B.2 Total net official development assistance to medical research and basic health sectors
3.C Substantially increase health financing and the recruitment, development, training and retention of the health workforce in developing countries, especially in least developed countries and small island developing States
3.C.1 Health worker density and distribution
3.D Strengthen the capacity of all countries, in particular developing countries, for early warning, risk reduction and management of national and global health risks
3.D.1 international Health regulations (iHr) capacity and health emergency preparedness

52 | FINANCING GLOBAL HEALTH 2019
and toward increased government spending and prepaid private spending as they experience economic growth. Indeed, Figure 5 shows that out-of-pocket spending and DAH are concentrated in low-income and lower-middle-income countries. Notably, as countries grow, they can also experience the “missing middle,” in which they have outgrown DAH eligi-bility but do not yet have a strong health financing system to organize pooled and prepaid funding through government or private insurance schemes, so citizens are forced to turn to out-of-pocket spending to make up the difference. That can lead to a reluctance to seek care, affect broader health-related economic progress, and lead to catastrophic health spending, such that a household falls into poverty in order to afford medical treat-ments. The “missing middle” is a major concern for middle-income countries, where out-of-pocket health spending (as a fraction of total spending) is greatest, as it can exacerbate inequitable health outcomes and broader socioeconomic inequality.
Despite the broad pattern shown in Figure 5, variations exist among income groups. For example, in the low-income group, 0.7% (0.5–0.9) of North Korea’s health spending is from DAH, while 70.5% (65.6–74.9) of Mozambique’s comes from DAH. Examining government health spending, meanwhile, shows that it makes up 28.3% (20.4–36.9) of Tajikistan’s total health spending, while Ethiopia’s government spending is 22.6% (19.0–25.9) of total health spending, despite Ethiopia having a higher GDP than Tajikistan. In 2017, Ethiopia’s GDP was $79.3 billion (70.7–90.5) while Tajikistan’s GDP was $7.4 billion (7.3–7.5). Similarly, in lower-middle- income and upper-middle-income groups, there are countries that
Figure 5 The share of health spending by source and gDP per person, 2017M
odel
ed p
ropo
rtion
of t
otal
hea
lth sp
endi
ng
gDP per person (2019 uS dollars)
130 500 2,500 10,000 50,000 112,0000.0
0.2
0.4
0.6
0.8
1.0
Development assistance for health
out-of-pocket health spending
Prepaid private health spending
government health spending

INTrODuCTION | 53
transition and rely more on pooled and prepaid health spending. For example, Bolivia and Botswana are two countries with relatively high health spending from the government, despite their levels of economic develop-ment. Moving forward, it is critical to understand the social and political processes that facilitate the creation of robust and equitable health financing systems. Countries such as Bolivia and Botswana are evidence that the missing middle is not a curse that all middle-income countries must endure.
Figure 6 shows how countries in GBD super-regions (in the top part of the figure, individual countries are assigned color-coded arrows) move toward, or away, from full universal health coverage (UHC) as health spending per person increases or decreases. In Figure 6, UHC is measured by the uni-versal health service coverage index, a composite measure of related indicators used to track health coverage using a single number, on a scale of 0 to 100.5 Moving up the 100-point scale, the UHC index is associated with improved health outcomes and improved effective coverage of key global health initiatives. As the figure shows, broadly, the higher per person health spending is in a country, the higher the universal health service coverage index score.
In late 2019, Tedros Adhanom Ghebreyesus, Director-General of WHO, and Shinzo Abe, Prime Minister of Japan, reasserted the importance of universal health coverage – “We believe that health care is a human right for all people, not a privilege for those who can afford it. If that’s the case, we can’t accept a world in which people are impoverished by exercising that right. That’s why we are both committed to UHC, so that all people can access the health services they need without financial hardship,” they noted.6 UHC (SDG 3.8) might therefore be seen as a foundational aspect of SDG 3, because its tenets – achieving universal health coverage, financial risk protection, access to quality services, and access to quality medicines and vaccines – are applicable to the rest of SDG 3’s targets.
Figure 6’s four histograms add context to the main figure by showing country groupings by the distribution of health spending (black), 2015–2017 spending (red), population distribution (purple), and the distribution of DALYs to countries (blue).
Tracking government health spending and prepaid private health spending as percentages of overall health spending may provide insight on where countries are on the path to financial risk protection. UHC service provision may be advanced through a mix of government, prepaid private, and donor spending, with the countries being least dependent on the latter (see again Figure 5). While UHC service provision is a key part of achieving UHC, it is not the only part. Patients achieving high-quality care at the expense of household welfare or being pushed into poverty is at odds with the concept of UHC. Financial risk protection, through government and prepaid health financing, may increase universal health service coverage and reduce the chances of medical impoverishment. Figure 7 illustrates the degree to which government and prepaid health spending contribute to overall spending in countries around the globe. The less likely people are to be impoverished by care, the more likely they are to take advantage of care.7, 8, 9
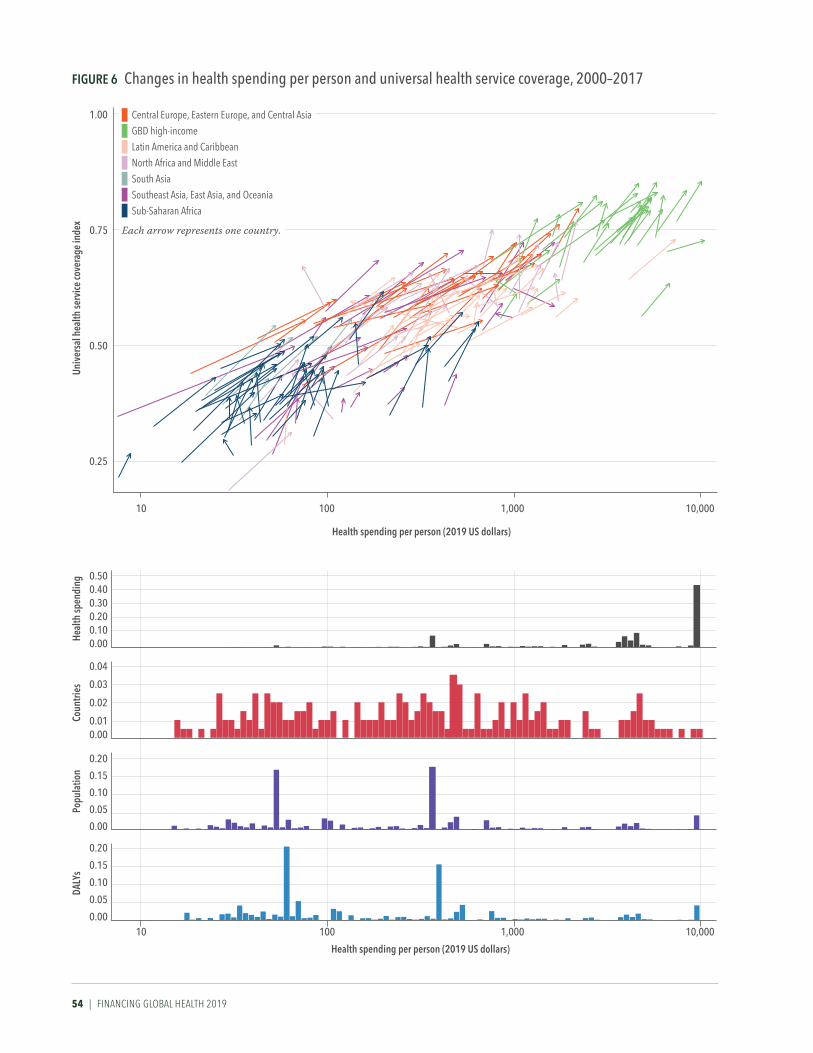
54 | FINANCING GLOBAL HEALTH 2019
Figure 6 Changes in health spending per person and universal health service coverage, 2000–2017
0.25
0.50
1.00
0.75
10 10,0001,000100
univ
ersa
l hea
lth se
rvice
cove
rage
inde
x
0.000.100.200.30
0.500.40
0.000.01
0.02
0.04
0.03
0.00
0.05
0.10
0.20
0.15
0.00
0.05
0.10
0.20
0.15
10 10,0001,000100
Heal
th sp
endi
ngCo
untri
esPo
pula
tion
DALY
s
Central Europe, Eastern Europe, and Central Asia GBD high-incomeLatin America and Caribbean
North Africa and Middle EastSouth Asia
Southeast Asia, East Asia, and Oceania
Sub-Saharan Africa
Each arrow represents one country.
Health spending per person (2019 uS dollars)
Health spending per person (2019 uS dollars)

INTrODuCTION | 55
Figure 7 government and prepaid private health spending as a share of total health spending, 2017
In sum, as economies continue to develop, the global community should keep an eye on how funding is directed to emerging health systems, especially in countries making the transition away from DAH to government and prepaid private spending-based models. Achieving UHC, and meeting SDG 3 targets, could be difficult in countries where the “missing middle” persists. Developing a robust health financing system to ensure that enough resources are available for health, and that those resources are pooled and prepaid such that all have access to high-quality care without excessive health spending is key.


OvErvIEW | 57
PART ONE
Overview
Total health spendingGlobally, health spending reached $7.9 trillion (7.8–8.0) in 2017, the most recent year for which data were available. Table 1 shows spending split by World Bank income group and by Global Burden of Disease (GBD) super- region. Most health spending occurred in high-income countries, with health spending per person reaching $5,307.5 (5,261.6–5,350.9) in 2017, far more than spending per person in low-income countries ($37.5 [35.8–39.3]). Indeed, there is an almost 150-fold difference between the two. Moreover, there is also a 10-fold difference between high-income and upper-middle- income country health spending per person, highlighting the disparity in per person spending between high-income countries and the rest of the world. Per person health spending in 2017 ranged from $6.19 (5.36–7.29) in Somalia to $10,242 (10,086.84–10,390.10) in the United States.
Additionally, Table 1 shows that health spending per GDP was second- highest in upper-middle-income countries, after high-income, at 5.7% (5.3–6.1) versus 12.2% (12.1–12.3). Notably, in low-income countries, where health spending per person was lowest globally, health spending per GDP was 5.3% (5.0–5.7) in 2017, only an estimated 0.4% less than spending per GDP in upper-middle-income countries. While low-income countries’ per person health spending reflects those countries’ lower GDPs, the percentage spent per GDP also reflects the importance of key health services regardless of income level and provision of DAH.
Other highlights include that the percentage of out-of-pocket spending per total health spending is highest in lower-middle-income countries, at 55.0% (50.6–59.9); high-income countries spent the highest percentage of total health spending on prepaid private spending, at 23.2% (22.8–23.6); and DAH as a percentage of total health spending was highest in low-income countries, at 27.7% (26.4–29.0).
Figure 8, meanwhile, shows at a high level how health spending moved from financing source to income group and GBD super-region between 2015 and 2017 (from middle to left and right, respectively). Details of income group and GBD super-region classifications can be found elsewhere.10 Government health spending – totaling $14.1 trillion (13.9–14.2), or 60.8% (60.5–61.2) – was the largest source of global health spending between 2015 and 2017. Out-of-pocket health spending accounted for 18.4% (18.1–18.8) and prepaid private health spending 20.5% (20.3–20.8) during this period.
Though DAH (excluding DAH spent on administering programs and global initiatives) was a small fraction of global health spending at $52.0 billion between 2015 and 2017, it accounted for 27.5% of spending in low- income countries between 2015 and 2017. According to GBD 2017 estimates, 9.2% of the world’s population lives in a low-income country, while 15.8% lives in a high-income country. Between 2015 and 2017, spending on health

58 | FINANCING GLOBAL HEALTH 2019
Health spending per person (uS dollars)
Health spending per person
(purchasing power parity)
Health spending per gross domestic
product
government health spending per total
health spending
out-of-pocket spending per total
health spending
Prepaid private spending per total
health spending
Development assistance for health per total health spending*
Annualized rate of change in health
spending, 1995–2017
Annualized rate of change in health
spending per person, 1995–2017
gLoBAL
Total 1,048 (1,034 to 1,062) 1,418 (1,393 to 1,445) 9.7% (9.6 to 9.8) 60.7% (60.2 to 61.2) 18.5% (18.0 to 19.1) 20.6% (20.2 to 21.0) 0.50% 3.93% (3.84 to 4.02) 1.27% (1.20 to 1.34)
WorLD BANK iNCoMe grouP
High-income 5,307 (5,262 to 5,351) 5,825 (5,777 to 5,872) 12.2% (12.1 to 12.3) 62.8% (62.4 to 63.3) 14.0% (13.8 to 14.3) 23.2% (22.8 to 23.6) 0.00% 3.56% (3.48 to 3.63) 1.88% (1.79 to 1.95)
Upper-middle-income 487 (457 to 520) 1,053 (995 to 1,118) 5.7% (5.3 to 6.1) 56.5% (54.3 to 58.6) 32.9% (30.2 to 35.6) 10.4% (9.1 to 12.3) 0.20% 5.94% (5.57 to 6.31) 1.89% (1.76 to 2.01)
Lower-middle-income 84 (76 to 93) 289 (261 to 322) 3.9% (3.5 to 4.3) 32.7% (29.7 to 35.3) 55.0% (50.6 to 59.9) 8.9% (6.8 to 11.5) 3.50% 5.59% (4.96 to 6.23) 0.78% (0.58 to 0.98)
Low-income 37 (36 to 39) 119 (113 to 126) 5.3% (5.0 to 5.7) 25.0% (23.5 to 26.7) 41.4% (38.9 to 43.8) 5.9% (4.7 to 7.6) 33.40% 4.04% (3.71 to 4.38) -0.97% (-1.24 to -0.71)
gBD SuPer-regioN
Central Europe, Eastern Europe, and Central Asia 538 (518 to 560) 1,332 (1,276 to 1,390) 5.9% (5.7 to 6.2) 62.2% (60.6 to 63.6) 33.8% (32.0 to 35.7) 3.8% (3.2 to 4.4) 0.30% 3.48% (3.17 to 3.77) 4.39% (4.24 to 4.53)
Global Burden of Disease high-income 5,760 (5,707 to 5,808) 6,175 (6,121 to 6,225) 12.6% (12.5 to 12.8) 62.7% (62.2 to 63.2) 13.8% (13.5 to 14.0) 23.6% (23.1 to 24.0) 0.00% 3.51% (3.44 to 3.59) 1.94% (1.86 to 2.00)
Latin America and Caribbean 589 (570 to 611) 1,189 (1,150 to 1,234) 7.4% (7.1 to 7.7) 50.1% (47.4 to 52.7) 30.2% (28.4 to 32.0) 19.5% (16.9 to 22.1) 0.30% 3.44% (3.14 to 3.76) 1.01% (0.60 to 1.35)
North Africa and Middle East 353 (339 to 367) 1,055 (1,012 to 1,104) 5.3% (5.1 to 5.5) 59.4% (58.1 to 60.6) 31.3% (29.5 to 33.1) 8.7% (7.9 to 9.6) 0.80% 5.60% (5.31 to 5.87) -0.95% (-1.13 to -0.77)
South Asia 62 (51 to 77) 236 (192 to 291) 3.4% (2.8 to 4.2) 26.2% (20.6 to 31.4) 62.9% (53.1 to 72.3) 9.1% (5.2 to 14.5) 2.00% 6.02% (4.57 to 7.46) 1.81% (1.13 to 2.52)
Southeast Asia, East Asia, and Oceania 365 (329 to 406) 757 (686 to 839) 4.9% (4.4 to 5.5) 57.0% (53.7 to 60.4) 35.5% (31.0 to 40.0) 7.2% (4.9 to 10.5) 0.30% 9.33% (8.57 to 10.14) 1.87% (1.55 to 2.19)
Sub-Saharan Africa 81 (75 to 87) 204 (190 to 218) 5.2% (4.8 to 5.6) 35.9% (33.9 to 37.6) 32.2% (29.0 to 35.8) 18.1% (16.1 to 20.0) 16.20% 4.33% (3.89 to 4.78) -0.93% (-1.16 to -0.71)
*Uncertainty invervals not produced for development assistance for health
TABLe 1 Total health spending and health spending by source, 2017

OvErvIEW | 59
Health spending per person (uS dollars)
Health spending per person
(purchasing power parity)
Health spending per gross domestic
product
government health spending per total
health spending
out-of-pocket spending per total
health spending
Prepaid private spending per total
health spending
Development assistance for health per total health spending*
Annualized rate of change in health
spending, 1995–2017
Annualized rate of change in health
spending per person, 1995–2017
gLoBAL
Total 1,048 (1,034 to 1,062) 1,418 (1,393 to 1,445) 9.7% (9.6 to 9.8) 60.7% (60.2 to 61.2) 18.5% (18.0 to 19.1) 20.6% (20.2 to 21.0) 0.50% 3.93% (3.84 to 4.02) 1.27% (1.20 to 1.34)
WorLD BANK iNCoMe grouP
High-income 5,307 (5,262 to 5,351) 5,825 (5,777 to 5,872) 12.2% (12.1 to 12.3) 62.8% (62.4 to 63.3) 14.0% (13.8 to 14.3) 23.2% (22.8 to 23.6) 0.00% 3.56% (3.48 to 3.63) 1.88% (1.79 to 1.95)
Upper-middle-income 487 (457 to 520) 1,053 (995 to 1,118) 5.7% (5.3 to 6.1) 56.5% (54.3 to 58.6) 32.9% (30.2 to 35.6) 10.4% (9.1 to 12.3) 0.20% 5.94% (5.57 to 6.31) 1.89% (1.76 to 2.01)
Lower-middle-income 84 (76 to 93) 289 (261 to 322) 3.9% (3.5 to 4.3) 32.7% (29.7 to 35.3) 55.0% (50.6 to 59.9) 8.9% (6.8 to 11.5) 3.50% 5.59% (4.96 to 6.23) 0.78% (0.58 to 0.98)
Low-income 37 (36 to 39) 119 (113 to 126) 5.3% (5.0 to 5.7) 25.0% (23.5 to 26.7) 41.4% (38.9 to 43.8) 5.9% (4.7 to 7.6) 33.40% 4.04% (3.71 to 4.38) -0.97% (-1.24 to -0.71)
gBD SuPer-regioN
Central Europe, Eastern Europe, and Central Asia 538 (518 to 560) 1,332 (1,276 to 1,390) 5.9% (5.7 to 6.2) 62.2% (60.6 to 63.6) 33.8% (32.0 to 35.7) 3.8% (3.2 to 4.4) 0.30% 3.48% (3.17 to 3.77) 4.39% (4.24 to 4.53)
Global Burden of Disease high-income 5,760 (5,707 to 5,808) 6,175 (6,121 to 6,225) 12.6% (12.5 to 12.8) 62.7% (62.2 to 63.2) 13.8% (13.5 to 14.0) 23.6% (23.1 to 24.0) 0.00% 3.51% (3.44 to 3.59) 1.94% (1.86 to 2.00)
Latin America and Caribbean 589 (570 to 611) 1,189 (1,150 to 1,234) 7.4% (7.1 to 7.7) 50.1% (47.4 to 52.7) 30.2% (28.4 to 32.0) 19.5% (16.9 to 22.1) 0.30% 3.44% (3.14 to 3.76) 1.01% (0.60 to 1.35)
North Africa and Middle East 353 (339 to 367) 1,055 (1,012 to 1,104) 5.3% (5.1 to 5.5) 59.4% (58.1 to 60.6) 31.3% (29.5 to 33.1) 8.7% (7.9 to 9.6) 0.80% 5.60% (5.31 to 5.87) -0.95% (-1.13 to -0.77)
South Asia 62 (51 to 77) 236 (192 to 291) 3.4% (2.8 to 4.2) 26.2% (20.6 to 31.4) 62.9% (53.1 to 72.3) 9.1% (5.2 to 14.5) 2.00% 6.02% (4.57 to 7.46) 1.81% (1.13 to 2.52)
Southeast Asia, East Asia, and Oceania 365 (329 to 406) 757 (686 to 839) 4.9% (4.4 to 5.5) 57.0% (53.7 to 60.4) 35.5% (31.0 to 40.0) 7.2% (4.9 to 10.5) 0.30% 9.33% (8.57 to 10.14) 1.87% (1.55 to 2.19)
Sub-Saharan Africa 81 (75 to 87) 204 (190 to 218) 5.2% (4.8 to 5.6) 35.9% (33.9 to 37.6) 32.2% (29.0 to 35.8) 18.1% (16.1 to 20.0) 16.20% 4.33% (3.89 to 4.78) -0.93% (-1.16 to -0.71)

60 | FINANCING GLOBAL HEALTH 2019
Figure 8 Flows of health spending from financing source to World Bank income groups and GBD super- regions, 2015–2017
World Bank income group Financing source gBD super–regionDevelopment assistance for health $52.0b
Prepaid private health spending $4.7T
out–of–pocket health spending $4.3T
government health spending $14.1T
Central europe, eastern europe, Central asia $654.6B
North africa andMiddle East $605.6B
Southeast asia, east asia, and oceania$2.2T
South asia $305.8B
Sub–Saharan africa $239.9B
gbD high-income$18.1T
latin america and Caribbean $1.0T
low-income $75.7B
upper-middle-income $3.7T
High-income $18.6T
lower-middle-income$716.1B
Values are reported in 2019 us dollars.
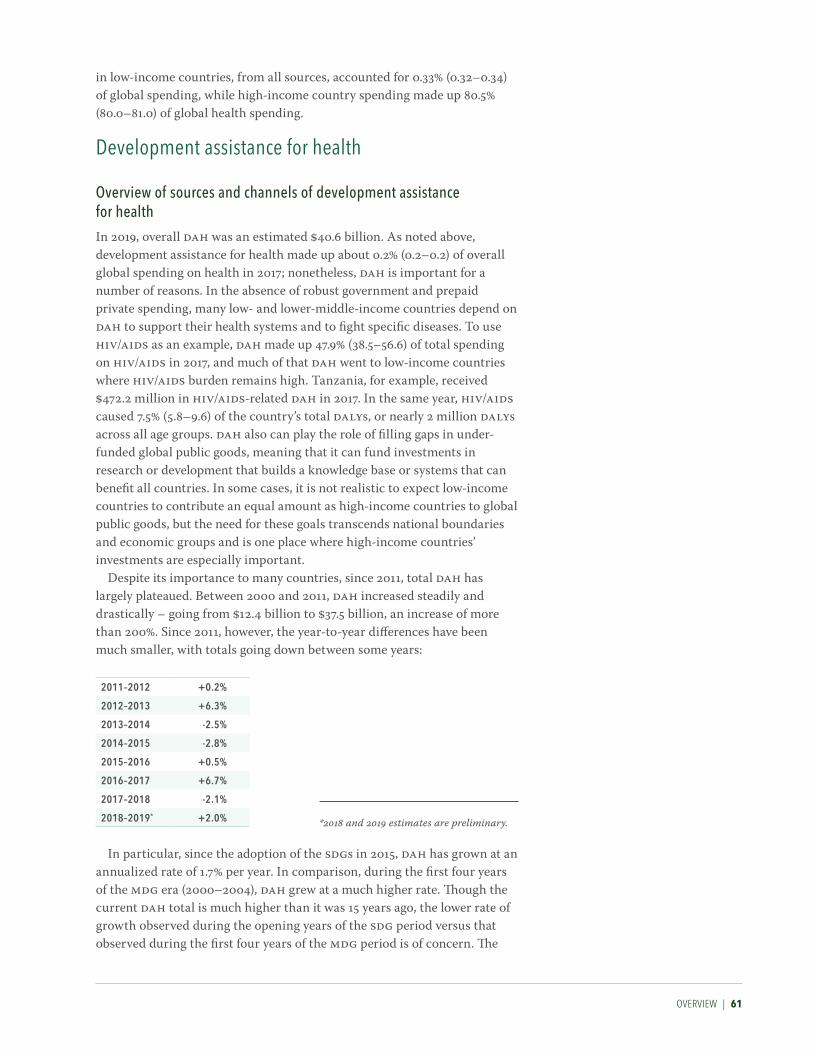
OvErvIEW | 61
in low-income countries, from all sources, accounted for 0.33% (0.32–0.34) of global spending, while high-income country spending made up 80.5% (80.0–81.0) of global health spending.
Development assistance for health
overview of sources and channels of development assistance for healthIn 2019, overall DAH was an estimated $40.6 billion. As noted above, development assistance for health made up about 0.2% (0.2–0.2) of overall global spending on health in 2017; nonetheless, DAH is important for a number of reasons. In the absence of robust government and prepaid private spending, many low- and lower-middle-income countries depend on DAH to support their health systems and to fight specific diseases. To use HIV/AIDS as an example, DAH made up 47.9% (38.5–56.6) of total spending on HIV/AIDS in 2017, and much of that DAH went to low-income countries where HIV/AIDS burden remains high. Tanzania, for example, received $472.2 million in HIV/AIDS-related DAH in 2017. In the same year, HIV/AIDS caused 7.5% (5.8–9.6) of the country’s total DALYs, or nearly 2 million DALYs across all age groups. DAH also can play the role of filling gaps in under-funded global public goods, meaning that it can fund investments in research or development that builds a knowledge base or systems that can benefit all countries. In some cases, it is not realistic to expect low-income countries to contribute an equal amount as high-income countries to global public goods, but the need for these goals transcends national boundaries and economic groups and is one place where high-income countries’ investments are especially important.
Despite its importance to many countries, since 2011, total DAH has largely plateaued. Between 2000 and 2011, DAH increased steadily and drastically – going from $12.4 billion to $37.5 billion, an increase of more than 200%. Since 2011, however, the year-to-year differences have been much smaller, with totals going down between some years:
2011–2012 +0.2%
2012–2013 +6.3%
2013–2014 -2.5%
2014–2015 -2.8%
2015–2016 +0.5%
2016–2017 +6.7%
2017–2018 -2.1%
2018–2019* +2.0%
In particular, since the adoption of the SDGs in 2015, DAH has grown at an annualized rate of 1.7% per year. In comparison, during the first four years of the MDG era (2000–2004), DAH grew at a much higher rate. Though the current DAH total is much higher than it was 15 years ago, the lower rate of growth observed during the opening years of the SDG period versus that observed during the first four years of the MDG period is of concern. The
*2018 and 2019 estimates are preliminary.

62 | FINANCING GLOBAL HEALTH 2019
Figure 9 Development assistance for health sources, channels of assistance, implementing institutions
iMPLeMeNTiNg iNSTiTuTioNS
governmental programs
National ministries of health
National disease control programs
Non-governmental programs
National NGOs
Private sector contractors
Universities and research institutions
CHANNeLS oF ASSiSTANCe
Bilateral development assistance agencies
The European Commission
UN agencies: UNFPA, UNAIDS, UNICEF, Unitaid, PAHO, WHO
The World Bank and regional development banks
The Global Fund
Gavi, the Vaccine Alliance
Foundations
NGOs
Coalition for Epidemic Preparedness Innovations
European Economic Area
FuNDiNg SourCeS
National treasuries
Private philanthropies
Debt repayments to international financial institutions
modest growth seen during the SDG period (and since 2011) indicates a general flattening of DAH.
Figure 9 shows how DAH moves from funding sources (originating in national treasuries, private philanthropic sources, and debt repayments) to channels of assistance (such as bilateral development assistance agencies, foundations, and non-governmental organizations, to name a few) to implementing institutions (via national ministries of health and non-gov-ernmental programs like private sector contractors).
As shown in Figure 10, the leading providers of DAH are largely unchanged in 2019. “Other” categories aside – which represent indirect disbursements such as investment income and revenue adjustments – the top three sources of DAH in 2019 were the United States ($12.2 billion), the Bill & Melinda Gates Foundation ($3.9 billion), and the United Kingdom ($3.5 billion). Between 2018 and 2019, we also saw increases among the following sources: Germany (+$185.3 million), Japan (+$162.1 million), and Norway (+$88.6 million).
Figure 11 shows annualized rates of change for each DAH source between 2000 and 2019. Between 2000 and 2015 – the MDG era – nearly all (except debt repayments) source-specific DAH amounts increased; total DAH increased at an annualized rate of 7.8% per year. However, a close examina-tion of the SDG period to date – from 2015 to 2019 – tells a different story. While a number of DAH sources saw their annualized growth rates increase (such as Spain, with a 15.5% annualized rate of change between 2015 and 2019 and -3.1% between 2000 and 2015), other sources had negative growth

OvErvIEW | 63
Box 4 Development assistance for health terms defined
Sources: The origins of funding, such as government treasuries, private philanthropic foundations, or any private-party contributions.
Channels: The intermediaries in the flow of funds, channels include bilateral aid agencies, multilateral organizations, non-governmental organizations (NGOs), UN agencies, public-private partnerships, and private foundations.
Implementing institutions: DAH is ultimately directed to implementing institutions to provide health services and prevent and treat diseases in low- and middle-income countries. These institutions include governmental bodies, NGOs, and international organizations.
Health focus areas: The health focus areas assessed in this report are malaria; HIV/AIDS; tuberculosis; reproductive, maternal, newborn, and child health; non-communicable diseases; other infectious diseases; and health systems strengthening and sector-wide approaches (SWAps). “Other DAH” refers to resources that target issues outside these focus areas, and “unallocable” captures the resources that we do not have information to assign.
Program areas: Within health focus areas, program areas describe the nature of the activity for which funds are being used. For example, program areas related to tuberculosis include diagnosis, drug resistance, human resources, and treatment.
Figure 10 Development assistance for health by source of funding, 1990–2019
Billi
ons o
f 201
9 uS
dol
lars
0
2
4
6
8
10
12
14
16
18
20
22
24
26
28
30
32
34
36
38
1991
1992
1993
1994
1995
1996
1997
1998
1999
2000
2001
2002
2003
2004
2005
2006
2007
2008
2009
2010
2011
2012
2013
2014
2016
2015
1990
2017
40
2018
*
42
2019
*
Unallocable
Other
Debt repayments (IBRD)
Other private philanthropy
Corporate donationsGates Foundation
Other governments
ChinaAustralia
Canada
JapanNetherlands
Norway
SpainFrance
Germany
United Kingdom
United States
*2018 and 2019 estimates are preliminary. ibrd = International Bank for Reconstruction and Development
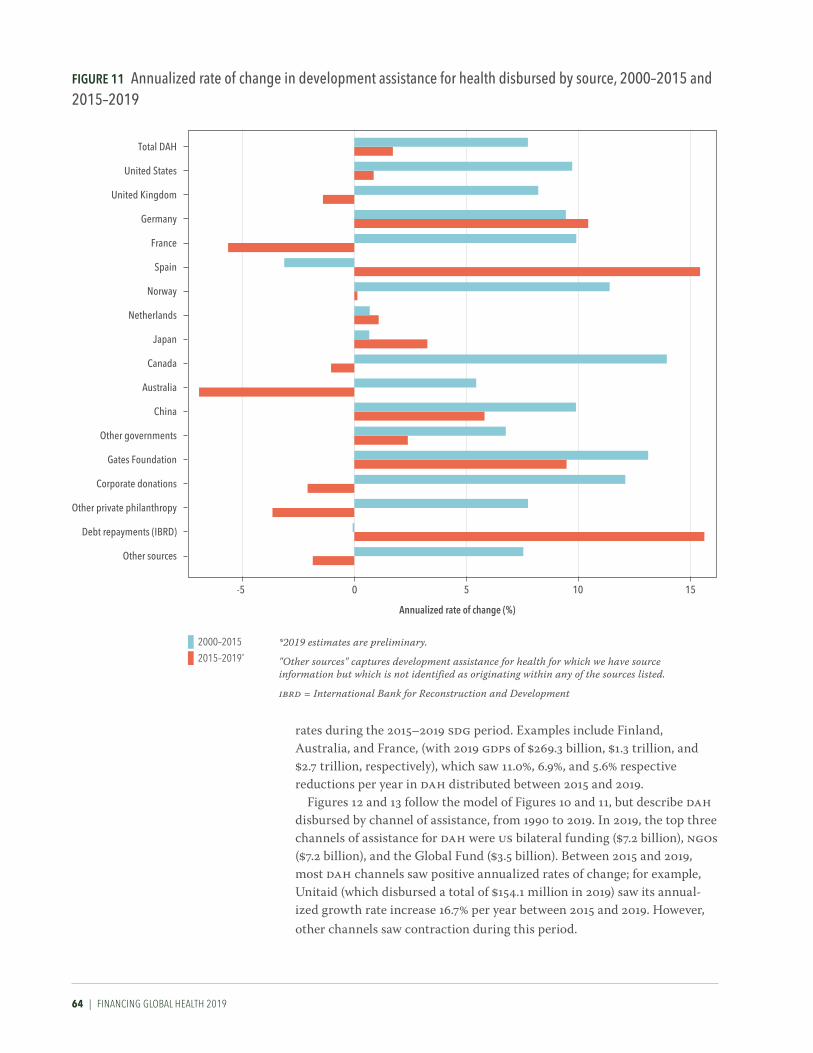
64 | FINANCING GLOBAL HEALTH 2019
rates during the 2015–2019 SDG period. Examples include Finland, Australia, and France, (with 2019 GDPs of $269.3 billion, $1.3 trillion, and $2.7 trillion, respectively), which saw 11.0%, 6.9%, and 5.6% respective reductions per year in DAH distributed between 2015 and 2019.
Figures 12 and 13 follow the model of Figures 10 and 11, but describe DAH disbursed by channel of assistance, from 1990 to 2019. In 2019, the top three channels of assistance for DAH were US bilateral funding ($7.2 billion), NGOs ($7.2 billion), and the Global Fund ($3.5 billion). Between 2015 and 2019, most DAH channels saw positive annualized rates of change; for example, Unitaid (which disbursed a total of $154.1 million in 2019) saw its annual-ized growth rate increase 16.7% per year between 2015 and 2019. However, other channels saw contraction during this period.
Figure 11 Annualized rate of change in development assistance for health disbursed by source, 2000–2015 and 2015–2019
Annualized rate of change (%)
-5 0 10 15
other sources
Debt repayments (ibrD)
other private philanthropy
Corporate donations
gates Foundation
other governments
China
australia
Canada
Japan
Netherlands
Norway
Spain
France
germany
united Kingdom
united States
Total DaH
5
2000–2015
2015–2019*
*2019 estimates are preliminary.
"Other sources" captures development assistance for health for which we have source information but which is not identified as originating within any of the sources listed.
ibrd = International Bank for Reconstruction and Development

OvErvIEW | 65
Billi
ons o
f 201
9 uS
dol
lars
0
2
4
6
8
10
12
14
16
18
20
22
24
26
28
30
32
34
36
3819
91
1992
1993
1994
1995
1996
1997
1998
1999
2000
2001
2002
2003
2004
2005
2006
2007
2008
2009
2010
2011
2012
2013
2014
2016
2015
1990
2017
40
2018
*
42
2019
*
Regional development banks
World Bank
US foundations
NGOs
Gates Foundation
CEPI
Global FundGavi
WHO
UNICEF, UNFPA, UNAIDS, Unitaid, PAHOOther bilateral development agencies
China bilateral
Australia bilateralCanada bilateral
France bilateral
Germany bilateral
UK bilateral
US bilateral
*2018 and 2019 estimates are preliminary
cepi = Coalition for Epidemic Preparedness Innovationsngos = Non-governmental organizationspaho = Pan American Health Organizationunaids = Joint United Nations Programme on hiv/aids
Regional development banks include the African Development Bank, the Asian Development Bank, and the Inter-American Development Bank.
unfpa = United Nations Population Fundunicef = United Nations Children’s Fundwho = World Health Organization
Figure 12 Development assistance for health by channel of assistance, 1990–2019

66 | FINANCING GLOBAL HEALTH 2019
Figure 13 annualized rate of change in development assistance for health disbursed by channel, 2000–2015 and 2015–2019
Annualized rate of change (%)
-10 0 10 15
regional development banks
World bank
uS foundations
Ngos
gates Foundation
global Fund
gavi
WHo
uNiCeF, uNFPa, uNaiDS, unitaid, PaHo
other bilateral development agencies
China bilateral
australia bilateral
Canada bilateral
France bilateral
germany bilateral
uK bilateral
uS bilateral
Total DaH
5-5
2000–2015
2015–2019*
*2019 estimates are preliminary
ngos = Non-governmental organizationspaho = Pan American Health Organizationunaids = Joint United Nations Programme on hiv/aidsunfpa = United Nations Population Fundunicef = United Nations Children’s Fundwho = World Health Organization
Gavi and the Global Fund began disbursing DAH during the first period. The 2000-2010 growth rates were excluded because annualized growth was so large during their initial years of disbursement.Regional development banks include the African Development Bank, the Asian Development Bank, and the Inter-American Development Bank.

OvErvIEW | 67
Health systems strengthening, sector-wide approaches, and pandemic preparednessThe term health systems strengthening (HSS) refers to funding intended to improve access, quality, or efficiency of health care, and can emphasize specific health focus areas or programs, like tuberculosis. Funds for sector- wide approaches (SWAps), meanwhile, are pooled for broad, national goals, and are intended to be allocated as the health ministry sees fit.
Figure 14 shows DAH for HSS/SWAps by channel of assistance from 1990 to 2019. Funding allocated to HSS/SWAps was $11.8 billion in 2019, down 0.8% from 2018, and accounted for 29.1% of total 2019 DAH. The top three channels of DAH for HSS, inclusive of spending on HSS for specific health conditions like HIV/AIDS or malaria, in 2019 were WHO, the World Bank, and NGOs. WHO channeled $1.0 billion or 8.5% of DAH for HSS/SWAps (a slight decrease of 0.2%); the World Bank channeled $877.8 million, down 13.2% from the previous year; and NGOs channeled $2.8 billion, up 0.3% from 2018, and 24.1% of DAH for HSS/SWAps.
6
0
2
4
1991
1992
1993
1994
1995
1996
1997
1998
1999
2000
2001
2002
2003
2004
2005
2006
2007
2008
2009
2010
2011
2012
2013
2014
2016
2015
1990
2017
2018
*
2019
*
Billi
ons o
f 201
9 uS
dol
lars
*2018 and 2019 estimates are preliminary
cepi = Coalition for Epidemic Preparedness Innovationsngos = Non-governmental organizationspaho = Pan American Health Organizationunaids = Joint United Nations Programme on hiv/aids
Regional development banks include the African Development Bank, the Asian Development Bank, and the Inter-American Development Bank.
unfpa = United Nations Population Fundunicef = United Nations Children’s Fundwho = World Health Organization
Regional development banks
World Bank
US foundations
NGOsGates Foundation
CEPI
Global FundGavi
WHO
UNICEF, UNFPA, UNAIDS, Unitaid, PAHOOther bilateral development agencies
China bilateral
Australia bilateralCanada bilateral
France bilateral
Germany bilateral
UK bilateral
US bilateral
Figure 14 Development assistance for health systems strengthening and sector-wide approaches by channel of assistance, 1990–2019

68 | FINANCING GLOBAL HEALTH 2019
Funding for SWAps and health systems strengthening – not aimed at a specific health focus area, but instead intended to strengthen the health system as a whole – totaled $5.6 billion in 2019. This represents 13.8% of total DAH in 2019. This number comprises $373.8 million for pandemic preparedness, $1.9 billion for human resources, and $3.3 billion in other spending.
While in principle, DAH for health systems strengthening is intended by many to be quite broad in focus, many development assistance projects aim to build health systems for specific health focus areas. Between 1990 and 2019, as shown in Figure 15, a significant portion of HSS resources were allocated to build systems focused on the prevention and treatment of HIV/AIDS, as well as newborn and child health-related HSS. Per Figure 15, in 2019, DAH for HSS by health focus areas breaks down as follows:
• $5.6 billion, or 13.8%, for HSS/SWAps;• $2.9 billion, or 7.2%, for reproductive, maternal, newborn,
and child health HSS;• $1.7 billion, or 4.1% of DAH, for HIV/AIDS HSS;• $596.8 million, or 1.5%, for malaria HSS;• $381.0 million, or 0.9%, for tuberculosis HSS.
15
0
5
10
1991
1992
1993
1994
1995
1996
1997
1998
1999
2000
2001
2002
2003
2004
2005
2006
2007
2008
2009
2010
2011
2012
2013
2014
2016
2015
1990
2017
2018
*
2019
*
Billi
ons o
f 201
9 uS
dol
lars
*2018 and 2019 estimates are preliminary
HSS/SWAps
Other infectious diseases HSS
Non-communicable diseases HSSReproductive and maternal health HSS
Newborn and child health HSS
Malaria HSSTuberculosis HSS
HIV/AIDS HSS
hss = Health systems strengtheningswaps = Sector-wide approaches
Figure 15 Development assistance for health systems strengthening by health focus area, 1990–2019

OvErvIEW | 69
Our 2019 estimate of spending to support pandemic preparedness – $373.8 million – is notable in light of the COVID-19 pandemic; by the time Financing Global Health 2019 went to press in July 2020, there were more than 9 million confirmed cases worldwide and over 470,000 deaths, with many more of each expected.1 In the US, according to estimates first published by IHME in March 2020 (and updated continually since then), COVID-19 is estimated to lead to more than 140,000 deaths by early August of 2020.11 COVID-19 – and the lockdowns put in place across the globe to control the pandemic – has also had a profound effect on the world economy. For example, the US economy lost roughly 22 million jobs in March and April, and the unemployment rate shot up to 14.7%, the worst US unemployment seen since the Great Depression.12
The 2019 estimate of funding for pandemic preparedness is slightly up versus 2018 and is the highest level of pandemic preparedness funding (in terms of total dollars) seen to date. Nonetheless, development assistance for health targeted at pandemic preparedness remains less than 1% of overall 2019 DAH.
Sources and channels of development assistance for health – further detailsFigure 16 shows how development assistance flowed from source to channel to health focus area between 1990 and 2019. The three largest sources were the United States ($210.4 billion, or 30.5% of DAH between 1990 and 2019), private philanthropy (other than the Bill & Melinda Gates Foundation) ($67.5 billion, or 9.8% of DAH between 1990 and 2019), and the United Kingdom ($50.6 billion, or 7.3% of DAH between 1990 and 2019).
Figures 17 and 18, meanwhile, show DAH trends by broad health focus area, then trends by health focus area and related program area, for 1990–2019 and 2000–2019, respectively. In Figure 17, we can see the sharp increase in spending on HIV/AIDS beginning in 2004, which culminated in a relative leveling trend starting in 2010. The amazing growth (and pla-teauing) of HIV/AIDS funding, as well as the gradual ascendancy of health financing for reproductive, maternal, newborn, and child health (32.8% of 2019 DAH), is also shown.
Since the start of the SDG era in 2015, many of the health focus areas shown in Figure 17 have experienced increases and dips in DAH. For example, in 2015, tuberculosis DAH was $1.3 billion; in 2016, it was $1.5 billion; in 2017, $1.7 billion; in 2018, $1.6 billion, and in 2019, $1.7 billion. Broadly, there has been a flattening trend across health focus areas since the kickoff of the SDGs.
Meanwhile, the program area estimates in Figure 18 highlight specific activities related to each health focus area (such as HIV/AIDS treatment and tobacco-specific non-communicable disease funding), and the fraction of DAH attributed to each health-specific program between 2000 and 2019.
Figure 19 shows the annualized rate of change in DAH disbursed by health focus area for the years 2000–2015 (the MDG era) and 2015–2019 (the beginning of the SDG era). In both time periods, DAH increased almost universally across health focus areas tracked in this report – the exception being other infectious diseases between 2015 and 2019, which saw a nearly

70 | FINANCING GLOBAL HEALTH 2019
Figure 16 Flows of development assistance for health from source to channel to health focus area, 1990–2019
*Other than the Gates Foundation and corporate donations.
2018 and 2019 estimates are preliminary.Values are reported in 2019 us dollars.
“Other health focus areas” captures development assistance for health for which we have health focus area information but which is not identified as being allocated to any of the health focus areas listed. Health assistance for which we have no health focus area information is designated as “Unallocable.” “Other sources” captures development assistance for health for which we have source information but which is not identified as originating within any of the sources listed.
cepi = Coalition for Epidemic Preparedness Innovationshss/swaps = Health systems strengthening and sector-wide approachesngos = Non-governmental organizations
Source Channel Health focus area
Development banks $72.7b
Ngos & foundations $163.7b
gates Foundation $25.3b
global Fund $49.3b
gavi $18.0bCePi $184.8M
uN agencies $118.0b
other bilateral aid agencies $52.1b
european Commission $11.5bChina $8.8b
Australia $5.7bCanada $5.2bFrance $9.4b
germany $12.3b
united Kingdom $20.8b
united States $116.8b
gates Foundation $39.6B
other privatephilanthropy*
$67.5B
other sources $82.0B
othergovernments
$140.5B
China $9.6Baustralia $10.1B
Canada $17.1B
France $22.1B
germany $27.0B
united Kingdom $50.6B
united States $210.4B
HiV/aiDS $164.4B
Malaria $31.6B
Tuberculosis $21.6B
reproductive and maternal health $90.1B
Newborn and child health $112.7B
other infectiousdiseases $35.2B
Non-communicable diseases $10.6B
HSS/SWaps $110.6B
other health focus areas$104.5B
unallocable $8.4B
Corporate donations$13.3B

OvErvIEW | 71
Figure 17 Development assistance for health by health focus area, 1990–2019Bi
llion
s of 2
019
uS d
olla
rs
0
2
4
6
8
10
12
14
16
18
20
22
24
26
28
30
32
34
36
3819
91
1992
1993
1994
1995
1996
1997
1998
1999
2000
2001
2002
2003
2004
2005
2006
2007
2008
2009
2010
2011
2012
2013
2014
2016
2015
1990
2017
40
2018
*
42
2019
*
UnallocableOther health focus areas
HSS/SWApsOther infectious diseases
Non-communicable diseasesReproductive and maternal health
Newborn and child health
MalariaTuberculosis
HIV/AIDS
*2018 and 2019 estimates are preliminary
“Other health focus areas” captures development assistance for health for which we have health focus area information but which is not identified as being allocated to any of the health focus areas listed. Health assistance for which we have no health focus area information is designated as “Unallocable.”
hss/swaps = Health systems strengthening and sector-wide approaches

72 | FINANCING GLOBAL HEALTH 2019
Figure 18 Development assistance for health by health focus area and program area, 2000–2019*
Other
Other health systems strengthening
Other
Care and support
Counseling and testing
Other health systems strengthening
Orphans and vulnerable children
PMTCT
Treatment
Prevention
Other
TreatmentOther health systems strengthening
Bed nets
Other control
Community outreach
Diagnosis
Child/newborn nutrition
Child/newborn otherVaccines
Maternal health
Family planning
Other health systems strengthening
Other health systemsstrengthening
Other
Other
Human resources
Other healthsystems
strengthening
Ebola
Tobacco
Human resources
Human resources
Vector control including indoor residual spraying
HSS/SWAps
Pandemic preparedness
Treatment
DiagnosisAntimicrobial resistance
Human resources
Human resources
Other maternal and reproductive health
Mental health
Other healthsystems
strengthening
Humanresources
Human resources
Human resources
Newborn and child healthMalaria
Unallocable
Other health focus areas
HSS/SWAps
Other infectious diseases
Non-communicable diseases
Tuberculosis
HIV/AIDS
Reproductive and maternal health
*2018 and 2019 estimates are preliminary. Values are reported in billions of 2019 US dollars.
“Other health focus areas” captures development assistance for health for which we have health focus area information but which is not identified as being allocated to any of the health focus areas listed. Health assistance for which we have no health focus area information is designated as “Unallocable.” The program areas for which the share is too small to show are listed at lower left.hss/swaps = Health systems strengthening and sector-wide approachespmtct = Prevention of mother-to-child transmission
Zika (0.191 billion)Malaria: antimicrobial resistance (0.054 billion)
Other infectious diseases: antimicrobial resistance (0.043 billion)
HIV/AIDS: antimicrobial resistance (0.091 billion)

OvErvIEW | 73
-10% annualized rate of change. Across health focus areas tracked, the MDG era saw positive annualized
rates of change. For example, between 2000 and 2015, DAH for HIV/AIDS, tuberculosis, and malaria went up annually by 13.0%, 16.2%, and 18.3%, respectively. Total DAH saw an annualized rate of change of 7.8% during these years.
However, the period between 2015 and 2019 tells a different story. While almost all areas saw positive annualized rates of change – such as tubercu-losis (5.7%), HSS/SWAps (4.8%), and non-communicable diseases (4.2%) – in many cases they were less robust increases than those seen between 2000 and 2010. Indeed, the 5.7% annualized rate of change seen in DAH for tuberculosis for 2015–2019 is the highest annualized rate of change observed during that period. And several areas saw negligible annualized
Figure 19 annualized rate of change in development assistance for health disbursed, by health focus area, 2000–2015 and 2015–2019*
Annualized rate of change (%)-10 0 10 20 30
other health focus areas
Total DaH
HSS/SWaps
other infectious diseases
Non-communicable diseases
Newborn and child health
reproductive and maternal health
Malaria
Tuberculosis
HiV/aiDS
2000–2015
2015–2019
*2019 estimates are preliminary
"Other health focus areas" captures development assistance for health for which we have health focus area information but which is not identified as being allocated to any of the health focus areas listed.
hss/swaps = Health systems strengthening and sector-wide approaches

74 | FINANCING GLOBAL HEALTH 2019
rates of change: malaria DAH grew only 1.7% between 2015 and 2019, while newborn and child health saw a 0.7% annualized rate of change during the period. The annualized rate of change in DAH for other infectious diseases (-9.6%) between 2015 and 2019 is in stark contrast to the 9.4% rate of increase observed during the MDG period. This follows the overall pla-teauing of DAH seen over the last decade.
Shifts in how DAH has been allocated to specific health focus areas between 1990 and 2019 is shown in Figure 20. The sharp rise in HIV/AIDS development assistance for health – starting in 2002–2006 – and the leveling off in the years since can be seen. Additionally, a reduction in HSS/SWAps DAH has taken place over the past three decades in favor of more targeted funding. And though it remains a minor segment of total DAH (4.1% in 2019), tuberculosis funding has increased 5,815.0% since 1990. 2019 tuberculosis funding is an estimated $1.7 billion.
Since the start of the SDG period, there has been an overall plateauing of spending across all health service areas shown in Figure 20. While spending in many health focus areas increased between 2015 and 2019 (such as HIV/AIDS, tuberculosis, newborn and child health, and non-communicable diseases), since 2017, spending has either flattened or decreased across all health focus areas.
For additional details on selected sources and channels of DAH, see the profiles in Part Four of this report. Further estimates for sources and channels not included in the profiles can be found in the report’s Annex, as well as our data visualization at healthdata.org.

OvErvIEW | 75
Figure 20 The share of development assistance for health allocated by health focus area, 1990–2019
0% 10% 20% 30% 40% 50% 60% 70% 80% 90% 100%
1991
1992
1993
1994
1995
1996
1997
1998
1999
2000
2001
2002
2003
2004
2005
2006
2007
2008
2009
2010
2011
2012
2013
2014
2016
2015
1990
2017
2018*
2019*
HIV/AIDS
UnallocableOther health focus areasHSS/SWApsOther infectious diseasesNon-communicable diseasesReproductive and maternal healthNewborn and child healthMalariaTuberculosis
*2018 and 2019 estimates are preliminary
“Other health focus areas” captures development assistance for health for which we have health focus area information but which is not identified as being allocated to any of the health focus areas listed. Health assistance for which we have no health focus area information is designated as “Unallocable.”
hss/swaps = Health systems strengthening and sector-wide approaches
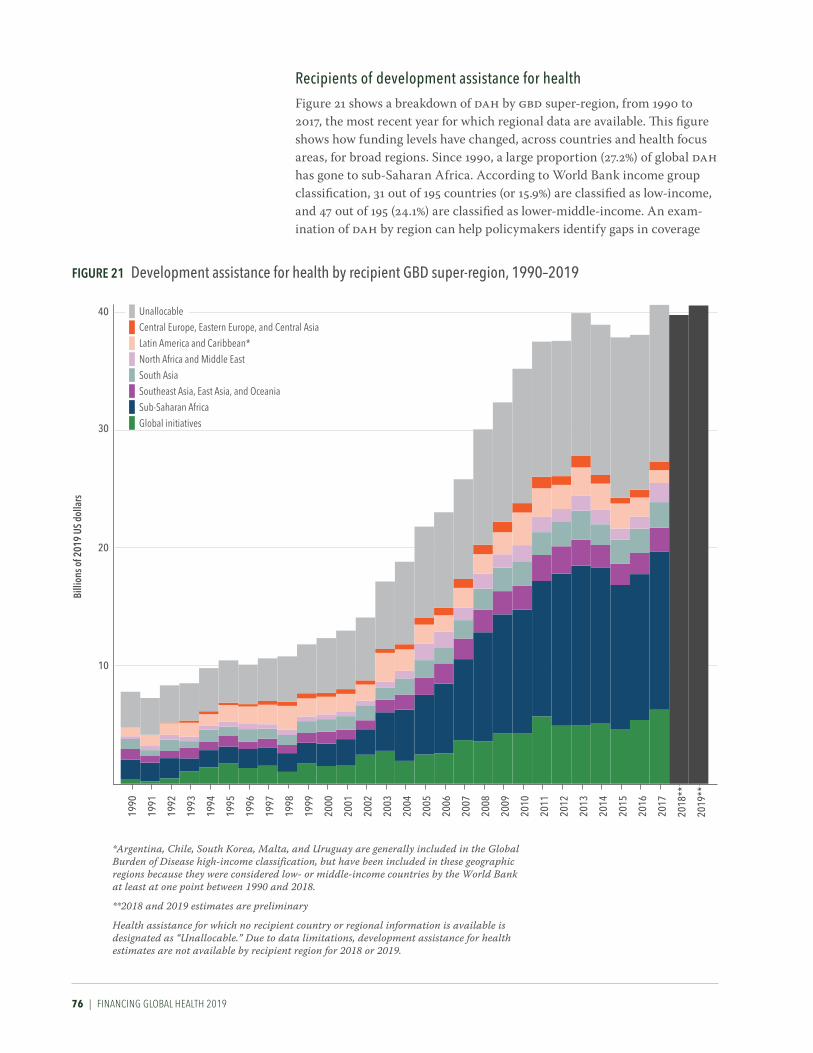
76 | FINANCING GLOBAL HEALTH 2019
recipients of development assistance for healthFigure 21 shows a breakdown of DAH by GBD super-region, from 1990 to 2017, the most recent year for which regional data are available. This figure shows how funding levels have changed, across countries and health focus areas, for broad regions. Since 1990, a large proportion (27.2%) of global DAH has gone to sub-Saharan Africa. According to World Bank income group classification, 31 out of 195 countries (or 15.9%) are classified as low-income, and 47 out of 195 (24.1%) are classified as lower-middle-income. An exam-ination of DAH by region can help policymakers identify gaps in coverage
Figure 21 Development assistance for health by recipient GBD super-region, 1990–2019
Billi
ons o
f 201
9 uS
dol
lars
10
20
30
1991
1992
1993
1994
1995
1996
1997
1998
1999
2000
2001
2002
2003
2004
2005
2006
2007
2008
2009
2010
2011
2012
2013
2014
2016
2015
1990
2017
2018
**
40
2019
**
Unallocable
Central Europe, Eastern Europe, and Central Asia
Latin America and Caribbean*North Africa and Middle East
South AsiaSoutheast Asia, East Asia, and Oceania
Sub-Saharan Africa
Global initiatives
*Argentina, Chile, South Korea, Malta, and Uruguay are generally included in the Global Burden of Disease high-income classification, but have been included in these geographic regions because they were considered low- or middle-income countries by the World Bank at least at one point between 1990 and 2018.
**2018 and 2019 estimates are preliminary
Health assistance for which no recipient country or regional information is available is designated as “Unallocable.” Due to data limitations, development assistance for health estimates are not available by recipient region for 2018 or 2019.

OvErvIEW | 77
and areas of opportunity as we move closer to the 2030 target for SDG completion. As countries work to achieve the health-related SDGs, DAH can be catalytic in moving countries away from donor-supported spending and toward self-funded government and prepaid private spending.
By Global Burden of Disease super-region, sub-Saharan Africa received the most DAH between 1990 and 2017. Sub-Saharan Africa’s DAH percentage has also grown since 1990: it was 20.9% of total DAH in 1990, and in 2017 stood at 33.0%. Further details by region are available below.
Sub-Saharan AfricaSub-Saharan Africa received $13.4 billion, or 33.0%, of global DAH in 2017. This represented an 8.2% increase from 2016. The US provided $6.9 billion or 51.9% of 2017 funding, and the Gates Foundation provided $601.8 million or 4.5%. Across health areas, $5.3 billion or 39.8% went to HIV/AIDS, and $3.4 billion or 25.4% went to reproductive, maternal, newborn, and child health. Nigeria, Kenya, and Tanzania were the countries receiving the most DAH in the region in 2017.
South AsiaSouth Asia received $2.2 billion or 5.3% of total DAH in 2017, up 5.4% from 2016. Of this, $904.1 million or 41.6% went to India, and $654.9 million or 30.2% was directed to Pakistan. Bangladesh, Bhutan, and Nepal were the recipients of $612.7 million, or 28.2%, collectively. The US and the UK were major sources of DAH to this region, providing $485.7 million and $301.0 million, respectively, in 2017. Across health areas, $1.2 billion or 56.7% of DAH to South Asia went to reproductive, maternal, newborn, and child health; $274.9 million or 12.7% went to health systems strengthening/SWAps; and $126.0 million or 5.8% went to HIV/AIDS.
Southeast Asia, East Asia, and OceaniaThis region, comprising China, small-island developing states, and the members of the Association of Southeast Asian Nations, received $2.0 billion or 5.0% of DAH in 2017, up 13.8% from 2016. The US provided $469.1 million or 23.0% of DAH to this region in 2017; Germany provided $248.0 million or 12.2%; and Japan provided $185.6 million or 9.1%. The Global Fund was a major channel of assistance to this region, providing $463.3 million or 22.7% of DAH in 2017; NGOs provided $119.6 million or 5.9%. Funding was directed primarily to HSS/SWAps ($497.9 million or 24.4%) and reproductive, maternal, newborn, and child health ($460.3 million or 22.6%). Of the total DAH to this region, China received 11.6% or $237.2 million in 2017.
North Africa and the Middle EastNorth Africa and the Middle East received $1.6 billion or 4.0% of DAH in 2017, up 60.2% from 2016. The UK, the US, and Germany were major sources of funding to the region, providing $237.9 million, $208.4 million, and $128.6 million, respectively. Across health focus areas, $503.4 million or 31.0% of DAH to the region was directed to HSS/SWAps, and $385.7 million or 23.8% went to reproductive, maternal, newborn, and child health.

78 | FINANCING GLOBAL HEALTH 2019
Latin America and the CaribbeanThe region of Latin America and the Caribbean received $1.1 billion or 2.7% of 2017 DAH, down 32.6% from 2016. The US and Canada were major sources, contributing $355.9 million and $43.9 million in DAH to the region, respectively. Across health areas, $314.4 million or 28.6% of 2017 DAH went to reproductive, maternal, newborn, and child health; $236.8 million or 21.6% went to HIV/AIDS; and $221.4 million or 20.2% went to HSS/SWAps.
Central Europe, Eastern Europe, and Central AsiaThis region received $724.8 million or 1.8% of DAH in 2017, up 9.9% from 2016. Major sources of funding were the US, Germany, and Japan, contrib-uting $135.1 million, $72.5 million, and $60.9 million in 2017, respectively. Across health areas, $226.4 million or 31.2% of funding was allocated to HSS/SWAps; $128.2 million or 17.7% to HIV/AIDS; and $116.9 million or 16.1% to tuberculosis.
Global InitiativesActivities that are not confined to a specific region but address research, development, preparedness, and/or health systems strengthening across boundaries are classified as “global initiatives.” DAH to this category totaled $6.3 billion in 2017, up 16.1% from 2016, and represented 15.5% of total DAH for the year. The US was the main source of funding, contributing $3.3 billion; other major sources included the Gates Foundation, contributing $1.4 billion, and the UK, contributing $473.0 million.
Figure 22 shows the top 20 countries by average DAH and their corre-sponding burden of disease, in terms of DALYs, for six health focus areas (and an “all diseases” category) between 2015 and 2017. DAH recipients are ranked from top to bottom, and the darker the box, the higher the burden of disease for that country/health focus area.
For additional DAH recipient country estimates, see Table B5 (Development assistance for health by recipient country, 1990–2017) in the Annex (page 170).

OvErvIEW | 79
burkina Faso
Nigeria117,672
Kenya17,857
Tanzania22,689
ethiopia37,828
india480,732
uganda16,629
Mozambique16,948
South africa24,023
Pakistan84,322
Congo, Dr44,300
Zambia7,920
Malawi8,275
bangladesh45,957
Zimbabwe6,980
Sierra leone4,821
Vietnam24,813
ghana12,014
liberia2,162
rwanda4,435
Haiti5,161
Kenya2,790
South africa7,349
Tanzania1,698
uganda1,779
Mozambique4,158
Nigeria9,230
ethiopia1,116
Zambia1,458
Malawi1,450
Zimbabwe975
india2,863
rwanda187
Côte d'ivoire1,068
Haiti219
Congo, Dr1,000
Namibia232
Swaziland155
Cameroon1,281
Vietnam623
botswana225
Nigeria11,620
Tanzania1,100
uganda1,708
Congo, Dr5,998
Mozambique1,306
ghana1,119
ethiopia201
Kenya291
Zambia340
Malawi463
Mali2,005
burkina Faso2,322
Myanmar192
india3,551
Sudan179
rwanda186
angola614
Zimbabwe55
Madagascar375
Côte d'ivoire1,112
argentina8,999
Sri lanka3,984
uganda5,077
india269,176
ukraine17,308
Morocco7,846
Yemen5,178
Tanzania8,363
Nicaragua884
brazil43,033
Congo, Dr13,537
ghana4,747
Palestine682
Jordan1,483
rwanda1,736
afghanistan6,949
Tunisia2,198
Moldova1,163
China307,002
Tonga21
Nigeria19,478
india49,540
Pakistan18,079
ethiopia7,724
bangladesh5,801
Congo, Dr6,167
Tanzania3,845
Kenya2,011
Mexico1,746
afghanistan2,683
Peru512
uganda2,796
Mozambique2,011
indonesia4,643
Malawi1,214
Nepal964
Mali3,086
South Sudan1,276
Zambia1,129
ghana1,809
Sierra leone58
liberia93
Nigeria1,406
guinea75
Kenya108
Côte d'ivoire106
Pakistan279
afghanistan163
ethiopia456
india2,777
brazil470
ghana76
Tanzania234
Congo, Dr1,067
uganda178
Senegal57
86
Vietnam259
Mali113
indonesia637
ethiopia480
Nigeria1,074
Kenya245
india2,475
Pakistan1,153
bangladesh290
Tanzania292
afghanistan236
Congo, Dr577
Malawi63
ghana73
Mali151
uganda128
Haiti57
South Sudan84
Zambia48
Nepal79
Senegal79
Mozambique134
rwanda44
india16,729
South africa2,403
Nigeria3,768
Pakistan1,946
Philippines1,113
bangladesh471
indonesia3,002
ethiopia1,771
Zambia912
Kenya1,122
Congo, Dr2,634
Myanmar581
ukraine160
Tanzania1,387
uganda1,317
Mozambique2,364
Malawi819
Vietnam645
Zimbabwe910
uzbekistan114
Figure 22 Top 20 countries by average development assistance for health received from 2015 to 2017, and their corresponding 2017 burden of disease
Sources: Financing Global Health Database 2019 and GBD 2017 study
Burden of disease is measured in number of disability-adjusted life years (DALYs). Colors represent 2017 DALYs for each health focus area within a country. Darker colors correspond to a higher number of DALYs. Values represent thousands of DALYs attributable to a country by disease.
Note that in Figure 22 the number of DALYs is shown, so population is a factor (as opposed to showing each country’s cause-specific DALYs as a percentage of that country’s overall DALYs). Hence why China (307,002 DALYs) and India (269,176 DALYs) have the highest burden of disease for non-communicable diseases, in terms of absolute numbers. The use of absolute numbers explains seeming incongruities in the figure. For example, though Nigeria received the most DAH for other infectious diseases in 2017 ($98.5 million), it actually had fewer DALYs from other infectious diseases than the far more populous India, which received the 10th-most DAH of other infectious diseases, at $23.3 million.
All diseases Malaria HIV/AIDSReproductive and maternal health
Newborn and child health Tuberculosis
Non- communicable
diseasesOther infectious
diseases
rank
ing
by d
evel
opm
ent a
ssis
tanc
e re
ceiv
ed b
y di
seas
e (2
015–
2017
ave
rage
)
1
2
3
4
5
6
7
8
9
10
11
12
13
14
15
16
17
18
19
20


DIsEAsE-spECIFIC spENDING | 81
PART TWO
Disease-specific spendingEstimates for total (domestic and donor) spending on three health condi-tions – HIV/AIDS, malaria, and tuberculosis – are presented in this section. Further details on the three health focus areas discussed here (in addition to several other health focus areas) can be found in Part Four of Financing Global Health 2019, the global health financing profiles (page 105).
Sustainable Development Goal 3.3 specifically addresses HIV/AIDS, malaria, and tuberculosis, aiming to end incidence of those diseases by 2030, in addition to combatting “neglected tropical diseases…hepatitis, water-borne diseases, and other communicable diseases.” Though official spending targets do not exist for SDG 3.3, unofficial stakeholder-driven financing goals – such as spending $26.2 billion per year by 2020 and $22.3 billion per year to reduce HIV incidence,13 and $6.6 billion per year by 2020 to reduce malaria incidence14 – can help guide priority-setting.
Notably, during the first four years of the MDG era (2000–2004) global HIV/AIDS, malaria, and tuberculosis spending had annualized growth rates of 18.6% (15.1–22.0), 11.8% (10.0–13.8), and 5.9% (2.2–9.5), respectively. In contrast, between 2015 and 2017, the opening two years of the SDG period, HIV/AIDS, malaria, and tuberculosis spending saw annualized growth rates of 6.4% (5.4–7.6), 2.8% (1.6–4.0), and 2.5% (-2.5 to 7.8). The difference in MDG versus SDG growth rates underscores the progress that remains to be made if SDG 3.3 targets are to be met by 2030.
Table B1, available in Annex 2, shows government health spending per person for all three diseases by World Bank income group, plus overall health spending per person, gross domestic product, and 2017 population for each income group.
Over the last two decades, HIV/AIDS, malaria, and tuberculosis spending has ebbed and flowed. Figure 23 shows how spending on these three conditions was split among government, DAH, out-of-pocket, and prepaid private spending between 2000 and 2017. For example, between 2000 and 2010, DAH as a percentage of overall HIV/AIDS spending grew while other forms of spending decreased. Since 2011, however, government spending has increased as a percentage of overall HIV/AIDS spending while DAH has fallen.
Figure 23’s second panel, on malaria spending since 2000, tells a different story. Where government health spending made up more than 50% of overall malaria spending in 2000, in 2017 it constituted just over a quarter of malaria spending. Since 2000, DAH spending on malaria has grown, while government, out-of-pocket, and to a lesser degree prepaid private spending as percentages of overall malaria spending have fallen.
The figure’s third panel, which depicts tuberculosis spending between 2000 and 2017, shows how the growth of government spending on DAH for tuberculosis has squeezed out-of-pocket spending as a percentage of the total, reducing it from 40.9% (35.4–48.2) of tuberculosis spending in 2000 to 18.7% (15.2–23.6) in 2017. Nonetheless, 2017 out-of-pocket tuberculosis

82 | FINANCING GLOBAL HEALTH 2019
spending makes up a higher percentage of overall spending on that disease than does out-of-pocket spending on HIV/AIDS and malaria. Prepaid private spending has also decreased since 2000, going from 4.3% (3.0–6.4) in 2000 to 2.1% (1.7–2.6) in 2017. In 2017, government spending and DAH were 63.5% (59.2–66.8) and 15.8% (14.7–16.8) of overall tuberculosis spending, respectively.
Figure 23 The share of HiV/aiDS, malaria, and tuberculosis spending allocated by government, development assistance for health, and out-of-pocket sources, 2000–2017
0%
25%
50%
75%
100%
2000
2001
2002
2003
2004
2005
2006
2007
2008
2009
2010
2011
2012
2013
2014
2016
2015
2017
2000
2001
2002
2003
2004
2005
2006
2007
2008
2009
2010
2011
2012
2013
2014
2016
2015
2017
2000
2001
2002
2003
2004
2005
2006
2007
2008
2009
2010
2011
2012
2013
2014
2016
2015
2017
Share of HiV/AiDS spending Share of malaria spending Share of tuberculosis spending
Development assistance for health
Out-of-pocket health spending
Prepaid private health spendingGovernment health spending
DIsEAsE-spECIFIC spENDING | 83
HIV/AIDSAlthough there are many positive stories to tell about the fight against HIV/AIDS – such as deaths related to HIV/AIDS decreasing 37.8% between 2000 and 2017 (in particular, HIV/AIDS deaths peaked in 2006) per the Global Burden of Disease 2017 study15 – challenges remain. According to GBD 2017, the overall global burden of HIV/AIDS has risen over the past three decades: in 1990, HIV/AIDS caused 20,880,944 DALYs, and in 2017 it caused 54,446,184 DALYs, an increase of more than 160%. Yet looking at such a wide timeframe doesn’t tell the whole story: while HIV/AIDS DALYs rose precipi-tously between 2000 and 2006, since 2006, HIV/AIDS DALYs have dropped from 109,906,633 (or about 50%).
UNAIDS estimates that $26.2 billion (in 2016 USD) will be needed to respond to HIV/AIDS in 2020 (SDG 3.3 aims to eliminate HIV/AIDS by 2030). According to our estimates, a total of $20.2 billion (17.0–25.0) was spent on HIV/AIDS (across all funding sources) in low- and middle-income countries in 2017, the most recent year for which we have overall spending data.* Figure 24 shows how that funding breaks down by financing source and GBD super-region across low- and middle-income countries; DAH plays a much larger role in overall spending in sub-Saharan Africa than in other regions. The figure also shows a breakdown of different sources of HIV/AIDS spending – DAH global initiatives, DAH administrative costs, DAH country projects, prepaid private spending, out-of-pocket spending, and government spending on health – between 2000 and 2017.
Figures 25 and 26 further explore funding by income group, this time for the period 2000–2017. Figure 25 illustrates how much HIV/AIDS spending (coming from government treasuries, broadly) occurs in upper-middle-in-come countries. Additionally, in low-income countries, HIV/AIDS spending has flattened, after growing more or less steadily from 2000 to 2010. Since the beginning of the SDG period in 2015, HIV/AIDS spending has increased across all super-regions, with the biggest gains observed in lower-income countries (20.9% [20.5–21.5]). During the SDG period, DAH for global initiatives has grown 15.5% and DAH for administrative costs has grown 26.5%.
Figure 26, meanwhile, explores spending across HIV/AIDS program areas. Taken together, the DAH-related program areas – development assistance administrative costs and global/unallocable projects, other: development assistance, and DAH care and treatment – make up 47.4% of 2017 HIV/AIDS spending in low- and middle-income countries. During the SDG period so far, increases have been observed across all HIV/AIDS program areas, with the largest annualized increases in DAH care and treatment (19.6%) and DAH administrative costs (12.5%).
* Note that spending estimates are inclusive of low- and middle-income countries.

84 | FINANCING GLOBAL HEALTH 2019
Billi
ons o
f 201
9 uS
dol
lars
2000
2017
2016
2015
2014
2013
2012
2011
2010
2009
2008
2007
2006
2005
2004
2003
2002
2001
0
5
10
15
20
25
$297
South Asia
$2,987
North Africa and Middle East
$1,702
Latin America and Caribbean
$943
Southeast Asia, East Asia,
and Oceania
$604
Central Europe,Eastern Europe, and Central Asia
$296
Sub-Saharan Africa
Spending per prevalent case
Annu
alize
d ra
te o
f cha
nge
of H
iV/A
iDS
incid
ence
per
100
,000
peo
ple
-0.10
0.00
-0.05
-0.15
0.05
0.15
0.10
0.20
0.00 0.350.300.250.200.150.100.05
Increased spending;increased HIV/AIDS
incidence
Increased spending;decreased HIV/AIDS
incidence
Decreased spending; increased HIV/AIDSincidence
Decreased spending; decreased HIV/AIDSincidence
Annualized rate of change of HiV/AiDS spending per person, 2019 uS dollars
CHN
MMr
TLSMoZ
LBr
gMBZWe
CMrrWAMWi
SWZNer
BFA
BWA
KHM
VeNYeM
MHL
FSM
ruS
CoM
PAK
MNg
AZeAFg
DZA
MuSTJK
BLrCuB
ArM geo
Development assistance for health: global initiatives
Development assistance for health: administration costs
Development assistance for health: country projectsPrepaid private health spending
Out-of-pocket health spending
Government health spending
gBD super-region
Central Europe, Eastern Europe, and Central Asia
Latin America and CaribbeanNorth Africa and Middle East
South AsiaSoutheast Asia, East Asia, and OceaniaSub-Saharan Africa
Pie size proportional to spending (in usd) per prevalent case of hiv/aids
Figure 24
PANeL B: HIV/AIDS spending by financing source and GBD super-region across World Bank low- and middle-income countries, 2017
PANeL A: HIV/AIDS spending by financing source in World Bank low- and middle-income countries, 2000–2017
PANeL C: annualized rate of change in HiV/aiDS incidence and annualized rate of change in HiV/aiDS spending per person across World Bank low- and middle-income countries, 2000–2017

DIsEAsE-spECIFIC spENDING | 85
Figure 25 HIV/AIDS spending in low- and middle-income countries by income group, 2000–2017
25
20
0
10
5
15
2012
2000
2001
2002
2003
2004
2005
2006
2007
2008
2009
2010
2011
2013
2014
2015
2016
2017
Billi
ons o
f 201
9 uS
dol
lars
Development assistance for health: global initiatives
Development assistance for health: administrative costs
Upper-middle-income countries
Lower-middle-income countries
Low-income countries
Billi
ons o
f 201
9 uS
dol
lars
0
5
10
2000
2001
2002
2003
2004
2005
2006
2007
2008
2009
2010
2011
2012
2013
2014
2016
2015
2017
15
25
20
Development assistance: global/regional projects
Development assistance: administrative costs
Development assistance: OtherDomestic financing: Other
Development assistance: PreventionDomestic financing: Prevention and voluntary testing
Development assistance: Care and treatment
Domestic spending: Care and treatment
Figure 26 HIV/AIDS spending in low- and middle-income countries by financing source and spending category over time, 2000–2017

86 | FINANCING GLOBAL HEALTH 2019
Figures 27 and 28 explore DAH-specific channels of assistance and program areas. Between 1990 and 2019, US bilateral assistance grew more than 80-fold, from $55.1 million to $4.5 billion. The launch of the US President’s Emergency Plan for AIDS Relief (PEPFAR) in 2003 led to a decade of HIV/AIDS US bilateral growth, with spending growing 440.5% between 2003 and 2013. By program area, HIV/AIDS treatment is currently the largest percentage of HIV/AIDS DAH and has grown steadily since 2003. Funding aimed at prevention efforts rose until 2013, when decline and volatility set in; the 2019 estimate of prevention-related DAH is now roughly equal to that of 2007. Finally, since 2008 there has been a decline in “other” funding, reflecting both improved data and/or more targeted spending strategies.
For additional details, see the HIV/AIDS global health financing profile on page 130.
Figure 27 Development assistance for HIV/AIDS by channel of assistance, 1990–2019
Billi
ons o
f 201
9 uS
dol
lars
5
0
10
1991
1992
1993
1994
1995
1996
1997
1998
1999
2000
2001
2002
2003
2004
2005
2006
2007
2008
2009
2010
2011
2012
2013
2014
2016
2015
1990
2017
2018
*
15
2019
*
Regional development banks
World Bank
US foundationsNGOs
Gates Foundation
CEPI
Global FundGavi
WHO
UNICEF, UNFPA, UNAIDS, Unitaid, PAHOOther bilateral development agencies
China bilateral
Australia bilateralCanada bilateral
France bilateral
Germany bilateral
UK bilateral
US bilateral
*2018 and 2019 estimates are preliminary
cepi = Coalition for Epidemic Preparedness Innovationsngos = Non-governmental organizationspaho = Pan American Health Organizationunaids = Joint United Nations Programme on hiv/aids
Regional development banks include the African Development Bank, the Asian Development Bank, and the Inter-American Development Bank.
unfpa = United Nations Population Fundunicef = United Nations Children’s Fundwho = World Health Organization

DIsEAsE-spECIFIC spENDING | 87
Figure 28 Development assistance for HIV/AIDS by program area, 1990–2019Bi
llion
s of 2
019
uS d
olla
rs
5
0
10
1991
1992
1993
1994
1995
1996
1997
1998
1999
2000
2001
2002
2003
2004
2005
2006
2007
2008
2009
2010
2011
2012
2013
2014
2016
2015
1990
2017
2018
*
15
2019
*
Other
Human resources
Health systems strengtheningDrug resistance
Care and supportOrphans and vulnerable children
Counseling and testing
Prevention of mother-to-child transmission (PMTCT)Prevention (excluding PMTCT)
Treatment
*2018 and 2019 estimates are preliminary
“Other” captures development assistance for health for which we have program area information but which is not identified as being allocated to any of the program areas listed.

88 | FINANCING GLOBAL HEALTH 2019
MalariaSDG 3.3 also covers malaria, aiming to eliminate it as an epidemic by 2030.16 Doing so would mean putting an end to the burden caused by one of the oldest diseases in recorded history.
The global burden of malaria has indeed gone down over the past few decades: per GBD data, in 1990 it caused 672,540 deaths, and in 2017 it caused 619,827 deaths, a reduction of 7.8%. But where malaria causes the most burden hasn’t changed entirely. To cite two examples, in 1990, Nigeria saw the most deaths from malaria, estimated at 138,000. But despite progress elsewhere in the world, in 2017, Nigeria remained the global leader in malaria deaths, with the number rising more than 10% from 1990 to 152,000.* On the other hand, there were 78,000 malaria deaths in India in 1990. That number decreased to 50,000 (despite India’s population increasing 58% in the intervening years), a reduction of 36%.
In 2017, a total of $5.1 billion (4.9–5.4) was spent on malaria in the 106 malaria-endemic countries and countries that have become malaria-free; we estimate a slight drop in malaria spending between 2017 and 2016, when $5.2 billion (5.0–5.5) was spent on malaria. By source, in 2017, government spending on malaria accounted for $1.6 billion (1.5–1.8), out-of-pocket spending $822.6 million (660.4–1,046.9), prepaid private spending $169.9 million (161.0–179.8), and DAH (including non-programmatic and adminis-trative expenses) $2.5 billion. In 2017, 16.1% of total spending on malaria was out-of-pocket. Out-of-pocket payment may force the poorest households to choose between malaria care and other household expenses; thus, this financing arrangement is not considered equitable and is a place for focused attention.
Figure 29 shows 2017 malaria spending by financing source and GBD super-regions; sub-Saharan Africa – at 64.2% of global malaria spending – saw the most malaria-related spending. And in sub-Saharan Africa, 41.7% (or $1.4 billion) was DAH; 33.6% (or $1.1 billion) was government spending; 21.1% (or $0.7 billion) was out-of-pocket; and 3.6% ($0.1 billion) was prepaid private spending.
As Figure 30 shows, the Global Fund plays a large role in channeling DAH for malaria, disbursing an estimated $1.3 billion to malaria in 2017, or 51.5% of the 2017 total. Other major channels include US bilateral aid, which accounted for $555.1 million, or 22.5% of malaria spending in 2017, and US NGOs, which accounted for $226.2 million, or 9.1%. In 2017, the Gates Foundation channeled $145.0 million, or 5.8% of the total channeled in 2017. Between 2000** and 2017, each of these channels saw exponential growth, with Global Fund malaria financing growing 463,666% during this period (starting in 2002), US bilateral aid 4,951%, NGOs 4,059%, and the Gates Foundation 302%.
For additional details, see the malaria global health financing profile on page 134.
*Note that Nigeria’s population grew from an estimated 96.6 million in 1990 (per Our World in Data) to 206.1 million in 2018, more than 113%. **The Global Fund was founded in 2002, and the Gates Foundation in 2000.

DIsEAsE-spECIFIC spENDING | 89
$0.15
South Asia
North Africa and Middle
East
$0.33
Latin America and Caribbean
$0.24
Southeast Asia, East Asia,
and Oceania
$0.18
Central Europe,Eastern Europe, and Central Asia
$0.10
Sub-Saharan Africa
Billi
ons o
f 201
9 uS
dol
lars
2000
2017
2016
2015
2014
2013
2012
2011
2010
2009
2008
2007
2006
2005
2004
2003
2002
2001
0
1
2
3
4
6
5
Annualized rate of change of malaria spending per person, 2019 uS dollars
Annu
alize
d ra
te o
f cha
nge
of m
alar
ia in
ciden
ce p
er 1
00,0
00 p
eopl
e
-0.10 0.200.100.00
-0.20
-0.40
-0.30
-0.10
0.00
0.20
0.10
$3.21
Spending per person
Increased spending;increased malaria
incidence
Increased spending;decreased malaria
incidence
Decreased spending; increased malariaincidence
Decreased spending; decreased malariaincidence
DJi
VeN
Ner
BgD
gMB
SWZ
MMr
CPVLBr
CHN
TLS
THA
BWANPL
BTN
SLV
AFg
gTM
CoM
YeM
HND
SoM
CoL
PHLMYS KHM
STP
gNB eTH
DZA
PrK
Development assistance for health: global initiatives
Development assistance for health: administration costs
Development assistance for health: country projectsPrepaid private health spending
Out-of-pocket health spending Government health spending
Pie size proportional to spending (in usd) per person on malaria
Central Europe, Eastern Europe, and Central Asia
Latin America and CaribbeanNorth Africa and Middle East
South AsiaSoutheast Asia, East Asia, and OceaniaSub-Saharan Africa
gBD super-region
Countries represented by dashed lines have eliminated malaria.
Figure 29
PANeL B: Malaria spending by financing source and GBD super-region across malaria-endemic, low- and middle-income countries, 2017
PANeL A: Malaria spending by financing source in World Bank low- and middle-income countries, 2000–2017
PANeL C: annualized rate of change in malaria incidence and annualized rate of change in malaria spending per person across malaria-endemic, low- and middle-income countries, 2000–2017
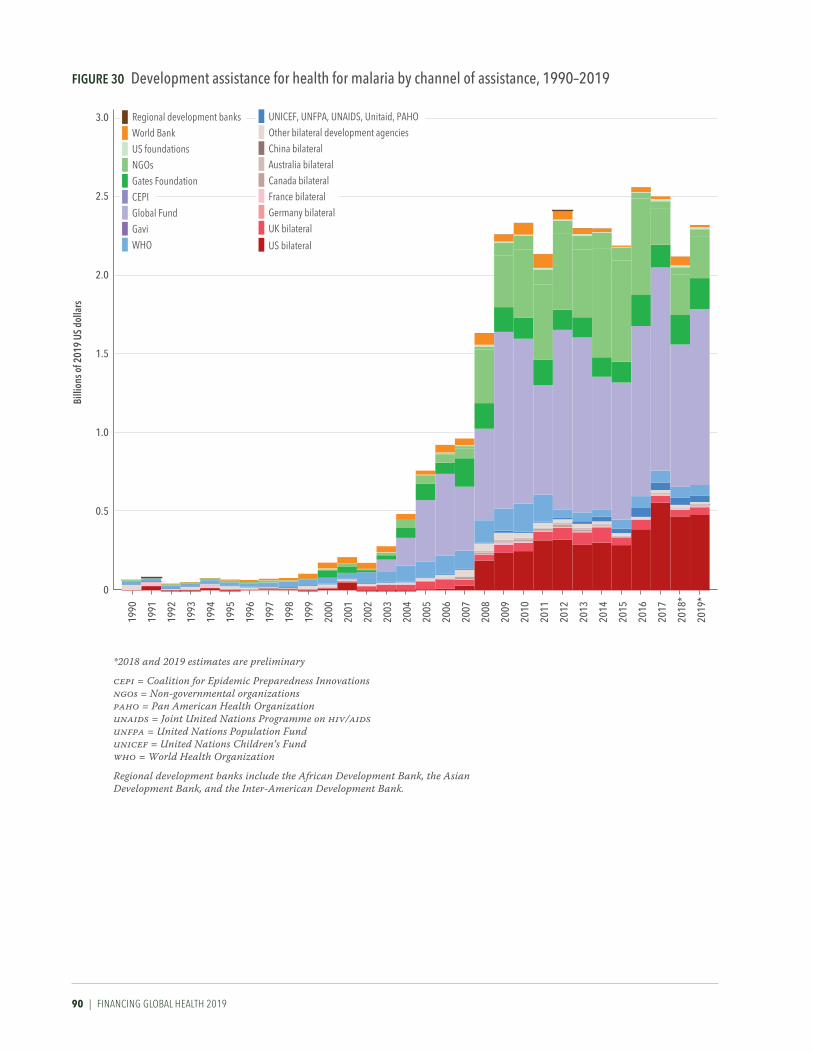
90 | FINANCING GLOBAL HEALTH 2019
Figure 30 Development assistance for health for malaria by channel of assistance, 1990–2019Bi
llion
s of 2
019
uS d
olla
rs
0.5
0
1.0
2.0
1991
1992
1993
1994
1995
1996
1997
1998
1999
2000
2001
2002
2003
2004
2005
2006
2007
2008
2009
2010
2011
2012
2013
2014
2016
2015
1990
2017
1.5
2018
*
3.0
2.5
2019
*
Regional development banks
World Bank
US foundationsNGOs
Gates Foundation
CEPI
Global FundGavi
WHO
UNICEF, UNFPA, UNAIDS, Unitaid, PAHOOther bilateral development agencies
China bilateral
Australia bilateralCanada bilateral
France bilateral
Germany bilateral
UK bilateral
US bilateral
*2018 and 2019 estimates are preliminary
cepi = Coalition for Epidemic Preparedness Innovationsngos = Non-governmental organizationspaho = Pan American Health Organizationunaids = Joint United Nations Programme on hiv/aidsunfpa = United Nations Population Fundunicef = United Nations Children’s Fundwho = World Health Organization
Regional development banks include the African Development Bank, the Asian Development Bank, and the Inter-American Development Bank.

DIsEAsE-spECIFIC spENDING | 91
TuberculosisFigure 31 below shows sources of tuberculosis spending between 2000 and 2017; we estimate a total of $10.9 billion (10.3–11.8) was spent on tubercu-losis in 2017. Of that total, the majority was government spending on notified cases, at 52.5% (48.9–56.0). Government spending on non-notified cases constituted 10.7% (7.5–14.4), out-of-pocket spending 18.7% (15.2–23.6), prepaid private spending 2.1% (1.7–2.6), DAH for country projects 10.5% (9.7–11.2), and DAH for administration and global initiatives 5.3% (4.9–5.6). Since 2000, out-of-pocket spending as a percentage of overall tuberculosis spending has declined while government spending on notified cases as a percentage of overall spending has increased, indicating improvements in case notification and government response. Note that our tuberculosis estimates are inclusive of both multidrug-resistant and drug-susceptible tuberculosis.
Per the World Health Organization, multidrug-resistant tuberculosis is tuberculosis that does not respond to the two most powerful tuberculosis medications, isoniazid and rifampicin. Multidrug-resistant tuberculosis can develop as a result of treatment mismanagement (tuberculosis treatment follows a strict, months-long regimen), which can lead to additional person-to-person transmission of drug-resistant tuberculosis.17
Multidrug-resistant tuberculosis can be much more expensive to treat than drug-susceptible disease, costing many times more than drug- susceptible treatments. Indeed, a literature review published in PharmacoEconomics by Laurence et al.18 found that the mean cost of multidrug-resistant tuberculosis treatment in high-, upper-middle-, lower- middle-, and low-income countries was far more than the mean cost of drug-susceptible tuberculosis treatment in those country income groups. The cost of multidrug-resistant tuberculosis was roughly 569% more than that of drug-susceptible-tuberculosis in high-income countries; about 629% more in upper-middle-income countries; 2,312% more in lower-middle-in-come countries; and 472% more in low-income countries. The huge cost differences mean that this form of tuberculosis presents treatment and funding challenges in areas where multidrug-resistant tuberculosis prevails.
Box 5 Notified and non-notified tuberculosis cases
Many countries have national programs that provide or subsidize tuberculosis treatment. To receive those benefits, and to ensure that tuberculosis cases are tracked locally and nationally, tuberculosis diagnoses need to be formally reported to the national program. For example, in the United States, health care professionals are generally required to report suspected or confirmed tuberculosis cases within 24 hours. Over time, the percentage of tuberculosis diagnoses that are “notified” has gone up in most countries across the world, meaning that more and more tuberculosis patients are receiving care paid for, subsidized by, or provided by their governments. “Non-notified” cases still exist, however. For them, most treatment is covered by out-of-pocket spending, or, in fewer cases, through private insurance and private providers.

92 | FINANCING GLOBAL HEALTH 2019
Figure 31 Tuberculosis spending by source and function, 2000–2017Bi
llion
s of 2
019
uS d
olla
rs
Perc
ent o
f tot
al0
3
6
9
12
0
25
50
75
100
Billi
ons o
f 201
9 uS
dol
lars
Perc
ent o
f tot
al
0
3
6
9
12
0
25
50
75
100
2000
2013
2001
2002
2003
2004
2005
2006
2007
2008
2009
2010
2011
2012
2017
2014
2015
2016
2000
2013
2001
2002
2003
2004
2005
2006
2007
2008
2009
2010
2011
2012
2017
2014
2015
2016
2000
2013
2001
2002
2003
2004
2005
2006
2007
2008
2009
2010
2011
2012
2017
2014
2015
2016
2000
2013
2001
2002
2003
2004
2005
2006
2007
2008
2009
2010
2011
2012
2017
2014
2015
2016
Tuberculosis spending by source
Tuberculosis spending by function
Development assistance for health: global initiatives
Development assistance for health: administrative costs
Development assistance: country projects
Prepaid private spending
Out-of-pocket spending
Government spending: non-notified cases
Government spending: notified cases
Development assistance for health: global initiatives
Development assistance for health: administrative costsNon-National Tuberculosis Programme drug spending
Outpatient spending
Inpatient spendingNational Tuberculosis Programme spending

DIsEAsE-spECIFIC spENDING | 93
According to the Global Burden of Disease study, tuberculosis caused 57.4 million DALYs and 1.4 million deaths in 2017. The highest tuberculosis DALYs rate is in Lesotho, at 1,985.3 DALYs per 100,000. Lesotho also experi-enced the highest death rate, at 40 deaths per 100,000.
Sustainable Development Goal 3.3 also aims to end tuberculosis as an epidemic by 2030, but doing so could require additional resource mobiliza-tion and global efforts. And as shown in Figure 32, an outsize portion of global tuberculosis spending occurs in Central and Eastern Europe and Central Asia, where government spending makes up the bulk of tuberculo-sis-related funding. The spending picture in this region is in sharp contrast to sub-Saharan Africa, where DAH constitutes 28.7% of tuberculosis spending, government spending 39.0%, and out-of-pocket spending 26.9%.
Figure 33 highlights which sources of tuberculosis spending – govern-ment, DAH, and out-of-pocket – are the dominant form in 135 low- and middle-income countries. As the figure shows, in most (79.8%) middle-in-come countries, government spending is the dominant source of tuberculosis spending. The situation is different in the 31 low-income countries: nine rely on DAH, and in 14, out-of-pocket spending is the most dominant source of tuberculosis spending.
Per Figure 34, in contrast to HIV/AIDS, where HIV/AIDS DAH channels of development assistance are primarily bilateral government assistance, a majority of tuberculosis DAH flows through the Global Fund (53.8% of 2019 tuberculosis DAH). US bilateral aid constitutes 10.1% of tuberculosis DAH, and all tracked government bilateral aid (comprising China, Australia, Canada, France, Germany, UK, US, and other countries) comes to just 14.2% of 2019 tuberculosis DAH.
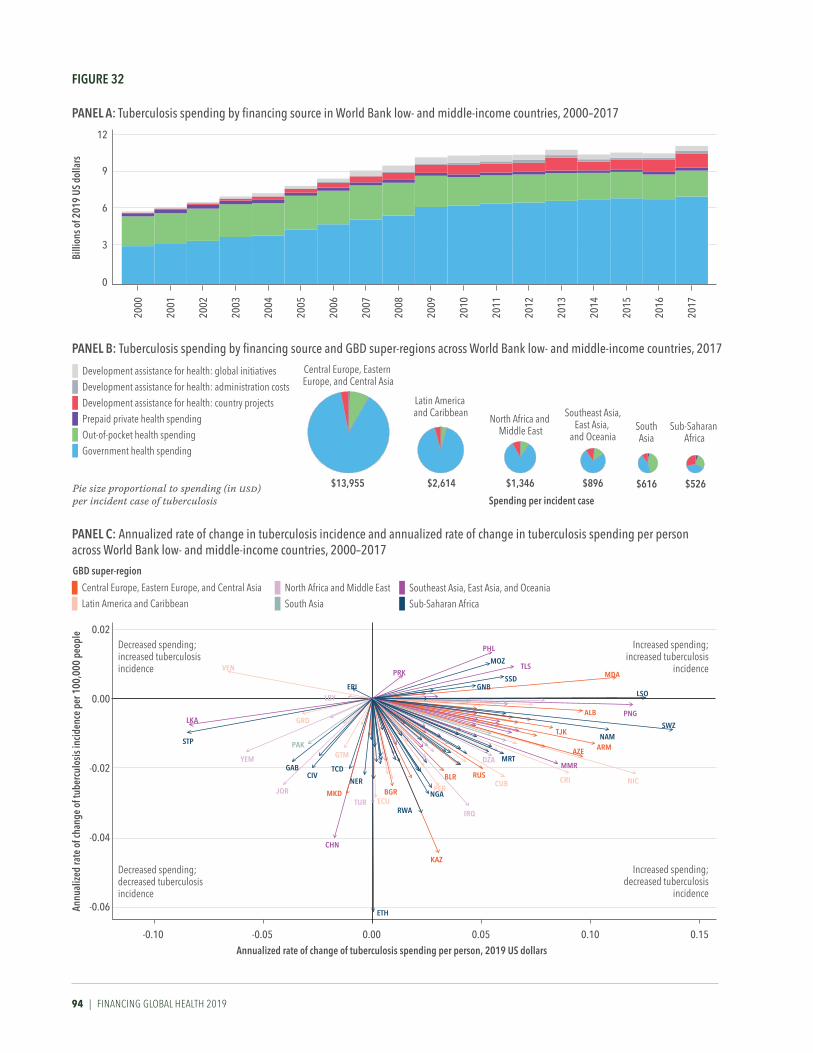
94 | FINANCING GLOBAL HEALTH 2019
Billi
ons o
f 201
9 uS
dol
lars
2000
2017
2016
2015
2014
2013
2012
2011
2010
2009
2008
2007
2006
2005
2004
2003
2002
2001
0
3
6
9
12
Annualized rate of change of tuberculosis spending per person, 2019 uS dollars
Annu
alize
d ra
te o
f cha
nge
of tu
berc
ulos
is in
ciden
ce p
er 1
00,0
00 p
eopl
e
-0.04
-0.06
-0.02
0.00
0.02
-0.10 0.150.100.050.00-0.05
Increased spending;increased tuberculosis
incidence
Increased spending;decreased tuberculosis
incidence
Decreased spending; increased tuberculosisincidence
Decreased spending; decreased tuberculosisincidence
Spending per incident case
Central Europe, Eastern Europe, and Central Asia
$13,955
Latin America and Caribbean
$2,614
North Africa and Middle East
$1,346
Southeast Asia,East Asia,
and Oceania
$896
SouthAsia
$616
Sub-Saharan Africa
$526
PrK
PHL
MoZTLS
SSDgNB
MDA
LSo
PNgALB
SWZNAM
ArM
TJK
AZe
NiCCri
MMr
CuBruS
irQ
KAZ
NgA
rWA
Bgr
eTH
Ner
CHN
DZA MrT
eri
VeN
LBY
LKA
STP
YeM
Jor
grD
PAK
gABCiV
gTM
TCD
MKDTur eCu
BLr
Per
Development assistance for health: global initiatives
Development assistance for health: administration costs
Development assistance for health: country projectsPrepaid private health spending
Out-of-pocket health spending Government health spending
Pie size proportional to spending (in usd) per incident case of tuberculosis
gBD super-region
Central Europe, Eastern Europe, and Central Asia
Latin America and CaribbeanNorth Africa and Middle EastSouth Asia
Southeast Asia, East Asia, and OceaniaSub-Saharan Africa
Figure 32
PANeL B: Tuberculosis spending by financing source and GBD super-regions across World Bank low- and middle-income countries, 2017
PANeL A: Tuberculosis spending by financing source in World Bank low- and middle-income countries, 2000–2017
PANeL C: annualized rate of change in tuberculosis incidence and annualized rate of change in tuberculosis spending per person across World Bank low- and middle-income countries, 2000–2017

DIsEAsE-spECIFIC spENDING | 95
Figure 33 Dominating financing source for total spending on tuberculosis in low- and middle-income countries, 2017
And as Figure 35 illustrates, by program area, a large percentage (62.1%) of tuberculosis DAH is allocated to “other” – DAH for which we have program area information but which isn’t identified as being allocated to human resources for health (9.8% in 2019), other health systems strengthening (13.1%), drug resistance (2.0%), diagnosis (2.0%), or treatment (11.0%).
For additional details, see the tuberculosis global health financing profile on page 132. And Table B2, available in Annex 2, shows 2017 tuberculosis spending for 135 low- and middle-income countries.

96 | FINANCING GLOBAL HEALTH 2019
Figure 34 Development assistance for tuberculosis by channel of assistance, 1990–2019Bi
llion
s of 2
019
uS d
olla
rs
0
0.5
1.0
1.5
2.0
1991
1992
1993
1994
1995
1996
1997
1998
1999
2000
2001
2002
2003
2004
2005
2006
2007
2008
2009
2010
2011
2012
2013
2014
2016
2015
1990
2017
2018
*
2019
*
Regional development banksWorld BankUS foundationsNGOsGates FoundationCEPIGlobal FundGaviWHO
UNICEF, UNFPA, UNAIDS, Unitaid, PAHOOther bilateral development agenciesChina bilateralAustralia bilateralCanada bilateralFrance bilateralGermany bilateralUK bilateralUS bilateral
*2018 and 2019 estimates are preliminary
cepi = Coalition for Epidemic Preparedness Innovationsngos = Non-governmental organizationspaho = Pan American Health Organizationunaids = Joint United Nations Programme on HIV/AIDS
Regional development banks include the African Development Bank, the Asian Development Bank, and the Inter-American Development Bank.
unfpa = United Nations Population Fundunicef = United Nations Children’s Fundwho = World Health Organization

DIsEAsE-spECIFIC spENDING | 97
Figure 35 Development assistance for tuberculosis by program area, 1990–2019Bi
llion
s of 2
019
uS d
olla
rs
0
0.5
1.0
1.5
2.0
1991
1992
1993
1994
1995
1996
1997
1998
1999
2000
2001
2002
2003
2004
2005
2006
2007
2008
2009
2010
2011
2012
2013
2014
2016
2015
1990
2017
2018
*
2019
*
* 2018 and 2019 estimates are preliminary
“Other” captures development assistance for health for which we have program area informationbut which is not identified as being allocated to any of the program areas listed.
OtherHuman resourcesHealth systems strengtheningAntimicrobial resistanceDiagnosis
Treament


FuTurE HEALTH spENDING | 99
PART THREE
Future health spendingThis chapter explores trends in future health spending for 195 countries, assuming historical spending patterns and relationships with other key determinants of health spending persist. In addition, we project scenarios in which governments raise – or lower – their resource commitments for health.
In keeping with this year’s focus on the Sustainable Development Goals, health spending projections to 2030 – the target year for the SDGs to be achieved – are presented and highlighted below; additional spending projections to 2050 are available in Annex 2. Increasing pooled resources for health, particularly from domestic government spending, is essential to building strong and sustainably financed health systems that provide adequate financial protection for populations.
Projections of future health spending, 2018–2030Global health spending is estimated to reach $11.0 trillion (10.7–11.2) in 2030, which equates to an increase of 38.4% (35.3–41.8) over 2017 spending, and 10.5% (10.1–10.9) of the 2030 global economy. By source, government spending is projected to rise 44.9% (40.7–49.1) by 2030, prepaid private spending 30.1% (28.1–32.0), out-of-pocket spending 26.9% (17.5–36.4), and DAH 23.2% (6.0–46.8).
Despite this projected growth, we expect existing disparities in funding and health service coverage to remain in place. 74.9% (73.4–76.2) of pro-jected 2030 spending will occur in countries that are currently high-income. In contrast, upper-middle-income, lower-middle-income, and low-income countries will see annualized rates of 4.3% (3.9–4.7), 4.4% (4.1–4.7), and 4.1% (3.8–4.6) per year, respectively, between 2018 and 2030. If these projections hold, the result will be a continuation of the current global health spending picture, in which disparities in spending between high-income and low- and middle-income countries persist.
Figure 36 shows projected spending scenarios from 1995 to 2030 by Global Burden of Disease super-region. Three spending scenarios are included for each super-region: a reference scenario, and scenarios of higher and lower (“better” and “worse”) health spending increases. Better and worse spending scenarios are derived based on high and low growth trends observed in the historical data and are applied to all countries. While not all countries, and in particular high-income countries, want to spend more on health per person, “better” in this case reflects more resources for the health sector to maintain or improve health. Importantly, improved health can be derived by spending existing health resources more efficiently or addressing other key drivers of health such as the social determinants or exposure to key risk factors.

100 | FINANCING GLOBAL HEALTH 2019
Figure 36 Future spending scenarios by GBD super-region, 1995–2030
High-income Latin America and Caribbean
Central Europe, Eastern Europe, and Central Asia
South Asia
Sub-Saharan Africa
North Africa and Middle East
Southeast Asia, East Asia,and Oceania
glob
al h
ealth
spen
ding
per
per
son
(201
9 uS
D)
400
600
800
1,000
200
400
600
800
4,000
5,000
6,000
7,000
8,000
9,000
50
100
400
600
800
200
300
400
500
600
75
100
125
150
1995
2030
2025
2020
2015
2010
2005
2000
1995
2030
2025
2020
2015
2010
2005
2000
1995
2030
2025
2020
2015
2010
2005
2000
1995
2030
2025
2020
2015
2010
2005
2000
1995
2030
2025
2020
2015
2010
2005
2000
1995
2030
2025
2020
2015
2010
2005
2000
1995
2030
2025
2020
2015
2010
2005
2000
Future spending scenario
Better
ReferenceWorse
The black lines represent retrospective estimates up to 2017. Green, blue, and red represent forecasted estimates for 2018–2030.
Shaded areas around each line represent 95% uncertainty intervals.

FuTurE HEALTH spENDING | 101
Figure 37 shows projected increases by source of spending (government, prepaid private, out-of-pocket, and DAH) per person by Global Burden of Disease super-region between 2017 and 2030. While many regions are projected to experience more than 70% growth in government spending on health per person between 2017 and 2030, the South Asia and sub-Saharan Africa super-regions are projected to experience 35.5% (28.0–41.9) and 57.3% (45.2–69.9) growth in government spending on health per person, respectively.
Figure 37 Share of projected increases due to each funding source by GBD super-region, 2017–2030
Share of change in total health spending (%) 2017—2030
Sub-Saharan africa
Southeast asia, east asia, and oceania
South asia
North africa and Middle east
latin america and Caribbean
gbD high-income
Central europe, easterneurope, and Central asia
-100 0 100 200
Government health spending per person
Prepaid private health spending per person
Out-of-pocket health spending per personDevelopment assistance for health spending per person Black lines represent 95% uncertainty intervals.

102 | FINANCING GLOBAL HEALTH 2019
Meeting the Sustainable Development Goals and challenges ahead To date in the SDG era (2015–2019), DAH has seen only modest growth in spending compared to increases seen during the first four years of the MDG period (2000–2004). In 2000, total development assistance for health stood at $12.4 billion; by 2004, total DAH had risen to $18.8 billion, an increase of 52.4%. Donors that saw notable growth in DAH between 2000 and 2004 include Sweden (up 360.5%), Ireland (up 305.0%), and Norway (up 250.3%). In contrast, in 2015, total DAH was $37.9 billion, and in 2019 it was $40.6 billion, growth of 7.1%. During that period, while we observed growth in some sources of development assistance for health – such as Spain (up 77.7%) and Germany (up 48.8%) – other sources (including Finland and Australia) saw a reduction in their DAH, driven in part by political sentiment in some countries.
For example, President Trump’s 2021 budget19 proposes cuts to the United States’ development assistance budget. The White House has proposed reducing its overall aid budget from $55.7 billion in 2020 to $44.1 billion, a cut of 20.8%.20 While the White House’s proposed budget is certain to be modified by Congress, the budget request underscores this administration’s interest in reducing its foreign commitments. In 2019, the US provided 30.2% of global DAH.
The near- and long-term implications of the United Kingdom’s exit from the European Union also loom over projections of future health spending and meeting the SDGs. Because UK aid is set as a fixed percentage of the country’s GNI, any contraction in the UK economy could lead to a reduction in the amount of health assistance the country provides. How that will affect global health financing remains to be seen.
Moreover, there is the prospect of climate change. If, for example, sea levels were to rise by a foot by 2100, Venice would be inundated by the Mediterranean and New Orleans would sink beneath the Gulf of Mexico.21 While our future health spending scenarios do not account for existential environmental events like these, such a change to geography could have effects on population health and government support for both domestic and development assistance health financing.22, 23
As of the date of this publication, COVID-19 has already taken a heavy toll on the world’s health and economy. If nothing else, the COVID-19 outbreak underscores the importance of having robust health reporting systems, cost projections, adequate supplies and funding for global events, and multilateral pandemic preparedness. But many bright spots remain, including the recent Global Fund replenishment. And although COVID-19 continues to cause burden and strain health services around the world, the global community’s response to the pandemic has been broad, from experts offering support and expertise,24 to emergency funding packages,25 to initiatives to spur vaccine and treatment development.26 Looking ahead, our hope is that the COVID-19 crisis, in conjunction with the ambitious targets set by the SDGs, leads to improvements in how health services are funded and delivered. We hope the estimates presented in Financing Global Health 2019 help policymakers direct spending to close gaps now and into the future.

FuTurE HEALTH spENDING | 103


GLOBAL HEALTH FINANCING prOFILEs | 105
PART FOUR
Global health financing profiles
Financing Global Health’s global health financing profiles expand upon the main report by offering detailed DAH data on a total of 14 funding sources and channels, as well as five health focus areas. We also present detail on other European and non-European government-sourced DAH, an overview of the Global Fund and UN agencies as channels, and explorations of health focus areas not covered in depth elsewhere in the report.

106 | FINANCING GLOBAL HEALTH 2019
KEY SOURCES OF DEVELOPMENT ASSISTANCE FOR HEALTH
United StatesThe United States has the world’s largest economy as measured by gross domestic product.27 Per GBD 2017, average life expectancy in the US in 2017 was 76.1 years for males and 81.1 years for females. The United States is a constitutional federal republic, with both a strong central government and 50 states that work together as a union.
In 2017, the United States spent $3.3 trillion (3.3–3.4) on domestic health, far and away the most in the world. Of that, $1.2 trillion (1.2–1.2), or 36.1% (35.3–37.0), was prepaid private spending, $381.9 billion (368.1–396.5), or 11.5% (11.1–11.9), was out-of-pocket, and $1.7 trillion (1.7–1.8), or 52.4% (51.5–53.3), was government spending. In 2019, the United States’ global health funding picture was largely unchanged from 2018: the US gave a total of $12.2 billion to DAH. Top channels of US aid include the country’s bilateral agencies, NGOs, and UN agencies. Leading health focus areas supported included HIV/AIDS, child health, and maternal health.
Despite a roughly flat trajectory in DAH growth since 2010, the US continues to be the largest contributor of DAH in the world, providing DAH to more than 123 countries in 2019. Since the start of the SDG era in 2015, US DAH contributions increased at an annual rate of 0.9%, but funding in 2019 was
down 0.6% from 2018. The United States has not taken part in the UN’s High-Level Political Forum on Sustainable Development (HLPF), in which countries collaborate to advance sustainable development, including submitting voluntary national reviews of work toward the SDGs. Nonetheless, the US is a partner in a number of sustainable development-related projects, including the 10YFP Sustainable Food Systems Programme, Safe Water System, and Saving Mothers, Giving Life, an initiative to reduce maternal and newborn mortality in sub-Saharan Africa.28
49.0% of 2019 US DAH ($6.0 billion) supported HIV/AIDS; 7.0% ($862.5 million) supported malaria; 11.4% ($1.4 billion) was disbursed for child health, and 10.8% ($1.3 billion) went to maternal health. In 2017, the most recent year for which regional DAH estimates are available, the US directed much of its resources to sub-Saharan Africa, sending 50.5%, or $6.9 billion, of 2017 DAH.
The US provided 59.2% of its funding in 2019 through its own bilateral agencies, including the United States Agency for International Development (USAID), the President’s Malaria Initiative (PMI), and PEPFAR. UN agencies received 6.2% of US DAH in 2019, or $761.4 million. Gavi received
$307.0 million, up 9.0% from 2018, and the Global Fund received $636.5 million, down 25.8%. NGOs received 26.8% of US DAH in 2019, or $3.3 billion.
Figure 1 shows US DAH provided by channel in 2019, while Figure 2 shows trends in DAH by health focus area for the period 2010–2019. And per Figure 3, in 2017 the US provided 51% of its DAH to sub-Saharan Africa and 24% to global recipients and programs.
*2019 estimates are preliminary.
NGOs = non-governmental organizations
Development banks = the African Development Bank, the Asian Development Bank, the Inter-American Development Bank, and the World Bank
UN agencies = PAHO, UNAIDS, UNFPA, UNICEF, Unitaid, WHO
<1%
US
NGOs & foundations
UN agencies
Global Fund
Gavi
Development banks 59%
3%5%
6%
27%
FIgURE 1 DAH provided by the uS to each disbursing channel, 2019*

uNITED sTATEs prOFILE | 107
Billi
ons o
f 201
9 uS
dol
lars
5
10
15
0
1991
1992
1993
1994
1995
1996
1997
1998
1999
2000
2001
2002
2003
2004
2005
2006
2007
2008
2009
2010
2011
2012
2013
2014
2016
2015
1990
2017
2018
*
2019
*
UnallocableOther health focus areas
HSS/SWApsNon-communicable diseases
Other infectious diseasesTuberculosis
Malaria
Newborn and child health
HIV/AIDS
Reproductive and maternal health
FIgURE 2 DAH provided by the uS targeting each health focus area, 1990–2019
1%1%
Sub-Saharan Africa
Global
Unallocable
South AsiaSoutheast Asia, East Asia, and OceaniaLatin America and Caribbean
North Africa and Middle EastCentral Europe, Eastern Europe, and Central Asia
51%
24%
3%3%
4%
13%
FIgURE 3 DAH provided by the uS for each gBD super-region, 2017
*2018 and 2019 estimates are preliminary.
“Other health focus areas” captures development assistance for health for which we have health focus area information but which is not identified as being allocated to any of the health focus areas listed.
HSS/SWAps = Health systems strengthening and sector-wide approaches
Health assistance for which we have no health focus area information, or for which no recipient country or regional information is available, is designated as “Unallocable.” Due to data limitations, development assistance for health estimates are not available by recipient region for 2018 or 2019.

108 | FINANCING GLOBAL HEALTH 2019
KEY SOURCES OF DEVELOPMENT ASSISTANCE FOR HEALTH
United KingdomIn 2018, the United Kingdom had the world’s fifth-largest economy, as measured by gross domestic product.27 And per GBD 2017, average life expectancy in the UK in 2017 was 79.2 years for males and 82.7 years for females.29 In 2017, the UK spent a total of $258.3 billion (250.5–266.4) on domestic health. Of that total, $11.8 billion (9.9–13.9) or 4.6% (3.9–5.3) was prepaid private spending, $41.3 billion (38.0–44.9) or 16.0% (14.8–17.2) was out-of-pocket, and $205.2 billion (199.5–211.3) or 79.4% (78.3–80.6) was government spending.
Prior to COVID-19, the biggest UK-related news in 2019 came at the end of the year: the UK’s exit from the European Union was approved. Following a UK general election in mid-December 2019, the move to leave the EU became law – the “European Union (Withdrawal Agreement) Act of 2020” – officially in January 2020. Political, trade, and budget-related uncertainty abounds as a result. In addition, because the UK’s foreign aid is tied to the country’s GNI (giving 0.70%), whether the UK’s departure from the EU will have any effect on its spending on global health remains to be seen.
Nonetheless, in 2019 the UK retained its place as the second-largest government funder for global health. In 2019,
the UK contributed $3.5 billion to DAH, up 20.6% from 2018 and accounting for 8.7% of total DAH worldwide; since the start of the SDG era in 2015, UK DAH has seen a 1.4% annual-ized decrease. Per the UK’s 2019 HLPF voluntary national review, the SDGs have helped the country “not just to compare our programmes abroad with those at home but also to reconsider our approach in the UK.” The UK is involved in a number of sustainability partnerships, from the Climate and Clean Air Coalition to Water and Sanitation for the Urban Poor.30
Of the UK’s 2019 DAH, $990.3 million (28.2%) was chan-neled to UK bilateral agencies; $524.6 million (14.9%) to UN agencies; $306.4 million (8.7%) to Gavi; and $817.1 million (23.3%) to the Global Fund. Reproductive, maternal, newborn, and child health was the focus of $1.4 billion (38.5%) of the UK’s DAH in 2019, followed by HIV/AIDS with $553.9 mil-lion (15.8%).
By GBD super-regions, the UK contributed $1.3 billion, or 37.3% of its 2017 DAH, to sub-Saharan Africa; $301.0 million (8.7%) to South Asia; $163.9 million (4.7%) to Southeast Asia, East Asia, and Oceania; $237.9 million (6.9%) to North Africa and the Middle East; and $41.0 million (1.2%) to Central
Europe, Eastern Europe, and Central Asia.Figure 1 shows UK DAH provided by channel
in 2019, while Figure 2 shows trends in DAH by health focus area for the period 2010–2019. And per Figure 3, in 2017, the UK provided 38% of its DAH to sub-Saharan Africa and 14% to global recipients and programs.
*2019 estimates are preliminary.
NGOs = non-governmental organizations
Development banks = the African Development Bank, the Asian Development Bank, the Inter-American Development Bank, and the World Bank
UN agencies = PAHO, UNAIDS, UNFPA, UNICEF, Unitaid, WHO
FIgURE 1 DAH provided by the uK to each disbursing channel, 2019*
<1%
UK
Global Fund
NGOs & foundations
UN agencies
Gavi
European Commission
Development banks
28%
9%4%
16%
23%20%

uNITED KINGDOm prOFILE | 109
FIgURE 3 DAH provided by the uK for each gBD super-region, 2017
FIgURE 2 DAH provided by the uK targeting each health focus area, 1990–2019
1%
38%
14%
1%5%
7%
9%
26%
Sub-Saharan Africa
GlobalUnallocable
South Asia
Southeast Asia, East Asia, and OceaniaLatin America and Caribbean
North Africa and Middle East
Central Europe, Eastern Europe, and Central Asia
1991
1992
1993
1994
1995
1996
1997
1998
1999
2000
2001
2002
2003
2004
2005
2006
2007
2008
2009
2010
2011
2012
2013
2014
2016
2015
1990
2017
2018
*
2019
*
Billi
ons o
f 201
9 uS
dol
lars
1.0
2.0
3.0
4.0
0.0
UnallocableOther health focus areas
HSS/SWAps
Non-communicable diseases
Other infectious diseasesTuberculosis
Malaria
Newborn and child health
HIV/AIDS
Reproductive and maternal health
*2018 and 2019 estimates are preliminary.
“Other health focus areas” captures development assistance for health for which we have health focus area information but which is not identified as being allocated to any of the health focus areas listed.
HSS/SWAps = Health systems strengthening and sector-wide approaches
Health assistance for which we have no health focus area information, or for which no recipient country or regional information is available, is designated as “Unallocable.” Due to data limitations, development assistance for health estimates are not available by recipient region for 2018 or 2019.

110 | FINANCING GLOBAL HEALTH 2019
KEY SOURCES OF DEVELOPMENT ASSISTANCE FOR HEALTH
Gates FoundationSince its inception in 2000, the Bill & Melinda Gates Foundation has grown into one of the wealthiest and most impactful private foundations in the world.31 The Foundation makes grants through four global programs (Development; Growth & Opportunity; Health; and Policy & Advocacy) as well as through its education and learning access-focused United States program.
In their 2020 Annual Letter,32 Bill and Melinda Gates highlighted their work with a number of organizations – including Gavi and the Global Fund – and their focus on immunization and reducing HIV/AIDS burden, as well as a continued commitment to making progress on malaria, tuberculosis, child and maternal health, and other focus areas. The Gates Foundation’s 2019 numbers reflect these commitments. In 2019, the Gates Foundation gave a total of $3.9 billion to DAH, putting it ahead of many sovereign governments. Top channels of Gates Foundation aid include its own programs, NGOs and foundations, and Gavi. Leading health focus areas supported include child health, HIV/AIDS, and other health focus areas.
The Gates Foundation’s 2019 DAH total of $3.9 billion was an increase of 9.9% from 2018. Of this, $2.5 billion or 64.0%
was channeled through the Gates Foundation directly to implementing institutions. In 2019, $266.8 million in Gates Foundation DAH went to UN agencies, $256.9 million went to the Global Fund, and $406.1 million was directed to Gavi.
In 2019, the Gates Foundation directed $1.5 billion, or 38.3%, of its DAH to reproductive, maternal, newborn, and child health; $709.3 million, or 18.1%, to HIV/AIDS; $303.9 million, or 7.8% to malaria; $237.6 million, or 6.1%, to tuberculosis; $266.5 million, or 6.8%, to health systems strengthening; and $72.4 million, or 1.9%, to non-communi-cable diseases.
In addition to these important disbursements, the Gates Foundation appointed an advisory board to accelerate SDG progress in 2019; the Foundation highlighted inequality in its third annual Goalkeepers report; and awards were given to youth activists and world leaders working to advance the SDGs.33 In early March 2020, the Foundation announced a partnership with Mastercard and the Wellcome Trust to commit $125 million to speed “the response to the COVID-19 epidemic by identifying, assessing, developing, and scaling up treatments.”34
Figure 1 shows Gates Foundation DAH provided by channel in 2019, while Figure 2 shows trends in DAH by health focus area for the period 2010–2019. And per Figure 3, in 2017, the Foundation provided 41% of its DAH to global recipients and programs and 18% to sub- Saharan Africa.
*2019 estimates are preliminary.
CEPI = Coalition for Epidemic Preparedness Innovations
NGOs = non-governmental organizations
UN agencies = PAHO, UNAIDS, UNFPA, UNICEF, Unitaid, WHO
FIgURE 1 DAH provided by the gates Foundation to each disbursing channel, 2019*
<1%
Gates Foundation
NGOs & foundations
Gavi
UN agencies
Global Fund
CEPI
64%
10%
7%
7%
12%

GATEs FOuNDATION prOFILE | 111
FIgURE 2 DAH provided by the gates Foundation targeting each health focus area, 1990–2019
Global
Sub-Saharan Africa
Unallocable
South Asia
North Africa and Middle East
Latin America and Caribbean
Southeast Asia, East Asia, and Oceania
Central Europe, Eastern Europe, and Central Asia
41%
3%
11%
18%
25%
1% 1%<1%
2000
2001
2002
2003
2004
2005
2006
2007
2008
2009
2010
2011
2012
2013
2014
2016
2015
1999
2017
2018
*
2019
*
Billi
ons o
f 201
9 uS
dol
lars
1.5
1.0
0.5
2.0
3.5
3.0
2.5
4.0
0.0
Unallocable
Other health focus areas
HSS/SWApsNon-communicable diseases
Other infectious diseasesTuberculosis
Malaria
Newborn and child health
HIV/AIDS
Reproductive and maternal health
FIgURE 3 DAH provided by the gates Foundation for each gBD super-region, 2017
*2018 and 2019 estimates are preliminary.
“Other health focus areas” captures development assistance for health for which we have health focus area information but which is not identified as being allocated to any of the health focus areas listed.
HSS/SWAps = Health systems strengthening and sector-wide approaches
Health assistance for which we have no health focus area information, or for which no recipient country or regional information is available, is designated as “Unallocable.” Due to data limitations, development assistance for health estimates are not available by recipient region for 2018 or 2019.

112 | FINANCING GLOBAL HEALTH 2019
KEY SOURCES OF DEVELOPMENT ASSISTANCE FOR HEALTH
France, Germany, and JapanFranceIn October 2019, France hosted the Global Fund’s Sixth Replenishment Conference, where donors pledged more than $14 billion over three years. In 2017, France spent a total of $298.2 billion (293.3–302.8) on domestic health. Of that total, $40.3 billion (37.9–42.9), or 13.5% (12.8–14.3), was prepaid private spending, $28.2 billion (25.8–30.4), or 9.4% (8.7–10.1), was out-of-pocket, and $229.7 billion (226.1–233.2), or 77.0% (76.1–77.9), was government spending.
2019 DAH from France decreased 19.6% from 2018, to $762.8 million. The Global Fund received $157.7 million from France in 2019 (20.7% of France’s DAH); Gavi received $3.0 million (0.4%); and Unitaid received $85.2 million (11.2%). France’s bilateral agencies received $215.8 million (28.3%), the European Commission received $163.4 million (21.4%), and NGOs received $71.4 million (9.4%).
The bulk of DAH from France in 2017 (the latest year for which regional data are available) – $650.9 million or 52.5% – was directed to sub-Saharan African countries. Across health focus areas, $124.2 million or 16.3% of DAH from France was allocated to HIV/AIDS, $86.3 million or 11.3% to malaria, $60.3 million or 7.9% to tuberculosis, and $133.6 million or 17.5% to reproductive, maternal, newborn, and child health. France is currently involved in a number of SDG-related programs, including the 10YFP Sustainable Food Systems Programme and the Network for Therapeutic Solidarity in Hospitals.35
GermanySince 1990, Germany has become a leading European power, and in 2018 it had the fourth-highest GDP in the world.27 In 2017, Germany spent a total of $430.0 billion (419.9–439.6) on domestic health. Of that, $41.7 billion (38.9–44.7), or 9.7% (9.2–10.2), was prepaid private spending, $54.6 billion (51.7–57.7), or 12.7% (12.1–13.3), was out-of-pocket, and $333.6 billion (327.3–340.0), or 77.6% (77.0–78.2), was govern-ment spending.
In 2019, DAH contributions from Germany totaled $2.1 billion, up 9.6% from 2018 and accounting for 5.2% of global DAH. German DAH contributions include $167.4 million (7.9% of its funding) to Gavi, $396.7 million (18.7%) to the Global Fund, and $346.7 million (16.4%) to UN agencies. Another $813.5 million, or 38.4% of Germany’s DAH in 2019, was disbursed through its own bilateral agencies. At the Global Fund Replenishment Conference, Germany pledged $1.1 billion between 2020 and 2022.
Sub-Saharan Africa received $638.5 million (38.0%) of DAH
contributions from Germany in 2017; Southeast Asia, East Asia, and Oceania received $248.0 million (14.8%); North Africa and the Middle East received $128.6 million (7.7%); South Asia received $121.1 million (7.2%); Latin America and the Caribbean received $23.1 million (1.4%); and Central Europe, Eastern Europe, and Central Asia received $72.5 million (4.3%).
As in 2018, German DAH in 2019 was again focused on reproductive, maternal, newborn, and child health, providing $665.1 million (31.4%). Other areas funded by Germany include HIV/AIDS, with $285.2 million (13.5%), and tubercu-losis, with $115.2 million (5.4%). Germany’s involvement in SDG-related programs includes the Blue Action Fund and the Climate and Clean Air Coalition.36
JapanTraditionally a major provider of DAH to improve health throughout the world and especially in Asia, Japan is currently facing the problems of a stagnant economy – Japan’s 2018 GDP was roughly equivalent to its 2000 GDP37 – an aging population, and COVID-19. Like so many countries, the future of DAH funding from Japan is uncertain.
In 2017, Japan spent a total of $551.7 billion (533.5–570.8) on domestic health. Of that total, $16.9 billion (13.8–20.8), or 3.1% (2.6–3.7), was prepaid private spending, $71.1 billion (66.9–75.7), or 12.9% (12.1–13.7), was out-of-pocket, and $463.7 billion (449.5–478.6), or 84.1% (83.3–84.7), was govern-ment spending.
With a contribution of $1.2 billion to DAH in 2019, up 16.0% from 2018 and representing 0.024% (0.024–0.024) of Japan’s 2019 GDP, Japan is the largest donor to global health in Asia. The bulk of Japan’s DAH was distributed through bilateral organizations ($414.7 million, or 35.4%) and the Global Fund ($442.4 million, or 37.7%). At the Global Fund Replenishment Conference, Japan pledged $840 million between 2020 and 2022.
Across regions, $520.2 million or 42.8% of Japan’s 2017 DAH was directed to sub-Saharan Africa; $185.6 million or 15.3% went to Southeast Asia, East Asia, and Oceania; and $116.2 million or 9.6% went to South Asia. By health focus area, Japan disbursed $207.0 million or 17.7% of its 2019 DAH to HIV/AIDS; $206.7 million or 17.6% to reproductive, maternal, newborn, and child health; $147.3 million or 12.6% to malaria; $126.5 million or 10.8% to tuberculosis; $169.4 million or 14.4% to health systems strengthening/SWAps; and $62.3 million or 5.3% to other infectious diseases. Japan’s SDG program partnerships include the African Clean Cities
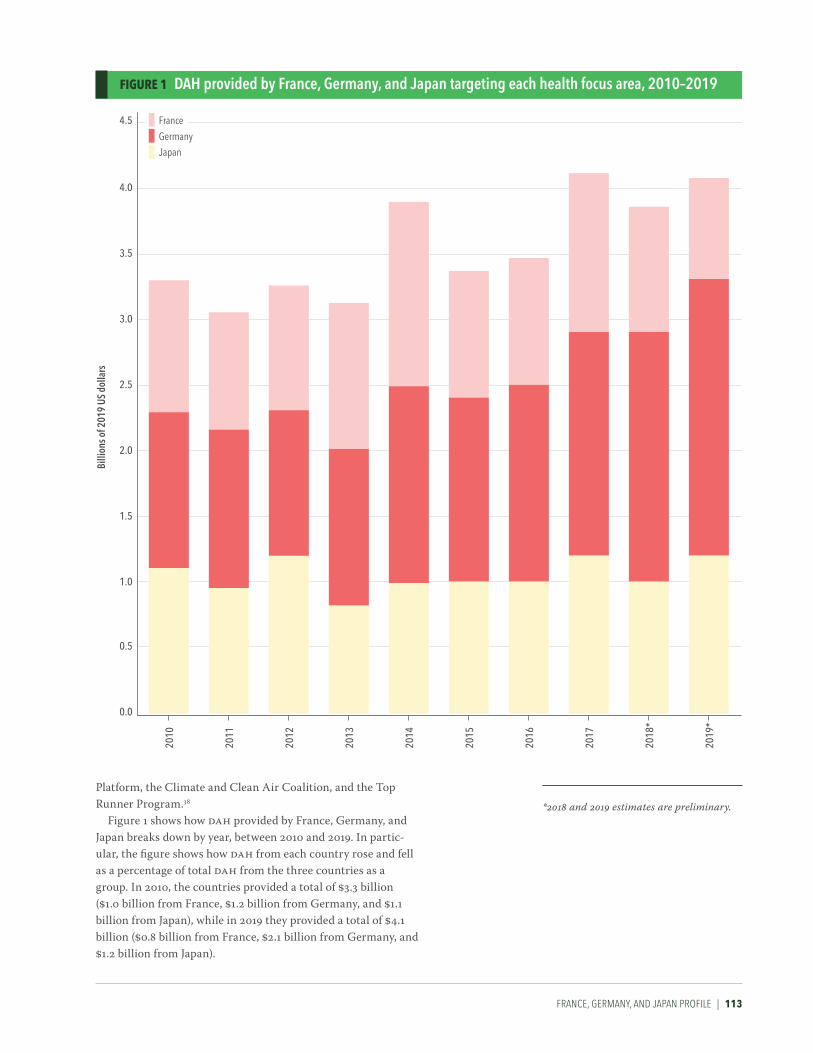
FrANCE, GErmANy, AND jApAN prOFILE | 113
Billi
ons o
f 201
9 uS
dol
lars
0.0
0.5
1.0
1.5
2.0
2.5
3.0
3.5
2010
2011
2012
2013
2014
2016
2015
2017
4.0
2018
*
4.5
2019
*
Japan
France
Germany
FIgURE 1 DAH provided by France, germany, and Japan targeting each health focus area, 2010–2019
Platform, the Climate and Clean Air Coalition, and the Top Runner Program.38
Figure 1 shows how DAH provided by France, Germany, and Japan breaks down by year, between 2010 and 2019. In partic-ular, the figure shows how DAH from each country rose and fell as a percentage of total DAH from the three countries as a group. In 2010, the countries provided a total of $3.3 billion ($1.0 billion from France, $1.2 billion from Germany, and $1.1 billion from Japan), while in 2019 they provided a total of $4.1 billion ($0.8 billion from France, $2.1 billion from Germany, and $1.2 billion from Japan).
*2018 and 2019 estimates are preliminary.

114 | FINANCING GLOBAL HEALTH 2019
FIgURE 1 DAH provided by other european governments to each disbursing channel, 2019*
<1%<1%
Bilaterals
NGOs & foundations
UN agencies
Global Fund
Gavi
WHO
CEPI
World Bank
Development banks
37%
5%7%
20%
13%
1%
16%
KEY SOURCES OF DEVELOPMENT ASSISTANCE FOR HEALTH
Other European governmentsThe other European governments profile comprises all countries in the Global Burden of Disease regions of Eastern Europe, Central Europe, and Western Europe. The grouping excludes the United Kingdom but includes France and Germany, which were covered in depth previously. All told, the “other European countries” profile covers a total of 45 countries, from Albania to Vatican City, and represents a broad range of societies and economies. High-income countries like Austria and Iceland are included (with 2018 GDPs of $455.3 billion and $24.5 billion, respectively), as are lower-middle-income countries such as Moldova (with a 2018 GDP of $11.4 billion), per World Bank data.39
Domestic spending levels ranged across countries included in the other European governments group. Excluding Germany and France, top countries for government spending in 2017 include Italy ($129.2 billion [125.4–133.0]) and Spain ($83.9 billion [80.9–87.2]). For 2017 out-of-pocket spending, Russia spent $33.7 billion (29.0–39.1) and Italy $40.7 billion (38.4–43.1). Germany ($41.7 billion [38.9–44.7]), France ($40.3 billion [37.9–42.9]), and Switzerland ($34.6 billion [33.4–35.8]) led the group in prepaid private spending in 2017.
Figure 1 shows other European government DAH provided by channel in 2019; the largest channels of DAH were bilateral agencies (37%) and NGOs and foundations (20%). Figure 2, meanwhile, shows trends in DAH by health focus area for the period 2010–2019; in particular, since the start of the SDG era in 2015, spending on HSS/SWAps has seen an 11.1% annualized rate of increase. And per Figure 3, in 2017, other European governments as a group provided 36% of their DAH to sub-Saharan Africa.
*2019 estimates are preliminary.
Other European governments are those of countries with GBD super-regions Eastern Europe, Central Europe, or Western Europe and excluding the United Kingdom.
CEPI = Coalition for Epidemic Preparedness Innovations
NGOs = non-governmental organizations
Development banks = the African Development Bank, the Asian Development Bank, the Inter-American Development Bank, and the World Bank
UN agencies = PAHO, UNAIDS, UNFPA, UNICEF, Unitaid, WHO

OTHEr EurOpEAN GOvErNmENTs prOFILE | 115
FIgURE 3 DAH provided by other european governments targeting each health focus area, 1990–2019
FIgURE 2 DAH provided by other european governments for each gBD super-region, 2017
Sub-Saharan Africa
Unallocable
South Asia
Global
Latin America and Caribbean
North Africa and Middle East
Central Europe, Eastern Europe, and Central Asia
Southeast Asia, East Asia, and Oceania
36%
28%
3%6%
10%
8%
8%
2%
Billi
ons o
f 201
9 uS
dol
lars
3
2
1
4
7
6
5
8
0
1991
1992
1993
1994
1995
1996
1997
1998
1999
2000
2001
2002
2003
2004
2005
2006
2007
2008
2009
2010
2011
2012
2013
2014
2016
2015
1990
2017
2018
*
2019
*
UnallocableOther health focus areas
HSS/SWApsNon-communicable diseases
Other infectious diseasesTuberculosis
Malaria
Newborn and child health
HIV/AIDS
Reproductive and maternal health
*2018 and 2019 estimates are preliminary.
Other European governments are those of countries with GBD regions Eastern Europe, Central Europe, or Western Europe and excluding the United Kingdom.
“Other health focus areas” captures development assistance for health for which we have health focus area information but which is not identified as being allocated to any of the health focus areas listed.
HSS/SWAps = Health systems strengthening and sector-wide approaches
Health assistance for which we have no health focus area information, or for which no recipient country or regional information is available, is designated as “Unallocable.” Due to data limitations, development assistance for health estimates are not available by recipient region for 2018 or 2019.

116 | FINANCING GLOBAL HEALTH 2019
FIgURE 1 DAH provided by other non-european governments to each disbursing channel, 2019*
<1%
Bilaterals
Global Fund
NGOs & foundations
WHO
UN agencies
Gavi
Development banks
CEPI
World Bank
46%
3%5%
1% 1%
18%
7%
18%
KEY SOURCES OF DEVELOPMENT ASSISTANCE FOR HEALTH
Other non-European governmentsThe other non-European governments profile comprises all countries in Global Burden of Disease regions outside of Eastern Europe, Central Europe, and Western Europe. In addition, the profile excludes the United States and the Trust Territories of the Pacific Islands as a group. Note that the Marshall Islands, the Federated States of Micronesia, and Palau are covered (as separate states) by the grouping.
In all, the other non-European governments group comprises a total of 160 countries and territories. The range in spending power and GDP across these countries is broad, from Afghanistan’s 2018 GDP of $19.4 billion to Hong Kong’s $362.7 billion.40
As in the previous profile, 2017 domestic spending levels varied across the other non-European governments group. Top countries for government spending in 2017 include Japan ($463.7 billion [449.5–478.6]) and China ($372.2 billion [326.5–419.7]). For 2017 out-of-pocket spending, India spent $58.7 billion (43.5–81.6) and Iran $18.9 billion (16.3–21.9). Brazil ($51.4 billion [43.5–60.5]) led the group in prepaid private spending in 2017.
Figure 1 shows other non-European government DAH provided by channel in 2019; the largest channel across the group was bilateral agencies. Figure 2 shows trends in DAH by health focus area for the period 2010–2019; since the start of the SDG era, spending on newborn and child health by other non-European governments has gone down 12.5%. And per Figure 3, in 2017, other non-European governments as a group provided 28% of their DAH to sub-Saharan Africa and 10% to Southeast Asia, East Asia, and Oceania.
*2019 estimates are preliminary.
Other non-European governments are those of countries with GBD super-regions outside of Eastern Europe, Central Europe, or Western Europe and excluding United States and Trust Territories of the Pacific Islands.
CEPI = Coalition for Epidemic Preparedness Innovations
NGOs = non-governmental organizations
Development banks = the African Development Bank, the Asian Development Bank, the Inter-American Development Bank, and the World Bank
UN agencies = PAHO, UNAIDS, UNFPA, UNICEF, Unitaid, WHO
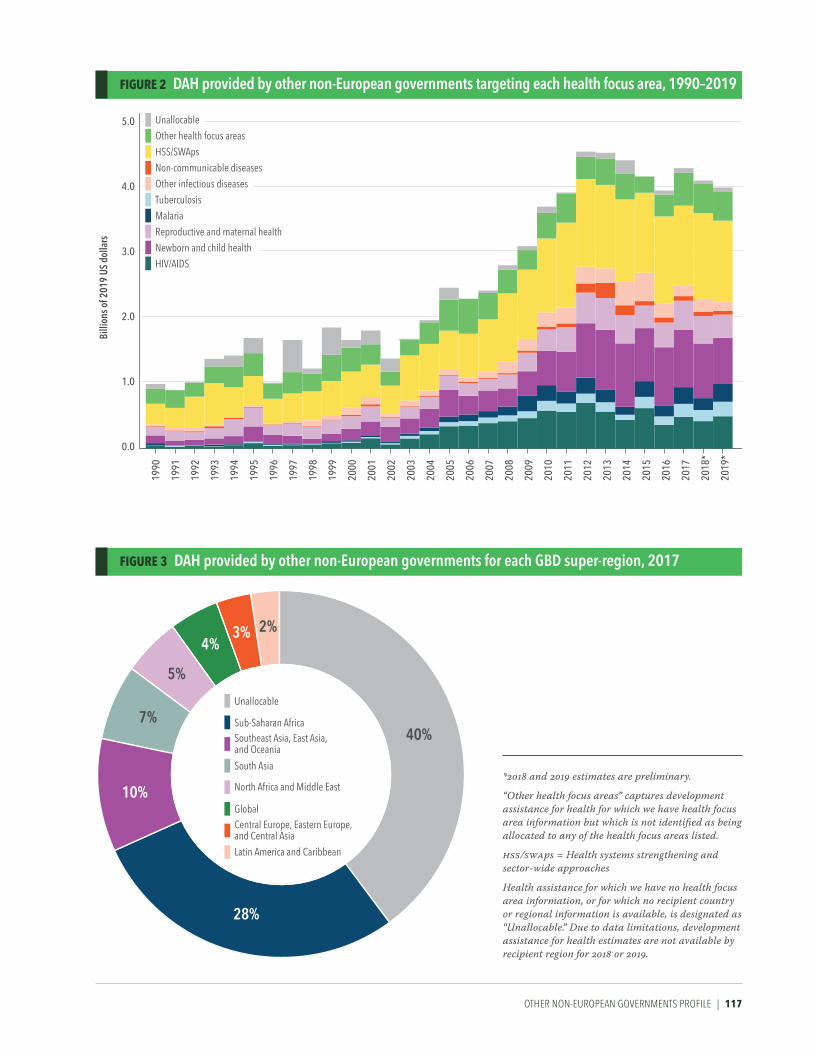
OTHEr NON-EurOpEAN GOvErNmENTs prOFILE | 117
FIgURE 3 DAH provided by other non-european governments for each gBD super-region, 2017
FIgURE 2 DAH provided by other non-european governments targeting each health focus area, 1990–2019
Unallocable
Sub-Saharan Africa
South Asia
Southeast Asia, East Asia, and Oceania
Global
Latin America and Caribbean
North Africa and Middle East
Central Europe, Eastern Europe, and Central Asia
40%
28%
3%4%
10%
5%
2%
7%
1991
1992
1993
1994
1995
1996
1997
1998
1999
2000
2001
2002
2003
2004
2005
2006
2007
2008
2009
2010
2011
2012
2013
2014
2016
2015
1990
2017
2018
*
2019
*
Billi
ons o
f 201
9 uS
dol
lars
1.0
2.0
3.0
5.0
4.0
0.0
UnallocableOther health focus areas
HSS/SWApsNon-communicable diseases
Other infectious diseasesTuberculosis
Malaria
Newborn and child health
HIV/AIDS
Reproductive and maternal health
*2018 and 2019 estimates are preliminary.
“Other health focus areas” captures development assistance for health for which we have health focus area information but which is not identified as being allocated to any of the health focus areas listed.
HSS/SWAps = Health systems strengthening and sector-wide approaches
Health assistance for which we have no health focus area information, or for which no recipient country or regional information is available, is designated as “Unallocable.” Due to data limitations, development assistance for health estimates are not available by recipient region for 2018 or 2019.

118 | FINANCING GLOBAL HEALTH 2019
FIgURE 1 DAH disbursed by CePi from each source, 2019*
KEY CHANNELS OF DEVELOPMENT ASSISTANCE FOR HEALTH
Coalition for Epidemic Preparedness Innovations (CEPI)Formed in Davos in 2017 by the Bill & Melinda Gates Foundation, the governments of Norway and India, the Wellcome Trust, and the World Economic Forum, CEPI is “an innovative global partnership between public, private, philanthropic, and civil society organizations” that works to stop infectious disease epidemics by developing vaccines.41 Based in Oslo, CEPI currently supports the development of a range of vaccine candidates against chikungunya, Lassa virus, Marburg virus, MERS, Nipah virus, and Rift Valley Fever. CEPI is also supporting a range of COVID-19 projects, including partnerships to accelerate vaccine development and production, as well as funding the development of COVID-19 vaccine candidates.42
Figure 1 shows CEPI DAH disbursed by source in 2019. Figure 2, meanwhile, shows trends in DAH by health focus area for the period 2010–2019.
*2019 estimates are preliminary.
Other governments = Japan, Norway, non-OECD Development Assistance Community countries
Private philanthropy = other private and corporate donations
4%
57%
Other governmentsGermanyOther sourcesGates FoundationCanadaAustraliaPrivate philanthropy
19%
11%
9%
<1%<1%


120 | FINANCING GLOBAL HEALTH 2019
<1%<1%
<1%<1%
1%1%
3%
Other sources
Other governments
UK
US
France
Australia
Canada
Germany
95%
FIgURE 1 DAH disbursed by development banks from each source, 2019*
KEY CHANNELS OF DEVELOPMENT ASSISTANCE FOR HEALTH
Development banksFocused on ending poverty in the world’s poorest countries, the World Bank’s International Development Association (IDA) disbursed $1.1 billion of DAH in 2019, down 33.9% from 2018. The International Bank for Reconstruction and Development (IBRD) is a global development cooperative owned by 189 countries. As “the world’s largest development bank,” the IBRD helps countries reduce poverty and extend the benefits of sustainable growth to all people. In 2019, the IBRD disbursed $11.1 billion of DAH, up 25.4% from 2018. Funds were targeted at reproductive, maternal, newborn, and child health; vaccination programs; infectious dis-eases; and NCDs.
Collectively, the African Development Bank (AfDB), the Asian Development Bank (ADB), and the Inter-American Development Bank (IDB) disbursed $618.4 million for global
health in 2019. AfDB funding was down 47.2% from 2018; ADB’s funding was down 51.6%; and IDB’s funding was down 28.2%.
These five organizations – the AfDB, the ADB, the IBD, the IBRD, and the IDA – make up the development banks channel of DAH. In 2019, a total of $2.8 billion in DAH was channeled through these development banks; leading sources of funds were debt repayments and the governments of the United Kingdom and France.
Figure 1 shows development bank DAH provided by source in 2019, while Figure 2 shows trends in DAH by health focus area for the period 2010–2019. And per Figure 3, in 2017, 27.6% of DAH disbursed by development banks as group went to sub-Saharan Africa and 20.5% to North Africa and the Middle East.
Other governments = Austria, Belgium, China, Denmark, Finland, Greece, Ireland, Italy, Japan, Luxembourg, Netherlands, New Zealand, non-OECD Development Assistance Community countries, Norway, Portugal, South Korea, Spain, Sweden, Switzerland
Other sources includes debt repayments

DEvELOpmENT BANKs prOFILE | 121
Sub-Saharan Africa
South Asia
North Africa and Middle East
Latin America and CaribbeanSoutheast Asia, East Asia, and OceaniaCentral Europe, Eastern Europe, and Central Asia
28%
15%
7%
14%
21%
15%
1991
1992
1993
1994
1995
1996
1997
1998
1999
2000
2001
2002
2003
2004
2005
2006
2007
2008
2009
2010
2011
2012
2013
2014
2016
2015
1990
2017
2018
*
2019
*
Billi
ons o
f 201
9 uS
dol
lars
1.5
1.0
0.5
2.0
3.5
3.0
2.5
4.0
0.0
UnallocableOther health focus areas
HSS/SWApsNon-communicable diseases
Other infectious diseasesTuberculosisMalaria
Newborn and child health
HIV/AIDS
Reproductive and maternal health
FIgURE 3 DAH disbursed by development banks targeting each gBD super-region, 2017
FIgURE 2 DAH disbursed by development banks targeting each health focus area, 1990–2019
*2018 and 2019 estimates are preliminary.
“Other health focus areas” captures development assistance for health for which we have health focus area information but which is not identified as being allocated to any of the health focus areas listed.
HSS/SWAps = Health systems strengthening and sector-wide approaches
Health assistance for which we have no health focus area information, or for which no recipient country or regional information is available, is designated as “Unallocable.” Due to data limitations, development assistance for health estimates are not available by recipient region for 2018 or 2019.

122 | FINANCING GLOBAL HEALTH 2019
22%
17%
Gates Foundation
Other governments
US
UK
Germany
Other sources
Canada
Australia
France
Private philanthropy
23%
17%
5%6%
10%
<1%<1% <1%
FIgURE 1 DAH disbursed by gavi from each source, 2019*
KEY CHANNELS OF DEVELOPMENT ASSISTANCE FOR HEALTH
Gavi, the Vaccine AllianceGavi, the Vaccine Alliance is a public-private partnership dedicated to creating equal access to vaccines for people in the world’s poorest countries; Gavi’s mission is to save children’s lives and protect people’s health by increasing equitable use of vaccines in lower-income countries. Founded in 2000 by a group of public-private partners – the Bill & Melinda Gates Foundation, UNICEF, WHO, and the World Bank – Gavi works “to encourage manufacturers to lower vaccine prices for the poorest countries in return for long-term, high-volume, and predictable demand from those countries.” Gavi supports countries by offering health systems strengthening support, vaccine support, cold-chain equipment optimization programs and support, and targeted country assistance. In 2019, Gavi channeled $1.8 billion in development assistance for health to child health (94.4% of Gavi funding) and non-communicable disease-related programs. Top sources of funding for Gavi in 2019 were the Bill & Melinda Gates Foundation, the United States, and the United Kingdom.
Gavi is currently working toward its own replenishment, aiming to raise $7.4 billion to cover the period 2021–2025. To that end, in 2019, Gavi announced that its next replenishment conference would be hosted by the United Kingdom.43 “Vaccines don’t just build healthier societies, they build healthier economies,” said Dr. Ngozi Okonjo-Iweala, the chair of Gavi’s board, when the conference was announced. Some examples of projects Gavi supported in 2019 include Ethiopia’s introduction of a measles vaccine44 and a Gavi-funded cholera vaccine campaign in Mozambique.45
In 2019, Gavi disbursed $1.8 billion in funding, increasing 11.1% from 2018. The UK provided $306.4 million to Gavi in 2019, the Gates Foundation provided $406.1 million, the US provided $307.0 million, and Norway provided $185.8 million.
Figure 1 shows Gavi DAH provided by source in 2019, while Figure 2 shows trends in DAH by health focus area for the period 2010–2019. And per Figure 3, in 2017, 52.6% of DAH disbursed by Gavi went to sub-Saharan Africa and 25.5% to South Asia.
*2019 estimates are preliminary.
Other governments = China, Ireland, Japan, Luxembourg, Netherlands, Norway, South Korea, Spain, Sweden, non-OECD Development Assistance Community countries
Private philanthropy = other private and corporate donations

GAvI, THE vACCINE ALLIANCE prOFILE | 123
Sub-Saharan Africa
North Africa and Middle East
South Asia
Global
Latin America and Caribbean
Central Europe, Eastern Europe, and Central Asia
Southeast Asia, East Asia, and Oceania 53%
7%
6%
25%
7%
1%1%
1991
1992
1993
1994
1995
1996
1997
1998
1999
2000
2001
2002
2003
2004
2005
2006
2007
2008
2009
2010
2011
2012
2013
2014
2016
2015
1990
2017
2018
*
2019
*
Billi
ons o
f 201
9 uS
dol
lars
0.5
1.0
1.5
2.0
0.0
Child and newborn health
Non-communicable diseases
FIgURE 3 DAH disbursed by gavi targeting each gBD super-region, 2017
FIgURE 2 DAH disbursed by gavi targeting each health focus area, 1990–2019
*2018 and 2019 estimates are preliminary.
Due to data limitations, development assistance for health estimates are not available by recipient region for 2018 or 2019.

124 | FINANCING GLOBAL HEALTH 2019
<1%2%3%
11%
5%
25%Other governments
UK
US
Germany
Gates Foundation
Canada
France
Other sources
Private philanthropy
Australia 23%
18%
6%
7%
FIgURE 1 DAH disbursed by the global Fund from each source, 2019*
KEY CHANNELS OF DEVELOPMENT ASSISTANCE FOR HEALTH
The Global Fund The Global Fund is a public-private partnership that began providing grants for the prevention and treatment of HIV/AIDS, malaria, and tuberculosis at the beginning of the millennium; it works to end these diseases by partnering with “governments, civil society, technical agencies, the private sector, and people affected by the diseases,” according to the organization’s website. Since its inception, the Global Fund has disbursed $49.3 billion focused on these three key communicable diseases.
At the October 2019 Sixth Replenishment Conference in Lyon, France, donors pledged a record $14.0 billion over three years to the Global Fund. The total is “the largest amount ever raised for a multilateral health organization, and the largest amount by the Global Fund,” the Global Fund noted in its press release about the replenishment.46 At the Sixth Replenishment Conference, selected 2020–2022 pledges included the United States ($4.6 billion), the United Kingdom ($1.7 billion), France ($1.4 billion), Germany ($1.1 billion),
Japan ($840 million), and the Bill & Melinda Gates Foundation ($760 million). Other pledges include $18 million from China, $50 million from Qatar, and $55.2 million from the United Arab Emirates.47
In 2019, the Global Fund channeled a total of $3.5 billion to programs worldwide. Leading sources of Global Fund contributions were the United States, the United Kingdom, and Japan. The UK provided $817.1 million or 23.3% to the Global Fund in 2019, more than any other contributor. The US contributed $636.5 million or 18.1%, Japan contributed $442.4 million or 12.6%, and Germany contributed $396.7 mil-lion or 11.3%.
Figure 1 shows Global Fund DAH provided by source in 2019, while Figure 2 shows trends in DAH by health focus area for the period 2010–2019. And per Figure 3, in 2017, 72.7% of DAH disbursed by the Global Fund went to sub-Saharan Africa and 10.5% to Southeast Asia, East Asia, and Oceania.
*2019 estimates are preliminary.
Other governments = Belgium, China, Denmark, Ireland, Italy, Japan, Luxembourg, Netherlands, New Zealand, non-OECD Development Assistance Community countries, Norway, Portugal, Sweden, Switzerland
Private philanthropy = other private and corporate donations

THE GLOBAL FuND prOFILE | 125
Sub-Saharan Africa
North Africa and Middle East
South Asia
Unallocable
Latin America and Caribbean
Central Europe, Eastern Europe, and Central Asia
Southeast Asia, East Asia, and Oceania
73%
4%
10%
9%
<1%2%2%
Billi
ons o
f 201
9 uS
dol
lars
2
4
6
0
1991
1992
1993
1994
1995
1996
1997
1998
1999
2000
2001
2002
2003
2004
2005
2006
2007
2008
2009
2010
2011
2012
2013
2014
2016
2015
1990
2017
2018
*
2019
*
HSS/SWAps
Tuberculosis
MalariaHIV/AIDS
FIgURE 3 DAH disbursed by the global Fund targeting each gBD super-region, 2017
FIgURE 2 DAH disbursed by the global Fund targeting each health focus area, 1990–2019
*2018 and 2019 estimates are preliminary.
HSS/SWAps = Health systems strengthening and sector-wide approaches
Health assistance for which no recipient country or regional information is available is designated as “Unallocable.” Due to data limitations, development assistance for health estimates are not available by recipient region for 2018 or 2019.

126 | FINANCING GLOBAL HEALTH 2019
US
Australia
Gates FoundationCanadaGermanyFrance
UKOther governmentsPrivate philanthropy
7% 34%
5%
2%
14%
1%
5%
33%
<1%
FIgURE 1 DAH disbursed by non-governmental organizations from each source, 2019*
KEY CHANNELS OF DEVELOPMENT ASSISTANCE FOR HEALTH
Non-governmental organizations This research is able to uniquely capture DAH contributions that are disbursed through domestic and international NGOs. This group of NGOs consists of any NGO that received resources from the US government in the last decade and includes roughly 1,600 NGOs, although that number is not comprehensive. Collectively, this group of NGOs disbursed $9.8 billion in DAH in 2019, amounting to 24.1% of the total DAH disbursed that year and representing a 0.4% increase from 2018. Global health NGOs that disbursed significant amounts of DAH in 2019 include Population Services International, Family Health International, and World Vision, Inc. Across health areas, in 2019, NGOs channeled $2.4 billion or 24.4% of funds to HIV/AIDS, and $3.5 billion or 36.2% to reproductive, maternal, newborn, and child health in 2019.
Figure 1 shows NGO DAH provided by source in 2019, while Figure 2 shows trends in DAH by health focus area for the period 2010–2019. And per Figure 3, in 2017, 64.3% of DAH disbursed by NGOs as a group was unallocable, while 21.2% went to sub-Saharan Africa.
*2019 estimates are preliminary.
Other governments = Austria, Belgium, Denmark, Finland, Greece, Ireland, Italy, Japan, Luxembourg, Netherlands, New Zealand, non-OECD Development Assistance Community countries, Norway, Portugal, South Korea, Spain, Sweden, Switzerland
Private philanthropy = other private and corporate donations

NON-GOvErNmENTAL OrGANIzATIONs prOFILE | 127
Unallocable
Global
Sub-Saharan Africa
South Asia
Southeast Asia, East Asia, and Oceania
Central Europe, Eastern Europe, and Central Asia
North Africa and Middle East
Latin America and Caribbean
21%
8%
64%
1%1%
1%
2%2%
1991
1992
1993
1994
1995
1996
1997
1998
1999
2000
2001
2002
2003
2004
2005
2006
2007
2008
2009
2010
2011
2012
2013
2014
2016
2015
1990
2017
2018
*
2019
*
0
Billi
ons o
f 201
9 uS
dol
lars
3
2
1
4
7
6
5
8
9
10
11
12 UnallocableOther health focus areas
HSS/SWApsNon-communicable diseases
Other infectious diseasesTuberculosisMalaria
Newborn and child health
HIV/AIDS
Reproductive and maternal health
FIgURE 3 DAH disbursed by non-governmental organizations targeting each gBD super-region, 2017
FIgURE 2 DAH disbursed by non-governmental organizations targeting each health focus area, 1990–2019
*2018 and 2019 estimates are preliminary.
“Other health focus areas” captures development assistance for health for which we have health focus area information but which is not identified as being allocated to any of the health focus areas listed.
HSS/SWAps = Health systems strengthening and sector-wide approaches
Health assistance for which we have no health focus area information, or for which no recipient country or regional information is available, is designated as “Unallocable.” Due to data limitations, development assistance for health estimates are not available by recipient region for 2018 or 2019.

128 | FINANCING GLOBAL HEALTH 2019
KEY CHANNELS OF DEVELOPMENT ASSISTANCE FOR HEALTH
United Nations agenciesBefitting its role as the world’s foremost intergovernmental organization, the umbrella of the United Nations organiza-tion includes a number of specialized agencies. Six of these – the Pan American Health Organization (PAHO), UNAIDS, the United Nations Population Fund (UNFPA), UNICEF, Unitaid, and the World Health Organization (WHO) – are some of the global body’s primary channels for disbursing global health spending.
Most immediately, WHO has acted as a central source of information, guidance, and resources during the COVID-19 pandemic. In addition, WHO based its Thirteenth General Programme of Work, which covers 2019–2023, on the SDGs. The Programme aims to ensure a billion more people have UHC, are better protected from health emergencies, and enjoy better health and well-being overall.48
Funding channeled through the six United Nations agencies included in this report totaled $6.9 billion in 2019, up 4.3% from 2018. WHO provided $2.5 billion of DAH in 2019, down 1.2% from 2018. Of this, $630.7 million or 24.9% was disbursed to other infectious diseases and $1.0 billion or 39.8% to health systems strengthening/SWAps.
PAHO works to reduce, control, and eliminate diseases such as onchocerciasis (river blindness), malaria, and Chagas disease across the Americas. PAHO provided $267.5 million in 2019, down 1.4% from 2018. Funding came from governments ($27.2 million, or 10.2%) and other sources ($240.3 million, or 89.8%) and was disbursed primarily to HSS/SWAps ($56.2 million, or 21.0%) and reproductive, maternal, newborn, and child health ($46.3 million, or 17.3%).
UNAIDS is leading the global effort to end AIDS as a public health threat by 2030. In addition, the agency is working toward its 2020 90-90-90 targets: for 90% of people living with HIV/AIDS to know their status; for 90% of those diagnosed with infections to receive antiretroviral treat-ments; and for 90% of patients receiving antiretroviral therapy to have viral suppression.49 In 2019, the agency disbursed $207.3 million, up 1.7% from 2018. The top five contributors to UNAIDS in 2019 were the US, Sweden, the Netherlands, the UK, and Norway.
The United Nations Population Fund (UNFPA) is the United Nations’ sexual and reproductive health agency. UNFPA’s programs include the Maternal and Newborn Health Thematic Fund, focused on preventing maternal deaths through strategic interventions. Training midwives and ending fistula, a childbirth injury caused by prolonged obstructed labor, are also part of the Maternal and Newborn Health Thematic Fund. Additionally, a November 2019 summit held in Nairobi to mark the 25th anniversary of the
International Conference on Population and Development led to a broad agreement to end “all maternal deaths, unmet need for family planning, and gender-based violence and harmful practices against women and girls by 2030,” according to the UNFPA. In 2019, UNFPA disbursed $1.1 billion in DAH, down 1.7% from 2018. Of this, UNFPA received $466.8 million, or 43.8%, from governments. In 2018, the US withheld funding from UNFPA for the third year in a row under the Kemp-Kasten amendment.
UNICEF provides long-term humanitarian and develop-ment assistance to children and mothers, with a specific focus on nutrition, immunization, and HIV/AIDS, as well as emergency (i.e., pandemic) assistance. UNICEF disbursed $2.6 billion in DAH in 2019, up 12.5% from 2018. Private philan-thropies provided UNICEF with $519.3 million, or 19.8% of its funding in 2019, and the US contributed $316.9 mil-lion, or 12.1%.
And last but certainly not least, per its website, Unitaid “invests in innovations to prevent, diagnose, and treat HIV/AIDS, tuberculosis, and malaria.” In 2019, Unitaid disbursed $154.1 million in DAH, up 35.2% from 2018. Projects Unitaid has been working on include a net program to combat malaria and a program to distribute and promote HIV self-testing kits in Africa.
Figure 1 shows UN agencies’ DAH provided by source in 2019, while Figure 2 shows trends in DAH by health focus area for the period 2010–2019.
*2018 and 2019 estimates are preliminary.
Other governments = Austria, Belgium, China, Denmark, Finland, Greece, Ireland, Italy, Japan, Luxembourg, Netherlands, New Zealand, non-OECD Development Assistance Community (DAC) countries, Norway, other OECD-DAC countries, Portugal, South Korea, Spain, Sweden, Switzerland
Private philanthropy = other private and corporate donations
“Other health focus areas” captures development assistance for health for which we have health focus area information but which is not identified as being allocated to any of the health focus areas listed. Health assistance for which we have no health focus area information is designated as “Unallocable.”
HSS/SWAps = Health systems strengthening and sector-wide approaches

uNITED NATIONs AGENCIEs prOFILE | 129
FIgURE 2 DAH disbursed by united Nations agencies targeting each health focus area, 1990–2019
0
1991
1992
1993
1994
1995
1996
1997
1998
1999
2000
2001
2002
2003
2004
2005
2006
2007
2008
2009
2010
2011
2012
2013
2014
2016
2015
1990
2017
2018
*
2019
*
Billi
ons o
f 201
9 uS
dol
lars
2.0
4.0
UnallocableOther health focus areas
HSS/SWApsNon-communicable diseases
Other infectious diseasesTuberculosis
Malaria
Newborn and child health
HIV/AIDS
Reproductive and maternal health
1%2%2%
26%12%
Other sources
Other governments
Private philanthropy
US
UK
Germany
Gates Foundation
France
Canada
Australia
29%
11%
4%5%
8%
FIgURE 1 DAH disbursed by united Nations agencies from each source, 2019*

130 | FINANCING GLOBAL HEALTH 2019
Government health spending
DAH (programmatic)
DAH (non-programmatic)
Out-of-pocket health spending
Prepaid private health spending
3% 2%
23%
24%
48%
FIgURE 1 Health spending on HiV/AiDS in low- and middle-income countries, 2017
HEALTH FOCUS AREAS
HIV/AIDSTransmitted during sexual intercourse, via syringes, or during pregnancy, breastfeeding, or childbirth, if left untreated, HIV/AIDS can lead to life-threatening infections and health conditions. The virus attacks white blood cells integral to fighting off infection, without which patients are extremely vulnerable. Though there are now effective antiretroviral treatments for HIV/AIDS, when the disease first appeared in the 1980s it led to a widespread public health crisis. Since the start of the epidemic, an estimated 32 million people have died from AIDS-related illnesses.50
In 2017, a total of $20.2 billion (17.0–25.0) was spent on HIV/AIDS; note that our global spending estimate for HIV/AIDS is only inclusive of 135 low- and middle-income countries. Between 2000 and 2017, total spending on HIV/AIDS increased 377.4% (323.2–433.6). Of the 2017 total, DAH accounted for 47.9% (38.5–56.6), prepaid private spending 1.8% (0.5–4.7), out-of-pocket spending 2.8% (1.3–5.4), and govern-ment spending 47.4% (40.7–53.1). Government spending on HIV/AIDS was highest in South Africa, Brazil, and China, while HIV/AIDS DAH was highest in South Africa, Tanzania, and Kenya.
Figure 1 shows HIV/AIDS spending in low- and middle-in-come countries in 2017. Figure 2, meanwhile, shows HIV/AIDS DAH received compared to government spending in low- and middle-income countries, illustrating where countries remain dependent on DAH for HIV/AIDS spending. And Figure 3 shows HIV/AIDS DAH received by program area in 2019.

Figure 2 Trends in development assistance for health provided, by health focus area, 2010–2019
HIv/AIDs prOFILE | 131
<1%
TreatmentOtherPreventionOther health systems strengtheningCare and supportHuman resourcesOrphans/vulnerable childrenCounseling/testingPMTCTDrug resistance
32%5%
5% 4%
8%
5%
15%
12%
14%
* All World Bank high-income designated countries are excluded and shown in white.
** 2019 estimates are preliminary
PMTCT = Prevention of mother-to-child transmission
FIgURE 3 DAH for HiV/AiDS, by program area, 2019**
FIgURE 2 Development assistance for HiV/AiDS compared to government health spending, 2017*

132 | FINANCING GLOBAL HEALTH 2019
2%5%
10%
19%
64%
Out-of-pocket health spending
Government health spending
DAH (programmatic)
DAH (non-programmatic)
Prepaid private health spending
FIgURE 1 Health spending on tuberculosis in low- and middle-income countries, 2017
HEALTH FOCUS AREAS
TuberculosisBoth contagious and airborne, tuberculosis is an infectious disease caused by the bacterium Mycobacterium tuberculosis, which generally affects the lungs. While many cases of tuberculosis do not progress to active disease, those that do can be fatal. Tuberculosis is especially deadly to patients who are smokers or have HIV/AIDS. Tuberculosis is a leading killer of people with HIV, and “a major cause of deaths related to antimicrobial resistance,” according to WHO.51 Much of the global tuberculosis burden is in middle-income countries, including India, Russia, China, and South Africa.
In 2017, a total of $10.9 billion (10.3–11.8) was spent on tuberculosis; note that our global spending estimate for tuberculosis is only inclusive of 135 low- and middle-income countries, as well as global initiatives and unallocable spending. Between 2000 and 2017, total spending on tuberculosis increased 90.9% (66.4–116.1). Of the 2017 total, DAH accounted for 15.8% (14.7–16.8), prepaid private spending 2.1% (1.7–2.6), out-of-pocket spending 18.7% (15.2–23.6), and government spending 63.5% (59.2–66.8). Government
spending on tuberculosis was highest in Russia, India, and China, while tuberculosis DAH was highest in India, South Africa, and Nigeria.
Figure 1 shows tuberculosis spending in low- and mid dle-income countries in 2017. Figure 2, meanwhile, shows tuberculosis DAH received compared to government spending in tuberculosis-endemic countries, illustrating which endemic countries remain dependent on DAH for tubercu-losis spending. And Figure 3 shows tuberculosis DAH received by program area in 2019.

TuBErCuLOsIs prOFILE | 133
OtherOther health systems strengtheningTreatmentHuman resourcesDiagnosisDrug resistance
11%
10%
14% 61%
2%2%
FIgURE 2 Development assistance for tuberculosis compared to government health spending, 2017*
FIgURE 3 DAH for tuberculosis, by program area, 2019**
* All World Bank high-income designated countries are excluded and shown in white.
** 2019 estimates are preliminary

134 | FINANCING GLOBAL HEALTH 2019
4%
16%
16%
31%
33%DAH (programmatic)
Out-of-pocket health spending
Government health spending
DAH (non-programmatic)
Prepaid private health spending
FIgURE 1 Health spending on malaria in endemic countries, 2017
HEALTH FOCUS AREAS
MalariaTransmitted by mosquitoes, malaria is a disease caused by parasites of the Plasmodium group, two of which – P. falciparum and P. vivax – pose the most threat to humans. Malaria’s effects include flu-like symptoms (chills, fever), vomiting, diarrhea, and jaundice,52 and if left untreated, malaria can lead to death. Globally, most malaria burden is in sub-Saharan Africa, with the highest DALY rates seen in Burkina Faso, Sierra Leone, and Niger. In 2017, according to the Global Burden of Disease 2017 study, the most malaria deaths were in Nigeria (more than 150,000), the Democratic Republic of the Congo (more than 80,000), and India (approximately 50,000).
In 2017, a total of $5.1 billion (4.9–5.4) was spent on malaria; note that our global spending estimate for malaria is only inclusive of 106 malaria-endemic countries, as well as global initiatives and unallocable spending. Between 2000 and 2017, total spending on malaria increased 268.4% (233.9–302.5). Of the 2017 total, DAH accounted for 48.7% (46.2–50.8), prepaid private spending 3.3% (3.2–3.5), out-of-pocket spending 16.1% (13.4–19.8), and government spending 31.9% (29.8–33.9). Government spending on malaria was
highest in Nigeria, Ghana, and India, while malaria DAH was highest in Kenya, Tanzania, and the Democratic Republic of the Congo.
Figure 1 shows malaria spending in low- and middle-in-come countries in 2017. Figure 2, meanwhile, shows malaria DAH received compared to government spending in malaria- endemic countries, illustrating which endemic countries remain dependent on DAH for malaria spending. And Figure 3 shows malaria DAH received by program area in 2019.

mALArIA prOFILE | 135
<1%
OtherOther health systems strengtheningTreatmentOther controlHuman resourcesNetsIndoor residual sprayingCommunity outreachDiagnosisDrug resistance
29%6%
7%
7%
8%
19%
4% 4%
16%
FIgURE 3 DAH for malaria, by program area, 2019**
FIgURE 2 Development assistance for malaria compared to government health spending, 2017*
* Non-endemic countries are shown in white.
** 2019 estimates are preliminary

136 | FINANCING GLOBAL HEALTH 2019
FIgURE 1 Development assistance for other infectious diseases by channel of assistance, 1990–2019
HEALTH FOCUS AREAS
Other infectious diseasesFinancing Global Health’s other infectious diseases group refers to all infectious diseases other than HIV/AIDS, tuberculosis, malaria, and childhood diseases covered under our reproductive, maternal, and child health spending category. Though the burden this broad group of diseases causes has gone down over the past two decades – per the Global Burden of Disease study, in 2017, one type of infec-tious disease, lower respiratory infections, caused 2,558,606 deaths, down from 3,415,941 in 1990 – where that burden is felt has not changed. Sub-Saharan Africa saw the most other infectious disease burden in 1990, and that remained true in 2017. Indeed, lower respiratory infections are the leading cause of death in Somalia, and the third-leading cause of death in Niger.
Figure 1 shows DAH for other infectious diseases by channel between 1990 and 2019. Figure 2, meanwhile, shows other infectious diseases DAH received compared to govern-ment spending in low- and middle-income countries, illustrating where countries remain dependent on DAH for spending on other infectious diseases. And Figure 3 shows DAH for other infectious diseases by program area in 2019.
4
0
1
2
3
1991
1992
1993
1994
1995
1996
1997
1998
1999
2000
2001
2002
2003
2004
2005
2006
2007
2008
2009
2010
2011
2012
2013
2014
2016
2015
1990
2017
2018
*
2019
*
Billi
ons o
f 201
9 US
dol
lars
Regional development banks
World Bank
US foundations
NGOs
Gates FoundationCEPI
Global FundGavi
WHO
UNICEF, UNFPA, UNAIDS, Unitaid, PAHO Other bilateral development agencies
China bilateral
Australia bilateralCanada bilateral
France bilateral
Germany bilateral
UK bilateral
US bilateral
*2018 and 2019 estimates are preliminary.
CEPI = Coalition for Epidemic Preparedness InnovationsNGOs = Non-governmental organizationsPAHO = Pan American Health OrganizationUNAIDS = Joint United Nations Programme on HIV/AIDSUNFPA = United Nations Population FundUNICEF = United Nations Children’s FundWHO = World Health Organization
Regional development banks include the African Development Bank, the Asian Development Bank, and the Inter-American Development Bank.
** All World Bank high-income designated countries are excluded and shown in white. Values are shown in 2019 US dollars.
“Other” captures development assistance for health for which we have program area information but which is not identified as being allocated to any of the program areas listed.

OTHEr INFECTIOus DIsEAsEs prOFILE | 137
4
0
1
2
3
1991
1992
1993
1994
1995
1996
1997
1998
1999
2000
2001
2002
2003
2004
2005
2006
2007
2008
2009
2010
2011
2012
2013
2014
2016
2015
1990
2017
2018
*
2019
*
Billi
ons o
f 201
9 US
dol
lars
Other
Human resources
Health systems strengthening Antimicrobial resistance
ZikaEbola
FIgURE 2 Development assistance for other infectious diseases compared to government health spending, 2017**
FIgURE 3 Development assistance for health for other infectious diseases by program area, 1990–2019

138 | FINANCING GLOBAL HEALTH 2019
FIgURE 1 Development assistance for reproductive and maternal health by channel of assistance, 1990–2019
HEALTH FOCUS AREAS
Reproductive, maternal, newborn, and child healthThe reproductive, maternal, newborn, and child health category casts a wide net, ranging from maternal disorders like maternal hemorrhage and ectopic pregnancy, to neonatal sepsis and jaundice, to vaccine-related funding. Taken together, maternal and neonatal disorders caused the most burden in sub-Saharan Africa and countries like Pakistan and Afghanistan, per the Global Burden of Disease 2017 study. Overall, maternal and neonatal disorders caused nearly 2 million deaths in 2017.
By cause, neonatal preterm birth and neonatal encephalop-athy caused the most burden in 2017, leading to nearly 649,000 and 533,000 global deaths, respectively. But strides have been made over the past few decades: since 1990, deaths due to neonatal preterm birth have gone down 49.4%, and deaths caused by maternal hemorrhage have gone down 69.9%, from 128,097 in 1990 to 38,542 in 2017.
Figure 1 shows DAH for reproductive and maternal health by channel between 1990 and 2019. Figure 2, meanwhile, shows newborn and child health DAH by channel between
1990 and 2019. Figures 3 and 4 show newborn and child health DAH and reproductive and maternal health DAH, respectively, between 1990 and 2019.
5
4
0
1
2
3
1991
1992
1993
1994
1995
1996
1997
1998
1999
2000
2001
2002
2003
2004
2005
2006
2007
2008
2009
2010
2011
2012
2013
2014
2016
2015
1990
2017
2018
*
2019
*
Billi
ons o
f 201
9 US
dol
lars
Regional development banks
World Bank
US foundationsNGOs
Gates Foundation
CEPI
Global FundGavi
WHO
UNICEF, UNFPA, UNAIDS, Unitaid, PAHO Other bilateral development agencies
China bilateral
Australia bilateralCanada bilateral
France bilateral
Germany bilateral
UK bilateral
US bilateral
*2018 and 2019 estimates are preliminary.
CEPI = Coalition for Epidemic Preparedness InnovationsNGOs = Non-governmental organizationsPAHO = Pan American Health OrganizationUNAIDS = Joint United Nations Programme on HIV/AIDSUNFPA = United Nations Population FundUNICEF = United Nations Children’s FundWHO = World Health Organization
Regional development banks include the African Development Bank, the Asian Development Bank, and the Inter-American Development Bank.
“Other” captures development assistance for health for which we have program area information but which is not identified as being allocated to any of the program areas listed.

rEprODuCTIvE, mATErNAL, NEWBOrN, AND CHILD HEALTH prOFILE | 139
8
10
6
0
2
4
1991
1992
1993
1994
1995
1996
1997
1998
1999
2000
2001
2002
2003
2004
2005
2006
2007
2008
2009
2010
2011
2012
2013
2014
2016
2015
1990
2017
2018
*
2019
*
Billi
ons o
f 201
9 US
dol
lars
Regional development banks
World Bank
US foundationsNGOs
Gates FoundationCEPI
Global Fund
Gavi
WHO
UNICEF, UNFPA, UNAIDS, Unitaid, PAHO Other bilateral development agencies
China bilateral
Australia bilateralCanada bilateral
France bilateral
Germany bilateral
UK bilateral
US bilateral
FIgURE 3 Development assistance for newborn and child health by program area, 1990–2019
FIgURE 2 Development assistance for newborn and child health by channel of assistance, 1990–2019
FIgURE 4 Development assistance for reproductive and maternal health by program area, 1990–2019
8
6
0
2
4
1991
1992
1993
1994
1995
1996
1997
1998
1999
2000
2001
2002
2003
2004
2005
2006
2007
2008
2009
2010
2011
2012
2013
2014
2016
2015
1990
2017
2018
*20
19*
Billi
ons o
f 201
9 US
dol
lars
Other
Human resources
Health systems strengtheningImmunization
Nutrition
5
0
2
3
1
4
1991
1992
1993
1994
1995
1996
1997
1998
1999
2000
2001
2002
2003
2004
2005
2006
2007
2008
2009
2010
2011
2012
2013
2014
2016
2015
1990
2017
2018
*20
19*
Billi
ons o
f 201
9 US
dol
lars
OtherHuman resources
Health systems strengtheningMaternal health
Family planning

140 | FINANCING GLOBAL HEALTH 2019
0.8
0
0.2
0.4
0.6
1991
1992
1993
1994
1995
1996
1997
1998
1999
2000
2001
2002
2003
2004
2005
2006
2007
2008
2009
2010
2011
2012
2013
2014
2016
2015
1990
2017
2018
*
2019
*
Billi
ons o
f 201
9 US
dol
lars
Regional development banks
World Bank
US foundations
NGOs
Gates Foundation
CEPI
Global FundGavi
WHO
UNICEF, UNFPA, UNAIDS, Unitaid, PAHO Other bilateral development agencies
China bilateral
Australia bilateralCanada bilateral
France bilateral
Germany bilateral
UK bilateral
US bilateral
FIgURE 1 Development assistance for non-communicable diseases by channel of assistance, 1990–2019
HEALTH FOCUS AREAS
Non-communicable diseasesNon-communicable diseases (NCDs) are defined as conditions that are not transmissible from person to person; NCDs are chronic diseases, and behaviors like smoking and overuse of alcohol can increase the chance of developing one. NCDs include cardiovascular diseases, chronic respiratory diseases, and cancers.
As a group, NCDs were the leading cause of health loss globally in 2017, causing nearly four times as many deaths (more than 41 million, or 73.4% of deaths) as communicable, maternal, neonatal, and nutritional diseases combined. Despite this, however, NCDs development assistance for health remains a fraction of total DAH. Indeed, while the global burden of NCDs has grown – in 2000 NCDs led to more than 31 million deaths worldwide, or 61.6% of global deaths – NCD DAH has not risen to meet the increasing burden these diseases cause. In 2000, NCD DAH stood at $190 million, or 1.6% of total DAH, whereas in 2019 it was $730 million, or 1.8% of overall DAH.
The leading types of NCDs include ischemic heart disease, stroke, and chronic obstructive pulmonary disease; NCD risk can be mitigated by modifying certain risk factors, like smoking.53 Globally, NCD burden is highest in many middle-income countries. For example, 31% of 2017 deaths
in Russia were attributable to ischemic heart disease, and 17% to stroke.
Figure 1 shows NCD DAH by channel between 1990 and 2019. Figure 2, meanwhile, shows NCD DAH received com-pared to government spending in low- and middle-income countries, illustrating which countries remain dependent on DAH for NCD spending. And Figure 3 shows NCD DAH by program area in 2019.
*2018 and 2019 estimates are preliminary.CEPI = Coalition for Epidemic Preparedness InnovationsNGOs = Non-governmental organizationsPAHO = Pan American Health OrganizationUNAIDS = Joint United Nations Programme on HIV/AIDSUNFPA = United Nations Population FundUNICEF = United Nations Children’s FundWHO = World Health OrganizationRegional development banks include the African Development Bank, the Asian Development Bank, and the Inter-American Development Bank.**All World Bank high-income designated countries are excluded and shown in white. Values are shown in 2019 US dollars.“Other” captures development assistance for health for which we have program area information but which is not identified as being allocated to any of the program areas listed.

NON-COmmuNICABLE DIsEAsEs prOFILE | 141
0.8
0
0.2
0.4
0.6
1991
1992
1993
1994
1995
1996
1997
1998
1999
2000
2001
2002
2003
2004
2005
2006
2007
2008
2009
2010
2011
2012
2013
2014
2016
2015
1990
2017
2018
*
2019
*
Billi
ons o
f 201
9 US
dol
lars
Other
Human resources
Health systems strengtheningMental health
Tobacco
FIgURE 3 Development assistance for health for non-communicable diseases by program area, 1990–2019
FIgURE 2 Development assistance for non-communicable diseases compared to government health spending, 2017**


CONCLusION | 143
ConclusionCOVID-19 – because of its burden and effects on daily life and in-person social interaction – underscores the importance of spending on global health as a public good, and as a way of buttressing against crisis. Robust health financing to provide universal health coverage, to meet the SDGs, and to ensure that we are prepared for the next pandemic is critically needed. In the absence of health systems that emphasize pooled, prepaid resources, countries are forced to rely on out-of-pocket spending, which can put an inequitable burden on lower-income households and does not provide broad financial risk protection.
Our efforts to track health spending by source, channel, and health focus area can help policymakers assess trends, allowing them to see who is paying for what and where. Decision-makers can use our data to identify gaps in their own health services and spending, with an eye toward moving away from donor assistance and toward more sustainable, robust spending on health.
Financing Global Health 2019 also shows that progress toward the health-related SDGs remains mixed, and that more resources will be needed in many areas to achieve the goals by 2030. Indeed, compared to the first four years of the Millennium Development Goal period (2000–2004), there has been only a modest ramping-up of spending since the launch of the SDGs in 2015. Our estimates of disease-specific indicators related to Sustainable Development Goal 3, the goal explicitly devoted to improving the health of the world’s population, highlight for policymakers the prog-ress made to date –and gaps that need to be filled.
Additionally, by including updated estimates of global health spending through 2017, this edition of Financing Global Health shows the large disparities in health spending across countries. Our estimates, including Financing Global Health 2019’s updated future health spending projections, show that these disparities are not expected to dissipate. There is, therefore, a need for deliberate action in the poorest countries to catalyze additional resources for health, both domestically and via global donors. Health spending remains, after all, a political choice. Not all countries that devote a significant percentage of their overall spending to health are high-income, while other countries do not prioritize health spending at all. To ensure that progress is made toward achieving Sustainable Development Goal 3 globally, prioritizing spending on health will be critical.
In the absence of robust domestic and prepaid spending on health, donor spending plays a key role. Our 2019 estimates of DAH give policymakers up-to-date data related to sources and channels of DAH, recipients, and topics like health systems strengthening and spending on pandemic preparedness. Donor commitment to development assistance for health underpins broad global public good projects like supporting treatment research and development and pandemic preparedness (which constituted about 0.9% of DAH in 2019, which was itself only 0.5% of overall spending on health). And despite being such a small fraction of global spending on

144 | FINANCING GLOBAL HEALTH 2019
health, DAH is integral to ensuring that countries and regions without sufficient economic resources have essential services, not to mention the ability to invest in (and work to improve) health.
The COVID-19 pandemic shows just how interconnected our global world is today. That the virus could spread globally in span of a few months underscores the importance of global cooperation and partnership; the pandemic also underscores, dramatically, the importance of building robust health systems that can absorb shocks, maintain extensive disease surveil-lance, and provide care for large populations in emergency settings. It is more critical than ever that health system leaders, donors, and decision-makers across areas of expertise work together to share lessons and best practices, to repair the damage done by COVID-19 and push forward toward achieving the SDGs. One of the silver linings of COVID-19 crisis has been the unprecedented level of cooperation among researchers across the world to better understand and treat COVID-19.54 We share the latest edition of Financing Global Health in the same spirt of openness, in hopes that these numbers can be used to inform policy decisions and resource allocation to maintain and improve health throughout the world.

145


rEFErENCEs | 147
References1. COVID-19 Map. Johns Hopkins
Coronavirus Resource Center. https://coronavirus.jhu.edu/map.html (accessed June 23, 2020).
2. “Coronavirus: China’s Economy Suffers Dramatic Collapse in January, February in Warning to Rest of World | South China Morning Post.” Accessed April 24, 2020. https://www.scmp.com/economy/china-economy/article/ 3075314/coronavirus-caused- dramatic-collapse-chinas- economy-warning.
3. “New Country Classifications by Income Level: 2019-2020.” Accessed May 20, 2020. https://blogs.worldbank.org/opendata/new-country- classifications-income-level-2019-2020.
4. “Goal 3: Sustainable Development Knowledge Platform.” Accessed April 24, 2020. https://sustainable development.un.org/sdg3.
5. Hogan, Daniel R., Gretchen A. Stevens, Ahmad Reza Hosseinpoor, and Ties Boerma. “Monitoring Universal Health Coverage within the Sustainable Development Goals: Development and Baseline Data for an Index of Essential Health Services.” The Lancet Global Health 6, no. 2 (February 1, 2018): e152–68. https://doi.org/10.1016/S2214-109X(17)30472-2.
6. “Japan PM Abe, WHO DG Tedros Discuss Importance Of Achieving UHC In Opinion Pieces.” The Henry J. Kaiser Family Foundation (blog), December 13, 2019. https://www.kff.org/news-summary/japan-pm- abe-who-dg-tedros-discuss- importance-of-achieving-uhc-in- opinion-pieces/.
7. Saksena, Priyanka, Justine Hsu, and David B. Evans. “Financial Risk Protection and Universal Health Coverage: Evidence and Measurement Challenges.” PLoS Medicine 11, no. 9 (September 22, 2014). https://doi.org/10.1371/journal.pmed.1001701.
8. “Assessing National and Subnational Inequalities in Medical Care Utilization and Financial Risk Protection in Rwanda. - PubMed - NCBI.” Accessed April 24, 2020. https://www.ncbi.nlm.nih.gov/pubmed/30917822.
9. Zeng, Wu, Laurence Lannes, and Ronald Mutasa. “Utilization of Health Care and Burden of Out-of-Pocket Health Expenditure in Zimbabwe: Results from a National Household Survey.” Health Systems and Reform 4, no. 4 (2018): 300–312. https://doi.org/ 10.1080/23288604.2018.1513264.
10. Institute for Health Metrics and Evaluation. “Frequently Asked Questions: What countries are in each region?,” May 9, 2014. http://www.healthdata.org/gbd/faq.
11. COVID-19 Projections. Institute for Health Metrics and Evaluation. https://covid19.healthdata.org/united-states-of-america (accessed June 23, 2020).
12. Unemployment rate jumps to 14.7 percent, the worst since the Great Depression - The Washington Post. https://www.washingtonpost.com/business/2020/05/08/april-2020-jobs-report/ (accessed June 1, 2020).
13. “Fast-Track Update on Investments Needed in the AIDS Response.” Accessed April 24, 2020. https://www.unaids.org/en/ resources/documents/2016/unaids_fast-track_update_ investments_needed.
14. WHO. “WHO | World Malaria Report 2018.” World Health Organization. Accessed April 24, 2020. http://www.who.int/malaria/publications/world-malaria- report-2018/en/.
15. Frank, Tahvi D., Austin Carter, Deepa Jahagirdar, Molly H. Biehl, Dirk Douwes-Schultz, Samantha Leigh Larson, Megha Arora, et al. “Global, Regional, and National Incidence, Prevalence, and Mortality of HIV, 1980–2017, and Forecasts to 2030, for 195 Countries and Territories: A Systematic Analysis for the Global Burden of Diseases, Injuries, and Risk Factors Study 2017.” The Lancet HIV 6, no. 12 (December 1, 2019): e831–59. https://doi.org/10.1016/S2352-3018(19)30196-1.
16. “Goal 3: Sustainable Development Knowledge Platform.” Accessed May 20, 2020. https://sustainable development.un.org/sdg3.
17. “What Is Multidrug-Resistant Tuberculosis (MDR-TB) and How Do We Control It?” Accessed April 24, 2020. https://www.who.int/news-room/q-a-detail/what-is-multidrug- resistant-tuberculosis-(mdr-tb)-and-how-do-we-control-it.
18. Laurence, Yoko V., Ulla K. Griffiths, and Anna Vassall. “Costs to Health Services and the Patient of Treating Tuberculosis: A Systematic Literature Review.” Pharmacoeconomics 33, no. 9 (2015): 939–55. https://doi.org/10.1007/s40273-015-0279-6.
19. The White House. “President’s Budget.” Accessed April 24, 2020. https://www.whitehouse.gov/omb/budget/.
20. “Trump Again Proposes Big Cut to Foreign Aid | Voice of America - English.” Accessed April 24, 2020. https://www.voanews.com/usa/ us-politics-trump-again-proposes- big-cut-foreign-aid.
21. “Surging Seas: Risk Zone Map.” Accessed April 24, 2020. https://ss2.climatecentral/org/#12/40.7298/-74.0070?show= satellite&projections=0-K14_RCP85-SLR&level=5&unit=feet&pois=hide.

148 | FINANCING GLOBAL HEALTH 2019
22. Wright, Robin. “The One War That the Human Species Can’t Lose.” The New Yorker. Accessed April 24, 2020. https://www.newyorker.com/news/dispatch/antarcticas-ice-the-one- war-that-the-human-species-cant-lose.
23. “Summary for Policymakers — Special Report on the Ocean and Cryosphere in a Changing Climate.” Accessed April 24, 2020. https://www.ipcc.ch/srocc/chapter/summary-for-policymakers/.
24. “Helping Governments Strengthen COVID-19 Preparedness.” Accessed April 24, 2020. https://www.path.org/articles/covid-19-preparedness-venczel/.
25. NPR.org. “Where That $8.3 Billion In U.S. Coronavirus Funding Will And Won’t Go.” Accessed April 24, 2020. https://www.npr.org/sections/health-shots/2020/03/06/812964894/where-that-8-3-billion-in-u-s-corona-virus-funding-will-and-wont-go.
26. “Wellcome Pledges $50 Million to the COVID-19 Therapeutics Accelerator | News | Wellcome.” Accessed April 24, 2020. https://wellcome.ac.uk/news/ wellcome-pledges-50-million- new-initiative-speed- development-covid-19-treatments.
27. The World Bank. GDP Ranking. Available from https://databank.worldbank.org/data/download/GDP.pdf (Accessed April 24, 2020).
28. “United States of America: Sustainable Development Knowledge Platform.” Accessed April 24, 2020. https://sustainabledevelopment.un.org/memberstates/usa.
29. Institute for Health Metrics and Evaluation. “United Kingdom,” September 9, 2015. http://www.healthdata.org/united-kingdom
30. “United Kingdom of Great Britain and Northern Ireland: Sustainable Development Knowledge Platform.” Accessed April 24, 2020. https://sustainabledevelopment.un.org/memberstates/unitedkingdom.
31. “Foundation Fact Sheet,” January 1, 1AD. https://www.gatesfoundation.org/Who-We-Are/General-Information/Foundation-Factsheet.
32. Gates, Bill and Melinda. “Why We Swing for the Fences.” gatesnotes.com. Accessed April 24, 2020. https://www.gatesnotes.com/2020-Annual-Letter.
33. “Press Releases,” January 1, 1AD. https://www.gatesfoundation.org/Media-Center/Press-Releases.
34. “COVID-19 Therapeutics Accelerator,” January 1, 1AD. https://www.gatesfoun-dation.org/Media-Center/Press-Releases/2020/03/COVID-19-Therapeutics-Accelerator.
35. “France: Sustainable Development Knowledge Platform.” Accessed April 24, 2020. https://sustainabledevelop-ment.un.org/memberstates/france.
36. “Germany: Sustainable Development Knowledge Platform.” Accessed April 24, 2020. https://sustainabledevelop-ment.un.org/memberstates/germany.
37. “GDP (Current US$) - Japan | Data.” Accessed April 24, 2020. https://data.worldbank.org/indicator/NY.GDP.MKTP.CD?locations=JP.
38. “Japan: Sustainable Development Knowledge Platform.” Accessed April 24, 2020. https://sustainabledevelop-ment.un.org/memberstates/japan.
39. “GDP (Current US$) - Austria, Iceland, Moldova | Data.” Accessed April 24, 2020. https://data.worldbank.org/indicator/NY.GDP.MKTP.CD?locations=AT-IS-MD.
40. “GDP (Current US$) - Afghanistan, Hong Kong SAR, China | Data.” Accessed April 24, 2020. https://data.worldbank.org/indicator/NY.GDP.MKTP.CD?locations=AF-HK.
41. CEPI. “Why We Exist.” Accessed April 24, 2020. https://cepi.net/about/whyweexist/.
42. COVID-19. CEPI. https://cepi.net/covid-19/ (accessed June 8, 2020).
43. “UK to Host Gavi Pledging Conference in 2020.” GOV.UK. Accessed April 24, 2020. https://www.gov.uk/government/news/uk-to-host-gavi-pledging- conference-in-2020.
44. “Ethiopia Introduces Measles Vaccine Second Dose with Support from Gavi.” Accessed April 24, 2020. https://www.gavi.org/news/media-room/ethiopia-introduces-measles-vac-cine-second-dose-support-gavi.
45. “Cholera Vaccination Campaign Begins in Mozambique.” Accessed April 24, 2020. https://www.gavi.org/news/media-room/cholera-vaccination- campaign-begins-mozambique.
46. “Global Fund Donors Pledge US$14 Billion in Fight to End Epidemics.” Accessed April 24, 2020. https://www. theglobalfund.org/en/news/2019- 10-10-global-fund-donors-pledge- usd14-billion-in-fight-to-end- epidemics/.
47. “Sixth Replenishment Conference Pledges.” Accessed April 24, 2020. https://www.theglobalfund.org/en/updates/other-updates/ 2019-10-11-sixth-replenishment- conference-pledges/.
48. “Thirteenth General Programme of Work 2019−2023.” Accessed April 24, 2020. https://www.who.int/about/what-we-do/thirteenth-general- programme-of-work-2019---2023.
49. “90–90–90 - An Ambitious Treatment Target to Help End the AIDS Epidemic | UNAIDS.” Accessed April 24, 2020. https://www.unaids.org/en/resources/documents/2017/90-90-90.
50. “Global HIV & AIDS Statistics — 2019 Fact Sheet.” Accessed April 24, 2020. https://www.unaids.org/en/resources/fact-sheet.
51. “Global Tuberculosis Report 2019.” Accessed April 24, 2020. https://www.who.int/tb/global-report-2019.
52. “Malaria.” Text. National Library of Medicine. Accessed April 24, 2020. https://medlineplus.gov/malaria.html.
53. “Non Communicable Diseases.” Accessed April 24, 2020. https://www.who.int/news-room/fact-sheets/detail/noncommunicable-diseases.
54. “Coronavirus Treatment: Hundreds of Scientists Scramble to Find One - The New York Times.” Accessed April 24, 2020. https://www.nytimes.com/2020/03/17/science/coronavi-rus-treatment.html.

rEFErENCEs | 149


mETHODs | 151
ANNEX 1
Methods
OverviewFinancing Global Health 2019 presents estimates based on the most reliable and up-to-date data available as of January 2020. Gathering data from spending accounts, budgets, and other estimates from a broad set of sources, we employed statistical models and accounting methods to produce our estimates. This section briefly outlines our processes. For more detailed information on the input data and methodology, please refer to our online Methods Annex, available at http://bit.ly/fgh2019report.
Additional information on methods can also be found in a paper pub-lished by the Global Burden of Disease Health Financing Collaborator Network in April 2020, “Health spending on HIV/AIDS, tuberculosis, and malaria, and development assistance for health: progress towards Sustainable Development Goal 3” in The Lancet, and in another paper authored by a smaller subset of the Collaborator Network, “Tracking total spending on tuberculosis by source and function in 135 low- and middle-in-come countries, 2000–2017” in The Lancet Infectious Diseases.
Development assistance for health IHME collated and compiled financing data from the sources and channels discussed in this report. Our goal was to track disbursements through international development agencies that aimed to improve health in low- and middle-income countries from 1990 through 2019. Besides data from international databases such as the Organisation for Economic Co-operation and Development’s Credit Reporting System, we extracted and harmonized commitment and disbursement data from development project records, annual budgets, annual financial statements, and revenue statements from a broad set of development agencies, including multilateral and bilateral aid agencies, public-private partnerships, NGOs, and private foundations.
Furthermore, for several channels, correspondence directly with agencies led to improved understanding of the data or to the acquisition of more granular, more reliable, or more timely data. Some organizations were not able to report on disbursements for the previous year because agencies’ accounting processes can be lengthy. We therefore relied on budgets, revenues, commitments, and appropriations, as well as macroeconomic data to estimate disbursements for organizations without up-to-date spending information, and these were used to model the most recent year’s disbursements. This method led to the development of “preliminary estimates” of DAH by source, channel, and health focus area for 2019. We do not report DAH estimates by recipient for 2018 and 2019 because prelimi-nary estimates were not made by recipient.

152 | FINANCING GLOBAL HEALTH 2019
Global health agencies frequently transfer funds among themselves. Since these funding flows are often reported by both the entity from which funds originate and the recipient agency, double-counting is common in the data. Including disbursements from both agencies would lead to an overestima-tion of disbursements. To prevent double-counting, we used revenue data to assess the source of all funds and remove resources that were passed between development agencies before being disbursed. For our accounting, the source of the funds is where the funds originated, while the channel is the last channel that we track to disburse the resources. Because each data source provides different categories and different information about what focus areas were targeted by their disbursements, project-specific sector and theme codes and keyword searches of project titles and descriptions were used to classify funding. All DAH from the Joint United Nations Programme on HIV/AIDS (UNAIDS) was considered funding for HIV/AIDS and TB. Funding from the United Nations Children’s Fund (UNICEF) was classified as DAH for reproductive, maternal, newborn, and child health, HIV/AIDS, and Ebola. For projects that span two or more health focus areas, funding was divided according to weights based on the number of keywords associated with each health focus area. DAH estimates were converted into 2019 US dollars.
Domestic health spending and total health spending To estimate total health spending and health spending by source, we extracted and adjusted health spending data from the World Health Organization Global Health Expenditure Database. Extracted data included transfers from government domestic revenue (allocated to health purposes), social insurance contributions, compulsory prepayment, voluntary prepay-ment, other domestic revenue from households, corporations, and nonprofit institutions serving the household, and GDP. We extracted spending estimates in current local currency and converted them into 2019 United States dollars. We used a spatiotemporal Gaussian process regression model (ST-GPR) to estimate health spending across time, country, and spending category. Additionally, we developed a method to prioritize data from the Global Health Expenditure Database that had the most credible sources and with the best documentation for our ST-GPR modeling in order to prevent data with unclear sources or imputation methods from influencing our ST-GPR estimation. Our method evaluated and assigned a weight based on the information describing the source and methods used to estimate data points in the Global Health Expenditure Database. Weights were based upon metadata completeness, documented source information, and documented methods for estimation. While we included all available data in the ST-GPR model, data with the most reputable sources and most complete documentation influenced the model the most. We aggregated DAH measured in 2019 US dollars, government health spending, prepaid private health spending, and out-of-pocket health spending to estimate total health spending.

mETHODs | 153
Tuberculosis spendingTo estimate spending on tuberculosis, we extracted data from various sources including WHO Global Tuberculosis database, Global Fund (pro-posals, concept notes, and funding landscape documents), WHO National Health Accounts and sub-accounts, WHO Global Health Expenditure Database, 11 National Tuberculosis Reports, Ministry of Health Reports, GBD data, and unit cost data from WHO-Choosing Interventions that are Cost Effective (CHOICE). Estimates were generated for 135 low- and mid-dle-income countries. A spatiotemporal Gaussian process model was used to generate a complete time series of estimates from 2000 to 2017 for each country. We estimated tuberculosis spending by source (government, out-of-pocket, and prepaid private spending for tuberculosis and DAH) and by function (the National Tuberculosis Programme [NTP], outpatient care, inpatient care, and drugs other than those purchased by the NTP) for notified (officially reported) and non-notified tuberculosis cases separately.
Malaria spendingTo update our existing estimates of spending on malaria for the 106 malaria-endemic countries, we extracted data from various spending reports, surveys, literature, and databases. These included the Global Fund (including concept notes, proposals, and funding landscape documents), World Malaria Reports, WHO National Health Accounts and sub-accounts, the Global Fund Price Quality Reporting, WHO Global Price Reporting Mechanism, Management Sciences for Health reference prices, Global Affordable Medicine Facility, Health Action International database, treatment data provided by the Malaria Atlas Project, and Demographic and Health Surveys. Each domestic financing source – government, out-of-pocket, and prepaid private – relied on a different strategy to generate estimates. The estimates of government malaria spending extracted from the World Malaria Report and the Global Fund did not include government spending on outpatient and inpatient care for malaria. To ensure consistency with the extracted data from the national health accounts, we estimated government spending on malaria patient care. ST-GPR was used to estimate a complete and comparable time series of estimates. All spending estimates are reported in 2019 US dollars.
HIV/AIDS spending To update our previous estimates of spending on HIV/AIDS, we extracted an additional 2,444 data points. We utilized data from national health accounts, national AIDS spending assessments, Global Fund concept notes and proposals, and AIDS information online. All reported spending mea-sures were converted to 2019 US dollars to provide a more tangible estimate to national and international policymakers. We estimated a total of five HIV/AIDS financing source models (domestic, private, government, out-of-pocket, and prepaid private) and three HIV/AIDS domestic spending categories (care and treatment, prevention, and other). We used ST-GPR to model each HIV/AIDS financing source and spending category.

154 | FINANCING GLOBAL HEALTH 2019
Future health spendingOur forecasted estimates include gross domestic product (GDP), general government spending (across all sectors); government, out-of-pocket, and prepaid private health spending; and total DAH provided and received from 2018 to 2030 and 2050. We used ensemble models to estimate per person GDP, government spending, DAH, and government, out-of-pocket, and prepaid private health spending through 2050, our reference scenario. We then estimated two alternative future health spending scenarios – best and worse. These scenarios were based on historical growth rates in which best represented high observed growth rates (85th percentile) and worse repre-sented low growth rates (15th percentile) across the country-years of data.

155

TABuLATED DATA | 157
ANNEX 2
Tabulated dataTable b1 Total health spending by World Bank income group and GBD super-region, 2017 .............. 158
Table b2 Tuberculosis spending in 135 low- and middle-income countries, 2017 ...............................160
Table b3 Development assistance for health by source of funding, 1990–2019 ....................................168
Table b4 Development assistance for health by channel of assistance, 1990–2019 ..............................169
Table b5 Development assistance for health by recipient country, 1990–2017 ..................................... 170
Table b6 Development assistance for health by health focus area and program area, 1990–2019 ....... 174

158 | FINANCING GLOBAL HEALTH 2019
TABLe B1 Total health spending by World bank income group and gbD super-region, 2017
Health spending per person, 2017 and 2030
(uS dollars)
Health spending per person, 2017 and 2030
(purchasing power parity)
Total health spending per gross domestic product,
2017
Total government health spending per person on
HiV/AiDS, 2017
Total government health spending per person on
tuberculosis, 2017
Total government health spending per person on
malaria, 2017Population, 2017
2017 2030 2017 2030 2019 uSD
WorLD BANK iNCoMe grouP
High-income 5,307 (5,262 to 5,351)
6,596 (6,482 to 6,708)
5,307 (5,262 to 5,351)
6,596 (6,482 to 6,708)
12.2% (12.1 to 12.3) † † 0.54
(0.35 to 0.79) 1,197,804,774
Upper-middle-income 487 (457 to 520)
808 (740 to 885)
487 (457 to 520)
808 (740 to 885)
5.7% (5.3 to 6.1)
3.35 (2.39 to 4.75)
2.04 (1.87 to 2.23)
0.16 (0.15 to 0.19) 2,666,322,743
Lower-middle-income 84 (76 to 93)
127 (114 to 141)
84 (76 to 93)
127 (114 to 141)
3.9% (3.5 to 4.3)
1.31 (1.12 to 1.58)
1.35 (1.19 to 1.55)
0.75 (0.69 to 0.83) 3,014,059,058
Low-income 37 (36 to 39)
45 (42 to 48)
37 (36 to 39)
45 (42 to 48)
5.3% (5.0 to 5.7)
3.75 (3.54 to 4.04)
1.25 (1.2 to 1.31)
2.33 (2.23 to 2.46) 695,593,793
gBD SuPer-regioN
Central Europe, Eastern Europe, and Central Asia 538 (518 to 560)
700 (672 to 730)
538 (518 to 560)
700 (672 to 730)
5.9% (5.7 to 6.2)
2.28 (1.72 to 3.01)
9.91 (8.99 to 10.9)
0.1 (0.08 to 0.13) 416,805,122
Global Burden of Disease high-income 5,760 (5,707 to 5,808)
7,106 (6,973 to 7,229)
5,760 (5,707 to 5,808)
7,106 (6,973 to 7,229)
12.6% (12.5 to 12.8)
10.08 (7.37 to 13.9)
1.64 (1.13 to 2.38)
0.02 (0.01 to 0.03) 1,075,526,629
Latin America and Caribbean 589 (570 to 611)
704 (682 to 729)
589 (570 to 611)
704 (682 to 729)
7.4% (7.1 to 7.7)
5.85 (3.83 to 9.07)
0.92 (0.82 to 1.03)
0.34 (0.28 to 0.42) 572,249,527
North Africa and Middle East 353 (339 to 367)
426 (404 to 451)
353 (339 to 367)
426 (404 to 451)
5.3% (5.1 to 5.5)
0.92 (0.57 to 1.41)
0.61 (0.54 to 0.7)
0.31 (0.26 to 0.36) 590,600,305
South Asia 62 (51 to 77)
104 (85 to 130)
62 (51 to 77)
104 (85 to 130)
3.4% (2.8 to 4.2)
0.35 (0.25 to 0.48)
1.23 (0.98 to 1.57)
0.15 (0.13 to 0.18) 1,760,404,286
Southeast Asia, East Asia, and Oceania 365 (329 to 406)
730 (645 to 825)
365 (329 to 406)
730 (645 to 825)
4.9% (4.4 to 5.5)
1.06 (0.75 to 1.49)
0.89 (0.75 to 1.07)
0.18 (0.16 to 0.2) 2,134,242,852
Sub-Saharan Africa 81 (75 to 87)
92 (85 to 99)
81 (75 to 87)
92 (85 to 99)
5.2% (4.8 to 5.6)
7.48 (6.66 to 8.54)
1.98 (1.86 to 2.15)
3.21 (3.02 to 3.45) 1,023,951,648
†Estimates for HIV/AIDS and tuberculosis were generated for low- and middle-income countries primarily.

TABuLATED DATA | 159
Health spending per person, 2017 and 2030
(uS dollars)
Health spending per person, 2017 and 2030
(purchasing power parity)
Total health spending per gross domestic product,
2017
Total government health spending per person on
HiV/AiDS, 2017
Total government health spending per person on
tuberculosis, 2017
Total government health spending per person on
malaria, 2017Population, 2017
2017 2030 2017 2030 2019 uSD
WorLD BANK iNCoMe grouP
High-income 5,307 (5,262 to 5,351)
6,596 (6,482 to 6,708)
5,307 (5,262 to 5,351)
6,596 (6,482 to 6,708)
12.2% (12.1 to 12.3) † † 0.54
(0.35 to 0.79) 1,197,804,774
Upper-middle-income 487 (457 to 520)
808 (740 to 885)
487 (457 to 520)
808 (740 to 885)
5.7% (5.3 to 6.1)
3.35 (2.39 to 4.75)
2.04 (1.87 to 2.23)
0.16 (0.15 to 0.19) 2,666,322,743
Lower-middle-income 84 (76 to 93)
127 (114 to 141)
84 (76 to 93)
127 (114 to 141)
3.9% (3.5 to 4.3)
1.31 (1.12 to 1.58)
1.35 (1.19 to 1.55)
0.75 (0.69 to 0.83) 3,014,059,058
Low-income 37 (36 to 39)
45 (42 to 48)
37 (36 to 39)
45 (42 to 48)
5.3% (5.0 to 5.7)
3.75 (3.54 to 4.04)
1.25 (1.2 to 1.31)
2.33 (2.23 to 2.46) 695,593,793
gBD SuPer-regioN
Central Europe, Eastern Europe, and Central Asia 538 (518 to 560)
700 (672 to 730)
538 (518 to 560)
700 (672 to 730)
5.9% (5.7 to 6.2)
2.28 (1.72 to 3.01)
9.91 (8.99 to 10.9)
0.1 (0.08 to 0.13) 416,805,122
Global Burden of Disease high-income 5,760 (5,707 to 5,808)
7,106 (6,973 to 7,229)
5,760 (5,707 to 5,808)
7,106 (6,973 to 7,229)
12.6% (12.5 to 12.8)
10.08 (7.37 to 13.9)
1.64 (1.13 to 2.38)
0.02 (0.01 to 0.03) 1,075,526,629
Latin America and Caribbean 589 (570 to 611)
704 (682 to 729)
589 (570 to 611)
704 (682 to 729)
7.4% (7.1 to 7.7)
5.85 (3.83 to 9.07)
0.92 (0.82 to 1.03)
0.34 (0.28 to 0.42) 572,249,527
North Africa and Middle East 353 (339 to 367)
426 (404 to 451)
353 (339 to 367)
426 (404 to 451)
5.3% (5.1 to 5.5)
0.92 (0.57 to 1.41)
0.61 (0.54 to 0.7)
0.31 (0.26 to 0.36) 590,600,305
South Asia 62 (51 to 77)
104 (85 to 130)
62 (51 to 77)
104 (85 to 130)
3.4% (2.8 to 4.2)
0.35 (0.25 to 0.48)
1.23 (0.98 to 1.57)
0.15 (0.13 to 0.18) 1,760,404,286
Southeast Asia, East Asia, and Oceania 365 (329 to 406)
730 (645 to 825)
365 (329 to 406)
730 (645 to 825)
4.9% (4.4 to 5.5)
1.06 (0.75 to 1.49)
0.89 (0.75 to 1.07)
0.18 (0.16 to 0.2) 2,134,242,852
Sub-Saharan Africa 81 (75 to 87)
92 (85 to 99)
81 (75 to 87)
92 (85 to 99)
5.2% (4.8 to 5.6)
7.48 (6.66 to 8.54)
1.98 (1.86 to 2.15)
3.21 (3.02 to 3.45) 1,023,951,648

160 | FINANCING GLOBAL HEALTH 2019
TABLe B2 Tuberculosis spending in 135 low- and middle-income countries, 2017
Location Total spending on tuberculosis, millions
(uS dollars)
Total spending on tuberculosis per incident case, millions
(uS dollars)
Tuberculosis development assistance per total tuberculosis
spending (%)
Tuberculosis government health spending per total tuberculosis spending (%)
Tuberculosis out-of-pocket spending per total tuberculosis spending (%)
Total spending on tuberculosis 2000–2017 annual growth rate
135 low- and middle-income countries (LMICs) 10,941.9 (10,273.7 to 11,753.9) 1,075.8 (1,010.1 to 1,155.7) 15.8 (14.7 to 16.8) 63.5 (59.2 to 66.8) 18.7 (15.2 to 23.6) 3.9 (3.0 to 4.6)
China and India 2,931.6 (2,382.1 to 3,644.2) 778.5 (632.6 to 967.7) 3.9 (3.1 to 4.8) 59.0 (46.7 to 69.3) 34.3 (23.6 to 47.6) 2.8 (0.3 to 5.0)
28 other high-burden countries 4,714.9 (4,356.0 to 5,093.7) 1,003.4 (927.1 to 1,084.1) 15.4 (14.3 to 16.7) 66.6 (62.8 to 69.8) 15.7 (12.5 to 20.0) 4.1 (3.3 to 4.8)
Other LMICs 2,719.2 (2,586.4 to 2,861.8) 1,593.7 (1,515.9 to 1,677.3) 11.3 (10.7 to 11.8) 76.5 (74.9 to 78.0) 10.9 (9.7 to 12.2) 3.9 (3.5 to 4.4)
World Bank low-income countries 872.0 (833.9 to 913.3) 410.8 (392.9 to 430.3) 30.5 (29.1 to 31.8) 33.8 (31.7 to 35.8) 30.9 (28.5 to 33.7) 4.3 (3.9 to 4.8)
World Bank lower-middle-income countries 4,060.4 (3,595.6 to 4,684.1) 654.6 (579.7 to 755.2) 17.2 (14.8 to 19.3) 47.8 (40.7 to 53.9) 32.5 (25.0 to 42.0) 5.7 (4.6 to 6.9)
World Bank upper-middle-income countries 5,433.3 (4,977.0 to 5,952.6) 2,944.2 (2,697.0 to 3,225.6) 3.4 (3.1 to 3.7) 86.7 (83.0 to 89.6) 8.3 (5.5 to 12.1) 2.4 (1.1 to 3.5)
Central Europe, Eastern Europe, and Central Asia 3,370.8 (3,057.8 to 3,705.6) 13,954.7 (12,659.3 to 15,340.8) 3.1 (2.8 to 3.4) 88.6 (84.1 to 91.6) 7.8 (4.7 to 12.4) 4.8 (3.8 to 5.8)
Latin America and Caribbean 518.3 (458.9 to 581.8) 2,613.8 (2,314.4 to 2,934.2) 4.3 (3.8 to 4.9) 91.5 (89.7 to 92.9) 3.5 (2.4 to 5.1) 2.6 (1.6 to 3.7)
North Africa and Middle East 326.7 (289.5 to 372.6) 1,345.6 (1,192.5 to 1,534.8) 8.3 (7.2 to 9.3) 82.3 (79.1 to 85.2) 8.9 (6.6 to 11.8) 4.3 (3.1 to 5.5)
South Asia 2,166.7 (1,720.8 to 2,769.2) 615.8 (489.1 to 787.1) 10.6 (8.1 to 13.1) 44.1 (32.3 to 54.8) 42.8 (30.0 to 56.8) 6.3 (4.1 to 8.6)
Southeast Asia, East Asia, and Oceania 1,879.2 (1,580.0 to 2,257.2) 896.1 (753.5 to 1,076.4) 9.9 (8.2 to 11.7) 74.7 (66.9 to 81.0) 13.4 (8.0 to 21.0) 0.4 (-1.9 to 2.6)
Sub-Saharan Africa 2,031.5 (1,902.4 to 2,196.4) 525.9 (492.5 to 568.6) 28.8 (26.6 to 30.7) 39.0 (35.4 to 42.7) 26.9 (23.2 to 32.0) 4.0 (3.3 to 4.7)
Afghanistan 28.8 (25.0 to 35.0) 702.7 (609.9 to 854.0) 58.5 (47.7 to 66.9) 19.6 (14.6 to 24.8) 21.9 (11.0 to 36.2) 9.6 (6.3 to 12.9)
Albania 3.9 (2.8 to 5.5) 8,983.0 (6,476.1 to 12,564.2) 0.9 (0.6 to 1.3) 98.7 (98.1 to 99.2) 0.3 (0.1 to 0.7) 8.7 (5.4 to 11.8)
Algeria 32.5 (23.1 to 45.0) 2,164.6 (1,536.5 to 2,999.1) 0.0 (0.0 to 0.0) 99.8 (99.6 to 99.9) 0.2 (0.1 to 0.4) 7.2 (4.3 to 10.1)
American Samoa 0.1 (0.1 to 0.1) 8,940.0 (6,081.1 to 12,634.6) 0.0 (0.0 to 0.0) 98.6 (97.3 to 99.4) 1.3 (0.5 to 2.6) 6.4 (3.2 to 9.6)
Angola 95.7 (80.8 to 114.9) 944.1 (797.5 to 1,134.3) 9.4 (7.7 to 11.0) 60.0 (49.5 to 69.0) 25.6 (16.2 to 37.0) 9.4 (7.3 to 11.5)
Argentina 72.6 (50.3 to 105.8) 7,206.6 (4,991.7 to 10,495.4) 0.0 (0.0 to 0.0) 99.8 (99.7 to 99.9) 0.1 (0.0 to 0.2) 3.4 (0.4 to 6.4)
Armenia 10.0 (8.2 to 11.9) 8,917.4 (7,297.9 to 10,663.7) 20.1 (16.6 to 24.3) 76.2 (70.5 to 80.6) 3.7 (1.6 to 7.3) 9.6 (7.6 to 11.7)
Azerbaijan 36.5 (28.4 to 47.5) 3,187.1 (2,478.4 to 4,144.0) 20.5 (15.5 to 25.9) 46.8 (34.0 to 58.2) 32.5 (18.4 to 49.6) 10.9 (8.1 to 13.9)
Bangladesh 89.2 (76.6 to 106.0) 460.4 (395.7 to 547.3) 53.9 (45.1 to 62.3) 25.2 (19.2 to 32.2) 20.5 (10.9 to 32.4) 6.7 (4.2 to 9.3)
Belarus 107.5 (86.8 to 131.2) 29,128.9 (23,527.5 to 35,553.9) 2.9 (2.4 to 3.6) 97.0 (96.3 to 97.6) 0.1 (0.0 to 0.1) 2.8 (1.1 to 4.5)
Belize 0.3 (0.3 to 0.4) 2,265.5 (1,933.3 to 2,701.1) 52.6 (43.8 to 61.1) 43.7 (34.5 to 53.0) 3.4 (1.5 to 6.5) 7.4 (5.0 to 9.6)
Benin 12.9 (9.9 to 16.9) 594.0 (459.3 to 778.7) 25.9 (19.5 to 33.0) 27.3 (19.3 to 36.1) 46.4 (33.3 to 60.0) 3.6 (1.2 to 6.2)
Bhutan 2.4 (1.9 to 3.1) 2,304.5 (1,779.9 to 2,911.1) 25.5 (19.8 to 32.4) 74.2 (67.2 to 79.9) 0.3 (0.1 to 0.6) 5.5 (2.9 to 8.1)
Bolivia 20.1 (16.2 to 25.0) 2,084.3 (1,683.4 to 2,601.0) 29.6 (23.4 to 36.2) 56.0 (46.0 to 66.1) 13.5 (6.4 to 23.3) 2.7 (0.7 to 4.5)
Bosnia and Herzegovina 13.2 (9.3 to 17.8) 11,040.1 (7,794.3 to 14,910.6) 0.1 (0.1 to 0.2) 99.1 (98.3 to 99.6) 0.8 (0.3 to 1.6) 6.3 (3.4 to 9.4)
Botswana 72.4 (62.7 to 83.6) 4,552.3 (3,945.6 to 5,259.7) 6.9 (6.0 to 7.9) 76.2 (72.3 to 79.8) 3.3 (2.3 to 4.5) 5.4 (4.3 to 6.6)
Brazil 95.9 (66.6 to 136.4) 1,166.9 (811.0 to 1,660.4) 0.1 (0.0 to 0.1) 91.5 (83.8 to 96.3) 7.2 (2.8 to 14.2) 0.7 (-2.4 to 3.7)
Bulgaria 22.0 (15.9 to 30.2) 14,713.2 (10,631.2 to 20,131.2) 6.6 (4.7 to 8.9) 91.9 (88.6 to 94.4) 1.5 (0.6 to 3.0) 0.2 (-2.2 to 2.8)
Burkina Faso 18.9 (14.4 to 25.1) 361.1 (275.5 to 479.4) 15.3 (11.3 to 19.6) 31.7 (22.2 to 42.1) 42.0 (27.6 to 56.1) 3.7 (1.7 to 5.6)
Burundi 28.8 (27.0 to 30.8) 434.9 (407.0 to 465.4) 32.9 (30.7 to 35.1) 23.2 (20.7 to 26.0) 32.8 (28.8 to 36.9) 3.8 (3.1 to 4.5)
Côte d'Ivoire 26.4 (20.9 to 34.6) 418.3 (332.1 to 548.3) 28.4 (21.3 to 35.2) 36.1 (25.8 to 46.8) 30.8 (16.5 to 46.7) -0.6 (-3.3 to 2.0)
Cambodia 43.0 (38.4 to 48.4) 1,102.7 (986.7 to 1,241.0) 28.9 (25.6 to 32.2) 67.8 (63.8 to 71.4) 3.3 (1.3 to 6.3) 3.8 (2.8 to 4.8)
Cameroon 39.6 (24.9 to 61.3) 559.3 (351.4 to 864.8) 9.3 (5.7 to 14.1) 13.9 (7.6 to 21.4) 72.3 (58.6 to 83.6) 3.6 (-0.3 to 7.5)
Cape Verde 1.2 (1.0 to 1.4) 1,652.0 (1,396.4 to 1,951.6) 41.5 (34.9 to 48.8) 44.5 (35.7 to 54.0) 13.0 (6.5 to 22.5) 5.2 (3.2 to 7.3)
Central African Republic 12.7 (11.9 to 13.7) 366.0 (343.6 to 394.7) 65.2 (60.4 to 69.4) 12.9 (11.0 to 14.8) 21.3 (16.4 to 27.0) 4.5 (3.2 to 5.7)
Chad 23.4 (18.5 to 29.8) 544.0 (429.4 to 693.4) 8.7 (6.7 to 10.8) 32.1 (24.5 to 41.0) 57.2 (46.0 to 66.9) 2.6 (0.6 to 4.5)
China 1,059.7 (775.3 to 1,433.2) 1,233.9 (902.8 to 1,668.8) 0.6 (0.5 to 0.8) 79.3 (65.6 to 89.5) 17.0 (7.7 to 30.9) -1.3 (-4.4 to 1.9)
Colombia 76.4 (53.8 to 107.1) 6,649.7 (4,680.4 to 9,328.4) 0.4 (0.3 to 0.5) 97.1 (94.7 to 98.6) 1.5 (0.6 to 3.3) 1.5 (-1.3 to 4.3)
Comoros 1.0 (0.7 to 1.4) 594.1 (430.5 to 861.7) 37.0 (24.8 to 49.6) 6.5 (4.0 to 9.9) 54.5 (39.0 to 69.8) 3.9 (-0.1 to 7.7)
Congo 9.5 (7.8 to 11.5) 474.8 (390.3 to 578.6) 26.9 (21.9 to 32.4) 45.3 (35.6 to 55.1) 26.6 (15.6 to 39.1) 4.9 (2.8 to 7.1)
Costa Rica 10.5 (7.1 to 14.6) 23,078.6 (15,649.6 to 32,005.4) 0.0 (0.0 to 0.0) 99.8 (99.7 to 99.9) 0.2 (0.1 to 0.3) 10.1 (6.8 to 13.6)

TABuLATED DATA | 161
Location Total spending on tuberculosis, millions
(uS dollars)
Total spending on tuberculosis per incident case, millions
(uS dollars)
Tuberculosis development assistance per total tuberculosis
spending (%)
Tuberculosis government health spending per total tuberculosis spending (%)
Tuberculosis out-of-pocket spending per total tuberculosis spending (%)
Total spending on tuberculosis 2000–2017 annual growth rate
135 low- and middle-income countries (LMICs) 10,941.9 (10,273.7 to 11,753.9) 1,075.8 (1,010.1 to 1,155.7) 15.8 (14.7 to 16.8) 63.5 (59.2 to 66.8) 18.7 (15.2 to 23.6) 3.9 (3.0 to 4.6)
China and India 2,931.6 (2,382.1 to 3,644.2) 778.5 (632.6 to 967.7) 3.9 (3.1 to 4.8) 59.0 (46.7 to 69.3) 34.3 (23.6 to 47.6) 2.8 (0.3 to 5.0)
28 other high-burden countries 4,714.9 (4,356.0 to 5,093.7) 1,003.4 (927.1 to 1,084.1) 15.4 (14.3 to 16.7) 66.6 (62.8 to 69.8) 15.7 (12.5 to 20.0) 4.1 (3.3 to 4.8)
Other LMICs 2,719.2 (2,586.4 to 2,861.8) 1,593.7 (1,515.9 to 1,677.3) 11.3 (10.7 to 11.8) 76.5 (74.9 to 78.0) 10.9 (9.7 to 12.2) 3.9 (3.5 to 4.4)
World Bank low-income countries 872.0 (833.9 to 913.3) 410.8 (392.9 to 430.3) 30.5 (29.1 to 31.8) 33.8 (31.7 to 35.8) 30.9 (28.5 to 33.7) 4.3 (3.9 to 4.8)
World Bank lower-middle-income countries 4,060.4 (3,595.6 to 4,684.1) 654.6 (579.7 to 755.2) 17.2 (14.8 to 19.3) 47.8 (40.7 to 53.9) 32.5 (25.0 to 42.0) 5.7 (4.6 to 6.9)
World Bank upper-middle-income countries 5,433.3 (4,977.0 to 5,952.6) 2,944.2 (2,697.0 to 3,225.6) 3.4 (3.1 to 3.7) 86.7 (83.0 to 89.6) 8.3 (5.5 to 12.1) 2.4 (1.1 to 3.5)
Central Europe, Eastern Europe, and Central Asia 3,370.8 (3,057.8 to 3,705.6) 13,954.7 (12,659.3 to 15,340.8) 3.1 (2.8 to 3.4) 88.6 (84.1 to 91.6) 7.8 (4.7 to 12.4) 4.8 (3.8 to 5.8)
Latin America and Caribbean 518.3 (458.9 to 581.8) 2,613.8 (2,314.4 to 2,934.2) 4.3 (3.8 to 4.9) 91.5 (89.7 to 92.9) 3.5 (2.4 to 5.1) 2.6 (1.6 to 3.7)
North Africa and Middle East 326.7 (289.5 to 372.6) 1,345.6 (1,192.5 to 1,534.8) 8.3 (7.2 to 9.3) 82.3 (79.1 to 85.2) 8.9 (6.6 to 11.8) 4.3 (3.1 to 5.5)
South Asia 2,166.7 (1,720.8 to 2,769.2) 615.8 (489.1 to 787.1) 10.6 (8.1 to 13.1) 44.1 (32.3 to 54.8) 42.8 (30.0 to 56.8) 6.3 (4.1 to 8.6)
Southeast Asia, East Asia, and Oceania 1,879.2 (1,580.0 to 2,257.2) 896.1 (753.5 to 1,076.4) 9.9 (8.2 to 11.7) 74.7 (66.9 to 81.0) 13.4 (8.0 to 21.0) 0.4 (-1.9 to 2.6)
Sub-Saharan Africa 2,031.5 (1,902.4 to 2,196.4) 525.9 (492.5 to 568.6) 28.8 (26.6 to 30.7) 39.0 (35.4 to 42.7) 26.9 (23.2 to 32.0) 4.0 (3.3 to 4.7)
Afghanistan 28.8 (25.0 to 35.0) 702.7 (609.9 to 854.0) 58.5 (47.7 to 66.9) 19.6 (14.6 to 24.8) 21.9 (11.0 to 36.2) 9.6 (6.3 to 12.9)
Albania 3.9 (2.8 to 5.5) 8,983.0 (6,476.1 to 12,564.2) 0.9 (0.6 to 1.3) 98.7 (98.1 to 99.2) 0.3 (0.1 to 0.7) 8.7 (5.4 to 11.8)
Algeria 32.5 (23.1 to 45.0) 2,164.6 (1,536.5 to 2,999.1) 0.0 (0.0 to 0.0) 99.8 (99.6 to 99.9) 0.2 (0.1 to 0.4) 7.2 (4.3 to 10.1)
American Samoa 0.1 (0.1 to 0.1) 8,940.0 (6,081.1 to 12,634.6) 0.0 (0.0 to 0.0) 98.6 (97.3 to 99.4) 1.3 (0.5 to 2.6) 6.4 (3.2 to 9.6)
Angola 95.7 (80.8 to 114.9) 944.1 (797.5 to 1,134.3) 9.4 (7.7 to 11.0) 60.0 (49.5 to 69.0) 25.6 (16.2 to 37.0) 9.4 (7.3 to 11.5)
Argentina 72.6 (50.3 to 105.8) 7,206.6 (4,991.7 to 10,495.4) 0.0 (0.0 to 0.0) 99.8 (99.7 to 99.9) 0.1 (0.0 to 0.2) 3.4 (0.4 to 6.4)
Armenia 10.0 (8.2 to 11.9) 8,917.4 (7,297.9 to 10,663.7) 20.1 (16.6 to 24.3) 76.2 (70.5 to 80.6) 3.7 (1.6 to 7.3) 9.6 (7.6 to 11.7)
Azerbaijan 36.5 (28.4 to 47.5) 3,187.1 (2,478.4 to 4,144.0) 20.5 (15.5 to 25.9) 46.8 (34.0 to 58.2) 32.5 (18.4 to 49.6) 10.9 (8.1 to 13.9)
Bangladesh 89.2 (76.6 to 106.0) 460.4 (395.7 to 547.3) 53.9 (45.1 to 62.3) 25.2 (19.2 to 32.2) 20.5 (10.9 to 32.4) 6.7 (4.2 to 9.3)
Belarus 107.5 (86.8 to 131.2) 29,128.9 (23,527.5 to 35,553.9) 2.9 (2.4 to 3.6) 97.0 (96.3 to 97.6) 0.1 (0.0 to 0.1) 2.8 (1.1 to 4.5)
Belize 0.3 (0.3 to 0.4) 2,265.5 (1,933.3 to 2,701.1) 52.6 (43.8 to 61.1) 43.7 (34.5 to 53.0) 3.4 (1.5 to 6.5) 7.4 (5.0 to 9.6)
Benin 12.9 (9.9 to 16.9) 594.0 (459.3 to 778.7) 25.9 (19.5 to 33.0) 27.3 (19.3 to 36.1) 46.4 (33.3 to 60.0) 3.6 (1.2 to 6.2)
Bhutan 2.4 (1.9 to 3.1) 2,304.5 (1,779.9 to 2,911.1) 25.5 (19.8 to 32.4) 74.2 (67.2 to 79.9) 0.3 (0.1 to 0.6) 5.5 (2.9 to 8.1)
Bolivia 20.1 (16.2 to 25.0) 2,084.3 (1,683.4 to 2,601.0) 29.6 (23.4 to 36.2) 56.0 (46.0 to 66.1) 13.5 (6.4 to 23.3) 2.7 (0.7 to 4.5)
Bosnia and Herzegovina 13.2 (9.3 to 17.8) 11,040.1 (7,794.3 to 14,910.6) 0.1 (0.1 to 0.2) 99.1 (98.3 to 99.6) 0.8 (0.3 to 1.6) 6.3 (3.4 to 9.4)
Botswana 72.4 (62.7 to 83.6) 4,552.3 (3,945.6 to 5,259.7) 6.9 (6.0 to 7.9) 76.2 (72.3 to 79.8) 3.3 (2.3 to 4.5) 5.4 (4.3 to 6.6)
Brazil 95.9 (66.6 to 136.4) 1,166.9 (811.0 to 1,660.4) 0.1 (0.0 to 0.1) 91.5 (83.8 to 96.3) 7.2 (2.8 to 14.2) 0.7 (-2.4 to 3.7)
Bulgaria 22.0 (15.9 to 30.2) 14,713.2 (10,631.2 to 20,131.2) 6.6 (4.7 to 8.9) 91.9 (88.6 to 94.4) 1.5 (0.6 to 3.0) 0.2 (-2.2 to 2.8)
Burkina Faso 18.9 (14.4 to 25.1) 361.1 (275.5 to 479.4) 15.3 (11.3 to 19.6) 31.7 (22.2 to 42.1) 42.0 (27.6 to 56.1) 3.7 (1.7 to 5.6)
Burundi 28.8 (27.0 to 30.8) 434.9 (407.0 to 465.4) 32.9 (30.7 to 35.1) 23.2 (20.7 to 26.0) 32.8 (28.8 to 36.9) 3.8 (3.1 to 4.5)
Côte d'Ivoire 26.4 (20.9 to 34.6) 418.3 (332.1 to 548.3) 28.4 (21.3 to 35.2) 36.1 (25.8 to 46.8) 30.8 (16.5 to 46.7) -0.6 (-3.3 to 2.0)
Cambodia 43.0 (38.4 to 48.4) 1,102.7 (986.7 to 1,241.0) 28.9 (25.6 to 32.2) 67.8 (63.8 to 71.4) 3.3 (1.3 to 6.3) 3.8 (2.8 to 4.8)
Cameroon 39.6 (24.9 to 61.3) 559.3 (351.4 to 864.8) 9.3 (5.7 to 14.1) 13.9 (7.6 to 21.4) 72.3 (58.6 to 83.6) 3.6 (-0.3 to 7.5)
Cape Verde 1.2 (1.0 to 1.4) 1,652.0 (1,396.4 to 1,951.6) 41.5 (34.9 to 48.8) 44.5 (35.7 to 54.0) 13.0 (6.5 to 22.5) 5.2 (3.2 to 7.3)
Central African Republic 12.7 (11.9 to 13.7) 366.0 (343.6 to 394.7) 65.2 (60.4 to 69.4) 12.9 (11.0 to 14.8) 21.3 (16.4 to 27.0) 4.5 (3.2 to 5.7)
Chad 23.4 (18.5 to 29.8) 544.0 (429.4 to 693.4) 8.7 (6.7 to 10.8) 32.1 (24.5 to 41.0) 57.2 (46.0 to 66.9) 2.6 (0.6 to 4.5)
China 1,059.7 (775.3 to 1,433.2) 1,233.9 (902.8 to 1,668.8) 0.6 (0.5 to 0.8) 79.3 (65.6 to 89.5) 17.0 (7.7 to 30.9) -1.3 (-4.4 to 1.9)
Colombia 76.4 (53.8 to 107.1) 6,649.7 (4,680.4 to 9,328.4) 0.4 (0.3 to 0.5) 97.1 (94.7 to 98.6) 1.5 (0.6 to 3.3) 1.5 (-1.3 to 4.3)
Comoros 1.0 (0.7 to 1.4) 594.1 (430.5 to 861.7) 37.0 (24.8 to 49.6) 6.5 (4.0 to 9.9) 54.5 (39.0 to 69.8) 3.9 (-0.1 to 7.7)
Congo 9.5 (7.8 to 11.5) 474.8 (390.3 to 578.6) 26.9 (21.9 to 32.4) 45.3 (35.6 to 55.1) 26.6 (15.6 to 39.1) 4.9 (2.8 to 7.1)
Costa Rica 10.5 (7.1 to 14.6) 23,078.6 (15,649.6 to 32,005.4) 0.0 (0.0 to 0.0) 99.8 (99.7 to 99.9) 0.2 (0.1 to 0.3) 10.1 (6.8 to 13.6)

162 | FINANCING GLOBAL HEALTH 2019
Location Total spending on tuberculosis, millions
(uS dollars)
Total spending on tuberculosis per incident case, millions
(uS dollars)
Tuberculosis development assistance per total tuberculosis
spending (%)
Tuberculosis government health spending per total tuberculosis spending (%)
Tuberculosis out-of-pocket spending per total tuberculosis spending (%)
Total spending on tuberculosis 2000–2017 annual growth rate
Cuba 28.2 (19.8 to 40.2) 36,718.7 (25,746.7 to 52,303.0) 0.0 (0.0 to 0.0) 99.7 (99.5 to 99.9) 0.2 (0.1 to 0.5) 6.1 (3.0 to 9.3)
Democratic Republic of the Congo 69.5 (56.1 to 86.0) 177.3 (143.1 to 219.5) 30.5 (24.3 to 37.3) 12.7 (8.4 to 17.6) 52.5 (41.9 to 62.2) 3.0 (1.3 to 4.8)
Djibouti 3.4 (3.0 to 3.9) 834.3 (727.6 to 962.6) 54.2 (46.8 to 61.9) 33.7 (25.5 to 42.4) 11.8 (6.5 to 18.8) 6.6 (4.9 to 8.3)
Dominica 0.1 (0.1 to 0.2) 5,346.9 (4,118.1 to 7,159.2) 18.6 (13.7 to 23.7) 76.8 (69.4 to 82.9) 4.4 (1.9 to 8.8) 1.4 (-1.1 to 4.2)
Dominican Republic 23.2 (17.0 to 31.7) 3,735.1 (2,742.4 to 5,104.9) 5.7 (4.1 to 7.6) 91.8 (88.5 to 94.5) 1.9 (0.8 to 3.8) 6.5 (3.8 to 9.3)
Ecuador 15.5 (11.0 to 22.0) 2,773.6 (1,964.1 to 3,930.3) 0.1 (0.0 to 0.1) 95.3 (90.8 to 98.1) 4.1 (1.5 to 8.8) 2.1 (-0.8 to 4.8)
Egypt 20.1 (14.6 to 27.0) 1,079.8 (784.2 to 1,450.8) 0.2 (0.2 to 0.3) 80.4 (65.3 to 90.1) 17.4 (8.0 to 31.7) 3.9 (1.2 to 6.6)
El Salvador 7.9 (6.5 to 9.8) 4,556.8 (3,740.0 to 5,626.1) 40.6 (32.5 to 48.9) 58.7 (50.3 to 66.8) 0.7 (0.3 to 1.4) 7.7 (5.4 to 10.1)
Equatorial Guinea 11.2 (7.9 to 16.0) 2,371.4 (1,666.9 to 3,406.3) 0.2 (0.1 to 0.2) 43.2 (28.2 to 59.4) 55.8 (39.4 to 71.1) 8.4 (4.5 to 12.0)
Eritrea 13.1 (11.1 to 15.2) 450.5 (382.8 to 523.4) 9.5 (8.2 to 11.1) 10.4 (7.1 to 14.7) 76.9 (71.5 to 81.1) 1.7 (0.3 to 3.2)
Eswatini 18.5 (17.0 to 20.4) 1,692.0 (1,556.5 to 1,861.6) 41.7 (37.8 to 45.2) 22.7 (17.6 to 29.2) 27.4 (23.7 to 31.0) 14.5 (12.2 to 16.6)
Ethiopia 126.5 (107.7 to 151.6) 550.7 (468.5 to 659.7) 23.6 (19.5 to 27.5) 41.5 (33.9 to 49.5) 24.0 (14.8 to 35.9) 2.5 (1.3 to 3.8)
Federated States of Micronesia 0.0 (0.0 to 0.0) 320.6 (272.0 to 380.1) 53.4 (44.6 to 62.4) 45.9 (36.8 to 55.0) 0.8 (0.3 to 1.6) 5.4 (2.9 to 7.8)
Fiji 3.9 (3.1 to 4.9) 11,592.0 (9,155.1 to 14,586.8) 18.4 (14.5 to 23.0) 81.4 (76.8 to 85.4) 0.1 (0.0 to 0.2) 5.5 (3.3 to 7.7)
Gabon 4.1 (3.0 to 5.4) 707.5 (522.6 to 928.5) 6.4 (4.7 to 8.4) 84.8 (77.1 to 90.0) 6.3 (2.7 to 12.9) -1.9 (-4.2 to 0.5)
Gambia 6.1 (5.9 to 6.5) 1,057.0 (1,012.2 to 1,114.7) 73.7 (69.8 to 76.9) 16.5 (14.2 to 18.9) 7.9 (4.6 to 12.2) 9.0 (7.9 to 10.0)
Georgia 22.9 (17.7 to 29.4) 8,417.5 (6,521.1 to 10,785.9) 24.7 (19.0 to 31.4) 71.7 (64.4 to 78.6) 3.1 (1.4 to 6.2) 5.7 (3.2 to 8.3)
Ghana 31.3 (25.0 to 40.9) 369.0 (295.2 to 481.7) 37.7 (28.4 to 46.4) 24.6 (16.8 to 32.6) 34.3 (21.0 to 50.0) 7.1 (3.5 to 10.7)
Grenada 0.1 (0.1 to 0.2) 9,505.0 (7,266.6 to 12,327.9) 18.2 (13.8 to 23.4) 76.8 (69.5 to 82.6) 4.8 (2.0 to 9.4) -3.2 (-5.5 to -0.6)
Guatemala 8.1 (5.8 to 11.0) 2,341.4 (1,665.2 to 3,157.0) 4.8 (3.5 to 6.6) 87.2 (79.7 to 92.3) 7.4 (3.1 to 14.8) 1.3 (-1.4 to 4.1)
Guinea 9.0 (7.1 to 12.0) 277.0 (218.7 to 367.8) 36.8 (27.2 to 45.8) 17.5 (11.7 to 23.9) 40.5 (25.6 to 56.2) 3.8 (0.8 to 7.0)
Guinea-Bissau 5.2 (4.6 to 6.2) 1,080.8 (946.5 to 1,280.7) 54.4 (45.6 to 61.7) 20.9 (16.8 to 24.9) 23.7 (14.4 to 35.6) 7.1 (4.9 to 9.4)
Guyana 1.0 (0.8 to 1.3) 2,186.0 (1,683.6 to 2,840.8) 24.8 (18.7 to 31.6) 74.8 (68.0 to 81.0) 0.4 (0.2 to 0.8) 5.6 (2.4 to 8.7)
Haiti 1.7 (1.3 to 2.2) 182.7 (141.9 to 234.0) 11.9 (9.1 to 15.1) 86.6 (82.8 to 89.8) 1.5 (0.6 to 2.9) 4.6 (2.2 to 7.0)
Honduras 6.2 (5.0 to 7.8) 1,903.1 (1,520.2 to 2,374.3) 33.2 (26.3 to 41.1) 61.6 (52.1 to 69.8) 4.9 (2.0 to 9.6) 3.4 (1.3 to 5.6)
India 1,871.8 (1,421.4 to 2,478.9) 644.0 (489.0 to 852.8) 5.9 (4.3 to 7.6) 47.7 (33.7 to 61.2) 43.8 (28.9 to 59.6) 7.9 (4.9 to 11.0)
Indonesia 181.3 (145.3 to 226.3) 322.9 (258.7 to 403.1) 26.4 (20.9 to 32.5) 56.8 (45.8 to 66.9) 14.5 (6.4 to 26.8) 2.6 (0.3 to 4.8)
Iran 75.9 (52.8 to 108.2) 5,861.4 (4,079.0 to 8,350.8) 0.0 (0.0 to 0.0) 99.4 (98.7 to 99.7) 0.6 (0.2 to 1.3) 9.2 (6.1 to 12.2)
Iraq 32.2 (24.7 to 42.8) 1,934.3 (1,482.4 to 2,574.7) 7.8 (5.8 to 10.0) 78.0 (67.0 to 86.0) 14.1 (6.6 to 25.7) 7.0 (4.1 to 9.7)
Jamaica 4.8 (3.4 to 6.4) 10,013.5 (7,209.9 to 13,421.2) 0.0 (0.0 to 0.0) 86.9 (78.2 to 93.0) 9.3 (4.0 to 17.7) -1.0 (-3.5 to 1.6)
Jordan 3.6 (2.7 to 4.6) 3,309.3 (2,482.2 to 4,317.4) 16.4 (12.3 to 21.5) 65.8 (53.7 to 75.6) 14.2 (6.3 to 26.4) 0.6 (-1.8 to 3.2)
Kazakhstan 364.7 (293.2 to 451.0) 26,277.7 (21,124.6 to 32,499.7) 2.5 (2.0 to 3.1) 97.1 (96.3 to 97.7) 0.1 (0.0 to 0.1) 4.1 (2.6 to 5.7)
Kenya 80.8 (69.5 to 95.6) 439.4 (378.2 to 520.1) 44.1 (37.0 to 50.9) 33.5 (25.9 to 41.3) 14.7 (7.5 to 25.1) 5.5 (2.8 to 8.0)
Kiribati 1.0 (0.8 to 1.2) 3,129.0 (2,580.7 to 3,750.4) 30.6 (25.3 to 36.8) 69.2 (63.0 to 74.6) 0.2 (0.1 to 0.3) 4.1 (2.3 to 6.0)
Kyrgyzstan 51.5 (46.2 to 57.2) 7,255.9 (6,512.9 to 8,062.4) 22.3 (20.0 to 24.7) 67.4 (62.2 to 71.5) 10.3 (6.4 to 15.9) 8.1 (7.0 to 9.3)
Laos 6.7 (5.5 to 8.2) 677.3 (553.8 to 826.9) 25.8 (20.9 to 31.3) 59.5 (50.4 to 67.9) 13.7 (6.8 to 23.9) 2.7 (0.6 to 4.7)
Lebanon 7.8 (5.7 to 10.4) 4,767.7 (3,502.4 to 6,398.0) 7.6 (5.5 to 10.0) 79.9 (70.3 to 86.9) 8.9 (3.9 to 17.4) -0.1 (-2.8 to 2.6)
Lesotho 23.5 (22.3 to 24.8) 900.7 (855.4 to 949.7) 70.1 (66.4 to 73.7) 12.2 (9.0 to 15.7) 17.7 (14.7 to 21.0) 12.8 (11.1 to 14.4)
Liberia 2.9 (2.3 to 3.7) 258.2 (206.2 to 333.4) 33.1 (25.2 to 40.8) 33.1 (23.6 to 43.3) 30.9 (16.9 to 46.6) 5.0 (2.3 to 7.7)
Libya 8.4 (5.9 to 11.7) 4,357.4 (3,044.3 to 6,073.7) 0.0 (0.0 to 0.0) 99.2 (98.4 to 99.6) 0.6 (0.2 to 1.3) 0.4 (-2.5 to 3.4)
Macedonia 2.0 (1.5 to 2.7) 3,555.7 (2,593.7 to 4,803.2) 4.1 (2.9 to 5.4) 83.2 (72.9 to 89.9) 11.6 (5.2 to 21.7) -0.8 (-3.3 to 1.8)
Madagascar 7.0 (5.6 to 8.9) 142.4 (112.8 to 181.1) 17.4 (13.5 to 21.6) 44.3 (32.7 to 56.4) 25.7 (14.2 to 40.0) 3.3 (1.0 to 5.7)
Malawi 28.6 (26.7 to 30.7) 302.6 (283.1 to 325.1) 65.2 (60.6 to 69.6) 9.1 (6.4 to 12.5) 24.2 (19.8 to 28.8) 6.8 (6.2 to 7.5)
Malaysia 88.5 (64.0 to 118.5) 4,790.6 (3,463.6 to 6,414.0) 0.0 (0.0 to 0.0) 98.9 (97.8 to 99.5) 0.9 (0.4 to 1.9) 7.8 (5.1 to 10.7)
Maldives 1.3 (0.9 to 1.8) 6,871.2 (4,726.5 to 9,655.6) 0.0 (0.0 to 0.0) 98.2 (96.6 to 99.3) 1.3 (0.5 to 2.8) 5.5 (2.6 to 8.4)
TABLe B2, CoNT. Tuberculosis spending in 135 low- and middle-income countries, 2017

TABuLATED DATA | 163
Location Total spending on tuberculosis, millions
(uS dollars)
Total spending on tuberculosis per incident case, millions
(uS dollars)
Tuberculosis development assistance per total tuberculosis
spending (%)
Tuberculosis government health spending per total tuberculosis spending (%)
Tuberculosis out-of-pocket spending per total tuberculosis spending (%)
Total spending on tuberculosis 2000–2017 annual growth rate
Cuba 28.2 (19.8 to 40.2) 36,718.7 (25,746.7 to 52,303.0) 0.0 (0.0 to 0.0) 99.7 (99.5 to 99.9) 0.2 (0.1 to 0.5) 6.1 (3.0 to 9.3)
Democratic Republic of the Congo 69.5 (56.1 to 86.0) 177.3 (143.1 to 219.5) 30.5 (24.3 to 37.3) 12.7 (8.4 to 17.6) 52.5 (41.9 to 62.2) 3.0 (1.3 to 4.8)
Djibouti 3.4 (3.0 to 3.9) 834.3 (727.6 to 962.6) 54.2 (46.8 to 61.9) 33.7 (25.5 to 42.4) 11.8 (6.5 to 18.8) 6.6 (4.9 to 8.3)
Dominica 0.1 (0.1 to 0.2) 5,346.9 (4,118.1 to 7,159.2) 18.6 (13.7 to 23.7) 76.8 (69.4 to 82.9) 4.4 (1.9 to 8.8) 1.4 (-1.1 to 4.2)
Dominican Republic 23.2 (17.0 to 31.7) 3,735.1 (2,742.4 to 5,104.9) 5.7 (4.1 to 7.6) 91.8 (88.5 to 94.5) 1.9 (0.8 to 3.8) 6.5 (3.8 to 9.3)
Ecuador 15.5 (11.0 to 22.0) 2,773.6 (1,964.1 to 3,930.3) 0.1 (0.0 to 0.1) 95.3 (90.8 to 98.1) 4.1 (1.5 to 8.8) 2.1 (-0.8 to 4.8)
Egypt 20.1 (14.6 to 27.0) 1,079.8 (784.2 to 1,450.8) 0.2 (0.2 to 0.3) 80.4 (65.3 to 90.1) 17.4 (8.0 to 31.7) 3.9 (1.2 to 6.6)
El Salvador 7.9 (6.5 to 9.8) 4,556.8 (3,740.0 to 5,626.1) 40.6 (32.5 to 48.9) 58.7 (50.3 to 66.8) 0.7 (0.3 to 1.4) 7.7 (5.4 to 10.1)
Equatorial Guinea 11.2 (7.9 to 16.0) 2,371.4 (1,666.9 to 3,406.3) 0.2 (0.1 to 0.2) 43.2 (28.2 to 59.4) 55.8 (39.4 to 71.1) 8.4 (4.5 to 12.0)
Eritrea 13.1 (11.1 to 15.2) 450.5 (382.8 to 523.4) 9.5 (8.2 to 11.1) 10.4 (7.1 to 14.7) 76.9 (71.5 to 81.1) 1.7 (0.3 to 3.2)
Eswatini 18.5 (17.0 to 20.4) 1,692.0 (1,556.5 to 1,861.6) 41.7 (37.8 to 45.2) 22.7 (17.6 to 29.2) 27.4 (23.7 to 31.0) 14.5 (12.2 to 16.6)
Ethiopia 126.5 (107.7 to 151.6) 550.7 (468.5 to 659.7) 23.6 (19.5 to 27.5) 41.5 (33.9 to 49.5) 24.0 (14.8 to 35.9) 2.5 (1.3 to 3.8)
Federated States of Micronesia 0.0 (0.0 to 0.0) 320.6 (272.0 to 380.1) 53.4 (44.6 to 62.4) 45.9 (36.8 to 55.0) 0.8 (0.3 to 1.6) 5.4 (2.9 to 7.8)
Fiji 3.9 (3.1 to 4.9) 11,592.0 (9,155.1 to 14,586.8) 18.4 (14.5 to 23.0) 81.4 (76.8 to 85.4) 0.1 (0.0 to 0.2) 5.5 (3.3 to 7.7)
Gabon 4.1 (3.0 to 5.4) 707.5 (522.6 to 928.5) 6.4 (4.7 to 8.4) 84.8 (77.1 to 90.0) 6.3 (2.7 to 12.9) -1.9 (-4.2 to 0.5)
Gambia 6.1 (5.9 to 6.5) 1,057.0 (1,012.2 to 1,114.7) 73.7 (69.8 to 76.9) 16.5 (14.2 to 18.9) 7.9 (4.6 to 12.2) 9.0 (7.9 to 10.0)
Georgia 22.9 (17.7 to 29.4) 8,417.5 (6,521.1 to 10,785.9) 24.7 (19.0 to 31.4) 71.7 (64.4 to 78.6) 3.1 (1.4 to 6.2) 5.7 (3.2 to 8.3)
Ghana 31.3 (25.0 to 40.9) 369.0 (295.2 to 481.7) 37.7 (28.4 to 46.4) 24.6 (16.8 to 32.6) 34.3 (21.0 to 50.0) 7.1 (3.5 to 10.7)
Grenada 0.1 (0.1 to 0.2) 9,505.0 (7,266.6 to 12,327.9) 18.2 (13.8 to 23.4) 76.8 (69.5 to 82.6) 4.8 (2.0 to 9.4) -3.2 (-5.5 to -0.6)
Guatemala 8.1 (5.8 to 11.0) 2,341.4 (1,665.2 to 3,157.0) 4.8 (3.5 to 6.6) 87.2 (79.7 to 92.3) 7.4 (3.1 to 14.8) 1.3 (-1.4 to 4.1)
Guinea 9.0 (7.1 to 12.0) 277.0 (218.7 to 367.8) 36.8 (27.2 to 45.8) 17.5 (11.7 to 23.9) 40.5 (25.6 to 56.2) 3.8 (0.8 to 7.0)
Guinea-Bissau 5.2 (4.6 to 6.2) 1,080.8 (946.5 to 1,280.7) 54.4 (45.6 to 61.7) 20.9 (16.8 to 24.9) 23.7 (14.4 to 35.6) 7.1 (4.9 to 9.4)
Guyana 1.0 (0.8 to 1.3) 2,186.0 (1,683.6 to 2,840.8) 24.8 (18.7 to 31.6) 74.8 (68.0 to 81.0) 0.4 (0.2 to 0.8) 5.6 (2.4 to 8.7)
Haiti 1.7 (1.3 to 2.2) 182.7 (141.9 to 234.0) 11.9 (9.1 to 15.1) 86.6 (82.8 to 89.8) 1.5 (0.6 to 2.9) 4.6 (2.2 to 7.0)
Honduras 6.2 (5.0 to 7.8) 1,903.1 (1,520.2 to 2,374.3) 33.2 (26.3 to 41.1) 61.6 (52.1 to 69.8) 4.9 (2.0 to 9.6) 3.4 (1.3 to 5.6)
India 1,871.8 (1,421.4 to 2,478.9) 644.0 (489.0 to 852.8) 5.9 (4.3 to 7.6) 47.7 (33.7 to 61.2) 43.8 (28.9 to 59.6) 7.9 (4.9 to 11.0)
Indonesia 181.3 (145.3 to 226.3) 322.9 (258.7 to 403.1) 26.4 (20.9 to 32.5) 56.8 (45.8 to 66.9) 14.5 (6.4 to 26.8) 2.6 (0.3 to 4.8)
Iran 75.9 (52.8 to 108.2) 5,861.4 (4,079.0 to 8,350.8) 0.0 (0.0 to 0.0) 99.4 (98.7 to 99.7) 0.6 (0.2 to 1.3) 9.2 (6.1 to 12.2)
Iraq 32.2 (24.7 to 42.8) 1,934.3 (1,482.4 to 2,574.7) 7.8 (5.8 to 10.0) 78.0 (67.0 to 86.0) 14.1 (6.6 to 25.7) 7.0 (4.1 to 9.7)
Jamaica 4.8 (3.4 to 6.4) 10,013.5 (7,209.9 to 13,421.2) 0.0 (0.0 to 0.0) 86.9 (78.2 to 93.0) 9.3 (4.0 to 17.7) -1.0 (-3.5 to 1.6)
Jordan 3.6 (2.7 to 4.6) 3,309.3 (2,482.2 to 4,317.4) 16.4 (12.3 to 21.5) 65.8 (53.7 to 75.6) 14.2 (6.3 to 26.4) 0.6 (-1.8 to 3.2)
Kazakhstan 364.7 (293.2 to 451.0) 26,277.7 (21,124.6 to 32,499.7) 2.5 (2.0 to 3.1) 97.1 (96.3 to 97.7) 0.1 (0.0 to 0.1) 4.1 (2.6 to 5.7)
Kenya 80.8 (69.5 to 95.6) 439.4 (378.2 to 520.1) 44.1 (37.0 to 50.9) 33.5 (25.9 to 41.3) 14.7 (7.5 to 25.1) 5.5 (2.8 to 8.0)
Kiribati 1.0 (0.8 to 1.2) 3,129.0 (2,580.7 to 3,750.4) 30.6 (25.3 to 36.8) 69.2 (63.0 to 74.6) 0.2 (0.1 to 0.3) 4.1 (2.3 to 6.0)
Kyrgyzstan 51.5 (46.2 to 57.2) 7,255.9 (6,512.9 to 8,062.4) 22.3 (20.0 to 24.7) 67.4 (62.2 to 71.5) 10.3 (6.4 to 15.9) 8.1 (7.0 to 9.3)
Laos 6.7 (5.5 to 8.2) 677.3 (553.8 to 826.9) 25.8 (20.9 to 31.3) 59.5 (50.4 to 67.9) 13.7 (6.8 to 23.9) 2.7 (0.6 to 4.7)
Lebanon 7.8 (5.7 to 10.4) 4,767.7 (3,502.4 to 6,398.0) 7.6 (5.5 to 10.0) 79.9 (70.3 to 86.9) 8.9 (3.9 to 17.4) -0.1 (-2.8 to 2.6)
Lesotho 23.5 (22.3 to 24.8) 900.7 (855.4 to 949.7) 70.1 (66.4 to 73.7) 12.2 (9.0 to 15.7) 17.7 (14.7 to 21.0) 12.8 (11.1 to 14.4)
Liberia 2.9 (2.3 to 3.7) 258.2 (206.2 to 333.4) 33.1 (25.2 to 40.8) 33.1 (23.6 to 43.3) 30.9 (16.9 to 46.6) 5.0 (2.3 to 7.7)
Libya 8.4 (5.9 to 11.7) 4,357.4 (3,044.3 to 6,073.7) 0.0 (0.0 to 0.0) 99.2 (98.4 to 99.6) 0.6 (0.2 to 1.3) 0.4 (-2.5 to 3.4)
Macedonia 2.0 (1.5 to 2.7) 3,555.7 (2,593.7 to 4,803.2) 4.1 (2.9 to 5.4) 83.2 (72.9 to 89.9) 11.6 (5.2 to 21.7) -0.8 (-3.3 to 1.8)
Madagascar 7.0 (5.6 to 8.9) 142.4 (112.8 to 181.1) 17.4 (13.5 to 21.6) 44.3 (32.7 to 56.4) 25.7 (14.2 to 40.0) 3.3 (1.0 to 5.7)
Malawi 28.6 (26.7 to 30.7) 302.6 (283.1 to 325.1) 65.2 (60.6 to 69.6) 9.1 (6.4 to 12.5) 24.2 (19.8 to 28.8) 6.8 (6.2 to 7.5)
Malaysia 88.5 (64.0 to 118.5) 4,790.6 (3,463.6 to 6,414.0) 0.0 (0.0 to 0.0) 98.9 (97.8 to 99.5) 0.9 (0.4 to 1.9) 7.8 (5.1 to 10.7)
Maldives 1.3 (0.9 to 1.8) 6,871.2 (4,726.5 to 9,655.6) 0.0 (0.0 to 0.0) 98.2 (96.6 to 99.3) 1.3 (0.5 to 2.8) 5.5 (2.6 to 8.4)
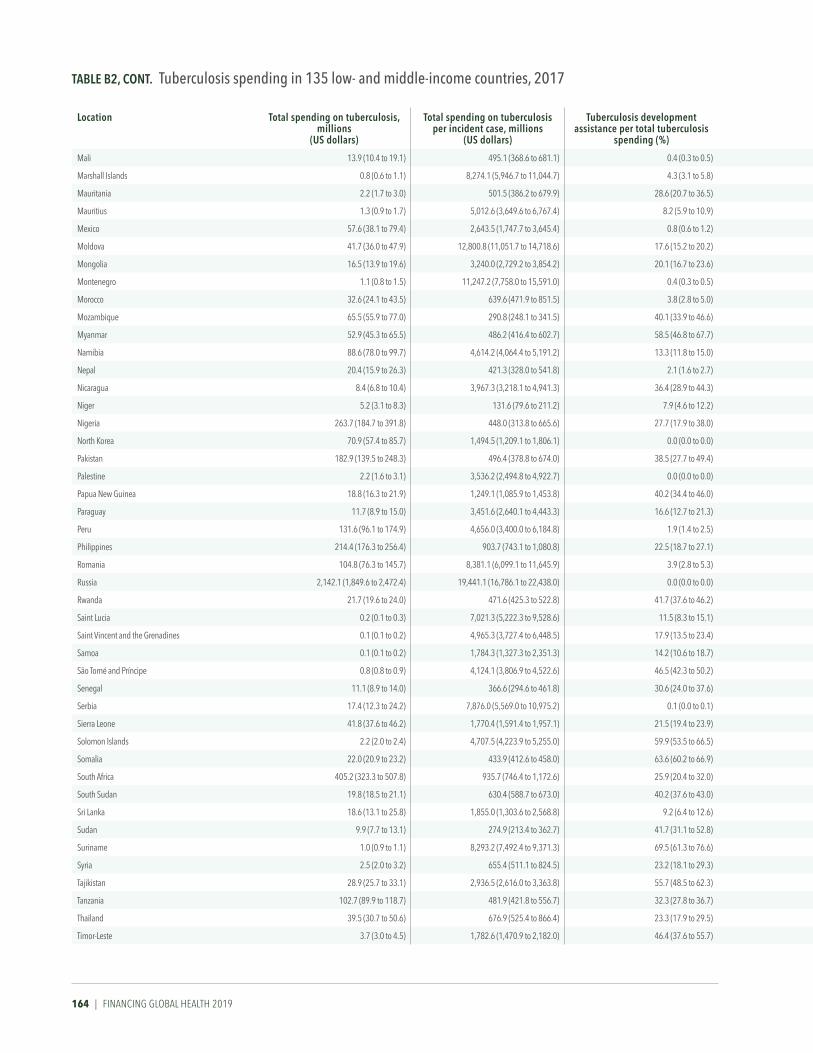
164 | FINANCING GLOBAL HEALTH 2019
Location Total spending on tuberculosis, millions
(uS dollars)
Total spending on tuberculosis per incident case, millions
(uS dollars)
Tuberculosis development assistance per total tuberculosis
spending (%)
Tuberculosis government health spending per total tuberculosis spending (%)
Tuberculosis out-of-pocket spending per total tuberculosis spending (%)
Total spending on tuberculosis 2000–2017 annual growth rate
Mali 13.9 (10.4 to 19.1) 495.1 (368.6 to 681.1) 0.4 (0.3 to 0.5) 39.3 (25.9 to 52.8) 56.4 (42.0 to 70.4) 4.9 (1.5 to 8.5)
Marshall Islands 0.8 (0.6 to 1.1) 8,274.1 (5,946.7 to 11,044.7) 4.3 (3.1 to 5.8) 95.1 (93.3 to 96.5) 0.5 (0.2 to 1.0) 5.2 (2.5 to 7.9)
Mauritania 2.2 (1.7 to 3.0) 501.5 (386.2 to 679.9) 28.6 (20.7 to 36.5) 31.7 (21.3 to 43.2) 37.7 (23.4 to 54.8) 8.5 (4.5 to 12.2)
Mauritius 1.3 (0.9 to 1.7) 5,012.6 (3,649.6 to 6,767.4) 8.2 (5.9 to 10.9) 86.9 (80.8 to 91.5) 4.9 (1.9 to 9.8) 5.1 (2.5 to 7.8)
Mexico 57.6 (38.1 to 79.4) 2,643.5 (1,747.7 to 3,645.4) 0.8 (0.6 to 1.2) 99.0 (98.5 to 99.3) 0.1 (0.0 to 0.1) 2.5 (-0.4 to 5.4)
Moldova 41.7 (36.0 to 47.9) 12,800.8 (11,051.7 to 14,718.6) 17.6 (15.2 to 20.2) 79.0 (75.4 to 82.1) 2.4 (1.1 to 4.5) 10.4 (8.7 to 12.4)
Mongolia 16.5 (13.9 to 19.6) 3,240.0 (2,729.2 to 3,854.2) 20.1 (16.7 to 23.6) 72.5 (66.8 to 77.7) 7.1 (3.7 to 12.0) 8.2 (6.3 to 10.3)
Montenegro 1.1 (0.8 to 1.5) 11,247.2 (7,758.0 to 15,591.0) 0.4 (0.3 to 0.5) 98.9 (98.1 to 99.4) 0.7 (0.3 to 1.4) -0.3 (-2.9 to 2.4)
Morocco 32.6 (24.1 to 43.5) 639.6 (471.9 to 851.5) 3.8 (2.8 to 5.0) 78.0 (63.8 to 87.4) 17.6 (8.3 to 31.9) 3.5 (0.5 to 6.4)
Mozambique 65.5 (55.9 to 77.0) 290.8 (248.1 to 341.5) 40.1 (33.9 to 46.6) 27.6 (21.8 to 33.6) 30.7 (20.1 to 41.0) 8.3 (7.0 to 9.5)
Myanmar 52.9 (45.3 to 65.5) 486.2 (416.4 to 602.7) 58.5 (46.8 to 67.7) 15.8 (10.8 to 21.2) 25.7 (14.8 to 40.5) 9.5 (7.5 to 11.6)
Namibia 88.6 (78.0 to 99.7) 4,614.2 (4,064.4 to 5,191.2) 13.3 (11.8 to 15.0) 75.7 (71.5 to 79.5) 2.2 (1.1 to 3.8) 12.4 (10.2 to 14.3)
Nepal 20.4 (15.9 to 26.3) 421.3 (328.0 to 541.8) 2.1 (1.6 to 2.7) 70.5 (56.5 to 81.5) 25.3 (14.0 to 39.9) 3.9 (1.3 to 6.4)
Nicaragua 8.4 (6.8 to 10.4) 3,967.3 (3,218.1 to 4,941.3) 36.4 (28.9 to 44.3) 63.1 (55.2 to 70.7) 0.5 (0.2 to 1.0) 13.8 (11.3 to 16.5)
Niger 5.2 (3.1 to 8.3) 131.6 (79.6 to 211.2) 7.9 (4.6 to 12.2) 20.0 (10.7 to 32.4) 70.7 (54.8 to 83.9) 3.5 (-0.9 to 8.2)
Nigeria 263.7 (184.7 to 391.8) 448.0 (313.8 to 665.6) 27.7 (17.9 to 38.0) 19.3 (11.6 to 28.1) 51.6 (35.1 to 68.9) 5.6 (1.9 to 9.8)
North Korea 70.9 (57.4 to 85.7) 1,494.5 (1,209.1 to 1,806.1) 0.0 (0.0 to 0.0) 95.5 (91.1 to 98.0) 4.4 (1.9 to 8.8) 1.9 (0.2 to 3.6)
Pakistan 182.9 (139.5 to 248.3) 496.4 (378.8 to 674.0) 38.5 (27.7 to 49.4) 15.1 (9.6 to 21.4) 43.8 (28.5 to 58.7) -0.6 (-2.8 to 1.8)
Palestine 2.2 (1.6 to 3.1) 3,536.2 (2,494.8 to 4,922.7) 0.0 (0.0 to 0.0) 92.8 (86.1 to 96.9) 4.5 (1.7 to 9.3) 5.6 (2.6 to 8.5)
Papua New Guinea 18.8 (16.3 to 21.9) 1,249.1 (1,085.9 to 1,453.8) 40.2 (34.4 to 46.0) 57.5 (51.3 to 63.9) 2.3 (1.1 to 4.1) 15.4 (13.1 to 17.8)
Paraguay 11.7 (8.9 to 15.0) 3,451.6 (2,640.1 to 4,443.3) 16.6 (12.7 to 21.3) 71.4 (61.0 to 79.6) 10.8 (4.8 to 20.6) 6.7 (4.4 to 9.3)
Peru 131.6 (96.1 to 174.9) 4,656.0 (3,400.0 to 6,184.8) 1.9 (1.4 to 2.5) 95.5 (92.7 to 97.2) 2.4 (1.0 to 4.9) 4.6 (2.3 to 7.0)
Philippines 214.4 (176.3 to 256.4) 903.7 (743.1 to 1,080.8) 22.5 (18.7 to 27.1) 72.9 (67.0 to 77.8) 4.1 (1.8 to 7.8) 7.4 (5.4 to 9.4)
Romania 104.8 (76.3 to 145.7) 8,381.1 (6,099.1 to 11,645.9) 3.9 (2.8 to 5.3) 95.9 (94.5 to 97.1) 0.2 (0.1 to 0.4) 0.9 (-1.7 to 3.7)
Russia 2,142.1 (1,849.6 to 2,472.4) 19,441.1 (16,786.1 to 22,438.0) 0.0 (0.0 to 0.0) 90.0 (83.3 to 94.8) 9.2 (4.4 to 16.0) 4.9 (3.4 to 6.4)
Rwanda 21.7 (19.6 to 24.0) 471.6 (425.3 to 522.8) 41.7 (37.6 to 46.2) 34.6 (28.8 to 40.8) 13.0 (9.6 to 17.3) 4.7 (3.9 to 5.6)
Saint Lucia 0.2 (0.1 to 0.3) 7,021.3 (5,222.3 to 9,528.6) 11.5 (8.3 to 15.1) 83.3 (76.7 to 88.3) 4.8 (1.9 to 10.0) 1.9 (-0.7 to 4.8)
Saint Vincent and the Grenadines 0.1 (0.1 to 0.2) 4,965.3 (3,727.4 to 6,448.5) 17.9 (13.5 to 23.4) 77.5 (70.4 to 83.2) 4.3 (1.9 to 8.8) 2.0 (-0.4 to 4.6)
Samoa 0.1 (0.1 to 0.2) 1,784.3 (1,327.3 to 2,351.3) 14.2 (10.6 to 18.7) 78.2 (70.2 to 84.6) 5.0 (2.0 to 10.6) 2.0 (-0.6 to 4.6)
São Tomé and Príncipe 0.8 (0.8 to 0.9) 4,124.1 (3,806.9 to 4,522.6) 46.5 (42.3 to 50.2) 19.1 (14.0 to 25.2) 7.0 (3.1 to 13.3) -6.7 (-8.7 to -4.1)
Senegal 11.1 (8.9 to 14.0) 366.6 (294.6 to 461.8) 30.6 (24.0 to 37.6) 41.7 (31.5 to 52.5) 24.4 (12.1 to 40.0) 3.4 (0.7 to 6.0)
Serbia 17.4 (12.3 to 24.2) 7,876.0 (5,569.0 to 10,975.2) 0.1 (0.0 to 0.1) 96.6 (93.2 to 98.6) 3.3 (1.3 to 6.6) 3.5 (0.8 to 6.1)
Sierra Leone 41.8 (37.6 to 46.2) 1,770.4 (1,591.4 to 1,957.1) 21.5 (19.4 to 23.9) 71.6 (67.4 to 75.0) 3.4 (1.6 to 6.7) 9.1 (7.6 to 10.7)
Solomon Islands 2.2 (2.0 to 2.4) 4,707.5 (4,223.9 to 5,255.0) 59.9 (53.5 to 66.5) 39.8 (33.1 to 46.3) 0.3 (0.1 to 0.5) 8.5 (6.6 to 10.6)
Somalia 22.0 (20.9 to 23.2) 433.9 (412.6 to 458.0) 63.6 (60.2 to 66.9) 7.8 (6.5 to 9.1) 27.9 (24.4 to 31.6) 8.5 (7.5 to 9.6)
South Africa 405.2 (323.3 to 507.8) 935.7 (746.4 to 1,172.6) 25.9 (20.4 to 32.0) 67.3 (59.3 to 74.4) 4.0 (1.7 to 7.5) 1.4 (-0.4 to 3.3)
South Sudan 19.8 (18.5 to 21.1) 630.4 (588.7 to 673.0) 40.2 (37.6 to 43.0) 6.2 (5.0 to 7.8) 47.0 (43.3 to 50.6) 7.2 (5.6 to 9.1)
Sri Lanka 18.6 (13.1 to 25.8) 1,855.0 (1,303.6 to 2,568.8) 9.2 (6.4 to 12.6) 88.5 (84.0 to 92.1) 2.1 (0.9 to 4.4) -7.6 (-10.3 to -5.1)
Sudan 9.9 (7.7 to 13.1) 274.9 (213.4 to 362.7) 41.7 (31.1 to 52.8) 24.2 (15.9 to 33.4) 32.6 (16.8 to 50.2) 5.7 (2.8 to 8.8)
Suriname 1.0 (0.9 to 1.1) 8,293.2 (7,492.4 to 9,371.3) 69.5 (61.3 to 76.6) 30.1 (22.9 to 38.4) 0.2 (0.1 to 0.4) 8.1 (5.8 to 10.4)
Syria 2.5 (2.0 to 3.2) 655.4 (511.1 to 824.5) 23.2 (18.1 to 29.3) 59.8 (49.4 to 69.4) 16.1 (8.1 to 27.2) -0.2 (-2.6 to 2.3)
Tajikistan 28.9 (25.7 to 33.1) 2,936.5 (2,616.0 to 3,363.8) 55.7 (48.5 to 62.3) 30.4 (24.1 to 37.5) 13.8 (7.6 to 22.8) 10.6 (9.0 to 12.1)
Tanzania 102.7 (89.9 to 118.7) 481.9 (421.8 to 556.7) 32.3 (27.8 to 36.7) 20.8 (15.5 to 27.2) 38.9 (31.5 to 46.7) 6.1 (4.6 to 7.7)
Thailand 39.5 (30.7 to 50.6) 676.9 (525.4 to 866.4) 23.3 (17.9 to 29.5) 64.5 (53.5 to 73.9) 10.7 (4.5 to 21.3) 1.3 (-1.1 to 3.8)
Timor-Leste 3.7 (3.0 to 4.5) 1,782.6 (1,470.9 to 2,182.0) 46.4 (37.6 to 55.7) 53.0 (43.6 to 62.0) 0.4 (0.2 to 0.9) 8.6 (6.6 to 10.7)
TABLe B2, CoNT. Tuberculosis spending in 135 low- and middle-income countries, 2017

TABuLATED DATA | 165
Location Total spending on tuberculosis, millions
(uS dollars)
Total spending on tuberculosis per incident case, millions
(uS dollars)
Tuberculosis development assistance per total tuberculosis
spending (%)
Tuberculosis government health spending per total tuberculosis spending (%)
Tuberculosis out-of-pocket spending per total tuberculosis spending (%)
Total spending on tuberculosis 2000–2017 annual growth rate
Mali 13.9 (10.4 to 19.1) 495.1 (368.6 to 681.1) 0.4 (0.3 to 0.5) 39.3 (25.9 to 52.8) 56.4 (42.0 to 70.4) 4.9 (1.5 to 8.5)
Marshall Islands 0.8 (0.6 to 1.1) 8,274.1 (5,946.7 to 11,044.7) 4.3 (3.1 to 5.8) 95.1 (93.3 to 96.5) 0.5 (0.2 to 1.0) 5.2 (2.5 to 7.9)
Mauritania 2.2 (1.7 to 3.0) 501.5 (386.2 to 679.9) 28.6 (20.7 to 36.5) 31.7 (21.3 to 43.2) 37.7 (23.4 to 54.8) 8.5 (4.5 to 12.2)
Mauritius 1.3 (0.9 to 1.7) 5,012.6 (3,649.6 to 6,767.4) 8.2 (5.9 to 10.9) 86.9 (80.8 to 91.5) 4.9 (1.9 to 9.8) 5.1 (2.5 to 7.8)
Mexico 57.6 (38.1 to 79.4) 2,643.5 (1,747.7 to 3,645.4) 0.8 (0.6 to 1.2) 99.0 (98.5 to 99.3) 0.1 (0.0 to 0.1) 2.5 (-0.4 to 5.4)
Moldova 41.7 (36.0 to 47.9) 12,800.8 (11,051.7 to 14,718.6) 17.6 (15.2 to 20.2) 79.0 (75.4 to 82.1) 2.4 (1.1 to 4.5) 10.4 (8.7 to 12.4)
Mongolia 16.5 (13.9 to 19.6) 3,240.0 (2,729.2 to 3,854.2) 20.1 (16.7 to 23.6) 72.5 (66.8 to 77.7) 7.1 (3.7 to 12.0) 8.2 (6.3 to 10.3)
Montenegro 1.1 (0.8 to 1.5) 11,247.2 (7,758.0 to 15,591.0) 0.4 (0.3 to 0.5) 98.9 (98.1 to 99.4) 0.7 (0.3 to 1.4) -0.3 (-2.9 to 2.4)
Morocco 32.6 (24.1 to 43.5) 639.6 (471.9 to 851.5) 3.8 (2.8 to 5.0) 78.0 (63.8 to 87.4) 17.6 (8.3 to 31.9) 3.5 (0.5 to 6.4)
Mozambique 65.5 (55.9 to 77.0) 290.8 (248.1 to 341.5) 40.1 (33.9 to 46.6) 27.6 (21.8 to 33.6) 30.7 (20.1 to 41.0) 8.3 (7.0 to 9.5)
Myanmar 52.9 (45.3 to 65.5) 486.2 (416.4 to 602.7) 58.5 (46.8 to 67.7) 15.8 (10.8 to 21.2) 25.7 (14.8 to 40.5) 9.5 (7.5 to 11.6)
Namibia 88.6 (78.0 to 99.7) 4,614.2 (4,064.4 to 5,191.2) 13.3 (11.8 to 15.0) 75.7 (71.5 to 79.5) 2.2 (1.1 to 3.8) 12.4 (10.2 to 14.3)
Nepal 20.4 (15.9 to 26.3) 421.3 (328.0 to 541.8) 2.1 (1.6 to 2.7) 70.5 (56.5 to 81.5) 25.3 (14.0 to 39.9) 3.9 (1.3 to 6.4)
Nicaragua 8.4 (6.8 to 10.4) 3,967.3 (3,218.1 to 4,941.3) 36.4 (28.9 to 44.3) 63.1 (55.2 to 70.7) 0.5 (0.2 to 1.0) 13.8 (11.3 to 16.5)
Niger 5.2 (3.1 to 8.3) 131.6 (79.6 to 211.2) 7.9 (4.6 to 12.2) 20.0 (10.7 to 32.4) 70.7 (54.8 to 83.9) 3.5 (-0.9 to 8.2)
Nigeria 263.7 (184.7 to 391.8) 448.0 (313.8 to 665.6) 27.7 (17.9 to 38.0) 19.3 (11.6 to 28.1) 51.6 (35.1 to 68.9) 5.6 (1.9 to 9.8)
North Korea 70.9 (57.4 to 85.7) 1,494.5 (1,209.1 to 1,806.1) 0.0 (0.0 to 0.0) 95.5 (91.1 to 98.0) 4.4 (1.9 to 8.8) 1.9 (0.2 to 3.6)
Pakistan 182.9 (139.5 to 248.3) 496.4 (378.8 to 674.0) 38.5 (27.7 to 49.4) 15.1 (9.6 to 21.4) 43.8 (28.5 to 58.7) -0.6 (-2.8 to 1.8)
Palestine 2.2 (1.6 to 3.1) 3,536.2 (2,494.8 to 4,922.7) 0.0 (0.0 to 0.0) 92.8 (86.1 to 96.9) 4.5 (1.7 to 9.3) 5.6 (2.6 to 8.5)
Papua New Guinea 18.8 (16.3 to 21.9) 1,249.1 (1,085.9 to 1,453.8) 40.2 (34.4 to 46.0) 57.5 (51.3 to 63.9) 2.3 (1.1 to 4.1) 15.4 (13.1 to 17.8)
Paraguay 11.7 (8.9 to 15.0) 3,451.6 (2,640.1 to 4,443.3) 16.6 (12.7 to 21.3) 71.4 (61.0 to 79.6) 10.8 (4.8 to 20.6) 6.7 (4.4 to 9.3)
Peru 131.6 (96.1 to 174.9) 4,656.0 (3,400.0 to 6,184.8) 1.9 (1.4 to 2.5) 95.5 (92.7 to 97.2) 2.4 (1.0 to 4.9) 4.6 (2.3 to 7.0)
Philippines 214.4 (176.3 to 256.4) 903.7 (743.1 to 1,080.8) 22.5 (18.7 to 27.1) 72.9 (67.0 to 77.8) 4.1 (1.8 to 7.8) 7.4 (5.4 to 9.4)
Romania 104.8 (76.3 to 145.7) 8,381.1 (6,099.1 to 11,645.9) 3.9 (2.8 to 5.3) 95.9 (94.5 to 97.1) 0.2 (0.1 to 0.4) 0.9 (-1.7 to 3.7)
Russia 2,142.1 (1,849.6 to 2,472.4) 19,441.1 (16,786.1 to 22,438.0) 0.0 (0.0 to 0.0) 90.0 (83.3 to 94.8) 9.2 (4.4 to 16.0) 4.9 (3.4 to 6.4)
Rwanda 21.7 (19.6 to 24.0) 471.6 (425.3 to 522.8) 41.7 (37.6 to 46.2) 34.6 (28.8 to 40.8) 13.0 (9.6 to 17.3) 4.7 (3.9 to 5.6)
Saint Lucia 0.2 (0.1 to 0.3) 7,021.3 (5,222.3 to 9,528.6) 11.5 (8.3 to 15.1) 83.3 (76.7 to 88.3) 4.8 (1.9 to 10.0) 1.9 (-0.7 to 4.8)
Saint Vincent and the Grenadines 0.1 (0.1 to 0.2) 4,965.3 (3,727.4 to 6,448.5) 17.9 (13.5 to 23.4) 77.5 (70.4 to 83.2) 4.3 (1.9 to 8.8) 2.0 (-0.4 to 4.6)
Samoa 0.1 (0.1 to 0.2) 1,784.3 (1,327.3 to 2,351.3) 14.2 (10.6 to 18.7) 78.2 (70.2 to 84.6) 5.0 (2.0 to 10.6) 2.0 (-0.6 to 4.6)
São Tomé and Príncipe 0.8 (0.8 to 0.9) 4,124.1 (3,806.9 to 4,522.6) 46.5 (42.3 to 50.2) 19.1 (14.0 to 25.2) 7.0 (3.1 to 13.3) -6.7 (-8.7 to -4.1)
Senegal 11.1 (8.9 to 14.0) 366.6 (294.6 to 461.8) 30.6 (24.0 to 37.6) 41.7 (31.5 to 52.5) 24.4 (12.1 to 40.0) 3.4 (0.7 to 6.0)
Serbia 17.4 (12.3 to 24.2) 7,876.0 (5,569.0 to 10,975.2) 0.1 (0.0 to 0.1) 96.6 (93.2 to 98.6) 3.3 (1.3 to 6.6) 3.5 (0.8 to 6.1)
Sierra Leone 41.8 (37.6 to 46.2) 1,770.4 (1,591.4 to 1,957.1) 21.5 (19.4 to 23.9) 71.6 (67.4 to 75.0) 3.4 (1.6 to 6.7) 9.1 (7.6 to 10.7)
Solomon Islands 2.2 (2.0 to 2.4) 4,707.5 (4,223.9 to 5,255.0) 59.9 (53.5 to 66.5) 39.8 (33.1 to 46.3) 0.3 (0.1 to 0.5) 8.5 (6.6 to 10.6)
Somalia 22.0 (20.9 to 23.2) 433.9 (412.6 to 458.0) 63.6 (60.2 to 66.9) 7.8 (6.5 to 9.1) 27.9 (24.4 to 31.6) 8.5 (7.5 to 9.6)
South Africa 405.2 (323.3 to 507.8) 935.7 (746.4 to 1,172.6) 25.9 (20.4 to 32.0) 67.3 (59.3 to 74.4) 4.0 (1.7 to 7.5) 1.4 (-0.4 to 3.3)
South Sudan 19.8 (18.5 to 21.1) 630.4 (588.7 to 673.0) 40.2 (37.6 to 43.0) 6.2 (5.0 to 7.8) 47.0 (43.3 to 50.6) 7.2 (5.6 to 9.1)
Sri Lanka 18.6 (13.1 to 25.8) 1,855.0 (1,303.6 to 2,568.8) 9.2 (6.4 to 12.6) 88.5 (84.0 to 92.1) 2.1 (0.9 to 4.4) -7.6 (-10.3 to -5.1)
Sudan 9.9 (7.7 to 13.1) 274.9 (213.4 to 362.7) 41.7 (31.1 to 52.8) 24.2 (15.9 to 33.4) 32.6 (16.8 to 50.2) 5.7 (2.8 to 8.8)
Suriname 1.0 (0.9 to 1.1) 8,293.2 (7,492.4 to 9,371.3) 69.5 (61.3 to 76.6) 30.1 (22.9 to 38.4) 0.2 (0.1 to 0.4) 8.1 (5.8 to 10.4)
Syria 2.5 (2.0 to 3.2) 655.4 (511.1 to 824.5) 23.2 (18.1 to 29.3) 59.8 (49.4 to 69.4) 16.1 (8.1 to 27.2) -0.2 (-2.6 to 2.3)
Tajikistan 28.9 (25.7 to 33.1) 2,936.5 (2,616.0 to 3,363.8) 55.7 (48.5 to 62.3) 30.4 (24.1 to 37.5) 13.8 (7.6 to 22.8) 10.6 (9.0 to 12.1)
Tanzania 102.7 (89.9 to 118.7) 481.9 (421.8 to 556.7) 32.3 (27.8 to 36.7) 20.8 (15.5 to 27.2) 38.9 (31.5 to 46.7) 6.1 (4.6 to 7.7)
Thailand 39.5 (30.7 to 50.6) 676.9 (525.4 to 866.4) 23.3 (17.9 to 29.5) 64.5 (53.5 to 73.9) 10.7 (4.5 to 21.3) 1.3 (-1.1 to 3.8)
Timor-Leste 3.7 (3.0 to 4.5) 1,782.6 (1,470.9 to 2,182.0) 46.4 (37.6 to 55.7) 53.0 (43.6 to 62.0) 0.4 (0.2 to 0.9) 8.6 (6.6 to 10.7)

166 | FINANCING GLOBAL HEALTH 2019
Location Total spending on tuberculosis, millions
(uS dollars)
Total spending on tuberculosis per incident case, millions
(uS dollars)
Tuberculosis development assistance per total tuberculosis
spending (%)
Tuberculosis government health spending per total tuberculosis spending (%)
Tuberculosis out-of-pocket spending per total tuberculosis spending (%)
Total spending on tuberculosis 2000–2017 annual growth rate
Togo 5.4 (4.1 to 7.3) 295.7 (227.8 to 400.2) 36.0 (26.0 to 45.7) 18.6 (12.0 to 26.0) 40.1 (25.4 to 57.2) 4.9 (1.7 to 8.3)
Tonga 0.2 (0.1 to 0.2) 5,516.1 (4,200.9 to 7,193.2) 9.5 (7.1 to 12.2) 68.3 (56.5 to 78.7) 21.5 (11.7 to 34.0) 4.1 (1.5 to 6.9)
Tunisia 1.6 (1.2 to 2.3) 517.1 (360.8 to 719.1) 0.3 (0.2 to 0.5) 94.5 (89.3 to 97.4) 5.0 (2.0 to 10.0) 4.7 (1.6 to 7.7)
Turkey 65.5 (45.8 to 93.5) 2,868.0 (2,003.2 to 4,092.6) 0.0 (0.0 to 0.0) 97.3 (94.5 to 98.8) 2.4 (1.0 to 5.2) 0.9 (-1.7 to 3.9)
Turkmenistan 17.2 (13.4 to 21.7) 4,215.3 (3,288.0 to 5,315.7) 14.0 (10.9 to 17.7) 66.9 (53.0 to 76.7) 18.5 (9.2 to 32.3) 6.9 (4.7 to 9.1)
Uganda 53.1 (43.4 to 68.3) 261.1 (213.5 to 335.5) 39.4 (30.2 to 47.5) 17.4 (12.4 to 23.4) 40.8 (28.2 to 54.1) 2.9 (1.2 to 4.8)
Ukraine 250.9 (205.1 to 310.0) 8,070.6 (6,596.6 to 9,972.3) 6.5 (5.2 to 7.9) 88.6 (84.3 to 91.8) 4.8 (2.2 to 9.2) 4.1 (2.1 to 6.3)
Uzbekistan 115.9 (93.4 to 141.5) 5,929.1 (4,774.1 to 7,236.6) 11.7 (9.5 to 14.4) 67.9 (57.2 to 76.3) 20.2 (12.0 to 31.0) 9.6 (7.5 to 11.7)
Vanuatu 0.5 (0.4 to 0.7) 2,919.0 (2,168.6 to 3,906.1) 3.3 (2.4 to 4.3) 92.4 (88.7 to 95.0) 3.8 (1.7 to 6.8) 4.8 (2.2 to 7.6)
Venezuela 7.6 (5.4 to 10.3) 1,036.5 (736.1 to 1,404.5) 0.0 (0.0 to 0.0) 89.5 (80.4 to 95.0) 5.6 (2.3 to 11.5) -5.6 (-8.2 to -2.8)
Vietnam 69.8 (55.6 to 89.0) 543.6 (433.4 to 693.3) 23.1 (17.9 to 28.6) 60.1 (48.1 to 69.8) 16.1 (7.4 to 29.1) 4.0 (2.0 to 6.0)
Yemen 3.0 (2.0 to 4.5) 181.3 (123.0 to 274.7) 23.2 (14.7 to 32.8) 23.3 (13.6 to 35.1) 52.9 (34.6 to 70.8) -3.1 (-6.1 to 0.1)
Zambia 85.6 (81.3 to 90.8) 753.0 (715.3 to 799.4) 56.3 (53.0 to 59.3) 12.2 (9.0 to 16.1) 15.9 (12.9 to 19.0) 0.8 (0.3 to 1.3)
Zimbabwe 40.2 (35.3 to 46.3) 301.4 (265.1 to 347.0) 34.1 (29.4 to 38.5) 19.6 (14.8 to 25.7) 37.0 (29.6 to 45.4) 3.9 (1.7 to 5.8)
All figures are in millions of 2019 US dollars. All estimates are for 2017 except for annual growth rate. Development assistance for health includes both financial and in-kind contributions for activities aimed at improving health in low- and middle-income countries.
TABLe B2, CoNT. Tuberculosis spending in 135 low- and middle-income countries, 2017

TABuLATED DATA | 167
Location Total spending on tuberculosis, millions
(uS dollars)
Total spending on tuberculosis per incident case, millions
(uS dollars)
Tuberculosis development assistance per total tuberculosis
spending (%)
Tuberculosis government health spending per total tuberculosis spending (%)
Tuberculosis out-of-pocket spending per total tuberculosis spending (%)
Total spending on tuberculosis 2000–2017 annual growth rate
Togo 5.4 (4.1 to 7.3) 295.7 (227.8 to 400.2) 36.0 (26.0 to 45.7) 18.6 (12.0 to 26.0) 40.1 (25.4 to 57.2) 4.9 (1.7 to 8.3)
Tonga 0.2 (0.1 to 0.2) 5,516.1 (4,200.9 to 7,193.2) 9.5 (7.1 to 12.2) 68.3 (56.5 to 78.7) 21.5 (11.7 to 34.0) 4.1 (1.5 to 6.9)
Tunisia 1.6 (1.2 to 2.3) 517.1 (360.8 to 719.1) 0.3 (0.2 to 0.5) 94.5 (89.3 to 97.4) 5.0 (2.0 to 10.0) 4.7 (1.6 to 7.7)
Turkey 65.5 (45.8 to 93.5) 2,868.0 (2,003.2 to 4,092.6) 0.0 (0.0 to 0.0) 97.3 (94.5 to 98.8) 2.4 (1.0 to 5.2) 0.9 (-1.7 to 3.9)
Turkmenistan 17.2 (13.4 to 21.7) 4,215.3 (3,288.0 to 5,315.7) 14.0 (10.9 to 17.7) 66.9 (53.0 to 76.7) 18.5 (9.2 to 32.3) 6.9 (4.7 to 9.1)
Uganda 53.1 (43.4 to 68.3) 261.1 (213.5 to 335.5) 39.4 (30.2 to 47.5) 17.4 (12.4 to 23.4) 40.8 (28.2 to 54.1) 2.9 (1.2 to 4.8)
Ukraine 250.9 (205.1 to 310.0) 8,070.6 (6,596.6 to 9,972.3) 6.5 (5.2 to 7.9) 88.6 (84.3 to 91.8) 4.8 (2.2 to 9.2) 4.1 (2.1 to 6.3)
Uzbekistan 115.9 (93.4 to 141.5) 5,929.1 (4,774.1 to 7,236.6) 11.7 (9.5 to 14.4) 67.9 (57.2 to 76.3) 20.2 (12.0 to 31.0) 9.6 (7.5 to 11.7)
Vanuatu 0.5 (0.4 to 0.7) 2,919.0 (2,168.6 to 3,906.1) 3.3 (2.4 to 4.3) 92.4 (88.7 to 95.0) 3.8 (1.7 to 6.8) 4.8 (2.2 to 7.6)
Venezuela 7.6 (5.4 to 10.3) 1,036.5 (736.1 to 1,404.5) 0.0 (0.0 to 0.0) 89.5 (80.4 to 95.0) 5.6 (2.3 to 11.5) -5.6 (-8.2 to -2.8)
Vietnam 69.8 (55.6 to 89.0) 543.6 (433.4 to 693.3) 23.1 (17.9 to 28.6) 60.1 (48.1 to 69.8) 16.1 (7.4 to 29.1) 4.0 (2.0 to 6.0)
Yemen 3.0 (2.0 to 4.5) 181.3 (123.0 to 274.7) 23.2 (14.7 to 32.8) 23.3 (13.6 to 35.1) 52.9 (34.6 to 70.8) -3.1 (-6.1 to 0.1)
Zambia 85.6 (81.3 to 90.8) 753.0 (715.3 to 799.4) 56.3 (53.0 to 59.3) 12.2 (9.0 to 16.1) 15.9 (12.9 to 19.0) 0.8 (0.3 to 1.3)
Zimbabwe 40.2 (35.3 to 46.3) 301.4 (265.1 to 347.0) 34.1 (29.4 to 38.5) 19.6 (14.8 to 25.7) 37.0 (29.6 to 45.4) 3.9 (1.7 to 5.8)

168 | FINANCING GLOBAL HEALTH 2019
TABLe B3 Development assistance for health by source of funding, 1990–2019
*2019 estimates are preliminary.
All figures are in millions of 2019 US dollars. Development assistance for health includes both financial and in-kind contributions for activities aimed at improving health in low- and middle-income countries. This table disaggregates development assistance for health by primary funding source. Dashes indicate inapplicable.
Funding source 1990 1995 2000 2005 2010 2015 2019*
NATioNAL TreASurieS
Australia 50.9 164.67 210.4 283.63 645.14 466.19 349.67
Austria 49.86 37.07 59.79 155.26 116.56 69.58 75.53
Belgium 151.64 135.49 144.37 520.21 357.12 297.28 275.95
Canada 164.47 235.1 157.55 822.45 1,018.84 1,119.52 1,073.73
China 82.78 98.83 142.09 217.45 443.22 585.93 734.69
Denmark 121.28 146.36 182.83 305.19 476.45 238.85 239.32
Finland 138.43 43.58 59.16 121.39 195.59 137.29 86.14
France 857.92 611.58 232.87 817.77 985.59 962.21 762.81
Germany 271.42 765.66 366.77 714.25 1,205.67 1,422.09 2,116.62
Greece 2.07 11.12 12.32 59.72 21.39 13.2 16.46
Ireland 5.18 34.78 45.77 202.51 218.95 141.97 161.09
Italy 280.34 186.94 174.22 511.65 319.5 363.18 444.06
Japan 617.59 964.91 932.95 856.34 1,094.27 1,031.03 1,172.41
Luxembourg 1.99 21.23 39.98 61.64 94.08 73.14 84.96
Netherlands 253.68 310.53 646.69 642.38 780.3 716.94 748.73
New Zealand 2.03 58.43 10.13 34.31 51.83 35.71 38
Norway 132.33 135.66 145.8 601.91 838.14 737.44 741.55
Portugal 1.4 15.17 17.48 30.45 36.78 38.92 31.41
South Korea 1.31 15.7 96.91 142.84 210.63 278.25 348.8
Spain 20.89 212.21 207.23 320.48 689.37 128.62 228.51
Sweden 403.78 253.68 154.76 707.46 859.07 604.96 717.01
Switzerland 109.87 75.18 71.86 111.58 161.62 263.55 265.72
United Kingdom 281.22 302.92 1,135.47 1,461.31 2,362.39 3,713.27 3,509.49
United States 2,101.74 2,795.81 2,932.43 5,643.82 11,527.86 11,819.76 12,234.94
Other governments 140.82 256.23 150.89 157.39 286.85 709.52 787.16
PriVATe PHiLANTHroPY
Gates Foundation 0 0 427.65 900.52 2,073.74 2,721.9 3,911.29
Corporate donations 56.86 119.14 158.46 555.69 648.8 880.53 809.26
Other private philanthropy excluding Gates Foundation 507.71 778.09 1,420.97 2,251.23 3,527.67 4,360.4 3,756.81
oTHer
Debt repayments 220.13 866.85 1,187.01 1,196.5 2,379.49 1,174.21 2,100.06
Other 689.19 722.77 770.55 1,395.77 1,216.3 2,297.08 2,131.28
Unallocable 79.68 88.56 54.79 0.12 347.21 473.14 603.99
ToTAL 7,798.47 10,464.25 12,350.16 21,803.23 35,190.42 37,875.66 40,557.47
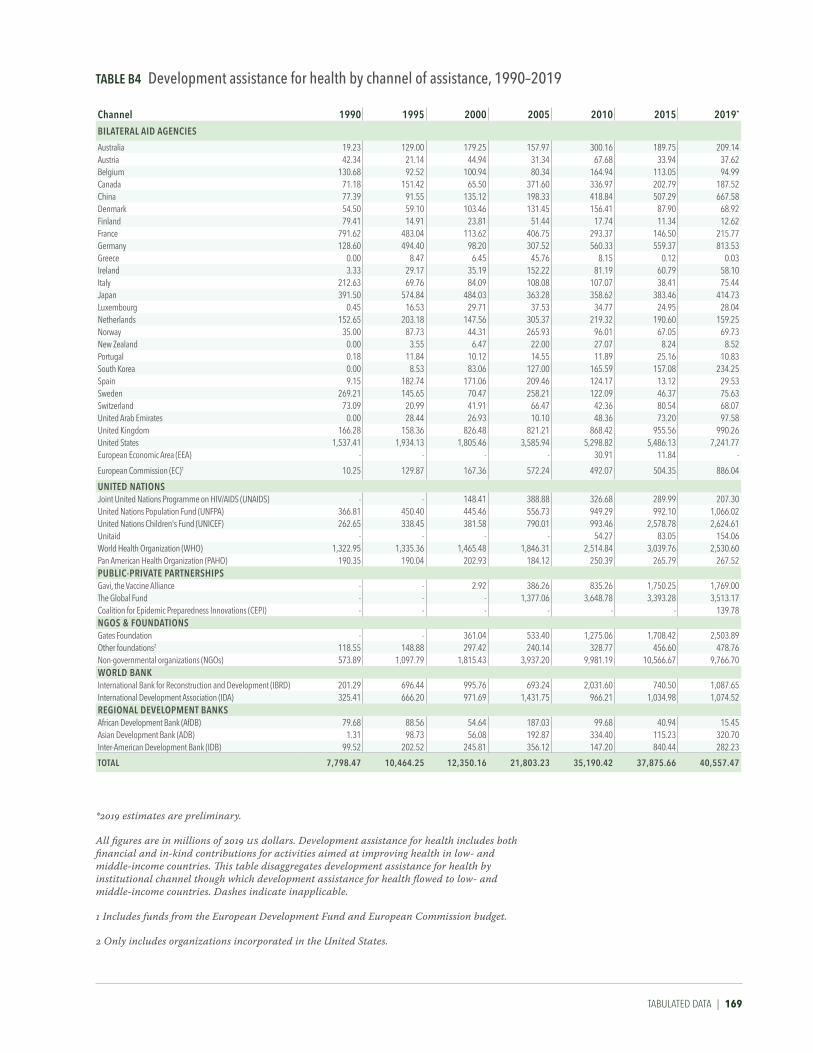
TABuLATED DATA | 169
TABLe B4 Development assistance for health by channel of assistance, 1990–2019
*2019 estimates are preliminary.
All figures are in millions of 2019 US dollars. Development assistance for health includes both financial and in-kind contributions for activities aimed at improving health in low- and middle-income countries. This table disaggregates development assistance for health by institutional channel though which development assistance for health flowed to low- and middle-income countries. Dashes indicate inapplicable.
1 Includes funds from the European Development Fund and European Commission budget.
2 Only includes organizations incorporated in the United States.
Channel 1990 1995 2000 2005 2010 2015 2019*
BiLATerAL AiD AgeNCieS
Australia 19.23 129.00 179.25 157.97 300.16 189.75 209.14Austria 42.34 21.14 44.94 31.34 67.68 33.94 37.62Belgium 130.68 92.52 100.94 80.34 164.94 113.05 94.99Canada 71.18 151.42 65.50 371.60 336.97 202.79 187.52China 77.39 91.55 135.12 198.33 418.84 507.29 667.58Denmark 54.50 59.10 103.46 131.45 156.41 87.90 68.92Finland 79.41 14.91 23.81 51.44 17.74 11.34 12.62France 791.62 483.04 113.62 406.75 293.37 146.50 215.77Germany 128.60 494.40 98.20 307.52 560.33 559.37 813.53Greece 0.00 8.47 6.45 45.76 8.15 0.12 0.03Ireland 3.33 29.17 35.19 152.22 81.19 60.79 58.10Italy 212.63 69.76 84.09 108.08 107.07 38.41 75.44Japan 391.50 574.84 484.03 363.28 358.62 383.46 414.73Luxembourg 0.45 16.53 29.71 37.53 34.77 24.95 28.04Netherlands 152.65 203.18 147.56 305.37 219.32 190.60 159.25Norway 35.00 87.73 44.31 265.93 96.01 67.05 69.73New Zealand 0.00 3.55 6.47 22.00 27.07 8.24 8.52Portugal 0.18 11.84 10.12 14.55 11.89 25.16 10.83South Korea 0.00 8.53 83.06 127.00 165.59 157.08 234.25Spain 9.15 182.74 171.06 209.46 124.17 13.12 29.53Sweden 269.21 145.65 70.47 258.21 122.09 46.37 75.63Switzerland 73.09 20.99 41.91 66.47 42.36 80.54 68.07United Arab Emirates 0.00 28.44 26.93 10.10 48.36 73.20 97.58United Kingdom 166.28 158.36 826.48 821.21 868.42 955.56 990.26United States 1,537.41 1,934.13 1,805.46 3,585.94 5,298.82 5,486.13 7,241.77European Economic Area (EEA) - - - - 30.91 11.84 -
European Commission (EC)1 10.25 129.87 167.36 572.24 492.07 504.35 886.04
uNiTeD NATioNSJoint United Nations Programme on HIV/AIDS (UNAIDS) - - 148.41 388.88 326.68 289.99 207.30United Nations Population Fund (UNFPA) 366.81 450.40 445.46 556.73 949.29 992.10 1,066.02United Nations Children's Fund (UNICEF) 262.65 338.45 381.58 790.01 993.46 2,578.78 2,624.61Unitaid - - - - 54.27 83.05 154.06World Health Organization (WHO) 1,322.95 1,335.36 1,465.48 1,846.31 2,514.84 3,039.76 2,530.60Pan American Health Organization (PAHO) 190.35 190.04 202.93 184.12 250.39 265.79 267.52PuBLiC-PriVATe PArTNerSHiPSGavi, the Vaccine Alliance - - 2.92 386.26 835.26 1,750.25 1,769.00The Global Fund - - - 1,377.06 3,648.78 3,393.28 3,513.17Coalition for Epidemic Preparedness Innovations (CEPI) - - - - - - 139.78NgoS & FouNDATioNSGates Foundation - - 361.04 533.40 1,275.06 1,708.42 2,503.89Other foundations2 118.55 148.88 297.42 240.14 328.77 456.60 478.76Non-governmental organizations (NGOs) 573.89 1,097.79 1,815.43 3,937.20 9,981.19 10,566.67 9,766.70WorLD BANKInternational Bank for Reconstruction and Development (IBRD) 201.29 696.44 995.76 693.24 2,031.60 740.50 1,087.65International Development Association (IDA) 325.41 666.20 971.69 1,431.75 966.21 1,034.98 1,074.52regioNAL DeVeLoPMeNT BANKSAfrican Development Bank (AfDB) 79.68 88.56 54.64 187.03 99.68 40.94 15.45Asian Development Bank (ADB) 1.31 98.73 56.08 192.87 334.40 115.23 320.70Inter-American Development Bank (IDB) 99.52 202.52 245.81 356.12 147.20 840.44 282.23
ToTAL 7,798.47 10,464.25 12,350.16 21,803.23 35,190.42 37,875.66 40,557.47

170 | FINANCING GLOBAL HEALTH 2019
TABLe B5 Development assistance for health by recipient country, 1990–2017
recipient country 1990 1995 2000 2005 2010 2015 2017
Afghanistan 76.72 4.96 9.99 171.13 350.56 357.77 230.87
Albania 0.00 17.68 26.40 34.57 19.87 7.88 5.50
Algeria 0.08 0.06 1.47 2.75 4.14 2.16 1.89
Angola 16.31 53.76 37.79 138.26 101.53 108.82 127.98
Antigua and Barbuda 0.00 0.00 1.38 - 0.60 - -
Argentina 18.82 210.70 86.29 96.25 195.66 216.98 -
Armenia 0.04 0.84 17.44 21.07 34.64 13.87 16.74
Azerbaijan 0.02 0.01 20.81 12.80 31.31 10.37 14.27
Bahrain - - 0.03 - - - -
Bangladesh 154.12 123.23 261.45 255.69 311.48 399.85 480.45
Barbados 2.62 15.29 - 15.15 - - -
Belarus 0.00 0.05 0.25 8.79 21.37 7.67 12.79
Belize 7.40 0.48 2.98 2.47 4.48 5.99 3.31
Benin 17.45 16.14 31.95 74.02 106.40 97.27 158.39
Bhutan 20.52 0.94 3.83 9.70 3.04 5.41 2.87
Bolivia 58.46 52.23 106.72 78.96 83.50 60.43 67.58
Bosnia and Herzegovina 0.00 1.77 20.73 17.36 62.92 9.53 32.15
Botswana 21.38 23.30 2.12 31.17 128.92 72.35 86.34
Brazil 65.97 177.92 187.30 179.36 379.50 77.23 171.64
Bulgaria - 0.07 13.96 42.83 18.40 7.68 5.78
Burkina Faso 32.91 38.97 31.93 112.26 184.84 177.84 183.02
Burundi 10.07 14.77 12.72 48.68 116.86 116.35 163.68
Cambodia 0.74 162.24 53.24 139.46 211.82 179.32 162.38
Cameroon 19.58 3.61 15.50 65.08 73.16 172.20 276.55
Cape Verde - 0.38 1.41 15.81 13.56 13.27 3.75
Central African Republic 10.77 14.02 6.52 18.96 25.03 26.09 56.99
Chad 30.81 38.74 26.83 51.84 65.43 43.58 64.85
Chile 42.71 30.08 4.25 18.98 5.35 - -
China 58.90 167.39 211.76 260.49 358.15 130.95 237.19
Colombia 24.79 18.27 22.00 280.50 340.41 22.56 28.29
Comoros 0.61 11.19 2.21 3.28 13.19 5.15 7.22
Congo 21.79 13.59 1.23 8.97 34.94 14.91 22.28
Costa Rica 2.45 8.90 31.05 3.97 5.44 2.70 2.37
Côte d'Ivoire 46.96 119.24 14.94 60.24 227.27 176.61 309.53
Croatia - 23.61 4.71 19.00 - - -
Cuba 0.37 0.29 4.95 11.39 23.89 14.30 13.30
Czech Republic - 0.00 - - - - -
Democratic Republic of the Congo 41.77 17.68 30.80 171.56 460.42 565.01 655.37
Djibouti 10.22 8.82 5.31 15.69 8.63 15.30 12.07
Dominica 0.01 0.00 0.02 0.47 0.85 0.57 0.58
Dominican Republic 22.66 10.08 40.90 85.20 130.59 311.98 62.32
Ecuador 36.16 26.28 30.83 44.53 47.34 16.96 15.69
Egypt 67.38 149.54 114.58 130.20 82.21 54.34 97.83
El Salvador 50.37 50.80 31.51 44.71 83.83 35.76 55.97
Equatorial Guinea 0.26 1.06 5.62 12.56 - 3.89 10.04
Eritrea 14.84 13.40 34.19 45.57 60.26 18.51 42.51
Estonia - - 0.20 3.44 - - -

TABuLATED DATA | 171
recipient country 1990 1995 2000 2005 2010 2015 2017
Ethiopia 84.20 78.28 110.27 316.73 923.84 897.28 999.68
Federated States of Micronesia 0.89 0.23 0.27 30.32 2.88 12.05 1.25
Fiji 0.41 0.77 11.15 6.52 16.08 9.34 6.73
Gabon 2.20 0.23 2.99 9.73 5.77 5.61 62.57
Gambia 3.04 0.96 5.27 28.91 32.33 33.04 67.20
Georgia 0.05 0.68 20.90 39.42 48.65 37.61 28.96
Ghana 23.71 28.29 69.42 262.65 304.05 345.93 294.73
Grenada 12.74 0.00 0.03 0.47 0.60 0.82 2.21
Guatemala 30.35 27.60 44.08 49.45 93.88 391.82 75.54
Guinea 6.59 53.51 31.14 38.89 51.24 228.99 137.53
Guinea-Bissau 9.23 32.33 5.67 14.76 40.15 33.26 34.73
Guyana 7.69 5.76 2.24 29.02 38.45 9.71 9.47
Haiti 91.98 194.77 75.67 103.76 250.71 268.65 245.00
Honduras 57.71 25.90 54.15 88.39 63.93 62.67 31.96
Hungary - 2.05 3.62 0.10 - - -
India 429.82 482.68 674.76 884.09 1056.45 892.32 904.11
Indonesia 471.13 235.36 301.25 238.92 318.51 224.27 285.03
Iran 2.39 4.95 8.43 80.86 11.83 10.48 7.46
Iraq 3.53 7.69 2.36 581.06 98.29 20.12 23.19
Jamaica 29.95 40.07 22.33 17.83 47.91 14.41 25.18
Jordan 12.29 27.83 55.44 29.63 53.29 28.37 82.51
Kazakhstan 0.03 6.90 24.67 13.85 61.46 21.06 35.82
Kenya 257.18 102.75 142.28 305.10 848.49 927.55 1142.31
Kiribati 13.81 0.29 0.28 3.89 9.05 3.53 5.50
Kyrgyzstan 0.04 18.34 18.85 35.46 48.43 46.41 48.86
Laos 0.51 11.24 29.57 44.61 67.81 88.42 69.21
Latvia - 0.84 2.10 0.00 49.51 - -
Lebanon 3.58 26.51 9.88 4.37 14.16 18.32 20.87
Lesotho 5.48 2.71 4.83 18.34 94.37 50.54 105.25
Liberia 2.48 0.87 14.08 21.69 111.27 566.72 145.70
Libya 0.09 0.03 0.11 0.42 1.14 2.29 8.48
Lithuania - 4.97 1.28 2.66 9.62 - -
Macedonia 0.00 12.57 0.86 7.85 5.63 5.01 2.02
Madagascar 12.52 40.06 32.68 101.91 145.48 111.77 90.62
Malawi 113.70 54.92 114.56 164.80 282.99 458.92 559.91
Malaysia 23.43 53.00 17.30 2.11 0.56 3.73 5.21
Maldives 0.00 0.00 0.47 0.65 1.50 0.98 0.13
Mali 39.39 42.69 39.34 100.57 238.01 231.69 246.69
Marshall Islands 0.82 0.53 1.90 21.80 1.91 5.46 3.99
Mauritania 76.70 20.20 17.26 9.57 15.83 20.04 30.48
Mauritius 0.04 0.08 0.31 0.33 2.82 0.71 4.09
Mexico 83.50 158.03 456.16 109.65 670.01 117.49 113.37
Moldova 0.00 0.13 16.37 31.91 60.52 57.92 26.01
Mongolia 12.48 6.48 5.25 7.35 41.58 29.27 68.43
Montenegro 0.00 0.60 0.22 1.73 3.79 1.36 0.26
Morocco 36.22 44.66 71.72 167.96 92.94 59.92 182.90
Mozambique 155.46 88.59 141.96 277.90 593.30 646.29 798.54

172 | FINANCING GLOBAL HEALTH 2019
TABLe B5, CoNT. Development assistance for health by recipient country, 1990–2017
recipient country 1990 1995 2000 2005 2010 2015 2017
Myanmar 3.46 0.34 9.94 57.67 91.66 193.10 249.54
Namibia 9.54 13.94 10.59 47.66 180.08 79.07 126.00
Nepal 57.09 19.03 46.85 86.50 161.47 181.78 129.40
Nicaragua 37.85 44.25 67.28 94.14 84.02 84.57 91.12
Niger 20.91 28.03 21.44 49.42 77.70 88.19 99.60
Nigeria 72.52 33.23 243.94 423.18 958.39 1523.15 1290.38
North Korea 0.01 0.02 0.13 6.23 7.24 12.99 14.89
Oman 0.81 0.00 0.02 0.02 - - -
Pakistan 186.73 176.40 75.68 237.02 531.90 588.64 654.93
Palau 0.03 0.00 0.02 2.10 1.83 0.56 -
Palestine 0.07 18.12 52.70 73.45 77.23 29.60 97.02
Panama 0.38 8.21 13.10 10.24 7.75 25.19 -
Papua New Guinea 62.52 7.56 106.11 81.36 133.12 139.92 95.90
Paraguay 2.92 0.56 23.02 10.67 34.27 12.95 17.31
Peru 46.93 138.89 120.54 120.70 130.06 307.06 28.65
Philippines 142.05 169.92 104.42 231.62 209.16 297.22 309.55
Poland - 11.32 2.14 0.79 - - -
Romania - 50.37 0.36 14.63 27.14 15.60 82.24
Russia - 1.03 54.23 51.18 44.55 5.35 7.00
Rwanda 30.21 23.57 39.30 140.76 412.90 283.26 292.30
Saint Lucia 5.82 0.02 0.07 0.96 2.38 3.97 4.86
Saint Vincent and the Grenadines 0.00 0.42 0.05 0.45 1.33 4.54 1.25
Samoa 0.18 0.62 4.20 5.46 13.74 10.37 4.43
São Tomé and Príncipe 8.88 3.51 7.00 6.05 6.11 7.43 9.05
Saudi Arabia - - 0.06 - - - -
Senegal 36.21 43.27 52.64 150.56 144.57 182.63 252.47
Serbia 0.00 0.49 20.18 23.15 18.72 6.36 34.77
Seychelles 0.07 12.03 1.65 1.50 0.71 - -
Sierra Leone 4.22 4.61 26.76 46.38 74.65 581.78 166.51
Slovakia - - - 23.09 - - -
Slovenia - 0.59 - - - - -
Solomon Islands 3.91 1.09 6.24 16.64 36.46 28.11 29.03
Somalia 18.60 4.90 5.86 12.45 27.79 42.89 57.84
South Africa 11.04 22.13 63.51 266.55 884.95 587.96 829.72
South Korea 67.41 - 0.06 - - - -
South Sudan 8.40 8.90 6.48 38.72 98.88 192.61 214.71
Sri Lanka 19.16 11.53 17.93 24.40 63.20 77.38 113.13
Sudan 11.22 12.47 11.28 52.29 124.16 148.77 115.61
Suriname 23.06 26.65 7.17 15.30 19.43 6.39 6.00
Swaziland 5.51 3.24 3.46 33.48 86.51 60.57 118.29
Syria 1.06 0.02 0.61 18.52 20.43 10.79 67.14
Tajikistan 0.05 2.47 5.42 20.42 55.54 39.85 66.00
Tanzania 112.39 66.82 121.90 382.20 969.36 864.48 1137.28
Thailand 2.92 3.07 50.69 50.27 76.53 47.44 59.93
Timor-Leste 4.78 2.65 1.18 11.89 27.84 20.92 22.21
Togo 4.41 0.92 6.76 18.53 36.05 31.33 69.64
Tonga 0.19 0.66 0.75 17.78 10.29 4.28 5.75
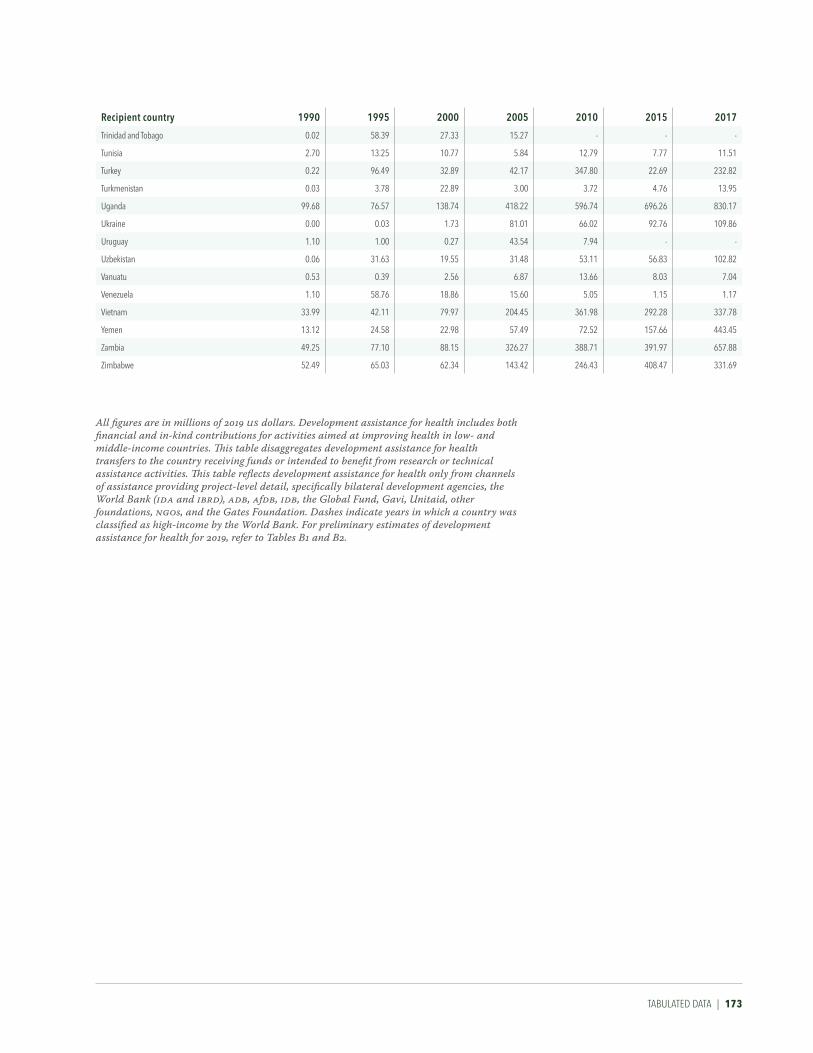
TABuLATED DATA | 173
recipient country 1990 1995 2000 2005 2010 2015 2017
Trinidad and Tobago 0.02 58.39 27.33 15.27 - - -
Tunisia 2.70 13.25 10.77 5.84 12.79 7.77 11.51
Turkey 0.22 96.49 32.89 42.17 347.80 22.69 232.82
Turkmenistan 0.03 3.78 22.89 3.00 3.72 4.76 13.95
Uganda 99.68 76.57 138.74 418.22 596.74 696.26 830.17
Ukraine 0.00 0.03 1.73 81.01 66.02 92.76 109.86
Uruguay 1.10 1.00 0.27 43.54 7.94 - -
Uzbekistan 0.06 31.63 19.55 31.48 53.11 56.83 102.82
Vanuatu 0.53 0.39 2.56 6.87 13.66 8.03 7.04
Venezuela 1.10 58.76 18.86 15.60 5.05 1.15 1.17
Vietnam 33.99 42.11 79.97 204.45 361.98 292.28 337.78
Yemen 13.12 24.58 22.98 57.49 72.52 157.66 443.45
Zambia 49.25 77.10 88.15 326.27 388.71 391.97 657.88
Zimbabwe 52.49 65.03 62.34 143.42 246.43 408.47 331.69
All figures are in millions of 2019 US dollars. Development assistance for health includes both financial and in-kind contributions for activities aimed at improving health in low- and middle-income countries. This table disaggregates development assistance for health transfers to the country receiving funds or intended to benefit from research or technical assistance activities. This table reflects development assistance for health only from channels of assistance providing project-level detail, specifically bilateral development agencies, the World Bank (IDA and IBRD), ADB, AfDB, IDB, the Global Fund, Gavi, Unitaid, other foundations, NGOs, and the Gates Foundation. Dashes indicate years in which a country was classified as high-income by the World Bank. For preliminary estimates of development assistance for health for 2019, refer to Tables B1 and B2.

174 | FINANCING GLOBAL HEALTH 2019
TABLe B6 Development assistance for health by health focus area and program area, 1990–2019
*2019 estimates are preliminary.
All figures are in millions of 2019 US dollars. Development assistance for health includes both financial and in-kind contributions for activities aimed at improving health in low- and middle-income countries. This table disaggregates development assistance for health earmarked for HIV/AIDS; maternal, newborn, and child health; malaria; tuberculosis; other infectious diseases; non-communicable diseases; and health systems strengthening and sector-wide approaches. "Other health focus areas" captures development assistance for health for which we have health focus area information but which is not identified as being allocated to any of the health focus areas listed. Contributions from remaining channels are shown as unallocable by disease.
Health focus areas and program areas 1990 1995 2000 2005 2010 2015 2019*
HiV/AiDS 379.20 828.11 1,386.73 5,570.10 11,428.64 8,696.18 9,479.42Drug resistance 0.02 0.04 0.55 0.22 16.99 4.09 4.08Care and support 3.39 10.80 26.09 251.56 778.53 704.47 796.24Counseling and testing 1.70 6.70 8.88 171.60 473.74 369.80 455.88Human resources 61.47 185.02 134.83 512.64 985.50 553.21 528.77Health systems strengthening 5.36 14.75 126.32 764.26 2,197.47 1,474.91 1,138.46Orphans and vulnerable children 3.99 8.97 19.52 137.48 570.39 427.81 499.51Prevention of mother-to-child transmission (PMTCT) 3.86 8.17 11.04 146.26 480.37 456.40 374.40Prevention (excluding PMTCT) 63.39 99.49 238.97 901.14 1,902.22 1,423.75 1,273.93Treatment 9.47 38.53 52.20 802.10 2,520.34 2,362.25 3,002.80Other 226.54 455.63 768.33 1,882.85 1,503.08 919.49 1,405.34MALAriA 62.46 65.96 175.04 757.56 2,324.20 2,181.90 2,330.08Antimicrobial resistance 0.00 0.00 0.00 0.32 7.26 1.52 4.00Community outreach 0.10 0.24 2.20 15.69 96.18 71.47 99.24Vector control including indoor residual spraying 0.00 0.00 0.00 11.48 70.81 125.07 145.83Bed nets 0.26 0.87 1.34 37.02 150.35 95.52 153.85Other control 0.25 0.87 2.74 39.93 254.04 159.94 197.12Diagnosis 0.00 0.55 0.24 9.56 71.54 70.15 91.02Human resources 0.57 3.34 2.55 30.13 163.56 241.69 164.62Health systems strengthening 0.61 4.07 4.98 67.65 419.37 404.77 432.14Treatment 1.31 4.17 18.93 189.01 484.13 386.57 372.56Other 59.35 51.86 142.06 356.77 606.96 625.20 669.69NoN-CoMMuNiCABLe DiSeASeS 134.77 133.83 193.00 174.33 483.68 622.38 735.00Human resources 25.13 37.92 39.18 48.73 161.90 118.88 118.30Health systems strengthening 3.05 3.82 5.75 20.48 19.59 50.89 58.25Mental health 65.13 10.72 66.40 33.90 50.24 96.28 155.09Tobacco 8.36 10.38 11.51 14.58 61.20 87.39 66.23Other 33.10 70.99 70.17 56.65 190.74 268.95 337.12NeWBorN AND CHiLD HeALTH 876.98 1,341.00 1,984.84 3,179.51 4,781.05 8,245.58 8,464.79Nutrition 160.90 466.42 363.99 570.90 1,176.58 1,946.75 1,908.87Immunization 373.35 335.09 401.03 1,319.03 1,430.21 2,796.97 3,092.17Human resources 52.44 74.60 295.90 266.07 465.78 520.49 550.15Health systems strengthening 37.90 81.68 122.86 183.34 403.26 731.30 1,222.66Other 252.38 383.21 801.05 840.17 1,305.23 2,250.06 1,690.94oTHer iNFeCTiouS DiSeASeS 139.76 266.00 935.67 824.29 1,477.11 3,601.77 2,402.22Antimicrobial resistance 0.00 0.00 1.14 0.00 1.28 1.86 5.34Ebola 2.20 2.88 8.60 5.07 16.89 1,552.70 183.70Human resources 4.87 9.91 13.41 33.19 64.73 157.47 199.83Health systems strengthening 8.70 8.55 10.46 22.11 91.00 196.34 280.30Zika 0.00 0.00 0.00 0.00 0.00 0.00 49.08Other 123.99 244.67 902.05 763.92 1,303.21 1,693.40 1,683.97reProDuCTiVe AND MATerNAL HeALTH 1,711.97 2,418.83 2,402.66 2,215.96 3,843.47 4,379.65 4,840.55Family planning 1,038.40 664.07 1,266.51 604.23 1,073.31 1,267.20 1,203.30Human resources 18.12 26.82 121.50 125.54 271.66 241.98 324.29Health systems strengthening 8.41 39.93 66.03 134.62 415.31 549.10 814.21Maternal health 421.93 1,253.44 466.30 746.64 1,412.65 1,498.87 1,465.40Other 225.11 434.57 482.31 604.93 670.55 822.50 1,033.34HSS/SWAPS 1,621.72 2,152.89 2,685.86 4,189.95 5,671.20 4,621.81 5,583.40Human resources 233.73 417.11 473.34 901.96 1,191.02 1,797.24 1,915.24Pandemic preparedness 50.85 57.68 78.46 79.12 185.78 363.07 373.82Other 1,337.14 1,678.10 2,134.07 3,208.87 4,294.39 2,461.50 3,294.35TuBerCuLoSiS 28.12 71.75 140.31 548.03 1,487.92 1,331.43 1,663.44Antimicrobial resistance 0.07 0.17 0.32 5.37 30.57 35.72 32.54Diagnosis 0.08 0.54 3.04 5.28 49.02 35.95 33.55Human resources 0.17 3.98 11.23 40.99 106.87 116.60 162.36Health systems strengthening 0.59 2.62 6.03 44.02 103.98 153.75 218.64Treatment 0.77 1.43 7.71 34.44 158.81 154.21 182.57Other 26.44 63.01 111.98 417.93 1,038.68 835.21 1,033.78oTHer HeALTH FoCuS AreAS 2,428.97 2,730.75 2,103.39 4,028.95 3,588.42 4,131.40 4,965.44uNALLoCABLe 414.52 455.13 342.66 314.55 104.72 63.56 93.14ToTAL 7,798.47 10,464.25 12,350.16 21,803.23 35,190.42 37,875.66 40,557.47

TABuLATED DATA | 175
Health focus areas and program areas 1990 1995 2000 2005 2010 2015 2019*
HiV/AiDS 379.20 828.11 1,386.73 5,570.10 11,428.64 8,696.18 9,479.42Drug resistance 0.02 0.04 0.55 0.22 16.99 4.09 4.08Care and support 3.39 10.80 26.09 251.56 778.53 704.47 796.24Counseling and testing 1.70 6.70 8.88 171.60 473.74 369.80 455.88Human resources 61.47 185.02 134.83 512.64 985.50 553.21 528.77Health systems strengthening 5.36 14.75 126.32 764.26 2,197.47 1,474.91 1,138.46Orphans and vulnerable children 3.99 8.97 19.52 137.48 570.39 427.81 499.51Prevention of mother-to-child transmission (PMTCT) 3.86 8.17 11.04 146.26 480.37 456.40 374.40Prevention (excluding PMTCT) 63.39 99.49 238.97 901.14 1,902.22 1,423.75 1,273.93Treatment 9.47 38.53 52.20 802.10 2,520.34 2,362.25 3,002.80Other 226.54 455.63 768.33 1,882.85 1,503.08 919.49 1,405.34MALAriA 62.46 65.96 175.04 757.56 2,324.20 2,181.90 2,330.08Antimicrobial resistance 0.00 0.00 0.00 0.32 7.26 1.52 4.00Community outreach 0.10 0.24 2.20 15.69 96.18 71.47 99.24Vector control including indoor residual spraying 0.00 0.00 0.00 11.48 70.81 125.07 145.83Bed nets 0.26 0.87 1.34 37.02 150.35 95.52 153.85Other control 0.25 0.87 2.74 39.93 254.04 159.94 197.12Diagnosis 0.00 0.55 0.24 9.56 71.54 70.15 91.02Human resources 0.57 3.34 2.55 30.13 163.56 241.69 164.62Health systems strengthening 0.61 4.07 4.98 67.65 419.37 404.77 432.14Treatment 1.31 4.17 18.93 189.01 484.13 386.57 372.56Other 59.35 51.86 142.06 356.77 606.96 625.20 669.69NoN-CoMMuNiCABLe DiSeASeS 134.77 133.83 193.00 174.33 483.68 622.38 735.00Human resources 25.13 37.92 39.18 48.73 161.90 118.88 118.30Health systems strengthening 3.05 3.82 5.75 20.48 19.59 50.89 58.25Mental health 65.13 10.72 66.40 33.90 50.24 96.28 155.09Tobacco 8.36 10.38 11.51 14.58 61.20 87.39 66.23Other 33.10 70.99 70.17 56.65 190.74 268.95 337.12NeWBorN AND CHiLD HeALTH 876.98 1,341.00 1,984.84 3,179.51 4,781.05 8,245.58 8,464.79Nutrition 160.90 466.42 363.99 570.90 1,176.58 1,946.75 1,908.87Immunization 373.35 335.09 401.03 1,319.03 1,430.21 2,796.97 3,092.17Human resources 52.44 74.60 295.90 266.07 465.78 520.49 550.15Health systems strengthening 37.90 81.68 122.86 183.34 403.26 731.30 1,222.66Other 252.38 383.21 801.05 840.17 1,305.23 2,250.06 1,690.94oTHer iNFeCTiouS DiSeASeS 139.76 266.00 935.67 824.29 1,477.11 3,601.77 2,402.22Antimicrobial resistance 0.00 0.00 1.14 0.00 1.28 1.86 5.34Ebola 2.20 2.88 8.60 5.07 16.89 1,552.70 183.70Human resources 4.87 9.91 13.41 33.19 64.73 157.47 199.83Health systems strengthening 8.70 8.55 10.46 22.11 91.00 196.34 280.30Zika 0.00 0.00 0.00 0.00 0.00 0.00 49.08Other 123.99 244.67 902.05 763.92 1,303.21 1,693.40 1,683.97reProDuCTiVe AND MATerNAL HeALTH 1,711.97 2,418.83 2,402.66 2,215.96 3,843.47 4,379.65 4,840.55Family planning 1,038.40 664.07 1,266.51 604.23 1,073.31 1,267.20 1,203.30Human resources 18.12 26.82 121.50 125.54 271.66 241.98 324.29Health systems strengthening 8.41 39.93 66.03 134.62 415.31 549.10 814.21Maternal health 421.93 1,253.44 466.30 746.64 1,412.65 1,498.87 1,465.40Other 225.11 434.57 482.31 604.93 670.55 822.50 1,033.34HSS/SWAPS 1,621.72 2,152.89 2,685.86 4,189.95 5,671.20 4,621.81 5,583.40Human resources 233.73 417.11 473.34 901.96 1,191.02 1,797.24 1,915.24Pandemic preparedness 50.85 57.68 78.46 79.12 185.78 363.07 373.82Other 1,337.14 1,678.10 2,134.07 3,208.87 4,294.39 2,461.50 3,294.35TuBerCuLoSiS 28.12 71.75 140.31 548.03 1,487.92 1,331.43 1,663.44Antimicrobial resistance 0.07 0.17 0.32 5.37 30.57 35.72 32.54Diagnosis 0.08 0.54 3.04 5.28 49.02 35.95 33.55Human resources 0.17 3.98 11.23 40.99 106.87 116.60 162.36Health systems strengthening 0.59 2.62 6.03 44.02 103.98 153.75 218.64Treatment 0.77 1.43 7.71 34.44 158.81 154.21 182.57Other 26.44 63.01 111.98 417.93 1,038.68 835.21 1,033.78oTHer HeALTH FoCuS AreAS 2,428.97 2,730.75 2,103.39 4,028.95 3,588.42 4,131.40 4,965.44uNALLoCABLe 414.52 455.13 342.66 314.55 104.72 63.56 93.14ToTAL 7,798.47 10,464.25 12,350.16 21,803.23 35,190.42 37,875.66 40,557.47


Financing Global Health 2019
Measuring Sustainable Developm
ent Goal Progress as a New Decade BeginsINSTITUTE FOR HEALTH M
ETRICS AND EVALUATION
INSTITUTE FOR HEALTH METRICS AND EVALUATION2301 Fifth Ave., Suite 600 Seattle, WA 98121 USA
Telephone: +1-206-897-2800 Fax: +1-206-897-2899 Email: [email protected]


![[EGYPT TII – 2019] [0] - Global Tobacco Index](https://static.fdokumen.com/doc/165x107/6319f6d81e5d335f8d0b611d/egypt-tii-2019-0-global-tobacco-index.jpg)