Financing Urban Shelter: Global Report on Human Settlements 2005 (Full report
297
-
Upload
pustral-ugm -
Category
Documents
-
view
0 -
download
0
Transcript of Financing Urban Shelter: Global Report on Human Settlements 2005 (Full report

FINANCING URBAN SHELTER

FINANCING URBAN SHELTER GLOBAL REPORT ON HUMAN SETTLEMENTS 2005
United Nations Human Settlements Programme
London and Sterling,VA
First published in the UK and USA in 2005 by Earthscan
Copyright © United Nations Human Settlements Programme (UN-Habitat), 2005
All rights reserved
United Nations Human Settlements Programme (UN-Habitat)PO Box 30030, Nairobi, KenyaTel: +254 2 621 234Fax: +254 2 624 266Web: www.unhabitat.org
DISCLAIMERThe designations employed and the presentation of the material in this publication do not imply the expression of any opinion whatsoever on the part ofthe Secretariat of the United Nations concerning the legal status of any country, territory, city or area, or of its authorities, or concerning delimitationof its frontiers or boundaries, or regarding its economic system or degree of development. The analysis, conclusions and recommendations of thereport do not necessarily reflect the views of the United Nations Human Settlements Programme, the Governing Council of the United NationsHuman Settlements Programme or its Member States
HS/752/05E
ISBN: 1-84407-211-8 paperback 1-84407-210-X hardback 92-1-131739-8 (UN-Habitat paperback)92-1-131740-1 (UN-Habitat hardback)
Typesetting by MapSet Ltd, Gateshead, UKPrinted and bound in Malta by Gutenberg PressCover design by Susanne HarrisIndex by Indexing Specialists (UK) Ltd
For a full list of publications please contact:
Earthscan8–12 Camden High StreetLondon, NW1 0JH, UKTel: +44 (0)20 7387 8558Fax: +44 (0)20 7387 8998Email: [email protected]: www.earthscan.co.uk
22883 Quicksilver Drive, Sterling, VA 20166-2012, USA
Earthscan is an imprint of James and James (Science Publishers) Ltd and publishes in association with the International Institute for Environment andDevelopment
A catalogue record for this book is available from the British Library
Library of Congress Cataloging-in-Publication Data has been applied for
Printed on elemental chlorine-free paper
FOREWORD
Reaching the objectives of the Millennium Declaration agreed by all governments will require us to achieve significantimprovement in the lives of slum dwellers. That, in turn, cannot be done without sound and sustainable economicdevelopment policies conducive to the establishment of a strong shelter sector. As emphasized in Financing Urban Shelter:Global Report on Human Settlements 2005, one of the key challenges in meeting the Millennium Declaration objective onslums is mobilizing the financial resources necessary for both slum upgrading and slum prevention by supplying new housingaffordable to lower income groups on a large scale.
In response to the Millennium Declaration objective of achieving a ‘significant improvement in the lives of at least 100million slum dwellers by 2020’, The Challenge of Slums: Global Report on Human Settlements 2003 presented the results ofthe first global slums assessment by the United Nations. It revealed a staggering number of slum dwellers – about 924 millionin 2001. The current projection is that, without concerted action by governments and their partners, the slum populationwill increase by slightly more than one billion in the next 25 years, to about two billion in 2030. Providing better shelter forall these will require better, more effective and sustainable financing mechanisms that truly benefit the poor.
Financing Urban Shelter: Global Report on Human Settlements 2005 provides a timely assessment of current trends inthe financing of urban shelter. It examines the characteristics and performance of conventional mortgage finance, highlightingits strengths and limitations. It further looks at the financing of social and rental housing, especially through subsidies, aswell as emerging trends in meeting the specific shelter finance needs of urban poor households.
The report shows that small housing loans, disbursed through housing microfinance institutions, are among the mostpromising developments in housing finance of the past decade. It also highlights the increasing popularity of sheltercommunity funds for upgrading informal and slum neighbourhoods. The growth of both financing mechanisms is a highlyencouraging response to the shelter needs of the urban poor, many of whom develop their housing incrementally inprogressive stages.
The report also emphasizes the need for robust and efficient conventional mortgage finance institutions, especially forthe middle- and upper-income groups that can afford the housing loans offered by such institutions. Experience has shownthat, without sustainable mortgage financing, higher income groups often resort to appropriating for themselves shelteropportunities developed for the poor.
It is my hope that, by highlighting the impacts of current shelter financing systems on low-income households, and byidentifying the types of financing mechanisms that appear to have worked for them, this report will contribute to the effortsof the wide range of actors involved in improving the lives of slum dwellers – including governments at the central and locallevels, as well as non-governmental and international organizations.
Kofi A. AnnanSecretary-General
United Nations

INTRODUCTION
Financing Urban Shelter: Global Report on Human Settlements 2005 examines the challenges of financing urban shelterdevelopment, focusing on the shelter needs of the poor and within the overall context of the United Nations MillenniumDevelopment target on slums. Recent estimates indicate that more than 2 billion people will be added to the number of urbandwellers in the developing countries over the next 25 years. If adequate financial resources are not invested in the developmentof urban shelter and requisite services, this additional population will also be trapped in urban poverty, deplorable housingconditions, poor health and low productivity, thus further compounding the enormous slum challenge that exists today.
In many developing countries, it is unlikely that conventional sources of funds will be available for investment on the scaleneeded to meet the projected demand for urban infrastructure and housing. Most poorly-performing countries continue to facedeficits in public budgets and weak financial sectors, and the contribution of official development assistance to the shelter sectoris generally insignificant. While city authorities have started to seek finance in national and global markets, this practice is only inits infancy. The report concludes that countries and cities will have to rely mainly on the savings of their citizens.
The report shows that mortgage finance has been expanding during the last decade and is increasingly available inmany countries, which was not the case 20 years ago. New mortgage providers have emerged, including commercial financialinstitutions and mortgage companies. However, the report emphasizes that only the middle and upper income householdshave access to such finance while the poor are generally excluded.
The report further highlights the continuing and necessary contribution of the public sector towards financing shelterfor the urban poor, as many households, even in developed countries, cannot afford home-ownership or market rents. Whilesocial housing is becoming less important in Europe and in countries with economies in transition, the need to provide shelterthat is affordable to low-income households still exists, including in developing countries.
Complete houses available through mortgage finance are well beyond the reach of the lower income groups, becausethey are unable to meet the deposit and income criteria set by conventional mortgage institutions. In this situation, themajority of urban poor households can only afford to build incrementally in stages, as and when financial resources becomeavailable. In response to this, microfinance institutions have started lending for low-income shelter development and havebecome very important in the last decade or so. The report also shows that guarantee schemes can, by providing creditenhancement, go a long way in broadening the appeal of microfinance institutions to lenders.
Another important trend in the last decade has been increasing interest in shelter community funds, which are oftenlinked to housing cooperatives as well as rotating savings and credit societies. Community-based financing of housing andservices has been used for both settlement upgrading and for building new housing on serviced sites. It has also been used toenhance the access of poor households to housing subsidies by providing bridge financing. The report concludes that, in lightof the general success of small loans and the increasing urbanization of poverty, community funds have many advantages forlow-income households.
Constraints to mobilizing financial resources for investment in shelter development are both financial and non-financialin nature. Non-financial constraints include land legislation that makes it difficult to use real estate as effective collateral, aswell as inappropriate national and local regulatory frameworks governing land use, occupancy and ownership. In light of this,the report analyses the role of secure tenure in housing finance and highlights the need for legal and institutional reformdesigned to protect the rights of both lenders and borrowers as well as to enhance access to credit.
Finally, Financing Urban Shelter: Global Report on Human Settlements 2005 emphasizes the fact that finance is onlyone dimension of securing sustainable solutions that can fill the gap between the two extreme outcomes of current systemsand processes: affordable shelter that is inadequate; and adequate shelter that is unaffordable. The report therefore concludesthat the locus of policy attention should be on both the cost of housing (the supply side) and the level of payment received byworkers (the demand side). I believe that this report will help governments, local authorities and all Habitat Agenda Partnersto identify opportunities for addressing the shelter affordability gap and to put in place financing mechanisms that are moreable to meet the shelter needs of the urban poor.
Anna Kajumulo TibaijukaUnder-Secretary-General and Executive Director
United Nations Human Settlements Programme (UN-Habitat)
ACKNOWLEDGEMENTS
Preparation of the Global Report series would not be possible without the dedicated assistance of eminent urban researchers,practitioners and policy-makers, whose knowledge and expertise have always been helpful in the production of this series.The current volume, departing from the findings and recommendations of the 2003 Global Report, deals with issues of thefinancing of urban shelter development. With the selection of this topic, the Global Report series reflects UN-Habitat’s strongcommitment to the goals of sustainable human settlements development, as outlined in the Habitat Agenda and Agenda 21.The Report is also guided by further decisions adopted by the Governing Council of the United Nations Human SettlementsProgramme and by the General Assembly of the United Nations. The Millennium Development Goals and the tasks aheaddetermine the overall motif and tone of this issue of the Global Report.
Financing Urban Shelter: Global Report on Human Settlements 2005 was prepared under the general guidance ofDonatus Okpala, Acting Director of the Monitoring and Research Division. Naison Mutizwa-Mangiza, Chief of the PolicyAnalysis, Synthesis and Dialogue Branch, supervised the preparation and editing of the report, with Iouri Moisseev managingits preparation.
Members of the UN-Habitat Senior Management Board provided strategic advice in the areas of their respectiveresponsibility at different stages in the preparation of the report. These included: Alioune Badiane, Nefise Bazoglu, DanielBiau, Axumite Gebre-Egziabher, Jorge Gavidia, Lucia Kiwala, Madhab Mathema, Joseph Mungai, Jane Nyakairu, LarsReutersward, Sharad Shankardass, Anathakrishnan Subramonia, Paul Taylor, Farouk Tebbal and Rolf Wichmann.
The Report benefited from a number of international meetings. Firstly, it should be mentioned that, during 2004, theGlobal Research Network on Human Settlements (HS-Net) was established to provide guidance in the preparation of theGlobal Report series. HS-Net focuses on sharing policy-orientated research results and its meetings are organized by UN-Habitat’s Policy Analysis, Synthesis and Dialogue Branch. At its meeting in November 2004, HS-Net reviewed and discussedthe outline and contents of the 2005 Global Report. The meeting was attended by the following experts: Marisa Carmona,Department of Urban Renewal and Management, Faculty of Architecture, Delft University of Technology, Netherlands;Suocheng Dong, Institute of Geographic Sciences and Natural Resources Research, Chinese Academy of Sciences, China;Alain Durand-Lasserve, Sociétés en Développement dans l’Espace et dans le Temps, Universite Denis Diderot, France; JozsefHegedüs, Metropolitan Research Institute, Varoskutatas Kft, Hungary; Paola Jiron, Housing Institute, University of Chile,Chile; Vinay Lall, Society for Development Studies, Indian Habitat Centre, India; Om Prakash Mathur, National Institute ofPublic Finance and Policy (IDFC), India; Diana Mitlin, Institute for Development Policy and Management (IDPM), Universityof Manchester, UK; Winnie Mitullah, Institute of Development Studies (IDS), University of Nairobi, Kenya; James G. Mutero,Human Settelements Consultant, Kenya; Peter Ngau, Department of Urban and Regional Planning, University of Nairobi,Kenya; Tumsifu Jonas Nnkya, Institute of Housing Studies and Building Research, University College of Lands and ArchitecturalStudies, University of Dar es Salaam,Tanzania; Gustavo Riofrio, Centro de Estudios y Promoción del Desarrollo (DESCO),Peru; Nelson Saule, Instituto de Estudios Formacao e Assessoria em Politicas Sociais (POLIS), Brazil; Mona Serageldin, Centrefor Urban Development Studies, Harvard University Graduate School of Design, US; Dina K. Shehayeb, Housing and BuildingResearch Centre, Egypt; Richard Stren, Centre of Urban and Community Studies, University of Toronto, Canada; Riad Tabbarah,Centre for Development Studies and Projects, Lebanon; A. Graham Tipple, School of Architecture, Planning and Landscape,University of Newcastle upon Tyne, UK; Luidmila Tkachenko, Institute of Moscow City Master Plan, Russian Federation; JoseLuis Lezama de la Torre, Center for Demographic, Urban and Environmental Studies, Mexico; Vladimer Vardosanidze, Instituteof Architecture, Georgia; Patrick Wakely, University College of London, Development Planning Unit, UK; Mutapha Zubairu,Centre for Human Settlements and Urban Development, Federal University of Technology, Nigeria.
The outcomes of the expert group meetings organized by UN-Habitat’s Urban Economy and Finance Branch providedvaluable ideas towards the conceptualization and preparation of the report. The expert group meetings were concerned withassessing the impacts of macroeconomic factors on urban growth as well as the role of microfinance in human settlementsdevelopment. Some insights were also provided by the meeting of the International Union of Economists that took place inNairobi in February 2005. The theme of the meeting was financing shelter and urban development. In particular, a majorbackground paper prepared by V. Ivanter, O. Ptchelintsev, N. Nozdrina, M. Minchenko and E. Shcherbakova was very helpful.
Background papers and drafts of sections of the report were prepared by a number of expert urban researchers andscholars, including: Gabriella Carolini, Columbia University, US; Michael Cohen, New School University, New York, US;Pietro Garau, University of Rome, Italy; David Jones, Harvard University Graduate School of Design, US; Diana Mitlin, IDPM,
University of Manchester, UK; Elliott Sclar, Columbia University, US; Mona Serageldin, Harvard University Graduate Schoolof Design, US; Elda Solloso, Harvard University Graduate School of Design, US; Graham Tipple, University of Newcastle uponTyne, UK; and François Vigier, Harvard University Graduate School of Design, US. Research assistance for preparation ofbackground papers and data analysis was provided by Shannon Bassett, Harvard University Graduate School of Design, US;Deanna Fowler, New School University, New York, US; Balakrishna Menon, Harvard University Graduate School of Design,US; and Luis Valenzuela, Harvard University Graduate School of Design, US.
The following staff members of UN-Habitat were involved in the preparation of the Statistical Annex: Iouri Moisseev,Guenter Karl, Gora Mboup and Markandey Rai. Eduardo Moreno and the staff of the Global Urban Observatory Sectionassisted with data analysis and checking. Philomena Fernandes assisted in data processing and preparation of the camera-ready copy of the Annex, while Phillip Mukungu provided technical assistance in data checking. Several professionals ofUN-Habitat made other valued contributions. In particular, the following staff kindly gave their time amidst competingdemands: Clarissa Augustinus, Selman Erguden, Yejin Ha, Inge Jensen, Uwe Lohse, Tatiana Roskoshnaya, Ananda Weliwitaand Christopher Williams.
In addition, many other people, whose names are not listed here, were helpful in reviewing and commenting on drafts,making valuable contributions to the report, compiling data, preparing graphs, contributing information and in a variety ofother ways. The report also benefited from consultations with colleagues in many international organizations. Finalization ofthe Report, its structural organization and substantive editing was carried out by Iouri Moisseev and Naison Mutizwa-Mangiza,under the overall direction of Donatus Okpala and with editorial support from Pamela Murage.
Karina Rossi and Antoine King, of UN-Habitat, as well as Josie Villamin, of the United Nations Office at Nairobi (UNON),provided administrative support during the preparation of the report. Design support was provided by Pouran Ghaffaroup andJinita Shah. Secretarial and general administrative support was provided by Mary Kariuki, Mary Dibo, Josephine Gichuhi,Ramadhan M. Indiya, Pamela Murage, Stella Otieno and Florence Bunei of UN-Habitat.
Special thanks are due to the Governments of Germany, Italy and The Netherlands for their earmarked contributionsto the United Nations Habitat and Human Settlements Foundation in support of research inputs to the Global Report series.Special thanks are also due to the staff at James & James/Earthscan, in particular Jonathan Sinclair Wilson, Publishing Director;Victoria Brown, Editor; Hamish Ironside, Production Editor; and Andrea Service, who copy-edited the report.
viii Financing Urban Shelter

CONTENTS
Foreword vIntroduction viAcknowledgements viiList of Figures, Boxes and Tables xvList of Acronyms and Abbreviations xviiiKey Issues, Findings and Messages xxiiiMDG Special Feature: Financing the Target on Slums xxviiSynopsis xxxii
PART IECONOMIC AND URBAN DEVELOPMENT CONTEXT
1 Challenges of Sustainable Shelter Development in Macroeconomic Context 3Understanding Urban Shelter Development Challenges 3
Demographic framework 3Translating demographic growth into the demand for housing and infrastructure 4Socio-behavioural framework 5Economic framework 5Environmental framework 7Financial framework 7
International development aid 7Foreign direct investment 8National public investment in shelter 8Valuing urban assets 8
Governance framework 9Mobilizing finance: removing constraints and reducing risks 9
Addressing shelter and infrastructure standards 9Constraints to mobilizing resources 10Risks to providers of finance for low-income households 10
The Macroeconomic Context of Urban Shelter Development 10Patterns of economic growth 10Sectoral performance and productivity 11Income distribution and inequality 11Poverty and employment 12Savings 13External debt 13Patterns of investment 14
Foreign investment 14Public investment 15Private investment 15
The impact of external factors on macroeconomic performance 17The urbanization of national economies 17
Concluding Remarks 17Notes 18

2 Shelter Policy and Finance: Retrospective Overview 19Context to International Thoughts on Financing for Urban Development 19Trends in Shelter and Municipal Finance Development: 1972–2004 21
Between 1972 and 1982: Habitat I 21The project approach 21Self-help 21Who took part in and benefited from the projects? 22
Towards financial sustainability: the 1980s 23Structural adjustment: towards macroeconomic orthodoxy 24The birth of the enabling strategy: the mid 1980s 25Sustainability and the Brown agenda 25Whole-sector development: 1987 onwards 26
The Global Strategy for Shelter 26Focus on building institutional capacity to develop housing and urban services 27Finance capital in development 28
Globalization of Finance 29The New Millennium: Policies and Organizations in Shelter and Urban Development 30
The Habitat Agenda 30Reaching the lowest income groups: community-based finance 30The right to housing 30
Concluding Remarks 31Notes 32
3 Financing Urban Development 34Municipal Finance and Urban Development: The Main Issues 34National Municipal Finance Systems 35Sources of Municipal Finance 37
Transfers 37Taxes on property and businesses 38User fees 39Betterment taxes and development exactions 40Borrowing 40
Short-term borrowing 41Credit enhancement, access to financial institutions and capital markets 41
Income-generating enterprises 42Municipal development funds 42Other sources 42
Municipal Spending Patterns 43Local government budgeting 43
Participatory budgeting 44Multi-year capital budgeting 44Lack of funds for maintaining existing assets 44
Managing municipal expenditures 45Accountability and transparency 45
Privatization of Municipal Services 47Key features 47Challenges of privatizing urban services 47Joint funding of infrastructure and urban services 48Joint funding of community-based initiatives for the delivery of basic services 48New trends in partnerships for local development 48
Summing Up: Assessing the Effectiveness and Impacts of Municipal Finance Systems 49Municipal finance and sustainable urban development 49Municipal finance and the delivery of land and services 49Impact of decentralization upon municipal finance and service delivery 50Impact of privatization upon municipal finance and service delivery 51
Notes 51
x Financing Urban Shelter
PART IISHELTER FINANCE: ASSESSMENT OF TRENDS
4 Mortgage Finance: Institutions and Mechanisms 55Highlights 55
Cost of houses and need for mortgage finance 55Mortgage finance and poverty 55
Recent Trends 56General trends related to providers 56Sources of finance 58Strengthening secondary markets 59State support for housing finance 61Direct construction and loans 62Taxation-related incentives 63Interest rate subsidies 63Securing stability: insurance and guarantees 64
Regional Analysis 65The North 66Transition countries 67The South 69
Asia 71Latin America 74Sub-Saharan Africa 75
Terms and Conditions 76Loan periods and loan-to-value ratios (LTVs): accessing loans 76Savings 77Interest rates 78
Housing Finance, Affordability and Lower Income Households 79The price of housing 79The cost of housing – and the response of supply to increased demand 80The implications for homeownership for the young 80More general problems of affordability 81The continuing problem of informality 83Assessing systemic risks 84
Notes 84
5 Financing for Social and Rental Housing 87Conditions and Trends 88
State rental housing in the North 88State rental housing in transition countries 90Rental housing in the South 91Social housing and homeownership 91
Challenges 95Poor location due to market choice and financial shortage 96
Notes 97
6 Small Loans: Shelter Microfinance 98Small Loan Challenges 98
Incremental development 99Access to financial services 99Microfinance: what is it? 101
The Growth of Microfinance for Shelter 102Links to formal financial agencies 104The microfinance institution (MFI) experience: enterprise to housing loans 105Reasons for expansion of MFIs into housing 106Neighbourhood improvement (slum upgrading) 106Land development 108
Other Providers and Sources of Finance 109Sources of capital finance 112
xiContents

Shelter microfinance and subsidies 113Terms and Conditions 113
Savings 114Collateral and security 114Interest rates 115Loan periods 115Technical assistance 115Orientation towards women 116Income generation 116
Foreseen Challenges 117Affordability 117Securing capital 117
Notes 119
7 Community Funds 120What Are Community Funds? 120Trends 122Funding Sources 126Terms and Conditions 129
Strengthening collective capacity: savings 129Interest rates 130Collateral and security 131Loan periods 132Technical assistance 132Income generation 133
Challenges 133Long-term strategies for continued viability 133The challenge of inclusion 134
Notes 135
PART IIITOWARDS SUSTAINABLE SHELTER FINANCE SYSTEMS
8 Assessing Shelter Finance Systems 139Affordability and the Difficulties of Reaching the Poor 140
The role of finance: relationship-building 142The Role of Mortgage Finance: Access to Capital and the Lack of Loan Finance 142The Bigger Picture and What the Market Cannot Manage 143
Financial risks 144The need for local organization 144The issue of urban development 144
Connections and Diversity within Globalization 145No global financial flows in housing 145
Concluding Remarks 146Notes 146
9 Policy Directions Towards Sustainable Urban Shelter Finance Systems 147Towards Inclusive Urban Infrastructure and Services 148
Financing for municipalities and service providers 148Public-sector inadequacy to the task 148Balancing local, provincial and national financing 148Importance of a municipal capital financing fund 149Debt swaps 149Betterment levies 149Improving tax collection 149Strengthening property tax systems 149Managing borrowing and debts 149
xii Financing Urban Shelter
Adjusting charges for local services 150Improving maintenance to reduce expenditure 150Private finance 150
Improving the efficiency of resource use 150Multi-year programmes and budgets 150Participatory budgeting 150Government as creditor of local authorities and service providers 150Eliminating corruption 151Reducing the cost of urban services 151
Enhancing households’ willingness and ability to pay 151Income and employment 151Reducing transaction costs 151
Strengthening the Sustainability and Performance of Shelter Finance Systems 152Reducing housing costs 152Enabling household decision-making through more effective policy 152Addressing the need for rental accommodation 152Contractor financing 153Development of ‘developers’ 153Reducing financing constraints and risks 153
Financing informal development 153Savings and debt 153
Improving the accessibility of mortgage finance 154Terms of housing loans 155The price of housing 155
Recognizing the need for incremental loans 156Lending based on the idea of housing as a productive good 156Enhancing pro-poor formal housing finance systems 156
Subsidies 156Social housing 157Incentives for investment in low-income rental housing 158
Small loans and housing microfinance 159The issue of default among low-income borrowers 160Guarantees 160Widening the scope of housing microfinance 160Credit for building materials 160Remittances 160The role of charity in low-income housing 161
Strengthening community-based funding mechanisms 161Notes 162
Epilogue: Towards Sustainable Urban Shelter 163First Element: Abating Housing Costs 165
Capital 165Land 166Infrastructure and land-use planning 166Building materials 166Standards 166Design 167Location 167Modes of production and delivery 167
Second Element: Increasing Purchasing Power 168Synergizing the Two: Lower Housing Prices and Higher Incomes 169
Capital 169Infrastructure and land-use planning 170Building materials and standards 170Design 170Modes of production 170
Formulating and Implementing Urban Shelter Policies: Sheltering the Poor from ‘Market Poaching’ 170‘High-end poaching’ in attractive urban locations 170
xiiiContents

‘Residential poaching’ in the urban periphery 171‘Mortgage finance poaching’ 171Political commitment and policy reform as the key to sustainable shelter 171Local engagement in the pursuit of the Millennium Development Goals (MDGs): the Millennium Towns and Cities Campaign 172
Concluding Remarks 172Notes 173
PART IVSTATISTICAL ANNEX
Technical Notes 177Explanation of Symbols 177Country Groupings and Statistical Aggregates 177
World major groupings 177United Nations Regional Groups 177Countries in the Human Development aggregates 178Countries in the income aggregates 178Sub-regional aggregates 179
Nomenclature and Order of Presentation 179Definition of Statistical Terms 180Sources of Data 184Notes 185
Data Tables 186Regional Aggregates 186
A.1 Demographic indicators 186A.2 Shelter indicators 187A.3 Social indicators 188
Country-Level Data 189B.1 Urbanization, urban population and urban slum dwellers 189B.2 Total and rural population size and rate of change 192B.3 Households: Total number and rate of change 195B.4 Household’s consumption indicators 197B.5 Environmental infrastructure 199B.6 Basic economic indicators 202B.7 Investment in infrastructure and foreign direct investment 204B.8 Energy and transport infrastructure 207B.9 Social indicators 209
City-Level Data 212C.1 Urban agglomerations: Population size and rate of change 212C.2 Housing and basic services, selected cities 218C.3 Urban transport and environment, selected cities 221C.4 Social indicators, selected cities 224
References 228Index 237
xiv Financing Urban Shelter
LIST OF FIGURES, BOXES AND TABLES
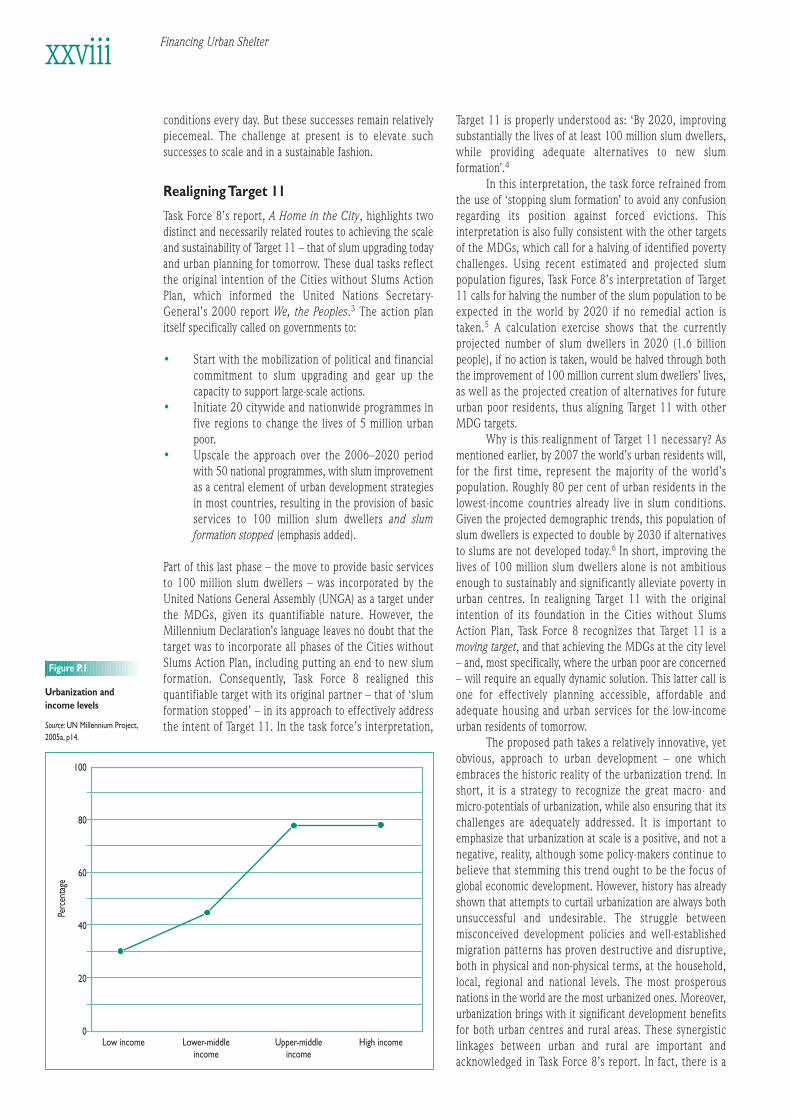
FIGURESP.1 Urbanization and income levels xxvii1.1 Official development assistance (percentage of GNI), 2002 81.2 Gross foreign direct investment (percentage of GDP), 2001 81.3 Regional income/consumption inequality patterns 121.4 Population below income poverty lines in five developing regions 121.5 Debt service, 2002 131.6 Official development assistance, selected countries, average during 1995–2000 163.1 Structure of local expenditure in Indonesia, 1997–2002 454.1 The bundled home mortgage delivery system 604.2 The unbundled mortgage delivery system 606.1 The Community-led Infrastructure Financing Facility (CLIFF) process 108
BOXES1.1 Demonstrating the foreign direct investment and official development assistance paradox: the case of Mali 81.2 Key features of slum upgrading projects 101.3 Poverty reduction strategy papers 131.4 Housing Development and Finance Corporation (HDFC) in India 172.1 Seven-point conceptualization of whole-sector development 262.2 Urban Management Programme 272.3 Housing finance institutions during the 1990s 292.4 Commitments on shelter finance, Habitat Agenda, 1996 312.5 Housing rights in South Africa 323.1 Development and equalization strategies under adverse economic conditions: Indonesia’s fiscal
decentralization process 363.2 Linkage fees in Boston, US 373.3 The role of special purpose vehicles in China 373.4 Côte d’Ivoire: challenges constraining the taxation of property and businesses 403.5 The challenges of borrowing 413.6 Tamil Nadu Urban Development Fund (TNUDF), India 433.7 Participatory budgeting in Brazil 443.8 Multi-year capital investment planning, Szczecin, Poland 453.9 Brazil’s law of fiscal responsibility 463.10 Accounting for the financial cost of urban services 463.11 Granting concessions for the operation of revenue-earning services: the experience of Abidjan, Côte d’Ivoire 484.1 Reductions in general subsidies to housing 564.2 Zambia: a brief history of state involvement in housing finance 584.3 The role of the Government Housing Bank in Thailand 594.4 Strategies to strengthen secondary markets in the US 614.5 Government support for mortgage finance in the Philippines 624.6 Financing homeownership in Singapore 634.7 Mexico: interest rate subsidies 644.8 The expansion of homeownership in the US 694.9 Land titles and mortgage finance in Peru 694.10 Deregulation of housing finance in the Republic of Korea 72
xvi Financing Urban Shelter
4.11 Bangladesh House Building Finance Corporation 734.12 The move to homeownership in China: Guangzhou Province 734.13 Extending housing finance in Mexico 744.14 Reducing lender risk in Mexico 754.15 Private development of affordable housing in India 824.16 Mortgage finance: problems with down-marketing in South Africa 845.1 Regulations, policies or subsidies? 885.2 Public housing in New York 895.3 Funding social housing in the European Union (EU) 905.4 The right to buy in China 915.5 The National Fund for Popular Housing, Brazil 925.6 The politicization of housing finance in India 925.7 The Chilean approach to housing subsidies 935.8 Costa Rica: savings, subsidies and loans 945.9 An assessment of direct-demand subsidies by the World Bank 955.10 The Chilean housing subsidy and the quality of dwellings 966.1 Housing finance for low-income households in Hyderabad, India 1006.2 Sanitation revolving fund in Kitale, Kenya 1036.3 Launching a housing microfinance product: Mibanco, Peru 1036.4 Proa: learning how to offer shelter loans 1046.5 Humanitarian housing interventions in Mexico 1046.6 Step-by-Step programme in Peru and Ecuador 1056.7 Assessing the demand for housing finance 1066.8 The local development programme (PRODEL) in Nicaragua 1076.9 Community-led Infrastructure Financing Facility (CLIFF) and bottom-up neighbourhood development 1086.10 Mexico and remittances 1116.11 From self-help group to housing co-operative in Kenya 1126.12 Acquiring loan finance in South Africa 1126.13 Swedish International Development Agency (SIDA) assistance to low-income housing in Central America 1136.14 Self-employed Women’s Association (SEWA) interest rates for housing, India 1156.15 Grameen Bank loan package, Bangladesh 1166.16 Improving shelter, improving health 1187.1 The Urban Poor Development Fund in Cambodia 1217.2 Addressing urban poverty with community funds 1217.3 Catholic Social Services in Pakistan 1227.4 Fondo Nacional de Habitaciones (FONHAPO), Mexico 1237.5 Community Mortgage Programme (CMP), the Philippines 1247.6 The evolution of shelter improvement strategies in Thailand 1247.7 A community fund for electricity services in Peru 1257.8 Build Together, Namibia 1267.9 Adding value: the uTshani Fund, South Africa 1277.10 Funding water improvements in Pakistan 1287.11 Alternatives to relocation in Thailand 1307.12 Determining housing interest at the Urban Community Development Office (UCDO), Thailand 1327.13 Group credit for housing loans: strengthening the Community Mortgage Programme (CMP) in the Philippines 1329.1 Pitfalls of providing financial support to private developers in India 1539.2 Hogar de Cristo, Chile 1579.3 Low-income rental housing: encouraging self-help landlords 158
Sources for text in boxes are attributed in notes beneath each box unless the material was originally written for this report, in which case no source is listed.
xviiList of figures, boxes and tables
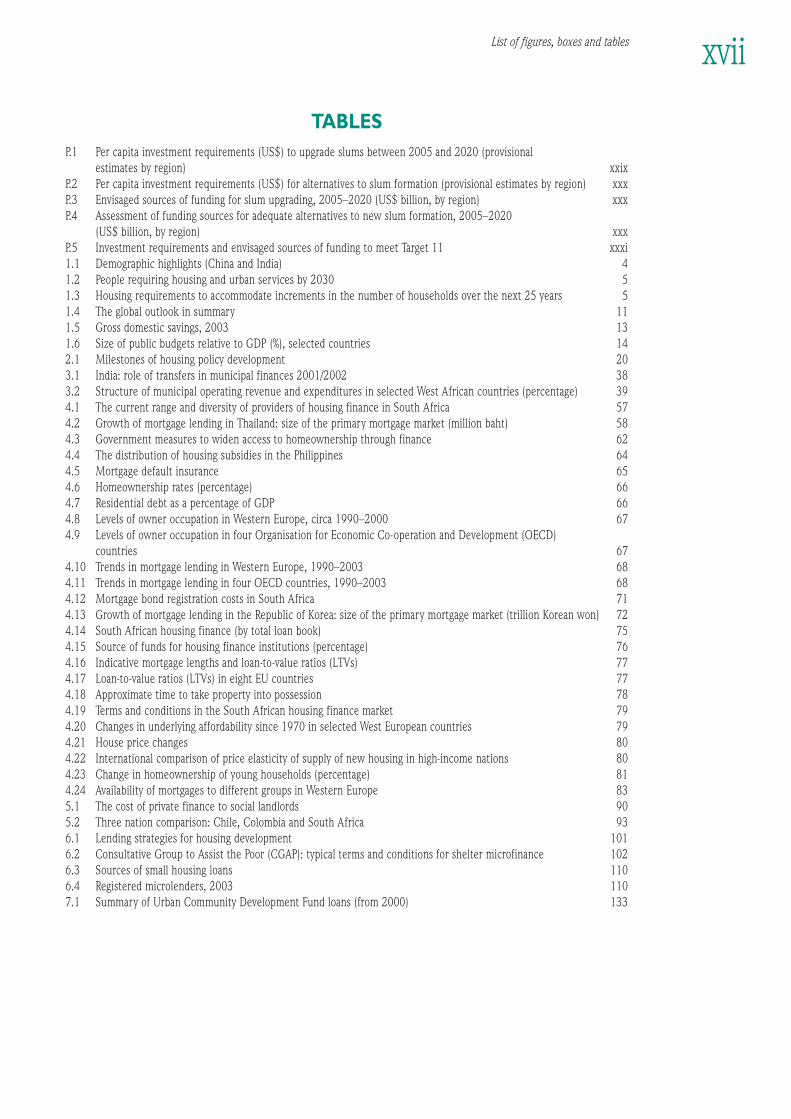
TABLESP.1 Per capita investment requirements (US$) to upgrade slums between 2005 and 2020 (provisional
estimates by region) xxixP.2 Per capita investment requirements (US$) for alternatives to slum formation (provisional estimates by region) xxxP.3 Envisaged sources of funding for slum upgrading, 2005–2020 (US$ billion, by region) xxxP.4 Assessment of funding sources for adequate alternatives to new slum formation, 2005–2020
(US$ billion, by region) xxxP.5 Investment requirements and envisaged sources of funding to meet Target 11 xxxi1.1 Demographic highlights (China and India) 41.2 People requiring housing and urban services by 2030 51.3 Housing requirements to accommodate increments in the number of households over the next 25 years 51.4 The global outlook in summary 111.5 Gross domestic savings, 2003 131.6 Size of public budgets relative to GDP (%), selected countries 142.1 Milestones of housing policy development 203.1 India: role of transfers in municipal finances 2001/2002 383.2 Structure of municipal operating revenue and expenditures in selected West African countries (percentage) 394.1 The current range and diversity of providers of housing finance in South Africa 574.2 Growth of mortgage lending in Thailand: size of the primary mortgage market (million baht) 584.3 Government measures to widen access to homeownership through finance 624.4 The distribution of housing subsidies in the Philippines 644.5 Mortgage default insurance 654.6 Homeownership rates (percentage) 664.7 Residential debt as a percentage of GDP 664.8 Levels of owner occupation in Western Europe, circa 1990–2000 674.9 Levels of owner occupation in four Organisation for Economic Co-operation and Development (OECD)
countries 674.10 Trends in mortgage lending in Western Europe, 1990–2003 684.11 Trends in mortgage lending in four OECD countries, 1990–2003 684.12 Mortgage bond registration costs in South Africa 714.13 Growth of mortgage lending in the Republic of Korea: size of the primary mortgage market (trillion Korean won) 724.14 South African housing finance (by total loan book) 754.15 Source of funds for housing finance institutions (percentage) 764.16 Indicative mortgage lengths and loan-to-value ratios (LTVs) 774.17 Loan-to-value ratios (LTVs) in eight EU countries 774.18 Approximate time to take property into possession 784.19 Terms and conditions in the South African housing finance market 794.20 Changes in underlying affordability since 1970 in selected West European countries 794.21 House price changes 804.22 International comparison of price elasticity of supply of new housing in high-income nations 804.23 Change in homeownership of young households (percentage) 814.24 Availability of mortgages to different groups in Western Europe 835.1 The cost of private finance to social landlords 905.2 Three nation comparison: Chile, Colombia and South Africa 936.1 Lending strategies for housing development 1016.2 Consultative Group to Assist the Poor (CGAP): typical terms and conditions for shelter microfinance 1026.3 Sources of small housing loans 1106.4 Registered microlenders, 2003 1107.1 Summary of Urban Community Development Fund loans (from 2000) 133
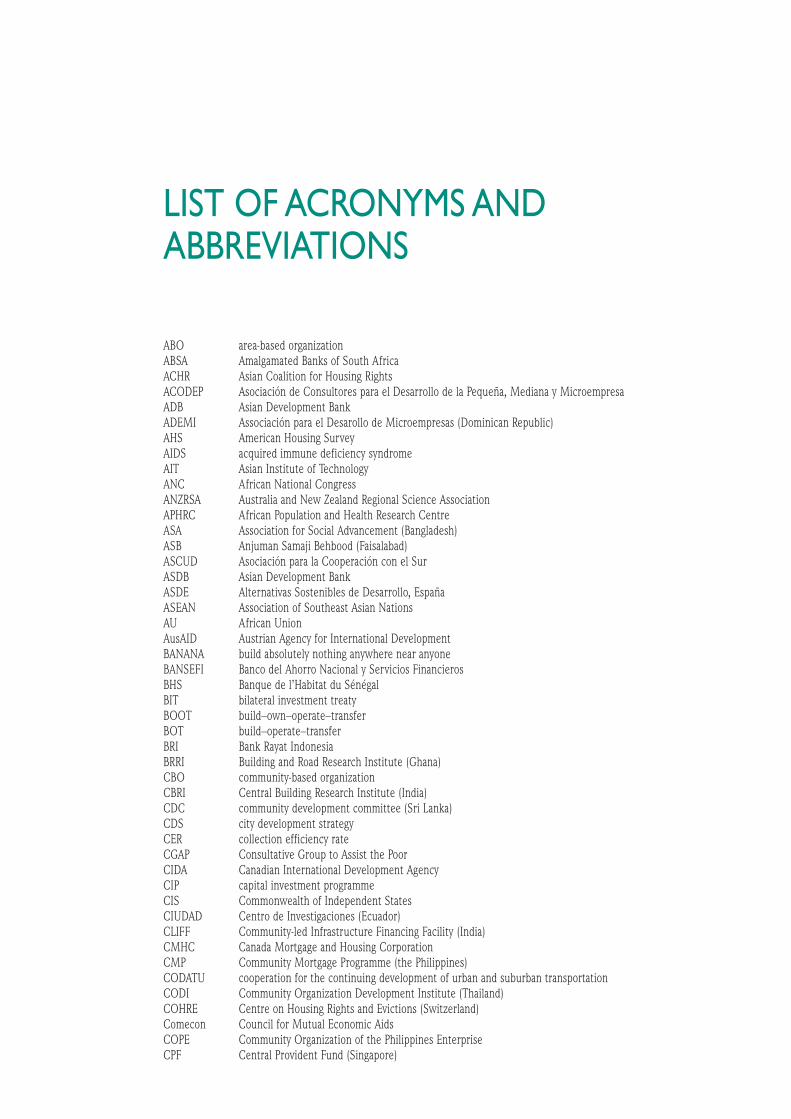
LIST OF ACRONYMS ANDABBREVIATIONS
ABO area-based organizationABSA Amalgamated Banks of South Africa ACHR Asian Coalition for Housing RightsACODEP Asociación de Consultores para el Desarrollo de la Pequeña, Mediana y MicroempresaADB Asian Development Bank ADEMI Associación para el Desarollo de Microempresas (Dominican Republic)AHS American Housing Survey AIDS acquired immune deficiency syndromeAIT Asian Institute of TechnologyANC African National CongressANZRSA Australia and New Zealand Regional Science AssociationAPHRC African Population and Health Research CentreASA Association for Social Advancement (Bangladesh)ASB Anjuman Samaji Behbood (Faisalabad)ASCUD Asociación para la Cooperación con el SurASDB Asian Development BankASDE Alternativas Sostenibles de Desarrollo, EspañaASEAN Association of Southeast Asian NationsAU African UnionAusAID Austrian Agency for International DevelopmentBANANA build absolutely nothing anywhere near anyoneBANSEFI Banco del Ahorro Nacional y Servicios Financieros BHS Banque de l’Habitat du SénégalBIT bilateral investment treatyBOOT build–own–operate–transferBOT build–operate–transferBRI Bank Rayat Indonesia BRRI Building and Road Research Institute (Ghana) CBO community-based organizationCBRI Central Building Research Institute (India) CDC community development committee (Sri Lanka)CDS city development strategyCER collection efficiency rate CGAP Consultative Group to Assist the Poor CIDA Canadian International Development AgencyCIP capital investment programme CIS Commonwealth of Independent StatesCIUDAD Centro de Investigaciones (Ecuador)CLIFF Community-led Infrastructure Financing Facility (India)CMHC Canada Mortgage and Housing CorporationCMP Community Mortgage Programme (the Philippines)CODATU cooperation for the continuing development of urban and suburban transportationCODI Community Organization Development Institute (Thailand)COHRE Centre on Housing Rights and Evictions (Switzerland)Comecon Council for Mutual Economic Aids COPE Community Organization of the Philippines EnterpriseCPF Central Provident Fund (Singapore)
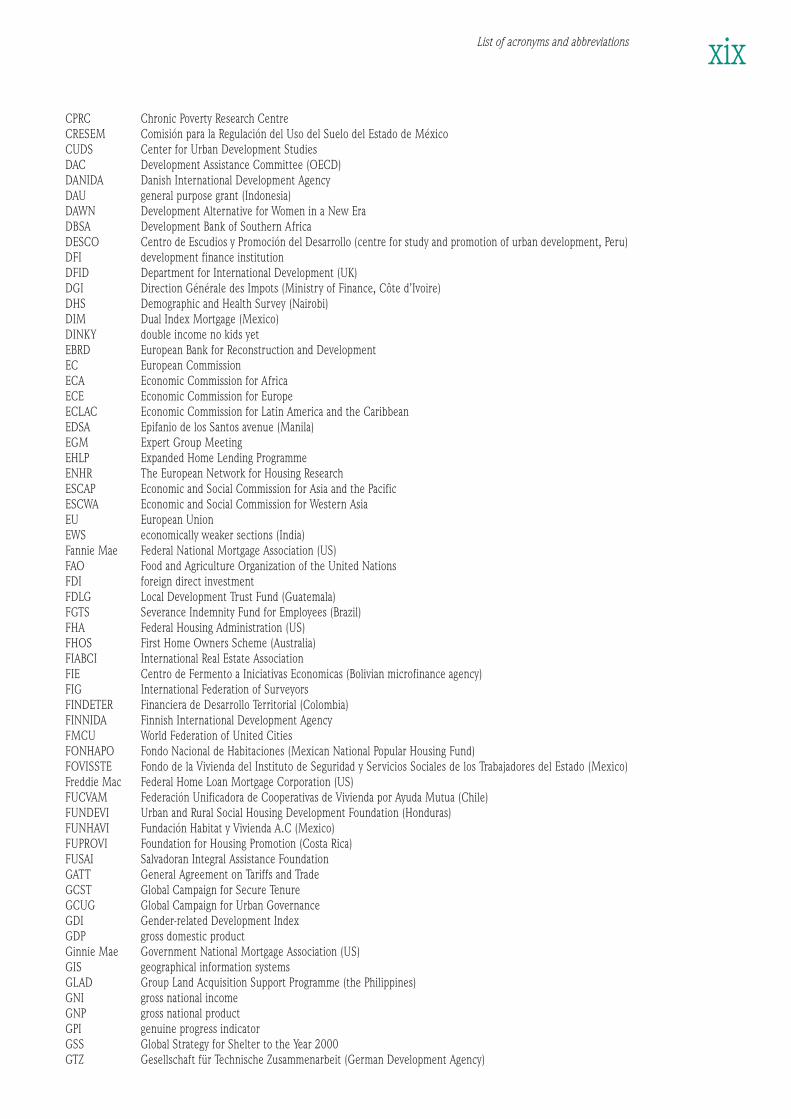
CPRC Chronic Poverty Research Centre CRESEM Comisión para la Regulación del Uso del Suelo del Estado de México CUDS Center for Urban Development StudiesDAC Development Assistance Committee (OECD)DANIDA Danish International Development AgencyDAU general purpose grant (Indonesia)DAWN Development Alternative for Women in a New EraDBSA Development Bank of Southern AfricaDESCO Centro de Escudios y Promoción del Desarrollo (centre for study and promotion of urban development, Peru)DFI development finance institutionDFID Department for International Development (UK)DGI Direction Générale des Impots (Ministry of Finance, Côte d’Ivoire)DHS Demographic and Health Survey (Nairobi)DIM Dual Index Mortgage (Mexico)DINKY double income no kids yetEBRD European Bank for Reconstruction and DevelopmentEC European CommissionECA Economic Commission for AfricaECE Economic Commission for EuropeECLAC Economic Commission for Latin America and the CaribbeanEDSA Epifanio de los Santos avenue (Manila)EGM Expert Group MeetingEHLP Expanded Home Lending Programme ENHR The European Network for Housing Research ESCAP Economic and Social Commission for Asia and the PacificESCWA Economic and Social Commission for Western AsiaEU European UnionEWS economically weaker sections (India)Fannie Mae Federal National Mortgage Association (US)FAO Food and Agriculture Organization of the United NationsFDI foreign direct investment FDLG Local Development Trust Fund (Guatemala)FGTS Severance Indemnity Fund for Employees (Brazil)FHA Federal Housing Administration (US)FHOS First Home Owners Scheme (Australia)FIABCI International Real Estate AssociationFIE Centro de Fermento a Iniciativas Economicas (Bolivian microfinance agency)FIG International Federation of SurveyorsFINDETER Financiera de Desarrollo Territorial (Colombia)FINNIDA Finnish International Development AgencyFMCU World Federation of United CitiesFONHAPO Fondo Nacional de Habitaciones (Mexican National Popular Housing Fund)FOVISSTE Fondo de la Vivienda del Instituto de Seguridad y Servicios Sociales de los Trabajadores del Estado (Mexico)Freddie Mac Federal Home Loan Mortgage Corporation (US)FUCVAM Federación Unificadora de Cooperativas de Vivienda por Ayuda Mutua (Chile)FUNDEVI Urban and Rural Social Housing Development Foundation (Honduras)FUNHAVI Fundación Habitat y Vivienda A.C (Mexico)FUPROVI Foundation for Housing Promotion (Costa Rica)FUSAI Salvadoran Integral Assistance Foundation GATT General Agreement on Tariffs and TradeGCST Global Campaign for Secure TenureGCUG Global Campaign for Urban GovernanceGDI Gender-related Development IndexGDP gross domestic productGinnie Mae Government National Mortgage Association (US)GIS geographical information systemsGLAD Group Land Acquisition Support Programme (the Philippines)GNI gross national incomeGNP gross national productGPI genuine progress indicatorGSS Global Strategy for Shelter to the Year 2000GTZ Gesellschaft für Technische Zusammenarbeit (German Development Agency)
xixList of acronyms and abbreviations

GUO Global Urban Observatory HABRI Housing and Building Research Institute (Kenya)HBFC House Building Finance Corporation (Bangladesh)HDA housing development authorityHDB Housing Development Board (Singapore)HDFC Housing Development and Finance Corporation (India)HDI Human Development IndexHDMF Home Development Mutual Fund (the Philippines)HDR Human Development Report HFCK Housing Finance Corporation of KenyaHIPC Heavily Indebted Poor Countries (debt initiative) HLGC Home Loan Guarantee Company (South Africa)HMFI housing microfinance institutionHRDU Housing Research Development Unit (now HABRI)HSD Human Settlements DevelopmentHUDCO Housing and Urban Development Corporation (India)IADB Inter-American Development BankIADF International Association of Development FundsIDA international development agencyIDA International Development AssociationIDP internally displaced personIDRC International Development Research CentreIEPALA Instituto de Estudios Políticos para América Latina y Africa IFC International Finance Corporation IFI international financial institutionIFPRI International Food Policy Research InstituteIIED International Institute for Environment and DevelopmentILO International Labour OfficeILO International Labour OrganizationIMF International Monetary Fund INFONAVIT Instituto del Fondo Nacional de la Vivienda para los Trabajadores (Mexico)IRGLUS International Research Group on Law and Urban SpaceISD informal subdivisions of state land (Pakistan)ISIC International Standard Industrial Classification ISSC International Social Science CouncilITDG Intermediate Technology Development GroupIULA International Union of Local AuthoritiesKATE Centre for Ecology and DevelopmentKERN Knowledge and Expertise Resource NetworkKIP (Comprehensive) Kampung Improvement Programme (Indonesia) LAC Latin America and the CaribbeanLDA land development agencyLDC least developed countryLDR less developed regionLEARN Link Environmental and Academic Research NetworkLLDC landlocked developing country LMI low and moderate incomeLTAP Land Tenurial Assistance Programme (the Philippines)LTV loan-to-value ratio MBS mortgage-backed security MDA Millennium Development AgendaMDF municipal development fundMDG Millennium Development GoalMDP Municipal Development Programme MDR more developed regionMELISSA Managing the Environment Locally in Sub-Saharan AfricaMFI microfinance institutionMFRC Microfinance Regulatory CouncilMHT Gujarat Mahila Housing SEWA Trust (India)MI mortgage insuranceMOST Management of Social Transformations (UNESCO) MPP Municipality of Phnom Penh
xx Financing Urban Shelter

MSE micro- and small-scale enterprise N-AERUS Network Association of European Researchers on Urbanization in the SouthNACHU National Housing Co-operative Union (Kenya)NAFTA North American Free Trade AgreementNAHECO Nakuru Housing and Environment Co-operative (Kenya)NATO North Atlantic Treaty OrganizationNAVIKU Nairobi Vikundi vya Kujisaidia (self-help group, Kenya)NCC Nairobi City CouncilNESDB National Economic and Social Development Board (Thailand)NGC National Government Centre (the Philippines)NGCHC National Government Centre Housing Committee (the Philippines)NGO non-governmental organizationNHA National Housing Authority (Zambia)NHDA National Housing Development Authority (Sri Lanka)NHFC National Housing Finance Corporation (South Africa)NIC newly industrialized countryNIMBY not in my backyardNMV non-motorized vehicleNORAD Norwegian Agency for International Development NSDF National Slum Dwellers Federation (India)NSS National Statistical Survey (India)NURCHA National Urban Reconstruction and Housing Agency (South Africa)NUREC Network on Urban Research in the European UnionNYCHA New York City Housing Authority NZ New ZealandOA official aidODA official development assistanceOECD Organisation for Economic Co-operation and DevelopmentOHCHR Office of the United Nations High Commissioner for Human RightsOPIC Overseas Private Investment Corporation (South Africa) OUP Office of University Partnerships PAAC Programa de Auto Ajuda e sistenciana Casa (programme of self-help for housing, Brazil)PANA participatory appraisal and needs assessmentPB participatory budgetingPHASE People’s Housing Alternative for Social Empowerment (the Philippines)PHI Presidential Housing Initiative (Zambia)PKSF Palli Karma-Sahayak Foundation (Bangladesh)PPP purchasing power parityPPPUE Public–Private Partnerships for the Urban Environment (UNDP)PRODEL Programa de Desarollo Local (Local Development Programme, Nicaragua)PROSAVI Programa Especial de Crédito y Subsidios a la Vivienda (the special programme for housing loans and
subsidies, Mexico)PROSPECT Programme of Support for Poverty Elimination and Community Transformation PRS poverty reduction strategyPRSP poverty reduction strategy paperPSH Programme for Social Housing (Brazil)PUSH Project Urban Self-help (Zambia)RDC residential development committee (PUSH)RDP Reconstruction and Development Programme (South Africa)RHLF Rural Housing Loan Fund (South Africa)ROSCA rotating savings and credit associationSAP structural adjustment programmeSDC Swiss Development CooperationSDI Shack/Slum Dwellers InternationalSELAVIP Servicio Latinoamericano y Asiatico de Vivienda Popular (Latin American and Asian low income housing
service)SEWA Self-employed Women’s Association (India)SFNV National Housing Financing System (Costa Rica)SHF Federal Mortgage Bank (Sociedad Hipotecaria Federal, Mexico)SHI Sustainable Homes InitiativeSIDA Swedish International Development AgencySIDS small island developing states
xxiList of acronyms and abbreviations

SIV Housing Incentive System (Ecuador)SNA System of National Accounts SODECI Société de Distribution d’Eau de Côte d’IvoireSOFOLES Sociedad Finaciera de Objeto Limitado (Mexico)SPARC Society for the Promotion of Area Resource Centres (Mumbai)SPV special purpose vehicle (China)SSE small-scale enterpriseSTDP Small Town Development Programme SUPF Squatter and Urban Poor Federation (Cambodia)TFYR The former Yugoslav RepublicTNC transnational corporationsTNUDF Tamil Nadu Urban Development Fund (India)TUHF Trust for Urban Housing Finance (South Africa)UCSF Urban Community Support Fund (Nepal)UCDF Urban Community Development Fund (Thailand) UCDO Urban Community Development Office (Thailand; now CODI)UCLG United Cities and Local GovernmentsUDIC Shanghai Urban Development Investment Corporation UEMOA West African Economic and Monetary Union UHLP Unified Home Lending Programme (the Philippines)UK United KingdomUMP Urban Management Programme (UN-Habitat, World Bank and UNDP)UNCED United Nations Conference on Environment and Development UNCHR United Nations Commission on Human RightsUNCHS United Nations Centre for Human Settlements (Habitat) (now UN-Habitat)UNCTAD United Nations Conference on Trade and DevelopmentUNDG United Nations Development GroupUNDP United Nations Development ProgrammeUNEP United Nations Environment ProgrammeUNESCO United Nations Educational, Scientific and Cultural OrganizationUNFPA United Nations Population FundUNGA United Nations General Assembly UN-Habitat United Nations Human Settlements Programme (formerly UNCHS (Habitat))UNHCR United Nations High Commissioner for Refugees UNHRP United Nations Housing Rights ProgrammeUNICEF United Nations International Children’s FundUNIFEM United Nations Development Fund for WomenUNON United Nations Office at NairobiUNRISD United Nations Research Institute for Social DevelopmentUS United StatesUSAID US Agency for International Development UTO United Towns OrganizationUVA Union of African TownsVA Veterans AdministrationVAMBAY Valmiki Ambedkar Yojna (subsidy scheme for housing the urban poor in India)VAT value added taxVHC Viviendas Hogar de Cristo (Chile)WACLAC World Assembly of Cities and Local Authorities Coordinators WCED World Commission for Environment and Development WEOG Western European and Other States Group WMO World Meteorological OrganizationWOCSOC World Civil Society ConferenceWTO World Trade OrganizationZNBS Zambia National Building SocietyZNPF Zambia National Provident FundZSIC Zambia State Insurance Corporation
xxii Financing Urban Shelter
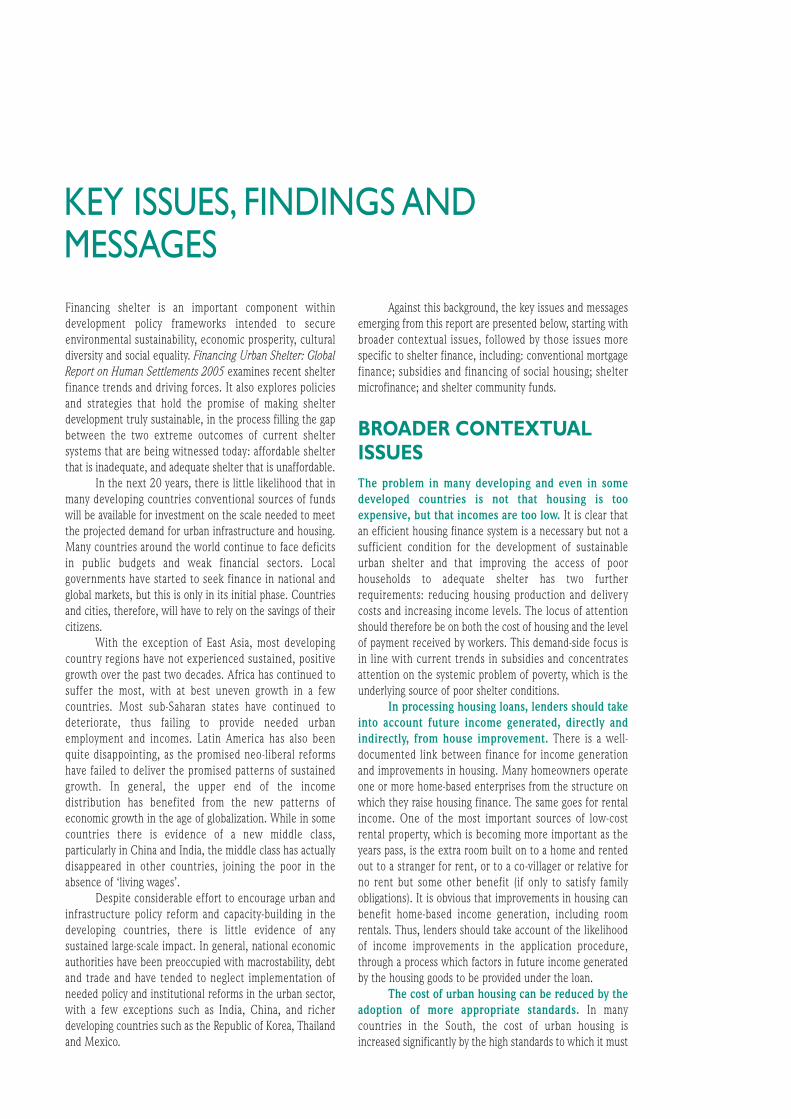
Financing shelter is an important component withindevelopment policy frameworks intended to secureenvironmental sustainability, economic prosperity, culturaldiversity and social equality. Financing Urban Shelter: GlobalReport on Human Settlements 2005 examines recent shelterfinance trends and driving forces. It also explores policiesand strategies that hold the promise of making shelterdevelopment truly sustainable, in the process filling the gapbetween the two extreme outcomes of current sheltersystems that are being witnessed today: affordable shelterthat is inadequate, and adequate shelter that is unaffordable.
In the next 20 years, there is little likelihood that inmany developing countries conventional sources of fundswill be available for investment on the scale needed to meetthe projected demand for urban infrastructure and housing.Many countries around the world continue to face deficitsin public budgets and weak financial sectors. Localgovernments have started to seek finance in national andglobal markets, but this is only in its initial phase. Countriesand cities, therefore, will have to rely on the savings of theircitizens.
With the exception of East Asia, most developingcountry regions have not experienced sustained, positivegrowth over the past two decades. Africa has continued tosuffer the most, with at best uneven growth in a fewcountries. Most sub-Saharan states have continued todeteriorate, thus failing to provide needed urbanemployment and incomes. Latin America has also beenquite disappointing, as the promised neo-liberal reformshave failed to deliver the promised patterns of sustainedgrowth. In general, the upper end of the incomedistribution has benefited from the new patterns ofeconomic growth in the age of globalization. While in somecountries there is evidence of a new middle class,particularly in China and India, the middle class has actuallydisappeared in other countries, joining the poor in theabsence of ‘living wages’.
Despite considerable effort to encourage urban andinfrastructure policy reform and capacity-building in thedeveloping countries, there is little evidence of anysustained large-scale impact. In general, national economicauthorities have been preoccupied with macrostability, debtand trade and have tended to neglect implementation ofneeded policy and institutional reforms in the urban sector,with a few exceptions such as India, China, and richerdeveloping countries such as the Republic of Korea, Thailandand Mexico.
Against this background, the key issues and messagesemerging from this report are presented below, starting withbroader contextual issues, followed by those issues morespecific to shelter finance, including: conventional mortgagefinance; subsidies and financing of social housing; sheltermicrofinance; and shelter community funds.
BROADER CONTEXTUALISSUESThe problem in many developing and even in somedeveloped countries is not that housing is tooexpensive, but that incomes are too low. It is clear thatan efficient housing finance system is a necessary but not asufficient condition for the development of sustainableurban shelter and that improving the access of poorhouseholds to adequate shelter has two furtherrequirements: reducing housing production and deliverycosts and increasing income levels. The locus of attentionshould therefore be on both the cost of housing and the levelof payment received by workers. This demand-side focus isin line with current trends in subsidies and concentratesattention on the systemic problem of poverty, which is theunderlying source of poor shelter conditions.
In processing housing loans, lenders should takeinto account future income generated, directly andindirectly, from house improvement. There is a well-documented link between finance for income generationand improvements in housing. Many homeowners operateone or more home-based enterprises from the structure onwhich they raise housing finance. The same goes for rentalincome. One of the most important sources of low-costrental property, which is becoming more important as theyears pass, is the extra room built on to a home and rentedout to a stranger for rent, or to a co-villager or relative forno rent but some other benefit (if only to satisfy familyobligations). It is obvious that improvements in housing canbenefit home-based income generation, including roomrentals. Thus, lenders should take account of the likelihoodof income improvements in the application procedure,through a process which factors in future income generatedby the housing goods to be provided under the loan.
The cost of urban housing can be reduced by theadoption of more appropriate standards. In manycountries in the South, the cost of urban housing isincreased significantly by the high standards to which it must
KEY ISSUES, FINDINGS ANDMESSAGES
comply. The introduction of lower standards that are moreappropriate to the local context could potentially makehousing more affordable to a far greater proportion of theurban population. Lower standards would still, however,have to safeguard the health and safety of the occupants andprotect the public interest.
There is much to be gained from encouragingmulti-occupied housing development where it fits inwith local norms. Most national shelter policies, some ofthem supported by official development assistance, arebased on the provision of independently serviced, singlehousehold dwellings, owned by their occupants. However,this is by no means the main form of occupation byhouseholds living in poverty. Instead, large numbers ofhouseholds live in buildings occupied by many households.
Financing schemes to assist small-scale landlords,in the context of informal settlement upgrading, arenecessary. Small-scale landlords in informal settlements area major source of affordable housing for a growing majorityof households living in poverty in the towns and cities ofdeveloping countries, but there are few initiatives to assistthem. It is imperative, therefore, to understand how best toassist the informal rental sector within informal settlementand slum upgrading programmes, and at the same timepreserve affordability so as to preclude gentrification.
Finance to provide healthy liquidity among small-scale contractors and single artisans is an essentialprerequisite to effective housing supply to scale. In thespirit of the Habitat Agenda, and if the current massivehousing backlog is to be cleared at all, it is vital that all actorsin the housing process are involved in the role in which theyare most efficient. The most important suppliers of dwellingsfor urban low-income communities, and their ancillaryservices, are the millions of small-scale building contractors,the single artisans or small groups of skilled people and thelabourers who service their needs. However much demandthere is for housing, it can only be supplied as quickly as theconstruction industry can build it.
In developing countries, large-scale developersof both private rental housing and housing for sale toowner occupiers need financing systems capable ofproviding bridging loans. In countries where the housingsupply system is efficient and speculative of what the marketdemands, developers are often an important part of theprocess. Some mechanism for recognizing their contributionwith financial assistance, especially for bridging loans, maybe very beneficial for the housing supply process indeveloping countries and could institute the efficientspeculative building of housing which is common indeveloped economies.
Domestic savings play a crucial role in thedevelopment of robust and effective shelter financesystems. The countries in which most of the urban growthwill take place in the next 20 years have very low domesticsavings measured as both per capita and as a percentage ofgross domestic product (GDP). As savings are thefoundations for investment, this does not auger well forurban shelter development. It is important that developingcountries maintain as much of the investment and savings
arising from local economic activity within their borders, orbenefit from net inflows from investments overseas. Theimportance of reliable banks and low inflation indiscouraging capital flight cannot be overemphasized
CONVENTIONALMORTGAGE FINANCEIn recent decades, governments have generally soughtto encourage homeownership and have, in many cases,provided preferential financing to influence consumerchoice. There has been a general shift towards market-basedmechanisms for the provision of housing, with attempts toreduce subsidies and deregulate markets. In part, this is dueto the past ineffectiveness of housing strategies thatdepended on direct provision by the state. This trend is alsoconsistent with the overall direction of macroeconomicstrategies in recent decades.
Mortgage finance has been expanding during thelast decade and is increasingly available in manycountries. Many developing countries now have access tomarket rate housing finance, which was not the case 20years ago. New mortgage providers include commercialfinancial institutions, or in some cases, mortgage companies.However, only the middle- and upper-income householdshave access to such finance while the poor, especially indeveloping countries and countries with economies intransition, are largely excluded.
It is in the interest of governments to extendmortgage markets down the income scale, ashomeownership is beneficial economically, socially andpolitically. Measures that have been adopted by somecountries, and could be emulated by others, include:reducing the cost of lending, especially through reductionof interest rates; supporting the system of mortgagefinancing, especially through extension of secondary marketsand reduction of risk; and providing direct capital grants toreduce the size of the households’ mortgage in comparisonwith the dwelling cost.
Loan periods and loan-to-value ratios are vitalcomponents of mortgage loans that have importantaccess implications, especially for the urban poor. Theseare determined by the lender rather than the global macro-economic environment. Decisions about them can be thedifference between success and failure of the mortgagecompany and determine who can afford to borrow, at leastat the margins. Low loan-to-value ratios (and, therefore, highinitial deposits) reduce risk but increase the need for upfrontcapital. The level of repayments can be varied to helphouseholds meet their obligations. Adoption of variable-interest loans allows low payments at the beginning,increasing as income improves to repay the loan on time.
Well-run mortgage facilities are undoubtedlyimportant to the health of the housing supply systems,although they generally fail to reach the poor.Conventional mortgage facilities constitute the dominantmeans of shelter financing in developed countries and maybe a major contributor to housing improvement in countries
xxiv Financing Urban Shelter

with economies in transition. They are also important inproviding upper- and middle-income groups in developingcountry cities with housing finance, without which theywould claim the shelter opportunities provided for thoselower down the income scale. However, as mortgage financeis unlikely to assist the majority of the people, it must notbe allowed to divert attention from financing helpful tolower-income groups, or to drain resources away from low-income households towards those in the middle- orupper-income groups.
SUBSIDIES AND FINANCINGOF SOCIAL HOUSINGThree specific trends with respect to social housing thatare consistent with privatization and deregulation arewell established in a number of countries:
1 governments have shifted away from the directconstruction and management of public housing andhave used several strategies to reduce their stocks,with large-scale transfers to occupiers in some cases;
2 there is increasing assistance for homeownershipthrough direct demand (capital) subsidies; and
3 consistent with the two trends above is the greateruse of housing allowances (rather than directprovision) to assist low-income families rentingaccommodation in the private or non-profit sectors.Despite their focus on lower income households,direct subsidies are often smaller in scale thaninterest rate subsidies when the full costs of the latterover the life of the loan are considered.
Those who cannot afford homeownership or marketrents in the private market need shelter through publicrental housing. Social housing is, almost by definition,subsidized housing. The subsidy element is a financial creditto the occupier and, thus, often constitutes an importantelement in a nation’s housing finance system. Althoughsocial housing is becoming residual in Europe and incountries with economies in transition, the need to providemore housing that is affordable to low-income households isstill present.
While subsidies are necessary for deserving low-income groups, the need for them can be reduced byadopting effective shelter-financing systems. At present,subsidies come in many guises, including: direct interest ratereductions; allowing mortgage interest payments to bededucted from income tax; supporting housing-relatedsavings; supporting insurance of mortgages; supporting thesecondary mortgage markets; and direct grants for shelter(or capital grant subsidies). If appropriate housing finance isin place, the proportion of households requiring subsidyshould be minimized, i.e. to only those too poor to affordthe real cost of the shelter available. The need for subsidycan, thus, be reduced by adopting effective financingsystems. The work of some non-governmental organizationsin providing funding to help individual households attract a
subsidy is very helpful. In some countries, revolving fundsthat provide the down payment necessary to obtain anational housing subsidy grant have been very effective.
SHELTER MICROFINANCEThe majority of urban poor households can only affordto build incrementally in stages as financial resourcesbecome available. These stages may be separated by manymonths, or even years. In new building, this is usuallyimplemented a room or a few rooms at a time but it may,less commonly, occur in construction stages, i.e., all thefoundations, followed by all the walls, etc. Complete housesavailable through mortgage finance are far too expensive forthe poor and they are unable to meet the deposit and incomecriteria set by mortgage institutions. It is thereforeimperative that national and international institutionsrecognize that low-income people build incrementally andprovide microfinance suitable for that process. This may alsocall for reform of building regulations that often do not allowincremental building of formally recognized dwellings.
Short-term, small-scale loans of one to eight yearsand in amounts of US$500 to 5000, are more useful forincremental development than the long term, largevalue loans favoured by the mortgage markets.Improvements and efficiency gains possible throughincremental building with small loans, rather than withsavings, include: greater likelihood of building well (thoughsmall) immediately and avoiding high annual maintenancecosts arising from poor construction; avoidance of thewasteful process of improvising a dwelling in temporarymaterials and then discarding them as they are replaced withpermanent materials; and reducing the age at which ahouseholder can afford to be an owner, as stages do not haveto await money being saved but can be paid for in arrears.
Small housing loans, disbursed through housingmicrofinance institutions, are some of the mostpromising developments in housing finance during thelast decade. They are suitable for extending existingdwellings, building on already serviced land, adding rooms(often for renting out), adding facilities such as toilets andhouse improvements within in situ neighbourhood or slumupgrading. They tend to reach much further down theincome scale than mortgage financing, but not to thehouseholds close to or below poverty lines. Experienceshows that there is great demand for microfinance even ifinterest rates are high.
In the context of large numbers of new low-income households in cities over the next two decades,it is important to increase the number of lenders in thehousing microfinance sector rather than concentrateonly on mortgage finance. Mortgage finance inevitablyserves the middle- and upper-income groups, while generallyexcluding the poor. However, there is a serious issue offunding for on-lending by microfinance institutions. Manyhave received concessionary funds and their lending reflectsthe low price of the capital. If they are to expand theiroperations, they may have to borrow at international marketrates and reflect this in their loans.
xxvKey issues, findings and messages

Guarantees are important in broadening theappeal of microfinance institutions to lenders. Microfinance institutions continually look for ways ofreducing their risks, even though the lowest-income groupstend to be assiduous at repayment. The establishment offormal guarantee organizations is an important prerequisiteto lending in many circumstances. Governments have muchto gain from setting up guarantee funds to allowmicrofinance institutions to lend to low-income householdsat reduced risk. In addition, development assistance shouldbe directed towards guarantee funds in order to capturetheir full value as catalysts for shelter development for theurban low-income groups.
COMMUNITY-BASEDSHELTER FUNDSAnother significant trend in the last decade has beenincreasing interest in shelter community funds grouploans. The growth of these funds has partly arisen from ageneral acknowledgement that small-scale lending has beensomewhat successful and that the urbanization of poverty isa growing challenge. Two further current trends related tothe development of shelter community funds are: first, thegrowing interest by local government in the possibility ofusing such funds to extend essential infrastructure; and,
second, the expansion of Shack or Slum DwellersInternational (SDI), a community/NGO network whosestrategies incorporate savings and lending activities forshelter improvements.
Community-based financing of housing andservices has been used for both settlement upgradingand for building on greenfield sites, and, in a contextwhere small loans are evidently successful and wherethere is an increase in poverty, it has many advantagesfor low-income and otherwise disempoweredhouseholds. It provides the benefits of scale – strength inlobbying, ability to affect neighbourhoods comprehensivelyrather than just single dwellings, ability to raise capitalfunding – and it builds the cohesion of the communitybecause its members act together. It takes strength from thewillingness of people to work together as communitiesthrough a variety of self-help cooperation traditions. Theexperience of the affiliates of the Shack or Slum Dwellers’Federation (SDI) has demonstrated that there is greatpotential for community-based organizations to managedevelopment finance to the benefit of large numbers ofrelatively poor households. The evident success ofcommunity funds has attracted some governments to takepart in their financing. However, there are issues about howfar non-members of such community groups are excludedby the activities of groups who so successfully lay claim tolimited resources.
xxvi Financing Urban Shelter

MILLENNIUMDEVELOPMENT GOALS ANDTHE TARGET ON SLUMSThe history of cities is the history of civilization. Forcenturies, migrants have sought improved lives forthemselves and their families in increasingly dense urbanlandscapes. Cities represent the greatest hopes of every age.The hope widens, falls and re-emerges in new form throughthe social interactions that define the fabric of urban society.In 2007, and for the first time in human history, the world’surban population will exceed its rural population. Are theworld’s urban centres ready for this monumental shift?
The Global Report on Human Settlements 2005focuses on broadening our understanding of the complexfinancial foundation lying at the heart of this growing urbanchallenge. The report critically asks and answers, withexamples, the question of how the costs of growingdemographic pressures across different regions of the worldwill be met. It is known that roughly one out of every sixpeople live in what can be characterized as ‘slums’ in smalland large cities alike. Thus far, it has been relatively easy toignore the woefully inadequate living conditions which thisstatistic implies by assuming that city life necessarily equateswith improved life. Although the aspirations of urbandwellers flow in that direction, the reality on the ground hasoften proven quite different. Ill-conceived and mismanagedpolicies and beliefs have too often translated into thepricing-out of affordable and humanely adequate housing inaccessible urban areas. Worse yet, in misdirected efforts toerase this market failure, forced evictions dominated policyresponses for decades. This was done despite the fact thatthe population of the urban poor never disappeared. Instead,the population of the urban poor and their informalsettlements continued to grow in depth and scale.
In the face of such adversities, the urban poor haveemerged with creative solutions. ‘Slums’ are often a solutionin progress – a gradual realization of the abiding hope tomake a home in the city and create a better life. This hasbeen recognized by international organizations indeclarations and policy agendas over the past two decades.And, increasingly, both local and national governments haveawakened to the promise of building better cities andnations through partnerships with the urban poor.
It was in this context that the United NationsMillennium Assembly of 2000 highlighted the need toimprove the lives of the urban poor through the inclusion ofa ‘slums target’ in the Millennium Declaration. This goal –‘by 2020, to have achieved a significant improvement in thelives of at least 100 million slum dwellers, as proposed inthe Cities without Slums Initiative’ – was later subsumed asTarget 11 of Millennium Development Goal (MDG) 7, thatof environmental sustainability. The United NationsMillennium Project, commissioned by Secretary-GeneralKofi Annan, was charged with establishing groups of expertsand practitioners from around the world, organized in tenthematic task forces, to make recommendations on how toachieve the MDGs and their targets. The work of Task Force8 was to address the ‘slum’ target.
From the beginning, it was evident to the task forcethat addressing Target 11, as the slum target is described inthe MDGs, in essence meant not only improving the lives ofan existing 100 million slum dwellers, but also creatingalternatives to slums for the future urban poor. Furthermore,it became apparent that the key to achieving Target 11 andleveraging the development potential of cities to the benefitof all was the networking and coordination of the activitiesof interested actors and relevant parties, placing the urbanpoor at the centre of this process.
It is not surprising, then, that the task force’s reporthighlights an investment model for upgrading today’s slumsand planning alternatives for tomorrow that assumes theactive participation and commitment of the urban poorthemselves, in partnership with the more usual actors: localand national governments, as well as internationalorganizations. Too often, the Millennium Project’s centralmessage is misinterpreted as merely securing more foreignaid alone. In fact, the Millennium Project’s main messageand central theme is quite different – it is that theMillennium Development Goals are achievable, that even asone reads this report, a diversity of activities undertaken bythe poor themselves are moving forward towards therealization of the MDGs, and that what is needed isacknowledgement, support for and coordination of this work– at every level. This reality of achievement is evident inslums, as is amply documented in A Home in the City, TaskForce 8’s report.2 The urban poor, often in partnership withlocal authorities and with the support of internationalorganizations and donors, are improving their own living
MDG SPECIAL FEATURE:FINANCING THE TARGET ON SLUMS1
conditions every day. But these successes remain relativelypiecemeal. The challenge at present is to elevate suchsuccesses to scale and in a sustainable fashion.
Realigning Target 11
Task Force 8’s report, A Home in the City, highlights twodistinct and necessarily related routes to achieving the scaleand sustainability of Target 11 – that of slum upgrading todayand urban planning for tomorrow. These dual tasks reflectthe original intention of the Cities without Slums ActionPlan, which informed the United Nations Secretary-General’s 2000 report We, the Peoples.3 The action planitself specifically called on governments to:
• Start with the mobilization of political and financialcommitment to slum upgrading and gear up thecapacity to support large-scale actions.
• Initiate 20 citywide and nationwide programmes infive regions to change the lives of 5 million urbanpoor.
• Upscale the approach over the 2006–2020 periodwith 50 national programmes, with slum improvementas a central element of urban development strategiesin most countries, resulting in the provision of basicservices to 100 million slum dwellers and slumformation stopped (emphasis added).
Part of this last phase – the move to provide basic servicesto 100 million slum dwellers – was incorporated by theUnited Nations General Assembly (UNGA) as a target underthe MDGs, given its quantifiable nature. However, theMillennium Declaration’s language leaves no doubt that thetarget was to incorporate all phases of the Cities withoutSlums Action Plan, including putting an end to new slumformation. Consequently, Task Force 8 realigned thisquantifiable target with its original partner – that of ‘slumformation stopped’ – in its approach to effectively addressthe intent of Target 11. In the task force’s interpretation,
Target 11 is properly understood as: ‘By 2020, improvingsubstantially the lives of at least 100 million slum dwellers,while providing adequate alternatives to new slumformation’.4
In this interpretation, the task force refrained fromthe use of ‘stopping slum formation’ to avoid any confusionregarding its position against forced evictions. Thisinterpretation is also fully consistent with the other targetsof the MDGs, which call for a halving of identified povertychallenges. Using recent estimated and projected slumpopulation figures, Task Force 8’s interpretation of Target11 calls for halving the number of the slum population to beexpected in the world by 2020 if no remedial action istaken.5 A calculation exercise shows that the currentlyprojected number of slum dwellers in 2020 (1.6 billionpeople), if no action is taken, would be halved through boththe improvement of 100 million current slum dwellers’ lives,as well as the projected creation of alternatives for futureurban poor residents, thus aligning Target 11 with otherMDG targets.
Why is this realignment of Target 11 necessary? Asmentioned earlier, by 2007 the world’s urban residents will,for the first time, represent the majority of the world’spopulation. Roughly 80 per cent of urban residents in thelowest-income countries already live in slum conditions.Given the projected demographic trends, this population ofslum dwellers is expected to double by 2030 if alternativesto slums are not developed today.6 In short, improving thelives of 100 million slum dwellers alone is not ambitiousenough to sustainably and significantly alleviate poverty inurban centres. In realigning Target 11 with the originalintention of its foundation in the Cities without SlumsAction Plan, Task Force 8 recognizes that Target 11 is amoving target, and that achieving the MDGs at the city level– and, most specifically, where the urban poor are concerned– will require an equally dynamic solution. This latter call isone for effectively planning accessible, affordable andadequate housing and urban services for the low-incomeurban residents of tomorrow.
The proposed path takes a relatively innovative, yetobvious, approach to urban development – one whichembraces the historic reality of the urbanization trend. Inshort, it is a strategy to recognize the great macro- andmicro-potentials of urbanization, while also ensuring that itschallenges are adequately addressed. It is important toemphasize that urbanization at scale is a positive, and not anegative, reality, although some policy-makers continue tobelieve that stemming this trend ought to be the focus ofglobal economic development. However, history has alreadyshown that attempts to curtail urbanization are always bothunsuccessful and undesirable. The struggle betweenmisconceived development policies and well-establishedmigration patterns has proven destructive and disruptive,both in physical and non-physical terms, at the household,local, regional and national levels. The most prosperousnations in the world are the most urbanized ones. Moreover,urbanization brings with it significant development benefitsfor both urban centres and rural areas. These synergisticlinkages between urban and rural are important andacknowledged in Task Force 8’s report. In fact, there is a
xxviii
Urbanization andincome levels
Source: UN Millennium Project,2005a, p14.
Financing Urban Shelter
Figure P.1
100
80
60
40
20
0Low income
Perc
enta
ge
Lower-middleincome
Upper-middleincome
High income

clear correlation between levels of urbanization and nationalincome levels, as Figure P.1 shows.
The real challenge is not the trade-off between urbanand rural development; rather, it is channelling the benefitsof development in a socially equitable fashion. This is thereason why meeting Target 11 is so critical. But is meetingTarget 11 in Task Force 8’s interpretation realizable –financially and politically? The answer is yes. To answer inany other way would mean ignoring the reality of what isnow taking place at the urban level, as well as the politicalmomentum building in support of the MDGs worldwide.While it is crucial that Target 11’s financial outlook is seenwithin the greater context of financing the MDGs overall,the specific components of the investment model developedby Task Force 8 to achieve Target 11 is revealing of howmovement towards this target is already under way. Mostnotably, while achieving the MDGs overall will requiresignificant contributions from donors – contributions which,in fact, have already been promised – it is of interest thatthe Target 11 component of the overall financing of theMDGs is largely based on domestic capital. This is the caseboth in upgrading slums today and in planning alternativesfor tomorrow.
MODELLING INVESTMENTIN SLUM UPGRADING ANDPROVIDING ADEQUATEALTERNATIVESAs already acknowledged, residents in informal settlementsand slums are already making significant investments toupgrade their housing and communities – particularly whentenure is secure. Therefore, in preparing its model ofupgrading and planning, Task Force 8 considered knownexamples of existing upgrading programmes across regions,and focused particularly on three successful large-scaleprogrammes in Central America for which detailed data wasavailable over a period of more than ten years.
In addition, the task force’s model was built on theworking estimates of upgrading costs and identifyinginterventions in the most recent authoritative studies. Thesestudies included the Cities without Slums Initiative of theCities Alliance, the 2003 Global Report on HumanSettlements,7 the need-assessment studies of Ghana,Tanzania and Uganda prepared by the United NationsMillennium Project, as well as a special investmentmodelling report requested by the task force andcommissioned by UN-Habitat (United Nations HumanSettlements Programme). In addition, the task force referredto a number of sector-specific studies to estimate the costsof interventions, such as those required for communityschooling and health services.
The task force combined estimations of demand forregularization and upgrading based on UN-Habitat’s 2001estimation of slum dwellers, with programme examples andexpert studies to derive its own estimations regarding whichinterventions to include and which to exclude from its
model. The Task Force 8 investment model included fiveoverall components:
1 land; 2 physical improvements to the housing stock;3 basic physical infrastructure (water, sanitation,
drainage, road paving, electricity);4 basic community services (schools and clinics); and5 security of tenure.
The five components of the model all require human,infrastructural and financial resources which clearly vary withcontext. For this reason, the aim of the task force was not totreat the model as an exact estimation, but as an opportunityto demonstrate – using data from existing programmes – therange of investment costs required to upgrade slums and toplan for alternatives. The resulting estimates show thesignificance of cost ranges across regions, largely due todifferences in the cost of labour and land.
Upgrading
More specifically, within the five overall components, thetask force identified and estimated the investments requiredfor the following eight interventions in its upgrading-specificmodel:
1 construction of basic housing;2 purchase of land or transfer;3 relocation (if necessary);4 provision of networked infrastructure;5 provision of bulk infrastructure (calculated as 30 per
cent of the value of networked infrastructure);6 construction of schools and clinics;7 construction of community facilities; and8 planning and oversight.
In addition, recognizing the importance of human resourcesavailable to manage the above interventions, the task forcealso included a final component in its upgrading model –that of capacity-building, which was calculated as 10 percent of the overall costs of the eight components identifiedabove. The estimates are presented in Table P.1.
In total, the estimates below translate into US$4.2billion per year, or roughly US$42 per beneficiary per year,given the target to improve the lives of an existing 100million slum dwellers between 2005 and 2020. Thesefigures were partially based on the costing estimates forinterventions proposed in the report commissioned for TaskForce 8,8 and were further adjusted by the task force on thebasis of the estimated costs of each intervention componentidentified in the studies of three Central Americanprogrammes mentioned earlier.
xxixMDG special feature
Per capita investmentrequirements (US$) toupgrade slums between2005 and 2020(provisional estimatesby region)
Table P.1
Arab States, Asia (including Latin America South-central Southeast Sub-Saharan Africa,Turkey and East China) and the Asia Asia Egypt and
Iran and Oceania Caribbean Sudan
1328 619 1200 612 643 528
Source: UN Millennium Project, 2005a, p128.
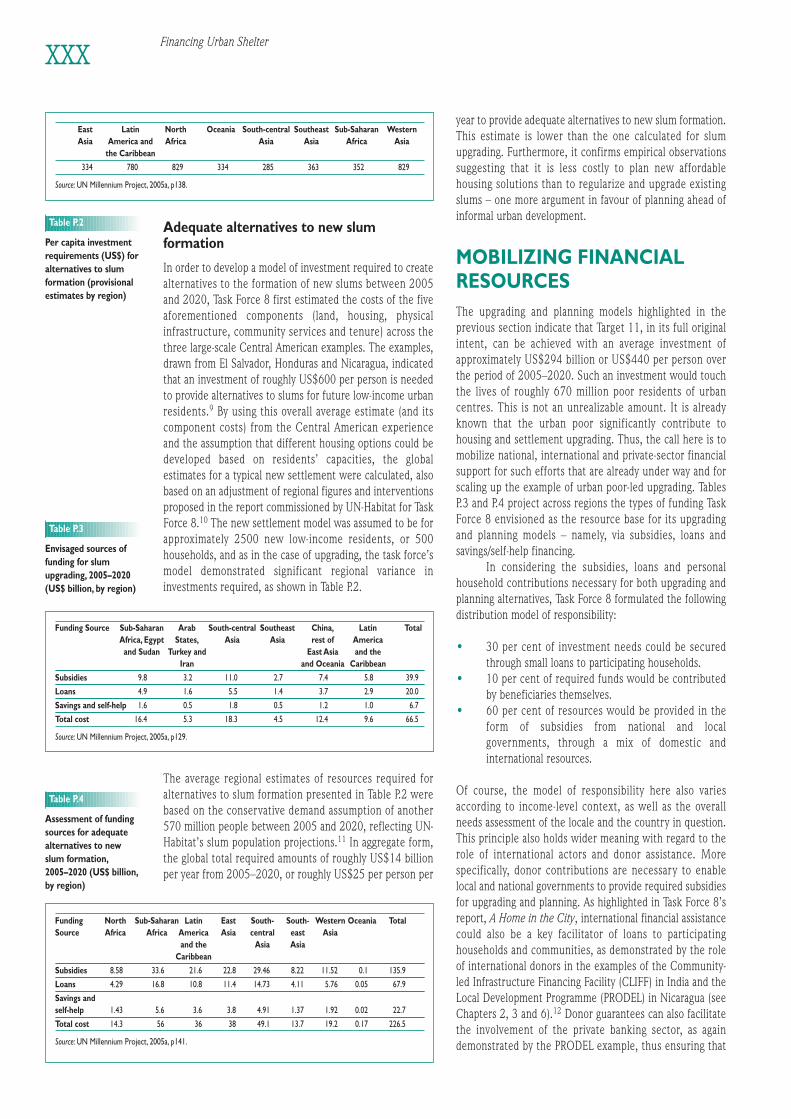
Adequate alternatives to new slumformation
In order to develop a model of investment required to createalternatives to the formation of new slums between 2005and 2020, Task Force 8 first estimated the costs of the fiveaforementioned components (land, housing, physicalinfrastructure, community services and tenure) across thethree large-scale Central American examples. The examples,drawn from El Salvador, Honduras and Nicaragua, indicatedthat an investment of roughly US$600 per person is neededto provide alternatives to slums for future low-income urbanresidents.9 By using this overall average estimate (and itscomponent costs) from the Central American experienceand the assumption that different housing options could bedeveloped based on residents’ capacities, the globalestimates for a typical new settlement were calculated, alsobased on an adjustment of regional figures and interventionsproposed in the report commissioned by UN-Habitat for TaskForce 8.10 The new settlement model was assumed to be forapproximately 2500 new low-income residents, or 500households, and as in the case of upgrading, the task force’smodel demonstrated significant regional variance ininvestments required, as shown in Table P.2.
The average regional estimates of resources required foralternatives to slum formation presented in Table P.2 werebased on the conservative demand assumption of another570 million people between 2005 and 2020, reflecting UN-Habitat’s slum population projections.11 In aggregate form,the global total required amounts of roughly US$14 billionper year from 2005–2020, or roughly US$25 per person per
year to provide adequate alternatives to new slum formation.This estimate is lower than the one calculated for slumupgrading. Furthermore, it confirms empirical observationssuggesting that it is less costly to plan new affordablehousing solutions than to regularize and upgrade existingslums – one more argument in favour of planning ahead ofinformal urban development.
MOBILIZING FINANCIALRESOURCESThe upgrading and planning models highlighted in theprevious section indicate that Target 11, in its full originalintent, can be achieved with an average investment ofapproximately US$294 billion or US$440 per person overthe period of 2005–2020. Such an investment would touchthe lives of roughly 670 million poor residents of urbancentres. This is not an unrealizable amount. It is alreadyknown that the urban poor significantly contribute tohousing and settlement upgrading. Thus, the call here is tomobilize national, international and private-sector financialsupport for such efforts that are already under way and forscaling up the example of urban poor-led upgrading. TablesP.3 and P.4 project across regions the types of funding TaskForce 8 envisioned as the resource base for its upgradingand planning models – namely, via subsidies, loans andsavings/self-help financing.
In considering the subsidies, loans and personalhousehold contributions necessary for both upgrading andplanning alternatives, Task Force 8 formulated the followingdistribution model of responsibility:
• 30 per cent of investment needs could be securedthrough small loans to participating households.
• 10 per cent of required funds would be contributedby beneficiaries themselves.
• 60 per cent of resources would be provided in theform of subsidies from national and localgovernments, through a mix of domestic andinternational resources.
Of course, the model of responsibility here also variesaccording to income-level context, as well as the overallneeds assessment of the locale and the country in question.This principle also holds wider meaning with regard to therole of international actors and donor assistance. Morespecifically, donor contributions are necessary to enablelocal and national governments to provide required subsidiesfor upgrading and planning. As highlighted in Task Force 8’sreport, A Home in the City, international financial assistancecould also be a key facilitator of loans to participatinghouseholds and communities, as demonstrated by the roleof international donors in the examples of the Community-led Infrastructure Financing Facility (CLIFF) in India and theLocal Development Programme (PRODEL) in Nicaragua (seeChapters 2, 3 and 6).12 Donor guarantees can also facilitatethe involvement of the private banking sector, as againdemonstrated by the PRODEL example, thus ensuring that
xxx Financing Urban Shelter
East Latin North Oceania South-central Southeast Sub-Saharan Western Asia America and Africa Asia Asia Africa Asia
the Caribbean
334 780 829 334 285 363 352 829
Source: UN Millennium Project, 2005a, p138.
Funding Source Sub-Saharan Arab South-central Southeast China, Latin TotalAfrica, Egypt States, Asia Asia rest of America
and Sudan Turkey and East Asia and the Iran and Oceania Caribbean
Subsidies 9.8 3.2 11.0 2.7 7.4 5.8 39.9
Loans 4.9 1.6 5.5 1.4 3.7 2.9 20.0
Savings and self-help 1.6 0.5 1.8 0.5 1.2 1.0 6.7
Total cost 16.4 5.3 18.3 4.5 12.4 9.6 66.5
Source: UN Millennium Project, 2005a, p129.
Funding North Sub-Saharan Latin East South- South- Western Oceania TotalSource Africa Africa America Asia central east Asia
and the Asia AsiaCaribbean
Subsidies 8.58 33.6 21.6 22.8 29.46 8.22 11.52 0.1 135.9
Loans 4.29 16.8 10.8 11.4 14.73 4.11 5.76 0.05 67.9
Savings and self-help 1.43 5.6 3.6 3.8 4.91 1.37 1.92 0.02 22.7
Total cost 14.3 56 36 38 49.1 13.7 19.2 0.17 226.5
Source: UN Millennium Project, 2005a, p141.
Per capita investmentrequirements (US$) foralternatives to slumformation (provisionalestimates by region)
Table P.2
Assessment of fundingsources for adequatealternatives to newslum formation,2005–2020 (US$ billion,by region)
Table P.4
Envisaged sources offunding for slumupgrading, 2005–2020(US$ billion, by region)
Table P.3
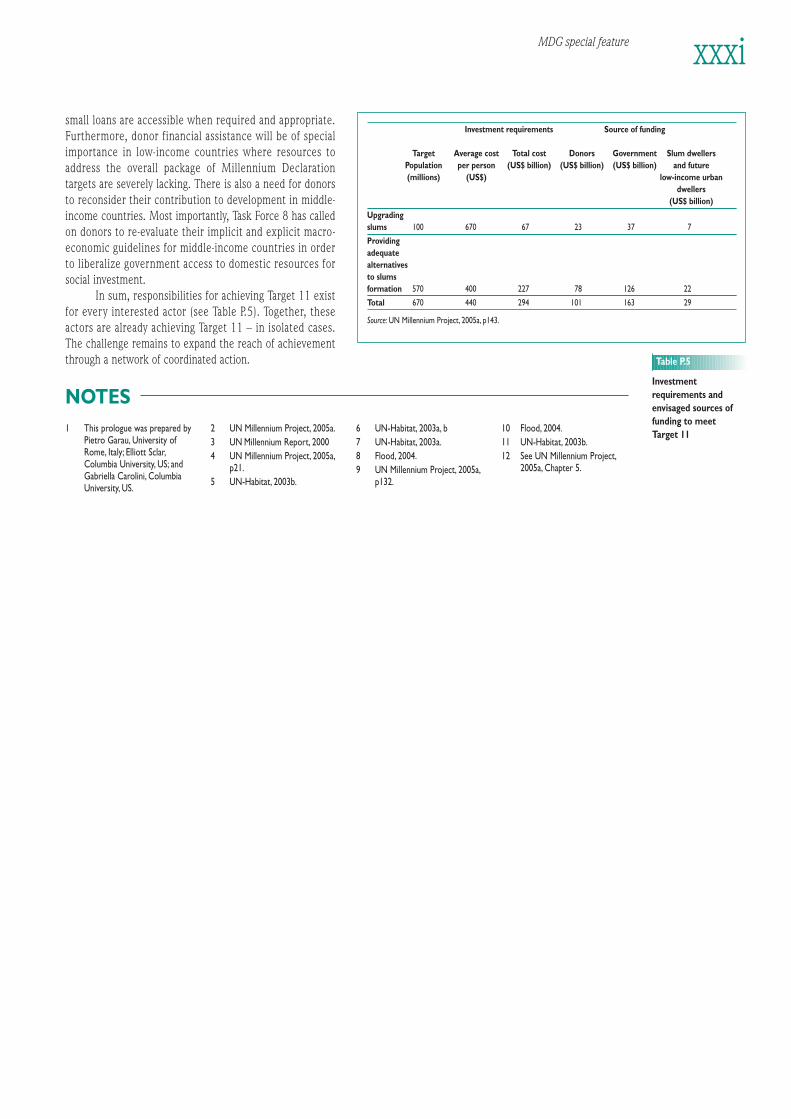
small loans are accessible when required and appropriate.Furthermore, donor financial assistance will be of specialimportance in low-income countries where resources toaddress the overall package of Millennium Declarationtargets are severely lacking. There is also a need for donorsto reconsider their contribution to development in middle-income countries. Most importantly, Task Force 8 has calledon donors to re-evaluate their implicit and explicit macro-economic guidelines for middle-income countries in orderto liberalize government access to domestic resources forsocial investment.
In sum, responsibilities for achieving Target 11 existfor every interested actor (see Table P.5). Together, theseactors are already achieving Target 11 – in isolated cases.The challenge remains to expand the reach of achievementthrough a network of coordinated action.
xxxiMDG special feature
Investment requirements Source of funding
Target Average cost Total cost Donors Government Slum dwellers Population per person (US$ billion) (US$ billion) (US$ billion) and future (millions) (US$) low-income urban
dwellers (US$ billion)
Upgrading slums 100 670 67 23 37 7
Providing adequate alternatives to slums formation 570 400 227 78 126 22
Total 670 440 294 101 163 29
Source: UN Millennium Project, 2005a, p143.
Investmentrequirements andenvisaged sources offunding to meet Target 11
Table P.5
NOTES1 This prologue was prepared by
Pietro Garau, University ofRome, Italy; Elliott Sclar,Columbia University, US; andGabriella Carolini, ColumbiaUniversity, US.
2 UN Millennium Project, 2005a.3 UN Millennium Report, 20004 UN Millennium Project, 2005a,
p21.5 UN-Habitat, 2003b.
6 UN-Habitat, 2003a, b7 UN-Habitat, 2003a.8 Flood, 2004.9 UN Millennium Project, 2005a,
p132.
10 Flood, 2004.11 UN-Habitat, 2003b.12 See UN Millennium Project,
2005a, Chapter 5.
More than 2 billion people will be added to the number ofurban dwellers in the developing countries over the next 25years. This implies an unprecedented growth in the demandfor housing, water supply, sanitation and other urbaninfrastructure services. This new challenge exists in acontext of already widespread poverty and inequality incities, with millions of people living in slums withoutadequate basic services. Providing these services to newresidents will be essential if this additional population is notto be trapped in urban poverty, poor health and lowproductivity. It is an urban problem with significant macro-economic consequences. This Global Report examines theurgent challenge of financing urban shelter developmentover the next generation. The report is divided into fourparts. Part I presents the macroeconomic, shelter policy andurban finance contexts of financing urban shelterdevelopment. Part II describes and assesses recent globaltrends in shelter finance, including mortgage finance,financing for social housing, shelter microfinance and sheltercommunity funds. Part III provides an overall assessment ofthe shelter financing systems analysed in Part II andexamines policy directions towards sustainable shelterfinance systems. The Epilogue in Part III examines theimplications of the report’s findings on sustainable urbanshelter policy. In Part IV, the Statistical Annex comprises 16tables covering three broad categories: demographicindicators and households data; housing and housinginfrastructure indicators; and economic and socialindicators. These tables are divided into three sectionspresenting data at the regional, country and city levels.
PART I: ECONOMIC ANDURBAN DEVELOPMENTCONTEXTChapter 1 – Challenges of SustainableShelter Development in MacroeconomicContext
By presenting the latest global demographic projections,Chapter 1 highlights the major social and economicchallenges of urban shelter provision in the next 25 years.The chapter also presents a macroeconomic frameworkwithin which to situate the problem of financing urbanshelter and to understand its broader implications. Whilemost of the urban population growth will occur in East andSouth Asia, particularly China and India, many places around
the world will experience the urbanization of poverty andinequality between rich and poor.
� Understanding urban shelter developmentchallenges
The current global backlog of slum dwellers is about 925million people. When this figure is combined with theprojected 1.9 billion additional urban population, it isapparent that 2.825 billion people will need housing andurban services by 2030. The demand for housing – just toaccommodate the increase in the number of households overthe next 25 years – is estimated to be 877 million housingunits.
This challenge is not just about the quantity ofpopulation, but also its composition. Cities are changingrapidly, especially in terms of both the scale and rate ofdemographic, social and economic transformation. Thispattern of growth will also place additional strains onenvironmental resources needed for cities, such as cleanwater and clean air. Growing demand for infrastructureservices places immediate pressures on natural resources.Environmental studies show that cities have importantimpacts upon the natural environments in which they arelocated, what is known as their ‘ecological footprint’.Consumption of natural resources by urban residents – forexample, firewood in Africa – is frequently growing fasterthan nature is able to reproduce those resources. Thispressure on natural resources is most dramatically shown bythe increasing cost of potable water in almost every city inthe world.
With this backdrop, it is clear that the capacity ofdeveloping countries to finance their needs depends largelyupon their level of future economic growth anddevelopment. If countries are able to generate employmentand incomes for growing populations at an accelerated rate,they will be able to generate and mobilize the savings andinvestment to finance housing and infrastructure services.Two key factors are needed to translate macroeconomicgrowth into finance for urban development. The first isgovernance – how public, private and non-governmentalinstitutions work together to plan and manage cities. Theseinstitutional challenges range from establishing the laws andregulations governing life in the city, to developing newresidential areas for the growing population, to decentralizedproblem-solving at the community level. The growing trendtowards decentralization in most national governments indeveloping countries has transformed the roles andresponsibilities of these institutions over the last two
SYNOPSIS

decades. However, this process is also insufficient to providethe needed housing and infrastructure services for growingpopulations. The second factor, finance, is essential for thisprocess. While the financial challenges are introduced in PartI, they are the subject of the body of this report.
� The macroeconomic context of urbanshelter development
The second part of Chapter 1 examines the macroeconomiccontext for urban development. It addresses the followingfactors: patterns of economic growth; sectoral performanceand productivity; income distribution and inequality; povertyand employment; savings; external debt; patterns ofinvestment (public, private and foreign); impacts of externalfactors upon macroeconomic performance; and theurbanization of national economies.
2004–2005 has been a period of unprecedentedeconomic growth at the global level. All developing regionsgrew at a pace faster than their growth rates of the 1980sand 1990s. Global trade also expanded considerably, withChina’s demand for imported raw materials and foodspurring exports from other developing countries. The moststriking feature of economic growth has been the high rateof growth for the developing countries, going above 6 percent for the first time. However, the distribution patternsare worrying because they continue the trend towardsgreater disparity in income levels between the regions, aswell as between developing and developed countries. Globalinequality between rich and poor countries, therefore,continues to worsen, even when there have beenextraordinarily high rates of economic growth. The mostquestionable aspect of this growth in 2005, however, iswhether it is likely to be sustained in the future.
The growing importance of world trade means that‘tradeables’, whether manufacturing products orcommodities, have become increasingly central to theeconomic growth of all countries, whether developed ordeveloping. While this places great emphasis on agricultureand production of raw materials, it also requiresimprovements in the efficiency of infrastructure intelecommunications, transport and key services such aselectricity and water supply needed for manufacturing andother industries.
Despite the impressive economic growth of the pastfew years, the enduring problem of massive poverty in thedeveloping countries remains the top priority problem facingthe world today. The incidence of poverty at the nationallevel is highly correlated with low levels of education andpoor health status, as well as lack of access to basicinfrastructure services such as clean water supply, sanitationand electricity.
The most direct and important factor contributing tourban poverty is the shortage of well-paid employment incities. The challenge here is both the creation of jobs andthe level of wages. The generation of employment dependsgenerally upon savings and investment within the macro-economy and local economies, as well. One problem that isassociated with high levels of poverty is a lack of domestic
savings within national economies. Low levels of domesticsavings – both public and private – contribute to low levelsof capitalization of the financial institutions in poorcountries. They are also reflected in low levels of taxrevenue collection and therefore place great limitations onpublic expenditures and public budgets. The issue of savingsis particularly important to the financing of urbaninfrastructure and housing.
The legacy of external borrowing for diverse purposeshas left many countries with unsustainable levels of externaldebt service. In some countries, particularly in Africa, thedebt service to gross domestic product (GDP) ratio hasreached over 400 per cent. These levels of debt immediatelyreduce available domestic capital for investment. Given theabove, the patterns of investment in the developingcountries have changed markedly over the past decade. Atthe same time, there has also been an importantsegmentation in the global financial markets, with somecountries – particularly the East Asian countries – being ableto attract high levels of foreign direct investment (FDI).Public investment as a share of GDP is also low in mostdeveloping countries. They have relatively large deficits intheir public budgets, with items such as the maintenance ofinfrastructure being a low priority in most countries.
The lack of resources for public investment in thepoorest countries poses a serious dilemma. Many of thesecountries do not qualify for FDI. They are dependent uponofficial development assistance (ODA) as the major sourceof financial support for economic development. Yet, ODA isalso severely limited. Even with promises of additionalfinance, the actual levels of official development aid areconstrained by lack of domestic political support in thedeveloped countries, or by the restrictions of macro-economic agreements with the international financialinstitutions.
Here, urban development must compete with otherpriorities in the fund allocation at international and nationallevels, which are clearly politically determined withinindividual governments. Many governments increasinglyassign responsibility for housing and urban development tothe provincial, state and local levels, rather than to thenational level. The weaknesses of the public sector and itsinability to mobilize substantial resources for urbandevelopment therefore point to the need to give greaterattention to private sources of finance, including the role ofprivatization of infrastructure services.
A final characteristic of the macroeconomic contextfor urban development is the urbanization of nationaleconomies themselves. Abundant evidence exists todemonstrate the growing importance of cities in the overallproductivity of countries. The increasing share of nationalGDP produced in cities has been well documented. Despitehistorically rapid rates of economic growth, there is littlelikelihood that conventional sources of funds will beavailable for investment on the scale needed to meet theprojected demand for urban shelter and relatedinfrastructure.
xxxiiiSynopsis
Chapter 2 – Shelter Policy and Finance:Retrospective Overview
Discussing the general trends in housing and urbandevelopment policy, this chapter highlights the paradigmshifts that have occurred – particularly in the policy contextof urban shelter finance.
� Between 1972 and 1982: Habitat IBy the early 1970s, the concept of intermediate technologyhad been developed and became popular, with therecognition that different technologies were appropriate indifferent contexts. Between 1972 and 1982, the focus offinancing was on low-interest loans, loan guarantees andsubsidies as a means of making housing affordable to low-income people. Interventions in this period concentrated ondemonstration projects of limited size, with regard to a cityor region, and were usually confined to a particularneighbourhood or group of neighbourhoods.
Projects tended to be outside of municipal control, tohave different standards from elsewhere, different means ofimplementation and to have little effect ‘outside the fence’.Projects generally focused on self-help, providing a contextin which the spare time and energy of low-income peoplecould be devoted to house construction or infrastructureprovision. They were broadly of two types: sites-and-servicesprojects for new housing provision; and settlement upgradingfor bringing squatter and other informal settlements up toan acceptable standard of servicing and public spaceprovision.
The concept of adding value through physical work,referred to as ‘sweat equity’, was strongly ingrained in theprojects of the 1970s. Participants in sites-and-servicesschemes were helped in their construction efforts by projectstaff who provided a range of services. However, evaluationshave shown that many participants used professionalbuilding workers in lieu of sweat equity.
In addition to finance by sweat equity, there weremany subsidies. Some were declared in the project (on-budget) and others were hidden (off-budget). Theparticipants in sites-and-services schemes tended to haverather higher incomes than the rhetoric and intentionimplied. Dwelling owners in upgrading schemes, on theother hand, tended to be among the low-income groups andtheir tenants were probably in even lower income echelons.
Many beneficiaries found themselves unsuited to theproject and bought their way out by selling to richerhouseholds, ignored some of the project requirements tobetter suit it to their needs, or defaulted on payments tomake it affordable. Tenants did not benefit much as theirrents would rise and tended to move out to other non-upgraded settlements where rents were still affordable.
The projects were often too complex for themunicipal authority to implement. The great majority ofcitizens – those outside the project ‘fence’ in the citiesaffected and those not finding work in the project –benefited hardly at all.
� The 1980s to the 1990s: Towards financialsustainability
For all the efforts aimed at improving housing, the un-serviced informal settlements appeared to be expandingrather than in decline. The limitations of this approachsequenced a low impact upon overall urban economicdevelopment, restrained institutional reforms and the fundswere restricted to ‘retail’ rather than ‘wholesale’ roles.
The 1980s saw ‘step-by-step moves towards a morecomprehensive whole housing-sector approach’. There wasa perceived need to incorporate housing within the widereconomic environment. It was recognized that the individualsites-and-services and slum upgrading projects alone couldnot affect the growing housing need and that a well-functioning finance system for housing for the majority wasnecessary.
This generated a paradigm shift from multi-sectoralbut quite localized projects, affecting a fortunate few, to anemphasis on creating a sustainable capability for housingsupply and urban development affecting most residents andcongruent with the overall policy and economicenvironment. The locus of borrowing changed from almostexclusively public-sector institutions to financialintermediaries. In parallel, attention shifted from thephysical asset financed to the institutional structure of theimplementing agency and its ability to mobilize thedevelopment required.
Reviews of housing policy transition have shown thatthere was a fulcrum of policy change during 1985 to 1987,a mid point between the two United Nations worldconferences on human settlements. By the end of this shortperiod, the enabling approach had been put together andlaunched on the international agenda, at the same time asmacroeconomic structural adjustment programme (SAP)initiatives designed to enable governments to recover fromyears of decline were being implemented.
The enabling approach treated housing and urbandevelopment as a multi-sectoral issue, affected just as muchby efficiencies and inefficiencies in finance as in theconstruction industry or land tenure systems or theregulatory framework. The task of the state was seen ascreating the legal, institutional and economic framework foreconomic productivity and social effectiveness, in whichefficient settlement development could then flourish.
The mid 1980s also saw the birth of sustainability asan overarching rubric for development activity. From thattime on, no agency could ignore the need to considerenvironmental impact alongside social and economicbenefits from its projects. Chapter 7 of Agenda 21 reiteratedthe overall objective of improving the social, economic andenvironmental quality of human settlements and the livingand working environments of all people, particularly thepoor. At the same time, there was a realignment of emphasisfrom ‘ability to pay’ to ‘willingness to pay’ as a result ofeconomic analysis which found that the latter producedmuch more accurate estimates in shelter-related cost-recovery calculations.
By 1988, the Global Strategy for Shelter to the Year2000 (GSS) had been formulated. It recognized that
xxxiv Financing Urban Shelter
governments had an obligation to ensure that an appropriateenvironment was created for the mobilization of finance forhousing. The objectives of such an effort were seen aspromoting and mobilizing savings, reducing costs, improvingthe efficiency of financial intermediation, and assisting thefree movement of capital through the national economy.Housing finance reform, which is a key component of ashelter strategy, was seen as part of a broad effort to reformand develop the financial sector.
The GSS had a laudable but over-optimistic objectiveof ‘decent housing’ for all by 2000. Later in the decade, thisterm was replaced by ‘adequate housing’. The need foradequate housing has also been included in many UnitedNations summit recommendations and closing declarations.The new paradigm encouraged institutional reform anddevelopment. This coincided with the spread ofdecentralization of power from the centre to regions andmunicipalities and the growth of a local sense ofresponsibility for urban conditions.
Reflecting the globalization beginning during the early1990s, the need for housing finance institutions to be ableto compete for deposits and investments on equal termswith other financial institutions was emphasized. Thus,lending had to be at positive, real interest rates and depositshad to be of sufficient term to support long-term lending.
During the 1990s, some developing countriesdeveloped proactive and well-integrated housing financepolicies and institutions. There was a recognition that purelygovernment-managed finance institutions had failed in theirlaudable aims and become bureaucratic, inefficient and preyto exploitation by insiders.
Mortgage finance is now available in most countries,but its limitations are obviously militating against its beingthe solution for most low-income households. In filling thisgap, microfinancing has progressed from being onlyenterprise focused to being an important feature of thehousing finance system.
� Strategy for the new millenniumJust before the turn of the millennium, the Habitat Agendawas adopted at the United Nations Conference on HumanSettlements in Istanbul in 1996. The agenda provides a basisfor international and national housing and urbandevelopment policy for the 21st century. With regard tofinance, the member states agreed to strengthen existingfinancial mechanisms. The importance of developinginnovative approaches for financing the implementation ofthe Habitat Agenda was also underlined.
In addition, the United Nations Conference on HumanSettlements reinforced the commitment of states to the fulland progressive realization of the right to adequate housing,as provided for in international instruments. Anyretrogressive measures, such as forced evictions, are regardedas violations of the right to housing. Indeed, states are seenas having a duty to respect, protect and fulfil housing rights.However, none of this is considered to entail a stateobligation to provide everyone with free housing but, rather,to set up the legal, social and economic environment in whichhouseholds have adequate chance to fulfil their needs.
Chapter 3 – Financing Urban Development
Highlighting the key issues of municipal finance systems,this chapter analyses the main sources of municipal finance,municipal spending patterns and privatization of municipalservices. The chapter emphasizes the relevance of urbandevelopment finance for shelter development. Thecomparative review of the approaches developed all over theworld reveals the emergence of several new trends: thebroadening of locally generated revenue sources; thestrengthening of local financial management; partnershipsin the financing of capital investments; and theenhancement of access to long-term credit formunicipalities.
� Sources of municipal financeThe sources of municipal finance – such as centralgovernment transfers, taxes on property and businesses,user fees, betterment taxes, development exactions,borrowing and income-generating enterprises – vary withinthe regions and from one municipality to the other. The mainrevenue sources at present are from central governmenttransfers; locally generated revenues which include taxes onproperty and on economic activities; user fees for thedelivery of services and the improvement of infrastructure;and loans borrowed to finance long-term investments.
� Municipal spending patternsMunicipal budgets, which reflect the policies and strategiesfor the delivery of mandatory and locally approved publicservices, should be capable of demonstrating the extent towhich the financial results have been realized, the intendedactivities performed and the anticipated outcomes achieved.The analysis of municipal spending patterns in relation tothe local government budgeting, which includesparticipatory budgeting and multi-year capital budgeting,shows that these are rarely achieved.
With regard to local government budgeting, problemsarise from the lack of financial management skills at the locallevels. Reliance on central government transfers also resultsin a number of constraints. The controls meant to improveefficiency and collection, or equity in distribution,sometimes also stifle local initiative and negate someadvantages of decentralization and democratic governance.Most local capital budgets reflect immediate needs orpolitical expediency rather than a long-term developmentstrategy, and most municipalities in developing countries areunable to borrow long-term funds from capital markets.
Participatory budgeting has emerged from thegrowing demands for accountability and transparency inmunicipal budgets and financial management, especially inthe allocation of scarce local resources and their utilization.Most developing countries lack funding for maintainingexisting assets. Thus, ‘preventive maintenance’ has toincreasingly become ‘crisis management’. The undueimportance laid on operating expenditures often leads to thedeferment of expenditures on maintaining existing assets.
The experience in many countries has shown thatdecentralization policies do not necessarily lead toresponsible financial management, as demonstrated by
xxxvSynopsis

budget deficits, accumulated debts and the inability to repayloans. Accountability for performance is a cornerstone ofgood governance and a major tool in financial management.It places as much emphasis upon transparency as uponfinancial management. Demands for greater accountabilityand transparency by voting and taxpaying constituencieshave combined with the constraints on the financialresources available to the public sector to exert politicalpressures for improving municipal financial management.Indeed, increasingly, mayors, councils and city managers areheld accountable for financial outcomes, as well as for thequalities of the services they deliver and the projects theyimplement. Reforms of existing systems and theintroduction of newer concepts and techniques haveprovided useful alternatives in financing and operatingpublic services.
� Privatization of municipal servicesIn both developing and advanced economies, privatizationhas resulted in revenue-producing services, includingwater supply and solid waste management, being graduallytaken over in the larger urban centres by specializedmultinational firms serving many local government units.Formal privatization in many cities has not benefited lowerincome communities, which underscores the need for thepublic sector to have a role in the delivery of essentialservices.
In the effort to deliver services effectively andefficiently, public–private partnerships have been usedunder joint-funding ventures. Such partnerships range fromthe granting of concessions, to joint venture agreements, tobuild–operate–transfer (BOT) or build–own–operate–transfer (BOOT) schemes. Of special interest to poorercountries are solutions based on partnerships betweenmunicipalities, non-governmental organizations (NGOs) andcommunity-based organizations (CBOs). In these countries,integrating poorer communities into the city fabric andgiving the poor access to basic services is hampered by thespread of chaotic urbanization, the mounting densities inthe central zones, the obsolescence of existing conventionalsystems and the lack of resources to maintain and upgradeexisting systems.
Municipalities are particularly reluctant to delegateauthority or share revenue with their peer entities. Thisreluctance is attributed to the difficulties encountered ingetting municipalities to collaborate in joint initiatives.Moreover, formalizing collaboration through negotiatedagreements and inter-municipal compacts is an even morechallenging task since there are no institutional incentivesfostering such strategic associations.
Decentralization and the privatization of services arefacing a number of constraints in developing countries, asopposed to advanced and transitional economies. Developingeconomies have not been able to enact and implementsuccessful decentralization policies that redistributeresources effectively. While privatization has forcedgovernments to examine entrenched practices and toconsider alternatives for their modification or replacementwith considerable success, it is not a panacea.
The major challenges that must be addressed includethe large numbers of smaller, financially weak municipalities;asymmetrical decentralization; retrenchment of centraltransfers; weakness of local revenue sources; lack of strongdomestic capital markets; impediments to the developmentof municipal credit institutions; inadequate capacity andrules for sound financial management at the local level; lackof mechanisms to finance urban investments; and lack offunds for maintaining existing assets.
In conclusion, the following recent trends inmunicipal finance may be highlighted:
• Financial discipline and the commercial outlook ofcompeting private enterprise have, in some countries,forced public administrators to lower costs, achievegreater efficiency and improve the quality of outputs.
• Opening up of public services to market participationhas created more opportunities for competition in thedelivery of these services than previously.
• A growing demand for accountability andtransparency in municipal budgeting has accompaniedpolitical and fiscal decentralization. There is a markedtrend for more rigorous financial management, clearprocedures for the allocation of resources, and theparticipation of residents in decisions that affect theircommunities.
• Public–private partnerships, which require significantdelegation of authority and can be very productive,have been on the increase. Some locally basedpartnerships involving CBOs and microenterpriseshave been found to provide successful means forempowerment and social inclusion, especially in thedeveloping countries.
PART II: SHELTER FINANCE –ASSESSMENT OF TRENDSChapter 4 – Mortgage Finance: Institutionsand Mechanisms
The cost of a complete dwelling could be between 2.5 to 6times the average annual salary. To purchase property, it isvery difficult to finance such costs without a loan and,generally, such loans will need to be long term. When therepayment period is to stretch for such a considerableperiod, a legal framework is required for lenders to beconfident about the security of their finance – hence thesignificance of mortgage finance in which the loan is securedon property.
Chapter 4 first considers emerging trends in theprovision of mortgage finance and summarizes the currentterms and conditions of such finance. Second, it looksparticularly at the situation with regard to lower incomehouseholds who might be seeking mortgage finance and theaffordability of such options for these households. Third, itexamines emerging tensions and opportunities in currentmortgage finance and assesses its potential contribution toaddressing household needs for housing finance.
xxxvi Financing Urban Shelter
� Providing mortgage finance
In general, governments have sought to encouragehomeownership and have, in many cases, providedpreferential financing to influence consumer choice. Therehas been a general shift towards market-based mechanismsfor providing housing, with attempts to reduce subsidies andderegulate markets. In part, this is due to the pastineffectiveness of housing strategies that have dependedupon direct provision by the state. This trend is alsoconsistent with the overall direction of macroeconomicstrategies during recent decades.
The importance of deposits to the bank system iswidely acknowledged. Deposits account for 62 per cent ofthe funding of all mortgage loans within the European Union(EU) countries, and this percentage is even higher in thetransition countries. However, if the only source of financeavailable to the mortgage lenders is deposits, then even ifthey can secure sufficient funds, lenders face a risk whencommitting long-term loans with short-term finance. As analternative to short-term deposits, there are several sourcesof longer-term finance. One source is the state itself and thedirect contributions that it might make. A second source isprivate funds institutionalized for housing finance throughspecialist saving schemes. A third source is privatecommercial investment. Despite these multiple sources, theavailability of long-term finance is limited in many countries.
The secondary market in mortgage finance developedin order to cope with the risks associated with short-termdeposits and longer-term loans. The US has leddevelopments in secondary markets, which have becomenotably significant from the mid 1980s onwards. For the last25 years, there have been significant changes in mortgagefinance with the growth of the involvement of capitalmarkets; this began in the US and spread to Europe and,more recently, is being explored in Latin America and Asia.
A number of measures have been taken in Africa tostrengthen secondary markets and, specifically, securitiz-ation. In Kenya, a recent draft national housing policy aimsto create a secondary market to ensure additional capital fromoverseas and a reduction in the costs of borrowing.
A further and remaining source of finance, despitefrequent criticisms on the grounds of economic efficiencyand ineffectual targeting, is the state. Governments haveover many decades intervened in housing markets with theintention of widening access to housing finance, and theycontinue to have a major role in housing finance through thecontinued use of subsidies.
There are several motivations for state involvement.With respect to the welfare of households, motivations are,notably, to promote homeownership as a whole and tospecifically address the needs of those with inadequatehousing. The state may also have systemic interests toensure that the financial markets for housing are stable.
The common strategies to increase homeownershipthrough the enhanced provision of finance are:
• mortgage interest relief;• interest subsidies;• housing savings schemes;
• guarantees;• subsidies for ‘key’ public-sector workers; and• intermediate tenures.
A more recent shift has been subsidies designed to augmentthe payment capacity of the poor (direct-demand subsidies).
One of the most far-reaching systems of stateintervention through direct construction has been used inthe case of Singapore, where 96 per cent of the householdsare living in homeownership apartments. The strategy hasbeen based on the provision of subsidized mortgage finance(primarily through the interest rate), combined with adedicated supply of funds through already existingprovident/pension funds. However, there are many examplesof failed public housing policies. One example is theNational Housing Corporation in Kenya, whose productionwas well below need, with only several thousand units ayear. Two parastatals in Côte d’Ivoire together constructed41,000 units between 1960 and the 1980s before beingwound up.
� Taxation-related incentivesIn many West European countries, mortgage interestpayments are, to some extent, tax deductible. Interest ratesubsidies have been a popular way of enhancing housingfinance affordability. Occasionally this policy has beencriticized as acting as a substitute for prudent macro-economic management. Interest rate subsidies may beassociated with savings schemes for housing investments.
However, the case against interest rate subsidies hasbeen strongly made. It has been argued that direct subsidiesare a preferred way of offering assistance with housing costsas they can be more precisely targeted on those in need.Interest rate subsidies inevitably favour those who can affordloans and larger subsidies go to those who are able to affordlarger loans. In spite of this, interest rate subsidies appearto continue to be used.
In addition to direct assistance to households toincrease the affordability of housing finance, governmentshave sought to ensure the stability of the system and toreduce the risks for lending institutions when they extendservices to lower income households. As the greateravailability of finance has been reflected in growing levels ofowner occupation, risks have increased.
� Regional highlightsHomeownership is now the majority tenure across WesternEurope, with exceptions – notably in Germany.Nevertheless, levels of owner occupation vary considerably,being highest among some of the Southern Europeancountries (Spain and Italy) where homeownership can bedescribed as being ‘dominant’. Homeownership is relativelyhigh in several other countries, notably the UK, at around70 per cent. In countries, such as France, the Netherlands,Denmark and Sweden, homeownership has been establishedas the ‘majority’ tenure without being especially high ordominant. There is little evidence of convergence inhomeownership levels, either in the sense that they aremoving in the same direction, or that they are convergingtowards similar levels.
xxxviiSynopsis
In 2003, the European market as a whole continuedto grow, with the total value of residential mortgage debtincreasing by 7.4 per cent, a little below the ten-year averageof 8 per cent. The total volume of mortgage loans in Europeat the end of 2003 was US$3.4 trillion. This figure hasgrown rapidly and it now accounts for 42 per cent of EUGDP. This rapid expansion in lending has been encouragedby lower interest rates. However, it should be rememberedthat the rise in the volume of lending is not necessarilyassociated with increasing access, as one further trend hasbeen rising house prices, with capital gains for currenthomeowners and increasing difficulties for those seeking tobecome homeowners for the first time. In the US,homeownership grew on average, as did income, throughoutthe largely prosperous 1990s and now stands at a recordhigh.
The transition countries face a particular problem inthat commercial housing finance markets were previouslynon-existent. There has been state support to thedevelopment of housing finance systems, with theexpectation that the commercial sector will become anincreasingly significant provider. Unfortunately, much of thissupport has been to the benefit of higher income groupswho are the only ones able to afford such finance.
Volumes of housing loans are low in the transitioncountries. However, there are indications that housing loanmarkets are growing rapidly; for example, in Estonia thescale of housing loans doubled between 1997 and 2000, andin the Czech Republic the scale of loans grew more thansixfold during the same period. During 2002 and 2003,mortgage lending grew particularly strongly in Hungary,Poland and Latvia (by more than 85 per cent).
The privatization process that took place resulted inthe transfer of significant numbers of dwellings into privatehands. Owner occupation is now close to or above 90 percent in Hungary, Bulgaria, Estonia and Romania, while inPoland, Slovakia and Slovenia it is above 70 per cent.However, despite this increase in homeownership, thefinancial systems needed for such ownership have notdeveloped.
The problems of affordability in the South areconsiderable. The supply of mortgages in Southern countrieshas been limited by a large number of factors, including lowincomes that barely cover subsistence needs for aconsiderable proportion of the population, a lack of formalfinancial institutions that can capture people’s savings, aswell as macroeconomic instability. The recent financial criseshave had negative impacts upon the formal housing financesystems in a number of countries and have particularlydeterred commercial provision of mortgage finance.However, there are signs of a recovery in lending in bothAsian and Latin American countries.
In China, the system of housing finance has beensignificantly redeveloped. The previous system was one inwhich dwellings were primarily provided through work unitsthat housed employees in return for a nominal rent. In 1995,the government introduced two major programmes toencourage home purchase, the National ComfortableHousing Project and the Housing Provident Fund.
In Latin America, less than 30 per cent of dwellingsare produced by the formal housing market. Residential debtis in general a fairly low percentage of GDP, indicating thatmortgage lending is not extensive. Significant difficulties offoreclosure, with long foreclosure periods taking over oneyear, are just one set of the problems that has reduced theattractiveness of mortgage finance in this region. During thelast decade, the core issues facing governments in LatinAmerica appear to be the longstanding problems of macro-economic performance and, notably, inflation, the specificeconomic difficulties of the late 1990s and the need toextend finance to those with lower incomes. The relatedstrategies have been titling, direct-demand subsidies, theuse of specially defined units for housing investment andthe expansion of capital into the system throughstrengthening of the secondary market.
While there are continuing problems ofunderdeveloped housing finance systems, in part as a resultof the economic difficulties of recent decades, there aresome positive trends in Chile, Costa Rica, Panama, Mexicoand Peru, with uneven progress in Colombia, Bolivia andEcuador. These improvements include financial-sectorreforms to facilitate the expansion of mortgage financing,judiciary reform to facilitate the recovery of collateral andincreases in housing production/finance in the privatesector. They also involve attempts to have public housingagencies working more effectively with the treasuries,private banks and developers to address the housing needsof beneficiaries.
The situation in sub-Saharan Africa divides betweenSouth Africa (and, to a lesser extent, Namibia and, untilrecently, Zimbabwe), where the commercial banking sectoris significantly involved in mortgage lending, and the restof the continent. South Africa’s mortgage market is about198 billion rand (US$30.7 billion). Most of its housingfinance is provided through bank mortgages. Despite thisscale of finance, there is evidence to suggest that the lowerincome households remain excluded from the market.While those who are in formal employment can use theirprovident funds to guarantee housing loans, many work inthe informal sector. Moreover, mortgage finance isunaffordable to many.
Although state housing finance institutions havecontinued in some cases, the greater emphasis on costrecovery and operating efficiency during the 1990s hasgiven them considerable problems in securing finance.Generally, those that do exist have been heavily regulatedand have also been seen as social instruments, rather thanfinancial mechanisms. More recently, the state haswithdrawn from this area and some housing financeinstitutions have withdrawn as well. A particular andcontinuing problem faced in Africa has been a lack ofeffective institutions and instruments to mobilize savingsand to channel them into housing investment. For the mostpart, housing finance institutions have remained dependentupon deposits and have not been able to secure long-termfinance.
xxxviii Financing Urban Shelter

� Terms and conditions
Mortgage lending is associated with a standard package ofterms and conditions which specify the contribution ofdeposits, in some cases the period of savings, the interestrate to be charged on the loan (and if it is fixed or variable),the period of the loan (potentially with penalties for earlyand late repayment), and loan-to-value ratios (the maximumpercentage of the loan against a verified value of thedwelling). A further important factor is the amount that theloan institution is willing to lend in relation to theborrowers’ income(s).
The increased diversification of housing loan suppliershas reduced the general significance of savings activities thatare specifically linked to housing; but some form of savingremains essential if mortgage loans are offered for less thanthe full cost of the property.
Considerable effort has been made to extendopportunities to secure housing finance during recent years.This is the product of two related factors. On the one hand,the housing finance market has become more competitiveas new providers have been encouraged to enter the market.Such providers have been seeking new customers to extendtheir activities. On the other hand, the state has beenlooking to the market to address housing need. Faced withconsiderable housing problems and seeking to reduce publicexpenditure, governments have sought to encourage themarket to address needs where possible.
As noted earlier, affordability is not just about accessto and the cost of housing finance, it is also critically aboutthe price of housing. One of the most important trends inhousing finance in Western Europe has been the widening‘gap’ between incomes and house prices, House prices haverisen since 1997, notably in Australia, Ireland, Spain and theUK. In 2003, the European Mortgage Federation notedstrong price increases in Latvia, Portugal, Spain, the UK andIreland.
In a number of countries, housing supply appears tobe inelastic, responding only slowly to increases in housingdemand expressed through rising prices. Research hasshown that local regulations that prevent housingconstruction are a significant cause of high house prices inthe US and UK, as well as in Malaysia, Republic of Korea,Tanzania and New Zealand.
In a context of rising house prices, housing financesystems have a greater job to do in bridging the gap betweenincomes and prices. Young people have particular difficultiesin purchasing dwellings as they have had less time to savefor a down payment (deposit) and earnings are lower forthose who have recently entered the labour market.
Turning to more general problems of affordability, USdata for 2004 indicates that there are some 6 millionhouseholds living in owner-occupied dwellings who fallbelow the poverty line. This is not that much less than the7.9 million households below the poverty line who are livingin rental accommodation. In the transition countries, thereare real problems with affordability due to generally lowlevels of income. For example, only 10 to 20 per cent of thepopulation in Estonia and Latvia are considered to be eligiblefor housing loans. In the South, the numbers of people able
to afford formal housing with the associated financing costsare limited. As indicated earlier, the clear emerging trend ina number of countries is that of the extension of mortgagefinance. However, it is very difficult to assess how successfulthis has been.
Chapter 5 – Financing for Rental and Social Housing
While a narrow definition of housing finance may focus onlyon the provision of credit, the scale and significance ofhousing finance subsidies primarily through rental housing,subsidized loan finance and direct-demand (capital) subsidiesmakes this component difficult to ignore. An understandingof how the financing of social housing can fit within abroader system of housing financing is needed. This chapterlooks specifically at some strategies that have recently beenused to provide financial subsidies.
Financial subsidies seek to provide incentives toenable and persuade a certain class of producers orconsumers to do something they would not otherwise do bylowering the opportunity cost or otherwise increasing thepotential benefit of doing so. Some argue that such financialsubsidies are best avoided and should be a policy of lastresort. Such concerns focus on the potential distortion ofmarkets and are often accomplished by recommendationson institutional and regulatory reforms. In addition,subsidies, especially those offered on interest rates, mayhave a huge hidden cost.
While subsidies tend to be criticized by economistsseeking to encourage a greater realization of the potentialeffectiveness of markets, they remain popular withgovernments. The interest in subsidies has resulted inmultiple approaches to their delivery, which notably includedirect interest rates reductions; allowing mortgage interestto be deducted from income taxes; support for housingsavings; support for insurance in the primary market;support for insurance in secondary markets; and directgrants. However, concerns remain, notably that suchsubsidies rarely reach the poor. Governments in the Northand the South have primarily used two financing strategiesto assist families to obtain housing: assistance for ownershipand/or the assistance to afford adequate rentalaccommodation.
Three specific trends are well established in a numberof countries:
1 Governments have shifted away from the directconstruction and management of public housing.They have used several strategies to reduce theirstocks, with large-scale transfers to occupiers in somecases.
2 There is increasing assistance for homeownershipthrough direct-demand (capital) subsidies.
3 Consistent with the two trends above is the greateruse of housing allowances (rather than directprovision) to assist low-income families rentingaccommodation in the private or non-profit sectors.
xxxixSynopsis
Despite their focus on lower income households, fundingfor direct subsidies is often smaller in scale than interestrate subsidies when the full costs of the latter over the lifeof the loan are considered.
� Rental housing in the NorthAlthough in the North the state is generally playing a lessdirect role in economic intervention, this is not necessarilythe case in housing. Despite the shift to income-relatedsupport, the social rented sector (defined as housing let atbelow-market prices and allocated administratively on thebasis of housing need, rather than on the ability to pay)remains a significant tenure in several states. However, therehave been significant changes in policy and the nature ofhousing support has shifted in Western Europe. Supportsystems with large, general interest subsidies for newconstruction and rehabilitation have been phased out.Targeted income-related subsidies have become relativelymore important, as have subsidies to depressed housing areas.
There has been a general marked decline in the levelsof new housing units in this sector. As the numbers ofdesignated social housing and/or public properties fall, thereare concerns that the scale of social disadvantage associatedwith such accommodation will rise. It is feared that this willresult in a high concentration of social disadvantage, therebyexacerbating social exclusion, reducing mobility and creatinggreater marginalization for tenants. One further concern isthat the growth of means-tested housing allowances (alsoencouraged by the use of private finance) has resulted inhigher rents. However, means-tested housing allowances areconsidered to offer better incentives in terms of labourmobility and to enable more effective targeting.
One of the most significant developments in socialrented housing has been the increased use of private financefor rented housing in much of Western Europe. Despite thisuse, there has been limited private equity investment.Another key trend during recent years has been theemergence of surpluses in the social rented sector, as awhole, in many countries. Declining debt burdens arisingfrom lower levels of construction and the repayment of olderdebt have coincided with rising rents to create thesesurpluses. Several countries have attempted to establish‘revolving-door’ systems of finance whereby surpluses arereinvested in the sector. However, it seems that revolving-door finance alone does not stimulate increasedconstruction, either because funds are inadequate orincentives are absent.
� Rental housing in transition countriesPrior to transition, in most Eastern European countrieshousing was provided by state institutions (workplace, localgovernment and/or housing co-operatives). Essentially, thesystem was one in which state-provided social rental systemsdominated, with low rents and administrative allocationsystems.
The transition phase included the transfer of some ofthese dwellings to their occupants under privatizationprogrammes. In some countries, more than 90 per cent ofthe stock was sold, while in others the percentage was as
low as 6 per cent. However, housing markets were verylimited. Even where people own their dwellings, it appearsto have been difficult to trade them.
By the end of the 1990s, there was some interest inreinvestment in rental housing – for example in Poland,Slovakia, the Czech Republic and Hungary. A significantscale is planned – between 10 and 30 per cent of newconstruction in Poland, Romania and Hungary. However, aconsiderable problem remains, which is that the institutionalstrategies for addressing the housing needs of the pooresthave collapsed, with no alternative being developed.
� Rental housing in the SouthLarge-scale public housing has not been that significant inthe South despite exceptions such as Hong Kong. Whilemany countries have experimented on a minor scale, ingeneral the scale of provision reflects the limited fundsavailable to invest in public housing initiatives and the highstandards that are required. In general, public rental housinghas not been allocated to the poor, nor would it necessarilyhave been affordable even if it had been allocated. In somecases, these properties have now been privatized followingthe increased emphasis on market provision. As with thetransition countries in Europe, China has relatively recentlybegun a policy to transfer to homeownership dwellings thathad previously been rented from state-owned enterprisesand from other state housing providers.
Despite a general trend against direct provision in theSouth as well as the North, there is some continuing supportfor rental housing in a number of countries. In Hong Kong,the Housing Authority actually increased its stock by 18,000units between 1991 and 2001. In the Republic of Korea,there has been (since 1989) a growing interest in apermanent rental dwelling programme for those on lowincomes. In South Africa, there has also been a policy (albeitas a secondary strategy subsidiary to the main emphasis onhomeownership) to support the development of a socialhousing sector and, more specifically, to encourage thedevelopment of housing associations to manage low-incomeestates and rental accommodation.
� Social housing and homeownership In practice, the high costs of construction of rental publichousing and the ongoing costs of maintenance, often in acontext in which rents remain very low and national housingbudgets very limited, has resulted in large-scale rentalprogrammes being considered impossible in many Southerncountries. Despite these problems, there are somegovernments that have sought to introduce subsidyprogrammes of a significant scale.
In a number of cases, they have chosen to use limitedfunds to support small loan programmes that enhance theprocess of incremental housing development. In othercases, governments have chosen to subsidize a minimumcomplete dwelling. In yet other cases, effective subsidieshave been given through low-interest loans. The limitedresources that exist for housing finance mean thatallocations may be made as political favours rather than asuniversal entitlements.
xl Financing Urban Shelter
Despite the initial political commitments andsignificant programmes, the Chilean, Colombian and SouthAfrican governments have not put large-scale funding intocapital subsidies. The percentage of state expenditure forthese three countries does not exceed 1.25 per cent, while2 per cent has been considered typical in the South.
Chapter 6 – Small Loans: Shelter Microfinance
For individuals or households with limited incomes, the onlypossibility of homeownership (even in an illegal settlement)is through shelter investment made in several stages. Landpurchase, service installation and upgrading, and housingconstruction, consolidation and expansion are all made atseparate times. An estimated 70 per cent of housinginvestment in developing countries occurs through suchprogressive building. Such incremental shelters, ofteninitially built of temporary materials, frequently requirerepairs because of damage (for example, from natural forces).
In the vast majority of cases these households areineligible for commercial mortgage finance. Householdsseeking to invest in their shelter (land, infrastructure andhousing) have been forced to use their own limited income,seek additional resources from family and friends, andborrow on informal credit markets or, in some cases, fromgroups like credit unions. There have been severalinstitutional efforts to assist these households secure accessto some kind of loan finance. In particular, sheltermicrofinance and community finance mechanisms havegrown considerably during recent decades. This chapterdiscusses the use of microfinance approaches to shelterlending. The loans are almost universally to individuals,generally those with some security of tenure, for investment(construction, improvement and extension) in housingrather than land and infrastructure.
� The growth of microfinance for shelterThe growth of microfinance agencies since their inceptionduring the 1980s has been considerable and there are nowmany such organizations. To exemplify the situation in onecountry, in India the number of such grassroots-levelorganizations engaged in mobilizing savings and providingmicro-loan services to the poor is estimated to be in therange of 400 to 500 organizations. Evaluations ofmicrofinance organizations have demonstrated that,whatever the loans were taken for, a proportion as large as25 per cent could be diverted for shelter investments.Findings such as these have encouraged the exploration ofmicrofinance lending specifically for shelter.
There are a considerable number of NGOs who havebeen working with housing issues, generally for lowerincome groups, and who have been drawn into loanfinancing in order to scale up their activities and/or toprovide assistance to residents who have been successful inacquiring land. Shelter NGOs looked to the examples ofmicrofinance agencies seeking to bring financial markets tothose who traditionally had been excluded fromopportunities for savings and credit. There are two distinct
groups of such NGOs working in housing finance. The firstgroup is professional urban development NGOs who haveprimarily been drawn into finance programmes to influencestate policies and the demands of low-income communities.The second group are humanitarian agencies who haveworked to improve housing conditions in low-income areas.Recognizing that families are able and willing to invest intheir own dwellings, they have directly developed small loanprogrammes at scale.
In addition to NGO initiatives, there has beenconsiderable interest in housing lending shown by themicrofinance sector. Microfinance agencies appear to bediversifying rapidly into housing microcredit in at least someregions. One study funded by the International FinanceCorporation (IFC) identifies 141 institutions providingshelter-finance loan products to the poor. The speed withwhich housing loans have been integrated within suchagencies appears to have been facilitated by the similarity oflending practice.
One reason for the diversification of microfinanceagencies into housing is commercial advantages. Suchdiversification may increase the financial stability of theirloan portfolio and enable them to take advantage ofopportunities for growth, as well as avoid losing clients toother microfinance agencies that provide housing loans. Afurther notable advantage is that the longer repaymentperiod associated with housing loans helps to draw theborrowers into a longer-term relationship with the lendingagency and increases the likelihood that further loans willbe taken.
� Neighbourhood improvement (slumupgrading)
A further potential role for shelter microfinance is withinmore comprehensive slum upgrading programmes. Thereappears to be a growing interest in using microfinanceagencies to provide specialist financial services within morecomprehensive neighbourhood improvement and povertyreduction programmes. Within this strategy, thedevelopment agency, central government and/ormunicipality finances a process to upgrade the low-incomearea with components to regularize tenure and provideand/or upgrade infrastructure and services. The upgradingprogramme then contracts with an organization to offersmall-scale housing loans for those who wish to upgradetheir homes.
A good example is the Local Development Programme(PRODEL) in Nicaragua that was set up to enhancedevelopment in smaller towns and cities with a number ofcomponents, including infrastructure improvements,housing loans and loans for microenterprises. A morefocused (and smaller-scale approach) is illustrated inAhmedabad, India, where the Slum Networking Project(undertaken within the municipality) wished to include acredit component to help households afford to contribute toinfrastructure improvements.
While most slum upgrading initiatives have been ledby the state, an alternative approach is that developed froman Indian alliance of the Society for the Promotion of Area
xliSynopsis

Resource Centres (SPARC) – an NGO – the National SlumDwellers Federation and Mahila Milan (a network of women’scollectives). Their strategy is to develop the capacity of localcommunities to manage a comprehensive upgrading andredevelopment process that is financed primarily by the state(through subsidies), with additional monies through loanstaken by communities and repaid by individual members.Through a not-for-profit company, Samudhaya NirmanSahayak, communities draw down the funds they need to pre-finance land, infrastructure and housing development. Thescale of activities has resulted in additional donor financebeing drawn into the process through the Community-ledInfrastructure Financing Facility (CLIFF).
A further model offering a more comprehensivedevelopment strategy than shelter microfinance is thestrategy of combining small loans for housing improvementwith land development. One illustration is the case of ElSalvador where low-cost subdivision regulations establishedduring the early 1990s have helped to stimulate a low-income land development industry of 200 firms. Afterdeveloping the area and selling the household a servicedplot, many of these developers offer a small loan (oftenaround US$1000) to build an initial core unit. It appears thatthis strategy has resulted in affordable secure tenure overthe last decade and – with greater supply – has lowered realestate prices in real terms.
The neighbourhood development (slum upgrading),together with the servicing of greenfield sites, approachessuggest a number of distinct neighbourhood and housingstrategies that include a role for small-scale housing loans:
• improvements of existing housing units (this is thedominant approach today within sheltermicrofinance);
• linked land purchase and housing loan developments;• linked land development and/or upgrading paid for
with a capital subsidy and housing loan developments;and
• linked settlement upgrading and housing loan.
� Sources of capital financeHow do microfinance agencies secure capital for theirlending? Some providers draw on their own capital, notablythe private sector and, for the most part, the small-scalevoluntary organizations such as credit unions.
In general, microfinance agencies have four sourcesof capital finance: deposits, development assistance,governments and the private sector. The problem of lack ofcapital remains even in countries with a well-developedmicrofinance sector.
There is a difference of opinion betweenmicrofinance agencies about the need for housing subsidies.On the one hand, there is a belief that subsidies are neededboth because of the traditional association betweensubsidies and low-income housing and because of the largersize of housing loans. On the other hand, it is widelyaccepted that microfinance needs to perform withoutsubsidy finance in order to be able to expand as marketconditions permit.
In situations in which there is no state support, thereappears to be an effective cross-subsidy from enterprise toshelter lending, as the interest rates are lower in the latter.In some countries, particularly in Asia, subsidies are availablethrough reduced interest rates, and microfinance agencieshave become a conduit to deliver state support to the poor.In some cases, the subsidy is provided in the form of aninterest rate reduction. Grameen Bank in Bangladesh andthe Self-employed Women’s Association (SEWA) in Indiahave both accessed low-interest sources of funds and passon this subsidy.
� Savings and collateralThe link between housing investment and savings extendswell beyond the microfinance sector. In the North, familieshave traditionally saved for several years simply to accessconventional mortgage finance. Similarly, many microfinanceprogrammes for housing, particularly in Asia and Africa, havesavings requirements. Savings has a place in microfinancefor many reasons. It is a strategy to assist with repaymentsin which borrowers have to demonstrate a capacity to makeregular payments and accumulate sufficient funds for therequired down payment or deposit.
Collateral is an asset pledged to a lender until theborrower pays back the debt. Its major role is in reducinglender risk and it is widely recognized that a key challengefor shelter microfinance is that of loan security. Manymicrofinance agencies seek to minimize the need forcollateral by using existing client history (enterpriselending). A further strategy used when lending for incomegeneration is small repeat loans as a way of building uprepayment skills and capacities and providing an incentivefor repayment. However, the larger size of sheltermicrofinance makes this strategy more difficult to follow.
Another strategy used by microenterprise lenders isthat of group guarantees. However, this strategy has beenfound to be problematic for housing loans, again because ofthe bigger loans and longer loan period. In the absence ofsuch strategies, a wide range of collaterals are used,including mortgages, personal guarantees, group guarantees,fixed assets and/or pension/provident fund guarantees.Pension fund collateral is used particularly in South Africaand Bangladesh and, more recently, in Namibia, but is notsignificant elsewhere.
� Foreseen challengesWhile shelter microfinance might not be effective in everycontext, there is now widespread experience andunderstanding of the process and considerable appreciationof the approach in many countries. There are two notablechallenges facing the shelter microfinance sector. The firstis the nature of the beneficiary group and the difficultiesfaced by very poor households due to problems ofaffordability and lack of secure tenure. The second is sourcesof funding.
Shelter microfinance programmes appear, in general,to reach the income groups served by microfinance agencieslending for enterprise development and families with similarincomes in the formal sector. Many shelter microfinance
xlii Financing Urban Shelter

programmes appear to be targeted at the higher incomeurban poor, sometimes those with formal employment (atleast one member of the family) and often those withdiversified household livelihood strategies. This bias reflectsthe need of the agencies to secure high levels of repaymentsand give out larger loans (with the administration coststherefore being a smaller proportion of the loan).
Lack of capital emerges as being a very significantconstraint on expansion. Banco ADEMI (in the DominicanRepublic) cited lack of capital as the principal challenge thatthe organization faces in providing housing credit, for whichthere has been substantial demand. These difficulties reflecta general constraint on the microfinance sector and, ingeneral, do not appear to be specifically related to housinglending. In addition, microfinance agencies face an issue ofscale. To be profitable they have to increase the quantity oflending. There is evidence that this is driving their expansioninto shelter microfinance; but for the smaller agencies, lackof capital to expand operations appears to be a significantconstraint. Longer-term loan repayment periods are alsocommon in shelter microfinance agencies despite the smallsize of the loans. Raising funds for shelter microfinance maybe more complicated than for enterprise lending because ofthese longer loan periods. Donor support has placedemphasis on building the institutional capacity of lendingagencies and assisting in the accumulation of their capitalbase. There has been a resistance to providing concessionalfunds for on-lending.
Chapter 7 – Community Funds
Community funds are of growing significance in assistingthe poor to address their shelter needs. As the role of thestate has diminished, increased emphasis has been placedon alternative strategies to support secure tenure, access tobasic services and improved dwellings. Community fundsoffer small loans to households but route these loansthrough community organizations. The emphasis oncollective loans is for many reasons, but one is that the loanssupport investments in land and infrastructure which arenecessarily made by a group working together. This chapterdescribes community funds, identifying their keycharacteristics, and discusses trends within this sector. Itlooks specifically at a number of key challenges, notably theaffordability of their strategies and sources of funds.
Community funds are financial mechanisms thatencourage savings through establishing and strengtheninglocal savings groups that provide collective finance forshelter improvement. This may include any one or more ofthe following activities: land purchase; land preparation;infrastructure installation; service provision and housingconstruction; and extension and improvement. Their mostdistinguishing characteristic is the way in which funding isperceived – rather than the mechanisms of the financingprocess. Community funds use savings and loans to trigger adevelopment process – not simply to increase the access ofthe poor to financial markets. They seek to strengthen thesocial bonds between community members (building socialcapital) so that existing finance within the community can
be used more effectively and external finance can beintegrated within community development strategies.Community funds are targeted at group borrowing andtherefore may include those with lower incomes.
Generally, there has been increasing interest incommunity funds during the last decade. The growth issupported by a general acknowledgement that small-scalelending has been somewhat successful and that urbanpoverty is growing. Two further current trends related to thedevelopment of such funds are worth noting: first, thegrowing interest by local government in these approaches,in part related to the use of such funds to extend essentialinfrastructure; and, second, the expansion of Shack or SlumDwellers International (SDI), a community/NGO networkwhose strategies incorporate savings and lending activitiesfor shelter improvements.
With respect to the latter trend, over the last 15 years,SDI has evolved into an international movement with affiliatesin more than 12 countries. SDI groups have spawned a hostof local community-owned and NGO-administered funds. InCambodia, the Philippines, South Africa, Nepal, Sri Lanka,Zimbabwe and Kenya, federation groups have established theirown funds, which they lend to savings schemes. Statecontributions have been obtained in South Africa, Namibiaand, more recently, Nepal.
� Funding sources The importance of mixed funding sources is evident. In somecases, funds have been established by government andlocated within a state agency with access to subsidies. Inother cases, the fund has been set up by civil societyorganizations and financed through a combination of statefunds, NGO monies, community contributions and,generally, international development assistance agencies. Inboth cases, the communities may make direct contributionsto the fund through deposits to secure loans.
An important and common characteristic ofcommunity funds is that some subsidy is provided – eitherthrough state funds or international development assistance.This is a further significant difference from conventionalmicrofinance and its individualized housing loans. Whileconventional microfinance programmes may offer a subsidy,in general there is an understanding that this should beavoided. Within community funds, greater priority is placedon achieving poverty reduction goals and neighbourhoodimprovement. Subsidies may be needed for institutionalsurvival if interest rates are below the level required tomaintain the real value of the fund. Equally or alternatively,subsidies may be required to reach everyone in a communityor to reach very low-income communities.
There are several routes through which subsidies aredelivered. The primary routes are direct subsidies, interestrate subsidies, additional support (for example, communitydevelopment and technical assistance) and unintendedsubsidies when delayed payment and/or default occurs.
A further source of finance is that of commercialfinancial institutions. A number of groups managingcommunity funds have sought to draw in commercial banks.At a minimal level, loan funds are released through banks,
xliiiSynopsis

thereby encouraging the poor to see such institutions assomething that they might use. In CLIFF, a donor-financedprogramme working with SPARC, the National SlumDwellers Federation and Mahila Milan in India, there is anexpectation that the urban poor groups will become strongenough to be able to borrow from the banks.
� Terms and conditionsSavings plays a central role in community funds. However,the programmes may differ in the speed and the intensity ofsavings. This difference reflects both the orientation of theprogramme itself and the possibilities within differentcountries. For example, in a large number of countries(including those with experience of informal savings andloan mechanisms), communities have been sceptical aboutthe value of savings for shelter investment, and loan financehas been provided rapidly once the savings commitment wasfulfilled. This is particularly true of countries that haveexperienced rapid inflation and/or where the state hasconfiscated or temporarily frozen savings.
Interest rates are generally subsidized, especially forland purchase and infrastructure, but often also forhousing investment. Three major reasons emerge for thispolicy: practical, political and social. On the practical side,many of these early programmes evolved with an interestrate subsidy because the relatively large size of the loanmade affordability difficult if market rates were used.Politically, the policies may have been influenced bycommunities who were familiar with state support forhousing through a reduced interest rate. This appears tobe particularly strong in Asia where, for example, theBangladeshi, Indian, Thai and Philippine governments allhave programmes with interest rate subsidies for low- (andlow-medium) income households. From a socialdevelopment perspective, inclusion of the poorest andaffordability are critical.
There are two distinctive characteristics of thecollateral strategies used by community funds. First, there isreliance on community systems and community collateralrather than claims over the individual borrowers. Second, incases of land purchase, legal title deeds may be used.However, the difficulties of loan security are considerablebecause of the different attitude towards non-repayment.
Loan periods appear to be longer than those used forshelter microfinance with, for example, rates of 25 years inthe Philippines and 10 years in Thailand. To a certain extent,this is because of the large size of the loan relative to familyincomes. It is also an acknowledgement of the fact that landpurchase, for example, may be only a part of the investmentsthat the family needs to make. NGO loan periods are lowerand are generally less than five years. While some appearlonger, such as those of the uTshani Fund in South Africa,the design reflects the fact that funds are primarily releasedas bridge finance for the state subsidy.
� ChallengesCommunity funds face challenges that are very similar tothose faced by agencies supporting shelter microfinanceinitiatives. How can they secure the funding they need for
long-term viability and how can they be effective in reachingout to those in need of shelter investment?
A particularly different challenge faces communityfunds as they develop – what should their strategy be withrespect to the state? Fundamentally, this is about strategiesthat maximize possibilities for scaling up funds whileretaining a process that can be controlled by localcommunities. Links to the state are almost certainly essentialif funding on the required scale is to be available. However,there is a concern that funds will be bureaucratized.
Community fund programmes are designed forrelatively stable communities who are in need of finance tosecure land tenure and to upgrade their neighbourhood.With regard to the challenge of inclusion, community fundsmay struggle to include all residents living within thesettlement. They may also find it difficult to assist those whodo not live permanently in areas of the city.
Throughout Asia, Latin America and Africa,conventional development processes have failed to dealwith many groups of poor people. In some cases, these arethe poorest; but this is not always the case. There areparticular groups who are vulnerable, such as illegalmigrants. For example, Nicaraguans living in Costa Rica,Peruvians in Ecuador or West Africans in South Africa areoften treated as non-citizens. The practice of daily saving inIndia helps to ensure that even the poorest can participate.The livelihoods of the poor are generally managed daily (orin three- to five-day cycles), not monthly. Groups who savemonthly exclude the poor. At the same time, richerhouseholds may not be interested in a process that requiresthem to save daily.
A group who may also face exclusion is tenants. It maybe difficult to ensure that tenants are granted equal rightsas tenure is secured and development takes place. A furtheraspect of inclusion is that of gender. There is a widespreadunderstanding that the centrality of women is important. Inpart, this is because women are concerned about theirneighbours, about who is sick and who needs what; it is alsorelated to the level of poverty and vulnerability experiencedby women. Women’s community role means that if womenare central to managing the savings process, then it is likelythat there will be fewer problems with exclusion within thecommunity. However, this requires that the process isorientated towards women taking up a leadership role. Whilethis seems prevalent in the case of savings and loans, insome contexts, the shift to construction encourages higherlevels of involvement by men.
PART III: TOWARDSSUSTAINABLE SHELTERFINANCE SYSTEMSChapter 8 – Assessing Shelter FinanceSystems
The analysis in Chapter 7 highlights a number of specificissues that have policy implications with regard to the valueof shelter finance in addressing urban shelter needs. This
xliv Financing Urban Shelter
chapter discusses these issues across the differentapproaches to shelter finance addressed in the GlobalReport. The issues considered are affordability and thedifficulties of reaching the poor; access to capital and thelack of loan finance; the move to markets and what themarket cannot manage – including the issues of maintainingfinancial viability; connections and diversity withinglobalization; and risk management within the market.
� Affordability and the difficulties of reachingthe poor
Rising house prices have made affordability more difficult inthe North, as well as in the South. There have been veryconsiderable attempts supported by government to extendhomeownership to lower income groups – for example,through the more extensive use of mortgage insurance. Thereare some indications of success (higher homeownershiprates) and some areas of concern as households may find itdifficult to manage the associated risks.
In the South, the percentage of those who cannotafford mortgage loans is significantly higher in manycountries, reflecting high levels of poverty. The estimatessuggest that these numbers may be over 70 per cent in sub-Saharan Africa and the lower income countries of Asia, andat or above 40 per cent in the higher income countries ofAsia and Latin America.
Opportunities to acquire small loans for landacquisition, infrastructure and housing do appear to havegrown significantly during the last two decades, particularlyduring the last ten years. However, provision still appearsvery small given potential demand (and in the context ofestimated housing deficits).
The growth of microfinance agencies for enterprisedevelopment pre-dates the specific rise of sheltermicrofinance. These agencies have been encouraged tomove into this sector due, in part, to the scale of enterpriseloans that were ‘misdirected’ at housing investment. Inother cases, they have extended their loan services torespond to explicit needs and requests, and because of theirown commercial needs to expand their markets. The majorproblem faced by these agencies appears to be a lack ofcapital for expansion.
The tradition of community funds has grown up torespond to the needs of urban poor groups to invest in landpurchase and to develop infrastructure on such land. Whilemany loans are for secure tenure and infrastructure, thefinancial systems are also used for more individualizedlending, both for housing and income generation.
Once more, there are indications that the poorest findit difficult to participate. Such problems are evident inassessments of the Community Mortgage Programme(CMP), a group-lending scheme in the Philippines that hasprovided almost 150,000 households with secure tenure,but which finds it difficult to include the pooresthouseholds. However, it has to be recognized that the useof loans carries inherent risks for those who are too poor tomanage repayment risk, and greater emphasis may need tobe placed on savings and grant combinations. Although therehave been some attempts to develop micro-insurance
schemes with microfinance initiatives, relatively littleattention has been given to such strategies in the context ofshelter microfinance.
� The role of mortgage finance: Access tocapital and the lack of loan finance
Mortgage finance is unaffordable for many of those living inthe South and a significant minority in the North. Despitethis, great emphasis has been placed by both governmentsand development agencies on mortgage finance, and statesubsidies for mortgage finance still appear to be at aconsiderable scale in more than a few countries.
Different housing markets are not distinct and if noother arrangements are made the higher income groupscould take up those opportunities that are being offered tothe poor.
In both Latin America and Asia, there have beeninitiatives at the government and multilateral agency levelto support the development of secondary markets toincrease wholesale finance to mortgage lenders. While it ispossible that it is a shortage of capital that is preventing theexpansion of mortgage finance, many other reasons havebeen identified in this report. What appears to be of mostsignificance is the scale of informality in property and labourmarkets. It seems that much emphasis has been placed onformalizing land titles; but, as seen in Peru, this has notnecessarily increased the take-up of either mortgages orenterprise loans. This suggests that access to loans may belimited in ways that cannot be addressed by reforms toproperty titles, increasing the ease of foreclosure or the scaleof finance and competition in the sector.
Despite these problems, mortgage lending doesappear to have expanded in a number of countries. Thisappears to be associated with economic growth and withincreasing affluence. Competition has intensified and themarket for mortgage finance is moving beyond a smallnumber of lenders in several countries.
There are risks for individual households in taking onmortgage loans, and some of these risks have been evidentwhen housing prices have fallen, notably in the UK andJapan. While mortgage insurance has been extended, itappears that much emphasis has been placed on protectingthe lender rather than the borrower. Mortgage finance hassurvived difficult circumstances in Asia and Latin Americaduring the last decade.
� The bigger picture and what the marketcannot manage
Despite a general emphasis on the expansion of market-orientated mortgage finance and housing support, moregenerally, the analysis in this report does point to a numberof areas in which markets alone appear to be struggling,including institutional failings related to necessarilycollective rather than individual investments in shelter, andissues related to urban planning and land-use management.
The housing finance market is strongly orientatedtowards providing loans to individual households. In two ofthe situations discussed in this report, there is a need forcollective investment: to maintain multi-family dwellings in
xlvSynopsis

transition countries and to invest in land and infrastructurefor those without tenure in the South. In both cases, itappears that the market is unable to make an adequateresponse, in part due to reasons of affordability, but alsobecause local institutions that can manage the finance aremissing. While the suggestion proposed by governmentagencies is often the establishment of formal managementcommittees, care needs to be given that these do notdiscriminate against the poor. To address the housing needsof the poor, housing finance systems need to provide forloans for such collective purposes, and appropriate localstructures must be in place for this to happen.
The market also seems to struggle with ensuring thequality of the urban environment (in a physical and socialsense). The greater emphasis on targeting and reduced socialprovision in the North appears to have resulted in a greaterconcentration of low-income households in specific areas.This applies both in the case of the transition countries andfor the richer countries of Western Europe.
Another important issue is the nature of thedevelopments that are being supported by the direct-demandsubsidies – for example, in South Africa and Chile. Aconsequence in both countries is that low-income housinghas been located on low-cost sites, often a considerabledistance from jobs, services and other facilities, with littleconsideration of the social cost that results from suchphysical exclusion. This suggests that the market is unableto respond to the needs of the poor without greaterinterventions from the state – either the funding agencyand/or the local authority. This further suggests that a keytask for government is to ensure adequate supplies of well-located and well-serviced land.
� Connections and diversity withinglobalization
The broad context within which the analysis in this report issituated is one in which financial markets are deregulating andthe state is withdrawing from direct involvement in theeconomy. Despite this financial deregulation, there isrelatively little evidence that financial globalization is takingplace in the housing sector. Markets for housing finance haveinternationalized rather than globalized. Hence, at present,while money can flow across borders and assets are soldoffshore as well as domestically, there is no globalized marketin which there is a continuous flow of funds into assets whoserisks and returns are independent of national regulatory andbanking structures, and where prices are identical acrossnational borders (for areas with similar risks).
Internationalization has occurred in place ofglobalization because, although the state has withdrawn tosome extent, it remains involved and housing financemarkets are still particular, depending upon their specifichistorical and structural contexts. As a result, rather thanthere being a single market, many national markets exist.
Chapter 9 – Pollicy Directions TowardsSustainable Urban Shelter Finance Systems
Chapter 9 discusses the ways in which shelter financesystems could be strengthened, in terms of both performance
and sustainability, on the basis of the experiences reviewedin the preceding chapters. Its main purpose is to point theway forward, highlighting best policies and practices. Thechapter starts by identifying policy directions in improvingurban development finance, which is necessary for citywideinfrastructure development. It then proceeds to identifypolicy directions in shelter finance.
The essential basis of the municipal side of thecompact between households and the public realm is asystem of financing public goods so that they can be providedacross the city, in appropriate quality and quantity, and ataffordable cost, and so that the city can be managedeffectively. Unless urban areas can produce more income atthe same rate that they absorb more people, the resources todevelop infrastructure and build shelter will not be available.
It is vital that powers, duties and revenues arecongruent. If the municipal authority is responsible for socialhousing, it should have the power to take policy decisionson how it will act and receive the required revenue, or beable to raise the finance.
� Towards inclusive urban infrastructure andservices
Municipalities should be able to raise at least part of theirrevenue from local taxation, at levels which reflect localconditions. As a consequence, municipalities andgovernments need to build the institutional capacity to levyand collect these taxes, and to spend them responsibly.Indeed, legislation may be necessary to guide theresponsible use of municipal revenues.
It is vital that there is some source of loans for capitalprojects to which municipalities can apply in order to allowthem to develop major projects that cannot be financed outof annual budgets. There are many models. Funds may bemade available through loans from central government or anagency thereof, a mortgage bank, a finance company, aprovincial-level institution, or a group of municipalitiesworking cooperatively.
Just as protecting endangered environments can befunded through debt swaps, so such exercises can be usedto fund housing and urban services, as shown in the case ofBolivia (described in Chapter 3). As in many other financingarrangements, having a poverty reduction strategy paper(PRSP) in place which influences urban policy enables debtswapping in that it gives the parties confidence that themoney will be spent within a strategy for poverty reductionrather than ad hoc.
The rising value of urban land is a significant potentialsource of finance for cities. Extracting public value out ofthe development process has been practised in manycountries, some with great success. The US linkage process,in which city authorities leverage funds from the profitsderived by developers of real estate to fund social projects,might be effective in cities in the South.
The level of accuracy required in land records forthe collection of property taxes is lower than that foravoidance or resolution of land disputes. Thus, suchsystems as half cadastres and the use of regular low-resolution aerial photography can provide a level ofaccuracy well able to support property taxation systems at
xlvi Financing Urban Shelter
relatively low cost, compared with an expensive, high-resolution land survey.
It is also important that municipalities are paideconomic charges for their services. Thus, functions such asland registry, building regulation and planning controlshould be subject to a charge that covers the cost. Similarly,user fees for municipal services (markets, abattoirs, carparks, transport interchanges, bus services, assembly halls,etc.) should cover life-cycle costs and, where appropriate,generate revenue.
In many cities, there is a culture of replacing regularmaintenance with irregular capital projects. It is betterpractice to cost infrastructure over its whole life (life-cyclecosting) and put aside money for periodic maintenance overa long life. The savings are considerable compared withrebuilding at the end of a short life.
The ability of the small-scale private sector to runlocal supplies of water, waste collection and other servicesin partnership with the public authorities is welldocumented and should be explored by municipalities notalready using such partnerships.
Wherever it occurs, corruption saps the ability ofcentral and municipal governments to meet the needs oftheir constituents through diverting money away from thedevelopment and maintenance of services. Only when realprogress is made on making corruption simply unacceptablein business and government, and involving people ineradicating it wherever it is found, will cities functionefficiently and with trust from all partners.
It is likely that government funding can have thegreatest effect if it is directed towards infrastructure andservices for low-income neighbourhoods and welfareservices for the poorest. In the provision of land, basicinfrastructure and social services to the poor and poorest,subsidy is likely to be required unless the cost of services islow indeed.
Unless urban areas can produce more income at thesame rate that they absorb more people, per capita incomeswill fall and urban poverty will deepen. Thus, employmentand income are central to the financing of urbandevelopment. The potential of shelter provision to generateemployment for low-income workers should be utilized togenerate income to improve people’s ability to pay forhousing. The income multipliers are very high forconstruction and even higher for low-technology, labour-intensive construction. In parallel, the provision of efficientinfrastructure and appropriate shelter is critical in ensuringthe economic productivity of the work force in urban areasand countries as a whole.
Local governments should reduce the costs ofeconomic activity by streamlining land allocation,development control and other regulatory activities, whileretaining appropriate ability to act in the public good. One-stop shops allowing planning and building control to bestreamlined are capable of radically reducing the transactioncosts of development and encourage more people to takethe formal development route.
� Strengthening the sustainability andperformance of the shelter finance system
Turning to housing finance, there is both a need and ademand for layers of finance for different sectors of thehousing supply process. Mortgage finance, for relativelylarge sums over a long period of repayment, is essential forthose well off enough to buy a complete formal dwelling.However, small loans, taken out over short terms of betweenone and eight years, loaned at market rates, are growing inimportance in the housing sector.
The problem in many developing (and even in somedeveloped) countries is not that housing is too expensive,but that incomes are too low. The locus of attention shouldnot be on the minimum quality and cost of housing, but onthe level of payment received by workers. This demand-sidefocus is in line with current trends in subsidies andconcentrates attention on the systemic problem of poverty,which generates poor housing consequences.
In many countries in the South, the cost of urbanhousing is increased significantly by the high standards towhich it must comply. The introduction of lower standardsthat are more appropriate to the local context couldpotentially make housing more affordable to a far greaterproportion of the urban population. Lower standards wouldstill, however, have to safeguard the health and safety of theoccupants and protect the public interest.
Most policies behind official development assistanceand national policies are based on the provision ofindependently serviced single-household dwellings, ownedby their occupants. However, this is by no means the mainform of occupation by households living in poverty. Instead,large numbers of households live in buildings occupied bymany households. There is much to be gained fromencouraging multi-occupied housing development where itfits in with local norms.
Small-scale landlords in informal settlements are amajor source of affordable housing for a growing majority ofhouseholds living in poverty in the urban South; but thereare few initiatives to assist them. It is imperative, therefore,to understand how best to assist the informal rental sectorand, at the same time, to preserve affordability in order topreclude gentrification.
In the spirit of the Habitat Agenda, and if the housingbacklog is to be cleared at all, it is vital that all actors in thehousing process are involved in the role in which they aremost efficient. The most important suppliers of the dwellingsthemselves, and their ancillary services, are the millions ofsmall-scale building contractors, the single artisans or smallgroups of skilled people and the labourers who service theirneeds. However much demand there is for housing, it canonly be supplied as quickly as the construction industry canbuild it. Finance to provide healthy liquidity among small-scale contractors and single artisans is an essentialprerequisite to effective housing supply to scale.
In countries where the housing supply system isefficient and speculative of what the market demands,developers are often an important part of the process. Somemechanism for recognizing their contribution with financial
xlviiSynopsis
assistance, especially for bridging loans, may be verybeneficial for the housing supply process and could institutethe efficient speculative building of housing, which iscommon in industrialized economies.
Recent research into regulatory frameworks for urbanupgrading and new housing development has recommendedthe removal of constraints that prevent the poor fromborrowing from financial institutions or accessing creditthrough other formal channels. In particular, administrativeprocedures that delay investments and/or increase risksshould be reviewed as they add to the cost and deter thepoor from conforming.
The countries in which most of the urban growth willtake place during the next 25 years have very low domesticsavings measured as both per capita and as a percentage ofGDP. As savings are the foundations for investment, this doesnot auger well for urban development. It is important thatdeveloping countries maintain as much as possible theinvestment and savings arising from local economic activitywithin their borders, or benefit from net inflows frominvestments overseas. It is difficult to overstress theimportance of reliable banks and low inflation indiscouraging capital flight.
It is in governments’ interests to extend mortgagemarkets down the income scale, as homeownership is seento be beneficial economically and politically. Measures thatcould be adopted include reducing the cost of lending,especially through reducing interest rates; supporting thesystem of mortgage financing, especially through extendingsecondary markets and reducing risks; and providing directcapital grants to reduce the size of a household’s mortgagein comparison with the dwelling cost.
Well-run mortgage facilities are undoubtedly importantto the health of the housing supply system in the North andmay be a major contributor to housing improvement intransitional countries. They are also important in providingupper- and middle-income groups with housing finance,without which they would claim the shelter opportunitiesprovided for those lower down the income scale.
As mortgage finance is unlikely to assist the majorityof the people, it must not be allowed to divert attention fromfinancing that is helpful to lower income groups or to drainresources away from low-income households towards thosein the middle- or upper-income groups.
Loan periods and loan-to-value ratios (LTVs) are vitalcomponents of mortgage loans, which are determined by thelender rather than the global macroeconomic environment.Decisions about them can be the difference between thesuccess and failure of the mortgage company and candetermine who can afford to borrow, at least at the margins.Low LTVs (and, therefore, high initial deposits) reduce riskbut increase the need for upfront capital. The level ofrepayments can be varied in order to help households meettheir obligations. Variable-interest loans allow low paymentsat the beginning, increasing as income improves to repay theloan on time.
There is a well-documented link between finance forincome generation and improvements in housing. Manyhomeowners operate one or more home-based enterprises
from the structure on which they raise housing finance. Thesame goes for rental income. One of the most importantsources of low-cost rental property, which is becoming moreimportant as the years pass, is the extra room built on to ahome and rented out to a stranger for rent, or to a co-villageror relative for no rent but some other benefit (if only tosatisfy family obligations).
It is obvious that improvements in housing canbenefit home-based income generation, including roomrentals. Thus, lenders should take account of the likelihoodof income improvements in the application procedurethrough a process which factors in future income generatedby the housing goods, to be provided under the loan. It isalso important that financiers recognize that the poor aremore concerned about access to credit than its cost.Experience shows that there is great demand formicrofinance even if interest rates are high.
Subsidies come in many guises, including directinterest-rate reductions; allowing mortgage interest paymentsto be deducted from income tax; supporting housing-relatedsavings; supporting insurance of mortgages; supporting thesecondary mortgage markets; and direct grants for shelter.
If appropriate housing finance is in place, theproportion of households requiring subsidy should beminimized to only those too poor to afford the real costof the shelter available. The need for subsidy can, thus,be reduced by adopting effective financing systems. Thework of some NGOs to provide funding to assistindividuals in accessing subsidies is very helpful to manyhouseholds. In Ecuador, a revolving fund provides thedown payment necessary to obtain a national housingsubsidy grant.
Social housing is, almost by definition, subsidizedhousing. The subsidy element is a financial credit to theoccupier and, thus, often constitutes an important elementin a nation’s housing finance system. Although social housingis becoming residual in Europe and transitional countries,the need to provide more housing that is affordable to thelow-income households is still present. Those who cannotafford homeownership or market rents in the private marketneed shelter through public rental housing. In the South,however, few countries have been successful in large-scalepublic rental housing.
Small housing loans, disbursed through housingmicrofinance institutions (HMFIs), are some of the mostpromising developments in housing finance during the lastdecade. They are suitable for extending existing dwellings,building on already serviced land, adding rooms (often forrenting out), adding services such as toilets, and housingimprovements within in situ neighbourhood upgrading. Theytend to reach much further down the income scale thanmortgage financing, but not to the households close to orbelow poverty lines.
In the context of large numbers of new low-incomehouseholds in cities over the next two decades, it isimportant to increase the number of lenders in the housingmicrofinance sector, rather than to concentrate only onmortgage finance which, inevitably, serves the middle- andupper-income groups.
xlviii Financing Urban Shelter
There is a serious issue of funding for on-lending byHMFIs. Many have received concessionary funds, and theirlending reflects the low price of the capital. If they are toexpand their operations, they will need to cope withborrowing at international market rates and reflect this intheir loans.
In comparison to enterprise microfinance, sheltermicrofinance lending involves long-term and large loans andgenerates a need for group security or some security of tenurebacked by documentation. In the context of group lending,mandatory savings periods before loans not only build up anunderstanding of finance, but also strengthen community tiesamong savers through regular group meetings. Then the groupbecomes the collateral, as the members will support eachother in times of difficulty and take away from the lender thecomplication of following up defaulters.
Throughout the days of sites-and-services projects andother aided self-help, efforts have been made to reduce thefinancial burden of low-income homeowners by allowingmaterials to be drawn from dedicated warehouses or to besupplied on credit through local commercial suppliers.Recent experience in Mexico and elsewhere has shown howthere may be great potential for this to expand alongsidehousing microfinance and the downscaling of mortgages tolower income households using the longstanding creditculture operated by furniture and household goods retailers.
Remittances from overseas residents of localnationality are an important part of housing finance in manycountries. Many people can remit enough to build a housein a few years overseas in quite lowly employment thatwould be impossible if they stayed at home in higher-levelemployment. But there is a danger that tastes, standards andability to pay from a different context may take over the localmarkets and drive other residents into poorer housing thanthey would otherwise have.
Many charities give large amounts of money towardshousing improvement and shelter for the poorest. There is aplace in funding shelter for the poor for that which arisesfrom altruistic humanitarian support.
Community-based financing of housing and serviceshas been used for both settlement upgrading and forbuilding on greenfield sites. In a context where small loansare evidently successful, and where there is an increase inpoverty, it has many advantages for low-income andotherwise disempowered households. The experience of theaffiliates of the Shack or Slum Dwellers’ Federation hasdemonstrated that there is great potential for community-based organizations to manage development finance to thebenefit of large numbers of relatively poor households. Theevident success of community funds has attracted somegovernments to take part in their financing.
Epilogue: Towards Sustainable UrbanShelter
The shelter issue has become one of a global nature afterthe concept of ‘human settlements’ found its place in theinternational development agenda. Until recently, theclassical response to the shelter problems of the urban poor
was social housing, both in developed and developingcountries. However, the massive demand for affordablehousing in developing countries, coupled with the limitedresources of the public sector, would have made thissolution inapplicable, even in the presence of a well-organized and transparent public-housing delivery sector.Notable exceptions are states such as Singapore, whichimplemented huge and very successful public housingprogrammes, as well as successful policies in other largercountries such as Tunisia and isolated exemplary projects inmany others.
The notion of ‘financing shelter for the poor’corresponds, in a way, to the abandonment of the traditionalconcept of public responsibility embedded in the ‘social roleof the state’. With the commodification of the economy,where housing is but another good to be produced, sold andbought, the solution to the shelter dilemma is based on thenotion that ‘the poor’ will always exist, and that their accessto a fundamental human need – adequate shelter – willalways require special measures and special solutions.
This Epilogue starts from the premise that ‘specialapproaches’ and ad hoc solutions, however ingenious, willnever work at the scale required. Three points are made.First, the percentage of the urban poor in the cities of thedeveloping world is far too high to be considered a residualissue. Second, the demand for affordable shelter isincreasing at an extremely fast pace, notably in the rapidlygrowing cities of the developing world. Third, the standardsand costs that city life requires are high and complex.Shelter is only one, albeit the central, requirement of allcitizens. Given the rapid spatial growth of cities in thedeveloping countries, transport, for example, becomes acrucial necessity for survival. The living, working and spatialcircumstances of city life require standards and services forall that are far superior in quality and sophistication to thoseusually associated with minimal shelter – a roof over one’shead.
Given these considerations, the issue is not simplyfinancing shelter for the poor. The issue is making adequateshelter affordable to the poor. This approach may be called‘sustainable shelter’: shelter that is environmentally, sociallyand economically sustainable because it satisfies the HabitatAgenda requirements of adequacy. Its acquisition, retentionand maintenance are affordable by those who enjoy it. Itdoes not overburden the community with unaffordablecosts. Finally, it is located in areas that do not constitute athreat to people or to the environment.
There is no single magic formula to achieve this.Individual self-help can only produce solutions that areadmirably suited to the harsh circumstances of urbanmigration, but are also the most fragile of all. Community-based funding has proven a valuable and indispensable asset,particularly for improving services and, in some cases,infrastructure in informal settlements; but it is not likely toreach the scale required, at least in the short term. It mustalso be noted that the admirable solidarity mechanismsfound in poor urban communities stem from the commonwill to stave off a common threat, often rooted in a state ofillegality and a risk of eviction. They also depend upon the
xlixSynopsis
cultural and ethnic composition of the informal settlement.Strongly desirable and supported outcomes such asregularization, infrastructure upgrading and theimprovement of economic circumstances can also bring theattenuation of community solidarity and mutual self-helpmechanisms. Therefore, they cannot be assumed to work inall cases and for indefinite periods of time.
� Abating housing costsHousing is becoming an increasingly expensive commodityin all countries. Between 1997 and 2004, according to a veryrecent survey, average housing prices grew by 131 per centin Spain, 147 per cent in the UK, 179 per cent in Ireland,113 per cent in Australia, 90 per cent in France and 65 percent in the US. The only developing country listed in thesurvey is South Africa, which registered the highest growthin the sampled countries: 195 per cent.
Of course, these sharp increases in housing pricescan, in many cases, be due mainly to speculative bubbles.But there is little that policies can do to prevent or controlthese phenomena. On the other hand, while average housingprices are lower in the developing countries, they are alsoinfluenced by steeply rising costs of land, building materialsand other cost components.
Affordability, therefore, rests to a large extent uponpolicies capable of bringing down housing production costs.Housing production cost components are known: capital,land, infrastructure, building materials, standards, design,location and modes of production. To be affordable, all ofthese elements will require a substantive element ofsubsidy; but in some cases they will only need intelligentpolicy changes.
� Increasing purchasing powerIn the developed world, a household with two sources ofincome, wife and husband, however humble the occupationor the source of income may be, normally can gain access todecent shelter on the market, however modest. In thedeveloping world, this is virtually impossible – hence, thevirtual necessity of finding affordable inadequate shelter ina slum. People who live in slums are known as ‘slumdwellers’. In reality, they are ‘working poor’: people whowork for a living, but whose income cannot guarantee themaccess to the basic needs that everybody in developedcountries take for granted – adequate shelter, propernourishment, health, education and decent and non-threatening living environments.
There is something terribly wrong about the inabilityof vast numbers of the working poor in developing countriesto gain access to adequate housing. Part of the problem isthe rising costs of conventional housing addressed above;but an equally important issue is the extremely low wagesin the formal sector and income from other income-earning
activities, particularly in the informal sector. This is whymaking shelter affordable to the poor also depends uponincreasing the poor’s income.
The issue, of course, is not simply that of higherwages. A regular income is also a standard prerequisite foraccessing mortgage or shelter microfinance markets.Continuity in income earning is important once one entersa mortgage agreement in order to avoid the risk of losing allof one’s investment through the painful process ofrepossession. But a decent income is the minimum basis foraccessing decent shelter, particularly in the situations ofvirtually all developing countries where workers’ benefitsand pensions are virtually non-existent and where the pricesof basic necessities rise as rapidly as those of housing.
� Lower housing prices and higher incomesIncreasing both wages and income opportunities for theworking poor augments the saving potential of the sameearning group. The urban poor show a marked propensityand ability to pool part of their incomes into communityfunds and other forms of saving arrangements. This triggersvirtuous circles: the more capital is saved, the more isavailable for improving shelter conditions, productivity, skillsformation and income-earning activities. With upgrading andadequate shelter solutions, more disposable income canbecome available to contribute to basic infrastructure andservices, thus making public capital investment in this areamore sustainable.
Financing shelter is only a component of the broadergoal of securing solutions that can make shelter trulysustainable and that can fill the gap between the twoextreme outcomes which are being witnessed today:affordable shelter that is inadequate and adequate shelterthat is unaffordable. One starting point is to look at theinhabitants of informal settlements not simply as ‘slumdwellers’, but as ‘working poor’. Important opportunitiesexist for addressing the affordability gap by acting on bothends of the sustainable shelter equation – reducing housingproduction costs and increasing the incomes of the workingpoor.
Given the urgency and growing significance of the‘urbanization of poverty’ challenge, it is difficult to think ofother areas of development that deserve more attention andinvestment on the part of the local, national and internationalinstitutions committed to reaching the MillenniumDevelopment Goals (MDGs), including the target ofimproving the lives of at least 100 million slum dwellers by2020 and, more generally, to find practical and sustainablesolutions to the global fight against poverty. Cities can leadthe way, and the MDG targets within them – the urban poor– can become the protagonists, leading actors and livingexamples of a brighter future for all of humanity.
l Financing Urban Shelter


During recent years, there has been a growing recognitionof the importance of urbanization in the economic and socialfutures of nations by the international community, memberstates of the United Nations and a wide range of civil societyorganizations. This recognition is based on countryexperiences, development policies, studies and projectssince the first United Nations Conference on HumanSettlements held in Vancouver, Canada, during 1976.
Urbanization – and its many dimensions – has beenimportant in all countries. The first and most evidentdimension is demographic, as most developing countrieshave urbanized considerably since the 1950s and areprojected to continue this process through the middle of the21st century (see Figure 1.1). This increasing share of totalpopulation living in cities is similar to the historic patternsof Europe and North America, with increasing urbanizationaccompanying rising levels of gross domestic product (GDP).The key differences lie in the faster pace of urban growth indeveloping countries during this period and the absolutelevels of urban population as represented both in theconcentration of people living in mega-cities (urbanagglomerations of over 10 million residents) and theincreasing numbers of medium-sized cities of up to 3million.
These facts of contemporary life in the 21st centuryhave themselves transformed the world, with higher levelsof individual and household incomes resulting fromunparalleled levels of economic productivity benefiting fromeconomies of agglomeration and scale. The concentration ofeconomic activity and power in cities has, in turn, attractedfootloose capital from the global economy, transforming theworld itself in what is now understood as a process of‘globalization’.
These processes, however, have also created manyproblems and contributed to growing patterns of differencewithin countries and people. Urbanization, for example, hasbeen accompanied by continued out-migration from ruralareas in many countries. The mechanization of agricultureand the globalization of agricultural production have reducedboth the local control of the rural sector and the demand for
rural labour. When placed into a national and internationalcontext, what might be called ‘a geography of difference’can be easily seen.
Together, these processes set the stage for thefundamental issue that this Global Report addresses: howcan housing and infrastructure services be financed forgrowing numbers of urban residents during the 21stcentury? The first part of this chapter presents the buildingblocks of a conceptual framework for answering thisquestion, while the second part presents, as a background,the macroeconomic context of financing urban shelterdevelopment.
UNDERSTANDING URBANSHELTER DEVELOPMENTCHALLENGESAs mentioned in the preceding section, this first part of thechapter presents the building blocks of a conceptualframework for understanding the global challenge offinancing the development of urban shelter, as well asrelated infrastructure and services. Individually, thesebuilding blocks are not controversial. They reflect thecurrent knowledge and the collective thinking of observersand participants in the world’s urbanization experience.However, when linked together, they demonstrate that theworld is facing an urgent and dramatic problem, withsignificant consequences for individual cities, countries,regions and the world itself.
Demographic framework
The starting point of this analysis is the process ofdemographic transformation. United Nations projections andrecent assessments of expected demographic growth indeveloping countries (see Statistical Annex, Tables B.1 andB.2) indicate that the developing countries will addapproximately 2 billion new urban residents during the next
The fundamentalissue is: how can
housing andinfrastructure
services be financedfor growing
numbers of urbanresidents during the
21st century?
C H A P T E R
CHALLENGES OF SUSTAINABLESHELTER DEVELOPMENT IN MACROECONOMIC CONTEXT 1
1

25 years.2 This robust finding, added to the existing numbersof 1 billion people currently living in slums, frames the‘demand side’ for the need for housing and infrastructureservices in developing countries.
Looking more closely, approximately 90 per cent ofthis demand will occur in 48 countries, with most of thegrowth occurring in East and South Asia. The concentrationof this demand reflects both the overall population sizes ofChina and India, but also other large Asian countries suchas Bangladesh and Pakistan in South Asia, and Indonesia, thePhilippines and Viet Nam in East Asia. During 1950, thesecountries were largely rural; today they continue toexperience rapid urban growth, with many of their urbanconcentrations reaching over the 1 million population level.Much of this growth has been fuelled by economic growthitself, with higher urban incomes attracting rural migrants.The enormous growth of urban populations of China andIndia are shown in Table 1.1, demonstrating that thesecountries have both experienced large-scale shifts in theirpopulations towards urban centres while continuing to growat aggregate levels.
It is predicted that the scenario of a decreasing ruralpopulation and increasing urban population, with the onlypossible exception of the African continent, will beexacerbated by expected universal reductions in fertilitylevels. Indeed, the prediction is that by 2020, the ruralpopulation growth rate will turn negative for the first time.3
Africa will also continue to experience rapid urbandemographic growth, reflecting continued rural-to-urbanmigration, with push factors from the lack of productivity ofagriculture and the inability to feed and provide incomes forrural populations. The slow growth of rural productivity inAfrican countries has many causes: environmental pressuresin the Sahel and East Africa, with severe water shortages,loss of topsoil and lack of rural infrastructure;overpopulation in some parts of the Great Lakes Region ofCentral Africa; or armed conflicts destabilizing cultivationpatterns. These internal problems have been exacerbated bythe global trading system, with subsidies by developedcountries – for example for cotton – which displace cottonproduced in Burkina Faso or Mali from world markets.
Even though Africa’s cities have not generated thejobs needed to sustain growing urban populations, theyhave, nonetheless, attracted large numbers of people fleeingrural poverty. While studies during the 1970s showed thatthese migrants were largely attracted by the prospects ofhigher wages from urban employment,4 this motivation hasbeen strengthened by the lack of food security in rural areas,as well as by the need for physical security from armed
conflict and environmental risks. This ‘urbanization of ruralpoverty’ is reflected in the increasingly large urban slums inmost African countries.
In contrast, the Latin American countries experiencedurbanization at an earlier period in which economic growthgenerated the financial resources needed for theconstruction of housing and urban infrastructure. Citiessuch as Buenos Aires, São Paulo or Mexico Citydemonstrated spectacular growth during the mid 20thcentury. Even during these periods of economic boom,however, this growth did not keep up with the growingdemand for housing and urban infrastructure, such as watersupply, sanitation and electricity. Public-sector institutionswere unable to provide these services at a rate faster thanthe proliferation of favelas in Rio de Janeiro, barriadas inLima or tugurios in Quito.
Nevertheless, Latin American cities have become theloci of economic productivity and employment growth. Atthe same time, they are also the loci of growing urbanpoverty and inequality between the rich and poor. How tobridge this gap will be discussed in later chapters of thisGlobal Report.
In contrast to the developing countries, transitioneconomies and developed countries face different challengesin the financing of urban development. Previous publicpatterns of provision of housing and infrastructure in thetransition countries have been disrupted by the political andeconomic changes following the collapse of the SovietUnion. These systems had provided a very minimum qualityof housing and infrastructure in most countries, with longwaiting periods for new households. Whether these citieswill become productive engines for the growth of their newreformed economies remains to be seen.
Cities in developed countries have occupied anincreasingly important place in their respective nationaleconomies. As economies shift towards financial servicesand the knowledge economy, these activities tend to belocated in large cities. How well the cities perform withthese functions depends upon the reliability of theirinfrastructure and the quality of urban life as factors inattracting new investment.
Each of these regions and individual countries havealways had their own set of characteristics that determinetheir patterns of urban growth and specific developmentchallenges to be faced by their governments and societies atlarge.5
Translating demographic growth into thedemand for housing and infrastructure
Recent data and analyses indicate that the current globalbacklog of slum dwellers is about 925 million people.6 Asshown in Table 1.2, when this figure is combined with theprojected 1.9 billion additional urban population,approximately 2.825 billion people will require housing andurban services by 2030. This projection is the starting pointfor this Global Report.
In considering this number, precision is not reallyvery important. What is critical, however, is the order of
Developingcountries will addapproximately 2billion new urbanresidents during thenext 25 years
4 Economic and urban development context
China IndiaUrbanization level in 2000, estimate (%) 35.8 27.7Urbanization level in 2030, projection (%) 60.5 41.4Urban population in 2000, estimate (000) 456,247 281,255Urban population in 2030, projection (000) 877,623 586,052Increase in urban population, 2000–2030 (000) 421,376 304,797Increase in number of total households, 2000–2030 (000) 284,040 129,358Average quinquennial increment, 2000–2030 (000) 47,840 21,560Average annual increment, 2000–2030 (000) 9.568 4,311
Source: UN Population Division, 2004. UN-Habitat, 2003a.
Demographichighlights (China and India)
Table 1.1

magnitude. Close to 3 billion people, or about 40 per centof the world’s population by 2030, will need to have housingand basic infrastructure services. Table 1.3 demonstratesthat in order to accommodate the increments in the numberof households over the next 25 years, 35.1 million housingunits per year will be required. This estimate, in turn,translates into completing 96,150 housing units per day or4000 per hour. These figures do not include replacementsof deteriorated and substandard housing stocks.
Socio-behavioural framework
The challenges raised are not, however, exclusively aboutthe quantity of population, but also about its composition. Arecent publication argued that the processes of socialdifferentiation in cities are also accelerating7 because theyare interacting with the scale and rate of demographicchange. There are not only more people in cities, but theyeat, work, play, educate, dress and express themselvesdifferently. The richness and, indeed, the tolerance of theculture and diversity of urban behaviour is a major factor inexplaining why there is not more violence and conflict thanexists in cities. One could easily make the argument thatMumbai and Bangkok are surprisingly peaceful, given theirscale and complexity. These processes of urban social andcultural differentiation require much more documentationand research because they are an important factor in whatwould actually be ‘sustained’ in sustainable cities.
Processes of differentiation also have financialimplications as diverse populations express their specialneeds, with more elderly populations requiring specialservices at the same time that there are school-age childrenrequire more schools and teachers. A wider diversity andrange of social needs implies a wider and more diverse setof services, whether provided by government or non-governmental organizations (NGOs). Growing ethnicallydiverse cities can also create the need for ethnically sensitivepolicies and programmes, as well as the necessity tomaintain peaceful relations between communities. Forexample, one can imagine that ethnically homogeneousneighbourhoods and communities may exclude other peoplenot sharing their particular identity. These conflicts can havedirect impacts upon the quality of life in neighbourhoodsand on access to infrastructure services.8
Economic framework
The capacity of developing countries to finance their needsdepends largely upon their level of future economic growthand development. If countries are productive and able togenerate employment and incomes for growing populationsat an accelerated rate, they will be able to generate andmobilize the savings and investment to finance basic needs,such as housing and infrastructure services. Then, withrealistic policies supported by effective institutions, they canhave a chance at meeting growing needs. If, however, theyremain at current growth rates or, as in some cases, areunable to grow economically, there will be little likelihoodthat these resources will be available. In this sense, macro-
economic growth is a necessary but not sufficient conditionfor addressing this problem.
This Global Report will examine that relationship andidentify each of the possible sources of finance for urbandevelopment in order to determine which policies andprogrammes are likely to assist in this process. The followingsections present the differences between the macro-economic conditions of countries, as well as the varioussources of macroeconomic growth needed to provide thefoundation for urban development, while also demonstratingthat this is a two-way process: cities and towns are alsoimportant contributors to macroeconomic performance.
Urban development requires the support of urban-based economic activities, including manufacturing, servicesand construction, among others. It must also alleviateexisting constraints to those economic activities, such asreducing infrastructure deficiencies by improving thereliability of water supply, electricity andtelecommunications, as well as by addressing the negativehealth and environmental impacts of human and solid waste,as well as pollution from transportation.
Public authorities will also need to strengthen theinstitutional framework within which private economicactivity occurs – for example, the regulatory frameworkdetermining how many steps are required to obtain abuilding permit or a licence to open a small business. Studiesduring the 1990s showed that some countries requiredextraordinary numbers of steps to obtain constructionpermits, such as 55 in Malaysia and 27 in South Africa.9
These excessive regulatory steps sharply increased the costof housing through the delays involved, even reaching 3 percent of GDP in Malaysia, as well as the transaction costs forindividual builders and construction enterprises. Localgovernment institutions have a large role to play in reducingthe costs of economic activity in cities. Similarly, localfinancial institutions that provide credit for construction orloans for small enterprises also play a pivotal role instimulating the local urban economy.10
The economic paradox of this situation is that whilecities are the loci of productivity, they are also the loci ofincreasing poverty. This poverty has many causes. Some of itis a result of the overall level of national income of countries:Burkina Faso is poorer than Brazil, which means that, onaverage, people in Burkina Faso consume less in absolute
The capacity ofdeveloping
countries to financetheir needs depends
largely upon theirlevel of future
economic growthand development
5Challenges of sustainable development in macroeconomic context
Urban population (2003) 3,043,934,680
Estimated urban population (2030) 4,944,679,063
Additional urban population 2003–2030 1,900,744,383
Population living in slums (2001) 923,986,000
People requiring housing and urban services by 2030 2,824,730,383
Source: Statistical Annex of this report
Increments in the number of households over a 25-year period 877,364,000
Average size of annual increments 35,094,000
Per day 96,150
Per hour 4,000
Source: Statistical Annex of this report
People requiringhousing and urbanservices by 2030
Table 1.2
Housing requirementsto accommodateincrements in thenumber of householdsover the next 25 years
Table 1.3
amounts of goods and services than do their Braziliancounterparts, and also that there is a narrower range ofgoods and services than are available in Brazil. It can alsomean that the social indicators of health and welfare arelower in terms of longevity, health status, literacy and infantmortality, as well as gender equality.
In urban areas, however, much of this poverty is aresult of the lack of housing and infrastructure services thatare necessary for people’s and enterprises’ basic needs,consumption and production. It is clear that the lack of theseservices has an impact upon the productivity of urbaneconomic activities and, therefore, on the city and the nationas a whole. A study of infrastructure services in Lagos,Bangkok and Jakarta during the 1990s demonstrated thatenterprises which had to provide their own water supply,electricity and other infrastructure services had lower profitsand were therefore constrained in their growth.Infrastructure deficiencies had a direct impact upon howmany jobs were being created. These companies in Lagosactually spent up to 35 per cent of their fixed investment inproviding their own infrastructure; as a result, they hadlower profits and were thus unable to grow.11
Varying types of deprivation, such as health,malnutrition and a lack of clean water supply, also have bothshort- and long-term impacts upon the health status and,thus, the productivity of men, women, and children.12
Poverty, therefore, becomes intergenerational, as is observedin many large city slums in developing countries, such as theDharavi slum in Mumbai, which now houses almost 2 millionpeople, or the slum in Mathare Valley, Nairobi.13
The key issue, however, is that increased urbanpopulation growth – increasing the denominator in the percapita calculation of gross domestic product – will necessarilymean that urban areas will become poorer if they are unableto augment jobs and incomes faster than their populationsgrow. Because rapid and large-scale urban population growthis expected between 2005 and 2030, cities will have todramatically increase their productivity in order to, first,generate jobs and incomes and, second, generate thefinancial resources for housing and urban services. In thissense, the issue of urban employment generation cannot beeasily separated from the options for financing future urbandevelopment in developing countries.
Employment and income generation will also have amajor impact upon what kinds of housing and infrastructurewill be affordable to growing urban populations. Theseissues are both quantitative and qualitative: quantitativebecause absolute levels of income will be needed to financespecific types of housing and infrastructure, and qualitativebecause the stability and growth of income over time willpermit certain financing options – for example, mortgages –while lower levels of income will not qualify for financing.
The economic condition of cities – how fast jobopportunities and incomes increase – is further complicatedby the growing impact of exogenous economic factors uponcities. Processes of economic globalization and trade havechanged patterns of production in cities, leading todeindustrialization in many cities. This means that footlooseindustries close in cities with higher relative costs and move
to new locations with lower costs – for example, from theUS to Mexico or, later, from Mexico to China. The pursuitof profit-maximizing locations by private enterprises has ledto major economic and social disruption in many countriesover the last two decades.
Today, this disruptive behaviour by firms iscompounded by new factors in the global economy, includingglobal interest rates, whereby change in one large economyaffects the price of money in the global economy as a whole.The Asian financial crisis of 1997–1998, followed by crisesin the Russian Federation, Brazil and, later, Argentina, alldemonstrated the volatility of the global economy. Changesin the supply and demand for specific products led to changesin the demand for their inputs, as well. In some cases, theanalyses of the distribution of risk for foreign investors at aglobal level increased the cost of borrowing by individualcountries, precipitating new crises, as in the case ofArgentina during late 2001. The oil price increases of late2004 have added to the feeling, in many developingcountries, that global market forces are beyond the controlof individual countries. These processes have even intensifiedas competition has grown between countries in providingvarious factors of production. Overall, the impact of thevolatility of global economic and financial forces upon citiesis manifested in dramatic and socially harmful impacts uponemployment and labour markets, more generally, with thefrequent flight of investment and jobs to new locations.14
Within this new global economic context, theeconomic roles of cities have become increasingly importantfor individual countries. If São Paulo is not productive, theeconomy of Brazil will suffer; similarly, if India is unable toefficiently move its exports through the port of Mumbai, thecosts of those exports will be higher and India’s overalleconomic performance will be hurt. Long journeys to workthrough the traffic congestion of Bangkok reduce workerefficiency. During the mid 1990s, Mexicans working in themaquiladora factories in Ciudad Juarez had to spend 29 percent of their incomes on transportation to work, therebyreducing the possibility of meeting other household needs.15
In contrast, the modal integration of transportation in theNetherlands facilitates the access of workers to a wide rangeof employment opportunities.
The key point here is that housing and urbaninfrastructure is a critical part of the economic productionfunction of cities. Without housing and public services,workers cannot be productive, and whole urban and nationaleconomies will feel the impact. Basic services such as waterand sanitation have immediate impacts upon the health ofthe population.
In this context, meeting the financial needs of citiesin developing countries, and particularly the financing ofinfrastructure and housing, should be high nationalpriorities. Yet, too often, national budgets for investment inurban infrastructure are very low, if existent at all. It isinteresting to note that official development assistance alsocontributes few resources for these investment needs.
Because the economic performance of cities is criticalto national economic performance and, indeed, to thefunctioning of the global economy itself, these financial
Cities will have toincrease theirproductivity in orderto generate jobs,incomes andfinancial resourcesas well as to provideurban services
6 Economic and urban development context

needs should be considered essential international prioritiesas well. Housing and infrastructure are essential for bothproduction and human welfare. It will be impossible toreduce urban poverty if slum conditions are not improved inmany cities throughout the developing world. In this regard,the Millennium Development Goal (MDG) of significantlyimproving the living conditions of at least 100 million slumdwellers by 2020 is important in bringing some internationalattention to this problem. It is equally important, however,to note that this MDG only represents about 4 per cent ofthe projected demand for slum improvement by 2030.
Environmental framework
An additional and important dimension of this problem is themanagement of natural resources required by the urbanpopulation, such as clean water and clean air. Growingdemand for infrastructure services places immediatepressures on these natural resources. It is also apparent frommost environmental studies that cities have important impactsupon the natural environments in which they are located.Studies during the 1990s demonstrate that the ecologicalfootprint of cities is having enormous consequences for thesustainability of natural resources.16 Consumption of naturalresources by urban residents is frequently growing faster thanthe environment’s ability to reproduce those resources. Aclear example of this situation is the deforestation of areasnear African cities. Urban residents collect firewood for usein cooking and heating, cutting down trees and scrub bushes,thereby contributing to the erosion of topsoil and thesustainability of local ground cover.
One of the most important environmental issues tobe addressed is the increasing cost of potable water inalmost every city in the world. High levels of waterconsumption, with little attention to conservation orconserving behaviour, has had the effect of increasing thedistance that cities must go to find potable water. Beijingnow collects its water from sources 1290 kilometres fromthe city. Indeed, there are over 30 Chinese cities thatcurrently have severe water shortages. This problem affectscities in both rich and poor countries: Los Angeles also goes1290 kilometres for its water and New York is dependentupon distant water resources in New York State. Yet, effortsto conserve and improve the efficiency of water use areminimal in most cities. Some cities have used higher watercharges as incentives for conservation and in order toimprove the efficiency of water use. Bogotá has worked onthis problem by educating its population.17
Another critical area is the management of human andsolid waste. This problem also becomes increasinglysignificant as urban populations grow. Water-borne seweragesystems are prohibitively expensive for most cities indeveloping countries. On-site methods of sanitation andwaste treatment are, in some cities, necessary alternativesto so-called conventional solutions. These issues also applyto non-human solid waste, where the quantities of wastequickly outstrip landfill capacity in many cities. The need forcollection and recycling programmes to avoid the completewaste of reusable materials is of high priority.
If these urban problems have important local andregional consequences, they also have global impacts. Arecent study from China demonstrates how urbanization iscontributing to global warming, with carbon dioxideemissions largely coming from cities.18 Another study alsonotes that global warming is reducing rice yields in Asia,suggesting that food may prove to be one of the most seriousconstraints to urban population growth over time.19 Thesystemic character of the impacts of urban settlements uponthe environment and, in turn, the impact of global climatechange and other forms of environmental change need to bebetter understood. However, it should be noted that citiescan also provide positive impacts upon the environment –for example, in concentrating all of the waste in specificlocations rather than dispersing it.
These environmental externalities, and particularlythe likelihood of severe shortages of natural resources andincreasing costs of infrastructure services, must be includedin any financial and economic framework for cities indeveloping countries. The notion of ‘sustainabledevelopment’ needs to be made operational, rather than justa normative and rhetorical objective of governments andvisionaries. As a result, this is an important component ofthe challenge posed by this Global Report. The task ofmobilizing finance should not simply be intended to havemore resources to extend current housing and infrastructureservices, but rather to change the production andconsumption of those services in the direction of methods,costs and impacts that can enhance the sustainability ofcities and their surrounding regions.20
Financial framework
The most fundamental financial issue in this Global Reportis that cities will require very large investments in order tocreate infrastructure and services with long-life benefits –yet, they lack the systems to finance these services. Forexample, it is almost impossible in most developing countrycities to obtain mortgages to finance the purchase ofhousing. And yet it is difficult to imagine that the greatmajority of cities and their residents can afford to usedisposable cash to finance long-life investments.
The following chapters in this Global Reportundertake an in-depth examination of potential sources offinance at the international, national and local levels. Apreliminary review of these sources suggests, however, thatit is unrealistic to expect major additional financing frominternational donors, the global financial sector, the nationallevel (where most governments are facing serious fiscaldeficits) or the municipal level (where local budgets are alsoseverely constrained).
� International development aidCurrent levels of foreign investment, international aid andgovernment financing are clearly not meeting the currentdemand for housing, as Box 1.1 illustrates. Furthermore,official development assistance (ODA) to Africa and SouthAsia does not seem to have had any major impact upon theincidence of slums (see Figure 1.1). Individual projects in
One of the mostimportant
environmentalissues to be
addressed is theincreasing cost ofpotable water in
almost every city inthe world
The problem is bothan issue of what is
actually financedand whether
sufficient levels offinance are beingmobilized for this
sector
7Challenges of sustainable development in macroeconomic context

specific cities may have been successful, such as Jakarta,Madras or Nairobi; but their national and even citywideimpacts have been limited.
� Foreign direct investmentAs shown in Figure 1.2, sub-Saharan Africa has the highestlevels of foreign direct investment (FDI) as a share of GDP;yet, in absolute terms, this level of FDI is only approximatelyUS$191,329,892, compared to US$535,569,231, whichSouth Asia receives. It is apparent from the data in Figure1.2 that FDI, even if it were addressed to improving slums,cannot make (and has not made) any appreciable difference.
In any case, only infrequently do private foreign investorsplace their investment funds in slums, even though therewould probably be a high rate of economic return, if notfinancial return. Exceptions include the Community-ledInfrastructure Financing Facility (CLIFF) initiative in India(see Chapter 6, Box 6.9).
� National public investment in shelterA third source of finance for housing and urbaninfrastructure would be national public investment – that is,publicly allocated funds from national budgets or specialfunds. With the exception of China and India, very fewdeveloping countries have allocated large absolute amountsof financial resources to housing and urban development.
The problem, therefore, is both an issue of what isactually financed: whether public investment in housing andurban infrastructure has been directed towards the needs ofthe poor and whether sufficient levels of finance are beingmobilized for this sector. Both issues are important and areaddressed in subsequent chapters of this Global Report.
The question of what is financed, however, must bebroadened to include a wider range of infrastructure andhousing solutions than normally included in internationaldiscussions. For example, in lieu of extending the networkof urban water supply, it may be necessary to drill boreholesin un-served areas on the urban periphery. This approachwould tap aquifers whose water is then distributed by above-ground tubing or pipes. Such a solution is a fraction of thecost of extending the existing water supply network –although, admittedly, it may present other problems, suchas the need for later aquifer recharge. This suggests that howhousing and urban infrastructure are considered in terms oftechnology, standards and costs can have very importantimplications for their financing.
� Valuing urban assetsAnother related issue to estimating the finance needed forcities is the fact that existing cities have enormous presentasset value. A rough exercise in the World Bank during theearly 1990s attempted to determine the ‘financial value ofcities’.21 It concluded that the infrastructure stock of citiesin developing countries was worth about US$3 trillion. Thiscompared to an annual investment flow of approximatelyUS$150 billion each year, or 5 per cent of the stock. Morethan 95 per cent of this annual flow came from domesticresources in countries, both public and private. This is asubstantial figure, but woefully inadequate when oneobserves the large numbers of households worldwidewithout adequate water supply or sanitation.
Nevertheless, it points to a critical policy problem: itis known that most urban infrastructure in developingcountries does not last as long as that in developedcountries. Maintenance is neglected, both for financial andtechnical reasons. If, however, cities were able to obtain, sayconservatively, another 5 per cent of benefits from improvedmaintenance of the stock, this would amount to US$150billion or roughly current annual investment. Betteroperations and maintenance could reduce the need forsome, though certainly not all, of the new annual
8 Economic and urban development context
Box 1.1 Demonstrating the foreign direct investment and official development assistance paradox: The case of Mali
Mali has one of the highest amounts of foreign direct investment (FDI) as a percentage of grossdomestic product (GDP) and a significant amount of official development assistance (ODA);yet, 93.2 per cent of Mali’s urban population live in slums. During 2002, FDI in Mali totalledUS$102.2 million and ODA was over US$472 million.
However, if US$574.2 million from the combined FDI and ODA were devoted solely tohousing the 3.4 million people in slums, it would not suffice. Estimating 7 persons perhousehold and US$5000 to build each housing unit, it would cost US$2.4 billion to house thecurrent population, not taking into account the projected population growth of over 11 millionby 2030.Source: World Bank, 2004d.
Official developmentassistance (percentageof GNI), 2002
Source: World Bank, 2004e.
Figure 1.1
Gross foreign directinvestment (percentageof GDP), 2001
Source: World Bank 2004e.
Figure 1.2
18
16
14
12
10
8
6
4
2
0Sub-Saharan
Africa
Perc
enta
ge o
f GN
I
Middle East Southeast andEast Asia
South Asia Latin Americaand Caribbean
6
5
4
3
2
1
0
Perc
enta
ge o
f GD
P
Sub-SaharanAfrica
Middle East Southeast andEast Asia
South Asia Latin Americaand Caribbean
NorthAmerica

investment, thereby reducing environmental and socialimpacts and avoiding additional debt.22 Improved initialdesign of infrastructure will also reduce maintenance costsin the long term.
A key policy conclusion, therefore, is that cities mustobtain more benefits from their existing assets, in a financialand economic sense, and that increase can allow theirnetworks to be sustained longer, at lower costs.23
This conclusion is of enormous strategic value inassessing the current balance of new investment versusimproving the management of current stock. It suggests thata first step in a strategy for sustainable cities would be anintensive examination of maintenance programmes toimprove infrastructure performance. This might include, forexample, various ways of improving information systemsabout the condition of infrastructure (smart infrastructure),which would alert city managers about the need formaintenance.
When these issues are discussed together, it raisesquestions about what, indeed, is to be financed. Forexample, rather than assume that it will be possible tofinance large-scale extensions of conventional urbaninfrastructure, with their heavy upfront investment costsand high maintenance requirements, perhaps an alternativestrategy is needed to complement ongoing infrastructurefinance. This might involve developing smaller decentralizedclusters of infrastructure services that lead to the growth ofmulti-nucleated urban centres, thus avoiding high downtowndensities and mass transit to central points of employment.This spatial alternative is also an engineering and financialalternative.24
Governance framework
Such a spatial approach also implies the need for adecentralized approach to urban governance. It connectswell to the principle of ‘subsidiarity’, which the EuropeanUnion (EU) has urged on its members, whereby problemsare best resolved at the jurisdictional level at which theyoccur rather than being referred to high administrative andpolitical levels.
It should also be noted that the participation andvoice of urban populations in formulating policy andprogrammes by the public sector is a critical dimension ofurban management. One aspect of participation is the needto shift from the top-down administrative formulation ofstrategy to including the full range of civil society interestsand organizations in governmental processes.25 Thisincludes thinking about the future and adding broad-basedcitizen involvement to conventional urban plans. The recent2050 initiatives in Buenos Aires, New York and, now,Barcelona demonstrate the importance of this issue.26
Using these elements of an analytic framework aspoints of departure, it is important to recognize the value ofmaking virtue from necessity, or rather of using the lack offinance for conventional solutions as an opportunity torefocus the discussion of urban policy towards urban formsand processes that may be able to enhance sustainability.Finance is therefore a critical lever to orient policy and to
recognize the growing role of community-based urbanprocesses.
Mobilizing finance: removing constraints and reducing risks
As noted earlier, the conventional forms of finance – nationalpublic investment funds; ODA; FDI; national and localprivate-sector finance; and municipal finance – either do notseem to place high priority on investment in housing andurban infrastructure, or they simply do not have therequisite resources.
While these various forms of finance will be analysedin greater detail in Chapters 4 to 7 of this Global Report,there are three important issues that deserve to behighlighted at the beginning. These are:
1 What forms of housing and urban infrastructureinvestment are legitimate and deserving of public- orprivate-sector investment?
2 What are the constraints to mobilizing these types ofresources for housing and urban development?
3 What are the risks to providers of finance for thesepurposes?
� Addressing shelter and infrastructurestandards
One of the serious issues to be addressed in considering thefinancing of housing and urban infrastructure is the viewthat housing and settlements which do not conform tobuilding codes and land-use regulations should necessarilybe excluded from consideration. This view, commonly heardduring the 1970s, has evolved over recent years; manygovernments now recognize that millions of people, mostlythe poor, are unable to find reasonably priced land forsettlement and construction. The drive to evict squattersfrom land legislated for other purposes, while continuing insome cities, has been reduced substantially as public officialsand public opinion have now recognized that the bulldozerand evictions are not effective answers in meeting thedemand for shelter. The result of evictions has simply beento move the poor to even more distant locations, increasingtheir transport costs to places of work. There is now greaterwillingness for public authorities to upgrade, in situ, thesettlements of the poor, allowing them at least occupancypermits, if not full ownership of the land.
These upgrading projects have been very successful inmany countries, ranging from large-scale efforts such as theKampung Improvement Programme in Indonesia, begunduring the late 1960s and expanded with World Bank supportduring the 1970s and 1980s, to the Bustee ImprovementProgramme in Calcutta, to smaller-scale upgradingprogrammes in African and Latin American cities. Theseprogrammes have several key features (see Box 1.2), discussedin more detail in subsequent chapters of this report.27
A second aspect of determining what is legitimate forfinancing is the role of building codes. In many countries,building codes require standards of construction that areprohibitively expensive for the majority of the population.
Public opinion hasnow recognized that
the bulldozer andevictions are not
effective answers inmeeting the demand
for shelter
9Challenges of sustainable development in macroeconomic context
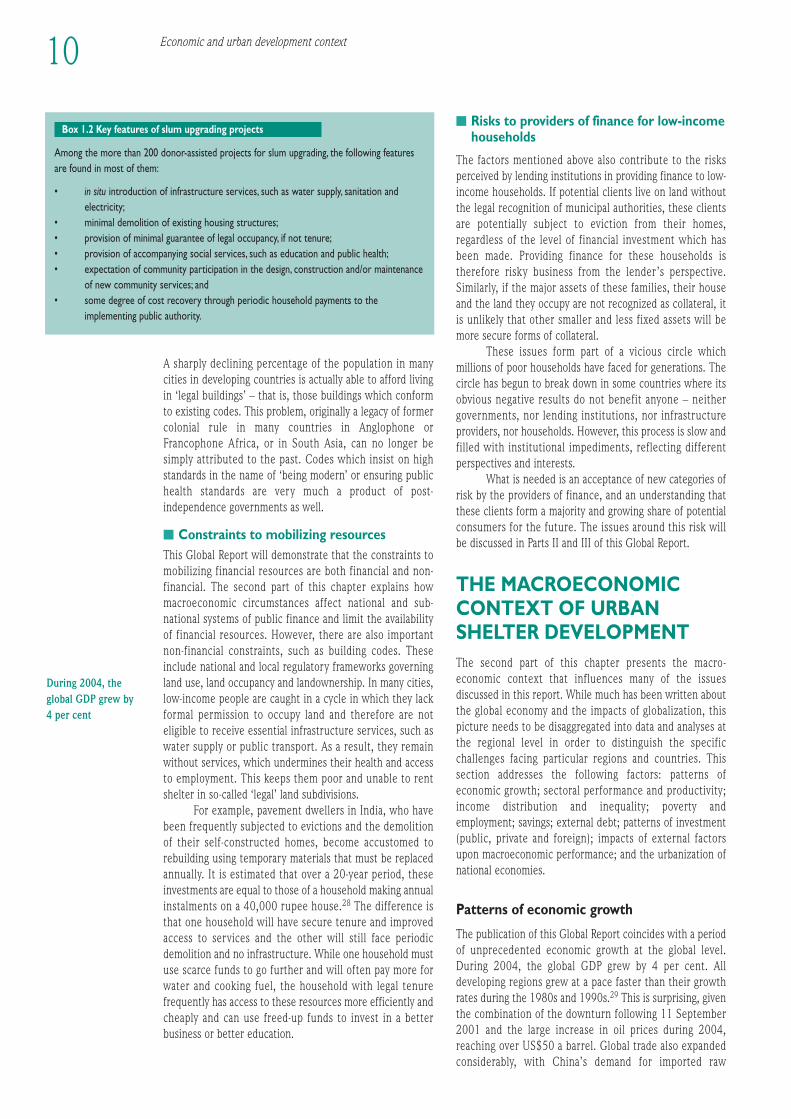
A sharply declining percentage of the population in manycities in developing countries is actually able to afford livingin ‘legal buildings’ – that is, those buildings which conformto existing codes. This problem, originally a legacy of formercolonial rule in many countries in Anglophone orFrancophone Africa, or in South Asia, can no longer besimply attributed to the past. Codes which insist on highstandards in the name of ‘being modern’ or ensuring publichealth standards are very much a product of post-independence governments as well.
� Constraints to mobilizing resourcesThis Global Report will demonstrate that the constraints tomobilizing financial resources are both financial and non-financial. The second part of this chapter explains howmacroeconomic circumstances affect national and sub-national systems of public finance and limit the availabilityof financial resources. However, there are also importantnon-financial constraints, such as building codes. Theseinclude national and local regulatory frameworks governingland use, land occupancy and landownership. In many cities,low-income people are caught in a cycle in which they lackformal permission to occupy land and therefore are noteligible to receive essential infrastructure services, such aswater supply or public transport. As a result, they remainwithout services, which undermines their health and accessto employment. This keeps them poor and unable to rentshelter in so-called ‘legal’ land subdivisions.
For example, pavement dwellers in India, who havebeen frequently subjected to evictions and the demolitionof their self-constructed homes, become accustomed torebuilding using temporary materials that must be replacedannually. It is estimated that over a 20-year period, theseinvestments are equal to those of a household making annualinstalments on a 40,000 rupee house.28 The difference isthat one household will have secure tenure and improvedaccess to services and the other will still face periodicdemolition and no infrastructure. While one household mustuse scarce funds to go further and will often pay more forwater and cooking fuel, the household with legal tenurefrequently has access to these resources more efficiently andcheaply and can use freed-up funds to invest in a betterbusiness or better education.
� Risks to providers of finance for low-incomehouseholds
The factors mentioned above also contribute to the risksperceived by lending institutions in providing finance to low-income households. If potential clients live on land withoutthe legal recognition of municipal authorities, these clientsare potentially subject to eviction from their homes,regardless of the level of financial investment which hasbeen made. Providing finance for these households istherefore risky business from the lender’s perspective.Similarly, if the major assets of these families, their houseand the land they occupy are not recognized as collateral, itis unlikely that other smaller and less fixed assets will bemore secure forms of collateral.
These issues form part of a vicious circle whichmillions of poor households have faced for generations. Thecircle has begun to break down in some countries where itsobvious negative results do not benefit anyone – neithergovernments, nor lending institutions, nor infrastructureproviders, nor households. However, this process is slow andfilled with institutional impediments, reflecting differentperspectives and interests.
What is needed is an acceptance of new categories ofrisk by the providers of finance, and an understanding thatthese clients form a majority and growing share of potentialconsumers for the future. The issues around this risk willbe discussed in Parts II and III of this Global Report.
THE MACROECONOMICCONTEXT OF URBANSHELTER DEVELOPMENTThe second part of this chapter presents the macro-economic context that influences many of the issuesdiscussed in this report. While much has been written aboutthe global economy and the impacts of globalization, thispicture needs to be disaggregated into data and analyses atthe regional level in order to distinguish the specificchallenges facing particular regions and countries. Thissection addresses the following factors: patterns ofeconomic growth; sectoral performance and productivity;income distribution and inequality; poverty andemployment; savings; external debt; patterns of investment(public, private and foreign); impacts of external factorsupon macroeconomic performance; and the urbanization ofnational economies.
Patterns of economic growth
The publication of this Global Report coincides with a periodof unprecedented economic growth at the global level.During 2004, the global GDP grew by 4 per cent. Alldeveloping regions grew at a pace faster than their growthrates during the 1980s and 1990s.29 This is surprising, giventhe combination of the downturn following 11 September2001 and the large increase in oil prices during 2004,reaching over US$50 a barrel. Global trade also expandedconsiderably, with China’s demand for imported raw
During 2004, theglobal GDP grew by4 per cent
10 Economic and urban development context
Box 1.2 Key features of slum upgrading projects
Among the more than 200 donor-assisted projects for slum upgrading, the following featuresare found in most of them:
• in situ introduction of infrastructure services, such as water supply, sanitation andelectricity;
• minimal demolition of existing housing structures;• provision of minimal guarantee of legal occupancy, if not tenure;• provision of accompanying social services, such as education and public health;• expectation of community participation in the design, construction and/or maintenance
of new community services; and• some degree of cost recovery through periodic household payments to the
implementing public authority.
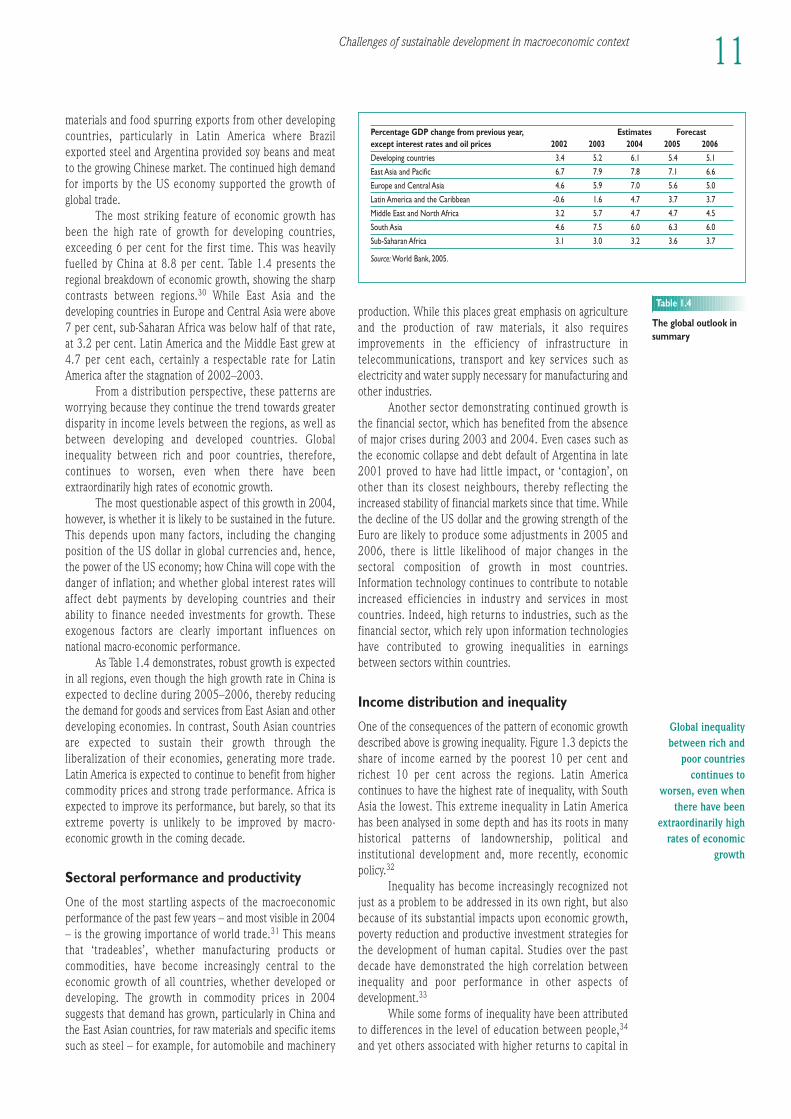
materials and food spurring exports from other developingcountries, particularly in Latin America where Brazilexported steel and Argentina provided soy beans and meatto the growing Chinese market. The continued high demandfor imports by the US economy supported the growth ofglobal trade.
The most striking feature of economic growth hasbeen the high rate of growth for developing countries,exceeding 6 per cent for the first time. This was heavilyfuelled by China at 8.8 per cent. Table 1.4 presents theregional breakdown of economic growth, showing the sharpcontrasts between regions.30 While East Asia and thedeveloping countries in Europe and Central Asia were above7 per cent, sub-Saharan Africa was below half of that rate,at 3.2 per cent. Latin America and the Middle East grew at4.7 per cent each, certainly a respectable rate for LatinAmerica after the stagnation of 2002–2003.
From a distribution perspective, these patterns areworrying because they continue the trend towards greaterdisparity in income levels between the regions, as well asbetween developing and developed countries. Globalinequality between rich and poor countries, therefore,continues to worsen, even when there have beenextraordinarily high rates of economic growth.
The most questionable aspect of this growth in 2004,however, is whether it is likely to be sustained in the future.This depends upon many factors, including the changingposition of the US dollar in global currencies and, hence,the power of the US economy; how China will cope with thedanger of inflation; and whether global interest rates willaffect debt payments by developing countries and theirability to finance needed investments for growth. Theseexogenous factors are clearly important influences onnational macro-economic performance.
As Table 1.4 demonstrates, robust growth is expectedin all regions, even though the high growth rate in China isexpected to decline during 2005–2006, thereby reducingthe demand for goods and services from East Asian and otherdeveloping economies. In contrast, South Asian countriesare expected to sustain their growth through theliberalization of their economies, generating more trade.Latin America is expected to continue to benefit from highercommodity prices and strong trade performance. Africa isexpected to improve its performance, but barely, so that itsextreme poverty is unlikely to be improved by macro-economic growth in the coming decade.
Sectoral performance and productivity
One of the most startling aspects of the macroeconomicperformance of the past few years – and most visible in 2004– is the growing importance of world trade.31 This meansthat ‘tradeables’, whether manufacturing products orcommodities, have become increasingly central to theeconomic growth of all countries, whether developed ordeveloping. The growth in commodity prices in 2004suggests that demand has grown, particularly in China andthe East Asian countries, for raw materials and specific itemssuch as steel – for example, for automobile and machinery
production. While this places great emphasis on agricultureand the production of raw materials, it also requiresimprovements in the efficiency of infrastructure intelecommunications, transport and key services such aselectricity and water supply necessary for manufacturing andother industries.
Another sector demonstrating continued growth isthe financial sector, which has benefited from the absenceof major crises during 2003 and 2004. Even cases such asthe economic collapse and debt default of Argentina in late2001 proved to have had little impact, or ‘contagion’, onother than its closest neighbours, thereby reflecting theincreased stability of financial markets since that time. Whilethe decline of the US dollar and the growing strength of theEuro are likely to produce some adjustments in 2005 and2006, there is little likelihood of major changes in thesectoral composition of growth in most countries.Information technology continues to contribute to notableincreased efficiencies in industry and services in mostcountries. Indeed, high returns to industries, such as thefinancial sector, which rely upon information technologieshave contributed to growing inequalities in earningsbetween sectors within countries.
Income distribution and inequality
One of the consequences of the pattern of economic growthdescribed above is growing inequality. Figure 1.3 depicts theshare of income earned by the poorest 10 per cent andrichest 10 per cent across the regions. Latin Americacontinues to have the highest rate of inequality, with SouthAsia the lowest. This extreme inequality in Latin Americahas been analysed in some depth and has its roots in manyhistorical patterns of landownership, political andinstitutional development and, more recently, economicpolicy.32
Inequality has become increasingly recognized notjust as a problem to be addressed in its own right, but alsobecause of its substantial impacts upon economic growth,poverty reduction and productive investment strategies forthe development of human capital. Studies over the pastdecade have demonstrated the high correlation betweeninequality and poor performance in other aspects ofdevelopment.33
While some forms of inequality have been attributedto differences in the level of education between people,34
and yet others associated with higher returns to capital in
Global inequalitybetween rich and
poor countriescontinues to
worsen, even whenthere have been
extraordinarily highrates of economic
growth
11Challenges of sustainable development in macroeconomic context
Percentage GDP change from previous year, Estimates Forecastexcept interest rates and oil prices 2002 2003 2004 2005 2006
Developing countries 3.4 5.2 6.1 5.4 5.1
East Asia and Pacific 6.7 7.9 7.8 7.1 6.6
Europe and Central Asia 4.6 5.9 7.0 5.6 5.0
Latin America and the Caribbean -0.6 1.6 4.7 3.7 3.7
Middle East and North Africa 3.2 5.7 4.7 4.7 4.5
South Asia 4.6 7.5 6.0 6.3 6.0
Sub-Saharan Africa 3.1 3.0 3.2 3.6 3.7
Source: World Bank, 2005.
The global outlook insummary
Table 1.4
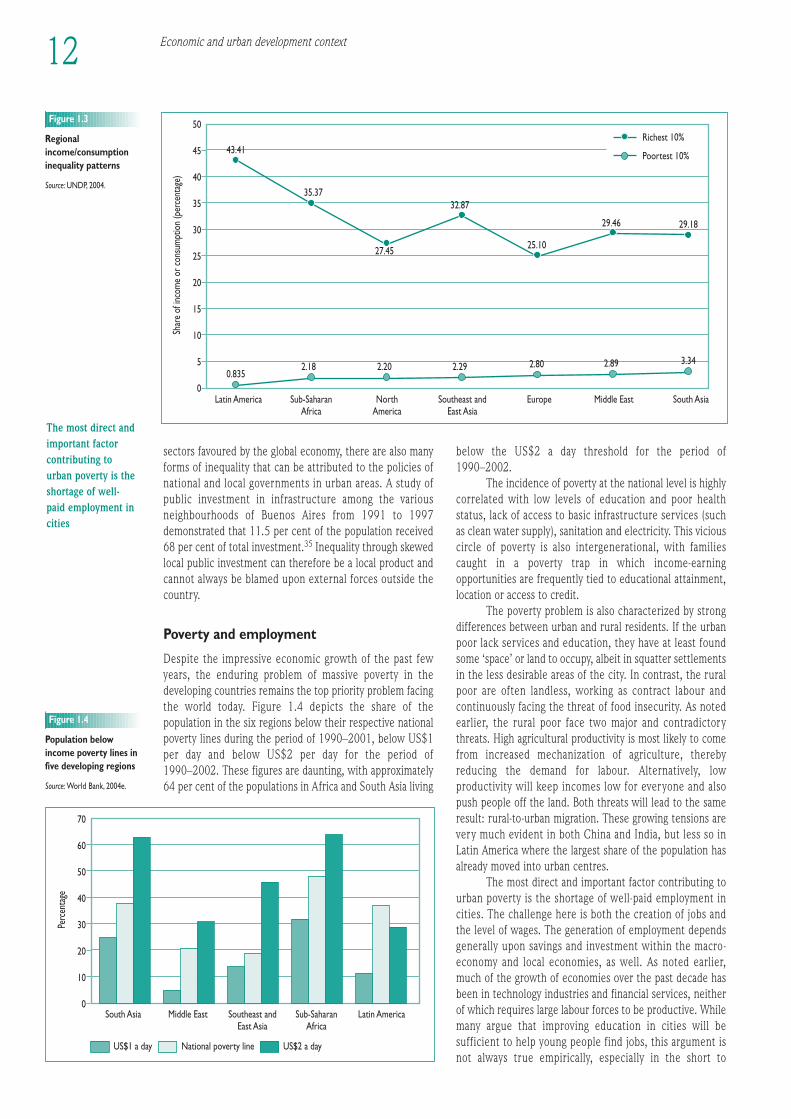
sectors favoured by the global economy, there are also manyforms of inequality that can be attributed to the policies ofnational and local governments in urban areas. A study ofpublic investment in infrastructure among the variousneighbourhoods of Buenos Aires from 1991 to 1997demonstrated that 11.5 per cent of the population received68 per cent of total investment.35 Inequality through skewedlocal public investment can therefore be a local product andcannot always be blamed upon external forces outside thecountry.
Poverty and employment
Despite the impressive economic growth of the past fewyears, the enduring problem of massive poverty in thedeveloping countries remains the top priority problem facingthe world today. Figure 1.4 depicts the share of thepopulation in the six regions below their respective nationalpoverty lines during the period of 1990–2001, below US$1per day and below US$2 per day for the period of1990–2002. These figures are daunting, with approximately64 per cent of the populations in Africa and South Asia living
below the US$2 a day threshold for the period of1990–2002.
The incidence of poverty at the national level is highlycorrelated with low levels of education and poor healthstatus, lack of access to basic infrastructure services (suchas clean water supply), sanitation and electricity. This viciouscircle of poverty is also intergenerational, with familiescaught in a poverty trap in which income-earningopportunities are frequently tied to educational attainment,location or access to credit.
The poverty problem is also characterized by strongdifferences between urban and rural residents. If the urbanpoor lack services and education, they have at least foundsome ‘space’ or land to occupy, albeit in squatter settlementsin the less desirable areas of the city. In contrast, the ruralpoor are often landless, working as contract labour andcontinuously facing the threat of food insecurity. As notedearlier, the rural poor face two major and contradictorythreats. High agricultural productivity is most likely to comefrom increased mechanization of agriculture, therebyreducing the demand for labour. Alternatively, lowproductivity will keep incomes low for everyone and alsopush people off the land. Both threats will lead to the sameresult: rural-to-urban migration. These growing tensions arevery much evident in both China and India, but less so inLatin America where the largest share of the population hasalready moved into urban centres.
The most direct and important factor contributing tourban poverty is the shortage of well-paid employment incities. The challenge here is both the creation of jobs andthe level of wages. The generation of employment dependsgenerally upon savings and investment within the macro-economy and local economies, as well. As noted earlier,much of the growth of economies over the past decade hasbeen in technology industries and financial services, neitherof which requires large labour forces to be productive. Whilemany argue that improving education in cities will besufficient to help young people find jobs, this argument isnot always true empirically, especially in the short to
The most direct andimportant factorcontributing tourban poverty is theshortage of well-paid employment incities
12 Economic and urban development context
Regionalincome/consumptioninequality patterns
Source: UNDP, 2004.
Figure 1.3
Population belowincome poverty lines infive developing regions
Source: World Bank, 2004e.
Figure 1.4
50
45
40
35
30
25
20
15
10
5
0Latin America
Shar
e of
inco
me
or co
nsum
ptio
n (p
erce
ntag
e)
Sub-SaharanAfrica
NorthAmerica
Southeast andEast Asia
Europe Middle East South Asia
0.8352.18 2.20 2.29 2.80 2.89 3.34
43.41
35.37
27.45
32.87
25.10
29.46 29.18
Richest 10%
Poortest 10%
South Asia
70
60
50
40
30
20
10
0
Perc
enta
ge
Middle East Southeast andEast Asia
Sub-SaharanAfrica
Latin America
US$1 a day National poverty line US$2 a day
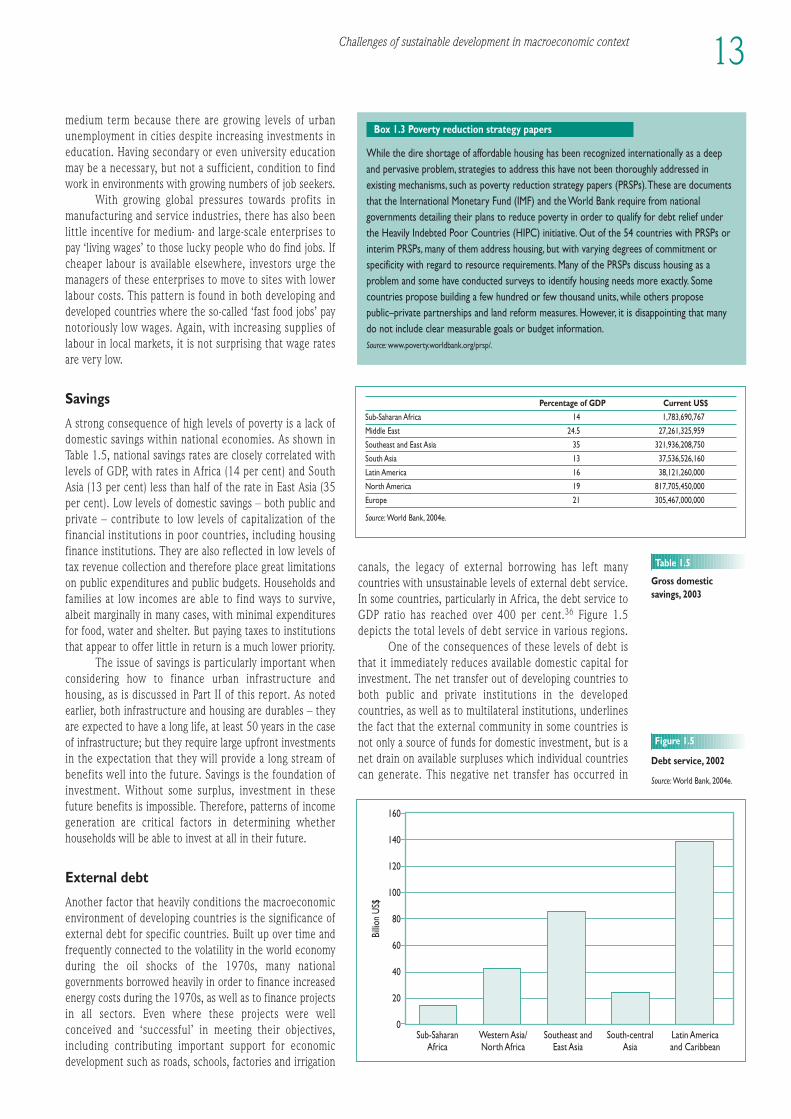
medium term because there are growing levels of urbanunemployment in cities despite increasing investments ineducation. Having secondary or even university educationmay be a necessary, but not a sufficient, condition to findwork in environments with growing numbers of job seekers.
With growing global pressures towards profits inmanufacturing and service industries, there has also beenlittle incentive for medium- and large-scale enterprises topay ‘living wages’ to those lucky people who do find jobs. Ifcheaper labour is available elsewhere, investors urge themanagers of these enterprises to move to sites with lowerlabour costs. This pattern is found in both developing anddeveloped countries where the so-called ‘fast food jobs’ paynotoriously low wages. Again, with increasing supplies oflabour in local markets, it is not surprising that wage ratesare very low.
Savings
A strong consequence of high levels of poverty is a lack ofdomestic savings within national economies. As shown inTable 1.5, national savings rates are closely correlated withlevels of GDP, with rates in Africa (14 per cent) and SouthAsia (13 per cent) less than half of the rate in East Asia (35per cent). Low levels of domestic savings – both public andprivate – contribute to low levels of capitalization of thefinancial institutions in poor countries, including housingfinance institutions. They are also reflected in low levels oftax revenue collection and therefore place great limitationson public expenditures and public budgets. Households andfamilies at low incomes are able to find ways to survive,albeit marginally in many cases, with minimal expendituresfor food, water and shelter. But paying taxes to institutionsthat appear to offer little in return is a much lower priority.
The issue of savings is particularly important whenconsidering how to finance urban infrastructure andhousing, as is discussed in Part II of this report. As notedearlier, both infrastructure and housing are durables – theyare expected to have a long life, at least 50 years in the caseof infrastructure; but they require large upfront investmentsin the expectation that they will provide a long stream ofbenefits well into the future. Savings is the foundation ofinvestment. Without some surplus, investment in thesefuture benefits is impossible. Therefore, patterns of incomegeneration are critical factors in determining whetherhouseholds will be able to invest at all in their future.
External debt
Another factor that heavily conditions the macroeconomicenvironment of developing countries is the significance ofexternal debt for specific countries. Built up over time andfrequently connected to the volatility in the world economyduring the oil shocks of the 1970s, many nationalgovernments borrowed heavily in order to finance increasedenergy costs during the 1970s, as well as to finance projectsin all sectors. Even where these projects were wellconceived and ‘successful’ in meeting their objectives,including contributing important support for economicdevelopment such as roads, schools, factories and irrigation
canals, the legacy of external borrowing has left manycountries with unsustainable levels of external debt service.In some countries, particularly in Africa, the debt service toGDP ratio has reached over 400 per cent.36 Figure 1.5depicts the total levels of debt service in various regions.
One of the consequences of these levels of debt isthat it immediately reduces available domestic capital forinvestment. The net transfer out of developing countries toboth public and private institutions in the developedcountries, as well as to multilateral institutions, underlinesthe fact that the external community in some countries isnot only a source of funds for domestic investment, but is anet drain on available surpluses which individual countriescan generate. This negative net transfer has occurred in
13Challenges of sustainable development in macroeconomic context
Gross domesticsavings, 2003
Table 1.5
Debt service, 2002
Source: World Bank, 2004e.
Figure 1.5
160
140
120
100
80
60
40
20
0Sub-Saharan
Africa
Billio
n US
$
Western Asia/North Africa
Southeast andEast Asia
South-centralAsia
Latin Americaand Caribbean
Box 1.3 Poverty reduction strategy papers
While the dire shortage of affordable housing has been recognized internationally as a deepand pervasive problem, strategies to address this have not been thoroughly addressed inexisting mechanisms, such as poverty reduction strategy papers (PRSPs).These are documentsthat the International Monetary Fund (IMF) and the World Bank require from nationalgovernments detailing their plans to reduce poverty in order to qualify for debt relief underthe Heavily Indebted Poor Countries (HIPC) initiative. Out of the 54 countries with PRSPs orinterim PRSPs, many of them address housing, but with varying degrees of commitment orspecificity with regard to resource requirements. Many of the PRSPs discuss housing as aproblem and some have conducted surveys to identify housing needs more exactly. Somecountries propose building a few hundred or few thousand units, while others proposepublic–private partnerships and land reform measures. However, it is disappointing that manydo not include clear measurable goals or budget information.Source: www.poverty.worldbank.org/prsp/.
Percentage of GDP Current US$
Sub-Saharan Africa 14 1,783,690,767
Middle East 24.5 27,261,325,959
Southeast and East Asia 35 321,936,208,750
South Asia 13 37,536,526,160
Latin America 16 38,121,260,000
North America 19 817,705,450,000
Europe 21 305,467,000,000
Source: World Bank, 2004e.
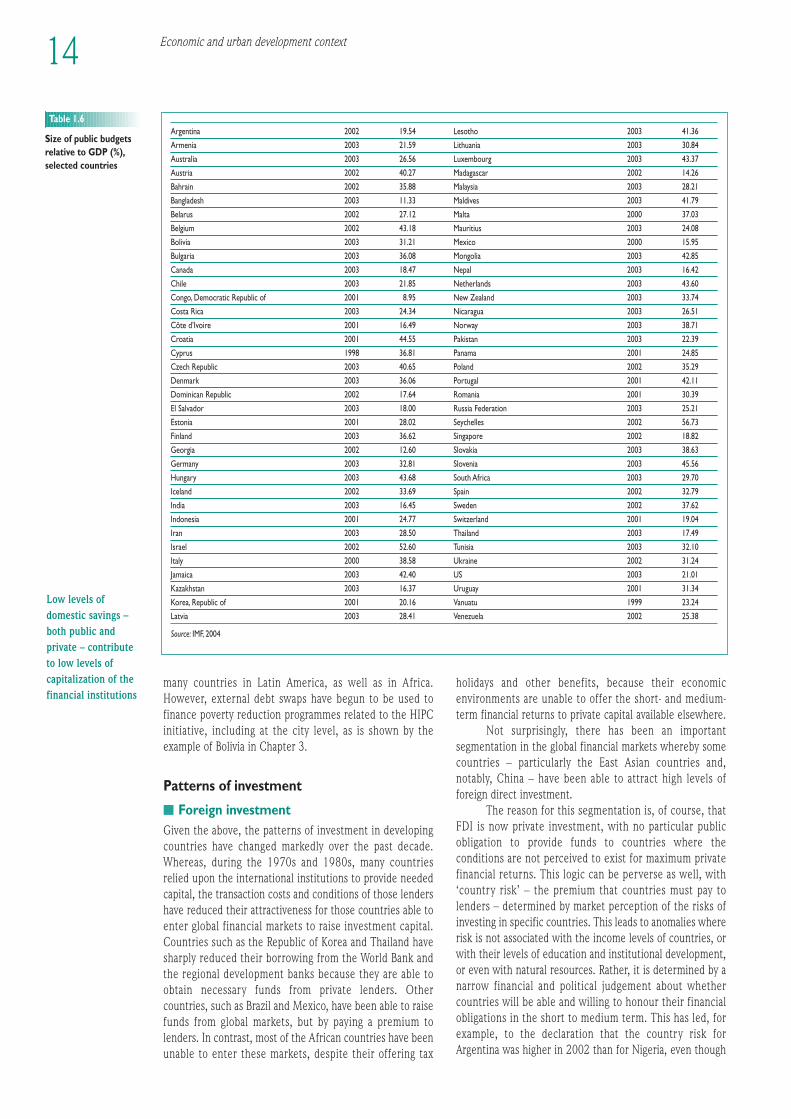
many countries in Latin America, as well as in Africa.However, external debt swaps have begun to be used tofinance poverty reduction programmes related to the HIPCinitiative, including at the city level, as is shown by theexample of Bolivia in Chapter 3.
Patterns of investment
� Foreign investmentGiven the above, the patterns of investment in developingcountries have changed markedly over the past decade.Whereas, during the 1970s and 1980s, many countriesrelied upon the international institutions to provide neededcapital, the transaction costs and conditions of those lendershave reduced their attractiveness for those countries able toenter global financial markets to raise investment capital.Countries such as the Republic of Korea and Thailand havesharply reduced their borrowing from the World Bank andthe regional development banks because they are able toobtain necessary funds from private lenders. Othercountries, such as Brazil and Mexico, have been able to raisefunds from global markets, but by paying a premium tolenders. In contrast, most of the African countries have beenunable to enter these markets, despite their offering tax
holidays and other benefits, because their economicenvironments are unable to offer the short- and medium-term financial returns to private capital available elsewhere.
Not surprisingly, there has been an importantsegmentation in the global financial markets whereby somecountries – particularly the East Asian countries and,notably, China – have been able to attract high levels offoreign direct investment.
The reason for this segmentation is, of course, thatFDI is now private investment, with no particular publicobligation to provide funds to countries where theconditions are not perceived to exist for maximum privatefinancial returns. This logic can be perverse as well, with‘country risk’ – the premium that countries must pay tolenders – determined by market perception of the risks ofinvesting in specific countries. This leads to anomalies whererisk is not associated with the income levels of countries, orwith their levels of education and institutional development,or even with natural resources. Rather, it is determined by anarrow financial and political judgement about whethercountries will be able and willing to honour their financialobligations in the short to medium term. This has led, forexample, to the declaration that the country risk forArgentina was higher in 2002 than for Nigeria, even though
Low levels ofdomestic savings –both public andprivate – contributeto low levels ofcapitalization of thefinancial institutions
14 Economic and urban development context
Size of public budgetsrelative to GDP (%),selected countries
Table 1.6Argentina 2002 19.54 Lesotho 2003 41.36
Armenia 2003 21.59 Lithuania 2003 30.84
Australia 2003 26.56 Luxembourg 2003 43.37
Austria 2002 40.27 Madagascar 2002 14.26
Bahrain 2002 35.88 Malaysia 2003 28.21
Bangladesh 2003 11.33 Maldives 2003 41.79
Belarus 2002 27.12 Malta 2000 37.03
Belgium 2002 43.18 Mauritius 2003 24.08
Bolivia 2003 31.21 Mexico 2000 15.95
Bulgaria 2003 36.08 Mongolia 2003 42.85
Canada 2003 18.47 Nepal 2003 16.42
Chile 2003 21.85 Netherlands 2003 43.60
Congo, Democratic Republic of 2001 8.95 New Zealand 2003 33.74
Costa Rica 2003 24.34 Nicaragua 2003 26.51
Côte d’Ivoire 2001 16.49 Norway 2003 38.71
Croatia 2001 44.55 Pakistan 2003 22.39
Cyprus 1998 36.81 Panama 2001 24.85
Czech Republic 2003 40.65 Poland 2002 35.29
Denmark 2003 36.06 Portugal 2001 42.11
Dominican Republic 2002 17.64 Romania 2001 30.39
El Salvador 2003 18.00 Russia Federation 2003 25.21
Estonia 2001 28.02 Seychelles 2002 56.73
Finland 2003 36.62 Singapore 2002 18.82
Georgia 2002 12.60 Slovakia 2003 38.63
Germany 2003 32.81 Slovenia 2003 45.56
Hungary 2003 43.68 South Africa 2003 29.70
Iceland 2002 33.69 Spain 2002 32.79
India 2003 16.45 Sweden 2002 37.62
Indonesia 2001 24.77 Switzerland 2001 19.04
Iran 2003 28.50 Thailand 2003 17.49
Israel 2002 52.60 Tunisia 2003 32.10
Italy 2000 38.58 Ukraine 2002 31.24
Jamaica 2003 42.40 US 2003 21.01
Kazakhstan 2003 16.37 Uruguay 2001 31.34
Korea, Republic of 2001 20.16 Vanuatu 1999 23.24
Latvia 2003 28.41 Venezuela 2002 25.38
Source: IMF, 2004
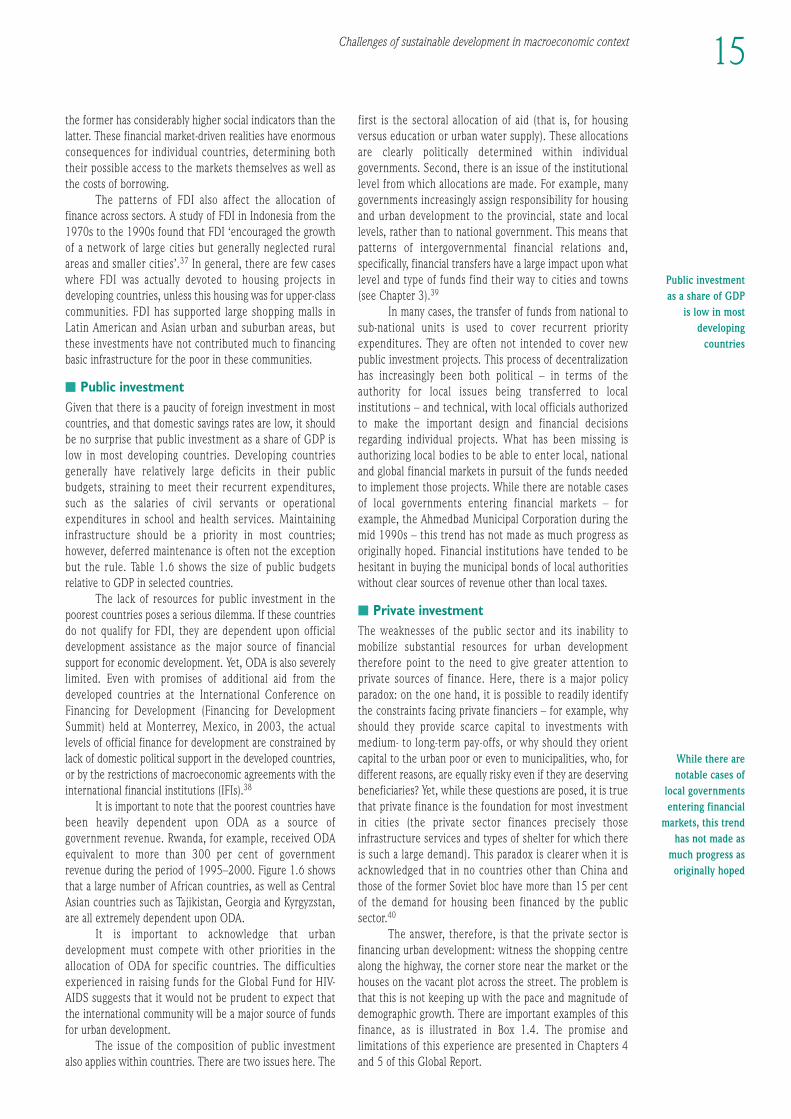
the former has considerably higher social indicators than thelatter. These financial market-driven realities have enormousconsequences for individual countries, determining boththeir possible access to the markets themselves as well asthe costs of borrowing.
The patterns of FDI also affect the allocation offinance across sectors. A study of FDI in Indonesia from the1970s to the 1990s found that FDI ‘encouraged the growthof a network of large cities but generally neglected ruralareas and smaller cities’.37 In general, there are few caseswhere FDI was actually devoted to housing projects indeveloping countries, unless this housing was for upper-classcommunities. FDI has supported large shopping malls inLatin American and Asian urban and suburban areas, butthese investments have not contributed much to financingbasic infrastructure for the poor in these communities.
� Public investmentGiven that there is a paucity of foreign investment in mostcountries, and that domestic savings rates are low, it shouldbe no surprise that public investment as a share of GDP islow in most developing countries. Developing countriesgenerally have relatively large deficits in their publicbudgets, straining to meet their recurrent expenditures,such as the salaries of civil servants or operationalexpenditures in school and health services. Maintaininginfrastructure should be a priority in most countries;however, deferred maintenance is often not the exceptionbut the rule. Table 1.6 shows the size of public budgetsrelative to GDP in selected countries.
The lack of resources for public investment in thepoorest countries poses a serious dilemma. If these countriesdo not qualify for FDI, they are dependent upon officialdevelopment assistance as the major source of financialsupport for economic development. Yet, ODA is also severelylimited. Even with promises of additional aid from thedeveloped countries at the International Conference onFinancing for Development (Financing for DevelopmentSummit) held at Monterrey, Mexico, in 2003, the actuallevels of official finance for development are constrained bylack of domestic political support in the developed countries,or by the restrictions of macroeconomic agreements with theinternational financial institutions (IFIs).38
It is important to note that the poorest countries havebeen heavily dependent upon ODA as a source ofgovernment revenue. Rwanda, for example, received ODAequivalent to more than 300 per cent of governmentrevenue during the period of 1995–2000. Figure 1.6 showsthat a large number of African countries, as well as CentralAsian countries such as Tajikistan, Georgia and Kyrgyzstan,are all extremely dependent upon ODA.
It is important to acknowledge that urbandevelopment must compete with other priorities in theallocation of ODA for specific countries. The difficultiesexperienced in raising funds for the Global Fund for HIV-AIDS suggests that it would not be prudent to expect thatthe international community will be a major source of fundsfor urban development.
The issue of the composition of public investmentalso applies within countries. There are two issues here. The
first is the sectoral allocation of aid (that is, for housingversus education or urban water supply). These allocationsare clearly politically determined within individualgovernments. Second, there is an issue of the institutionallevel from which allocations are made. For example, manygovernments increasingly assign responsibility for housingand urban development to the provincial, state and locallevels, rather than to national government. This means thatpatterns of intergovernmental financial relations and,specifically, financial transfers have a large impact upon whatlevel and type of funds find their way to cities and towns(see Chapter 3).39
In many cases, the transfer of funds from national tosub-national units is used to cover recurrent priorityexpenditures. They are often not intended to cover newpublic investment projects. This process of decentralizationhas increasingly been both political – in terms of theauthority for local issues being transferred to localinstitutions – and technical, with local officials authorizedto make the important design and financial decisionsregarding individual projects. What has been missing isauthorizing local bodies to be able to enter local, nationaland global financial markets in pursuit of the funds neededto implement those projects. While there are notable casesof local governments entering financial markets – forexample, the Ahmedbad Municipal Corporation during themid 1990s – this trend has not made as much progress asoriginally hoped. Financial institutions have tended to behesitant in buying the municipal bonds of local authoritieswithout clear sources of revenue other than local taxes.
� Private investmentThe weaknesses of the public sector and its inability tomobilize substantial resources for urban developmenttherefore point to the need to give greater attention toprivate sources of finance. Here, there is a major policyparadox: on the one hand, it is possible to readily identifythe constraints facing private financiers – for example, whyshould they provide scarce capital to investments withmedium- to long-term pay-offs, or why should they orientcapital to the urban poor or even to municipalities, who, fordifferent reasons, are equally risky even if they are deservingbeneficiaries? Yet, while these questions are posed, it is truethat private finance is the foundation for most investmentin cities (the private sector finances precisely thoseinfrastructure services and types of shelter for which thereis such a large demand). This paradox is clearer when it isacknowledged that in no countries other than China andthose of the former Soviet bloc have more than 15 per centof the demand for housing been financed by the publicsector.40
The answer, therefore, is that the private sector isfinancing urban development: witness the shopping centrealong the highway, the corner store near the market or thehouses on the vacant plot across the street. The problem isthat this is not keeping up with the pace and magnitude ofdemographic growth. There are important examples of thisfinance, as is illustrated in Box 1.4. The promise andlimitations of this experience are presented in Chapters 4and 5 of this Global Report.
Public investment as a share of GDP
is low in mostdeveloping
countries
While there arenotable cases of
local governmentsentering financial
markets, this trendhas not made as
much progress asoriginally hoped
15Challenges of sustainable development in macroeconomic context

One controversial aspect of private investment was alsothe trend, during the 1990s, to privatize public services onthe grounds that private management was more efficient andcost conscious, and frequently could be counted upon to helpmobilize needed capital for investment in the rehabilitationor expansion of infrastructure networks. While some of theseprivatization experiments resulted in such benefits, manywere sharply criticized because private managers oftenincreased the tariffs of previous public services, therebyexcluding the poor from needed infrastructure, such as watersupply. In addition, many privatized firms were unable toattract new capital for network expansions. This createdpolitical problems for public authorities who had justified theirdecisions to privatize, in part, on the expectation that un-served populations would receive services. While an overallassessment of the privatization experiment remains to bedone, it is clear that effective privatization requires effective
public regulation, and this factor was often missing (seeChapter 3).
Other dimensions of macroeconomic performancethat have affected the availability of private finance for urbandevelopment have been the level of interest rates andinflation in the respective developing country economies.While, in general, global interest rates have been low andmoney has been available for investment in developedcountries, this pattern has served to discourage greaterexploration of so-called ‘emerging markets’, where risks arehigher and the potential for inflation greater due touncertainties in macroeconomic management and theimpact of the global economy upon local markets andspecific investments. The concentration of capital inEuropean and North American markets has tended to attractnew investment as well because there are moreopportunities to diversify within these markets.
16 Economic and urban development context
Official developmentassistance, selectedcountries, averageduring 1995–2000(percentage of totalgovernment revenue,excluding grants)
Source: IMF and IDA, 2004, p8.
Figure 1.6
0 50 100 150 200 250 300 350
RwandaSierra LeoneMozambique
TajikistanNiger
ZambiaNicaraguaMongolia
UgandaTanzania
Burkina FasoHaiti
GeorgiaMali
KyrgyzstanMauritania
BurundiMadagascar
BhutanBenin
VanuatuEthiopiaSenegalBoliviaGhana
AlbaniaCameroon
MoldovaPapua New Guinea
SudanCôte d’Ivoire
MaldivesKenya
Viet NamYemen
ZimbabweSri LankaPakistan
IndiaNigeria
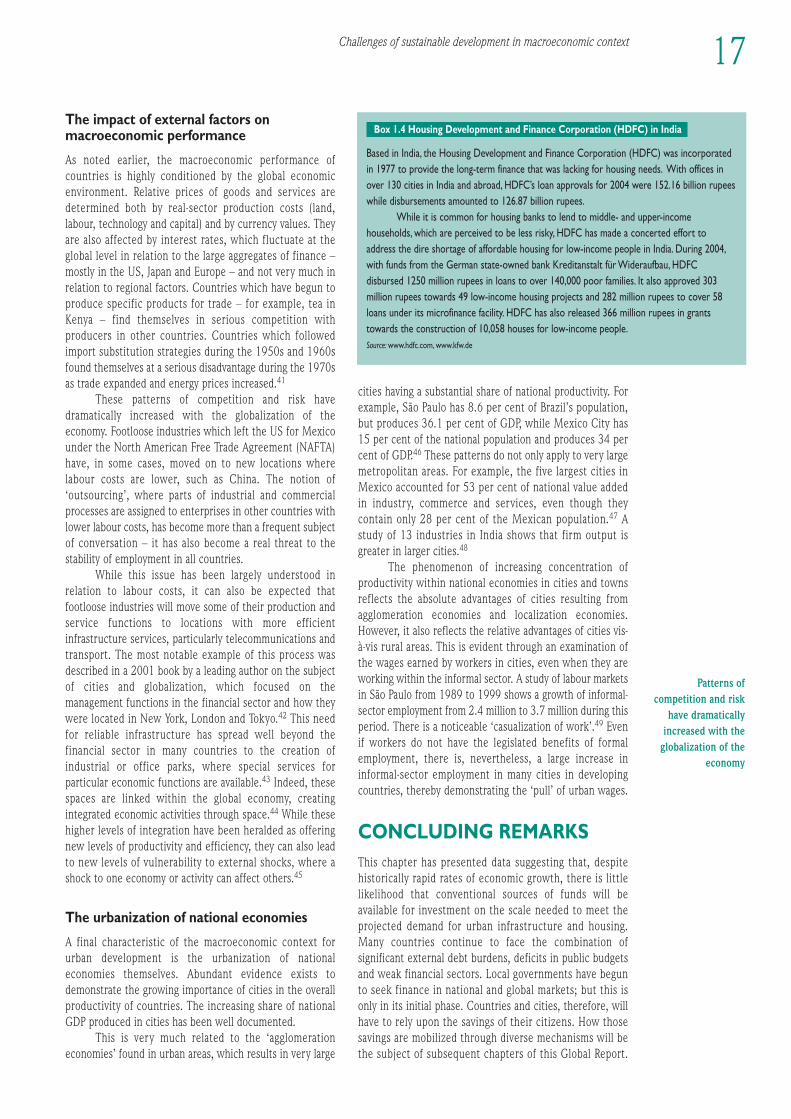
The impact of external factors on macroeconomic performance
As noted earlier, the macroeconomic performance ofcountries is highly conditioned by the global economicenvironment. Relative prices of goods and services aredetermined both by real-sector production costs (land,labour, technology and capital) and by currency values. Theyare also affected by interest rates, which fluctuate at theglobal level in relation to the large aggregates of finance –mostly in the US, Japan and Europe – and not very much inrelation to regional factors. Countries which have begun toproduce specific products for trade – for example, tea inKenya – find themselves in serious competition withproducers in other countries. Countries which followedimport substitution strategies during the 1950s and 1960sfound themselves at a serious disadvantage during the 1970sas trade expanded and energy prices increased.41
These patterns of competition and risk havedramatically increased with the globalization of theeconomy. Footloose industries which left the US for Mexicounder the North American Free Trade Agreement (NAFTA)have, in some cases, moved on to new locations wherelabour costs are lower, such as China. The notion of‘outsourcing’, where parts of industrial and commercialprocesses are assigned to enterprises in other countries withlower labour costs, has become more than a frequent subjectof conversation – it has also become a real threat to thestability of employment in all countries.
While this issue has been largely understood inrelation to labour costs, it can also be expected thatfootloose industries will move some of their production andservice functions to locations with more efficientinfrastructure services, particularly telecommunications andtransport. The most notable example of this process wasdescribed in a 2001 book by a leading author on the subjectof cities and globalization, which focused on themanagement functions in the financial sector and how theywere located in New York, London and Tokyo.42 This needfor reliable infrastructure has spread well beyond thefinancial sector in many countries to the creation ofindustrial or office parks, where special services forparticular economic functions are available.43 Indeed, thesespaces are linked within the global economy, creatingintegrated economic activities through space.44 While thesehigher levels of integration have been heralded as offeringnew levels of productivity and efficiency, they can also leadto new levels of vulnerability to external shocks, where ashock to one economy or activity can affect others.45
The urbanization of national economies
A final characteristic of the macroeconomic context forurban development is the urbanization of nationaleconomies themselves. Abundant evidence exists todemonstrate the growing importance of cities in the overallproductivity of countries. The increasing share of nationalGDP produced in cities has been well documented.
This is very much related to the ‘agglomerationeconomies’ found in urban areas, which results in very large
cities having a substantial share of national productivity. Forexample, São Paulo has 8.6 per cent of Brazil’s population,but produces 36.1 per cent of GDP, while Mexico City has15 per cent of the national population and produces 34 percent of GDP.46 These patterns do not only apply to very largemetropolitan areas. For example, the five largest cities inMexico accounted for 53 per cent of national value addedin industry, commerce and services, even though theycontain only 28 per cent of the Mexican population.47 Astudy of 13 industries in India shows that firm output isgreater in larger cities.48
The phenomenon of increasing concentration ofproductivity within national economies in cities and townsreflects the absolute advantages of cities resulting fromagglomeration economies and localization economies.However, it also reflects the relative advantages of cities vis-à-vis rural areas. This is evident through an examination ofthe wages earned by workers in cities, even when they areworking within the informal sector. A study of labour marketsin São Paulo from 1989 to 1999 shows a growth of informal-sector employment from 2.4 million to 3.7 million during thisperiod. There is a noticeable ‘casualization of work’.49 Evenif workers do not have the legislated benefits of formalemployment, there is, nevertheless, a large increase ininformal-sector employment in many cities in developingcountries, thereby demonstrating the ‘pull’ of urban wages.
CONCLUDING REMARKSThis chapter has presented data suggesting that, despitehistorically rapid rates of economic growth, there is littlelikelihood that conventional sources of funds will beavailable for investment on the scale needed to meet theprojected demand for urban infrastructure and housing.Many countries continue to face the combination ofsignificant external debt burdens, deficits in public budgetsand weak financial sectors. Local governments have begunto seek finance in national and global markets; but this isonly in its initial phase. Countries and cities, therefore, willhave to rely upon the savings of their citizens. How thosesavings are mobilized through diverse mechanisms will bethe subject of subsequent chapters of this Global Report.
Patterns ofcompetition and risk
have dramaticallyincreased with the
globalization of theeconomy
17Challenges of sustainable development in macroeconomic context
Box 1.4 Housing Development and Finance Corporation (HDFC) in India
Based in India, the Housing Development and Finance Corporation (HDFC) was incorporatedin 1977 to provide the long-term finance that was lacking for housing needs. With offices inover 130 cities in India and abroad, HDFC’s loan approvals for 2004 were 152.16 billion rupeeswhile disbursements amounted to 126.87 billion rupees.
While it is common for housing banks to lend to middle- and upper-incomehouseholds, which are perceived to be less risky, HDFC has made a concerted effort toaddress the dire shortage of affordable housing for low-income people in India. During 2004,with funds from the German state-owned bank Kreditanstalt für Wideraufbau, HDFCdisbursed 1250 million rupees in loans to over 140,000 poor families. It also approved 303million rupees towards 49 low-income housing projects and 282 million rupees to cover 58loans under its microfinance facility. HDFC has also released 366 million rupees in grantstowards the construction of 10,058 houses for low-income people.Source: www.hdfc.com, www.kfw.de
Key underlying questions that have been addressedin this chapter are summarized and answered as follows:
• How have macroeconomic trends affected the livingconditions of urban households during the last twodecades? With the exception of East Asian countries,most developing country regions have not experiencedsustained positive growth over the past two decades.Africa has continued to suffer the most, with at bestuneven growth in a few countries; but most sub-Saharan states have continued to deteriorate inproviding needed urban employment and incomes.Latin America has also been quite disappointing as thepromised neo-liberal reforms have failed to deliver theanticipated patterns of sustained growth. In general,the upper end of the income distribution hasbenefited from the new patterns of economic growthin the age of globalization. While in some countriesthere is evidence of a new middle class, particularly inChina and India, the middle class has actuallydisappeared in other countries, joining the poor in theabsence of ‘living wages’.
• Have macroeconomic trends and national developmentpolicies of the last two decades improved urban- and
housing-sector operations? The answer here is mostlynegative. With exceptions in some countries, again inparts of India and China, and in richer developingcountries such as the Republic of Korea, Thailand orMexico, national economic authorities have generallybeen preoccupied with macrostability, debt and trade,and have tended to neglect implementation of theneeded policy and institutional reforms in the urbansector.
• Has international financial assistance to the municipaland housing sectors made a significant contribution toimproving urban infrastructure services and housingwithin cities in developing countries and countries intransition? It must be recognized that, despiteconsiderable effort to encourage urban andinfrastructure policy reform and capacity-building inthe developing countries, there is little evidence ofany sustained large-scale impact. One seniorgovernment official in a large developing countryonce replied to this question by suggesting that thequestion itself was presumptuous in that the level offinancial resources and the applicability of the policyadvice were both considerably short of what wasrequired.
18 Economic and urban development context
1 This chapter is based on twobackground papers preparedby Michael Cohen, New SchoolUniversity, New York, US, withassistance from DeannaFowler.
2 UN Population Division, 2004;National Research Council,2003.
3 UN Millennium Project, 2003,p4.
4 Harris and Todaro, 1970.5 George Beier, Anthony
Churchill, Michael Cohen andBertrand Renaud developedthis typology of urban growthand the range of challengesfacing individual countries. SeeBeier et al, 1976.
6 UN-Habitat, 2003a.7 Montgomery et al, 2004. See
also UN-Habitat, 2004.8 Sharma, 2005.
9 Angel, 2002.10 World Bank, 1991.11 Lee et al, 1999.12 National Research Council,
2003.13 Sharma, 2005.14 UN-Habitat, 2004.15 Dillinger et al, 1994.16 Rees, 1992.17 Mockus, Antanas, ‘Camino a la
Igualdad’, included in MemoriasEncuentro Internacional deCompetitividad, 2002.
18 National Academy of Science,2004.
19 National Academy of Science,2004.
20 Roberts and Cohen, 2002.21 World Bank, 1992.22 According to 1990 World Bank
estimates.23 Cohen, 1998.
24 See Graham and Marvin, 2001.25 National Research Council,
2003.26 Margarita Gutman,
Presentation on the 2050Initiatives at the World UrbanForum, Barcelona, September2004.
27 UN-Habitat, 2003a.28 Homeless International
Dialogue, ‘Risk and investmentin urban communities aroundthe world’, September 2002.
29 World Bank, 2005, p1.30 World Bank, 2005, p2.31 UNCTAD, 2004.32 IADB, 1998.33 Birdsall, 2001.34 UNHCS, 2001.35 Cohen and Debowicz, 2004.36 For detail see: IMF and IDA,
2004.
37 Douglass, 1997, cited inNational Research Council,2003, p345.
38 United Nations, ‘Building onMonterrey’ Financing forDevelopment, 2002.
39 See, for example, Bird andSlack, 2003.
40 World Bank, 1993.41 UNCTAD, 2003.42 Sassen, 2001.43 See for example, Graham and
Marvin, 2001.44 Sassen, 2002; UN-Habitat,
2004.45 Pettis, 2001.46 Freire and Polese, 2003, p6.47 National Research Council,
2003, p303.48 Cited in National Research
Council, 2003, p309; see alsoShukla, 1996.
49 Buechler, 2000.
NOTES
Housing finance is both the servant and the master of thehousing process. The finance available fits into the generalpolicy framework in that it enables the construction ofhousing within the wider supply context current at the time.It also drives the process: reductions in finance affect thescale of supply and allocation among groups supplying anddemanding housing. In times when centralized control ispolitically dominant, finance is likely to be directed atgovernments and their agencies. Decentralization directsfinance to smaller units, concentrating more on localauthorities than on central governments. In times when non-governmental organizations (NGOs) are trusted abovegovernments, shelter finance will be channelled throughthem. The same occurs when citizen groups gain power andrespect.
There have been major shifts in housing policy at theinternational level during the last six decades or so, andthese have tended to drive the agenda, especially whencountries rely upon international institutions to supporttheir endeavours. However, at the same time, somecountries have been following old agendas, while othershave been driving forward innovative ideas.
This chapter discusses the general trends in housingand urban development policy since the end of World War IIand highlights the paradigm shifts that have occurred duringthe last 60 years, and particularly during the last 30 years.From a time when colonial governments, especially in Franceand the UK, drove policy to supply urgently needed urbanimprovements and ‘homes for heroes’, there have beenmajor changes. The recognition that ordinary people couldparticipate in the housing and urban development processgave rise, first, to self-help projects in which people withlittle income were expected to provide goods and servicesfor themselves that those with high incomes were providedwith, often free of charge. This has now developed intocommunity-led urban programmes in which ordinary peopledrive the process.
The context in which housing is provided hasprogressed from welfare provision, through an understandingthat better conditions result in healthier and more productivepeople, to housing as a basic human right. In parallel,financing has moved from subsidizing the cost of a few high-quality dwellings in well-serviced neighbourhoods, through
enabling the finance markets to provide for most, to thebeginnings of a recognition that some subsidized housing isrequired for households too poor to be catered for by the freemarket. Table 2.1 depicts the evolution of policies since 1945.
CONTEXT TOINTERNATIONALTHOUGHTS ON FINANCINGFOR URBAN DEVELOPMENTDuring the early post-World War II years, house building wasregarded as a social overhead cost to economic development.This focused on several issues: economic development; theconstruction industry and construction quality;development of human capital; social development; andsubsidies for workers.2
It was assumed that good housing assisted economicdevelopment; therefore, investments in housing were worthmaking. As such, it became a suitable case for treatment byinternational aid organizations and lenders. During the1960s, the US Agency for International Development(USAID) began loaning substantial sums for housingdevelopment in Latin America as a direct contribution toeconomic development within the context of thriftinstitutions to finance housing.3
During the 1950s and 1960s, the modern movementin architecture generated a branch of interest in tropicalarchitecture.4 Its concern with climatic comfort and the useof local materials was set within the context of the view thatgood design and construction were key elements in creatingaffordable and appropriate towns. At the same time, buildingresearch establishments set up in the colonies – such asCentral Building Research Institute (CBRI) in Roorkee, India,Housing Research Development Unit (HRDU, now known asHousing and Building Research Institute (HABRI)) in Nairobiand Building and Road Research Institute (BRRI) in Kumasi,Ghana – were at the centre of the housing effort, includingexperimentation and testing of materials, techniques anddesigns.
However, the nature of the construction industry,especially the part of it that constructs housing, is so diffuse,
It was assumed thatgood housing
assisted economicdevelopment;
therefore,investments in
housing were worthmaking
C H A P T E R
SHELTER POLICY AND FINANCE:RETROSPECTIVE OVERVIEW 1
2
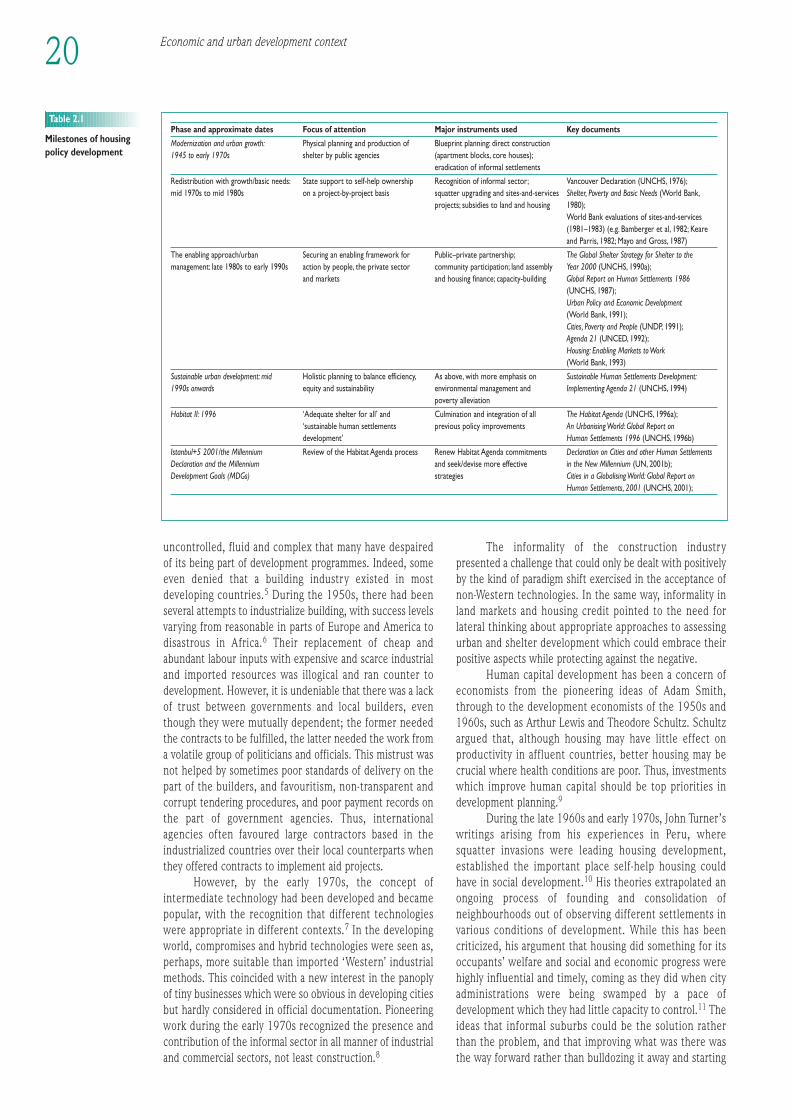
uncontrolled, fluid and complex that many have despairedof its being part of development programmes. Indeed, someeven denied that a building industry existed in mostdeveloping countries.5 During the 1950s, there had beenseveral attempts to industrialize building, with success levelsvarying from reasonable in parts of Europe and America todisastrous in Africa.6 Their replacement of cheap andabundant labour inputs with expensive and scarce industrialand imported resources was illogical and ran counter todevelopment. However, it is undeniable that there was a lackof trust between governments and local builders, eventhough they were mutually dependent; the former neededthe contracts to be fulfilled, the latter needed the work froma volatile group of politicians and officials. This mistrust wasnot helped by sometimes poor standards of delivery on thepart of the builders, and favouritism, non-transparent andcorrupt tendering procedures, and poor payment records onthe part of government agencies. Thus, internationalagencies often favoured large contractors based in theindustrialized countries over their local counterparts whenthey offered contracts to implement aid projects.
However, by the early 1970s, the concept ofintermediate technology had been developed and becamepopular, with the recognition that different technologieswere appropriate in different contexts.7 In the developingworld, compromises and hybrid technologies were seen as,perhaps, more suitable than imported ‘Western’ industrialmethods. This coincided with a new interest in the panoplyof tiny businesses which were so obvious in developing citiesbut hardly considered in official documentation. Pioneeringwork during the early 1970s recognized the presence andcontribution of the informal sector in all manner of industrialand commercial sectors, not least construction.8
The informality of the construction industrypresented a challenge that could only be dealt with positivelyby the kind of paradigm shift exercised in the acceptance ofnon-Western technologies. In the same way, informality inland markets and housing credit pointed to the need forlateral thinking about appropriate approaches to assessingurban and shelter development which could embrace theirpositive aspects while protecting against the negative.
Human capital development has been a concern ofeconomists from the pioneering ideas of Adam Smith,through to the development economists of the 1950s and1960s, such as Arthur Lewis and Theodore Schultz. Schultzargued that, although housing may have little effect onproductivity in affluent countries, better housing may becrucial where health conditions are poor. Thus, investmentswhich improve human capital should be top priorities indevelopment planning.9
During the late 1960s and early 1970s, John Turner’swritings arising from his experiences in Peru, wheresquatter invasions were leading housing development,established the important place self-help housing couldhave in social development.10 His theories extrapolated anongoing process of founding and consolidation ofneighbourhoods out of observing different settlements invarious conditions of development. While this has beencriticized, his argument that housing did something for itsoccupants’ welfare and social and economic progress werehighly influential and timely, coming as they did when cityadministrations were being swamped by a pace ofdevelopment which they had little capacity to control.11 Theideas that informal suburbs could be the solution ratherthan the problem, and that improving what was there wasthe way forward rather than bulldozing it away and starting
20 Economic and urban development context
Milestones of housingpolicy development
Table 2.1Phase and approximate dates Focus of attention Major instruments used Key documents
Modernization and urban growth: Physical planning and production of Blueprint planning: direct construction 1945 to early 1970s shelter by public agencies (apartment blocks, core houses);
eradication of informal settlements
Redistribution with growth/basic needs: State support to self-help ownership Recognition of informal sector; Vancouver Declaration (UNCHS, 1976);mid 1970s to mid 1980s on a project-by-project basis squatter upgrading and sites-and-services Shelter, Poverty and Basic Needs (World Bank,
projects; subsidies to land and housing 1980);World Bank evaluations of sites-and-services (1981–1983) (e.g. Bamberger et al, 1982; Keare and Parris, 1982; Mayo and Gross, 1987)
The enabling approach/urban Securing an enabling framework for Public–private partnership; The Global Shelter Strategy for Shelter to the management: late 1980s to early 1990s action by people, the private sector community participation; land assembly Year 2000 (UNCHS, 1990a);
and markets and housing finance; capacity-building Global Report on Human Settlements 1986 (UNCHS, 1987);Urban Policy and Economic Development (World Bank, 1991);Cities, Poverty and People (UNDP, 1991);Agenda 21 (UNCED, 1992);Housing: Enabling Markets to Work (World Bank, 1993)
Sustainable urban development: mid Holistic planning to balance efficiency, As above, with more emphasis on Sustainable Human Settlements Development:1990s onwards equity and sustainability environmental management and Implementing Agenda 21 (UNCHS, 1994)
poverty alleviation
Habitat II: 1996 ‘Adequate shelter for all’ and Culmination and integration of all The Habitat Agenda (UNCHS, 1996a);‘sustainable human settlements previous policy improvements An Urbanising World: Global Report on development’ Human Settlements 1996 (UNCHS, 1996b)
Istanbul+5 2001/the Millennium Review of the Habitat Agenda process Renew Habitat Agenda commitments Declaration on Cities and other Human Settlements Declaration and the Millennium and seek/devise more effective in the New Millennium (UN, 2001b);Development Goals (MDGs) strategies Cities in a Globalising World: Global Report on
Human Settlements, 2001 (UNCHS, 2001);

again, became conventional wisdom in international circles,if not in country policies.12
In the formal sector, during the 1950s and 1960s,subsidies were an important part of housing policy. Bothbefore and after the war, housing for urban workers tendedto be rented out at less than economic rents, usually relatedto income. Occasionally, this would be a direct relationshipby being a certain percentage of wages extracted at sourceby employers (typically large manufacturing and extractiveindustries) who provided housing for their workers. Forothers, rents were fixed at what was thought to be a realisticamount for the average household to afford. In parallel,during World War II, many countries had sought to controlthe effect of wartime inflation on urban rents by imposingcontrols. These were often continued into peacetime andbecame a feature of many cities’ housing. They constitute asubsidy offered (reluctantly) by landlords to tenants.
There was, therefore, little link made between theneed to finance housing and its supply. As an example, inthe Gold Coast/Ghana, although it was acknowledged insuccessive development plans during the 1950s and 1960sthat the private-sector landlords provided most housing,rents were consistently controlled to levels that affected theprofitability of such supply, and rental income was taxed athigher levels than ‘earned’ income.13 The costs of suchpractices, represented by the poor condition of the stockand the lack of new supply, are well known.14
TRENDS IN SHELTER ANDMUNICIPAL FINANCEDEVELOPMENT: 1972–2004Between 1972 and 1982: Habitat I
The World Bank began lending for urban developmentprojects during the 1970s. It made an explicit effort todemonstrate that it was financially and economically feasibleto provide services and shelter for the lowest incomesegments of society.15 However, the focus of financing atthat time, as outlined in the report of the first UnitedNations Conference on Human Settlements, was on low-interest loans, loan guarantees and subsidies as a means ofmaking housing affordable to low-income people.16 Inaddition, the active use of pricing policies was seen as themeans to enhance equity in service and infrastructuredelivery to all. The sources of funding and the implicationsof under-pricing the services were not discussed.17
� The project approachInterventions during this period concentrated ondemonstration projects of limited size with respect to a cityor region, and usually confined to a particular neighbourhoodor group of neighbourhoods. The idea of the projects was todemonstrate the feasibility of providing low-cost housing andservices in particular ways thought to be suited to low-income people and capable of replication at a large scaleelsewhere in the city/country and in other countries.Replication demanded full-cost recovery as a basic premise.
Only in this way could the project benefits be rolled out tothe general population living in poor housing conditionsthrough follow-up projects. Unless costs could be recovered,the financing would be used up and the self-perpetuating andlimitless growth of subsidies would have to continue.18 Inpractice, there was little success in collecting repayments.Project beneficiaries were not pursued when they defaultedand it was politically unacceptable to evict them. Thus, theyreceived further subsidies in forgiven payments and toleratedarrears at the expense of others who could benefit from thereplication of the projects. In the event, replication rateswere very poor.
Projects tended to be outside of municipal control,and to have different standards from elsewhere, differentmeans of implementation (for example, materialsprocurement through project depots at subsidized prices andsoft loans) and little effect ‘outside the fence’.
� Self-helpProjects during the first period of international financing forurban development focused upon self-help, providing acontext in which the spare time and energy of low-incomepeople could be devoted to house construction orinfrastructure provision. They were broadly of two types:sites-and-services projects for new housing provision andsettlement upgrading for bringing squatter and other informalsettlements up to an acceptable standard of servicing andpublic space provision. Some of the classic projects duringthe early to mid 1970s, including the World Bank urbandevelopment projects in Botswana, El Salvador, Senegal andTanzania, focused upon new development through sites andservices – providing a minimal core house and infrastructureon ‘greenfield’ sites. This approach was much more costeffective than direct provision of housing. Other classicprojects – notably, World Bank projects in Indonesia, BurkinaFaso and Zambia – focused upon slum upgrading throughimproving conditions in un-serviced settlements andproviding some serviced sites for overspill. This was moresocially and politically acceptable than the alternative ofwholesale clearance and relocation. They often ran together,as residents were displaced from the squatter settlementsduring the rationalization process required to retrofit roadsand open up the most congested parts, would be given aserviced plot as recompense for their removal. Both types ofdevelopment intended to provide occupants with ‘acceptable’environments, though they often did not conform to thecontemporary legal standards.
Residents of each would be involved in the projectthrough their own physical work, either building thedwellings in sites-and-services schemes, or fittinginfrastructure in upgrading. This concept of adding valuethrough physical work, referred to as ‘sweat equity’, wasstrongly ingrained in the projects of the 1970s. For ahousehold to engage artisanal help, by employing a builderto construct their home, was felt to be not playing the gameby the rules. There was an assumption that, in a reflection ofthe Protestant ethic, hard work was morally good and, if itwas expended building a home or improving theneighbourhood, the occupants would value the dwelling so
During the 1950sand 1960s,
subsidies were animportant part of
housing policy
21Shelter policy and finance: retrospective overview

much that they would look after it well and care for theneighbourhood and its services. In this, the project designerswere supported by a then developing literature on theimportance of making home as a process, not least by thehighly influential work of John Turner.19 Intuitively, it can beaccepted that if someone has been part of constructing adwelling or a sewer, they will be vigilant with respect to itsmaintenance and will also be capable of repairing it.
Participants in sites-and-services schemes were helpedin their construction efforts by project staff who provided arange of services. They might provide plans of standarddwellings (in first phase and complete forms) including block-by-block guides to construction, help with setting out andlaying foundation slabs, and constant encouragement topersevere until the construction was complete. Participantswere meant to repay loans taken out to build the dwellingsand also to repay the cost of infrastructure and the ongoingservices provided. In slum upgrading projects, less repaymentwas expected; but users were expected to contribute in cashor labour in fitting infrastructure, as well as to pay for thewater and other services as they used them. Recipients ofupgrading benefits were expected to be among the pooresthouseholds in the city.20
One analysis of World Bank projects demonstratedthat the projects generated greater than expected privateinvestment in housing – in Senegal about eight times asmuch as the project cost – in addition to considerablebenefits in the informal construction industry.21
Although land, infrastructure, services andadministration were financed from loans, sweat equitybecame a major housing finance mode; the opportunity costof leisure time or other economic activity replaced moneyto pay contractors, just as in pre-industrial societies. Self-help assumed that the opportunity cost of participants’ timewas near zero when, in fact, most low-income people arenot really idle when they are not at their formal work (if theyhave any). Instead, they work hard as parents or makebusiness to increase their household livelihood portfolio. Itwas, therefore, difficult for them to fit the sweat equitymould, and many employed artisans to carry outconstruction tasks.22 Indeed, evaluations have shown howmany participants used professional building workers23 Onlyone fifth of households in a Philippines scheme had reliedupon their own labour.24 In Matero, Lusaka, 92 per cent ofparticipants in the World Bank-financed sites-and-servicesscheme employed construction labour.25 In the El SalvadorWorld Bank projects, about 72 per cent of labour inputs (byvalue) were hired – a total of 6.5 work months hired labourper dwelling.26 As might be expected, households withhigher incomes and greater employment opportunities weremore likely to contract out their ‘sweat equity’ contributionto artisans than those with lower incomes.27
In addition to finance by sweat equity, there weremany subsidies. Some were declared in the project (on-budget) and others were hidden (off-budget). For example,project administrative costs were rarely passed on to therecipients, being absorbed, instead, as a hidden subsidy. Off-budget subsidies were usually many times larger thanon-budget.28
The participants in sites-and-services schemes tendedto have rather higher incomes than the rhetoric and intentionimplied. As they usually had to apply in writing, often in aninternational language or an urban lingua franca, mostsuccessful participants were literate in their second languageand, therefore, able to earn more than the minimum wage.It was in the interests of project administrators to allocateplots and the consequent subsidized benefits to householdswho could well afford to keep up the repayments. Thus, thefinancial requirements, with respect to upfront payments andongoing repayments, rendered the projects self-selecting topeople who had a likelihood (and some evidence) of long-term stable income. Of course, this undermined the povertyalleviation goal of such projects. It is, therefore, notsurprising that, in many projects, low-income householdsshowed themselves able and willing to pay for housing andservices in a way that undercut the basic premise ofsubsidies.29 In others, poor repayment by occupantsundermined any hope of replication. Only in a few countries(notably, Indonesia, Jordan and Tunisia) was substantialreplication successful.
Dwelling owners in upgrading schemes, on the otherhand, tended to be among the low-income groups and theirtenants were probably in even lower income echelons(although their per capita income was probably similar orhigher).30
� Who took part in and benefited from the projects?
The successful project beneficiaries ‘won the lottery’ byhaving access to benefits unavailable to the mass population.They undoubtedly benefited with respect to long-termimprovements in their housing conditions, the improvedsecurity of tenure which went with the schemes, and interms of the consequent increase in the value of theirproperty. However, they had to accept what was on offer andit may not have been what they had bargained for or whatthey required the most. Many found themselves unsuited tothe project and bought their way out by selling to richerhouseholds, ignored some of the project requirements tobetter suit it to their needs, or defaulted on payments tomake it affordable. Tenants tended not to benefit much astheir rents would rise to cover any repayments required,often above their willingness to pay. Thus, they tended tomove out to another non-upgraded settlement where rentswere still affordable. In the process, however, their socialand economic networks would probably be seriouslydislocated.
Many owners took advantage of demand for thegreatly improved housing and sold out to higher incomehouseholds, who had not enjoyed such secure tenure, andthen moved into another un-serviced area. Indeed, it wasnot uncommon for site-and-service owners to remain in thesquatter settlement and rent out the newly built dwelling toanother, better-off, household. Where those who sold orrented out achieved a good price for their dwelling, theymight be said to have exercised a reasonable market choiceto convert housing capital gains into more flexible forms inorder to diversify the benefits into other parts of their
22 Economic and urban development context

household livelihoods portfolios.31 However, anecdotalevidence suggests that few gained a full market price as evena relatively small capital sum represented more money thanmost had ever contemplated possessing, and they wereeasily wooed into selling themselves short and moving backinto un-serviced squatter areas. This ‘raiding’, or ‘poaching’,by middle-income households has been a feature of manysuch interventions through the decades and is still an issuein South Africa’s housing subsidy developments.32
Many participants benefited from learning new skillsand gaining confidence in, and understanding of,construction and the installation of services, as well as indealing with authority figures. Some went on to make aliving with their new skills. However, it has been argued thatthe process of teaching lay-people to build their owndwellings is inefficient in that they only really master theprocess when they have almost finished.33 The newlylearned skills are then usually neglected and forgotten. Thisis counterproductive as it is more important to have a well-functioning cadre of small-scale contractors than to teachindividuals skills that they will only use once.
There was an obvious problem about how far therecipients were being involved in planning and decision-making. Projects tended to include a bundle of services andcomponents chosen by distant decision-makers and imposedupon the recipients, with their involvement sought only in atoken participation exercise to gain their cooperation andacquiescence. Thus, in the World Bank’s early Lusaka Projectin Zambia, residents of squatter settlements went oncollective walks to guide the detailed route of roads that hadalready been roughly marked out in thick felt pen on adiagram of the project.34 They were not involved in thedecisions about how much investment should be devoted toroads and what the general layout should be; theirparticipation was restricted to details of routing and whichbuildings should be demolished to implement theirconstruction.
The construction industry benefited in contrastingways. Large formal (sometimes international) contractorshad the opportunity to tender for the large contracts and thesuccessful firms undoubtedly benefited. Their workerswould also receive regular income and experience. However,much of the construction industry consists of independentartisans who tackle jobs alone or in informal gatherings oftradespeople and labourers. They were often disqualifiedfrom tendering because of the conditions about previousexperience and the bonds to be deposited. Many, however,benefited from small contracts to provide skilled inputs intoso-called self-help housing. However, they were unlikely tohave garnered as much work as if the housing had beendeveloped in a manner designed to value the role of localconstruction firms. The effect of the subsidy element inthese self-help projects on small contractors was oftenconflicting. On the one hand, the reduction in land andother costs allowed clients to spend more on the structure,improving the opportunities for small contractors. On theother hand, the same contractors might also suffer areduction in the value of their work as subsidized alternativehousing goods became available.
The municipalities and utilities agencies took part andbenefited in a limited way. The projects were often toocomplex for the municipal authority to implement.Municipalities provided the land for the projects atsubsidized prices. The improvement in the housing stockand the upgrading of some of the worst housing undoubtedlytook away some problems and generated potential forimproved property tax and utility charges. However, theyinherited servicing and maintenance burdens from the newinfrastructure and often found that the clients had nointention of repaying the cost of fitting or the ongoingservice charges. In addition, collection of taxes and chargesis often very poor, so such benefits are minimized.Defaulting behaviour is likely to be particularly seriouswhere some allocations have been made to return politicalor other favours, or where defaulting has been tolerated inthe past or used as a political weapon – for example,apartheid South Africa. More importantly, perhaps, theseearly projects had almost no positive effect on the ability ofthe municipalities to manage urban programmes as theirstaff had been bypassed in the planning, financing andimplementation, which were conducted by a speciallyrecruited team only tangentially attached to the municipalcouncils. However, the negative effect on municipalities wasoften felt through the ‘diversion of scarce talent to a smallenclave of public programmes’ that were not managed bythe municipality in which they took place.35
The great majority of citizens – those outside theproject ‘fence’ in the cities affected, those not finding workin the project, and those living elsewhere in the country(including the rural areas) – benefited hardly at all. Indeed,it is likely that they experienced poorer conditions than theycould have done if the resources had been used differently,rather than being concentrated on the projects. Most peoplein the countries affected could, therefore, be excused forfeeling it was all a waste of money that could have beenbetter spent helping each qualifying household a little,instead of giving a windfall to a few. Furthermore, largeamounts of subsidized dwellings in particularneighbourhoods may well have had a depressing effect ongeneral housing values.36 The inescapable reality is that mostpeople living in poverty did not benefit from the project-based approach at all. Indeed, its poverty alleviation focuswas probably subsumed, in implementation, by the impetusto complete the project on time within budget, and todemonstrate that the approaches worked and could bereplicated, even though they did not reach those in thelowest income groups.
Towards financial sustainability: the 1980s
The 1980s were a period of change. The projects of the1970s were subject to detailed analysis, both withininternational funding institutions37 and from outside,38 andlessons had been learned. For example, for all the effortsaimed at improving housing, the existence of un-servicedinformal settlements appeared to be continuing; indeed,they appeared to be expanding rather than in decline. Thelimitations found in the project approach included the
The 1980s saw‘step-by-step moves
towards a morecomprehensivewhole-housing
sector approach’
23Shelter policy and finance: retrospective overview

following: that they had a low impact on overall urbaneconomic development; that they encouraged institutionalreforms only in those organizations implementing theprojects; and that the funder’s funds were restricted to‘retail’ rather than ‘wholesale’ roles.39 The 1980s saw ‘step-by-step moves towards a more comprehensivewhole-housing sector approach’ in which evaluating existingprojects was as influential as general changes in policytowards housing and urban development.40
There was a perceived need to incorporate housingwithin the wider economic environment, rather than dealingwith it as a special sector requiring attention out of welfareconsiderations. It was recognized that the individual sites-and-services and slum upgrading projects alone could notaffect the growing housing need – a well-functioning financesystem for housing for the majority was necessary.
This generated a paradigm shift from multi-sectoral,but quite localized, projects, affecting a fortunate few, to anemphasis on creating a sustainable capability for housingsupply and urban development affecting most residents andcongruent with the overall policy and economicenvironment. The locus of borrowing changed from almostexclusively public-sector institutions to financialintermediaries. In parallel, attention shifted from thephysical asset financed to the institutional structure of theimplementing agency and its ability to mobilize thedevelopment required.41
Quite early in this period, as a way of countering theobvious problem that the components planned were notnecessarily the priorities for the recipients, the World Bankdeveloped programmatic projects in which the localmunicipalities and other institutions could propose sideprojects within an agreed range. The prototype for these wasBrazil’s Parana Market Towns Improvement Project,implemented between 1983 and 1988, in which a largenumber of municipalities could compete for investmentsaccording to local priorities. This project demonstrated earlysuccess in proliferating urban projects and targeting themto the sectors in which there was local need.
� Structural adjustment: towards macroeconomic orthodoxy
During the early 1980s, World Bank loan financing was madeavailable to enable governments to recover from years ofdecline through structural adjustment programmes (SAPs).Indeed, for many countries, the SAP was imposed as acondition on other loan finance. It consisted of, among otherthings, a reduction in government and quasi-governmentagencies, a reduction in public spending, and theintroduction of markets in the supply side of housing andurban development. The purpose of SAPs was to:
• introduce economic reforms and reduce balance ofpayments deficits;
• reduce public expenditure to more manageable levels;and
• carry out medium-term reforms to improve exportsand growth.
SAPs were intended to integrate local economies within theinternational trade and finance systems and to establishbalance between state and market roles.42 The advocates ofthis approach saw the free market as the means of improvingefficiency and injecting dynamism into the economy. Thestate’s role was that of enablement: securing privateproperty rights; reducing regulations in inhibited markets;achieving macroeconomic stability; developing financecapital markets; and providing sector policies andinstitutional frameworks for effective development.43
There was a perceived need to be involved in thepromotion of sound financial institutions in the borrowingcountries, in which housing finance was seen to be a part.44
Public institutions were the target provider. At the same time,there was a change in attitudes towards subsidies. It wasbelieved that they should be reduced, effectively targeted andchanged from financial (money up front) to fiscal (tax breaksor credits). This occurred in parallel with structuraladjustment in the wider economic and financial context.
Structural adjustment has often been seen asultimately unhelpful to the countries upon which it wasimposed. It frequently resulted in a reduction of formal-sector employment without enough alternative employmentopportunities, and the social welfare protection introducedin mitigation programmes was often insufficient. It focusedupon exports; but Organisation for Economic Co-operationand Development (OECD) countries did not lift tariff andquota restrictions to allow the exports to compete on equalterms in the world market.
Externally supported projects at the time channelledhousing and urban loans into housing finance institutionsand municipal development funds, where they would bedisbursed more widely and quickly than could geographicallydelineated inputs.45 A key objective of projects promoted bythe World Bank was financial sustainability – creatinghousing finance systems that fitted into a generally soundand sustainable financial sector.
In the housing sector, the direct results of SAPs wereoften some or all of the following:
• development of housing finance capital markets,including intermediaries capable of offeringmortgages to middle- and low-income households;
• deregulation of interest rates on loans;• collapse of uncompetitive housing finance
institutions;• curbing of public expenditure, which often cut
infrastructure programmes and maintenance;• taking direct provision away from the state in favour
of private developers and NGOs; and • diversion of investment from construction into other,
so-called ‘more productive’, export-orientatedsectors.46
The shift from project-orientated lending to lending forhousing finance brought about a major shift in the scale ofloans. World Bank project averages rose from US$19 millionduring 1972–1975 to US$211 million during 1985–1990.At the same time, there was an increasing number of loans
It was recognizedthat a well-functioning housingfinance system forthe majority wasnecessary
24 Economic and urban development context
and a larger share of lending to housing and municipalfinancing. From 1986–1991, housing and related residentialinfrastructure (about 70 per cent of urban lending) rangedfrom 3 to 7 per cent of World Bank lending and averagedUS$900 million annually.47 However, at the same time, thecountries assisted by the financial-sector loans tended to bebetter off than those assisted in the project-based phase.48
� The birth of the enabling strategy:the mid 1980s
One significant review of housing policy transition arguesthat there was a fulcrum of policy change during 1985 to1987, a mid point between the two major United Nationsconferences.49 It was a time when the in-depth reflectionon the accumulated experience in the shelter sector wasbringing improved understanding and there was discussionof the way forward in several influential documents. Therewas also advocacy arising out of the 1987 International Yearof Shelter for the Homeless.50 Self-help was then seen asprovisional, evolving from sweat equity to contracting ofconstruction professionals.51 Furthermore, by the end ofthis short period, the enabling approach had been puttogether and launched on the international agenda. Asmentioned earlier, the 1980s saw ‘step-by-step movestowards a more comprehensive whole-housing sectorapproach’ in which evaluating existing projects was asinfluential as general changes in policy towards housing andurban development.52
The Global Report on Human Settlements 1986introduced the enabling approach as a development from theproject-based approach towards settlement-wide,participatory action aimed at reducing the ring-fenced effectsof the earlier projects and allowing all to enjoy better housingconditions.53 It was clear that there was an inescapable needto scale up activities to meet the needs of the very largenumbers of people living in poverty. It was also becomingobvious that whole housing sector development dependedupon how well the economic, financial, legal and institutionalenvironment supported it.54
The enabling approach treats housing and urbandevelopment as a multi-sectoral issue, affected just as muchby efficiencies and inefficiencies in finance as in theconstruction industry or land-tenure systems, or theregulatory framework. The task of the state is to create thelegal, institutional and economic framework for economicproductivity and social effectiveness, in which efficientsettlement development can then flourish.
The enabling approach calls for a housing policyenvironment that oversees and regulates the sector, with thegovernment not supplying housing directly, but leavingactual production and delivery of housing to the housingmarket, in which all ‘actors’, ranging from large formal-sectordevelopers through artisans and individual households, tovoluntary community organizations, involve themselves attheir most effective level in the production process. Theenabling approach replaces the interventionist provision ofpublic housing by the state, which presupposes that thegovernment and its agencies are the best actors to supplythe kind of housing that society should have.
In the World Bank’s 1993 housing sector paper, whichreflected many aspects of its urban policy document of1991, the enabling approach was introduced in some detailin the context of overall financial markets.55 Both sectorpapers emphasized enablement approaches, the sectors’contributions to general macroeconomic development, andthe acceptance of pro-poor policies, including targetedsubsidies.56 There was also a recognition that most housingand infrastructure loan programmes required a mix ofmarket, state, voluntary sector and household roles,especially in recognizing that each may be most effective ata particular level.
In order to enable housing provision, the six inputs(five markets and one intervention) in the housing supplysystem should be freed up to operate effectively. The sixinputs are: land; finance; construction industry/labour;building materials; infrastructure; and the regulatoryframework. The argument is that removing bottlenecks fromeach of these will enable housing supply at the requisitescale and variety for urban development to effectivelyaccommodate the people. For example, if finance is easilyavailable but construction materials are in short supply, extrafinancial inputs to end-users might only raise the price ofmaterials. What may be needed more is investment inbuilding materials supply.
It is vital for the enabling approach to shelter that awide range of non-state actors are willing and able to produceand market housing, and to undertake essential support rolesin the housing process, such as facilitating the flow ofhousing inputs, organizing communities and operatingservices. These non-state actors include the commercialprivate sector (such as developers/real estate agents andbanking/finance institutions) and, more importantly for theurban poor, NGOs, community-based and other socio-civicorganizations, as well as small-scale producers in the informalsector. Since each of these actors has distinct comparativeadvantages in housing, the goal of policy is to developpartnerships that complement their strengths andweaknesses. This will maximize their contributions andminimize costs to particular groups or to the city as a whole.Partnerships are thus fundamental to the enabling approachand to achieving adequate shelter for all.57
� Sustainability and the brown agendaThe mid 1980s also saw the birth of sustainability as anoverarching rubric for development activity. Following thefounding of the World Commission for Environment andDevelopment (WCED) in 1983, the Brundtland Reportdevised the now classic definition of sustainabledevelopment as meeting ‘the needs of the present withoutcompromising the ability of future generations to meet theirown needs’.58 From that time on, no agency could ignorethe need to consider environmental impact alongside thesocial and economic benefits of its projects. Shortly after,the 1992 United Nations Conference on Environment andDevelopment (UNCED, or the Earth Summit) in Rio deJaneiro agreed on Agenda 21. Its Chapter 7 dealt withhuman settlements, emphasizing the significance of urbanenvironments and community-based environmental planning
The enablingapproach treats
housing and urbandevelopment as a
multi-sectoral issue
25Shelter policy and finance: retrospective overview

and management. Housing, infrastructure and urbangovernance were firmly rooted into the sustainabilityagenda. An essential component of sustainability in humansettlements is equity in distribution, with particularemphasis on the low-income groups.
The most immediate and critical problemsconfronting developing country cities are the health hazardsderiving from inadequate water, sanitation, drainage andsolid waste services; poor urban and industrial wastemanagement; air pollution; accidents linked to congestionand crowding; occupation and degradation of marginal andsensitive lands; and the interrelationships between theseproblems. This aggregation of problems, which collectivelyconstitute the ‘brown agenda’, disproportionately affects theurban poor, who are most affected by ill health, lowerproductivity, reduced incomes and lowered quality of life.
Chapter 7 reiterates the overall objective of improvingthe social, economic and environmental quality of humansettlements and the living and working environments of allpeople, particularly the poor. Such improvement should bebased on technical cooperation activities, partnershipsamong the public, private and community sectors, andparticipatory decision-making by community and specialinterest groups.
At the same time, there was a realignment ofemphasis from the ‘ability to pay’ to ‘willingness to pay’ as aresult of economic analysis which found that the latterproduced much more accurate estimates in cost-recoverycalculations.59 Ability to pay depends particularly upon theeconomic conditions of the potential users and tends to beexpressed as a percentage of household income (forexample, 20 per cent for housing and 3–5 per cent for
water), although this can vary considerably depending uponthe nature of the local economy. Willingness to pay, on theother hand, represents perceived utility and benefit of aservice. Factors that are likely to affect willingness to payinclude household income; the potential of additionalincome or savings owing to the improved service; the leveland value of time saved; and the perceived convenience,reliability and quality of the improved service compared tothe old service.
� Whole-sector development: 1987 onwardsThe 1990s saw a consolidation of the sector-wide approachthat had emerged in the early 1980s in which major donorsstarted giving support in an agreed sector to be coordinatedby governments at local or national level (see Box 2.1) Thisshifted donor interventions from direct programmes, whichsuited the donor’s priorities, to supporting governments toimplement their own priorities.
Approaches range from a set of coordinated projects,to simply supporting a sector budget. This often occurredwithin a context in which governments agreed on corepoverty reduction strategy (PRS) principles within which todisburse funding. Assistance was then given to achieve:
• greater government ownership of reform anddevelopment programmes;
• increased government accountability;• development of sustainable capacity;• transparency and predictability of resource flows; and• maximum value for money and minimum transaction
costs.60
The focus moved from physical targets to broad institutionaldevelopment, including financially sustainable operation ofupgrading programmes. In parallel, the lending agenciesmoved away from a ‘retailing role’, involved in every detailof the project, to that of a ‘wholesaler’, with localmunicipalities or other institutions planning andimplementing the details within broad programmeparameters and demonstration of administrative capability.61
As in the Parana Market Towns Improvement Project, financewas awarded to an institution or consortium which thendisbursed its components to others. This represented a‘wholesaler’ to ‘retailer’ relationship that promised greaterefficiency. Loan conditions required ‘sustainable finance’,represented in cost recovery, and in the skilled managementof receipts and expenditures within a context of operationaleffectiveness. Members of the consortium (in the Paranacase, local governments and their communities) selectedtheir type of sub-projects, costed them, and rationalizedcommunity participation in the selection of priorities.62
The Global Strategy for Shelter
By 1990, the United Nations Centre for Human Settlements(UNCHS, now UN-Habitat) had formulated itscomprehensive ideas of housing reform and released theGlobal Strategy for Shelter to the year 2000.63 This had alaudable, but what is now recognized as an over-optimistic,
26 Economic and urban development context
Box 2.1 Seven-point conceptualization of whole-sector development
Sustainable development requires approaches that are integrated, reaching across sectors andtouching physical, economic and social activities and institutions. Such integrated approacheshave been promoted by major international organizations such as the United Nations systemand the European Union (EU).
In its 1993 housing sector paper, Housing: Enabling Markets to Work, the World Bankconceptualized whole-sector housing development as comprising seven components, three onthe demand side, three on the supply side and one appertaining to managing the sector:
Demand side
1 the development of property rights – for example, in regularizing tenure in squattersettlements and in removing rent controls;
2 the development of housing finance systems, especially mortgage finance;3 the targeting of subsidies;
Supply side
4 infrastructure provision for residential land development;5 the regulation of land and housing development, including introducing regulatory audits
to remove barriers to development;6 improved organization and competition in the building industry;
Managing the sector
7 appropriate institutionally loaded reform.
Source: World Bank, 1993; Pugh, 2001.

objective of ‘decent housing’ for all by 2000.64 Later in thedecade, this term was replaced by ‘adequate housing’; butthis was also defined in some detail in the Habitat Agendato include the physical conditions of the dwelling, itsservices, tenure security, location and many othercharacteristics.65 The need for adequate housing has alsobeen included in many United Nations summitrecommendations and closing declarations, includingUNCED in Rio de Janiero,66 the Social Development Summitin Copenhagen,67 the Fourth World Conference on Womenin Beijing,68 the United Nations Conference on HumanSettlements in Istanbul,69 as well as the Durban Declarationon Racism, Racial Discrimination, Xenophobia and RelatedIntolerance.70
The 1992 UNCED Earth Summit in Rio de Janeiroinfluenced both UNCHS (Habitat) and the World Bank. Asmentioned earlier, it included housing and urban policieswithin Chapter 7 of Agenda 21, its strategy for the 21stcentury. Sustainability is seen as a three-pronged approach,joining environmental, social and economic development inhousing and urban programmes. Agenda 21 called upon localgovernments to mobilize their communities for policyformulation and action plans for environmentalimprovement in Local Agenda 21s.
The Global Strategy for Shelter to the Year 2000(GSS) recognized that governments have an obligation toensure that an appropriate environment is created for themobilization of finance for housing. The objectives of suchan effort are to promote and mobilize savings, reduce costs,improve the efficiency of financial intermediation, and assistthe free movement of capital through the national economy.Housing finance reform, which is a key component of ashelter strategy, should be seen as part of a broad effort toreform and develop the financial sector.71
The GSS encouraged providers to reduce the cost ofhousing finance to the lowest possible level, but urged thatthe days of housing subsidies, artificially low interest ratesand political interventions to forgive defaults be left behind.Instead, government interventions should be consistentwith sound financial and economic principles throughprudent interventions in the deposit rate, servicing costs,cost of risk, risks of default, fluctuations in interest rates,liquidity and repayment. Personal savings should still be thecornerstone of housing finance for lower income groups andthese had to be mobilized as fully as possible.72
The GSS accepted that subsidies were necessary forsome groups, but called for ensuring that they provided thegreatest benefit to those most in need and treated equallythose in equal need. They should be targeted to deliver thegreatest possible benefit to their intended beneficiaries atthe lowest possible administration cost. In addition, theyshould not impose unacceptable costs on others, includinginstitutions.73 Whatever else subsidies are, they should fitinto an overall approach to social welfare for people living inpoverty.74
� Focus on building institutional capacity to develop housing and urban services
The new paradigm encouraged institutional reform anddevelopment. In contrast to the 1970s approach of bypassing
local institutions, sending signals that they wereuntrustworthy and less than competent, the new approachwas to uplift local institutions, affirming theirtrustworthiness and challenging them to be effective. Thiscoincided with the spread of decentralization of power fromthe centre to regions and municipalities, and the growth ofa local sense of responsibility for urban conditions. It alsogave local authorities a financial resource to draw upon in acontext where bond and financial securities markets wereoften undeveloped.77
Efforts to improve municipal government led to thesetting up of the Urban Management Programme (UMP) asa partnership between UNCHS (Habitat), now UN-Habitat(the executing agency), the World Bank (the associateagency), and the United Nations Development Programme(UNDP) (providing core funding, with various bilateraldonors, and monitoring) in 1986 (see Box 2.2)
The focus of the UMP echoes the more holistic, inter-agency approach which grew through the 1980s and therecognition that the future success of development mightrest in the cities of the world. The emphasis on assistingmunicipalities to carry out their functions effectivelyillustrates the shift from early project-based assistance toaddressing the core capabilities of public authorities andtheir citizens to improve service delivery and sustainability.
In 1999, the Cities Alliance was established as aglobal alliance of cities and their development partnerscommitted to improving the conditions of the urban poorthrough city development strategies and slum upgrading.Like the Urban Management Programme, it is a partnershipbetween the World Bank and UN-Habitat, with severalcountries and other agencies involved in funding. It worksin partnership with local authorities and nationalgovernments to, among other things, scale up solutionspromoted by local authorities to address the shelter needsof the urban poor, who are treated as partners, not problems.With respect to finance, it engages potential investmentpartners to expand the resources available to localauthorities and the urban poor, enabling them to build theirassets and income.78
A holistic approach to settlement upgrading,sometimes called ‘the Orangi model’ after a successfullyupgraded area in Karachi, Pakistan, has been replicated inseveral countries.79 The process adopted involves making
GSS recognized thatgovernments have
an obligation toensure that an
appropriateenvironment iscreated for themobilization of
finance for housing
27Shelter policy and finance: retrospective overview
Box 2.2 Urban Management Programme
The Urban Management Programme (UMP) was set up to strengthen the contribution thattowns and cities make towards economic growth, social development, reduction of povertyand the improvement of environmental quality. In its first few years, it was mainly notable forthe development of policy frameworks and discussion papers, especially on land and urbanenvironmental management. From 1992 onwards, it focused upon technical cooperation on ademand-driven basis from developing countries, managed through regional offices.75 It hasemphasized participatory urban governance, urban poverty alleviation, urban environmentalmanagement and, more recently, the shelter effects of HIV/AIDS, with gender as a cross-cuttingissue. Participatory decision-making processes have been institutionalized in participating citiesthrough 120 city consultations.The UMP’s way of working directly with cities, both in the cityconsultations and in its seven city development strategies,76 is in line with the climate ofdirectly funding existing local institutions.

know-how available to an organized community which hasits own leadership for negotiating policy and for mobilizinglocal people to take part in self-help activities. Choices aremade about the selection of affordable technology andresource allocation in water and sanitation services to bringhealth and economic benefits, including generatinginvestment in housing improvement. Sometimes acommunity will manage the infrastructure system orcontract with private or public sectors.80 Of course, themodel is implemented differently, and has differentoutcomes, depending upon political, cultural andprofessional factors in each place. In some projects, forexample, the communities expressed their rights and needsin a unified way, and this facilitated better results per unitinvested than in cases where political disputes arose amongresidents when deciding priorities for environmentalimprovements. Clearly, the ‘political’ realm can influencethe effectiveness of upgrading investments.
It is clear that this is fundamentally different from the1970s model used in Lusaka and elsewhere, where the onlychoices offered to the residents were the detailed routes ofthe already planned service lines, even though they wereexpected to expend time and energy in fitting the services.
The development of mortgage finance became a majorfocus for the World Bank’s interventions and influencedother international lenders. It was recognized that less than10 to 20 per cent of annual housing investment indeveloping countries was covered by mortgage finance. Overseveral decades, national banks and building societies hadto cope not only with the age-old problem of mortgagefinancing (lending over the long term while borrowing overthe short term – through deposit and current accountbalances), but many also had to endure political interferencein their business dealings. They were, typically, coerced intolending at fixed rates (often at negative real interest rates)and forgiving loans; as a result, they could not maintainliquidity. Thus, numbers of mortgages were very small andinstitutions were extremely risk averse, lending only to themost financially secure or politically favoured clients.
Reflecting the globalization beginning during the early1990s, the World Bank pointed out the need for housingfinance institutions to be able to compete for deposits andinvestments on equal terms with other financial institutions.Thus, lending must be at positive, real interest rates anddeposits should be of sufficient term to support long-termlending. Characteristics of lending should include:
• mortgage lending at variable rates and appropriateindexation;
• secure land tenure and property rights; and• enforceable foreclosure procedures.81
All of these are necessary to protect the lenders and toenable them to lend with some confidence.82
� Finance capital in developmentThe World Development Report of 1989 was devoted to therole of finance capital in development.83 Its key message wasthat effective growth and economic development dependedupon having financial systems that were effective in linking
markets and government agencies with the range of financialinstitutions and instruments. Gone were the days when itwas efficient to have low interest rates in some sectors. Ithad become clear from research that the formal-sectorfinancial institutions were fragmented, had liquidityproblems, could not effectively manage credit and interestrate risks and could not make their capital profitable.84
Moreover, and probably most importantly, they were involvedin only 20 per cent of housing. There was urgent need forreform to generate confidence in finance institutions bothamong potential customers and among the donor agencieswho would channel money through them.
During the 1990s, some developing countriesdeveloped proactive and well-integrated housing financepolicies and institutions. In this, they responded to theunprecedented rate of urban growth and changes in globalfinance markets. In addition, there was a recognition thatpurely government-managed finance institutions had failedin their laudable aims and had become bureaucratic,inefficient and prey to exploitation by insiders.
A 1999 study suggested that there were six broadcategories of housing finance systems in place, many ofwhich needed a range of reforms in order to make themmore effective (see Box 2.3).85
Countries with well-developed housing financesectors, primarily among middle-income developingcountries and some Asian countries, benefited from theinternational concentration on housing finance. Between1982 and 1992, the World Bank invested US$715 million inhousing finance institutions in Mexico, the Republic ofKorea and India. This included a US$250 million loan to theprivate-sector Housing Development and FinanceCorporation (HDFC) of India, with which it was able to takehousing credit lower down the distribution of householdincome. The new policy was an effort to improve theperformance of financial institutions by providing guaranteesto international investors similar to those of the HousingLoan Guaranty Scheme used by USAID, the USgovernment’s bilateral aid agency.86 Sri Lanka also receivedsignificant funds, which were then on-lent to local co-operative societies to boost its 2.5 million small loansprogramme.
However, some housing finance systems moved fromboom to bust, with serious local consequences. Oneexample was the Mexican housing finance system. Despiteno lack of interest by private builders, speculative housebuilding was severely limited in scope in Mexico until theend of the 1980s. However, liberalization of mortgage fundsfrom commercial banks and privatization of someinvestments related to payroll funds boosted the housingdevelopment industry so that private developers becameactive all across the country. During the early 1990s, aninflux of investment capital fuelled the mortgage market andincreased the impetus of the building boom, especially incondominiums, driving up land prices. This all crashed inDecember 1994, leaving mortgagees with un-payable debtsand negative equity in their homes. A special programmewas launched in 1996 to bail out the banks, which continueto loan to middle-income homeowners while the low-incomegroup is left to make its way in the informal sector.87
Economicdevelopmentdepends on efficacyof financial systems
28 Economic and urban development context
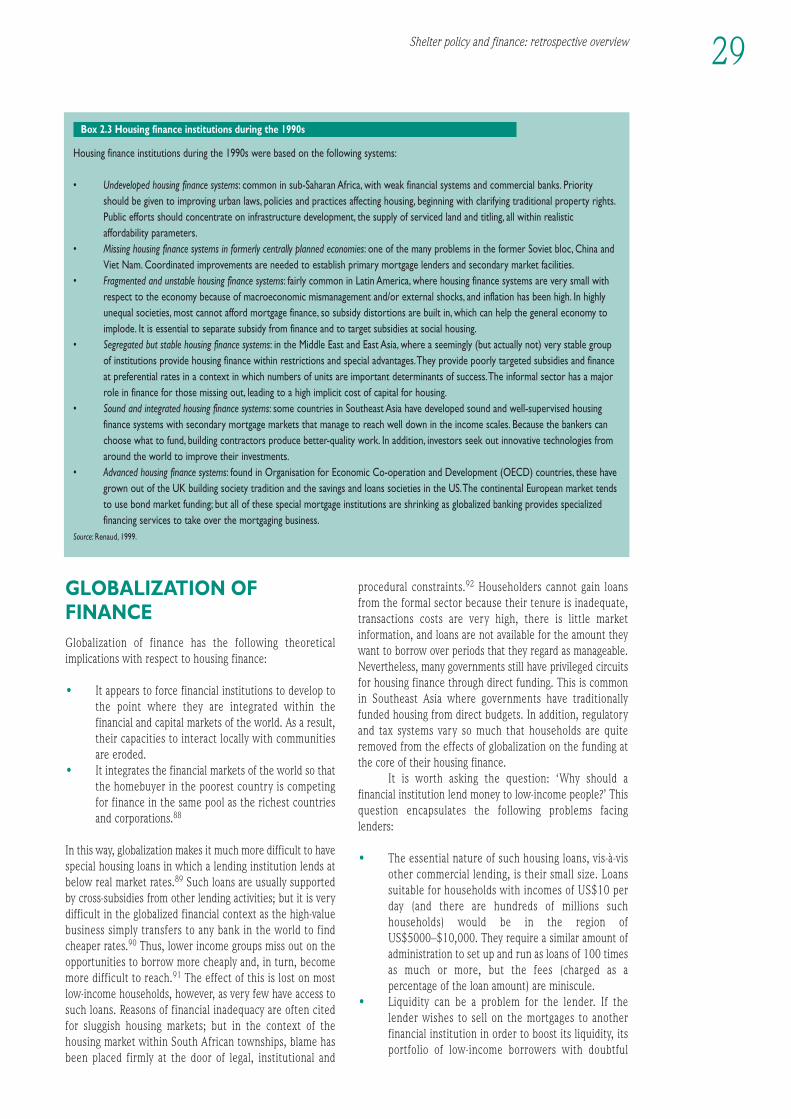
GLOBALIZATION OFFINANCEGlobalization of finance has the following theoreticalimplications with respect to housing finance:
• It appears to force financial institutions to develop tothe point where they are integrated within thefinancial and capital markets of the world. As a result,their capacities to interact locally with communitiesare eroded.
• It integrates the financial markets of the world so thatthe homebuyer in the poorest country is competingfor finance in the same pool as the richest countriesand corporations.88
In this way, globalization makes it much more difficult to havespecial housing loans in which a lending institution lends atbelow real market rates.89 Such loans are usually supportedby cross-subsidies from other lending activities; but it is verydifficult in the globalized financial context as the high-valuebusiness simply transfers to any bank in the world to findcheaper rates.90 Thus, lower income groups miss out on theopportunities to borrow more cheaply and, in turn, becomemore difficult to reach.91 The effect of this is lost on mostlow-income households, however, as very few have access tosuch loans. Reasons of financial inadequacy are often citedfor sluggish housing markets; but in the context of thehousing market within South African townships, blame hasbeen placed firmly at the door of legal, institutional and
procedural constraints.92 Householders cannot gain loansfrom the formal sector because their tenure is inadequate,transactions costs are very high, there is little marketinformation, and loans are not available for the amount theywant to borrow over periods that they regard as manageable.Nevertheless, many governments still have privileged circuitsfor housing finance through direct funding. This is commonin Southeast Asia where governments have traditionallyfunded housing from direct budgets. In addition, regulatoryand tax systems vary so much that households are quiteremoved from the effects of globalization on the funding atthe core of their housing finance.
It is worth asking the question: ‘Why should afinancial institution lend money to low-income people?’ Thisquestion encapsulates the following problems facinglenders:
• The essential nature of such housing loans, vis-à-visother commercial lending, is their small size. Loanssuitable for households with incomes of US$10 perday (and there are hundreds of millions suchhouseholds) would be in the region ofUS$5000–$10,000. They require a similar amount ofadministration to set up and run as loans of 100 timesas much or more, but the fees (charged as apercentage of the loan amount) are miniscule.
• Liquidity can be a problem for the lender. If thelender wishes to sell on the mortgages to anotherfinancial institution in order to boost its liquidity, itsportfolio of low-income borrowers with doubtful
29Shelter policy and finance: retrospective overview
Box 2.3 Housing finance institutions during the 1990s
Housing finance institutions during the 1990s were based on the following systems:
• Undeveloped housing finance systems: common in sub-Saharan Africa, with weak financial systems and commercial banks. Priorityshould be given to improving urban laws, policies and practices affecting housing, beginning with clarifying traditional property rights.Public efforts should concentrate on infrastructure development, the supply of serviced land and titling, all within realisticaffordability parameters.
• Missing housing finance systems in formerly centrally planned economies: one of the many problems in the former Soviet bloc, China andViet Nam. Coordinated improvements are needed to establish primary mortgage lenders and secondary market facilities.
• Fragmented and unstable housing finance systems: fairly common in Latin America, where housing finance systems are very small withrespect to the economy because of macroeconomic mismanagement and/or external shocks, and inflation has been high. In highlyunequal societies, most cannot afford mortgage finance, so subsidy distortions are built in, which can help the general economy toimplode. It is essential to separate subsidy from finance and to target subsidies at social housing.
• Segregated but stable housing finance systems: in the Middle East and East Asia, where a seemingly (but actually not) very stable groupof institutions provide housing finance within restrictions and special advantages.They provide poorly targeted subsidies and financeat preferential rates in a context in which numbers of units are important determinants of success.The informal sector has a majorrole in finance for those missing out, leading to a high implicit cost of capital for housing.
• Sound and integrated housing finance systems: some countries in Southeast Asia have developed sound and well-supervised housingfinance systems with secondary mortgage markets that manage to reach well down in the income scales. Because the bankers canchoose what to fund, building contractors produce better-quality work. In addition, investors seek out innovative technologies fromaround the world to improve their investments.
• Advanced housing finance systems: found in Organisation for Economic Co-operation and Development (OECD) countries, these havegrown out of the UK building society tradition and the savings and loans societies in the US.The continental European market tendsto use bond market funding; but all of these special mortgage institutions are shrinking as globalized banking provides specializedfinancing services to take over the mortgaging business.
Source: Renaud, 1999.

collateral and poor security is unattractive in financialmarkets.
It is partly because of these problems that sheltermicrofinance and community funding solutions haveemerged, especially in developing countries (see Chapters 6and 7).
THE NEW MILLENNIUM:POLICIES ANDORGANIZATIONS INSHELTER AND URBANDEVELOPMENTThe new millennium started with a very different climate ofshelter and urban finance from that which appertained 20years ago. During the early 1980s, large formal financialinstitutions were the main partners for international fundersand lending was banker led; secondary mortgage marketswere also seen to be the way forward and were thought tobe able to reach as far down the income scale as bankerscould countenance. Lending to low-income households wastoo risky a proposition for most banks.
The low-income worker’s role in housing finance wasoften only to contribute to a compulsory savings scheme.However, all but a lucky few of the poor were untouchedby the efforts of international and bilateral finance forhousing and urban development. Municipalities werebeginning to be trusted; but there was little effort to involveelected representatives who actually voted on resourceallocation.
In the new millennium, formal bank financing is onlyone of several players in the field. Mortgage finance isavailable in most countries, but its limitations are obviouslymilitating against its being the solution for most low-incomehouseholds. Microfinancing has progressed from being onlyenterprise focused to being an important feature of thehousing finance system. The savings and loans system, whichcontains within it the tradition of regular meetings of savers,establishing social links, is an important community builderas well as financial resource. Community grassroots activitiesare now centre stage in at least some countries in settingthe agenda and disbursing the funding. They are reachingpeople at such low-income levels and in such large numbersthat other systems can only dream of.
The Habitat Agenda
Just before the turn of the millennium, the Global Strategyfor Shelter to the Year 2000 and Agenda 21, Chapter 7, wereconsolidated into the Habitat Agenda at the Istanbul Summitin 1996. It reflects the essence of both previous documentsand provides a basis for international and national housingand urban development policy for the 21st century (see Box2.4).
Reaching the lowest income groups:community-based finance
There is no hiding from the unpalatable truth that formalhousing finance institutions cannot address the needs ofhundreds of millions of households whose incomes are low.Their assets are just too small and too insecurely held forthe formal sector to bother with them or to feel secure inhanding out funds to them. Even when formal housingfinancing is deepening and widening, a majority ofhouseholds still do not meet the assets and collateralconditions of formal-sector lenders. Formally constitutedmicrofinance organizations have been successful in fundingmany low-income households, especially through grouploans; but even they are by no means universally distributed.
Only the most flexible housing finance organizationswill directly help some of the poorest people in society, andeven they will not reach the many millions of householdswho find any expense above actual survival difficult. The riseof community-based organizations (CBOs) involved inproviding loans to people living in poverty has been animportant feature of the last decade. Perhaps equallyimportant has been the setting up of national andinternational umbrella organizations to enable and assisttheir operations, such as Shack/Slum Dwellers International(SDI) and the Society for the Promotion of Area ResourceCentres (SPARC) in India. These can negotiate directly withthe World Bank and bilateral agencies to borrow largeamounts of money at favourable rates for onward lending totheir member organizations, who can then use it inpartnership with their clients, the households living inpoorly serviced and ill-constructed housing and places withlittle security. They can also have access at the highest levelto policy-makers in the United Nations system and nationalgovernments.93 Because of the scale of their groups, and thelinks with major funders and policy-makers, internationalgrassroots networks have become major forces at theinternational level on behalf of people living in poverty andare changing the way in which funding is offered and how itis disbursed.
This grassroots movement has introduced a newdimension to the financing of housing and urbandevelopment. Probably for the first time, the people who arethe ultimate beneficiaries of major international loans are inthe driving seat, determining how the money should bespent and organizing others to do the same. These morerecent shelter financing approaches are discussed in detailin Part II of this Global Report, alongside reviews of thecurrent status of mortgage finance and social housingapproaches.
The right to housing
During the 1990s, the need to ensure adequate housingbecame the right to adequate housing. This had already beenon the agenda since it was included in Article 25 of the 1948Universal Declaration of Human Rights.94 During the late1980s, it appeared again in the United Nations GeneralAssembly, which reiterated:
Mortgage finance isavailable in mostcountries, but itslimitations areobviously militatingagainst its being thesolution for low-income households
30 Economic and urban development context

… the need to take (at national andinternational levels) measures to promote theright of all persons to an adequate standard ofliving for themselves and their families(including adequate housing) (Resolution42/146).95
It was also reaffirmed in the Vienna Declaration on HumanRights, which emphasizes:96
… the rights of everyone to a standard of livingadequate for their health and well-being,including food and medical care, housing andthe necessary social services.
The Istanbul Human Settlements Summit further reinforcedthe:
… commitment to the full and progressiverealization of the right to adequate housing asprovided for in international instruments. Tothat end, we shall seek the active participationof our public, private and non-governmentalpartners at all levels to ensure legal security oftenure, protection from discrimination andequal access to affordable, adequate housing forall persons and their families.97
The ‘progressive legal obligation’ stance is enshrined in thecornerstone of the International Covenant on Economic,Social and Cultural Rights, which urges all states to makeevery effort towards ‘achieving progressively the fullrealization’ of the rights in the covenant.98 However, thisdoes not mean that states can wait until economic orfinancial conditions make fulfilment of housing rights morestraightforward. Indeed, all states are expected to providefor at least a minimum essential level of each right such thata state in which ‘any significant number of individuals isdeprived of basic shelter is prima facie failing to perform itsobligations under the covenant’.99
Any retrogressive measures, such as forced evictions,are violations of the right to housing. Indeed, states have aduty to respect, protect and fulfill housing rights. Respectingobligates the state not to do anything that violates rights;protecting obligates the state to prevent any other agencyfrom violating people’s right to housing; and fulfillingincorporates obligations both to facilitate (or enable) throughnational housing policies and to provide for those for whomhousing is impossible within their own resources.100 Thelatter is important to the financing of urban shelterdevelopment.
None of this embodies a state obligation to provideeveryone with free housing, but rather to set up the legal,social and economic environment in which households havean adequate chance to fulfil their needs. An example of theoutworking of this can be found in South Africa, where thenew state constitution was being drafted at this time.101 Init, the state must take ‘reasonable legislative and othermeasures, within the available resources, to achieve the
progressive realization of the rights’.102 This has been testedthrough the legal campaign of displaced people in thecelebrated Grootboom versus Oostenberg Municipality case(see Box 2.5).103
CONCLUDING REMARKSDespite many changes in emphasis, international andnational efforts in housing finance have failed to reach themajority of households. Housing finance from internationalinstitutions began by encouraging projects aimed atimproving housing in selected areas and for particulargroups, primarily to discourage the growth of poorconditions in low-income neighbourhoods. Such finance wasnarrowly focused but had a catalytic purpose: to spread toother areas and groups until all were assisted. However,
31Shelter policy and finance: retrospective overview
Box 2.4 Commitments on shelter finance, Habitat Agenda, 1996
On finance, paragraph 47 of the Habitat Agenda commits member states to:
… strengthening existing financial mechanisms and, where appropriate, developinginnovative approaches for financing the implementation of the Habitat Agenda, whichwill mobilize additional resources from various sources of finance – public, private,multilateral and bilateral – at the international, regional, national and local levels, andwhich will promote the efficient, effective and accountable allocation and managementof resources, recognizing that local institutions involved in microcredit may hold themost potential for housing the poor.
Paragraph 48 also commits member states to:
(a) [Stimulating] national and local economies through promoting economicdevelopment, social development and environmental protection that will attractdomestic and international financial resources and private investment, generateemployment and increase revenues, providing a stronger financial base to supportadequate shelter and sustainable human settlements development.
(b) [Strengthening] fiscal and financial management capacity at all levels, so as to fullydevelop the sources of revenue.
(c) [Enhancing] public revenue through the use, as appropriate, of fiscal instrumentsthat are conducive to environmentally sound practices in order to promote directsupport for sustainable human settlements development.
(d) [Strengthening] regulatory and legal frameworks to enable markets to work,overcome market failure and facilitate independent initiative and creativity, as well asto promote socially and environmentally responsible corporate investment andreinvestment in, and in partnership with, local communities and to encourage a widerange of other partnerships to finance shelter and human settlements development.
(e) [Promoting] equal access to credit for all people.
(f) [Adopting], where appropriate, transparent, timely, predictable and performance-based mechanisms for the allocation of resources among different levels ofgovernment and various actors.
(g) [Fostering] the accessibility of the market for those who are less organized andinformed or otherwise excluded from participation by providing subsidies, whereappropriate, and promoting appropriate credit mechanisms and other instruments toaddress their needs.
Source: United Nations, 1996b.

replicability turned out to be a chimera; projects did notgenerally provide a way forward for everyone, nor did theychange the way in which housing was provided. Indeed, thepace of informal urbanization quickened and was patentlyuntouched by international financing.
Multi-sectoral approaches followed, out ofrecognition that housing is only one of a group of interlinkedsectors affecting the lives of city dwellers. In addition, the
importance of the market as a context and a driver of urbandevelopment and housing dominated international and manynational interventions through the final decade of the 20thcentury. However, only a few million households havebenefited; the majority still have to provide their ownhousing without assistance from market lenders.
The growth of monitoring tools is probably one of themost important developments in housing finance since it haschanged the way in which proposals are viewed. Once, toassist 250 households was sufficient cause for action, nomatter what effect it might have on the ability of others tobe assisted. With initiatives such as poverty reductionstrategy papers (PRSPs) and the Millennium DevelopmentGoals (MDGs), targets are visible and can be monitored.Interventions can, therefore, be judged against the largercontext, diluting the impressiveness of tightly drawnprojects and promoting programmes that are available to awide spectra of the population.
Similarly, there has been a long-term switch from top-down, imposed projects, in which participation was minimal,to community-led programmes in which people decide howhousing finance institutions can help them and lobby for thatassistance. This change has been facilitated by the growthof NGOs, through whom large quantities of finance werechannelled during the last few years of the 20th century.However, there has also been a recent revival of channellingfinance through governments, including local authorities, asan encouragement of, and response to, improvements intransparency and democracy. Chapter 3 turns to a review ofrecent financing developments at the urban local authoritylevel.
32 Economic and urban development context
1 This chapter is based on adraft prepared by GrahamTipple, University of Newcastleupon Tyne, UK.
2 Harris and Arku, 2004.3 Harris and Arku, 2004.4 Fry and Drew, 1964;
Koenigsberger, 1973.5 Abrams, 1964, p60.6 The Schokbeton scheme in
1950s Gold Coast stands as afarcical waste of resourcesabandoned following UnitedNations advice (Abrams, 1964),although the dwellings built stillstand.
7 Schumacher, 1973.8 Hart, 1973; ILO, 1972.9 Harris and Arku, 2004.10 Turner, 1968, 1972, 1976.11 Burgess, 1982;Ward, 1982;
Burgess, 1985.12 For a discussion of the way in
which central and localgovernment in Zambia movedfrom being in the forefront ofpositive attitudes towardssquatter settlements and theirupgrading to having a negativeview of the informal-sectorbuilt environment only adecade later, see Kasongo andTipple, 1990.
13 Tipple, 1988.14 Malpezzi et al, 1990; Malpezzi
and Ball, 1991.15 Kessides, 1997.16 UN, 1976.17 Kim, 1997.18 Pugh, 1995.19 Turner, 1967, 1972.20 Kessides, 1997.21 Kessides, 1997.22 As observed by Martin (1983),
one of the main reasons foremploying skilled workers wasto improve the quality ofconstruction and, therefore,the status of its owner.
23 Keare, 1983.24 Keare, 1983.25 Laquian, 1983b.26 Laquian, 1983b.27 Jiminez, 1982.28 Buckley and Mayo, 1989.29 Kessides, 1997.30 This is a reasonably consistent
finding in work in Ghana over20 years, and in work on user-initiated extension activities inseveral countries. See Tipple etal, 1999;Tipple, 2000.
31 Rakodi and Lloyd-Jones, 2002.
32 Gilbert, 2000; Napier et al,2003.
33 Tipple, 1994.34 Martin, 1983.35 Renaud, 1999, p759.36 This, however, might have much
less effect in developingcountries where fewhomeowners consider selling(Gilbert, 1999) than it wouldhave in an industrializedcountry with a lively market inhousing.
37 For example, Keare and Parris(1982),World Bank (1983) andnumerous papers and reportsemanating from the researchteam in the Infrastructure andUrban Department – forexample, see Malpezzi and Ball,1991.
38 For example, Laquian, 1983a;Skinner and Roddell, 1983;Rodwin and Sanyal, 1987.
39 Pugh, 2001, p409.40 Pugh, 2001, p410.41 Buckley, 1999.42 Pugh, 1995.43 Pugh, 1995.44 World Bank, 1993.45 Pugh, 2001.46 The argument that housing
construction is economicallyproductive has been well madein earlier United Nationsdocuments, especially UNCHSand the International LabourOrganization (ILO)(UNCHS/ILO, 1995), and inother literature (for example,Tipple, 1995).
47 World Bank, 1993.48 World Bank, 1993.49 Pugh, 1997.50 Including the first Global Report
on Human Settlements 1986(UNCHS, 1987).
51 Pugh, 1997.52 Pugh, 2001, p410.53 UNCHS, 1987.54 Pugh, 2001.55 World Bank, 1993, 1991.56 Pugh, 2001.57 UNCHS, 1993, 1997, 1998;
Porio, 199858 WCED, 1987.59 For example, by Whittington et
al, 1990.60 DFID, 2004a.61 Pugh, 2001.62 Pugh, 2001.63 UNCHS, 1990a.64 Pugh, 2001.
Box 2.5 Housing rights in South Africa
In the final hearing of the Grootboom versus Oostenberg Municipality case, the South AfricanConstitutional Court ruled that it was not for the judiciary to enquire whether bettermeasures could have been adopted to provide adequate housing, but rather to determinewhether or not the state had violated the right of access to housing of the people concerned.In determining the ‘reasonableness’ of the measures taken by the state, it is right to take intoaccount the resources it has at its disposal.The constitution does not expect more than thestate can afford and felt that its housing programme was, so far, a major achievement andrepresented a systematic response to a pressing social need.The overall programme was,indeed, aimed at realizing access to housing for all in the long and medium term. However, thecourt found that the state had neglected the short-term aspect. It was clear that no real policyexisted which could be applied to people in need of housing in crisis situations. Apart from thenormal channel of applying for low-cost housing, which normally takes years, there was norelief for Mrs Grootboom, her children and her neighbours.There was no provision in anypolicy, whether national, provincial or local, that applied to her desperate situation.Thus, theyordered that ‘second-best’ facilities, falling short of acceptable housing standards, butnevertheless a basic form of shelter, should be provided for the displaced people. However, thiswas not to be seen as a licence for people to jump the housing queue by squatting and thenlitigating for their rights.Source: UN-Habitat, 2002
NOTES
65 UNCHS, 1996a.66 UN, 1992.67 UN, 1995b.68 UN, 1995a.69 UN, 1996b.70 UN, 2001a.71 UNCHS, 1990b, pp18–19.72 UNCHS, 1990b.73 Too many institutions who
have given subsidies have beenfatally damaged by thislargesse, often imposed uponthem by government.
74 UNCHS, 1990b.75 McAuslan, 1997.
76 In Bamako, Mali; Cuenca,Ecuador; Colombo, Sri Lanka;Johannesburg, South Africa;Santo Andre, Brazil; Shenyang,China; and Tunis,Tunisia.
77 Pugh, 2001.78 Cities Alliance, 2000.79 Pugh, 2001.80 These may require group
guarantees where foreclosureprocedures are weak.
81 World Bank, 1993.82 World Bank, 1989.83 World Bank, 1993, 1991.84 Renaud, 1984.85 Renaud, 1999.
86 Pugh, 2001.87 Connolly, cited in UNCHS,
2001.88 Tucker and Tomlinson, 2000.89 Kim, 1997.90 Especially those specializing in
high-value niche markets.91 Tucker and Tomlinson, 2000.92 Nell et al, 2004.93 Indeed, SDI was one of the
most influential voices inorganizing and hosting theMeeting of the World UrbanForum in Nairobi in 2002 andin Barcelona in 2004.
94 UN, 1948.95 UN, 1987.96 UN, 1993, para 31.97 UN, 1996b, para 8.98 UN, 1966,Article 2 (1).99 UN-Habitat, 2002, p21.100 UN-Habitat, 2002.101 Kabir, 2002.102 Republic of South Africa, 1996,
Article 26.103 Grootboom versus
Oostenberg Municipality,which became Government ofSouth Africa versusGrootboom 2000 (11) BCLR1169 (CC).
33Shelter policy and finance: retrospective overview
This chapter addresses the wide range of problems that facemunicipal authorities in financing urban development asthey respond to the challenges of major shifts in theireconomic base, resulting from falling trade barriers and aglobalizing economy. Concurrently, the devolution ofadministrative and financial responsibility from centralgovernments has forced them to finance a growingproportion of their recurrent and capital expenditures at atime when, in most countries, the urban population isexpanding rapidly. This chapter particularly highlights newand innovative approaches to financing urban development,as well as the contextual relevance of urban developmentfinance to finance for shelter development. At the core ofthis linkage is the fact that municipal finance plays a centralrole in providing citywide infrastructure services, includingwithin the slums that accommodate the majority of theurban population in developing countries.2 Indeed, withoutsuch services, it would be very difficult and expensive toimplement citywide slum upgrading programmes and, moregenerally, to improve access to adequate shelter for the vastmajority of the urban poor.
Municipalities are only one actor in the financing ofurban development; but in many ways they are the pivotalone because of their statutory powers and their ability toact on all sectors in a defined geographic space. Householdsand private enterprises are the developers and builders ofurban communities and the owners and operators ofeconomic activities. But unless the municipality can deliverto them the support infrastructure and services that theyneed, orderly development will be impaired. In developingcountries, the rapid pace of urbanization and large migratoryflows have increased the pressure on local governmentspending for urban development. In most of these countries,decentralization laws were enacted during the decades ofthe 1980s and 1990s amid fiscal deficits, financial crises andpolitical unrest, eroding local revenue and disrupting accessto funds for capital investment.
The chapter places emphasis on developing countries,where the challenges are the greatest and the resourceconstraints the most acute. They are the countries targetedby the Millennium Development Goals (MDGs) andassociated 2015 targets adopted in 2001.3 Multilateral andbilateral development organizations, as well as the individualstates, are placing a priority on poverty reduction,reaffirming the world commitment to addressing the
growing disparities in income and wealth among countriesand within countries. The success of these efforts hingesupon democratic local governance, partnerships involvingcommunities and stakeholders in urban developmentinitiatives, and strengthening of the capabilities andresources of local governments as the pivotal partners in thedevelopment process.
Although differences clearly exist betweendeveloping, transitional and advanced economies, there areequally striking differences within each region. A series ofcases presented in this chapter illustrates the range of issuesfaced by municipalities, how they have responded to them,their capacity to identify and work with strategic partners,the difficulties encountered and the results achieved. Thefact that countries in different parts of the world havedeveloped comparable approaches illustrates the emergenceof several important new trends: the broadening of locallygenerated revenue sources; the strengthening of localfinancial management; partnerships to finance capitalinvestments; and enhancement of access to long-term creditfor municipalities. The cases illustrate innovative approachesto address these challenges. Some have receivedinternational recognition as ‘best practices’.4
MUNICIPAL FINANCE ANDURBAN DEVELOPMENT:THEMAIN ISSUESIn advanced economies, the combination of strong local taxbases, structured central/local fiscal relations and well-targeted transfers give local governments the means to drivetheir own economic, social and physical development, topartner with private-sector entities on developmentinitiatives and to work with non-governmental organizations(NGOs) on social programmes. Their fiscal resources allowthem to access a variety of financing sources, ranging fromspecialized municipal credit institutions and privatelymanaged local development funds to commercial banks andinternational capital markets. Through strategic investments,they are able to manage growth patterns and improve theurban environment.
In transitional economies, the evolution of municipalfinance for urban development reflects the path followed by
Municipal financeplays a central rolein providingcitywideinfrastructureservices
C H A P T E R
FINANCING URBAN DEVELOPMENT 1
3
each country as it integrates within the global economy. Thesequencing of the reforms affecting legal and institutionalframeworks and economic sectors is of paramountimportance. Political, administrative and fiscaldecentralization, changes in public and private roles andresponsibilities, devolution of functional responsibilities,adjustments in central transfers, and privatization of landand property ownership all affect the capacity ofmunicipalities to deliver services and manage urbandevelopment, work with local communities and enter intopartnerships with the private sector. In general,municipalities have initiated jointly funded programmes withresidents and developers to improve infrastructure andhousing. Leading cities seek to compete in the regional andglobal economy. They strive to manage their financesresponsibly in order to attract private investors, obtaininvestment-grade credit ratings and access the capitalmarkets. Where local authorities are not empowered toborrow, as in China, they have found off-budget methodsand instruments to obtain the financing needed to drive andimplement urban development strategies and key projects.
In developing countries, municipal finance suffersfrom the fiscally destabilizing effects of asymmetricaldecentralization. Where devolution is proceeding accordingto a planned legal, institutional and regulatory framework,local authorities benefit from more predictable finances and,in many ways, greater discretion. Successive ad hocadjustments to correct fiscal imbalances tend to disruptmunicipal financial management. In all cases, localauthorities in developing countries lack the supportiveframework enjoyed by local governments in advancedeconomies. They have to be creative and experiment withinnovative approaches to meet their economic and socialobjectives, particularly in generating employment,expanding service delivery, upgrading the urbanenvironment and improving shelter conditions in poorercommunities.
In some developing countries, government-sponsoredmunicipal development funds have provided municipalitieswith resources for specific categories of projects, includingrevenue-producing services and infrastructure. Socialprogrammes continue to rely upon central funding and uponsupport from bilateral and multilateral organizations. Lack ofaccess to long-term financing hampers their ability to fundurban development and to finance the infrastructure servicesthat are so critical to shelter delivery. They are learning toseek partners and alliances, and the best managedmunicipalities have managed to launch and sustain initiativeswith higher levels of government, private businesses, NGOsand community-based organizations (CBOs), as well asbilateral and multilateral organizations.
In the poorer developing countries, local authoritiesdepend heavily upon central transfers to cover deficits intheir operating expenditures and upon grants from donorsto address their most pressing environmental and socialproblems. External funds are the main source of financingprojects to upgrade and expand infrastructure and urbanservices. Decentralization policies have devolvedfunctional responsibilities to them without providing them
with the fiscal resources needed to discharge thismandate.5 The general poverty of the population erodeslocal revenue, which relies upon a multiplicity of low-yieldtaxes and fees, cumbersome to manage and difficult tocollect. Municipal performance is further depressed bychaotic urbanization and the proliferation of informalactivities.6 The MDGs have opened up new opportunitiesfor poor countries to access funding through the HeavilyIndebted Poor Countries (HIPC) initiatives for social andenvironmental programmes. While municipalities canbenefit directly and indirectly from these financialresources, the lack of technical and managerial capacityhampers their ability to use efficiently the funding theyreceive, let alone to leverage the funds.
Around the world, globalization has aggravated unevenspatial distribution of economic activity and increaseddisparities in income and wealth among regions and countries,and within countries. These inequalities affect urban centres,with some benefiting from locational advantages while others,sometimes even close by, are bypassed by development. Theseimbalances are aggravated by the social dimension ofglobalization that has increased and concentrated poverty, ledto massive population movements, and reduced local revenuesbecause of the greater mobility of tax bases.7 Within theshelter sector, the unregulated acquisition of property rightsby outsiders has tended to constrict access to shelter by localpopulations.
Municipalities are hard pressed to find the resourcesneeded to finance urban development policies fosteringshelter delivery, poverty reduction and social inclusion. Thischallenge is further compounded by the growingconcentration of wealth in the private sector brought aboutby globalization, the concomitant retrenchment ofgovernmental expenditures, and the disengagement of theinternational community from urban issues in developingcountries. Municipalities have to learn to tap privateresources and access capital markets, both domestic andglobal, in order to fund the delivery of urban services andfinance urban development programmes.
NATIONAL MUNICIPALFINANCE SYSTEMSTwo key emerging issues are affecting municipal financesystems in both developed and developing economies. Thefirst is the progressive decentralization of the responsibilityfor infrastructure investment and the delivery of services tolocal governments, a trend that has increased their fiscalburden. In some countries, such as Brazil and Indonesia,municipalities have taken advantage of this new autonomyto develop innovative approaches – participatory budgetingin Porto Alegre and other Brazilian municipalities, and thematching grants provided by the central government toIndonesian municipalities that show good fiscal capacities,as well as meet specified need criteria. In other parts of theworld, overcoming a tradition of centralized administrationis proving difficult, particularly in many African and Asiancountries.
The MDGs haveopened up new
opportunities forpoor countries to
access fundingthrough the Heavily
Indebted PoorCountry (HIPC)
initiatives for socialand environmental
programmes
35Financing urban development
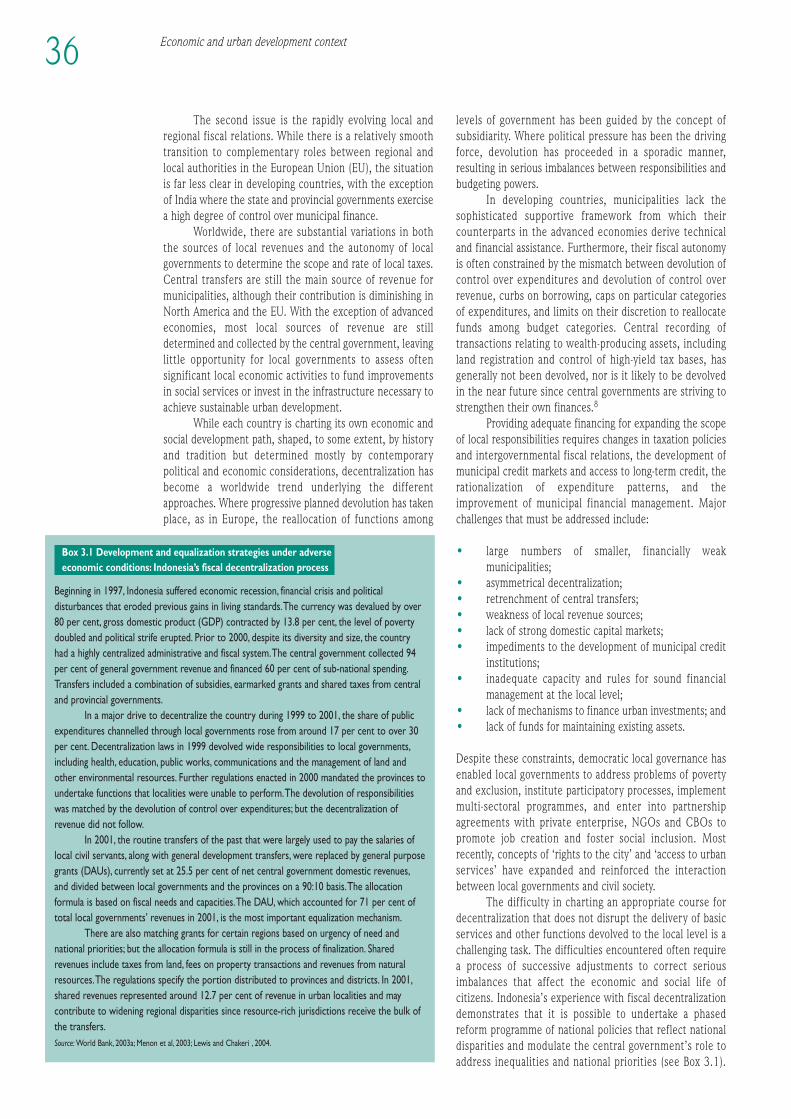
The second issue is the rapidly evolving local andregional fiscal relations. While there is a relatively smoothtransition to complementary roles between regional andlocal authorities in the European Union (EU), the situationis far less clear in developing countries, with the exceptionof India where the state and provincial governments exercisea high degree of control over municipal finance.
Worldwide, there are substantial variations in boththe sources of local revenues and the autonomy of localgovernments to determine the scope and rate of local taxes.Central transfers are still the main source of revenue formunicipalities, although their contribution is diminishing inNorth America and the EU. With the exception of advancedeconomies, most local sources of revenue are stilldetermined and collected by the central government, leavinglittle opportunity for local governments to assess oftensignificant local economic activities to fund improvementsin social services or invest in the infrastructure necessary toachieve sustainable urban development.
While each country is charting its own economic andsocial development path, shaped, to some extent, by historyand tradition but determined mostly by contemporarypolitical and economic considerations, decentralization hasbecome a worldwide trend underlying the differentapproaches. Where progressive planned devolution has takenplace, as in Europe, the reallocation of functions among
levels of government has been guided by the concept ofsubsidiarity. Where political pressure has been the drivingforce, devolution has proceeded in a sporadic manner,resulting in serious imbalances between responsibilities andbudgeting powers.
In developing countries, municipalities lack thesophisticated supportive framework from which theircounterparts in the advanced economies derive technicaland financial assistance. Furthermore, their fiscal autonomyis often constrained by the mismatch between devolution ofcontrol over expenditures and devolution of control overrevenue, curbs on borrowing, caps on particular categoriesof expenditures, and limits on their discretion to reallocatefunds among budget categories. Central recording oftransactions relating to wealth-producing assets, includingland registration and control of high-yield tax bases, hasgenerally not been devolved, nor is it likely to be devolvedin the near future since central governments are striving tostrengthen their own finances.8
Providing adequate financing for expanding the scopeof local responsibilities requires changes in taxation policiesand intergovernmental fiscal relations, the development ofmunicipal credit markets and access to long-term credit, therationalization of expenditure patterns, and theimprovement of municipal financial management. Majorchallenges that must be addressed include:
• large numbers of smaller, financially weakmunicipalities;
• asymmetrical decentralization;• retrenchment of central transfers;• weakness of local revenue sources;• lack of strong domestic capital markets;• impediments to the development of municipal credit
institutions;• inadequate capacity and rules for sound financial
management at the local level;• lack of mechanisms to finance urban investments; and• lack of funds for maintaining existing assets.
Despite these constraints, democratic local governance hasenabled local governments to address problems of povertyand exclusion, institute participatory processes, implementmulti-sectoral programmes, and enter into partnershipagreements with private enterprise, NGOs and CBOs topromote job creation and foster social inclusion. Mostrecently, concepts of ‘rights to the city’ and ‘access to urbanservices’ have expanded and reinforced the interactionbetween local governments and civil society.
The difficulty in charting an appropriate course fordecentralization that does not disrupt the delivery of basicservices and other functions devolved to the local level is achallenging task. The difficulties encountered often requirea process of successive adjustments to correct seriousimbalances that affect the economic and social life ofcitizens. Indonesia’s experience with fiscal decentralizationdemonstrates that it is possible to undertake a phasedreform programme of national policies that reflect nationaldisparities and modulate the central government’s role toaddress inequalities and national priorities (see Box 3.1).
36 Economic and urban development context
Box 3.1 Development and equalization strategies under adverse economic conditions: Indonesia’s fiscal decentralization process
Beginning in 1997, Indonesia suffered economic recession, financial crisis and politicaldisturbances that eroded previous gains in living standards.The currency was devalued by over80 per cent, gross domestic product (GDP) contracted by 13.8 per cent, the level of povertydoubled and political strife erupted. Prior to 2000, despite its diversity and size, the countryhad a highly centralized administrative and fiscal system.The central government collected 94per cent of general government revenue and financed 60 per cent of sub-national spending.Transfers included a combination of subsidies, earmarked grants and shared taxes from centraland provincial governments.
In a major drive to decentralize the country during 1999 to 2001, the share of publicexpenditures channelled through local governments rose from around 17 per cent to over 30per cent. Decentralization laws in 1999 devolved wide responsibilities to local governments,including health, education, public works, communications and the management of land andother environmental resources. Further regulations enacted in 2000 mandated the provinces toundertake functions that localities were unable to perform.The devolution of responsibilitieswas matched by the devolution of control over expenditures; but the decentralization ofrevenue did not follow.
In 2001, the routine transfers of the past that were largely used to pay the salaries oflocal civil servants, along with general development transfers, were replaced by general purposegrants (DAUs), currently set at 25.5 per cent of net central government domestic revenues,and divided between local governments and the provinces on a 90:10 basis.The allocationformula is based on fiscal needs and capacities.The DAU, which accounted for 71 per cent oftotal local governments’ revenues in 2001, is the most important equalization mechanism.
There are also matching grants for certain regions based on urgency of need andnational priorities; but the allocation formula is still in the process of finalization. Sharedrevenues include taxes from land, fees on property transactions and revenues from naturalresources.The regulations specify the portion distributed to provinces and districts. In 2001,shared revenues represented around 12.7 per cent of revenue in urban localities and maycontribute to widening regional disparities since resource-rich jurisdictions receive the bulk ofthe transfers.Source: World Bank, 2003a; Menon et al, 2003; Lewis and Chakeri , 2004.

SOURCES OF MUNICIPALFINANCEMunicipalities obtain their finance from a wide variety ofsources, but the main categories consist of financial transfersfrom the central government and locally generated revenue,including debt finance. Central government transfersaccount for the bulk of local resources in most countries,particularly for capital investments, and are usually based ona redistribution of certain centrally collected revenues: apartial redistribution of the value added tax (VAT),entitlement grants for recurrent expenditures, and grantsfor specific projects. These transfers bridge the gap betweenthe revenue-raising capacity of municipalities and mandatorylocal expenditures.
Locally generated revenues fall into three broadcategories: taxes on property and on economic activities;user fees for the delivery of services and the improvementof infrastructure; and loans borrowed to finance long-terminvestments, generally infrastructure. While well-managedmunicipalities maintain a proper balance among thesesources, the rapid urbanization that is taking place in mostof the world, institutional constraints and weak localmanagement have slowed the efforts of local governmentsto increase their financial autonomy as part of the devolutionof responsibility from the central to the local level.Increasing the yield of locally generated taxes is thereforethe key challenge faced by all developing economies. Theinability to do so is manifest in the fact that almost allmunicipalities operate at a deficit that is bridged by transfersfrom the central government.
Taxes on real property and, to a lesser extent,business activities are the major potential source of localrevenue. A combination of factors, ranging from technicalissues such as the lack of computerized databases tocomplex legal issues of property rights under traditional andmodern tenure patterns have suppressed the yield fromproperty taxes.9 Although they reflect the range of economicactivities found in a locality, these local revenues are oftenset at the national or regional level (as is the case in India),and may be collected by a central administration on behalfof the municipality. In several West African countries, aportion of the tax collected is retained by the centralgovernment. A variety of low-yield local taxes are also to befound, often the hold-overs from the colonial era.
The price structure of user fees reflects socialconsiderations and, for the most part, does not cover therecurrent costs of delivering the service, much less theamortization of its capital cost. As a result, most developedeconomies have moved towards more sophisticated means torecover a varying portion of the public costs induced byprivate development. They range from betterment taxes,assessed on either or both existing and new development, toexactions to fund social programmes. Since the mid 1980s,the proceeds of the linkage programme that mandatespayments by developers of larger commercial developmenthas financed both the construction of affordable housing andjob training for residents of lower income neighbourhoods inSan Francisco and Boston, US (see Box 3.2).
The financing of capital investments by issuing long-termbonds is a well-established practice in the developedeconomies and the trend is spreading to other parts of theworld, except in situations of high inflation, structuraladjustment or economic recession. However, access tofinancial markets, both domestic and international, requiresefficient municipal financial management and skills. Ininstances where municipalities are not allowed to borrow,ingenious alternative mechanisms have frequently been usedby separating revenue-producing activities from the generalbudget and allowing them to borrow against future revenue,as is the case with China’s special purpose vehicles (see Box3.3).
Transfers
The rising share of total public expenditures channelledthrough local authorities testifies to the expanding scope oftheir responsibilities. In Indonesia, local governmentexpenditures jumped from 17 per cent in 2000 to 28 percent of public expenditures in 2001 following the enactmentof decentralization laws. However, wide variations in levelsof decentralization and fiscal capacities among regions andwithin regions prevail: from under 5 per cent to over 15 per
37Financing urban development
Box 3.2 Linkage fees in Boston, US
In Boston, developers sign a Development Impact Project agreement with the BostonRedevelopment Authority for substantial real estate projects that require a zoning amendment.A linkage fee is levied on each additional square foot of floor space in excess of a 100,000square feet ceiling. In 2004, linkage fees equalled US$8.62 per square foot, out of whichUS$7.18 subsidize affordable housing and US$1.44 job training.This rate can be adjusted everythree years to follow inflation.The schedule of payments is spread out over 7 years fordowntown projects and 12 years for projects in other areas, and the fees are deposited in aspecial fund for affordable housing and training. Alternatively, developers may choose to buildaffordable housing projects or create a job training programme. Between 1987 and 2004,US$79.6 million were generated for housing through linkage, adding 7604 units to the city’shousing stock, 6116 of which were affordable.The programme generated US$15.2 million forjob training and awarded US$12.9 million to 190 different job programmes, such as school-to-work initiatives, family literacy or workplace-based education, creating over 1000 jobs.Source: Boston Housing Authority, 2000, 2002, 2004;Avault et al, 2000,Boston Municipal Research Bureau, 1998.
Box 3.3 The role of special purpose vehicles in China
In China, municipalities have no borrowing power and rely upon off-budget entities to obtainthe capital they need for investment, primarily in infrastructure.These special purpose vehicles(SPVs) are wholly owned companies operating on a quasi-commercial basis. SPVs raise funds byborrowing from state-owned banks and undertake investments on behalf of provincial andmunicipal authorities.The Shanghai Urban Development Investment Corporation (UDIC),owned by the city, has directly issued bonds to finance infrastructure projects on the financialstrength of the city authority.The implicit guarantee is that the city will not allow UDIC to fail.The bonds issued by a municipality are viewed as a contingent liability of the municipalauthority and are usually backed by municipal assets transferred to the SPV or by the revenuestream of a self-sustaining project.
Local authorities are prohibited from guaranteeing loans to SPVs, and the extent oftheir indebtedness is a major concern as China restructures its domestic financial markets andplays an increasingly bigger role in the international capital markets.Source: Serageldin et al, 2004.
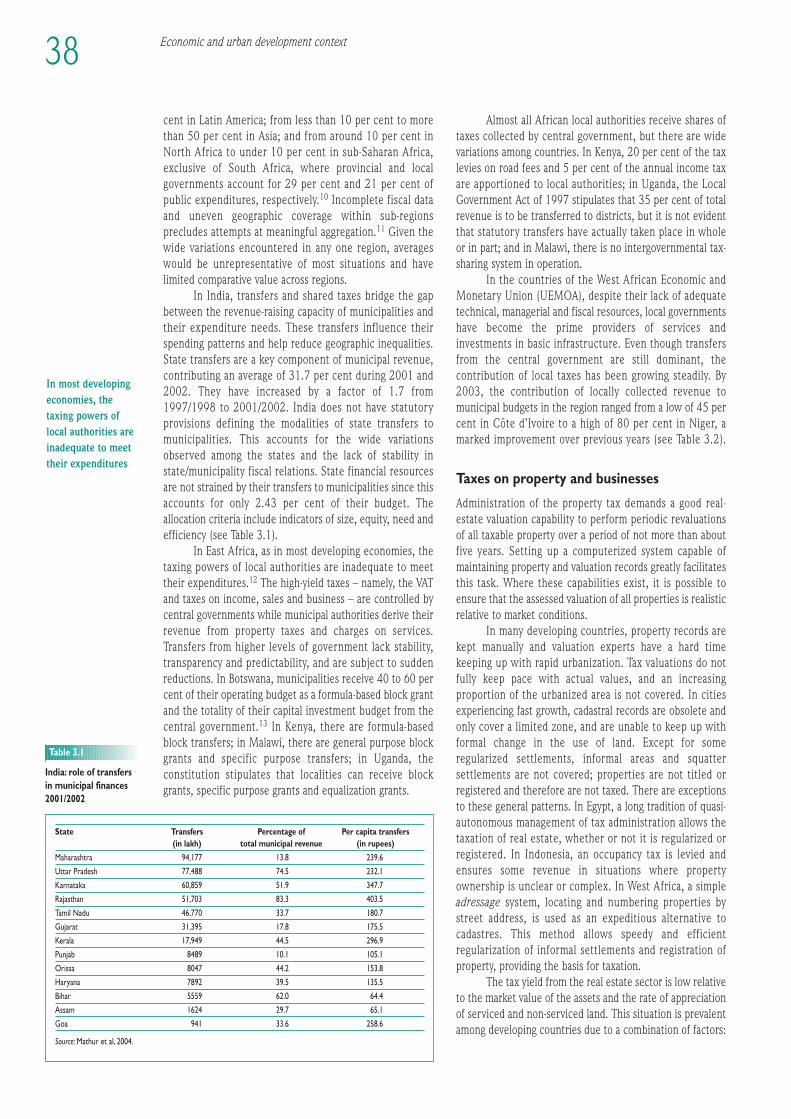
cent in Latin America; from less than 10 per cent to morethan 50 per cent in Asia; and from around 10 per cent inNorth Africa to under 10 per cent in sub-Saharan Africa,exclusive of South Africa, where provincial and localgovernments account for 29 per cent and 21 per cent ofpublic expenditures, respectively.10 Incomplete fiscal dataand uneven geographic coverage within sub-regionsprecludes attempts at meaningful aggregation.11 Given thewide variations encountered in any one region, averageswould be unrepresentative of most situations and havelimited comparative value across regions.
In India, transfers and shared taxes bridge the gapbetween the revenue-raising capacity of municipalities andtheir expenditure needs. These transfers influence theirspending patterns and help reduce geographic inequalities.State transfers are a key component of municipal revenue,contributing an average of 31.7 per cent during 2001 and2002. They have increased by a factor of 1.7 from1997/1998 to 2001/2002. India does not have statutoryprovisions defining the modalities of state transfers tomunicipalities. This accounts for the wide variationsobserved among the states and the lack of stability instate/municipality fiscal relations. State financial resourcesare not strained by their transfers to municipalities since thisaccounts for only 2.43 per cent of their budget. Theallocation criteria include indicators of size, equity, need andefficiency (see Table 3.1).
In East Africa, as in most developing economies, thetaxing powers of local authorities are inadequate to meettheir expenditures.12 The high-yield taxes – namely, the VATand taxes on income, sales and business – are controlled bycentral governments while municipal authorities derive theirrevenue from property taxes and charges on services.Transfers from higher levels of government lack stability,transparency and predictability, and are subject to suddenreductions. In Botswana, municipalities receive 40 to 60 percent of their operating budget as a formula-based block grantand the totality of their capital investment budget from thecentral government.13 In Kenya, there are formula-basedblock transfers; in Malawi, there are general purpose blockgrants and specific purpose transfers; in Uganda, theconstitution stipulates that localities can receive blockgrants, specific purpose grants and equalization grants.
Almost all African local authorities receive shares oftaxes collected by central government, but there are widevariations among countries. In Kenya, 20 per cent of the taxlevies on road fees and 5 per cent of the annual income taxare apportioned to local authorities; in Uganda, the LocalGovernment Act of 1997 stipulates that 35 per cent of totalrevenue is to be transferred to districts, but it is not evidentthat statutory transfers have actually taken place in wholeor in part; and in Malawi, there is no intergovernmental tax-sharing system in operation.
In the countries of the West African Economic andMonetary Union (UEMOA), despite their lack of adequatetechnical, managerial and fiscal resources, local governmentshave become the prime providers of services andinvestments in basic infrastructure. Even though transfersfrom the central government are still dominant, thecontribution of local taxes has been growing steadily. By2003, the contribution of locally collected revenue tomunicipal budgets in the region ranged from a low of 45 percent in Côte d’Ivoire to a high of 80 per cent in Niger, amarked improvement over previous years (see Table 3.2).
Taxes on property and businesses
Administration of the property tax demands a good real-estate valuation capability to perform periodic revaluationsof all taxable property over a period of not more than aboutfive years. Setting up a computerized system capable ofmaintaining property and valuation records greatly facilitatesthis task. Where these capabilities exist, it is possible toensure that the assessed valuation of all properties is realisticrelative to market conditions.
In many developing countries, property records arekept manually and valuation experts have a hard timekeeping up with rapid urbanization. Tax valuations do notfully keep pace with actual values, and an increasingproportion of the urbanized area is not covered. In citiesexperiencing fast growth, cadastral records are obsolete andonly cover a limited zone, and are unable to keep up withformal change in the use of land. Except for someregularized settlements, informal areas and squattersettlements are not covered; properties are not titled orregistered and therefore are not taxed. There are exceptionsto these general patterns. In Egypt, a long tradition of quasi-autonomous management of tax administration allows thetaxation of real estate, whether or not it is regularized orregistered. In Indonesia, an occupancy tax is levied andensures some revenue in situations where propertyownership is unclear or complex. In West Africa, a simpleadressage system, locating and numbering properties bystreet address, is used as an expeditious alternative tocadastres. This method allows speedy and efficientregularization of informal settlements and registration ofproperty, providing the basis for taxation.
The tax yield from the real estate sector is low relativeto the market value of the assets and the rate of appreciationof serviced and non-serviced land. This situation is prevalentamong developing countries due to a combination of factors:
In most developingeconomies, thetaxing powers oflocal authorities areinadequate to meettheir expenditures
38 Economic and urban development context
State Transfers Percentage of Per capita transfers (in lakh) total municipal revenue (in rupees)
Maharashtra 94,177 13.8 239.6
Uttar Pradesh 77,488 74.5 232.1
Karnataka 60,859 51.9 347.7
Rajasthan 51,703 83.3 403.5
Tamil Nadu 46,770 33.7 180.7
Gujarat 31,395 17.8 175.5
Kerala 17,949 44.5 296.9
Punjab 8489 10.1 105.1
Orissa 8047 44.2 153.8
Haryana 7892 39.5 135.5
Bihar 5559 62.0 64.4
Assam 1624 29.7 65.1
Goa 941 33.6 258.6
Source: Mathur et al, 2004.
India: role of transfersin municipal finances2001/2002
Table 3.1
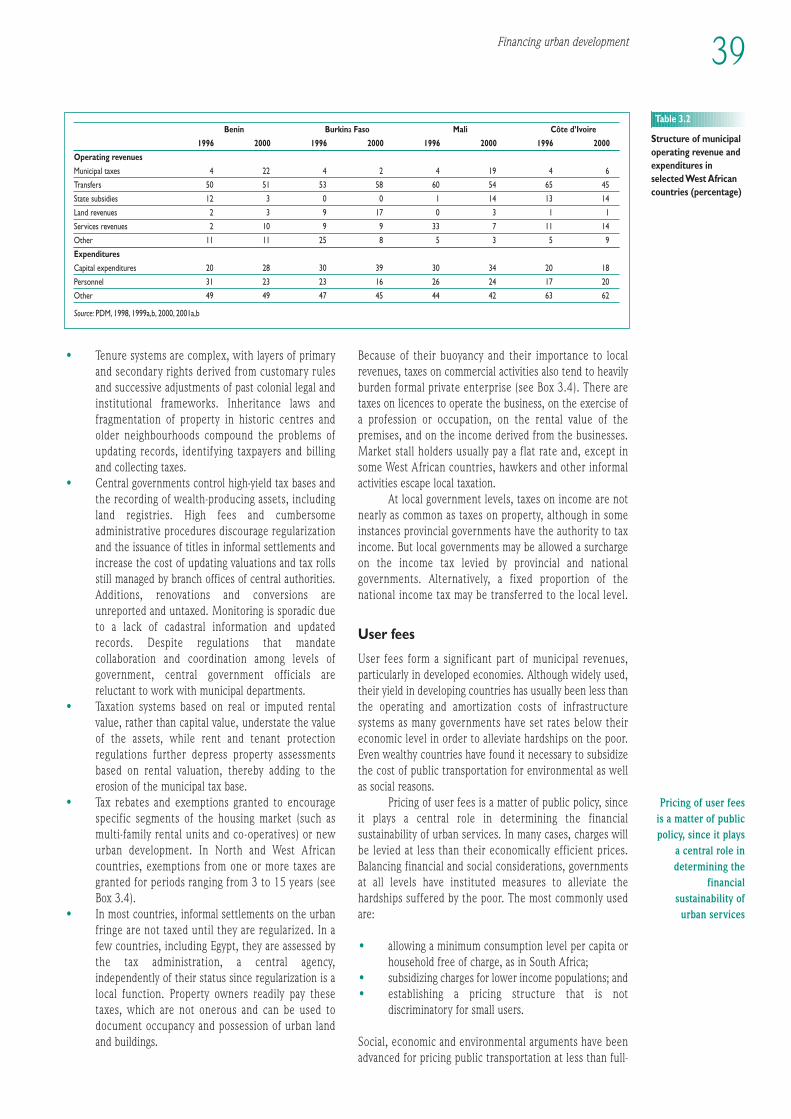
• Tenure systems are complex, with layers of primaryand secondary rights derived from customary rulesand successive adjustments of past colonial legal andinstitutional frameworks. Inheritance laws andfragmentation of property in historic centres andolder neighbourhoods compound the problems ofupdating records, identifying taxpayers and billingand collecting taxes.
• Central governments control high-yield tax bases andthe recording of wealth-producing assets, includingland registries. High fees and cumbersomeadministrative procedures discourage regularizationand the issuance of titles in informal settlements andincrease the cost of updating valuations and tax rollsstill managed by branch offices of central authorities.Additions, renovations and conversions areunreported and untaxed. Monitoring is sporadic dueto a lack of cadastral information and updatedrecords. Despite regulations that mandatecollaboration and coordination among levels ofgovernment, central government officials arereluctant to work with municipal departments.
• Taxation systems based on real or imputed rentalvalue, rather than capital value, understate the valueof the assets, while rent and tenant protectionregulations further depress property assessmentsbased on rental valuation, thereby adding to theerosion of the municipal tax base.
• Tax rebates and exemptions granted to encouragespecific segments of the housing market (such asmulti-family rental units and co-operatives) or newurban development. In North and West Africancountries, exemptions from one or more taxes aregranted for periods ranging from 3 to 15 years (seeBox 3.4).
• In most countries, informal settlements on the urbanfringe are not taxed until they are regularized. In afew countries, including Egypt, they are assessed bythe tax administration, a central agency,independently of their status since regularization is alocal function. Property owners readily pay thesetaxes, which are not onerous and can be used todocument occupancy and possession of urban landand buildings.
Because of their buoyancy and their importance to localrevenues, taxes on commercial activities also tend to heavilyburden formal private enterprise (see Box 3.4). There aretaxes on licences to operate the business, on the exercise ofa profession or occupation, on the rental value of thepremises, and on the income derived from the businesses.Market stall holders usually pay a flat rate and, except insome West African countries, hawkers and other informalactivities escape local taxation.
At local government levels, taxes on income are notnearly as common as taxes on property, although in someinstances provincial governments have the authority to taxincome. But local governments may be allowed a surchargeon the income tax levied by provincial and nationalgovernments. Alternatively, a fixed proportion of thenational income tax may be transferred to the local level.
User fees
User fees form a significant part of municipal revenues,particularly in developed economies. Although widely used,their yield in developing countries has usually been less thanthe operating and amortization costs of infrastructuresystems as many governments have set rates below theireconomic level in order to alleviate hardships on the poor.Even wealthy countries have found it necessary to subsidizethe cost of public transportation for environmental as wellas social reasons.
Pricing of user fees is a matter of public policy, sinceit plays a central role in determining the financialsustainability of urban services. In many cases, charges willbe levied at less than their economically efficient prices.Balancing financial and social considerations, governmentsat all levels have instituted measures to alleviate thehardships suffered by the poor. The most commonly usedare:
• allowing a minimum consumption level per capita orhousehold free of charge, as in South Africa;
• subsidizing charges for lower income populations; and • establishing a pricing structure that is not
discriminatory for small users.
Social, economic and environmental arguments have beenadvanced for pricing public transportation at less than full-
Pricing of user feesis a matter of publicpolicy, since it plays
a central role indetermining the
financialsustainability of
urban services
39Financing urban development
Benin Burkina Faso Mali Côte d’Ivoire
1996 2000 1996 2000 1996 2000 1996 2000
Operating revenues
Municipal taxes 4 22 4 2 4 19 4 6
Transfers 50 51 53 58 60 54 65 45
State subsidies 12 3 0 0 1 14 13 14
Land revenues 2 3 9 17 0 3 1 1
Services revenues 2 10 9 9 33 7 11 14
Other 11 11 25 8 5 3 5 9
Expenditures
Capital expenditures 20 28 30 39 30 34 20 18
Personnel 31 23 23 16 26 24 17 20
Other 49 49 47 45 44 42 63 62
Source: PDM, 1998, 1999a,b, 2000, 2001a,b
Structure of municipaloperating revenue andexpenditures inselected West Africancountries (percentage)
Table 3.2

cost recovery. For water supply, social considerations and,in many cases, the reassertion of pre-colonial traditionsand/or religious beliefs have thwarted attempts to raiseprices to financially sustainable levels since the 1980s.Under structural adjustment programmes, price increaseshave led to contentious debates and civil disturbances.
Most recently, the debate over the pricing of essentialservices has acquired a new dimension because of the NGO-led movement to assert the legal ‘right to the city’. This rightincludes access to urban land and urban services for allresidents. The debate is ongoing in many parts of thedeveloping world. Nevertheless, there is some consensusregarding the desirability of charging for a public serviceeven when the charge cannot cover full financial costs. Inmost circumstances, user charges are not structured to takeinto account the recovery of capital investments, evenwhere an operational profit materializes. Expansion ofservices usually takes precedence over maintenance ofsystems, and political pressure and rapid urbanization weighheavily in these decisions.
Betterment taxes and development exactions
In advanced economies, an array of impact fees andbetterment taxes compensate local authorities for theadditional expenditures incurred in extending urban
infrastructure and services to new urban developmentprojects or to upgrade services in the urbanized area. Thesefees are also structured to recapture part of the unearnedincrement in real estate values resulting from publicinvestment. Because they are payable over terms of up toten years, betterment levies do not directly provideimmediate funding for capital investments. Revaluation ofproperties affected by public works improvements makes amajor contribution towards municipal revenue throughproperty tax assessments.
Many countries with rapidly developing economieshave instituted betterment fees and require developers tocontribute to the costs of providing new services. They couldbenefit from the linkage concept as a mechanism employedin the US to redistribute the benefit of growth duringperiods of rapid economic development.
Borrowing
Funding for capital expenditure requires access to long-termborrowing, broadly related to the working lives of assets tobe financed. Debt service can then be annually financed,either from internally generated funds for revenue-earningservices or from general revenues for tax-borne services.Users of services provided by public assets are expected topay for current use, as well as an appropriate share of the
40 Economic and urban development context
Box 3.4 Côte d’Ivoire: challenges constraining the taxation of property and businesses
Côte d’Ivoire exemplifies the challenges encountered bydeveloping countries in taxing property and businesses.
In Abidjan, the principal commercial centre, the realestate sector is overburdened.There are no less than ninedirect taxes on urban property, exclusive of the taxation ofrental income. Four basic taxes are levied and collected by theMinistry of Finance’s Direction Générale des Impots (DGI),which transfers to the communes a portion of the receiptsaccording to a separate formula for each tax.The tax on builtproperty is the mainstay of the taxation system. Other realestate taxes include the tax on un-built property, a tax onunderdeveloped urban property to deter speculative landholding, and a tax on property belonging to real estatedevelopment corporations and building societies. Municipalcouncils can levy supplemental charges not exceeding 20 percent of the tax.Two special purpose taxes earmarked forinfrastructure maintenance are also levied on all built propertyand no temporary or permanent exemptions are granted: thesanitation tax is collected by the state and the tax for roads andrefuse removal is collected by the municipality. Communes canlevy additional taxes on real estate, which are collected on theirbehalf by the DGI, including a tax on net income from builtproperty; a tax on the capital value of un-built property; and atax on the rental value of premises subject to the commerciallicence fees paid to the state.
The expansion of the urbanized area during the 1970sand 1980s has not been matched by a commensurate expansionof the tax base.Three factors contribute to the erosion of thetax base:
1 temporary exemptions granted to new construction foroverly long periods ranging from 5 to 20 years;
2 central control of the tax roll and rates; and3 the proliferation of informal development on the urban
fringe through the unauthorized subdivision of triballand.
Buildings in informal settlements were not legally recognized ortaxed. When a regularization policy was adopted in 1977, theprocess was too cumbersome and lengthy and failed to keep upwith the pace of urbanization. DGI estimates the performanceof real estate taxes to range between 20 per cent and 30 percent.
Commercial taxes are the mainstay of municipal financein West African cities. In Abidjan, they account for over 50 percent of local revenue.There are two main taxes: the patentelevied by the DGI on larger businesses with annual sales volumeabove a specified threshold, and the Taxe Forfaitaire, a flat-ratetax levied on small retailers and craftsmen and collected directlyby the communes. Small shops and workshops pay on a monthlybasis, while street vendors pay a daily fee for a ticket whichallows them to trade on the sidewalks or in the designatedmarket areas. Central authorities tend to view local commercialtaxes as too numerous, difficult to manage and enforce, and lowyield in comparison to other forms of taxation.Yet, theircontribution to local fiscal revenue cannot be overlooked.Source: Serageldin, 1990.
fixed asset costs, over the full working lives of the facilities,a situation that is rarely the case in developing countries orin many advanced economies, for that matter.
In situations of high inflation, economic recession,structural adjustment and other constraining factors, long-term borrowing is typically not available, although variousmethods have been devised to counter these constraints.The standard solution is to add the expected inflation rateto the real cost of money, adopt variable rates or index eitherthe principal or the annuity payments to the inflation rate.Alternatively, domestic loans are linked to a stable foreigncurrency, as has happened in many Latin Americancountries.
� Short-term borrowingIn the absence of long-term financing, local governmentshave tended to use short-term commercial debt where theoption is available to them. Short-term borrowing bymunicipal governments is normally limited to coveringcapital investments. In many countries, attempts havesometimes been made to continuously roll over short-termdebt used to finance capital expenditure. Debt hassometimes been used to cover recurrent budgetary deficitsor for short-term cash-flow management. Accumulated debthas to be brought under control and refinanced, otherwiseit can lead to financial crisis. Box 3.5 highlights some of theborrowing challenges faced by city authorities.
� Credit enhancement, access to financialinstitutions and capital markets
Local governments need sophisticated debt managementcapability to draw on the range of financial options andinstruments to finance their capital investment needs. Thesecapabilities are not currently prevalent among many localadministrations in the developing world. In order tostrengthen local finances and enhance municipal access tomedium- and longer-term credit, shared revenues areregarded as part of the local resources available to servicedebt and can be pledged as collateral. Thus, shared revenuesserve as loan guarantees and central governments canwithhold them from municipal governments and authorizelenders to intercept the transfers in order to settle arrearsof debt service obligations. This arrangement enhances thecredit rating of municipalities.
International capital markets and multilateral financialinstitutions have focused upon East Asia’s credit market inlight of the strength of the regional economy, anchored byJapan and China, and the Asian countries’ own performancerebounding from the 1997 financial crisis. However, thesecountries offer sharply contrasting financial environments.The Philippines was one of the first Asian countries todevolve functions and resources to local government units.A 1991 code allowed localities to create new own sourcesof revenue and gave them borrowing powers. Municipalitiesand provinces are authorized to issue bonds to finance self-liquidating, income-generating projects, enhancing thequality of life in the city. Two government-owned banks andtwo municipal development funds provide local governmentswith credit. A steady flow of generous central transfers andthe power of state-owned financial institutions to intercept
these transfers to settle arrears have allowed the municipalcredit market to function and a limited domestic bondmarket to operate.14
By contrast, Viet Nam is barely starting on thetransition path and local authorities have little fiscalautonomy. Borrowing is restricted to capital expendituresand the state bank can extend loans to localities for up to30 per cent of project cost.15
In India, the Ahmedabad Municipal Corporationbecame the first municipality to issue bonds on the capitalmarket; but other municipalities have also used this methodwith the back-up of credit rating agencies. The ninemunicipalities that have accessed the capital market havethus far been able to issue bonds without requiring aguarantee from the state government or a bank, astraditionally required by lenders to municipal entities. They
41Financing urban development
Box 3.5 The challenges of borrowing
RussiaDuring the mid 1990s, a series of Russian laws established rather liberal borrowing rules forsub-national entities and authorized municipalities to issue bonds and lottery tickets, to extendand take out loans, and to open municipal accounts with banks and other financial and creditinstitutions. Municipalities borrowed from regions to cover deficits, issued municipal bonds andcontracted short-term loans from banks. Municipal financial mismanagement and indebtednessled to the revocation of these laws. Following the 1998 financial crisis, the Law on Specificity inIssuance and Circulation of State and Municipal Securities and the Budget Code prohibitmunicipalities from contracting external debt or debt obligations exceeding ten years.Theissuance of debt obligations is limited to the financing of capital expenditures.Theserestrictions, while justified to curb runaway municipal finances, constitute a constraint on thefinancing of local public infrastructure projects.
IndonesiaIn Indonesia, during the aftermath of the 1997 financial crisis, widespread defaults onoutstanding loans from the Indonesian National Development Fund need to be resolved andthe stability of the banking system fully restored before borrowing can be meaningfullyaddressed. In the meantime, regional governments depend upon donor and sovereign loanfunds (primarily from the World Bank and the Asian Development Bank) for regionalinfrastructure projects. Despite favourable loan terms, arrears reached 40 per cent in 1998.Regional and local governments were considered financially too weak to benefit from theregulatory framework authorizing sub-national entities to borrow on the financial markets. Inthe period leading to the 1997 financial crisis, private investors preferred to seek concessionsand build–operate–transfer (BOT) contracts, fuelling a risky reliance on offshore financing.Theweakness of local government finances and their reliance on transfers and shared revenueprompted the Indonesian Ministry of Finance to prohibit all new borrowing from bothdomestic and foreign sources.The only exceptions are borrowing through on-lendinginstitutions for short-term working capital or profitable locally owned enterprises. Since localgovernments have not yet been authorized to levy new sources of revenue, their financialsituation remains weak.
Sub-Saharan Africa In sub-Saharan Africa, South Africa and Zimbabwe have led the decentralization process.Regional local governments in the two countries are empowered to borrow in order tofinance capital investments. In Uganda, local authorities are allowed to borrow, but haverefrained from doing so due to the lack of a municipal development bank such as South Africa’sDevelopment Bank of Southern Africa (DBSA). In most other countries, current debt burdensand legal constraints impede the development of municipal financial institutions.Source: Chernyavsky, undated (Russia);World Bank, 2003a; Menon et al, 2003 (Indonesia); Lewis and Chakeri , 2004;Freire et al, 2004 (sub-Saharan Africa).

have raised capital on the strength of their own creditrating.16
Income-generating enterprises
Local governments can establish separate income-generatingenterprises to enhance their overall revenue-generationcapability. The advantage of using an income-generatingenterprise is that its activities can be accounted forindependently of general tax-borne activities. Typically, therole of revenue-earning enterprises is not to generatecontributions to general public revenues, but to removeopen-ended reliance upon such revenues. This approach alsohighlights the full costs of operation, so that these may bemore appropriately covered from user charges and carefullytargeted subsidies.
In China, formal government budgets account for onlyhalf of local government financial activity due to theimportance of off-budget finance. Own-revenue sourcesconsist of special fees, taxes, profit distributions from locallyowned enterprises, land leases and taxes on businessenterprises (VAT and income). The property tax on urban andrural land generates a meagre 2 per cent of local revenue,while the business tax contributes 34 per cent but exacts aheavy burden on businesses, representing about half theirprofits. As they have no borrowing power, municipalities haveresorted to the ingenious mechanism of creating independentwholly owned companies, whose activities are off-budget, tofinance the capital financing of development projects,particularly infrastructure. These so-called special purposevehicles (SPVs) are allowed to borrow on the capital marketsand use their revenue to amortize their debt. They havebecome a key instrument in implementing large-scale urbandevelopment projects (see Box 3.3).
Municipal development funds
Many countries have established municipal developmentfunds (MDFs) that provide regional and local governmentswith needed capital. The Public Works Loan Board (UK) andthe Crédit Foncier (France) are among the oldest and haveserved as models for other countries. Typically, MDFs havebeen sponsored by central governments, with internationaldevelopment organizations initially participating in thecreation of these institutions. Some poorly managed MDFshave collapsed, while others have been sustained andcontinue to finance development projects. Yet others havemanaged to leverage local capital contributions and a fewhave evolved into such noteworthy institutions asColombia’s Financiera de Desarrollo Territorial (FINDETER)and the Development Bank of Southern Africa.
An alternative approach has been for groups ofmunicipalities to obtain pooled financing as members ofspecialized sub-national entities, such as Sweden’sKommuninvest Corporation, or by virtue of their regionallocation – for instance, Virginia’s Resources Authority in theUS. Both approaches are based on a financial intermediarywhose size and managerial capacity allows it to access financialmarkets on better terms than its individual members. The
resulting savings are passed on to the municipalities. Initiallydeveloped in Europe and the US, this model has beensuccessfully adapted in the case of India’s Tamil Nadu UrbanDevelopment Fund (TNUDF) (see Box 3.6).
Other sources
There are other sources, including social investment funds,environment funds and special funds financed by debtswaps. Social investment funds were introduced in severalcountries in Latin America, Asia and Africa over a decadeago to finance projects aimed at social development andpoverty reduction. Environmental funds are similarlystructured, but focus on environmental management,pollution control and the preservation of natural resources.
Bolivia has tried to improve the performance of itssocial investment fund by integrating it within the system ofintergovernmental fiscal transfers aimed at promotingdecentralization and redistributing fiscal revenues to thepoorer areas. The country also has a programme whichblends grants and loans to implement strategic actions thatsupport decentralization, increase local resources and fostera sound fiscal management, while promoting theinvolvement of the private sector in municipal finance. Toachieve these objectives, the programme helps to build thetechnical and managerial capacity of municipalities with aspecial emphasis on fiscal management and theadministration of property cadastres and tax rolls. It is alsosponsoring credit rating for the major municipalities in orderto prepare them to issue bonds.17
Even though still an exception, targeted funding ofpoverty reduction and environmental projects is growing inimportance, particularly in Latin America. Funding tends tobe either through external donations or through debt swapsunder the Heavily Indebted Poor Countries (HIPC) initiativeof the Bretton Woods institutions. In a formal sense, ascommonly used in financial markets, debt swaps are employedby two or more partners to exchange legal liabilities for alreadyincurred debt. Each partner carries financial obligations; butthe transaction is mutually advantageous in terms of meetingsome strategic objective.
The Bolivian Strategy for Poverty Reduction, withinthe HIPC initiative, gives an important role to localauthorities as a way of increasing the efficiency in servicesdelivery to impoverished populations and to promote localdevelopment. It relies upon municipalities to develop andimplement action plans to reduce poverty. An amount ofapproximately US$20 million annually is transferred to localauthorities to invest within the eight national prioritysectors.18
Governments to whom debt is owed can also agree todiscount the debt and allow indebted governments to repaythe balance in local currency. The debt service proceeds ofthese ‘swap’ arrangements are deposited in a fund to supportnew local capital investments or to promote strategic socialand environmental objectives. One of the first such swapsinvolved Costa Rica’s debt and helped to preserve the richecosystem of the national rainforest reservations. Morerecently, swaps have been used to fund poverty alleviation
Many countrieshave establishedmunicipaldevelopment funds(MDFs) that provideregional and localgovernments withneeded capital
42 Economic and urban development context
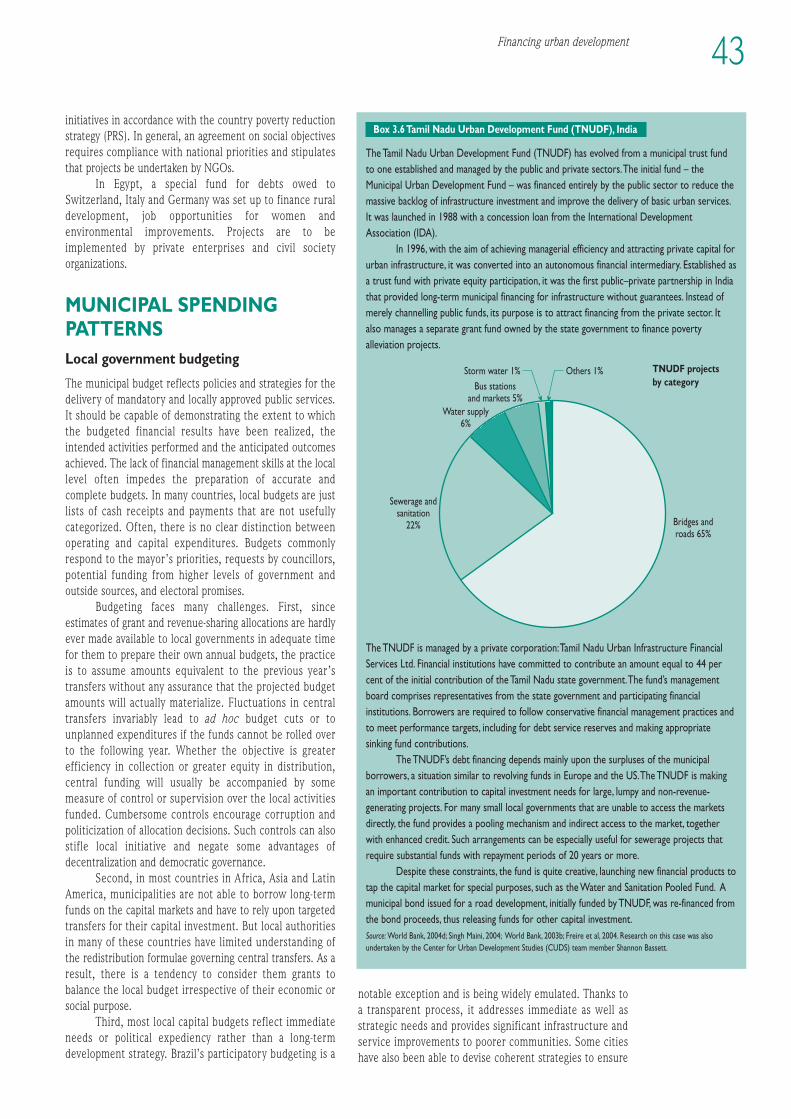
initiatives in accordance with the country poverty reductionstrategy (PRS). In general, an agreement on social objectivesrequires compliance with national priorities and stipulatesthat projects be undertaken by NGOs.
In Egypt, a special fund for debts owed toSwitzerland, Italy and Germany was set up to finance ruraldevelopment, job opportunities for women andenvironmental improvements. Projects are to beimplemented by private enterprises and civil societyorganizations.
MUNICIPAL SPENDINGPATTERNSLocal government budgeting
The municipal budget reflects policies and strategies for thedelivery of mandatory and locally approved public services.It should be capable of demonstrating the extent to whichthe budgeted financial results have been realized, theintended activities performed and the anticipated outcomesachieved. The lack of financial management skills at the locallevel often impedes the preparation of accurate andcomplete budgets. In many countries, local budgets are justlists of cash receipts and payments that are not usefullycategorized. Often, there is no clear distinction betweenoperating and capital expenditures. Budgets commonlyrespond to the mayor’s priorities, requests by councillors,potential funding from higher levels of government andoutside sources, and electoral promises.
Budgeting faces many challenges. First, sinceestimates of grant and revenue-sharing allocations are hardlyever made available to local governments in adequate timefor them to prepare their own annual budgets, the practiceis to assume amounts equivalent to the previous year’stransfers without any assurance that the projected budgetamounts will actually materialize. Fluctuations in centraltransfers invariably lead to ad hoc budget cuts or tounplanned expenditures if the funds cannot be rolled overto the following year. Whether the objective is greaterefficiency in collection or greater equity in distribution,central funding will usually be accompanied by somemeasure of control or supervision over the local activitiesfunded. Cumbersome controls encourage corruption andpoliticization of allocation decisions. Such controls can alsostifle local initiative and negate some advantages ofdecentralization and democratic governance.
Second, in most countries in Africa, Asia and LatinAmerica, municipalities are not able to borrow long-termfunds on the capital markets and have to rely upon targetedtransfers for their capital investment. But local authoritiesin many of these countries have limited understanding ofthe redistribution formulae governing central transfers. As aresult, there is a tendency to consider them grants tobalance the local budget irrespective of their economic orsocial purpose.
Third, most local capital budgets reflect immediateneeds or political expediency rather than a long-termdevelopment strategy. Brazil’s participatory budgeting is a
notable exception and is being widely emulated. Thanks toa transparent process, it addresses immediate as well asstrategic needs and provides significant infrastructure andservice improvements to poorer communities. Some citieshave also been able to devise coherent strategies to ensure
43Financing urban development
Box 3.6 Tamil Nadu Urban Development Fund (TNUDF), India
The Tamil Nadu Urban Development Fund (TNUDF) has evolved from a municipal trust fundto one established and managed by the public and private sectors.The initial fund – theMunicipal Urban Development Fund – was financed entirely by the public sector to reduce themassive backlog of infrastructure investment and improve the delivery of basic urban services.It was launched in 1988 with a concession loan from the International DevelopmentAssociation (IDA).
In 1996, with the aim of achieving managerial efficiency and attracting private capital forurban infrastructure, it was converted into an autonomous financial intermediary. Established asa trust fund with private equity participation, it was the first public–private partnership in Indiathat provided long-term municipal financing for infrastructure without guarantees. Instead ofmerely channelling public funds, its purpose is to attract financing from the private sector. Italso manages a separate grant fund owned by the state government to finance povertyalleviation projects.
The TNUDF is managed by a private corporation:Tamil Nadu Urban Infrastructure FinancialServices Ltd. Financial institutions have committed to contribute an amount equal to 44 percent of the initial contribution of the Tamil Nadu state government.The fund’s managementboard comprises representatives from the state government and participating financialinstitutions. Borrowers are required to follow conservative financial management practices andto meet performance targets, including for debt service reserves and making appropriatesinking fund contributions.
The TNUDF’s debt financing depends mainly upon the surpluses of the municipalborrowers, a situation similar to revolving funds in Europe and the US.The TNUDF is makingan important contribution to capital investment needs for large, lumpy and non-revenue-generating projects. For many small local governments that are unable to access the marketsdirectly, the fund provides a pooling mechanism and indirect access to the market, togetherwith enhanced credit. Such arrangements can be especially useful for sewerage projects thatrequire substantial funds with repayment periods of 20 years or more.
Despite these constraints, the fund is quite creative, launching new financial products totap the capital market for special purposes, such as the Water and Sanitation Pooled Fund. Amunicipal bond issued for a road development, initially funded by TNUDF, was re-financed fromthe bond proceeds, thus releasing funds for other capital investment.Source: World Bank, 2004d; Singh Maini, 2004; World Bank, 2003b; Freire et al, 2004. Research on this case was alsoundertaken by the Center for Urban Development Studies (CUDS) team member Shannon Bassett.
Others 1%Storm water 1%Bus stations
and markets 5%Water supply
6%
Sewerage andsanitation
22% Bridges androads 65%
TNUDF projects by category
that a stream of relatively small annual capital improvementsbecomes an integral component of a long-term developmentstrategy.
Fourth, the efficient collection of taxes is a dauntingproblem, particularly in parts of the world that areexperiencing rapid urbanization. The lack of up-to-daterecords, inadequately trained personnel and the prevalenceof informal housing and of unstructured floating economicactivities are major obstacles to an increased financial self-reliance of local governments. This has prevented thepreparation of multi-year capital investment budgets that areindispensable in ensuring an adequate supply of servicedland and the delivery of improved services and, generally, inmeeting the goals of sustainable urban development.
� Participatory budgeting Democratic local governance has fuelled growing demandsfor accountability and transparency in municipal budgetingand financial management, particularly with regard to theallocation of scarce local resources and their utilization.There is a marked trend for more rigorous financialmanagement, clear procedures for the allocation ofresources and the participation of residents in decisionsaffecting their communities. Of particular interest is thetransparency mandated by Brazilian legislation and thespread of participatory budgeting – first instituted by PortoAlegre (see Box 3.7) – to municipalities in Brazil and otherLatin American countries.
� Multi-year capital budgeting Capital investment budgets are a major undertaking for localgovernments. These budgets are often not well linked todevelopment strategies and spatial plans, or such plans maynot exist or may be mere wish lists of projects. There aremany criteria for prioritizing capital expenditure: urgency ofneed; political importance; economic efficiency; availabilityof funding; implementation capabilities; and operation andmaintenance costs of the completed assets, or life-cyclecosting, to ensure that the assets and related activities willcontinue to operate over longer time periods. In manyinfrastructure projects, the relation between capitalinvestments and operation and maintenance costs is notadequately considered and is hardly ever accounted for inchoosing among options.
The rolling four-year capital investment programmeof Szczecin in Poland allowed the city to improve its financialmanagement standards to a level that enabled it to attractlocal and foreign investors, and to obtain a credit rating andborrow from commercial financial institutions (see Box 3.8).
� Lack of funds for maintaining existingassets
In developing countries, asymmetrical decentralization hasled to serious fiscal imbalances. In many such countries thefunding provided barely allows for the delivery of servicesor coverage of settlements within the jurisdiction, thusundercutting shelter delivery. Local governments must lookto other sources, domestic and external, to supplement theirown.
Because they immediately impact upon day-to-dayactivities, operating expenditures are almost alwaysperceived as the most urgent. Priority operatingexpenditures and financial constraints frequently lead todeferment of expenditures on maintaining existing assets.Unlike capital investments for which a variety of externalsources of finance can be found, funding for themaintenance of existing assets is lacking. Even as itcontinues to perform, existing infrastructure deterioratesand becomes less efficient with the passage of time.Preventive maintenance is increasingly converted into crisismanagement, impairing the functional efficiency of manycities in the developing world. Particularly in the largerurban centres, authorities have to purchase expensive parts
44 Economic and urban development context
Box 3.7 Participatory budgeting in Brazil
The emergence and spread of participatory budgeting (PB) in Brazil is rooted in the legalmandate requiring popular participation in local decision-making. Municipalities introducedmechanisms ranging from the presentation of budget proposals for public comment to theactual involvement of residents in decision-making. Participatory budgeting was first institutedby the city of Porto Alegre in 1989 and gave the city international recognition as a leader in‘popular democracy’ in local governance.The concept has now been adopted by approximately180 Brazilian municipalities and is spreading beyond Brazil in Latin America to cities inArgentina, Uruguay, Peru, Ecuador, Colombia, Bolivia, Mexico and Chile. More recently, cities inother parts of the world are adapting the process to their own situation.
PB allows residents to have a voice in the annual allocation of capital investments. It isbased on the delegation of statutory executive powers regarding the preparation of themunicipal budget and has to be initiated by the mayor.There is no similar delegation ofauthority from the legislative branch, and the city council remains the statutory authorityapproving the municipal budget.
The PB concept embodies four key features:
1 It ensures representation of residents in each sub-area within the jurisdiction in thedecision-making process.
2 It requires municipal officials to report on what has been accomplished with theprevious year’s budget and to provide estimates of revenues and expenditures for theupcoming year in order to determine the budget envelope for capital investments.
3 It is structured to ensure transparency through direct popular participation and anopen voting system.
4 It ensures objectivity through the use of quantitative criteria for the prioritization offunding requests and the allocation of resources.
Participatory budgeting is primarily an instrument of empowerment and social inclusion.Participation and social impact are its most important dimensions. It covers all capitalinvestments, which range from 5 to 15 per cent of the total budget in Brazilian municipalities. Itis a flexible instrument since the rules can be amended at the end of each budget cycle, butcannot be changed during the cycle.
Popular assemblies are the cornerstone of the PB process. Attendance has grownsteadily over the years in parallel with the growth of capital investments and as the importanceof participation becomes evident to a wider spectrum of the population.The dynamics ofattendance are complex and reflect the strategies and tactics of grassroots organizations andsocial movements, the mobilization efforts of groups who want to press for specific demands,and the degree of coordinated action at the community level. Outreach at the community levelis needed to foster participation of lower income groups for whom the cost of attendance ishigh.This entails a significant commitment of resources on the part of the municipality,particularly in terms of personnel.Source: Serageldin et al, 2003a,b.

from current revenue and delay the renewal of plants,facilities and networks. When infrastructure projects carryoutstanding debt, debt service often pre-empts necessarymaintenance of the assets.
Managing municipal expenditures
As recurrent expenditures have increasingly dominatedbudgets, techniques for determining expenditures andmeasuring actual performance have been developed andincorporated within budgetary processes. Best practicedemands that capital expenditure is budgeted and accountedfor separately from recurrent operating expenditures; thatoperating expenditures be financed from fees, charges,regular taxes, regular shared revenues and recurrentgovernment grants and not allowed to exceed these currentrevenues; and that borrowing, when permitted by law, berestricted to financing capital investments, with the possibleexception of covering temporary cash-flow shortages. Theseprinciples of financial management are increasinglyincorporated within legislation on national finance systemsrelating to state and local budgeting and provide aframework for financial management and assessment ofperformance, where local officials and electedrepresentatives are held accountable for their own actions.
From 1999 to 2002, local government expendituresin Indonesia rose by a factor of 3.3 at an average rate of 55per cent annually, in nominal terms. Capital spendingincreased by 60 per cent annually, slightly outpacingoperating expenditure that rose by about 52 per cent.However, the structure of local government expenditure hasbarely changed (see Figure 3.1). Wages still constitute themost dominant component, although their share hasdecreased slightly from over 50 per cent to less than 45 percent of total expenditure. Conversely, other recurrentexpenditures have increased somewhat from 17 per cent toabout 21 per cent of the total.
But the decision-making authority and financialautonomy that local governments obtain throughdecentralization policies do not necessarily lead toresponsible financial management, as the experience ofmany cities in developing countries demonstrates. FromBrazil to Morocco to India, municipalities are runningbudget deficits. In countries where they are empowered toborrow, many have accumulated debt and are unable torepay their loans.
In South Africa and Brazil, municipalities haveconstitutionally defined authority and fiscal resources. Thisprivileged status gives them wide decision-making powersand discretion in the use of their revenues. In Brazil,dynamic mayors used their new constitutional authority toinstitute reforms and innovate in areas critical to soundmunicipal governance, including participatory planning andmanagement, and partnerships with private enterprises,NGOs and CBOs for economic and social developmentinitiatives in Santo Andre, Belo Horizonte and Recife, amongother cities. Unfortunately, many more did not manage theiraffairs responsibly, forcing the federal government tointervene and rein in their runaway finances (see Box 3.9).
Accountability and transparency
Accountability for performance is a cornerstone of goodgovernance and a major tool in financial management. Itplaces as much emphasis upon transparency as upon finance.Increasingly, mayors, councils and city managers are heldaccountable for financial outcomes, as well as for thequalities of the services they deliver and the projects theyimplement. There are increasing demands for localempowerment and for greater public participation indetermining how public revenues are raised and spent. Fromconventional public budget hearings to participatorybudgeting, people are demanding a voice in the resourceallocation procedures and oversight regarding their actualapplication.
Demands for greater accountability and transparencyby voting and taxpaying constituencies have combined withthe constraints on the financial resources available to the
45Financing urban development
Box 3.8 Multi-year capital investment planning, Szczecin, Poland
During the transition towards a market economy, priority was placed on capital investmentsthat structure and support the local economy and enhance local development, including roadconstruction and maintenance; water supply and sewerage systems; revitalization of communalhousing; and improving education and healthcare facilities. Szczecin was the first Polish city tolink its city development strategy to a four-year capital investment programme (CIP).Approved by the city council in 1997, the CIP proved to be one of the most importantinstruments of financial management during the transition. It allowed the city to determine itsfinancial and development capacity, and to prepare forecasts for local and foreign investors.
The first four-year CIP (1997–2000) coincided with the rapid expansion of theresponsibilities of local governments as a result of devolution. In March 1998, the city counciladopted a resolution detailing the principles governing the preparation of the CIP andestablished procedures and criteria for prioritizing and selecting projects to be funded.Theseincluded assessment of existing needs; linkages to the city development strategy; technicalaspects of projects; implementation costs; financing capacity based on the city budget; andsources and conditions of potential external financing.
The programme identified each capital expenditure by year – disaggregated by project,programme and responsible department, and funding sources for each category – andproposed methods of financing.The rolling four-year CIP is submitted to the city council forannual approval.The first year’s capital investment programme is integrated within the citybudget.Source: Center for Urban Development Studies, 2000; Serageldin et al, 2004.
0 20 100
2002
2001
1999
1998
1997
40 60 80Percentage of total expenditure
Staff Trade and transportationOther routine expenditures Other
Structure of localexpenditure inIndonesia, 1997–2002
Source: Lewis and Chakeri,2004
Figure 3.1
public sector to exert political pressure to improve municipalfinancial management. Reforms of existing systems and theintroduction of newer concepts and techniques haveprovided useful alternatives in financing and operating public
services. They have also opened the public sector morewidely to many innovations and efficiencies, hitherto largelyconfined to the private sector, prompting governments toimprove their accounting and budgeting practices.
Until very recently, practices have varied in theirapplication and enforcement among different countries.Accounting systems for activities to be funded from generalrevenues are often much simpler in form, but cover a largevariety of activities. Unfortunately, in many countries,particularly in developing countries, local financial systemstypically fall far short of the structure and rigour needed toprovide instruments and indicators for policy formulation,resource allocations and strategic investment decisions. Withmany accounting systems currently in use in state and localgovernments in different countries, incompleteness iscommon. Therefore, unit costs and other indicators derivedfrom these accounts will not usually account for the totalityof the resources committed or consumed.
For revenue-producing activities, municipalaccounting systems are often quite similar to those used inprivate-sector enterprises, particularly when the activitiesare performed by an entity legally separate from corefunctions, funded from budgeted general revenues. Fosteredby decentralization and economic transition, the number ofcategories and entities financed through off-budget sourceshas multiplied during the past decade, particularly in EasternEurope. Some have been established specifically for thepurpose of circumventing the constraints of provincial andlocal governments on financial autonomy, as happened inChina and is now occurring in India and elsewhere.
46 Economic and urban development context
Box 3.9 Brazil’s law of fiscal responsibility
In Brazil, the privileged status of state and municipal governments under the 1988 constitutionstrengthened the role of mayors and governors in the national administrative framework.However, these same constitutional guarantees provided an impetus for municipalmismanagement and the multiplication of municipalities through fragmentation, to reach 5559municipalities in 2003. Dependency upon central transfers and shared revenue, and excessivepoliticization of local governance accounts for a focus on the short term and a general lack ofcoherence and continuity in municipal management.The constitutional amendment, enacted inconjunction with the fiscal stability programme adopted in October 1998, established rules forresponsible fiscal management, and the passage of the Fiscal Responsibility Act in May 2000 setfurther rules and standards for responsible fiscal management. For the three levels ofgovernment, the law mandates multi-year budgeting with fiscal targets, contingent liabilities andcost controls, and also introduces balanced-budget principles and incentives for mobilizing ownresources.
The law caps expenditures on personnel at 60 per cent and relates them to taxrevenue. It mandates expenditures on education at no less than 25 per cent. It limits borrowingto the financing of capital expenditures, with the setting aside of adequate reserves to offsetincreases in long-term financial obligations.The law also mandates public access to fiscal andbudgetary information. In 2001, the Statute of the City established general directives for urbanpolicies and mandated regularization of informal settlements and upgrading of the livingenvironment in areas housing lower income communities.These national priorities are, in turn,reflected in the municipal budgets.Source: Serageldin, et al, 2003a.
Box 3.10 Accounting for the financial cost of urban services
For some public services (particularly, water supply, sewerage,drainage and transport), operation and maintenance costsrepresent small inputs in terms of economic resource usecompared to the massive quantities of land, buildings,infrastructure and equipment that are in constant use to keepthe systems functioning.Yet, despite this large input of fixedassets, there has been a great reluctance, all over the world, toaccount for their employment. Consequently, public servicedecisions, especially with regard to the pricing of services, areoften made on the basis of cash-flow data for operatingexpenses.
Currently, more recognition is being given to the needfor comprehensive cost analysis and accounting for fixed assets.Depreciation costs are charged in operating statements.The networth of fixed assets is periodically revalued to its current valueand the operating statements are charged with notionalinterest, reflecting the opportunity cost of capital invested.Reform of existing systems and the transition to newer financialsystems usually take several years to implement.To prepare andupdate an inventory of fully recorded and valued fixed assets,the local government or other service delivery unit requiresspecialized personnel whom local governments may notnecessarily have in house.They must either build this capacity orprocure the services by contracting out.
Worldwide, progress is being made on the institution ofmore transparent systems in local financial management. For
example, two of the world’s largest countries, Russia andIndonesia, have very different cultures and histories.Yet, in eachone, during the past few years, laws have been promulgated thatwill require the use of full accrual accounting in state and localgovernments. St. Petersburg in Russia and a few other majorcities began this reform during the 1990s. As housing andshelter are among Russia’s most pressing social concerns,financing and budgeting for this sector need to undergo acomplete overhaul. In Indonesia, capacity-building is helping localauthorities to implement accrual-based budgeting; but progressis still slow.
Less ambitious trends have appeared in smallercountries. For example, in 2003 Macedonia conducted a seriesof national seminars sponsored by the United NationsDevelopment Programme (UNDP) on ‘Strengthening Local Self-governing Institutions in Macedonia, through CapitalDevelopment,Transparency and Financial Accountability’, tobuild capacity as a first step in the reform of local financialsystems. In the poorer countries, donor-sponsored fiscaldecentralization includes the development andinstitutionalization of accounting reforms to ensure that thesystems meet donor requirements. Capacity-building isextended to local governments to ensure properimplementation of the new systems, often starting with pilotinitiatives.Source: Serageldin et al, 2004
Accountability requires some measurement ofperformance, and – since the mid 1980s – localgovernments in Western Europe, the UK and the US havestarted to measure the real costs of delivering publicservices. Accrual-based multi-year budgeting provides moreor less robust indicators of performance and is becoming amore common alternative to the traditional cash flow-basedlocal budgets (see Box 3.10). In developing countries, mostmunicipalities lack the capacity and resources to implementsophisticated monitoring of financial performance.Nevertheless, publicizing even crude, quantitative andqualitative indicators enhances community understanding ofurban management and development challenges andpromotes citizen participation in local governance.
PRIVATIZATION OFMUNICIPAL SERVICESKey features
Starting in the 1980s, ‘privatization’ became an internationaltrend embraced by countries all over the world, promptedby international and bilateral development organizationsadvocating the greater use of private-sector entities as themeans of improving the delivery of public services. Thistrend was sustained by instances of policy and regulatoryfailure, bureaucratic impediments and public-sectorinefficiencies in service delivery. Depending upon theproject or the service in question, there was a gradualrecognition and acceptance of the fact that privateenterprise, NGOs or CBOs could undertake the task moreefficiently and with greater effectiveness.
During the early years, there were massiveprivatizations of public utilities, in the electric power,telephone, transport, gas and other industries throughoutthe world, with little regard for the impact of the change ofownership upon the poor; nor was it adequately taken intoaccount that some utilities were natural monopolies wherethe discipline of competition, a major justification forprivatization, was substantially absent. Most of theseoutright privatizations concerned industries that werecontrolled by national or state governments. In manyinstances, along with its service delivery capability, theprivate sector has been able to supply much-needed capitalinvestment raised by using practices that were closed to thepublic sector or methods that the public sector was legallybarred from using, such as borrowing.
Privatization of local services entailed modificationsin existing procedures and the introduction of newmodalities of supply and delivery of services, including thecontracting out of all or part of individual services;public–private partnerships; franchises; and forcing internalservice units to compete on a commercial basis, as happenedin Eastern Europe. However, the scope for privatization atthe local level was limited to a relatively small number ofservices. These included public transport; water supply;solid waste management; a number of activities includingjanitorial and cleaning services; information processing andaccounting; landscaping; and vehicle and plant maintenance.
The success of the outcomes depends upon theparticularities of each situation and the viewpoints of keystakeholders.
In both developing and advanced economies,privatization has resulted in revenue-producing services,including water supply and solid waste management beinggradually taken over in the larger urban centres byspecialized multinational firms serving many localgovernment units. Although not complete monopolies, thesizes of many firms allow them to resort to predatory pricingto secure contracts in new locations and to exact costlyindemnities and guarantees from local governments. Manyof the activities are capital intensive and the high entry andexit costs make it difficult for potential competitors tocompete against entrenched interests. Concessions grantedto foreign enterprises also inhibit any substitution since thecancellation of the contract for unsatisfactory performancecarries heavy political and financial risks. The contractormust usually be indemnified and the sponsoring foreigngovernment placated, as occurred in Argentina.
Challenges of privatizing urban services
It becomes incumbent upon each locality to considerwhether it should separately manage each of the services itdelivers, or combine some services with one or more of itsneighbouring units. Local authorities, separately or jointly,can outsource the management and delivery of one or moreservices to private operators, non-profit organizations orcommunity groups. In Europe, there are strong incentivesfor inter-communal compacts; in some instances, as inFrance, national legislation mandates cooperation. Intransitional and developing countries, local authorities arereluctant to engage in joint action, which typically requiressome delegation of powers and sharing of revenues. In LatinAmerica, political affiliations create divisive forces thatimpede the development of joint activities.
Many local authorities in developing countries haveopted to establish separate operating units for some serviceswith their own assets, staffing and management. Theseenterprises are managed by a ‘board’ or a committee wherethe locality is represented. In transitional countries, thesesemi-independent entities were viewed as an intermediatestep in the process of privatization. This was particularly thecase for housing maintenance and solid waste management.Similarly, the various jurisdictions can choose to jointlycontract out combined service packages to a private-sectorentity, which might be either publicly or privately managedor supervised. The organizational structure and therepresentation of partners in decisions regarding all aspectsof management and finances will always be key concerns.
The experience of formal privatization in many citiesis that it has not benefited lower income communities,pointing to the need for the public sector to have a role indelivering essential services, especially within slum areas.The abolition of social rates and other forms of subsidizationof minimum consumption levels for basic services hasworked against the urban poor. Some NGOs have arguedthat poor urban families are unable to pay even the minimumcharges required for access to basic infrastructure and
The experience offormal privatization
in many cities isthat it has not
benefited lowerincome
communities
47Financing urban development
services, prompting the emergence of parallel systemsranging from well-managed facilities sponsored by NGOs andcharitable foundations to highly inadequate, poorly runinitiatives operated on an ad hoc basis by local groups withor without outside support.
Côte d’Ivoire illustrates the challenges of privatizingwater and sanitation services in a developing country andthe difficulties of addressing the needs of lower incomecommunities (see Box 3.11).
Joint funding of infrastructure and urban services
In China, provincial and local authorities increasingly lookto public–private partnerships as an option to fund orimplement infrastructure and urban development projects.Partnerships with private investors range from the grantingof concessions, to joint venture agreements, tobuild–operate–transfer (BOT) or build–own–operate–transfer (BOOT) schemes. The public sector provides landfor urban development and the construction ofinfrastructure and facilities (mostly new high-grade highwaysand toll roads). They also contribute repayable equity orloans. The private partners provide equity and shareholder
loans. Concessions and BOOT agreements are moreattractive to private investors – and foreign investors, inparticular – because they can offer security in the form ofguarantees of minimum revenue or profit, loss protection,repayment of capital, tax exemptions and other fiscalincentives, and preferential loan repayment terms. Provincialauthorities can use assets and revenue-backed securities tofinance their share of the investment.
Of special interest to poorer countries are solutionsbased on partnerships between municipalities, NGOs andCBOs. In these countries, integrating poorer communitieswithin the city fabric and giving the poor access to basicservices is hampered by the spread of chaotic urbanization,the mounting densities in the central zones, theobsolescence of existing conventional systems, and the lackof resources to maintain and upgrade existing systems.
To improve living conditions in the under-servicedcommunities, systems and networks using differenttechnologies and serving different population groups andgeographic areas must somehow be interlinked. Solid wastemanagement is one of the services most affected by theneed to merge traditional solutions with moderntechnologies. In West African cities, potable water supplycould also benefit from this approach. Cotonou’s (Benin)award-winning programmes demonstrate the importance oflinking formal and informal service providers.
Joint funding of community-based initiativesfor the delivery of basic services
Microcredit institutions have largely focused on givingmicroentrepreneurs the credit they need to start up andexpand their businesses (see Chapter 6). Recognizing theimportance of home-based income-generating activities,particularly for women, these institutions have started tooffer loans for housing. They have progressively expandedtheir lending to help poor families access land and basicinfrastructure services. Today, they have become keypartners in municipal initiatives to improve the livingconditions of poor households in both urban and rural areas.The experiences of Guatemala’s Genesis EmpresarialPROMUNI programme and the partnership between theAhmedabad Municipal Corporation and the Self-employedWomen’s Association (SEWA) Mahila Trust to upgrade slumsthrough the Parivartan programme illustrate the potential ofthese partnerships.
New trends in partnerships for localdevelopment
In developing countries, where decentralization is a recentor ongoing reform, municipalities are particularly reluctantto delegate authority or share revenue with their peerentities. This reluctance accounts for the difficultiesencountered in getting municipalities to collaborate on jointinitiatives. Formalizing collaboration through negotiatedagreements and inter-municipal compacts is an even morechallenging task as there are no institutional incentives thatfoster strategic associations other than through external aidentities. The successful initiatives mostly focus on economic
48 Economic and urban development context
Box 3.11 Granting concessions for the operation of revenue-earning services: the experience of Abidjan, Côte d’Ivoire
Abidjan, Côte d’Ivoire, has a long history of granting concessions, having retained privatelyoperated utilities and services. Before the disruptions and chaotic environment brought aboutby wars and civil strife, Abidjan’s services functioned remarkably well compared to thesituation prevailing in neighbouring countries. Communes within Abidjan’s administrativeboundaries paid the city an annual contribution for the services provided according to aformula combining population and revenue.
A French water company, la Société de Distribution d’Eau de Côte d’Ivoire (SODECI),had the concession for operating the water supply system. It was also awarded a contract formaintaining the sewerage and drainage system.These contracts contained clauses that shieldedthe company and shifted any risk involved in the operation of the system to the government.Even then, subsidized connections for poor households were abolished under the structuraladjustment programme, and the vast majority of lower income renters now purchase theirwater from property owners, shopkeepers and water vendors. Despite the fact that itscontract contained a clause entitling the company to compensation for any discrepancybetween actual consumption and the estimates developed by the Water Directorate (the basisfor negotiating concession contracts), the company contended that the maintenance ofunderutilized systems is inefficient, and periodically shuts off the mains supplying areas withhigh concentrations of low-cost rental housing and squatter settlements in a futile attempt toput the water vendors out of business.
The company’s performance regarding the maintenance of the sanitation network washighly inadequate. Frequent obstructions, primarily due to defective solid waste management,were not attended to promptly despite the fact that local authorities were charged high feesfor the service. However, the company’s sunk investment in plant and equipment and itspresence on the ground gave it a virtual monopoly, as competitors were unable to match theterms it offered.
Abidjan’s solid waste management was also privatized.The different companies thatwere contracted covered the primary road network system and the main market areas.Theirtrucks were ill adapted to the high organic content of the wastes.They collected trash andgarbage deposited in bins and dumpsters.The service was too infrequent for an equatorialcountry. Waste spilled from overflowing dumpsters was not collected.Source: Serageldin, 1990; Center for Urban Development Studies, 2000.

development, as in the case of the ABC Region19 in GreaterSão Paulo, Brazil, where seven municipalities have to copewith economic restructuring and the rebuilding of the localeconomy based on new growth sectors following the declineof the automotive industry.
The difficulties encountered in mobilizing andstructuring alliances of stakeholders to promote localdevelopment are illustrated by the experiences from CentralAmerica. It has become clear that in poor regions bypassedby development, programmes promoting development mustalso foster social inclusion. Inter-municipal initiatives cansignificantly enhance the effectiveness of these efforts, as inthe case of the Valle de Sula Metropolitan Area strategicassociation in Honduras. The challenge is to overcomedistrust and apprehension. The participatory processrequired to reach consensus on objectives, operatingmodalities and action plans takes anywhere from two to threeyears, and the institutional framework must be organizedbefore any activities can be initiated. Implementation ofpartnership agreements often requires the creation of a largenumber of assemblies, committees, boards and delegationsthat may become cumbersome to the point of reducing theeffectiveness of the alliances. San Andres Valley, San Salvador,illustrates the benefits of forging stakeholder alliances.20
SUMMING UP: ASSESSINGTHE EFFECTIVENESS ANDIMPACTS OF MUNICIPALFINANCE SYSTEMSMunicipal finance and sustainable urbandevelopment
Municipal finance heavily influences the ability of localgovernments to meet the environmental and social goals ofsustainable urban development and, in particular, to addressissues of shelter delivery, poverty reduction and socialinclusion. Sustainable urban development requiressignificant capital and operating expenditures, especially insituations where urban expansion depends upon theperiodic extension of infrastructure systems. In particular,making services available to low-income familiesnecessitates substantial subsidies that municipalities havebeen unable to generate from their own revenues. Unlessthe inequities generated by globalization, decentralization,central–local fiscal relations, and the dynamics of urbangrowth are addressed, the sustainability of urbandevelopment and shelter delivery, primarily in developingcountries, will remain highly problematic.
In many parts of the world, including advancedeconomies, globalization has affected the financial resourcesof both national and local governments as taxable economicactivities move to other locations. The situation is furtheraggravated by the increased local fiscal burden resultingfrom the shifting of responsibility for infrastructureinvestment and the delivery of services to localgovernments. Additional complexity is introduced by newdevelopments that overlap municipal boundaries and impose
an unexpected financial burden on the localities housingpoorer populations or receiving migrants. Households inthese under-serviced communities and outlying areas haveto pay more per unit cost for inferior-quality services.
Municipalities are faced with a mismatch betweentheir newly acquired responsibilities to provide services andfund capital improvements and a lack of control over theirrevenue sources. The resulting scaling-back of publicexpenditures on both capital investment and socialprogrammes is having an adverse effect on urbandevelopment and is impeding the achievement of theMillennium Development Goals.
In the poorer countries, the deterioration of existinginfrastructure and the inability to meet the demands createdby rapid urbanization have led to chaotic urbanization, theproliferation of informal settlements and the emergence ofinformal providers of basic services. This has beenparticularly the case for water supply in Tanzania, Botswana,Kenya, Mauritania and Benin. As will be shown in Chapter 7,NGOs have contributed to the alleviation of hardshipsendured by the poor and provided them with some services.Their interventions have targeted specific communitiesselected in accordance with their own objectives and criteria.
Programmes addressing the social dimension of urbandevelopment are still largely dependent uponintergovernmental transfers or international aid. Debt swapsand discounted debt under the Heavily Indebted PoorCountries initiative are only beginning to be used to financeenvironmental and social programmes, mostly through localNGOs and CBOs. Bolivia is an exceptional case where fundsare channelled through local authorities. The integration ofthese new sources into the pool of resources available tofinance urban development could open up newopportunities well worth exploring.
Municipal finance and the delivery of landand services
The effectiveness of municipal authorities to improve thesupply of serviced land and to deliver basic services is clearlya function of both the pace of the development they faceand the country’s level of economic development. Generally,the advanced and some transitional economies have both thefinancial and administrative resources to managedevelopment and provide urban residents with servicesranging from adequate to good. Stable or decliningpopulations have facilitated this task. In contrast, the poorercountries have, for the most part, been unable to keep upwith the demand for serviced land or provide adequate basicservices to a growing percentage of their rapidly expandingurban populations. The major obstacles they face are:
• inadequate financial resources to pay for the deliveryof services to a growing population;
• limited or no access to capital resources to financeinvestments in infrastructure; and
• lack of institutional capacity to prepare mid- and long-term development strategies and the capitalimprovement programmes necessary to implementthem.
Municipal financeheavily influencesthe ability of local
governments tomeet the
environmental andsocial goals of
sustainable urbandevelopment
Globalization hasaffected the
financial resourcesof both national and
local governmentsas taxable economic
activities move toother locations
49Financing urban development
Few municipalities have complete authority over taxation.In many countries, high-yield tax bases are still largelycontrolled by the central government and are not likely tobe turned over to the local level in the near future, as statedearlier. Even though local governments are nominallyresponsible for managing their affairs, their real autonomy isrestricted by the dominant role the national governmentcontinues to play in determining the local tax base, and inthe collection and redistribution of tax revenue.
A generalized lack of resources and the difficulty inaccessing capital markets impedes the preparation of long-term capital improvement programmes. Brazil’s municipalreforms that imposed fiscal management standards, limitedpersonnel expenditures and mandated the preparation ofmulti-year capital improvement programmes is anexceptional case. Elsewhere, the preparation of multi-yearbudgets is gradually being introduced as a mandatoryrequirement in national public finance regulations.
Financial constraints are reflected in two generalizedtrends: the lack of funds for maintaining existing assets andthe inability of many municipalities to undertake the capitalimprovements needed to keep up with urban growth, letalone guide urbanization and development. While somecountries, such as South Africa, have provided grants forcapital investment in infrastructure, central funds aregenerally in short supply in most parts of the world and areoften channelled to larger cities. As a result, it is notuncommon for existing infrastructure to deteriorate as aresult of a lack of maintenance.
To circumvent legal, regulatory and fiscal constraintson their budgets, local governments in both advanced anddeveloping countries are developing means to finance urbandevelopment and public improvements as off-budgetexpenditures through special purpose vehicles, as in China,and assessments and impact fees requiring privatedevelopers to pay part of the public infrastructure neededfor their projects – a common practice in the US and sometransitional economies.
In developing countries, medium and smallmunicipalities lack the technical skills to prepare thecoherent urban investment strategies required to accessgrants and loans from donors and municipal developmentfunds. Santo Andre in Brazil and Szczecin in Poland standout as successful examples of a forceful commitment toinstitute the reforms needed for financial planning andmanagement, and a determined effort to leverage localresources, access credit finance and obtain funding frommultilateral and bilateral organizations.
Strengthening the capacity of municipalities to planand manage their economic, spatial and social development,disseminating information on successful approaches, andproviding the institutional framework to support reforminitiatives remain a major challenge worldwide. In adverseeconomic conditions or institutionally fragile environments,building the capacity of weak municipalities requires longer-term support that has to be provided by strong locally basedinstitutions. Sponsoring local capacity-building institutionsis an effective mechanism fostering the achievement of theMDGs.
Impact of decentralization upon municipalfinance and service delivery
With the exception of the advanced economies where atleast the larger cities have substantial experience inmanaging their finances, the devolution of functionalresponsibilities has presented local governments with amajor challenge, often compounded by adverse economicand political conditions. In Eastern and Central Europeancountries, local political autonomy, links to the West andparticipation in regional and international networks, andhopes of eventual accession to the EU help to cushion theburdens of devolution. Grants extended to promote social,economic and environmental objectives have providedneeded funding for urban projects.
In Africa, Asia and Latin America, transfers fromcentral governments have declined steadily, particularly forlarger cities, and charting an appropriate course fordecentralization without disrupting the delivery of basicservices devolved to the local level has proved to be adifficult task. Only a few countries have formulatedsuccessful policies to redistribute resources that are moreefficiently collected at the national level and have equalizedthe burden on municipalities that are economically weak orface higher per capita expenditures. Effective instrumentsused to foster a smooth decentralization include:
• local statutory rights guaranteed by the constitutionor by national legislation;
• the mandatory transfer of shared tax revenues;• formula-based redistribution favouring smaller and
fiscally weaker municipalities;• the sharing of fiscal revenue through formulae that
take into account concentrations of poverty; and• intergovernmental agreements and inter-municipal
compacts and joint initiatives.
The experiences of Brazil, Bolivia and South Africa stand outin this respect. Other countries, such as Indonesia, have hadto undertake successive adjustments to correct seriousimbalances that affect the economic and social life of theircitizens. Even municipalities in the poorest countries havemade considerable efforts in reducing their reliance upondwindling transfers from central governments. Despiteadverse economic conditions, local authorities in East andWest Africa have managed to increase the contribution oflocally collected taxes. In the countries of the West AfricanEconomic and Monetary Union, these taxes now account forclose to 50 per cent of municipal revenue, a significantincrease over a relatively short time. In Burkina Faso,‘communes’ do not receive any transfers from the nationalgovernment.
A growing demand for accountability and transparencyin municipal budgeting has accompanied political and fiscaldecentralization. There is a marked trend for more rigorousfinancial management, clear procedures for the allocation ofresources and the participation of residents in decisionsaffecting their communities. Of particular interest is thetransparency mandated by the Brazilian legislation and thespread of participatory budgeting.
Despite adverseeconomicconditions, localauthorities in Eastand West Africahave managed toincrease thecontribution oflocally collectedtaxes
50 Economic and urban development context
Impact of privatization upon municipalfinance and service delivery
Privatization of public service delivery requires many yearsof operation for comprehensive and robust evidence toemerge regarding the extent of success or failure. But thereis evidence that the outcomes have not always matched theexpectations. More rigorous analysis is needed to determinein each situation whether private profits are engendered bygenuine economic efficiency of operations, or by allowingthe plant and equipment to continue deteriorating, or byraising prices to levels beyond the means of lower incomecommunities, as happened in some Latin Americancountries. Moreover, the ability of private operators to cashout or withdraw allows them to increase profits by under-funding or deferring expenditures on replacement andpreventive maintenance. When the private contractor walksaway from essential services, the public sector has to pickup the operations.
Reversing or modifying a particular mode of servicedelivery – publicly or privately provided, or contracted out –is not simple. Many activities are capital intensive or havesignificant institutional implications. These entry or exitcosts can be quite high and make it difficult for potentialcompetitors to compete against entrenched interests, ashappens in many concession situations in developingeconomies. Privatization and, in particular, the awarding ofconcessions have not been devoid of corruption, includinglower initial bid prices to win, followed by later requests forcontract amendments.
In developing economies and, in particular, in thepoorer countries, there is an urgent need to addressinequities in access to basic services. This is an issue thatprivatization will not resolve. Disparities result from a legacyof inadequate urban policies and ineffective responses,aggravated by the current dynamics of urban development.Many governments do provide subsidized access to poorfamilies and some, like South Africa, extend these subsidiesto cover minimum consumption levels. In the poorercountries, linking formal and informal service providersremains the most effective mechanism by which services tolower income communities can be provided and improved,as the experience of water supply and solid wastemanagement in Cotonou, Benin, demonstrates.
At both the national and local levels, privatizationprovides an expedient way around constraints on other typesof financing, especially for capital expenditures whererestrictions on public-sector borrowing exist. Privatizationhas, to some extent, shaken local government financialmanagement from an earlier complacency about budgetaryrigour and accountability. It has forced a much greaterattention upon cost recognition and control, leading toimproved accounting practices and a greater concern for therecovery of costs and the collection of payments when it waspreviously assumed that shortfalls would automatically becovered from general public revenues.
The financial discipline and commercial outlook ofcompeting private enterprise has forced publicadministrators to lower costs, achieve greater efficiency andimprove the quality of outputs. Opening up public servicesto market participation has created more opportunities forcompetition in the delivery of these services. The privatesector has introduced useful new products, more successfulactivities and labour-saving technologies to gain a greater‘return’ on the huge sums of money invested in publicservices. While privatization has forced governments toexamine entrenched practices and to consider alternativesfor their modification or replacement with considerablesuccess, it is not a panacea. There are many ways of involvingthe private sector in public service delivery on a rationalbasis short of outright privatization.
Public–private partnerships require significantdelegation of authority but can be very productive. Locallybased partnerships involving CBOs and microenterpriseshave provided successful means for empowerment and socialinclusion. Solid waste management and recycling havebecome prime mechanisms to simultaneously promoteenvironmental and social objectives. There are numerousaward-winning schemes worldwide such as Santo Andre, inBrazil, and the Scavenger communities, in the North-WestProvince, South Africa. Furthermore, in the poorestcountries, labour-intensive activities are important inproviding productive employment to impoverishedpopulations. Partnerships between local governments,communities and microenterprises can help to achieve theseobjectives.
Opening up publicservices to market
participation hascreated more
opportunities forcompetition in the
service delivery
51Financing urban development
1 This chapter is based on draftsprepared by a team of expertsled by Mona Serageldin,Harvard University, US.
2 UN-Habitat, 2003a.3 See UN Millennium Project
(2005b) for detail.4 See www.bestpractices.org.5 UN-Habitat, 1998.6 UN-Habitat, 2003a.
7 Alm et al, 2002; UNCHS, 2001.8 UN-Habitat, 1998.9 UN-Habitat, 1998.10 Shah and Thompson, 2002.11 See, for instance, Litvack et al,
1998.12 See, for instance, Steffensen
and Tidemand, 2004.13 Mosha, 2004.14 Freire et al, 2004.
15 Freire et al, 2004.16 Mathur et al, 2004.17 Brakarz, 2003.18 Brakarz, 2003.19 In 1990, the seven municipal
governments of the Regionestablished the IntermunicipalConsortium of the GreaterABC.The Greater ABC regionis located in the southeasternpart of the Greater São Paulo
metropolitan area (Brazil) andhas a population of 2.4 millioninhabitants, according to theIBGE Census of 2000. Its sevenmunicipalities are: Santo André,São Bernardo do Campo, SãoCaetano do Sul, Diadema,Mauá, Ribeirão Pires, RioGrande da Serra.
20 See the Statistical Annex inPart IV for detail.
NOTES


Despite its recognized economic and socialimportance, housing finance often remainsunderdeveloped in emerging economies.Residential lending is typically small, poorlyaccessible and depository based. Lendersremain vulnerable to significant credit, liquidityand interest rate risks. As a result, housingfinance is relatively expensive and oftenrationed. The importance of developing robustsystems of housing finance is paramount asemerging economy governments struggle tocope with population growth, rapidurbanization and rising expectations from agrowing middle class.2
HIGHLIGHTS Cost of houses and need for mortgage finance
The cost of a complete dwelling in the North is generally2.5 to 6 times the average annual salary.3 Indicative costssuggest very similar figures or higher figures for the South.The Housing Indicators Programme suggested the ratio wasas high as 12 for Algeria.4 For those planning and able topurchase property, it is very difficult to finance such costswithout a loan and generally such loans will need to be longterm (typically over 10 years and sometimes over 20 years).When the repayment period is to stretch for such aconsiderable period, a legal framework is required forlenders to be confident about the security of their finance –hence, the significance of mortgage finance in which theloan is secured on property. This is the predominant contextin which lending for a complete (or almost complete)dwelling takes place.
The primary emphasis in this chapter is on suchmortgage finance. This is generally provided by commercialcompanies and/or by the state through specialist housingfinance organizations. The majority of housing financeagencies only provide finance for completed units thatcomply with building regulations – Chapters 6 and 7consider those institutions that are concerned with theprovision of small loans. In some countries in the South,
mortgage finance may be available for an ‘almost complete’dwelling (together with title).5
Loans secured on the property only offer realisticcollateral for the lender if a claim on the property can beestablished and the property is sold to cover any remainingmonies owing on the loan in the case of default. As a result,there is a requirement for the legal capacity to registerproperty rights, transfer titles and foreclose on loans. Thereare also systemic requirements for mortgage finance.Sources of funding need to be appropriate, particularly withregard to the long-term nature of the loan commitment.Such financial systems are generally also dependent upon astable economy, notably to ensure that default rates areminimal (as borrowers maintain real incomes) and becauseof the multiple impacts of high levels of inflation. However,the experiences discussed in this chapter suggest that, in anumber of countries, the systems have been strong enoughto recover from the difficult economic situation experiencedin parts of the world during the 1990s.
Mortgage finance and poverty
The size of such loans (given the cost of properties) and therequirement for a deposit or down payment to cover asignificant part of the cost means that most householdsaccessing mortgage finance are those at the top or in themiddle of the income scale. As noted already, low-incomehouseholds may lack the finance for the down payment andare likely to lack formal legal title deeds; therefore, they areunlikely to be able to offer acceptable collateral. The poorface further problems in their search for housing finance.6
Other significant issues discussed in this chapter include thelack of verifiable incomes, the additional costs involved inthe process of purchase, and lending policies that impose aminimum loan size.
Despite such difficulties, one emerging global trendis the effort to extend mortgage finance to lower incomegroups, expanding the market for housing finance andincreasing formal homeownership. Such policies are partlycommercial and partly state led. The commercial interest isin extending financial services to a new group of people. Thelast two decades have been ones of financial deregulation,with increasing numbers of financial agencies and growing
C H A P T E R
MORTGAGE FINANCE:INSTITUTIONS AND MECHANISMS 1
4
competition in financial services. In many countries,governments have been behind strategies to extendmortgage finance to those who have traditionally beenunable to afford such loans. Governments have multiplereasons to support homeownership, including thesignificance of the construction industry for economicgrowth and prosperity, the significance of shelter for well-being (and poverty reduction), and the political popularity ofsuch policies. As discussed later in this chapter, they havefollowed numerous strategies, including providing financialsupport. Measures that have focused primarily on reducingthe cost of lending (notably through reductions in theinterest rate) and support to the system of mortgage finance(such as extending secondary markets and reducing risks)are considered in this chapter.7 Other measures haveincluded capital grants (direct demand subsidies), sometimeswith access to mortgage finance for additional loans (seeChapter 5). While government support has been widespread,it should also be noted that there is no universal agreementon the appropriateness of encouraging homeownership.8
The focus of this chapter is threefold:
1 to consider emerging trends in the provision ofmortgage finance and to summarize present termsand conditions of such finance;
2 in the context of this discussion, to look particularlyat the situation with regard to lower incomehouseholds who might be seeking mortgage financeand the affordability of such options for thesehouseholds; and
3 to look at emerging tensions and opportunities incurrent mortgage finance and to assess its potentialcontribution to addressing household needs forhousing finance.
RECENT TRENDSGeneral trends related to providers
In general, governments have sought to encouragehomeownership and have, in many cases, providedpreferential financing to influence consumer choice. In part,this reflects the multiple benefits of housing, combined withthe belief that citizens will take better care of the dwellingsif they own them and the knowledge that many householdswish to provide for themselves. One further factormotivating housing investment is the financial advantagearising from capital gains, as homeownership is oftenassociated with capital appreciation.9
There has been a general shift towards market-basedmechanisms for the provision of housing, with attempts toreduce subsidies and deregulate markets (Box 4.1).10 This isdue, in part, to the past ineffectiveness of housing strategiesthat have depended upon direct provision by the state. Thistrend is also consistent with the overall direction of macro-economic strategies during recent decades. With limitedstate funds (in the North and South) and few social providersbeyond the state, increasing access to housing meansincreasing the affordability of housing provided by themarket. Governments are (almost universally) seeking tostabilize or reduce state expenditures, and the scale of theirsupport is limited. In this context, many have actively soughtto encourage commercial companies to address the needs oflower income households. This fits more generally withinpolicies to liberalize financial services and encouragecompetition within this service sector. It is anticipated thatmore providers will reduce the cost of housing finance andtherefore contribute to easing affordability constraints.
As noted in the following chapters, this trend towardsmarket provision is significant in how it has influencedstrategies for social housing and has included, in at leastsome countries and some institutions, greater use of smallloans. There was a shift towards the market for those at thelower end of the income scale in the North. Such changesare one factor encouraging more homeownership in theNorth. However, the example of New Zealand also warnsagainst the dangers of generalization as, in this country, thenew policy towards market provision has replaced a previousstrategy that was considered to be more specificallyfavourable towards homeownership, while the new policyalso encourages private rental markets.11
Traditionally, mortgage agencies have focused on aspecific set of users (such as those saving regularly or makingpayroll contributions). The preferential circumstancesfavouring these groups (notably lower interest rates) meanthat other financial institutions may have been reluctant toenter the market. In other cases, they were simply unabledue to government policies. The shift to greater financialderegulation has meant that while mortgage finance used tobe the preserve of specialist lenders (commercial mortgagecompanies and/or state housing banks), other providers,including more conventional financial institutions, have nowbeen drawn into the market. In European Union (EU)countries, non-specialist financial institutions now accountfor more than 60 per cent of the mortgage market.12 In some
Governments havemultiple reasons tosupporthomeownership,including thesignificance of theconstructionindustry foreconomic growthand prosperity
56 Shelter finance: assessment of trends
Box 4.1 Reductions in general subsidies to housing
A survey of the Nordic countries,Western Europe and more highly liberalized systems showsthat there are clear tendencies to restrict general subsidies and deregulate financial andhousing markets.The greatest impact upon housing investment has come from the reduction inthe scale of direct subsidies for housing. In most countries, targeting towards particular typesof investment or households has become more significant.Two countries of particular interestare New Zealand and the Netherlands. In New Zealand, the whole range of subsidies and taxrelief has been removed to be replaced with market rents and prices, together with an‘accommodation allowance’ payable to low-income households of all tenures. In TheNetherlands, all existing supply-side subsidies have been rolled up into a single capital grant andreplaced with a system of privatized guarantees to assist both the social and owner-occupiedsector to raise finance.
There are three potential impacts of these very large reductions in general assistance.In most countries there have been significant falls in output in both social and private sectors.Second, there have been significant increases in risk in the finance market.This was particularlyobvious during house price falls during the early 1990s.To counter this trend, there has beensome increase in credit insurance and guarantees. Finally, there has been an impact upon prices,although this is hard to assess because of other influences. In social housing, costs haveincreased as a result of reduced supply-side subsidies.Source: Turner and Whitehead, 2002, pp172–173.

countries, providers previously came solely from thegovernment sector. New mortgage providers may becommercial financial institutions or, in some cases, mortgagecompanies. Many Southern countries now have access tomarket-rate housing finance, which was not the case 20years ago.13 The section on ‘Regional analysis’ discusses thistrend in more detail.
Table 4.1 illustrates the current range and diversityof providers of housing finance in South Africa. The tablelooks at all providers of housing finance both for mortgageand smaller loans. However, it does not include the kinds ofprogrammes discussed in Chapter 5, which are significantin South Africa as there is a state-financed capital subsidyscheme to assist the poor in addressing housing need.
However, precise assessments of the extent to whichthere has been a de-concentration of mortgage providersaway from state agencies, or those benefiting from stateconcessions, remains difficult. For example, while thenumbers of financial institutions in India has clearlyincreased (including those providing housing finance), anestimated 92 per cent of India’s banking sector remainsunder state control.14 In addition to the state’s overall
involvement in the finance sector, the state may beparticularly involved in the direct provision of mortgagefinance. Even where this is not the case, the state may stillseek to influence housing outcomes and make institutionalinterventions.
The aspirations of government to influence the scaleand quality of the housing stock through housing finance arelongstanding. Box 4.2 gives an example from Zambia of thecomplexity of state involvement in housing institutions andthe continuing aspirations of the state for involvement.Despite these attempts, the policies have not beensuccessful and housing need was estimated at 846,000 unitsin 1996.15 More generally, the performance of state-ownedhousing finance institutions in the South has been widelycriticized. One recent analysis of the performance of suchfinancial institutions concludes that mortgage lending in theSouth has not emerged as a financially viable housing financestrategy for the poor.16 It is suggested that ‘housing bankscreated with the help of donor agencies over the past 30years have gone bankrupt or moribund, evolved into full-fledged commercial banks (such as Capital Bank in Haiti), orbecome real estate-focused banks with very few poor clients
57Mortgage finance: institutions and mechanisms
Number Category Description of institution Products Examples
1 Wholesale finance institutions
1.1 Wholesale finance institutions Providers of wholesale finance facilities that may be used by housing Wholesale loans Mutual banksinstitutions for internal capital needs or for retail lending activities. Institutional loans Banks (e.g. Standard, Nedcor,
ABSA)
1.2 Specialist housing finance Specialist DFIs established with state support in order to increase Wholesale loans NHFC institutions the number and capacity of housing finance organizations through providing Institutional loans NURCHA
inter alia wholesale finance. Regulated by special statutes. RHLF TUHF
2 Retail finance institutions
2.1 Banks Commercial financial institutions regulated by Banks Act and Usury Act. Mortgage finance Members of the banking council
2.2 Non-bank lenders Institutions issuing medium to small loans or exempted for Securitized loans NHFC (Makhulong product)products of below 10,000 rand. Personal equity-backed loans South Africa home loans
2.3 Microfinance institutions These are a subsection of non-bank lenders that grant unsecured personal loans Unsecured small loans Members of the Microfinance which are exempted from the Usury Act (Usury Act Exemption Notice) Savings-backed microloans Regulatory Counciland regulated by the Microfinance Regulatory Council (MFRC).These include normal microfinance institutions, niche market lenders and NGO lenders.
2.4 Housing institutions Specialist housing institutions providing end-user financing for housing products Instalment sale products Rental housing institutions using innovative tenure arrangements. Rental tenure co-operatives (e.g. Johannesburg Housing Company)Regulated by various laws, including Instalment Sale (Alienation of Land Act, 1989). Social housing institutions (e.g. COPE
Housing Association)Instalment sale institutions (e.g. Cape Town Housing Company)
3 Savings institutions
3.1 Savings-linked credit institutions Housing savings schemes linked to the provision of credit by microfinance Savings-linked credit Instalment sale institutions institutions. (e.g. Cape Town Community Housing
Company)Finance institutions (e.g. uTshani Fund)
3.2 Specialist savings institutions Specialist institutions or schemes established to assist low-income households Savings schemes National Savings Scheme (NURCHA)to accrue savings for their ‘own contributions’ to subsidized housing.
4 Guarantors
4.1 Wholesale housing finance Institutions that underwrite or provide guarantees to the providers of Housing-specific wholesale NHFC (specialist guarantees)guarantors wholesale loans for housing purposes. finance guarantees NURCHA (OPIC bridging
‘Hardship cover’ guarantees for finance guarantees; Gauteng Rental rental institutions/SHIs Guarantee Fund guarantees for rental
institutions)HLGC (hardship cover guarantees on rental income streams for rental institutions)
4.2 End-user housing finance Institutions that provide guarantees to the providers of end-user housing Loan default guarantees HLGC guarantee productsguarantors finance (mortgage finance) on individual loans. AIDS guarantees
Note: see pp xviii–xxii for unabbreviated forms of acronyms and abbreviations in this table
The current range anddiversity of providers ofhousing finance inSouth Africa
Table 4.1
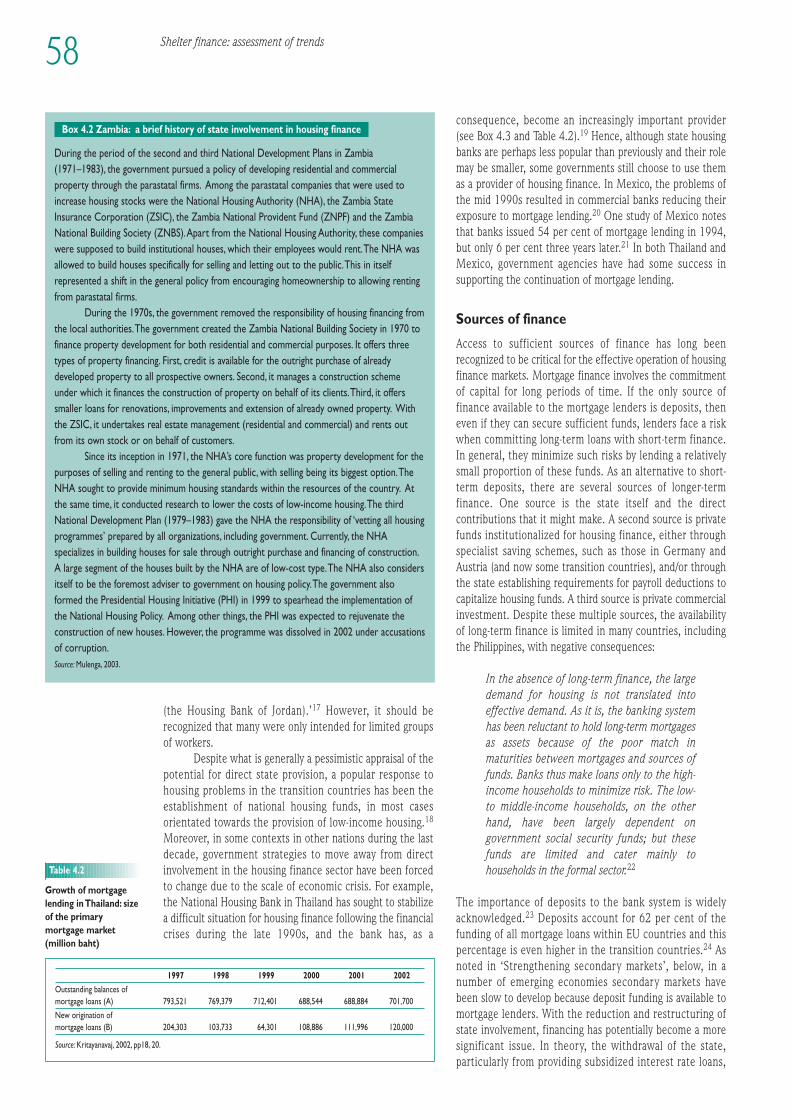
(the Housing Bank of Jordan).’17 However, it should berecognized that many were only intended for limited groupsof workers.
Despite what is generally a pessimistic appraisal of thepotential for direct state provision, a popular response tohousing problems in the transition countries has been theestablishment of national housing funds, in most casesorientated towards the provision of low-income housing.18
Moreover, in some contexts in other nations during the lastdecade, government strategies to move away from directinvolvement in the housing finance sector have been forcedto change due to the scale of economic crisis. For example,the National Housing Bank in Thailand has sought to stabilizea difficult situation for housing finance following the financialcrises during the late 1990s, and the bank has, as a
consequence, become an increasingly important provider(see Box 4.3 and Table 4.2).19 Hence, although state housingbanks are perhaps less popular than previously and their rolemay be smaller, some governments still choose to use themas a provider of housing finance. In Mexico, the problems ofthe mid 1990s resulted in commercial banks reducing theirexposure to mortgage lending.20 One study of Mexico notesthat banks issued 54 per cent of mortgage lending in 1994,but only 6 per cent three years later.21 In both Thailand andMexico, government agencies have had some success insupporting the continuation of mortgage lending.
Sources of finance
Access to sufficient sources of finance has long beenrecognized to be critical for the effective operation of housingfinance markets. Mortgage finance involves the commitmentof capital for long periods of time. If the only source offinance available to the mortgage lenders is deposits, theneven if they can secure sufficient funds, lenders face a riskwhen committing long-term loans with short-term finance.In general, they minimize such risks by lending a relativelysmall proportion of these funds. As an alternative to short-term deposits, there are several sources of longer-termfinance. One source is the state itself and the directcontributions that it might make. A second source is privatefunds institutionalized for housing finance, either throughspecialist saving schemes, such as those in Germany andAustria (and now some transition countries), and/or throughthe state establishing requirements for payroll deductions tocapitalize housing funds. A third source is private commercialinvestment. Despite these multiple sources, the availabilityof long-term finance is limited in many countries, includingthe Philippines, with negative consequences:
In the absence of long-term finance, the largedemand for housing is not translated intoeffective demand. As it is, the banking systemhas been reluctant to hold long-term mortgagesas assets because of the poor match inmaturities between mortgages and sources offunds. Banks thus make loans only to the high-income households to minimize risk. The low-to middle-income households, on the otherhand, have been largely dependent ongovernment social security funds; but thesefunds are limited and cater mainly tohouseholds in the formal sector.22
The importance of deposits to the bank system is widelyacknowledged.23 Deposits account for 62 per cent of thefunding of all mortgage loans within EU countries and thispercentage is even higher in the transition countries.24 Asnoted in ‘Strengthening secondary markets’, below, in anumber of emerging economies secondary markets havebeen slow to develop because deposit funding is available tomortgage lenders. With the reduction and restructuring ofstate involvement, financing has potentially become a moresignificant issue. In theory, the withdrawal of the state,particularly from providing subsidized interest rate loans,
58 Shelter finance: assessment of trends
Box 4.2 Zambia: a brief history of state involvement in housing finance
During the period of the second and third National Development Plans in Zambia(1971–1983), the government pursued a policy of developing residential and commercialproperty through the parastatal firms. Among the parastatal companies that were used toincrease housing stocks were the National Housing Authority (NHA), the Zambia StateInsurance Corporation (ZSIC), the Zambia National Provident Fund (ZNPF) and the ZambiaNational Building Society (ZNBS).Apart from the National Housing Authority, these companieswere supposed to build institutional houses, which their employees would rent.The NHA wasallowed to build houses specifically for selling and letting out to the public.This in itselfrepresented a shift in the general policy from encouraging homeownership to allowing rentingfrom parastatal firms.
During the 1970s, the government removed the responsibility of housing financing fromthe local authorities.The government created the Zambia National Building Society in 1970 tofinance property development for both residential and commercial purposes. It offers threetypes of property financing. First, credit is available for the outright purchase of alreadydeveloped property to all prospective owners. Second, it manages a construction schemeunder which it finances the construction of property on behalf of its clients.Third, it offerssmaller loans for renovations, improvements and extension of already owned property. Withthe ZSIC, it undertakes real estate management (residential and commercial) and rents outfrom its own stock or on behalf of customers.
Since its inception in 1971, the NHA’s core function was property development for thepurposes of selling and renting to the general public, with selling being its biggest option.TheNHA sought to provide minimum housing standards within the resources of the country. Atthe same time, it conducted research to lower the costs of low-income housing.The thirdNational Development Plan (1979–1983) gave the NHA the responsibility of ‘vetting all housingprogrammes’ prepared by all organizations, including government. Currently, the NHAspecializes in building houses for sale through outright purchase and financing of construction.A large segment of the houses built by the NHA are of low-cost type.The NHA also considersitself to be the foremost adviser to government on housing policy.The government alsoformed the Presidential Housing Initiative (PHI) in 1999 to spearhead the implementation ofthe National Housing Policy. Among other things, the PHI was expected to rejuvenate theconstruction of new houses. However, the programme was dissolved in 2002 under accusationsof corruption.Source: Mulenga, 2003.
1997 1998 1999 2000 2001 2002
Outstanding balances of mortgage loans (A) 793,521 769,379 712,401 688,544 688,884 701,700
New origination of mortgage loans (B) 204,303 103,733 64,301 108,886 111,996 120,000
Source: Kritayanavaj, 2002, pp18, 20.
Growth of mortgagelending in Thailand: sizeof the primarymortgage market(million baht)
Table 4.2

should have encouraged additional agencies into a morecommercially orientated market. Nevertheless, there areconcerns, notably in Asia and Latin America, that a lack ofcapital will inhibit lending and reduce the effectiveness ofhousing finance reforms. As a result, there have been anumber of efforts to strengthen secondary markets inhousing finance.25 The following discussion considers theseefforts, the need for them and their success.
While the state has become less significant in somecountries, it maintains a high level of involvement in others(see ‘Regional analysis’, below). Governments may havesimply been concerned to ensure sufficient cash flow intothe housing sector. In Latin America, for example, strategiesto raise the amount of loan finance available include the useof special payroll taxes, taxes on fuel, surcharges on sales taxand state lottery sales.26 A further source is the proceeds ofprivatization, which have been important in some countries– for example, the Housing Finance Company of Uganda inwhich such funds formed 50 per cent of the available capitalby 2000.27 And, as noted in the case of India, the state mayprovide capital finance to state-owned housing financecompanies for on-lending, notably in the case of the Housingand Urban Development Corporation Ltd (HUDCO).28
Budget allocations to 2001 were responsible for takingHUDCO’s total equity to US$204.1 million.
A notable further source of finance is employer andemployee contributions to payroll funds for housing.29
Country-level analyses suggest that they are of significancein countries as diverse as Mexico, Singapore and, now,China. In Nigeria, attempts have been made to extend theirsignificance, and there is now a mandatory contribution of2.5 per cent for workers with monthly incomes of over 3000Nigerian naira. Every commercial and merchant bank ismandated to invest 10 per cent of loans and advances in thefund and with further requirements on investmentcompanies; but there is a serious problem of compliance.30
Provident funds have also been used in some cases – withparticular effectiveness in Singapore. They are beingemployed in Bangladesh, Namibia and South Africa as asource of loan guarantees.
Strengthening secondary markets
The secondary market in mortgage finance developed tocope with the risks associated with short-term deposits andlonger-term loans. The US has led developments insecondary markets, which have become notably significantfrom the mid 1980s.31 For the last 25 years, there have beensignificant changes in mortgage finance with the growth ofinvolvement by the capital markets; this began in the US andspread to Europe and, more recently, is being explored inLatin America and Asia.32 In the transition countries,legislation to support the development of secondary marketsin housing finance has been introduced, or is beingintroduced, in the Czech and Slovak republics, Hungary,Poland and Latvia.33 Such growth, in Europe and beyond,partly reflects the integration of financial markets and theattractiveness of mortgage finance for internationalinvestors. European markets now include all three major
securities – structured covered bonds, agency bonds andmortgage-backed securities.34 In addition to specificmeasures to enable the investment of other financialinstitutions in mortgage lending, there has been the relatedtrend towards specialization. In the US, which is the globalleader in this respect, mortgage finance has becomeincreasingly complex with the growing division betweenaspects of the mortgage lending process: origination,servicing, funding and accepting credit risk. The shift inmodels is summarized in Figures 4.1 and 4.2.
The significance of the secondary market in the US isconsiderable, where most US mortgages are now sold –especially fixed rate mortgages, which take up 60 to 90 percent of the market.35 The government has supported the riseof specific institutions that have supported these financial
59Mortgage finance: institutions and mechanisms
Box 4.3 The role of the Government Housing Bank in Thailand
The Government Housing Bank was established in Thailand in 1953. Its major functions wereintended to be the mobilization of funds for on-lending, land subdivision and the constructionof houses for sale to the public. However, the bank was forced to be a developer due to a lackof alternatives. In 1972, the National Housing Authority was established to take on this role(among other activities) and this enabled the bank to focus on finance.
During the 1990s, the Government Housing Bank expanded its retail lending, andbetween 1990 and 1994 the number of retail branches grew from 10 to 100. Growthcontinued during the 1990s, and by mid 2002 the bank had 30 main branches in Bangkok, 30main branches elsewhere and 43 sub-branches. Between 1987 and 1997, the mortgage markethad expanded rapidly. In 1988, annual new home loan origination by all financial institutions inThailand was 40 million baht; but during the mid 1990s it reached over 200,000 million baht.However, the situation became particularly difficult during the financial disasters of the late1990s, when there was a crisis of confidence in financial institutions and several collapsed.Thehousing market went into a slump, in part because there was a significant oversupply as a resultof speculative building. In 1994, there were 253,000 new housing units offered in the BangkokMetropolitan Region; by 1998, this had fallen to 1000, rising to 6000 in 2001.
The total number of home mortgages outstanding in Thailand had risen to a peak of794,000 in 1997.The consequence of a speculative market and falling prices resulted in a rapidrise in non-performing loans. In 1997, the ratio of non-performing loans reached more than 30per cent (although by the end of 2001 it had fallen back to about 23 per cent). By June 2002,the Government Housing Bank had a non-performing loan ratio of 17.4 per cent, stillconsidered to be too high.
As a result of the crises of the late 1990s, commercial firms tended to withdraw fromthe market and reduce their lending. However, the bank sought to stimulate newdevelopments.The mortgage rate was kept low for low- and lower middle-income groups. Itsshare of the market in outstanding home loans increased from about 20 per cent during theearly 1990s to almost 40 per cent by the first years of the new millennium. By the end ofMarch 2002, the bank had outstanding home loans totalling about 280,000 million baht and wasservicing 700,000 borrowers.
The Government Housing Bank has sought to offer low interest rates due to efficiencyand a desire for growth, and in order to assist entry into homeownership. It offers lower rateson the smallest loans (less than 1 million baht and some 90 per cent of borrowers) with across-subsidy between high- and low-value loans. In order to increase affordability after thefinancial crisis, repayment periods were increased to 30 years and loan-to-value ratios rose to90–100 per cent.This willingness to lend reflects, in part, the strategy of the government, whichis to use housing development as part of its economic policy and to be willing to stimulate theeconomy through housing. Its strategies include a low interest rate for lower incomeborrowers, a further interest rate reduction for state employees and the possibility forborrowers to fix interest rates for three to five years (thereby reducing their risk).Source: Kritayanavaj, 2002, p15.
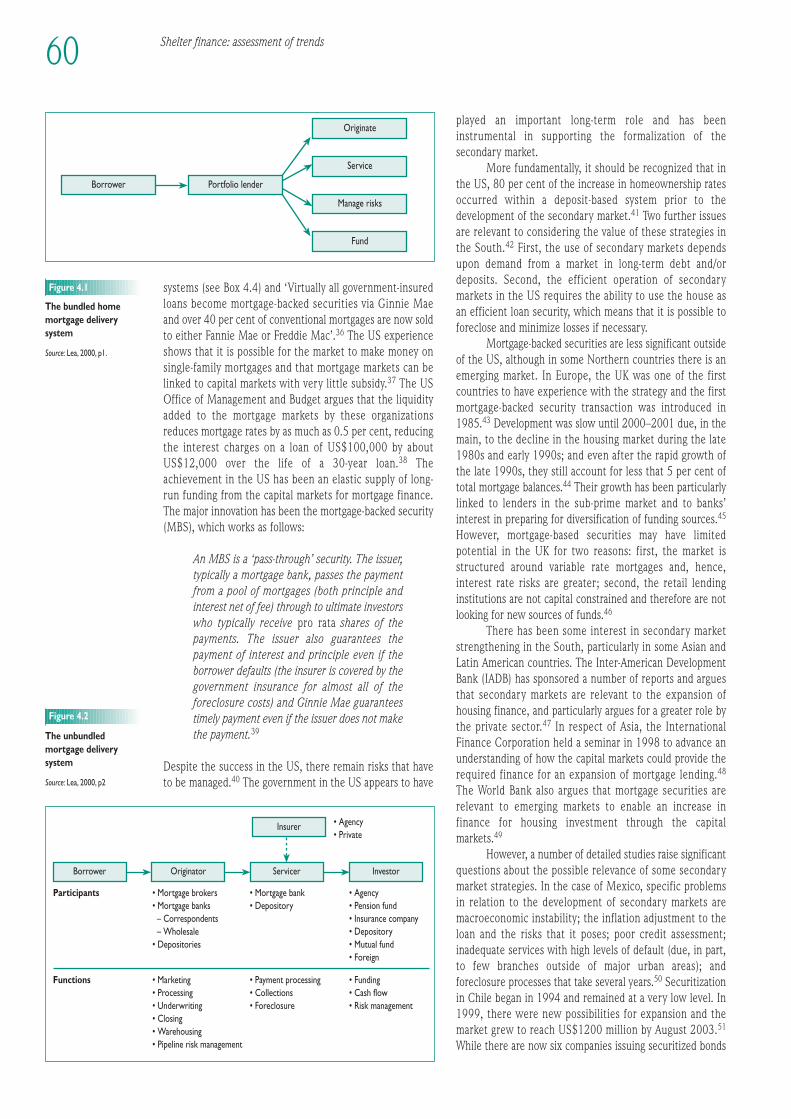
systems (see Box 4.4) and ‘Virtually all government-insuredloans become mortgage-backed securities via Ginnie Maeand over 40 per cent of conventional mortgages are now soldto either Fannie Mae or Freddie Mac’.36 The US experienceshows that it is possible for the market to make money onsingle-family mortgages and that mortgage markets can belinked to capital markets with very little subsidy.37 The USOffice of Management and Budget argues that the liquidityadded to the mortgage markets by these organizationsreduces mortgage rates by as much as 0.5 per cent, reducingthe interest charges on a loan of US$100,000 by aboutUS$12,000 over the life of a 30-year loan.38 Theachievement in the US has been an elastic supply of long-run funding from the capital markets for mortgage finance.The major innovation has been the mortgage-backed security(MBS), which works as follows:
An MBS is a ‘pass-through’ security. The issuer,typically a mortgage bank, passes the paymentfrom a pool of mortgages (both principle andinterest net of fee) through to ultimate investorswho typically receive pro rata shares of thepayments. The issuer also guarantees thepayment of interest and principle even if theborrower defaults (the insurer is covered by thegovernment insurance for almost all of theforeclosure costs) and Ginnie Mae guaranteestimely payment even if the issuer does not makethe payment.39
Despite the success in the US, there remain risks that haveto be managed.40 The government in the US appears to have
played an important long-term role and has beeninstrumental in supporting the formalization of thesecondary market.
More fundamentally, it should be recognized that inthe US, 80 per cent of the increase in homeownership ratesoccurred within a deposit-based system prior to thedevelopment of the secondary market.41 Two further issuesare relevant to considering the value of these strategies inthe South.42 First, the use of secondary markets dependsupon demand from a market in long-term debt and/ordeposits. Second, the efficient operation of secondarymarkets in the US requires the ability to use the house asan efficient loan security, which means that it is possible toforeclose and minimize losses if necessary.
Mortgage-backed securities are less significant outsideof the US, although in some Northern countries there is anemerging market. In Europe, the UK was one of the firstcountries to have experience with the strategy and the firstmortgage-backed security transaction was introduced in1985.43 Development was slow until 2000–2001 due, in themain, to the decline in the housing market during the late1980s and early 1990s; and even after the rapid growth ofthe late 1990s, they still account for less that 5 per cent oftotal mortgage balances.44 Their growth has been particularlylinked to lenders in the sub-prime market and to banks’interest in preparing for diversification of funding sources.45
However, mortgage-based securities may have limitedpotential in the UK for two reasons: first, the market isstructured around variable rate mortgages and, hence,interest rate risks are greater; second, the retail lendinginstitutions are not capital constrained and therefore are notlooking for new sources of funds.46
There has been some interest in secondary marketstrengthening in the South, particularly in some Asian andLatin American countries. The Inter-American DevelopmentBank (IADB) has sponsored a number of reports and arguesthat secondary markets are relevant to the expansion ofhousing finance, and particularly argues for a greater role bythe private sector.47 In respect of Asia, the InternationalFinance Corporation held a seminar in 1998 to advance anunderstanding of how the capital markets could provide therequired finance for an expansion of mortgage lending.48
The World Bank also argues that mortgage securities arerelevant to emerging markets to enable an increase infinance for housing investment through the capitalmarkets.49
However, a number of detailed studies raise significantquestions about the possible relevance of some secondarymarket strategies. In the case of Mexico, specific problemsin relation to the development of secondary markets aremacroeconomic instability; the inflation adjustment to theloan and the risks that it poses; poor credit assessment;inadequate services with high levels of default (due, in part,to few branches outside of major urban areas); andforeclosure processes that take several years.50 Securitizationin Chile began in 1994 and remained at a very low level. In1999, there were new possibilities for expansion and themarket grew to reach US$1200 million by August 2003.51
While there are now six companies issuing securitized bonds
60 Shelter finance: assessment of trends
The bundled homemortgage deliverysystem
Source: Lea, 2000, p1.
Figure 4.1
The unbundledmortgage deliverysystem
Source: Lea, 2000, p2
Figure 4.2
Borrower Portfolio lender
Originate
Service
Manage risks
Fund
Borrower Originator
Insurer
Servicer Investor
• Agency• Private
Participants • Mortgage brokers• Mortgage banks – Correspondents – Wholesale• Depositories
• Mortgage bank• Depository
• Agency• Pension fund• Insurance company• Depository• Mutual fund• Foreign
Functions • Marketing• Processing• Underwriting• Closing• Warehousing• Pipeline risk management
• Payment processing• Collections• Foreclosure
• Funding• Cash flow• Risk management
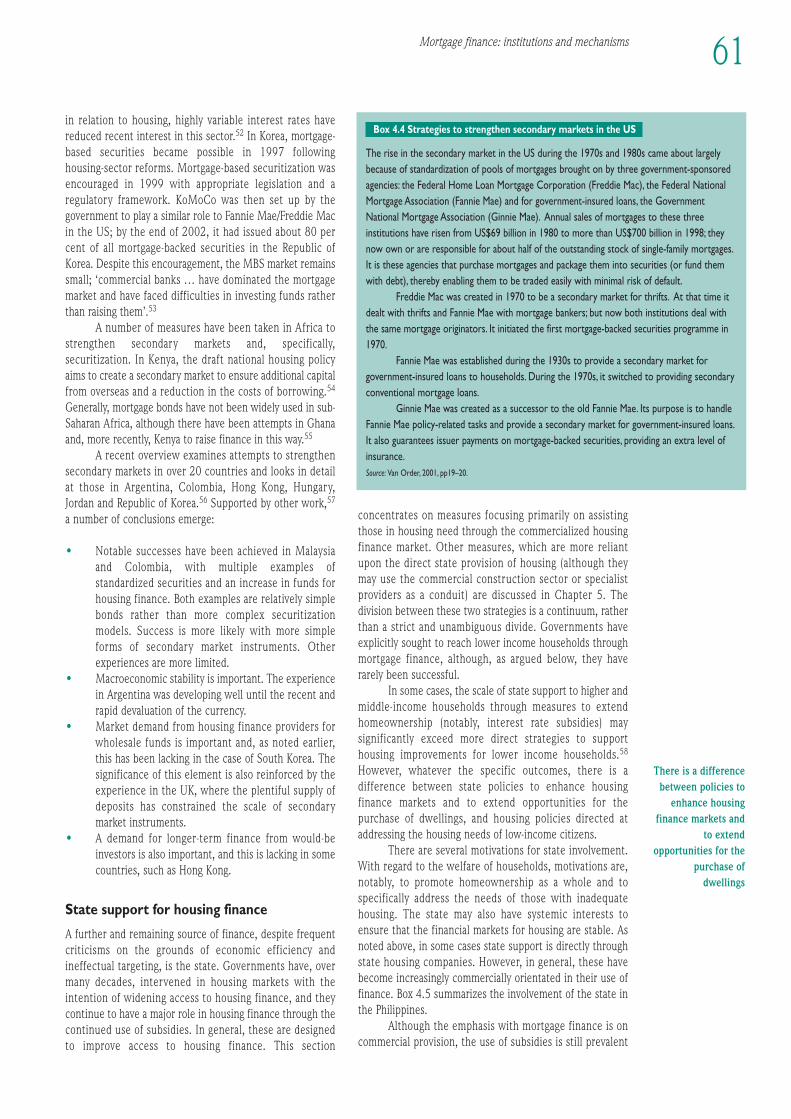
in relation to housing, highly variable interest rates havereduced recent interest in this sector.52 In Korea, mortgage-based securities became possible in 1997 followinghousing-sector reforms. Mortgage-based securitization wasencouraged in 1999 with appropriate legislation and aregulatory framework. KoMoCo was then set up by thegovernment to play a similar role to Fannie Mae/Freddie Macin the US; by the end of 2002, it had issued about 80 percent of all mortgage-backed securities in the Republic ofKorea. Despite this encouragement, the MBS market remainssmall; ‘commercial banks … have dominated the mortgagemarket and have faced difficulties in investing funds ratherthan raising them’.53
A number of measures have been taken in Africa tostrengthen secondary markets and, specifically,securitization. In Kenya, the draft national housing policyaims to create a secondary market to ensure additional capitalfrom overseas and a reduction in the costs of borrowing.54
Generally, mortgage bonds have not been widely used in sub-Saharan Africa, although there have been attempts in Ghanaand, more recently, Kenya to raise finance in this way.55
A recent overview examines attempts to strengthensecondary markets in over 20 countries and looks in detailat those in Argentina, Colombia, Hong Kong, Hungary,Jordan and Republic of Korea.56 Supported by other work,57
a number of conclusions emerge:
• Notable successes have been achieved in Malaysiaand Colombia, with multiple examples ofstandardized securities and an increase in funds forhousing finance. Both examples are relatively simplebonds rather than more complex securitizationmodels. Success is more likely with more simpleforms of secondary market instruments. Otherexperiences are more limited.
• Macroeconomic stability is important. The experiencein Argentina was developing well until the recent andrapid devaluation of the currency.
• Market demand from housing finance providers forwholesale funds is important and, as noted earlier,this has been lacking in the case of South Korea. Thesignificance of this element is also reinforced by theexperience in the UK, where the plentiful supply ofdeposits has constrained the scale of secondarymarket instruments.
• A demand for longer-term finance from would-beinvestors is also important, and this is lacking in somecountries, such as Hong Kong.
State support for housing finance
A further and remaining source of finance, despite frequentcriticisms on the grounds of economic efficiency andineffectual targeting, is the state. Governments have, overmany decades, intervened in housing markets with theintention of widening access to housing finance, and theycontinue to have a major role in housing finance through thecontinued use of subsidies. In general, these are designedto improve access to housing finance. This section
concentrates on measures focusing primarily on assistingthose in housing need through the commercialized housingfinance market. Other measures, which are more reliantupon the direct state provision of housing (although theymay use the commercial construction sector or specialistproviders as a conduit) are discussed in Chapter 5. Thedivision between these two strategies is a continuum, ratherthan a strict and unambiguous divide. Governments haveexplicitly sought to reach lower income households throughmortgage finance, although, as argued below, they haverarely been successful.
In some cases, the scale of state support to higher andmiddle-income households through measures to extendhomeownership (notably, interest rate subsidies) maysignificantly exceed more direct strategies to supporthousing improvements for lower income households.58
However, whatever the specific outcomes, there is adifference between state policies to enhance housingfinance markets and to extend opportunities for thepurchase of dwellings, and housing policies directed ataddressing the housing needs of low-income citizens.
There are several motivations for state involvement.With regard to the welfare of households, motivations are,notably, to promote homeownership as a whole and tospecifically address the needs of those with inadequatehousing. The state may also have systemic interests toensure that the financial markets for housing are stable. Asnoted above, in some cases state support is directly throughstate housing companies. However, in general, these havebecome increasingly commercially orientated in their use offinance. Box 4.5 summarizes the involvement of the state inthe Philippines.
Although the emphasis with mortgage finance is oncommercial provision, the use of subsidies is still prevalent
There is a differencebetween policies to
enhance housingfinance markets and
to extendopportunities for the
purchase ofdwellings
61Mortgage finance: institutions and mechanisms
Box 4.4 Strategies to strengthen secondary markets in the US
The rise in the secondary market in the US during the 1970s and 1980s came about largelybecause of standardization of pools of mortgages brought on by three government-sponsoredagencies: the Federal Home Loan Mortgage Corporation (Freddie Mac), the Federal NationalMortgage Association (Fannie Mae) and for government-insured loans, the GovernmentNational Mortgage Association (Ginnie Mae). Annual sales of mortgages to these threeinstitutions have risen from US$69 billion in 1980 to more than US$700 billion in 1998; theynow own or are responsible for about half of the outstanding stock of single-family mortgages.It is these agencies that purchase mortgages and package them into securities (or fund themwith debt), thereby enabling them to be traded easily with minimal risk of default.
Freddie Mac was created in 1970 to be a secondary market for thrifts. At that time itdealt with thrifts and Fannie Mae with mortgage bankers; but now both institutions deal withthe same mortgage originators. It initiated the first mortgage-backed securities programme in1970.
Fannie Mae was established during the 1930s to provide a secondary market forgovernment-insured loans to households. During the 1970s, it switched to providing secondaryconventional mortgage loans.
Ginnie Mae was created as a successor to the old Fannie Mae. Its purpose is to handleFannie Mae policy-related tasks and provide a secondary market for government-insured loans.It also guarantees issuer payments on mortgage-backed securities, providing an extra level ofinsurance.Source: Van Order, 2001, pp19–20.

in some contexts. The popularity of attaching subsidies tofinance continues, in part to meet the ‘social goals andexpectations of the middle and lower-middle classes’.59
Their scale is often significant, even in countries in whichcommercial mortgage systems are advanced. In France, forexample, during 1990, 23 per cent of mortgages still had asubsidy.60 Such programmes are indicative of the supportgiven to housing both for issues of social need and, morelikely given the income groups that benefit from suchmeasures, political popularity.
Table 4.3 summarizes common strategies to increasehomeownership through the enhanced provision of finance.It draws upon experiences in the North and particularlyWestern Europe, although such strategies have been widelyused in many other countries. One further strategyemployed in some countries is the more direct involvementof the state in housing construction, with governmentsseeking to address housing needs by expanding the supply
of suitable dwellings and/or lowering the price for owneroccupiers. In the West European context, this strategy hasnot been significant, except in Spain, where banks wereobliged to invest in housing at sub-market returns, with thecost reduction theoretically passed on to the ultimateoccupant.61 However, in some countries in the South itremains popular, although it has not often been effective atscale.
A more recent shift, discussed in Chapter 5, has beensubsidies designed to augment the payment capacity of thepoor (direct-demand subsidies). The strategy has beenstrongly associated with a number of countries, includingChile, where state-subsidized housing is a very significantcomponent of new housing construction, with thegovernment at least partially financing between 58 and 63per cent of the total housing construction for each yearbetween 1994 and 1997.62 Of total construction, about 44per cent was heavily financed and another 16 per cent had aless significant public contribution, being financed underthe Unified Subsidy Programme and produced by the privatesector on the open market.63
Direct construction and loans
One of the most far-reaching systems of state interventionthrough direct construction has been used in the case ofSingapore, where 96 per cent of the households are livingin homeownership apartments (Box 4.6).64 The strategy hasbeen based on the provision of subsidized mortgage finance(primarily through the interest rate), combined with adedicated supply of funds through already existingprovident/pension funds.
The Singapore system appears to be a closed one inwhich the Housing and Development Board manages theconstruction (sometimes with subcontracts to the privatesector) and the financing. Despite the accomplishmentshere, there are many other less successful attempts.Singapore was successful in part because it has one of theworld’s fastest growing economies, in part because thegovernment owned so much land, so that land acquisitionwas not a problem (although compulsory purchase wasused), and in part because there was little in-migration asthe rural population was small. Nigeria is an example of howSouthern governments have been committed to improvingthe housing situation in their countries, but have struggledto find effective policies. Between 1971 and 1995, thegovernment actually built only 76,370 dwellings, 13 percent of the units they intended to construct.65 The problemscan be explained thus:
Since the attainment of independence in 1960,and the subsequently intensified urban growth,there are some major distinct approaches tohousing development and improvement inNigeria. These include slum clearance andresettlement, public housing schemes, sites-and-services [projects], settlement upgradingand self-help housing. Apart from the last, thesehousing strategies are essentially public
62 Shelter finance: assessment of trends
Box 4.5 Government support for mortgage finance in the Philippines
In the Philippines, the government aims to address the needs of the lowest 50 per cent ofincome earners through the direct production of units by government, through the provisionof public funds for private development and through end-user financing to entice the privatesector to produce suitable housing.There are several significant state agencies that supporthousing finance.The Housing Guaranty Corporation provides mortgage insurance andguarantees in order to encourage private banks and financial institutions to grant housing loanson easy terms of payment.The National Home Mortgage Finance Corporation acts as asecondary market for housing mortgages.The National Housing Authority is specificallyconcerned with social housing. Finally, the Home Development Mutual Fund is a providentsavings/pension fund for formal-sector workers. Increasingly, strategies have moved from beinghighly centralized to being more participatory, with the involvement of communities, localgovernment and private-sector agencies in delivering housing. Measures continue to be takento improve the supply of funds and the secondary mortgage market.
In housing finance, the government’s role in the market remains that of a primarylender. Between 1993 and 2001, approximately 971,000 households gained homeownershipthrough the National Shelter Programme. Fifty-one per cent of these obtained housing thoughprivate developers with loan finance provided through government programmes. About 13 percent benefited from state-financed resettlement programmes, while a further 12 per centsecured dwellings through the community mortgage programme and other communityprogrammes. Ownership through the presidential proclamations of public land for low-incomehousing accounted for a further 16 per cent. Despite such provision, however, the proportionliving in informal settlements continues to rise.Source: Ballesteros, 2002.
Scheme Comments
Mortgage interest relief Can be poorly targeted/regressive
Can be capitalized into higher prices
Interest subsidies Often a substitute for poor economic management
Housing savings scheme Can be poorly targeted
May be used as subsidized savings scheme and not used for housing
Design can deal with these problems
Guarantees Form of credit enhancement
Provided by market in the UK
Subsidies for ‘key’ public-sector workers Can crowd out private-sector workers and inflate prices
May be more efficient (though possibly more costly) to vary wages by region
Intermediate tenures Lower risk method of extending ownership
Source: Stephens, 2004.
Government measuresto widen access tohomeownershipthrough finance
Table 4.3
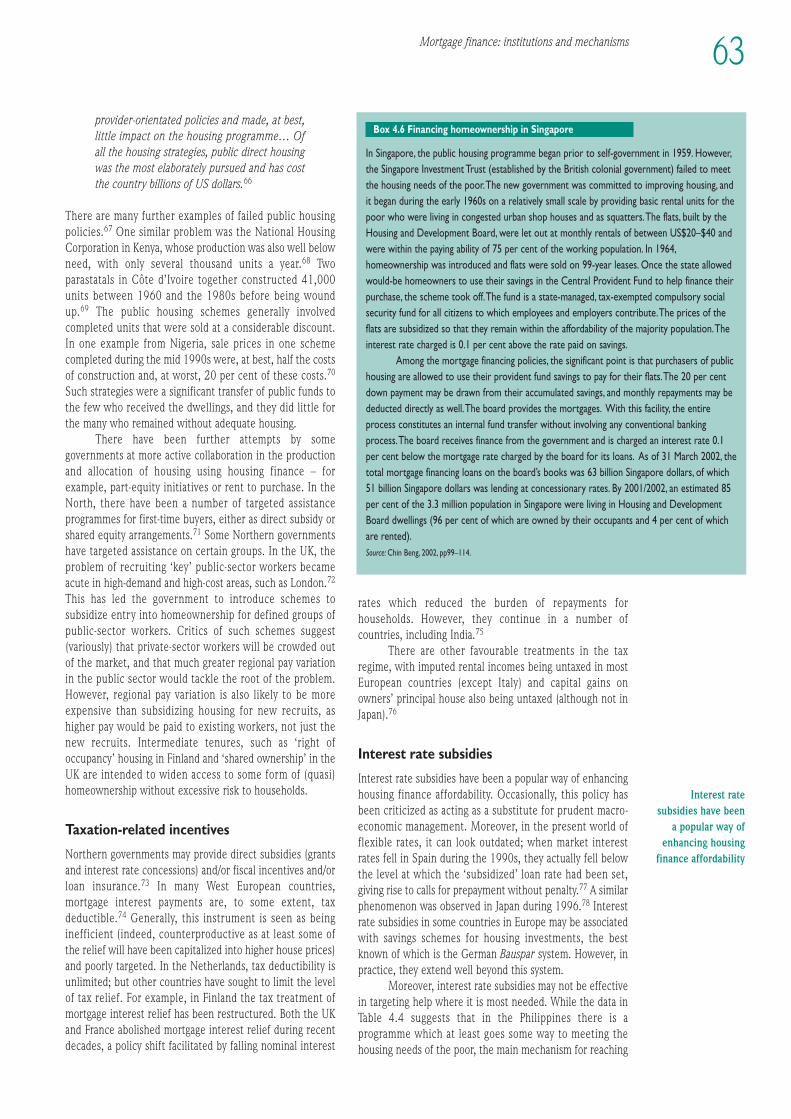
provider-orientated policies and made, at best,little impact on the housing programme… Ofall the housing strategies, public direct housingwas the most elaborately pursued and has costthe country billions of US dollars.66
There are many further examples of failed public housingpolicies.67 One similar problem was the National HousingCorporation in Kenya, whose production was also well belowneed, with only several thousand units a year.68 Twoparastatals in Côte d’Ivoire together constructed 41,000units between 1960 and the 1980s before being woundup.69 The public housing schemes generally involvedcompleted units that were sold at a considerable discount.In one example from Nigeria, sale prices in one schemecompleted during the mid 1990s were, at best, half the costsof construction and, at worst, 20 per cent of these costs.70
Such strategies were a significant transfer of public funds tothe few who received the dwellings, and they did little forthe many who remained without adequate housing.
There have been further attempts by somegovernments at more active collaboration in the productionand allocation of housing using housing finance – forexample, part-equity initiatives or rent to purchase. In theNorth, there have been a number of targeted assistanceprogrammes for first-time buyers, either as direct subsidy orshared equity arrangements.71 Some Northern governmentshave targeted assistance on certain groups. In the UK, theproblem of recruiting ‘key’ public-sector workers becameacute in high-demand and high-cost areas, such as London.72
This has led the government to introduce schemes tosubsidize entry into homeownership for defined groups ofpublic-sector workers. Critics of such schemes suggest(variously) that private-sector workers will be crowded outof the market, and that much greater regional pay variationin the public sector would tackle the root of the problem.However, regional pay variation is also likely to be moreexpensive than subsidizing housing for new recruits, ashigher pay would be paid to existing workers, not just thenew recruits. Intermediate tenures, such as ‘right ofoccupancy’ housing in Finland and ‘shared ownership’ in theUK are intended to widen access to some form of (quasi)homeownership without excessive risk to households.
Taxation-related incentives
Northern governments may provide direct subsidies (grantsand interest rate concessions) and/or fiscal incentives and/orloan insurance.73 In many West European countries,mortgage interest payments are, to some extent, taxdeductible.74 Generally, this instrument is seen as beinginefficient (indeed, counterproductive as at least some ofthe relief will have been capitalized into higher house prices)and poorly targeted. In the Netherlands, tax deductibility isunlimited; but other countries have sought to limit the levelof tax relief. For example, in Finland the tax treatment ofmortgage interest relief has been restructured. Both the UKand France abolished mortgage interest relief during recentdecades, a policy shift facilitated by falling nominal interest
rates which reduced the burden of repayments forhouseholds. However, they continue in a number ofcountries, including India.75
There are other favourable treatments in the taxregime, with imputed rental incomes being untaxed in mostEuropean countries (except Italy) and capital gains onowners’ principal house also being untaxed (although not inJapan).76
Interest rate subsidies
Interest rate subsidies have been a popular way of enhancinghousing finance affordability. Occasionally, this policy hasbeen criticized as acting as a substitute for prudent macro-economic management. Moreover, in the present world offlexible rates, it can look outdated; when market interestrates fell in Spain during the 1990s, they actually fell belowthe level at which the ‘subsidized’ loan rate had been set,giving rise to calls for prepayment without penalty.77 A similarphenomenon was observed in Japan during 1996.78 Interestrate subsidies in some countries in Europe may be associatedwith savings schemes for housing investments, the bestknown of which is the German Bauspar system. However, inpractice, they extend well beyond this system.
Moreover, interest rate subsidies may not be effectivein targeting help where it is most needed. While the data inTable 4.4 suggests that in the Philippines there is aprogramme which at least goes some way to meeting thehousing needs of the poor, the main mechanism for reaching
Interest ratesubsidies have been
a popular way ofenhancing housing
finance affordability
63Mortgage finance: institutions and mechanisms
Box 4.6 Financing homeownership in Singapore
In Singapore, the public housing programme began prior to self-government in 1959. However,the Singapore Investment Trust (established by the British colonial government) failed to meetthe housing needs of the poor.The new government was committed to improving housing, andit began during the early 1960s on a relatively small scale by providing basic rental units for thepoor who were living in congested urban shop houses and as squatters.The flats, built by theHousing and Development Board, were let out at monthly rentals of between US$20–$40 andwere within the paying ability of 75 per cent of the working population. In 1964,homeownership was introduced and flats were sold on 99-year leases. Once the state allowedwould-be homeowners to use their savings in the Central Provident Fund to help finance theirpurchase, the scheme took off.The fund is a state-managed, tax-exempted compulsory socialsecurity fund for all citizens to which employees and employers contribute.The prices of theflats are subsidized so that they remain within the affordability of the majority population.Theinterest rate charged is 0.1 per cent above the rate paid on savings.
Among the mortgage financing policies, the significant point is that purchasers of publichousing are allowed to use their provident fund savings to pay for their flats.The 20 per centdown payment may be drawn from their accumulated savings, and monthly repayments may bededucted directly as well.The board provides the mortgages. With this facility, the entireprocess constitutes an internal fund transfer without involving any conventional bankingprocess.The board receives finance from the government and is charged an interest rate 0.1per cent below the mortgage rate charged by the board for its loans. As of 31 March 2002, thetotal mortgage financing loans on the board’s books was 63 billion Singapore dollars, of which51 billion Singapore dollars was lending at concessionary rates. By 2001/2002, an estimated 85per cent of the 3.3 million population in Singapore were living in Housing and DevelopmentBoard dwellings (96 per cent of which are owned by their occupants and 4 per cent of whichare rented).Source: Chin Beng, 2002, pp99–114.
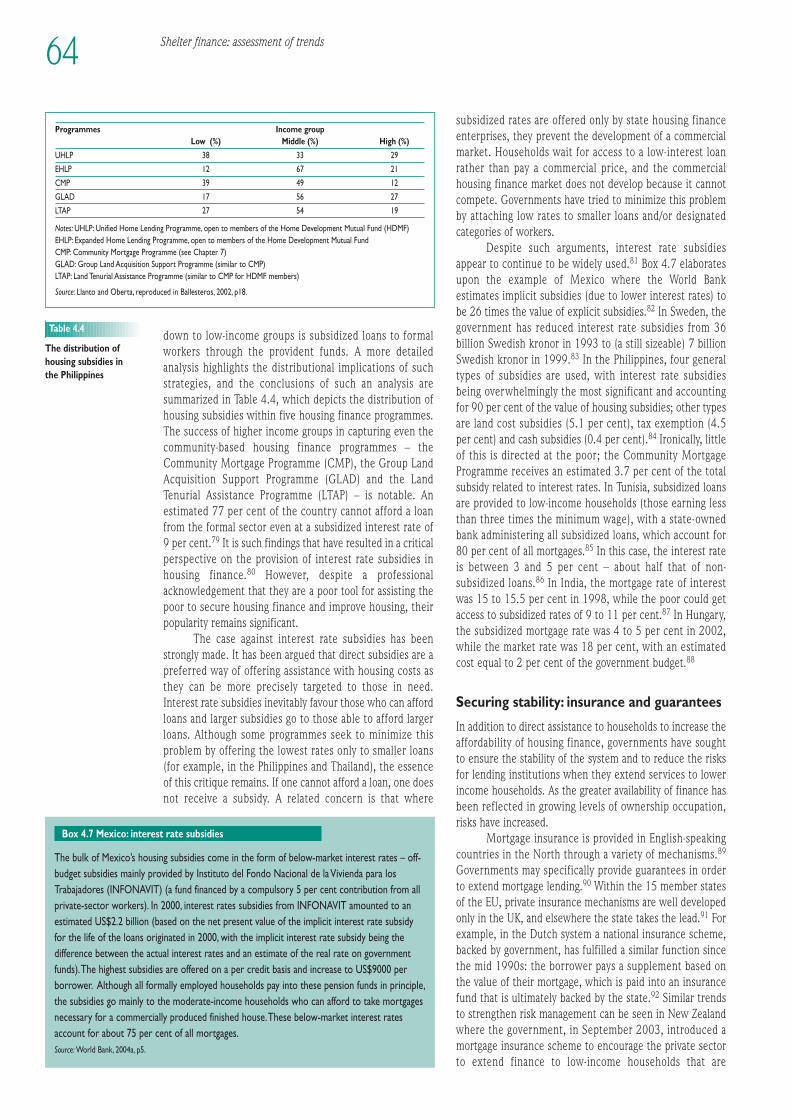
down to low-income groups is subsidized loans to formalworkers through the provident funds. A more detailedanalysis highlights the distributional implications of suchstrategies, and the conclusions of such an analysis aresummarized in Table 4.4, which depicts the distribution ofhousing subsidies within five housing finance programmes.The success of higher income groups in capturing even thecommunity-based housing finance programmes – theCommunity Mortgage Programme (CMP), the Group LandAcquisition Support Programme (GLAD) and the LandTenurial Assistance Programme (LTAP) – is notable. Anestimated 77 per cent of the country cannot afford a loanfrom the formal sector even at a subsidized interest rate of9 per cent.79 It is such findings that have resulted in a criticalperspective on the provision of interest rate subsidies inhousing finance.80 However, despite a professionalacknowledgement that they are a poor tool for assisting thepoor to secure housing finance and improve housing, theirpopularity remains significant.
The case against interest rate subsidies has beenstrongly made. It has been argued that direct subsidies are apreferred way of offering assistance with housing costs asthey can be more precisely targeted to those in need.Interest rate subsidies inevitably favour those who can affordloans and larger subsidies go to those able to afford largerloans. Although some programmes seek to minimize thisproblem by offering the lowest rates only to smaller loans(for example, in the Philippines and Thailand), the essenceof this critique remains. If one cannot afford a loan, one doesnot receive a subsidy. A related concern is that where
subsidized rates are offered only by state housing financeenterprises, they prevent the development of a commercialmarket. Households wait for access to a low-interest loanrather than pay a commercial price, and the commercialhousing finance market does not develop because it cannotcompete. Governments have tried to minimize this problemby attaching low rates to smaller loans and/or designatedcategories of workers.
Despite such arguments, interest rate subsidiesappear to continue to be widely used.81 Box 4.7 elaboratesupon the example of Mexico where the World Bankestimates implicit subsidies (due to lower interest rates) tobe 26 times the value of explicit subsidies.82 In Sweden, thegovernment has reduced interest rate subsidies from 36billion Swedish kronor in 1993 to (a still sizeable) 7 billionSwedish kronor in 1999.83 In the Philippines, four generaltypes of subsidies are used, with interest rate subsidiesbeing overwhelmingly the most significant and accountingfor 90 per cent of the value of housing subsidies; other typesare land cost subsidies (5.1 per cent), tax exemption (4.5per cent) and cash subsidies (0.4 per cent).84 Ironically, littleof this is directed at the poor; the Community MortgageProgramme receives an estimated 3.7 per cent of the totalsubsidy related to interest rates. In Tunisia, subsidized loansare provided to low-income households (those earning lessthan three times the minimum wage), with a state-ownedbank administering all subsidized loans, which account for80 per cent of all mortgages.85 In this case, the interest rateis between 3 and 5 per cent – about half that of non-subsidized loans.86 In India, the mortgage rate of interestwas 15 to 15.5 per cent in 1998, while the poor could getaccess to subsidized rates of 9 to 11 per cent.87 In Hungary,the subsidized mortgage rate was 4 to 5 per cent in 2002,while the market rate was 18 per cent, with an estimatedcost equal to 2 per cent of the government budget.88
Securing stability: insurance and guarantees
In addition to direct assistance to households to increase theaffordability of housing finance, governments have soughtto ensure the stability of the system and to reduce the risksfor lending institutions when they extend services to lowerincome households. As the greater availability of finance hasbeen reflected in growing levels of ownership occupation,risks have increased.
Mortgage insurance is provided in English-speakingcountries in the North through a variety of mechanisms.89
Governments may specifically provide guarantees in orderto extend mortgage lending.90 Within the 15 member statesof the EU, private insurance mechanisms are well developedonly in the UK, and elsewhere the state takes the lead.91 Forexample, in the Dutch system a national insurance scheme,backed by government, has fulfilled a similar function sincethe mid 1990s: the borrower pays a supplement based onthe value of their mortgage, which is paid into an insurancefund that is ultimately backed by the state.92 Similar trendsto strengthen risk management can be seen in New Zealandwhere the government, in September 2003, introduced amortgage insurance scheme to encourage the private sectorto extend finance to low-income households that are
64 Shelter finance: assessment of trends
Programmes Income groupLow (%) Middle (%) High (%)
UHLP 38 33 29
EHLP 12 67 21
CMP 39 49 12
GLAD 17 56 27
LTAP 27 54 19
Notes: UHLP: Unified Home Lending Programme, open to members of the Home Development Mutual Fund (HDMF) EHLP: Expanded Home Lending Programme, open to members of the Home Development Mutual FundCMP: Community Mortgage Programme (see Chapter 7)GLAD: Group Land Acquisition Support Programme (similar to CMP)LTAP: Land Tenurial Assistance Programme (similar to CMP for HDMF members)
Source: Llanto and Oberta, reproduced in Ballesteros, 2002, p18.
The distribution ofhousing subsidies in the Philippines
Table 4.4
Box 4.7 Mexico: interest rate subsidies
The bulk of Mexico’s housing subsidies come in the form of below-market interest rates – off-budget subsidies mainly provided by Instituto del Fondo Nacional de la Vivienda para losTrabajadores (INFONAVIT) (a fund financed by a compulsory 5 per cent contribution from allprivate-sector workers). In 2000, interest rates subsidies from INFONAVIT amounted to anestimated US$2.2 billion (based on the net present value of the implicit interest rate subsidyfor the life of the loans originated in 2000, with the implicit interest rate subsidy being thedifference between the actual interest rates and an estimate of the real rate on governmentfunds).The highest subsidies are offered on a per credit basis and increase to US$9000 perborrower. Although all formally employed households pay into these pension funds in principle,the subsidies go mainly to the moderate-income households who can afford to take mortgagesnecessary for a commercially produced finished house.These below-market interest ratesaccount for about 75 per cent of all mortgages.Source: World Bank, 2004a, p5.
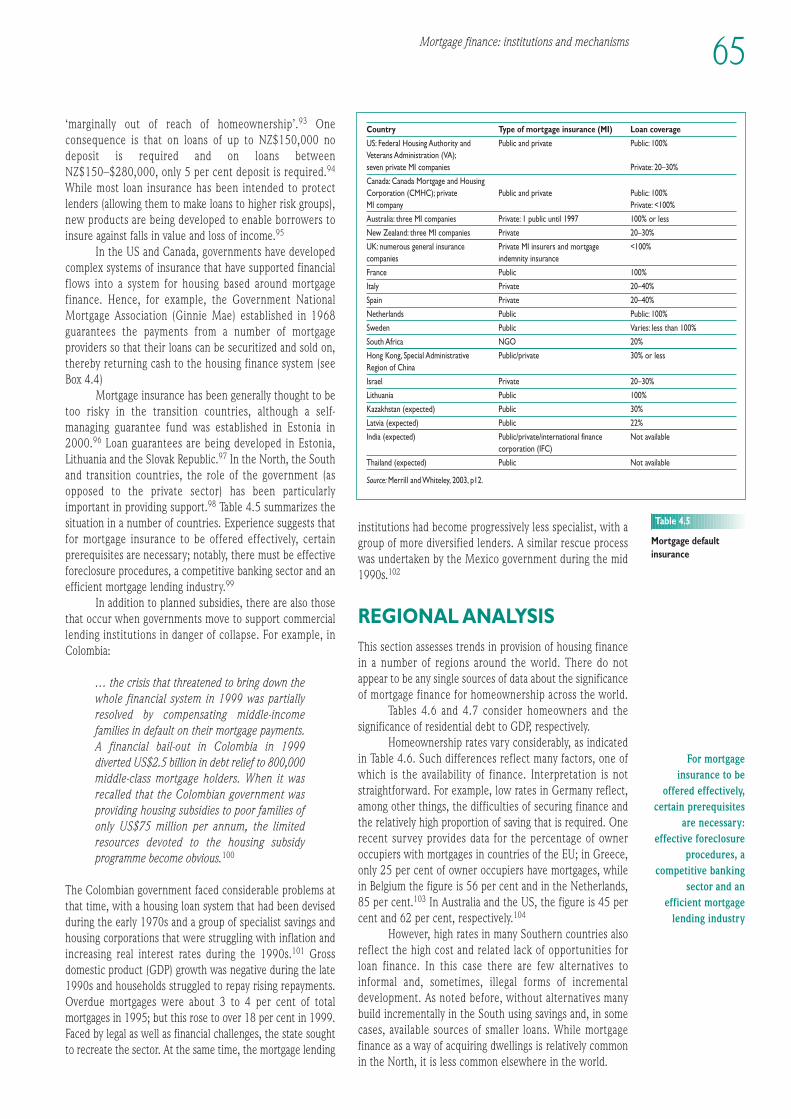
‘marginally out of reach of homeownership’.93 Oneconsequence is that on loans of up to NZ$150,000 nodeposit is required and on loans betweenNZ$150–$280,000, only 5 per cent deposit is required.94
While most loan insurance has been intended to protectlenders (allowing them to make loans to higher risk groups),new products are being developed to enable borrowers toinsure against falls in value and loss of income.95
In the US and Canada, governments have developedcomplex systems of insurance that have supported financialflows into a system for housing based around mortgagefinance. Hence, for example, the Government NationalMortgage Association (Ginnie Mae) established in 1968guarantees the payments from a number of mortgageproviders so that their loans can be securitized and sold on,thereby returning cash to the housing finance system (seeBox 4.4)
Mortgage insurance has been generally thought to betoo risky in the transition countries, although a self-managing guarantee fund was established in Estonia in2000.96 Loan guarantees are being developed in Estonia,Lithuania and the Slovak Republic.97 In the North, the Southand transition countries, the role of the government (asopposed to the private sector) has been particularlyimportant in providing support.98 Table 4.5 summarizes thesituation in a number of countries. Experience suggests thatfor mortgage insurance to be offered effectively, certainprerequisites are necessary; notably, there must be effectiveforeclosure procedures, a competitive banking sector and anefficient mortgage lending industry.99
In addition to planned subsidies, there are also thosethat occur when governments move to support commerciallending institutions in danger of collapse. For example, inColombia:
… the crisis that threatened to bring down thewhole financial system in 1999 was partiallyresolved by compensating middle-incomefamilies in default on their mortgage payments.A financial bail-out in Colombia in 1999diverted US$2.5 billion in debt relief to 800,000middle-class mortgage holders. When it wasrecalled that the Colombian government wasproviding housing subsidies to poor families ofonly US$75 million per annum, the limitedresources devoted to the housing subsidyprogramme become obvious.100
The Colombian government faced considerable problems atthat time, with a housing loan system that had been devisedduring the early 1970s and a group of specialist savings andhousing corporations that were struggling with inflation andincreasing real interest rates during the 1990s.101 Grossdomestic product (GDP) growth was negative during the late1990s and households struggled to repay rising repayments.Overdue mortgages were about 3 to 4 per cent of totalmortgages in 1995; but this rose to over 18 per cent in 1999.Faced by legal as well as financial challenges, the state soughtto recreate the sector. At the same time, the mortgage lending
institutions had become progressively less specialist, with agroup of more diversified lenders. A similar rescue processwas undertaken by the Mexico government during the mid1990s.102
REGIONAL ANALYSISThis section assesses trends in provision of housing financein a number of regions around the world. There do notappear to be any single sources of data about the significanceof mortgage finance for homeownership across the world.
Tables 4.6 and 4.7 consider homeowners and thesignificance of residential debt to GDP, respectively.
Homeownership rates vary considerably, as indicatedin Table 4.6. Such differences reflect many factors, one ofwhich is the availability of finance. Interpretation is notstraightforward. For example, low rates in Germany reflect,among other things, the difficulties of securing finance andthe relatively high proportion of saving that is required. Onerecent survey provides data for the percentage of owneroccupiers with mortgages in countries of the EU; in Greece,only 25 per cent of owner occupiers have mortgages, whilein Belgium the figure is 56 per cent and in the Netherlands,85 per cent.103 In Australia and the US, the figure is 45 percent and 62 per cent, respectively.104
However, high rates in many Southern countries alsoreflect the high cost and related lack of opportunities forloan finance. In this case there are few alternatives toinformal and, sometimes, illegal forms of incrementaldevelopment. As noted before, without alternatives manybuild incrementally in the South using savings and, in somecases, available sources of smaller loans. While mortgagefinance as a way of acquiring dwellings is relatively commonin the North, it is less common elsewhere in the world.
For mortgageinsurance to be
offered effectively,certain prerequisites
are necessary:effective foreclosure
procedures, acompetitive banking
sector and anefficient mortgage
lending industry
65Mortgage finance: institutions and mechanisms
Country Type of mortgage insurance (MI) Loan coverage
US: Federal Housing Authority and Public and private Public: 100%Veterans Administration (VA);seven private MI companies Private: 20–30%
Canada: Canada Mortgage and Housing Corporation (CMHC); private Public and private Public: 100%MI company Private: <100%
Australia: three MI companies Private: 1 public until 1997 100% or less
New Zealand: three MI companies Private 20–30%
UK: numerous general insurance Private MI insurers and mortgage <100%companies indemnity insurance
France Public 100%
Italy Private 20–40%
Spain Private 20–40%
Netherlands Public Public: 100%
Sweden Public Varies: less than 100%
South Africa NGO 20%
Hong Kong, Special Administrative Public/private 30% or lessRegion of China
Israel Private 20–30%
Lithuania Public 100%
Kazakhstan (expected) Public 30%
Latvia (expected) Public 22%
India (expected) Public/private/international finance Not availablecorporation (IFC)
Thailand (expected) Public Not available
Source: Merrill and Whiteley, 2003, p12.
Mortgage defaultinsurance
Table 4.5
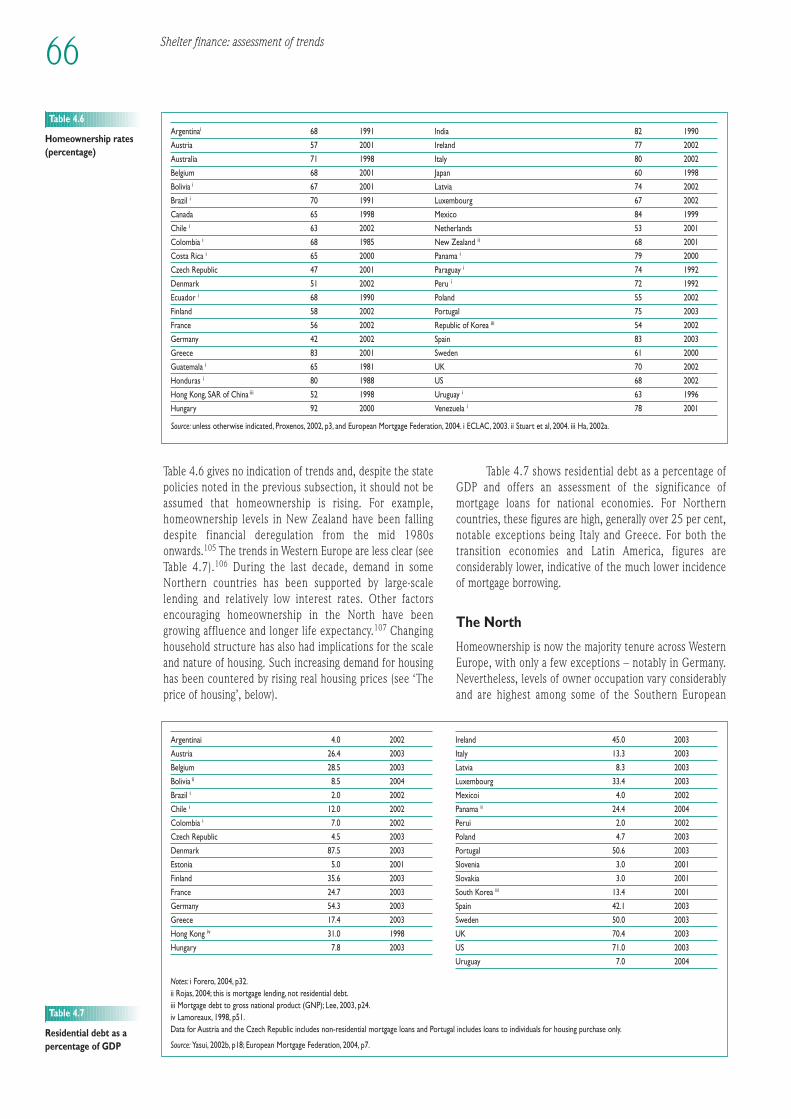
Table 4.6 gives no indication of trends and, despite the statepolicies noted in the previous subsection, it should not beassumed that homeownership is rising. For example,homeownership levels in New Zealand have been fallingdespite financial deregulation from the mid 1980sonwards.105 The trends in Western Europe are less clear (seeTable 4.7).106 During the last decade, demand in someNorthern countries has been supported by large-scalelending and relatively low interest rates. Other factorsencouraging homeownership in the North have beengrowing affluence and longer life expectancy.107 Changinghousehold structure has also had implications for the scaleand nature of housing. Such increasing demand for housinghas been countered by rising real housing prices (see ‘Theprice of housing’, below).
Table 4.7 shows residential debt as a percentage ofGDP and offers an assessment of the significance ofmortgage loans for national economies. For Northerncountries, these figures are high, generally over 25 per cent,notable exceptions being Italy and Greece. For both thetransition economies and Latin America, figures areconsiderably lower, indicative of the much lower incidenceof mortgage borrowing.
The North
Homeownership is now the majority tenure across WesternEurope, with only a few exceptions – notably in Germany.Nevertheless, levels of owner occupation vary considerablyand are highest among some of the Southern European
66 Shelter finance: assessment of trends
Argentinai 68 1991 India 82 1990
Austria 57 2001 Ireland 77 2002
Australia 71 1998 Italy 80 2002
Belgium 68 2001 Japan 60 1998
Bolivia i 67 2001 Latvia 74 2002
Brazil i 70 1991 Luxembourg 67 2002
Canada 65 1998 Mexico 84 1999
Chile i 63 2002 Netherlands 53 2001
Colombia i 68 1985 New Zealand ii 68 2001
Costa Rica i 65 2000 Panama i 79 2000
Czech Republic 47 2001 Paraguay i 74 1992
Denmark 51 2002 Peru i 72 1992
Ecuador i 68 1990 Poland 55 2002
Finland 58 2002 Portugal 75 2003
France 56 2002 Republic of Korea iii 54 2002
Germany 42 2002 Spain 83 2003
Greece 83 2001 Sweden 61 2000
Guatemala i 65 1981 UK 70 2002
Honduras i 80 1988 US 68 2002
Hong Kong, SAR of China iii 52 1998 Uruguay i 63 1996
Hungary 92 2000 Venezuela i 78 2001
Source: unless otherwise indicated, Proxenos, 2002, p3, and European Mortgage Federation, 2004. i ECLAC, 2003. ii Stuart et al, 2004. iii Ha, 2002a.
Argentinai 4.0 2002
Austria 26.4 2003
Belgium 28.5 2003
Bolivia ii 8.5 2004
Brazil i 2.0 2002
Chile i 12.0 2002
Colombia i 7.0 2002
Czech Republic 4.5 2003
Denmark 87.5 2003
Estonia 5.0 2001
Finland 35.6 2003
France 24.7 2003
Germany 54.3 2003
Greece 17.4 2003
Hong Kong iv 31.0 1998
Hungary 7.8 2003
Ireland 45.0 2003
Italy 13.3 2003
Latvia 8.3 2003
Luxembourg 33.4 2003
Mexicoi 4.0 2002
Panama ii 24.4 2004
Perui 2.0 2002
Poland 4.7 2003
Portugal 50.6 2003
Slovenia 3.0 2001
Slovakia 3.0 2001
South Korea iii 13.4 2001
Spain 42.1 2003
Sweden 50.0 2003
UK 70.4 2003
US 71.0 2003
Uruguay 7.0 2004
Homeownership rates(percentage)
Table 4.6
Residential debt as apercentage of GDP
Notes: i Forero, 2004, p32.ii Rojas, 2004; this is mortgage lending, not residential debt.iii Mortgage debt to gross national product (GNP); Lee, 2003, p24.iv Lamoreaux, 1998, p51.Data for Austria and the Czech Republic includes non-residential mortgage loans and Portugal includes loans to individuals for housing purchase only.
Source: Yasui, 2002b, p18; European Mortgage Federation, 2004, p7.
Table 4.7

countries (Spain and Italy), where homeownership can bedescribed as being ‘dominant’ (see Table 4.8).Homeownership is relatively high in several other countries,notably the UK, at around 70 per cent. In a cluster ofcountries, such as France, the Netherlands, Denmark andSweden, homeownership has been established as the‘majority’ tenure without being especially high or dominant.Among members of the EU, homeownership in Germany still‘lags’ behind the other countries (outside the 15 memberstates of the EU, but within Western Europe, similarly lowlevels of homeownership exist in Switzerland.)
There is little evidence of convergence inhomeownership levels, either in the sense that they aremoving in the same direction, or that they are convergingtowards similar levels.108 As a result, since 1980, there hasbeen strong growth in homeownership in Germany and theNetherlands, starting from relatively low bases, but also inItaly, starting from one of the highest bases. Finlandexhibited a marked fall in homeownership levels, which isattributable to the coincidence of a very severe propertymarket slump with an extremely severe economic recessionpartly linked to the loss of trade with the former SovietUnion. Sweden also experienced a severe housing marketslump during the early 1990s, which seems to havecontributed to a stagnation of homeownership levels. In thefour other Organisation for Economic Co-operation andDevelopment (OECD) countries for which data is reportedin Table 4.9, levels of homeownership are relatively high andincreased significantly in the US, but changed little in theother nations.
It is difficult to detect a consistent trend in mortgagelending despite a convergence in mortgage rates both withinthe Euro zone and outside it.109 In general, strong growth inmortgage lending has been experienced; but there is littleconsistency between these countries. The Netherlands standsout as having experienced a huge rise in mortgage lending,linked to deregulation in the mortgage market during the1990s; this took place somewhat later than in Scandinavia andthe UK, while arguably it has still to occur fully in Germany,France and Italy. Having experienced big rises in mortgagelending during the 1980s, the process was thrown intoreverse in Sweden, and between the years selected, itstagnated in Finland.110 In fact, in each of these countries, aslump was followed by renewed and strong growth, so Table4.10 is slightly misleading in this respect. Table 4.11summarizes trends in other OECD countries, and they are alsopositive – although the scale of increase differs considerably.
In 2003, the European market, as a whole, continuedto grow with the total value of residential mortgage debtincreasing by 7.4 per cent, a little below the ten-year averageof 8 per cent.111 The total volume of mortgage loans inEurope at the end of 2003 was US$3.4 trillion.112 This figurehas grown rapidly and it now accounts for 42 per cent of theEU’s GDP. This rapid expansion in lending has beenencouraged by lower interest rates (both because ofcurrency convergence and low global rates); in particular,this has helped to increase borrowing in countries such asSpain, Greece and Ireland.113 However, it should beremembered that the rise in the volume of lending is notnecessarily associated with increasing access, as one further
trend has been rising house prices, with capital gains forcurrent homeowners and increasing difficulties for thoseseeking to become homeowners for the first time. The finalpart of this chapter discusses the rise in house prices duringthe late 1990s and the early 21st century.
In the US, homeownership grew on average, as didincome, throughout the largely prosperous 1990s and nowstands at a record high. The homeownership level has, infact, become a significant measurement of economichealth.114 However, data from the US Census Bureau andAmerican Housing Survey’s (AHS) most recent publicationindicate that affordability constraints are significant. Box 4.8shows a measure of success of government policy inreaching down to lower income households with FederalHousing Administration (FHA) support through insuranceassistance. Almost 52 per cent of Fannie Mae’s mortgagepurchases went to low- and moderate-income (LMI)household mortgages in 2002.115 Likewise, Freddie Mac’sLMI mortgage purchases reached 51.4 per cent of its total2002 purchases.116 Furthermore, 2 million household unitsin 2002, or close to 70 per cent of the units that qualifiedtoward Fannie Mae’s LMI performance, served low-incomefamilies (those earning 80 per cent or less of area medianincome). Freddie Mac had similar success, purchasing 1.4million mortgages from low-income household units, orroughly 69 per cent of its total qualifying LMI mortgagepurchases.117
Transition countries
The transition countries face a particular problem in thatcommercial housing finance markets were previously non-existent. The shift in political systems resulted inconsiderable and continuing housing problems, with verylow levels of housing construction and, in some cases,deliberate attempts to encourage building.
67Mortgage finance: institutions and mechanisms
Country circa 1990 circa 2000 Change
Dominant
Spain 78 82 (1999) +4
Italy 74 (1993) 80 (2002) +6
High
UK 66 (1992) 70 (2002) +4
Finland 71 (1992) 64 (2001) –7
Majority
Netherlands 45 53 (1998) +8
Sweden 55 (1991) 55 (1997) 0
Denmark 55 53 (1999) –2
France 54 56 (2002) +2
Low
West Germany 37 (1987) 46 (2003) +9
Germany – 44 (2003) not available
Source: Stephens, 2004.
Country 1990 2003 Change
Australia 72 70 –2
Canada 63 65.2 +2.2
Japan 61 62 +1
US 63.95 68.25 +4.3
Source: IMF, 2004, p73.
Levels of owneroccupation in WesternEurope, circa1990–2000
Table 4.8
Levels of owneroccupation in fourOrganisation forEconomic Co-operation andDevelopment (OECD)countries
Table 4.9
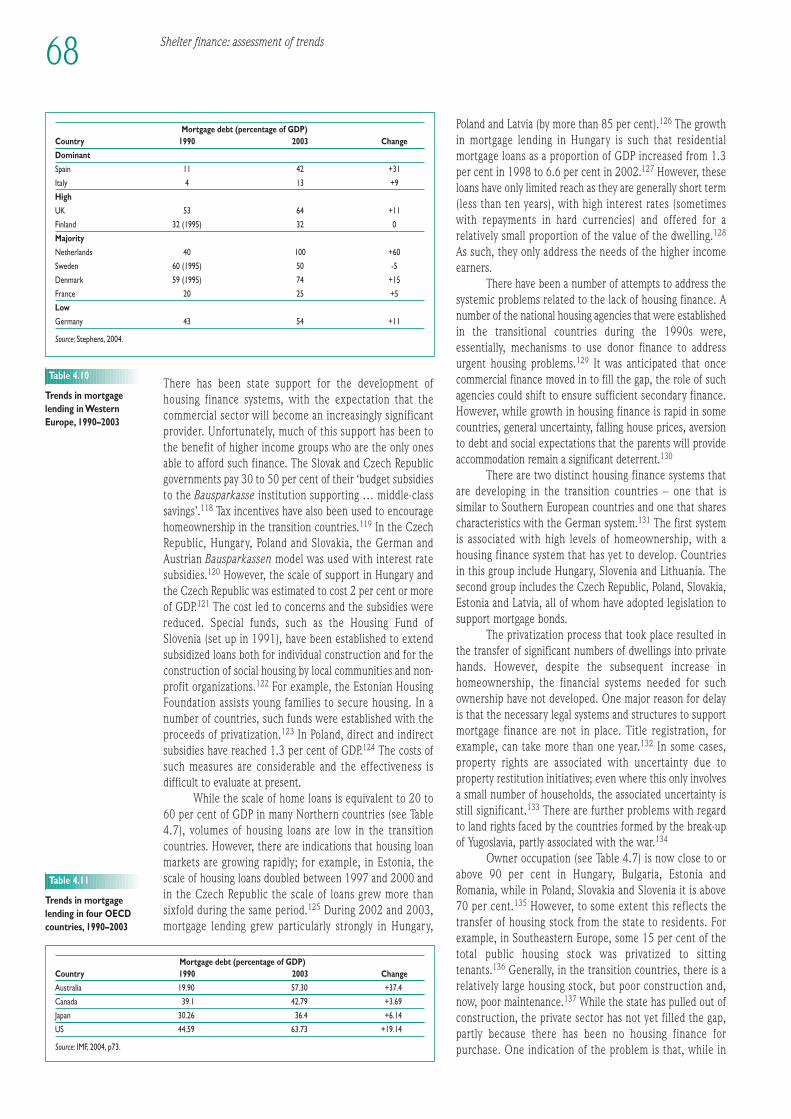
There has been state support for the development ofhousing finance systems, with the expectation that thecommercial sector will become an increasingly significantprovider. Unfortunately, much of this support has been tothe benefit of higher income groups who are the only onesable to afford such finance. The Slovak and Czech Republicgovernments pay 30 to 50 per cent of their ‘budget subsidiesto the Bausparkasse institution supporting … middle-classsavings’.118 Tax incentives have also been used to encouragehomeownership in the transition countries.119 In the CzechRepublic, Hungary, Poland and Slovakia, the German andAustrian Bausparkassen model was used with interest ratesubsidies.120 However, the scale of support in Hungary andthe Czech Republic was estimated to cost 2 per cent or moreof GDP.121 The cost led to concerns and the subsidies werereduced. Special funds, such as the Housing Fund ofSlovenia (set up in 1991), have been established to extendsubsidized loans both for individual construction and for theconstruction of social housing by local communities and non-profit organizations.122 For example, the Estonian HousingFoundation assists young families to secure housing. In anumber of countries, such funds were established with theproceeds of privatization.123 In Poland, direct and indirectsubsidies have reached 1.3 per cent of GDP.124 The costs ofsuch measures are considerable and the effectiveness isdifficult to evaluate at present.
While the scale of home loans is equivalent to 20 to60 per cent of GDP in many Northern countries (see Table4.7), volumes of housing loans are low in the transitioncountries. However, there are indications that housing loanmarkets are growing rapidly; for example, in Estonia, thescale of housing loans doubled between 1997 and 2000 andin the Czech Republic the scale of loans grew more thansixfold during the same period.125 During 2002 and 2003,mortgage lending grew particularly strongly in Hungary,
Poland and Latvia (by more than 85 per cent).126 The growthin mortgage lending in Hungary is such that residentialmortgage loans as a proportion of GDP increased from 1.3per cent in 1998 to 6.6 per cent in 2002.127 However, theseloans have only limited reach as they are generally short term(less than ten years), with high interest rates (sometimeswith repayments in hard currencies) and offered for arelatively small proportion of the value of the dwelling.128
As such, they only address the needs of the higher incomeearners.
There have been a number of attempts to address thesystemic problems related to the lack of housing finance. Anumber of the national housing agencies that were establishedin the transitional countries during the 1990s were,essentially, mechanisms to use donor finance to addressurgent housing problems.129 It was anticipated that oncecommercial finance moved in to fill the gap, the role of suchagencies could shift to ensure sufficient secondary finance.However, while growth in housing finance is rapid in somecountries, general uncertainty, falling house prices, aversionto debt and social expectations that the parents will provideaccommodation remain a significant deterrent.130
There are two distinct housing finance systems thatare developing in the transition countries – one that issimilar to Southern European countries and one that sharescharacteristics with the German system.131 The first systemis associated with high levels of homeownership, with ahousing finance system that has yet to develop. Countriesin this group include Hungary, Slovenia and Lithuania. Thesecond group includes the Czech Republic, Poland, Slovakia,Estonia and Latvia, all of whom have adopted legislation tosupport mortgage bonds.
The privatization process that took place resulted inthe transfer of significant numbers of dwellings into privatehands. However, despite the subsequent increase inhomeownership, the financial systems needed for suchownership have not developed. One major reason for delayis that the necessary legal systems and structures to supportmortgage finance are not in place. Title registration, forexample, can take more than one year.132 In some cases,property rights are associated with uncertainty due toproperty restitution initiatives; even where this only involvesa small number of households, the associated uncertainty isstill significant.133 There are further problems with regardto land rights faced by the countries formed by the break-upof Yugoslavia, partly associated with the war.134
Owner occupation (see Table 4.7) is now close to orabove 90 per cent in Hungary, Bulgaria, Estonia andRomania, while in Poland, Slovakia and Slovenia it is above70 per cent.135 However, to some extent this reflects thetransfer of housing stock from the state to residents. Forexample, in Southeastern Europe, some 15 per cent of thetotal public housing stock was privatized to sittingtenants.136 Generally, in the transition countries, there is arelatively large housing stock, but poor construction and,now, poor maintenance.137 While the state has pulled out ofconstruction, the private sector has not yet filled the gap,partly because there has been no housing finance forpurchase. One indication of the problem is that, while in
68 Shelter finance: assessment of trends
Mortgage debt (percentage of GDP)Country 1990 2003 Change
Australia 19.90 57.30 +37.4
Canada 39.1 42.79 +3.69
Japan 30.26 36.4 +6.14
US 44.59 63.73 +19.14
Source: IMF, 2004, p73.
Mortgage debt (percentage of GDP)Country 1990 2003 Change
Dominant
Spain 11 42 +31
Italy 4 13 +9
High
UK 53 64 +11
Finland 32 (1995) 32 0
Majority
Netherlands 40 100 +60
Sweden 60 (1995) 50 -5
Denmark 59 (1995) 74 +15
France 20 25 +5
Low
Germany 43 54 +11
Source: Stephens, 2004.
Trends in mortgagelending in WesternEurope, 1990–2003
Table 4.10
Trends in mortgagelending in four OECDcountries, 1990–2003
Table 4.11

most EU countries between four to seven dwellings werecompleted for every 1000 inhabitants in 1998, in thetransition countries the figure was two or less, except forSlovenia (2.5 dwellings).138
The South
The problems of affordability in the South are considerable.As noted above, high levels of homeownership can bemisleading because while many own their homes, they areillegal and/or informal. The housing price to average incomeratio in Southern countries is considerably worse than in theNorth. While house prices are four times average incomesin the developed world, the ratio is just under six in LatinAmerica and the Caribbean, seven in oriental Asia, almostten in the rest of Asia and more than ten in Africa. Thissubsection makes some general comments about problemsthat are fairly universal before looking in more detail at whatis happening in specific regions within the South.
The supply of mortgages in Southern countries hasbeen limited by a large number of factors. First, in general,there is a lack of supply of long-term funding, even in thoseSouthern countries in which financial markets are beginningto ‘emerge’.139 This is related to many factors, including lowincomes that barely cover subsistence needs for aconsiderable proportion of the population, a lack of formalfinancial institutions that can capture people’s savings, andmacroeconomic instability that deters households fromholding savings with institutions, such as pension funds thathave a particular interest in long-term finance. Low incomesand macroeconomic instability prevent institutions fromdeveloping to address problems and to facilitate the flow oflong-term funds.140 The recent financial crises have hadnegative impacts upon the formal housing finance systemsin a number of countries and have particularly deterredcommercial provision of mortgage finance. However, thereare signs of a recovery in lending in both Asian and LatinAmerican countries. It should also be recognized that (asdiscussed earlier) secondary markets have not developed toany large extent in a number of countries because there wasno shortage of retail funds for mortgage lending.
Second, urban land and property development andurban livelihoods (labour markets) are associated with a highdegree of informality that does not fit easily with therequirements of mortgage finance. The property market hasnot favoured mortgage systems because of uncertainproperty titles and difficulties in using the property ascollateral, and the difficulties with which foreclosure cantake place. With respect to the latter point, in somecountries, there are multiple barriers to eviction that can beexemplified by political pressures on courts to restricteviction – for example, in Zimbabwe during the early1990s.141 For many homeowners in the South, titles areproblematic as formal registration systems may be lackingand there may be multiple claims on the land. The relevanceof legal property titles to the scale of economic developmentand, notably, to the development of capitalism has recentlybeen emphasized.142 The argument is that property titlesare essential if assets are to be used as productive wealth.As a consequence of this work, there has been a greater
interest in titling during recent years. Box 4.9 summarizesthe findings of research on a state programme that issuedland titles in Peru and the relationship of such titles to therelease of mortgage finance. The research took place sevenyears after the introduction of this policy.
The findings from Peru clearly indicate that legal titlealone is unlikely to secure large-scale lending. There isgrowing evidence that titling programmes are only one partof what is needed to improve the definition of propertyrights; titling is often expensive and may be disputed.143 A
69Mortgage finance: institutions and mechanisms
Box 4.8 The expansion of homeownership in the US
A sample survey of loan originations made in 2002 by the US leading home mortgage lender(Wells Fargo Home Mortgage) provides further clarity on US Federal Housing Administration(FHA) clientele. From a survey size of 173,541 loans, 21 per cent (or 36,474) of originatedloans were FHA insured and the remaining 79 per cent were conventional mortgages(uninsured by federal government agencies). Of FHA-insured mortgages, 35 per cent weremade to moderate-income borrowers or borrowers who were purchasing a home in aneighbourhood where the median income was below 80 per cent the area median. Another14 per cent of FHA-insured mortgages were extended to low-income households (thosewhose income is less than 50 per cent the area median or whose home purchase is in aneighbourhood where the median income was below 50 per cent the area median). Overall,the study implies that just less than half, or 49 per cent, of FHA-insured mortgages reach low-and moderate-income households.The conventional mortgage market only reaches 28 per centof the population (for example, 9 per cent to low income and 19 per cent to moderateincome).Source: Carolini, 2004, p8.
Box 4.9 Land titles and mortgage finance in Peru
The policy to legalize property was established by the Peruvian government in 1996 throughthe Urban Property Rights Programme. A commission to legalize informal property wascreated and more than 1 million title deeds were distributed by 2000.The assumption was thatthis would enable the poor to access loans and thereby improve their standard of living. Inorder to maximize the potential, the commission established an information centre and offeredtraining workshops in the use of credit for microenterprise development (although it should benoted that the government had previously legalized squatter settlements and the commissionwas speeding up rather than initiating a process).
There are a number of categories of insecure tenure and inadequate titles in thecountry. Clearly, not everyone was entitled to receive a land title. Generally, owners ofunauthorized housing (those in public housing but who have not yet been given title deeds) andthose living in low-income settlements which either began life as squatter settlements andwhich are in the process of regularization, or those which are illegal subdivisions (fromagricultural land) are entitled to benefit from this policy. In the case of squatting on privateland, the granting of title deeds takes longer because the commission seeks an agreement forthe purchase of the land between the squatters and owners.
Taking into account all of those able to claim a land title, between 1996 and 2002,1,269,194 title deeds were awarded, almost half of which were in metropolitan Lima. However,many of those living in squatter settlements who are in the process of improving theirsettlements were already reasonably confident of their tenure security. While they did nothave effective possession of a title deed, improvements (both self-help and investments fromservice providers) had not waited on such a legal title. Perhaps as a consequence, there wasvery little take-up of mortgage finance. Up to 2002, 17,324 families in Peru who had obtainedtitle deeds from the commission had gained access to mortgage loans, some 1.3 per cent ofthe total title deeds allocated during the process.This evidence suggests that the poor are asscared of borrowing from the banks as the banks are reluctant to lend to the poor.Source: Calderón, 2004.

healthy housing market may exist without titling.144 Inrelation to housing finance, a critical point (elaborated uponin Box 4.9) is that the granting of title may not necessarilymean that the title can be used to secure loans because, forexample, formal employment may be required to obtaincredit.145 Thus, titles are valuable; but they do notnecessarily ‘unlock’ capital.146
However, it is recognized that problems of titles havemade foreclosure difficult and deterred lending. Overlappingcustomary and Western land tenure systems may furtherexacerbate the problem in some countries. In addition toimprovements in titling, one element of housing policyreform now ongoing in some Latin American countries,including Chile, Costa Rica, Colombia, Ecuador, Guatemalaand Peru, are legal changes to facilitate the recovery ofcollateral.147 In Latin America, there has been a shift towardsland reform and more effective land titling and landregistration, which, in turn, enables more land to be used ascollateral to secure loans.148 Limited ownership rights mayreduce the ability of the poor to transfer their assets.149
However, other factors are also important. In South Africa,the ability to secure a mortgage to purchase a property in alow-income settlement may be prevented by factors otherthan a clear title, such as insufficient income by thepurchaser, lack of formal employment and ‘red-lining’ (therefusal to issue mortgages in specific areas) due togeneralized problems of foreclosure.150 The informality ofincomes is not highlighted in the general literature, althoughit did emerge as significant in research to understand the lowtake-up of loans in Peru and South Africa, and it also appearsto be significant in Panama.151 As discussed in ‘Housingfinance, affordability and lower income households’, this canbe a relatively significant barrier preventing mortgage lendingto certain households in the North.
A third and further barrier is the low level of incomerelative to the cost of complete dwellings. There aregenerally two related problems: households cannot affordthe deposits (which are often large as a result of the riskassessment of the financial institutions) because they havenot been able to accumulate this quantity of cash, and theycannot afford to repay the loan due to their low incomes.The first problem is, in part, related to attempts by thelending institutions to reduce their risks (see Table 4.16).Lenders can reduce risk by offering to restrict the loan to asmaller proportion of the value of the dwelling. As shown inChapter 5, a number of countries (notably, in Latin America)have introduced subsidy programmes that offer capitalgrants to address this problem and enable the would-behomeowner to then take up a loan.
A further indication of the problem of affordability isgiven by the World Bank, which reports that for Mexico‘about 40 per cent of newly formed households (300,000)earn less than three minimum wages (below US$327 permonth) and cannot afford a finished house in a servicedneighbourhood’.152 Only 12.6 per cent of the housing stockin Mexico is currently mortgaged and self-built housingaccounts for roughly half of all new building in Mexico.153
One assessment of the costs involved in borrowing moneyto purchase contractor-built housing in four Latin American
countries noted that even a modest 40 square metre houseon a 100 square metre plot is too expensive for the low-income groups under existing lending terms andconditions.154 In Colombia, a similar percentage (40 percent) of families earn less than two minimum salaries(US$250 each month) and are considered to be too poor tobe able to afford loans for housing.155 Other studies havealso reported the lack of mortgage finance in low-incomeareas. In urban areas of Morocco, where just under 50 percent of families own their own home, only 6 per cent of allformal housing loans are secured by low- and moderate-income households despite a government subsidyprogramme offering low-interest loans.156 In Bangladesh, forexample, the construction of a small house is affordable onlyfor those with median incomes and above.157 When the landcosts for Dhaka are added to this cost, it increasessignificantly, and therefore only high-density medium riseappears affordable for this income group. Rising land pricesalso appear to have been a problem in some other Asiancities (for example, Manila) due to rapid economic growthand inward flows of finance for speculative propertyinvestment. In the context of Mexico, one assessmentconcludes:
… the least expensive commercially producedunit costs US$16,000 and is affordable only tofamilies earning about five minimum salarieswithout subsidies. In contrast, major homeimprovement and/or expansion costs US$2000to US$40,000 and is affordable to householdsearning 1.5 to 2.0 minimum salaries. Otherrelative low-cost housing solutions includeconstruction of a core unit on a lot alreadyowned by the households (US$6000 toUS$8000) and purchase of an existing unit in alow-income settlement (US$10,000).158
The kind of dwelling being referred to in Mexico is a basicunit of 40 square metres designed for further growth on aplot of, perhaps, 60 square metres and on the outskirts ofthe city. An indication of the scale of those who cannotafford mortgage finance is that 40 per cent of householdsearn less than three minimum salaries and, hence, cannotafford mortgage finance even when it is subsidized by thegovernment.159 In Latin America, only the upper-middle andupper-income households have access to mortgage finance.In Bolivia, Colombia, Venezuela and Suriname, low-incomehouseholds make up, respectively, more than 60 per cent,78 per cent, 80 per cent and above 70 per cent of thepopulations.160 In the Philippines, one commentatorconcludes that the state is ineffective in targeting low-income households through a homeownership policy and aninterest rate subsidy.161 Given indicative loan thresholds,the monthly repayment of a loan of 150,000 pesos for a low-cost house is such that 77 per cent of the country cannotafford to access these loans (54.5 per cent of urbanhouseholds). In Panama, 34 per cent of urban householdsearn less than US$300 a month and cannot afford mortgagefinance (a further 43 per cent earn over US$600 and qualify
Low incomes andmacro-economicinstability preventinstitutions fromfacilitating the flowof long-term funds
70 Shelter finance: assessment of trends

without difficulty).162 The middle group households are inan intermediate zone and may only be able to securemortgages if they have formal employment since it iscommon practice in Panama for mortgage payments to bededucted from salaries.163 As these figures indicate, even inSouthern countries that have experienced rapid growth inhousehold income, few can afford mortgage loans. Many ofthe attempts to provide mortgage finance to lower incomegroups have failed due to issues of affordability (even withsubsidy support).
In addition to the cost of the property, there aresignificant additional costs related to the transfer ofproperties, securing a mortgage and associated titleregistration costs. Table 4.12 gives indicative costs formortgage bond registration and the transfer duty in SouthAfrica; legal costs and taxes amount to an average of justunder 7 per cent of the purchase price of a typical middle-class home. Transaction costs in Chile are estimated to beconsiderably lower, at about 2.75 per cent of the cost of atypical dwelling of US$40,000, with just under half beingstamp and registration fees.164 One estimate suggests suchcosts equal 10 to 30 per cent of dwelling cost in sub-SaharanAfrica, with stamp duty at 4 per cent in Kenya.165 Such costsrise to 31 per cent of the estimated average transaction inBangladesh.166
Informal incomes may not be acceptable to thoselending mortgage finance because they cannot be verified.Mortgage companies may refuse to provide finance to thosewho do not work in the formal sector and/or who cannotprove their incomes. Even if some income is secured throughformal labour markets, in many cases, informal employmentis a further and significant source of livelihood for thehousehold. Alternative collateral such as provident orpension funds can be used in South Africa, Bangladesh and,more recently, in Namibia; but it does not emerge as animportant source of a guarantee elsewhere. A furtherexample about the problems of informal incomes comesfrom a group of potters, who have legal ownership of land,in the city of Alwar, India.167 They have saving and landcollateral, but no financing institution is ready to supportthem. This is mainly due to the seasonal nature of their job,which does not provide a regular income throughout theyear. As such, the dependence upon the indigenous moneylenders remains in the range of 60 to 80 per cent.
The costs of loan services may be too expensive atUS$10 a month in the US.168 Total repayments onmicrofinance loans in Latin America are typicallyUS$20–$80 a month, illustrating the difficulties that mightbe faced if high loan servicing costs were added:
… collecting on and processing a mortgagepayment costs roughly US$15 for a typicalsavings and loan in Latin America, while thetotal payment on most HMF [housingmicrofinance] loans usually is only US$25 toUS$100 per month (for families earningUS$100 to US$400 per month – i.e. incomerange of the low-/moderate-income majority inLatin America and the Caribbean).169
Both dimensions of affordability emerge from a moredetailed analysis of the situation of the potters in Alwar. Onereason why they face difficulties in accessing formal housingloans is described thus: ‘Actually, the crux of the issue is thatthese loans are non-profitable for the banks due to smallamount and high administration cost; and according to thebankers, these are high-risk loans.’170 While a number ofself-help groups in the city manage to save and access bankloans for income generation, their incomes are not adequateto access the larger loans for housing investment.171
For those who can afford mortgage loans and who canoffer acceptable collateral, there are further barriers. Insome settlements, it is difficult for low-income residents toreach the banks during opening hours due to their distancefrom low-income settlements. As a result, taking loans andmaking regular repayments is not possible. When the Self-employed Women’s Association (SEWA) in India introducedits small loan programme, it sought to overcome theseproblems through pioneering doorstep banking.172 This wasinitiated by SEWA Bank in 1978, when its first mobile vantravelled to areas of high customer concentration in orderto facilitate cash collection. Today, two mobile vans coverthe city daily, with average daily collections of 10,000 to15,000 rupees each. Further barriers are cultural and skillrelated. In many societies, including Botswana, womensuffer particular difficulties in securing formal housingfinance because of their lower labour market participationin formal employment and the fact that they may not be ableto prove ownership of assets.173 The formal requirements offinancial institutions may be difficult for the poor, who mayhave limited literacy skills and not be familiar with formalprocesses. These general comments serve as the preface toa more detailed look at the trends in Southern regions.
� AsiaThe financial crisis of the late 1990s resulted in difficultiesfor a number of Asian countries and housing finance hasbeen struggling to recover. There is evidence from a numberof countries that the difficulties have been overcome andmortgage finance is now continuing to grow. Box 4.3describes the increase in default rates and, hence, poorfinancial returns in Thailand. The total number of homemortgages outstanding in Thailand had risen to a peak of794,000 in 1997. Mortgage finance had expanded rapidlybetween 1985 and 1995, growing annually at 34 per centin the first five-year period and 33 per cent in the second.174
As a result of the financial difficulties during the late 1990s,there was a crisis of confidence in financial institutions andseveral collapsed. Mortgage finance, supported by theGovernment Housing Bank, has picked up in recent years. In the Republic of Korea, the system has recently been
71Mortgage finance: institutions and mechanisms
Registration costs of a bond of 300,000 randInitial costs Valuation Stamp Administration Registration Transfer
costs duty costs per month duty
199.50 rand Up to 1250 randi 600 randii 5.70 randii 3500 randiii 15,400 randiii
Notes: i Maximum permitted by law; around 684 rand would probably be charged.ii Defined by law.iii Average based on quotations supplied by three banks.
Source: Hawkins, 2003, cited in Baumann, 2004
Mortgage bondregistration costs inSouth Africa
Table 4.12

through major changes. While the financial crisis hasencouraged the trend, deregulation began significantlyearlier during the late 1980s.175 Mortgage lending rosesteadily throughout the early period of the 1990s and growthwas in double figures until 1996.176 The market was furtherencouraged by the removal of price controls on housing in1998.177 Financial deregulation did not initially result in alarge uptake in mortgages because ‘the long-term interestrate is very high, there is no tax concession on mortgageloan repayments, and the ratio of mortgage loan to housingprice is set very low’.178 However, the housing market beganto recover towards the end of the 1990s, as indicated inTable 4.13. The more active involvement of the privatesector in mortgage lending after 1997 was furtherencouraged by the fact that there was no longer anadvantage to the public sector due to lower interest rates.By 2001, the private sector accounted for 42 per cent ofmortgage loans.
Strong growth is also reported elsewhere. In HongKong, SAR of China, growth rates have been strong duringthe mid to late 1990s – for example, 26 per cent growthduring the first half of 1997.179
The economic crisis in Japan has been longer lastingthan that which affected Asia during the late 1990s. Theexperience of Japan is particularly important because ithighlights some of the risks of deregulation as increasing
financing opportunities encouraged lending for housing andconsumer credit.180 Investments in homeownership wereencouraged during the 1960s and the lack of public rentalaccommodation increased the pressure on households tobecome homeowners.181 As economic problems increasedfor the banks’ traditional industrial customers, they switchedtheir concentration to potential homeowners. However,rapid rises in land prices caused particular problems duringthe 1990s – although the initial rise in prices and theassociated real capital gains encouraged residentialinvestment.182 In 1992, prices were so high that therequired average loans equalled five times the averageincomes of working people.183 Prices peaked around1990–1991 and have fallen since then. The state has soughtto offer assistance to those in particular difficulties as aresult of redundancy and income falls; but take-up of optionssuch as longer repayment periods has been minimal.Homeownership levels are now similar to the early 1960s.While homeownership was heavily concentrated amongmen, recent trends and, notably, lower prices and interestrates together with deregulation of lending criteria haveresulted in greater access for women.
Mortgage growth has also been notable in lowerincome Asian countries, such as Indonesia and India. InIndonesia, housing finance grew at annual rates of over 20per cent between 1993 and 1996.184 In India, the 1990swere noted for the increase in the number of specialisthousing finance institutions. Prior to this, developments hadbeen slow, although the Housing Development and FinanceCorporation (HDFC) had been established in 1977.185
During the 1980s, banks were reluctant to lend for housingas they saw it as too risky. However, during the 1990s, therewas a turnaround when industrial growth slowed and bankslooked for alternative borrowers. Low interest rates, risingdisposable incomes, stable property prices and fiscalincentives all encouraged growth in lending for housepurchase.186 One commentator summarized the situationduring the late 1990s thus: ‘There are now more than 370such companies that have housing finance as their principleobjective, although the majority of them play an insignificantrole.’187 Reflecting this last conclusion, only 26 of thesecompanies worked with the National Housing Bank.188
These institutions have been lending to middle- and higherincome groups. However, the scale of finance has increasedby an estimated annual rate of 30 per cent during the lastfive years.189 Nevertheless, the market remains small inIndia at only 2 per cent of GNP, compared to 13 per cent inthe Republic of Korea.190
This somewhat optimistic picture is not replicatedeverywhere. Mortgage finance has been slow to emerge inPakistan, while traditional approaches have also dominatedin Bangladesh. Box 4.11 describes the role played by theBangladesh House Building Finance Corporation and itscontinuing emphasis on higher income groups.
In the Philippines, the government does appear tohave been somewhat successful in extending subsidizedloans to middle- and lower middle-income groups employedin the formal sector, principally through government-controlled pension and provident funds.191 There was an
72 Shelter finance: assessment of trends
Box 4.10 Deregulation of housing finance in the Republic of Korea
Prior to the financial difficulties in the Republic of Korea in 1997, the major source of fundingwas the Korea Housing Bank, renamed the Housing and Commercial Bank in 1997.The stateused the bank to support low-income, low-cost housing; in effect, there was a single publicsupplier of mortgage housing finance, with only the Korea Housing Bank being authorized togive long-term mortgages with terms exceeding ten years. Housing finance was relatively scarceand homeownership in urban areas actually fell between 1960 and 1995 from 62 to 46 percent.
The government sought to prioritize finance for industrial development and theHousing Bank was heavily dependent upon savings. Demand for housing so exceeded supplythat state housing allocations were determined by lottery, the ‘winners’ of which could join thebank’s lending scheme after making ‘subscription deposits’ for two years. Little additional stateresources were directed to housing, and the system was public only in so far as it wasstructured by the state; people provided their own finance through savings.To further assist theaccumulation of resources, a very specific rental finance system developed with capitalcommitments thereby facilitating the accumulation of funds; in 1997, informal rental depositswere twice the amount of formal housing loans. Mortgage rates benefited from an interest ratesubsidy, although the benefits were primarily realized by the middle class who could afford toaccumulate sufficient funds for the required deposit and take loans.Source: Ahn, 2002, pp255–257; Ha, 2002b, p243; Ha cited in La Grange and Nam Jung, 2004, p563.
1997 1998 1999 2000 2001
Outstanding balances of 53.0 55.5 61.3 67.6 72.9mortgage loans (A)
New origination of 13.4 12.1 17.1. 21.4 29.7mortgage loans (B)
Gross domestic product (C) 453.3 444.4 482.7 522.0 545.0
A/C (percentage) 11.7 12.5 12.7 13.0 13.4
B/C (percentage) 3.0 2.7 3.5 4.1 5.4
Source: Bank of Korea, Kookmin Bank, quoted in Lee, 2003, p24.
Growth of mortgagelending in the Republic of Korea: sizeof the primarymortgage market(trillion Korean won)
Table 4.13
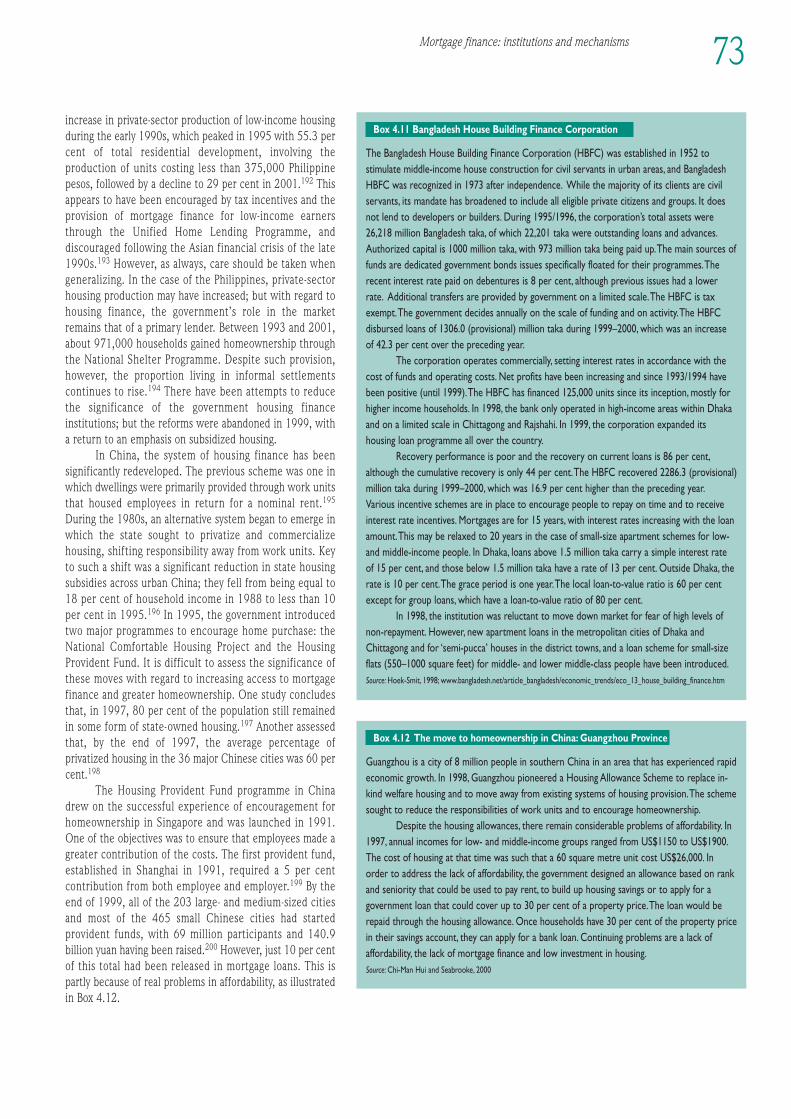
increase in private-sector production of low-income housingduring the early 1990s, which peaked in 1995 with 55.3 percent of total residential development, involving theproduction of units costing less than 375,000 Philippinepesos, followed by a decline to 29 per cent in 2001.192 Thisappears to have been encouraged by tax incentives and theprovision of mortgage finance for low-income earnersthrough the Unified Home Lending Programme, anddiscouraged following the Asian financial crisis of the late1990s.193 However, as always, care should be taken whengeneralizing. In the case of the Philippines, private-sectorhousing production may have increased; but with regard tohousing finance, the government’s role in the marketremains that of a primary lender. Between 1993 and 2001,about 971,000 households gained homeownership throughthe National Shelter Programme. Despite such provision,however, the proportion living in informal settlementscontinues to rise.194 There have been attempts to reducethe significance of the government housing financeinstitutions; but the reforms were abandoned in 1999, witha return to an emphasis on subsidized housing.
In China, the system of housing finance has beensignificantly redeveloped. The previous scheme was one inwhich dwellings were primarily provided through work unitsthat housed employees in return for a nominal rent.195
During the 1980s, an alternative system began to emerge inwhich the state sought to privatize and commercializehousing, shifting responsibility away from work units. Keyto such a shift was a significant reduction in state housingsubsidies across urban China; they fell from being equal to18 per cent of household income in 1988 to less than 10per cent in 1995.196 In 1995, the government introducedtwo major programmes to encourage home purchase: theNational Comfortable Housing Project and the HousingProvident Fund. It is difficult to assess the significance ofthese moves with regard to increasing access to mortgagefinance and greater homeownership. One study concludesthat, in 1997, 80 per cent of the population still remainedin some form of state-owned housing.197 Another assessedthat, by the end of 1997, the average percentage ofprivatized housing in the 36 major Chinese cities was 60 percent.198
The Housing Provident Fund programme in Chinadrew on the successful experience of encouragement forhomeownership in Singapore and was launched in 1991.One of the objectives was to ensure that employees made agreater contribution of the costs. The first provident fund,established in Shanghai in 1991, required a 5 per centcontribution from both employee and employer.199 By theend of 1999, all of the 203 large- and medium-sized citiesand most of the 465 small Chinese cities had startedprovident funds, with 69 million participants and 140.9billion yuan having been raised.200 However, just 10 per centof this total had been released in mortgage loans. This ispartly because of real problems in affordability, as illustratedin Box 4.12.
73Mortgage finance: institutions and mechanisms
Box 4.11 Bangladesh House Building Finance Corporation
The Bangladesh House Building Finance Corporation (HBFC) was established in 1952 tostimulate middle-income house construction for civil servants in urban areas, and BangladeshHBFC was recognized in 1973 after independence. While the majority of its clients are civilservants, its mandate has broadened to include all eligible private citizens and groups. It doesnot lend to developers or builders. During 1995/1996, the corporation’s total assets were26,218 million Bangladesh taka, of which 22,201 taka were outstanding loans and advances.Authorized capital is 1000 million taka, with 973 million taka being paid up.The main sources offunds are dedicated government bonds issues specifically floated for their programmes.Therecent interest rate paid on debentures is 8 per cent, although previous issues had a lowerrate. Additional transfers are provided by government on a limited scale.The HBFC is taxexempt.The government decides annually on the scale of funding and on activity.The HBFCdisbursed loans of 1306.0 (provisional) million taka during 1999–2000, which was an increaseof 42.3 per cent over the preceding year.
The corporation operates commercially, setting interest rates in accordance with thecost of funds and operating costs. Net profits have been increasing and since 1993/1994 havebeen positive (until 1999).The HBFC has financed 125,000 units since its inception, mostly forhigher income households. In 1998, the bank only operated in high-income areas within Dhakaand on a limited scale in Chittagong and Rajshahi. In 1999, the corporation expanded itshousing loan programme all over the country.
Recovery performance is poor and the recovery on current loans is 86 per cent,although the cumulative recovery is only 44 per cent.The HBFC recovered 2286.3 (provisional)million taka during 1999–2000, which was 16.9 per cent higher than the preceding year.Various incentive schemes are in place to encourage people to repay on time and to receiveinterest rate incentives. Mortgages are for 15 years, with interest rates increasing with the loanamount.This may be relaxed to 20 years in the case of small-size apartment schemes for low-and middle-income people. In Dhaka, loans above 1.5 million taka carry a simple interest rateof 15 per cent, and those below 1.5 million taka have a rate of 13 per cent. Outside Dhaka, therate is 10 per cent.The grace period is one year.The local loan-to-value ratio is 60 per centexcept for group loans, which have a loan-to-value ratio of 80 per cent.
In 1998, the institution was reluctant to move down market for fear of high levels ofnon-repayment. However, new apartment loans in the metropolitan cities of Dhaka andChittagong and for ‘semi-pucca’ houses in the district towns, and a loan scheme for small-sizeflats (550–1000 square feet) for middle- and lower middle-class people have been introduced.Source: Hoek-Smit, 1998; www.bangladesh.net/article_bangladesh/economic_trends/eco_13_house_building_finance.htm
Box 4.12 The move to homeownership in China: Guangzhou Province
Guangzhou is a city of 8 million people in southern China in an area that has experienced rapideconomic growth. In 1998, Guangzhou pioneered a Housing Allowance Scheme to replace in-kind welfare housing and to move away from existing systems of housing provision.The schemesought to reduce the responsibilities of work units and to encourage homeownership.
Despite the housing allowances, there remain considerable problems of affordability. In1997, annual incomes for low- and middle-income groups ranged from US$1150 to US$1900.The cost of housing at that time was such that a 60 square metre unit cost US$26,000. Inorder to address the lack of affordability, the government designed an allowance based on rankand seniority that could be used to pay rent, to build up housing savings or to apply for agovernment loan that could cover up to 30 per cent of a property price.The loan would berepaid through the housing allowance. Once households have 30 per cent of the property pricein their savings account, they can apply for a bank loan. Continuing problems are a lack ofaffordability, the lack of mortgage finance and low investment in housing.Source: Chi-Man Hui and Seabrooke, 2000
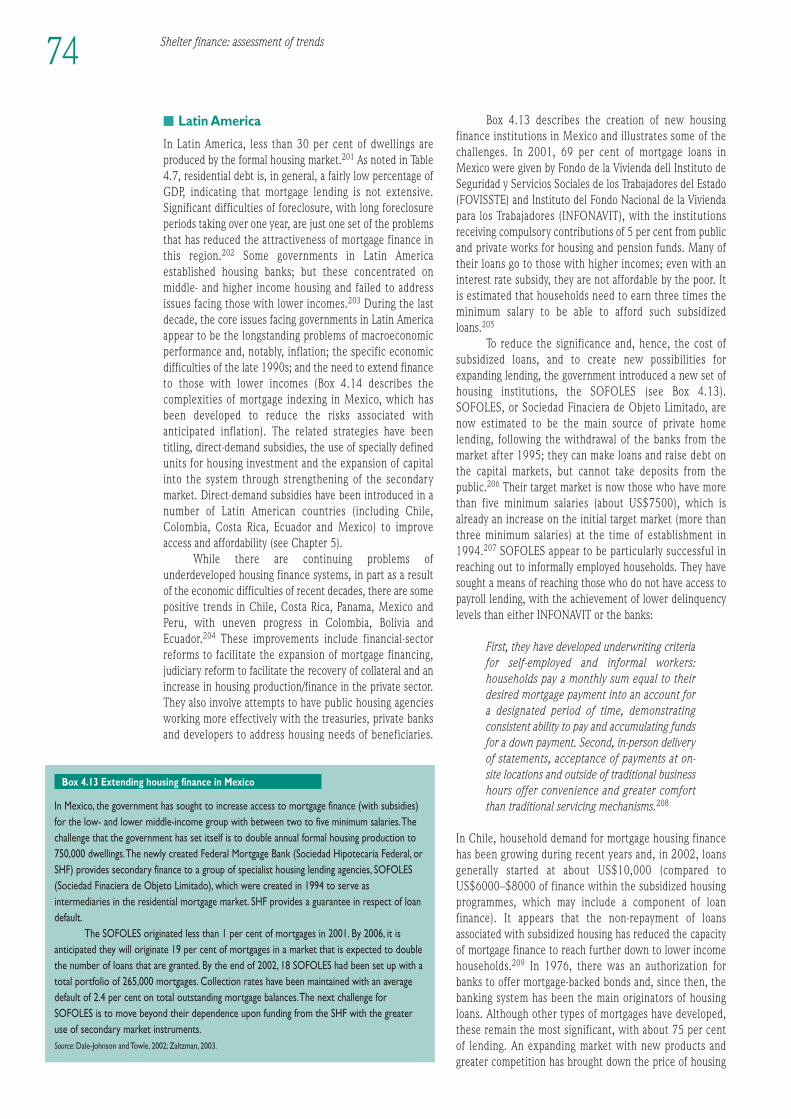
� Latin America
In Latin America, less than 30 per cent of dwellings areproduced by the formal housing market.201 As noted in Table4.7, residential debt is, in general, a fairly low percentage ofGDP, indicating that mortgage lending is not extensive.Significant difficulties of foreclosure, with long foreclosureperiods taking over one year, are just one set of the problemsthat has reduced the attractiveness of mortgage finance inthis region.202 Some governments in Latin Americaestablished housing banks; but these concentrated onmiddle- and higher income housing and failed to addressissues facing those with lower incomes.203 During the lastdecade, the core issues facing governments in Latin Americaappear to be the longstanding problems of macroeconomicperformance and, notably, inflation; the specific economicdifficulties of the late 1990s; and the need to extend financeto those with lower incomes (Box 4.14 describes thecomplexities of mortgage indexing in Mexico, which hasbeen developed to reduce the risks associated withanticipated inflation). The related strategies have beentitling, direct-demand subsidies, the use of specially definedunits for housing investment and the expansion of capitalinto the system through strengthening of the secondarymarket. Direct-demand subsidies have been introduced in anumber of Latin American countries (including Chile,Colombia, Costa Rica, Ecuador and Mexico) to improveaccess and affordability (see Chapter 5).
While there are continuing problems ofunderdeveloped housing finance systems, in part as a resultof the economic difficulties of recent decades, there are somepositive trends in Chile, Costa Rica, Panama, Mexico andPeru, with uneven progress in Colombia, Bolivia andEcuador.204 These improvements include financial-sectorreforms to facilitate the expansion of mortgage financing,judiciary reform to facilitate the recovery of collateral and anincrease in housing production/finance in the private sector.They also involve attempts to have public housing agenciesworking more effectively with the treasuries, private banksand developers to address housing needs of beneficiaries.
Box 4.13 describes the creation of new housingfinance institutions in Mexico and illustrates some of thechallenges. In 2001, 69 per cent of mortgage loans inMexico were given by Fondo de la Vivienda dell Instituto deSeguridad y Servicios Sociales de los Trabajadores del Estado(FOVISSTE) and Instituto del Fondo Nacional de la Viviendapara los Trabajadores (INFONAVIT), with the institutionsreceiving compulsory contributions of 5 per cent from publicand private works for housing and pension funds. Many oftheir loans go to those with higher incomes; even with aninterest rate subsidy, they are not affordable by the poor. Itis estimated that households need to earn three times theminimum salary to be able to afford such subsidizedloans.205
To reduce the significance and, hence, the cost ofsubsidized loans, and to create new possibilities forexpanding lending, the government introduced a new set ofhousing institutions, the SOFOLES (see Box 4.13).SOFOLES, or Sociedad Finaciera de Objeto Limitado, arenow estimated to be the main source of private homelending, following the withdrawal of the banks from themarket after 1995; they can make loans and raise debt onthe capital markets, but cannot take deposits from thepublic.206 Their target market is now those who have morethan five minimum salaries (about US$7500), which isalready an increase on the initial target market (more thanthree minimum salaries) at the time of establishment in1994.207 SOFOLES appear to be particularly successful inreaching out to informally employed households. They havesought a means of reaching those who do not have access topayroll lending, with the achievement of lower delinquencylevels than either INFONAVIT or the banks:
First, they have developed underwriting criteriafor self-employed and informal workers:households pay a monthly sum equal to theirdesired mortgage payment into an account fora designated period of time, demonstratingconsistent ability to pay and accumulating fundsfor a down payment. Second, in-person deliveryof statements, acceptance of payments at on-site locations and outside of traditional businesshours offer convenience and greater comfortthan traditional servicing mechanisms.208
In Chile, household demand for mortgage housing financehas been growing during recent years and, in 2002, loansgenerally started at about US$10,000 (compared toUS$6000–$8000 of finance within the subsidized housingprogrammes, which may include a component of loanfinance). It appears that the non-repayment of loansassociated with subsidized housing has reduced the capacityof mortgage finance to reach further down to lower incomehouseholds.209 In 1976, there was an authorization forbanks to offer mortgage-backed bonds and, since then, thebanking system has been the main originators of housingloans. Although other types of mortgages have developed,these remain the most significant, with about 75 per centof lending. An expanding market with new products andgreater competition has brought down the price of housing
74 Shelter finance: assessment of trends
Box 4.13 Extending housing finance in Mexico
In Mexico, the government has sought to increase access to mortgage finance (with subsidies)for the low- and lower middle-income group with between two to five minimum salaries.Thechallenge that the government has set itself is to double annual formal housing production to750,000 dwellings.The newly created Federal Mortgage Bank (Sociedad Hipotecaria Federal, orSHF) provides secondary finance to a group of specialist housing lending agencies, SOFOLES(Sociedad Finaciera de Objeto Limitado), which were created in 1994 to serve asintermediaries in the residential mortgage market. SHF provides a guarantee in respect of loandefault.
The SOFOLES originated less than 1 per cent of mortgages in 2001. By 2006, it isanticipated they will originate 19 per cent of mortgages in a market that is expected to doublethe number of loans that are granted. By the end of 2002, 18 SOFOLES had been set up with atotal portfolio of 265,000 mortgages. Collection rates have been maintained with an averagedefault of 2.4 per cent on total outstanding mortgage balances.The next challenge forSOFOLES is to move beyond their dependence upon funding from the SHF with the greateruse of secondary market instruments.Source: Dale-Johnson and Towle, 2002; Zaltzman, 2003.

finance, with a decline in the spread (the difference betweenthe rate paid on the bond and that paid by the borrower)from 3 to 2 per cent between 1988 and 1997.210
� Sub-Saharan Africa The situation in sub-Saharan Africa divides between SouthAfrica (and, to a lesser extent, Namibia and, until recently,Zimbabwe), where the commercial banking sector issignificantly involved in mortgage lending, and the rest ofthe continent.211
In South Africa, outstanding credit extended toprivate households in South Africa was about 360 billionrand (US$55.8 billion212) in 2002 (see Table 4.14). Of this,191 billion rand (53 per cent – US$29.6 billion) was forprivate mortgages. A further 7 billion rand (US$1 billion)was for mortgages extended by parastatals and non-bankinstitutions. South Africa’s mortgage market is thus about198 billion rand (US$30.7 billion). The South AfricanMicrofinance Regulatory Council213 estimates thatregistered microlenders (including banks) currently hold 5.6billion rand (US$868 million) in non-mortgage credit usedfor housing purposes.
Table 4.14 emphasizes that most housing finance isprovided through bank mortgages. Despite this scale offinance, there is evidence to suggest that the lower incomehouseholds remain excluded from the market. A nationalsurvey by the National Housing Finance Corporation in 2000focused on the 1000 to 8000 rand monthly income bracketof lower to lower middle-income households.214 The surveyfound that, of those seeking to buy, 41 per cent felt thatfinancial institutions would not provide them with creditfacilities due to their low income, while nearly a third (31per cent) were unable to access credit from financialinstitutions due to being informally or self-employed. Only38 per cent had applied for finance, with 13 per cent beingsuccessful. Three specific problems emerge: informality oftenure and incomes; lack of affordability; and lack ofinstitutional reach. The informality of tenure and of incomesmakes it hard for the poor to secure finance. While thosewho are in formal employment can use their provident fundsto guarantee housing loans, many work in the informalsector. Moreover, mortgage finance is unaffordable to many.Approximately 2.28 million households live in South Africa’s‘township’ areas, 21 per cent of all households in SouthAfrica. Thirty-three per cent of these households own theirproperty (compared to a national average of 53 per cent).215
Most lack sufficient income, estimated to be a minimum of2500 rand, or US$390, per month, that is needed to afforda mortgage loan. The government census of 1996 estimatedthat 75 per cent of households have incomes below thislevel. There are few alternatives; those offering smaller loanscharge higher interest rates. Although legislation has easedthe provision of such microloans, their size is small andinsufficient for housing purchase. As discussed in Chapter6, many would be refused loans for reasons other thanincome.
The lack of market development in much of the restof sub-Saharan Africa is related to similar reasons forexcluding many poor South Africans from formal mortgage
markets. Incomes are too low and employment is informal.Further problems include macroeconomic instability andproblems around tenure insecurity. As a result of suchfactors, commercial housing markets remain minimal inmany African cities.216 The housing finance sector isdominated by those institutions which are state owned,receive financial support from the state, often offersubsidized loans and have poor repayment records.217
The original conceptualization after politicalindependence was that the private sector would provide forhigher income groups; hence, the focus of governmentshould be on the middle- and lower income groups. Manysub-Saharan African governments established nationalhousing agencies to directly develop houses, offer loans andestablish financial systems. However, the experiences werenot successful. As illustrated in the case of the NationalHousing Fund in Zimbabwe, there were structural andaffordability problems.218 In this specific case, the fundloaned at interest rates that were lower than the cost offunds, and had significant arrears from local authorities whomanaged the dwellings and who were responsible forrepayment. Nevertheless, despite a technical agreement thatsuch local authorities would be denied future loans, inpractice the political decision was that investments shouldcontinue, even in the case of local authorities in arrears.219
A further example is the Tanzania Housing Bank establishedin 1973, which collapsed in 1995. In this case, despite anumber of specialist and general funds, relatively few loanswere issued, with a total of about 36,000 units, over the 22-year period of its existence and the estimated loan recoveryrate was only 22 per cent.220
75Mortgage finance: institutions and mechanisms
Box 4.14 Reducing lender risk in Mexico
One of the historic problems for Mexican borrowers and lenders has been interest rate risk asa result of high inflation. During the early 1990s, escalating payments and falling incomesresulted in up to 80 per cent defaults on loans.
The Dual Index Mortgage (DIM) links the price of the house, or principal of the loan,to Unidades de Inversión (UDIs), which are the Mexican unit of investment introduced afterthe 1995 financial fiasco. In November 2004, the UDI was worth 3.5 pesos, or approximatelyUS$0.30.The UDIs are indexed to the cost of living, so the amount that borrowers have to payrises as the value of the loan rises, while the monthly payment is indexed to the minimum wagelevel, which also increases (although it often lags somewhat behind both the cost of living andaverage wage). Differences between the actual and required payments are added to the loanbalance. In extreme cases it might be that the lender had a loan that could never be fullyamortized.This problem has been reduced by the introduction of insurance against relativedeclines in the borrower’s income.The insurance was originally 11 per cent of the monthlypayment, but is now 5 per cent.Source: Dale-Johnson and Towle, 2002, p23; Lea, 2000, p18.
Type of credit US$ billion Percentage of housing Percentage of finance market consumer credit
market
Consumer credit 55.8 – 100
Total housing finance, of which: 30.9 100 55.4
bank mortgages 29.6 95.8 53.0
non-bank mortgages 1.01 3.3 10.0
non-mortgage loans for housing 0.87 2.8 1.6
Source: Hawkins, 2003, and Microfinance Regulatory Council (www.mfrc.co.za), both cited in Baumann, 2004.
South African housingfinance (by total loanbook)
Table 4.14
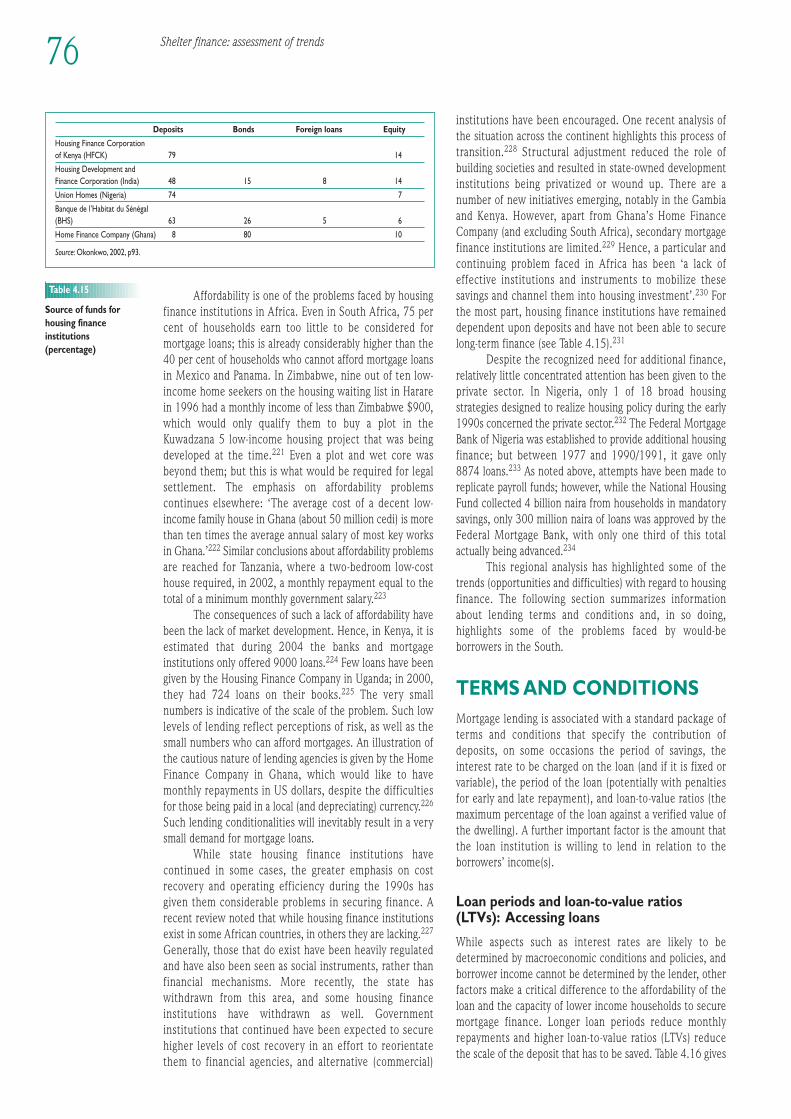
Affordability is one of the problems faced by housingfinance institutions in Africa. Even in South Africa, 75 percent of households earn too little to be considered formortgage loans; this is already considerably higher than the40 per cent of households who cannot afford mortgage loansin Mexico and Panama. In Zimbabwe, nine out of ten low-income home seekers on the housing waiting list in Hararein 1996 had a monthly income of less than Zimbabwe $900,which would only qualify them to buy a plot in theKuwadzana 5 low-income housing project that was beingdeveloped at the time.221 Even a plot and wet core wasbeyond them; but this is what would be required for legalsettlement. The emphasis on affordability problemscontinues elsewhere: ‘The average cost of a decent low-income family house in Ghana (about 50 million cedi) is morethan ten times the average annual salary of most key worksin Ghana.’222 Similar conclusions about affordability problemsare reached for Tanzania, where a two-bedroom low-costhouse required, in 2002, a monthly repayment equal to thetotal of a minimum monthly government salary.223
The consequences of such a lack of affordability havebeen the lack of market development. Hence, in Kenya, it isestimated that during 2004 the banks and mortgageinstitutions only offered 9000 loans.224 Few loans have beengiven by the Housing Finance Company in Uganda; in 2000,they had 724 loans on their books.225 The very smallnumbers is indicative of the scale of the problem. Such lowlevels of lending reflect perceptions of risk, as well as thesmall numbers who can afford mortgages. An illustration ofthe cautious nature of lending agencies is given by the HomeFinance Company in Ghana, which would like to havemonthly repayments in US dollars, despite the difficultiesfor those being paid in a local (and depreciating) currency.226
Such lending conditionalities will inevitably result in a verysmall demand for mortgage loans.
While state housing finance institutions havecontinued in some cases, the greater emphasis on costrecovery and operating efficiency during the 1990s hasgiven them considerable problems in securing finance. Arecent review noted that while housing finance institutionsexist in some African countries, in others they are lacking.227
Generally, those that do exist have been heavily regulatedand have also been seen as social instruments, rather thanfinancial mechanisms. More recently, the state haswithdrawn from this area, and some housing financeinstitutions have withdrawn as well. Governmentinstitutions that continued have been expected to securehigher levels of cost recovery in an effort to reorientatethem to financial agencies, and alternative (commercial)
institutions have been encouraged. One recent analysis ofthe situation across the continent highlights this process oftransition.228 Structural adjustment reduced the role ofbuilding societies and resulted in state-owned developmentinstitutions being privatized or wound up. There are anumber of new initiatives emerging, notably in the Gambiaand Kenya. However, apart from Ghana’s Home FinanceCompany (and excluding South Africa), secondary mortgagefinance institutions are limited.229 Hence, a particular andcontinuing problem faced in Africa has been ‘a lack ofeffective institutions and instruments to mobilize thesesavings and channel them into housing investment’.230 Forthe most part, housing finance institutions have remaineddependent upon deposits and have not been able to securelong-term finance (see Table 4.15).231
Despite the recognized need for additional finance,relatively little concentrated attention has been given to theprivate sector. In Nigeria, only 1 of 18 broad housingstrategies designed to realize housing policy during the early1990s concerned the private sector.232 The Federal MortgageBank of Nigeria was established to provide additional housingfinance; but between 1977 and 1990/1991, it gave only8874 loans.233 As noted above, attempts have been made toreplicate payroll funds; however, while the National HousingFund collected 4 billion naira from households in mandatorysavings, only 300 million naira of loans was approved by theFederal Mortgage Bank, with only one third of this totalactually being advanced.234
This regional analysis has highlighted some of thetrends (opportunities and difficulties) with regard to housingfinance. The following section summarizes informationabout lending terms and conditions and, in so doing,highlights some of the problems faced by would-beborrowers in the South.
TERMS AND CONDITIONSMortgage lending is associated with a standard package ofterms and conditions that specify the contribution ofdeposits, on some occasions the period of savings, theinterest rate to be charged on the loan (and if it is fixed orvariable), the period of the loan (potentially with penaltiesfor early and late repayment), and loan-to-value ratios (themaximum percentage of the loan against a verified value ofthe dwelling). A further important factor is the amount thatthe loan institution is willing to lend in relation to theborrowers’ income(s).
Loan periods and loan-to-value ratios(LTVs): Accessing loans
While aspects such as interest rates are likely to bedetermined by macroeconomic conditions and policies, andborrower income cannot be determined by the lender, otherfactors make a critical difference to the affordability of theloan and the capacity of lower income households to securemortgage finance. Longer loan periods reduce monthlyrepayments and higher loan-to-value ratios (LTVs) reducethe scale of the deposit that has to be saved. Table 4.16 gives
76 Shelter finance: assessment of trends
Deposits Bonds Foreign loans Equity
Housing Finance Corporation of Kenya (HFCK) 79 14
Housing Development and Finance Corporation (India) 48 15 8 14
Union Homes (Nigeria) 74 7
Banque de l’Habitat du Sénégal (BHS) 63 26 5 6
Home Finance Company (Ghana) 8 80 10
Source: Okonkwo, 2002, p93.
Source of funds forhousing financeinstitutions(percentage)
Table 4.15
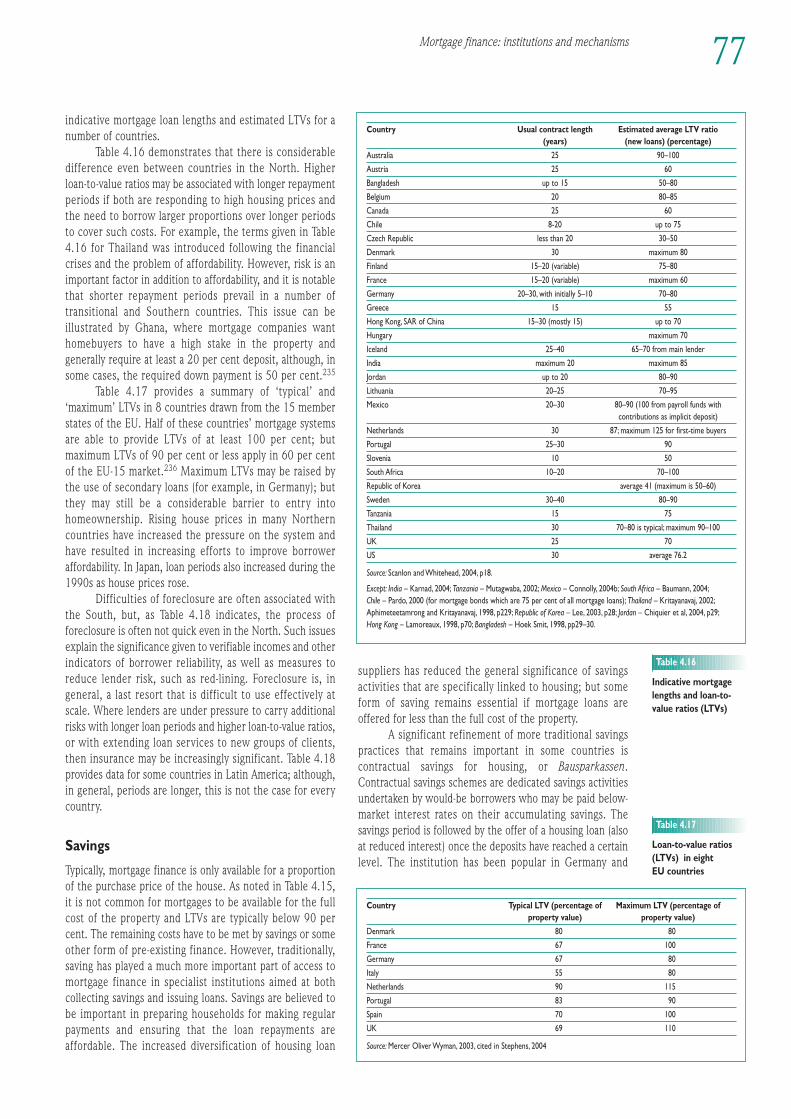
indicative mortgage loan lengths and estimated LTVs for anumber of countries.
Table 4.16 demonstrates that there is considerabledifference even between countries in the North. Higherloan-to-value ratios may be associated with longer repaymentperiods if both are responding to high housing prices andthe need to borrow larger proportions over longer periodsto cover such costs. For example, the terms given in Table4.16 for Thailand was introduced following the financialcrises and the problem of affordability. However, risk is animportant factor in addition to affordability, and it is notablethat shorter repayment periods prevail in a number oftransitional and Southern countries. This issue can beillustrated by Ghana, where mortgage companies wanthomebuyers to have a high stake in the property andgenerally require at least a 20 per cent deposit, although, insome cases, the required down payment is 50 per cent.235
Table 4.17 provides a summary of ‘typical’ and‘maximum’ LTVs in 8 countries drawn from the 15 memberstates of the EU. Half of these countries’ mortgage systemsare able to provide LTVs of at least 100 per cent; butmaximum LTVs of 90 per cent or less apply in 60 per centof the EU-15 market.236 Maximum LTVs may be raised bythe use of secondary loans (for example, in Germany); butthey may still be a considerable barrier to entry intohomeownership. Rising house prices in many Northerncountries have increased the pressure on the system andhave resulted in increasing efforts to improve borroweraffordability. In Japan, loan periods also increased during the1990s as house prices rose.
Difficulties of foreclosure are often associated withthe South, but, as Table 4.18 indicates, the process offoreclosure is often not quick even in the North. Such issuesexplain the significance given to verifiable incomes and otherindicators of borrower reliability, as well as measures toreduce lender risk, such as red-lining. Foreclosure is, ingeneral, a last resort that is difficult to use effectively atscale. Where lenders are under pressure to carry additionalrisks with longer loan periods and higher loan-to-value ratios,or with extending loan services to new groups of clients,then insurance may be increasingly significant. Table 4.18provides data for some countries in Latin America; although,in general, periods are longer, this is not the case for everycountry.
Savings
Typically, mortgage finance is only available for a proportionof the purchase price of the house. As noted in Table 4.15,it is not common for mortgages to be available for the fullcost of the property and LTVs are typically below 90 percent. The remaining costs have to be met by savings or someother form of pre-existing finance. However, traditionally,saving has played a much more important part of access tomortgage finance in specialist institutions aimed at bothcollecting savings and issuing loans. Savings are believed tobe important in preparing households for making regularpayments and ensuring that the loan repayments areaffordable. The increased diversification of housing loan
suppliers has reduced the general significance of savingsactivities that are specifically linked to housing; but someform of saving remains essential if mortgage loans areoffered for less than the full cost of the property.
A significant refinement of more traditional savingspractices that remains important in some countries iscontractual savings for housing, or Bausparkassen.Contractual savings schemes are dedicated savings activitiesundertaken by would-be borrowers who may be paid below-market interest rates on their accumulating savings. Thesavings period is followed by the offer of a housing loan (alsoat reduced interest) once the deposits have reached a certainlevel. The institution has been popular in Germany and
77Mortgage finance: institutions and mechanisms
Country Usual contract length Estimated average LTV ratio (years) (new loans) (percentage)
Australia 25 90–100
Austria 25 60
Bangladesh up to 15 50–80
Belgium 20 80–85
Canada 25 60
Chile 8-20 up to 75
Czech Republic less than 20 30–50
Denmark 30 maximum 80
Finland 15–20 (variable) 75–80
France 15–20 (variable) maximum 60
Germany 20–30, with initially 5–10 70–80
Greece 15 55
Hong Kong, SAR of China 15–30 (mostly 15) up to 70
Hungary maximum 70
Iceland 25–40 65–70 from main lender
India maximum 20 maximum 85
Jordan up to 20 80–90
Lithuania 20–25 70–95
Mexico 20–30 80–90 (100 from payroll funds with contributions as implicit deposit)
Netherlands 30 87; maximum 125 for first-time buyers
Portugal 25–30 90
Slovenia 10 50
South Africa 10–20 70–100
Republic of Korea average 41 (maximum is 50–60)
Sweden 30–40 80–90
Tanzania 15 75
Thailand 30 70–80 is typical; maximum 90–100
UK 25 70
US 30 average 76.2
Source: Scanlon and Whitehead, 2004, p18.
Except: India – Karnad, 2004; Tanzania – Mutagwaba, 2002; Mexico – Connolly, 2004b; South Africa – Baumann, 2004;Chile – Pardo, 2000 (for mortgage bonds which are 75 per cent of all mortgage loans); Thailand – Kritayanavaj, 2002;Aphimeteetamrong and Kritayanavaj, 1998, p229; Republic of Korea – Lee, 2003, p28; Jordan – Chiquier et al, 2004, p29;Hong Kong – Lamoreaux, 1998, p70; Bangladesh – Hoek Smit, 1998, pp29–30.
Country Typical LTV (percentage of Maximum LTV (percentage of property value) property value)
Denmark 80 80
France 67 100
Germany 67 80
Italy 55 80
Netherlands 90 115
Portugal 83 90
Spain 70 100
UK 69 110
Source: Mercer Oliver Wyman, 2003, cited in Stephens, 2004
Indicative mortgagelengths and loan-to-value ratios (LTVs)
Table 4.16
Loan-to-value ratios(LTVs) in eight EU countries
Table 4.17

Austria and has more recently spread to other countries,particularly the transition countries. Such institutions wereintroduced in Slovakia (1993), the Czech Republic(approximately 1994), Hungary (1997) and Croatia(2000).237 The subsidy is often justified on the grounds thatlong-term savings are encouraged, that the practice of regularpayment is established by the early period of saving and thatinterest rate changes are minimized.238 However, onenecessary precondition is low and stable inflation rates(thereby maintaining the value of the accumulating funds).
There have been concerns about the efficiency ofcontractual savings schemes. Once committed, the savingsare tied up; as a result, such schemes suffer from theirinflexibility when the broader financial and economicenvironment changes. The subsidies required to attractsavings may be considerable, leading to the inefficient useof government funds and budgetary pressures. It is forreasons such as these that Poland is moving away from thissystem.239 In Slovakia, there is some evidence that they havebeen used as a transitional instrument, with loan volumesrising while the subsidy burden is falling.240 Such schemeshave been poorly targeted in terms of households’ incomes.However, they could potentially be limited to certain groupsdefined by income or age. Some schemes have beencriticized for being used to subsidize savings unconnectedto house purchase, although this could also be prevented bya more restrictive design.241
Interest rates
Interest rates reflect the cost of capital – they are the pricethat borrowers have to pay to the lender to make use of thefunds. If the housing finance market is working effectively,interest rates should be only slightly higher than primelending or deposit rates in the commercial banking sector.242
However, in practice, rates may be higher and/or lowerdepending upon market efficiencies, perceptions of risks andstate intervention. Despite the comment above that interestrates are often a ‘given’, set exogenously by macroeconomictrends and monetary policy, in some cases state housinginstitutions or those receiving subsidies charge interest ratesbelow market rates.
State housing agencies have more flexibility in theuse of funds. In Thailand, for example, the National Housing
Bank undercuts commercial interest rates. It also offersdifferential rates (through a cross-subsidy) to those takingsmaller loans in order to ‘make borrowing more accessibleand more affordable to a large number of home buyers’.243
Examples of subsidized interest rates have been given in thischapter for Tunisia, India and Hungary. A further examplecomes from the Philippines mortgage market, where ratesare variable; in 1996 the cost of commercial borrowing was16 per cent (secure for one year), while subsidized loanscharged 9 to 12 per cent.244
Alternatively, the way in which financial marketsrespond may also differ. As a result, the cost of funds mayvary to reflect the relatively lower administration costsassociated with larger loans. The following figures are thosecurrently prevailing in Chile:245
• For loans from 800 to 1999 UF (Unidades deFomento, a Chilean-peso denominated unit with dailyadjustment to inflation) the rate is 4.8 per cent.
• For those from 1999 to 2999 UF, the rate is 4.4 percent.
• For 3000 UF and more, the rate is 3.7 per cent.
Interest rates can be particularly problematic for affordabilityduring periods of high inflation. High nominal interest ratestend to worsen the so-called ‘front-end loading’ problem,where the real burden of interest payments falls very heavilyduring the early years of the mortgage, which oftencoincides with stages in the life cycle when financial burdensare high (dependent children) and earnings have not yetbeen maximized. High interest rates considerably increasethe cost of borrowing and make housing investmentsunaffordable for many families. The problem can beexemplified by Tanzania, where inflation in 2000 wasbetween 18 and 25 per cent.246 A loan equal to three timesannual income would require total yearly payments equal to55 to 75 per cent of annual income. A more detailed reportcalculates that if the interest rate ‘was to drop to 10 per centper annum, the affordability ratio, though still low, willtremendously improve’.247
In the North, there is discrepancy between fixed andvariable rates. In general, there appears to have been a shiftto flexible, variable rates, which pass more of the risks fromthe provider of the loan to the borrower.
Table 4.19 illustrates the situation in South Africa byproviding a snapshot of terms and conditions for lenders ofsmall loans (the first two rows) and complete loans (thefollowing four rows). Interest rates are relatively high,reflecting two state policies not unusual in the South: first,the government wishes to encourage capital inflows tostrengthen the currency and, second, it wishes to encouragesaving. Table 4.19 illustrates the high cost of borrowing forthose unable to secure mortgages.
Finally, lenders commonly restrict loan repayments toa maximum percentage of incomes. While a typicalpercentage is up to 25–30 per cent of income, higher rateshave been used to increase loan acceptances as house pricesrise. In Hong Kong, the rate rose to 50 per cent, in Thailandit is 30 per cent or higher for big loans and in Ghana it isabout 35 per cent.248
78 Shelter finance: assessment of trends
Country Time (months)
Netherlands i 4
Denmark i 6
Spain i 8
France i 10
Germany i 10
UK i 11
Portugal i 20
Italy i 60
Argentina ii 10–18
Chile ii 12–18
Colombia ii 45
Peru ii 31
Uruguay ii 24
Source: i Mercer Oliver Wyman, 2003, cited in Stephens, 2004; ii Rojas, 2004, p14.
Approximate time totake property intopossession
Table 4.18
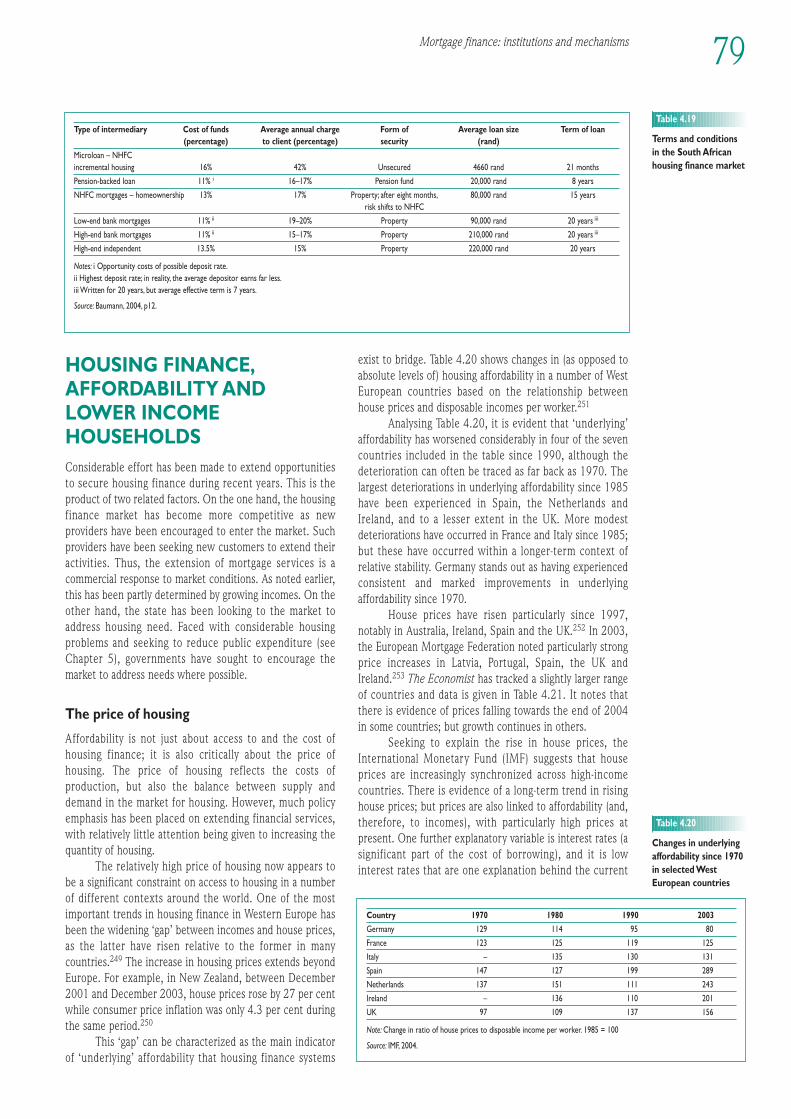
HOUSING FINANCE,AFFORDABILITY ANDLOWER INCOMEHOUSEHOLDSConsiderable effort has been made to extend opportunitiesto secure housing finance during recent years. This is theproduct of two related factors. On the one hand, the housingfinance market has become more competitive as newproviders have been encouraged to enter the market. Suchproviders have been seeking new customers to extend theiractivities. Thus, the extension of mortgage services is acommercial response to market conditions. As noted earlier,this has been partly determined by growing incomes. On theother hand, the state has been looking to the market toaddress housing need. Faced with considerable housingproblems and seeking to reduce public expenditure (seeChapter 5), governments have sought to encourage themarket to address needs where possible.
The price of housing
Affordability is not just about access to and the cost ofhousing finance; it is also critically about the price ofhousing. The price of housing reflects the costs ofproduction, but also the balance between supply anddemand in the market for housing. However, much policyemphasis has been placed on extending financial services,with relatively little attention being given to increasing thequantity of housing.
The relatively high price of housing now appears tobe a significant constraint on access to housing in a numberof different contexts around the world. One of the mostimportant trends in housing finance in Western Europe hasbeen the widening ‘gap’ between incomes and house prices,as the latter have risen relative to the former in manycountries.249 The increase in housing prices extends beyondEurope. For example, in New Zealand, between December2001 and December 2003, house prices rose by 27 per centwhile consumer price inflation was only 4.3 per cent duringthe same period.250
This ‘gap’ can be characterized as the main indicatorof ‘underlying’ affordability that housing finance systems
exist to bridge. Table 4.20 shows changes in (as opposed toabsolute levels of) housing affordability in a number of WestEuropean countries based on the relationship betweenhouse prices and disposable incomes per worker.251
Analysing Table 4.20, it is evident that ‘underlying’affordability has worsened considerably in four of the sevencountries included in the table since 1990, although thedeterioration can often be traced as far back as 1970. Thelargest deteriorations in underlying affordability since 1985have been experienced in Spain, the Netherlands andIreland, and to a lesser extent in the UK. More modestdeteriorations have occurred in France and Italy since 1985;but these have occurred within a longer-term context ofrelative stability. Germany stands out as having experiencedconsistent and marked improvements in underlyingaffordability since 1970.
House prices have risen particularly since 1997,notably in Australia, Ireland, Spain and the UK.252 In 2003,the European Mortgage Federation noted particularly strongprice increases in Latvia, Portugal, Spain, the UK andIreland.253 The Economist has tracked a slightly larger rangeof countries and data is given in Table 4.21. It notes thatthere is evidence of prices falling towards the end of 2004in some countries; but growth continues in others.
Seeking to explain the rise in house prices, theInternational Monetary Fund (IMF) suggests that houseprices are increasingly synchronized across high-incomecountries. There is evidence of a long-term trend in risinghouse prices; but prices are also linked to affordability (and,therefore, to incomes), with particularly high prices atpresent. One further explanatory variable is interest rates (asignificant part of the cost of borrowing), and it is lowinterest rates that are one explanation behind the current
79Mortgage finance: institutions and mechanisms
Type of intermediary Cost of funds Average annual charge Form of Average loan size Term of loan(percentage) to client (percentage) security (rand)
Microloan – NHFC incremental housing 16% 42% Unsecured 4660 rand 21 months
Pension-backed loan 11% i 16–17% Pension fund 20,000 rand 8 years
NHFC mortgages – homeownership 13% 17% Property; after eight months, 80,000 rand 15 yearsrisk shifts to NHFC
Low-end bank mortgages 11% ii 19–20% Property 90,000 rand 20 years iii
High-end bank mortgages 11% ii 15–17% Property 210,000 rand 20 years iii
High-end independent 13.5% 15% Property 220,000 rand 20 years
Notes: i Opportunity costs of possible deposit rate.ii Highest deposit rate; in reality, the average depositor earns far less.iii Written for 20 years, but average effective term is 7 years.
Source: Baumann, 2004, p12.
Country 1970 1980 1990 2003
Germany 129 114 95 80
France 123 125 119 125
Italy – 135 130 131
Spain 147 127 199 289
Netherlands 137 151 111 243
Ireland – 136 110 201
UK 97 109 137 156
Note: Change in ratio of house prices to disposable income per worker. 1985 = 100
Source: IMF, 2004.
Terms and conditionsin the South Africanhousing finance market
Table 4.19
Changes in underlyingaffordability since 1970in selected WestEuropean countries
Table 4.20

global price boom. Overall, global developments, includingthose specific to housing markets (the performance of theglobal economy such as real stock prices, per capita outputand real interest rates), explain 40 per cent of house pricemovements during the period of the IMF study (from 1980to 2004).254 The UK and the US are particularly open to suchglobal markets as such factors explain approximately 70 percent of house price movements in these countries, whilethey only explain 3 per cent of house price movements inNew Zealand. There is evidence to suggest that thedeepening of mortgage markets has been associated withhigher global house prices (that is, efforts to expandaffordability by increasing access to housing finance haveresulted in increasing prices).255
The cost of housing – and the response ofsupply to increased demand
In a number of countries, housing supply appears to respondonly slowly to increases in housing demand expressedthrough rising prices. This is clearly linked to the manystages involved in the construction process. When ‘supply isinelastic, the same increase in demand … results in a muchlarger increase in price and a much smaller increase in
quantity supplied’.256 If supply does not increase, or onlyincreases slowly, there is no reason to believe that a moreefficient housing finance market will result in better housing(even in the short or medium term); it will simply result inrising house prices. The increase in the availability ofhousing finance assumes that more dwellings will beproduced and/or marketed in response to increased demandand, hence, that homeownership will rise. But howresponsive is supply to demand? Housing elasticity variesconsiderably between countries and estimates for WesternEurope are given in Table 4.22.
A major reason accounting for the lack ofresponsiveness is regulation. Research has shown that localregulations that prevent housing construction are asignificant cause of high house prices in US and UK cities;more evidence shows that in Malaysia and South Korea thereis also an unresponsive housing supply due to regulations.257
In Finland, one of the reasons for low housing starts is thatlocal authorities are reluctant to sanction new housingconstruction because of the associated costs ofinfrastructure and services.258 Similar problems emerge inTanzania, where it is noted that in Dar es Salaam the averageannual demand for plots between 1990–2001 was 20,000,while average annual supply was under 700.259 Similarconcerns emerge in the context of the Philippines:
… the inelastic housing supply aggravates thehousing problem. Supply-side constraints ariseprimarily from problems in the land andfinancial markets. The land market has beeninefficient because land administration andmanagement is weak in various aspects: legaland regulatory framework and administrationinfrastructure. Land laws in the country areinconsistent… Land administration infra-structure is also poor and inadequate.260
A poor and inadequate regulatory system is not the onlyreason for a low responsiveness of supply to demand inhousing construction. In New Zealand, where prices roserapidly between 2001 and 2004, the building sector notedthat the lack of labour was a major constraint on expandingthe supply for housing.261
Whatever the causes, the consequence is thathomeownership is unaffordable to some groups. Analysingthe figures in Table 4.20 and Table 4.22, one factor ensuringthe continued affordability of homeownership in Germanymay be the responsiveness of construction to changes inprice.262 This discussion highlights the interconnectednature of housing finance with other factors, notably landmarkets and regulations for housing, land development andother urban development processes.
The implications for homeownership for the young
In a context of rising prices, housing is becoming moreexpensive and housing finance systems have a greater job todo in bridging this gap. Young people have particular
80 Shelter finance: assessment of trends
Country 2004 i 2003 ii 1997–2004
Australia 8.2 17.6 112
Belgium 9.3 5.5 50
Canada 6.7 6.5 43
China 9.9 4.1 no data
Denmark 7.3 3.4 50
France 14.7 11.5 76
Germany –1.7 iii –4.5 –3
UK 13.8 11 139
Hong Kong, SAR of China 31.2 –13.6 –49
Ireland 10.8 14.8 187
Italy 9.7 10.6 69
Japan –6.4 –4.8 –24
The Netherlands 3.3 1.9 76
New Zealand 16.4 21.2 56
South Africa 35.1 20.9 227
Spain 17.2 16.5 149
Singapore nil –2.3 no data
Sweden 9.8 5.5 81
Switzerland 2.2 2.4 12
United States 13 6 65
Notes:The first two columns show percentage change on a year earlier.i Third quarter, or 2004 latest. ii Third quarter. iii Second half of 2003.
Source: The Economist, 2004.
Country Price elasticity of supply
UK 0.5
Germany 2.1
France 1.1
Netherlands 0.3
Denmark 0.7
US 1.4
Notes: >1 = relatively strong supply response to rising prices.0–1 = relatively weak supply response to rising prices.
Source: Swank et al, cited in Stephens, 2004
House price changes
Table 4.21
Internationalcomparison of priceelasticity of supply ofnew housing in high-income nations
Table 4.22
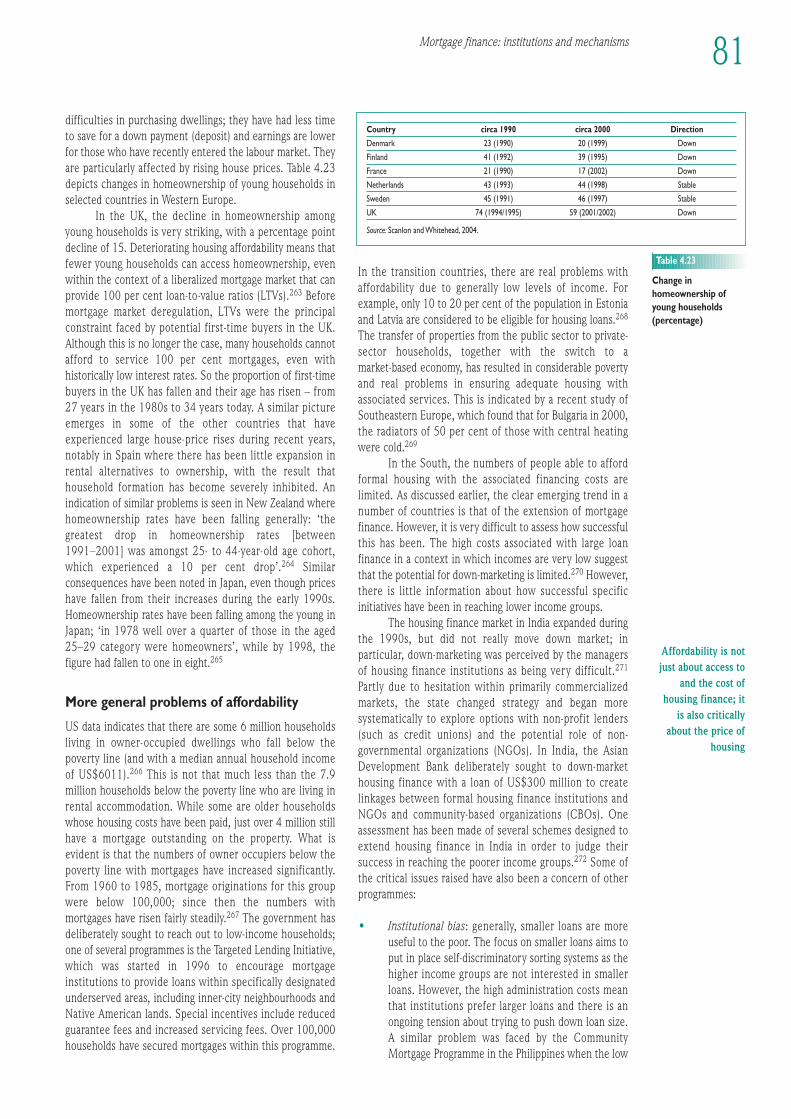
difficulties in purchasing dwellings; they have had less timeto save for a down payment (deposit) and earnings are lowerfor those who have recently entered the labour market. Theyare particularly affected by rising house prices. Table 4.23depicts changes in homeownership of young households inselected countries in Western Europe.
In the UK, the decline in homeownership amongyoung households is very striking, with a percentage pointdecline of 15. Deteriorating housing affordability means thatfewer young households can access homeownership, evenwithin the context of a liberalized mortgage market that canprovide 100 per cent loan-to-value ratios (LTVs).263 Beforemortgage market deregulation, LTVs were the principalconstraint faced by potential first-time buyers in the UK.Although this is no longer the case, many households cannotafford to service 100 per cent mortgages, even withhistorically low interest rates. So the proportion of first-timebuyers in the UK has fallen and their age has risen – from27 years in the 1980s to 34 years today. A similar pictureemerges in some of the other countries that haveexperienced large house-price rises during recent years,notably in Spain where there has been little expansion inrental alternatives to ownership, with the result thathousehold formation has become severely inhibited. Anindication of similar problems is seen in New Zealand wherehomeownership rates have been falling generally: ‘thegreatest drop in homeownership rates [between1991–2001] was amongst 25- to 44-year-old age cohort,which experienced a 10 per cent drop’.264 Similarconsequences have been noted in Japan, even though priceshave fallen from their increases during the early 1990s.Homeownership rates have been falling among the young inJapan; ‘in 1978 well over a quarter of those in the aged25–29 category were homeowners’, while by 1998, thefigure had fallen to one in eight.265
More general problems of affordability
US data indicates that there are some 6 million householdsliving in owner-occupied dwellings who fall below thepoverty line (and with a median annual household incomeof US$6011).266 This is not that much less than the 7.9million households below the poverty line who are living inrental accommodation. While some are older householdswhose housing costs have been paid, just over 4 million stillhave a mortgage outstanding on the property. What isevident is that the numbers of owner occupiers below thepoverty line with mortgages have increased significantly.From 1960 to 1985, mortgage originations for this groupwere below 100,000; since then the numbers withmortgages have risen fairly steadily.267 The government hasdeliberately sought to reach out to low-income households;one of several programmes is the Targeted Lending Initiative,which was started in 1996 to encourage mortgageinstitutions to provide loans within specifically designatedunderserved areas, including inner-city neighbourhoods andNative American lands. Special incentives include reducedguarantee fees and increased servicing fees. Over 100,000households have secured mortgages within this programme.
In the transition countries, there are real problems withaffordability due to generally low levels of income. Forexample, only 10 to 20 per cent of the population in Estoniaand Latvia are considered to be eligible for housing loans.268
The transfer of properties from the public sector to private-sector households, together with the switch to amarket-based economy, has resulted in considerable povertyand real problems in ensuring adequate housing withassociated services. This is indicated by a recent study ofSoutheastern Europe, which found that for Bulgaria in 2000,the radiators of 50 per cent of those with central heatingwere cold.269
In the South, the numbers of people able to affordformal housing with the associated financing costs arelimited. As discussed earlier, the clear emerging trend in anumber of countries is that of the extension of mortgagefinance. However, it is very difficult to assess how successfulthis has been. The high costs associated with large loanfinance in a context in which incomes are very low suggestthat the potential for down-marketing is limited.270 However,there is little information about how successful specificinitiatives have been in reaching lower income groups.
The housing finance market in India expanded duringthe 1990s, but did not really move down market; inparticular, down-marketing was perceived by the managersof housing finance institutions as being very difficult.271
Partly due to hesitation within primarily commercializedmarkets, the state changed strategy and began moresystematically to explore options with non-profit lenders(such as credit unions) and the potential role of non-governmental organizations (NGOs). In India, the AsianDevelopment Bank deliberately sought to down-markethousing finance with a loan of US$300 million to createlinkages between formal housing finance institutions andNGOs and community-based organizations (CBOs). Oneassessment has been made of several schemes designed toextend housing finance in India in order to judge theirsuccess in reaching the poorer income groups.272 Some ofthe critical issues raised have also been a concern of otherprogrammes:
• Institutional bias: generally, smaller loans are moreuseful to the poor. The focus on smaller loans aims toput in place self-discriminatory sorting systems as thehigher income groups are not interested in smallerloans. However, the high administration costs meanthat institutions prefer larger loans and there is anongoing tension about trying to push down loan size.A similar problem was faced by the CommunityMortgage Programme in the Philippines when the low
Affordability is notjust about access to
and the cost ofhousing finance; it
is also criticallyabout the price of
housing
81Mortgage finance: institutions and mechanisms
Country circa 1990 circa 2000 Direction
Denmark 23 (1990) 20 (1999) Down
Finland 41 (1992) 39 (1995) Down
France 21 (1990) 17 (2002) Down
Netherlands 43 (1993) 44 (1998) Stable
Sweden 45 (1991) 46 (1997) Stable
UK 74 (1994/1995) 59 (2001/2002) Down
Source: Scanlon and Whitehead, 2004.
Change inhomeownership ofyoung households(percentage)
Table 4.23

interest rate meant that the support institution wasreluctant to give loans during the mid 1990s as itcould make more money investing the funds.
• Savings-related barriers: savings-linked schemes aregenerally thought to require too long a time periodbefore the release of loans.
• Land title: lack of clear land title is a continuingproblem in India. In many cases, communities are notthreatened with eviction and therefore have securetenure; but without a legal title the land cannot beused for collateral.
• Payroll deductions: workers on low wages are notallowed in India to have their repayment deducted atsource, and this is a further deterrent to housingfinance corporations. Wage deductions are seen asone strategy to reduce risk. As noted earlier in thediscussion of Panama, a problem in lower middle-income families working in the informal sector wasthat they could not have direct deductions andtherefore were not accepted by mortgage lenders.
• Flexible payments: requirement for regularrepayments can also be hard for the poor. This isparticularly true for informal workers. It is notablethat the success of the SOFOLES in reaching theinformal sector in Mexico is linked to acceptance ofpayments at on-site locations and outside oftraditional business hours.
Some of the lowest-cost housing (and, hence, smallestmortgages) have been for incomplete units, which (whilebeing of sufficient quality to be legal dwellings) enableoccupiers to finish them as and when incomes increase. Thepossibilities of such strategies to extend homeownershipthrough mortgage finance in the Indian context are analysedthrough the experiences of a private developer inAhmedabad (see Box 4.15).273 This example involves apartnership between the state and the private sector inwhich the finance was provided by the national governmentagency, the Housing and Urban Development Corporation(HUDCO), for a low-cost housing development. Previously,the company had been successful in providing housing forlower middle-income households, and the objective of thedevelopment was to use a proven low-cost constructionprocess with state mortgage finance to reach a group thathad previously been excluded on the grounds of affordability.However, the experience raises questions about thisstrategy, with the presence of public agencies reducing theextent of informality in the development and thereforemaking it less attractive for the developer.274 In particular:
… enabling informal-sector developers can beextremely difficult and tricky because publicinvolvement and support can reduce theirflexibility and incentives, as well as impact uponthe expectations and opportunities ofhomebuyers.275
A similar strategy for homeownership via subsidized stateloans with minimal investment required for a completed unithas been tried in the Philippines, this time from a privatedeveloper that has particularly targeted the lower end of themarket for social reasons. Freedom to Build is active in Manilaand provides core or starter housing units of 20 square metresto those able to secure government mortgages (generallyemployed in low-income formal-sector work). The companyargues that its model is effective. However, the profit levelsare lower than those for developers aiming at the higher endof the market, and for this reason there are relatively few suchproviders. To date, 7000 units have been completed with amajor problem being the identification of suitable land.276
While Freedom to Build is somewhat unusual in beingspecifically orientated towards low-income housing, there hasgenerally been an increase in private-sector production of low-income housing during the early 1990s.277
More commonly, affordability and loan repaymentremain a problem in many Asian contexts. In the Philippines,the recovery rate on programmes provided by the NationalHousing Authority varies from 23 to 74 per cent.278 Loanprogrammes that provide only plots have performed betterthan completed housing loan programmes, and attempts toshift towards self-help have improved loan performance.These low repayment rates have resulted in internalpressures for reform and, as a result of poor loanrepayments, the pension funds that have been providingfinance for the Unified Home Lending have refused torelease further funds.279 Such a situation is indicative ofremaining strains in the housing finance system.
82 Shelter finance: assessment of trends
Box 4.15 Private development of affordable housing in India
The Parshwanath Group had developed a niche market in Ahmedabad in providing housing tolower middle-income households – generally those employed as school teachers, policeconstables, tailors, carpenters, bus and taxi drivers – and had developed over 20,000 units in125 projects. During the late 1980s, they began a partnership with the government agency, theHousing and Urban Development Corporation (HUDCO). HUDCO’s objective was to enablethe developer to expand its operations and reach further down market.Together, the twoplanned to develop Parshwanath township.The group had previously targeted relatively low-income households by reducing costs through the manufacture of its own building materialsand constructing minimal units, with the new residents constructing second floors andcompleting the finishes, such as kitchen counters, plastered walls and staircases.
HUDCO provided the Parshwanath Group with development capital for constructionand agreed to offer mortgages to the residential buyers. Only the first two phases weredeveloped. Initially, the Self-employed Women’s Association (SEWA), a local NGO, had intendedto be involved in targeting low-income households and in supporting repayments, but thiscomponent never fully evolved.The Parshwanath Group ran into litigation and financialtroubles (when some residents refused to make repayments and challenged the quality of thebuildings); the group sold the remainder of the land to developers, who now intend to targethigher income groups.
The development proved acceptable to some purchasers; but others subsequentlycomplained about the quality of the units and their size. Some residents filed a lawsuit againstthe developer due to the poor quality of completion, the lack of services such as street lightsand the poor quality of construction. It appears that expectations had changed and that thequality was no longer considered acceptable. At the same time, the link with the public agencymeant that the formal planning and regulatory procedures had to be complied with and that‘informal’ practices previously used (such as the post-dating of cheques for repayment) wereno longer possible.Source: Mukhija, 2004a.
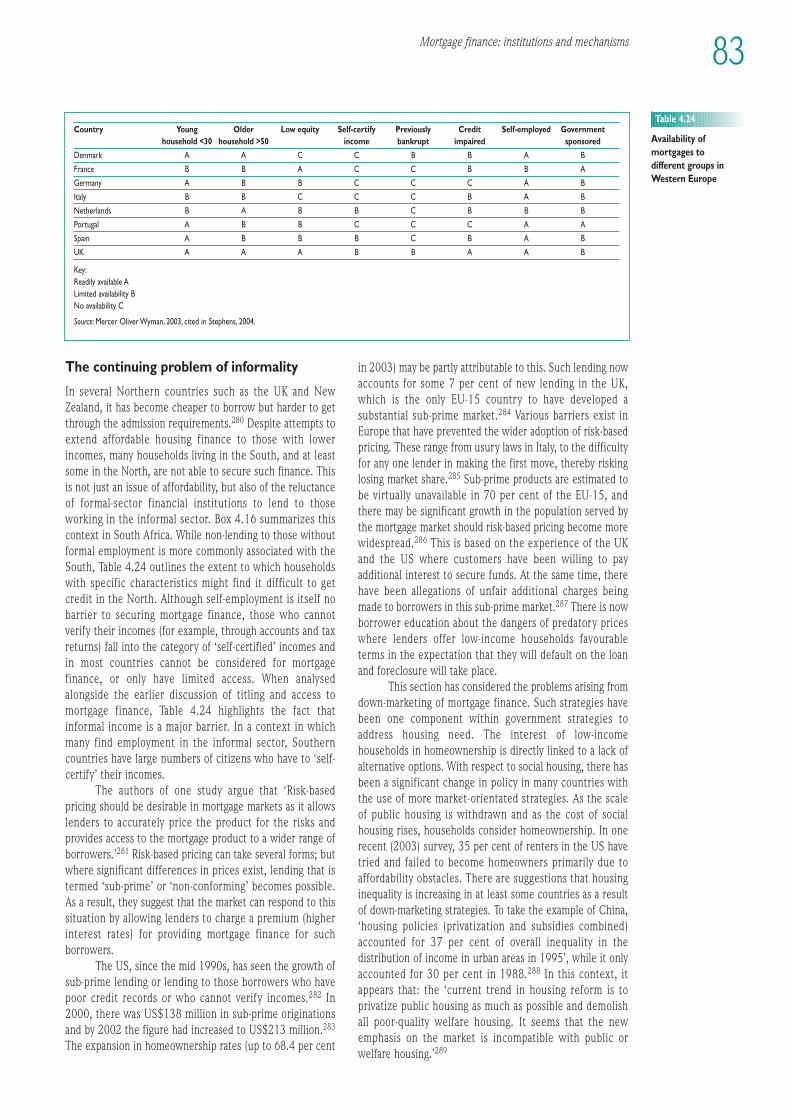
The continuing problem of informality
In several Northern countries such as the UK and NewZealand, it has become cheaper to borrow but harder to getthrough the admission requirements.280 Despite attempts toextend affordable housing finance to those with lowerincomes, many households living in the South, and at leastsome in the North, are not able to secure such finance. Thisis not just an issue of affordability, but also of the reluctanceof formal-sector financial institutions to lend to thoseworking in the informal sector. Box 4.16 summarizes thiscontext in South Africa. While non-lending to those withoutformal employment is more commonly associated with theSouth, Table 4.24 outlines the extent to which householdswith specific characteristics might find it difficult to getcredit in the North. Although self-employment is itself nobarrier to securing mortgage finance, those who cannotverify their incomes (for example, through accounts and taxreturns) fall into the category of ‘self-certified’ incomes andin most countries cannot be considered for mortgagefinance, or only have limited access. When analysedalongside the earlier discussion of titling and access tomortgage finance, Table 4.24 highlights the fact thatinformal income is a major barrier. In a context in whichmany find employment in the informal sector, Southerncountries have large numbers of citizens who have to ‘self-certify’ their incomes.
The authors of one study argue that ‘Risk-basedpricing should be desirable in mortgage markets as it allowslenders to accurately price the product for the risks andprovides access to the mortgage product to a wider range ofborrowers.’281 Risk-based pricing can take several forms; butwhere significant differences in prices exist, lending that istermed ‘sub-prime’ or ‘non-conforming’ becomes possible.As a result, they suggest that the market can respond to thissituation by allowing lenders to charge a premium (higherinterest rates) for providing mortgage finance for suchborrowers.
The US, since the mid 1990s, has seen the growth ofsub-prime lending or lending to those borrowers who havepoor credit records or who cannot verify incomes.282 In2000, there was US$138 million in sub-prime originationsand by 2002 the figure had increased to US$213 million.283
The expansion in homeownership rates (up to 68.4 per cent
in 2003) may be partly attributable to this. Such lending nowaccounts for some 7 per cent of new lending in the UK,which is the only EU-15 country to have developed asubstantial sub-prime market.284 Various barriers exist inEurope that have prevented the wider adoption of risk-basedpricing. These range from usury laws in Italy, to the difficultyfor any one lender in making the first move, thereby riskinglosing market share.285 Sub-prime products are estimated tobe virtually unavailable in 70 per cent of the EU-15, andthere may be significant growth in the population served bythe mortgage market should risk-based pricing become morewidespread.286 This is based on the experience of the UKand the US where customers have been willing to payadditional interest to secure funds. At the same time, therehave been allegations of unfair additional charges beingmade to borrowers in this sub-prime market.287 There is nowborrower education about the dangers of predatory priceswhere lenders offer low-income households favourableterms in the expectation that they will default on the loanand foreclosure will take place.
This section has considered the problems arising fromdown-marketing of mortgage finance. Such strategies havebeen one component within government strategies toaddress housing need. The interest of low-incomehouseholds in homeownership is directly linked to a lack ofalternative options. With respect to social housing, there hasbeen a significant change in policy in many countries withthe use of more market-orientated strategies. As the scaleof public housing is withdrawn and as the cost of socialhousing rises, households consider homeownership. In onerecent (2003) survey, 35 per cent of renters in the US havetried and failed to become homeowners primarily due toaffordability obstacles. There are suggestions that housinginequality is increasing in at least some countries as a resultof down-marketing strategies. To take the example of China,‘housing policies (privatization and subsidies combined)accounted for 37 per cent of overall inequality in thedistribution of income in urban areas in 1995’, while it onlyaccounted for 30 per cent in 1988.288 In this context, itappears that: the ‘current trend in housing reform is toprivatize public housing as much as possible and demolishall poor-quality welfare housing. It seems that the newemphasis on the market is incompatible with public orwelfare housing.’289
83Mortgage finance: institutions and mechanisms
Country Young Older Low equity Self-certify Previously Credit Self-employed Government household <30 household >50 income bankrupt impaired sponsored
Denmark A A C C B B A B
France B B A C C B B A
Germany A B B C C C A B
Italy B B C C C B A B
Netherlands B A B B C B B B
Portugal A B B C C C A A
Spain A B B B C B A B
UK A A A B B A A B
Key:Readily available ALimited availability BNo availability C
Source: Mercer Oliver Wyman, 2003, cited in Stephens, 2004.
Availability ofmortgages to different groups inWestern Europe
Table 4.24

Assessing systemic risks
Considerable efforts have taken place in some countries toextend market reach. The ‘market’ may be able to extendreach by improving its efficiency; but, ultimately, there islikely to be a trade-off between extending ‘reach’ and riskarising from the increased likelihood of a borrower with alarge loan defaulting.290 The risks with regard to individualborrowers can be reduced through insurance. However,there is also a need to recognize that such risks may besystemic rather than random (for example, they occurbecause of a general economic recession or rise in interestrates), and therefore can endanger the financial systemitself. This, in part, explains the willingness of the state toprovide assistance to households who find themselves infinancial difficulties at the time of a financial crisis. Themarket itself may provide ways of mitigating against risk toprotect itself, or allow individual borrowers to shift risk tothird parties.
In the absence of falling prices assisting inaffordability, the mortgage finance industry has to balanceits response to consumer demand together with requests bygovernments to expand lending against pressure fromshareholders, members and regulators, and start to lend
prudently. The new lending undertaken by mortgageproviders in the North has introduced new risks into thelending process.291 Even in high-income countries, thehousing market may be volatile partly due to the scale offinancial deregulation. A recent IMF survey suggests thatstrong regulation of the banking sector is necessary tominimize these risks and that a deregulated banking systemcan encourage speculative investment in property.292 TheIMF highlights the specific problems faced by Thailand and(to a lesser extent) Malaysia.
In the US and UK, there have been problems withhousing market ‘booms and busts’.293 Policy changes in theUK have shifted risks from institutions to borrowers. Severalfactors, notably increasing interest rates and very high loan-to-value ratios, resulted in a crisis during the late 1980s,with a significant increase in foreclosures. The 1980foreclosure rate (as a percentage of outstanding mortgages)was 0.06 per cent, while the rate of 6 to 12 months’ arrearswas 0.25 per cent and the rate of 12-month-plus arrears was0.08 per cent.294 By 1989, these figures had risen to 0.17,0.73 and 0.15, and by 1991 they were 0.77, 1.87 and 0.93per cent, respectively. A related problem to ‘boom-and-bust’house prices combined with high loan-to-value ratios isnegative equity – that is when the value of the remainingloan exceeds the price of the house (for example, followinga fall in prices). The fall in the Japanese market during theearly 1990s offers an illustration of the potential scale ofthis problem: ‘The total amount of negative equity for thewhole of the Tokyo area was estimated [1995] to be aboutUK£7 billion.’295 The consequences are considerable. Oneimmediate problem is less housing mobility, as householdssimply cannot afford to repay their mortgage and takeanother because of the additional capital that they have toraise. A second problem is that foreclosure becomes lesseffective for the lending company since the value of theproperty will not fully cover the debt. Other problems relateto a lack of confidence in the housing finance system andhousing markets in general. The dependence of the Japanesebanking system upon real estate collateral resulted inconsiderable financial instability when land prices fell.296
The message is that in addition to assessing the effectivenessof extending mortgage finance for their poverty reductiongoals, governments also need to consider the implicationsand risks for housing market stability.
84 Shelter finance: assessment of trends
1 This chapter is based on adraft prepared by Diana Mitlin,University of Manchester, UK.
2 Chiquier et al, 2004, p1.3 Yasui, 2002a, p15.4 Nuri Erbas and Nothaft, 2002,
p15.5 It is only such dwellings that
are likely to meet the need forpotential repossession andresale. Even if incrementaldwellings have a legal land title,they may contravene buildingand/or zoning regulations.
6 Lohse, 2002, p42.
7 Governments have sought tocontrol inflation for manyreasons; but success in thisarea is likely to haveparticularly beneficial effectson mortgage lending.
8 For example, some argue thathomeownership limits labourmobility and/or the need is forhousehold savings (withappropriate interest ratepolicies) to be directed to thebenefit of enterpriseinvestment rather thanpersonal assets.
9 Stephens, 2003, p1015.Stephens also notes that thispattern is associated with thehousing finance history ofWestern Europe in recentdecades. During the lastdecade, consistently lowerinflation (likely to continuegiven current macroeconomicpolicies) means that the realvalue of the mortgage doesnot rapidly erode. Hence,consumer preferences maychange.
10 Renaud, 1999.11 Stuart at al, 2004.
12 Yasui, 2002a, p14.13 Buckley and Kalarickal, 2004,
p2.14 Cities Alliance, 2002, p2.15 Government of the Republic of
Zambia, cited in Mulenga, 2003,p52.
16 Daphnis, 2004a, p2.17 Daphnis, 2004a, p2.18 Hegedüs, 2004, p8.19 See Kritayanavaj, 2002, p15.
Nevertheless, the bank’s non-performing loans are at 17.4per cent (Kritayanavaj, 2002,p25), and this suggests that the
Box 4.16 Mortgage finance: problems with down-marketing in South Africa
The preconditions for the mortgage model are that houses have exchange value and are easilytraded, so banks can use them as security for a high-value, long-term mortgage, and thatborrowers can make regular repayments out of a predictable income stream.These conditions,however, do not hold for South Africa’s low-income majority. South African banks areundeniably correct that they cannot extend mortgage finance to the informally employed, low-income majority, most of whom do not even have bank accounts. What is only beginning to beunderstood is that mortgage lending at the bottom end of a ‘developing country’ market –which is what South Africa really is – is risky not only for banks, but also for potential low-income borrowers. Even though they can repay small loans (as some South Africanmicrofinance institutions have proved), most low-income households cannot maintain the rigidrepayment schedule required by a mortgage. Moreover, South Africa’s ‘township’ housingmarkets are institutionally weak, and it is very difficult to sell a house, either to move up/downthe housing ladder, or in execution.To make matters worse, South African formal-sector wageemployment has actually declined in absolute terms since 1994, especially in the low middle-income bracket. As a result, when they do manage to get a mortgage, many low-income blackSouth Africans lose their houses due to factors such as income instability and retrenchment.Source: Baumann, 2004, p6.
NOTES
weakness referred to byDaphnis (2004a) has not beenfully addressed.
20 Lea, 2000, p17.21 Joint Center for Housing
Studies, 2004, p8.22 Ballesteros, 2002, p323 Dübel, 2004, p28.24 Yasui, 2002a, p12.25 The primary market is retail
lending to households.Thesecondary market is wholesalelending to retail providers.
26 Rubinstein, 2002, p15.27 Okwir, 2002, p94.28 Suresh, 2002, p119.29 These are funds that receive
mandatory payments, generallyfrom employers andemployees, and from which theemployees can draw on forhousing finance underparticular circumstances.
30 Gadzama, 2002, p74.31 Van Order, 2001, p16.32 Dübel, 2004, p28.33 Yasui, 2002a.34 Dübel, 2004, p28.35 Van Order, 2001, p21.36 Van Order, 2001, pp20–21.37 Van Order, 2001, p29.38 Carolini, 2004.39 Van Order, 2001, p20.40 Van Order, 2001, p17.41 Van Order, 2001, p29.42 Van Order, 2001, p19.43 Karley and Whitehead, 2002,
p31.44 ODPM, 2003, p1.45 Karley and Whitehead, 2002,
p32.46 Karley and Whitehead, 2002,
p36.47 Lea, 2000, unnumbered
Foreword.48 Watanabe, 1998.49 Chiquier et al, 2004, p2.50 Lea, 2000, pp20–21.51 D’Cruz, 2004a, p19.52 D’Cruz, 2004a.53 Lee, 2003, p26.54 Gitau, 2004, p2.55 Gitau, 2004, p9.56 Chiquier et al, 2004.57 Dübel, 2004, p29; Lea, 2000,
pp3–5.58 Connolly, 2004b.59 Hoek-Smit and Diamond,
2003, p7.60 Dymski and Isenburg, 1998.61 Stephens, 2004, p11.62 Pardo, 2000, p3.63 Pardo, 2000, p364 Chin Beng 2002, p100.65 Ogu and Ogbuozobe, 2001,
p476.66 Ogu and Ogbuozobe, 2001,
p477.67 Hardoy and Satterthwaite,
1989, pp107–111.68 Stren, cited in Gitau, 2004, p4.69 Mabogunje, cited in Gitau,
2004, p4.70 Ogu and Ogbuozobe, 2001,
p478.71 Williams, 2004.72 Stephens, 2004.73 Stephens, 2003, p1020.74 Stephens 2004, p11.75 Suresh, 2002, p120.76 Stephens, 2003, p1020.77 Stephens, 2004.78 Watanabe, 1998, p135.79 Ballesteros, 2002, p18.80 See, for example, Okpala, 1994,
and Renaud, 1999.81 As illustrated by Rubinstein
(2002, p16) for Brazil, Mexicoand Panama.
82 Quoted in Connolly, 2004b, p2.83 Turner and Whitehead, 2002,
p176.84 Ballesteros, 2002, p18.85 Nuri Erbas and Nothaft, 2002,
p22.86 Nuri Erbas and Nothaft 2002,
p22.87 Kumar Garg, 1998, p106;
Smets, 2002, p138.88 Lea, 2004b, p24.89 Stephens, 2003, p1014.90 Stephens, 2004, p12.91 Scanlon and Whitehead, 200492 Stephens, 2004, p9.93 Stuart et al, 2004, p9.94 Stuart et al, 2004, p9.95 Scanlon and Whitehead, 2004,
p20.96 Kahrlik, cited in Hegedüs,
2004, p7.97 Yasui, 2002b, p27.98 Merrill and Whiteley, 2003,
pp11–12.99 Merrill and Whiteley, 2003,
p18.100 Gilbert, 2004, p35.101 Forero, 2004, pp34–38.102 Connolly, 2004b.103 Scanlon and Whitehead, 2004,
p18.104 Scanlon and Whitehead, 2004,
p18.105 Stuart et al, 2004, p3.106 Stephens, 2004.107 Williams, 2004, p20.108 Stephens, 2004, p3.109 Stephens (2004, p4) notes that
nominal interest rates fellthroughout the advancedeconomies, a phenomenonlinked to the worldwide fall ininflation; however, although thenominal interest rate is thesame throughout the Eurozone, different levels ofinflation between membercountries mean that realinterest rates continue to vary.
110 Stephens, 2004, p4.111 Earley, 2004b, p4.112 Earley, 2004b; Lambert, 2004.113 Earley, 2004b.114 Pitcoff, cited in Carolini, 2004,
p2.
115 HUD, 2003, cited in Carolini,2004.
116 Carolini, 2004.117 HUD, cited in Carolini, 2004,
p11.118 Hegedüs, 2004, p6.119 Hegedüs, 2004, p6;Yasui,
2002b, p25.120 Lea, 2004b, pp22–24.121 Lea, 2004b, pp22–24.122 Yasui, 2002b pp29–30.123 Yasui, 2002b, p30.124 Hegedüs, 2002, p56.125 Yasui, 2002b, p19.126 Earley, 2004b.127 Chiquier et al, 2004, p28.128 Yasui, 2002b, p19.129 Hegedüs, 2002, p10.130 Hegedüs, 2002, p49.131 Stephens, 2003, p1021.132 Yasui, 2002a, p11.These delays
are partly due to the extensivetransfer of properties fromstate to household in manycountries (Hegedüs and Teller,2003).
133 Hegedüs and Teller, 2003.134 Hegedüs, 2002, pp18, 23.135 Yasui, 2002b, p22.136 Hegedüs and Teller, 2003.137 Yasui, 2002a, p8.138 Yasui, 2002b, p23.139 Bugie, 2004, pp32–33.140 An example of the scale of the
problems is given by Zambiawhere, between 1985 and2000, the average mortgageinterest rate oscillatedbetween 20 and 90 per centper annum (Groves, 2004).
141 Kamete, 2000, p255.142 De Soto, 2002.143 Buckley and Kalarickal, 2004,
pp21–22; Lincoln Institute ofLand Policy, 2002.
144 Gilbert, 2002b, p16.145 Buckley and Kalarickal, 2004,
p22.146 Buckley and Kalarickal, 2004,
p23.147 Rojas, 2004.148 Vance, 2004, p127.149 Daphnis, 2004b, p107.150 Nell et al, cited in Baumann,
2004.151 Calderón, 2004.152 World Bank, 2004a, p2.153 Joint Center for Housing
Studies, 2004, pp12–14.154 Ferguson, 1999, p186.155 IADB, 2003.156 Davies and Mahony, 2001, p25.157 Hoek-Smit, 1998, p18.158 World Bank, 2004a, p3.159 World Bank, 2004a, pp2–3.160 Ferguson, 1999, pp186–187.161 Ballesteros, 2002, p18.162 Jacobs and Savedoff, 1999, p5.163 Jacobs and Savedoff, 1999, p6.164 Pardo, 2000, pp23–24.165 Gitau, 2004, p13.166 Hoek-Smit, 1998, p18.
167 Lall and Lall, 2003, pp15–16.168 Ferguson, 2004a, p22.169 Ferguson, 2003.170 Lall and Lall, 2003, p16.171 Lall and Lall, 2003, pp20–21.172 Biswas, 2003.173 Datta, 1999, pp192–193.174 Aphimeteetamrong and
Kritayanavaj, 1998, p227.175 Ahn, 2002.176 Lee and Lee, 1998, p162.177 Ha, 2002b, p245.178 Kim and Ahn, 2002, p224.179 Lamoreaux, 1998, p69.180 Itoh, 2002, p157.181 Oizumi, 2002, p170.182 Oizumi, 2002, p181.183 Itoh, 2002, p166.184 Seki and Watanabe, 1998,
pp118–119.185 Karnad, 2004.186 Karnad, 2004, pp8–9.187 Kumar Garg, 1998, p98.188 Kumar Garg, 1998, p99.189 Karnad, 2004, p8.190 Karnad, 2004, p8.191 Gallarado, 1998, p204.192 Ballesteros, 2002, p28.193 Ballesteros, 2002, p28.194 Ballesteros, 2004, pp15–16.195 Zhao and Bourassa, 2003,
p722.196 Zhao and Bourassa, 2003,
p738.197 Ballesteros, 2002.198 Zhao and Bourassa, 2003,
p724.199 Zhao and Bourassa, 2003,
p733.200 Zhao and Bourassa, 2003,
p733.201 Rojas, 2004.202 Rojas, 2004.203 Rubinstein, 2002, p15; Rojas,
2004.204 Rojas, 2004.205 World Bank, 2004a. Minimum
salaries are set in many LatinAmerican countries. However,they have not kept pace withinflation and, hence, theassessment of what is requiredto afford a mortgage even on avery basic unit.
206 World Bank, 2004a, p4.207 Joint Center for Housing
Studies, 2004, p35.208 Joint Center for Housing
Studies, 2004, p35.209 World Bank, 2004a.210 World Bank, 2004a.211 Coovadia, 2004, pp10–11.212 At the exchange rate of US$1
= 6.45 rand, as of Thursday, 7October 2004.
213 See www.mfrc.co.za/detail.php?s=91 downloadedon 7 October 2004.
214 Moss, 2001, pp33–34.215 Nell el al, cited in Baumann,
2004.216 Groves, 2004.
85Mortgage finance: institutions and mechanisms

217 Coovadia, 2004, pp10–11.218 Kamete, 2000, p252.219 Kamete, 2000, p254.220 Government of Tanzania and
UN-Habitat, 2003, pp44–47.221 Kamete, 2000, pp249–251.222 Kofi Karley, 2002, p27.223 Government of Tanzania and
UN-Habitat, 2003, p32.224 Sunday Nation, 2004, cited in
Gitau, 2004, p2.225 Okwir, 2002, p95.226 Kofi Karley, 2002, p28.227 Shelter Afrique, 2002, pp50–51.228 Baëta Ansah, 2002, pp55–59.229 Okonkwo, 2002, p87.230 Baëta Ansah, 2002, p57.231 Although, as observed earlier,
Van Order (2001) argues that,in the US, 80 per cent of theincrease in homeownershiprates occurred within adeposit-based system andprior to the development ofthe secondary market.
232 Ogu and Ogbuozobe, 2001,p479.
233 Ogu and Ogbuozobe, 2001,p480.
234 Nubi, cited in Gitau, 2004, p4.
235 Kofi Karley, 2002, p28.236 Mercer Oliver Wyman, cited in
Stephens, 2004, pp7–8.237 Hegedüs, 2004, p7.238 Yasui, 2002a, p13.239 Yasui, 2002a, p13; Yasui, 2002b,
p29.240 Zehnder, 2004.241 Stephens, 2004, p12.242 Arimah, 2000, p2562.243 Kritayanavaj, 2002, p21.244 Gallarado, 1998, p212;
Ballesteros, 2002.245 Fernandez, 2004.246 UN-Habitat, 2002, p8.247 Government of Tanzania and
UN-Habitat, 2003, p72.248 See, respectively, Lamoreaux,
1998, p51; Aphimeteetamrongand Kritayanavaj, 1998, p229;Kofi Karley, 2002, p27.
249 Stephens, 2004, p5.250 Stuart et al, 2004, p3.251 This is not a perfect guide to
‘underlying’ affordabilitybecause the growth of dual-income households in somecountries increases thenumber of incomes that canbe called upon to financehouse purchase or pay interest
charges on mortgages.252 IMF, 2004, p72.253 Earley, 2004b, p11.254 IMF, 2004, p84.255 IMF, 2004, p86.256 Buckley and Kalarickal, 2004,
p12.257 Stephens, 2002.258 Buckley and Kalarickal, 2004,
p12.259 Government of Tanzania and
UN-Habitat, 2003, p26.260 Ballesteros, 2002, p2.261 Stuart et al, 2004, p5.262 Stephens, 2004.263 Stephens, 2004, p5.264 Stuart et al, 2004, p6.265 Forrest et al, 2003, p286.266 Carolini, 2004, p4.267 Carolini, 2004, p4.268 Yasui, 2002b, p31.269 Hegedüs and Teller, 2003.270 Down-marking is a term used
to refer to the practice ofreaching lower income groups.
271 Smets, 2002, p175.272 Smets, 2002, p175.273 Mukhija, 2004a.274 Mukhija, 2004a, p2235.
275 Mukhija, 2004a, p2241.276 Freedom to Build, 2004, p77.277 Ballesteros, 2002, p28.278 Ballesteros, 2002, p21.279 Ballesteros 2002, p23.280 Dymski and Isenburg, 1998;
Stuart et al, 2004.281 Mercer Oliver Wyman, 2003,
quoted in Stephens, 2004.282 Lea, 2004a, p13.283 Carolini, 2004.284 Stephens, 2004, p10.285 Mercer Oliver Wyman, cited in
Stephens, 2004.286 Mercer Oliver Wyman, cited in
Stephens, 2004.287 Lea, 2004a, p13.288 Khan, cited in Zhao and
Bourassa, 2003, pp738–739.289 Zhao and Bourassa, 2003,
p742.290 Stephens, 2004, p1.291 Williams, 2004, pp20–21.292 Collyns and Senhadji, 2002,
p73.293 Stephens, 2003, p1014.294 Dymski and Isenburg, 1998;
Stephens, 2003, p1014.295 Forrest et al, 2003, pp285–286.296 Forrest et al, 2003, p282.
86 Shelter finance: assessment of trends
As already indicated in the discussion of subsidies withinChapter 4, there is a widespread acceptance of the need forsubsidies. This does not simply reflect political ideology, noris it only a popularist response by politicians in need of votes.The willingness of governments to consider housingsubsidies reflects the significance of shelter and a home tocitizens, the recognized importance of this to society, andthe importance of residential construction for the economy.More specifically, a number of reasons can be identified toexplain the prevalence for state subsidies for shelter (whichexplicitly includes services and the dwelling):2
• Improving public health and, more specifically,ensuring that living conditions do not cause outbreaksof diseases. This relates particularly, but notexclusively, to the provision of water and sanitationservices.
• Improving fairness, justice and social stability. This setof objectives reflects the poverty orientation of somehousing programmes. It is understood that childrenneed places in which to study and to be safe, andequally that social exclusion and poverty may becharacterized by living in an inadequately resourcedneighbourhood. It may simply be that incomes are toolow to afford the basic standard of living that societywishes to provide to its members or that householdsunder-provide from their income – hence the needfor subsidies.
• Providing some aspects of housing considered to be a‘public good’ that is not adequately coped with by theprivate market. For example, the high level ofinformality in Latin America suggests that ‘It is apublic responsibility to devise and implement thelegal systems and policies required to bring housinginto compliance with land and building regulations.’3
Only such tenure security will encourage privateinvestment in housing.
• Overcoming market inefficiencies that may result inmonopoly profits and undersupply by developers, poorhousing quality, or an insufficient volume ofconstruction, particularly low-income housing.Financial subsidies are only one possible response tosuch problems; others would include facilitating the
supply of land and reforming the regulatoryframework.
• Reducing housing costs. This can be achieved, forexample, by developing a system for mortgageinsurance in primary or secondary markets, orencouraging competition in the building materialssector.
• Stimulating economic growth. The constructionindustry is a very important sector.
The breadth of the appeal of subsidies is illustrated later inthis chapter by the government of the Republic of Korea,which, even as it considers how to deregulate the housingfinance market, is looking at alternative ways to assist thosein housing need. Moreover, as indicated by housing-supportstrategies in the North, increasing prosperity does notnecessarily result in the state doing less in housing markets.
While a narrow definition of housing finance mayfocus only on the provision of credit, the scale andsignificance of housing finance subsidies – primarily throughrental housing, subsidized loan finance and direct demand(capital) subsidies – makes this component difficult toignore. An understanding of how the financing of socialhousing can fit within a broader system of housing financingis needed.4 This chapter looks specifically at some strategiesthat have recently been used to provide financial subsidies.Financial subsidies seek to provide incentives ‘to enable andpersuade a certain class of producers or consumers to dosomething they would not otherwise do by lowering theopportunity cost or otherwise increasing the potentialbenefit of doing so’.5 Some argue that such financialsubsidies are best avoided and should ‘be a policy of lastresort’.6 These concerns focus on the potential distortion ofmarkets and are often accomplished by recommendationson institutional and regulatory reforms, such as thoseelaborated upon in Box 5.1. As already noted in Chapter 4,such subsidies, especially those offered on interest rates,may have a huge hidden cost.
Although subsidies tend to be criticized byeconomists seeking to encourage a greater realization of thepotential effectiveness of markets, they remain popular withgovernments. One critical assessment of the potential ofsubsidies in Latin America is forced to also recognize, in a
Increasingprosperity does not
necessarily result inthe state doing lessin housing markets
C H A P T E R
FINANCING FOR SOCIAL ANDRENTAL HOUSING 1
5
footnote, that ‘it appears that countries at the level ofeconomic development in Latin America allocate from 1 to5 per cent of government budgets for housing subsidies’.7
The interest in subsidies has resulted in multiple approachesto their delivery of subsidies, which notably include directinterest-rates reductions, allowing mortgage interest to bededucted from income taxes; support for housing savings;support for insurance in the primary market; and supportfor insurance in secondary markets and direct grants.8
Nevertheless, concerns remain, notably that suchsubsidies rarely reach the poor. This concern has beenwidely recognized and is validated in Chapter 4. As discussedin Chapters 6 and 7, recent housing policy in some countriesof the South has been associated with a growing interest insmall loans to enhance the process of incremental orprogressive housing. Furthermore, as discussed in Chapter6 (which deals with smaller loans), many of the poor,particularly those living in the South, face highly distortedmarkets for housing, especially in the markets for credit andland. Further problems arise because of the constrainingimpact of the regulatory systems. In such a context,governments have made use of finance as a way to addressneed. This chapter looks specifically at financial subsidiesthat have particularly sought to reach the poor and providethem with access to a complete dwelling. Governments inthe North and the South have primarily used two financingstrategies to assist families to obtain housing: assistance forownership and/or the assistance to afford adequate rentalaccommodation. Despite this focus on the poor, thelimitations of these approaches should be recognized. TheChilean programme, for example, gives a majority of subsidyfunds to subsidy streams that include loan components andare for higher income households.9
Prior to discussing specific experiences in theprovision of subsidized housing finance to low-incomefamilies for complete dwellings, several predominant trendsshould be recognized. As is the case with Chapter 4, thereare always exceptions to such trends. Nevertheless, three
specific trends are well established in a number ofcountries:10
1 There is now less direct provision managed by thestate or agencies associated with the state.Governments have shifted away from the directconstruction and management of public housing.They have also used several strategies to reduce theirstocks with, in some cases, large-scale transfers tooccupiers.
2 There is increasing assistance for homeownershipthrough direct-demand (capital) subsidies. The scaleand costs of interest rate subsidies have already beennoted. In an effort to reduce costs and increase theeffectiveness of expenditure, several countries haveintroduced capital subsidies for those with lowincomes to assist them in purchasing complete (oralmost complete) dwellings. The use of targetedfinancial benefits for housing presupposes theinstitutional capacity to identify households in need.This may not exist in all Southern countries.
3 Consistent with the two trends above is the greateruse of housing allowances (rather than directprovision) to assist low-income families rentingaccommodation in private or not-for-profit sectors.
All these options involve considerable subsidy finance andtherefore their use is limited to a number of countries. Noconsideration is given in this chapter to loan finance, asinterest rate subsidies have been considered in Chapter 4with regard to larger loans and are considered in Chapters 6and 7 in the light of smaller loans. However, it should benoted that some of the direct-demand subsidies have loancomponents. Despite their focus on lower incomehouseholds, funding for direct subsidies is often smaller inscale than interest rate subsidies when the full costs of thelatter over the life of the loan are considered. The differentstrategies for supporting the housing costs of the poordepend considerably upon state capacity to pay; for thisreason, this chapter is divided by world region.
CONDITIONS AND TRENDSState rental housing in the North
Although the state in the North is generally playing a lessdirect role in economic intervention, this is not necessarilythe case in housing. Despite the shift to income-relatedsupport, the social rented sector (defined as housing let atbelow-market prices and allocated administratively on thebasis of housing need, rather than on the ability to pay)remains a significant tenure in several of the 15 EuropeanUnion (EU-15) member states, including the UK, France,Denmark, Finland, Sweden and the Netherlands. However,there have been significant changes in policy and the natureof housing support has shifted in Western Europe:
The existing support system with large, generalinterest subsidies for new construction and
88 Shelter finance: assessment of trends
Box 5.1 Regulations, policies or subsidies?
Subsidy should be used as a policy of last resort or, more precisely, should only be used inconjunction with other policy steps.The hierarchy of complementary government actionsneeded to improve the housing conditions for the majority of housing in an economy are asfollows:
• Develop or reform institutions and policies to facilitate the role of private and non-profit lenders and developers in expanding the moderate-/low-income housing supply,and provide education and training to consumers and producers to improve theoperation of the housing finance industry;
• Improve the regulatory system in the different supply markets (land, finance andinfrastructure) to allow more households to acquire authorized and healthful housing;
• Provide subsidies to address well-defined objectives.
Simply put, if government does not do what is necessary to encourage housing constructionand finance industries to function efficiently, housing supply cannot respond to price signals, andhigher incomes or subsidies will not translate into better housing.Source: Hoek-Smit and Grigsby, cited in Hoek-Smit and Diamond, 2003, p5.

rehabilitation has been phased out. Targeted,income-related, subsidies have becomerelatively more important, as have subsidies todepressed housing areas.11
Such changes partly reflect the success of housing systemsin addressing housing need.12 However, what is also evidentis that, despite a commonality of trends with regard to morelimited funding, considerable diversity continues withinEurope and there is no single approach to addressinghousing need.13
In the US, the direct provision of social housing hasnot been a popular strategy, with just 1.7 per cent of thepopulation living in public housing.14 Just over half of thefunding to support low-income housing from the Housingand Urban Development Department goes to the Section 8Housing Choice Voucher Programme, which initially focusedon rental housing, but which has now been extended toenable support for ownership occupiers. This scheme ismeans tested by income and family size. Within thisprogramme, there is evidence of similar trends to those inEurope, with a shift away from designated housing units andtowards greater market choice, with the individual selectionof accommodation. Public housing also remains an option(see Box 5.2), albeit somewhat limited. There are 1.8 millionoccupied units across the country owned by public housingauthorities. There is also limited assistance, such as taxcredits for private-sector developers building rental housingfor low- and moderate-income housing. However, publichousing is not perceived as the most suitable option for low-income families; rather, it is a route that will lead, in thelonger term, ‘toward self-sufficiency and homeownership’.15
There has been a general marked decline in the levelsof new housing units in this sector. Subsequent problemsinclude those faced by women in Canada as reductions instate funding in 1993 resulted in the loss of 325,000subsidized rental units.16 The decline in new housing unitsreflects the fulfilment of the mission to remove ‘crude’housing shortages (when the number of householdsexceeded the number of dwellings), although regionalshortages have often re-emerged.17 As noted earlier, thegovernment still plays an important role in housing peoplewho are unable to access housing through marketmechanisms, although the emphasis placed on the safety netfunction (assistance to the very poor) and wider affordability(assistance to those who are not so poor) objectives variesgreatly. In the UK, the emphasis is very much on the safetynet function, which has contributed to the concentration ofvery poor households in the sector. Elsewhere, the tenure ismuch more mixed, although sometimes the mostmarginalized households have difficulty in accessing socialhousing. The incomes of social renters averaged at least 70per cent of the average in France, Germany, the Netherlandsand Sweden, but were less than 50 per cent of the averagein the UK.18
As the numbers of designated social housing and/orpublic properties fall, there are concerns that the scale ofsocial disadvantage associated with such accommodation willrise. It is feared that the shifts in housing policy in Europeand, notably, a more limited housing stock will result in a
high concentration of social disadvantage, therebyexacerbating social exclusion, reducing mobility and creatinggreater marginalization for tenants.19 One further concernis that the growth of means-tested housing allowances (alsoencouraged by use of private finance) has resulted in higherrents.20 However, these are considered to offer betterincentives in terms of labour mobility and to enable moreeffective targeting.
One of the most significant developments in socialrented housing has been the increased use made of privatefinance for social rented housing in much of WesternEurope.21 Despite this use, there has been limited private-equity investment, although there is some evidence ofgreater interest in the UK.22 Box 5.3 discusses changes inthe financing of social housing in the EU countries. Ananalysis of margins suggested that despite a degree ofsophistication, UK housing associations pay more for financethan their counterparts in the Netherlands, Denmark andSweden (see Table 5.1). This could be attributable to theabsence of a state guarantee system in the UK.
One of the key trends during recent years has beenthe emergence of surpluses in the social rented sector as awhole in many countries.23 Declining debt burdens arisingfrom lower levels of construction and the repayment of olderdebt have coincided with rising rents to create thesesurpluses. Several countries have attempted to establish‘revolving-door’ systems of finance whereby surpluses arereinvested in the sector. This may happen informally (as inthe Netherlands where redistribution between landlordsoccurs through the informal mechanism of merger) andmore formally (through the Housing Fund in Finland and thebuilding funds in Denmark). However, it seems thatrevolving-door finance alone does not stimulate increasedconstruction, either because funds are inadequate orincentives are absent. Without subsidy mechanisms,governments appear to lack the leverage with which tostimulate the social rented sector.
At the same time, the shift from state provision tostate financing of a range of providers means thatgovernment has reduced its risk. However, the market forsocial housing is heavily influenced by political choice.Whatever the housing system for lower income households,governments appear to be highly involved; even if they are
One of the mostsignificant
developments insocial rented
housing has beenthe increased use
made of privatefinance
89Financing for social and rental housing
Box 5.2 Public housing in New York
The New York City Housing Authority (NYCHA) is the largest public housing authority in the country, with roughly 181,000 apartments in 2698 residential buildings throughout the city(as of September 2004).The public housing residential population represents roughly 5 percent of the city’s total, and on average pays US$311 in monthly rent.This same population’saverage annual income is US$18,334, and almost 18 per cent of households are on publicassistance.
NYCHA has more than 10,000 apartments that are for the elderly alone, and about 33per cent of NYCHA households are headed by persons over 62 years of age. Working familiesaccount for 40 per cent of NYCHA residents; but with an extremely low vacancy rate of only0.43 per cent of apartments available for all public housing households, it is not very surprisingthat over 136,000 families are on NYCHA’s waiting list.Source: Information from NYCHA Fact Sheet (revised 2 December 2004) quoted in Carolini, 2004, accessible online atwww.nyc.gov/html/nycha/pdf/factsheet.pdf.
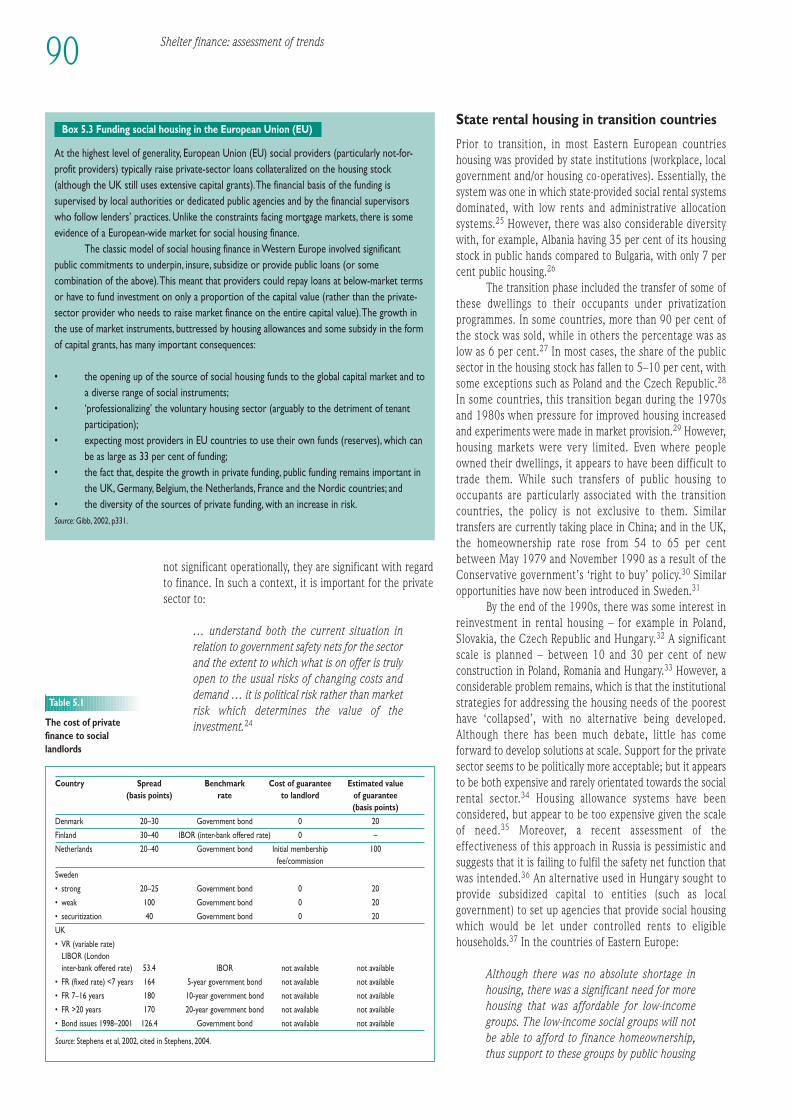
not significant operationally, they are significant with regardto finance. In such a context, it is important for the privatesector to:
… understand both the current situation inrelation to government safety nets for the sectorand the extent to which what is on offer is trulyopen to the usual risks of changing costs anddemand … it is political risk rather than marketrisk which determines the value of theinvestment.24
State rental housing in transition countries
Prior to transition, in most Eastern European countrieshousing was provided by state institutions (workplace, localgovernment and/or housing co-operatives). Essentially, thesystem was one in which state-provided social rental systemsdominated, with low rents and administrative allocationsystems.25 However, there was also considerable diversitywith, for example, Albania having 35 per cent of its housingstock in public hands compared to Bulgaria, with only 7 percent public housing.26
The transition phase included the transfer of some ofthese dwellings to their occupants under privatizationprogrammes. In some countries, more than 90 per cent ofthe stock was sold, while in others the percentage was aslow as 6 per cent.27 In most cases, the share of the publicsector in the housing stock has fallen to 5–10 per cent, withsome exceptions such as Poland and the Czech Republic.28
In some countries, this transition began during the 1970sand 1980s when pressure for improved housing increasedand experiments were made in market provision.29 However,housing markets were very limited. Even where peopleowned their dwellings, it appears to have been difficult totrade them. While such transfers of public housing tooccupants are particularly associated with the transitioncountries, the policy is not exclusive to them. Similartransfers are currently taking place in China; and in the UK,the homeownership rate rose from 54 to 65 per centbetween May 1979 and November 1990 as a result of theConservative government’s ‘right to buy’ policy.30 Similaropportunities have now been introduced in Sweden.31
By the end of the 1990s, there was some interest inreinvestment in rental housing – for example in Poland,Slovakia, the Czech Republic and Hungary.32 A significantscale is planned – between 10 and 30 per cent of newconstruction in Poland, Romania and Hungary.33 However, aconsiderable problem remains, which is that the institutionalstrategies for addressing the housing needs of the pooresthave ‘collapsed’, with no alternative being developed.Although there has been much debate, little has comeforward to develop solutions at scale. Support for the privatesector seems to be politically more acceptable; but it appearsto be both expensive and rarely orientated towards the socialrental sector.34 Housing allowance systems have beenconsidered, but appear to be too expensive given the scaleof need.35 Moreover, a recent assessment of theeffectiveness of this approach in Russia is pessimistic andsuggests that it is failing to fulfil the safety net function thatwas intended.36 An alternative used in Hungary sought toprovide subsidized capital to entities (such as localgovernment) to set up agencies that provide social housingwhich would be let under controlled rents to eligiblehouseholds.37 In the countries of Eastern Europe:
Although there was no absolute shortage inhousing, there was a significant need for morehousing that was affordable for low-incomegroups. The low-income social groups will notbe able to afford to finance homeownership,thus support to these groups by public housing
90 Shelter finance: assessment of trends
Box 5.3 Funding social housing in the European Union (EU)
At the highest level of generality, European Union (EU) social providers (particularly not-for-profit providers) typically raise private-sector loans collateralized on the housing stock(although the UK still uses extensive capital grants).The financial basis of the funding issupervised by local authorities or dedicated public agencies and by the financial supervisorswho follow lenders’ practices. Unlike the constraints facing mortgage markets, there is someevidence of a European-wide market for social housing finance.
The classic model of social housing finance in Western Europe involved significantpublic commitments to underpin, insure, subsidize or provide public loans (or somecombination of the above).This meant that providers could repay loans at below-market termsor have to fund investment on only a proportion of the capital value (rather than the private-sector provider who needs to raise market finance on the entire capital value).The growth inthe use of market instruments, buttressed by housing allowances and some subsidy in the formof capital grants, has many important consequences:
• the opening up of the source of social housing funds to the global capital market and toa diverse range of social instruments;
• ‘professionalizing’ the voluntary housing sector (arguably to the detriment of tenantparticipation);
• expecting most providers in EU countries to use their own funds (reserves), which canbe as large as 33 per cent of funding;
• the fact that, despite the growth in private funding, public funding remains important inthe UK, Germany, Belgium, the Netherlands, France and the Nordic countries; and
• the diversity of the sources of private funding, with an increase in risk.Source: Gibb, 2002, p331.
Country Spread Benchmark Cost of guarantee Estimated value (basis points) rate to landlord of guarantee
(basis points)
Denmark 20–30 Government bond 0 20
Finland 30–40 IBOR (inter-bank offered rate) 0 –
Netherlands 20–40 Government bond Initial membership 100fee/commission
Sweden
• strong 20–25 Government bond 0 20
• weak 100 Government bond 0 20
• securitization 40 Government bond 0 20
UK
• VR (variable rate) LIBOR (London inter-bank offered rate) 53.4 IBOR not available not available
• FR (fixed rate) <7 years 164 5-year government bond not available not available
• FR 7–16 years 180 10-year government bond not available not available
• FR >20 years 170 20-year government bond not available not available
• Bond issues 1998–2001 126.4 Government bond not available not available
Source: Stephens et al, 2002, cited in Stephens, 2004.
The cost of privatefinance to sociallandlords
Table 5.1
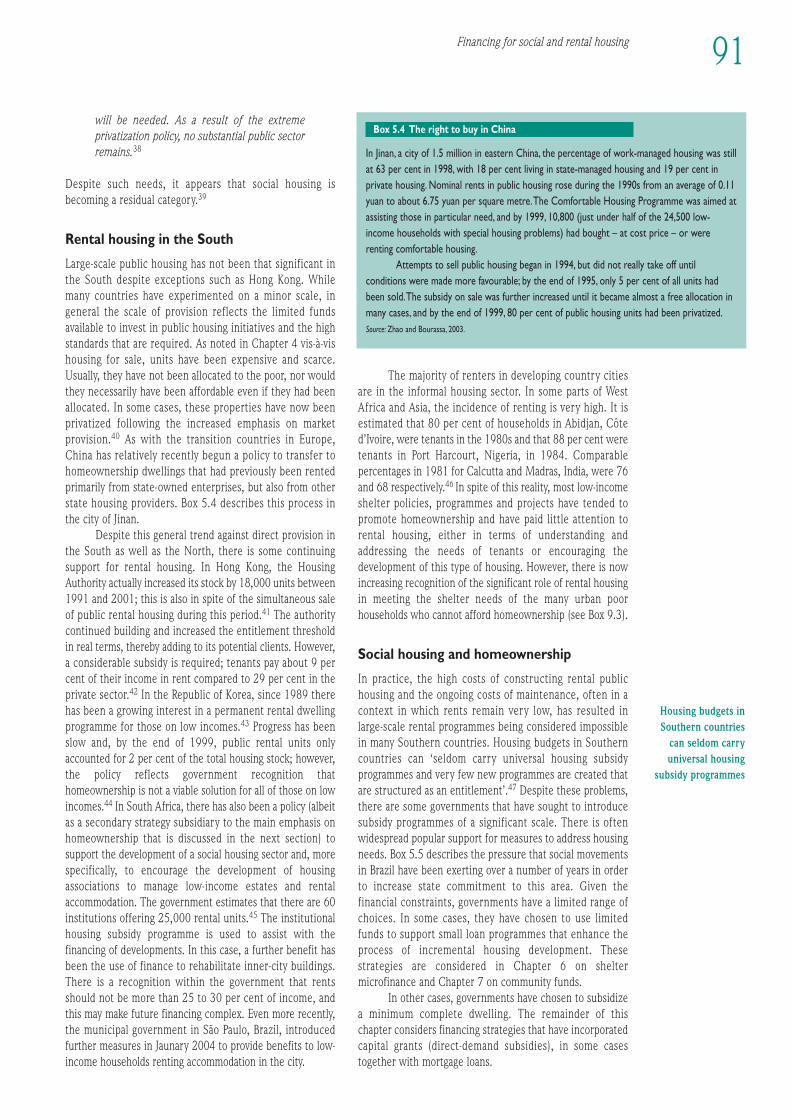
will be needed. As a result of the extremeprivatization policy, no substantial public sectorremains.38
Despite such needs, it appears that social housing isbecoming a residual category.39
Rental housing in the South
Large-scale public housing has not been that significant inthe South despite exceptions such as Hong Kong. Whilemany countries have experimented on a minor scale, ingeneral the scale of provision reflects the limited fundsavailable to invest in public housing initiatives and the highstandards that are required. As noted in Chapter 4 vis-à-vishousing for sale, units have been expensive and scarce.Usually, they have not been allocated to the poor, nor wouldthey necessarily have been affordable even if they had beenallocated. In some cases, these properties have now beenprivatized following the increased emphasis on marketprovision.40 As with the transition countries in Europe,China has relatively recently begun a policy to transfer tohomeownership dwellings that had previously been rentedprimarily from state-owned enterprises, but also from otherstate housing providers. Box 5.4 describes this process inthe city of Jinan.
Despite this general trend against direct provision inthe South as well as the North, there is some continuingsupport for rental housing. In Hong Kong, the HousingAuthority actually increased its stock by 18,000 units between1991 and 2001; this is also in spite of the simultaneous saleof public rental housing during this period.41 The authoritycontinued building and increased the entitlement thresholdin real terms, thereby adding to its potential clients. However,a considerable subsidy is required; tenants pay about 9 percent of their income in rent compared to 29 per cent in theprivate sector.42 In the Republic of Korea, since 1989 therehas been a growing interest in a permanent rental dwellingprogramme for those on low incomes.43 Progress has beenslow and, by the end of 1999, public rental units onlyaccounted for 2 per cent of the total housing stock; however,the policy reflects government recognition thathomeownership is not a viable solution for all of those on lowincomes.44 In South Africa, there has also been a policy (albeitas a secondary strategy subsidiary to the main emphasis onhomeownership that is discussed in the next section) tosupport the development of a social housing sector and, morespecifically, to encourage the development of housingassociations to manage low-income estates and rentalaccommodation. The government estimates that there are 60institutions offering 25,000 rental units.45 The institutionalhousing subsidy programme is used to assist with thefinancing of developments. In this case, a further benefit hasbeen the use of finance to rehabilitate inner-city buildings.There is a recognition within the government that rentsshould not be more than 25 to 30 per cent of income, andthis may make future financing complex. Even more recently,the municipal government in São Paulo, Brazil, introducedfurther measures in Jaunary 2004 to provide benefits to low-income households renting accommodation in the city.
The majority of renters in developing country citiesare in the informal housing sector. In some parts of WestAfrica and Asia, the incidence of renting is very high. It isestimated that 80 per cent of households in Abidjan, Côted’Ivoire, were tenants in the 1980s and that 88 per cent weretenants in Port Harcourt, Nigeria, in 1984. Comparablepercentages in 1981 for Calcutta and Madras, India, were 76and 68 respectively.46 In spite of this reality, most low-incomeshelter policies, programmes and projects have tended topromote homeownership and have paid little attention torental housing, either in terms of understanding andaddressing the needs of tenants or encouraging thedevelopment of this type of housing. However, there is nowincreasing recognition of the significant role of rental housingin meeting the shelter needs of the many urban poorhouseholds who cannot afford homeownership (see Box 9.3).
Social housing and homeownership
In practice, the high costs of constructing rental publichousing and the ongoing costs of maintenance, often in acontext in which rents remain very low, has resulted inlarge-scale rental programmes being considered impossiblein many Southern countries. Housing budgets in Southerncountries can ‘seldom carry universal housing subsidyprogrammes and very few new programmes are created thatare structured as an entitlement’.47 Despite these problems,there are some governments that have sought to introducesubsidy programmes of a significant scale. There is oftenwidespread popular support for measures to address housingneeds. Box 5.5 describes the pressure that social movementsin Brazil have been exerting over a number of years in orderto increase state commitment to this area. Given thefinancial constraints, governments have a limited range ofchoices. In some cases, they have chosen to use limitedfunds to support small loan programmes that enhance theprocess of incremental housing development. Thesestrategies are considered in Chapter 6 on sheltermicrofinance and Chapter 7 on community funds.
In other cases, governments have chosen to subsidizea minimum complete dwelling. The remainder of thischapter considers financing strategies that have incorporatedcapital grants (direct-demand subsidies), in some casestogether with mortgage loans.
Housing budgets inSouthern countries
can seldom carryuniversal housing
subsidy programmes
91Financing for social and rental housing
Box 5.4 The right to buy in China
In Jinan, a city of 1.5 million in eastern China, the percentage of work-managed housing was stillat 63 per cent in 1998, with 18 per cent living in state-managed housing and 19 per cent inprivate housing. Nominal rents in public housing rose during the 1990s from an average of 0.11yuan to about 6.75 yuan per square metre.The Comfortable Housing Programme was aimed atassisting those in particular need, and by 1999, 10,800 (just under half of the 24,500 low-income households with special housing problems) had bought – at cost price – or wererenting comfortable housing.
Attempts to sell public housing began in 1994, but did not really take off untilconditions were made more favourable; by the end of 1995, only 5 per cent of all units hadbeen sold.The subsidy on sale was further increased until it became almost a free allocation inmany cases, and by the end of 1999, 80 per cent of public housing units had been privatized.Source: Zhao and Bourassa, 2003.

Occasionally, effective capital subsidies have beengiven through supposed low-interest loans. The poorperformance of state-owned housing finance companies hasalready been discussed in Chapter 4; but what was notelaborated upon are the reasons for such a poor
performance. The limited resources that exist for housingfinance mean that allocations may be made as politicalfavours rather than universal entitlements. Governmentshave been reluctant to be seen to agree to foreclosure, asnoted in the example from Zimbabwe in Chapter 4.49 Inother cases, state loans may simply be written off (perhapsas part of an election campaign). In such contexts, onereason for low repayment rates on government loans is thatborrowers do not expect to be held to their repaymentcommitments. The dynamics around such lending areillustrated in Box 5.6.50 In this case, the scheme sought toassist the poor, identified by the Indian classification systemof ‘economically weaker sections’ (EWS), with additional andexplicit criteria specifying inclusion of scheduled castes,scheduled tribes and backward classes. In order toparticipate in the schemes, beneficiaries had to own land;furthermore, to enable the inclusion of the poorest, land wasallocated free to some squatting on public land with plots ofless than 85 square metres. A basic permanent structure wasprovided using funds provided by the Housing and UrbanDevelopment Corporation (HUDCO) at a subsidized interestrate of 9 per cent, with the loans to be repaid by beneficiariesand guaranteed by the state government. In one project, in1994, used for purposes of illustration, the cost of each unitwas 13,000 rupees, of which 11,700 rupees comprised aloan. The reason for a recovery rate of less than 15 per centis explained in Box 5.6.
92 Shelter finance: assessment of trends
Box 5.5 The National Fund for Popular Housing, Brazil
Source: Nelson Saule, pers comm, 2004
Box 5.6 The politicization of housing finance in India
By building as many housing units for ‘economically weaker sections’ (EWS) of the Indian socialhierarchy, the Indian government has attempted to demonstrate that it is doing a lot to benefitthe poor. However, almost all of the actors involved try to manipulate the creation of policy,the selection of beneficiaries and/or the implementation of housing schemes for personal gain.Almost none of the government officials are really bothered whether or not the target groupis helped.
The recovery rate of EWS housing loans is also poor, which implies that the schemescan only be implemented at the expense of the taxpayer. Party-political leaders allocate and sellpattas (land titles) and half-completed houses to people who do not necessarily belong to thetarget group. For this purpose, beneficiaries have to pay slum leaders.
The leaders in cooperation with political leaders create a vote bank by getting thehousing scheme sanctioned. Later on, these politicians try to maintain their vote bank by tellingthe beneficiaries that they do not need to repay the housing loans provided by thegovernment.The leaders have to bribe bureaucrats and other political leaders to get housingunits allocated to people of their choice. Bureaucrats who do not cooperate face beingtransferred to unpopular districts. Despite payments, which have to be made to (political)leaders and government officials, EWS housing schemes tend to be gift schemes.Source: Smets, 2002, p150.
During the early 1990s in Brazil, the popular housing movementsacting in the National Forum of Urban Reform presented to theBrazilian Congress a popular initiative subscribed to by 1 millionvoters,48 hoping to create the National Fund of Popular Housingand the National Council of Popular Housing.This project hasbeen a long time in gestation (over 12 years); but was finally passedin the Brazilian Chamber of Deputies in June 2004 and is nowawaiting approval of the senate.
The objective is to make access to housing easier for low-income populations in both urban and rural areas through the useof subsidies. Land policies will need to facilitate this programme.The target population are those living in insecure conditions, inslums, collective-renting accommodation, tenement houses and riskareas, or individuals with an income equal to or lower than tenminimum wages. It is proposed that the main resources for thefund will be the national budget, together with the investmentresources of the government’s Severance Indemnity Fund forEmployees (FGTS).These resources will be invested in socialprogrammes such as the production of serviced land; slumimprovement; the upgrading of tenement houses and co-operativerental housing; the construction and reform of community and/orinstitutional facilities connected with housing projects; landregulation; and the purchase of building materials.
It is proposed that a National Council of Popular Housingbe established to draft guidelines and design programmes toallocate the fund’s resources, to carry out the economicmanagement of these resources and to determine objective
criteria for resource distribution.The membership of the councilwill be drawn from the federal government, the trade unions andlegally constituted popular housing organizations.The system, as awhole, must include the Brazilian Urban Ministry and other federal,state and municipal organizations of public administration.
The federal government already manages various socialhousing programmes of benefit to low-income rural and urbanpopulations, which provide land for housing and smallholdings.These programmes include:
• the efficient production of economical housing andinfrastructure improvement (Better Living and Pro-Housing; Residential Leasing);
• regularization of informal settlements; and • slum upgrading (Habitar Brazil).
These are all subsidized programmes controlled by Programme forSocial Housing (PSH), a federal entity. In addition to financing self-help and co-operative construction, they endeavour to give somepriority to women who are heads of household, to families withthe lowest incomes, and to rural and poor urban populations.There is also a low-cost credit aid programme (Solidarity Credit)directed at family groups organized into formal co-operatives orhousing associations where the members’ incomes ranges fromzero to three times the present minimum wage, with 542 millionBrazilian real for 2004.
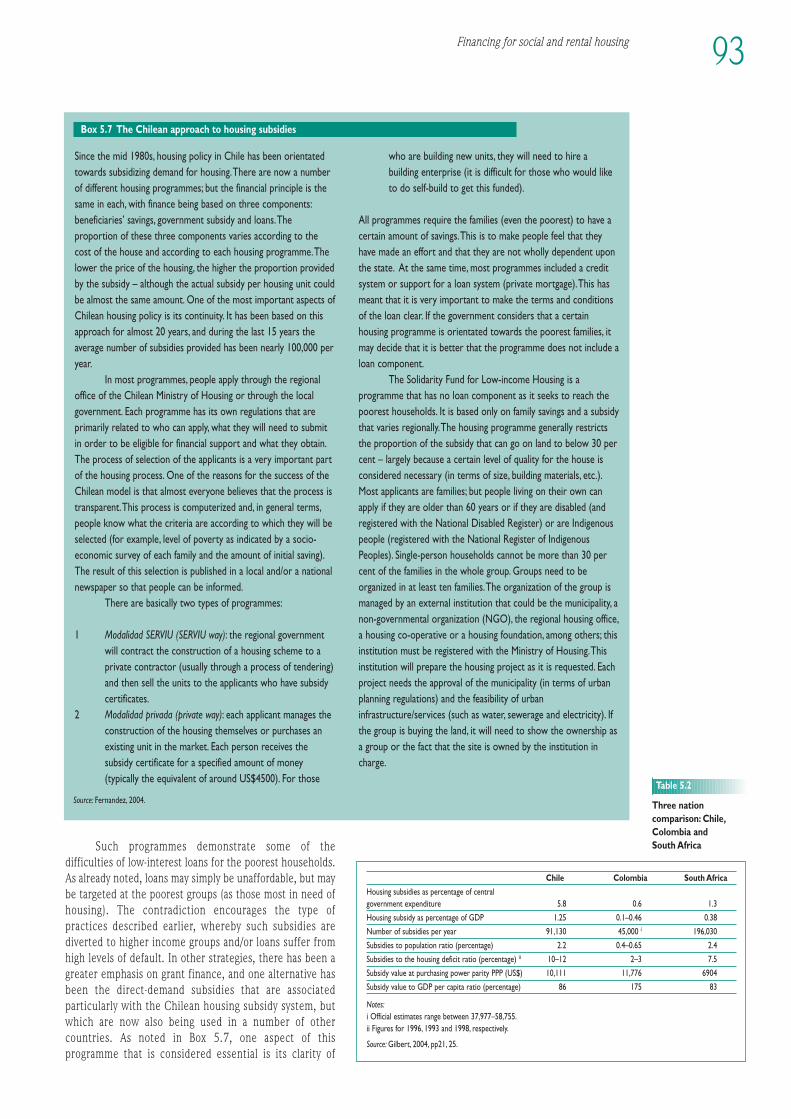
Such programmes demonstrate some of thedifficulties of low-interest loans for the poorest households.As already noted, loans may simply be unaffordable, but maybe targeted at the poorest groups (as those most in need ofhousing). The contradiction encourages the type ofpractices described earlier, whereby such subsidies arediverted to higher income groups and/or loans suffer fromhigh levels of default. In other strategies, there has been agreater emphasis on grant finance, and one alternative hasbeen the direct-demand subsidies that are associatedparticularly with the Chilean housing subsidy system, butwhich are now also being used in a number of othercountries. As noted in Box 5.7, one aspect of thisprogramme that is considered essential is its clarity of
93Financing for social and rental housing
Chile Colombia South Africa
Housing subsidies as percentage of central government expenditure 5.8 0.6 1.3
Housing subsidy as percentage of GDP 1.25 0.1–0.46 0.38
Number of subsidies per year 91,130 45,000 i 196,030
Subsidies to population ratio (percentage) 2.2 0.4–0.65 2.4
Subsidies to the housing deficit ratio (percentage) ii 10–12 2–3 7.5
Subsidy value at purchasing power parity PPP (US$) 10,111 11,776 6904
Subsidy value to GDP per capita ratio (percentage) 86 175 83
Notes:i Official estimates range between 37,977–58,755.ii Figures for 1996, 1993 and 1998, respectively.
Source: Gilbert, 2004, pp21, 25.
Three nationcomparison: Chile,Colombia and South Africa
Table 5.2
Box 5.7 The Chilean approach to housing subsidies
Source: Fernandez, 2004.
Since the mid 1980s, housing policy in Chile has been orientatedtowards subsidizing demand for housing.There are now a numberof different housing programmes; but the financial principle is thesame in each, with finance being based on three components:beneficiaries’ savings, government subsidy and loans.Theproportion of these three components varies according to thecost of the house and according to each housing programme.Thelower the price of the housing, the higher the proportion providedby the subsidy – although the actual subsidy per housing unit couldbe almost the same amount. One of the most important aspects ofChilean housing policy is its continuity. It has been based on thisapproach for almost 20 years, and during the last 15 years theaverage number of subsidies provided has been nearly 100,000 peryear.
In most programmes, people apply through the regionaloffice of the Chilean Ministry of Housing or through the localgovernment. Each programme has its own regulations that areprimarily related to who can apply, what they will need to submitin order to be eligible for financial support and what they obtain.The process of selection of the applicants is a very important partof the housing process. One of the reasons for the success of theChilean model is that almost everyone believes that the process istransparent.This process is computerized and, in general terms,people know what the criteria are according to which they will beselected (for example, level of poverty as indicated by a socio-economic survey of each family and the amount of initial saving).The result of this selection is published in a local and/or a nationalnewspaper so that people can be informed.
There are basically two types of programmes:
1 Modalidad SERVIU (SERVIU way): the regional governmentwill contract the construction of a housing scheme to aprivate contractor (usually through a process of tendering)and then sell the units to the applicants who have subsidycertificates.
2 Modalidad privada (private way): each applicant manages theconstruction of the housing themselves or purchases anexisting unit in the market. Each person receives thesubsidy certificate for a specified amount of money(typically the equivalent of around US$4500). For those
who are building new units, they will need to hire abuilding enterprise (it is difficult for those who would liketo do self-build to get this funded).
All programmes require the families (even the poorest) to have acertain amount of savings.This is to make people feel that theyhave made an effort and that they are not wholly dependent uponthe state. At the same time, most programmes included a creditsystem or support for a loan system (private mortgage).This hasmeant that it is very important to make the terms and conditionsof the loan clear. If the government considers that a certainhousing programme is orientated towards the poorest families, itmay decide that it is better that the programme does not include aloan component.
The Solidarity Fund for Low-income Housing is aprogramme that has no loan component as it seeks to reach thepoorest households. It is based only on family savings and a subsidythat varies regionally.The housing programme generally restrictsthe proportion of the subsidy that can go on land to below 30 percent – largely because a certain level of quality for the house isconsidered necessary (in terms of size, building materials, etc.).Most applicants are families; but people living on their own canapply if they are older than 60 years or if they are disabled (andregistered with the National Disabled Register) or are Indigenouspeople (registered with the National Register of IndigenousPeoples). Single-person households cannot be more than 30 percent of the families in the whole group. Groups need to beorganized in at least ten families.The organization of the group ismanaged by an external institution that could be the municipality, anon-governmental organization (NGO), the regional housing office,a housing co-operative or a housing foundation, among others; thisinstitution must be registered with the Ministry of Housing.Thisinstitution will prepare the housing project as it is requested. Eachproject needs the approval of the municipality (in terms of urbanplanning regulations) and the feasibility of urbaninfrastructure/services (such as water, sewerage and electricity). Ifthe group is buying the land, it will need to show the ownership asa group or the fact that the site is owned by the institution incharge.

conditions and transparency of selection. Previousprogrammes had been characterized by public-sectorprovision, inadequate scale and, subsequently, by politicalfavouritism and corruption in their allocation.51 In general,such programmes are small, although in both Chile andSouth Africa there have been extensive programmes ofgrant finance to access homeownership. This has beenlinked to loans in the case of Chile and, more recently,South Africa. Capital grant subsidies have also been offeredin a number of other countries, although at a smaller scale.By 1999, five other Latin American countries hadintroduced owner-orientated direct-demand subsidies:Costa Rica (1986), Colombia, El Salvador, Paraguay andUruguay (all in 1991).52
As noted in Box 5.7, the Chilean subsidy programmerequires a period of savings, which is then rewarded byaccess to a subsidy to be used to purchase housing. Familiescompete for subsidy vouchers, with the funds beingallocated on the basis of four criteria: savings, poverty levelof the family, family size and geographic location.53 Savingsis the variable that they can most easily affect, and savingslevels have grown considerably to 1.38 million savingsaccounts by the end of 1997. Savings contributions arebecoming recognized as being more important in SouthAfrica. The South African capital subsidy scheme hasrecently been amended to require a mandatory upfrontsavings contribution of 2479 rand for all subsidies, unlessthe beneficiary chooses the People’s Housing Process (self-build) route, in which case they must contribute ‘sweatequity’, although there are not yet fixed guidelines for whatthis means in practice.
Despite the initial political commitment, a recentcomparative study argues that the Chilean, Colombian orSouth African governments have not put large-scale fundinginto this process.54 As shown in Table 5.2, the percentageof state expenditure for these three countries does notexceed 1.25 per cent, while 2 per cent has been consideredtypical in the South. The Chilean state was committed toprovide a complete house, rather than support incremental
development, and for that reason gave fewer and largersubsidies.55 Colombia concurred with the emphasis oncomplete housing (except for a period between 1994 and1998 when upgrading was also included). In South Africa,the emphasis has been on scale, although it is alsoconsidered necessary that a complete house be offered;minimum size requirements were introduced during thelate 1990s reflecting concerns about the small size of theunits.
Arguably, the strong focus on capital subsidiesresponded to the needs of the construction industry. Theconstruction companies in Chile appear to have favouredhigher standards and have been opposed to self-helphousing.56 In South Africa, while the focus on housingreflected political priorities, the strategy for addressinghousing need emerged from the business representativesand consultants who dominated the National Housing Forumbetween 1992 and 1994.57 The forum saw low-incomehousing finance in terms of a new capital subsidy deployedby private developers in large-scale construction projects.The Costa Rican programme profile in Box 5.8 is particularlyinteresting because it appears to have avoided theseproblems, being less concerned with construction volumeand more orientated towards addressing the needs of thepoor.
The interest in these programmes is highlighted inBox 5.9, which summarizes an analysis by the World Bank ofthe merits of the approach. As noted earlier, similarprogrammes have been introduced in a number of countries,including Ecuador and Colombia. In Colombia, a recentInter-American Development Bank (IADB) loan is to provideadditional financing, with an anticipated 10,000 subsidiesfor housing improvement and 61,000 subsidies for completehousing aimed at the poorest 40 per cent of households withmonthly incomes of less than two minimum salaries. Aspecific component aims to support shelter microfinance.58
In Ecuador, the Housing Incentive System (SIV) offershouseholds access to a subsidy if they can provide savings.There is state assistance to purchase a new house and alsofor housing improvements. In the case of housingimprovements that are seen as being appropriate for thelower income groups, the take-up of a loan is optional.Between 1998 (the beginning of the programme) andOctober 2002, approximately 25,000 families were givensupport for housing improvement and a further 25,000higher income families received support for housingpurchase.59
The influence can also be seen in current discussionsin Mexico where the theoretical arguments haveincreasingly favoured direct subsidies, although, as describedin Chapter 4, interest rate subsidies have, in practice, beengiven much emphasis. The government now intends to putin place a single unified system of housing subsidies linkedto savings and loans with (for those with low incomes) TuCasa and, for those with slightly higher incomes, a moremarket-orientated linked subsidy and loan (such as thespecial programme for housing loans and subsidies,PROSAVI).60 In 2003, just over 13,000 loans were providedthrough this second programme. Plans for Tu Casa highlight
94 Shelter finance: assessment of trends
Box 5.8 Costa Rica: savings, subsidies and loans
Costa Rica has a population of 3.3 million, with 786,600 housing units of which about 100,000are informal and an estimated housing deficit of 164,000. A direct-demand subsidy programmewas introduced in 1987 which, modelled on the Chilean system, offered access to a subsidyand a mortgage loan in return for a down payment (savings).The lowest-income households upto one minimum salary do not have to make a down payment.The process works largelythrough ‘authorized entities’ that support households to acquire a house.
In contrast to Chile and most other countries that have adopted direct-demandsubsidies, the programme of Costa Rica has succeeded in reaching low-income groups.Themain reason is that a group of sophisticated non-governmental organizations (NGOs),experienced in housing development, have become the main developers under the programme.At first, many for-profit developers where involved; but they have now withdrawn from theprogramme. Some NGOs have become authorized entities, forming communities, extendingcredit and building the units.These NGO-authorized entities even issue bonds to raise moneyon public markets for housing finance. Between 1988 and 1998, the programme delivered justover 93,000 dwellings reaching 13 per cent of households in the country.Source: Ferguson, 2002, p169.
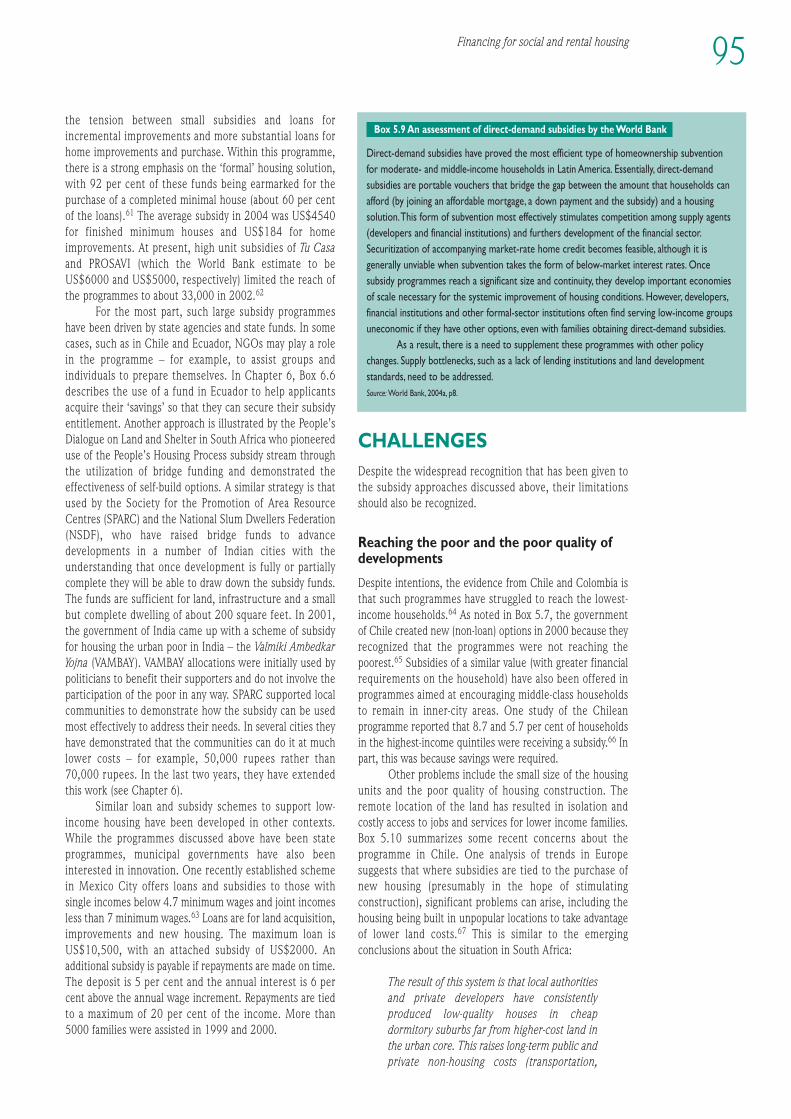
the tension between small subsidies and loans forincremental improvements and more substantial loans forhome improvements and purchase. Within this programme,there is a strong emphasis on the ‘formal’ housing solution,with 92 per cent of these funds being earmarked for thepurchase of a completed minimal house (about 60 per centof the loans).61 The average subsidy in 2004 was US$4540for finished minimum houses and US$184 for homeimprovements. At present, high unit subsidies of Tu Casaand PROSAVI (which the World Bank estimate to beUS$6000 and US$5000, respectively) limited the reach ofthe programmes to about 33,000 in 2002.62
For the most part, such large subsidy programmeshave been driven by state agencies and state funds. In somecases, such as in Chile and Ecuador, NGOs may play a rolein the programme – for example, to assist groups andindividuals to prepare themselves. In Chapter 6, Box 6.6describes the use of a fund in Ecuador to help applicantsacquire their ‘savings’ so that they can secure their subsidyentitlement. Another approach is illustrated by the People’sDialogue on Land and Shelter in South Africa who pioneereduse of the People’s Housing Process subsidy stream throughthe utilization of bridge funding and demonstrated theeffectiveness of self-build options. A similar strategy is thatused by the Society for the Promotion of Area ResourceCentres (SPARC) and the National Slum Dwellers Federation(NSDF), who have raised bridge funds to advancedevelopments in a number of Indian cities with theunderstanding that once development is fully or partiallycomplete they will be able to draw down the subsidy funds.The funds are sufficient for land, infrastructure and a smallbut complete dwelling of about 200 square feet. In 2001,the government of India came up with a scheme of subsidyfor housing the urban poor in India – the Valmiki AmbedkarYojna (VAMBAY). VAMBAY allocations were initially used bypoliticians to benefit their supporters and do not involve theparticipation of the poor in any way. SPARC supported localcommunities to demonstrate how the subsidy can be usedmost effectively to address their needs. In several cities theyhave demonstrated that the communities can do it at muchlower costs – for example, 50,000 rupees rather than70,000 rupees. In the last two years, they have extendedthis work (see Chapter 6).
Similar loan and subsidy schemes to support low-income housing have been developed in other contexts.While the programmes discussed above have been stateprogrammes, municipal governments have also beeninterested in innovation. One recently established schemein Mexico City offers loans and subsidies to those withsingle incomes below 4.7 minimum wages and joint incomesless than 7 minimum wages.63 Loans are for land acquisition,improvements and new housing. The maximum loan isUS$10,500, with an attached subsidy of US$2000. Anadditional subsidy is payable if repayments are made on time.The deposit is 5 per cent and the annual interest is 6 percent above the annual wage increment. Repayments are tiedto a maximum of 20 per cent of the income. More than5000 families were assisted in 1999 and 2000.
CHALLENGESDespite the widespread recognition that has been given tothe subsidy approaches discussed above, their limitationsshould also be recognized.
Reaching the poor and the poor quality ofdevelopments
Despite intentions, the evidence from Chile and Colombia isthat such programmes have struggled to reach the lowest-income households.64 As noted in Box 5.7, the governmentof Chile created new (non-loan) options in 2000 because theyrecognized that the programmes were not reaching thepoorest.65 Subsidies of a similar value (with greater financialrequirements on the household) have also been offered inprogrammes aimed at encouraging middle-class householdsto remain in inner-city areas. One study of the Chileanprogramme reported that 8.7 and 5.7 per cent of householdsin the highest-income quintiles were receiving a subsidy.66 Inpart, this was because savings were required.
Other problems include the small size of the housingunits and the poor quality of housing construction. Theremote location of the land has resulted in isolation andcostly access to jobs and services for lower income families.Box 5.10 summarizes some recent concerns about theprogramme in Chile. One analysis of trends in Europesuggests that where subsidies are tied to the purchase ofnew housing (presumably in the hope of stimulatingconstruction), significant problems can arise, including thehousing being built in unpopular locations to take advantageof lower land costs.67 This is similar to the emergingconclusions about the situation in South Africa:
The result of this system is that local authoritiesand private developers have consistentlyproduced low-quality houses in cheapdormitory suburbs far from higher-cost land inthe urban core. This raises long-term public andprivate non-housing costs (transportation,
95Financing for social and rental housing
Box 5.9 An assessment of direct-demand subsidies by the World Bank
Direct-demand subsidies have proved the most efficient type of homeownership subventionfor moderate- and middle-income households in Latin America. Essentially, direct-demandsubsidies are portable vouchers that bridge the gap between the amount that households canafford (by joining an affordable mortgage, a down payment and the subsidy) and a housingsolution.This form of subvention most effectively stimulates competition among supply agents(developers and financial institutions) and furthers development of the financial sector.Securitization of accompanying market-rate home credit becomes feasible, although it isgenerally unviable when subvention takes the form of below-market interest rates. Oncesubsidy programmes reach a significant size and continuity, they develop important economiesof scale necessary for the systemic improvement of housing conditions. However, developers,financial institutions and other formal-sector institutions often find serving low-income groupsuneconomic if they have other options, even with families obtaining direct-demand subsidies.
As a result, there is a need to supplement these programmes with other policychanges. Supply bottlenecks, such as a lack of lending institutions and land developmentstandards, need to be addressed.Source: World Bank, 2004a, p8.

schooling, etc.) and creates numerous negativeexternalities, including household- andcommunity-level economic decline, increasedcrime and so on. This is entirely in keeping withthe logic of private-sector housing deliveryunder a fixed output price (the subsidy), butalso reflects a broader failure to see housingdelivery in terms of integrated humansettlement development rather than thephysical production of ‘top structures’.68
Cost for households
One problem in South Africa is that some households arebeginning to abandon their subsidy houses, partly becauseof their poor quality and location, but also becausehouseholds are now liable for rates and other servicecharges. It is not clear that capital subsidies are the way togo for the poorest households. A more effective strategymight be to ensure access to serviced plots in well-locatedareas where the poor choose to live and then to providesmall loans to finance incremental housing.
How much of a problem is affordability in LatinAmerica? There are some indications in Chile thataffordability is not a serious problem as service bills arebeing paid, although the repayment of housing loansreceived in association with capital subsidies is poor.69
However, it should also be recognized that only 17 per centof subsidies go to the poorest income group.70 The financingmodel in Colombia anticipated that households earning lessthan two minimum salaries with an average monthly incomeof US$117 will be able to save US$710 and repay US$35 amonth.71 This seems somewhat unlikely and suggests thataffordability may be an issue. In Ecuador, there is alsoevidence that suggests the lowest-income families find ithard to participate, particularly in the larger towns. The
cheapest dwellings are now priced at around US$2400 insmaller towns and US$4500 in the larger cities.
There are those who believe that such programmesare unaffordable to the poor in Latin America, given thatthere are 18 million indigent poor in the continent and thatthese families cannot provide themselves with enough toeat, let alone save for housing.72 However, solutions can bedeveloped. In Chile, Hogar de Cristo has provided more than330,000 shelters. One of the key activists behind the LatinAmerican and Asian Low-income Housing Service (SELAVIP),an NGO which has supported many housing initiatives forthe poor argues that:
What is required … is that the poorest of thepoor have access to locate themselves on urbanproperty. A bit of their own land permits thefamilies to advance by their own means in thebuilding of a house.73
Costs for the state
The potential scale of such strategies for financing housingappears to be limited by the high and explicit costs: ‘fewgovernments can afford to grant ample per-unit subsidies forcomplete units’ and, generally, these strategies lead to smalland insignificant programmes.74 In some countries, such asVenezuela, this is funded by specific taxes on salaries;however, the Ley de Politica Habitacional results in only onein a hundred of the contributors being assisted each year.75
In Chile, Colombia and South Africa, the intentionwas that the commercial banks would be involved inproviding credit (small loans) to supplement the subsidies.‘Unfortunately, all three countries have faced majorproblems in convincing the banks to lend to the poor.’76
Clearly, in a financial context in which the ambition is tokeep the subsidy to a minimum, the option of supplementaryloan finance is attractive. However, it appears thatcommercial institutions used to mortgage finance find thelow-income market difficult due to a lack of conventionalcollateral and lack of affordability.77 In addition, initialattempts to draw in private finance may have failed in Chilebecause loan recovery on state loans was poor.78 Oneadditional factor is that, despite the political situation duringthe 1980s, it was considered unacceptable to evict people:
… government efforts to recover due paymentsor collect by exercising its rights through thecourt system have been minimal. For example,despite arrears in the order of 65–75 per cent,there have been few efforts to repossessproperties.79
For such reasons, in 1992, the State Bank of Chile (as theprivate sector had avoided offering loans) had 62 per cent ofborrowers in this programme who were more than fourpayments late.80 However, the state has now passed over theloans to the banks, together with a guarantee of repayment,as the banks know that past repayment rates have been low.A similar strategy to persuade the banks to offer loans forhousing to low-income households occurred in South Africa,
96 Shelter finance: assessment of trends
Box 5.10 The Chilean housing subsidy and the quality of dwellings
A considerable accomplishment of the Chilean government has been achieving a high rate ofhousing construction, which has controlled the housing deficit through using public resourcesto leverage private contributions. However, while significant numbers of dwellings have beenconstructed, concerns have also been raised. In particular, the policy offers few location optionsfor the urban poor.The construction focuses on new housing developments that have primarilybeen built in the urban periphery where land costs are lowest.This has promoted a rapidprocess of urban expansion.Today, social housing is only available in a few very distant areas ofthe capital city of Metropolitan Santiago.
However, the peripheral setting of these units, together with the size of the complexes(estates), has resulted in serious problems for the residents’ well-being, with implications forthe quality of life in Santiago.The externalities of building on the periphery have not been fullytaken into account and no allowance has been made for the costs of new transportationnetworks and other urban infrastructure and services. Nor has any consideration been givento the additional transport costs faced by families who often have limited employmentpossibilities. A further problem is the consequences arising from a high concentration ofvulnerable families in remote areas.The result is greater urban and social segregation, anincrease in the disparity in access to urban services, a worsening of local living conditions,increased environmental damage, urban security problems, and the deterioration of urban andhistoric centres.Source: Jiron and Fadda, 2003.

where it was believed that South Africa’s mainline bankswould extend the middle-class mortgage model‘downwards’. This was, in part, based on the suppositionthat finance market behaviour had largely reflected racialdiscrimination. In this case, there was also opposition toincremental housing on political grounds and a reluctanceto accept ‘second-best’ strategies for the poor (black)majority in housing need.81
Poor location due to market choice and financial shortage
There are concerns with regard to social housing (includingboth Northern rental and Southern direct-demand subsidyoptions) about the concentration of the poor in specificspatial areas. It is recognized that remote location can addto problems of social exclusion, while a high concentrationof very poor households can increase some of the problemsof poverty. In programmes that place emphasis on marketmechanisms, the poor may have relatively little choice aboutthe kind of housing solution that is offered. The locationsappear to be a result of greater reliance on the market, whichchooses the location according to a range of factors but
which has no particular incentive (in most cases) tomaximize locational advantage to the poor. The emphasisplaced by government on the adequate standard of thedwelling (as in Chile and South Africa), combined with thewish for contractors to maximize profits, tend to orientatethe solution towards lower land costs and greaterconstruction investment.
There are repeated concerns about the lack of financein these systems except, perhaps, vis-à-vis the North. Evenin the North, there are expressed concerns about the qualityof provision, which is related to the scale of finance. In theSouth, there is some evidence of a lack of provision evenamong those countries that do have programmes, as well asconcerns about the quality of the social housing that isprovided. Many are not reached by the systems of capitalsubsidies discussed earlier. Even in the countries in whichthey are operating, it can be hard to secure subsidies, withnumbers considerably below need. In every case, there aremany who remain in need. In the South, many low- and lowmiddle-income households build incrementally because thisis all that is affordable (see Chapter 6). Much of this building(as is shown in Chapters 6 and 7) is financed by saving andvirtually none by the formal financial sector.
With regard to socialhousing, there are
concerns about theconcentration of the
poor in specificareas
97Financing for social and rental housing
1 This chapter was prepared bya team of experts led by DianaMitlin, University ofManchester, UK.
2 Mayo, 1999; Hoek-Smit andDiamond, 2003, pp3–5.
3 Mayo, 1999, p9.4 Renaud, 1999, p756.5 Hoek-Smit and Diamond, 2003,
p5.6 Hoek-Smit and Diamond, 2003,
p5.7 Mayo, 1999, p40.8 Hoek-Smit and Diamond, 2003,
pp11–12.9 Fernandez, 2004.10 Renaud (1999, p758) argues
that the superiority ofdemand-side subsidies hadbeen shown in the USexperience during the 1970s.He argues that there is astrong case for saying incometransfers were needed morethan expenditure on improvedhousing.
11 Turner and Whitehead, 2002,p171.
12 Whitehead, 2003; Stephens,2004.
13 Whitehead, 2003.14 Taylor-Hayford, 2002, p149.
15 HUD, cited in Carolini, 2004,p16.
16 Farha and Goba, 2003, p22.17 Stephens, 2004.18 Stephens, 2002.19 Priemus and Dieleman, 2002,
p198.20 Gibb, 2002, p332.21 Stephens, 2004.22 Whitehead, 2003.23 Stephens, 2004.24 Whitehead, 2003, p6.25 Stephens, 2003, p1021.26 Hegedüs and Teller, 2003.27 Hegedüs et al, cited in
Stephens 2003, p1021.28 Hegedüs, 2004, p1.29 Stephens, 2003, p1021.30 Proxenos, 2002, p5.31 Turner and Whitehead 2004,
p175.32 Hegedüs, 2004, p4; Yasui
2002b, p25.33 Hegedüs, 2004, p4.34 Hegedüs, 2004, p3.35 Hegedüs, 2004, p3.36 Lykova et al, 2004, p633.37 Hegedüs, 2004, p5.38 Hegedüs, 2002, p24.39 Stephens, 2002, p180.
40 See Mulenga, 2003, for anillustrative discussion of thisprocess in Zambia.
41 Ho, 2004, p486.42 Lamoureaux, 1998, p71.43 Ha, 2002b, p202.44 Ha, 2002b, p200.45 Department of Housing, 2003.46 UN-Habitat, 2003c.47 Hoek-Smit and Diamond, 2003,
p6.48 According to the Brazilian
constitution, citizens have theright to present bills throughthe instrument of popularinitiative. In the case of nationalbills, 1 per cent of the nationalelectorate must subscribe tothe initiative through signing apetition.
49 Kamete, 2000.50 Smets, 2002, p150.51 Gilbert, 2004, p15; Gilbert,
2002b, p310.52 Mayo, 1999, p36.53 Pardo, 2000, p5.54 Gilbert, 2004, p20.55 Gilbert, 2004, p23.56 Gilbert, 2004, p28.57 Baumann, 2004, p6;
Huchzermeyer, 2003, p604.
58 IADB, 2003, p2.59 Frank, 2004, p173.60 World Bank 2004a, p6.61 Connolly, 2004b, p4.62 World Bank, 2004a, p9.63 Solis and Ortiz, 2002,
pp157–158.64 Gilbert, 2004, p27.65 Fernandez, 2004.66 Cummings and Di Pasquale,
1997, p13.67 Bosvieux and Vorms, cited in
Scanlon and Whitehead, 2004.68 Baumann, 2004, p17.69 Pardo, 2000, p6.70 Fernandez, 2004.71 IADB, 2003, p3.72 Van der Rest, 2003, p8.73 Van der Rest, 2003, p7.74 Ferguson, 1999, p190.75 Ferguson, 1999.76 Gilbert, 2004, p32.77 Tomlinson, cited in Gilbert,
2004, p33.78 Gilbert, 2002a, p315.79 Pardo, 2000, p6.80 Cummings and Di Pasquale,
1997, p8.81 Baumann, 2004, p6.
NOTES

SMALL LOAN CHALLENGESShelter has become a commodity for increasing numbers oflow-income households, especially those living in urbanareas of developing countries. Those who buildincrementally (or progressively) are a very significant groupin many countries in the South. However, loan finance forshelter-related investments in incremental dwellings madeby low-income households whose income comes from theinformal economy is rarely available through the formalcommercial financial sector. In the vast majority of cases,these households are ineligible for commercial mortgagefinance. Households seeking to invest in their shelter (land,infrastructure and housing) have been forced to use theirown limited income, seek additional resources from familyand friends, and borrow on informal credit markets or, insome cases, from groups such as credit unions. Sources oflonger-term finance are extremely limited and interest ratesmay be high. Box 6.1 illustrates sources of finance used bylow-income households in Hyderabad, India.
There have been several institutional efforts to assistthese households in obtaining secure access to some kind ofloan finance. In particular, shelter microfinance andcommunity finance mechanisms have grown considerablyduring recent decades. Based predominantly in Asia andLatin America, there have been multiple explorations andinnovations over the last 20 years.2 Initial activities weredeveloped by non-governmental organizations (NGOs)working in housing and urban development, and bymicrofinance organizations interested in supporting housinginvestment. Agencies responsible for these activities nowspan the voluntary and public sectors. There are now a smallnumber of larger programmes that involve multi-sectoralinitiatives, with some also having a role for the privatesector. As the effectiveness of small loans has become moreevident, some innovative state programmes have sought tosecure similar development benefits by replicating suchprogrammes, albeit within different structures and systems.A small number of private-sector initiatives have beenlaunched, generally building on microfinance approachesand seeking to expand into what is perceived to be apotentially profitable market. Urban dwellers in a wide rangeof different countries may now be offered such
opportunities related to savings and loans for shelterinvestments.
What is characteristic of these initiatives is that theyinvolve small-scale lending for shelter improvements. Inmany cases, they also encourage savings (although this maybe constrained by the rules and regulations of the financialsystem). The growing interest in such programmes isreflected in the launch by the Cities Alliance of the ShelterFinance for the Poor Initiative in 2001, which focuses onemerging practices of providing housing finance to poorclients on commercially viable terms.
These initiatives are of particular significance in theurban sphere where land, housing, infrastructure and basicservices are all marketed commodities. However, in somecases, lenders have extended into rural areas, notably inBangladesh, where traditional materials are not sufficient fora secure dwelling. Community funds for utilities such aselectricity and water management may also be associatedwith rural areas.
The programmes share a common perspective in thatthey work with the realities of urban development in theSouth (and, in some cases, in transitional economies), ratherthan the Northern model of urban development in which ahouse is constructed and then sold (often through afinancing package) to a family or individual. Their underlyingmodel of housing investment is one of incremental shelterdevelopment. Housing is secured over time as improvementsare made when funding is available. The dwelling is graduallyconsolidated, made more secure and services andinfrastructure are obtained. As is the case with micro-enterprise development, there is not a big market for suchlending in the North.3 This is partly due to much higherlevels of affordability, but also arises because buildingregulations prevent the extensive use of incremental shelterstrategies. In the North, conventional modern housing iscomplete in one single stage even if later investmentsexpand, renovate and/or modify the dwelling.
Low- and many middle-income urban households inthe South use incremental strategies. Underlyingincremental housing development is the issue ofaffordability; as already noted in Chapter 4, many struggleto afford mortgage finance and lack the capital to purchase acompleted house outright. In 1991, one study in nine Asian
Sheltermicrofinance andcommunity financemechanisms havegrown considerablyduring recentdecades
C H A P T E R
SMALL LOANS: SHELTERMICROFINANCE 1
6
countries concluded that between 40 and 95 per cent of allhouseholds had no possibility of living in a dwellingproduced by the formal sector.4 Estimates of cementproducers conclude that 70 per cent of housing investmentin Mexico is occurring incrementally.5 In Tanzania, it isestimated that 98 per cent of the housing stock in urbanareas is constructed on an incremental basis.6 This isunchanged from the figures quoted for 1978.7 In thePhilippines, a similar estimate is that 93 per cent of owner-occupied houses have been built through an incrementalbuilding process.8 Such figures emphasize the significanceof incremental development.
This chapter considers a distinct approach todelivering small loans to low-income households (almostuniversally in the South): microfinance. Another significantapproach – community funds – is discussed in Chapter 7.9
Microfinance loans are almost universally to individuals,generally to those with some security of tenure, forinvestment in housing (construction, improvement andextension). Chapter 7 examines the community fundapproach in which lending is typically to communities forland purchase, infrastructure and service investment, and(in some cases) for housing construction. In both cases(although most likely in the first), shelter lending may beaccompanied by opportunities to borrow for micro-enterprise development. Prior to considering these lendingstrategies, the strategy of incremental development ofshelter and the strategies used by the poor to secure financeare introduced.
Incremental development
For individuals or households with limited incomes, theonly possibility of homeownership (even in an illegalsettlement) is through shelter investment made in severalstages. Land purchase, service installation and upgrading,as well as housing construction, consolidation andexpansion, are all made at separate times. For higherincome households, the land purchase may be first, withsubsequent investments made as incomes increase andassets accumulate over a period of years. In the lowerincome families, the first investments may be in shelter ona piece of land with uncertain security. Subsequentinvestments are made as security increases. Infrastructuremay be installed (perhaps with state assistance). A shackmay be transformed into a more robust dwelling, withrooms being added, and flooring and roofing improved withthe use of permanent materials.
Such incremental shelters, often initially built oftemporary materials, frequently require repairs because ofdamage – for example, from natural forces. In Hyderabad,about one quarter of a sample of 224 households hadrecently repaired their house.10 No less than 64 per centhad repaired the roof (essential against monsoon rains). Box6.15 on the Grameen Bank’s loan package highlights thehigh cost of repeat repairs for houses built of traditionalmaterials; with loan finance, scarce funds can be allocatedmore effectively.
Box 6.1 describes the strategies that are used inHyderabad, India. The lack of contact with formal financial
institutions that is illustrated within this example is evidentin many parts of the world.
Despite its significance, incremental developmentmay be discouraged by more formal housing financeagencies. The Kenyan Banking and Building Societies Actexplicitly forbids financial institutions from lending for plotsof land with no or partially constructed housing on it.11
Households allocated land by the state Self-help HousingAgency in Botswana were expected to replace traditionalbuilding materials within two years – a very short period oftime for those with low incomes to accumulate sufficientfunds.12 One study of housing strategies for the poor inZimbabwe also highlights the resistance of some politiciansand residents to incremental housing.13 The lendingconditions of the Housing Finance Company of Ugandarequire land title, together with a number of furtherconditions: the development must be located in an urbanarea, have full services, be constructed of permanentmaterials and have local authority approval forconstruction.14
In general, this resistance to incremental housing byformal finance companies is because of the risks associatedwith the building processes (particularly potential illegality)and because of uncertainty about house value and, hence,problems of mortgage valuation. However, one general policyconcern about incremental strategies is that investment iswasteful because small improvements are made that mighthave to be repeated when a further extension is added.15
However, the financial implications are also clear. Low-income households cannot afford to pay the high interestcharges on a complete loan, but are more likely to be ableto cover the relatively small interest charges from repeatborrowings of much smaller amounts of finance.
Access to financial services
What research and practice during the early 1990semphasized was that the quality of self-help investmentcould be enhanced by financial institutions that enabled theaccumulation of savings and/or offered small loans. However,little finance is available for the poor in the South. Severalexamples from different countries all point to the highdependency of the poor upon non-mortgage sources ofhousing finance.
In India, according to the National Statistical Survey’s(NSS’s) 44th round survey, more than 80 per cent of housingfinance comes from private savings, sale of assets and non-formal sources of credit.16 In a number of households studiedin Hyderabad, 45 per cent of those living in 13 low-incomesettlements were in debt for housing (but less than 2 percent borrowed from formal financial institutions).17 This ishigher than that reported in low-income settlements inAmritsar, where it was estimated that 10 per cent of thecredit taken out by low-income households was for housing.18
A further example comes from South Africa, a country widelynoted for having an extended financial sector. As noted inthe discussion of mortgage finance, within one group of lowto lower-middle earners in South Africa, only 38 per cent hadapplied for finance, with 13 per cent being successful.19 Forthose unable to secure mortgages, in the non-mortgage
Low- and manymiddle-income
urban households in the South use
incrementalstrategies
99Small loans: shelter microfinance
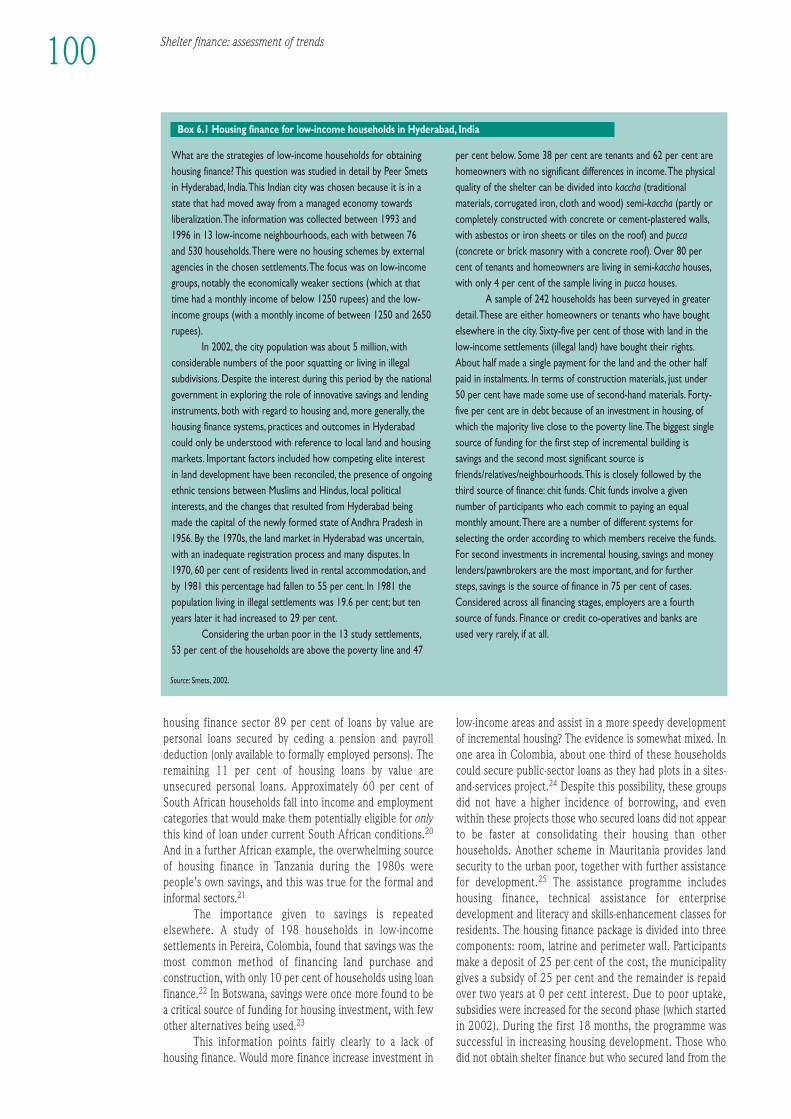
housing finance sector 89 per cent of loans by value arepersonal loans secured by ceding a pension and payrolldeduction (only available to formally employed persons). Theremaining 11 per cent of housing loans by value areunsecured personal loans. Approximately 60 per cent ofSouth African households fall into income and employmentcategories that would make them potentially eligible for onlythis kind of loan under current South African conditions.20
And in a further African example, the overwhelming sourceof housing finance in Tanzania during the 1980s werepeople’s own savings, and this was true for the formal andinformal sectors.21
The importance given to savings is repeatedelsewhere. A study of 198 households in low-incomesettlements in Pereira, Colombia, found that savings was themost common method of financing land purchase andconstruction, with only 10 per cent of households using loanfinance.22 In Botswana, savings were once more found to bea critical source of funding for housing investment, with fewother alternatives being used.23
This information points fairly clearly to a lack ofhousing finance. Would more finance increase investment in
low-income areas and assist in a more speedy developmentof incremental housing? The evidence is somewhat mixed. Inone area in Colombia, about one third of these householdscould secure public-sector loans as they had plots in a sites-and-services project.24 Despite this possibility, these groupsdid not have a higher incidence of borrowing, and evenwithin these projects those who secured loans did not appearto be faster at consolidating their housing than otherhouseholds. Another scheme in Mauritania provides landsecurity to the urban poor, together with further assistancefor development.25 The assistance programme includeshousing finance, technical assistance for enterprisedevelopment and literacy and skills-enhancement classes forresidents. The housing finance package is divided into threecomponents: room, latrine and perimeter wall. Participantsmake a deposit of 25 per cent of the cost, the municipalitygives a subsidy of 25 per cent and the remainder is repaidover two years at 0 per cent interest. Due to poor uptake,subsidies were increased for the second phase (which startedin 2002). During the first 18 months, the programme wassuccessful in increasing housing development. Those whodid not obtain shelter finance but who secured land from the
100 Shelter finance: assessment of trends
Box 6.1 Housing finance for low-income households in Hyderabad, India
Source: Smets, 2002.
What are the strategies of low-income households for obtaininghousing finance? This question was studied in detail by Peer Smetsin Hyderabad, India.This Indian city was chosen because it is in astate that had moved away from a managed economy towardsliberalization.The information was collected between 1993 and1996 in 13 low-income neighbourhoods, each with between 76and 530 households.There were no housing schemes by externalagencies in the chosen settlements.The focus was on low-incomegroups, notably the economically weaker sections (which at thattime had a monthly income of below 1250 rupees) and the low-income groups (with a monthly income of between 1250 and 2650rupees).
In 2002, the city population was about 5 million, withconsiderable numbers of the poor squatting or living in illegalsubdivisions. Despite the interest during this period by the nationalgovernment in exploring the role of innovative savings and lendinginstruments, both with regard to housing and, more generally, thehousing finance systems, practices and outcomes in Hyderabadcould only be understood with reference to local land and housingmarkets. Important factors included how competing elite interestin land development have been reconciled, the presence of ongoingethnic tensions between Muslims and Hindus, local politicalinterests, and the changes that resulted from Hyderabad beingmade the capital of the newly formed state of Andhra Pradesh in1956. By the 1970s, the land market in Hyderabad was uncertain,with an inadequate registration process and many disputes. In1970, 60 per cent of residents lived in rental accommodation, andby 1981 this percentage had fallen to 55 per cent. In 1981 thepopulation living in illegal settlements was 19.6 per cent; but tenyears later it had increased to 29 per cent.
Considering the urban poor in the 13 study settlements,53 per cent of the households are above the poverty line and 47
per cent below. Some 38 per cent are tenants and 62 per cent arehomeowners with no significant differences in income.The physicalquality of the shelter can be divided into kaccha (traditionalmaterials, corrugated iron, cloth and wood) semi-kaccha (partly orcompletely constructed with concrete or cement-plastered walls,with asbestos or iron sheets or tiles on the roof) and pucca(concrete or brick masonry with a concrete roof). Over 80 percent of tenants and homeowners are living in semi-kaccha houses,with only 4 per cent of the sample living in pucca houses.
A sample of 242 households has been surveyed in greaterdetail.These are either homeowners or tenants who have boughtelsewhere in the city. Sixty-five per cent of those with land in thelow-income settlements (illegal land) have bought their rights.About half made a single payment for the land and the other halfpaid in instalments. In terms of construction materials, just under50 per cent have made some use of second-hand materials. Forty-five per cent are in debt because of an investment in housing, ofwhich the majority live close to the poverty line.The biggest singlesource of funding for the first step of incremental building issavings and the second most significant source isfriends/relatives/neighbourhoods.This is closely followed by thethird source of finance: chit funds. Chit funds involve a givennumber of participants who each commit to paying an equalmonthly amount.There are a number of different systems forselecting the order according to which members receive the funds.For second investments in incremental housing, savings and moneylenders/pawnbrokers are the most important, and for furthersteps, savings is the source of finance in 75 per cent of cases.Considered across all financing stages, employers are a fourthsource of funds. Finance or credit co-operatives and banks areused very rarely, if at all.
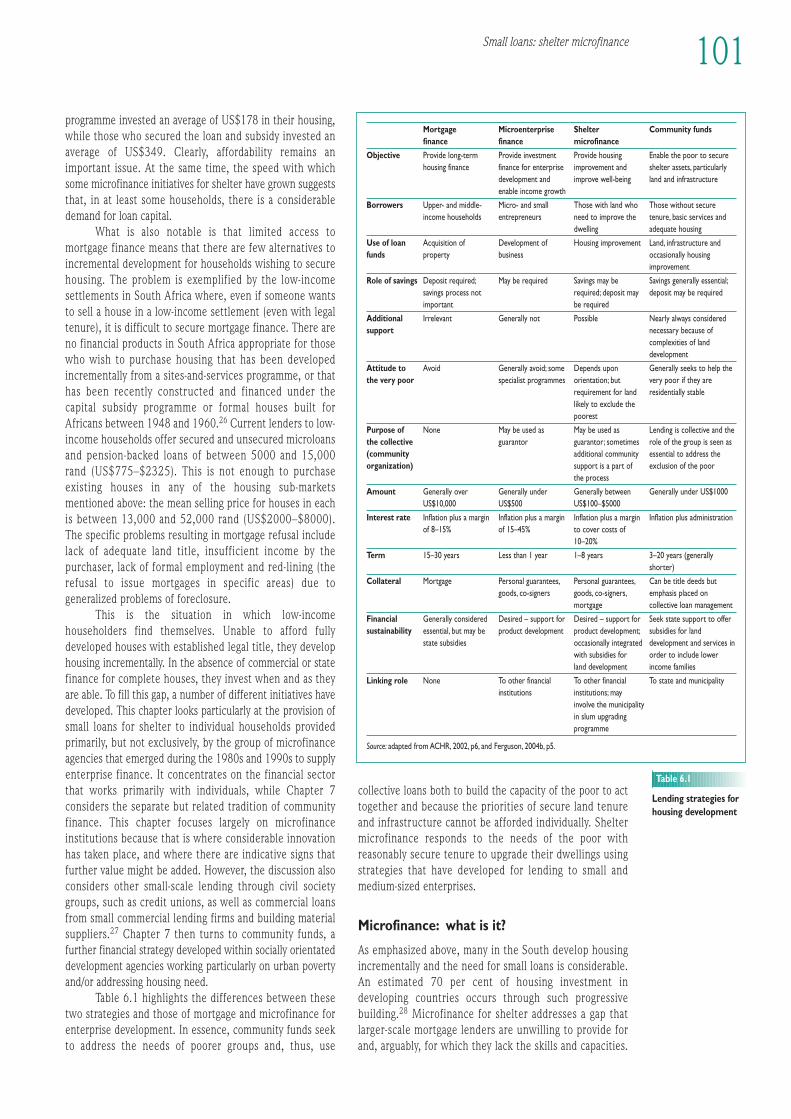
programme invested an average of US$178 in their housing,while those who secured the loan and subsidy invested anaverage of US$349. Clearly, affordability remains animportant issue. At the same time, the speed with whichsome microfinance initiatives for shelter have grown suggeststhat, in at least some households, there is a considerabledemand for loan capital.
What is also notable is that limited access tomortgage finance means that there are few alternatives toincremental development for households wishing to securehousing. The problem is exemplified by the low-incomesettlements in South Africa where, even if someone wantsto sell a house in a low-income settlement (even with legaltenure), it is difficult to secure mortgage finance. There areno financial products in South Africa appropriate for thosewho wish to purchase housing that has been developedincrementally from a sites-and-services programme, or thathas been recently constructed and financed under thecapital subsidy programme or formal houses built forAfricans between 1948 and 1960.26 Current lenders to low-income households offer secured and unsecured microloansand pension-backed loans of between 5000 and 15,000rand (US$775–$2325). This is not enough to purchaseexisting houses in any of the housing sub-marketsmentioned above: the mean selling price for houses in eachis between 13,000 and 52,000 rand (US$2000–$8000).The specific problems resulting in mortgage refusal includelack of adequate land title, insufficient income by thepurchaser, lack of formal employment and red-lining (therefusal to issue mortgages in specific areas) due togeneralized problems of foreclosure.
This is the situation in which low-incomehouseholders find themselves. Unable to afford fullydeveloped houses with established legal title, they develophousing incrementally. In the absence of commercial or statefinance for complete houses, they invest when and as theyare able. To fill this gap, a number of different initiatives havedeveloped. This chapter looks particularly at the provision ofsmall loans for shelter to individual households providedprimarily, but not exclusively, by the group of microfinanceagencies that emerged during the 1980s and 1990s to supplyenterprise finance. It concentrates on the financial sectorthat works primarily with individuals, while Chapter 7considers the separate but related tradition of communityfinance. This chapter focuses largely on microfinanceinstitutions because that is where considerable innovationhas taken place, and where there are indicative signs thatfurther value might be added. However, the discussion alsoconsiders other small-scale lending through civil societygroups, such as credit unions, as well as commercial loansfrom small commercial lending firms and building materialsuppliers.27 Chapter 7 then turns to community funds, afurther financial strategy developed within socially orientateddevelopment agencies working particularly on urban povertyand/or addressing housing need.
Table 6.1 highlights the differences between thesetwo strategies and those of mortgage and microfinance forenterprise development. In essence, community funds seekto address the needs of poorer groups and, thus, use
collective loans both to build the capacity of the poor to acttogether and because the priorities of secure land tenureand infrastructure cannot be afforded individually. Sheltermicrofinance responds to the needs of the poor withreasonably secure tenure to upgrade their dwellings usingstrategies that have developed for lending to small andmedium-sized enterprises.
Microfinance: what is it?
As emphasized above, many in the South develop housingincrementally and the need for small loans is considerable.An estimated 70 per cent of housing investment indeveloping countries occurs through such progressivebuilding.28 Microfinance for shelter addresses a gap thatlarger-scale mortgage lenders are unwilling to provide forand, arguably, for which they lack the skills and capacities.
101Small loans: shelter microfinance
Mortgage Microenterprise Shelter Community fundsfinance finance microfinance
Objective Provide long-term Provide investment Provide housing Enable the poor to secure housing finance finance for enterprise improvement and shelter assets, particularly
development and improve well-being land and infrastructure enable income growth
Borrowers Upper- and middle- Micro- and small Those with land who Those without secure income households entrepreneurs need to improve the tenure, basic services and
dwelling adequate housing
Use of loan Acquisition of Development of Housing improvement Land, infrastructure and funds property business occasionally housing
improvement
Role of savings Deposit required; May be required Savings may be Savings generally essential;savings process not required; deposit may deposit may be requiredimportant be required
Additional Irrelevant Generally not Possible Nearly always considered support necessary because of
complexities of land development
Attitude to Avoid Generally avoid; some Depends upon Generally seeks to help the the very poor specialist programmes orientation; but very poor if they are
requirement for land residentially stablelikely to exclude the poorest
Purpose of None May be used as May be used as Lending is collective and the the collective guarantor guarantor; sometimes role of the group is seen as (community additional community essential to address the organization) support is a part of exclusion of the poor
the process
Amount Generally over Generally under Generally between Generally under US$1000US$10,000 US$500 US$100–$5000
Interest rate Inflation plus a margin Inflation plus a margin Inflation plus a margin Inflation plus administrationof 8–15% of 15–45% to cover costs of
10–20%
Term 15–30 years Less than 1 year 1–8 years 3–20 years (generally shorter)
Collateral Mortgage Personal guarantees, Personal guarantees, Can be title deeds but goods, co-signers goods, co-signers, emphasis placed on
mortgage collective loan management
Financial Generally considered Desired – support for Desired – support for Seek state support to offer sustainability essential, but may be product development product development; subsidies for land
state subsidies occasionally integrated development and services in with subsidies for order to include lower land development income families
Linking role None To other financial To other financial To state and municipality institutions institutions; may
involve the municipality in slum upgrading programme
Source: adapted from ACHR, 2002, p6, and Ferguson, 2004b, p5.
Lending strategies forhousing development
Table 6.1

The main issues discussed in this section are the growth ofshelter microfinance, including the sources of funding, theterms and conditions of lending and the challenges that thissector faces.
Microfinance for shelter offers small loans suitablefor significant housing improvements. Terms and conditionsare summarized in Table 6.2. Loan sizes are betweenUS$1000 and US$5000, although they may be smaller insome countries where construction costs are lower and/orbuilding standards do not prevent low-cost housing options.Loan terms are generally between one and eight years,although in most cases they are at the shorter end of thisrange. Hence, although these loans are often given byexisting microfinance lenders and are seen as falling withinthis category of financial services, they are oftenconsiderably larger than enterprise loans (especially thosetaken by new borrowers when entering this market).29
Security conditions vary considerably depending uponlocal circumstances. In some cases, they are similar to thoserequired for enterprise development (that is, groupguarantees and co-signers). In other cases, they involveholding the para-legal documents to the property and othernon-mortgage collateral. Some shelter microfinance lendersfollow a process similar to that of a conventional mortgagefor larger loans. The Consultative Group to Assist the Poor(CGAP) is a consortium of 28 public and privatedevelopment agencies seeking to expand access to financialservices (microfinance) for the poor in the South. In 2004,they recognized the significance of shelter microfinancewith a briefing for members.
Loans are generally taken to build additional rooms(often turning space constructed using wood and traditionalmaterials into concrete built structures), improve roofs andfloors, and add kitchens and toilets. Investing in improvedfacilities is very popular and the Self-employed Women’sAssociation (SEWA) in India estimates that ‘almost 35 percent of housing loans from SEWA Bank are utilized forinstalling infrastructure, such as a private water connectionor toilet’.30 The emphasis is very much on improvements forhomeowners. The terms and conditions of microfinancelending in the context of incremental development favourthose who already have some degree of tenure security andhousing structure. For this reason, these loans are oftenreferred to as housing loans, or housing microfinance. Insome cases, they are also for land – for example, theGrameen Bank will lend for land purchase if the borrowerdoes not have legal tenure. However, lending for land
purchase is much less likely because of the high costs andother problems with individualized solutions to tenure andinfrastructure needs, and because some degree of landsecurity may be a prerequisite for such a loan.
There is a vibrant rental market in many low-incomesettlements in most Southern cities. Such rental activitiesare, in general, informal; in addition to the fact that theincome is not taxed or declared, the rental agreements aremanaged outside of the formal legal system. Tenants may beparticularly vulnerable and may face difficult terms andconditions, with few alternative affordable options. Theygenerally enjoy restricted access to services.31 In somecases, microfinance loans are used by the landlords toconstruct additional rooms for rent. However, there is notmuch information about such purposes and it does notappear to be happening at scale. In one housing loan schemein low-income settlements in Mauritania, two-thirds ofhouseholds used the home for some kind of enterpriseactivity, including renting space. The percentage rentingspace to others among the group who took housing loans istwice the percentage of those who did not take loans – butit still remains low at 6 per cent of households.32 In a fewcases, small loan programmes have been orientated towardsthe landlord sector to improve the living conditions oftenants. However, there are relatively few intentionalinitiatives of this kind. One difficult issue is that, althoughthe project may be intended to improve living conditions fortenants, in practice, the improvements may be associatedwith rent increases and the displacement of one (poorer)group of tenants by another (higher income group). Box 6.2describes a small revolving fund in Kitale, Kenya, whichoffers loans for improved sanitation to plot owners, many ofwhom are also renting rooms. The objective is to improveenvironmental health, although the risk of potential rentincreases and the displacement of tenants is recognized.
THE GROWTH OFMICROFINANCE FORSHELTERThe growth of microfinance agencies since their inceptionduring the 1980s has been considerable and there are nowmany such organizations. To exemplify the situation in onecountry, in India the number of such grassroots-levelorganizations engaged in mobilizing savings and providingmicroloan services to the poor is estimated to be in therange of 400 to 500 organizations.33 However, some 60million families in India (approximately 36 per cent of thecountry’s population) are in need of financial services, whilethe cumulative outreach by microfinance agencies is nomore than 1.5 million households (2.5 per cent).34
The developments in shelter microfinance follow thedevelopment of a growing microfinance sector. During the1980s, several agencies demonstrated success in offeringsmall loans for enterprise development. The underlying andemerging argument was that small entrepreneurs wereconstrained by a lack of credit. The availability of credit, itwas argued, would enable businesses to expand and
Sheltermicrofinanceresponds to theneeds of the poorwith reasonablysecure tenure toupgrade theirdwellings
Microfinance forshelter addresses agap that larger-scalemortgage lendersare unwilling toprovide for
102 Shelter finance: assessment of trends
Size Varies, but generally two to four times larger than average working capital loans
Term Usually 2 to 24 months for home improvements and two to five years for land purchase or construction
Interest Same as standard working capital loans or slightly lower
Delivery method Almost always provided to individuals rather than to groups
Collateral Mostly unsecured; co-signers often used; real guarantees may be used; formal ownership of dwelling or land may be required; savings sometimes used as guarantee (may be compulsory)
Target clientele Low-income salaried workers; microentrepreneurs primarily in urban areas; poor people
Other services Sometimes accompanied by land acquisition, land registration and construction (including self-help building techniques)
Source: CGAP, 2004.
Consultative Group toAssist the Poor(CGAP): typical termsand conditions forshelter microfinance
Table 6.2
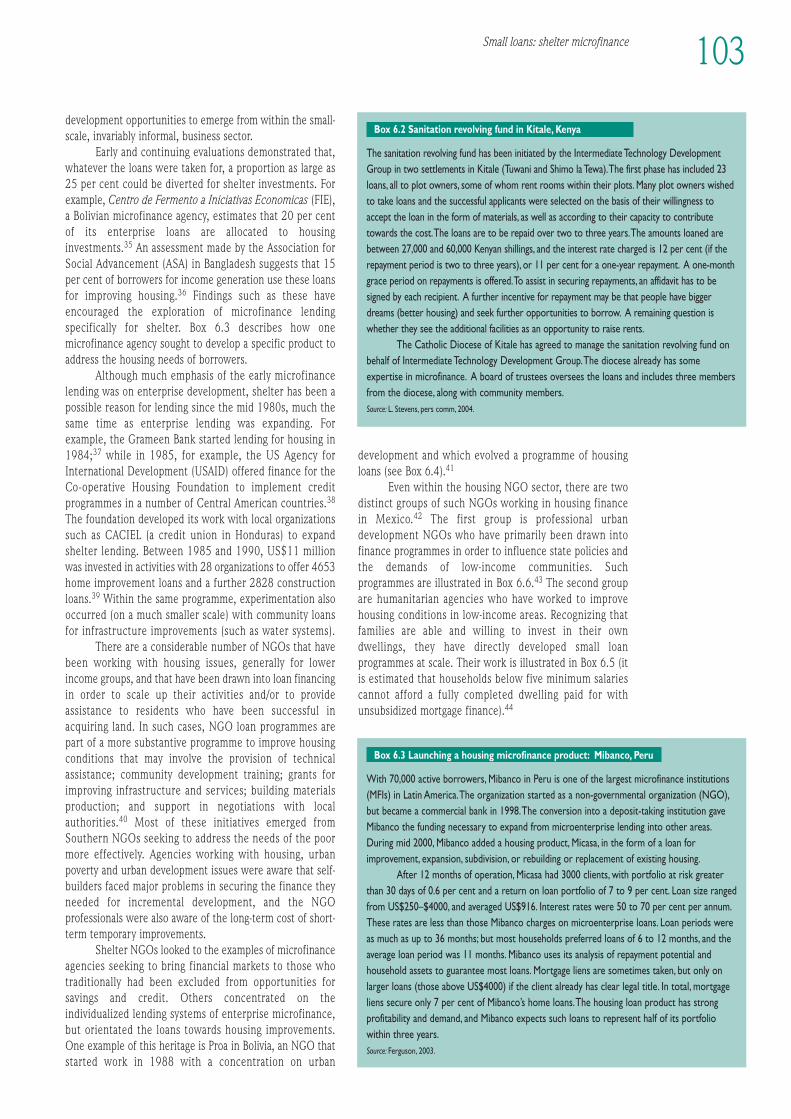
development opportunities to emerge from within the small-scale, invariably informal, business sector.
Early and continuing evaluations demonstrated that,whatever the loans were taken for, a proportion as large as25 per cent could be diverted for shelter investments. Forexample, Centro de Fermento a Iniciativas Economicas (FIE),a Bolivian microfinance agency, estimates that 20 per centof its enterprise loans are allocated to housinginvestments.35 An assessment made by the Association forSocial Advancement (ASA) in Bangladesh suggests that 15per cent of borrowers for income generation use these loansfor improving housing.36 Findings such as these haveencouraged the exploration of microfinance lendingspecifically for shelter. Box 6.3 describes how onemicrofinance agency sought to develop a specific product toaddress the housing needs of borrowers.
Although much emphasis of the early microfinancelending was on enterprise development, shelter has been apossible reason for lending since the mid 1980s, much thesame time as enterprise lending was expanding. Forexample, the Grameen Bank started lending for housing in1984;37 while in 1985, for example, the US Agency forInternational Development (USAID) offered finance for theCo-operative Housing Foundation to implement creditprogrammes in a number of Central American countries.38
The foundation developed its work with local organizationssuch as CACIEL (a credit union in Honduras) to expandshelter lending. Between 1985 and 1990, US$11 millionwas invested in activities with 28 organizations to offer 4653home improvement loans and a further 2828 constructionloans.39 Within the same programme, experimentation alsooccurred (on a much smaller scale) with community loansfor infrastructure improvements (such as water systems).
There are a considerable number of NGOs that havebeen working with housing issues, generally for lowerincome groups, and that have been drawn into loan financingin order to scale up their activities and/or to provideassistance to residents who have been successful inacquiring land. In such cases, NGO loan programmes arepart of a more substantive programme to improve housingconditions that may involve the provision of technicalassistance; community development training; grants forimproving infrastructure and services; building materialsproduction; and support in negotiations with localauthorities.40 Most of these initiatives emerged fromSouthern NGOs seeking to address the needs of the poormore effectively. Agencies working with housing, urbanpoverty and urban development issues were aware that self-builders faced major problems in securing the finance theyneeded for incremental development, and the NGOprofessionals were also aware of the long-term cost of short-term temporary improvements.
Shelter NGOs looked to the examples of microfinanceagencies seeking to bring financial markets to those whotraditionally had been excluded from opportunities forsavings and credit. Others concentrated on theindividualized lending systems of enterprise microfinance,but orientated the loans towards housing improvements.One example of this heritage is Proa in Bolivia, an NGO thatstarted work in 1988 with a concentration on urban
development and which evolved a programme of housingloans (see Box 6.4).41
Even within the housing NGO sector, there are twodistinct groups of such NGOs working in housing financein Mexico.42 The first group is professional urbandevelopment NGOs who have primarily been drawn intofinance programmes in order to influence state policies andthe demands of low-income communities. Suchprogrammes are illustrated in Box 6.6.43 The second groupare humanitarian agencies who have worked to improvehousing conditions in low-income areas. Recognizing thatfamilies are able and willing to invest in their owndwellings, they have directly developed small loanprogrammes at scale. Their work is illustrated in Box 6.5 (itis estimated that households below five minimum salariescannot afford a fully completed dwelling paid for withunsubsidized mortgage finance).44
103Small loans: shelter microfinance
Box 6.2 Sanitation revolving fund in Kitale, Kenya
The sanitation revolving fund has been initiated by the Intermediate Technology DevelopmentGroup in two settlements in Kitale (Tuwani and Shimo la Tewa).The first phase has included 23loans, all to plot owners, some of whom rent rooms within their plots. Many plot owners wishedto take loans and the successful applicants were selected on the basis of their willingness toaccept the loan in the form of materials, as well as according to their capacity to contributetowards the cost.The loans are to be repaid over two to three years.The amounts loaned arebetween 27,000 and 60,000 Kenyan shillings, and the interest rate charged is 12 per cent (if therepayment period is two to three years), or 11 per cent for a one-year repayment. A one-monthgrace period on repayments is offered.To assist in securing repayments, an affidavit has to besigned by each recipient. A further incentive for repayment may be that people have biggerdreams (better housing) and seek further opportunities to borrow. A remaining question iswhether they see the additional facilities as an opportunity to raise rents.
The Catholic Diocese of Kitale has agreed to manage the sanitation revolving fund onbehalf of Intermediate Technology Development Group.The diocese already has someexpertise in microfinance. A board of trustees oversees the loans and includes three membersfrom the diocese, along with community members.Source: L. Stevens, pers comm, 2004.
Box 6.3 Launching a housing microfinance product: Mibanco, Peru
With 70,000 active borrowers, Mibanco in Peru is one of the largest microfinance institutions(MFIs) in Latin America.The organization started as a non-governmental organization (NGO),but became a commercial bank in 1998.The conversion into a deposit-taking institution gaveMibanco the funding necessary to expand from microenterprise lending into other areas.During mid 2000, Mibanco added a housing product, Micasa, in the form of a loan forimprovement, expansion, subdivision, or rebuilding or replacement of existing housing.
After 12 months of operation, Micasa had 3000 clients, with portfolio at risk greaterthan 30 days of 0.6 per cent and a return on loan portfolio of 7 to 9 per cent. Loan size rangedfrom US$250–$4000, and averaged US$916. Interest rates were 50 to 70 per cent per annum.These rates are less than those Mibanco charges on microenterprise loans. Loan periods wereas much as up to 36 months; but most households preferred loans of 6 to 12 months, and theaverage loan period was 11 months. Mibanco uses its analysis of repayment potential andhousehold assets to guarantee most loans. Mortgage liens are sometimes taken, but only onlarger loans (those above US$4000) if the client already has clear legal title. In total, mortgageliens secure only 7 per cent of Mibanco’s home loans.The housing loan product has strongprofitability and demand, and Mibanco expects such loans to represent half of its portfoliowithin three years.Source: Ferguson, 2003.
However, it is also important to recognize that not allhousing and urban development NGOs have chosen todevelop financial services for housing. In Mumbai, forexample, at the end of the 1990s there were 18 NGOsaddressing issues broadly related to housing and communityfinance, but only four specifically providing housing loans.45
Urban development NGOs in Mexico have tended todevelop housing finance initiatives as exemplar projects, notnecessarily intending to take them to scale, but seeking to
use the experiences to influence the ways in which housingpolicy is being developed.46 This strategy extends wellbeyond Mexico, and many other NGOs who are advocatingfor more successful housing policies and strategies haveintroduced demonstration projects to show the effectivenessof small loan provision.47 Another significant and influentialgroup are the community organizations and theirrepresentatives, and NGO-initiated programmes have soughtto switch community demands away from clientalist favoursand towards effective development interventions that cango to scale. The Step-by-Step programme in Ecuador andPeru is a recent example of such a programme (see Box 6.6).
As illustrated by the Step-by-Step programme, in thecase of some NGO programmes the desire to influencepolicy is combined with a wish to respond to the needs ofthose seeking to improve their housing and to improveaccess to loan finance. Despite widespread discussions aboutthe value of microfinance, need remains acute, and in manycases there are few providers. In Ecuador there is a subsidyprogramme; but as illustrated in Box 6.6, the requirementfor a savings contribution means that it cannot be accessedby many low-income households.
A further illustration of the continuing responsivenessof the NGO sector is given by the launch of South Africa’sKuyasa Fund (see Box 6.12). In South Africa, there isconsiderable state subsidy for housing provision and acommercial banking sector that has been under significantpressure to expand lending to the poor. Hence, the contextappears to be one in which there are opportunities for low-income communities to secure both housing improvementsand financial services. Despite this apparently favourablecontext, there is a further need for small housing loans. ACape Town-based NGO, the Development Action Group,launched the Kuyasa Fund in 2001 after beginning trialhousing loans in 1999. It did so because the communitieswith whom it was working needed finance to upgrade theirdwellings, and there were few alternative accessible andaffordable sources of finance.
Links to formal financial agencies
During the 1980s, some programmes had the explicitintention of preparing their clients for entry into formalhousing finance either in the short or the longer term.48
There was an underlying expectation that the poor couldborrow from the formal financial systems once appropriatemodifications had been identified and implemented. Forexample, in the case of the Central American programmessupported by the Swedish International DevelopmentAgency (SIDA), links have been sought. However, in practice,it has proved difficult to convince such formal financialinstitutions that they should participate in direct lending;this is due, in part, to the small loan size and associated highadministration costs.49 Generally, this expectation haschanged and there is now greater recognition that it mightbe preferable to build significant institutions that specializein small loans. Such institutions might link to the moreformal commercial financial institutions to secure capital;but the formal financial institutions would not be expectedto interact directly with the poor.
104 Shelter finance: assessment of trends
Box 6.4 Proa: learning how to offer shelter loans
When the non-governmental organization (NGO) Proa in Bolivia moved into housing financein 1991, its original strategy was small loans for home improvements using solidarity groups toguarantee repayments. For this and subsequent strategies, it secured funding from Mutual LaPaz, a mutual savings association.This first strategy failed and Proa was forced to cover some ofthe losses with Mutual La Paz; however, there was an enthusiasm to carry on.
The second strategy was to use some form of individual guarantee usinglandownership.The costs (and time) of registering a mortgage with the Office of PropertyRights were considered too high; but even without this measure some claim over the propertycould be secured. In addition, procedures to follow up repayments were strengthened.Thissystem worked relatively well and a refined, but broadly similar, strategy was introduced in1993.
Most loans are for housing improvements including access to water and sanitationservices. However, some are for the regularization of properties and new construction by smallcontractors. One measure of success has been that foreclosure and late payment rates arenow below those for Mutual La Paz’s overall mortgage lending and are low for Bolivia.Repayments that are more than 90 days late account for 1.09 per cent of the portfoliocompared to 4.1 per cent for Mutual La Paz’s middle- to higher income mortgage lending.Source: Ferguson, 1999, p193.
Box 6.5 Humanitarian housing interventions in Mexico
One of the most significant of the humanitarian housing agencies operating in Mexico isHabitat para la Humanidad México A.C., the Mexican branch of Habitat for Humanity.This agencybegan operating in Mexico in 1987 and currently works in the federal district and 13 otherstates, with 20 active affiliate groups.The organization provides credit to previously formedmutual aid groups of selected families, who supply the labour for their own and other groupmembers’ house construction on their own land. Until now, it has financed 14,388 houses in600 communities in both rural and urban areas.
Another non-governmental organization (NGO) which provides home improvementsfinance for workers in the bonded industries (maquiladores) in Ciudad Juárez, on theMexico–US border, is Fundación Habitat y Vivienda A.C. (FUNHAVI).This was set up in 1996 as abranch of Co-operative Housing Foundation International with the help of a Ford Foundationdonation as seed capital. It is also sponsored by the Inter American Foundation, from which itreceived two loans for a total of US$500,000 last year and donations from local businesses. Itstarget population comprises homeowners earning between two and eight times the minimumwage, although the average income of beneficiaries was four minimum wages in 2001; 38 percent were women.The same source quotes that loans ranged from US$500 to $2500 (averageloans of US$1623), interest rates were 2.5 to 3 per cent a month, and a 2 per cent commissionis charged by the organisation, as well as a US$20 mandatory technical assistance fee.Thetechnical assistance provider or ‘architect’ decides what sort of loan is needed. Loan termsvary from 6 to 36 months, with repayments being paid monthly at the local supermarket chain,with which FUNHAVI has a special arrangement. Another special arrangement withconstruction material distributors enables FUNHAVI to purchase them at wholesale prices,although recipients of the loans have to buy them from FUNHAVI at retail prices; this covers11 per cent of FUNHAVI’s running costs.Source: Connolly, 2004b.
There remains the tradition of guarantee funds,although their use is somewhat limited to a few specificexamples, and scaling up such examples into regular practiceappears difficult.50 A number of NGOs have specificallysought to use guarantee fund strategies to release financialcapital from the formal (mainly commercial) financial sector.Such guarantee systems have a dual rationale. On the onehand, they are intended to build links between the formaland informal financial systems, encouraging further lending(with no or lower guarantee ratios) once a positiveexperience has occurred. Second, they are a way ofleveraging finance if the guarantee is accepted to be lessthan 100 per cent. Examples of guarantee funds include theLatin American and Asian Low-income Housing Service(SELAVIP), the Society for the Promotion of Area ResourceCentres (SPARC), Homeless International and a number ofother Southern NGOs. Such guarantees can be illustratedby SPARC (an Indian NGO), the state-financed Housing andUrban Development Corporation (HUDCO) and a housingco-operative in Dharavi (a large low-income area inMumbai).51 In this case, the funding was only released afterSPARC guaranteed the repayments (with the financialsupport of a Northern NGO) and 25 per cent was withheldfrom the first loan instalment as a contribution to interestpayments. More recently, SPARC has had more successfulexperiences based on the increasing interest of the private
sector to find a way of investing in the development of low-income urban areas.52 One experienced commentatorconcludes that despite difficulties around the release ofadditional finance for the local development activities ofNGOs and community organizations ‘it is too early to giveup on banks yet’.53
In this context, the more recent interest bycommercial financial agencies, such as the Colombian BancoDavivienda, in developing a small loan facility is notable.54
However, what is not yet clear is the extent to which thestate will have to support such initiatives. What is evidentfrom the following discussion is that the commercial bankingsector in some countries is seeking more involvement inwhat is considered to be a potentially profitable sector.
The microfinance institution (MFI)experience: enterprise to housing loans
In addition to NGO initiatives, there has been considerableinterest in housing lending shown by the microfinancesector. It is difficult to assess the significance of the growthof microfinance agencies into small shelter lending, but itappears to be significant. For example, three significantmicrofinance agencies were profiled in a 1996 study when,at that time, none of them were working in housing.55 Fouryears later, two of the three were working in this area.
Microfinanceagencies appear to
be diversifyingrapidly into housing
micro-credit in atleast some regions
105Small loans: shelter microfinance
Box 6.6 Step-by-Step programme in Peru and Ecuador
Source: M.Vasconez, pers comm, 2004.
The Step-by-Step programme is located in Peru and Ecuador and isbeing implemented by Centro de Investigaciones (CIUDAD) andCentro de Escudios y Promoción del Desarrollo (DESCO), withcontributions from the European Union (EU), Centre for Ecologyand Development (KATE), Instituto de Estudios Políticos paraAmérica Latina y Africa (IEPALA),Alternativas Sostenibles deDesarrollo, España (ASDE) and La Asociación para la Cooperacióncon el Sur/Las Segovias (ACSUD-Las Segovias). Activities includethe establishment of a revolving loan fund with the relatedconstruction of safe and affordable housing through incrementaldevelopment and the promotion of savings among participants.Therevolving loan fund for shelter production seeks to establish acredit system that is adaptable to, and appropriate for, the needs ofself-building families.Technical assistance in the building ofaffordable, healthy and safe houses is also being provided.Trainingprogrammes for the people involved in the construction of low-income housing are offered, together with the dissemination ofgood practices on progressive shelter financing schemes through atraining and dissemination centre. In addition to the direct benefits,a further intention is to improve housing policies for low-incomefamilies through the targeted dissemination of the programme’sachievements.
The total budget for the programme is 1.8 million Euros. InPeru, the project is taking place in Villa el Salvador (part ofmetropolitan Lima), with its 1 million residents. In Ecuador, theproject is located in Quito, Riobamba,Alausí and Cotacachi. Intotal, 0.54 million Euros are allocated to the revolving fund and it isanticipated that just over 2000 loans will be provided.
In Ecuador there is a national housing subsidy system thatoffers families a grant of US$1800. However, families have to beable to save 10 per cent of the value of the house to qualify, andexperience suggests that it is difficult to save the required amount.Generally, they are not eligible for loans and they do not trustformal credit institutions. As a result, one use of the revolving fundis for the down payment to secure the subsidy. Additional uses arepart payment for new houses in existing housing programmes,housing improvement, down payments or deposits for commercialloans and providing community facilities.
Local financial strategies involving the fund can beexemplified through the women’s association Luchando por la Vida.The 36 families have an average income of US$185 per month,with 94 per cent of households falling below the official povertyline (US$360 per month).The housing programme involves theconstruction of 6 buildings and 36 apartments (of 60 squaremetres at a unit cost of US$5100).The total costs are paid thus: 33per cent by the government housing subsidy and 67 per cent bythe families (using a combination of savings, commercial loan and aStep-by-Step deposit to access the housing subsidy).
From 2001 to 2004, Step-by-Step in Ecuador has grantedmore than 930 loans and 550 families have secured new houses ofgood quality. In addition, 62 per cent of the users of the loans arewomen, and 72 per cent of families who have secured housesthrough the programme have incomes below the poverty line.Step-by-Step’s loans (for a total amount of US$750,000) havealready mobilized more than US$2.5 million from governmentsubsidy (25 per cent) and private bank loans (75 per cent).
Microfinance agencies appear to be diversifying rapidly intohousing microcredit in at least some regions.
Over the last three years, most leading microfinanceagencies in Latin America and the Hispanic Caribbean haveestablished a housing product. Cases in point include BancoSol in Bolivia, Banco Solidario in Ecuador, Mibanco in Peru,Banco Ademi in the Dominican Republic, Calpia inHonduras, and Genesis Empresarial in Guatemala.56
One study funded by the International FinanceCorporation (IFC) identifies 141 institutions providingshelter-finance loan products to the poor.57 Another, focusingon Latin America, identifies 57 microfinance agencies asoffering housing loans, just under 30 per cent of the totalnumber of such institutions.58 Of these agencies, about 18per cent of their total loan portfolio is related to housingloans, amounting to about US$160 million.59 Among the 27financial institutions in the Accion Network, seven havehousing portfolios totalling almost 10,000 active clients andUS$20 million in outstanding balances.
The speed with which housing loans have beenintegrated within such agencies appears to have beenfacilitated by the similarity of lending practice. For example,in the case of one Peruvian agency, Mibanco, adding a homeimprovement loan product was easier than originallyanticipated.60 Traditional microfinance agencies treat housingloans broadly as they treat microenterprise lending, withsmall repeat loans that are not (in many cases) conditionalupon collateral.
Reasons for expansion of MFIs into housing
One reason for the diversification of microfinance agenciesinto housing is commercial advantage. Such diversificationmay increase the financial stability of their loan portfolio,enable them to take advantage of opportunities for growth,and avoid losing clients to other microfinance agencies thatprovide housing loans.61 A further notable advantage is thatthe longer repayment period associated with housing loanshelps to draw the borrowers into a longer-term relationshipwith the lending agency and increases the likelihood thatfurther loans will be taken (for example, for enterprisedevelopment). Thus, lending for land and housing hascommercial benefits for a microfinance industry seeking toextend its niche and strengthen performance. The need fordiversification may be particularly important in countriessuch as El Salvador and Bolivia, in which microfinanceagencies are facing considerable competition for clients.62
It appears likely that there is significant scope forexpansion, at least in most of Latin America and Asia. Giventhe scale of housing need, microfinance for shelter remainssignificantly underdeveloped in many countries in whichmarket conditions appear favourable, such as Mexico andBrazil.63 In Central America, the SIDA has been financing anumber of market assessment studies to identify whatpeople want, both in terms of demand for housing loans andother financial services beyond credit.64 Generally, demandhas been diverse and has included infrastructure loans, aswell as demand for microinsurance and housing. The marketmay also be significant in Africa; but it is likely that theincome group will be different. In Africa, where many of themiddle class may not be able to access formal loans due toland title problems, microfinance may not reach down theincome groups so far and scale may be smaller but stillvaluable. Box 6.7 summarizes a recent analysis of thepotential for growth in a number of countries. Theseassessments are only indicative of potential. However, theyillustrate some of the reasoning that lies behind newinitiatives in shelter microfinance.
Neighbourhood improvement (slum upgrading)
A further potential role for shelter microfinance is withinmore comprehensive slum upgrading programmes. Thereappears to be a growing interest in using microfinanceagencies to provide specialist financial services within morecomprehensive neighbourhood improvement and povertyreduction programmes. Within this strategy, thedevelopment agency, central government and/ormunicipality finances a process to upgrade the low-incomearea with components to regularize tenure and provideand/or upgrade infrastructure and services. The upgradingprogramme then contracts with an organization to offersmall-scale housing loans for those who wish to upgradetheir homes. At the broadest level, such programmes aresimilar to best practice elsewhere, involving localgovernment and public–private partnerships to addresshousing and community development activities.65
A further potentialrole for sheltermicrofinance iswithin morecomprehensive slumupgradingprogrammes
106 Shelter finance: assessment of trends
Box 6.7 Assessing the demand for housing finance
Demand for housing and small-scale lending for housing investment is likely to increase, as isillustrated by the following examples:
• Peru: 82 per cent of the 8 million people living in greater Lima are classified as poor. Atleast half of poor households and 60 per cent of the poorest households express astrong desire to expand or improve their home within the next 12 months. Only 10 to15 per cent are borrowing from formal or informal sources.The potential market inmetropolitan Lima for housing finance loans is estimated at 610,000 homeimprovements annually.
• Indonesia: during 2000, the country’s urban population of 85 million already represented40 per cent of the total. By 2010 it will represent 50 per cent, with 120 million people.Annual projections for housing needs for the next ten years are approximately 735,000new units and an additional 420,000 in need of improvement. An estimated 70 to 80per cent of all housing in Indonesia is constructed informally and incrementally, withminimal access to formal financial markets.
• Morocco: two surveys found that 88 per cent of households have or are planning aproductive activity in the home, and more than 83 per cent of households are willingto take a loan to finance home improvement. Ninety-two per cent of urban and 94 percent of rural households constructed their own homes without access to formalfinance.
• Mexico: one market study of microfinance in three Mexican cities (Tijuana, Matamorosand Juarez) bordering the US found that 14 per cent of all households both qualifiedfor and wanted housing microcredit at terms of 35 per cent amortized over threeyears.The effective demand for shelter microfinance (US$122 million) amounted to fivetimes that for microenterprise loans (US$20 million) in these cities.
Source: Malhotra, 2003, pp218–219.
A number of different variants of this model havedeveloped. Box 6.8 describes the Local DevelopmentProgramme (Programa de Desarollo Local, or PRODEL) inNicaragua that was set up to enhance development insmaller towns and cities with a number of components,including infrastructure improvements, housing loans andloans for microenterprises. The activities received thesupport of SIDA, who signed an agreement with theNicaraguan government in 1993 for the implementation ofa programme to address basic needs and supportdevelopment in a number of urban centres. In this case, theprogramme worked with Banco Crédito Popular, a statecommercial bank, and selected two existing NGOs,Asociacíon de Consultores para el Desarrollo de la Pequeña,Mediana y Microempresa (ACODEP) and Nilapán-FDL, bothof whom were already active in lending for micro-enterprises and who wished to expand their activities.66
Although the physical areas for the different components ofthe programme do not necessarily overlap exactly, thecumulative effects are illustrated by the change in thenumber of those receiving housing loans who have landtitles. In 1994, only 15 per cent of those receiving housingloans had title deeds; in 2002, the figure had increased to73 per cent as the titling programme expanded.67 Althoughcommunities do not pay directly for the improvements in
basic services and infrastructure, they contribute self-helpestimated at 13 per cent of the costs.
A more focused (and smaller-scale approach) isillustrated in Ahmedabad, India, where the Slum NetworkingProject (undertaken within the municipality) wished toinclude a credit component to help households afford tocontribute to infrastructure improvements. In establishingthis programme, they drew upon the local expertise of SEWA,a local agency lending to the poor. More recently, theParivartan Programme has been established to upgrade slumsin and around Ahmedabad through the joint participation ofgovernment entities, NGOs, the private sector and low-income residents themselves. The programme was initiatedby the Slum Networking Cell within the Ahmedabad citygovernment. Parivartan means ‘transformation’ in Gujarati andHindi. The programme seeks to offer improved infrastructureand better communication between the local residents andthe authorities. It provides a water supply to every house, anunderground sewerage connection, toilets in the home andan efficient storm water drainage system. Further benefits arestreet lighting, paved roads and pathways and basiclandscaping, together with solid waste management. Costsare divided between the residents (2000 rupees, or US$42)and the municipality (8000 rupees, or US$170). SEWA helpsthe lower income residents with loans.68
107Small loans: shelter microfinance
Box 6.8 The local development programme (PRODEL) in Nicaragua
Source: Stein, 2004, pp117–118; PRODEL, 2004.
In order to address the need to improve the physical environmentand the socio-economic conditions of the poor in Nicaragua,Programa de Desarollo Local (PRODEL), a local developmentprogramme, established the following kinds of support:
• infrastructure and community works, including theintroduction, expansion, repair and improvement ofinfrastructure and services through small-scale projectscosting up to US$50,000;
• housing improvement through small loans (of betweenUS$200–$1400) targeted at low-income families who canafford to enlarge and improve houses and to repay theirloans;
• financial assistance to microenterprises with small short-term loans (of between US$300–$1500) for fixed andworking capital; these loans are directed, in particular, atmicroenterprises owned and operated by women; and
• technical assistance and institutional development tostrengthen the capacities of local governments andencourage institutionalized financial entities to becomeinvolved in non-conventional lending programmes forhousing improvements and microenterprise loans.
Between April 1994 and December 1998, 260 infrastructure andcommunity projects were carried out in 155 differentneighbourhoods, benefiting more than 38,000 families.Totalinvestment has been US$4.4 million (an average of US$16,972 perproject). Contributions from municipal governments and thebeneficiary communities (in kind, cash, materials, tools, labour,
administration and supervision) totalled 43.1 per cent, with theremaining 56.9 per cent coming from the programme.Thirty-fiveper cent of the projects were for improving roads, gutters andsidewalks; 10 per cent for improving and expanding potable waterand sewage systems; 14 per cent for rainwater and storm waterdrainage; 18 per cent for electrification (public lighting and/orhousehold connections); and 23 per cent addressed communityinfrastructure (including construction, improvement, expansion andrepair of primary schools, daycare centres, health centres, parksand playgrounds).The communities contributed approximately132,000 days of work to these 260 projects, both volunteer andpaid, using their own resources.
In five years, more than 4168 loans were given for housingimprovements (total disbursed funds reached US$2.7 million). By2003, the total had grown to over 11,000 loans and annualdisbursements during this year exceeded US$2.5 million.Thesebenefited approximately the same number of families. Familiescontributed their own resources, construction materials, labour,transportation and project administration to an amount equivalentto at least 15 per cent of the total value of the labour, transportand building materials. Seventy per cent of the families havemonthly incomes of US$200 or less, including many with monthlyincomes below US$100.
More than 12,451 loans to microentrepreneurs wereallocated to communities in which PRODEL is active, with almostUS$5.5 million being disbursed, benefiting approximately 2400existing families. Seventy new microenterprises have been created,giving jobs to some 210 people.
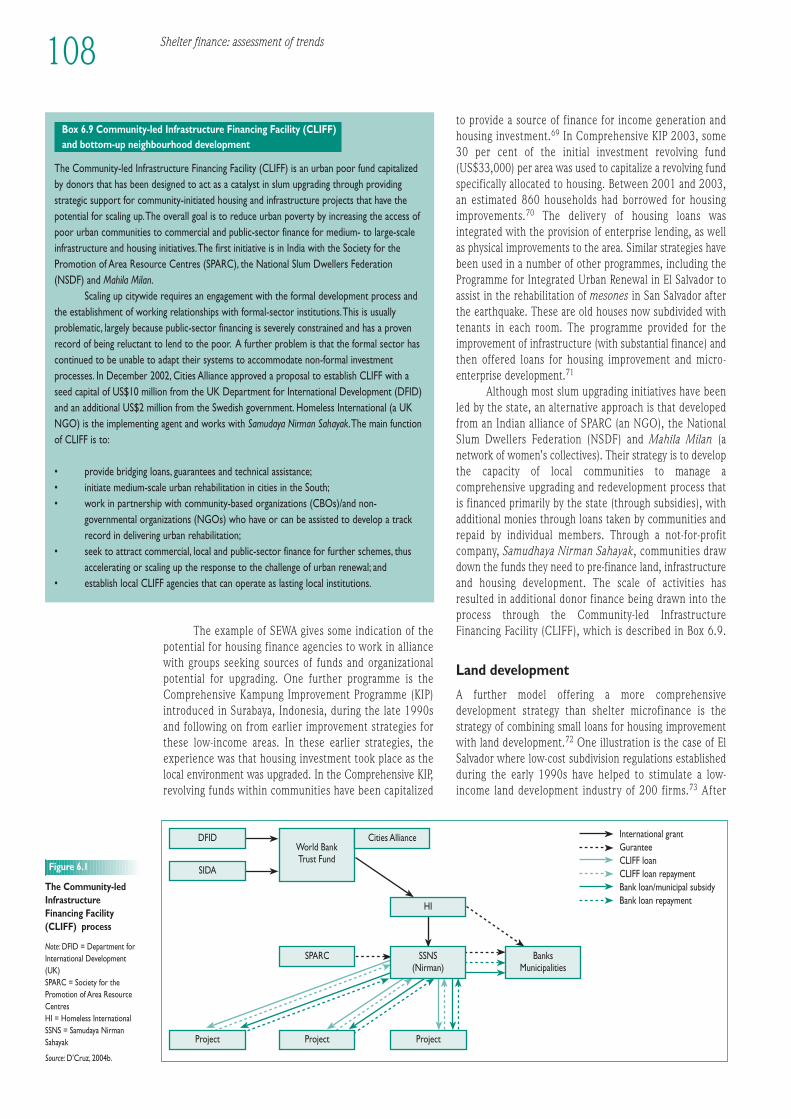
The example of SEWA gives some indication of thepotential for housing finance agencies to work in alliancewith groups seeking sources of funds and organizationalpotential for upgrading. One further programme is theComprehensive Kampung Improvement Programme (KIP)introduced in Surabaya, Indonesia, during the late 1990sand following on from earlier improvement strategies forthese low-income areas. In these earlier strategies, theexperience was that housing investment took place as thelocal environment was upgraded. In the Comprehensive KIP,revolving funds within communities have been capitalized
to provide a source of finance for income generation andhousing investment.69 In Comprehensive KIP 2003, some30 per cent of the initial investment revolving fund(US$33,000) per area was used to capitalize a revolving fundspecifically allocated to housing. Between 2001 and 2003,an estimated 860 households had borrowed for housingimprovements.70 The delivery of housing loans wasintegrated with the provision of enterprise lending, as wellas physical improvements to the area. Similar strategies havebeen used in a number of other programmes, including theProgramme for Integrated Urban Renewal in El Salvador toassist in the rehabilitation of mesones in San Salvador afterthe earthquake. These are old houses now subdivided withtenants in each room. The programme provided for theimprovement of infrastructure (with substantial finance) andthen offered loans for housing improvement and micro-enterprise development.71
Although most slum upgrading initiatives have beenled by the state, an alternative approach is that developedfrom an Indian alliance of SPARC (an NGO), the NationalSlum Dwellers Federation (NSDF) and Mahila Milan (anetwork of women’s collectives). Their strategy is to developthe capacity of local communities to manage acomprehensive upgrading and redevelopment process thatis financed primarily by the state (through subsidies), withadditional monies through loans taken by communities andrepaid by individual members. Through a not-for-profitcompany, Samudhaya Nirman Sahayak, communities drawdown the funds they need to pre-finance land, infrastructureand housing development. The scale of activities hasresulted in additional donor finance being drawn into theprocess through the Community-led InfrastructureFinancing Facility (CLIFF), which is described in Box 6.9.
Land development
A further model offering a more comprehensivedevelopment strategy than shelter microfinance is thestrategy of combining small loans for housing improvementwith land development.72 One illustration is the case of ElSalvador where low-cost subdivision regulations establishedduring the early 1990s have helped to stimulate a low-income land development industry of 200 firms.73 After
108 Shelter finance: assessment of trends
Box 6.9 Community-led Infrastructure Financing Facility (CLIFF) and bottom-up neighbourhood development
The Community-led Infrastructure Financing Facility (CLIFF) is an urban poor fund capitalizedby donors that has been designed to act as a catalyst in slum upgrading through providingstrategic support for community-initiated housing and infrastructure projects that have thepotential for scaling up.The overall goal is to reduce urban poverty by increasing the access ofpoor urban communities to commercial and public-sector finance for medium- to large-scaleinfrastructure and housing initiatives.The first initiative is in India with the Society for thePromotion of Area Resource Centres (SPARC), the National Slum Dwellers Federation(NSDF) and Mahila Milan.
Scaling up citywide requires an engagement with the formal development process andthe establishment of working relationships with formal-sector institutions.This is usuallyproblematic, largely because public-sector financing is severely constrained and has a provenrecord of being reluctant to lend to the poor. A further problem is that the formal sector hascontinued to be unable to adapt their systems to accommodate non-formal investmentprocesses. In December 2002, Cities Alliance approved a proposal to establish CLIFF with aseed capital of US$10 million from the UK Department for International Development (DFID)and an additional US$2 million from the Swedish government. Homeless International (a UKNGO) is the implementing agent and works with Samudaya Nirman Sahayak.The main functionof CLIFF is to:
• provide bridging loans, guarantees and technical assistance;• initiate medium-scale urban rehabilitation in cities in the South;• work in partnership with community-based organizations (CBOs)/and non-
governmental organizations (NGOs) who have or can be assisted to develop a trackrecord in delivering urban rehabilitation;
• seek to attract commercial, local and public-sector finance for further schemes, thusaccelerating or scaling up the response to the challenge of urban renewal; and
• establish local CLIFF agencies that can operate as lasting local institutions.
International grantGuranteeCLIFF loanCLIFF loan repaymentBank loan/municipal subsidyBank loan repayment
DFIDWorld BankTrust Fund
HI
Cities Alliance
Project
SIDA
SSNS(Nirman)
BanksMunicipalities
SPARC
ProjectProject
The Community-ledInfrastructureFinancing Facility(CLIFF) process
Note: DFID = Department forInternational Development(UK)SPARC = Society for thePromotion of Area ResourceCentresHI = Homeless InternationalSSNS = Samudaya NirmanSahayak
Source: D’Cruz, 2004b.
Figure 6.1

developing the area and selling the household a servicedplot, many of these developers offer a small loan (oftenaround US$1,000) to build an initial core unit. It appearsthat this strategy has resulted in affordable secure tenureover the last decade, and – with greater supply – has loweredreal estate prices in real terms. However, there are concernsabout housing quality, and households who face difficultiesat the end of the period may fail to secure a legal title.74 Asimilar system is used by the Salvadoran Integral AssistanceFoundation (FUSAI), a microfinance agency that has alsostarted to be operational in land development in order toaddress the needs of clients. FUSAI acquires the title to theland and undertakes the cost of infrastructure development.Once serviced, the land is subdivided and allocated tofamilies who have been accepted by FUSAI according toincome and capacity to pay criteria. Families receive the landtitle once they pay back the loan. The amount to be financedby the loan equals the price of the house, including road andinfrastructure development, minus the subsidy receivedfrom the state, minus the value of the self-help contributionby the family.75 Similar initiatives are ongoing in Boliviawhere Banco Sol has an agreement with a major developerand construction company in Santa Cruz.76
The discussion here highlights the growing diversityof approaches that are grouped together within sheltermicrofinance. This final discussion on neighbourhooddevelopment (slum upgrading), together with the servicingof greenfield sites, has suggested a number of distinctneighbourhood and housing strategies that include a role forsmall-scale housing loans:
• Improvements of existing housing units: this is thedominant approach at present within sheltermicrofinance. Small-scale loans are provided tohouseholds with reasonably secure land tenure toenable the extension and/or improvement ofaccommodation.
• Linked land purchase and housing loan developments:private development companies prepare serviced land(and, perhaps, basic housing units) for sale withadditional loans for housing development.
• Linked land development and/or upgrading paid forwith a capital subsidy and housing loan developments:this has been discussed in Chapter 5 in the contextof complete housing (paid for by saving, subsidy andloan); but the subsidy funds might be used to preparea serviced plot with additional loans being taken asthe household can afford to improve the dwelling.
• Linked settlement upgrading and housing loan: afurther option may be for the government (eitherdevelopment agency and/or municipality) to upgradethe area, with households then taking additional loansto improve the dwelling.
In the case of the final three options, there are two distinctstrategies that are considered in this chapter and Chapter 7.Shelter microfinance considers those strategies that arebased on individual lending to the household by themicrofinance agency. Without community capacity (and inthe absence of state upgrading programmes), it is not
possible for shelter microfinance to do more than loans forhousing improvement.77 Chapter 7 looks at an alternativeapproach, community funds, which places more emphasison collective capacity and which lends to groups of low-income households within a defined area and/or group. Insome cases, the approaches within community funds haveled into much larger-scale upgrading or land developmentstrategies with the involvement of a much greater numberof agencies. Notable examples are the Baan Mankongprogramme in Thailand (which has emerged from the workof the Community Organization Development Institute, orCODI) and the upgrading of 100 settlements in PhnomPenh, Cambodia, which was catalysed by lending from theUrban Poor Development Fund.
OTHER PROVIDERS ANDSOURCES OF FINANCEThe preceding discussion concentrated on the growth inprovision of small-scale loans for housing by NGOs andmicrofinance agencies. However, there are numeroussources of finance for small loans, although there are fewlarge programmes that offer opportunities to financeincremental housing development at scale. One reason forthe lack of scale is a lack of capital. The discussion of thedevelopment of this sector has concentrated onmicrofinance agencies and NGOs, both of whom receiveexternal development assistance. Many of the providersconsidered below have had no external source of finance.The lack of loan capital is relevant to all providers and isdiscussed further in Chapter 8 as one of the challengesfacing the sector.
Small loans tend to be offered by less formal financialmarkets and they may have a number of characteristics thatdiffer from formal financial markets.78 Access to finance maydepend upon social networks based on religion or ethnicity.In some cases, households secure finance from neitherformal nor informal financial markets, but borrow orotherwise obtain from friends and family. In this case, theremay be further obligations in addition to repayments, withthe loan being simply one component within a dense set ofreciprocal exchanges. The following discussion focusesprimarily on small loans being offered by institutions andorganizations, rather than those being offered throughentirely personal networks. Table 6.3 draws on one recentanalysis that identified several key types of providers.79
The potential significance of commercial micro-lenders can be illustrated in the case of South Africa. Likemost countries in the South, South Africa has always hadinformal money lenders who ignore official interest raterestrictions. During the mid 1990s, however, revisions tothe Usury Act created the possibility of formal commercialmicrolending at unregulated interest rates. Thesecommercial microlenders, shown in Table 6.4, now comprise64 per cent of registered institutions with the MicrofinanceRegulatory Council. Table 6.4 also illustrates the importanceof larger banks. These commercial micro-lenders serve amarket that is predominantly formally employed, with accessto a bank account. The council estimates that about 11 per
There are numerous sources
of finance for small loans,
although there are few large
programmes thatoffer opportunities
to financeincremental
housingdevelopment at
scale
109Small loans: shelter microfinance
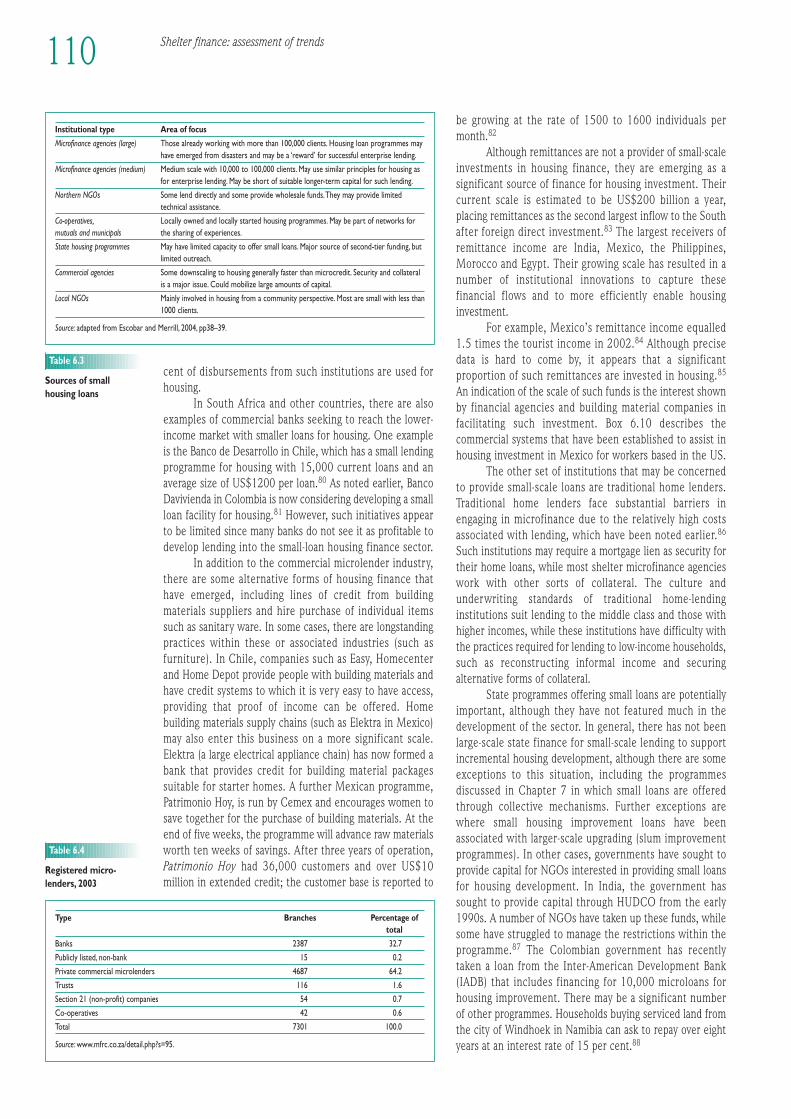
cent of disbursements from such institutions are used forhousing.
In South Africa and other countries, there are alsoexamples of commercial banks seeking to reach the lower-income market with smaller loans for housing. One exampleis the Banco de Desarrollo in Chile, which has a small lendingprogramme for housing with 15,000 current loans and anaverage size of US$1200 per loan.80 As noted earlier, BancoDavivienda in Colombia is now considering developing a smallloan facility for housing.81 However, such initiatives appearto be limited since many banks do not see it as profitable todevelop lending into the small-loan housing finance sector.
In addition to the commercial microlender industry,there are some alternative forms of housing finance thathave emerged, including lines of credit from buildingmaterials suppliers and hire purchase of individual itemssuch as sanitary ware. In some cases, there are longstandingpractices within these or associated industries (such asfurniture). In Chile, companies such as Easy, Homecenterand Home Depot provide people with building materials andhave credit systems to which it is very easy to have access,providing that proof of income can be offered. Homebuilding materials supply chains (such as Elektra in Mexico)may also enter this business on a more significant scale.Elektra (a large electrical appliance chain) has now formed abank that provides credit for building material packagessuitable for starter homes. A further Mexican programme,Patrimonio Hoy, is run by Cemex and encourages women tosave together for the purchase of building materials. At theend of five weeks, the programme will advance raw materialsworth ten weeks of savings. After three years of operation,Patrimonio Hoy had 36,000 customers and over US$10million in extended credit; the customer base is reported to
be growing at the rate of 1500 to 1600 individuals permonth.82
Although remittances are not a provider of small-scaleinvestments in housing finance, they are emerging as asignificant source of finance for housing investment. Theircurrent scale is estimated to be US$200 billion a year,placing remittances as the second largest inflow to the Southafter foreign direct investment.83 The largest receivers ofremittance income are India, Mexico, the Philippines,Morocco and Egypt. Their growing scale has resulted in anumber of institutional innovations to capture thesefinancial flows and to more efficiently enable housinginvestment.
For example, Mexico’s remittance income equalled1.5 times the tourist income in 2002.84 Although precisedata is hard to come by, it appears that a significantproportion of such remittances are invested in housing.85
An indication of the scale of such funds is the interest shownby financial agencies and building material companies infacilitating such investment. Box 6.10 describes thecommercial systems that have been established to assist inhousing investment in Mexico for workers based in the US.
The other set of institutions that may be concernedto provide small-scale loans are traditional home lenders.Traditional home lenders face substantial barriers inengaging in microfinance due to the relatively high costsassociated with lending, which have been noted earlier.86
Such institutions may require a mortgage lien as security fortheir home loans, while most shelter microfinance agencieswork with other sorts of collateral. The culture andunderwriting standards of traditional home-lendinginstitutions suit lending to the middle class and those withhigher incomes, while these institutions have difficulty withthe practices required for lending to low-income households,such as reconstructing informal income and securingalternative forms of collateral.
State programmes offering small loans are potentiallyimportant, although they have not featured much in thedevelopment of the sector. In general, there has not beenlarge-scale state finance for small-scale lending to supportincremental housing development, although there are someexceptions to this situation, including the programmesdiscussed in Chapter 7 in which small loans are offeredthrough collective mechanisms. Further exceptions arewhere small housing improvement loans have beenassociated with larger-scale upgrading (slum improvementprogrammes). In other cases, governments have sought toprovide capital for NGOs interested in providing small loansfor housing development. In India, the government hassought to provide capital through HUDCO from the early1990s. A number of NGOs have taken up these funds, whilesome have struggled to manage the restrictions within theprogramme.87 The Colombian government has recentlytaken a loan from the Inter-American Development Bank(IADB) that includes financing for 10,000 microloans forhousing improvement. There may be a significant numberof other programmes. Households buying serviced land fromthe city of Windhoek in Namibia can ask to repay over eightyears at an interest rate of 15 per cent.88
110 Shelter finance: assessment of trends
Institutional type Area of focus
Microfinance agencies (large) Those already working with more than 100,000 clients. Housing loan programmes may have emerged from disasters and may be a ‘reward’ for successful enterprise lending.
Microfinance agencies (medium) Medium scale with 10,000 to 100,000 clients. May use similar principles for housing as for enterprise lending. May be short of suitable longer-term capital for such lending.
Northern NGOs Some lend directly and some provide wholesale funds.They may provide limited technical assistance.
Co-operatives, Locally owned and locally started housing programmes. May be part of networks for mutuals and municipals the sharing of experiences.
State housing programmes May have limited capacity to offer small loans. Major source of second-tier funding, but limited outreach.
Commercial agencies Some downscaling to housing generally faster than microcredit. Security and collateral is a major issue. Could mobilize large amounts of capital.
Local NGOs Mainly involved in housing from a community perspective. Most are small with less than 1000 clients.
Source: adapted from Escobar and Merrill, 2004, pp38–39.
Type Branches Percentage of total
Banks 2387 32.7
Publicly listed, non-bank 15 0.2
Private commercial microlenders 4687 64.2
Trusts 116 1.6
Section 21 (non-profit) companies 54 0.7
Co-operatives 42 0.6
Total 7301 100.0
Source: www.mfrc.co.za/detail.php?s=95.
Sources of smallhousing loans
Table 6.3
Registered micro-lenders, 2003
Table 6.4
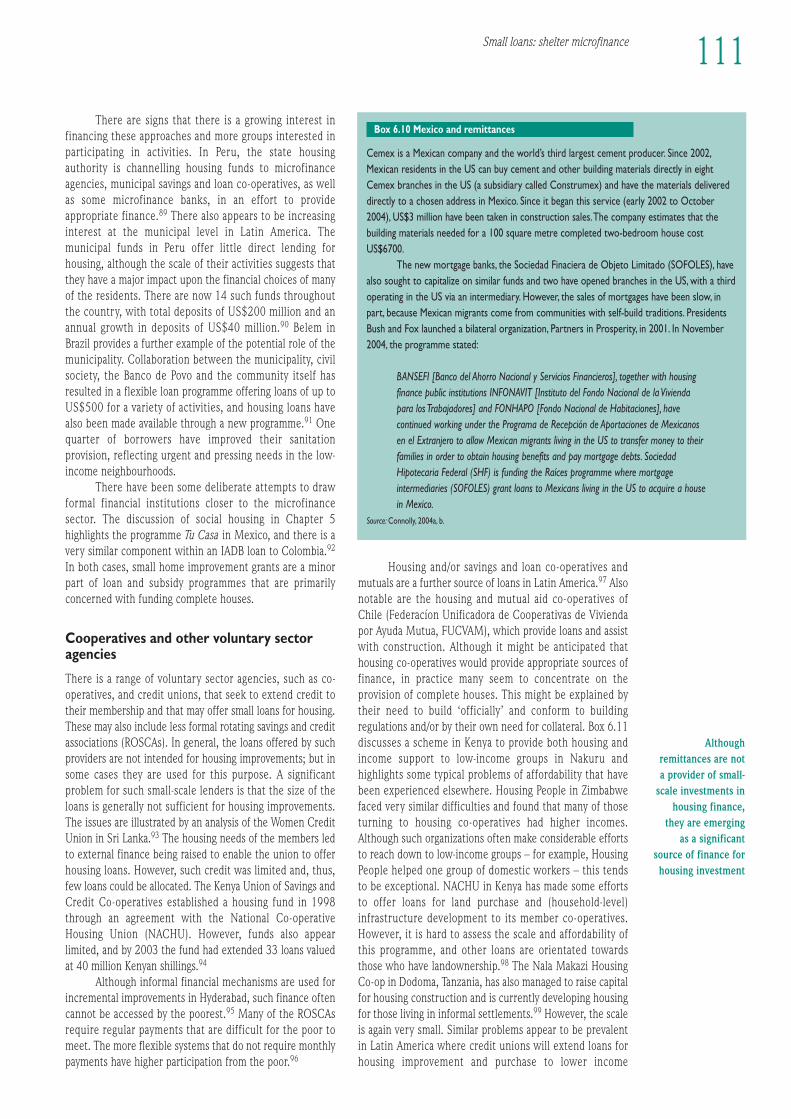
There are signs that there is a growing interest infinancing these approaches and more groups interested inparticipating in activities. In Peru, the state housingauthority is channelling housing funds to microfinanceagencies, municipal savings and loan co-operatives, as wellas some microfinance banks, in an effort to provideappropriate finance.89 There also appears to be increasinginterest at the municipal level in Latin America. Themunicipal funds in Peru offer little direct lending forhousing, although the scale of their activities suggests thatthey have a major impact upon the financial choices of manyof the residents. There are now 14 such funds throughoutthe country, with total deposits of US$200 million and anannual growth in deposits of US$40 million.90 Belem inBrazil provides a further example of the potential role of themunicipality. Collaboration between the municipality, civilsociety, the Banco de Povo and the community itself hasresulted in a flexible loan programme offering loans of up toUS$500 for a variety of activities, and housing loans havealso been made available through a new programme.91 Onequarter of borrowers have improved their sanitationprovision, reflecting urgent and pressing needs in the low-income neighbourhoods.
There have been some deliberate attempts to drawformal financial institutions closer to the microfinancesector. The discussion of social housing in Chapter 5highlights the programme Tu Casa in Mexico, and there is avery similar component within an IADB loan to Colombia.92
In both cases, small home improvement grants are a minorpart of loan and subsidy programmes that are primarilyconcerned with funding complete houses.
Cooperatives and other voluntary sectoragencies
There is a range of voluntary sector agencies, such as co-operatives, and credit unions, that seek to extend credit totheir membership and that may offer small loans for housing.These may also include less formal rotating savings and creditassociations (ROSCAs). In general, the loans offered by suchproviders are not intended for housing improvements; but insome cases they are used for this purpose. A significantproblem for such small-scale lenders is that the size of theloans is generally not sufficient for housing improvements.The issues are illustrated by an analysis of the Women CreditUnion in Sri Lanka.93 The housing needs of the members ledto external finance being raised to enable the union to offerhousing loans. However, such credit was limited and, thus,few loans could be allocated. The Kenya Union of Savings andCredit Co-operatives established a housing fund in 1998through an agreement with the National Co-operativeHousing Union (NACHU). However, funds also appearlimited, and by 2003 the fund had extended 33 loans valuedat 40 million Kenyan shillings.94
Although informal financial mechanisms are used forincremental improvements in Hyderabad, such finance oftencannot be accessed by the poorest.95 Many of the ROSCAsrequire regular payments that are difficult for the poor tomeet. The more flexible systems that do not require monthlypayments have higher participation from the poor.96
Housing and/or savings and loan co-operatives andmutuals are a further source of loans in Latin America.97 Alsonotable are the housing and mutual aid co-operatives ofChile (Federacíon Unificadora de Cooperativas de Viviendapor Ayuda Mutua, FUCVAM), which provide loans and assistwith construction. Although it might be anticipated thathousing co-operatives would provide appropriate sources offinance, in practice many seem to concentrate on theprovision of complete houses. This might be explained bytheir need to build ‘officially’ and conform to buildingregulations and/or by their own need for collateral. Box 6.11discusses a scheme in Kenya to provide both housing andincome support to low-income groups in Nakuru andhighlights some typical problems of affordability that havebeen experienced elsewhere. Housing People in Zimbabwefaced very similar difficulties and found that many of thoseturning to housing co-operatives had higher incomes.Although such organizations often make considerable effortsto reach down to low-income groups – for example, HousingPeople helped one group of domestic workers – this tendsto be exceptional. NACHU in Kenya has made some effortsto offer loans for land purchase and (household-level)infrastructure development to its member co-operatives.However, it is hard to assess the scale and affordability ofthis programme, and other loans are orientated towardsthose who have landownership.98 The Nala Makazi HousingCo-op in Dodoma, Tanzania, has also managed to raise capitalfor housing construction and is currently developing housingfor those living in informal settlements.99 However, the scaleis again very small. Similar problems appear to be prevalentin Latin America where credit unions will extend loans forhousing improvement and purchase to lower income
Althoughremittances are nota provider of small-
scale investments inhousing finance,
they are emergingas a significant
source of finance forhousing investment
111Small loans: shelter microfinance
Box 6.10 Mexico and remittances
Cemex is a Mexican company and the world’s third largest cement producer. Since 2002,Mexican residents in the US can buy cement and other building materials directly in eightCemex branches in the US (a subsidiary called Construmex) and have the materials delivereddirectly to a chosen address in Mexico. Since it began this service (early 2002 to October2004), US$3 million have been taken in construction sales.The company estimates that thebuilding materials needed for a 100 square metre completed two-bedroom house costUS$6700.
The new mortgage banks, the Sociedad Finaciera de Objeto Limitado (SOFOLES), havealso sought to capitalize on similar funds and two have opened branches in the US, with a thirdoperating in the US via an intermediary. However, the sales of mortgages have been slow, inpart, because Mexican migrants come from communities with self-build traditions. PresidentsBush and Fox launched a bilateral organization, Partners in Prosperity, in 2001. In November2004, the programme stated:
BANSEFI [Banco del Ahorro Nacional y Servicios Financieros], together with housingfinance public institutions INFONAVIT [Instituto del Fondo Nacional de la Viviendapara los Trabajadores] and FONHAPO [Fondo Nacional de Habitaciones], havecontinued working under the Programa de Recepción de Aportaciones de Mexicanosen el Extranjero to allow Mexican migrants living in the US to transfer money to theirfamilies in order to obtain housing benefits and pay mortgage debts. SociedadHipotecaria Federal (SHF) is funding the Raíces programme where mortgageintermediaries (SOFOLES) grant loans to Mexicans living in the US to acquire a housein Mexico.
Source: Connolly, 2004a, b.

households; but they require that households have savingsdeposits equal to about 25 per cent of the loan, which thepoorer households are unlikely to find affordable.100 Oneexception to lending for incremental housing is the co-operative Jesus Nazareno in Bolivia, which provides smallloans with a solidarity group guarantee for the purchase ofland.101 However, titles are held by the co-operative untilrepayment is completed, and this suggests that the loans areto those able to afford secure tenure and title.
Despite such difficulties, the significance of manysmall providers is emphasized by a recent assessment of themicrofinance sector in Peru.102 Major institutions offeringsmall loans include self-managed communal funds and co-operatives, NGO programmes, local microfinance agencies,municipal funds, rural funds and the protection funds ofsome workers’ unions. An estimated US$25 million may beloaned each year to housing, of which about 67 per centcomes from the savings and loan co-operatives.
Sources of capital finance
How do microfinance agencies secure capital for theirlending? Some providers draw on their own capital, notablythe private sector and, for the most part, the small-scalevoluntary organizations, such as credit unions. However,most agencies who wish to expand their lending have to findsignificant sources of capital.
Although consumers in South Africa have beensuccessful in accessing and using small loans and targetedsavings for incremental housing improvement, the policy andregulatory environment has not been developed with thisapproach in mind, and there is no source of wholesalefinance or technical support for such institutions.103 TheNGOs who have developed this model cannot drive thedevelopment of a pro-poor housing finance sector alone.Groups such as the Kuyasa Fund now face a major constraintin the lack of capital to expand lending (see Box 6.12).
Such NGOs and other microfinance agencies havefour sources of funds: deposits, development assistance,governments and the private sector. The problem remainseven in countries with a well-developed microfinance sector,such as Bangladesh. Despite the creation of an apexfinancing institution, the Palli Karma-Sahayak Foundation(PKSF), agencies such as the Grameen Bank remain short ofcapital to finance microloans for housing.104
Although many agencies encourage deposits and, asnoted in Box 6.14, in SEWA’s case these savings provide 80per cent of capital, availability of medium-term capital isrecognized to be a constraint. This is a problem even in thecontext of the Central American agencies funded by SIDAthat generally receive medium- to long-term support (anaverage of nine years per programme).105
Microfinance organizations, for the most part, seekto be viable commercial enterprises. The small number ofagencies studied by Cities Alliance are broadly successful inthis aspiration.106 Micasa (the housing programme ofMibanco in Bolivia) broke even on a cash-flow basis,including the initial investment in adjusting the managementinformation system, within nine months; if performancecontinues at current levels, it is expected to generate areturn on loan portfolio of between 7 and 9 per cent,compared with its overall return on loan portfolio of 3.4 percent. FUNHAVI, the Mexican agency, was operationally self-sufficient after six years of business and moving towards fullfinancial sustainability.
However, both these agencies appear to have hadsufficient capital to expand their activities to a profitable level.Proa (also in Bolivia) has a model that would work without asubsidy only if volumes increased.107 The programme hasmoney from a mutual savings association at 9 to 10 per centand on-lends at 13.5 to 15 per cent. Given current volumes,a higher fee (margin) is required; but this is not allowed bythe mutual association providing the funds. The expansion ofthe programme from US$175,000 to US$500,000 of newloans per month would allow costs to be covered. The successof this strategy is critically dependent upon securing adequatecapital to expand lending.
This aspiration to be financially viable without accessto financial support has a number of implications for the
112 Shelter finance: assessment of trends
Box 6.11 From self-help group to housing co-operative in Kenya
Between January and February 2003, members of the Nakuru Housing and Environment Co-operative (NAHECO) in Kenya have accessed seven housing loans from the National HousingCo-operative Union (NACHU) amounting to 360,000 Kenyan shillings and microcredit loansamounting to 140,500 Kenyan shillings.The membership of the co-operative has increasedfrom the initial number of 15 groups from the three low-income settlements to 30 groupsdrawn from seven low-income settlements.The increased membership to NAHECO hasresulted in increased savings. NAHECO has taken up a role of coordinating local self-helpactivities and people show confidence and trust in the operations of the group.
However, the poorest within the area are unable to benefit from this programme.Theparticipatory needs assessment results showed that 92.6 per cent of people living in the threeproject settlements were tenants living in dilapidated housing; 70.9 per cent of them were verypoor, with no land on which to construct own housing. One of the criteria for accessing creditfor housing through NAHECO is possession of land or the ability to save enough to buy some.This is a major weakness in identifying the target group and formulating the guidelines foraccessing credit through NAHECO.This implies that the poorest of the people in the targetarea may be excluded from benefiting from the project.Source: Ng’ayu, 2003.
Box 6.12 Acquiring loan finance in South Africa
The Kuyasa Fund is a non-profit microfinance institution based in Cape Town, South Africa.Since 2001, it has reached more than 2643 clients with US$1.8 million of housing loans.Portfolio at risk is 15 per cent and write-offs are 5 per cent of cumulative disbursements.Women constitute the vast majority of Kuyasa borrowers at 72 per cent, and account for 70per cent of the value of loans taken.
The Kuyasa Fund has been unable to obtain any loan equity locally, and the wholesaleequity and start-up grants have all come from offshore donor sources. Although the parastatalNational Urban Reconstruction and Housing Agency (NURCHA) has assisted with loanguarantees, none of South Africa’s housing-related parastatals have been willing to lend or grantKuyasa any funds on the grounds of ‘high risk’. Kuyasa, however, has already demonstratedconclusively that its lending performance is better than that of mortgage lenders operating inthe same market. Recently, the National Housing Finance Corporation has courted Kuyasamanagement with the offer of a loan, but on terms that made it unviable for Kuyasa. Onceagain, the parastatal cited risk as its main concern. Kuyasa’s difficulty in attracting local equity,even in the face of solid performance, reflects the continuing dominance of the mortgagemindset and risk aversion in South Africa’s parastatal housing finance sector.Source: Baumann, 2004; Van Rooyan, 2004.

nature and development of microfinance. Manymicrofinance organizations face a balance between reachingdown to the poorer households with smaller loans andminimizing administration and management costs byoffering larger loans. In general, the emphasis has beengreater on cost-effective lending. There is a widespreadbelief (supported by many experiences) that access to creditis rather more important than the price of credit and, hence,that microenterprise lending can charge interest rates thatare relatively high in comparison to the formal financialmarkets (although low compared to informal moneylenders). However, housing loans are often considerablylarger and therefore the interest rate charges are moresignificant. In some cases, lenders have developed specifichousing products with lower interest rates; these aregenerally commercially viable even if they are not fullymarket based.108
Some bilateral donors have funded sheltermicrofinance activities for a considerable period (almost 20years) including Swedish Assistance (Box 6.13) and USAID.However, the multilateral donors – such as the IADB and theWorld Bank – have only begun to learn about and developprogrammes in this area over the last few years. In theirabsence, Northern NGOs have played a very significant rolein supporting such initiatives. These NGOs have includedMisereor (Germany) and CordAid (the Netherlands), as wellas specialist housing and urban development groups such asSELAVIP (Belgium) and Homeless International (the UK).
Shelter microfinance and subsidies
There is a difference of opinion between microfinanceagencies about the need for housing subsidies. On the onehand, there is a belief that subsidies are necessary becauseof the traditional association between subsidies and low-income housing and because of the larger size of housingloans.109 On the other hand, it is widely accepted thatmicrofinance needs to perform without subsidy finance inorder to be able to expand as market conditions permit.Sector commentators suggest that subsidies should not beoffered through interest rates or permitted defaults, and thatsubsidies, if offered, should be managed separately outsideof the loan operation.110 For example, subsidies might beprovided through capital grants for housing investment orthrough the provision of water and sanitation services.Chapter 5 discussed the use of small loans to top up housingsubsidy finance.
Despite such recommendations, this is not necessarilycommon practice. In situations in which there is no statesupport, there appears to be an effective cross-subsidy fromenterprise to shelter lending, as the interest rates are lowerin the latter. In some countries, particularly in Asia, subsidiesare available through reduced interest rates andmicrofinance agencies have become a conduit to deliverstate support to the poor. In some cases, the subsidy isprovided in the form of an interest rate reduction. GrameenBank and SEWA have both accessed low-interest sources offunds and pass on this subsidy.
TERMS AND CONDITIONSThere is a considerable diversity in the nature of sheltermicrofinance as provided by the many differentorganizations who are active in this sector. Onecommentator illustrates such differences thus:
In Mexico, CHF International and FUNHAVI[Fundación Habitat y Vivienda A. C.] havedeveloped a home improvement loan thatfeatures an average loan amount of US$1800, arepayment period of 18 months for first-timeborrowers and a 54 per cent effective annualinterest rate. The Grameen Bank’s housingloans typically are repaid over ten years. Theyare offered at an interest rate that is 10 per centbelow rates assessed for microenterprise loans,and first-time clients are not eligible for suchloans.111
The average size of the Grameen Bank housing loan is13,386 Bangladesh taka (US$224).112 This contrastdemonstrates the significance of local context in developingappropriate housing finance solutions. The differencebetween these approaches reflects the type of housingsolution that is acceptable and affordable to the borrowers,and the solution that is likely to be approved by theauthorities if they have a significant presence. The contrastalso reflects the target group for lending activities and theoperating constraints and choices of the agency. Forexample, as is sometimes the case for microenterpriselending, some microfinance agencies prefer to give fewerlarger loans, thereby reducing their administration costs andincreasing their financial returns for a given amount of loancapital.
113Small loans: shelter microfinance
Box 6.13 Swedish International Development Agency (SIDA) assistance to low-income housing in Central America
Since 1988, the Swedish International Development Agency (SIDA) has financed housing andlocal development programmes in Central America with total resources of US$50 million. Bythe end of 2003, the programmes had helped approximately 80,000 low-income families, orabout 400,000 people, in the main urban areas of the region to improve their habitatconditions.The resources from SIDA have been channelled through different institutions andprogrammes – namely, the Foundation for Housing Promotion (FUPROVI) in Costa Rica, theLocal Development Programme (PRODEL) in Nicaragua, the Salvadoran Integral AssistanceFoundation (FUSAI) in El Salvador, the Urban and Rural Social Housing DevelopmentFoundation (FUNDEVI) in Honduras and the Local Development Trust Fund (FDLG) inGuatemala.
SIDA’s policy throughout the region has been that housing subsidies are primarily theresponsibility of national governments, who act as counterparts to the international agency.That is why most of the funds allocated by SIDA have been channelled to finance three maincomponents of these programmes: loans (including microloans for housing improvements andnew housing), technical assistance (both to executing agencies and the target population) andinstitutional development, especially of those institutions that manage the Swedish funds.Source: Stein with Castillo, 2005.

Savings
The link between housing investment and savings extendswell beyond the microfinance sector. In the North,traditionally families have saved for several years simply toaccess conventional mortgage finance. Savings is aparticularly significant component of the contract-savingsschemes in Western Europe, notably the GermanBausparkasen and UK building societies.113 Similarly, manymicrofinance programmes for housing, particularly in Asiaand Africa, have savings requirements.
Savings has a place in microfinance for many reasons.Savings is a strategy to assist with repayments in whichborrowers have to demonstrate a capacity to make regularpayments and accumulate sufficient funds for the requireddown payment or deposit. Microfinance agencies may try toget would-be borrowers to save at a rate equal to loanrepayments, in part to reduce the risk to lender andborrower. The required savings period typically lastsbetween 6 to 12 months before a loan is granted.114 Onenotable example is Bank Rayat Indonesia (BRI), which hasmobilized more than US$2.7 billion in voluntary savingsthrough 16.1 million savings accounts; however, saving onthis scale is very unusual. A further reason to encouragesavings is to assist the agencies themselves in acquiringfunds.115 In SEWA’s case, the bulk of the bank’s loanportfolio arises from client deposits, although additionalfinance for housing loans is provided by the governmentthough HUDCO.116 The importance of saving can beillustrated for the case of SEWA:
In order to be eligible for any loan from SEWABank, for example, the would-be borrower musthave a regular savings record at SEWA Bank forat least one year. What is important for SEWA isthat the savings history is stable and consistent.SEWA Bank’s experience is that facilitation of astrong savings habit correlates significantly withhigh loan repayment rates – hence, a client’ssavings record serves as the main form ofcollateral for loans.117
The significance of savings to the clients of microfinanceagencies has long been recognized. The experience of theKuyasa Fund in South Africa is that clients use their savingsto augment the subsidy that they receive from the state. Avery notable estimated 65 per cent of Kuyasa clients onlysave and do not take loans.118
Collateral and security
Collateral is an asset pledged to a lender until the borrowerpays back the debt. Its major role is in reducing lender riskand it is widely recognized that a key challenge for sheltermicrofinance is that of loan security.119 Many microfinanceagencies seek to minimize the need for collateral by usingexisting client history (enterprise lending). A furtherstrategy used for lending for income generation is smallrepeat loans as a way of building up repayment skills andcapacities and providing an incentive for repayment.
However, the larger size of shelter microfinance makes thisstrategy more difficult to follow.
Another strategy used by microenterprise lenders isthat of group guarantees. However, this strategy has beenfound to be problematic for housing loans, again becauseof the bigger loans and longer loan period.120 This mayexplain the problems faced by the Group Credit Companyin South Africa (which tried and failed to replicate GrameenBank strategies in offering small loans). Difficulties arerelated to the longer period of the loans and, hence, thelack of need for the group unless repeat income-generationlending is also taking place. The use of group guaranteesshould not be confused with group loans, which include acollective responsibility to manage and repay the loan (seeChapter 7).
In the absence of such strategies, a wide range ofcollaterals are used, including mortgages, personalguarantees, group guarantees, fixed assets and/orpension/provident fund guarantees.121 Pension fundcollateral is used particularly in South Africa and Bangladesh,and more recently in Namibia, but is not significantelsewhere. In a recent study of microfinance agencies’practices, the following are identified as collateral:122
• land title and buildings;• chattel mortgage/lien on assets;• obligatory savings;• assignment of future income (wages);• personal guarantees (co-signers);• joint liability and group guarantees (character-based
lending); and• other financial assets (for example, life insurance
policies and pension funds).
One difficult area is the extent to which legal title is arequirement of lending. One commentator argues that‘Client ownership of the home or land is preferred: it isagainst the policy of some lenders to provide credit forhousing on squatted land.’123 Moreover, in some countriessuch as the Dominican Republic, lenders may not be legallyallowed to extend housing loans without a formal propertytitle.124 However, despite an emphasis on land ownership,the use of title deeds as collateral for microfinance loans islimited, and one study of 80 such organizations found thatonly one quarter use it.125 For example, the experience ofMibanco in Peru is also to avoid the use of land titles. Theagency relies on the same informal collateral of householdassets and co-signers used for microenterprise loans (despitethe mass land-titling programme that has taken place in Peru,discussed in Chapter 4). Mibanco found that land titles areexpensive to use as guarantees, and that poor clients do notwant to use title as collateral for a loan of less thanUS$1000.126 Banco Sol uses such collateral but considersthat there are major risks because of the poor standard ofdeeds and title documentation.127
Alternative strategies are varied. In some cases, suchas the Grameen Bank, home loans are only given to thosewho have experience in enterprise lending and a goodrepayment record. Alternatively, social collateral such as
114 Shelter finance: assessment of trends
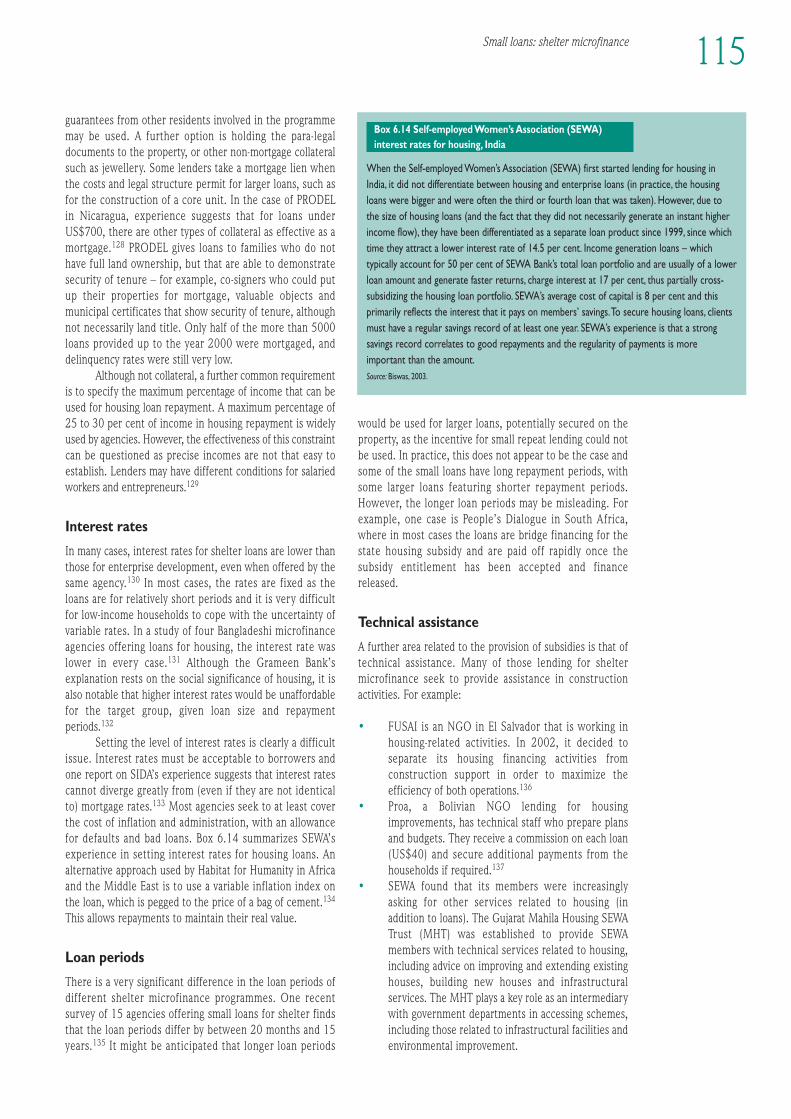
guarantees from other residents involved in the programmemay be used. A further option is holding the para-legaldocuments to the property, or other non-mortgage collateralsuch as jewellery. Some lenders take a mortgage lien whenthe costs and legal structure permit for larger loans, such asfor the construction of a core unit. In the case of PRODELin Nicaragua, experience suggests that for loans underUS$700, there are other types of collateral as effective as amortgage.128 PRODEL gives loans to families who do nothave full land ownership, but that are able to demonstratesecurity of tenure – for example, co-signers who could putup their properties for mortgage, valuable objects andmunicipal certificates that show security of tenure, althoughnot necessarily land title. Only half of the more than 5000loans provided up to the year 2000 were mortgaged, anddelinquency rates were still very low.
Although not collateral, a further common requirementis to specify the maximum percentage of income that can beused for housing loan repayment. A maximum percentage of25 to 30 per cent of income in housing repayment is widelyused by agencies. However, the effectiveness of this constraintcan be questioned as precise incomes are not that easy toestablish. Lenders may have different conditions for salariedworkers and entrepreneurs.129
Interest rates
In many cases, interest rates for shelter loans are lower thanthose for enterprise development, even when offered by thesame agency.130 In most cases, the rates are fixed as theloans are for relatively short periods and it is very difficultfor low-income households to cope with the uncertainty ofvariable rates. In a study of four Bangladeshi microfinanceagencies offering loans for housing, the interest rate waslower in every case.131 Although the Grameen Bank’sexplanation rests on the social significance of housing, it isalso notable that higher interest rates would be unaffordablefor the target group, given loan size and repaymentperiods.132
Setting the level of interest rates is clearly a difficultissue. Interest rates must be acceptable to borrowers andone report on SIDA’s experience suggests that interest ratescannot diverge greatly from (even if they are not identicalto) mortgage rates.133 Most agencies seek to at least coverthe cost of inflation and administration, with an allowancefor defaults and bad loans. Box 6.14 summarizes SEWA’sexperience in setting interest rates for housing loans. Analternative approach used by Habitat for Humanity in Africaand the Middle East is to use a variable inflation index onthe loan, which is pegged to the price of a bag of cement.134
This allows repayments to maintain their real value.
Loan periods
There is a very significant difference in the loan periods ofdifferent shelter microfinance programmes. One recentsurvey of 15 agencies offering small loans for shelter findsthat the loan periods differ by between 20 months and 15years.135 It might be anticipated that longer loan periods
would be used for larger loans, potentially secured on theproperty, as the incentive for small repeat lending could notbe used. In practice, this does not appear to be the case andsome of the small loans have long repayment periods, withsome larger loans featuring shorter repayment periods.However, the longer loan periods may be misleading. Forexample, one case is People’s Dialogue in South Africa,where in most cases the loans are bridge financing for thestate housing subsidy and are paid off rapidly once thesubsidy entitlement has been accepted and financereleased.
Technical assistance
A further area related to the provision of subsidies is that oftechnical assistance. Many of those lending for sheltermicrofinance seek to provide assistance in constructionactivities. For example:
• FUSAI is an NGO in El Salvador that is working inhousing-related activities. In 2002, it decided toseparate its housing financing activities fromconstruction support in order to maximize theefficiency of both operations.136
• Proa, a Bolivian NGO lending for housingimprovements, has technical staff who prepare plansand budgets. They receive a commission on each loan(US$40) and secure additional payments from thehouseholds if required.137
• SEWA found that its members were increasinglyasking for other services related to housing (inaddition to loans). The Gujarat Mahila Housing SEWATrust (MHT) was established to provide SEWAmembers with technical services related to housing,including advice on improving and extending existinghouses, building new houses and infrastructuralservices. The MHT plays a key role as an intermediarywith government departments in accessing schemes,including those related to infrastructural facilities andenvironmental improvement.
115Small loans: shelter microfinance
Box 6.14 Self-employed Women’s Association (SEWA) interest rates for housing, India
When the Self-employed Women’s Association (SEWA) first started lending for housing inIndia, it did not differentiate between housing and enterprise loans (in practice, the housingloans were bigger and were often the third or fourth loan that was taken). However, due tothe size of housing loans (and the fact that they did not necessarily generate an instant higherincome flow), they have been differentiated as a separate loan product since 1999, since whichtime they attract a lower interest rate of 14.5 per cent. Income generation loans – whichtypically account for 50 per cent of SEWA Bank’s total loan portfolio and are usually of a lowerloan amount and generate faster returns, charge interest at 17 per cent, thus partially cross-subsidizing the housing loan portfolio. SEWA’s average cost of capital is 8 per cent and thisprimarily reflects the interest that it pays on members’ savings.To secure housing loans, clientsmust have a regular savings record of at least one year. SEWA’s experience is that a strongsavings record correlates to good repayments and the regularity of payments is moreimportant than the amount.Source: Biswas, 2003.
• FUNHAVI (Mexico) goes one step further andrequires borrowers to buy construction materialsfrom it (as well as providing technical advice).However, this is also a financial measure, as it buys atwholesale and sells at retail prices.138
Opinions differ about the viability of such services formicrofinance agencies. One argument is that the moredeveloped microfinance agencies do not offer suchservices.139 A related view is that ‘Construction assistancesin the context of housing microfinance does not appear tobe a predictor of financial performance.’140 Some, such asAssociación para el Desarollo de Microempresas (ADEMI)(Dominican Republic), argue that it is up to clients tomanage their own affairs. Groups such as the Co-operativeHousing Foundation argue that it is a necessary service andthe content helps to reduce default rates. Another positionis that of the Kuyasa Fund in South Africa, which does notwant to provide these services itself, but recognizes theneed to work alongside those who can provide technicalassistance around construction issues.
In some cases, such as the Grameen Bank inBangladesh, the loan is for a defined package of buildingmaterials, which minimizes the need for technical assistance(or greatly eases its provision) (see Box 6.15).
Orientation towards women
There is an emerging preference to lend to women in manyof these institutions, based on the reliability ofrepayment.141 Women borrowers are ‘current good practice’
and there is a particularly strong predisposition towardslending to women in Asia.142 The Grameen Bank, forexample, argues that the title to the house constructed withloan finance is vested with the borrower, and in 95 per centof cases this is the woman. By having title to the house, thewoman obtains financial security and an improved statuswithin the family and society. In the case of FUNHAVI inMexico, 38 per cent of the clients are women.143 Accordingto the Kuyasa Fund, South Africa, women are 72 per cent ofthe borrowers.144 In the case of PRODEL in Nicaragua, morethan 60 per cent of the housing improvement loan recipientsand 70 per cent of the microentrepreneurs are women.145
Such figures are indicative of the more general position:women are often predominant among borrowers, but fewfunds exclusively serve women.
In the case of shelter, the role of home carer is oftendefined by gender and given to women. Hence, women mayhave a greater interest in investing in housing even if theyare less likely to be the formal ‘owner’ of the dwelling.
Income generation
Although the primary focus of the initiatives discussed aboveis on savings and lending for shelter improvement, some ofthese programmes recognize the evident links betweenshelter and livelihoods. Some agencies, such as SEWA, havelong recognized the close connection between home-basedenterprise lending and housing improvement loans.146
Improving the infrastructure in the areas in which SEWA isworking resulted in an average 35 per cent increase in smallenterprise earnings.147 Through experiences such as these,there is a growing awareness of the links between enterpriseand shelter investment.
There are three notable ways in which theseprogrammes are linked to enterprise lending. The first isthrough lending for income generation. In many cases,shelter microfinance is offered along with income-generationloans. In some cases, it is a condition of the lendingorganization that income-generation loans are taken first, inother cases, one or other might be taken. The justificationfor the first strategy is that successful income generation isneeded to be able to afford housing investment and relatedloan repayments. The argument in favour of the secondstrategy is that many ‘enterprise’ loans are diverted tohousing investments and repayments proceed successfully.
Second, housing investments are more directly linkedto income generation in a number of ways. Housingconstruction activities may be to improve a business orproduction area, such as a small shop or a workroom. Insome cases, they may not even be related to a productive orvending enterprise directly, but may be providing a room torent. Finally, the more ambitious schemes have explored thepossibility of creating commercial centres to improve locallivelihoods and to strengthen the local economy. Generally,these strategies belong to initiatives with more ambitiousdevelopment objectives (see Chapter 7).
116 Shelter finance: assessment of trends
Box 6.15 Grameen Bank loan package, Bangladesh
In Bangladesh, the families who are members of the Grameen Bank typically live in smallshelters of jute stick, straw, grass thatch, bamboo and dried mud. Each year a family has tospend about US$30 to repair the house after the monsoons. For an equal amount of money, afamily can repay a housing loan for a strong, well-constructed house with a floor area of 20square metres.The bank views housing loans as investment rather than consumption since asecure and well-constructed house aids the health and well-being of the family and helps themto break the vicious circle of poverty.The house can be used for storage for their smallbusinesses, and time and money are saved in not having to continually repair the jute-stickshelters.
The Grameen Bank has developed two standard house designs.The smaller one costsUS$300 and a larger version costs US$625. In many cases, the family adds their own savings tothe loan and spends up to US$800–$1000 on their home and its furnishings.The houses varyin appearance throughout the country, but have the same basic structural components.Thereare four reinforced concrete pillars on brick foundations at the corners of the house and sixintermediary bamboo or concrete posts, with bamboo tie beams, wooden rafters and purlinssupporting corrugated-iron roofing sheets.This provides stability in the flood and strongmonsoon wind and protection from the heavy rain during the monsoon season. In cases ofsevere flooding, the house can be dismantled and the components stored and reassembledlater. A sanitary latrine must be provided with each house. Families can build the housesthemselves with the help of friends and neighbours. Local skilled carpenters carry out the roofconstruction.Source: www.bshf.org and www.grameen-info.org.
FORESEEN CHALLENGESAlthough shelter microfinance might not be effective inevery context, there is now widespread experience andunderstanding of the process and considerable appreciationof the approach in many countries. There are two notablechallenges facing the shelter microfinance sector. The firstis the nature of the beneficiary group and the difficultiesfaced by very poor households due to problems ofaffordability and lack of secure tenure. The second is sourcesof funding. Although other issues may be of specific concernto particular programmes, these two subjects are those thatappear to be the most significant.
Affordability
Microfinance for shelter may contribute to a more holisticapproach to development than that generally associated withmicrofinance. In so doing, it may be addressing some of theconcerns raised about its ability to assist some of the poorerfamilies.148 By reducing expenditure on basic needs (such asrent, repairs to housing and water costs), lending for land,infrastructure and housing may increase remaining incomeand reduce vulnerability. As demonstrated in the case of theGrameen Bank (see Box 6.15), housing investment reducedrepair costs and essential expenditures.
These programmes appear, in general, to reach theincome groups served by microfinance agencies lending forenterprise development and families with similar incomesin the formal sector. The bias of microfinance agenciestowards the somewhat higher income groups has beenrecognized for some time. This bias reflects the need of theagencies to secure high levels of repayments and give outlarger loans (with the administration costs therefore being asmaller proportion of the loan). It also reflects the self-selection of their clients, with the more vulnerable avoidingthe problems of debt, or beginning and dropping out of theprogrammes. Many shelter microfinance programmes appearto be targeted at the higher income urban poor, sometimesthose with formal employment (at least one member of thefamily) and often those with diversified household livelihoodstrategies. As is the case with SEWA, successful income-generation borrowing may be required prior to housing loanapplications. In many cases, land tenure is required.
The target group of those agencies reviewed by CitiesAlliance is profiled thus:
…these financial institutions describe theirclients as the economically active poor in theinformal sector. They are largely serving theirexisting poor clients with this new loan product,and most provide housing loans as a reward forgood past performance on microenterpriseloans.149
In the cases of the agencies considered, Mibanco’s clientshave an income that is around or below the poverty line forPeru (where 50 per cent of the population have incomesbelow the poverty line). FUNHAVI in Mexico serves clientswho earn between two and eight times the local monthly
minimal wage of US$125. SEWA Bank’s clients are all poorself-employed women – predominately street vendors,labourers or home-based workers. In 1998, an estimated 76per cent of SEWA borrowers had annual household incomesbelow US$415 and half of these had annual incomes belowUS$276. Clearly, the group that is being reached is poor andin need of housing investment. However, these are largeincome categories and they may say little about how far belowthe poverty line such programmes are able to extend.
In some cases, shelter microfinance is linked to statesubsidy programmes (notably in Latin America), and this mayextend their reach downwards towards lower incomegroups. The Step-by-Step programme in Ecuador, forexample, helps households to raise the deposit they need inorder to secure the direct demand subsidy and thereforeafford improved housing. However, as noted in Chapter 5,such programmes may include further loans and, hence, thepoorest may not be able to afford the costs of inclusion.
The use of other mechanisms and, notably, therequirement for secure tenure, may further define the clientgroup as being the poor, but not so poor. The greatestdifficulty faced by the poor is that, in general, theseprogrammes offer small loans for housing improvement andtherefore cannot address the large numbers who do not havetenure security (if not a full title). A further illustration ofsuch restrictions is given for one housing loan programmein India in which only those households who were occupyingthe house on an ownership basis were selected and tenantson rent were excluded; this was based on the considerationthat such households would not be in a position to join theshelter upgrading programme.150
It might be argued that any household able to afforda loan is not going to be the very poorest; therefore, theshelter microfinance programmes will inherently struggle toreach down to those with lower incomes. The group that isbeing reached by these programmes is clearly benefitingfrom the assistance. Moreover, without access to loans,housing investment is very inefficient. For those who dosecure loans, the benefits can be considerable. In additionto the income benefits discussed above, Box 6.16 describessome of the health consequences. Shelter microfinanceappears to be effective in improving the housing conditionsof a group eager to invest in its own dwellings. It has asignificant role in a system of housing finance, while, at thesame time, there is a need to be realistic about thelimitations of the strategy in reaching the poorest.
Securing capital
As noted above, securing sufficient loan capital is difficult.Lack of capital emerges as being a very significant constrainton expansion. Banco ADEMI (in the Dominican Republic)cited lack of capital as the principal challenge that theorganization faces in providing housing credit, for whichthere has been substantial demand.151 These difficultiesreflect a general constraint on the microfinance sector andusually do not appear to be specifically related to housinglending; however, as illustrated in the example ofBangladesh, there may be even more limited sources in thecase of housing. As noted earlier, in the case of some
117Small loans: shelter microfinance

agencies, viability is related to the scale of activities, andcapital for expansion will result in profitable lending andpotentially an easing of capital constraints.
Very little is known about the aggregate balance ofsources of funding for shelter microfinance. A recent studyof the total capital of the larger microfinance agencies inBangladesh highlights some interesting trends.152 It isnotable that finance from the commercial banking sectorincreased from 3 to 11 per cent of total capital between1996 and 2002. Donor finance has dropped fairlydramatically through a similar period (from 58 to 17 percent), although this partly reflects the growing significanceof the Palli Karma Sahayak Foundation, a public–private apexbody that channels funds to microfinance agencies, whichhas increased its significance by providing 12 per cent ofcapital in 1996 and 24 per cent of capital in 2002. However,the analysis suggests that the strategy used by these agenciesmay not be easy to replicate in other countries and it is notso evident that shelter microfinance can succeed in ensuringa growing and secure capital base. A further specificsuggestion is that Palli Karma Sahayak Foundation shouldextend its activities and provide finance for housing.153
Shelter microfinance agencies may face a particularlydifficult balance in setting interest rates that weighborrowers’ demands against their own financial needs.Interest rates must be acceptable to borrowers.154 In somecountries, subsidized interest rates for mortgage loans mayincrease pressure for reduced interest rates. Such factors,as well as longer-loan terms and required concessions foraffordability, may explain the use of favourable interest ratesin the case of small loans for housing.
As is evident from this discussion, microfinanceagencies face an issue of scale. To be profitable, they haveto increase the quantity of lending. There is evidence thatthis is driving their expansion into shelter microfinance; butfor the smaller agencies, lack of capital to expand operationsappears to be a significant constraint. One view is that theshorter lending terms of shelter microfinance may better fitthe short-term funding sources (with the bulk of financial
liabilities often one year or less) available to financialinstitutions in the South; therefore, more conventionalhousing lenders should be active in this area. Such a matchof demand and supply may help to account for the stronginterest being shown in this area. The greater interestdemonstrated by the private sector may assist in reducingthe capital constraint; however, it is equally evident that thisis unlikely to happen in all countries. The Banco Daviviendain Colombia is currently working with the government toexamine the possibility of offering loans of less thanUS$2800 to be repaid in up to five years for homes valuedat less than US$15,000.155
Nevertheless, it is equally apparent that longer-termloan repayment periods are also common in sheltermicrofinance agencies, despite the small size of the loans.Raising funds for shelter microfinance may be morecomplicated than for enterprise lending because of theselonger loan periods. In the case of microenterprise lending,donor support has placed emphasis on building theinstitutional capacity of lending agencies and assisting in theaccumulation of their capital base. There has been aresistance to providing concessional funds for on-lending.Despite this, it has been argued that one problem is thatsuch agencies have had access to funds at a modestlyconcessional rate, which have been built into the cost basisof their operation. As a result:
… one recent ambitious effort to raise fundingfor major MFIs [microfinance institutions] oninternational capital markets ran squarely intothis problem – lack of demand for the funds.Very few MFIs wanted funds on the resultingmarket terms.156
Shelter microfinance products continue to be developed, andthere are reasons to believe that more agencies are enteringthis area and that those that are here already are expandingtheir activities. Can shelter microfinance continue to scaleup? Lack of financial capital does appear to be a significantconstraint. However, there are more agencies interested inthis area in some countries, notably the private sector,municipal government and central government. In somecases, they are working with existing microfinance agencies;in others, they are developing their own products. In part,the growth of shelter microfinance has been driven by thecommercial interests of existing microfinance agencies andthe need to consolidate and extend their own market base.In the Latin American context, this has happened in anumber of countries in which direct-demand subsidiesalready exist or are being introduced. Microfinance can helpto secure subsidies and add value to the construction process.In other cases, microfinance agencies have responded to theirown analysis of need and have been able to secure funds fromthe state to extend their services. As a result, sheltermicrofinance as a sector is witnessing the expansion ofexisting agencies, new NGO and microfinance agencyinitiatives and new interest from groups that were notpreviously involved in offering small loans.
It is not so evidentthat sheltermicrofinance cansucceed in ensuringa growing andsecure capital base
118 Shelter finance: assessment of trends
Box 6.16 Improving shelter, improving health
The few impact evaluations conducted of shelter finance point to positive results for the poor.An evaluation of Plan International’s Credit for Habitat programmes in Bolivia and Guatemalashowed that clients invested their US$200–$800 loans in roofing, walls, floors, tiling, water,sewage and electrical connections, as well as additional rooms. Seventy-eight per cent of clientssaid that home improvements improved family health. Clients with Grameen-financed homes inBangladesh – equipped with Grameen’s construction standards of cement pillars and sanitarylatrines – had 50 per cent fewer incidences of illnesses than those without Grameen houses.Their houses suffered far less structural damage during the devastating floods of 1987 andsince, compared with non-Grameen homes. An impact assessment of the Self-employedWomen’s Association (SEWA) Bank’s slum upgrading programme in India, which includedprogressive housing loans, reported increases in literacy (school children enrolment),productivity (increase in number of working hours), income and health (lower incidences ofillness and, thus, lower health expenditures), and increased marriage opportunities, higherstatus and respect in the community for women borrowers. In sum, housing finance loansserve poor households and help them to improve their livelihoods.Source: Malhotra, 2003.
1 This chapter is based on adraft prepared by Diana Mitlin,University of Manchester, UK,with assistance from a numberof urban researchers listed inthe Acknowledgements.
2 See, for example, thosediscussed in ESCAP, 1991;Environment and Urbanization,1993; Arrossi et al, 1994;Mitlin, 1997; Jones and Datta,1999; Center for UrbanDevelopment Studies, 2000;Environment and Urbanization,2001; ACHR, 2002; Daphnisand Ferguson, 2004; Malhotra,2003.
3 There has been someexperimentation and the casefor housing microfinance isexplored in Daphnis andFerguson, 2004.
4 ESCAP, 1991.5 Ferguson, 2004b, p4.6 Mutagwaba, cited in
Government of Tanzania andUN-Habitat, 2003, p31.
7 See Okpala, 1994, p1572.8 Ballesteros, 2002, p3.9 The Center for Urban
Development Studies (2000)divides the groups into twobased on the nature andpurpose of the originatingagency (microfinance orshelter advocacy).Thealternative division used here,which divides by the terms andconditions of the loan and, inparticular, by whether loansare collective or individual, hasthe advantage of distinguishingthose agencies able to lend forland and infrastructure (whichmust necessarily be collective)and those for whom shelterfinance is primarily restrictedto housing improvement.
10 Smets, 2002, p77.11 Malhotra, 2003, p225.12 Datta, 1999, p204.13 Kamete, 2000, p254.14 Okwir, 2002, p95.15 Okonkwo, 2002, p97.16 Biswas, 2003.17 Smets, 2002, pp65, 87.18 Smets, 2002, p65.19 Moss, 2001, p33-4.20 Baumann, 2003, p88.21 Government of Tanzania and
UN-Habitat, 2003, pp53–54.22 Gough, 1999.23 Datta, 1999, p203.24 Gough, 1999.25 Wahba, 2001.26 Nell et al, cited in Baumann,
2004.27 Civil society is a term used to
refer to the not-for-profit andvoluntary sector. It is alsoreferred to as the third sectorin some texts.The distinctivefeatures of such agencies are
that they are not part of thestate, nor are they commercialcompanies. Although not allsuch organizations areregistered (for example, ascharities and/or voluntaryassociations), many of thoseoffering loans and/or savingsfacilities are likely to havesome kind of registration.Theexception is the large numberof less formal savings groupsincluding those that fall underthe title of ROSCAs (rotatingsavings and creditassociations).They are notdiscussed here as few offersums substantial enough forshelter investment.
28 Ferguson, 2003.29 CGAP, 2004.30 Biswas, 2003, p51.31 Smets, 2002, p75; Mohamed,
1997.32 Wahba, 2001, Appendix 1.33 SANMFI, cited in Biswas, 2003.34 Biswas, 2003.35 Ferguson, 1999, p191.36 Hoek-Smit, 1998, p41.37 Arrossi et al, 1994, p58.38 Co-operative Housing
Foundation, 1993, p38.39 Co-operative Housing
Foundation, 1993, p41.40 Jones and Mitlin, 1999, p27.41 Ferguson, 1999, p93.42 Connolly, 2004b, p9.43 A further Mexican example is
FOSOVI, an NGO active inMexico City. Between 1998(when it was set up) and 2000,FOSOVI granted 1266 housingloans to families (SELAVIP,2003, p43).The maximum loanper family is US$1000 and theloan period is 36 months.Capital has been securedthrough a partnership withlocal government, local savingsand loan societies, NGOs andpopular movements (residents’associations). About onequarter has been for theconstruction of a core houseand half for the extension ofan existing house; theremaining loans were for theimprovement of facilities suchas toilets or the improvementof housing quality. Familiesorganize themselves intogroups to receive the loansand this group helps in thematerial purchasing andconstruction process.
44 World Bank, 2004a, p3.45 Smets, 2002, p181.46 Connolly, 2004b.47 Center for Urban
Development Studies, 2000.48 Arrossi et al, 1994, p54.49 Stein with Castillo, 2005.50 McLeod and Mitlin, 1993.
51 Smets, 2002, pp195–197.52 Sheela Patel (director of
SPARC), pers comm, 2004.53 McLeod, 2002, p204.54 Forero, 2004, p41.55 Mutua et al, 1996.56 Ferguson, 2003, pp26–27.57 Malhotra, 2004, p222.58 Escobar, undated, p21.59 Escobar, undated, p24.60 Malhotra, 2003, p222.61 Mutua et al, 1996, p182;
Escobar and Merrill, 2004, p36;Ferguson, 2004a, pp24–25.
62 Ferguson, 2003.63 Ferguson, 2003.64 Vance, pers comm, 2004.65 See Renaud, 1999, p760, for a
discussion of such processes inthe US.
66 Stein, 2004, p116.67 PRODEL, 2002.68 Cities Alliance, 2002.69 Silas, 2004.70 Septanti, 2004, p8.71 Murcia de López and Castillo,
1997, p173.72 Ferguson, 2003.73 Ferguson and Haider, cited in
Ferguson, 2003.74 Escobar, undated, p36.75 Stein with Castillo, 2005.76 Escobar, undated.77 Stein with Castillo, 2005.78 Smets, 2002, p9.79 Escobar and Merrill, 2004,
pp37–38.80 Escobar and Merrill, 2004, p41.81 Forero, 2004, p41.82 Prahalad, cited in Connolly,
2004b.83 Ratha, 2003.84 Ratha, 2003.85 Connolly, 2004b, p3.86 Ferguson, 2003.87 Cities Alliance, 2002, p3; Smets,
2002.88 Gold et al, 2002.89 Escobar and Merrill, 2004, p40.90 Cabannes, 2002.91 Cabannes, 2004.92 IADB, 2003.93 Albee and Gamage, 1996.94 Gitau, 2004.95 Smets, 2002, p129.96 Smets, 2002, p130.97 Escobar and Merrill, 2004, p39.98 Gitau, 2004.99 Gitau, 2004.100 IADB, 2003, p4.101 Vance, 2004, p142.102 Escalante, 2004, p59.103 Baumann, 2004.104 Hoek-Smit, 1998, p39.105 Stein with Castillo, 2005.106 Malhotra, 2003.107 Ferguson, 1999, p196.108 Escobar and Merrill, 2004, p58.
109 See, for example, Christen,2004, pxiii.
110 CGAP, 2004.111 Daphnis, 2004a, p3.112 Grameen Bank, 2004.113 Ferguson, 2004b, p4.114 Vance, 2004, p141.115 Escobar and Merrill, 2004,
pp45, 48.116 Biswas, 2003.117 Biswas, 2003.118 Van Rooyan, 2004.119 Christen, 2004, pxiii.120 Jones and Datta, 1999, p21;
Escobar and Merrill, 2004, p58.121 Escobar and Merrill, 2004, p61.122 Vance, 2004, p139.123 Escobar and Merrill, 2004, p62.124 Daphnis, 2004b, pp108, 110.125 Vance, 2004, p135126 Malhotra, 2003.127 Escobar, undated, p26.128 Stein with Castillo, 2005.129 Escobar, undated.130 Escobar and Merrill (2004,
p57) note that six of the eightagencies they profile offerlower interest rates, and oneof the other two agencies mayalso offer lower rates.
131 Hoek-Smit, 1998.132 Hoek-Smit, 1998, p38.133 Stein with Castillo, 2005.134 Escobar, undated, p19.135 Escobar and Merrill, 2004, p56.136 CGAP, 2004.137 Ferguson, 1999, p196.138 Malhotra, 2003, p221.139 Escobar and Merrill, 2004, p62.140 Daphnis, 2004b, p105.141 Arrossi et al, 1994, p63.142 Escobar and Merrill, 2004, p51.
This emphasis on women isalso true for microenterpriselending, although in some casesit has resulted in the woman ina family taking the loan but notbeing in control of theinvestment.
143 Malhotra, 2003.144 Van Rooyan, 2004.145 Stein, 2004, pp117–118.146 Biswas, 2003.147 Center for Urban
Development Studies, 2000.148 See concerns expressed by
Hulme, 2001.149 Malhotra, 2003, pp219–220.150 Lall and Lall, 2003, p15.151 Davies and Mahony, 2001, p15;
Pedro Jímenez, executive vice-president, Banco ADEMI,Housing MicrofinanceQuestionnaire, 7 March 2001.
152 Zaman, 2004, pp9–12.153 Hoek-Smit, 1998.154 Stein with Castillo, 2005.155 Forero, 2004, p41.156 Ferguson, 2003, p27.
119Small loans: shelter microfinance
NOTES

Community funds are of growing significance in assistingthe poor to address their shelter needs. As the role of thestate has diminished, increased emphasis has been placedon alternative strategies to support secure tenure, access tobasic services and improved dwellings. The increase inmicrofinance has resulted in a growing diversity ofapproaches to providing the small loans required to help self-build communities address their multiple needs. Communityfunds offer small loans to households but route these loansthrough community organizations. The emphasis oncollective loans is for many reasons; but one is that the loanssupport investments in land and infrastructure, which arenecessarily made by a group working together. This chapterdescribes community funds, identifying their keycharacteristics, and discusses trends within this sector. Itlooks specifically at a number of key challenges, notably theaffordability of their strategies and sources of funds.
It should be said immediately that it is difficult toassess their changing significance for several reasons. First,although the strategy is not new, there have been fewoverviews to date. Without an established baseline, it is notpossible to consider what has changed. Second, thedistinctions with microfinance are often not that clearlydrawn, with a graduation rather than a clear dividing line.As shown in Chapter 6, both community funds andmicrofinance seek to assist an incremental developmentprocess through the use of small loans. Community fundswork with group loans, thereby enabling them to addressthe needs of those without land and/or infrastructure. As aresult, they place greater emphasis on the priorities of thelower income families. They may also offer loans for housing;in general, these are also managed at the community level,although the investment takes place at the household level.Some community funds lend for income generation and usemore conventional microfinance approaches for theirincome-generation loans, further confusing the distinction.
WHAT ARE COMMUNITYFUNDS?The growth of shelter microfinance initiatives has beenparalleled by a further development – that of sociallyorientated savings and loans for shelter improvement.Community funds are financial mechanisms that encourage
savings through establishing and strengthening local savingsgroups, providing collective finance for shelter improvement(which may include any one or more of the followingactivities: land purchase, land preparation, infrastructureinstallation and service provision, as well as housingconstruction, extension and improvement). Communityfunds offer loans to groups due to their interest insupporting land and service acquisition. Their mostdistinguishing characteristic is the way in which funding isperceived – rather than the mechanisms of the financingprocess. Community funds use savings and loans to trigger adevelopment process – not simply to increase the access ofthe poor to financial markets. They seek to strengthen thesocial bonds between community members (building socialcapital) so that existing finance within the community canbe used more effectively and external finance can beintegrated within community development strategies.Significantly, they believe that small loans for individualizedinvestment in private dwellings cannot address the multipleneeds of the poor, and that finance and financial skills arerequired for tenure and investments in infrastructure andservices. Community funds are targeted at group borrowingand therefore may include those with lower incomes.
One approach common to some of the programmesgrouped together in this chapter is an emphasis on savingsfor shelter improvement and the use of collective strategiesboth to reduce the risks for the individuals involved and tobuild relations between low-income citizens anddevelopment agencies and/or the state. Collective saving andlending seeks to offer a number of administrative and,sometimes, political advantages. The programmes go beyondthe simple role of the credit agency to integrate financialand social approaches in the search for long-termdevelopment that works for the poor. Box 7.1 describes howsuch approaches have catalysed pro-poor social change inPhnom Penh, Cambodia. In this case, the management ofthe fund built relationships between civil society and themunicipality which resulted in a common recognition thatupgrading was a better development strategy thanrelocation. In other cases, community funds have a morelimited conceptualization and offer loans only for one (orsometimes two) specific activities.
As with many such development trends, there is nosingle source for the innovations around community fundsand the approach has emerged from a combination of
Community fundsoffer small loans tohouseholds butroute these loansthrough communityorganizations
C H A P T E R
COMMUNITY FUNDS 1
7

factors. And as with shelter microfinance, one of these hasbeen the recognition by housing professionals of theinefficiencies in housing investment that arise from a lackof access to loan capital. Other factors of notable importancehave been the following:
• Non-governmental organizations (NGOs) are seekingto use donor monies more effectively; there is also arecognition of people’s willingness to invest in theirown neighbourhood (land and infrastructure) anddwellings, suggesting an interest in repayment ofexternal finance.
• State agencies are attempting to find more effectiveways of addressing housing need and building basedon their experience of what has not worked in thepast. The growth of community-managedinfrastructure, such as in water, indicates thatdevelopment agencies (including nationalgovernments) are looking for new mechanisms toextend access to essential services.
• There is a growing expertise in poverty reduction anda greater awareness of the role of assets in securingimproved livelihoods. This has been coupled with alongstanding recognition that basic infrastructure isimportant in improving health with multiple benefits.
• More recently, there has been an awareness of thescale of differentiation within low-income groups. Asthe importance of reaching the poorest has grownwithin development, so has a willingness to look atnew methods that might be effective in securinginclusion.
Many microfinance enterprise initiatives are premised onthe understanding that increasing incomes is an effectivestrategy to reduce poverty. Shelter lending is, in part,consistent with that strategy, but also seeks to enablehouseholds to reduce expenditure, using their monies moreeffectively to achieve their goals. Community funds thatoffer comprehensive borrowing ‘windows’ are designedaround the premise that increasing incomes is simply onecomponent of a poverty reduction strategy. A number ofdimensions of urban poverty have been identified and Box7.2 outlines specific poverty reduction strategies to addresssuch features, which are embedded within the communityfund approach.2
While Table 6.1 differentiates between microfinanceand community fund approaches, the relationship betweenmicrofinance and community funds can best be representedas a continuum. At one extreme are agencies who seek tooperate according to the criteria of financial markets; at theother are those who offer highly subsidized loanprogrammes, with a premium being placed on the inclusionof those most in need. In between lies a range of agencieswho seek to blend a commitment to improved financialservices with the recognition that poverty has multiplecauses that cannot all be addressed through finance. Asnoted in Chapter 6, many shelter microfinance agencies uselower interest rates for shelter lending. Some have linkedup with more comprehensive development programmes that
offer support for neighbourhood development and (slum)upgrading. Equally, community funds seek to use morestringent (market-orientated) financial conditions withregard to their lending for enterprise development, whileplacing greater development emphasis on lending for tenuresecurity, infrastructure improvements and housing.
In practice, there is considerable overlap of interestbetween community funds and microfinance. Microfinanceinstitutions are anxious to consider new ways of reducing
121Community funds
Box 7.1 The Urban Poor Development Fund in Cambodia
Since the first democratic election in 1993, and increasingly after the economic crisis andgreater political stability after 1997, development and investment in Phnom Penh have escalatedsignificantly. As a consequence, commercial and public development agendas have collided withthe needs of the poor within the city. As elsewhere, the poor have been left worse off as aresult; they have been struggling to secure a place in the city in the face of aggressivecommercialization of land markets.
In 1998, the Urban Poor Development Fund was formed.The fund is a collaborationbetween the Squatter and Urban Poor Federation (SUPF), the municipality and local non-governmental organizations (NGOs).The fund was initially intended for shelter loans for acommunity relocated in an inner-city development, but has diversified into other areas inresponse to community needs. Between 1998 and 2003, more than 18 relocations of low-income communities took place, with great variance in the viability of the new sites.Thedevelopment of the fund has had to respond to such needs. Relocation was the only optionoffered to communities facing eviction.
Frustrated with the lack of alternatives, several organizations considered a new CityDevelopment Strategy. Building on the relationships within the fund, this emerged as a jointprogramme of the Municipality of Phnom Penh (MPP), the United Nations Human SettlementsProgramme (UN-Habitat) and the Asian Coalition for Housing Rights (ACHR), the SUPF andthe Urban Resource Centre, a local NGO.The organizations initiating the strategy believedthat developing a shared vision of the city’s development between various stakeholders wasessential. Preparatory studies for the strategy led to a consensus that in situ upgrading neededto be an option.
The fund used its fifth anniversary event (24–26 May 2003) to promote the strategy ofon-site community improvement.The approaching national election provided added incentivefor the government to launch the pro-poor upgrading initiative. Prime Minister Hun Sen gavethe opening speech, in which he announced his policy for the upgrading of 100 settlements inone year in Phnom Penh with 500 settlements in five years.Source: ACHR, 2004.
Box 7.2 Addressing urban poverty with community funds
Aspect of poverty Poverty reduction strategy
Income Enterprise development
Assets Housing and land investment
Poor-quality housing Housing and infrastructure investment
Inadequate public infrastructure Negotiations with authorities; improved infrastructure from community investment; community-managed investments
Inadequate basic services Negotiations with authorities; direct investment by the community; community-managed investments
Limited or no safety net Emergency funds and savings
Inadequate protection of Stronger community organizations; political negotiationspoor groups
Voiceless/powerless Stronger community organizations; federations and networks; political negotiations

poverty – many of them remain mission-led developmentagencies – while community funds face similar issues of loanand debt management and are anxious to learn about newtools and mechanisms so that they are better able to addresssuch management challenges. The continuum includesprogrammes that place more emphasis on collective aspects(including strengthening local organizations and improvingrelationships with political/state agencies) and others thathighlight market-orientated financial investments. Somemicrofinance agencies recognize that money is just oneaspect of what is needed. Banco Sol in Bolivia and others inEcuador and elsewhere have separated their credit activitiesfrom technical assistance services as they have grown; onegroup has concentrated on credit and another on technicalassistance (particularly marketing).3 Some conventionalmicrofinance agencies are very serious about seeking to addvalue to their financial strategies; they are careful to assessthe needs of their clients and adapt their programmesaccordingly.
TRENDSAs noted above, community funds are embedded in a socialdevelopment approach to addressing need. The small scale oftraditional housing programmes for the poor has led to asearch for more effective ways of improving housing andaddressing the shelter needs of the poorest at scale. Thechallenge has been to use the relatively small amount of fundseffectively and to ensure that those benefiting from theprogramme have a strong sense of ownership, driving anddeveloping the programme to meet their needs: savings andloans programmes offer these advantages. While slightlyhigher income groups can be assisted with programmes thatoffer only housing improvements, lower income groupsrequire more holistic development interventions. Securingland and services requires a collective effort and savingsprovides a good organizing basis for such efforts. Many ofthese programmes were piloted by NGOs who were workingwith groups in acute need of housing, perhaps under threatof eviction. Box 7.3 offers an example of the kinds of activitiesthat lie behind the development of some community funds.
While such programmes developed in tandem with theevolution of microfinance, they already had a significantlydifferent approach, with an emphasis on the collective and acomprehensive position on addressing development needsthat expanded beyond purely financial services.
As communities, sometimes supported by NGOs,became successful at securing land, they needed to accessfunds for upgrading and improvement. Some of the moneythey could raise themselves, and they could provide theirown labour; but this was not enough to finance the houseswithout any loan capital. At this point, securing financebecomes a major issue. NGOs have been using revolvingfunds as one option to assist families with finance. Oneexample is the work of the Carvajal Foundation in Colombia,which set up a number of programmes to assist with housingimprovements. Its approaches included setting up materialbanks in low-income settlements to assist small businessesinvolved in the production of building materials to securetheir market, thus helping to ensure that house builders canget access to what they need without high transportationcosts.4 Other traditions are characterized by the FundaciónVivienda y Comunidad in Argentina, which raisedapproximately US$600,000 from one Northern NGO in1987 for a fund that offered money under three distinctfunding ‘windows’: full subsidy; part loan and part subsidy;and full loan. Activities included income generation,improvements in services such as education, andneighbourhood improvements such as water supplies.5
The success of such initiatives built up confidenceamong NGOs, and more ambitious plans were developed.NGOs (and other civil society groups) began to considerways in which families could be assisted to save and todevelop mechanisms to draw in state subsidy funds. Thescale and effectiveness of NGO innovation began to bereflected in government programmes. NGOs argued thatsuch programmes deserved state support because theyoffered a real sense of capacity and confidence to low-income communities. Problems of selection and dependency(which were associated with more traditional welfareassistance) were avoided as participants were ‘self-selected’,perhaps through savings activities. Further benefits were lowadministration costs as management roles were taken on bythe community, and the fact that loan repayments enabledthe available subsidies to be ‘stretched’ much further thanwas previously possible when the full costs of housing weresubsidized. The vision was one of pro-poor, inclusivepoverty-orientated development. Such a tradition is inkeeping with the principles of social justice that are at theroot of many of the NGOs who instigated microfinanceprogrammes. NGO experiences, together with those of theUruguayan housing co-operatives during the late 1960s, ledto the design and development of a programme in Mexico,Fondo Nacional de Habitaciones (FONHAPO), which is oneof the earliest examples of state support for flexiblecollective loans channeled through multiple agencies forshelter improvements (see Box 7.4).
The willingness of some governments to explorethese processes has increased ambition among thoseinterested in working with these funds. Funding support
Securing land andservices requires acollective effort andsavings provides agood organizingbasis for suchefforts
122 Shelter finance: assessment of trends
Box 7.3 Catholic Social Services in Pakistan
Catholic Social Services began their housing loan programme in Karachi, Pakistan, in 1981when a group they were working with in Benaras Colony was resettled on the edge of the cityfollowing eviction.The community of 200 households had had their houses demolished.Theywere offered land far from where they were living; without any other resources, thecommunity remained homeless.The non-governmental organization (NGO) provided interest-free loans of 4000 rupees (US$160) to each household with a repayment period of threeyears.The loan size later increased to 6000 rupees.
As the programme expanded, it worked with more communities. Individuals in needwho came to the NGO were encouraged to form co-operatives that were able to manage thefinances. In general, the NGO worked through these co-operatives, which took collectiveresponsibility for loan management, including repayments. Maximum loans were just sufficientto build a single room. By 1993, the programme had expanded to 830 families, with some 347loans having been successfully repaid.Source: Ghouri and Nihal, 1993, pp18–25.

has spread from being primarily Northern NGO, notablythose with the larger budgets in Holland and Germany, toinclude national governments. In some cases, notably theUK and Holland, the programmes overlapped with self-helphousing traditions that had emerged during the 19thcentury and with long-established state support for owneroccupation. There were sufficient synergies to enable theexpansion of funding for these programmes. In a limitednumber of cases, funds were also sought from thecommercial banking sector within countries. The Societyfor the Promotion of Area Resource Centres (SPARC)accessed first the Housing and Urban DevelopmentCorporation (HUDCO), a state housing bank, and thenCitibank funds; however, in both cases guarantees wereneeded from European NGOs (see Chapter 6). Theseinitiatives benefit from a further trend, which was theincreasing realization by NGOs focusing on infrastructureimprovements that, in an era of cost recovery, soft loanfunds offered the best possibility to secure developmentassistance to expand access to services. NGOs such asWaterAid began to undertake increasing numbers ofprogrammes to improve access to water services thatcombined community management with soft loans to repaywater infrastructure investments.6
The growing interest of state agencies in communityfunds has been due, in part, to the movement of staffbetween the two sectors and, in part, to the recognized
mutual benefits from close collaboration. In countries suchas Chile, Mexico, the Philippines and South Africa,professionals with experience in housing NGOs have movedto posts in government poverty-reduction programmes. Theyhave begun to draw on multiple experiences to designhousing loan programmes to address the needs of the poor.It should be emphasized that this discussion is not aboutgovernment programmes to provide conventional mortgagefinance to lower middle-income households, but about non-conventional lending programmes. A further example is theCommunity Mortgage Programme (CMP) in the Philippines(see Box 7.5).
Part of the motivation for state involvement in suchprogrammes has been an awareness of the need for povertyreduction in urban areas, coupled with the knowledge thatneighbourhood and housing improvement is essential.Previous solutions were recognized to have failed and fromthe 1980s onwards there was a growing interest in workingwith the self-help capacities of the poor. The earliergeneration of NGO programmes was restricted to a specificgroup that the programme works with and/or apredetermined spatial area. State programmes have to growbeyond such restrictions in order to achieve scale andinclusion (within the specific rules of the programme). Box7.6 explains the evolution of the community fund processin Thailand as it emerged from more traditional approachesto addressing housing need.
123Community funds
Box 7.4 Fondo Nacional de Habitaciones (FONHAPO), Mexico
Source: Connolly, 2004a.
FONHAPO is a state institution which still has a role in Mexicangovernment housing policy; but its most significant internationalinfluence stems from its work in the early and mid 1980s.FONHAPO sought a strategy that would enable it to reach the 60to 70 per cent of the population whose incomes were below 2.5times the minimum wage. During this period it provided loans tointermediate organizations, either public, private (such as financialinstitutions and development trusts) or social (co-operatives andother legally constituted social organizations). Five types ofhousing project were financed: sites and services; incrementalhousing; home improvements; finished dwellings; and productionand distribution of building materials. FONHAPO, in contrast tothe other housing institutions, progressively favoured financingpartial housing solutions over finished dwellings.
FONHAPO offered a flexible range of credit packages,including small loans, on a large scale.The value of the loans wasexpressed in terms of multiples of the local daily minimum wage,the maximum value being 2000 minimum wages (about US$6000in 1988).The amount of money loaned depended upon theincome of the head of household.Those earning less than theminimum wage could be loaned up to 1200 daily minimum wages(about US$3700 in 1988), those earning between 1 and 1.5minimum wages could be loaned up to 1600 daily minimum wages(US$4900) and those earning between 1.5 and 2.5 minimumwages could receive up to the maximum loan of 2000 minimumwages.The credit limits for sites and services, incremental housing,home improvements and finished housing were 600, 2000, 1150
and 2000, respectively (US$1847, US$6157, US$3540 andUS$6147 in 1988).
A deposit of between 10 and 15 per cent had to be paidby the final beneficiaries. An initial subsidy of between 15 and 25per cent was offered on the value of all loans. Additionally, afurther 15 per cent would be offered for prompt repayment.Thisimplied a direct subsidy of 30 per cent of the loan value for thelarger loans for incremental or finished housing, and up to 40 percent of the loan value for smaller loan packages. On the basis of amaximum payment of 25 per cent of the beneficiary’s monthlyincome, the amount and number of repayments were calculated interms of percentages of minimum wages at the time ofcontracting the loan.These payments would escalate according tothe increase in minimum wage. In this way the real value of loansrepayment was maintained approximately in line with inflation. Inall, it was estimated that the total subsidy to the beneficiarieswould average at 50 per cent – that is, the repayments from twoloans would finance one more of similar amount.
Between 1982 and 1988, just over 10 per cent of newdwellings, including core houses, financed by the public sector canbe attributed to FONHAPO, using just 4 per cent of the availablefunds.This was accomplished by giving high priority to smaller loanpackages for core housing and site and services, and to public andprivate housing organizations. Between 1982 and 1994,FONHAPO finished 203,657 core housing units, 115,870 sites-and-services projects, 179,661 home improvement loans and 1730finished houses.
There has been increasing interest in communityfunds during the last decade. The growth is supported by ageneral acknowledgement that small-scale lending has beensomewhat successful and that urban poverty is growing. Thetrend towards small loans for shelter improvements hasreceived a considerable boost by the popularity ofmicrofinance. For NGOs and governments seeking to put inplace comprehensive and integrated programmes to addressurban poverty, experimentation with loan packages thatincorporate savings and building collective communitycapacity have been popular. There are two noteworthy
current trends related to the development of such funds:first, the growing interest by local government in theseapproaches, in part related to the use of such funds toextend essential infrastructure; and, second, the expansionof Shack or Slum Dwellers International (SDI), acommunity/NGO network whose strategies incorporatesavings and lending activities for shelter improvements.
Decentralization to local government in both Asia andLatin America is opening new possibilities, both in terms offunding and of meeting responsibilities towards theircitizens. In Latin America, democratization anddecentralization appear to be associated with increasingsupport for shelter improvements, including communityfunds and microfinance. In Forteleza, Brazil, the localgovernment was willing to contribute to innovations usingthe mutirão tradition of collective building.7 Thelongstanding participatory budgeting process in BeloHorizonte, Brazil, has extended outwards frominfrastructure and services to address housing need; themunicipality built 1600 units up to 2002, just under half asa result of consultations within the participatory budgetingprocess.8 As the quality of consultation has improved, somunicipal housing strategies have begun to reflect thepriorities of the poor, moving away from medium-riseconstruction to land titling in squatter and informal areas.In Maracaibo, Venezuela, the plight of the poor hascontinued despite oil wealth. Recognizing the need toaddress poverty, a new municipal programme has offeredloan finance; additional funds were then offered by a localNGO, Nuevo Amanecer. A first round of 50 loansdemonstrated the ease of the process. The municipality,NGOs and grassroots organizations are committed toexpanding this fund and making it available to otherneighbourhoods. Financial support has recently beenobtained from the Fondo Intergubernamental para laDescentralización through the local municipality, and theprogramme has been expanded to reach 267 households.9
In Asia there is a similar interest at some local levels.In Kathmandu, the Urban Community Support Fund (UCSF)is a pool of resources which the urban poor can draw uponto assist them with the development of their communities.The UCSF was launched on 30 May 2004 at the city hall,with a financial contribution from the mayor.10 In thePhilippines, local authorities have been drawn into thefunding process over a longer period through the CMP,which has allowed them to be ‘originators’ (that is, tosupport local communities through the process and providetechnical assistance with a small fee payment attached). Insome cases, they have made their own resources available –for example, in the city of Muntinlupa in Metro Manila, overUS$1 million has been provided to assist families within theprogramme.11
A further area of interest is the use of communityfunds for utility investment, for which the local authoritymay be formally responsible. Infrastructure investments andland purchase that involve loan finance have generallyrequired some level of external development supportbecause the technical issues may be more complicated andbecause a collective investment is generally required.
124 Shelter finance: assessment of trends
Box 7.5 Community Mortgage Programme (CMP), the Philippines
The Community Mortgage Programme (CMP) is a housing finance programme in thePhilippines that allows poor families and households living on public and private lands withoutsecurity of tenure to have access to affordable housing. Between 1989 and 2003, it assisted140,650 poor families in securing housing and tenure in 1126 communities, with a total loanvolume of 4.404 billion Philippine pesos and an average loan size of 31,000 Philippine pesos.
The CMP was established in the post-Marcos era of the Philippines in an attempt toaddress the housing needs of the poor. Lending is for residents at risk of eviction who haveorganized themselves into a community association. Each group has an ‘originator,’ generally anon-governmental organization (NGO) or local government that is responsible for assistingwith the development of the land.The average loan size in 2001 was US$665 per household.The repayment period is 25 years and the (state-subsidized) interest rate is 6 per cent. Whileoriginally conceived of as a housing loan programme for groups of the urban poor, the highprice of land (especially in Manila) means that many groups borrow only for land purchase. Inthese circumstances, residents and community associations use multiple strategies to secureinfrastructure and improve their homes.Source: Porio et al, 2004; CMP Bulletin, 2004.
Box 7.6 The evolution of shelter improvement strategies in Thailand
The concept of upgrading slums in Thailand began during the late 1970s. At first there wereattempts to secure cost recovery for the improvements; but there was little support withinlow-income communities. As a result, a subsidy model was used and 128,000 householdsbenefited from improvements financed by the National Housing Authority. However, landtenure was not offered and the community had little say in what was done.
During the early 1990s, the conventional strategies of medium-rise rental flats andrelocation were used by the state to address the needs of those being evicted from inner-cityland as rapid economic growth took place. In keeping with other trends, there was awillingness to decentralize these funds for upgrading to municipalities. However, at the sametime, the Urban Community Development Office (from 1992) began to build up the capacity oflocal communities through savings and loan funds, which offered finance for income generationand shelter improvements. Several hundred savings schemes rapidly emerged and thesecommunities began to negotiate with their local municipal offices.The office included theUrban Community Environment Activities Project, which offered small grant funds to savingsgroups to undertake further neighbourhood improvements.This project required communitiesto work with municipalities and other city-based professionals (such as university and NGOstaff), and the results demonstrated just how effectively communities could use grants.
As the national funds for upgrading were decentralized, some municipalities began towork with the communities who were already improving their own situation. When thegovernment made a commitment to address the needs of 300,000 households in 2000 urban-poor communities in 200 cities within five years (the Baan Mankong programme), the strategyof offering infrastructure grants together with subsidized housing loans to organized localcommunities was accepted.Source: CODI, 2004.
However, there has also been experimentation (andincreasing interest) in lending for infrastructure. Box 7.7describes a fund for microhydro investments in remotePeruvian villages, while Box 7.10 describes a fund for waterinvestments in Faisalabad, Pakistan. In both cases, newrelationships with local authorities needed to be secured.Even where the local authority does not directly offerfinancial support, it may be interested in working with thefund (once they realize the potential) to improve localservices. In the case of microhydro investments, a furtherlinked component has been lending to individuals forenterprise development once the electricity supply has beensecured. A similar example is Genesis Empresarial inGuatemala, which also lends for electrification (in ruralareas) and potable water projects (sometimes with publicassistance).12 In this case, the groups are very small,between 4 to 12 members. Fundación Pro Vivienda Social inArgentina primarily provides housing loans, but will extendthese to provide infrastructure loans to small groups wherethere is clear evidence of solidarity and strong cooperation.13
WaterAid is a UK NGO that assists in the provision of water.In its work in Bangladesh, WaterAid finances seven localNGOs working in Dhaka and Chittagong to provide servicesusing a full-cost recovery strategy.14 Local communities areprovided with a range of facilities, including water pointsand sanitation blocks. Management committees collect feesthat repay construction and installation costs, and whichcover maintenance. The capital costs are repaid to the NGOswho use these monies to finance further investment.
Contrasting approaches to community funds can beseen in Namibia, where there is both a government fund(the Build Together programme) and civil society fund (theTwahangana Fund) managed by a local NGO, the NamibiaHousing Action Group, on behalf of the Shack DwellersFederation of Namibia. Box 7.8 describes the Build Togetherprogramme and the work that it does to support housingdevelopment. The Build Together fund is relatively close toshelter microfinance in that it supports individual housinginvestments, albeit through a local committee. TheTwahangana Fund is financed by international developmentassistance (Northern NGOs) and the Namibian government.It provides loans to savings groups in order to developservices and income-generation activities. To date, thegovernment has contributed Namibian $2 million(US$300,000) in loan finance to the fund and almostNamibian $2.5 million (US$ 385,000) has been donated byinternational development assistance. In addition, thegovernment has routed Namibian $4.35 million(US$670,000) of Build Together loans through Twahanganato help to reach lower income households who are typicallyinvolved in Build Together. The civil society fund givessmaller loans (for land purchase, infrastructure developmentand enterprise investment) and is acknowledged by thegovernment to provide essential support to assist low-income groups in benefiting from the state programme.
The Shack Dwellers Federation of Namibia is amember of Shack/Slum Dwellers International (SDI). Withinthe NGO sector, there are numerous individual initiatives inthis area; but there is one multi-country initiative of
particular significance. SDI is a network of grassrootsorganizations and support NGOs who share a focus onsavings and credit as one component of a programme totransform relations within low-income communities, andbetween local communities and local authorities. WithinSDI, collectively organized and locally managed savings fundscomprise a strategy to reconstitute grassroots organizationsinto democratic and accountable organizations. Throughsavings, communities learn financial skills and how tomanage systems of financial accountability. Lending forhousing, land and infrastructure responds to the localpriorities of members.
Shack/Slum Dwellers International has emerged froman NGO–community-based organization (CBO) partnershipbetween SPARC, the National Slum Dwellers Federation andMahila Milan in India, and their peer exchanges with similargroups that emerged in South Africa. Over the last 15 yearsthis has evolved into an international movement withaffiliates in more than 12 countries. SDI groups havespawned a host of local community-owned and NGO-administered funds. In Cambodia, the Philippines, SouthAfrica, Nepal, Sri Lanka, Zimbabwe and Kenya, federationgroups have established their own funds, which they lend tosavings schemes. State contributions have been obtained inSouth Africa, Namibia and, more recently, Nepal. Otherwise
Through savings,communities learnfinancial skills and
how to managesystems of financial
accountability
125Community funds
Box 7.7 A community fund for electricity services in Peru
A community fund to assist in the extension of electricity through small hydro installations wasstarted in 1994 in Peru under an agreement between Intermediate Technology DevelopmentGroup (ITDG) and the Inter-American Development Bank (IADB).The finance model hasdeveloped over time and has demonstrated that loan finance to small villages and privatefarmers can leverage local capital and government funds for locally owned and sustainable ruralelectrification.The financial model combines subsidized loans and technical assistance throughshared efforts between technical cooperation agencies and government institutions (local,regional and central governments). Its purpose is to meet the small-scale electricityrequirements in isolated rural areas of Peru that cannot be served with the conventional gridsystem.To date 26 loans, totaling US$850,000, have been made for the same number ofinstallations, which has leveraged US$3.5 millions – a total installed capacity of 1.6 megawattsbenefiting 5000 families
The loans range from US$10,000 to US$50,000, with a 10 per cent interest rate,reimbursement terms of one to five years and variable periods of grace depending upon thefinancial situation of the client(s). Guarantees vary slightly depending upon clients’circumstances and whether they belong to the public or private sector. Borrowers includelocal governments, small entrepreneurs (mostly farmers and/or livestock breeders), farming co-operatives and peasant communities.The installations have been ranging from 4 kilowatts to130 kilowatts; the larger ones in villages, the smaller for privates businesses.Villages (the publicsector) must show a positive cash flow, including short- and medium-term investment plans,whereas private entrepreneurs must submit actual and collateral guarantees.
The project’s total capital now stands at US$700,000, of which US$400,000 representsthe initial capital (under the 1994 agreement) and US$300,000 the increase approved by theIADB in 2000. During the first part of the project, the focus had been the implementation ofhydro schemes, while since 2001 there has been a very important component of promotingsmall-scale business and employment-generating initiatives, utilizing the power generated.
Loan recovery is a significant and complex task that requires careful monitoring ofclients, frequent consultations with the bank and notices of payment deadlines. In the event ofany delay or non-payment, the loan agreements contain regulations that permit legal recoveryactions. So far, no enforcement actions have been required. A small consulting firm, AFIDER, isused for this work and to conduct financial appraisals of each project.Source: Sánchez-Campos, 2004.
these urban poor funds are financed by internationaldevelopment assistance and by local fundraising. In somecases, such as in Zimbabwe, the savings scheme membersalso contribute to these national funds. The IndianFederation has developed a further model that integratesloan and subsidy finance within the construction process.More recently, it has been pioneering the Community-ledInfrastructure Financing Facility (CLIFF) programme (seeChapter 6).
SDI affiliates attempt to secure state contributions inorder to enable the poor to afford adequate improvementsin shelter. Box 7.9 describes how the People’s Dialogue onLand and Shelter and the South African Homeless People’sFederation used the subsidy funding that they secured inSouth Africa. Through their own community fund (uTshaniFund), local savings schemes facilitated access to statesubsidies by providing bridging finance, thereby enablingcommunity groups to develop for themselves and at theirown pace. The analysis of their experience suggests that thisapproach is effective, generating secure assets for some ofthe poorest households. However, during recent yearsproblems have been caused by considerable and continuingdelays in securing the subsidy funds.15
This example (and others) demonstrates the potentialof such strategies; but it also highlights the issue of funding.
Securing an adequate capital base is difficult for non-state(and, sometimes, state) initiatives, as has already beendiscussed in the case of shelter microfinance (see Chapter6). The situation is more complex for community fundsbecause of the interest in providing subsidy and increasingaffordability.
FUNDING SOURCES The importance of mixed funding sources is evident from anumber of examples and, notably, the study of a number ofcommunity fund programmes.16 In some cases, funds havebeen established by government and located within a stateagency with access to subsidies. In other cases, the fund hasbeen set up by civil society organizations and financedthrough a combination of state funds, NGO monies,community contributions and, generally, internationaldevelopment assistance agencies. In both cases, thecommunities may make direct contributions to the fundthrough deposits to secure loans.
An important and common characteristic ofcommunity funds is that some subsidy is provided – eitherthrough state funds or international development assistance.This is a further significant difference with regard toconventional microfinance and its individualized housingloans.17 While conventional microfinance programmes mayoffer a subsidy, in general there is an understanding that thisshould be avoided. Within community funds, greater priorityis placed on achieving poverty reduction goals andneighbourhood improvement. Subsidies may be needed forinstitutional survival if interest rates are below the levelrequired to maintain the real value of the fund. Equally oralternatively, subsidies may be required to reach everyonein a community or to reach very low-income communities.These funds are viewed as an alternative strategy forachieving equitable development, rather than an attempt tobring financial markets down to a traditionally excludedgroup. In this context, rather than the perception being thatmoney is lost through a subsidy, it is considered that fundswhich simply grant finance are used effectively becauseownership is strong and some of the investment made isreturned through repayments.18
There are several routes through which subsidies aredelivered. The primary sources are direct subsidies, interestrate subsidies, additional support (for example, communitydevelopment and technical assistance) and unintendedsubsidies when delayed payment and/or default occur. Someof the different approaches can be exemplified thus:
• In Faisalabad, the Anjuman Samaji Behbood (ASB) hasnot been charging interest on loans from their fundto improve water supplies (see Box 7.10). Technicalassistance was initially provided by another NGO, theOrangi Pilot Project, to ASB free of charge. ASB hasalso been assisting the community in which it worksfree of charge.
• In the Urban Community Development Office (nowthe Community Organization Development Institute)in Thailand, the associated housing loan activities
Lending forhousing, land andinfrastructureresponds to the localpriorities ofmembers
126 Shelter finance: assessment of trends
Box 7.8 Build Together, Namibia
The Build Together programme in Namibia was established in 1991 (operational from 1992) inorder to offer financial support to people who use self-help efforts to construct their ownhousing.The programme lends money to low- and very low-income groups and families inurban and rural areas who are thought to be too risky by the commercial financial institutions.The programme offers loans for land purchase, housing and a range of infrastructure andservices. Loans vary between US$460 and US$4900, with a graduating interest rate andrepayment period of 20 years.The interest rate is 5 per cent for loans of betweenUS$460–$3700 and rises to 9 per cent for the maximum loan of US$4900.The implementationof the programme has now been decentralized to local authorities. Local Build Togethercommittees with multi-stakeholder membership, including representatives of those receivingloans, are established to oversee the implementation of the programme.The role of thesegroups is to identify communities and families in need of housing or housing improvement intheir area. Groups should also consult with individuals on how the community wants to solvetheir problems, prepare an implementation programme and submit it for funding.Thecommittee checks the credibility of loan applicants and monitors their building. It also plays akey role in monitoring the repayments of the borrowers.
There has been a very high degree of participation of women in the programme, withover 45 per cent of the beneficiaries being women-headed households.The programme seeksto encourage more women to take part, thus enabling them to learn building skills and to beinvolved in the process.They will also be encouraged to form savings and credit societies tomeet their regular credit needs, as well as to improve their houses. Families who wish tobenefit from the programme are encouraged to set up a local organization for theirsettlement.The rules stipulate that only those living within the settlement can be officebearers, although external advisers can be appointed.This group negotiates with the BuildTogether committee to secure loan finance to develop the area.
Since 1992, 11,187 families have been supported to improve their shelter. Localauthorities have been assisted to build 323 houses for those in special need and 2830 dwellingshave been created from the redevelopment of previous ‘single quarters’ areas. A further13,656 families have benefited from the upgrading of informal settlements.Source: Helao, 2004.

charge an interest rate of 3 per cent, which is cross-subsidized by a higher interest charged oncommercial lending. The aggregate interest chargesaim to cover inflation and administration, not toprovide an equivalent market return on capital.Technical support is provided free of charge. Shortlyafter the office merged with another organization andbecame the Community Organization DevelopmentInstitute, the government introduced the BaanMankong programme, which offers grants forinfrastructure with the community, with additionalmonies for re-blocking and relocating.
• In Peru, the ITDG fund to extend electricity suppliesthrough microhydro is designed to facilitate theprocess of leveraging additional resources from localauthorities, with success in some cases. The interestrate charged to borrowing communities is 10 per centa year, well below microfinance rates.
Direct subsidies. As noted above, grant-based subsidies maybe offered to supplement loans and extend the scope of theprogramme. In Fortaleza, Brazil, the Cearah Periferiadeveloped two programmes during the mid 1990s. In CasaMehlor, Brazil, with local authority participation, the fundingdelivered to households was one -third saving, one thirdsubsidy and one third loan.19 A further programme, PAAC(Programa de Auto Ajuda e sistenciana Casa), wasundertaken without local authority financial support and thesubsidy fell by 50 per cent to one sixth of the availablefinance, with an additional loan element making up thedifference. In Thailand, the Baan Mankong programme ofthe Community Organization Development Institute, aparastatal development agency, offers infrastructuresubsidies to organized communities for each family ofUS$625 for in situ upgrading, US$1125 for re-blocking andUS$1625 for relocation.20 Additional loan funds are availablefor housing improvements. In Guatemala, GenesisEmpresarial assists the groups who receive loans for waterand electrical supplies to apply for public grants.21
Bridging finance for state funding. In a small number of cases,community funds have been used to bridge finance statedirect subsidies, enabling them to be used by communitiesin ways that more closely follow a locally driven developmentprocess (see Chapter 5). In these cases, the direct (capital)subsidy is not attached to the community fund as such; butthe fund is a means of obtaining the subsidy. In South Africa,the South African Homeless People’s Federation and thePeople’s Dialogue pioneered a new route for the state subsidythat funds land, infrastructure and a dwelling unit (asdescribed in Box 7.9). The loan fund of the federation, theuTshani (or grassroots) Fund, helped to spread the use of thePeople’s Housing Process subsidies – a particular formdesigned for self-help housing but not widely used,accounting for only 2 per cent of the total number of subsidyreleases.22 In India, SPARC, the NGO that works with theNational Slum Dwellers Federation, provides local groupswith development finance (bridging loans) to enable them tobuild and, hence, secure access to state subsidies that can
only be drawn down once developments are complete. Inboth cases, communities add to loan releases with their ownsavings. In the Philippines, delays with the CommunityMortgage Programme (CMP) resulted in the NGOs raisinginternational development assistance to enable them toestablish a fund to bridge finance CMP funds. In other cases,such as in Chile, NGOs such as Cobijo have also beenworking with low-income residents to assist them inaccessing the state housing subsidy programme.23
One advantage for the communities involved incommunity management options within such programmes(or in the context of any self-help initiative) is lower costsor – for a fixed subsidy amount – improved housing. Forexample, the housing developed by the National SlumDwellers Federation in India is designed to maximize theuse of the available subsidies. In Sholapur, Maharashtra, theNational Slum Dwellers Federration (NSDF) has developeda design and building strategy that secures terraced houses
127Community funds
Box 7.9 Adding value: The uTshani Fund, South Africa
The uTshani Fund of the South African Homeless People’s Federation was set up in 1994 toprovide an opportunity for federation members to experiment with a self-build approach tohousing. It was hoped that success in this regard would lead to greater government willingnessto release housing subsidies directly to organized poor communities rather than throughcommercial developers. From 1995 to 1999, the uTshani Fund received substantial grantfunding, including 10 million rand (US$1.5 million) from the South Africa Department ofHousing and many millions more from European donors who supported the federation’sstrategy. It on-lent this money to federation members who used it to start building houseswhile waiting for subsidy approval. During this period the uTshani Fund facilitated theconstruction of almost 15,000 houses, all of them larger and of better quality than comparabledeveloper-built products.
The uTshani Fund provides several positive examples of a way forward for SouthAfrican low-income housing finance. First, accessing finance directly and controlling its useallowed federation members to produce much better houses than the Reconstruction andDevelopment Programme (RDP) driven model that has dominated the post-1994 housingdrive. Second, uTshani showed that ordinary households could manage external housing financesuccessfully and at low cost if supported by an appropriate institutional framework with clearrules.Third, uTshani was able to act as a financial management tool for community-basedresidential land acquisition and development, allowing the federation to produce some of SouthAfrica’s best examples of community-driven housing.
Taking a somewhat conservative view of the benefits secured, making modestassumptions about the value that has been generated and only considering those benefits thatcan be quantified financially, the development investment in the People’s Dialogue on Land andShelter and the South African Homeless People’s Federation has created a net present value of540 million rand (in 2000 prices) or US$47 million. In just eight years, the uTshani process hascreated assets worth seven times the value of the original investment.With average monthlyincomes for federation members of 700 rand, these assets have directly contributed to addingto the well-being of some of South Africa’s poorest urban citizens.The overwhelming bulk ofthe value added is attributable to the housing that has been developed. In contrast to muchprivately developed state housing in South Africa, a federation house is worth considerablymore than the resources put into it.Values of three to eight times the cost of the buildingmaterials and skilled labour have been suggested and sometimes offered by potential non-federation purchasers, although few federation members have been interested in selling.Thevalue of federation houses stands in sharp contrast to the experience of many RDP housingdevelopments, where beneficiaries have resold their new houses at far less than the amountspent on them by the state.Source: Baumann and Mitlin, 2003.

for 62,000 rupees. There is a subsidy of 40,000 rupees, andhouseholds use savings or borrow to cover the additional22,000 rupees. While the NSDF has built 350 houses, tentimes this number have been built by local trade unions andfinanced by the state. Until the NSDF started buildinghouses, the cost of such a basic unit was 100,000 rupees –with a subsidy of 40,000 rupees, this left a large amount forthe families to find. After seeing what the NSDF could do,the costs in the other projects fell to 75,000 rupees.24
Interest rate subsidies. As noted in Chapters 4, 5 and 6 ofthis report, there is widespread use of lower interest ratesin the case of shelter loans because of the longer periods ofrepayment and in order to improve affordability, recognizingthat while shelter improvements may assist incomegeneration, this is not necessarily the case. State-financedcommunity funds are associated with subsidized interestrates. This discussion is elaborated upon in ‘Terms andconditions’.
Delayed repayment. In the more successful programmes, it isevident that community groups generally take repaymentresponsibilities very seriously. Even if the subsidy is greaterthan for other programmes, higher collection rates may assistin making up this shortfall. For example, in the Philippines,
the CMP has the highest collection efficiency rate (CER) of75 per cent compared to the other government housing loanprogrammes, such as the Unified Home Lending Programme(UHLP), which has a lower collection rate of 54 per cent.25
By 2004, the CMP collection rate had risen to 78.67 percent.26 The CMP is assessed as being among the most costeffective of state housing programmes, with an overallaverage loan amount of 27,946 Philippine pesos (aboutUS$665) per family, which accounts roughly for 15 per centof the average loan amount of other housing programmes.
Subsidies may be offered through measures to allowdelayed repayments. Several experiences suggest that thereare significant delayed repayments that reflect the economicsituation at the household, local, city and national level, andthat communities are unlikely to be able to manage to securerepayments from all their members at any given point intime.27 In part, this reflects the ability of communities tomanage collective repayments for the benefit of all members:
• SPARC (India): Our system never says that repayment is 100per cent! We discovered that about 65–70 percent of communities were able to repay on timein any single month. The others have a problemand need longer to repay. Now we assume that,at any given time, there will be 30–40 per centof people who don’t have money in their pocketfor that period. It’s not designed in this fantasythat it is 98 per cent. We are not saying thatpeople don’t repay that money; but we alwaysfind that about 30 per cent of people need toextend beyond the initial point. (ACHR, CODIand IIED, 2004)
• Build Together (Namibia): Our general experience is that women are verygood at completing the programme; but menare not so good. The loan recovery rate is about75 per cent. The groups that work with theShack Dwellers Federation of Namibia, they arebetter able to manage these problems. (ACHR,CODI and IIED, 2004)
• Maracibo (Venezuela) has a savings process that hasdeveloped into a loan programme. Approximately 30per cent fall into a grey zone, and there are manyreasons for this. One reason comprises the economicdifficulties that have been experienced by some LatinAmerican economies. People have to manage thiseconomic crisis and it is difficult for them all tomanage it easily. Generally, after some time, whenpeople begin to cope with their difficulties,repayments start again.
In Thailand, several groups were forced into difficulty at thetime of the financial crisis during the late 1990s. The UrbanCommunity Development Office offered rescheduling loansat zero interest rate to enable communities to sort out theirproblems.28 This was successful in offering a period in whichpeople could re-establish their livelihoods and continuepaying.
128 Shelter finance: assessment of trends
Box 7.10 Funding water improvements in Pakistan
Faisalabad is one of Pakistan’s largest cities.Two-thirds of Faisalabad’s population live in areaswith little or no official provision for services, and most new housing and land developmentstake place without official approval. Less than half the city’s population have piped water andless than one third are connected to the sewer system.The Anjuman Samaji Behbood (ASB) is anon-governmental organization (NGO) active in the city.The area in which they are working isDhuddiwala – one among many informal settlements in Faisalabad – with a population of 8080in 1999.
In 1994, ASB developed a successful microcredit programme for local businesses.TheNGO agreed to help the community secure water improvements. Staff used and adapted themodel developed by the Kararchi-based NGO, Orangi Pilot Project.The model requires thatthose inhabitants of each lane within a settlement that want improvements have to organize andwork out how to pay for the immediate cost of the water supply and sewer infrastructure andthe connection charges.The Water Supply Committee felt that before such a process couldhappen, it needed funds to lay the main pipeline to the water mains.Then, individual lanes’inhabitants could lay their own distribution lines and households would connect to them and paytheir share, so the project costs would be recovered. A loan for a revolving fund was receivedfrom WaterAid to cover the cost of laying 1100 running feet of main pipeline.The communityinvested 1,028,367 rupees to complete this work (around US$18,700) which was only one thirdof the cost of water authority initial estimates for this project (3.2 million rupees). A self-financing piped water supply and underground sewer system were developed between 1995 and1999, with 253 houses benefiting from in-house connections to water and 1300 houses withsewers. By 1999, 73,500 rupees had been recovered from the WaterAid loan (300 rupees perhousehold).Within the first three years, slightly more than 30 per cent of households had beenconnected to the system.The Water Supply Committee was responsible for collecting paymentsfor water connections, keeping accounts, purchasing construction materials and supervising theconstruction of the main line and the distribution lines in the lanes.
Many other communities are now asking ASB for technical assistance in laying sewagelines, and a second phase of the programme is under way, developing a new collector sewer toserve 1000 households.Source: Alimuddin et al, 2004.

While the need for a subsidy might imply a lack ofscale, some of the programmes described here have beensuccessful in reaching large numbers of those in shelterneed. Rather than attempt to be viable within financialmarkets, such programmes have sought expansion throughstate poverty reduction programmes. In some cases, theprogramme use loan finance to access subsidies; in othercases, the state subsidy is integrated within the programme.The belief is that community funds should be able todemonstrate their advantages and mobilize the politicalsupport needed for their continuation. Sources of fundingare both national governments (in some instances) anddevelopment assistance. While many of the originalsupporters of this work were Northern NGOs (notably,Cordaid, Homeless International, Misereor and SELAVIP),international development assistance agencies have becomeincreasingly interested in supporting such initiatives.Funding for the initiatives described here has been providedby the UK Department for International Development(DFID), the European Union (EU), the Inter-AmericanDevelopment Bank (IADB) and the Swedish InternationalDevelopment Agency (SIDA).
A further source of finance is that of commercialfinancial institutions. A number of groups who managecommunity funds have sought to draw in commercial banks.At a minimal level, loan funds are released through banks,thereby encouraging the poor to see such institutions assomething that they might use. In CLIFF, a donor-financedprogramme working with SPARC, the National SlumDwellers Federation and Mahila Milan in India, there is anexpectation that urban poor groups will become strongenough to be able to borrow from the banks. There is alsothe assumption that the banks will recognize their financialresponsibilities and develop ways of reaching the poor.However, there is an increasing recognition that the answermay not be to extend formal banking services to low-incomecommunities since this may be expensive and it may bebetter for the community to organize it for themselves. Inresponse to the economic crisis and the recognized need torestructure the financial system, there is an ongoing reviewin Thailand. Communities explained to the review group thatthey had access to financial services which they provided forthemselves. The committee had been thinking of taking thebanking system to the grassroots level; but after the meetingthey changed their minds and were looking at how the banksshould work with the grassroots financial systems. Therewas no longer talk of formal and informal systems – therewas a recognition that all groups are part of a whole and thebest solution may not be to integrate the informal with theformal.
TERMS AND CONDITIONSThe emphasis on local funds has resulted in a complexity ofarrangements within community funds themselves. In thesimplest form, the fund passes a loan to a community for aspecifically defined shelter-related activity. The communitythen collects repayments and passes them back to the fund.In some cases, communities also manage local revolving
funds (capitalized by their own savings), which are used togive small loans to members for multiple purposes and whichare then augmented by the larger-scale community fund. Asa result, a wide variety of terms and conditions may be found.
Strengthening collective capacity: savings
Savings plays a central role in community funds. However,the programmes may differ in the speed and the intensity ofsavings. This difference reflects both the orientation of theprogramme itself and the possibilities within differentcountries. For example, in a large number of countries(including those with experience of informal savings andloan mechanisms), communities have been sceptical aboutthe value of savings for shelter investment, and loan financehas been provided rapidly once the savings commitment wasfulfilled. This is particularly true of countries that haveexperienced rapid inflation and/or where the state hasconfiscated or temporarily frozen savings.
These programmes are primarily orientated towardsurban-poor neighbourhoods which often have insecuretenure and inadequate services, with families who are usingself-build strategies to provide themselves with housing.They are intended to benefit those without secure landtenure, adequate basic services and/or suitable housing. Asalready noted, in many cases, emphasis is put on collectivebenefits and on reaching the poorest. In some cases, wherefunds are restricted, benefits may be limited to particularimprovements. For example, some funds, such as theTwahangana Fund in Namibia, may prioritize land tenure andbasic services with the understanding that a full package islikely to be too expensive for many residents.29
As noted above, while finance is integral to theseapproaches, the role of finance is set within a comprehensivedevelopment approach. Finance becomes the means to buildstrong communities, as well as the resource needed toimprove material conditions. The emphasis is on usingsavings (occasionally lending activities are the primarymechanism) to build the collective capacity of the communityto address their development needs. There are severalreasons for this. First and foremost, there is theunderstanding that development that is affordable for theurban (and, sometimes, the rural) poor will need to includelocal authorities to secure state subsidies (where possible)and/or to negotiate reductions from unaffordable regulations.Such changes are only possible when the poor engage thestate as a group; changes in rules, regulations and/or financialprocedures are unlikely to happen for (poor) individuals. Thesavings process equips communities with new skills and anassociated new consciousness, enabling them to strategicallyengage with the state to obtain the redistribution ofresources and regulatory reforms that assist in their accessto secure tenure, basic services and housing.30 In the case ofthe example illustrated for Faisalabad (see Box 7.10), thecommunity had to negotiate with the water authorities andwith local politicians who sought to develop an alternativeprocess.
Second, with an emphasis on solutions that work forthe poorest, land purchase and infrastructure development
Communities areencouraged to work
together to savemoney?
129Community funds
become important, perhaps more important than housingimprovement. Land purchase and infrastructure developmentcan only be undertaken with groups – they are unaffordablefor the poor (even for the not so poor) as individualizeddevelopments. The activities of securing land (either bypurchase, lease or rent) and installing infrastructure needstrong groups with financial management capacity. Landpurchase may be to secure existing land or to purchase newland if a community is threatened with eviction. In somecases, the communities can afford to purchase land on themarket (or with their own negotiating capacity securing adiscount from the owners). In other cases, savings providesthe means to bring communities together and successfullynegotiate a subsidy or change in policy from the state. Box7.11 explains how communities in Thailand found thatalthough peripheral land was affordable for communities, inthe longer term it was too expensive. A more effectivestrategy was to join together into city networks and then usecollective strength to negotiate for communities to remain intheir existing locations. In these first housing schemesfunded by the Urban Community Development Office(UCDO) in Thailand (1992–1996), some 54 per cent hadpreviously been renting land and the remainder had beensquatters.31 A higher proportion (72 per cent) had owned thestructure on the land.
Infrastructure is similar to land in that it is likely tobenefit from a greater collective capacity. In this case, thereare also issues related to installation and ongoingmanagement. While some improvements to infrastructurecan be made by individual borrowing (for example, waterstorage tanks to take account of irregularly supplied water),many infrastructure improvements require group efforts. Forinstance, in a typical project, families in a low-incomesettlement in Dakar, Senegal, borrowed to install a water
supply system and drainage channels; the investment paidfor itself within a year due to savings in medical bills.32
Third, there is the recognition that collective actioncan save money. Communities are encouraged to worktogether to save money – perhaps through group purchaseof building materials (with associated discounts) and/orthrough joint work programmes. Even where lending is forhousing improvements, collective involvement may offeradditional benefits. In some cases, community funds enablegroups to construct units for each of their members. In manycases, construction is organized collectively, with allparticipating in the construction process.
A fourth reason for the emphasis on savings is thatmanaging collective finance builds within communities anunderstanding of how to manage money. Many developmentprogrammes that seek to be people centred want to givecommunities financial responsibility. However, building thiscapacity once a large-scale externally funded project hasbegun is very difficult. Local community leaders often failand that failure knocks their confidence, while associatedallegations of corruption and mismanagement further dividecommunities. Locally managed savings and loan programmesensure that communities embed financial managementwithin their own organizations and associated socialrelationships. Groups learn by trial and error to set up robustsystems, to call for assistance when needed and to manageproblems along the way. By starting with their own funds,they increase their ownership of this learning process. Finally,these approaches often encourage the community to usetheir savings to set up local funds, capitalized by savings,which can lend to members for emergencies and/orenterprise development and thereby offer immediate materialbenefits. This further develops the skills and experiences offinancial management as fund managers learn from successesand mistakes. Typical emergencies are health expenditureswhen a family member falls sick or transport costs to get towork or to take up a livelihood opportunity.33
Despite the merits in saving with lending activities,in some countries this is not possible due to financialregulations. This is a problem both for conventionalmicrofinance as well as community funds. A recent reportfrom ACHR, CODI and IIED suggests that:
… in Nicaragua, government regulationsprevent loan agencies, except for a fewauthorized by the superintendency, from takingsavings. Today, there are some 300 non-profitorganizations lending to the poor; but none areallowed to collect savings.34
Interest rates
Interest rates are generally subsidized, especially for landpurchase and infrastructure, but often also for housinginvestment. Three major reasons emerge for this policy:practical, political and social. On the practical side, many ofthese early programmes evolved with an interest rate subsidybecause the relatively large size of the loan madeaffordability difficult if market rates were used. Even land
130 Shelter finance: assessment of trends
Box 7.11 Alternatives to relocation in Thailand
The experience of Thai urban poor groups has been that communities cannot afford the costsof land purchase if they also need to construct housing, even with the subsidized interest ratethat the Community Organization Development Institute (CODI) provides. During the mid1990s prior to the financial crisis in Thailand, groups did buy land.The first communitiesthreatened with eviction were eager to purchase land and resettle. In these first housingschemes funded by the Urban Community Development Office (UCDO) in Thailand(1992–1996), some 54 per cent had previously been renting land and the remainder had beensquatters.
The high prices meant they could only afford plots outside the city centre. Even beforethe financial crisis, some families struggled to secure their livelihood in these areas. Unable tofind alternative sources of income, they continued with their existing work and managed eitherhigh transport costs or renting minimal accommodation closer to their previous inner-citylocations. Other savings groups learned about these experiences through the communitynetworks that had been established.They realized that relocation was a difficult strategy andthat families would have been better remaining in their existing locations. Now networksactively discourage households from relocating. As the financial crisis came to an end, thecommunity networks developed alternatives. Rather than lend money for relocation, theywould work with communities threatened with eviction to strengthen their capacity tonegotiate with their landowners.The costs are lower and the location is better with regard toincome-earning opportunities.Source: Boonyabancha, 2004.
and infrastructure are often sizeable investments. Additionalcosts were incurred in some cases because of theinvolvement of local authorities and other state agencieswho had standards and regulations that needed to becomplied with. Politically, the policies may have beeninfluenced by communities who were familiar with statesupport for housing through a reduced interest rate. Thisappears to be particularly strong in Asia where, for example,the Bangladeshi, Indian, Thai and Philippine governments allhave programmes with interest rate subsidies for low- (andlow-medium) income households. Inevitably, this influencedthe expectations of the communities participating in thefunds. For example, when the Urban CommunityDevelopment Office (UCDO) (now the CommunityOrganization Development Institute, or CODI) in Thailandfirst met to discuss interest rates, the community membersof the board negotiated for 3 per cent. This was considerablybelow inflation at the time. Box 7.12 describes the decision-making process. Interest rates for water investment inBangladesh and Pakistan are both set to zero (see Box 7.10for Pakistan).35
From a social development perspective, inclusion ofthe poorest and affordability are critical. As noted above,interest rate subsidies are common and, in some cases, theyhave been preferred to capital subsidies despite thediscussions against this strategy in some of the literature andthe position of some international agencies. The preferencefor interest rate subsidies is because there is no direct grantinvolved. The concern is that if something is offered for free,there will be a struggle within the community to secure sucha free resource. The advantage of interest rate subsidies isseen as being that the subsidy depends upon action that thecommunity takes by participating in the programme. Afurther advantage is that communities are believed to bemore motivated to repay when they can see that most oftheir contribution reduces their loan balance. In thiscontext, community funds rarely seek to charge rates thatare equivalent to market rates for commercial lending. Theinterest on shelter-related loans may be set in order to coverinflation costs and administration charges (therebymaintaining the real value of the fund) or may be below thisamount.
The state funds demonstrate a willingness to offersubsidized interest rates. In Namibia, the Build Togetherprogramme recently reduced its interest rate to 5 per cent.36
Clearly, it is much easier for state programmes to offerinterest rate subsidies than it is for NGO initiatives to setinterest rates to cover inflation and administration. Whilethe need to raise continued funding might have beenthought to deter NGOs from using subsidized interest rates,this does not always appear to be the case. As noted in thediscussion of SIDA’s programme in Chapter 6, interest ratesubsidies appear to be important, in part, because they areconsidered alongside mortgage rates in many countries, andthe practices in the formal housing finance institutionsinfluence those in the small loan market. In India, the statehousing agency, the Housing and Urban DevelopmentCorporation (HUDCO), has made some subsidized loansthrough NGOs and other civil society organizations for
housing development, aware of the benefits of such anapproach.37
Community funds may carry on even in very difficulteconomic contexts if there appear to be strategic advantages.In Zimbabwe, the loan fund of the Zimbabwean HomelessPeople’s Federation (the Gungano Fund) is continuing tooffer loans despite the present economic difficulties and thehigh current rates of inflation (600–800 per cent).Continued lending is taking place because the difficultpolitical climate has enabled a number of councils tonegotiate development standards and, hence, to lower thecosts of improvements with higher densities, partialinfrastructure and delayed housing construction. By 2002,nine local authorities had committed themselves to releasingland that they own to the urban poor, and seven had releasedplots with tenure to more than 2000 households.38
Collateral and security
There are two distinctive characteristics of the collateralstrategies used by community funds. First, there is relianceupon community systems and community collateral ratherthan claims over the individual borrowers. Second, in casesof land purchase, legal title deeds may be used.
However, the difficulties of loan security areconsiderable because of the different attitude towards non-repayment. How can programmes distinguish betweenthose who genuinely need more time to pay and the freeriders who are exploiting a poverty-reduction orientationfor their personal gain? The microfinance agenciesdescribed in Chapter 6 solve this problem through acombination of incentives (access to additional loans) andthreats (for example, foreclosure). Community funds mayuse these strategies; but they also rely on local knowledgeto address the problems of information for those issuing theloans. Local loans managers help to institute checks andbalances within the system to ensure that abuse isminimized. In the Community Mortgage Programme in thePhilippines, 61 per cent of accounts are over six monthsoverdue, although (in terms of collection efficiency) theprogramme performs relatively well, with a rate thatexceeds that of most housing loan programmes in thePhilippines.39 Box 7.13 suggests some measures to reducethese problems, including greater emphasis on theindividualization of plots. This last measure may weakenincentives to strengthen group practice in communityfunds.
NGOs may find themselves taking on the role ofguarantor to give the communities space to develop systemsand to gain confidence, and because links with moreconventional financial institutions require it. For example,in India SPARC found that a role emerged aroundmaintaining books and providing information about theperformance of local revolving funds. Community leaderswere worried that they would be pressurized into givingloans, or that they would have other problems. Therefore,as the NGO, SPARC set up a fund financed by grants, andthis fund operated like a guarantee for the savings.Communities established revolving funds using their savings.
Locally managedsavings and loan
programmes ensurethat communities
embed financialmanagement within
their ownorganizations andassociated social
relationships
131Community funds
If thefts occurred, then the community saving was supportedthrough additional resources provided by SPARC. In effect,SPARC acted as guarantor and this gave communities thecourage to carry on. As activities increased, the NGO cameunder pressure from the communities to secure morecapital, thereby enabling them to expand their local funds
with external capital, and with that came a system of peeraccountability. If one community failed to repay the capitalthat they had borrowed, another investigated the non-repayment and supported the community to resolve anyproblems. SPARC became a wholesale banker; eachtransaction was identified and the information sent back tocommunities. Like a bank, every transaction is identified andthat information is provided each month to the nationalfederation.
As is the case with shelter microfinance, communityfunds seek to ensure that households do not overburdenthemselves with debt, and most do not let householdsborrow such that repayments are more than 25 per cent oftheir income. However, there are problems with estimatingincomes and, in practice, this restriction may not beeffective.
Loan periods
Loan periods seek to recognize the fact that considerablecare is needed in any loan programme for low-income groupssince the capacity of such groups to repay is obviouslylimited. They also have a limited capacity to cope withsudden stresses (such as higher interest rates) or shocks(such as maintaining repayments when their income falls).‘Good practice’ among loan programmes for low-incomegroups should actually support them in avoiding loans or intaking the smallest loans they need with rapid repaymentperiods (to minimize interest charges), rather thanmaximizing the size and number of loans (which would bethe conventional measure of ‘success’ for most loanprogrammes). Such loan programmes should also ensure thatthey have measures to help those who find it difficult torepay. And, obviously, loan programmes work best for low-income groups where the cost of what is to be funded by aloan is kept down.
Loan periods appear to be longer than those used forshelter microfinance with, for example, terms of 25 years inthe Philippines and 10 years in Thailand. In part, this isbecause of the large size of the loan relative to familyincomes. It is also acknowledged that land purchase, forexample, may be only a part of the investments that thefamily needs to make. NGO loan periods are lower and aregenerally less than five years. While some appear longer,such as those of the uTshani Fund in South Africa, the designreflects the fact that funds are primarily released as bridgefinance for the state subsidy.
Technical assistance
Community funds generally place some emphasis ontechnical assistance, in part because access to land andinfrastructure may be more difficult than simple houseconstruction. However, advice is not limited to thedifficulties of land purchase and subdivision and/orinfrastructure installation. Support is often given to forginglinks with the local authority both with regard to theprofessional staff responsible for municipal rules andregulations, as well as the politicians. It appears that once it
132 Shelter finance: assessment of trends
Box 7.12 Determining housing interest at the Urban Community Development Office (UCDO),Thailand
When the Urban Community Development Fund (UCDF) was established, the UCDO boardcalculated that it could be self-sustainable with an annual average interest rate of 7 per cent.These monies would cover all administration expenses, including the community developmentprocess (an estimated 4 per cent), with a small allowance for inflation (which was relativelylow).The setting of the terms and conditions of the loan processes was immediately a politicalrather than a technical issue.The idea of a ‘shared’ interest rate with a proportion remainingwith the community organization developed during the initial study phase from the experiencewith earlier loan funds.These groups (and, later, the networks) were allowed to add a marginto cover their own costs and to provide funds for development costs or their communitywelfare fund.The decision on this margin or on an additional rate depends upon agreementmade within the community and ranges between 2 and 10 per cent.
Achieving the aggregate figure of 7 per cent return across all loans was an objectiveused to design the interest rate structure for the various loans, considering the amount ofcapital, repayment period and use made of the loans.The more conservative board memberswere anxious that UCDO loans did not undercut existing financial markets. When theyunderstood that the reason why they did not undercut existing financial institutions wasbecause the community itself added to the interest rate of the office, there was a discussionabout why the office itself should not benefit from high interest rates. Eventually the boardagreed that the interest charges would be shared with the savings schemes.
In reality, the actual average interest gained across all lending was only 5 per cent.Thisshortfall was caused by the high percentage of housing loans requested during the initial years.The interest rate on housing loans is only 3 per cent. However, only one third of the total fundwas being loaned to communities and the rest remained on deposit.The interest earned ondeposit was generally sufficient to compensate for the shortfall.Therefore, annual averageinterest gained from all the monies in the fund has averaged 7 per cent.Total expenses for alldevelopment activities and management costs have averaged 3 per cent a year.Source: Boonyabancha, 2004.
Box 7.13 Group credit for housing loans: strengthening the Community Mortgage Programme (CMP) in the Philippines
Within the Community Mortgage Programme (CMP) in the Philippines, repaymentperformance is unsustainable and highly variable.The strength of the community is affected byits size, with smaller communities having a better repayment performance, and by whether ornot the project is on site or off site. Off-site projects have a lower repayment rate as there areproblems with cooperation (members come from different areas) and livelihoods may not bewell established in the new area.To improve the repayment rate, there is a need to establishand strengthen collective action and joint liability in CMP community organizations as ananchor of programme sustainability.This requires the CMP to take into consideration keyprinciples that have evolved from the experience of group lending. Groups have to agree oninternal rules; they have to monitor loan performance and uncooperative behaviour; and theymust rely upon members’ deposits rather than external sources to increase the borrower’sincentive to repay.
There is also a need to resolve land issues in group lending for housing. Site selectionand planning are necessary conditions for a CMP scheme to work. Government has to act onownership conflicts and titling problems and include the individualization of plots as animportant part of the incentive system.Source: Ballesteros and Vertido, 2004.
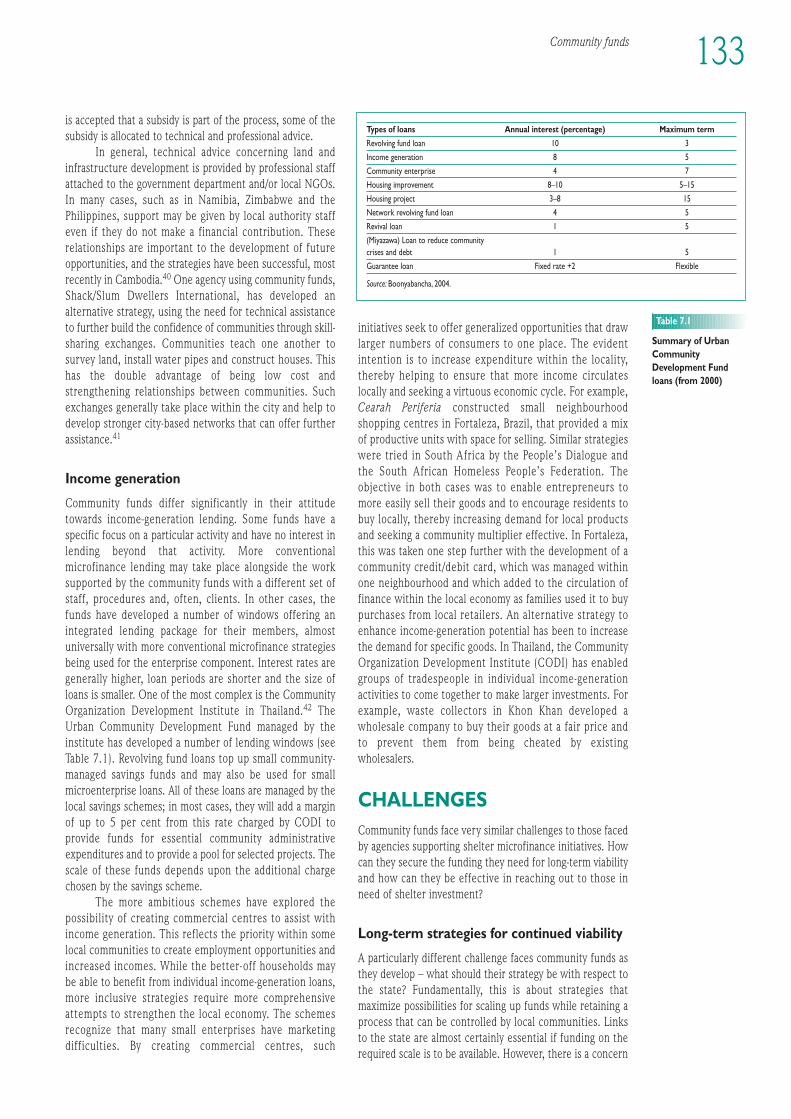
is accepted that a subsidy is part of the process, some of thesubsidy is allocated to technical and professional advice.
In general, technical advice concerning land andinfrastructure development is provided by professional staffattached to the government department and/or local NGOs.In many cases, such as in Namibia, Zimbabwe and thePhilippines, support may be given by local authority staffeven if they do not make a financial contribution. Theserelationships are important to the development of futureopportunities, and the strategies have been successful, mostrecently in Cambodia.40 One agency using community funds,Shack/Slum Dwellers International, has developed analternative strategy, using the need for technical assistanceto further build the confidence of communities through skill-sharing exchanges. Communities teach one another tosurvey land, install water pipes and construct houses. Thishas the double advantage of being low cost andstrengthening relationships between communities. Suchexchanges generally take place within the city and help todevelop stronger city-based networks that can offer furtherassistance.41
Income generation
Community funds differ significantly in their attitudetowards income-generation lending. Some funds have aspecific focus on a particular activity and have no interest inlending beyond that activity. More conventionalmicrofinance lending may take place alongside the worksupported by the community funds with a different set ofstaff, procedures and, often, clients. In other cases, thefunds have developed a number of windows offering anintegrated lending package for their members, almostuniversally with more conventional microfinance strategiesbeing used for the enterprise component. Interest rates aregenerally higher, loan periods are shorter and the size ofloans is smaller. One of the most complex is the CommunityOrganization Development Institute in Thailand.42 TheUrban Community Development Fund managed by theinstitute has developed a number of lending windows (seeTable 7.1). Revolving fund loans top up small community-managed savings funds and may also be used for smallmicroenterprise loans. All of these loans are managed by thelocal savings schemes; in most cases, they will add a marginof up to 5 per cent from this rate charged by CODI toprovide funds for essential community administrativeexpenditures and to provide a pool for selected projects. Thescale of these funds depends upon the additional chargechosen by the savings scheme.
The more ambitious schemes have explored thepossibility of creating commercial centres to assist withincome generation. This reflects the priority within somelocal communities to create employment opportunities andincreased incomes. While the better-off households maybe able to benefit from individual income-generation loans,more inclusive strategies require more comprehensiveattempts to strengthen the local economy. The schemesrecognize that many small enterprises have marketingdifficulties. By creating commercial centres, such
initiatives seek to offer generalized opportunities that drawlarger numbers of consumers to one place. The evidentintention is to increase expenditure within the locality,thereby helping to ensure that more income circulateslocally and seeking a virtuous economic cycle. For example,Cearah Periferia constructed small neighbourhoodshopping centres in Fortaleza, Brazil, that provided a mixof productive units with space for selling. Similar strategieswere tried in South Africa by the People’s Dialogue andthe South African Homeless People’s Federation. Theobjective in both cases was to enable entrepreneurs tomore easily sell their goods and to encourage residents tobuy locally, thereby increasing demand for local productsand seeking a community multiplier effective. In Fortaleza,this was taken one step further with the development of acommunity credit/debit card, which was managed withinone neighbourhood and which added to the circulation offinance within the local economy as families used it to buypurchases from local retailers. An alternative strategy toenhance income-generation potential has been to increasethe demand for specific goods. In Thailand, the CommunityOrganization Development Institute (CODI) has enabledgroups of tradespeople in individual income-generationactivities to come together to make larger investments. Forexample, waste collectors in Khon Khan developed awholesale company to buy their goods at a fair price andto prevent them from being cheated by existingwholesalers.
CHALLENGESCommunity funds face very similar challenges to those facedby agencies supporting shelter microfinance initiatives. Howcan they secure the funding they need for long-term viabilityand how can they be effective in reaching out to those inneed of shelter investment?
Long-term strategies for continued viability
A particularly different challenge faces community funds asthey develop – what should their strategy be with respect tothe state? Fundamentally, this is about strategies thatmaximize possibilities for scaling up funds while retaining aprocess that can be controlled by local communities. Linksto the state are almost certainly essential if funding on therequired scale is to be available. However, there is a concern
133Community funds
Types of loans Annual interest (percentage) Maximum term
Revolving fund loan 10 3
Income generation 8 5
Community enterprise 4 7
Housing improvement 8–10 5–15
Housing project 3–8 15
Network revolving fund loan 4 5
Revival loan 1 5
(Miyazawa) Loan to reduce community crises and debt 1 5
Guarantee loan Fixed rate +2 Flexible
Source: Boonyabancha, 2004.
Summary of UrbanCommunityDevelopment Fundloans (from 2000)
Table 7.1

that funds will be bureaucratized. There are broadly threemodels in the programmes reviewed here:
1 state agency;2 independent agency with state contributions to a
central fund;3 independent agency with state contributions to local
activities supported by the fund.
The experiences in Thailand and the Philippines have beendiscussed above. UCDO started life under the NationalHousing Authority and CODI (UCDO’s successor) is now apublic agency with its own funds. There are advantages tobeing within government, such as preferential access tostate finances and legitimacy when convening other groups– for example, local government. However, the agency canalso be vulnerable to political pressures, and the process mayneed to be managed carefully. In the Philippines, there hasbeen considerable support for community fund approaches,with a high level of institutionalization of people’sorganizations and NGOs within state housing strategies:
In recent years, NGOs, in particular, have alsoprovided housing communities with financingand services for site and home development.The NGOs, through funds from private andinternational donors, offer bridge-financingfacilities to housing communities…Community-based programmes have raised aneed, which apparently cannot be adequatelysupported by government housing programmes,by the formal financial markets or by thebusiness sector.43
However, there are also difficulties in raising the requiredfunds. One source of difficulties, evident in the Philippines,comes from a lack of acceptance of incremental housingstrategies:
… the CMP has also failed to obtain the supportof government officials, including heads ofhousing agencies, because of the perceptionthat it legitimizes the existence of squatters anddegraded neighbourhoods in urban areas… Atthe heart of this issue are the differentperspectives informing what constitutes a validhousing solution.44
As a consequence, the CMP has, at times, been starved offunds. For example, between January 1993 and September1998, only 19.5 per cent of the total expenditure on housingwas allocated to poverty-orientated housing projects(socialized housing) and only 1.33 per cent to the CMP.45 Ithas now been proposed that a social housing financecorporation should be established in the Philippines toenable the CMP and other initiatives to be managed withina supportive state framework. The advantage of beingindependent and somewhat removed from government isthat a positive political context can offer benefits; but if and
when state strategies shift to other approaches, the fund canconsolidate without being threatened. One of the reasonsfor the reduction of support for FONHAPO’s innovativeprogramme in Mexico was that the general trend shifted infavour of market-based solutions and the agency was unableto protect its approach.46
Nevertheless, a critical strategy of community fundsis to secure state support both for central lending activitiesand to subsidize local development initiatives so that theycan be inclusive and affordable. It is very difficult for aprocess that does not secure national funds to achieve scaleeven if it is successful in attracting donor support. In SouthAfrica, the South African Homeless People’s Federation,based around a network of savings schemes, became verystrong. At one point, the intention was to set up a state fund.However, government distanced itself from the federation,claiming that it was difficult for it to support a singleinitiative.
The challenge of inclusion
Community fund programmes are designed for relativelystable communities who are in need of finance to secureland tenure and upgrade their neighbourhood. In somecases, communities choose to resettle. In other cases, theyremain where they are and invest in their existing location.Such investments do not necessarily imply land purchase.Many communities have taken small loans to makeimprovements that are designed to improve the quality oftheir immediate lives and the visual appearance of thesettlement and, hence, the likelihood of longer-termresidency even if legal tenure cannot be secured. Withregard to the challenge of inclusion, community funds maystruggle to include all residents living within the settlement.They may also find it difficult to assist those who do not livepermanently in the city.
Throughout Asia, Latin America and Africa,conventional development processes have failed to deal withmany groups of poor people. In some cases, these are thepoorest; but this is not always the case. There are particulargroups who are vulnerable, such as illegal migrants. Forexample, Nicaraguans living in Costa Rica, Peruvians inEcuador or West Africans in South Africa are often treatedas non-citizens. Such groups often fall outside of anydevelopment scheme and are excluded from the benefitsthat others can secure. Community funds struggle to reachthese groups and others who live in very distinctgeographical areas or who do not have a permanent location.A major reason is that savings schemes build up linksbetween neighbours in geographical areas. It is difficult forthose who are working but not living in the city to join in,or for those who are very mobile. In Latin America, theUrban Management Programme tried to set up savingsschemes with a group of street sellers in Quito; but it failed,in part, due to the attitude of local government.47
In respect of activities within the settlements, policiesfor inclusion in savings and loans schemes may be difficultto operate effectively. To take a very different example fromAsia, the Grameen Bank in Bangladesh has very strict criteria
Community fundprogrammes aredesigned forrelatively stablecommunities thatare in need offinance to secureland tenure and toupgrade theirneighbourhood
134 Shelter finance: assessment of trends
and tries to ensure that only the very poor take part. It isnervous that the richer groups within the community willbe too strong and will determine the rules and regulations.In other countries, such as Thailand, such a highly targetedpolicy would not work easily.48 Within urban-poorcommunities, there is a lot of sharing between residents.CODI seeks to look at the community more holistically andinclusively, with rich and poor alike. However, CODI staffrecognize that there is the danger that the process will bedifficult for the poor. The difficulty with more inclusivegroups is that the rules they adopt are hard for the poor tocomply with. The practice of daily saving in India helps toensure that even the poorest can participate. The livelihoodsof the poor are generally managed daily (or in three- to five-day cycles), not monthly. Groups who save monthly excludethe poor. At the same time, richer households may not beinterested in a process that requires them to save daily.
A group who may face exclusion is tenants. It may bedifficult to ensure that tenants are granted equal rights astenure is secured and development takes place. One areathat has managed to overcome its differences and worktogether to develop their area equitably is Huruma inNairobi, Kenya.49 In this case it was facilitated by therequirement that agreement between all residents had to bereached before development could occur.
A further aspect of inclusion is that of gender. Thereis a widespread understanding that the centrality of womenis important. In part, this is because women are concernedabout their neighbours, about who is sick and who needswhat; it is also related to the level of poverty andvulnerability experienced by women. Women’s communityrole means that if women are central to managing thesavings process, then it is likely that there will be fewerproblems with exclusion within the community. However,this requires that the process is orientated towards womentaking up a leadership role. While this seems prevalent inthe case of savings and loans, in some contexts the shift toconstruction encourages higher levels of involvement bymen. In the experiences of the Gungano Fund, Zimbabwe,and the uTshani Fund, South Africa, women are members ofthe savings schemes and are among those who take theloans; but a significant percentage of titles are registered inthe name of the man. Nevertheless the high level of activityfrom women often continues. In the Community MortgageProgramme, for example, 70 to 90 per cent of communityboard members and officers are women and the assessmentfrom research is that women are considered to be the morereliable managers.50 Some of the groups have a
demonstrated capacity to move from housing on to otherneeds, such as daycare centres.
The microfinance agencies have noted the difficultiesthat they have in reaching some of the poorest groups, andsuch problems have been recognized in the case ofcommunity funds. For example, while even the poorest inthe settlements supported by WaterAid in Bangladesh arebetter off as a result of the investments in water facilities,some individuals cannot afford to pay for adequate suppliesof clean water.51 With a requirement for full-cost recovery,local communities have to cover the costs that are required.Inclusion issues may be particularly strong in the case ofmore formal processes, such as those associated withgovernment funds. The situation within the CMP is assessedthus:
If we take the income level of beneficiaries atthe time of CMP application, the programmehas reached those coming from the bottomthree income deciles (3178 Philippine pesosand below) … with the majority coming fromthe second- and third-income deciles (2600Philippine pesos to 3178 pesos)…52 Only asmall percentage (7 per cent) of thebeneficiaries came from the bottom segment orthe first-income decile (2600 Philippine pesosand below)… [Moreover], substitution ofbeneficiaries53 and/or selling of rights haveoccurred (ranging from a low 5 per cent to ahigh 35 per cent) because of inability to pay theamortization due to loss of income because ofsickness, death or unemployment. In somecases, the beneficiary has moved to anotherplace because of marital separation, death andjob transfer… That the CMP beneficiaries donot come from the poorest of the poor is furthersupported by their occupational profile andincome sources. Almost half (45 per cent)derived their income from low-wage work (e.g.employee, nurse/teacher, factory worker andservices) or from the informal sector(vending/selling, transport service workers).Most families have several income earners whopool together their earnings in order to pay theamortization, as well as meet their basic survivalneeds.54
135Community funds
1 This chapter is based on adraft prepared by Diana Mitlin,University of Manchester, UK.
2 Mitlin and Satterthwaite,2004b, p15.
3 ACHR, CODI and IIED, 2004.4 Arrossi et al, 1994, pp130–134.5 Arrossi et al, 1994.6 Hanchett et al, 2003.
7 Cavalcanti et al, 2004.8 Cabannes, 2004, p30.9 Gonzáles de Kauffman and
Rincón, 2004.10 Lumanti, pers comm (2004).11 Porio et al, 2004, p63.12 Escobar, undated, pp40–41.13 Escobar, undated, p43.14 Hanchett et al, 2003, p44.
15 Baumann and Bolnick, 2001.16 Mitlin and Satterthwaite,
2004b, p13.17 Mitlin, 2003.18 Mitlin, 2003.19 Cavalcanti et al, 2004,
pp172–173.20 CODI, 2004.21 Escobar, undated, p41.
22 Baumann and Bolnick, 2001.23 Saborido, pers comm (2004).24 SPARC, pers comm (2004).25 Porio et al, 2004.26 CMP Bulletin, 2004, in SELAVIP,
2004, p93.27 ACHR, CODI and IIED, 2005.28 Boonyabancha, pers comm
(2004).
NOTES
29 Mitlin and Muller, 2004.30 Mitlin and Patel, 2005.31 Boonyabancha, 2004.32 See Gaye and Diallo, 1997.33 Patel and D’Cruz, 1993.34 ACHR, 2004, pp3–4. Some
financial regulations preventorganizations from lending andcollecting savings. While thismay be well intentioned, thereare evident problems inlending without savingopportunities. In addition tothe benefits described here,without savings people are lesslikely to build up assets toenable them to repay loans intimes of difficulty, or todevelop the habit of regularly
making payments. Hence, theymay be more vulnerable.
35 Hanchett et al, 2003, p47.36 Ministry of Regional, Local
Government and Housing,2003.
37 Escobar and Merrill, 2004, p66.38 HiFi News, 2002; SELAVIP,
2004, pp129–134.39 Ballesteros, 2002, pp21–23.40 ACHR, 2004.41 Patel and Mitlin, 2002.42 Boonyabancha, 2004.43 Ballesteros, 2002, p12.44 Porio et al, 2004, p60.45 CMP Bulletin, January 1998,
cited in Porio et al, 2004.
46 Connolly, 2004a, b.47 Cabannes, pers comm (2004).48 ACHR, CODI and IIED, 2004.49 Weru, 2004.50 Porio et al, 2004, p75.51 Hanchett et al, 2003, pp48–49.52 This study opted to use the
lowest three mean incomedecile criteria (bottom 30 percent), rather than the povertythreshold definition of poverty(4945 Philippine pesos in 1994and 6231 pesos in 1997).However, comparing the twoindicators of poverty showshow much deficit the poorsuffer in terms of their incomeand basic needs for survival
(for example, almost 100 percent deficit of the third decile’saverage monthly income of3544 Philippine pesos versusthe poverty threshold of 6321Philippine pesos).
53 Substitution of beneficiariesoccurs when an originalmember of the organizationcannot/refuses to fulfil hisduties to the association anddecides to forfeit his accessrights to the CMP project.Reasons include death,migration, inability to pay orloss of faith in the project.
54 Porio et al, 2004, pp72–73.
136 Shelter finance: assessment of trends


The analysis in the previous chapters of this Global Reporthighlights a number of specific issues that have policyimplications with regard to the value of housing finance inaddressing the world’s housing needs. This chapter bringstogether a discussion of these issues across the differentapproaches to housing finance that have been addressed.Several themes are considered:
• affordability and the difficulties of reaching the poor;• access to capital and the lack of loan finance;• the move to markets and what the market cannot
manage, including the issues of maintaining financialviability; and
• connections and diversity within globalization, as wellas risk management within the market.
Housing finance is critical to the process of development:‘cities are built the way they are financed’.2 While urbanform reflects other factors, such as land regulations, buildingcodes, cultural values and demographic change, finance is apowerful influence on the kind of cities and settlements inwhich people can expect to live. Hence, the development ofurban areas reflects who has money, how much they haveand on what conditions.
The challenge is to ensure that finance contributesto the equitable and sustainable development of cities.Clearly, as indicated in earlier chapters of this report,finance for the dwelling is only a part of the picture.Finance for other components of urban development is alsoimportant. At the level of the settlement, municipal financeis important, as demonstrated in Chapter 3. Householdsneed to consider finance for land and for services inaddition to the dwelling itself. While the typical model ofurban development in the North is where the householdpurchases a complete unit (dwelling, serviced site, landtenure), this is not the reality for much of the South (seeChapter 6). In this context, housing finance has to beappropriate to the multiple needs of incrementaldevelopment (land, services, infrastructure and dwelling).This raises a further and very significant complexity sinceinvestments in land and infrastructure are rarely affordableon an individual basis – as discussed in Chapter 7 andconsidered further in this chapter.
It no longer seems true to say, as in a 1993 study, thatmost developing countries do not have a sustainable andviable institutional housing finance system.3 In most partsof Asia and Latin America, this does exist in some shape andform and it has been growing significantly during the last 10to 15 years. In some cases, the state remains a verysignificant influence on the market for housing finance(through regulation, direct lending activities or, as in thecase of Chile, other subsidy finance strategies). In others,governments’ significance appears to be decreasing as thenumber of alternative providers increases and more market-orientated policies begin to gain more influence (seeChapters 4 and 5). This ‘formal’ housing finance system,orientated towards the provision of mortgage finance, islimited in scale, with low-income households beingexcluded. Arguably, it is not as cheap or as flexible as isrequired. In sub-Saharan Africa, it still appears to be lackingon a significant scale. But it does, for the most part, exist inmany Latin American and Asian countries. In general, itappears to be growing, and it has demonstrated a capacityto survive the financial stresses of the 1990s. While macro-economic stability is widely acknowledged to be importantfor the health of the housing finance sector, housing financesystems have demonstrated some resilience as they haverecovered successfully from financial crises during the1990s (see Chapter 4).
Unable to afford mortgage finance or completedwellings, many low-income residents financehomeownership through incremental development, makingsmall investments over a considerable time period. ‘Formal’institutions providing small loans for shelter improvementshave become more significant during the last 15 years.During the early 1980s, the distinction between non-institutional and institutional almost entirely replicated thesmall loans/big loans division, with the majority ofinstitutional sources supplying big loans for complete (oralmost complete) dwellings and non-institutional sourcessupplying small loans used for incremental shelterdevelopment. This is no longer the case. As discussed inChapter 6, there has been a significant growth in non-governmental organizations (NGOs), microfinance agenciesand government programmes offering small loans to assistin financing incremental shelter strategies. Many in low-
Cities are built theway they are
financed
The challenge is toensure that finance
contributes to theequitable and
sustainabledevelopment of
cities
C H A P T E R
ASSESSING SHELTER FINANCE SYSTEMS 1
8
income countries in the South still develop their housingincrementally; for the poorer households, this remains theonly viable strategy, even in relatively wealthy Southerncountries. As a result, the provision of appropriate fundingis a development priority. However, small loans frommicrofinance agencies, in general, go to those with landtenure for housing improvement and extension, limitingonce more their contribution to addressing the needs ofmany in the South. Community funds with an emphasis oncollective loans have recently emerged to address the needsof the urban poor. However, much of their work remainsexperimental and it rests somewhat uneasily betweenfinancial approaches and poverty reduction programming.
The integration of neighbourhood upgrading and slumimprovement programmes with small loan programmesoffers significant support to the poor. Within suchprogrammes, in general, subsidy funding (sometimestogether with small loan finance) is orientated towards landtenure, infrastructure and services, while small loans assistfamilies in finding the funds for housing improvements.Although not always the case, there are clear furtherbenefits if small loan funds are also provided for enterprisedevelopment. Two emerging models exist for suchupgrading. In one model, the local authority, or some otherprofessional development agency, takes the lead, with smallloans being provided through subcontracting arrangementswith microfinance agencies. In the other model, exemplifiedby the work of the Community Organization DevelopmentInstitute (CODI) in Thailand and the Community-ledInfrastructure Financing Facility (CLIFF) in India, thecommunity build up their financial management expertisethrough the use of community funds and they take the leadin managing the process, with appropriate support fromgovernment agencies and professional NGO staff.
Despite its lack of immediate relevance for the poor,great emphasis has been placed, by governments anddevelopment agencies, on mortgage finance. This isrepresented in the weight of the discussion in this report,which, in turn, reflects research, documents, institutionalinvestments and financial capital related to mortgagefinance. However, it is not directly relevant to those most inneed in the world – at its crudest, their incomes are simplytoo low. This is not to say that this work is insignificant tothe poor. There is evidence that housing finance has to betreated as a system. If the needs of higher income groupsare not met, they will occupy the shelter opportunitiescreated for the poor.
With a growing global dependence upon the market forthe delivery of finance, how have housing finance systemsresponded? There are a growing number of providers innumerous countries. Consumers who can access mortgagefinance have been able to benefit from competition, withsome indications of improving loan-to-value ratios4 and smallerloan margins.5 While loan periods have also lengthened insome countries, this seems to be more concerned with thecrisis of affordability than with competition per se. Thebenefits seem, in part, to have been taken up in rising dwellingprices, and increases in the scale of mortgage lending are lessimpressive once price increases are taken into account. Yet
there does appear to be more money for housing finance inmost regions of the world, with sub-Saharan Africa being anotable exception. While there have been initiatives in thisregion (for example, in Ghana and Nigeria), they remain smallscale and relatively insignificant.
The greater emphasis on the market has broughtbenefits, but also problems. A number of specific issuesarising from too great a dependence upon the market thathave been highlighted in previous chapters of this report.None of these themes are new; but they have, perhaps, beenoverlooked in the eagerness of policy-makers to move fromineffective strategies to increase access to housing financetowards something that appears to work. These are areaswhere the market cannot be expected to respond effectively;by its very nature, it produces outcomes that reflectindividual decision-maker’s choices rather than grander plans.The areas are systemic risks within the financial system;ensuring that institutional frameworks are in place for multi-family dwelling and neighbourhood development andmaintenance; and urban planning and land-use management.They are all areas which require a role for government (andgovernance) in developing appropriate structures forplanning, regulation and institutional development.
Finally, recent development discussions have placedmuch emphasis on globalization. While globalization meansmany things to many people, the two specific areas relevantto this debate are the relationship between global financialflows and housing finance, and the ways in which ‘global’ideas about housing finance are permeating solutions andstrategies to address housing needs. The final themeconsiders these issues.
AFFORDABILITY AND THEDIFFICULTIES OF REACHINGTHE POORThe discussion in Chapter 4 highlights the difficulties thatthe poor have in affording mortgage finance to purchase acomplete dwelling through a single purchase that is fundedprimarily (but rarely exclusively) by a loan. Significantnumbers of people in the North remain in rentalaccommodation and cannot afford the costs ofhomeownership, even in a context in which subsidies havebeen provided. The indications are that rising house priceshave made affordability more difficult in the North, althoughthe ratio of current prices to incomes is high when comparedto long-term trends, and greater affordability may beanticipated in the short term. There have been veryconsiderable attempts supported by government to extendhomeownership to lower income groups – for example,through the more extensive use of mortgage insurance.There are some indications of success (higherhomeownership rates) and some areas of concern ashouseholds may find it difficult to manage the associatedrisks. Northern governments seek to supplementcommercial housing finance for homeowners with a rangeof measures in order to assist the poor in securing adequateaccommodation, primarily through rental markets.
The greateremphasis on themarket has broughtbenefits, but alsoproblems
If the needs ofhigher incomegroups are not met,they will occupy theshelteropportunitiescreated for the poor
140 Towards sustainable shelter finance systems
In the South, the percentage of those who cannotafford mortgage loans is significantly higher in manycountries, reflecting high levels of poverty. The estimates inChapter 4 suggest that these numbers may be over 70 percent in sub-Saharan Africa and the lower income countriesof Asia, and at or above 40 per cent in the higher incomecountries of Asia and Latin America. The problems are notsimply related to lack of income (looking at restrictions onmortgage lending in the North); they are also related to thenature of the economy and its high dependence uponinformal as well as low-paid employment.
The costs of being poor are considerable. There is nodoubt that the poor wish to save and accumulate assets. TheWorld Bank estimates that 60 per cent of households inMexico save for housing.6 That figure appears low. A verydetailed analysis of the overwhelming importance of savingsin housing investment in Hyderabad has been done,7 whileit has also been noted that 65 per cent of those who join ashelter microfinance facility in Cape Town, the Kuyasa Fund,do so only to use its savings facilities.8 The scale of informalsaving appears to be very significant. The success ofmicrofinance in providing essential financial services to thepoor has been noted. There is a willingness to save amongthe poor, and as the discussion of community funds explains,programmes have been able to build on such experiences toincrease take-up of financial services (see Chapter 7).
While the poorest may not be able to afford to investmuch in housing, the costs of squatting, of purchasing waterand of repairing temporary dwellings are very significant.Given the opportunity, the poor readily take up opportunitiesto save and acquire small loans through microfinanceagencies and/or community funds. Programme reportsdiscuss many issues; but none have ever referred to a lackof demand for their services. Opportunities to acquire smallloans for land acquisition, infrastructure and housing doappear to have grown significantly during the last twodecades, particularly during the last ten years. However,provision still appears very small, given potential demand(and in the context of estimated housing deficits).
Small loan agencies have been established and havecontributed to addressing shelter needs. They have beenextensively discussed in Chapters 6 and 7. Incrementaldevelopment is all that is affordable to the poor and is aviable strategy that has helped to develop housing formillions. Incremental development requires finance and is,for the most part, primarily financed through savings atpresent. Loan finance can reduce the time taken for suchdevelopment and the overall scale of the investment. Theinterest in this sector is reflected by a growth in sources ofprovision (as well as the scale), with municipal and nationalgovernments, commercial financial institutions and otherprivate-sector groups such as building material suppliers allbecoming involved.
The growth of microfinance agencies for enterprisedevelopment pre-dates the specific rise of sheltermicrofinance. These agencies have been encouraged to moveinto the shelter sector due, in part, to the scale of enterpriseloans that were ‘misdirected’ at housing investment. In othercases, they have extended their loan services to respond to
explicit needs and requests, and because of their owncommercial needs to expand their markets. While not allmicrofinance programmes for housing have been successful,there is a body of experience that demonstrates thepossibilities. The major problem faced by these agenciesappears to be a lack of capital for expansion.
The particular focus of shelter microfinance agencieson individualized lending for housing improvements limitstheir value to many of the poorest urban dwellers. It isindicative that the Grameen Bank in Bangladesh, whichlends to low-income rural dwellers (mainly women) forhousing, except where land tenure is uncertain (in whichcase they lend for land purchase prior to lending for housinginvestment), does not consider this model to be transferableto urban areas where land costs are so much higher. Thisdoes not mean that shelter microfinance is unimportant. Itprovides essential assistance in enabling urbanimprovements to take place in many areas in which tenureis secure and in some urban informal settlements in theSouth. It may also be of significance in illegal subdivisions,where the tenure is not in dispute but where additionalinvestment is required for infrastructure and services, aswell as upgrading of dwellings. But in seeking to address theMillennium Development Goals (MDGs), the limitations ofmicrofinance strategies as well as their potential have beenrecognized. Shelter microfinance assists in the consolidationof urban poor areas; it helps households to build up theirassets, investing their savings in dwellings that provide botha place of shelter and a source of enterprise developmentfor many working in the informal sector. In other cases, itadds directly to income when families rent rooms. However,its value is predominantly for those who already have tenure(although this may not be formal legal tenure).
The tradition of community funds has grown up torespond to the needs of urban poor groups to invest in landpurchase and to develop infrastructure on such land.Community funds offer collective loans to organizedcommunities to enhance their development capacities.While many loans are for secure tenure and infrastructure,the financial systems are also used for more individualizedlending both for housing and income generation. Thestrategy seeks to strengthen local institutions to addressinvestment needs that individual households, andindividualized solutions, cannot tackle.
However, once more, there are indications that thepoorest find it difficult to participate. Such problems areevident in assessments of the Community MortgageProgramme (CMP), a group-lending scheme in the Philippinesthat has provided almost 150,000 households with securetenure, but which finds it difficult to include the pooresthouseholds. The solution used by some agencies such as theSociety for the Promotion of Area Resource Centres (SPARC),an Indian NGO, is to seek to develop models that work forthe poorest within a residential group, and then allow higherincome groups to join in if they wish. However, it has to berecognized that the use of loans carries inherent risks forthose who are too poor to manage repayment risk. Thevulnerability of the poorest may be too great to successfullymanage these risks (despite the capacity of an organized
In the South, thepercentage of those
who cannot affordmortgage loans is
very high, reflectinghigh levels of
poverty
141Assessing shelter finance systems
community to provide support), and greater emphasis mayneed to be placed on savings and grant combinations. Whilethere have been some attempts to develop microinsuranceschemes with microfinance initiatives, relatively littleattention has been given to such strategies in the context ofshelter microfinance. Another limitation is that bulkinvestments are still required by the local authority to enablecommunities to develop infrastructure. In Namibia, thecollaboration between the government (through the BuildTogether programme) with the Shack Dwellers Federation ofNamibia (and its community-based Twahangana Fund) haveallowed improved housing, tenure and infrastructure to beextended to several thousand households. However, landpurchase is becoming increasingly difficult due to the needfor bulk infrastructure investments in urban areas such asWindhoek and Walvis Bay.9
Both shelter microfinance and community funds havebeen integrated with neighbourhood improvement (slumupgrading) programmes for a more comprehensive approachto address the needs of the urban poor. In such a model,subsidy (sometimes augmented by household loanrepayments, such as in Ahmedabad, India) contributes to theimprovement of the area, with secure tenure andimprovements to essential services such as water, sanitation,drainage and pathways. Small loan funding will then assisthouseholds that can afford to take loans to improve theirdwellings. In some cases, very similar subsidy/loan strategiesare also associated with greenfield site development.Additional loan finance may be provided to help householdsinvest in enterprise development. Both ‘top-down’ and‘bottom-up’ models have developed in which developmentis led by state agencies (local and/or national government)and community groups, respectively. In addition to the workof CODI (in Thailand) and SPARC/National Slum Dwellers’Federation (NSDF) (in India) in supporting bottom-upapproaches, the experiences supported by the SwedishInternational Development Agency (SIDA) in CentralAmerica (through alliances of local government and civilsociety organizations) are also notable. Such programmesprovide subsidies for integrated upgrading, enhanced bysmall loans, and ensure the significant participation of boththe community and the local authority. While finance is avery significant direct aspect to the success of theseprogrammes, it is more critical in supporting changes inrelationships between the citizens (through communityorganizations) and the urban development agencies(including state and, in some cases, the private sector).
The role of finance: relationship-building
The significance of social networks and relationships inhelping those in need of housing is remarked upon in onepro-market analysis of social housing.10 The analysishighlights the networks that individuals need to avoidhomelessness in the US. However, there is a wider relevanceto the argument when analysed in the context of destitutionin the South. In this case, those in housing need are rarelyin need of specific social support (such as dealing withmental illness and drug addiction); rather, they face much
wider system failings in the lack of affordable legalopportunities to acquire adequate shelter. The notable pointabout the strategy used by community funds and byneighbourhood upgrading programmes, such as thosesupported by SIDA in Central America, is the greater use offinance to build improved social relationships. The patternof urban development in the South, with the extensivesettlements of informal housing, patron–client relationshipswithin such settlements, and (sometimes) weak andunaccountable government structures, is such that therelationships necessary for urban development are missing.The experiences here suggest that collectively managedsavings and loan finance, together with upgrading strategies,help to strengthen local governance, as well as provide themeans for investments in individual and collective physicalimprovements.
Within the community fund programmes described inChapter 7, savings strengthen relations between communitymembers, enabling them to be more effective (skilled andcohesive) groups, while the joint development of land andinfrastructure for the poor are the basis for newrelationships between urban-poor communities and localauthorities. As SPARC has found with the CLIFF programme,private commercial financial institutions are interested infinding ways to link to the urban poor, but need localinstitutional strengthening to be able to do this successfully.
THE ROLE OF MORTGAGEFINANCE: ACCESS TOCAPITAL AND THE LACK OFLOAN FINANCEAs noted earlier, mortgage finance is unaffordable for manyof those living in the South and a significant minority in theNorth. Despite this, great emphasis has been placed by bothgovernments and development agencies on mortgagefinance and state subsidies for mortgage finance still appearto be at a considerable scale in more than a few countries.The fairly extensive use of interest-based subsidies formortgage finance is likely to be reducing competitionsignificantly in some countries and, hence, may be delayingthe development of more extensive private provision ofmortgage finance. Such interest rate subsidies appear toreach only the higher income levels among the poor, if theyreach the poor at all. Even when they are affordable, otherfactors (notably, informality in property and labour markets)prevent access by those with low incomes. There is reasonto believe that the reduction in interest rates is likely to beaccompanied by the more extensive development of themarket. However, some households may not be able to affordthe subsequent rates and, thus, may not be able to accesshousing finance. While there appears to be good reason topress for the reduction of interest rate subsidies onmortgage loans since it does little to assist the poor to secureaccess to housing finance, it should also be recognized thatsuch a reduction has been suggested many times before andgovernments still persist in favouring this strategy.
Bulk investmentsare still required bythe local authorityto enablecommunities todevelopinfrastructure
Collectivelymanaged savingsand loan finance,together withupgradingstrategies, help tostrengthen localgovernance
142 Towards sustainable shelter finance systems
In some countries (and particularly in Latin America)there has been a shift to direct-demand subsidies. They areassociated with large-scale programmes, notably in Chile andSouth Africa, which address housing need through theprovision of finance. In other countries, programmes aresignificantly smaller. However, as noted in Chapter 5, issuesof quality remain. Programmes in Colombia and Mexicoappear to be placing considerable emphasis on larger unitsubsidies for complete houses (as is also the case in theChilean and South African programmes), while, arguably,more extensive programmes to support smaller loans forincremental development would spread the available financemore widely, be appropriate to lower income households andbe less attractive an option for higher income groups tocapture. The strong association with dwelling constructionwithin these programmes appears to be influenced by theinvolvement of construction companies in their execution.It is clearly not a priority of the poor.
Governments do need to be concerned about thedevelopment of appropriate systems for housing finance, andthe existence of strong mortgage lenders is important toboth higher income groups as well as low-income groups.Different housing markets are not necessarily distinct, andif possibilities are not created for higher income groups tosecure the housing improvements that they seek throughthe market, they are likely to take up those that are beingoffered to the poor.
While subsidies are often justified by the expectationthat they will assist the poor to secure housingimprovements, in practice, higher income groups have beensuccessful in gaining access to such subsidies. This suggeststhat programmes to address the housing needs of the poorneed to be more carefully designed.
Returning to the role of mortgage finance and supportfor such finance, in both Latin America and Asia, there havebeen initiatives at the government and multilateral agencylevel to support the development of secondary markets toincrease wholesale finance to mortgage lenders. Generally,these efforts appear to be overdone. As discussed in Chapter4, in many cases these have not been successful becausemarket conditions have not been right. While it is possiblethat it is a shortage of capital that is preventing theexpansion of mortgage finance, many other reasons havebeen identified in this report. What appears to be of mostsignificance is the scale of informality in property and labourmarkets. Hence, there is a group excluded from mortgagefinance, not for reasons related to the scale of their incomes(or lack of land title), but due to the informal nature of theiremployment.
It appears that much emphasis has been placed onformalizing land titles; but, as seen in Peru, this has notnecessarily increased the take-up of either mortgages orenterprise loans. A detailed examination of sources of incomein the context of Europe demonstrates that this problem hasnot been solved, and those who cannot verify their incomes(due to small-scale or informal entrepreneurship) are alsounable to get loans in most countries and have limited accessin others. The problem is less evident because this group isproportionally much smaller in the North due to the natureof the labour market. This suggests that access to loans may
be limited in ways that cannot be addressed by reforms toproperty titles, increasing the ease of foreclosure or the scaleof finance and competition in the sector. Land titling shouldnot be relied upon as a single solution to the lack of loanfinance reaching groups who can apparently afford to takemortgage loans. The example of the new housing banks inMexico, Sociedad Finaciera de Objeto Limitado (SOFOLES),and their apparent ability to reach such groups is important(see Chapter 4). However, the information that they havemoved up income groups since their creation should also beacknowledged. This implies that they may be successfullyworking with higher income levels in the informal sector –but still not reaching the poor.
Despite these problems, mortgage lending does appearto have expanded in a number of countries. This may beassociated with economic growth and with growingaffluence. Competition has increased and the market formortgage finance is moving beyond a small number of lendersin several countries. As shown above in the case of India,even in these circumstances, down-marketing mortgagefinance can be difficult. However, there appears to be asignificant group that is being reached by the market due tomore extensive housing finance in some Northern countriesand the wealthier countries of Asia and Latin America. Morecompetition in the finance sector and greater efficiency inthe delivery of loans, together with increases in real incomes,have increased the numbers and percentages of people whocan afford mortgage finance.
There are risks for individual households in taking onthese loans, and some of these risks have been evident whenhousing prices have fallen, notably in the UK and Japan. Ifmortgage finance continues to be extended to low-incomehouseholds, there is a strong case for more attention beinggiven to the potential negative consequences for low-incomehouseholds. While mortgage insurance has been extended,it appears that much emphasis has been placed on protectingthe lender rather than the borrower.
At the national level, mortgage finance has surviveddifficult circumstances in Asia and Latin America during thelast decade. As seen by the examples of Colombia, Mexicoand Thailand, there is evidence of systemic strain and ofrecovery. Governments have been involved in managing theoutcomes of the financial crises that took place during the1990s and mortgage lending is continuing (albeit with a highlevel of state involvement in some contexts).
THE BIGGER PICTURE ANDWHAT THE MARKETCANNOT MANAGEDespite a general emphasis on the expansion of market-orientated mortgage finance and housing support, moregenerally, the analysis does point to a number of areas inwhich markets alone appear to be struggling. Three haveemerged as being particularly important: systemic financialrisk, institutional failings related to necessarily collectiverather than individual investments in shelter, and issuesrelated to urban planning and land-use management.
While mortgageinsurance has been
extended, it appearsthat much emphasishas been placed on
protecting thelender rather than
the borrower
143Assessing shelter finance systems

Financial risks
As suggested in the discussion of house prices above, thereis evidence that the expansion of housing finance has helpedto fuel house price increases. This suggests that sufficientconsideration has not been given to measures to address therestrictions that have prevented an increase in the supply ofhousing.
In addition to inefficiencies in the constructionmarkets, as noted in Chapter 4, a recent survey suggests thatstrong regulation of the banking sector is necessary toensure that financial deregulation does not permitspeculative investment in property.11 Experiences have beenmixed, with some evidence of weak regulation in Thailandand (to a lesser extent) Malaysia, but few problems inSingapore and Hong Kong, Special Administrative Region ofChina. In the US, housing finance has become closely linkedto the capital markets, with government involvement (insome form) in both primary and secondary markets.12 Totalmortgage debt in the US is now US$6.2 trillion. If houseprices fell rapidly in a number of countries, resulting in therisks of negative equity and a sharp reduction in housinginvestment, then the effects might be felt on a larger scalewithin the global economy.
The need for local organization
The housing finance market is strongly orientated towardsproviding loans to individual households. In two of thesituations discussed in this Global Report, there is a needfor collective investment – to maintain multi-familydwellings in transition countries and to invest in land andinfrastructure for those without tenure in the South. In bothcases, it appears that the market is unable to make anadequate response due, in part, to reasons of affordability,but also because local institutions that can manage thefinance are missing.
There is a significant problem in the transitioncountries with the very poor quality of much of the multi-family dwelling housing stock (that is, apartment blocks).During the transition process, there was a significanttransfer of dwellings into homeownership; but a lack ofhousehold incomes and institutional weaknesses have meantthat little maintenance has taken place. Indications of thescale of the problem are given in a 2003 study, which reportsthat in Romania only 17 per cent of the housing stock wasassessed in 1992 as being likely to provide reliable shelterin 2020.13 The cost of renovations is estimated to be 30 percent of gross domestic product (GDP) in Latvia and 8 percent of GDP in Poland.14 The problems of maintenance areexacerbated by poor construction technology, lack ofmaintenance prior to transition and a lack of affordabilityduring recent years. But a core problem is simply that thereis no appropriate institutional structure.15 Even whenhouseholds can afford to maintain their dwellings, they oftendo not have an appropriate institution that enables them todo this.
These buildings were previously managed by state-owned companies. With the transfer of ownership to theindividual households, such companies no longer had a
demand for their services. By the middle of the 1990s (aftersome delay), new laws were introduced to support thedevelopment of homeownership organizations. Furtherproblems are that the administrative procedures may becomplex and the laws often provide inadequate guidelinesregarding voting procedures, cost-sharing mechanisms andenforcement possibilities. For example, in Romania, theHousing Act of 1996 meant that the multi-dwellingproperties had to establish a Homeowners’ Association, alegal entity, to ensure property management. However, in2003, it was reported that only an estimated 20 per centhad done so.16 In addition, there remain problems ofaffordability for many households.
Similar problems can be found in multi-familydwellings in the South. In Mumbai, for example, some ofthe families resettled in medium-rise buildings after theclearance of shacks alongside the railway have beenstruggling to pay the running costs (electricity bills).17 Whilethe suggestion proposed by government agencies is oftenthe establishment of formal management committees, careneeds to be given that these do not discriminate against thepoor.18
Moreover, as discussed above and considered in detailin Chapters 6 and 7, mortgage finance is for higher incomeformal workers and small loans are orientated towards thosewith secure tenure. Many in the South rent accommodationor squat in precarious situations with little security oftenure. In numerous cases, improvements are unaffordablebecause individual purchase (even of an insecure site) isbeyond the cost of such households. Collective landpurchase may be affordable (particularly if households arerenting in the informal housing markets). However, suchcollective land purchase requires financial capital. It may alsorequire relationship-building with the local authority in orderto ensure that building regulations are flexibly enforced and,hence, that the development remains affordable. This is theprocess that community fund mechanisms have often soughtto support. However, there remain many areas in which suchstrategies are not being used and, in this case, there are fewalternatives offered to the poor.
To address the housing needs of the poor, housingfinance systems need to provide loans for such collectivepurposes, and appropriate local structures need to be inplace if this is to occur.
The issue of urban development
Finally, the market seems to struggle with ensuring thequality of the urban environment (in a physical and socialsense). In the discussion above, the problems associatedwith urban development patterns and form seem to begreatest in relation to the extended reliance on the marketin social housing programmes, and two specific issues havearisen. First, the greater emphasis on targeting and reducedsocial provision in the North appears to have resulted in agreater concentration of low-income households in specificareas. This applies both in the case of the transitioncountries and for richer countries of Western Europe. In thecase of the transition countries, it is also linked with the lack
Expansion ofhousing finance hashelped to fuel houseprice increases
If housing prices fallrapidly, there arerisks of negativeequity and a sharpreduction in housinginvestment
144 Towards sustainable shelter finance systems
of investment possibilities in multi-family dwellings. Hence,the privatization of state housing has resulted in theincreasing spatial segregation of rich and poor. The richergroups have tended to move to detached houses and moreup-market housing estates, while the poorest have beendrawn together in areas that lack maintenance. In thecontext of Western Europe, ‘lower levels of owneroccupation seem to facilitate less polarized housing systemsbecause the rental sectors can be less residualized’.19
The second issue is the nature of the developmentsthat are being supported by the direct demand subsidies, forexample in South Africa and Chile. In both cases, the privatesector is constructing housing paid for by government-financed capital subsidies. In Chile, the amount that can bespent on (serviced) land is explicitly limited to 30 per cent.In South Africa, there is no such limit; but a minimum sizeof house has been introduced, encouraging investment inthe dwelling itself. A consequence in both countries is thatlow-income housing has been located on low-cost sites oftena considerable distance from jobs, services and otherfacilities, with little consideration of the social cost thatresults from such physical exclusion. This suggests that themarket is unable to respond to the needs of the poor withoutgreater interventions from the state – either the fundingagency and/or the local authority. This suggests that a keytask for government is to ensure adequate supplies of well-located and well-serviced land – which could fit well withthe small loan-based strategies discussed earlier in thischapter.
In the North, there are also environmental (as well associal) issues about the patterns of development emergingfrom the housing market. At the end of World War II, roughly70 per cent of the US population lived in central cities; butin the decades since, that figure has dropped to below 40per cent.20 This has been partly fuelled by the accessibilityof the home mortgage. However, environmental problemsare emerging. In addition to the problems of air pollutionand high energy use from the dependence upon cars, thequick construction of mass settlements in greenfield sitesoutside urban centres often relied upon the use of septicsystems rather than sewers. Yet, the failure of septic tanksin many parts of the country has been responsible foroutbreaks of infectious diseases, as well as the pollution ofgroundwater, streams and lakes.21
CONNECTIONS ANDDIVERSITY WITHINGLOBALIZATIONThe broad context within which this discussion is situatedis one in which financial markets are deregulating and thestate is withdrawing from direct involvement in theeconomy. It should be recognized that there are distinctlimitations to this model. Governments continue to investin housing support in order to meet poverty reduction goalsand for social reasons. There are also continuingprogrammes, in a number of countries, to supporthomeownership among higher income groups. In addition,
governments have intervened to stabilize difficult financialsituations and have, in some cases, offered support tohousing finance institutions. However, despite this, ingeneral there is a broad trend in favour of greater relianceupon financial markets and less direct state involvement.
No global financial flows in housing
Despite this financial deregulation, there is relatively littleevidence that financial globalization is taking place in thehousing sector.22 Markets for housing finance haveinternationalized rather than globalized.23 Hence, atpresent, while money can flow across borders and assets aresold offshore as well as domestically, there is not a globalizedmarket in which there is a continuous flow of funds intoassets whose risks and returns are independent of nationalregulatory and banking structures and where prices areidentical across national borders (for areas with similarrisks).
Internationalization, it has been argued, has occurredin place of globalization because, although the state haswithdrawn to some extent, it remains involved and housingfinance markets are still particular, depending upon theirspecific historical and structural contexts. As a result, ratherthan there being a single market, many national marketsexist. Moreover, it has been noted that in European markets‘attempts at cross-border lending have been small scale,frequently loss-making and often brief’.24 It is the scale oflocal diversity and the lack of understanding of the localcontext that deter such investments. For example, mortgagelending involves a security on a property which is very fixedand valuation systems vary between countries, as does theease of foreclosure. ‘The evidence from advanced economiessuggests that not only do housing finance systems play animportant role in determining the nature of housing systems,they are also fairly resistant to convergence.’25 Theseconclusions are reinforced by other studies which concludethat there is little international investment in the UK marketfor mortgage-backed security26 and that international fundingof social housing in Europe is an exception.27
Despite these conclusions about specific investmentflows that are directly concerned with housing, there isevidence that economies are becoming more interdependentand this is affecting housing finance markets. A recent studyemphasizes that there is evidence of the synchronization ofhousing price increases in Northern markets.28 The growingsignificance of international capital flows has affectedhousing markets through exchange and interest rates.29
There are also commonalities in housing markets due to theincreased use of market mechanisms in addressing housingneed.
However, with regard to state activities, the globaltrend is very difficult to establish. National and regionalexperiences are different. It has been argued that, in thecontext of Western Europe, ‘it is not possible to detect ageneral, unidirectional and irreversible retreat by governmentfrom financial assistance for homeowners’.30
The creation of the Euro zone in the European Union(EU) has reduced the variation in national-level monetary
The market isunable to respond to
the needs of thepoor without
interventions fromthe state
Markets for housingfinance have
internationalized,economies are
becoming moreinterdependent and
this is affectinghousing finance
markets
145Assessing shelter finance systems

policies. Increased incomes and, thus, affordability havemade a real difference for some households (and thereforeopened up new market-based opportunities), notably in Asiabut also elsewhere. The experience of New Zealandhighlights the potential of governments to change policies.While in 1991, the government moved away fromhomeownership and towards ‘a tenure-neutral form ofincome supplementation called the accommodationsupplement, available at the same rate to all eligiblehouseholds’, a few years later it moved back to create amortgage insurance system that encouraged the extensionof mortgage finance possibilities for lower incomehouseholds.31 Although the scale of instability in financialmarkets during the late 1990s encouraged somegovernments to be proactive in ensuring that finance forhousing was available (illustrated earlier in the case ofColombia, Mexico and Thailand), such instability was notexperienced by all countries.
In summary, with respect to financial flows, studiesof Asia and Europe find that housing finance markets remaindistinct despite the presence of international investment.There is evidence of the convergence of housing markets,notably around current price increases; but local factorsremain important, particularly in some countries. Withregard to housing policy, there has been a widely acceptedtrend of relying more upon market mechanisms; but manygovernments still intervene for multiple reasons.
CONCLUDING REMARKSIt is evident that many of the poor cannot afford access tomortgage loan finance to improve their shelter because ofthe conditions attached to loans and the scale of poverty.This presents a significant challenge to the world as it seeksto achieve the Millennium Development Goals. This is notto say that mortgage finance is unimportant. Shelter financeis critical to improving the situation of urban and ruralcitizens across the world. Mortgage finance systems have toaddress the needs of those who can afford financial marketsand have to do so efficiently. But the groups that are targetedby the MDGs are not those who can afford mortgagefinance.
Additional measures are needed for those who cannotafford mortgage finance and/or who live and work ininformal markets and who cannot obtain mortgages. Smallloans will help these households to address their desire andneed for shelter improvements. However, the experience ofshelter finance suggests that it is limited in what it cancontribute directly to the MDGs. Most small loans throughshelter microfinance agencies go to households with landtenure. Moreover, such loans are rarely used forinfrastructure, partly because such loans are not on offerand because, without support, few communities have asuitable social organization through which to borrow forinfrastructure improvements. Hence, these loans improvedwellings but do not address other development priorities.The experiences with community funds are particularlyinteresting because their target group is people with lowincomes and few assets. However, development may be slowand limited if finance depends upon loans to assist theincremental building process. As noted above, with respectto the needs of the poor in the South, the greatest potentialappears to lie in integrating neighbourhood developmentstrategies with small loan packages (including incomegeneration, housing improvement and community fundmethodologies for additional needs). Loans and grantpackages that enable the poor to identify and collectivelydevelop land may also be useful, in addition to support forthe upgrading of existing areas.32 It should be noted thatneighbourhood development packages tend to concentrateon those who already have some claim to land within thedesignated areas (even if it is not a legal title), and tenantsmay be neglected even if they are also interested in securingtenure.
Housing finance markets have developed significantlyduring the last two decades. The extension of the marketfor housing finance has offered assistance to more affluentcitizens, particularly urban dwellers. However, the problemsfor the poor remain and difficulties related to the scale ofincome, the degree of informality and the affordability ofhousing mean that mortgage housing finance markets offerlittle to the poor. If the MDGs are to be achieved, muchgreater consideration has to be given to how this group canaccess effective financial systems and strategies that buildassets and do not increase vulnerability.
Instability infinancial marketsencouraged somegovernments to beproactive inensuring availabilityof finance forhousing
146 Towards sustainable shelter finance systems
1 This chapter is based on adraft prepared by Diana Mitlin,University of Manchester, UK.
2 Renaud, 1999, p761.3 Okpala, 1994.4 As the loan-to-value ratio
moves closer to 100, the downpayment required to securethe property falls.
5 Pardo, 2000.6 World Bank, 2004a, p13.7 Smets, 2002.8 Van Rooyan, 2004.9 Muller, pers comm (2004).10 Renaud, 1999, p759.
11 Collyns and Senhadji, 2002,p73.
12 Carolini, 2004, pp5–6.13 Hegedüs and Teller, 2003.14 Yasui, 2002b, p23.15 Hegedüs and Teller, 2003.16 Hegedüs and Teller, 2003.17 Railways Slum Dwellers
Federation, pers comm (2004).18 There is evidence that the
poorest members are lesslikely to participate in formalorganizations. See, Cleaver,2004; Thorp et al, forthcoming;D’Cruz and Mitlin, 2005.
19 Stephens, 2003, p1020, andPriemus and Dieleman, 2002,p198, substantiate theseconcerns.
20 Frey and Fielding, cited inCarolini, 2004.
21 Rome, 2001, p89.22 Stephens, 2003; Dymski and
Isenberg, 1998, 2002.23 Dymski and Isenburg, 1998.24 Stephens, 2003, p1018.25 Stephens, 2003, p1021.26 Kofi Karley and Whitehead,
2002, p35.27 Gibb, 2002.28 IMF, 2004.
29 D’Arista, 1998.30 Stephens, 2003, p1020.31 Stuart et al, 2004, p8.32 In Phnom Penh, many
communities were evicted in2003 and they were onlyoffered land some distancefrom the city centre with verylimited transport facilities.Thestronger communitiesnegotiated with the city for acontribution and, usingadditional savings and a loan,purchased land much closer tothe city (Urban PoorDevelopment Fund, perscomm., 2004).
NOTES
The scale of the need for urban services and housing in thecoming decades is both huge and unprecedented. Startingfrom a position characterized by backlogs, developingcountries will add about 2 billion new urban residents duringthe next 20 years, all of whom will need services and shelterin some form. They will be concentrated in 48 countries,mostly in South, Southeast and East Asia, with 660 millionin China and India. In most countries, in the absence ofsome major global change, there will be continuing anddeepening urbanization of poverty. As stated in Chapter 1,the current backlog of people living in slums isapproximately 925 million. They will probably be joined bya further 1900 million (more than twice as many again),resulting in 2.8 billion slum dwellers by 2030.
The bureaucratic institutions currently in place inmost countries are too unwieldy for rapid and efficient urbandevelopment. The costs of bypassing regulations andproviding services that city authorities fail to provide(including water, electricity, waste disposal and security) oronly provide intermittently (for example, with frequentpower failures) are not insignificant and reduce thecompetitive position of many cities in the global economy.
Urban development and housing policies often appearto be unconcerned with whether any goods are actuallysupplied and often appear to be really targeted at stoppinganything regarded as undesirable by policy-makers. Forexample, if an occupant of a plot decides to build a seconddwelling on it to rent out, they may well discover that it isillegal to have two dwellings on a plot. Housing supply is lessimportant than maintaining plot ratios. Similarly, water-connection pricing policy based on actual cost rather thanaverage cost can severely discourage providers fromextending the mains system. In another vein, taxationsystems that tax rental income more highly than ‘earned’income, or rent control that reduces the profitability ofproviding rooms to low-income households, can severelyaffect housing supply, especially for those in need. There isa fundamental need to put the supply of housing and otherurban goods at the centre of urban development policy andits financing.
Although there has been a great deal of recent focuson establishing well-functioning financial markets into whichhouseholders can dip in order to finance their dwellings,most households in most developing countries have no accessto housing finance, nor are they likely to feel that they haveaccess to any. There are many societies in which low-incomepeople are too risk averse to borrow money.
In the supply process followed by millions ofhouseholders, if low-income people want to own a housethey must build one, employing a local contractor to do thework incrementally. They must save up enough money to beable to pay the contractor for each stage of the work, in cash,as expenses are encountered. The contractor is unlikely togive credit, even in the form of wages paid to workers aheadof a payment by the owner. Indeed, most small contractorscannot raise credit for their operations and therefore mustpass on all costs to the client immediately or in advance. Itis not unusual for the client to have to pay the workers’wages at the end of each day or each week. In addition, theclient may have to purchase and arrange delivery of thematerials to site, the contractor going along to advise, butnot to meet any costs. As the savings run out, so the workstops, often mid process, in a hiatus that will last until moremoney is saved. In this way, as a result of lack of capital,many homes which could be completed within a few monthstake many years to reach a stage where they can beoccupied. This ties up peripheral land around countlesscities under haphazard and wasteful quasi-residential landuses, with few people in residence and under-use of anyservice lines fitted ahead of development. In consequence,authorities are loath to fit services ahead of the developmentprocess and pioneer residents may have to wait many yearsbefore service lines are installed.
In an ideal world, there is a compact betweenhouseholders and the public realm represented by cityauthorities and the providers of services. Householdersexpect that their dwelling will exist within an efficientpublic environment that supplies them with convenienceand location. They will receive the benefits of road access;water supply; sanitation; waste disposal; energy and
The scale of theneed for urban
services andhousing in the
coming decades isunprecedented
C H A P T E R
POLICY DIRECTIONS TOWARDSSUSTAINABLE URBAN SHELTERFINANCE SYSTEMS 1
9
telecommunications; commercial, educational and socialservices; and the other benefits of city life. In exchange, theywill pay for what they receive at a level that is bothaffordable and recompenses the providers for the publicservices they provide. This will not only happen at thebeginning of the development of their dwelling, but will alsopersist through their lives and those of their children inperpetuity.
In order to fulfil this compact, the following arerequired:
• efficient and well-funded city authorities and serviceproviders;
• appropriate and affordable technologies;• appropriately distributed service lines and locations;• appropriate charges for services, agreed to by both
users and providers;• the ability and willingness of the city authorities and
service providers to levy and collect the charges; and• the ability and willingness of householders to pay for
services received.
This is the ideal; but the preceding chapters have shown thatthis is not usually the reality, especially for low-incomehouseholds.
This chapter will, on the basis of the experiencesreviewed in this Global Report, discuss the ways in whichshelter finance systems could be strengthened in terms ofboth performance and sustainability. Its main purpose willbe to point the way forward, highlighting best policies andpractices. Currently, the great majority of households inmany countries are unlikely ever to afford a formal-sectordwelling, but are usually left financially unassisted in theirstruggle for shelter in the informal sector. Furthermore,the scale of need for shelter is and will remain at levelsunparalleled in the past, requiring finance in much greaterquantities than ever before. The implications of failure toprovide finance for shelter for all are stark. This must formthe context of the following discussion of the wayforward.
TOWARDS INCLUSIVEURBAN INFRASTRUCTUREAND SERVICES The essential basis of the municipal side of the compact is asystem of financing public goods so that they can beprovided across the city in appropriate quality and quantity,and at affordable cost, and so that the city can be managedeffectively. Unless urban areas can produce more income atthe same rate that they absorb more people, the resourcesto develop infrastructure and build shelter will not beavailable.
Pro-poor municipal financing requires that effectivelevels of finance reach the municipality to enable servicesto be provided to all neighbourhoods and householdsregardless of their influence or income. Thus, funding formunicipalities should be adequate to the task, paid on time
and reliable over the medium term, and should allow themunicipality some flexibility over its level and source.
The means by which municipalities receive theirfinance and the balance between their funding andobligations are considered below.
Financing for municipalities and serviceproviders
It is vital that powers, duties and revenues are congruent. Ifthe municipal authority is responsible for social housing, itshould have the power to take policy decisions on how it willact and receive the required revenue or be able to raise thefinance. Furthermore, it is important that the balance shouldexpress where power is best exercised and revenue can bemost effectively disbursed. This is in line with the currenttrend to decentralize power to municipalities.
� Public-sector inadequacy to the taskMost developing countries labour under large public budgetdeficits, with public resources scarcely able to meet salariesof civil servants and operating costs of schools and hospitals.Infrastructure maintenance is regularly deferred and newinfrastructure cannot remotely keep pace with development.Reliance upon official development assistance (ODA) for newinfrastructure leaves it prey to competition from othercountries for the scarce resources on offer. When eventssuch as the 2003 Bam Earthquake and the 2004 tsunami inthe Indian Ocean occur, ODA is inevitably diverted to reliefefforts because public opinion in donor countries drives thepolitical agenda.
Without a revolution in how it is raised and managed,public-sector finance is unlikely to be an appropriateresource for service and housing provision for the majority,or even any significant fraction of the population. The macro-economics of how currently poor countries become richertend to be determined by trade terms and the flow ofinternational finance, which are largely outside the remit ofthis Global Report. The following sections discuss howimprovements can be made in how governments,municipalities and service providers raise and manage theirresources; but only major restructuring can remove theunderlying causes of urban servicing and housing shortfalls– the effect on poorer countries of the inequalities in globalresource distribution.
� Balancing local, provincial and nationalfinancing
There are many ways to balance different levels ofgovernment, with services provision and responsibilities forsuch issues as housing, education, policing and many othersresiding in municipalities or provinces with more or lessequal effectiveness. Incongruities, such as municipalitieshaving most of the duties but provinces receiving most ofthe revenue, fundamentally affect the ability of householdsliving in poverty to improve their circumstances.
The needs of local government bodies to raiserevenues are expressed in many different ways, and it is notthe purpose of this report to recommend a single way
Unless urban areasproduce sufficientincome, theresources to developinfrastructure andbuild shelter willnot be available
148 Towards sustainable shelter finance systems

forward. However, the balance of argument seems to favourmunicipalities being able to raise at least part of theirrevenue from local taxation, at levels which reflect localconditions. As a consequence, municipalities andgovernments need to build the institutional capacity to levyand collect these taxes, and to spend them responsibly.Indeed, legislation may be necessary to guide theresponsible use of municipal revenues.
� Importance of a municipal capital financing fund
It is vital that there is some source of loans for capitalprojects to which municipalities can apply to allow them todevelop major projects that cannot be financed out of annualbudgets. There are many models. Funds may be madeavailable through loans from central government or anagency thereof, a mortgage bank, a finance company, aprovincial-level institution, or a group of municipalitiesworking cooperatively. Such an institution can be used forraising and passing on grants and loans from commercialbanks and/or multilateral and bilateral funders. If there iscentral control, care can be taken that the projects fundedfit into a national strategy; but smaller municipalities maymiss out in favour of larger, more internationallycompetitive, cities. However, local discretion is required sothat municipalities can compete and work on managing localdifferences to their advantage.
� Debt swapsJust as protecting endangered environments can be fundedthrough debt swaps, so such exercises can be used to fundhousing and urban services, as shown in the case of Boliviadescribed in Chapter 3. As in many other financingarrangements, having a poverty reduction strategy paper(PRSP) in place that influences urban policy enables debtswapping in that it gives the parties confidence that themoney will be spent within a strategy for poverty reductionrather than ad hoc.
� Betterment leviesThe rising value of urban land is a significant potential sourceof finance for cities. It is argued that landowners who benefitfrom the increased value of their land as a result of itsconversion from agricultural to urban uses, or as a result ofthe provision of infrastructure, should contribute to thecosts of new infrastructure from their ‘windfall’ gains. Thisrevenue could finance interventions to increase access toland for the poorest groups. Extracting public value out ofthe development process has been practised in manycountries, some with great success. The US linkage process,in which city authorities leverage funds from the profitsderived by developers of real estate to fund social projects,might be effective in cities in the South.
� Improving tax collectionAs a means of increasing revenue for a municipality, it isimportant to actually collect the taxes and revenues to whichit is entitled from those who are liable to pay. Manymunicipalities have abysmal records in collecting taxes and
service charges. To enable this to improve, there is a needfor:2
• up-to-date information on who should pay (thisshould be in a form that is easy to access; manymunicipalities will need assistance to change fromoutdated paper methods to computerized record-keeping – this is especially important for propertytaxes, but is also applicable to market traders’ andhawkers’ licences);
• transparent charging structures adhered to duringcollection and recording;
• efficient collection methods with regard to reachingall who should pay (ranging from cash daily tomonthly or annual bank standing orders);
• career progression prospects and other rewardsystems for tax and charge collectors so that they haveincentives to collect efficiently;
• effective penalties for those who do not pay,especially those who exploit positions of power toescape payment; and
• appropriate means to keep tax levels in line withinflation and changes in costs.
� Strengthening property tax systemsThe above characteristics of currency of records,transparency and efficiency of collection are particularlyrelevant with respect to property taxes where systems areoften poorly provided with records, where tax levels appeararbitrary and have not kept pace with property values, andwhere taxes are inefficiently collected. The level of accuracyrequired in land records for collection of property taxes islower than that for avoidance or resolution of land disputes.Thus, such systems as half cadastres and the use of regularlow-resolution aerial photography can provide a level ofaccuracy well able to support property taxation systems atrelatively low cost compared with an expensive, highresolution land survey. Where available, geographicalinformation systems (GIS) and satellite imaging can providean ideal basis for property tax records. Tax levels andpayment records could be seeded into one layer of a GISdataset, with access limited to tax collection staff asappropriate.3
It is also important that the tradition of allowinginformal settlement occupants to free-ride on the propertytax base should be abandoned. The dilemma that thispresents of taxing people for occupying land that is notrecognized as theirs to occupy, and from which services arewithheld for that reason, should be addressed instead ofcontinuing to ignore it. In Egypt, the link between taxingand regularizing has been broken, and residents ofperipheral settlements pay up in exchange for receipts thatprovide them with documentary evidence of occupation.Other locally appropriate solutions are required elsewhere.
� Managing borrowing and debtsThere is a need for municipalities to raise capital and thereare several methods in use around the world. However, manyhave become severely embarrassed by debt-servicing
Transparency andefficiency of tax
collection areparticularly
important
149Policy directions towards sustainable urban shelter finance systems
burdens. Debt management is a field in which there is anurgent need for capacity-building within local authorities inrapidly developing countries.
� Adjusting charges for local servicesIt is important that municipalities are paid economic chargesfor their services. Thus, functions such as land registry,building regulation and planning control should be subjectto a charge that covers the cost. This is essential if theinstitutions are to survive and attract high-quality staff onprogressive career paths.
Similarly, user fees for municipal services (markets,abattoirs, car parks, transport interchanges, bus services,assembly halls, etc.) should cover life-cycle costs and, whereappropriate, generate revenue. Where concessions are to begranted, this should be done through demand-sideinterventions, such as tokens for low-income users suppliedcentrally rather than by compelling the service to givesupply-side concessions to some users. The exchange ofrecyclable waste for transport tokens in Curitiba, Brazil, is agood example of a method of granting concessions whilemaintaining the profitability of a transport system.
� Improving maintenance to reduceexpenditure
In many cities, there is a culture of replacing regularmaintenance with irregular capital projects. Rather thanannual road repair cycles, keeping them up to standard,roads are allowed to disintegrate over a few years and arethen rebuilt using capital funds, often sourced throughODA.4 It is better practice to cost infrastructure over itswhole life (life-cycle costing) and put aside money forperiodic maintenance over a long life. The savings areconsiderable compared with rebuilding at the end of a shortlife. In this way, low capital cost solutions that involveexpensive maintenance or have short life can be avoided infavour of those with a lower life-cycle cost, even thoughtheir initial capital costs are higher.
There are also gains to be made from servicing coststhrough maintenance. When New Delhi loses 40 per centof its water through leakages and unauthorizedconnections,5 there are obvious savings to be made throughfollowing up leaks and stopping them. New technologies,including in-pipe monitors, which reduce the inevitability ofmajor leaks escaping attention are now available. Moreefficient use of the current water flow will also delay theneed for, and limit the size of, new reservoirs and othermajor capital investments.
� Private financePrivate-sector finance is probably the most important enginefor urban development, providing large shopping malls andcorner shops, high-rise apartments and informal housing.However, it cannot keep pace with demand, especially wherethere is insufficient profit to make it worthwhile for outsideinvestors to participate (that is, most housingdevelopments). Foreign direct investment (FDI) is vital inmost countries; but in all regions, it averages less than 6 percent of gross domestic product (GDP).
One of the most important segments of the privatesector in financing shelter is the domestic (household)economy, in which households save money and investincrementally in their housing and the services around it.Not only will this improvement affect the dwelling and itswater, sanitation and energy services, it will also affect thesupply of shops, social facilities such as crèches, schools,clinics and employment opportunities. It is likely that thiswill continue to be a vital part of shelter supply and shouldbe encouraged as a matter of priority. The ability of thesmall-scale private sector to run local supplies of water,waste collection and other services in partnership with thepublic authorities is well documented and should beexplored by municipalities not already using suchpartnerships.
Improving the efficiency of resource use
� Multi-year programmes and budgetsJust as life-cycle costing is important to maintain themomentum of maintenance,6 planning budgets ahead of thenext financial year also allows for programmatic investment.As stated in Chapter 3, multi-year capital investmentplanning has proved very successful in Szczecin, Poland, asthe city carried out a programme of transformation duringthe 1990s. The confidence established through the medium-term planning allowed the city to leverage non-municipalresources for its capital investment programme, which couldbe adopted in many other cities to improve efficiency.
� Participatory budgetingWhere municipalities in Brazil have implemented popularparticipation in budgeting, four key features have beenintroduced in the budgeting process:7
1 representation of residents through popularassemblies;
2 accountability by officials;3 transparency, with open voting; and4 objectivity in prioritization – for example, through a
quality-of-life index.
Participatory budgeting has changed the dynamics ofcitizen–municipality relationships from confrontation andcorrupt political bargaining to trust and constructiveengagement. Its success depends, however, upon therebeing sufficient funding to give people participating in theprocess some hope that they will see improvement in theirown lives, as well as those of others.
� Government as creditor of local authoritiesand service providers
It has become almost established practice for governmentsand their agencies to delay payments to municipal councils.This is also the case for service providers who may wait yearsfor government ministries to pay for electricity, water, wastedisposal and other services. The service providers may havelittle ability to use their usual tactics to ensure payments.For example, when a prison is disconnected from the water
It is important thatmunicipalities arepaid economiccharges for theirservices
Private-sectorfinance is probablythe most importantengine for urbandevelopment
150 Towards sustainable shelter finance systems

supply, inmates may die of dysentery. The minister of prisonsis unlikely to tolerate disconnection of supply and the waterauthority will continue supply even without the bill beingsettled. Multiplied by the many other ministries – and goodreasons for not cutting off supply – arrears build up tounsustainable proportions. Similarly, if government fails topay the agreed proportion of municipalities’ revenues ontime, or the property taxes on its premises in a city, itimpoverishes local government. When changes in levels ofcost chargeable for service delivery are ordered bygovernment, it is quite likely that funding for the servicewill not increase. Even where governments recognize theimportance of local government through devolution, thesepractices are all too common.
Such exploitation of its position by centralgovernment should be stopped in the interest of effectivelocal government and service provision. Similarly,municipalities should pay service providers on time and atthe levels agreed.
� Eliminating corruptionWherever it occurs, corruption saps the ability of central andmunicipal governments to meet the needs of theirconstituents through diverting money away from thedevelopment and maintenance of services.8 The eradicationof corruption would allow greater benefit to be passed onto people living in poverty, instead of benefits simply passinginto the hands of small elite groups. Not only couldinternational finance perform more effectively, but peopletrying to obtain small loans would receive better value, andall cases in between could be more effective per unit offinance involved.
International advocacy – such as through the UnitedNations Convention against Corruption, the work ofTransparency International in, among others, publishing theannual Global Corruption Report, UN-Habitat’s GlobalCampaign on Urban Governance and the World BankInstitute’s theme on governance and anti-corruption – areall steps in the right direction. However, only when realprogress is made on making corruption simply unacceptablein business and government, and involving people ineradicating it wherever it is found, will the vicious cycle bebroken.
� Reducing the cost of urban servicesIt is likely that government funding can have the greatesteffect if it is directed towards infrastructure and services forlow-income neighbourhoods and welfare services for thepoorest. In the provision of land, basic infrastructure andsocial services to the poor and poorest, subsidy is likely tobe required unless the cost of services is low indeed. Publictaps, public toilets and neighbourhood waste collectionpoints have all been utilized to reduce cost per household.However, there are often seemingly insuperable problemsarising from maintenance and payment when such servicesare shared among many people. A mid point at whichservices are shared among a limited group of people who allknow each other, especially those who live in a multi-occupied house of the type common in cities in Nigeria and
Ghana, may provide a means of sharing without the usualproblems of public services.
Enhancing households’ willingness andability to pay
� Income and employmentUnless urban areas can produce more income at the samerate that they absorb more people, per capita incomes willfall and urban poverty will deepen. Thus, employment andincome are central to the financing of urban development.It is, therefore, vital that employment and economicopportunities are available for as many people as possible inthe cities. Improved income allows people to better affordservices and to achieve more choice in their housing.Housing and service provision present important potentialfor employment.9 The potential of shelter provision togenerate employment for low-income workers should beutilized to generate income to improve people’s ability topay for housing. The income multipliers (the number oftimes income circulates in the local economy before beingsaved, paid in tax or spent on imported items) are very highfor construction and even higher for low-technology, labour-intensive construction.10 In addition, backward linkages (inwhich economic activity is generated in other sectors) andforward linkages (in which the building is used in generatingeconomic activity either in equipping and maintaining it orby using it for work) are also high in construction.11 Thus,the very activity that the housing finance allows is capableof generating further wealth and economic developmentvery effectively, largely concentrated in low-incomehouseholds.
In parallel, the provision of efficient infrastructureand appropriate shelter is critical in ensuring the economicproductivity of the work force in urban areas and countriesas a whole. Although it is very difficult to demonstrateempirically, it is intuitively evident that where people arewell housed, they can be more productive. In addition,workshops, offices and other workplaces need good serviceconnections. Where workplaces are in or adjacent to thehome, services to residential neighbourhoods areadditionally important for employment and productivity.Thus, investment in urban infrastructure and shelter areessential components of national economic success.
� Reducing transaction costsLocal governments should reduce the costs of economicactivity by streamlining land allocation, development controland other regulatory activities while retaining appropriateability to act in the public good. Municipalities should carryout audits of their regulatory procedures and reduce theircomplexity for the user. One-stop shops allowing planningand building control to be streamlined are capable ofradically reducing the transaction costs of development andencourage more people to take the formal developmentroute. Despite high initial set-up costs, record-keeping onGIS and other electronic systems can reduce bureaucraticcomplexity in addition to their primary task in land registry,urban planning and infrastructure planning.
Improved incomeallows people to
better affordservices and to
achieve more choicein their housing
151Policy directions towards sustainable urban shelter finance systems

STRENGTHENING THESUSTAINABILITY ANDPERFORMANCE OF SHELTERFINANCE SYSTEMSThere is both a need and a demand for different types offinance for different sectors of the housing supply process.Mortgage finance, for relatively large sums over a longperiod of repayment, is essential for those well off enoughto buy a complete formal dwelling. However, small loans,taken out over short terms of between one and eight years,loaned at market rates, are growing in importance in thehousing sector, as shown in Chapters 6 and 7.
Reducing housing costs
The problem in many developing and even in somedeveloped countries is not that housing is too expensive butthat incomes are too low. It should be noted that in manycountries housing is very inexpensive in international termsand it is difficult to significantly reduce the cost any further.The real problem is that incomes are too low. As seen inChapter 2, more than 60 per cent of the population of SouthAsia and sub-Saharan Africa survive on less than US$2 perday. Thus, the locus of attention should not only be on theminimum quality and cost of housing, but also on the levelof payment received by workers. This demand-side focus isin line with current trends in subsidies and concentratesattention on the systemic problem of poverty, which isresponsible for generating poor housing conditions.
In many countries in the South, the cost of urbanhousing is increased significantly by the high standards towhich it must comply. The standards in force often specifythe use of building materials and components that useimported materials and/or inputs. This not only increases thecost substantially, but also necessitates expenditure of scarceforeign exchange. It is often the case that these standardsare either a colonial legacy or have been adopted from aforeign context, and are therefore of little practical relevanceto the prevailing socio-economic situation. The introductionof lower standards that are more appropriate to the localcontext could potentially make housing more affordable to afar greater proportion of the urban population. Lowerstandards would still, however, have to safeguard the healthand safety of the occupants and protect the public interest.12
Enabling household decision-makingthrough more effective policy
The context of shelter provision can be summed up thus:households will make housing arrangements that they canafford for the amount of their income that they are willingto spend on housing. This may vary through many householdcircumstances, including:
• spending the occasional dollar on bribing a policemanto allow them to sleep in a sheltered place on thepavement;
• renting an un-serviced room in an informalsettlement;
• spending about half the household’s income on therent of a flat so that they can have a secure base inthe city;
• building a shack in a land invasion on the edge of thecity;
• after years of saving, engaging a builder to constructa cement-block dwelling in an informal settlement;and
• using a mortgage to buy a formal dwelling in a fullyserviced area.
Although there may seem to be an upward income gradientfrom the first to the last of the above circumstances, thismay not be the case as the old idea of households devotinga fixed amount of their income to housing is no longerplausible.
Housing decisions depend upon the proportion ofincome that a household is willing to spend and how theyare willing to spend it. Thus, destitute households maychoose to pay for a room in a shack or may prefer to sleeprough and use the rent money another way, includingsending it back to their home village. Similarly, householdswho could easily afford a formal-sector dwelling may chooseto stay in an informal settlement and use their money to puta child through college overseas. A similar household maychoose to own a large informal dwelling rather than a smallformal one, or to stay in the squatter settlement amongfriends and business clients rather than move to betterhousing on the periphery, or any of a multitude ofcircumstances. All households need a policy environment inwhich these choices can be taken and sustained.
Addressing the need for rentalaccommodation
Most policies behind ODA and national policies are based onthe provision of independently serviced, single-householddwellings, owned by their occupants. However, this is by nomeans the main form of occupation by households living inpoverty. Instead, large numbers of households live in buildingsoccupied by many households. These may be, at the upperend of the market, spacious fully serviced apartments or, atthe lower end, houses with many households sharing servicesand having a single room each.13 Except for their developmentby entrepreneurs for sale or renting, there is little financeavailable for co-operative construction and ownership. Forexample, tenants wishing to redevelop their tenements(chawls) in Mumbai had to become involved in ‘black’ moneyto finance the project because of restrictive rules over sellingprices.14 There is much to be gained from encouraging multi-occupied housing development where it fits in with localnorms. If someone is willing to build accommodation for manypeople, financing conditions should take account of rentalincome or the combining of many incomes to assess the scaleof a loan for construction.
Small-scale landlords in informal settlements are amajor source of affordable housing for a growing majority of
The problem is notthat housing is tooexpensive but thatincomes are too low
152 Towards sustainable shelter finance systems
households living in poverty in the urban South; but thereare few initiatives to assist them.15 In many cities, over halfthe population live in such settlements, and the proportionof those occupying rental accommodation is increasing bythe day. Evidence from past experience shows that in situupgrading to improve access to water supply, sanitation andother basic urban services often results in higher rent levels.When this happens, there is little to prevent displacementof poorer tenants by higher income households. The former,consequently, have to move to another settlement whereliving conditions are less satisfactory but within their means.It is imperative, therefore, to understand how best to assistthe informal rental sector, and at the same time to preserveaffordability in order to preclude gentrification (see Box 9.3).
Contractor financing
In the spirit of the Habitat Agenda, and if the housingbacklog is to be cleared at all, it is vital that all actors in thehousing process are involved in the role in which they aremost efficient. The most important suppliers of thedwellings themselves, and their ancillary services, are themillions of small-scale building contractors, the singleartisans or small groups of skilled people and the labourerswho service their needs. However much demand there isfor housing, it can only be supplied as quickly as theconstruction industry can build it. The small-scalecontractors take on most of the work but are ill equipped tooperate efficiently because they are underfinanced. It is fartoo common for a client to have to pay the workers and buythe raw materials because the contractor cannot evenborrow enough money for a week’s work ahead of payment.For the same reason, technological improvements are slowin coming – even the smallest power tools are unusual onsmall-scale construction sites.
The resources provided in the past to self-help buildersinvolved in sweat equity consolidation should now beprovided to those individuals who do not stop when they havebuilt a single house for their own use, but who will go on toconstruct several each year for the rest of their career ascontractors.16 Finance to provide healthy liquidity amongsmall-scale contractors and single artisans is an essentialprerequisite to effective housing supply to scale. Unlessfinance and other assistance are available, the contractors,whose efforts build vast swathes of our cities, are unlikely tobe able to adopt efficient methods of employment, materialpurchasing and customer payment schedules. Neither arethey likely to adopt tools and technologies appropriate totheir making best use of local materials and labour conditions.Suitable finance is urgently needed to allow them to buy toolsand materials, and to pay their workers for periods beforebeing paid for a job, and to retain them between jobs. Theyare likely to be able to pay market rates for loans, so there isno need for tax revenue to be expended in helping them tomake better profits (see Box 9.1).17
Development of ‘developers’
In countries where the housing supply system is efficientand speculative of what the market demands, developers are
often an important part of the process. In this sense,developers are not builders. Instead, they are investors wholocate and buy land, engage and brief designers, gainpermissions and infrastructure provision, engage andsupervise contractors, and sell the completed properties.They drive the process of housing development, especiallywhen it uses private-sector funds.
The process of development can be taught, typicallyat management schools, but is also one that some peoplecan do instinctively. However, they need finance for theirrisky, but often highly lucrative, business. Some mechanismfor recognizing their contribution with financial assistance,especially for bridging loans, may be very beneficial for thehousing supply process and could institute the efficientspeculative building of housing that is common inindustrialized economies.
Reducing financing constraints and risks
� Financing informal developmentFollowing a long history of increasing acceptance of thevalidity of informal development and that which does notconform to prevailing high standards, it is easier to financethe informal housing development efforts of people living inpoverty now than it was 20 years ago. There is still a need,however, for a pro-poor enabling policy environment inwhich households living in poverty can obtain secure landtenure and build housing within their affordability range.Recent research into regulatory frameworks for urbanupgrading and new housing development has recommendedthe removal of constraints that prevent the poor fromborrowing from financial institutions or accessing creditthrough other formal channels. In particular, administrativeprocedures that delay investments and/or increase risksshould be reviewed as they add to the cost and deter thepoor from conforming.18
� Savings and debtThe countries in which most of the urban growth will takeplace in the next 25 years have very low domestic savings,
Where the housingsupply system is
efficient, developersare an important
part of the process
153Policy directions towards sustainable urban shelter finance systems
Box 9.1 Pitfalls of providing financial support to private developers in India
The following is a cautionary tale from Ahmedabad in India where the state housing financecompany funded a large private developer to build low-income housing. Although thedeveloper was well known for its cost-cutting low-income housing, its involvement withofficialdom and the expectations that built up in the customers caused severe problems anddrove the developer out of low-income development. No longer able to cut corners withregard to land acquisition and finishes, and under pressure to use the secure tenure land forhigher income groups, the developer cut down on the cheaper dwellings to make more profitfrom better-off clients.This example of a large contractor being assisted in carrying out a verylarge contract provides some caution for helping small contractors, mainly with regard to thechanges wrought by enabling secure tenure and providing government agency imprimatur. Mostof the problems found in the Ahmedabad case would be avoided by arms-length loans fromcommercial banks to small-scale contractors. Self-interest-orientated and opportunisticbehaviour from each of the actors in the housing process, rather than naively hoping thateveryone will act for the common good, should be expected.Source: Mukhija, 2004a.
measured as both per capita and as a percentage of GDP (13and 14 per cent, respectively, in South Asia and sub-SaharanAfrica). As savings are the foundation for investment, thisdoes not auger well for urban development. These countriesare heavy with debt, especially external debt to public andprivate institutions in developed countries. Many of thecountries, especially in sub-Saharan Africa, are unable tooffer the environment required by private investment andmust rely upon ODA and loans from internationaldevelopment agencies.
It is important that developing countries maintain asmuch of the investment and savings arising from localeconomic activity within their borders or benefit from netinflows from investments overseas. In many countries, assetsare stripped out as profits are stored in foreign exchange inSwiss or other Northern banks, or used to buy property andeducation in the North in a way that does not lead tobenefits back home. Such capital flight contributes toinvestments in shelter and infrastructure in Europe orAmerica, but not in cities at home. It is difficult to overstressthe importance of reliable banks and low inflation indiscouraging capital flight.
Improving the accessibility of mortgage finance
Mortgage finance, in the sense of long-term fixed or variableinterest rate loans sufficient to buy a whole dwelling whencombined with a deposit, is helpful to the middle- and upper-income groups in most societies. It is in governments’interests to extend mortgage markets down the income scalesince homeownership is beneficial economically, socially andpolitically. Measures adopted have included:
• reducing the cost of lending, especially throughlowering interest rates;
• supporting the system of mortgage financing,especially through extending secondary markets andreducing risks; and
• direct capital grants to reduce the size of thehousehold’s mortgage in comparison with thedwelling cost.
Some governments are still heavily involved in mortgagefinance; but experiences vary from great success toembarrassing failure. In the transitional countries, nationalhousing funds offering loans to lower income groups havebecome very popular.19 In addition, some Southeast Asiancountries have major government housing financeprogrammes. The Thai Government Housing Bank lends toabout 40 per cent of homeowners. It offers some lessons in:
• making loans to lower income groups at lower ratessubsidized by higher rates charged to higher incomegroups; and
• offering fixed rates to borrowers for three to fiveyears to reduce their risk.
The Thai government uses housing development as part ofits economic strategy and is willing to stimulate its economy
through shelter development.20 The Philippine governmentalso has the role of primary lender for housing and hashelped nearly 1 million households into homeownershipbetween 1993 and 2003. Even so, the number ofhouseholds not served and living in informal housing grows,and this must be noted while attempting to use mortgagesto reach low-income groups.21
There are examples, particularly in Latin America,where mortgage companies have arrangements to reducerisks in lending to the informally employed, particularlythrough establishing a savings record before the loan isgranted and the lender is willing to receive repayments outof normal banking hours.22
Secondary mortgage markets have been successful inproviding funding outside the ‘borrowing short, lendinglong’ cycle of deposit funding. In the US, Europe andtransitional countries, secondary mortgage markets are inplace or are being set up. They are also being instituted inmany countries in Latin America and Asia, sometimes withmultilateral donor support. The limited experiences withsecondary mortgage markets in developing countries allowsome conclusions to be drawn:
• Keep it simple – success is more likely with simplebonds and simple forms of secondary mortgageinstruments.
• Macroeconomic stability is essential.• There must be demand from housing finance
providers for secondary mortgage market funds.• Investors must want longer-term financial
arrangements.• Standardized mortgages simplify pooling for selling
on to the secondary lender.23
Within the fraction of the population for whom they arehelpful, mortgages inevitably lead to issues about landtenure and the need for long-term security, even freehold,owing to the lenders’ need to be able to foreclose andliquidate the asset in the case of default. The importance oflegal property titles for developing sound economies cannotbe overemphasized.24 In itself, the need for secure tenuredisqualifies hundreds of millions of low-income householdsfrom mortgage finance. Providing secure tenure for the pooris seen to be a key to opening the door to leveraginghousehold expenditure on the dwelling. A recent studyshows that willingness to invest in housing is likely to beover 30 per cent for owners with secure tenure, but no morethan 15 per cent for those with poor tenure or renters. Lessthan full title may be sufficient, however, and even beneficialin that it may reduce raiding by higher income groups. Manymicrofinance institutions do not use title deeds as collateral;therefore, secure land title is not a prerequisite.25
Nevertheless, not all experience has supported theidea that legalizing land holdings leads to a greateravailability of some of the benefits of capitalism, includingbank finance. Many countries have no loans for peoplewishing to buy existing low-income housing. For example,resale of formal housing in South Africa’s former ‘blacktownships’ is hampered by a lack of suitable loans.26 It must
There is a need for apro-poor enablingpolicy environment
154 Towards sustainable shelter finance systems

be remembered, however, that many cultures and urbancircumstances preclude the development of a market insecond-hand housing; once bought or built, low-incomehousing is rarely sold.27
In Peru, many squatters without title deeds wereimproving their settlements in the confidence that they weresecure; but only 1.3 per cent of the 1.25 million householdswho had obtained legal title were applying for mortgageloans.28 The link between investment and legal securityseems much more tenuous and localized than is oftenargued. Indeed, other characteristics may be moreimportant, such as lack of formal employment, transactioncosts, and, vitally, low income in comparison with the costof a dwelling.
Even where they can gain access to it, long-termlending implicit in mortgaging may be very unsuitable forlow-income households as they are unlikely to be able tokeep up an unrelenting stream of payments over many yearsowing to irregular incomes or external circumstances, suchas economic recession leading to unemployment and/orincreases in interest rates. Mortgages tend to havesubstantial transaction costs that can put them outside theaffordability of most households. There is a need to reducesuch costs.
Well-run mortgage facilities are undoubtedlyimportant to the health of the housing supply system in theNorth and may be a major contributor to housingimprovement in transitional countries. They are alsoimportant in providing upper- and middle-income groupswith housing finance, without which they would claim theshelter provision directed at those lower down the incomescale. However, the introduction or continuation ofmortgage schemes in developing countries must not bethought of as a way of financing more than a minority ofhouseholds’ need for shelter.
Since mortgage finance is unlikely to assist themajority of the people, it must not be allowed to divertattention from financing that is helpful to lower incomegroups, or to drain resources away from low-incomehouseholds towards those in the middle- or upper-incomegroups. In the past, it has commonly done this in severalways. Perhaps the most influential has been whengovernments have supported mortgages in order to stimulatethe formal building industry and improve homeownershiprates, especially among their own power base. However,such supported mortgages have, typically, underperformedon numbers, especially those directed towards even thehigher echelons of the lower income majority, and havetransferred large sums from the majority to the better-offminority. Even in developed and transitional countries,mortgages redistribute resources from the poor to the notso poor where there is government assistance in the form oftax relief on interest payments (as there still is in France) orany other concessions for mortgage holders. Where suchtransfers occur, they are usually much greater than anydirect subsidies offered to support low-income housing andare insupportable on equity grounds.
In transitional and developing countries, it is notunusual for governments to subsidize interest rates on
mortgages, or to fix rates arbitrarily so that the mortgagelender cannot maintain liquidity. A further significantconcession is the tolerance of large amounts of arrears fromborrowers. Although they only deal with relatively well-offhouseholds and eschew moving down the market becauseof fears of default, many mortgage companies have relativelypoor loan recovery rates. In sum, in the South, mortgagesshould avoid blanket concessionary interest rates, tax reliefand tolerance of arrears as these all favour the better off atthe expense of the poor. Their political sponsors should alsobe clear that they in no way assist the poor majority.
� Terms of housing loansLoan periods and loan-to-value ratios (LTVs) are vitalcomponents of mortgage loans that are determined by thelender rather than the global macroeconomic environment.Decisions about them can be the difference between successand failure of the mortgage company and can determine whocan afford to borrow, at least at the margins. Low LTVs (and,therefore, high initial deposits) reduce risk but increase theneed for upfront capital. However, the UK Department forInternational Development (DFID) experience in Indoreshows that a low LTV may simply drive borrowers into theclutches of dealers in unsecured, high-interest loans to coverthe gap between price and formal loan, greatly increasingrisk of default and impoverishment of the borrowers throughhigh monthly payments.29
The level of repayments can be varied to helphouseholds meet their obligations. Variable-interest loansallow low payments at the beginning, increasing as incomeimproves to repay the loan on time. Loan repayments canbe linked to cost of living, with payments indexed tominimum wage levels. All ‘save now, pay later’ programmessuch as these, however, are vulnerable to economicfluctuations that adversely affect household incomes.
� The price of housingIn some contexts, recent rises in housing prices comparedwith incomes and other prices have occurred. Particularlysharp rises have transpired in Australia, Ireland, Spain andthe UK.30 The picture in the developing world is, however,less easy to determine and may not present the same risein property prices against others. There was anunderstanding that it was becoming more difficult to owna dwelling during the 1980s and 1990s; land was no longeravailable free for the invading. This was accompanied byan assumption that housing was more expensive thanbefore, which was not dented by the early housingindicators results that showed very high house cost-to-income ratios in many countries.31 However, detailedstudies in Ghana gave no support to this idea thathouseholds need to be better off now in order to beowners than they had to be in the past. They demonstratedthat recent owners were no better off than moreestablished owners and that, although prices had risensharply, they were not out of step with other price risesand those of incomes from all sources.32
Well-run mortgagefacilities areundoubtedly
important to thehealth of the
housing supplysystem
155Policy directions towards sustainable urban shelter finance systems

Recognizing the need for incremental loans
The majority of housing in developing countries is developedincrementally in stages, separated by many months or years.In new building, this is usually implemented a room or a fewrooms at a time; but it may, less commonly, occur inconstruction stages (for example, all the foundations,followed by all the walls, etc.). In the ongoing process ofconsolidating and improving an existing dwelling, orreplacing worn-out materials, there is investment in newer,stronger and more durable materials – perhaps dismantlinga wood-and-tin structure and replacing it with bricks andtiles. It is imperative that national and internationalinstitutions recognize that low-income people buildincrementally and provide microfinance suitable for thatprocess. This may also call for reform of building regulationsthat often do not allow incremental building in formallyrecognized dwellings. Currently, they rarely tend to legalizea more incremental approach even if it is planned to producea fully compliant structure in the end. Thus, it is time toremove the assumption that a single process will complete adwelling and to accept the reality of incremental buildingover many years so that lending can be tailor-made forincremental construction.
There are many incremental activities that add to thehousing stock, and extension activity is one of the mostimportant. A study of extension activity in formergovernment estates in four countries found that finance hadbeen the most important problem facing extenders; butmost had coped despite having to pay cash.33 Householdincome characteristics had relatively little influence on thedecision to extend, but they did constrain what was actuallybuilt. Larger and better-quality extensions could be built andthe process could be much more efficient if suitable loanscould be raised to allow one or two rooms to be addedefficiently and without delay. Short-term, small-scale loans,on one-year to eight-years loan terms and in amounts ofUS$500–$5000 are more useful for incrementaldevelopment than the long-term, large value loans favouredby the mortgage markets.
Improvements and efficiency gains possible throughincremental building with small loans, rather than withsavings, include:
• greater likelihood of building well (though on a smallscale), building immediately and avoiding highannual maintenance costs arising from poorconstruction;
• avoiding the wasteful process of improvising adwelling in temporary materials and then discardingthem as they are replaced with permanent materials;and
• reducing the age at which a householder can affordto be an owner as stages do not have to wait formoney to be saved but can be paid for in arrears.34
Problems regarding the valuation of incrementallyconstructed dwellings may be avoided if building cost, ratherthan resale value, is taken as the measure for valuation.
Lending based on the idea of housing as a productive good
There is a well-documented link between finance for incomegeneration and improvements in housing. Manyhomeowners operate one or more home-based enterprisesfrom the structure on which they raise housing finance. Intheir household portfolio, such enterprises are important asa contributor of about half the household income, onaverage, or all the household income for a large minority ofoperators.35 Without the home-based enterprise, thehousehold would not be able to afford the house. Many suchhouseholds should have their home-based enterpriseincome-factored into the loan affordability criteria.
The same goes for rental income. One of the mostimportant sources of low-cost rental property, which isbecoming more important as the years pass, is the extraroom built on to a home and rented out to a stranger forrent, or to a co-villager or relative for no rent but for someother benefit (if only to satisfy family obligations).36 Suchpetty landlord behaviour is very common and often involvesan owner who has a lower per capita household income thanthe tenants.37 In societies where rents approximate to agood return on capital investment, such activity can increasea household’s ability to pay for housing, and plans to rentout rooms should be factored into their affordabilitycalculations when considering a housing loan. The buy-to-let loans available in the UK may be a model for this.
Many of the large microlenders are quite sanguineabout their enterprise loans being used for improvinghousing. It is obvious that improvements in housing canbenefit home-based income generation, including roomrentals. Thus, lenders should take account of the likelihoodof income improvements in the application procedurethrough a process which factors in future income generatedby the housing goods to be provided under the loan.
Enhancing pro-poor formal housing finance systems
It is important that financiers recognize that the poor aremore concerned about access to credit than its cost.Experience shows that there is great demand formicrofinance even if interest rates are high. Interest rateceilings distort the lending environment, as do forgivenessof arrears and default, as well as subsidies. Since housing isa productive asset for many low-income households (30 to60 per cent of housing finance clients have a home-basedenterprise), borrowers are able to service their loans.38
A hospitable macroeconomic, financial and regulatoryframework is necessary for the development of sound andsustainable housing finance institutions. In Bolivia, freedomfrom unfair competition from a state-run bank andtemporary waiving of regulations helped financial providersto become established.
� SubsidiesIn the past, subsidies were the accepted way to help the poor.The theory was that if goods could be cheaper, people livingin poverty could afford them. Thus, reducing the price would
Experience showsthat there is greatdemand formicrofinance
156 Towards sustainable shelter finance systems
make housing more accessible to the poor. However, this didnot work out as planned. As the subsidy increased real cost tothe government, only a few could be provided in comparisonwith the need or demand. The scarce subsidized dwellingswere then rationed – vertically, by being only available to someincome groups, and horizontally, by being in insufficientquantities to serve all who qualified. This was furtherdistorted as the subsidized housing tended to be captured byhouseholds who were not living in poverty, but who hadinfluence or were regarded as ‘deserving’ through somecriteria other than income. These criteria may be incomeneutral, for example, having lived in the city for a time, orinvolve some indirect income redistribution, for example, bynumbers of dependants (redistribution towards the poor) orby having secured a loan (redistribution away from the poor).Indeed, subsidies rarely reach the poor.39
Subsidies come in many guises, including:
• direct interest rate reductions;• allowing mortgage interest payments to be deducted
from income tax;• supporting housing-related savings;• supporting insurance of mortgages;• supporting the secondary mortgage markets; and• direct grants for shelter.40
The last can be through housing allowances paid withsalaries, a mark-down of the house purchase price, or theprovision of a bundle of shelter benefits at cut price or free.
Subsidized loans are still offered by manygovernments, including Brazil, Hungary, Mexico, Panama,the Philippines, India, Tunisia, Thailand and many more.However, to qualify, a household must be able to afford theloan. This may disqualify a majority of the population frombenefiting from the subsidy and increases inequity. Subsidiesoffered by governments tend to prevent the development ofa commercial market, not only in loans but also, in extremecases, in house building. Indeed, free government housingoffered to citizens in the oil-rich Gulf States can even reducethe quality of the current housing stock through allowingthe older stock to fall into disrepair in order to qualify fornew housing.41
Interest rates are often subsidized to increaseaffordability – indeed, some ODA finance has been used tofund interest rate subsidies. However, this has been seen tobe both unsustainable at a large scale or in the long run andto redistribute income towards the upper-income groups.However, market rates may be so high (perhaps above 20per cent per annum) that they make it impossible for all buta very few households to afford repayments, leading topolitical pressure to reduce rates through subsidies.
Subsidy is a function of the failure to afford the marketprice of shelter solutions. If appropriate housing finance is inplace, the proportion of households requiring subsidy shouldbe minimized to only those too poor to afford the real costof the shelter available. The need for subsidy can, thus, bereduced by adopting effective financing systems.
The work of some non-governmental organizations(NGOs) in providing funding for the individual’s contributionto attract a subsidy is very helpful to many households. In
Ecuador, a revolving fund provides the down paymentnecessary to obtain a national housing subsidy grant. NGOsin South Africa, such as the Kuyasa Trust, lend money forimprovements to be made to housing provided by thesubsidy programme. Although the amounts per householdare often quite small, such loans are frequently pivotal inproviding improved housing to low-income households. TheCommunity-led Infrastructure Financing Facility (CLIFF) inIndia provides grants so that professional help can beacquired to help communities ‘package’ projects in a waythat will attract loans from banks and draw down applicablesubsidies from state authorities. Then, CLIFF bridging loansare granted to slum development projects so that initiativescan start while negotiations go on with formal financeinstitutions and public officials. Housing finance institutionsshould be vigilant for such opportunities to enable targetgroups to benefit from their entitlements.
� Social housingSocial housing is, almost by definition, subsidized housing.As stated earlier, the reasons that governments subsidizeshelter include improving fairness and social stability,especially in ways that do not occur through marketmechanisms. The subsidy element is a financial credit to theoccupier and, thus, often constitutes an important elementin a nation’s housing finance system. Many countries havefollowed the example given by several European countriesduring the early 20th century in their large state rentalsectors. Former colonies inherited systems of social housingfrom their respective colonial powers.
In Europe, recent shifts from government as providerto government as funder has reduced the level of its risk,
The subsidy elementis a financial credit
and, thus, oftenconstitutes an
important elementin a nation’s housing
finance system
157Policy directions towards sustainable urban shelter finance systems
Box 9.2 Hogar de Cristo, Chile
Hogar de Cristo is a non-governmental, non-profit, Church institution, whose mission isto provide appropriate and loving shelter to the poorest among the poor and,particularly, to the helpless aged, to the homeless, to the terminally ill andirrecoverable who lack any form of support, and to children and youths who areabandoned, excluded and lacking in opportunities. It also seeks to generate anawareness of the real extent of the problems of the poor in order to encourage drivesto relieve them, and to denounce what can be solved.i
Founded in Chile over 50 years ago, and featuring many programmes to help the poor,Viviendas Hogar de Cristo (VHC) has grown into a major provider of wooden sectionalhousing to the poor. Its Ecuadorian branch produces 100 dwellings daily from bamboo, which itgrows in its own plantations. Seventy-seven per cent of its beneficiaries have incomes of lessthan US$20 per month. About half are widows or female single parents.ii
The overall costs of the house are US$450; but there is a government subsidy ofUS$144 (US$4 per month for three years).The client has to pay US$186 through payments ofUS$4–$5 per month. If they pay at the VHC office, the client can simultaneously receivemedical attention and lunch for themselves and their youngest children, subsidized by thegovernment.They can pay with their social welfare of US$11 per month or with other income.Some are supported by VHC’s charitable funds.
Currently, VHC has 16,000 clients, of whom 80 per cent pay every month; some evenpay several months in advance. Only 1 to 2 per cent of clients are regarded as permanentdefaulters.Notes: i Hogar de Cristo, undated.ii Costa, 2002.
Source: INBAR, undated.

but has not removed the necessity for government to beinvolved in housing for lower income groups.
Although social housing is becoming residual inEurope and transitional countries, the need to provide morehousing that is affordable to low-income households is stillpresent. Those who cannot afford homeownership or marketrents in the private market need shelter through publicrental housing. In the South, however, few countries havebeen successful in large-scale public rental housing. It isunlikely that any country which does not already have aconsiderable stock could successfully develop public rentalhousing as a major component of housing supply during the21st century.
Building for occupant ownership, either in whole orcombined with a housing association or some other not-for-profit partner, is practised in some countries – for example,Brazil, South Africa, Chile, Colombia, Costa Rica and India –with reasonable success, but still carries the problem of howto target subsidies and how to reach the low-income groupthat is the target population. The effective target group isthose who have been described as ‘moderate and middleincome households’.42 Reaching the lower income groups isespecially difficult when considerable contributions arerequired from the recipients or the move into the formal
sector involves paying taxes and service charges, where nonewere required in their previous, informal, neighbourhood.Costa Rica seems to have reached the target population mosteffectively through collaboration with an active NGO sector.43
NGOs, especially faith-based organizations, appear to bebetter at targeting the poor than governments. Hogar deCristo (Hearth of Christ) has been particularly effective withsimple timber dwellings; but other successful programmes areoften featured by the Latin American and Asian Low-incomeHousing Service (SELAVIP) in its newsletter.
� Incentives for investment in low-incomerental housing
As pointed out in Chapter 5 and earlier in this chapter, mostlow-income shelter policies and programmes in developingcountries focus on promoting homeownership, in spite ofthe preponderance of rental housing among urban poorhouseholds. While little attention has been paid to rentalhousing in the past, there is now increasing recognition ofits importance to the many urban poor households whocannot afford homeownership. Box 9.3 summarises some ofthe ways that have been proposed to support self-helplandlords, who are the suppliers of most low-income rentalaccommodation in developing country cities.
158 Towards sustainable shelter finance systems
Box 9.3 Low-income rental housing: encouraging self-help landlords
Source: UN-Habitat, 2003c
Few developing countries have in the past put in place incentivesto encourage private landlords to develop or improve the qualityof rental housing. A recent review proposes the following ways ofencouraging self-help landlords to create more and better rentalaccommodation for low-income households:
• Providing subsidies to poor owners, or poor privatelandlords, who create living space for others. Iflandlords are as poor as their tenants, equity objections tothis approach do not present a problem. Subsidies couldalso be in the form of tax relief, the difficulty being, ofcourse, that very few small landlords pay formal taxes.
• Building rental incentives into upgradingprogrammes. Planners and managers of slum upgradingprogrammes should take the needs of tenants intoconsideration and encourage homeowners to increase thesupply of rental housing by, for example, offering credit orsubsidies. Good examples of this approach are the PlanTerrazas Programme in Colombia, implemented in the1970s in the cities of Medellin, Cali and Bogotá, as well asthe more recent Mawani Squatter Resettlement Programmein Voi, Kenya.
• Providing microcredit for self-help landlords. The ideaof extending credit to informal sector landlords is nowwidely recommended, particularly since the emergence andrapid growth of shelter microfinance during the last decade.Governments should also encourage banks to move intothe low-income housing sector and to lend to landlordswishing to enlarge or improve their rental properties.
• Modifying planning regulations. House extensions areoften discouraged by planning regulations on maximum
use of plots. In addition, the projected impact ofdensification on the supply of urban services is often usedas a reason for prohibiting owners from adding rentalrooms to their existing houses. Incorporating rentalhousing into upgrading programmes or encouraging itsdevelopment in upgraded settlements may thereforerequire some modifications to existing building regulations.
• Reassuring self-help landlords. Existing and potentiallandlords often feel threatened by government policiesthat either give tenants the right to claim a house that hasbeen rented to them illegally or that do not sufficientlyprotect them when tenants fail to pay rent.The adoptionof rental regulations that protect the rights of bothlandlords and tenants, subject to the housing meetingspecified minimum standards, will go a long way inencouraging landlords to invest more in rental housing.Governments and local authorities could also facilitate useof standard written lease agreements and establishmediation and reconciliation tribunals to address tenant-landlord disputes.
• Application of more carefully designed rent controlmeasures. Many governments have in the past used rentcontrol measures to achieve housing affordability.Unfortunately, such measures have often turned out to beinequitable and inefficient, as they tend to distort marketvalues.They have also tended to discourage goodmaintenance, as they often rendered rental housingunprofitable, and have sometimes been applied in ahaphazard way. Where it is necessary to apply rentcontrol measures, care should be taken to avoid thesenegative results.

Small loans and housing microfinance
As stated earlier, the links between housing finance andincome generation are many and should be taken intoaccount in policy-making.44 Numerous agencies offeringhousing microfinance may require housing borrowers tohave a successful credit record on enterprise loans beforeraising a housing loan. This also has the advantage thatenterprise loans are likely to increase income and, therefore,the ability to repay the larger housing loans. Indeed, somemicrofinance institutions (MFIs) came into the housing loansbusiness because it was acknowledged that houseimprovements to enable more effective home-basedenterprises were a valid use for their loans.
Small housing loans, disbursed through housingmicrofinance institutions (HMFIs), are some of the mostpromising developments in housing finance during the lastdecade. They are suitable for extending existing dwellings,building on already serviced land, adding rooms (often forrenting out), adding services such as toilets, and housingimprovements within in situ neighbourhood upgrading. Onlyin a few cases – for example, from the Grameen Bank inBangladesh – are they intended for land purchase becausesecure land is often a prerequisite for collateral. They tendto reach much further down the income scale than mortgagefinancing, but not to the households close to or belowpoverty lines.
Small loans are seen as a way of lifting many low-income households out of the necessity to build theirhousing with cash or savings. As pointed out earlier, theincremental building process, carried out in a cash-onlycontext, tends to begin with poor-quality materials that needreplacing repeatedly and demolishing when the next stageof construction is carried out. This is a wasteful use ofresources and expensive in relation to the total investment.Small loans, even when the market rate is quite high, providethe capital to make incremental building more efficientthrough more durable materials earlier in the process.Repeatedly borrowing small amounts is good for ahousehold’s credit rating and imbues confidence in lendersand their guarantors. Fully secure tenure has not been foundto be essential for improving housing through microfinance,as highlighted above.
In the context of large numbers of new low-incomehouseholds in cities over the next two decades, it isimportant to increase the number of lenders in the housingmicrofinance sector rather than to concentrate only onmortgage finance which, inevitably, serves the middle- andupper-income groups. Many HMFIs have come in fromenterprise-focused microfinance as it is a simple ‘next step’and the commercial advantages are evident. Currently,housing microfinance tends to be a small portion of thecurrent business of enterprise MFIs; but they are growingquickly. Their loans tend to be small and short term,reflecting their enterprise loans and a reluctance to saddlethe poor with much debt.
However, there is room for other financialinstitutions, governments, NGOs and community groups tobe involved. The number of HMFIs is very large – there arebetween 400 and 500 in India alone – but their reach is
currently quite small. A recent study in India reports thatHMFIs reach no more than 2.5 million of the 60 millionhouseholds in need of microfinance.45
There is a serious issue of funding for on-lending byHMFIs. Many have received concessionary funds and theirlending reflects the low price of the capital. If they are toexpand their operations, they will need to cope withborrowing at international market rates and to reflect this intheir loans.
HMFIs may charge very high interest rates. Forexample, the very successful Mibanco MFI in Peru launchedMicasa for housing microfinance, which lends at between50 and 70 per cent per annum.46 Some MFIs that offerhousing microfinance charge lower interest rates for thehousing loans than for their enterprise loans. Whereconcessionary finance can be accessed, however, interestrates can be lower than the market would dictate. WhereMFIs (even large ones such as the Grameen Bank inBangladesh and the Self-employed Women’s Association, orSEWA, in India) receive preferential loans fromgovernments, they can keep interest rates and costs as lowas possible to reach as far down the income scale as possible.This could be a very effective use of government subsidiesand is a good reason to divert them from mortgages andother finance, which is more difficult to target to the low-income group.
There are cogent arguments about why HMFIs shouldoperate without subsidies, especially so that they can expandas the market allows. Where subsidies are made available,they should be through capital grants or service provision,rather than through interest rate discounts or the toleranceof arrears.
Housing microfinance is an important potentialresource for increasing the rate, scale and quality of housingsupply. Small loans should be incorporated within policy ina number of contexts, as follows:
• loans to improve and extend existing units, to supplyservices within the dwelling, and to add rooms formore generous domestic space or for renting out orfor active home-based enterprises;
• loans linked to land development, whether it be ledby private enterprise, NGOs or government;
• loans linked to developments for which a capitalsubsidy is payable; and
• loans linked to neighbourhood upgrading andavailable to improve the dwellings affected.
In comparison to enterprise microfinance, however, theseare long-term and large loans, and they generate a need forgroup security or some security of tenure backed bydocumentation. Some microlenders only offer housing loansto those who have had enterprise loans and have successfullyestablished a credit rating through their payment history.Others gain a lien on pension funds, future income ormovable assets; or require savings, sometimes at a monthlylevel of payment equivalent to the loan repayments, for ayear or so in advance; or accept group or co-signers’guarantees. These mechanisms address different sectors ofthe low-income population, small entrepreneurs and formal-
Housingmicrofinance is an
important potentialresource for
increasing the rate,scale and quality of
housing supply
159Policy directions towards sustainable urban shelter finance systems

sector workers, demonstrating that a palette of acceptablecollateral methods could cover just about everyone.
In the context of group lending, mandatory savingsperiods before loans are issued not only build up anunderstanding of finance, but also strengthen communityties among savers through regular group meetings. Then thegroup becomes the collateral as the members will supporteach other in times of difficulty and take the complicationof following up defaulters away from the lender.
There is a need for an international exchange ofexperience about how different forms of collateral performwith regard to default levels and feasibility of recoveringvalue in case of irredeemable default.
� The issue of default among low-incomeborrowers
While it may seem self-evident that lower income borrowersare more likely to default on their loans than those withhigher incomes, the evidence does not support this. Incontrast, many housing microfinance agencies achieve verylow levels of default, indeed. The repayment rates can befurther improved by flexibility in where and when paymentsare made. Travelling banking vans visiting low-incomeneighbourhoods, banks which are open outside office hours,repayments through local supermarkets: all these and otherscan assist lenders to minimize defaults and encourageborrowers to keep up with their payments.
The Kuyasa Fund in South Africa has an innovativeway of dealing with defaults. It uses the same means as thefurniture hire-purchase companies so familiar to its clientele:it sends in bailiffs to take possession of household goods,such as televisions and furniture in distraint until housingrepayments are up to date again. It does not, however,repossess the home since the result of this could becatastrophic.
Habitat for Humanity International, which givesinterest-free loans through grants from Christian institutionsin the North, relies upon group pressure to ensure thatindividuals keep up with their repayments. It also does notrepossess dwellings from defaulters.
� GuaranteesNotwithstanding the above, guarantees are important inbroadening the appeal of housing microfinance to lenders asthey will look for ways of reducing their risks, even thoughthe lowest income groups tend to be assiduous at repayment.The catalytic value of guarantees is evident in the Dharavihousing co-operative process, in India, in which a formalhousing finance company (the Housing and UrbanDevelopment Corporation, or HUDCO) would only lendwhen an NGO (the Society for the Promotion of AreaResource Centres, or SPARC) guaranteed the community’srepayments. This is being continued in a wider contextthrough CLIFF, which has a guarantee fund to reduce banks’perceived risks in lending to groups of low-income people.The National Urban Reconstruction and Housing Agency(NURCHA) in South Africa guarantees a portion of loans at acost of 2 per cent of the portion covered. In the absence ofgovernment action, some NGOs have sufficient institutionalcapacity to act as guarantors for community groups.
In many circumstances, the establishment of formalguarantee organizations is an important prerequisite tolending. Governments have much to gain from setting upguarantee funds to allow HMFIs to lend to low-incomehouseholds at reduced risk. ODA should be directed towardsthem so that the full value of guarantees as catalysts forshelter development can be captured for low-income groups.
� Widening the scope of housingmicrofinance
There has been comparatively little government involvementso far; but some recent developments in Colombia and Perudemonstrate that there is a great potential for central andlocal government to channel housing funds through smallloans. Voluntary-sector organizations often find their effortshampered by the lack of funding on which they can draw.Funding from below, such as from savings associations androtating savings and credit associations (ROSCAs), is mostlyinadequate to the task (Indonesia’s Bank Rayat Indonesia, orBRI, and India’s SEWA are major exceptions). Funding fromfinancial agencies is often lacking because of the default riskperceived by the potential funder even though actualdefaults can be shown to be low. Medium-term funding isrequired and tends to be in short supply. Some HMFIs resistgovernment involvement, while others welcome it. There isscope for governments to consult HMFIs and to respond inan appropriate manner as to whether their financial backingwould be welcome or not.
� Credit for building materialsThroughout the days of sites-and-services projects and otheraided self-help, efforts were made to reduce the financialburden of low-income homeowners by allowing materials tobe drawn from dedicated warehouses, or to be supplied oncredit through local commercial suppliers. Recentexperience in Mexico and elsewhere has shown how theremay be great potential for this to expand alongside housingmicrofinance and the downscaling of mortgages to lowerincome households, using the longstanding credit cultureoperated by furniture and household goods retailers.
� RemittancesRemittances from overseas residents of local nationality arean important part of housing finance in numerous countries.Many people can remit enough to build a house in a few yearsoverseas in quite lowly employment, which would beimpossible if they stayed at home in higher level employment.Indeed, in countries such as Ghana, remittances have been asubstantial contributor to housing supply for at least 20years.47 In many African cities, it is often only the ‘been-to’,‘wa-Benzi’ and ‘burger’ (former expatriate) populations whocan afford palatial housing, alongside their peers who havebecome rich through opportunism. This is good news for acountry’s gross fixed capital formation; but there is a dangerthat tastes, standards and ability to pay from a differentcontext take over the local markets and drive other residentsinto poorer housing than they would otherwise have. InGhana, formal-sector housing developments in Accra arelikely to be sold to residents of London and Hamburg and areway above the prices that Accra residents can afford.
160 Towards sustainable shelter finance systems
� The role of charity in low-income housing
Some of the initiatives that have been successful in reachinghouseholds living in poverty have had considerable fundingfrom charity. Many charities give large amounts of moneytowards housing improvement and shelter for the poorest.Habitat for Humanity International augments such monetarysupport with volunteering, recruiting groups of short-termvolunteers, mainly from the North, who offer free andenthusiastic labour for a week or two in exchange for afeeling of doing something of worth and seeing an unfamiliarcountry at first hand. There has recently been a flurry ofcharitable support for shelter and urban developmentfollowing the tsunami in Asia in December 2004.
There is a place in funding shelter for the poor for thatwhich arises from altruistic humanitarian support. However,there is a need to target such support towards those whoneed it most and to avoid reinforcing dependency. Mostcharities would probably admit that, however hard they try,they do not always manage this as well as they would wish.
Strengthening community-based funding mechanisms
Community-based financing of housing and services hasbeen used for both settlement upgrading and for buildingon greenfield sites. In a context where small loans areevidently successful and where there is an increase inpoverty, it has many advantages for low-income andotherwise disempowered households. It provides thebenefits of scale – strength in lobbying, the ability to affectneighbourhoods comprehensively, rather than just singledwellings, and the ability to raise capital funding – and itbuilds the cohesion of the community because its membersact together. It takes strength from the willingness of peopleto work together as communities through traditions such asgotong royong in Indonesia.
The experience of the affiliates of the Shack or SlumDwellers’ Federation (SDI) has demonstrated that there isgreat potential for community-based organizations tomanage development finance to the benefit of large numbersof relatively poor households. Community-based funding isfocused on the comprehensive development process, notjust on raising finance. Through cooperation in this way, low-income households can raise finance and influence policy,even changing by-laws, in a way unthinkable if they actedindividually.
Through the growth in community-focused NGOs,particularly the SDI network, development funds are nowregularly directed towards community initiatives. Grassrootsorganizations demonstrate a high degree of ownership ofimprovements achieved through channelling assistancedirectly to their members and neighbourhoods. They haveachieved high levels of added value and low levels of drop-out and default. They have been effective in directingexisting funding sources and maximizing the direction ofsubsidies to their members.
If community-based funding is to be successful, thefollowing must occur:
• NGOs should act as intermediaries with funders andassist in providing links with local authorities,government departments, local funding institutionsand other stakeholders. In some cases – for example,the Build Together programme in Namibia – this roleis taken by a government or quasi-governmentinstitution. The appropriateness of this will varyamong countries and hinges on the balances betweensuch characteristics as funding, control, influence andindependence.
• A guarantor should safeguard funding so that financialinstitutions feel confident enough to lend.
• Decision-making should be decentralized and fundsdisbursed to community-based organizations (CBOs).
• Community organizations should be able to act aslegal entities. This, in turn, requires a history ofworking together, which is often achieved throughsavings groups.
• Finance sources should exist to augment savings andlocal resources.
• There must be help for prospective borrowers to takethe smallest loans over the shortest period possible,or not to borrow at all. This is contrary toconventional banking practice where the assumptionis to maximize the loan.
• Stable interest rates should continue through the lifeof the loan as low-income households can be severelyaffected by upward fluctuations in payments. Thisincreases the appropriateness of short-term loanssince they are less vulnerable to interest ratefluctuations over time.
• Care must be taken not to lend so that a householdhas total debt repayments of more than 25 per centof income.
• Technical advice on infrastructure installation andhouse improvement should be provided. Whenoffered free, this becomes a subsidy. SDI avoids thissubsidy element by encouraging group exchangeswhere a successful community group in the networkshares experience with newly established groups.
• Policy on defaults is vital as some community fundsexperience serious default levels – for example, theCommunity Mortgage Programme (CMP) in thePhilippines has 61 per cent of its accounts more thansix months overdue.48 In serious cases of groupmoney being embezzled, peer review has been usedin India where the NGO involved will send onecommunity in to investigate another. This may beimpossible in many cultures.
Working in groups allows communities to negotiate cheaperbuilding materials, to buy land in large plots for subdivision,and to install infrastructure without the piecemeal, wastefulapproach inherent in individual connections. The long periodof community loans may prove to be a problem, however,especially with the issues of fixed interest rates and ensuringcontinuity of committed leadership over periods of up to 25years.
The evident success of community funds has attractedsome governments to take part in their financing. The
Community-basedfunding is focused
on thecomprehensive
developmentprocess
161Policy directions towards sustainable urban shelter finance systems
1 This chapter is based on adraft prepared by GrahamTipple, University ofNewcastle upon Tyne, UK.
2 UN-Habitat, 2004.3 UN-Habitat, 2003a.4 Satterthwaite, 2000.5 Sharma, 2005.6 Ashworth, 1993.7 See Chapter 3 for detail.8 UN-Habitat, 2003a.9 UNCHS/ILO, 1995.10 UNCHS/ILO, 1995.11 Klaassen et al, 1987.12 Payne and Majale, 2004.13 Or, even further down the
market, shared dormitorieswith ‘hot beds’ slept in byseveral people in a 24-hourperiod.Tipple and Willis, 1991;Schlyter, 2003.
14 Mukhija, 2004b.15 UN-Habitat, 2003b.
16 Tipple, 1994.17 This is similar to the
experience in Malaysiandevelopments, where higherincome dwellings can only bebuilt in developments includinga certain percentage of low-income dwellings.Thecontractors build the moreexpensive ones and thenneglect to build the cheaperones.
18 Payne and Majale, 2004.19 Hegedüs, 2004.20 Kritayanavaj, 2002.21 Ballesteros, 2002.22 Joint Center for Housing
Studies, 2004.23 Lea, 2000; Chiquier et al, 2004.24 De Soto, 2002.25 Malhotra, 2003.26 Nell et al, cited in Baumann,
2004.
27 Tipple and Korboe, 1998;Gilbert, 1999.
28 Calderón, 2004.29 See Chapters 6 and 7 for
detail.30 IMF, 2004.31 UNCHS (Habitat), 1993b.32 Even though formal-sector
salaries appeared to be lower.Tipple et al, 1999.
33 Tipple, 2000.34 The mean age of becoming an
owner in urban Ghana, whereno incremental housing financeis available, is in the late 40s.See Tipple et al, 1999.
35 Tipple, 2005.36 UN-Habitat, 2003b.37 UN-Habitat, 2003b; Tipple,
1991; Tipple et al, 1999.38 Tipple (2005) suggests that 25
to 40 per cent of householdsmay be a reasonablecomparable figure in low-
income neighbourhoods as awhole. Since many loans areconnected with home-basedworking (for example, SEWA)and others tend to be offeredto clients who have had micro-enterprise loans before (suchas the Banco Sol and theGrameen Bank), these couldinfluence the high frequency ofhome-based enterprisesamong borrowers.
39 Hoek-Smit and Diamond,2003.
40 Hoek-Smit and Diamond,2003.
41 Al-Mansoori, 1997.42 World Bank, 2004c, p8.43 Ferguson, 2001.44 UNCHS/ILO, 1995.45 Biswas, 2003.46 Ferguson, 2002.47 Diko and Tipple, 1992.48 Ballasteros, 2002.
Philippines Social Housing Finance Corporation is a goodexample. Community funding tends to benefit from anumber of funding sources, including members’ savings,ODA, government grants and subsidies, bank loans, short-term credit from suppliers and contractors, and leveragingof property values through development rights transfers.Often, subsidies can only be accessed by a group.
The expectation behind the CLIFF programme is thatcommunity groups of low-income households will be able toestablish enough strength and creditworthiness that theywill be able to negotiate loans directly with banks.
Nevertheless, there are issues about how far non-members of such community groups are excluded by theactivities of groups who so successfully lay claim to limitedresources. Are the groups simply capturing rationed benefitsat the expense of the majority in the same way that themiddle- and upper-income groups have done for decades?Even if benefits are potentially open to all comers, in reality,most benefits are rationed because of limited budgets. Inthis context, those who successfully receive benefits reducethe chances of others. Similarly, where groups negotiateparticularly favourable terms – for example, in low interestrates – they may exacerbate the intrinsic rationing. Ineconomies of shortage, there will be winners and losers.How it is determined whether particular groups win or loseshould be as transparent as possible, and measures shouldbe taken to remove obstacles and give everyone as near anequal chance of benefiting.
Care must be taken not to transfer problems thatwould happen at government or municipal level down to acommunity level where they may be more difficult tocontrol. For example, community group leaders are probablyas likely to act factionally or to defraud funds as are nationalpoliticians and officials, but social pressures may inhibit
criticism or censure. Community groups formed aroundconfronting or negotiating with state bodies may findresolving sensitive internal conflicts beyond their ability.
Savings are now seen as not only one of the mostimportant prerequisites for obtaining finance, but also oneof the most effective ways of building social cohesion inneighbourhoods. They are central to housing microfinanceand community funds. The savings process can be used to:
• Establish lender confidence in the group ofborrowers, thus reducing risk in the transaction. Theability of prospective borrowers to save consistentlyover several months is a valuable measure of reliabilityfor the lender.
• Equip communities with the cohesion, skills andconsciousness to engage with the state over thedistribution of resources and regulations in order togain better tenure, services and housing.
• Form the groups to which land is allocated, subsidiesgranted, funds loaned and infrastructure provided.
• Build an understanding of the management of money.• Set up internal funds for lending to those in greatest
need or going through crises.
Where regulations limit the establishment of savings groups,careful attention should be directed to whether they can bewithdrawn so that the benefits arising from communitysavings groups can be garnered.
Interest rates are often subsidized for communityfunds; but this is likely to reduce their sustainability andability to expand to cover most people living in poverty. Thebalance of advantage arising from such subsidies should bekept under review, especially with regard to whether therecipients are drawn from the poorest households.
162 Towards sustainable shelter finance systems
NOTES
Among the issues addressed in this Global Report on HumanSettlements 2005 is the financing of shelter for the urbanpoor. This focus is but the latest manifestation of a broaderconcern that has been at the centre of the preoccupation ofsocial activists, reformers and public authorities since thedawn of the Industrial Revolution, when the issue arose ofproviding humane living conditions to workers and poorfamilies crowded in the rapidly growing cities of Europe. Thesame issue has become one of a global nature after theconcept of ‘human settlements’ found its place in theinternational development agenda as one of the mainchallenges facing countries experiencing similar processesof rapid urbanization, but without the resources to provideadequate living conditions to their low-income urbanpopulations.2
Until recently, the classical response to the shelterproblems of the urban poor was social housing, both indeveloped and developing countries. However, the massivedemand for affordable housing in developing countries,coupled with the limited resources of the public sector,would have made this solution inapplicable, even in thepresence of a well-organized and transparent public housingdelivery sector. Notable exceptions were states such asSingapore, which implemented huge and very successfulpublic housing programmes, as well as successful policies inother larger countries such as Tunisia and isolated exemplaryprojects in many others. By and large, however, socialhousing was abandoned. Unfortunately, none of thealternative solutions developed during the 1970s and 1980sproved capable of addressing the problem. Sites-and-servicesprogrammes, for example, simply lowered shelter standardswithout reaching the scale required. In the absence ofadequate solutions, and with city authorities being incapableof guiding development or preventing uncontrolled growth,shelter delivery for the poor was largely left to‘spontaneous’, informal mechanisms.
The notion of ‘financing shelter for the poor’corresponds, in a way, to the abandonment of the traditionalconcept of public responsibility embedded in the ‘social roleof the state’. With the commodification of the economy,where housing is but another good to be produced, sold andbought, the solution to the shelter dilemma is based on thenotion that ‘the poor’ will always exist, and that their access
to a fundamental human need, adequate shelter, will alwaysrequire special measures and special solutions. At the sametime, this premise implies that there will always be acategory of citizens who will never, on their own, haveaccess to decent shelter – hence the need for specialapproaches and solutions aimed at ‘helping the poor’.
This Epilogue starts from the premise that ‘specialapproaches’ and ad hoc solutions, however ingenious, willnever work at the scale required. Three points are made.First, the percentage of the urban poor in the cities of thedeveloping world is far too high to be considered a residualissue. Second, the demand for affordable shelter isincreasing at an extremely fast pace, notably in the rapidlygrowing cities of the developing world.
Third, the standards and costs that city life requiresare high and complex. Shelter is only one, albeit the central,requirement of all citizens. Given the rapid spatial growthof cities in the developing countries, transport, for example,becomes a crucial necessity for survival. The living, workingand spatial circumstances of city life require standards andservices for all that are far superior in quality andsophistication to those usually associated with minimalshelter – a roof over one’s head.
The definition of ‘adequate shelter’ in the HabitatAgenda alludes to the multiple and complex characteristicsof minimum standards in an urban setting:
Adequate shelter means more than a roof overone’s head. It also means adequate privacy;adequate space; physical accessibility; adequatesecurity; security of tenure; structural stabilityand durability; adequate lighting, heating andventilation; adequate basic infrastructure, suchas water supply, sanitation and wastemanagement facilities; suitable environmentalquality and health-related factors; and adequateand accessible location with regard to work andbasic facilities: all of which should be availableat affordable cost.3
This definition highlights the idea that all citizens should beable to afford adequate shelter, as described. Affordabilitygoes beyond the ability to secure some form of tenure – that
The classicalresponse to the
shelter problems ofthe urban poor wassocial housing, but
the massive demandfor housing, coupled
with the limitedresources of the
public sector, wouldhave made this
solution inapplicable
E P I L O G U E :
TOWARDS SUSTAINABLE URBAN SHELTER 1

is, a title of ownership or rental of a legal dwelling unit. Italso means the capacity to hold on to this asset through aregular source of income, to pay taxes and utility user fees,as well as to absorb recurrent costs of maintenance.
Given these considerations, the issue is not simplyfinancing shelter for the poor. The issue is making adequateshelter affordable to the poor. This approach may be called‘sustainable shelter’: shelter that is environmentally, sociallyand economically sustainable because it satisfies the HabitatAgenda requirements of adequacy. Its acquisition, retentionand maintenance are affordable by those who enjoy it. Itdoes not overburden the community with unaffordablecosts. Finally, it is located in areas that do not constitute athreat to people or to the environment.
There is no single magic formula to achieve this.Individual self-help can only produce solutions that areadmirably suited to the harsh circumstances of urbanmigration, but are also the most fragile of all. Community-based funding has proven a valuable and indispensable asset,particularly for improving services and, in some cases,infrastructure in informal settlements; but it is not likely toreach the scale required, at least in the short term. It mustalso be noted that the admirable solidarity mechanismsfound in poor urban communities stem from the commonwill to stave off a common threat, often rooted in a state ofillegality and a risk of eviction. They also depend upon thecultural and ethnic composition of the informal settlement.Strongly desirable and supported outcomes such asregularization, infrastructure upgrading and theimprovement of economic circumstances can also bring theattenuation of community solidarity and mutual self-helpmechanisms. Therefore, they cannot be assumed to work inall cases and for indefinite periods of time.
At the opposite end of the spectrum, one of the majorinadequacies is the inability of the market to provideadequate, secure housing at affordable prices for poorpeople.4 There is no need for sophisticated analysis to provethis argument. If this were not the case, 43 per cent of theurban population of developing countries would not be livingin slums – an indicator that is estimated to be as high as 78per cent in the least developed countries. It is interesting tonote, in this regard, that the private sector does not ignorethe poor – it simply provides housing only whencircumstances make it profitable. In many slums, shacks arebuilt by private investors on public land illegally appropriatedby them to extract rent from the poor. Many argue that thiskind of housing market, thanks to the rapid turnover of the‘investment’, can be even more profitable than formalhousing. Often it is the connivance between privateinterests and unscrupulous public authorities, rather thanhumanitarian concerns, which permit the consolidation ofinformal urban settlements and the perpetuation of theirfragile tenurial balance between silent acquiescence andsudden forced eviction.
Other informal shelter delivery systems foundeverywhere, but particularly in Latin America, are illegalsubdivisions. This is also a thriving market, where privatelandowners cut out tracts of land in small lots to be sold tolow-income families. The occupants own their land, but stillin a situation of illegality, often with insufficient
infrastructure. There, two examples of ‘unsustainability’ arefound: an individual one, due to the illegality of thesettlement; and a public one, as municipalities are eventuallyforced to bring necessary infrastructure to settlements thatwere never meant to be developed for residential purposes.
Ironically, neither example presents a problem of‘financing’ or ‘affordability’. Rental fees in slums accuratelyreflect the maximum affordability level of slum dwellers: ifthis were not the case, this particular market would notexist. The prices of plots in illegal subdivisions are tailoredto the affordability levels of the buyers, while investmentsin layout and basic infrastructure are kept to a minimum tomaximize profits.
So far, the unsuitability of two kinds of existingmechanisms – informal and ‘legal’– for providing sustainableshelter has been highlighted. The first one is unsuitablebecause it is ‘affordable’, but not adequate. The second –conventional housing built by the private sector – isadequate but not affordable. What solutions can then befound for sustainable shelter for the poor – including thetwo basic components of adequacy and affordability?
Slum upgrading is the solution offered to make‘affordable shelter’ adequate. This solution has beenchampioned by all international agencies and is stronglysupported by the United Nations Millennium Project TaskForce on Improving the Lives of Slum Dwellers. It is seen asa necessary and humane remedy to consolidated situationswhere the urban poor have created communities. The mainargument is that the costs of regularization and upgradingto be borne by society can be largely offset by the benefitsthat can accrue to the residents and to the city as a whole.There are many elements of sustainability involved in thisprocess. One of them is that regularization and the grantingof secure tenure creates a sense of security and a solidjustification for self-help investment in the improvement ofhousing and its immediate environment. Therefore,investment in regularization and physical upgrading releasesimportant resources on the part of the residents. Moreover,it creates hope and self-esteem, which are the basis forexpanding small business activities and, in turn, forgenerating higher income. With increases in income,residents can begin to afford basic utilities (water, electricityand solid waste management). With time, therefore, at leastpart of public investments in basic infrastructure can berepaid and the delivery of services and utilities can becomemore sustainable. Upgrading also achieves two importantobjectives: it allows more successful residents to be able toaccess the conventional housing market, and it eliminatesdemand for other sites suitable for low-cost housing, whichcan therefore be reserved for new residents and low-incomein-migrants. Therefore, the two solutions advocated by thetask force – upgrading and the development of assisted self-help housing on greenfield sites – are mutually reinforcing.Existing slum dwellers are given the option of notencroaching on new land, and new city dwellers have analternative to squeezing in already overcrowded informalsettlements.
Ultimately, the affordability question hinges on costsand real demand. Therefore, a good starting point is to acton all the elements that make adequate housing unaffordable
One of the majorinadequacies is theinability of themarket to provideadequate, securehousing ataffordable prices forpoor people
164 Towards sustainable shelter finance systems

to the poor, keeping in mind that the whole enterprise is anoxymoron of sorts: making adequate shelter an increasinglyexpensive commodity, affordable to people who, at best, haveonly enough to survive on a daily basis. Making adequateshelter affordable to the poor has two requirements: reducinghousing production and delivery costs and increasing incomelevels. These are examined in succession.
FIRST ELEMENT: ABATINGHOUSING COSTSHousing is becoming an increasingly expensive commodityin all countries. As in other socio-economic areas,information and data are more readily available forindustrialized countries. Between 1997 and 2004, accordingto a very recent survey, average housing prices grew by 131per cent in Spain, 147 per cent in the UK, 179 per cent inIreland, 113 per cent in Australia, 90 per cent in France and65 per cent in the US. The only developing country listedin the survey is South Africa, which registered the highestgrowth in the sampled countries: 195 per cent.5
Of course, these sharp increases in housing pricescan, in many cases, be due mainly to speculative bubbles.But there is little that policies can do to prevent or controlthese phenomena. On the other hand, while average housingprices are lower in the developing countries, they are alsoinfluenced by steeply rising costs of land, building materialsand other cost components.
Affordability, therefore, rests to a large extent onpolicies capable of bringing down housing production costs.Housing production cost components are known: capital,land, infrastructure, building materials, standards, design,location and modes of production. To be affordable, all ofthese elements will require a substantive element ofsubsidy; but in some cases they will only need intelligentpolicy changes. Some examples are offered below.
Capital
Activities that create wealth for the richer segments of thecity population must be tapped in order to subsidizesustainable shelter. The obvious one is an important sourceof wealth in rapidly growing cities: the rapid increase in landvalues. Efficient collection of property taxes, as well astaxation of land and property transactions, is the basic capitalresource that cities can tap in order to cross-subsidize socialinvestment, including sustainable shelter. Subsidies ofvarious types, in turn, can encourage the private sector toproduce less expensive housing while still retaining a profit,the co-operative sector to expand its activities, and thecommunity sector to play a larger role in what it does best –building cheap housing.
The report of the Millennium Project Task Force onImproving the Lives of Slum Dwellers argues thatdevelopment aid will be necessary in order to finance partof the costs of slum upgrading and new low-cost housing.The difficult part is to justify it. This can be done if donorsare made to perceive that aid funds for sustainable shelterare an investment, and not an expenditure. The fundamental
argument here is that improving the lives of the urban poorand turning them into citizens by regularizing and improvingtheir shelter conditions is the best investment in ‘makingcities work’, which is a precondition for sustainable nationaldevelopment and, ultimately, the gradual elimination of aidas a necessary, and often major, component of many nationalbudgets of developing countries.
One factor that still stands in the way of greater flowsof development aid is the perception that the governanceperformance of most developing countries is too low toallow for external funds to be employed fairly and effectively.The Millennium Project argues that if the MillenniumDeclaration Goals, including improving the lives of slumdwellers, are to be met, there is no luxury of waiting forperfect governance to be in place. The important thing is forcountries who want to receive development aid to givesubstantive signals that they are reorienting their budgetallocations to the social sector. This can be done in manyways. One of them is the reduction of military budgets.Another, particularly important for the sustainable shelteragenda, is to increase budget allocations to the socialhousing sector. This does not mean massive public housingprojects – although, as mentioned before, not all large-scalepublic housing projects have been a disaster – but, moregenerally, to develop nationwide enabling policies for cities,shelter and related infrastructure, as argued in The GlobalStrategy for Shelter to the Year 2000.6
The argument for donor assistance to housing for theurban poor is implicitly confirmed by the fact that ‘rich’countries have the same problems themselves. For example,one of the main conclusions of a recent report to the USCongress by the Millennium Housing Commission, releasedin May 2002, states that:
… there is simply not enough affordablehousing. The inadequacy of supply increasesdramatically as one moves down the ladder offamily earnings. The challenge is most acute forrental housing in high-cost areas, and the mostegregious problem is for the very poor.
The same report highlights some of the built-in biases ofdomestic subsidies to owner-occupied housing. In the US,about 90 per cent of the total benefits of the mortgageinterest deduction system accrue to homeowners with morethan US$40,000 annual income. This observation is animportant reminder of the need for subsidies to beconcentrated on the neediest. This principle was statedclearly in The Global Strategy for Shelter to the Year 2000,which recognized that economic growth and the creation ofwell-functioning housing markets are not always sufficientto ensure that shelter conditions are adequate for speciallydisadvantaged households, and that such subsidies shouldbe ‘targeted’ (designed to focus on, and reach, the people inneed whom they are devised to help).
Land
Cities in developing countries still hold large tracts ofunused land, both publicly and privately held. Although
Affordability rests to a large extent
on policies capableof bringing
down housingproduction costs
165Epilogue: towards sustainable urban shelter
some efforts to avoid land hoarding for speculation purposeshave proven unsuccessful, as in the case of the Land CeilingAct of India, other countries have enacted legislation toencourage the utilization of idle urban land. This is the casein Brazil, whose ‘Statute of the City’7 recognizes the socialvalue of property and provides disincentives for landownerswho deliberately hold land, hoping to accrue unearned gainon its value arising from the investments of other public andprivate actors in urban development.
Cities must engage, as a first priority, in identifyingpublic land to be developed for sustainable shelter andrelated income-generating activities. Unused land is unusedcapital; but keeping land idle when half of the city’spopulation is housed in appalling conditions and newpotential slum dwellers are on their way is irresponsible.Paradoxically, the idea stems from the concept of‘sustainable slum’: a greenfield site, preferably alreadyowned by a public body or institution, developed fromscratch, but retaining the same incremental characteristicsthat make informal settlements an affordable settlementsolution for the urban poor. Accordingly, sites would beidentified and reserved for sustainable shelter development,furnished with essential basic infrastructure and services,and used as a ‘building platform’ for minimal, low-costhousing solutions to be developed according to theprinciples of assisted self-help housing. The sustainabilityfactor, in this case, would be guaranteed by the fact that thechoice of the site would be governed by soundenvironmental criteria, excluding, for example, ecologicallyfragile locations and reserved sites, such as water catchmentareas; by social criteria, as they would cater to the economiccircumstances of the urban poor; and by economic criteria,as their development would follow principles of the mosteconomic use of land and infrastructural investment. In fact,public sites can remain in public hands as long as their usersare granted a long-term title for their occupation. Privateland could also be used this way through a number ofincentives: property tax exemptions, ‘leasehold swaps’,building rights vouchers, and rental fees subsidized bymunicipalities, government, donors, foundations and otherstakeholders. Intelligent innovations for the use of publicland can also have unexpected results. The United NationsHuman Settlements Programme (UN-Habitat), incooperation with the government of Finland, is testing aninnovative approach in Kenya whereby part of that country’sbilateral debt would be forgiven in exchange for theearmarking of a tract of public land of equivalent value forlow-income housing.
Infrastructure and land-use planning
With sound planning, trunk infrastructure developed forupper- and middle-income housing and commercialdevelopment can be extended at marginal additional coststo nearby areas reserved for sustainable shelter for lowerincome groups. There could be nothing more intelligent andenvironmentally, socially and economically sound thanlocating sustainable low-cost shelter in the proximity ofindustrial and commercial areas. One must only think of the
hours saved in commuting and the advantages for easingtraffic congestion and pollution.
Upgrading does not leave the planner much choice asthe task is dictated by existing functions in an existinglocation. But an equally challenging task is to plan ahead ofdevelopment, instead of regularizing post-facto situations.The task of planners is to identify suitable locations in thecity for sustainable shelter development for the urban poor.
As argued in Investing in Development: A PracticalPlan to Achieve the Millennium Development Goals, theMillennium Project’s overview report,8 community-basedslum upgrading and earmarking idle public land for low-costhousing is one of the ‘quick wins’ that need to be embeddedwithin the longer-term investment policy framework ofMillennium Development Goal (MDG)-based povertyreduction strategies.
Building materials
Assisted self-help housing is the most affordable andintelligent way of providing sustainable shelter. It is cheapbecause it is based on minimum standards and incorporatesa substantive amount of sweat equity. It is useful becauseindividuals and communities engaged in it acquire preciousskills. It is practical because it responds to people’s actualneed and levels of affordability. It is flexible becausedwelling units are often designed to be able to expand overtime. But all construction, and particularly incrementalupgrading, requires a suitable supply of building materials,components and fittings. These markets already exist andthrive in virtually every city of the developing world becausethey respond to a huge solvent demand. They have to besupported by the public and large-scale private sectorbecause they abate housing costs and provide precious jobsand incomes.
Standards
For decades, UN-Habitat and other international agencies haverecommended reforming building codes and standards inorder to allow for housing construction that is affordable forthe poor.9 Now is the time for developing-country central andlocal governments to engage in sweeping reforms to establishrealistic and reasonable minimal standards for sustainableshelter. This reform alone would cut housing production costsconsiderably and, equally importantly, legalize a huge chunkof the existing and future housing stock.
Regulations both for upgraded and new shelter shouldallow, and indeed encourage, the development of small-scalemanufacturing and service activities in the home (such astailoring and small repairs) and in workshops especiallydesigned for the purpose, and all kinds of other activitiesthat do not endanger public health (for example, kiosks,small restaurants and cinemas). Of particular value are allnon-housing activities that can enhance the dynamism of anygiven settlement and encourage social interaction: theyoften constitute the best ‘acupuncture’ against boredom andcrime.10
The task of plannersis to identifysuitable locations inthe city forsustainable shelterdevelopment for theurban poor
Now is the time toestablish realisticand reasonableminimal standardsfor sustainableshelter
166 Towards sustainable shelter finance systems
Design
Design is a cost factor that has also been neglected for toolong. Often, large-scale, high-rise housing projects result invery high costs per unit because they entail high overheadsand are a typical target for corrupt contracting practices. Thescale, brutality and anonymity of the high-rise housing foundin most developing countries also often accounts for socialtraumas in people and communities engaged in a difficulttransition from rural to urban settings and accustomed to amore minute and ‘horizontal’ scale of human interaction. Atthe other end of the spectrum, non-assisted self-helphousing can be cheaper in the long run, but can result inflimsy and hazardous construction. The happy medium aredesign practices that combine the skills and briefs ofclients/users with the abilities of dedicated trainedprofessionals (architects, engineers, planners, surveyors) andreconcile the need for an efficient use of land with human-scale design. Sustainable design can also help to identify thebest and cheapest building materials and components andreconcile the needs for stability and durability with theimperative of efficient and low-cost construction solutions.Architects, planners and public-sector professionals from allover the world must be mobilized in this effort.11
Location
Although, as a rule, land and housing costs tend to decreasewith distance from the city, it is important for sustainablelow-cost shelter to be located as close as possible to thewidest range and concentration of income-earningopportunities, which is found in or near the cities’ centralareas. This is why it is important for slum dwellers locatedin central and peri-central parts of the city to be able to holdon to their most important asset – consolidated settlementin a favourable location. This is the imperative of in situ slumupgrading, and this is why the retention of establishedsettlers in centrally located informal settlements throughregularization and upgrading is the best investment thatpublic authorities can make in guaranteeing the economicsurvival of their poorest citizens. It is also possible to takeadvantage of lower land costs in parts of the city moredistant from prime locations for greenfield development oflow-cost housing, but only on the condition that suchdevelopment includes good income-earning opportunitiesand affordable and efficient transport services.
Modes of production and delivery
Clearly, the final cost to the user also depends upon themode of production and delivery of a housing unit. Thecheapest form of housing, for example, is shelter built orassembled by individuals on a piece of land occupied withoutany formal title. This is the mode of housing productioncommonly found in the conventional slum. But its drawbacksare also well known – insecurity, lack of services and poorconstruction. This mode of construction is the cheapestavailable, but also the most expensive in terms of health andsecurity. The most expensive mode of production, on theother hand, is standard and legal housing produced on a
market basis. This kind of housing incorporates all the costsfound in all contexts, developed and developing, includingland, capital, various fees and construction, as well as theprofit component. And by its nature, it is this mode ofconstruction that is the least eligible for governmentsubsidies.12
However, there are other modes of housingconstruction that, by their own nature, involve lower coststo the purchaser/user. One of them is self-help housing,which replaces built-in labour, time and resources employedin conventional housing with the labour, time and materialsprovided by its future occupants. ‘Assisted self-help housing’,which incorporates a large component of donor anddomestic government technical and financial inputs is, infact, the mode of production recommended by the UnitedNations Millennium Project’s Task Force on Improving theLives of Slum Dwellers as the best and cheapest alternativeto new slum formation in the developing countries.13
Another successful approach is cooperative housing.This approach does not necessarily reach the poorest of thepoor, but it does produce housing that is more affordable,by virtue of the elimination of the profit component and theadvantage of government subsidies granted by law by virtueof its social nature. Its traditional form of organization isbased on affiliation to the same trade or profession: often,however, the aggregation of cooperators can reach beyondaffiliation and be based on kinship. This later element is astrong factor in creating a sense of community around the‘build together’ concept. This important social asset is notfound in conventional housing, which is bought, sold orrented on an individual basis.
Another mode of production, or delivery, is socialhousing. Traditionally, social housing involves theconstruction, with public funds, of low-cost housing units,usually as comprehensive projects, for rental to deservinglow-income families. A recent report stresses the importanceof rental housing as a far too neglected means of satisfyingthe shelter needs of lower income groups.14 Social housingis built on the premise that public funds should be employedfor the provision of housing to the neediest on a subsidizedrental basis. This approach, however, has come under severecriticism during recent years on several grounds. One ofthem is efficiency. But it must be remembered that socialhousing – or public housing, or council housing, as it isknown in different countries who pioneered it on a vastscale – historically drew its justification from differentgrounds. One of them is the sense of collective responsibilitythat nations felt towards the shelter needs of the lessfortunate members of society. Other reasons were socialstability, political support, public health and hygiene. Andanother was purely of a macroeconomic nature – theadvantages of using large public funds to revive the economy,support the domestic construction and building materialssector, and create employment. Some of these factors stillexist today, and it is, indeed, remarkable that social housingprogrammes have been virtually abandoned where peopleneed them most – the developing countries.
Rental housing is important in terms of affordabilitybecause it is particularly suited to the economiccircumstances of the urban poor: lack of capital and lack of
Rental housing isimportant in terms
of affordabilitybecause it is
particularly suitedto the economic
circumstances of the urban poor
167Epilogue: towards sustainable urban shelter

access to it. It is not surprising that in most slums,particularly in sub-Saharan Africa, the poorest of the poorare not owner occupiers, but renters. The solution here isto abate the costs of rental housing by devising a system ofsubsidies capable of stimulating the production of rentalhousing for the poor by accessing all possible and practicableavenues – built-for-rental housing; housing purchased orbuilt as an income-producing asset; housing built bycompanies for their workers; and social housing.
So far, a variety of approaches that can help to abatehousing production costs and reduce the price of sustainableshelter to the target client – the urban poor – has beendiscussed. However, sustainability also has to do with theincrease of purchasing power. The higher the disposableincomes of the urban poor become, the wider will theiraccess be to housing markets. The next section addresses thissecond element of adequate shelter affordability strategies:increasing the purchasing power of the urban poor.
SECOND ELEMENT:INCREASING PURCHASINGPOWERIs this goal too ambitious? The 2003 issue of the GlobalReport on Human Settlements offered some prudentscepticism:
It has to be remembered that slums have alwaysbeen part of market societies. In the long run,the goal of cities without slums is only going tobe achieved in a predominantly marketeconomy once a good majority of the urbanwork force has middle-class incomes. How toachieve this major aim of development is rootedin controversy and is somewhat beyond thescope of this report.15
A recent observation portrays one of the many slum familiesin New Delhi.16 A shack, about 2 metres long and 2 metreswide, is home to a family composed of husband, wife andfour children. It is just one of 7700 such shacks in a streetbehind the residential area where the mother of this familyworks as a domestic help. Her husband is a plumber and herchildren study at a nearby government school.
The striking aspect of this situation is that the wifeholds a steady job, and her husband has a skill that isconsidered to be highly rewarding in industrializedcountries. Yet, they are forced to live in a shack withconsiderably less than 1 square metre of space perhousehold member. By the same standard, a small 100square metre apartment in a rich country could hold roughly150 people – all of whom, however, would enjoy theconsiderable advantage of protection from the elements, awell-functioning communal toilet, the luxury of runningwater and electricity, and protection against forced evictions(at least as long as public health officials did not report theintolerable overcrowding condition of that particulardwelling unit).
The circumstances described above are very similarto those experienced by the vast majority of the more than900 million slum dwellers all over the world, whose adultmembers often hold jobs or rely upon some kind of regularrevenue-generating activity. In the developed world, ahousehold with two sources of income, wife and husband,however humble the occupation or the source of incomemay be, normally can gain access to decent shelter on themarket, however modest. In the developing world, this isvirtually impossible – hence the virtual necessity of findingaffordable inadequate shelter in a slum. People who live inslums are known as ‘slum dwellers’. In reality, they are‘working poor’: people who work for a living, but whoseincome cannot guarantee them access to the basic needsthat everybody in developed countries take for granted –adequate shelter, proper nourishment, health, education anddecent and non-threatening living environments.
The Delhi example shows that there is somethingterribly wrong about the inability of the working poor indeveloping countries to gain access to adequate housing.Part of the problem is the rising costs of conventionalhousing addressed in the previous section; but an equallyimportant issue is the extremely low income in both theformal and informal sectors. This is why making shelteraffordable to the poor also depends upon increasing thepoor’s income.17
The issue, of course, is not simply that of higherwages. A regular income is also a standard prerequisite foraccessing mortgage or shelter microfinance markets.Continuity in income earning is also important once oneenters a mortgage agreement in order to avoid the risk oflosing all of one’s investment through the painful process ofrepossession. But a decent income is the minimum basis foraccessing decent shelter, particularly in the situations ofvirtually all developing countries where workers’ benefitsand pensions are virtually non-existent and where the pricesof basic necessities rise as rapidly as those of housing.
It is often argued that low wages in developingcountries, particularly in sub-Saharan Africa, are justified bya variety of factors, including the low skills of the work force,low productivity, the volatility of the economy, capitalrestrictions and various forms of risks for the capital invested.However, some of these negative factors may not play such alarge role today as they did previously. Rising levels of literacy,even in most of the poorest countries, coupled with the rapidremoval of capital and profit-repatriation restrictions, haveintroduced much more favourable conditions for domesticand foreign direct investment (FDI) in the industrial andservices sector. The fact that migrants with little or no formaleducation tend to find all sorts of jobs in developed countriesshows that their skills are dramatically underutilized in theircountries of origin. China, which boasts an extremely skilledand active pool of labour, still registers very low wages incomparison with the massive and rapid growth of itseconomy. From the point of view of sheer equity, it is hardto explain to a construction worker in a developing countrythat he may never afford to live in any of the houses he buildsor drive on any of the roads he paves, while his counterpartsin richer countries can.
The urban poorcould not bereached withoutabating housingproduction costs andreducing the priceof sustainableshelter
Making shelteraffordable to thepoor depends uponincreasing thepoor’s income
168 Towards sustainable shelter finance systems
On the other hand, economists and policy-makerstend to disregard important factors that dramatically lowerproductivity in developing countries, all linked to theresidential circumstances of the working poor. Among themare lack of hygiene, leading to health vulnerability andconsequent loss of working days and, more dramatically,high mortality rates; living environments that are the leastconducive to decent recuperation after a day’s hard work;constant exposure to the risks of violence, assault, theft andforced eviction, leading to mental stress, physical injury andlong-term traumas; long commuting times spent, at best, incrowded, dangerous and unreliable means of public or para-public transport and, at worst, walking at pre-dawn, duskand after sunset on often unpaved paths. Is it unrealistic toassume that improving the residential circumstances of theworking poor would ultimately lead to higher productivity,higher profits, higher wages and, more generally, to avirtuous cycle that could ultimately make the living andshelter conditions of workers more comparable across theNorth–South divide?
The argument above is in favour of investments inimproving the living conditions of the urban poor throughsustainable shelter as a precondition for sustainableeconomic and social development.
A second argument is questioning the level ofworking wages and benefits in developing countries. Aninformed guess is that there is no reason why wages in thesectors where the urban poor are usually employed –domestic work, retail shops, warehouses, security services,factories, construction, repairs and maintenance, publicinstitutions, schools, hospitals, and so on – should be soabysmally low all across the board. It may well be that thisrelates more to a non-signed understanding among all kindsof formal and informal employers than to a real reflection ofthe costs and benefits of decently paid work. More likely,wages are generally set on the basis of the classic parameterof the ‘reproduction of the work force’ – the bundle ofexpenditures required to survive, rather than to live adignified life. On the other hand, it is reasonable to assumethat well-to-do families could very well afford to pay morefor domestic help. Most factories could probably well absorbreasonable increases in workers’ salaries and benefits; andeven public employers could raise low-end salaries to adecent level and provide in-house training in exchange formore efficient, reliable and regular delivery of the requiredservices.18 All of this would certainly result in moreproductive and efficient outcomes with benefits for all: theearning power of the employed and a better quality ofproducts and services.
Transnational corporations, for example, are makinggrowing recourse to job outsourcing in order to takeadvantage of the huge salary differential between salaries athome and those in developing or transition economies. Thisis an inescapable trait of globalization. However, suchcorporations are also under strong pressure to show that theiractivities are not over-exploitative. In this particular area, isit unrealistic to assume that some of the most important andvisible of them, while retaining this comparative advantage,could give the good example of paying their workers salaries
that allow them to lead a decent life for themselves and theirchildren? The suggestion here is that salaries should notfollow a ‘race to the bottom’, but the inverse route. It is quitelikely that all of this would result, in addition to theachievement of adequate shelter conditions, in a less violentand threatening world for all.
Many specialists also point at ways of easing theburden and increasing the earning capacity of the hugenumbers of people who draw their livelihood from the so-called ‘informal sector’. The following recommendationshave been made by such specialists:19
• providing the physical infrastructure for businessdevelopment and job creation, including home-basedenterprises;
• adopting pro-poor and labour-based methods whencreating and maintaining infrastructure and providingbasic services;
• easing the regulatory and fiscal burden for startingand growing enterprises;
• facilitating financial and business support for localenterprises;
• adopting community contracting on a much largerscale; and
• facilitating the regularization and operations ofinformal-sector activities.
SYNERGIZING THE TWO:LOWER HOUSING PRICESAND HIGHER INCOMESOne important aspect is the synergies between lowerhousing prices and higher incomes. This section considersthe mutually supporting benefits of acting on both sides ofthe spectrum.
Capital
Increasing both wages and income opportunities for theworking poor augments the saving potential of the sameearning group. As documented in the Millennium ProjectTask Force report, the urban poor show a marked propensityand ability to pool part of their incomes into communityfunds and other forms of saving arrangements. This triggersvirtuous circles: the more capital is saved, the more isavailable for improving shelter conditions, productivity, skillsformation and income-earning activities. With upgrading andadequate shelter solutions, more disposable income canbecome available to contribute to basic infrastructure andservices, thus making public capital investment in this areamore sustainable.
Infrastructure and land-use planning
Investments in infrastructure and land-use planning canprovide important income-earning opportunities for theworking poor. One of them is ‘community contracts’,whereby contracts for physical improvements are offered to
Investments inimproving the living
conditions of theurban poor throughsustainable shelter
is a precondition forsustainable
economic and socialdevelopment
169Epilogue: towards sustainable urban shelter
the communities themselves, thus internalizing at least partof public investments in upgrading and rehabilitation.
Building materials and standards
The revision of standards in favour of locally produced buildingmaterials, in addition to enabling ‘home-grown’ constructionpractices, can give a strong impetus to the local building-materials industry, which typically employs low-incomeworkers and a large part of the so-called informal sector.Similarly, the revision of planning regulations in favour ofhome-based and community-based economic activities canstimulate local economies and enhance the incomeopportunities of the working poor. Women, in particular, haveproven particularly active and able in the production of simpleand low-cost building materials, such as bricks and tiles. Moregenerally, stepped-up public and private investment ininfrastructure development and maintenance and citywideservices, essential to improving urban productivity (roads,transport, utilities, health and educational structures),typically create income for the working poor and create andimprove badly needed skills.
Design
The development of appropriate design solutions for urbanliving, from fixtures and furniture, to new building materialproduction techniques, shelter design and residential andother development schemes – including environmentallysound solutions for waste management and energy sourcesand use – can open up wide avenues for employment andskills training. The Cinva Ram machine, for example,developed decades ago in a Colombian appropriatetechnology centre for the production of compressed earthblocks, proved to be one of the most effective anduniversally used means for the local production of affordablebuilding materials. Similar, and much improved, solutions indesign are being developed in many parts of the world. Theirwider dissemination would provide a great impetus toefficiency in sustainable solutions encompassing both costreduction and employment creation.
Modes of production
The more participatory assisted upgrading and new housingdevelopment programmes and projects are, the greater thechance they have to improve the access of the working poorto the foundations of a modern urban economy: from creditto design, planning, management, trade and so on.Participation in the design of collaborative schemes, such asupgrading, assisted self-help and cooperative housing, canbring into clearer focus the strongly perceived need on thepart of the working poor to integrate housing functions withincome-earning facilities, such as shops, workshops, foodprocessing, arts and crafts, repair shops, carpentry and skillsincubators, and light manufacturing.
FORMULATING ANDIMPLEMENTING URBANSHELTER POLICIES:SHELTERING THE POORFROM ‘MARKET POACHING’The identification of sustainable ways of guaranteeingadequate and affordable shelter for the urban poor requiresclose attention to a third aspect, in addition to reducingcosts and improving incomes. This third aspect has to dowith the fact that all shelter sub-markets are permeable, andthat different levels of demand (from very low income, tolow income, up to middle income) can come into conflictand/or competition with one another. In these cases, it isalways the poorest who lose. This undesirable outcome canbe defined as ‘market poaching’: an outcome whereby moreaffluent social groups, taking advantage of their morefavourable positions in the land and housing markets, canend up, voluntarily or not, absorbing resources (financial,spatial and otherwise) that are of vital importance insatisfying the shelter needs of the more vulnerable membersof society.
‘High-end poaching’ in attractive urban locations
Competition among income groups and different land usescan occur in many different ways. Classic examples aredrawn from forced evictions of poor populations living in un-regularized informal settlements. In some cases, suchevictions are determined by attempts to satisfy the perceivedneeds of the city as a whole (such as improvements in theroad infrastructure and public services). In others, they aremotivated by the desire to put the land to a more profitableuse (for example, commercial or attractive private housingdevelopment). In this latter case, a utilization of high socialvalue (affordable shelter for the poor) mutates into anothertype of use that satisfies a smaller and selected cluster ofhigher income city dwellers, often with large profits for veryfew (the landowner and the developer). City authorities, atleast in theory, also stand to gain from higher property valuesand real estate tax revenue.
Similar cases of ‘locational poaching’ occur in the all-too-frequent instances of ‘market evictions’. In these cases,the dislocation of the urban poor does not occur because offorced evictions; but the results are similar. Whether or notin possession of a legal title, the poor who occupy a piece ofland in a central location can be easily persuaded to clear outand transfer their property to higher income location seekers.The new occupants usually find it much easier to obtain atitle, and as they are imitated by others, a low-incomesettlement is quietly transformed into a middle- or high-income neighbourhood. In all cases, these transformationsare motivated by the value of a location which, with theexpansion of the city, has become highly attractive.
Ironically, this kind of competition is, on the onehand, highly penalizing for the poor because choice central
Stepped-up publicand privateinvestment ininfrastructuredevelopment andmaintenance andcitywide services,essential toimproving urbanproductivity
170 Towards sustainable shelter finance systems
locations are the ones that offer them the best opportunitiesfor income generation and are hardly affected by theavailability or not of conventional housing mortgagefinancing. This is because choice locations attract high-endmarket uses for which capital financing is generally available.
The obvious antidote to this undesirable outcome isto adopt policies that accord top priority to the regularizationand upgrading of consolidated informal settlements, save forthe cases where their existence constitutes a permanentthreat to the residents or can cause the irreversible loss ofecological resources.
‘Residential poaching’ in the urbanperiphery
Location is not the only factor that can determine‘residential poaching’. One very important grey area isrepresented by the more peripheral parts of the city, wherepotential competition between low- and middle-incomehousing is more acute. A classic case is that of subdivisions,legal or informal. The system works through the actualpurchase of building plots and the construction of residentialunits, whether by the purchasers themselves or by thesubdivider/developer. In this case, the discriminating factorcan be the availability of finance to purchase the plot, whichis obviously beyond the means of the poorest of the poor.Although this kind of acquisition is typically conductedthrough informal channels such as family or kinshipconnections, the unplanned way in which it often occursplaces the poorest residents in a position of weakness withregard to access to new residential opportunities in the city.
This kind of competition reveals the unsustainabilityof ‘spontaneous’ informal settlements as a means ofsatisfying the shelter needs of the poorest citizens. Theantidote is anticipatory land-use planning policies capable ofincreasing the total amount of land available for residentialpurposes and encouraging mixed development schemes,particularly of public land, that can provide a good social mixand ensure an appropriate combination of affordable shelter,employment opportunities, basic infrastructure andaccessible community services. Cross-subsidies can bedevised to ensure a sufficient amount of land for assistedself-help housing development for the lowest incomegroups.
‘Mortgage finance poaching’
Direct and indirect means of providing financial access toshelter can result, deliberately or not, in higher incomegroups taking advantage of government subsidies andincentives created to address the needs of the mostvulnerable groups of society. The case has already beenmentioned of the utilization of tax expenditures in countriessuch as the US, which result in higher deductions for highermortgages and, therefore, the upper end of the housingmarket.
In most developing countries, tax deductions onmortgages tend to be less widely used; where they exist, thefairness of their application is more vulnerable to less
accountable practices. That leaves a greater burden onclassic mortgage financing. However, ratios of outstandingmortgage loans to gross domestic product (GDP) range fromaround 35 per cent to 70 per cent in developed countries,and from 1 per cent to 17 per cent in developingcountries.20
The lack of mortgage financing for shelter purposesin the developing countries is compounded by difficulties inaccessing proper information and reliable professionalservices. In addition, cases abound of favourable loans beingobtained through cronyism and manipulation of the bankingsector. Patronage and connections are additional elementsthat broaden the access-to-financing gulf between the well-to-do and the poor, in addition to the well-known barriersrepresented by creditworthiness and the existence ofcollateral. The result is that in developing countries, limitedmortgage financing resources tend to be monopolized evenmore severely by those who normally have much bettereconomic access to adequate shelter.
However, the trend with regard to the use ofmortgage financing in the developing countries is on therise, and it can be hoped that in many of them the availabilityof financing for the shelter sector will increase. This can, inthe long run, bring about beneficial results as ‘mortgagefinance poaching’ may become less severe.
One mechanism for financing the shelter needs offormally employed workers – the ones most likely tocompete for adequate and affordable shelter with the poor– is the creation of a housing development fund, based oncontributions from the government, the employers and theworkers themselves. It is through mechanisms of this naturethat so many countries, in all continents, made dramaticbreakthroughs in improving the housing conditions of theirpopulations. Provided that they are managed in an efficientand transparent manner, such funds can create win–winsituations for everybody – the construction sector; thebanking sector; the employment situation; the efficiency ofcities; the improvement of infrastructure and services; andthe improvement in the quality of life of an important sectorof the working population.
Political commitment and policy reform asthe key to sustainable shelter
While shelter mortgage financing may improve in the future,the destinies of the urban poor cannot be left to theexpansion of the markets. No serious and responsibleapproach to this problem can ignore the necessity for a muchstronger financial and policy involvement on the part ofcentral and local government.
The Millennium Project, in developing a practical planfor the achievement of the Millennium Development Goals,pointed out that developing countries, and particularly thepoorest among them, can achieve the MDGs only if theymanage to devote much greater resources to sustainablepolicies for the reduction of poverty and the improvementof the living conditions of people. The report of theMillennium Project Task Force on Improving the Lives ofSlum Dwellers identifies official development assistance as
Limited mortgagefinancing resources
tend to bemonopolized evenmore severely by
those who normallyhave much better
economic access toadequate shelter
171Epilogue: towards sustainable urban shelter

an indispensable component of this effort, and suggests thatall countries should develop, as a matter of urgency, MDG-based poverty reduction strategies indicating the domesticand international resources required to achieve the goals.
Cities are the key to sustainable development. It isthrough the development of commerce, services andindustry in the framework of a diversified economy thatsignificant gains in economic growth can be made. This, inturn, can generate the resources and the opportunities thatthe poor need in order to improve their own lives and tooptimize their contribution to national development. Theurban poor have an indispensable role to play because theyare the ones who work in cities and who make cities work.Nowhere is this positive concatenation more evident thanin those developing countries that have made the greateststrides in modernization and GDP formation.
Recent trends indicate that more donor countries maybe willing to increase the level of their official developmentassistance as a means of reaching the MDG goals and targets.However, the best catalyst to bring this about and to attractflows of aid will be the proven commitment to invest insustainable development. Key to this goal are the urban poor,and central to improving the lives of the urban poor issustainable shelter.
Therefore, governments should consider, as a prioritymatter, adopting the innovative policy changes required toimprove the shelter conditions of the urban poor and toachieve sustainable shelter development. Among them are:
• reallocating a reasonable level of domestic resourcesto the shelter sector, particularly to programmesspecifically geared to slum regularization andupgrading and the provision of low-cost housing;
• mobilizing public resources for urban and shelterdevelopment through a transparent and rigorous useof existing public revenue-generation mechanisms,including property taxes;
• actively seeking donor support for funding pro-poorprogrammes linked to increased public-sector andadministrative efficiency, taking advantage of theMDG-based poverty reduction strategy approach;
• identifying blockages and introducing incentives forthe expansion of housing mortgage financing;
• creating or strengthening funding mechanisms for theprovision of adequate shelter to the urban poorthrough, for example, national housing funds anddirect subsidies; and
• involving the working poor and their organizations inevery step of policy review, reform andimplementation, from the national to the local level.
Local engagement in the pursuit of theMillennium Development Goals (MDGs):the Millennium Towns and Cities Campaign
The above recommendations apply to central governmentsand local governments alike, within their distinctive spheresof responsibility. Legislative reform remains a prerogative ofcentral governments, but steady advances in decentralization
of powers and responsibilities has greatly increased therange of action of local governments. Ultimately, progressunder the sustainable shelter agenda rests on positivesynergies among all spheres of government.
One such synergy is represented by the role that localgovernments can play in achieving the MillenniumDevelopment target of improving the lives of slum dwellers– and, at the same time, creating viable alternatives to newslum formation. The report of the Task Force on Improvingthe Lives of Slum Dwellers argues that the MDG-relatedpoverty reduction strategies should be based on localconcerns (both those expressed by the poor themselves andby the local governments that have the direct responsibilityof addressing them) and should generate local povertyreduction strategies. In a way, this suggestion is drawn fromthe Agenda 21 experience and the success registered bylocal Agendas 21. The level of global attention that theMDGs are currently receiving provides a great opportunityfor local governments to engage in the process and to attractthe support and the resources, both domestic andinternational, that they need in order to discharge theirresponsibilities in a more sustainable and equitable way.Cities are now offered the opportunity to engage in theMDG implementation process by following the example ofpioneering municipal administrations in the North and inthe South (Los Angeles and Curitiba, among them) whichhave voluntarily endorsed the Millennium DevelopmentGoals and activated mechanisms for monitoring theirperformance in this respect. International agencies areshaping initiatives around this goal.21 In this regard, citiesare becoming key agents in formulating and implementinglocal MDG-based poverty reduction and sustainabledevelopment strategies.22 The new world organizationUnited Cities and Local Governments has taken animportant step in this direction by endorsing the MDGs andcommitting to the organization of an action-orientated globalMillennium Towns and Cities Campaign. The potential ofthis approach is high, particularly in terms of the approachadvocated in this Epilogue: an integrated, citywide strategyto the central issue of securing sustainable shelterdevelopment opportunities for the urban poor.
CONCLUDING REMARKSFinancing shelter is only a component of the broader goal ofsecuring solutions that can make shelter truly sustainableand fill the gap between the two extreme outcomes that arebeing witnessed today: affordable shelter that is inadequateand adequate shelter that is unaffordable. One starting pointis to look at the inhabitants of informal settlements notsimply as ‘slum dwellers’, but as ‘working poor’. Importantopportunities exist for addressing the affordability gap byacting on both ends of the sustainable shelter equation –reducing housing production costs and increasing theincomes of the working poor. Given the urgency and growingsignificance of the ‘urbanization of poverty’ challenge, it isdifficult to think of other areas of development that deservemore attention and investment on the part of the local,national and international institutions committed to
Cities are the key to sustainabledevelopment: in the framework of a diversifiedeconomy significantgains in economicgrowth can be made
172 Towards sustainable shelter finance systems

reaching the Millennium Development Goals, including thetarget of improving the lives of at least 100 million slumdwellers by 2020 and, more generally, of finding practicaland sustainable solutions to the global fight against poverty.
Cities can lead the way, and the urban poor, who are thetargets of the Millennium Development Goals, can becomethe protagonists, leading actors and living examples of abrighter future for all of humanity.
173Epilogue: towards sustainable urban shelter
1 This Epilogue is based on apaper prepared by PietroGarau, University of Rome,Italy.
2 The identification ofurbanization and theurbanization of poverty as oneof the fundamental challengesfacing development is notrestricted to humansettlements scholars andpolicy-makers. See, forexample, Sir Hans Singer inMeyer and Stiglitz, 2000, p518:‘Soon, the majority of thepopulation and the majority ofthe poor will live in towns,often in megacities.This willgive added urgency to theproblem of local government,civic participation, the urbaninformal sector, and urbaninfrastructure andenvironment.’
3 UNCHS, 1996a.4 UN-Habitat, 2003a.
5 The Economist, 2004; IMF, 2004.6 UNCHS, 1990a.7 UN Millennium Project, 2005a.8 UN Millennium Project, 2005b.9 As remarked at one of the
meetings of the UnitedNations Millennium Project’sTask Force on Improving theLives of Slum Dwellers, Italianhill towns could be classified asinadequate by a stern publichealth official or plannerapplying conventional ‘modern’standards.
10 UN-Habitat, 2004.11 Following up on a
recommendation by the TaskForce on Improving the Livesof Slum Dwellers during theWorld Congress of theInternational Union ofArchitects in Istanbul in June2005, teams of architecturalstudents in partnership withresidents of a low-incomecommunity soughtarchitectural solutions to
improve the livingenvironment.
12 Although in several countriesall housing construction,including built-for-profithousing, is eligible for subsidies.For example, tax expendituresbenefiting all owner occupantsin the US and the housingvoucher system adopted inChile.
13 UN Millennium Project, 2005a.14 UN-Habitat, 2003b.15 UN-Habitat, 2003a.16 Sood, 2003, p14.17 Much has been said and
written about the obstaclesthat the poor face in accessingconventional housing loans.However, this is only a smallpart of the picture and there isevidence that the issue is farwider than ‘shelter finance’.The dramatically high level ofrepossessions of mortgagedhousing in many industrializedcountries reveals that accessing
credit and obtaining a loan isonly the first step in the longprocess towards sheltersecurity. Moreover, insufficientincomes also prevent access todecent rental housing, whichcontinues to be an importantway of securing adequateshelter in all countries. SeeUN-Habitat, 2003a, for detail.
18 UN Millennium Project, 2005b.19 UN Millennium Project, 2005a.20 Mintz, 2003.21 United Cities and Local
Governments (UCLG) hascoordinated the localgovernment contribution tothe United Nations five-yearreview of the implementationof the MillenniumDevelopment Goals, stressingthe importance of the localimplementation of the MDGs.
22 Advanced cities should behonoured with the title ofMillennium City.
NOTES


The Statistical Annex comprises 16 tables covering threebroad categories: (i) demographic indicators and householdsdata; (ii) housing and housing infrastructure indicators; and(iii) economic and social indicators. These tables are dividedinto three sections presenting data at the regional, countryand city levels. Tables A.1 to A.3 present regional-level datagrouped by selected criteria of geographic, economic anddevelopment aggregation. Tables B.1 to B.9 contain country-level data and Tables C.1 to C.4 are devoted to city-level data.Data have been compiled from various international sources,from national statistical offices and from the United Nations.
EXPLANATION OF SYMBOLSThe following symbols have been used in presenting datathroughout the Statistical Annex:
Category not applicable ..Data not available ...Magnitude zero –Provisional data is given in italics and bracketed numbershave a negative value.
COUNTRY GROUPINGS ANDSTATISTICAL AGGREGATES World major groupings
More developed regions: All countries and areas of Europeand Northern America, as well as Australia, Japan and NewZealand.
Less developed regions: All countries and areas of Africa,Latin America, Asia (excluding Japan) and Oceania(excluding Australia and New Zealand).
Least developed countries (LDCs): The United Nationscurrently designates 49 countries as LDCs: Afghanistan,Angola, Bangladesh, Benin, Bhutan, Burkina Faso, Burundi,Cambodia, Cape Verde, Central African Republic, Chad,Comoros, Democratic Republic of the Congo, Djibouti,Equatorial Guinea, Eritrea, Ethiopia, Gambia, Guinea, Guinea-Bissau, Haiti, Kiribati, Lao People’s Democratic Republic,Lesotho, Liberia, Madagascar, Malawi, Maldives, Mali,Mauritania, Mozambique, Myanmar, Nepal, Niger, Rwanda,Samoa, Sao Tome and Principe, Senegal, Sierra Leone,Solomon Islands, Somalia, Sudan, Togo, Tuvalu, Uganda,United Republic of Tanzania, Vanuatu, Yemen, Zambia.
Landlocked developing countries (LLDCs): Afghanistan,Armenia, Azerbaijan, Bhutan, Bolivia, Botswana, BurkinaFaso, Burundi, Central African Republic, Chad, Ethiopia,Kazakhstan, Kyrgyzstan, Lao People’s Democratic Republic,Lesotho, Malawi, Mali, Mongolia, Nepal, Niger, Paraguay,Rwanda, Swaziland, Tajikistan, TFYR of Macedonia,Turkmenistan, Uganda, Uzbekistan, Zambia, Zimbabwe.
Small island developing states (SIDS): Antigua andBarbuda, Aruba, Bahamas, Bahrain, Barbados, Belize, CapeVerde, Comoros, Cook Islands, Cuba, Cyprus, Dominica,Dominican Republic, Fiji, Grenada, Guinea-Bissau, Guyana,Haiti, Jamaica, Kiribati, Maldives, Malta, Marshall Islands,Mauritius, Micronesia (Federated States of), Nauru,Netherlands Antilles, Niue, Palau, Papua New Guinea, SaintKitts and Nevis, Saint Lucia, Samoa, Sao Tome and Principe,Seychelles, Singapore, Solomon Islands, Saint Vincent andthe Grenadines, Suriname, Tokelau, Tonga, Trinidad andTobago, Tuvalu, United States Virgin Islands, Vanuatu.
United Nations Regional Groups1
African States: Algeria, Angola, Benin, Botswana, BurkinaFaso, Burundi, Cameroon, Cape Verde, Central AfricanRepublic, Chad, Comoros, Congo, Côte d’Ivoire, DemocraticRepublic of the Congo, Djibouti, Egypt, Equatorial Guinea,Eritrea, Ethiopia, Gabon, Gambia, Ghana, Guinea, Guinea-Bissau, Kenya, Lesotho, Liberia, Libyan Arab Jamahiriya,Madagascar, Malawi, Mali, Mauritania, Mauritius, Morocco,Mozambique, Namibia, Niger, Nigeria, Rwanda, Sao Tomeand Principe, Senegal, Seychelles, Sierra Leone, Somalia,South Africa, Sudan, Swaziland, Togo, Tunisia, Uganda,United Republic of Tanzania, Zambia, Zimbabwe.
Asian States: Afghanistan, Bahrain, Bangladesh, Bhutan,Brunei Darussalam, Cambodia, China, Cyprus, DemocraticPeople’s Republic of Korea, Fiji, India, Indonesia, Iran, Iraq,Japan, Jordan, Kazakhstan, Kuwait, Kyrgyzstan, Lao People’sDemocratic Republic, Lebanon, Malaysia, Maldives, MarshallIslands, Micronesia (Federated States of), Mongolia,Myanmar, Nauru, Nepal, Oman, Pakistan, Palau, Papua NewGuinea, Philippines, Qatar, Republic of Korea, Samoa, SaudiArabia, Singapore, Solomon Islands, Sri Lanka, Syrian ArabRepublic, Tajikistan, Thailand, Tonga, Turkmenistan, Tuvalu,United Arab Emirates, Uzbekistan, Vanuatu, Viet Nam,Yemen.
Eastern European States: Albania, Armenia, Azerbaijan,Belarus, Bosnia and Herzegovina, Bulgaria, Croatia, Czech
TECHNICAL NOTES
Republic, Georgia, Hungary, Latvia, Lithuania, Poland,Republic of Moldova, Romania, Russian Federation, Serbia andMontenegro, Slovakia, Slovenia, TFYR Macedonia, Ukraine.
Latin American and Caribbean States: Antigua andBarbuda, Argentina, Bahamas, Barbados, Belize, Bolivia,Brazil, Chile, Colombia, Costa Rica, Cuba, Dominica,Dominican Republic, Ecuador, El Salvador, Grenada,Guatemala, Guyana, Haiti, Honduras, Jamaica, Mexico,Nicaragua, Panama, Paraguay, Peru, Saint Kitts and Nevis,Saint Lucia, Saint Vincent and the Grenadines, Suriname,Trinidad and Tobago, Uruguay, Venezuela.
Western Europe and Other States: Andorra, Australia,Austria, Belgium, Canada, Denmark, Finland, France,Germany, Greece, Iceland, Ireland, Israel, Italy,Liechtenstein, Luxembourg, Malta, Monaco, Netherlands,New Zealand, Norway, Portugal, San Marino, Spain, Sweden,Switzerland, Turkey, United Kingdom.
Countries in the Human Developmentaggregates2
High human development (HDI 0.800 and above):3
Antigua and Barbuda, Argentina, Australia, Austria, Bahamas,Bahrain, Barbados, Belgium, Brunei Darussalam, Canada,Chile, Hong Kong SAR of China, Costa Rica, Croatia, Cuba,Cyprus, Czech Republic, Denmark, Estonia, Finland, France,Germany, Greece, Hungary, Iceland, Ireland, Israel, Italy,Japan, Kuwait, Latvia, Lithuania, Luxembourg, Malta,Mexico, Netherlands, New Zealand, Norway, Poland,Portugal, Qatar, Republic of Korea, Saint Kitts and Nevis,Seychelles, Singapore, Slovakia, Slovenia, Spain, Sweden,Switzerland, Trinidad and Tobago, United Arab Emirates,United Kingdom, United States, Uruguay.
Medium human development (HDI 0.500–0.799):4
Albania, Algeria, Armenia, Azerbaijan, Bangladesh, Belarus,Belize, Bhutan, Bolivia, Bosnia and Herzegovina, Botswana,Brazil, Bulgaria, Cambodia, Cameroon, Cape Verde, China,Colombia, Comoros, Dominica, Dominican Republic, Ecuador,Egypt, El Salvador, Equatorial Guinea, Fiji, Gabon, Georgia,Ghana, Grenada, Guatemala, Guyana, Honduras, India,Indonesia, Iran (Islamic Republic of), Jamaica, Jordan,Kazakhstan, Kyrgyzstan, Lao People’s Democratic Republic,Lebanon, Libyan Arab Jamahiriya, Malaysia, Maldives,Mauritius, Mongolia, Morocco, Myanmar, Namibia, Nepal,Nicaragua, Occupied Palestinian Territory, Oman, Panama,Papua New Guinea, Paraguay, Peru, Philippines, Republic ofMoldova, Romania, Russian Federation, Saint Lucia, SaintVincent and the Grenadines, Samoa, Sao Tome and Principe,Saudi Arabia, Solomon Islands, South Africa, Sri Lanka, Sudan,Suriname, Swaziland, Syrian Arab Republic, Tajikistan, TFYRMacedonia, Thailand, Tonga, Tunisia, Turkey, Turkmenistan,Ukraine, Uzbekistan, Vanuatu, Venezuela, Viet Nam.
Low human development (HDI 0.500 and below):5
Angola, Benin, Burkina Faso, Burundi, Central AfricanRepublic, Chad, Congo, Côte d’Ivoire, Democratic Republicof the Congo, Djibouti, Eritrea, Ethiopia, Gambia, Guinea,
Guinea-Bissau, Haiti, Kenya, Lesotho, Madagascar, Malawi,Mali, Mauritania, Mozambique, Niger, Nigeria, Pakistan,Rwanda, Senegal, Sierra Leone, Timor-Leste, Togo, Uganda,United Republic of Tanzania, Yemen, Zambia, Zimbabwe.
Countries in the income aggregates6
High income (GNP per capita US$9386 or more):Andorra, Aruba, Australia, Austria, Bahamas, Bahrain,Belgium, Bermuda, Brunei Darussalam, Canada, CaymanIslands, Channel Islands, Cyprus, Denmark, Faeroe Islands,Finland, France, French Polynesia, Germany, Greece,Greenland, Guam, Hong Kong SAR of China, Iceland,Ireland, Isle of Man, Israel, Italy, Japan, Kuwait,Liechtenstein, Luxembourg, Macao SAR of China, Malta,Monaco, Netherlands, Netherlands Antilles, NewCaledonia, New Zealand, Norway, Portugal, Puerto Rico,Qatar, Republic of Korea, San Marino, Singapore, Slovenia,Spain, Sweden, Switzerland, United Arab Emirates, UnitedKingdom, United States, United States Virgin Islands.
Upper-middle income (GNP per capitaUS$3036–9385): American Samoa, Antigua and Barbuda,Argentina, Barbados, Belize, Botswana, Chile, Costa Rica,Croatia, Czech Republic, Dominica, Estonia, Gabon,Grenada, Hungary, Latvia, Lebanon, Libyan Arab Jamahiriya,Lithuania, Malaysia, Mauritius, Mexico, Northern MarianaIslands, Oman, Palau, Panama, Poland, Saint Vincent and theGrenadines, Saudi Arabia, Seychelles, Slovakia, Saint Kittsand Nevis, Saint Lucia, Trinidad and Tobago, Uruguay,Venezuela.
Lower-middle income (GNP per capita US$766–3035):Albania, Algeria, Armenia, Azerbaijan, Belarus, Bolivia,Bosnia and Herzegovina, Brazil, Bulgaria, Cape Verde, China,Colombia, Cuba, Djibouti, Dominican Republic, Ecuador,Egypt, El Salvador, Fiji, Georgia, Guatemala, Guyana,Honduras, Indonesia, Iran (Islamic Republic of), Iraq,Jamaica, Jordan, Kazakhstan, Kiribati, Maldives, MarshallIslands, Micronesia (Federated States of), Morocco,Namibia, Occupied Palestinian Territory, Paraguay, Peru,Philippines, Romania, Russian Federation, Samoa, Serbia andMontenegro, South Africa, Sri Lanka, Suriname, Swaziland,Syrian Arab Republic, TFYR Macedonia, Thailand, Tonga,Tunisia, Turkey, Turkmenistan, Ukraine, Vanuatu.
Low income (GNP per capita US$765 or less):Afghanistan, Angola, Bangladesh, Benin, Bhutan, Burkina Faso,Burundi, Cambodia, Cameroon, Central African Republic,Chad, Comoros, Congo, Côte d’Ivoire, Democratic People’sRepublic of Korea, Democratic Republic of the Congo,Equatorial Guinea, Eritrea, Ethiopia, Gambia, Ghana, Guinea,Guinea-Bissau, Haiti, India, Kenya, Kyrgyzstan, Lao People’sDemocratic Republic, Lesotho, Liberia, Madagascar, Malawi,Mali, Mauritania, Mongolia, Mozambique, Myanmar, Nepal,Nicaragua, Niger, Nigeria, Pakistan, Papua New Guinea,Republic of Moldova, Rwanda, Sao Tome and Principe,Senegal, Sierra Leone, Solomon Islands, Somalia, Sudan,Tajikistan, Timor-Leste, Togo, Uganda, United Republic ofTanzania, Uzbekistan, Viet Nam, Yemen, Zambia, Zimbabwe.
178 Statistical annex

Sub-regional aggregates
� AfricaEastern Africa: Burundi, Comoros, Djibouti, Eritrea,Ethiopia, Kenya, Madagascar, Malawi, Mauritius,Mozambique Réunion, Rwanda, Seychelles, Somalia,Uganda, United Republic of Tanzania, Zambia, Zimbabwe.
Middle Africa: Angola, Cameroon, Central AfricanRepublic, Chad, Congo, Democratic Republic of the Congo,Equatorial Guinea, Gabon, Sao Tome and Principe.
Northern Africa: Algeria, Egypt, Libyan Arab Jamahiriya,Morocco, Sudan, Tunisia, Western Sahara.
Southern Africa: Botswana, Lesotho, Namibia, SouthAfrica, Swaziland.
Western Africa: Benin, Burkina Faso, Cape Verde, Côted’Ivoire, Gambia, Ghana, Guinea, Guinea-Bissau, Liberia,Mali, Mauritania, Niger, Nigeria, Saint Helena, Senegal,Sierra Leone, Togo.
� AsiaEastern Asia: China, Hong Kong SAR of China, Macao SARof China, Democratic People’s Republic of Korea, Japan,Mongolia, Republic of Korea.
South-central Asia: Afghanistan, Bangladesh, Bhutan,India, Iran (Islamic Republic of), Kazakhstan, Kyrgyzstan,Maldives, Nepal, Pakistan, Sri Lanka, Tajikistan,Turkmenistan, Uzbekistan.
Southeastern Asia: Brunei Darussalam, Cambodia,Indonesia, Lao People’s Democratic Republic, Malaysia,Myanmar, Philippines, Singapore, Thailand, Timor-Leste,Viet Nam.
Western Asia: Armenia, Azerbaijan, Bahrain, Cyprus,Georgia, Iraq, Israel, Jordan, Kuwait, Lebanon, OccupiedPalestinian Territory, Oman, Qatar, Saudi Arabia, Syrian ArabRepublic, Turkey, United Arab Emirates, Yemen
� EuropeEastern Europe: Belarus, Bulgaria, Czech Republic,Hungary, Poland, Republic of Moldova, Romania, RussianFederation, Slovakia, Ukraine.
Northern Europe: Channel Islands, Denmark, Estonia,Faeroe Islands, Finland, Iceland, Ireland, Isle of Man, Latvia,Lithuania, Norway, Sweden, United Kingdom.
Southern Europe: Albania, Andorra, Bosnia andHerzegovina, Croatia, Gibraltar, Greece, Holy See, Italy,Malta, Portugal, San Marino, Serbia and Montenegro,Slovenia, Spain, TFYR Macedonia.
Western Europe: Austria, Belgium, France, Germany,Liechtenstein, Luxembourg, Monaco, The Netherlands,Switzerland.
� Latin America and the CaribbeanCaribbean: Anguilla, Antigua and Barbuda, Aruba, Bahamas,Barbados, British Virgin Islands, Cayman Islands, Cuba,Dominica, Dominican Republic, Grenada, Guadeloupe, Haiti,Jamaica, Martinique, Montserrat, Netherlands Antilles,Puerto Rico, Saint Kitts and Nevis, Saint Lucia, Saint Vincentand the Grenadines, Trinidad and Tobago, Turks and CaicosIslands, United States Virgin Islands.
Central America: Belize, Costa Rica, El Salvador,Guatemala, Honduras, Mexico, Nicaragua, Panama.
South America: Argentina, Bolivia, Brazil, Chile, Colombia,Ecuador, Falkland Islands (Malvinas), French Guiana,Guyana, Paraguay, Peru, Suriname, Uruguay, Venezuela.
� Northern AmericaBermuda, Canada, Greenland, Saint-Pierre and Miquelon,United States.
� OceaniaAustralia/New Zealand: Australia, New Zealand.
Melanesia: Fiji, New Caledonia, Papua New Guinea,Solomon Islands, Vanuatu.
Micronesia: Guam, Kiribati, Marshall Islands, Micronesia(Federated States of), Nauru, Northern Mariana Islands,Palau.
Polynesia: American Samoa, Cook Islands, French Polynesia,Niue, Pitcairn, Samoa, Tokelau, Tonga, Tuvalu, Wallis andFutuna Islands.
NOMENCLATURE ANDORDER OF PRESENTATIONTables A.1 to A.3 contain regional, income and developmentaggregates data. Tables B.1 to B.9 and C.1 to C.4 containnational- and city-level data, respectively. In these tables, thecountries or areas are listed in English alphabetical orderwithin the macroregions of Africa, Asia, Europe, LatinAmerica, Northern America and Oceania. Countries or areanames are presented in the form commonly used within theUnited Nations Secretariat for statistical purposes. Due tospace limitations, the short name is used – for example, theUnited Kingdom of Great Britain and Northern Ireland isreferred to as ‘United Kingdom’, the United States ofAmerica as ‘United States’.
179Technical notes
DEFINITION OFSTATISTICAL TERMSAccess to improved drinking water supply: ‘Improved’water supply technologies are household connection, publicstandpipe, borehole, protected dug well, protected spring,rainwater collection. Availability of at least 20 litres perperson per day from a source within 1 kilometre of theuser’s dwelling. ‘Not improved’ are unprotected well,unprotected spring, vendor-provided water, bottled water(based on concerns about the quantity of supplied water,not concerns over the quality of water), tanker truck-provided water.
Access to improved sanitation: ‘Improved’ sanitationtechnologies are connection to a public sewer, connectionto septic system, pour-flush latrine, simple pit latrine,ventilated improved pit latrine. The excreta disposal systemis considered adequate if it is private or shared (but notpublic) and if it hygienically separates human excreta fromhuman contact. ‘Not improved’ are service or bucket latrines(where excreta are manually removed), public latrines,latrines with an open pit.
Access to water: Percentage of households with access towater. Access is defined as having water located within 200metres of the dwelling. It refers to housing units where thepiped water is available within the unit and to those whereit is not available to occupants within their housing unit, butis accessible within the range of 200 metres. This assumesthat access to piped water within that distance allowsoccupants to provide water for household needs withoutbeing subjected to extreme effort.
Aid dependency ratios: Calculated using values in USdollars converted at official exchange rates. Aid per capitaincludes both official development assistance (ODA) andofficial aid (OA).
Commercial energy production: Commercial forms ofprimary energy – petroleum (crude oil, natural gas liquidsand oil from non-conventional sources); natural gas; solidfuels (coal, lignite and other derived fuels); and primaryelectricity – all converted into oil equivalents.
Commercial energy use: Apparent consumption, which isequal to indigenous production plus imports and stockchanges, minus exports and fuels supplied to ships andaircraft engaged in international transport.
Development assistance: Consists of disbursements ofloans made on concessional terms (net of repayments ofprincipal) and grants by official agencies of the members ofthe Development Assistance Committee (DAC), bymultilateral institutions, and by non-DAC countries topromote economic development and welfare in countriesand territories in part 1 of the DAC list of aid recipients. Itincludes loans with a grant element of at least 25 per cent(calculated at a rate of discount of 10 per cent).
Domestic gross savings: Calculated as gross domesticproduct (GDP) less total consumption.
Domestic credit to private sector: Refers to financialresources provided to the private sector – such as throughloans, purchases of non-equity securities, and trade creditsand other accounts receivable – that establish a claim forrepayment. For some countries these claims include creditto public enterprises.
Electric rail lines: The length of line with electric traction.This line can include overhead catenary at various directcurrent or alternating current voltage and third-rail directcurrent systems.
Energy use per capita: Refers to apparent consumption,which is equal to indigenous production plus imports andstock changes, minus exports and fuels supplied to ships andaircraft engaged in international transport.
Foreign direct investment (FDI): Net inflows ofinvestment to acquire a lasting management interest (10 percent or more of voting stock) in an enterprise operating inan economy other than that of the investor. It is the sum ofequity capital, reinvestment of earnings, other long-termcapital and short-term capital as shown in the balance ofpayments.
Foreign direct investment (FDI) in–out flows: Data are ona net basis (capital transactions’ credits less debits betweendirect investors and their foreign affiliates). Net decreases inassets (outward FDI) or net increases in liabilities (inward FDI)are recorded as credits (recorded with a positive sign in thebalance of payments), while net increases in assets or netdecreases in liabilities are recorded as debits (recorded with anegative sign in the balance of payments). FDI flows with anegative sign indicate that at least one of the threecomponents of FDI (equity capital, reinvested earnings orintra-company loans) is negative and is not offset by positiveamounts of the other components. These are instances ofreverse investment or disinvestments.
The United Nations Conference on Trade andDevelopment (UNCTAD) regularly collects published andunpublished national official FDI flows data directly fromcentral banks, statistical offices or national authorities on anaggregated and disaggregated basis for its FDI/transnationalcorporations (TNC) database. These data constitute the mainsource of reported data on FDI flows.
Female-headed households: Percentage of householdswith a female head.
Fuel prices: Pump prices of the most widely sold grade ofpetrol and diesel fuel. Prices have been converted from thelocal currency to US dollars.
Gini index: Measures the extent to which the distributionof income (or, in some cases, consumption expenditure)among individuals or households within an economy deviates
180 Statistical annex

from a perfectly equal distribution. A Lorenz curve plots thecumulative percentages of total income received against thecumulative number of recipients, starting with the poorestindividual or household. The Gini index measures the areabetween the Lorenz curve and a hypothetical line ofabsolute equality, expressed as a percentage of the maximumarea under the line. Thus, a Gini index of 0 representsperfect equality, while an index of 100 implies absoluteinequality.
Gross capital formation: Consists of outlays on additionsto the fixed assets of the economy, plus net changes in thelevel of inventories. Fixed assets include land improvements(for example, fences, ditches, drains), plant, machinery andequipment purchases, and the construction of roads,railways and the like, including schools, offices, hospitals,private residential dwellings, and commercial and industrialbuildings. Inventories are stocks of goods held by firms tomeet temporary or unexpected fluctuations in productionor sales, and ‘work in progress’.
Gross domestic product (GDP): At purchaser prices, thisis the sum of the gross value added by all resident producersin the economy, plus any product taxes, minus any subsidiesnot included in the value of the products. It is calculatedwithout making deductions for depreciation of fabricatedassets or for depletion and degradation of natural resources.GDP per capita: GDP divided by the mid-year population.Growth is calculated from constant price GDP data in localcurrency.
Gross national savings: Calculated as the differencebetween gross national income and public and privateconsumption, plus net current transfers.
Gross school enrolment ratio: Number of students, bysex, enrolled in a level of education, whether or not theybelong in the relevant age group for that level, as apercentage of the population in the relevant group for thatlevel.
Hospital beds: Include in-patient beds available in public,private, general, and specialized hospitals and rehabilitationcentres. In most cases, beds for both acute and chronic careare included.
Household: Estimations and projections prepared by theUnited Nations Human Settlements Programme (UN-Habitat). Household statistics were collected through theHuman Settlements Statistical Questionnaires. The conceptof household is based on the arrangements made by persons,individually or in groups, for providing themselves with foodor other essentials for living. A household may be either:
1 A one-person household – that is to say, a person whomakes provision for his or her own food or otheressentials for living without combining with any otherperson to form a part of a multi-person household; or
2 A multi-person household – that is to say, a group oftwo or more persons living together who makecommon provision for food or other essentials forliving. The persons in the group may pool theirincomes and may, to a greater or lesser extent, havea common budget; they may be related or unrelatedpersons or constitute a combination of persons bothrelated and unrelated. This concept of household isknown as the ‘housekeeping’ concept. It does notassume that the number of households and housingunits is equal. Although the concept of housing unitimplies that it is a space occupied by one household,it may also be occupied by more than one householdor by a part of a household (for example, two nuclearhouseholds that share one housing unit for economicreasons or one household in a polygamous societyroutinely occupying two or more housing units).
Household final consumption expenditure: The marketvalue of all goods and services, including durable products(such as cars, washing machines and home computers),purchased by households. It excludes purchases of dwellingsbut includes imputed rent for owner-occupied dwellings. Italso includes payments and fees to governments to obtainpermits and licences. Here, household consumptionexpenditure includes the expenditures of non-profitinstitutions serving households, even when reportedseparately by the country. In practice, householdconsumption expenditure may include any statisticaldiscrepancy in the use of resources relative to the supply ofresources.
Household projection methods: Determined byavailability and reliability of data. The five types of projectionapproaches followed by the lists of countries, for which therespective approach has been applied, are:
1 Total headship rate-based projection: Albania, Algeria,Austria, Bangladesh, Belarus, Benin, Bolivia,Botswana, Brazil, Brunei Darussalam, Bulgaria,Burkina Faso, Cambodia, Cape Verde, China MacauSAR, Colombia, Cyprus, Denmark, DominicanRepublic, Ecuador, Estonia, Fiji, Finland, France,French Polynesia, Gambia, Georgia, Germany, Greece,Guatemala, Haiti, Honduras, Hungary, Ireland, Italy,India, Indonesia, Iraq, Jamaica, Japan, Kazakhstan,Kenya, Kuwait, Latvia, Lesotho, Libyan ArabJamahiriya, Lithuania, Luxembourg, Malaysia,Maldives, Malta, Madagascar, Malawi, Mali,Mauritius, Mexico, Netherlands, New Caledonia,Nicaragua, Niger, Pakistan, Paraguay, Peru, Poland,Portugal, Republic of Korea, Rwanda, Singapore,Solomon Islands, South Africa, Spain, Sudan,Switzerland, Thailand, Tunisia, Turkey, UnitedRepublic of Tanzania, United States, Venezuela, VietNam, Yemen, Zambia and Zimbabwe.
2 Headship size rate-based projection: Argentina,Armenia, Australia, Azerbaijan, Bahamas, Bahrain,Barbados, Belgium, Belize, Burundi, Canada, Central
181Technical notes
African Republic, Chile, Congo, Costa Rica, Egypt, ElSalvador, Guadeloupe, Guam, Guyana, Iran (IslamicRepublic of), Israel, Jordan, Kyrgyzstan, Liberia,Martinique, Morocco, Nepal, Netherlands Antilles,New Zealand, Norway, Panama, Philippines, PuertoRico, Republic of Moldova, Réunion, Romania, RussianFederation, Serbia and Montenegro, Samoa, Sweden,Syrian Arab Republic, Tajikistan, Trinidad and Tobago,Turkmenistan, Ukraine, United Kingdom, Uruguay,Uzbekistan and Vanuatu.
3 Estimation on country level not possible: Afghanistan,Angola, Bosnia and Herzegovina, Democratic People’sRepublic of Korea, Lebanon, Occupied PalestinianTerritory, Sierra Leone, Timor-Leste and WesternSahara.
4 Estimation on the basis of one data point: Cameroon,Comoros, Côte d’Ivoire, Croatia, Czech Republic,Democratic Republic of the Congo, Eritrea, Ethiopia,Gabon, Ghana, Guinea, Guinea-Bissau, Iceland,Mauritania, Mongolia, Mozambique, Myanmar,Namibia, Nigeria, Oman, Papua New Guinea, Qatar,Senegal, Slovakia, Slovenia, Suriname, TFYRMacedonia, Togo, Uganda and United Arab Emirates.
5 Estimation with no data point: Bhutan, Chad, Djibouti,Equatorial Guinea, Lao People’s Democratic Republic,Saudi Arabia, Somalia and Swaziland.
The following countries or areas are not included in the totalnumber of households calculated for regions and otheraggregates: American Samoa, Andorra, Anguilla, Antigua andBarbuda, Aruba, Bermuda, British Virgin Islands, CaymanIslands, Channel Islands, Cook Islands, Dominica, FaeroeIslands, Falklands, French Guiana, Gibraltar, Greenland,Grenada, Holy See, Isle of Man, Liechtenstein, MarshallIslands, Micronesia (Federal States of), Monaco, Montserrat,Nauru, Northern Mariana Islands, Palau, Pitcairn, SaintHelena, Saint Kitts and Nevis, Saint Lucia, Saint-Pierre andMiquelon, Saint Vincent, San Marino, Sao Tome andPrincipe, Seychelles, Tokelau, Tonga, Turks and CaicosIslands, Tuvalu, United States Virgin Islands, and Wallis andFutuna Islands.
For the following countries the estimates areextremely rough and cannot be interpreted on their own;they have only been calculated for completeness reasons onthe aggregate (regional and global) level: Afghanistan,Angola, Bosnia and Herzegovina, Democratic People’sRepublic of Korea, Lebanon, Occupied Palestinian Territory,Sierra Leone, Timor-Leste and Western Sahara.
Investment in infrastructure projects with privateparticipation: Covers infrastructure projects intelecommunications, energy (electricity and natural gastransmission and distribution), transport and water andsanitation that have reached financial closure and directly orindirectly serve the public. Incinerators, movable assets,stand-alone solid waste projects and small projects such aswindmills are excluded. The types of projects included areoperation and management contracts with major capitalexpenditure, greenfield projects (in which a private entity
or a public–private joint venture builds and operates a newfacility) and divestiture.
Level of urbanization: Percentage of the populationresiding in places classified as urban. Urban and ruralsettlements are defined in the national context and varyamong countries (the definitions of urban are generallynational definitions incorporated within the latest census).
Life expectancy at birth: Number of years a newborninfant would live if prevailing patterns of mortality at thetime of birth were to stay the same throughout the child’slife.
Literacy rate: Percentage of persons aged 15 and above whocan, with understanding, both read and write a short, simplestatement about their everyday life. In practice, literacy isdifficult to measure. To estimate literacy using such adefinition requires census or survey measurements undercontrolled conditions. Many countries estimate the numberof literate people from self-reported data. Some useeducational attainment data as a proxy, but apply differentlengths of school attendance or level completion. Asdefinition and methodologies of data collection differ acrosscountry – and even over time within countries – data needto be used with caution.
Local government revenue and expenditures: Totalannual local government revenue from all sources in USdollars, both capital and recurrent, divided by population(three-year average) and capital expenditure in US dollarsper person, by all local governments in the metropolitanarea, averaged over the last three years. Per capitaexpenditures: Include both fixed capital and plant as per thecapital account.
Motor vehicles: Include cars, buses and freight vehiclesbut not two-wheelers. Population figures refer to the mid-year population in the year for which data are available.Roads refer to motorways, highways, main or national roads,and secondary or regional roads. A motorway is a roadspecially designed and built for motor traffic that separatesthe traffic flowing in opposite directions.
Ownership: Owner: A household who owns the livingquarters that it occupies, whether used wholly or partly forown occupation by the owner. This may include livingquarters being purchased in instalments or mortgaged,according to national legal systems and practice. Otherarrangements, such as living quarters in co-operatives andhousing associations, may also be included depending uponnational practices. Tenant in publicly owned housing unit: Ahousehold residing in a housing unit that it does not own,but is owned by a public institution (disregarding whetheror not the institution is sponsored by central or localgovernment). These institutions may be co-operatives,housing associations or government agencies. Tenant inprivately owned housing unit: A household residing in ahousing unit that it does not own, but is owned by the
182 Statistical annex
private sector. This includes households renting a housingunit from individuals – for example, a landlord – or unitsowned by a private corporation.
Persons in housing units: Number of persons resident inhousing units. Persons per room: Figures are derived bydividing the number of occupants by the number of roomsin a given housing unit. The number of rooms is obtained bymultiplying the number of units by the number of rooms inthe unit. The calculations were done by the United NationsSecretariat.
Poor households: Percentage of women- and men-headedhouseholds situated below the locally defined poverty line.The poverty line is usually an ‘absolute’ poverty line, takenas the income necessary to afford a minimum nutritionallyadequate diet, plus essential non-food requirements, for ahousehold of a given size.
Population, total: Mid-year population estimates for theworld, region, countries or areas. The Population Division ofthe United Nations Department of Economic and SocialAffairs updates, every two years, population estimates andprojections by incorporating new data, new estimates andnew analysis of data on population, fertility, mortality andinternational migration. Data from new population censusesand/or demographic surveys are used to verify and updateold estimates of population or demographic indicators, or tomake new ones and to check the validity of the assumptionsmade in the projections. Total population refers to theestimates and projections (medium variant) of the totalpopulation for each country region and major area. Annualgrowth rate, calculated by UN-Habitat, refers to the averageannual percentage change of population during the indicatedperiod for each country, major regions and global totals. Theformula used throughout the Annex is as follows:
r = [(1/t) � ln(A2/A1)] � 100,
where ‘A1’ is a value at any given year; ‘A2’ is a value at anygiven year later than the year of ‘Al’; ‘t’ is the year intervalbetween ‘Al’ and ‘A2’; and ‘ln’ is the natural logarithmfunction.
Population, urban and rural: Mid-year estimates andprojections (medium variant) of the population residing inhuman settlements classified as urban or rural.
Poverty definitions: National poverty rate: Percentage ofthe population living below the national poverty line.National estimates are based on population-weighted sub-group estimates from household surveys. Survey year is theyear in which the underlying data were collected. Populationbelow US$1 a day and Population below US$2 a day:Percentages of the population living on less than US$1.08 aday and US$2.15 a day at 1993 international prices(equivalent to US$1 and US$2 in 1985 prices, adjusted forpurchasing power parity). Poverty rates are comparableacross countries, but as a result of revisions in purchasingpower parity (PPP) exchange rates, they cannot be compared
with poverty rates reported in previous editions forindividual countries.
Purchasing power parity (PPP) gross national income:Gross national income (GNI) converted to internationaldollars using purchasing power parity rates. An internationaldollar has the same purchasing power over GNI as a USdollar has in the United States.
Refugees, asylum-seekers and IDPs: Data are providedby governments based on their own definitions andmethods of collection. Total asylum-seekers, refugees andothers of concern to the United Nations HighCommissioner for Refugees (UNHCR) include the following.Refugees: Persons recognized as refugees under theinternational conventions, in accordance with the UNHCRStatute; persons allowed to stay on humanitarian groundsand those granted temporary protection. Asylum-seekers:Persons whose application for refugee status is pending inthe asylum procedure or who are otherwise registered asasylum-seekers. The total number of asylum-seekers isunderestimated due to a lack of data from a number ofcountries. Returned refugees: Refugees who have returnedto their country of origin during the year. Internallydisplaced persons (IDPs): Persons who are displaced withintheir country and to whom UNHCR extends protection orassistance, generally pursuant to a special request by acompetent organ of the United Nations. Returned IDPs:IDPs of concern to UNHCR who have returned to theirplace of origin during the year.
Roads: Motorways, highways, main or national roads, andsecondary or regional roads. A motorway is a road speciallydesigned and built for motor vehicles that separates thetraffic flowing in opposite directions. Total road network:Includes motorways, highways and main or national roads,secondary or regional roads, and all other roads in a country.Paved roads: Roads surfaced with crushed stone (macadam)and hydrocarbon binder or bitumized agents, with concreteor with cobblestones, as a percentage of all of the country’sroads measured in length.
Squatter household: A household who built a structurethat it occupies on land on which it does not have a title.Squatter settlements are usually built on the fringes of largecities without a predetermined plan and without any legalvalidation. Most of the structures of these settlementsusually fall into the category of ‘marginal housing unit’,although they may also consist of more solid structures.
Total health expenditure: Sum of public and private healthexpenditure. It covers the provision of health services(preventive and curative), family planning activities,nutrition activities and emergency aid designated for health,but does not include provision of water and sanitation.
Transport used for work trips: Percentage of work tripsundertaken by private car (A); train, tram or ferry (B); busor minibus (C); other (motorcycle, bicycle and other non-
183Technical notes
motorized modes) (D). When several modes of transport areused for a given trip, the principal mode is selected.
Travel time: Average time in minutes for a one-way worktrip. This is an average over all modes of transport.
Type of living quarters: Living quarters are structurallyseparate and independent places of abode. They may (i) havebeen constructed, built, converted or arranged for humanhabitation, provided that they are not used wholly for otherpurposes and that, in the case of improvised housing unitsand collective living quarters, they are occupied at the timeof the enumeration; or (ii) although not intended forhabitation, actually be in use for such a purpose. Livingquarters are either housing units or collective livingquarters. Housing unit: A separate and independent place ofabode intended for habitation by a single household, or onenot intended for habitation but occupied as living quartersby a household at the time of the enumeration. It may be anoccupied or vacant dwelling, an occupied mobile orimprovised housing unit or any other place occupied as livingquarters by a household at the time of the census. Thiscategory includes housing of various levels of permanencyand acceptability.
Value added: The net output of an industry after adding upall outputs and subtracting intermediate inputs. Theindustrial origin of value added is determined by theInternational Standard Industrial Classification (ISIC)revision 3. Agriculture includes forestry and fishing.Industry comprises mining, manufacturing (also reported asa separate sub-group), construction, electricity, water andgas. Manufacturing refers to industries. Services sector isderived as a residual (from GDP, less agriculture andindustry) and may not properly reflect the sum of serviceoutput, including banking and financial services.
Under-five mortality: Percentage of female children andmale children who die before reaching their fifth birthday.Child mortality = (number of deaths for children below fiveyears of age during the year)/(average number of live birthsduring the last five years).
Urban agglomeration: The contours of contiguousterritory without regard to administrative boundaries. Itcomprises the city or town proper and also the suburbanfringe lying outside of, but adjacent to, the city boundaries.Table B.1 contains revised estimates and projections for allurban agglomerations comprising 750,000 or moreinhabitants. Annual growth rate: Average annual percentagechange of population during the indicated period for eachcountry’s major regions and global totals.
Wastewater treated: Percentage of all wastewaterundergoing some form of treatment.
Water consumption: Average consumption of water inlitres per day per person for all domestic uses (excludesindustrial use) in settlements.
Water supply system: ‘Housing units with piped waterinside the housing unit’ refers to the existence of waterpipes within the walls that constitute a housing unit. Watercan be piped from the community source – that is, one thatis subject to inspection and control by public authorities.Water can also be piped into the unit from a private source,such as a pressure tank, a pump or some other installation.The category ‘piped water outside unit, but within 200metres’ refers to units where the piped water is not availableto occupants within the unit they reside in, but is accessiblewithin the range of 200 metres, assuming that access topiped water within that distance allows occupants to providewater for household needs without being subjected toextreme effort. ‘Other’ refers to units that do not haveaccess to piped water at all, whose occupants depend uponsprings or wells, or to units where piped water is locatedbeyond 200 metres.
Women-headed household: Households headed bywomen. In identifying the members of a household, acommon approach is to identify, first, the household heador reference person and then the remaining members of thehousehold according to their relationship to the head orreference person. The head of household is defined as thatperson in the household who is acknowledged as such byother members. However, it is recognized that nationalpractices in identifying household headship vary significantlyon the basis of customs and cultural traditions.
SOURCES OF DATAThe Statistical Data Tables have been compiled from thefollowing UN-Habitat databases: Human SettlementsStatistics Database, Global Urban Observatory (GUO)Database, CitiBase and Habitat’s Household ProjectionsProject.
Various statistical publications from the UnitedNations and other international organizations have beenused as well. Notable among them are International EnergyAgency (IEA), Energy Balances of OECD Countries, Paris,various years. International Labour Organization (2003)Economically Active Population Estimates and Projections:1950–2010, 4th edition, Geneva. International RoadFederation (IRF) (2001) World Road Statistics 2001, Geneva.Organisation for Economic Co-operation and Development(OECD) International Development Statistics, CD-ROM,various years, Paris. United Nations (2001) Compendium ofHuman Settlements Statistics 2001 (United Nationspublication sales No E01.XVII5), UN, New York. UNDP(2004) Human Development Report. UNDP/OxfordUniversity Press, New York. United Nations PopulationDivision (2004) World Urbanization Prospects: The 2003Revision, UN, New York. UNESCO (2002) EstimatedIlliteracy Rate and Illiterate Population Aged 15 Years andOlder, by Country, 1970–2015: July 2002 Assessment,Institute for Statistics (UIS), Montreal. United Nations HighCommissioner for Refugees (UNHCR) (2002) StatisticalYearbook 2001, Geneva. United Nations Human SettlementsProgramme (UN-Habitat) (2002) Global Urban Indicators
184 Statistical annex

Database 2, UN-Habitat, Nairobi. United Nations StatisticsDivision (2002) Energy Statistics Yearbook 2002, New York.United Nations Statistics Division (UNSD) National AccountsStatistics: Main Aggregates and Detailed Tables, parts 1 and2, various years, New York. World Bank (2002) WorldDevelopment Indicators, 2002, World Bank, Washington DC.World Bank (2004) World Development Indicators 2004.World Bank, Washington DC. World Health Organization(WHO), United Nations Children’s Fund (UNICEF) and
Water Supply and Sanitation Collaborative Council (2000)Global Water Supply and Sanitation Assessment, 2000 Report,Geneva and New York. WHO/UNICEF Joint MonitoringProgramme for Water Supply and Sanitation (2004) Meetingthe MDG Drinking Water and Sanitation Target: A Mid-termAssessment of Progress. WHO/UNICEF, Geneva. WorldResources Institute (WRI) (2000) World Resources2000–2001, Washington, DC.
185Technical notes
1 All members of the UnitedNations General Assemblyarranged in Regional Groups.According to the UnitedNations Handbook 2003 (2003),this grouping is unofficial andhas been developed to takeaccount of the purposes ofGeneral Assembly Resolution1991 (XVIII) (1963), 33/138(1978) and 2847 (XXVI)(1971).The US is not amember of any regional group,but attends meetings of theWestern European and Other
States Group (WEOG) as anobserver and is considered tobe a member of that group forelectoral purposes.Turkeyparticipates fully in both theAsian and WEOG groups, butfor electoral purposes isconsidered a member ofWEOG only. Israel became afull member of WEOG on atemporary basis on 28 May2000. As of 31 May 2002,Estonia and Kiribati were notmembers of any regionalgroup. In addition to member
states, there is also a non-member state, the Holy See,that has observer status in theUnited Nations. By GeneralAssembly Resolution 52/250(1998), the General Assemblyconferred upon Palestine, in itscapacity as observer, additionalrights and privileges ofparticipation.These included,inter alia, the right toparticipation in the generaldebate of the GeneralAssembly, but did not includethe right to vote or to put
forward candidates.2 As classified by the United
Nations DevelopmentProgramme (UNDP); seeHuman Development Reportsfor detail.
3 55 countries or areas.4 86 countries or areas.5 36 countries or areas.6 As classified by the World
Bank; see World DevelopmentReports for detail.
NOTES
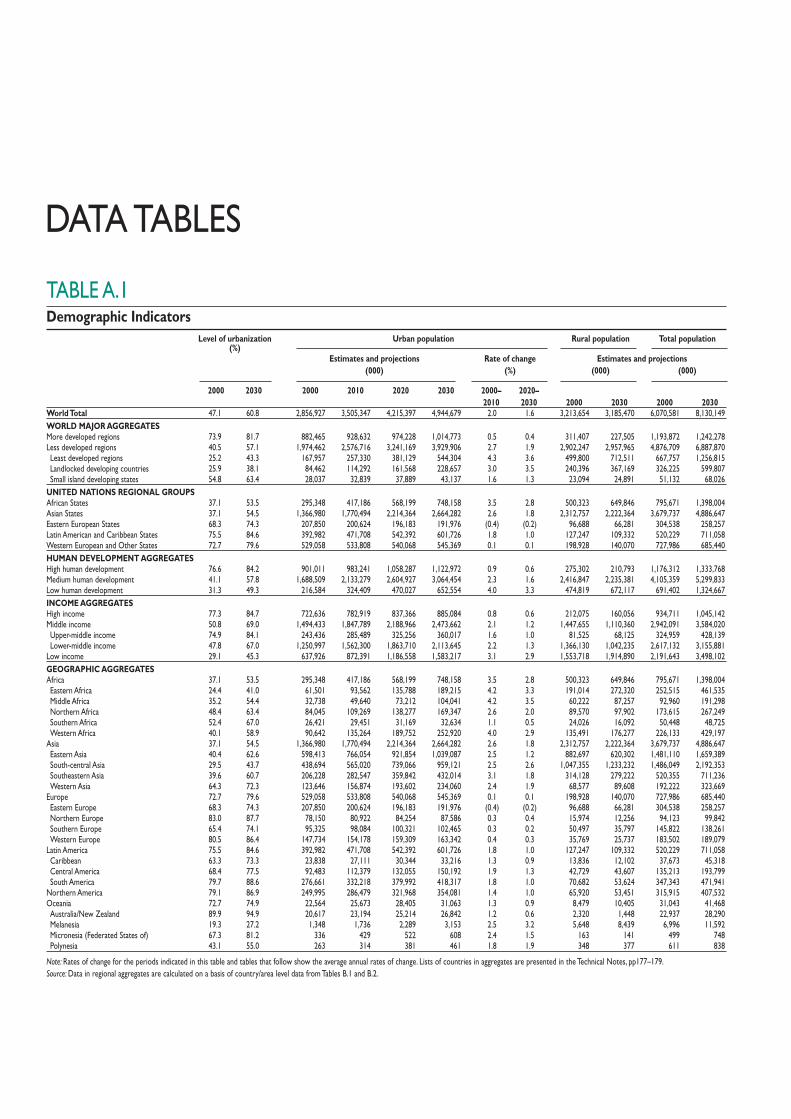
TABLE A.1Demographic Indicators
Level of urbanization Urban population Rural population Total population(%)
Estimates and projections Rate of change Estimates and projections(000) (%) (000) (000)
2000 2030 2000 2010 2020 2030 2000– 2020–2010 2030 2000 2030 2000 2030
World Total 47.1 60.8 2,856,927 3,505,347 4,215,397 4,944,679 2.0 1.6 3,213,654 3,185,470 6,070,581 8,130,149 WORLD MAJOR AGGREGATESMore developed regions 73.9 81.7 882,465 928,632 974,228 1,014,773 0.5 0.4 311,407 227,505 1,193,872 1,242,278Less developed regions 40.5 57.1 1,974,462 2,576,716 3,241,169 3,929,906 2.7 1.9 2,902,247 2,957,965 4,876,709 6,887,870Least developed regions 25.2 43.3 167,957 257,330 381,129 544,304 4.3 3.6 499,800 712,511 667,757 1,256,815Landlocked developing countries 25.9 38.1 84,462 114,292 161,568 228,657 3.0 3.5 240,396 367,169 326,225 599,807Small island developing states 54.8 63.4 28,037 32,839 37,889 43,137 1.6 1.3 23,094 24,891 51,132 68,026
UNITED NATIONS REGIONAL GROUPSAfrican States 37.1 53.5 295,348 417,186 568,199 748,158 3.5 2.8 500,323 649,846 795,671 1,398,004Asian States 37.1 54.5 1,366,980 1,770,494 2,214,364 2,664,282 2.6 1.8 2,312,757 2,222,364 3,679,737 4,886,647Eastern European States 68.3 74.3 207,850 200,624 196,183 191,976 (0.4) (0.2) 96,688 66,281 304,538 258,257Latin American and Caribbean States 75.5 84.6 392,982 471,708 542,392 601,726 1.8 1.0 127,247 109,332 520,229 711,058Western European and Other States 72.7 79.6 529,058 533,808 540,068 545,369 0.1 0.1 198,928 140,070 727,986 685,440HUMAN DEVELOPMENT AGGREGATESHigh human development 76.6 84.2 901,011 983,241 1,058,287 1,122,972 0.9 0.6 275,302 210,793 1,176,312 1,333,768Medium human development 41.1 57.8 1,688,509 2,133,279 2,604,927 3,064,454 2.3 1.6 2,416,847 2,235,381 4,105,359 5,299,833Low human development 31.3 49.3 216,584 324,409 470,027 652,554 4.0 3.3 474,819 672,117 691,402 1,324,667INCOME AGGREGATESHigh income 77.3 84.7 722,636 782,919 837,366 885,084 0.8 0.6 212,075 160,056 934,711 1,045,142Middle income 50.8 69.0 1,494,433 1,847,789 2,188,966 2,473,662 2.1 1.2 1,447,655 1,110,360 2,942,091 3,584,020Upper-middle income 74.9 84.1 243,436 285,489 325,256 360,017 1.6 1.0 81,525 68,125 324,959 428,139Lower-middle income 47.8 67.0 1,250,997 1,562,300 1,863,710 2,113,645 2.2 1.3 1,366,130 1,042,235 2,617,132 3,155,881
Low income 29.1 45.3 637,926 872,391 1,186,558 1,583,217 3.1 2.9 1,553,718 1,914,890 2,191,643 3,498,102GEOGRAPHIC AGGREGATESAfrica 37.1 53.5 295,348 417,186 568,199 748,158 3.5 2.8 500,323 649,846 795,671 1,398,004Eastern Africa 24.4 41.0 61,501 93,562 135,788 189,215 4.2 3.3 191,014 272,320 252,515 461,535Middle Africa 35.2 54.4 32,738 49,640 73,212 104,041 4.2 3.5 60,222 87,257 92,960 191,298Northern Africa 48.4 63.4 84,045 109,269 138,277 169,347 2.6 2.0 89,570 97,902 173,615 267,249Southern Africa 52.4 67.0 26,421 29,451 31,169 32,634 1.1 0.5 24,026 16,092 50,448 48,725Western Africa 40.1 58.9 90,642 135,264 189,752 252,920 4.0 2.9 135,491 176,277 226,133 429,197
Asia 37.1 54.5 1,366,980 1,770,494 2,214,364 2,664,282 2.6 1.8 2,312,757 2,222,364 3,679,737 4,886,647Eastern Asia 40.4 62.6 598,413 766,054 921,854 1,039,087 2.5 1.2 882,697 620,302 1,481,110 1,659,389South-central Asia 29.5 43.7 438,694 565,020 739,066 959,121 2.5 2.6 1,047,355 1,233,232 1,486,049 2,192,353Southeastern Asia 39.6 60.7 206,228 282,547 359,842 432,014 3.1 1.8 314,128 279,222 520,355 711,236Western Asia 64.3 72.3 123,646 156,874 193,602 234,060 2.4 1.9 68,577 89,608 192,222 323,669
Europe 72.7 79.6 529,058 533,808 540,068 545,369 0.1 0.1 198,928 140,070 727,986 685,440Eastern Europe 68.3 74.3 207,850 200,624 196,183 191,976 (0.4) (0.2) 96,688 66,281 304,538 258,257Northern Europe 83.0 87.7 78,150 80,922 84,254 87,586 0.3 0.4 15,974 12,256 94,123 99,842Southern Europe 65.4 74.1 95,325 98,084 100,321 102,465 0.3 0.2 50,497 35,797 145,822 138,261Western Europe 80.5 86.4 147,734 154,178 159,309 163,342 0.4 0.3 35,769 25,737 183,502 189,079
Latin America 75.5 84.6 392,982 471,708 542,392 601,726 1.8 1.0 127,247 109,332 520,229 711,058Caribbean 63.3 73.3 23,838 27,111 30,344 33,216 1.3 0.9 13,836 12,102 37,673 45,318Central America 68.4 77.5 92,483 112,379 132,055 150,192 1.9 1.3 42,729 43,607 135,213 193,799South America 79.7 88.6 276,661 332,218 379,992 418,317 1.8 1.0 70,682 53,624 347,343 471,941
Northern America 79.1 86.9 249,995 286,479 321,968 354,081 1.4 1.0 65,920 53,451 315,915 407,532Oceania 72.7 74.9 22,564 25,673 28,405 31,063 1.3 0.9 8,479 10,405 31,043 41,468Australia/New Zealand 89.9 94.9 20,617 23,194 25,214 26,842 1.2 0.6 2,320 1,448 22,937 28,290Melanesia 19.3 27.2 1,348 1,736 2,289 3,153 2.5 3.2 5,648 8,439 6,996 11,592Micronesia (Federated States of) 67.3 81.2 336 429 522 608 2.4 1.5 163 141 499 748Polynesia 43.1 55.0 263 314 381 461 1.8 1.9 348 377 611 838
Note: Rates of change for the periods indicated in this table and tables that follow show the average annual rates of change. Lists of countries in aggregates are presented in the Technical Notes, pp177–179.Source: Data in regional aggregates are calculated on a basis of country/area level data from Tables B.1 and B.2.
DATA TABLES

TABLE A.2Shelter Indicators
Access to urban services Number of households
Improved Improved House Estimates and projections Five-year incrementwater sanitation connections (000) (000)
(%) (%) (%)
1990 2002 1990 2002 1990 2002 2005 2015 2025 2005– 2010– 2015– 2020–2010 2015 2020 2025
World Total 92.1 92.4 81.1 81.2 73.3 71.6 1,743,640 2,116,248 2,461,422 191,930 180,678 175,481 169,694WORLD MAJOR AGGREGATESMore developed regions 99.8 99.6 99.4 98.0 97.9 96.4 497,505 547,104 582,358 27,161 22,438 18,896 16,357Less developed regions 89.0 89.9 73.8 75.4 63.5 62.9 1,246,135 1,569,144 1,879,065 164,769 158,240 156,584 153,337Least developed regions 74.9 79.2 49.0 57.8 32.9 34.7 134,798 179,679 239,473 21,416 23,465 27,327 32,468Landlocked developing countries 83.2 86.2 54.8 61.6 43.3 53.2 72,437 93,677 121,838 10,016 11,224 13,064 15,098Small island developing states 93.7 94.2 85.8 86.1 80.2 76.0 11,187 12,882 14,375 839 856 777 716
UNITED NATIONS REGIONAL GROUPSAfrican States 78.7 83.4 55.3 57.8 42.5 43.3 188,308 248,991 321,124 30,867 29,816 33,993 38,140Asian States 91.3 90.8 82.1 81.0 69.4 70.3 937,383 1,164,423 1,368,331 116,316 110,725 105,331 98,576Eastern European States 97.5 97.7 97.6 93.3 90.9 88.9 139,769 147,013 147,129 5,384 1,860 471 (355)Latin American and Caribbean States 94.4 96.3 82.6 86.4 82.9 83.8 142,689 175,549 206,351 16,644 16,215 15,749 15,054Western European and Other States 98.5 98.5 99.4 99.7 98.8 99.6 209,865 231,808 248,799 11,384 10,560 9,050 7,941HUMAN DEVELOPMENT AGGREGATESHigh human development 99.0 99.2 98.2 98.4 96.6 96.1 461,648 518,920 566,193 29,490 27,782 24,769 22,504Medium human development 93.4 92.6 80.4 81.1 70.6 72.1 1,134,804 1,396,006 1,623,226 136,728 124,473 118,068 109,153Low human development 74.3 81.9 47.5 53.9 33.7 34.8 147,188 201,322 272,003 25,712 28,423 32,644 38,037INCOME AGGREGATESHigh income 99.8 99.8 99.6 99.6 98.9 98.8 386,518 433,249 472,107 23,984 22,747 20,349 18,509Middle income 95.2 95.5 98.9 88.4 83.4 84.5 891,644 1,083,250 1,247,057 101,780 89,827 85,217 78,590Upper-middle income 95.7 95.9 92.7 89.9 86.3 86.0 93,028 109,385 124,323 8,259 8,098 7,649 7,290Low-middle income 93.9 94.2 83.6 85.5 77.3 78.8 798,616 973,865 1,122,734 93,520 81,729 77,569 71,300
Low income 79.7 81.7 50.7 58.3 37.3 40.5 465,479 599,749 742,258 66,167 68,104 69,914 72,595GEOGRAPHIC AGGREGATESAfrica 78.7 83.4 55.3 57.8 42.5 43.3 188,604 249,358 321,562 30,902 29,853 34,029 38,174Eastern Africa 85.2 84.5 51.1 53.8 42.9 42.3 56,357 72,812 96,066 7,637 8,819 10,661 12,593Middle Africa 67.9 74.9 46.0 43.2 30.0 30.8 22,129 31,268 44,370 4,144 4,994 5,987 7,115Northern Africa 91.0 91.4 89.6 90.6 78.4 84.8 34,070 43,207 52,890 4,885 4,252 5,198 4,485Southern Africa 94.0 94.2 68.8 69.6 62.0 63.6 18,711 21,932 22,194 2,759 462 144 118Western Africa 95.6 81.6 46.2 57.0 27.8 32.8 57,337 80,139 106,041 11,477 11,326 12,039 13,863
Asia 91.3 90.8 82.1 81.0 69.4 70.3 962,492 1,194,550 1,402,896 118,823 113,236 107,657 100,690Eastern Asia 96.8 95.2 82.0 75.5 80.8 83.0 480,753 593,113 690,509 59,045 53,315 50,415 46,981South-central Asia 94.0 88.9 76.9 74.4 62.9 63.9 303,843 381,645 451,755 38,779 39,023 36,374 33,736Southeastern Asia 90.6 85.5 71.9 78.7 49.0 42.7 135,880 166,502 193,391 15,585 15,037 14,197 12,693Western Asia 94.1 94.4 95.5 93.9 85.2 85.7 42,015 53,291 67,242 5,414 5,862 6,671 7,280
Europe 99.7 99.5 99.3 97.5 97.7 96.0 302,806 323,017 331,902 12,323 7,888 5,298 3,588Eastern Europe 99.3 98.6 98.6 73.9 93.0 88.0 125,626 132,180 132,129 4,965 1,589 368 (418)Northern Europe 100.0 100.0 100.0 97.7 98.9 98.7 42,179 47,064 51,179 2,486 2,399 2,125 1,990Southern Europe 99.7 99.7 99.0 99.0 96.7 98.4 53,614 56,055 57,033 1,401 1,040 625 353Western Europe 100.0 100.0 100.0 100.0 100.0 100.0 81,387 87,717 91,561 3,471 2,860 2,181 1,663
Latin America 94.4 96.3 82.6 86.4 82.9 83.8 144,416 177,484 208,475 16,746 16,321 15,848 15,143Caribbean 96.4 97.4 87.8 90.4 81.8 79.3 11,230 13,189 14,767 1,035 924 838 739Central America 93.3 97.3 73.2 82.0 86.0 88.0 34,455 43,243 51,722 4,349 4,439 4,365 4,114South America 92.2 94.2 81.0 84.5 81.5 86.9 98,731 121,052 141,985 11,361 10,959 10,644 10,290
Northern America 100.0 100.0 100.0 100.0 100.0 100.0 133,819 158,218 180,848 12,076 12,323 11,597 11,033Oceania 93.3 91.9 83.9 88.6 79.3 75.5 11,504 13,621 15,739 1,060 1,056 1,053 1,065Australia/New Zealand 100.0 100.0 100.0 100.0 100.0 100.0 9,600 11,254 12,790 837 817 782 755Melanesia 90.5 89.0 88.0 85.5 72.3 70.0 1,647 2,056 2,584 198 212 243 284Micronesia (Federated States of) 88.8 88.2 71.7 83.7 ... ... 116 141 166 11 13 13 13Polynesia 99.7 97.0 99.0 99.0 ... 81.7 142 170 199 14 15 15 14
Note: Lists of countries in aggregates are presented in the Technical Notes, pp177–179.Source: Data in regional aggregates are calculated on a basis of country/area level data from Tables B.3 and B.5.
187Data tables
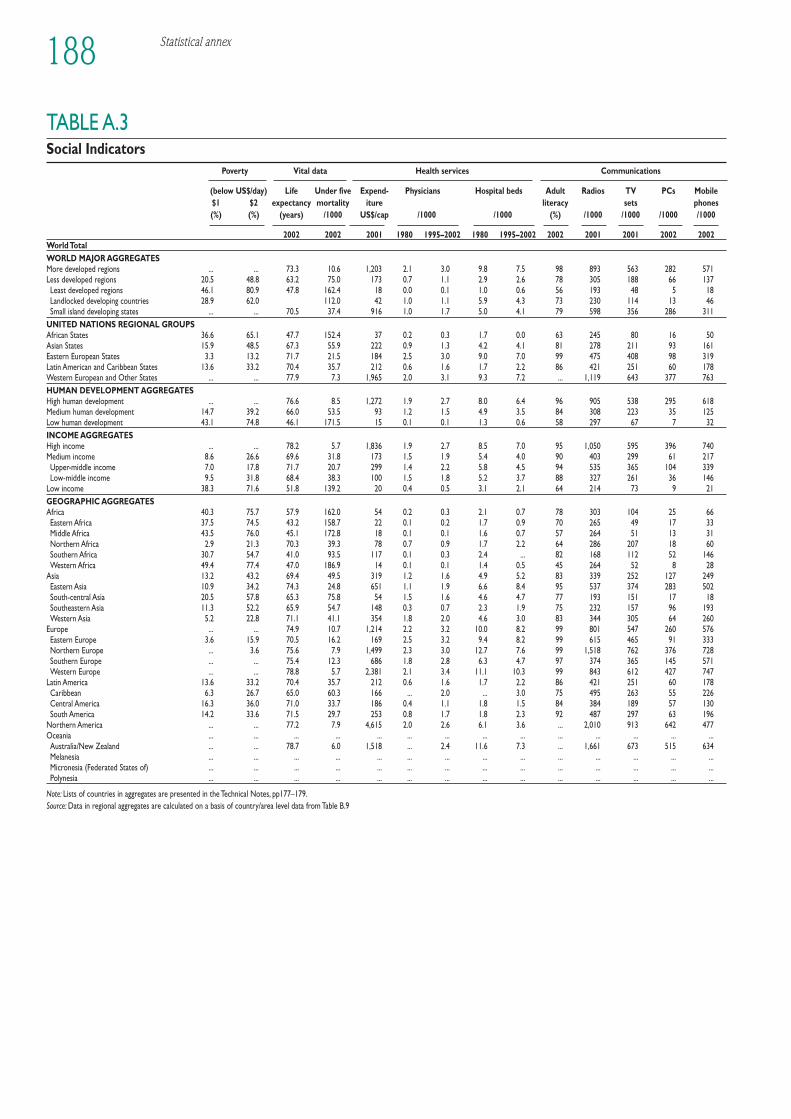
TABLE A.3Social Indicators
Poverty Vital data Health services Communications
(below US$/day) Life Under five Expend- Physicians Hospital beds Adult Radios TV PCs Mobile $1 $2 expectancy mortality iture literacy sets phones(%) (%) (years) /1000 US$/cap /1000 /1000 (%) /1000 /1000 /1000 /1000
2002 2002 2001 1980 1995–2002 1980 1995–2002 2002 2001 2001 2002 2002World TotalWORLD MAJOR AGGREGATESMore developed regions ... ... 73.3 10.6 1,203 2.1 3.0 9.8 7.5 98 893 563 282 571Less developed regions 20.5 48.8 63.2 75.0 173 0.7 1.1 2.9 2.6 78 305 188 66 137Least developed regions 46.1 80.9 47.8 162.4 18 0.0 0.1 1.0 0.6 56 193 48 5 18Landlocked developing countries 28.9 62.0 112.0 42 1.0 1.1 5.9 4.3 73 230 114 13 46Small island developing states ... ... 70.5 37.4 916 1.0 1.7 5.0 4.1 79 598 356 286 311
UNITED NATIONS REGIONAL GROUPSAfrican States 36.6 65.1 47.7 152.4 37 0.2 0.3 1.7 0.0 63 245 80 16 50Asian States 15.9 48.5 67.3 55.9 222 0.9 1.3 4.2 4.1 81 278 211 93 161Eastern European States 3.3 13.2 71.7 21.5 184 2.5 3.0 9.0 7.0 99 475 408 98 319Latin American and Caribbean States 13.6 33.2 70.4 35.7 212 0.6 1.6 1.7 2.2 86 421 251 60 178Western European and Other States ... ... 77.9 7.3 1,965 2.0 3.1 9.3 7.2 ... 1,119 643 377 763HUMAN DEVELOPMENT AGGREGATESHigh human development ... ... 76.6 8.5 1,272 1.9 2.7 8.0 6.4 96 905 538 295 618Medium human development 14.7 39.2 66.0 53.5 93 1.2 1.5 4.9 3.5 84 308 223 35 125Low human development 43.1 74.8 46.1 171.5 15 0.1 0.1 1.3 0.6 58 297 67 7 32INCOME AGGREGATESHigh income ... ... 78.2 5.7 1,836 1.9 2.7 8.5 7.0 95 1,050 595 396 740Medium income 8.6 26.6 69.6 31.8 173 1.5 1.9 5.4 4.0 90 403 299 61 217Upper-middle income 7.0 17.8 71.7 20.7 299 1.4 2.2 5.8 4.5 94 535 365 104 339Low-middle income 9.5 31.8 68.4 38.3 100 1.5 1.8 5.2 3.7 88 327 261 36 146
Low income 38.3 71.6 51.8 139.2 20 0.4 0.5 3.1 2.1 64 214 73 9 21GEOGRAPHIC AGGREGATESAfrica 40.3 75.7 57.9 162.0 54 0.2 0.3 2.1 0.7 78 303 104 25 66Eastern Africa 37.5 74.5 43.2 158.7 22 0.1 0.2 1.7 0.9 70 265 49 17 33Middle Africa 43.5 76.0 45.1 172.8 18 0.1 0.1 1.6 0.7 57 264 51 13 31Northern Africa 2.9 21.3 70.3 39.3 78 0.7 0.9 1.7 2.2 64 286 207 18 60Southern Africa 30.7 54.7 41.0 93.5 117 0.1 0.3 2.4 ... 82 168 112 52 146Western Africa 49.4 77.4 47.0 186.9 14 0.1 0.1 1.4 0.5 45 264 52 8 28
Asia 13.2 43.2 69.4 49.5 319 1.2 1.6 4.9 5.2 83 339 252 127 249Eastern Asia 10.9 34.2 74.3 24.8 651 1.1 1.9 6.6 8.4 95 537 374 283 502South-central Asia 20.5 57.8 65.3 75.8 54 1.5 1.6 4.6 4.7 77 193 151 17 18Southeastern Asia 11.3 52.2 65.9 54.7 148 0.3 0.7 2.3 1.9 75 232 157 96 193Western Asia 5.2 22.8 71.1 41.1 354 1.8 2.0 4.6 3.0 83 344 305 64 260
Europe ... ... 74.9 10.7 1,214 2.2 3.2 10.0 8.2 99 801 547 260 576Eastern Europe 3.6 15.9 70.5 16.2 169 2.5 3.2 9.4 8.2 99 615 465 91 333Northern Europe ... 3.6 75.6 7.9 1,499 2.3 3.0 12.7 7.6 99 1,518 762 376 728Southern Europe ... ... 75.4 12.3 686 1.8 2.8 6.3 4.7 97 374 365 145 571Western Europe ... ... 78.8 5.7 2,381 2.1 3.4 11.1 10.3 99 843 612 427 747
Latin America 13.6 33.2 70.4 35.7 212 0.6 1.6 1.7 2.2 86 421 251 60 178Caribbean 6.3 26.7 65.0 60.3 166 ... 2.0 ... 3.0 75 495 263 55 226Central America 16.3 36.0 71.0 33.7 186 0.4 1.1 1.8 1.5 84 384 189 57 130South America 14.2 33.6 71.5 29.7 253 0.8 1.7 1.8 2.3 92 487 297 63 196
Northern America ... ... 77.2 7.9 4,615 2.0 2.6 6.1 3.6 ... 2,010 913 642 477Oceania ... ... ... ... ... ... ... ... ... ... ... ... ... ...Australia/New Zealand ... ... 78.7 6.0 1,518 ... 2.4 11.6 7.3 ... 1,661 673 515 634Melanesia ... ... ... ... ... ... ... ... ... ... ... ... ... ...Micronesia (Federated States of) ... ... ... ... ... ... ... ... ... ... ... ... ... ...Polynesia ... ... ... ... ... ... ... ... ... ... ... ... ... ...
Note: Lists of countries in aggregates are presented in the Technical Notes, pp177–179.Source: Data in regional aggregates are calculated on a basis of country/area level data from Table B.9
188 Statistical annex
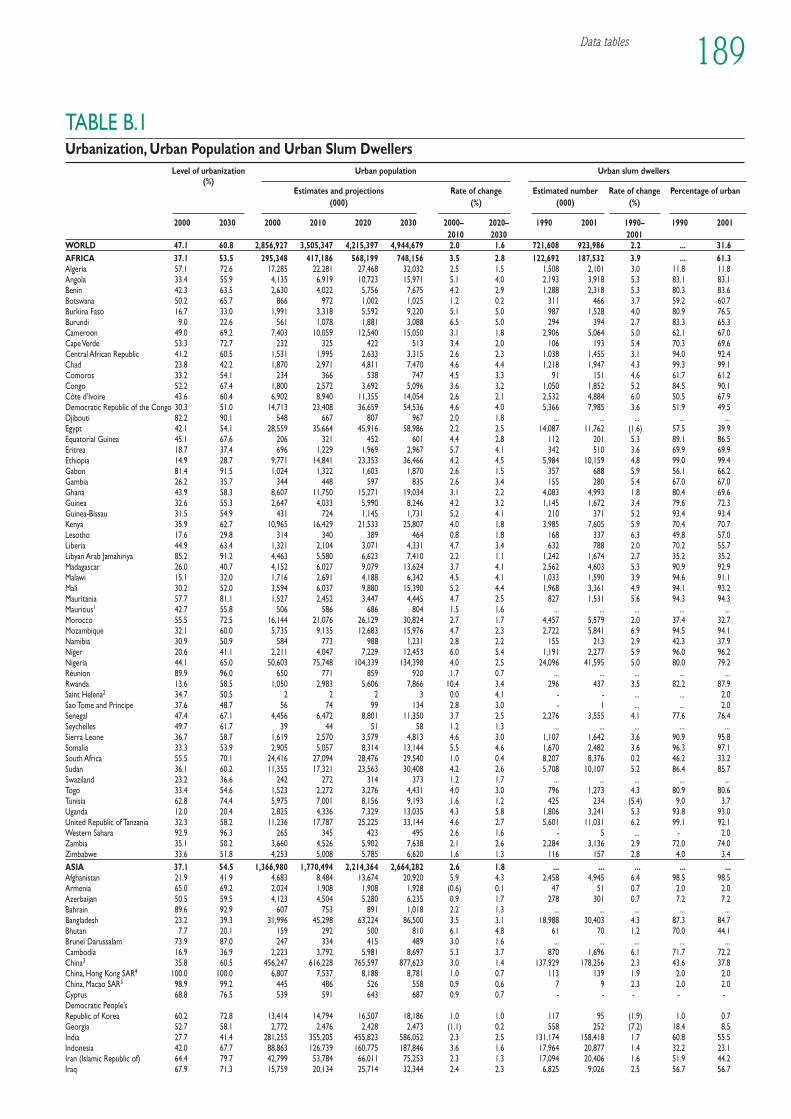
TABLE B.1Urbanization, Urban Population and Urban Slum Dwellers
Level of urbanization Urban population Urban slum dwellers(%)
Estimates and projections Rate of change Estimated number Rate of change Percentage of urban(000) (%) (000) (%)
2000 2030 2000 2010 2020 2030 2000– 2020– 1990 2001 1990– 1990 2001 2010 2030 2001
WORLD 47.1 60.8 2,856,927 3,505,347 4,215,397 4,944,679 2.0 1.6 721,608 923,986 2.2 ... 31.6 AFRICA 37.1 53.5 295,348 417,186 568,199 748,156 3.5 2.8 122,692 187,532 3.9 ... 61.3 Algeria 57.1 72.6 17,285 22,281 27,468 32,032 2.5 1.5 1,508 2,101 3.0 11.8 11.8 Angola 33.4 55.9 4,135 6,919 10,723 15,971 5.1 4.0 2,193 3,918 5.3 83.1 83.1 Benin 42.3 63.5 2,630 4,022 5,756 7,675 4.2 2.9 1,288 2,318 5.3 80.3 83.6 Botswana 50.2 65.7 866 972 1,002 1,025 1.2 0.2 311 466 3.7 59.2 60.7 Burkina Faso 16.7 33.0 1,991 3,318 5,592 9,220 5.1 5.0 987 1,528 4.0 80.9 76.5 Burundi 9.0 22.6 561 1,078 1,881 3,088 6.5 5.0 294 394 2.7 83.3 65.3 Cameroon 49.0 69.2 7,403 10,059 12,540 15,050 3.1 1.8 2,906 5,064 5.0 62.1 67.0 Cape Verde 53.3 72.7 232 325 422 513 3.4 2.0 106 193 5.4 70.3 69.6 Central African Republic 41.2 60.5 1,531 1,995 2,633 3,315 2.6 2.3 1,038 1,455 3.1 94.0 92.4 Chad 23.8 42.2 1,870 2,971 4,811 7,470 4.6 4.4 1,218 1,947 4.3 99.3 99.1 Comoros 33.2 54.1 234 366 538 747 4.5 3.3 91 151 4.6 61.7 61.2 Congo 52.2 67.4 1,800 2,572 3,692 5,096 3.6 3.2 1,050 1,852 5.2 84.5 90.1 Côte d’Ivoire 43.6 60.4 6,902 8,940 11,355 14,054 2.6 2.1 2,532 4,884 6.0 50.5 67.9 Democratic Republic of the Congo 30.3 51.0 14,713 23,408 36,659 54,536 4.6 4.0 5,366 7,985 3.6 51.9 49.5 Djibouti 82.2 90.1 548 667 807 967 2.0 1.8 ... ... ... ... ...Egypt 42.1 54.1 28,559 35,664 45,916 58,986 2.2 2.5 14,087 11,762 (1.6) 57.5 39.9 Equatorial Guinea 45.1 67.6 206 321 452 601 4.4 2.8 112 201 5.3 89.1 86.5 Eritrea 18.7 37.4 696 1,229 1,969 2,967 5.7 4.1 342 510 3.6 69.9 69.9 Ethiopia 14.9 28.7 9,771 14,841 23,353 36,466 4.2 4.5 5,984 10,159 4.8 99.0 99.4 Gabon 81.4 91.5 1,024 1,322 1,603 1,870 2.6 1.5 357 688 5.9 56.1 66.2 Gambia 26.2 35.7 344 448 597 835 2.6 3.4 155 280 5.4 67.0 67.0 Ghana 43.9 58.3 8,607 11,750 15,271 19,034 3.1 2.2 4,083 4,993 1.8 80.4 69.6 Guinea 32.6 55.3 2,647 4,033 5,990 8,246 4.2 3.2 1,145 1,672 3.4 79.6 72.3 Guinea-Bissau 31.5 54.9 431 724 1,145 1,731 5.2 4.1 210 371 5.2 93.4 93.4 Kenya 35.9 62.7 10,965 16,429 21,533 25,807 4.0 1.8 3,985 7,605 5.9 70.4 70.7 Lesotho 17.6 29.8 314 340 389 464 0.8 1.8 168 337 6.3 49.8 57.0 Liberia 44.9 63.4 1,321 2,104 3,071 4,331 4.7 3.4 632 788 2.0 70.2 55.7 Libyan Arab Jamahiriya 85.2 91.2 4,463 5,580 6,623 7,410 2.2 1.1 1,242 1,674 2.7 35.2 35.2 Madagascar 26.0 40.7 4,152 6,027 9,079 13,624 3.7 4.1 2,562 4,603 5.3 90.9 92.9 Malawi 15.1 32.0 1,716 2,691 4,188 6,342 4.5 4.1 1,033 1,590 3.9 94.6 91.1 Mali 30.2 52.0 3,594 6,037 9,880 15,390 5.2 4.4 1,968 3,361 4.9 94.1 93.2 Mauritania 57.7 81.1 1,527 2,452 3,447 4,445 4.7 2.5 827 1,531 5.6 94.3 94.3 Mauritius1 42.7 55.8 506 586 686 804 1.5 1.6 ... ... ... ... ...Morocco 55.5 72.5 16,144 21,076 26,129 30,824 2.7 1.7 4,457 5,579 2.0 37.4 32.7 Mozambique 32.1 60.0 5,735 9,135 12,683 15,976 4.7 2.3 2,722 5,841 6.9 94.5 94.1 Namibia 30.9 50.9 584 773 988 1,231 2.8 2.2 155 213 2.9 42.3 37.9 Niger 20.6 41.1 2,211 4,047 7,229 12,453 6.0 5.4 1,191 2,277 5.9 96.0 96.2 Nigeria 44.1 65.0 50,603 75,748 104,339 134,398 4.0 2.5 24,096 41,595 5.0 80.0 79.2 Réunion 89.9 96.0 650 771 859 920 1.7 0.7 ... ... ... ... ...Rwanda 13.6 58.5 1,050 2,983 5,606 7,866 10.4 3.4 296 437 3.5 82.2 87.9 Saint Helena2 34.7 50.5 2 2 2 3 0.0 4.1 - - ... ... 2.0 Sao Tome and Principe 37.6 48.7 56 74 99 134 2.8 3.0 - 1 ... ... 2.0 Senegal 47.4 67.1 4,456 6,472 8,801 11,350 3.7 2.5 2,276 3,555 4.1 77.6 76.4 Seychelles 49.7 61.7 39 44 51 58 1.2 1.3 ... ... ... ... ...Sierra Leone 36.7 58.7 1,619 2,570 3,579 4,813 4.6 3.0 1,107 1,642 3.6 90.9 95.8 Somalia 33.3 53.9 2,905 5,057 8,314 13,144 5.5 4.6 1,670 2,482 3.6 96.3 97.1 South Africa 55.5 70.1 24,416 27,094 28,476 29,540 1.0 0.4 8,207 8,376 0.2 46.2 33.2 Sudan 36.1 60.2 11,355 17,321 23,563 30,408 4.2 2.6 5,708 10,107 5.2 86.4 85.7 Swaziland 23.2 36.6 242 272 314 373 1.2 1.7 ... ... ... ... ...Togo 33.4 54.6 1,523 2,272 3,276 4,431 4.0 3.0 796 1,273 4.3 80.9 80.6 Tunisia 62.8 74.4 5,975 7,001 8,156 9,193 1.6 1.2 425 234 (5.4) 9.0 3.7 Uganda 12.0 20.4 2,825 4,336 7,329 13,035 4.3 5.8 1,806 3,241 5.3 93.8 93.0 United Republic of Tanzania 32.3 58.2 11,236 17,787 25,225 33,144 4.6 2.7 5,601 11,031 6.2 99.1 92.1 Western Sahara 92.9 96.3 265 345 423 495 2.6 1.6 - 5 ... - 2.0 Zambia 35.1 50.2 3,660 4,526 5,902 7,638 2.1 2.6 2,284 3,136 2.9 72.0 74.0 Zimbabwe 33.6 51.8 4,253 5,008 5,785 6,620 1.6 1.3 116 157 2.8 4.0 3.4 ASIA 37.1 54.5 1,366,980 1,770,494 2,214,364 2,664,282 2.6 1.8 ... ... ... ... ...Afghanistan 21.9 41.9 4,683 8,484 13,674 20,920 5.9 4.3 2,458 4,945 6.4 98.5 98.5 Armenia 65.0 69.2 2,024 1,908 1,908 1,928 (0.6) 0.1 47 51 0.7 2.0 2.0 Azerbaijan 50.5 59.5 4,123 4,504 5,280 6,235 0.9 1.7 278 301 0.7 7.2 7.2 Bahrain 89.6 92.9 607 753 891 1,018 2.2 1.3 ... ... ... ... ...Bangladesh 23.2 39.3 31,996 45,298 63,224 86,500 3.5 3.1 18,988 30,403 4.3 87.3 84.7 Bhutan 7.7 20.1 159 292 500 810 6.1 4.8 61 70 1.2 70.0 44.1 Brunei Darussalam 73.9 87.0 247 334 415 489 3.0 1.6 ... ... ... ... ...Cambodia 16.9 36.9 2,223 3,792 5,981 8,697 5.3 3.7 870 1,696 6.1 71.7 72.2 China3 35.8 60.5 456,247 616,228 765,597 877,623 3.0 1.4 137,929 178,256 2.3 43.6 37.8 China, Hong Kong SAR4 100.0 100.0 6,807 7,537 8,188 8,781 1.0 0.7 113 139 1.9 2.0 2.0 China, Macao SAR5 98.9 99.2 445 486 526 558 0.9 0.6 7 9 2.3 2.0 2.0 Cyprus 68.8 76.5 539 591 643 687 0.9 0.7 - - - - -Democratic People’s Republic of Korea 60.2 72.8 13,414 14,794 16,507 18,186 1.0 1.0 117 95 (1.9) 1.0 0.7 Georgia 52.7 58.1 2,772 2,476 2,428 2,473 (1.1) 0.2 558 252 (7.2) 18.4 8.5 India 27.7 41.4 281,255 355,205 455,823 586,052 2.3 2.5 131,174 158,418 1.7 60.8 55.5 Indonesia 42.0 67.7 88,863 126,739 160,775 187,846 3.6 1.6 17,964 20,877 1.4 32.2 23.1 Iran (Islamic Republic of) 64.4 79.7 42,799 53,784 66,011 75,253 2.3 1.3 17,094 20,406 1.6 51.9 44.2 Iraq 67.9 71.3 15,759 20,134 25,714 32,344 2.4 2.3 6,825 9,026 2.5 56.7 56.7
189Data tables

TABLE B.1continued
Level of urbanization Urban population Urban slum dwellers(%)
Estimates and projections Rate of change Estimated number Rate of change Percentage of urban(000) (%) (000) (%)
2000 2030 2000 2010 2020 2030 2000– 2020– 1990 2001 1990– 1990 2001 2010 2030 2001
Israel 91.5 93.6 5,527 6,687 7,600 8,392 1.9 1.0 81 113 3.0 2.0 2.0 Japan 65.2 73.1 82,794 85,150 86,977 88,482 0.3 0.2 6,117 6,430 0.5 6.4 6.4 Jordan 78.7 84.6 3,963 5,117 6,216 7,311 2.6 1.6 388 623 4.3 16.5 15.7 Kazakhstan 55.8 65.7 8,733 8,580 9,297 10,018 (0.2) 0.7 2,835 2,664 (0.6) 29.7 29.7 Kuwait 96.0 97.5 2,157 2,942 3,542 4,091 3.1 1.4 60 56 (0.6) 3.0 3.0 Kyrgyzstan 34.4 44.6 1,692 1,914 2,349 2,993 1.2 2.4 858 885 0.3 51.8 51.8 Lao People’s Democratic Republic 19.3 38.2 1,018 1,603 2,451 3,549 4.5 3.7 422 705 4.7 66.1 66.1 Lebanon 86.6 92.0 3,013 3,566 3,991 4,317 1.7 0.8 1,142 1,602 3.1 50.0 50.0 Malaysia 61.8 77.6 14,212 18,768 23,218 27,324 2.8 1.6 177 262 3.6 2.0 2.0 Maldives 27.5 45.9 80 126 194 282 4.5 3.7 - - - - -Mongolia 56.6 66.9 1,415 1,658 1,988 2,336 1.6 1.6 886 940 0.5 68.5 64.9 Myanmar 28.0 49.1 13,290 18,147 23,921 30,086 3.1 2.3 3,105 3,596 1.3 31.1 26.4 Nepal 13.7 29.4 3,220 5,253 8,082 11,976 4.9 3.9 1,574 2,656 4.8 96.9 92.4 Occupied Palestinian Territory 70.0 80.5 2,233 3,324 4,686 6,246 4.0 2.9 ... ... ... ... ...Oman 76.0 86.3 1,982 2,796 3,658 4,509 3.4 2.1 671 1,214 5.4 60.5 60.5 Pakistan 33.1 49.8 47,220 67,140 96,952 135,347 3.5 3.3 26,416 35,627 2.7 78.7 73.6 Philippines 58.5 76.1 44,327 59,294 73,763 86,615 2.9 1.6 16,346 20,183 1.9 54.9 44.1 Qatar 91.5 94.8 532 623 708 778 1.6 0.9 8 11 2.9 2.0 2.0 Republic of Korea 79.6 86.2 37,291 40,200 42,070 43,120 0.8 0.2 11,728 14,385 1.9 37.0 37.0 Saudi Arabia 86.2 92.9 19,083 26,282 33,265 40,124 3.2 1.9 2,385 3,609 3.8 19.8 19.8 Singapore 100.0 100.0 4,016 4,574 4,812 4,934 1.3 0.3 - - - - -Sri Lanka 21.1 29.9 3,927 4,309 5,118 6,481 0.9 2.4 899 597 (3.7) 24.8 13.6 Syrian Arab Republic 50.1 59.8 8,289 10,640 13,627 17,188 2.5 2.3 629 892 3.2 10.4 10.4 Tajikistan 25.8 32.6 1,568 1,602 2,032 2,787 0.2 3.2 942 951 0.1 56.0 56.0 Thailand 31.1 47.0 18,974 22,994 28,569 35,420 1.9 2.1 1,998 ... ... 19.5 ...Timor-Leste 7.5 15.2 52 82 127 189 4.6 4.0 1 7 16.4 2.0 12.0 Turkey 64.7 77.7 44,206 54,308 63,395 71,415 2.1 1.2 14,633 19,080 2.4 42.6 42.6 Turkmenistan 44.8 59.6 2,080 2,571 3,308 4,071 2.1 2.1 ... ... ... ... ...United Arab Emirates 84.6 89.6 2,386 2,904 3,332 3,633 2.0 0.9 ... ... ... ... ...Uzbekistan 37.3 44.6 9,282 10,462 12,502 15,632 1.2 2.2 4,170 4,689 1.1 50.7 50.7 Viet Nam 24.3 43.2 19,006 26,221 35,809 46,863 3.2 2.7 8,100 9,197 1.2 60.5 47.4 Yemen 24.7 42.2 4,452 7,321 12,718 21,370 5.0 5.2 1,787 3,110 5.0 67.5 65.1 EUROPE 72.7 79.6 529,058 533,808 540,068 545,369 0.1 0.1 ... ... ... ... ...Albania 42.0 60.7 1,306 1,603 1,929 2,233 2.0 1.5 ... ... ... ... ...Andorra 92.4 92.1 61 77 96 116 2.3 1.9 ... ... ... ... ...Austria 65.8 72.3 5,331 5,363 5,497 5,723 0.1 0.4 ... ... ... ... ...Belarus 69.8 80.2 7,003 7,057 7,082 6,959 0.1 (0.2) ... ... ... ... ...Belgium 97.1 97.9 9,955 10,158 10,257 10,295 0.2 - ... ... ... ... ...Bosnia and Herzegovina 43.0 61.0 1,708 2,051 2,315 2,495 1.8 0.7 ... ... ... ... ...Bulgaria 68.8 79.0 5,569 5,390 5,208 5,004 (0.3) (0.4) ... ... ... ... ...Channel Islands 30.5 30.5 44 44 43 43 - - ... ... ... ... ...Croatia 57.7 72.1 2,566 2,704 2,815 2,877 0.5 0.2 ... ... ... ... ...Czech Republic 74.1 77.4 7,607 7,634 7,597 7,439 - (0.2) ... ... ... ... ...Denmark 85.1 89.0 4,529 4,672 4,774 4,866 0.3 0.2 ... ... ... ... ...Estonia 69.4 76.6 949 861 794 722 (1.0) (1.0) ... ... ... ... ...Faeroe Islands 37.8 52.6 17 20 24 28 1.6 1.5 ... ... ... ... ...Finland 61.1 67.9 3,164 3,218 3,362 3,565 0.2 0.6 ... ... ... ... ...France 75.7 83.0 44,897 48,135 51,062 53,581 0.7 0.5 ... ... ... ... ...Germany 87.5 91.9 72,036 73,729 74,621 74,907 0.2 0.0 ... ... ... ... ...Gibraltar 100.0 100.0 27 27 27 26 0.0 (0.4) ... ... ... ... ...Greece 60.1 72.4 6,552 6,937 7,339 7,646 0.6 0.4 ... ... ... ... ...Holy See6 100.0 100.0 1 1 1 1 - - - - - - -Hungary 64.0 75.9 6,406 6,496 6,551 6,559 0.1 0.0 ... ... ... ... ...Iceland 92.4 95.1 261 283 301 314 0.8 0.4 ... ... ... ... ...Ireland 59.1 70.1 2,259 2,612 2,985 3,339 1.5 1.1 ... ... ... ... ...Isle of Man 51.8 51.8 38 40 41 41 0.5 0.0 ... ... ... ... ...Italy 67.2 74.3 38,677 38,570 38,315 38,278 0.0 0.0 ... ... ... ... ...Latvia 66.8 72.0 1,586 1,420 1,330 1,260 (1.1) (0.5) ... ... ... ... ...Liechtenstein 21.4 32.0 7 8 10 12 1.3 1.8 ... ... ... ... ...Lithuania 67.0 72.4 2,344 2,212 2,151 2,126 (0.6) (0.1) ... ... ... ... ...Luxembourg 91.0 95.3 396 461 521 581 1.5 1.1 ... ... ... ... ...Malta 90.9 95.0 354 376 392 396 0.6 0.1 ... ... ... ... ...Monaco 100.0 100.0 33 36 39 41 0.9 0.5 ... ... ... ... ...Netherlands 64.3 77.2 10,230 11,470 12,467 13,305 1.1 0.7 ... ... ... ... ...Norway 75.8 90.1 3,392 3,901 4,223 4,428 1.4 0.5 ... ... ... ... ...Poland 61.7 69.9 23,846 24,103 24,840 25,649 0.1 0.3 ... ... ... ... ...Portugal 53.0 68.7 5,312 5,875 6,315 6,674 1.0 0.6 ... ... ... ... ...Republic of Moldova 45.8 59.5 1,961 2,019 2,216 2,387 0.3 0.7 ... ... ... ... ...Romania 54.6 59.0 12,274 12,206 12,178 11,997 (0.1) (0.1) ... ... ... ... ...Russian Federation 73.3 78.3 106,758 101,218 97,201 93,736 (0.5) (0.4) ... ... ... ... ...San Marino 88.9 91.1 24 26 28 30 0.8 0.7 ... ... ... ... ...Serbia and Montenegro 51.6 63.7 5,444 5,634 6,003 6,432 0.3 0.7 ... ... ... ... ...Slovakia 56.8 64.9 3,062 3,228 3,377 3,470 0.5 0.3 ... ... ... ... ...Slovenia 50.8 59.8 1,011 1,007 1,033 1,085 0.0 0.5 ... ... ... ... ...Spain 76.3 81.7 31,078 31,910 32,315 32,657 0.3 0.1 ... ... ... ... ...Sweden 83.3 86.7 7,377 7,488 7,668 7,831 0.1 0.2 ... ... ... ... ...Switzerland 67.6 73.6 4,849 4,816 4,835 4,896 (0.1) 0.1 ... ... ... ... ...TFYR Macedonia7 59.4 68.9 1,202 1,284 1,398 1,520 0.7 0.8 ... ... ... ... ...Ukraine 67.1 73.9 33,363 31,274 29,935 28,777 (0.6) (0.4) ... ... ... ... ...United Kingdom 88.9 92.0 52,189 54,151 56,559 59,024 0.4 0.4 ... ... ... ... ...
190 Statistical annex
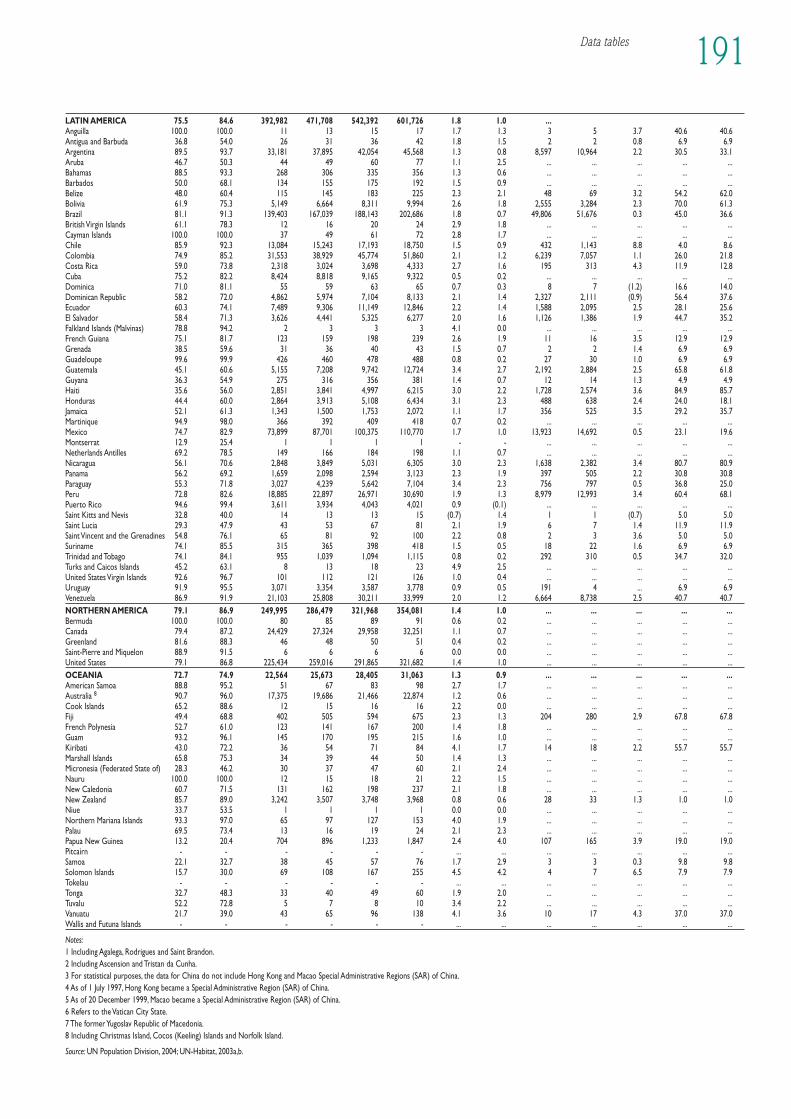
LATIN AMERICA 75.5 84.6 392,982 471,708 542,392 601,726 1.8 1.0 ...Anguilla 100.0 100.0 11 13 15 17 1.7 1.3 3 5 3.7 40.6 40.6 Antigua and Barbuda 36.8 54.0 26 31 36 42 1.8 1.5 2 2 0.8 6.9 6.9 Argentina 89.5 93.7 33,181 37,895 42,054 45,568 1.3 0.8 8,597 10,964 2.2 30.5 33.1 Aruba 46.7 50.3 44 49 60 77 1.1 2.5 ... ... ... ... ...Bahamas 88.5 93.3 268 306 335 356 1.3 0.6 ... ... ... ... ...Barbados 50.0 68.1 134 155 175 192 1.5 0.9 ... ... ... ... ...Belize 48.0 60.4 115 145 183 225 2.3 2.1 48 69 3.2 54.2 62.0 Bolivia 61.9 75.3 5,149 6,664 8,311 9,994 2.6 1.8 2,555 3,284 2.3 70.0 61.3 Brazil 81.1 91.3 139,403 167,039 188,143 202,686 1.8 0.7 49,806 51,676 0.3 45.0 36.6 British Virgin Islands 61.1 78.3 12 16 20 24 2.9 1.8 ... ... ... ... ...Cayman Islands 100.0 100.0 37 49 61 72 2.8 1.7 ... ... ... ... ...Chile 85.9 92.3 13,084 15,243 17,193 18,750 1.5 0.9 432 1,143 8.8 4.0 8.6 Colombia 74.9 85.2 31,553 38,929 45,774 51,860 2.1 1.2 6,239 7,057 1.1 26.0 21.8 Costa Rica 59.0 73.8 2,318 3,024 3,698 4,333 2.7 1.6 195 313 4.3 11.9 12.8 Cuba 75.2 82.2 8,424 8,818 9,165 9,322 0.5 0.2 ... ... ... ... ...Dominica 71.0 81.1 55 59 63 65 0.7 0.3 8 7 (1.2) 16.6 14.0 Dominican Republic 58.2 72.0 4,862 5,974 7,104 8,133 2.1 1.4 2,327 2,111 (0.9) 56.4 37.6 Ecuador 60.3 74.1 7,489 9,306 11,149 12,846 2.2 1.4 1,588 2,095 2.5 28.1 25.6 El Salvador 58.4 71.3 3,626 4,441 5,325 6,277 2.0 1.6 1,126 1,386 1.9 44.7 35.2 Falkland Islands (Malvinas) 78.8 94.2 2 3 3 3 4.1 0.0 ... ... ... ... ...French Guiana 75.1 81.7 123 159 198 239 2.6 1.9 11 16 3.5 12.9 12.9 Grenada 38.5 59.6 31 36 40 43 1.5 0.7 2 2 1.4 6.9 6.9 Guadeloupe 99.6 99.9 426 460 478 488 0.8 0.2 27 30 1.0 6.9 6.9 Guatemala 45.1 60.6 5,155 7,208 9,742 12,724 3.4 2.7 2,192 2,884 2.5 65.8 61.8 Guyana 36.3 54.9 275 316 356 381 1.4 0.7 12 14 1.3 4.9 4.9 Haiti 35.6 56.0 2,851 3,841 4,997 6,215 3.0 2.2 1,728 2,574 3.6 84.9 85.7 Honduras 44.4 60.0 2,864 3,913 5,108 6,434 3.1 2.3 488 638 2.4 24.0 18.1 Jamaica 52.1 61.3 1,343 1,500 1,753 2,072 1.1 1.7 356 525 3.5 29.2 35.7 Martinique 94.9 98.0 366 392 409 418 0.7 0.2 ... ... ... ... ...Mexico 74.7 82.9 73,899 87,701 100,375 110,770 1.7 1.0 13,923 14,692 0.5 23.1 19.6 Montserrat 12.9 25.4 1 1 1 1 - - ... ... ... ... ...Netherlands Antilles 69.2 78.5 149 166 184 198 1.1 0.7 ... ... ... ... ...Nicaragua 56.1 70.6 2,848 3,849 5,031 6,305 3.0 2.3 1,638 2,382 3.4 80.7 80.9 Panama 56.2 69.2 1,659 2,098 2,594 3,123 2.3 1.9 397 505 2.2 30.8 30.8 Paraguay 55.3 71.8 3,027 4,239 5,642 7,104 3.4 2.3 756 797 0.5 36.8 25.0 Peru 72.8 82.6 18,885 22,897 26,971 30,690 1.9 1.3 8,979 12,993 3.4 60.4 68.1 Puerto Rico 94.6 99.4 3,611 3,934 4,043 4,021 0.9 (0.1) ... ... ... ... ...Saint Kitts and Nevis 32.8 40.0 14 13 13 15 (0.7) 1.4 1 1 (0.7) 5.0 5.0 Saint Lucia 29.3 47.9 43 53 67 81 2.1 1.9 6 7 1.4 11.9 11.9 Saint Vincent and the Grenadines 54.8 76.1 65 81 92 100 2.2 0.8 2 3 3.6 5.0 5.0 Suriname 74.1 85.5 315 365 398 418 1.5 0.5 18 22 1.6 6.9 6.9 Trinidad and Tobago 74.1 84.1 955 1,039 1,094 1,115 0.8 0.2 292 310 0.5 34.7 32.0 Turks and Caicos Islands 45.2 63.1 8 13 18 23 4.9 2.5 ... ... ... ... ...United States Virgin Islands 92.6 96.7 101 112 121 126 1.0 0.4 ... ... ... ... ...Uruguay 91.9 95.5 3,071 3,354 3,587 3,778 0.9 0.5 191 4 ... 6.9 6.9 Venezuela 86.9 91.9 21,103 25,808 30,211 33,999 2.0 1.2 6,664 8,738 2.5 40.7 40.7 NORTHERN AMERICA 79.1 86.9 249,995 286,479 321,968 354,081 1.4 1.0 ... ... ... ... ...Bermuda 100.0 100.0 80 85 89 91 0.6 0.2 ... ... ... ... ...Canada 79.4 87.2 24,429 27,324 29,958 32,251 1.1 0.7 ... ... ... ... ...Greenland 81.6 88.3 46 48 50 51 0.4 0.2 ... ... ... ... ...Saint-Pierre and Miquelon 88.9 91.5 6 6 6 6 0.0 0.0 ... ... ... ... ...United States 79.1 86.8 225,434 259,016 291,865 321,682 1.4 1.0 ... ... ... ... ...OCEANIA 72.7 74.9 22,564 25,673 28,405 31,063 1.3 0.9 ... ... ... ... ...American Samoa 88.8 95.2 51 67 83 98 2.7 1.7 ... ... ... ... ...Australia 8 90.7 96.0 17,375 19,686 21,466 22,874 1.2 0.6 ... ... ... ... ...Cook Islands 65.2 88.6 12 15 16 16 2.2 0.0 ... ... ... ... ...Fiji 49.4 68.8 402 505 594 675 2.3 1.3 204 280 2.9 67.8 67.8 French Polynesia 52.7 61.0 123 141 167 200 1.4 1.8 ... ... ... ... ...Guam 93.2 96.1 145 170 195 215 1.6 1.0 ... ... ... ... ...Kiribati 43.0 72.2 36 54 71 84 4.1 1.7 14 18 2.2 55.7 55.7 Marshall Islands 65.8 75.3 34 39 44 50 1.4 1.3 ... ... ... ... ...Micronesia (Federated State of) 28.3 46.2 30 37 47 60 2.1 2.4 ... ... ... ... ...Nauru 100.0 100.0 12 15 18 21 2.2 1.5 ... ... ... ... ...New Caledonia 60.7 71.5 131 162 198 237 2.1 1.8 ... ... ... ... ...New Zealand 85.7 89.0 3,242 3,507 3,748 3,968 0.8 0.6 28 33 1.3 1.0 1.0 Niue 33.7 53.5 1 1 1 1 0.0 0.0 ... ... ... ... ...Northern Mariana Islands 93.3 97.0 65 97 127 153 4.0 1.9 ... ... ... ... ...Palau 69.5 73.4 13 16 19 24 2.1 2.3 ... ... ... ... ...Papua New Guinea 13.2 20.4 704 896 1,233 1,847 2.4 4.0 107 165 3.9 19.0 19.0 Pitcairn - - - - - - ... ... ... ... ... ... ...Samoa 22.1 32.7 38 45 57 76 1.7 2.9 3 3 0.3 9.8 9.8 Solomon Islands 15.7 30.0 69 108 167 255 4.5 4.2 4 7 6.5 7.9 7.9 Tokelau - - - - - - ... ... ... ... ... ... ...Tonga 32.7 48.3 33 40 49 60 1.9 2.0 ... ... ... ... ...Tuvalu 52.2 72.8 5 7 8 10 3.4 2.2 ... ... ... ... ...Vanuatu 21.7 39.0 43 65 96 138 4.1 3.6 10 17 4.3 37.0 37.0 Wallis and Futuna Islands - - - - - - ... ... ... ... ... ... ...
Notes:1 Including Agalega, Rodrigues and Saint Brandon.2 Including Ascension and Tristan da Cunha.3 For statistical purposes, the data for China do not include Hong Kong and Macao Special Administrative Regions (SAR) of China.4 As of 1 July 1997, Hong Kong became a Special Administrative Region (SAR) of China.5 As of 20 December 1999, Macao became a Special Administrative Region (SAR) of China.6 Refers to the Vatican City State.7 The former Yugoslav Republic of Macedonia.8 Including Christmas Island, Cocos (Keeling) Islands and Norfolk Island.
Source: UN Population Division, 2004; UN-Habitat, 2003a,b.
191Data tables
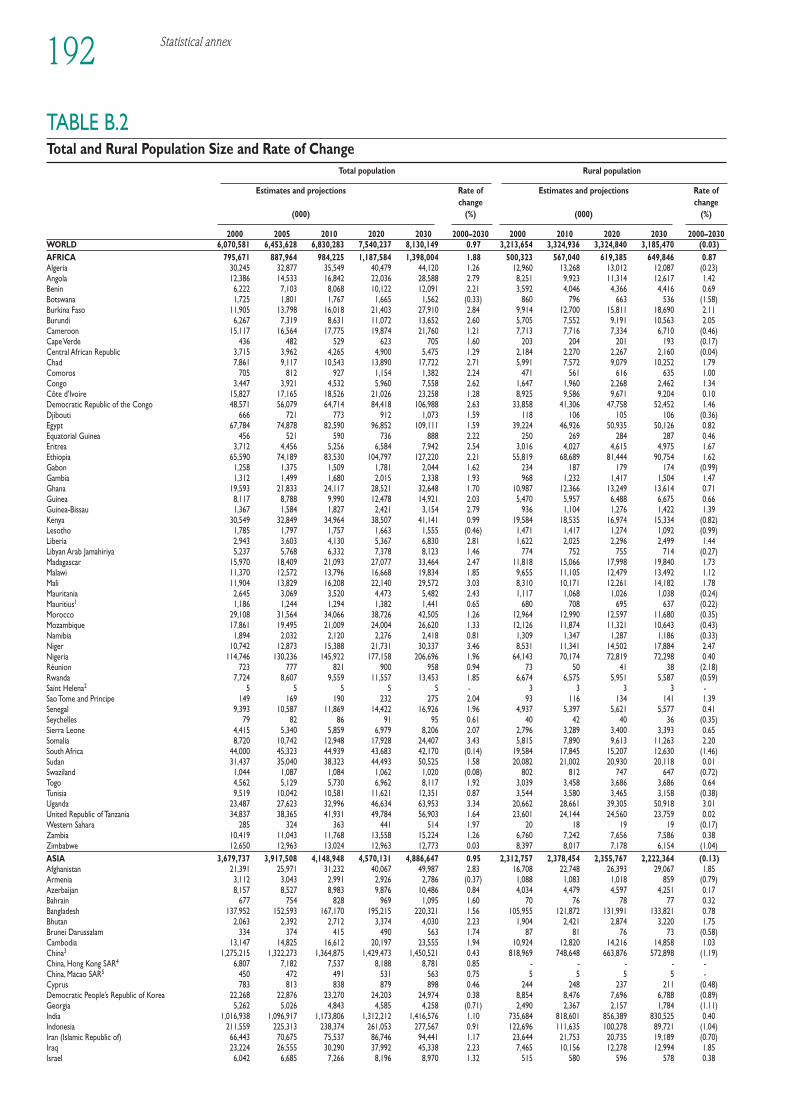
TABLE B.2Total and Rural Population Size and Rate of Change
Total population Rural population
Estimates and projections Rate of Estimates and projections Rate ofchange change
(000) (%) (000) (%)
2000 2005 2010 2020 2030 2000–2030 2000 2010 2020 2030 2000–2030WORLD 6,070,581 6,453,628 6,830,283 7,540,237 8,130,149 0.97 3,213,654 3,324,936 3,324,840 3,185,470 (0.03)AFRICA 795,671 887,964 984,225 1,187,584 1,398,004 1.88 500,323 567,040 619,385 649,846 0.87 Algeria 30,245 32,877 35,549 40,479 44,120 1.26 12,960 13,268 13,012 12,087 (0.23)Angola 12,386 14,533 16,842 22,036 28,588 2.79 8,251 9,923 11,314 12,617 1.42 Benin 6,222 7,103 8,068 10,122 12,091 2.21 3,592 4,046 4,366 4,416 0.69 Botswana 1,725 1,801 1,767 1,665 1,562 (0.33) 860 796 663 536 (1.58)Burkina Faso 11,905 13,798 16,018 21,403 27,910 2.84 9,914 12,700 15,811 18,690 2.11 Burundi 6,267 7,319 8,631 11,072 13,652 2.60 5,705 7,552 9,191 10,563 2.05 Cameroon 15,117 16,564 17,775 19,874 21,760 1.21 7,713 7,716 7,334 6,710 (0.46)Cape Verde 436 482 529 623 705 1.60 203 204 201 193 (0.17)Central African Republic 3,715 3,962 4,265 4,900 5,475 1.29 2,184 2,270 2,267 2,160 (0.04)Chad 7,861 9,117 10,543 13,890 17,722 2.71 5,991 7,572 9,079 10,252 1.79 Comoros 705 812 927 1,154 1,382 2.24 471 561 616 635 1.00 Congo 3,447 3,921 4,532 5,960 7,558 2.62 1,647 1,960 2,268 2,462 1.34 Côte d’Ivoire 15,827 17,165 18,526 21,026 23,258 1.28 8,925 9,586 9,671 9,204 0.10 Democratic Republic of the Congo 48,571 56,079 64,714 84,418 106,988 2.63 33,858 41,306 47,758 52,452 1.46 Djibouti 666 721 773 912 1,073 1.59 118 106 105 106 (0.36)Egypt 67,784 74,878 82,590 96,852 109,111 1.59 39,224 46,926 50,935 50,126 0.82 Equatorial Guinea 456 521 590 736 888 2.22 250 269 284 287 0.46 Eritrea 3,712 4,456 5,256 6,584 7,942 2.54 3,016 4,027 4,615 4,975 1.67 Ethiopia 65,590 74,189 83,530 104,797 127,220 2.21 55,819 68,689 81,444 90,754 1.62 Gabon 1,258 1,375 1,509 1,781 2,044 1.62 234 187 179 174 (0.99)Gambia 1,312 1,499 1,680 2,015 2,338 1.93 968 1,232 1,417 1,504 1.47 Ghana 19,593 21,833 24,117 28,521 32,648 1.70 10,987 12,366 13,249 13,614 0.71 Guinea 8,117 8,788 9,990 12,478 14,921 2.03 5,470 5,957 6,488 6,675 0.66 Guinea-Bissau 1,367 1,584 1,827 2,421 3,154 2.79 936 1,104 1,276 1,422 1.39 Kenya 30,549 32,849 34,964 38,507 41,141 0.99 19,584 18,535 16,974 15,334 (0.82)Lesotho 1,785 1,797 1,757 1,663 1,555 (0.46) 1,471 1,417 1,274 1,092 (0.99)Liberia 2,943 3,603 4,130 5,367 6,830 2.81 1,622 2,025 2,296 2,499 1.44 Libyan Arab Jamahiriya 5,237 5,768 6,332 7,378 8,123 1.46 774 752 755 714 (0.27)Madagascar 15,970 18,409 21,093 27,077 33,464 2.47 11,818 15,066 17,998 19,840 1.73 Malawi 11,370 12,572 13,796 16,668 19,834 1.85 9,655 11,105 12,479 13,492 1.12 Mali 11,904 13,829 16,208 22,140 29,572 3.03 8,310 10,171 12,261 14,182 1.78 Mauritania 2,645 3,069 3,520 4,473 5,482 2.43 1,117 1,068 1,026 1,038 (0.24)Mauritius1 1,186 1,244 1,294 1,382 1,441 0.65 680 708 695 637 (0.22)Morocco 29,108 31,564 34,066 38,726 42,505 1.26 12,964 12,990 12,597 11,680 (0.35)Mozambique 17,861 19,495 21,009 24,004 26,620 1.33 12,126 11,874 11,321 10,643 (0.43)Namibia 1,894 2,032 2,120 2,276 2,418 0.81 1,309 1,347 1,287 1,186 (0.33)Niger 10,742 12,873 15,388 21,731 30,337 3.46 8,531 11,341 14,502 17,884 2.47 Nigeria 114,746 130,236 145,922 177,158 206,696 1.96 64,143 70,174 72,819 72,298 0.40 Réunion 723 777 821 900 958 0.94 73 50 41 38 (2.18)Rwanda 7,724 8,607 9,559 11,557 13,453 1.85 6,674 6,575 5,951 5,587 (0.59)Saint Helena2 5 5 5 5 5 - 3 3 3 3 -Sao Tome and Principe 149 169 190 232 275 2.04 93 116 134 141 1.39 Senegal 9,393 10,587 11,869 14,422 16,926 1.96 4,937 5,397 5,621 5,577 0.41 Seychelles 79 82 86 91 95 0.61 40 42 40 36 (0.35)Sierra Leone 4,415 5,340 5,859 6,979 8,206 2.07 2,796 3,289 3,400 3,393 0.65 Somalia 8,720 10,742 12,948 17,928 24,407 3.43 5,815 7,890 9,613 11,263 2.20 South Africa 44,000 45,323 44,939 43,683 42,170 (0.14) 19,584 17,845 15,207 12,630 (1.46)Sudan 31,437 35,040 38,323 44,493 50,525 1.58 20,082 21,002 20,930 20,118 0.01 Swaziland 1,044 1,087 1,084 1,062 1,020 (0.08) 802 812 747 647 (0.72)Togo 4,562 5,129 5,730 6,962 8,117 1.92 3,039 3,458 3,686 3,686 0.64 Tunisia 9,519 10,042 10,581 11,621 12,351 0.87 3,544 3,580 3,465 3,158 (0.38)Uganda 23,487 27,623 32,996 46,634 63,953 3.34 20,662 28,661 39,305 50,918 3.01 United Republic of Tanzania 34,837 38,365 41,931 49,784 56,903 1.64 23,601 24,144 24,560 23,759 0.02 Western Sahara 285 324 363 441 514 1.97 20 18 19 19 (0.17)Zambia 10,419 11,043 11,768 13,558 15,224 1.26 6,760 7,242 7,656 7,586 0.38 Zimbabwe 12,650 12,963 13,024 12,963 12,773 0.03 8,397 8,017 7,178 6,154 (1.04)ASIA 3,679,737 3,917,508 4,148,948 4,570,131 4,886,647 0.95 2,312,757 2,378,454 2,355,767 2,222,364 (0.13)Afghanistan 21,391 25,971 31,232 40,067 49,987 2.83 16,708 22,748 26,393 29,067 1.85 Armenia 3,112 3,043 2,991 2,926 2,786 (0.37) 1,088 1,083 1,018 859 (0.79)Azerbaijan 8,157 8,527 8,983 9,876 10,486 0.84 4,034 4,479 4,597 4,251 0.17 Bahrain 677 754 828 969 1,095 1.60 70 76 78 77 0.32 Bangladesh 137,952 152,593 167,170 195,215 220,321 1.56 105,955 121,872 131,991 133,821 0.78 Bhutan 2,063 2,392 2,712 3,374 4,030 2.23 1,904 2,421 2,874 3,220 1.75 Brunei Darussalam 334 374 415 490 563 1.74 87 81 76 73 (0.58)Cambodia 13,147 14,825 16,612 20,197 23,555 1.94 10,924 12,820 14,216 14,858 1.03 China3 1,275,215 1,322,273 1,364,875 1,429,473 1,450,521 0.43 818,969 748,648 663,876 572,898 (1.19)China, Hong Kong SAR4 6,807 7,182 7,537 8,188 8,781 0.85 - - - - -China, Macao SAR5 450 472 491 531 563 0.75 5 5 5 5 -Cyprus 783 813 838 879 898 0.46 244 248 237 211 (0.48)Democratic People’s Republic of Korea 22,268 22,876 23,270 24,203 24,974 0.38 8,854 8,476 7,696 6,788 (0.89)Georgia 5,262 5,026 4,843 4,585 4,258 (0.71) 2,490 2,367 2,157 1,784 (1.11)India 1,016,938 1,096,917 1,173,806 1,312,212 1,416,576 1.10 735,684 818,601 856,389 830,525 0.40 Indonesia 211,559 225,313 238,374 261,053 277,567 0.91 122,696 111,635 100,278 89,721 (1.04)Iran (Islamic Republic of) 66,443 70,675 75,537 86,746 94,441 1.17 23,644 21,753 20,735 19,189 (0.70)Iraq 23,224 26,555 30,290 37,992 45,338 2.23 7,465 10,156 12,278 12,994 1.85 Israel 6,042 6,685 7,266 8,196 8,970 1.32 515 580 596 578 0.38
192 Statistical annex
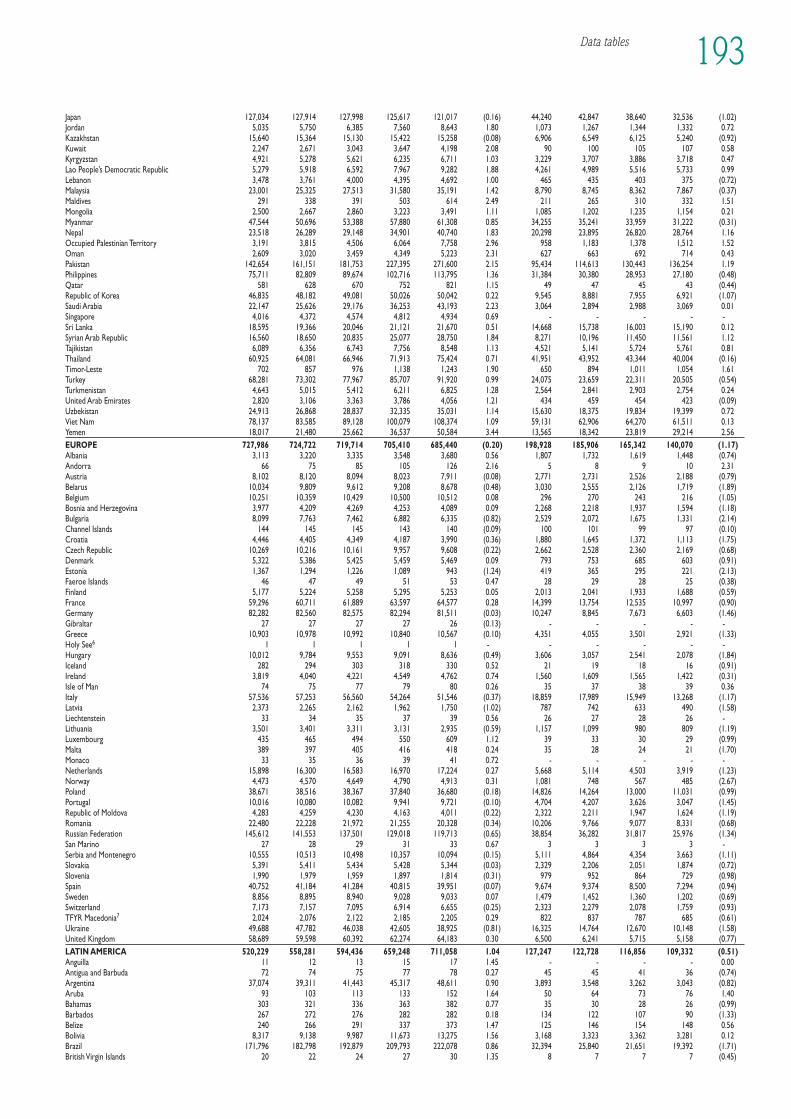
Japan 127,034 127,914 127,998 125,617 121,017 (0.16) 44,240 42,847 38,640 32,536 (1.02)Jordan 5,035 5,750 6,385 7,560 8,643 1.80 1,073 1,267 1,344 1,332 0.72 Kazakhstan 15,640 15,364 15,130 15,422 15,258 (0.08) 6,906 6,549 6,125 5,240 (0.92)Kuwait 2,247 2,671 3,043 3,647 4,198 2.08 90 100 105 107 0.58 Kyrgyzstan 4,921 5,278 5,621 6,235 6,711 1.03 3,229 3,707 3,886 3,718 0.47 Lao People’s Democratic Republic 5,279 5,918 6,592 7,967 9,282 1.88 4,261 4,989 5,516 5,733 0.99 Lebanon 3,478 3,761 4,000 4,395 4,692 1.00 465 435 403 375 (0.72)Malaysia 23,001 25,325 27,513 31,580 35,191 1.42 8,790 8,745 8,362 7,867 (0.37)Maldives 291 338 391 503 614 2.49 211 265 310 332 1.51 Mongolia 2,500 2,667 2,860 3,223 3,491 1.11 1,085 1,202 1,235 1,154 0.21 Myanmar 47,544 50,696 53,388 57,880 61,308 0.85 34,255 35,241 33,959 31,222 (0.31)Nepal 23,518 26,289 29,148 34,901 40,740 1.83 20,298 23,895 26,820 28,764 1.16 Occupied Palestinian Territory 3,191 3,815 4,506 6,064 7,758 2.96 958 1,183 1,378 1,512 1.52 Oman 2,609 3,020 3,459 4,349 5,223 2.31 627 663 692 714 0.43 Pakistan 142,654 161,151 181,753 227,395 271,600 2.15 95,434 114,613 130,443 136,254 1.19 Philippines 75,711 82,809 89,674 102,716 113,795 1.36 31,384 30,380 28,953 27,180 (0.48)Qatar 581 628 670 752 821 1.15 49 47 45 43 (0.44)Republic of Korea 46,835 48,182 49,081 50,026 50,042 0.22 9,545 8,881 7,955 6,921 (1.07)Saudi Arabia 22,147 25,626 29,176 36,253 43,193 2.23 3,064 2,894 2,988 3,069 0.01 Singapore 4,016 4,372 4,574 4,812 4,934 0.69 - - - - -Sri Lanka 18,595 19,366 20,046 21,121 21,670 0.51 14,668 15,738 16,003 15,190 0.12 Syrian Arab Republic 16,560 18,650 20,835 25,077 28,750 1.84 8,271 10,196 11,450 11,561 1.12 Tajikistan 6,089 6,356 6,743 7,756 8,548 1.13 4,521 5,141 5,724 5,761 0.81 Thailand 60,925 64,081 66,946 71,913 75,424 0.71 41,951 43,952 43,344 40,004 (0.16)Timor-Leste 702 857 976 1,138 1,243 1.90 650 894 1,011 1,054 1.61 Turkey 68,281 73,302 77,967 85,707 91,920 0.99 24,075 23,659 22,311 20,505 (0.54)Turkmenistan 4,643 5,015 5,412 6,211 6,825 1.28 2,564 2,841 2,903 2,754 0.24 United Arab Emirates 2,820 3,106 3,363 3,786 4,056 1.21 434 459 454 423 (0.09)Uzbekistan 24,913 26,868 28,837 32,335 35,031 1.14 15,630 18,375 19,834 19,399 0.72 Viet Nam 78,137 83,585 89,128 100,079 108,374 1.09 59,131 62,906 64,270 61,511 0.13 Yemen 18,017 21,480 25,662 36,537 50,584 3.44 13,565 18,342 23,819 29,214 2.56 EUROPE 727,986 724,722 719,714 705,410 685,440 (0.20) 198,928 185,906 165,342 140,070 (1.17)Albania 3,113 3,220 3,335 3,548 3,680 0.56 1,807 1,732 1,619 1,448 (0.74)Andorra 66 75 85 105 126 2.16 5 8 9 10 2.31 Austria 8,102 8,120 8,094 8,023 7,911 (0.08) 2,771 2,731 2,526 2,188 (0.79)Belarus 10,034 9,809 9,612 9,208 8,678 (0.48) 3,030 2,555 2,126 1,719 (1.89)Belgium 10,251 10,359 10,429 10,500 10,512 0.08 296 270 243 216 (1.05)Bosnia and Herzegovina 3,977 4,209 4,269 4,253 4,089 0.09 2,268 2,218 1,937 1,594 (1.18)Bulgaria 8,099 7,763 7,462 6,882 6,335 (0.82) 2,529 2,072 1,675 1,331 (2.14)Channel Islands 144 145 145 143 140 (0.09) 100 101 99 97 (0.10)Croatia 4,446 4,405 4,349 4,187 3,990 (0.36) 1,880 1,645 1,372 1,113 (1.75)Czech Republic 10,269 10,216 10,161 9,957 9,608 (0.22) 2,662 2,528 2,360 2,169 (0.68)Denmark 5,322 5,386 5,425 5,459 5,469 0.09 793 753 685 603 (0.91)Estonia 1,367 1,294 1,226 1,089 943 (1.24) 419 365 295 221 (2.13)Faeroe Islands 46 47 49 51 53 0.47 28 29 28 25 (0.38)Finland 5,177 5,224 5,258 5,295 5,253 0.05 2,013 2,041 1,933 1,688 (0.59)France 59,296 60,711 61,889 63,597 64,577 0.28 14,399 13,754 12,535 10,997 (0.90)Germany 82,282 82,560 82,575 82,294 81,511 (0.03) 10,247 8,845 7,673 6,603 (1.46)Gibraltar 27 27 27 27 26 (0.13) - - - - -Greece 10,903 10,978 10,992 10,840 10,567 (0.10) 4,351 4,055 3,501 2,921 (1.33)Holy See6 1 1 1 1 1 - - - - - -Hungary 10,012 9,784 9,553 9,091 8,636 (0.49) 3,606 3,057 2,541 2,078 (1.84)Iceland 282 294 303 318 330 0.52 21 19 18 16 (0.91)Ireland 3,819 4,040 4,221 4,549 4,762 0.74 1,560 1,609 1,565 1,422 (0.31)Isle of Man 74 75 77 79 80 0.26 35 37 38 39 0.36 Italy 57,536 57,253 56,560 54,264 51,546 (0.37) 18,859 17,989 15,949 13,268 (1.17)Latvia 2,373 2,265 2,162 1,962 1,750 (1.02) 787 742 633 490 (1.58)Liechtenstein 33 34 35 37 39 0.56 26 27 28 26 -Lithuania 3,501 3,401 3,311 3,131 2,935 (0.59) 1,157 1,099 980 809 (1.19)Luxembourg 435 465 494 550 609 1.12 39 33 30 29 (0.99)Malta 389 397 405 416 418 0.24 35 28 24 21 (1.70)Monaco 33 35 36 39 41 0.72 - - - - -Netherlands 15,898 16,300 16,583 16,970 17,224 0.27 5,668 5,114 4,503 3,919 (1.23)Norway 4,473 4,570 4,649 4,790 4,913 0.31 1,081 748 567 485 (2.67)Poland 38,671 38,516 38,367 37,840 36,680 (0.18) 14,826 14,264 13,000 11,031 (0.99)Portugal 10,016 10,080 10,082 9,941 9,721 (0.10) 4,704 4,207 3,626 3,047 (1.45)Republic of Moldova 4,283 4,259 4,230 4,163 4,011 (0.22) 2,322 2,211 1,947 1,624 (1.19)Romania 22,480 22,228 21,972 21,255 20,328 (0.34) 10,206 9,766 9,077 8,331 (0.68)Russian Federation 145,612 141,553 137,501 129,018 119,713 (0.65) 38,854 36,282 31,817 25,976 (1.34)San Marino 27 28 29 31 33 0.67 3 3 3 3 -Serbia and Montenegro 10,555 10,513 10,498 10,357 10,094 (0.15) 5,111 4,864 4,354 3,663 (1.11)Slovakia 5,391 5,411 5,434 5,428 5,344 (0.03) 2,329 2,206 2,051 1,874 (0.72)Slovenia 1,990 1,979 1,959 1,897 1,814 (0.31) 979 952 864 729 (0.98)Spain 40,752 41,184 41,284 40,815 39,951 (0.07) 9,674 9,374 8,500 7,294 (0.94)Sweden 8,856 8,895 8,940 9,028 9,033 0.07 1,479 1,452 1,360 1,202 (0.69)Switzerland 7,173 7,157 7,095 6,914 6,655 (0.25) 2,323 2,279 2,078 1,759 (0.93)TFYR Macedonia7 2,024 2,076 2,122 2,185 2,205 0.29 822 837 787 685 (0.61)Ukraine 49,688 47,782 46,038 42,605 38,925 (0.81) 16,325 14,764 12,670 10,148 (1.58)United Kingdom 58,689 59,598 60,392 62,274 64,183 0.30 6,500 6,241 5,715 5,158 (0.77)LATIN AMERICA 520,229 558,281 594,436 659,248 711,058 1.04 127,247 122,728 116,856 109,332 (0.51)Anguilla 11 12 13 15 17 1.45 - - - - 0.00 Antigua and Barbuda 72 74 75 77 78 0.27 45 45 41 36 (0.74)Argentina 37,074 39,311 41,443 45,317 48,611 0.90 3,893 3,548 3,262 3,043 (0.82)Aruba 93 103 113 133 152 1.64 50 64 73 76 1.40 Bahamas 303 321 336 363 382 0.77 35 30 28 26 (0.99)Barbados 267 272 276 282 282 0.18 134 122 107 90 (1.33)Belize 240 266 291 337 373 1.47 125 146 154 148 0.56 Bolivia 8,317 9,138 9,987 11,673 13,275 1.56 3,168 3,323 3,362 3,281 0.12 Brazil 171,796 182,798 192,879 209,793 222,078 0.86 32,394 25,840 21,651 19,392 (1.71)British Virgin Islands 20 22 24 27 30 1.35 8 7 7 7 (0.45)
193Data tables
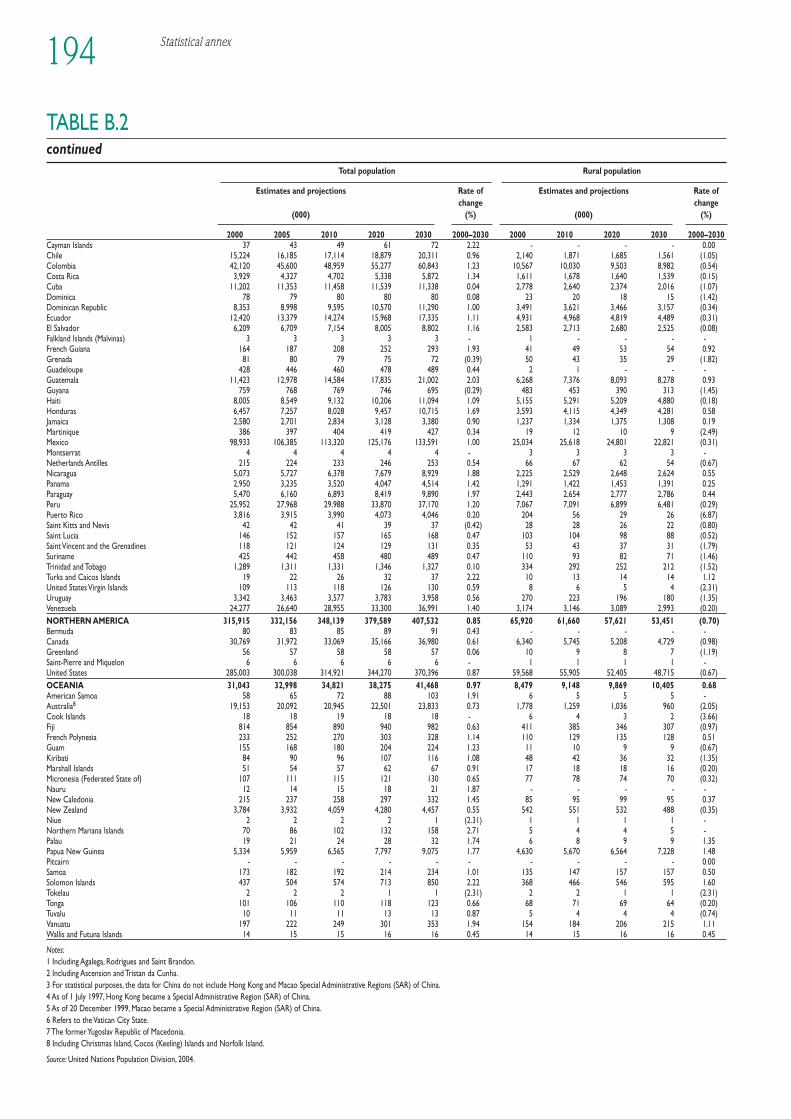
TABLE B.2continued
Total population Rural population
Estimates and projections Rate of Estimates and projections Rate ofchange change
(000) (%) (000) (%)
2000 2005 2010 2020 2030 2000–2030 2000 2010 2020 2030 2000–2030Cayman Islands 37 43 49 61 72 2.22 - - - - 0.00 Chile 15,224 16,185 17,114 18,879 20,311 0.96 2,140 1,871 1,685 1,561 (1.05)Colombia 42,120 45,600 48,959 55,277 60,843 1.23 10,567 10,030 9,503 8,982 (0.54)Costa Rica 3,929 4,327 4,702 5,338 5,872 1.34 1,611 1,678 1,640 1,539 (0.15)Cuba 11,202 11,353 11,458 11,539 11,338 0.04 2,778 2,640 2,374 2,016 (1.07)Dominica 78 79 80 80 80 0.08 23 20 18 15 (1.42)Dominican Republic 8,353 8,998 9,595 10,570 11,290 1.00 3,491 3,621 3,466 3,157 (0.34)Ecuador 12,420 13,379 14,274 15,968 17,335 1.11 4,931 4,968 4,819 4,489 (0.31)El Salvador 6,209 6,709 7,154 8,005 8,802 1.16 2,583 2,713 2,680 2,525 (0.08)Falkland Islands (Malvinas) 3 3 3 3 3 - 1 - - - -French Guiana 164 187 208 252 293 1.93 41 49 53 54 0.92 Grenada 81 80 79 75 72 (0.39) 50 43 35 29 (1.82)Guadeloupe 428 446 460 478 489 0.44 2 1 - - -Guatemala 11,423 12,978 14,584 17,835 21,002 2.03 6,268 7,376 8,093 8,278 0.93 Guyana 759 768 769 746 695 (0.29) 483 453 390 313 (1.45)Haiti 8,005 8,549 9,132 10,206 11,094 1.09 5,155 5,291 5,209 4,880 (0.18)Honduras 6,457 7,257 8,028 9,457 10,715 1.69 3,593 4,115 4,349 4,281 0.58 Jamaica 2,580 2,701 2,834 3,128 3,380 0.90 1,237 1,334 1,375 1,308 0.19 Martinique 386 397 404 419 427 0.34 19 12 10 9 (2.49)Mexico 98,933 106,385 113,320 125,176 133,591 1.00 25,034 25,618 24,801 22,821 (0.31)Montserrat 4 4 4 4 4 - 3 3 3 3 -Netherlands Antilles 215 224 233 246 253 0.54 66 67 62 54 (0.67)Nicaragua 5,073 5,727 6,378 7,679 8,929 1.88 2,225 2,529 2,648 2,624 0.55 Panama 2,950 3,235 3,520 4,047 4,514 1.42 1,291 1,422 1,453 1,391 0.25 Paraguay 5,470 6,160 6,893 8,419 9,890 1.97 2,443 2,654 2,777 2,786 0.44 Peru 25,952 27,968 29,988 33,870 37,170 1.20 7,067 7,091 6,899 6,481 (0.29)Puerto Rico 3,816 3,915 3,990 4,073 4,046 0.20 204 56 29 26 (6.87)Saint Kitts and Nevis 42 42 41 39 37 (0.42) 28 28 26 22 (0.80)Saint Lucia 146 152 157 165 168 0.47 103 104 98 88 (0.52)Saint Vincent and the Grenadines 118 121 124 129 131 0.35 53 43 37 31 (1.79)Suriname 425 442 458 480 489 0.47 110 93 82 71 (1.46)Trinidad and Tobago 1,289 1,311 1,331 1,346 1,327 0.10 334 292 252 212 (1.52)Turks and Caicos Islands 19 22 26 32 37 2.22 10 13 14 14 1.12 United States Virgin Islands 109 113 118 126 130 0.59 8 6 5 4 (2.31)Uruguay 3,342 3,463 3,577 3,783 3,958 0.56 270 223 196 180 (1.35)Venezuela 24,277 26,640 28,955 33,300 36,991 1.40 3,174 3,146 3,089 2,993 (0.20)NORTHERN AMERICA 315,915 332,156 348,139 379,589 407,532 0.85 65,920 61,660 57,621 53,451 (0.70)Bermuda 80 83 85 89 91 0.43 - - - - -Canada 30,769 31,972 33,069 35,166 36,980 0.61 6,340 5,745 5,208 4,729 (0.98)Greenland 56 57 58 58 57 0.06 10 9 8 7 (1.19)Saint-Pierre and Miquelon 6 6 6 6 6 - 1 1 1 1 -United States 285,003 300,038 314,921 344,270 370,396 0.87 59,568 55,905 52,405 48,715 (0.67)OCEANIA 31,043 32,998 34,821 38,275 41,468 0.97 8,479 9,148 9,869 10,405 0.68 American Samoa 58 65 72 88 103 1.91 6 5 5 5 -Australia8 19,153 20,092 20,945 22,501 23,833 0.73 1,778 1,259 1,036 960 (2.05)Cook Islands 18 18 19 18 18 - 6 4 3 2 (3.66)Fiji 814 854 890 940 982 0.63 411 385 346 307 (0.97)French Polynesia 233 252 270 303 328 1.14 110 129 135 128 0.51 Guam 155 168 180 204 224 1.23 11 10 9 9 (0.67)Kiribati 84 90 96 107 116 1.08 48 42 36 32 (1.35)Marshall Islands 51 54 57 62 67 0.91 17 18 18 16 (0.20)Micronesia (Federated State of) 107 111 115 121 130 0.65 77 78 74 70 (0.32)Nauru 12 14 15 18 21 1.87 - - - - -New Caledonia 215 237 258 297 332 1.45 85 95 99 95 0.37 New Zealand 3,784 3,932 4,059 4,280 4,457 0.55 542 551 532 488 (0.35)Niue 2 2 2 2 1 (2.31) 1 1 1 1 -Northern Mariana Islands 70 86 102 132 158 2.71 5 4 4 5 -Palau 19 21 24 28 32 1.74 6 8 9 9 1.35 Papua New Guinea 5,334 5,959 6,565 7,797 9,075 1.77 4,630 5,670 6,564 7,228 1.48 Pitcairn - - - - - - - - - - 0.00 Samoa 173 182 192 214 234 1.01 135 147 157 157 0.50 Solomon Islands 437 504 574 713 850 2.22 368 466 546 595 1.60 Tokelau 2 2 2 1 1 (2.31) 2 2 1 1 (2.31)Tonga 101 106 110 118 123 0.66 68 71 69 64 (0.20)Tuvalu 10 11 11 13 13 0.87 5 4 4 4 (0.74)Vanuatu 197 222 249 301 353 1.94 154 184 206 215 1.11 Wallis and Futuna Islands 14 15 15 16 16 0.45 14 15 16 16 0.45
Notes:1 Including Agalega, Rodrigues and Saint Brandon.2 Including Ascension and Tristan da Cunha.3 For statistical purposes, the data for China do not include Hong Kong and Macao Special Administrative Regions (SAR) of China.4 As of 1 July 1997, Hong Kong became a Special Administrative Region (SAR) of China.5 As of 20 December 1999, Macao became a Special Administrative Region (SAR) of China.6 Refers to the Vatican City State.7 The former Yugoslav Republic of Macedonia.8 Including Christmas Island, Cocos (Keeling) Islands and Norfolk Island.
Source: United Nations Population Division, 2004.
194 Statistical annex

TABLE B.3Households: Total Number and Rate of Change
Estimates and projections Annual rate of change Five-year increment(000) (%) (000)
2005 2010 2015 2020 2025 2000–2010 2010–2020 2020–2030 2005–2010 2010–2015 2015–2020 2020–2025WORLD 1,743,640 1,935,570 2,116,248 2,291,729 2,461,422 2.10 1.70 1.36 191,930 180,678 175,481 169,694AFRICA 188,604 219,505 249,358 283,387 321,562 2.98 2.67 2.51 30,902 29,853 34,029 38,174 Algeria 5,372 5,974 6,184 7,322 7,901 2.25 2.03 1.31 602 209 1,138 580 Angola 2,894 3,420 4,009 4,757 5,693 3.50 3.30 3.62 526 589 748 936 Benin 1,286 1,526 1,778 2,054 2,371 3.49 2.97 2.88 239 252 276 317 Botswana 430 426 417 415 417 0.87 (0.26) 0.14 (5) (9) (2) 2 Burkina Faso 1,797 1,994 2,236 2,520 2,848 2.02 2.34 2.45 197 242 284 328 Burundi 1,642 2,120 2,566 3,057 3,632 3.92 3.66 3.53 478 445 491 576 Cameroon 3,944 4,504 5,083 5,718 6,453 2.91 2.39 2.48 560 578 635 735 Cape Verde 108 125 145 167 189 2.95 2.89 2.32 17 20 22 23 Central African Republic 861 969 1,085 1,216 1,369 2.27 2.27 2.41 108 116 131 153 Chad 1,300 1,479 1,693 1,941 2,230 2.58 2.71 2.80 180 214 247 289 Comoros 120 143 167 194 226 3.62 3.06 3.01 22 24 27 32 Congo 991 1,222 1,516 1,882 2,320 3.95 4.32 4.12 231 295 365 438 Côte d’Ivoire 3,398 3,856 4,287 4,793 5,429 2.32 2.18 2.51 459 431 507 636 Democratic Republic of the Congo 11,627 14,088 17,201 20,957 25,404 3.28 3.97 3.84 2,461 3,113 3,756 4,447 Djibouti 145 164 185 211 240 1.60 2.51 2.70 18 22 25 30 Egypt 15,544 18,296 20,938 23,477 25,847 3.21 2.49 1.76 2,752 2,641 2,539 2,370 Equatorial Guinea 125 150 180 215 254 3.67 3.58 3.33 25 30 34 40 Eritrea 924 1,146 1,364 1,618 1,919 4.93 3.45 3.42 221 218 255 301 Ethiopia 14,913 17,247 20,102 23,564 27,658 2.91 3.12 3.20 2,334 2,855 3,462 4,094 Gabon 355 403 457 521 590 2.38 2.56 2.50 48 54 64 70 Gambia 201 236 273 313 356 3.58 2.81 2.52 35 37 40 43 Ghana 4,723 5,492 6,310 7,176 8,156 3.08 2.67 2.57 770 818 866 981 Guinea 1,184 1,458 1,841 2,076 2,353 2.89 3.61 3.83 274 383 235 277 Guinea-Bissau 184 234 295 351 393 2.43 2.62 2.47 50 61 56 42 Kenya 8,780 10,228 11,535 12,953 14,488 3.30 2.36 2.16 1,448 1,307 1,418 1,534 Lesotho 352 346 339 336 336 0.14 (0.29) 0.09 (6) (7) (3) 0 Liberia 574 664 744 874 1,086 8.41 2.76 4.18 89 80 130 212 Libyan Arab Jamahiriya 814 884 935 990 1,058 1.82 1.13 1.48 71 51 55 67 Madagascar 3,769 4,370 5,221 6,101 7,026 2.85 3.34 2.77 601 851 880 925 Malawi 1,718 1,619 1,549 1,659 1,886 (1.13) 0.24 2.60 (98) (71) 110 227 Mali 2,276 2,698 3,233 3,889 4,699 3.32 3.66 3.78 422 535 656 810 Mauritania 424 482 547 618 697 2.66 2.48 2.38 58 65 71 79 Mauritius 306 322 341 354 365 1.19 0.94 0.57 16 19 13 11 Morocco 6,229 6,976 7,684 8,468 9,180 2.32 1.94 1.48 747 708 784 713 Mozambique 3,092 3,156 3,174 3,298 3,478 0.75 0.44 1.14 64 17 124 180 Namibia 398 419 426 440 461 1.72 0.51 1.00 21 7 15 20 Niger 1,504 1,742 2,045 2,390 2,800 2.86 3.16 3.20 238 303 345 409 Nigeria 36,458 44,615 52,169 60,104 69,100 4.37 2.98 2.78 8,156 7,554 7,935 8,997 Réunion 230 256 283 307 329 2.26 1.80 1.29 26 27 24 22 Rwanda 2,269 2,624 3,014 3,482 4,048 5.82 2.83 3.07 354 391 468 566 Senegal 1,058 1,225 1,414 1,620 1,849 2.86 2.79 2.66 166 190 205 229 Somalia 1,369 1,701 2,057 2,548 3,193 4.38 4.05 4.54 332 357 491 644 South Africa 17,270 19,988 20,444 20,567 20,651 4.05 0.29 0.04 2,718 457 122 85 Sudan 3,822 4,325 4,795 5,323 5,932 2.02 2.08 2.19 503 470 527 609 Swaziland 261 292 306 318 328 2.82 0.85 0.66 30 15 11 11 Togo 1,097 1,276 1,491 1,727 1,997 3.03 3.02 2.93 180 214 236 270 Tunisia 2,224 2,425 2,587 2,730 2,864 1.88 1.19 0.88 201 163 143 134 Uganda 4,830 5,811 7,157 8,942 11,232 3.01 4.31 4.51 981 1,346 1,785 2,290 United Republic of Tanzania 6,659 7,149 7,747 8,368 9,013 1.40 1.57 1.50 490 598 621 645 Zambia 2,019 2,115 2,297 2,519 2,779 1.11 1.75 2.02 95 182 223 260 Zimbabwe 3,554 3,808 4,036 4,279 4,532 1.78 1.17 1.09 254 229 243 253 ASIA 962,492 1,081,314 1,194,550 1,302,207 1,402,896 2.35 1.88 1.43 118,823 113,236 107,657 100,690 Armenia 576 563 547 523 502 (0.66) (0.74) (0.77) (13) (16) (24) (21)Azerbaijan 1,744 1,893 2,034 2,111 2,182 1.39 1.09 0.67 149 141 77 71 Bahrain 124 138 152 161 166 2.26 1.55 0.61 14 14 9 5 Bangladesh 30,611 35,130 38,869 43,190 47,628 3.09 2.07 1.79 4,519 3,739 4,321 4,438 Bhutan 423 493 574 661 752 3.16 2.92 2.57 70 81 87 91 Brunei Darussalam 61 68 75 79 82 2.16 1.42 0.63 7 6 4 3 Cambodia 3,145 3,792 4,449 5,157 5,894 3.77 3.08 2.62 647 657 708 737 China 405,474 460,902 511,168 558,867 603,485 2.46 1.93 1.47 55,428 50,266 47,699 44,617 China, Hong Kong SAR 2,253 2,513 2,739 2,944 3,154 2.56 1.58 1.35 260 226 205 210 China, Macao SAR 180 208 234 257 277 3.49 2.13 1.43 28 26 23 20 Cyprus 211 221 228 230 231 1.05 0.40 0.03 10 7 2 1 Democratic People’s Republic of Korea 5,612 6,061 6,483 6,909 7,320 1.59 1.31 1.07 448 423 426 411 Georgia 1,310 1,273 1,245 1,212 1,177 (1.11) (0.49) (0.62) (37) (28) (33) (35)India 209,389 234,345 259,658 281,906 300,831 2.28 1.85 1.14 24,956 25,313 22,248 18,925 Indonesia 57,869 63,740 69,139 74,132 78,261 2.05 1.51 0.98 5,871 5,399 4,993 4,129 Iran (Islamic Republic of) 18,149 20,777 23,598 25,635 27,633 3.34 2.10 1.48 2,629 2,820 2,038 1,997 Iraq 3,006 3,351 3,737 4,340 5,049 2.03 2.59 2.96 345 386 602 710 Israel 1,858 2,081 2,291 2,464 2,625 2.54 1.69 1.13 223 209 173 160 Japan 51,281 53,206 54,616 55,836 56,818 0.90 0.48 0.28 1,924 1,410 1,220 982 Jordan 578 665 758 862 977 3.02 2.58 2.45 88 92 104 115 Kazakhstan 5,734 5,928 6,252 6,526 6,775 0.74 0.96 0.72 194 323 274 249 Kuwait 384 462 510 548 584 4.42 1.71 1.19 78 48 38 36 Kyrgyzstan 1,032 1,103 1,178 1,236 1,276 1.18 1.14 0.58 71 75 57 41 Lao People’s Democratic Republic 1,093 1,271 1,468 1,672 1,901 2.86 2.75 2.59 177 197 205 228 Lebanon 734 798 861 931 1,001 1.92 1.53 1.43 64 62 70 70 Malaysia 5,706 6,532 7,517 8,422 9,216 2.85 2.54 1.61 826 985 905 795
195Data tables
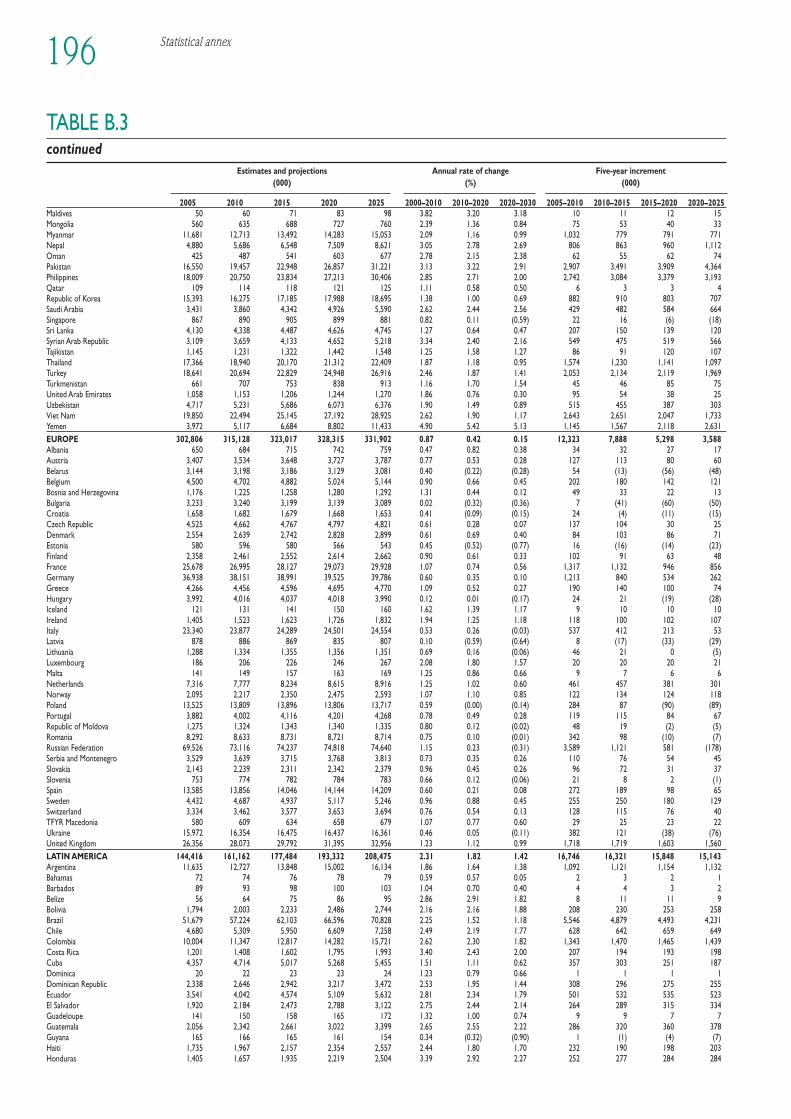
TABLE B.3continued
Estimates and projections Annual rate of change Five-year increment(000) (%) (000)
2005 2010 2015 2020 2025 2000–2010 2010–2020 2020–2030 2005–2010 2010–2015 2015–2020 2020–2025Maldives 50 60 71 83 98 3.82 3.20 3.18 10 11 12 15 Mongolia 560 635 688 727 760 2.39 1.36 0.84 75 53 40 33 Myanmar 11,681 12,713 13,492 14,283 15,053 2.09 1.16 0.99 1,032 779 791 771 Nepal 4,880 5,686 6,548 7,509 8,621 3.05 2.78 2.69 806 863 960 1,112 Oman 425 487 541 603 677 2.78 2.15 2.38 62 55 62 74 Pakistan 16,550 19,457 22,948 26,857 31,221 3.13 3.22 2.91 2,907 3,491 3,909 4,364 Philippines 18,009 20,750 23,834 27,213 30,406 2.85 2.71 2.00 2,742 3,084 3,379 3,193 Qatar 109 114 118 121 125 1.11 0.58 0.50 6 3 3 4 Republic of Korea 15,393 16,275 17,185 17,988 18,695 1.38 1.00 0.69 882 910 803 707 Saudi Arabia 3,431 3,860 4,342 4,926 5,590 2.62 2.44 2.56 429 482 584 664 Singapore 867 890 905 899 881 0.82 0.11 (0.59) 22 16 (6) (18)Sri Lanka 4,130 4,338 4,487 4,626 4,745 1.27 0.64 0.47 207 150 139 120 Syrian Arab Republic 3,109 3,659 4,133 4,652 5,218 3.34 2.40 2.16 549 475 519 566 Tajikistan 1,145 1,231 1,322 1,442 1,548 1.25 1.58 1.27 86 91 120 107 Thailand 17,366 18,940 20,170 21,312 22,409 1.87 1.18 0.95 1,574 1,230 1,141 1,097 Turkey 18,641 20,694 22,829 24,948 26,916 2.46 1.87 1.41 2,053 2,134 2,119 1,969 Turkmenistan 661 707 753 838 913 1.16 1.70 1.54 45 46 85 75 United Arab Emirates 1,058 1,153 1,206 1,244 1,270 1.86 0.76 0.30 95 54 38 25 Uzbekistan 4,717 5,231 5,686 6,073 6,376 1.90 1.49 0.89 515 455 387 303 Viet Nam 19,850 22,494 25,145 27,192 28,925 2.62 1.90 1.17 2,643 2,651 2,047 1,733 Yemen 3,972 5,117 6,684 8,802 11,433 4.90 5.42 5.13 1,145 1,567 2,118 2,631 EUROPE 302,806 315,128 323,017 328,315 331,902 0.87 0.42 0.15 12,323 7,888 5,298 3,588 Albania 650 684 715 742 759 0.47 0.82 0.38 34 32 27 17 Austria 3,407 3,534 3,648 3,727 3,787 0.77 0.53 0.28 127 113 80 60 Belarus 3,144 3,198 3,186 3,129 3,081 0.40 (0.22) (0.28) 54 (13) (56) (48)Belgium 4,500 4,702 4,882 5,024 5,144 0.90 0.66 0.45 202 180 142 121 Bosnia and Herzegovina 1,176 1,225 1,258 1,280 1,292 1.31 0.44 0.12 49 33 22 13 Bulgaria 3,233 3,240 3,199 3,139 3,089 0.02 (0.32) (0.36) 7 (41) (60) (50)Croatia 1,658 1,682 1,679 1,668 1,653 0.41 (0.09) (0.15) 24 (4) (11) (15)Czech Republic 4,525 4,662 4,767 4,797 4,821 0.61 0.28 0.07 137 104 30 25 Denmark 2,554 2,639 2,742 2,828 2,899 0.61 0.69 0.40 84 103 86 71 Estonia 580 596 580 566 543 0.45 (0.52) (0.77) 16 (16) (14) (23)Finland 2,358 2,461 2,552 2,614 2,662 0.90 0.61 0.33 102 91 63 48 France 25,678 26,995 28,127 29,073 29,928 1.07 0.74 0.56 1,317 1,132 946 856 Germany 36,938 38,151 38,991 39,525 39,786 0.60 0.35 0.10 1,213 840 534 262 Greece 4,266 4,456 4,596 4,695 4,770 1.09 0.52 0.27 190 140 100 74 Hungary 3,992 4,016 4,037 4,018 3,990 0.12 0.01 (0.17) 24 21 (19) (28)Iceland 121 131 141 150 160 1.62 1.39 1.17 9 10 10 10 Ireland 1,405 1,523 1,623 1,726 1,832 1.94 1.25 1.18 118 100 102 107 Italy 23,340 23,877 24,289 24,501 24,554 0.53 0.26 (0.03) 537 412 213 53 Latvia 878 886 869 835 807 0.10 (0.59) (0.64) 8 (17) (33) (29)Lithuania 1,288 1,334 1,355 1,356 1,351 0.69 0.16 (0.06) 46 21 0 (5)Luxembourg 186 206 226 246 267 2.08 1.80 1.57 20 20 20 21 Malta 141 149 157 163 169 1.25 0.86 0.66 9 7 6 6 Netherlands 7,316 7,777 8,234 8,615 8,916 1.25 1.02 0.60 461 457 381 301 Norway 2,095 2,217 2,350 2,475 2,593 1.07 1.10 0.85 122 134 124 118 Poland 13,525 13,809 13,896 13,806 13,717 0.59 (0.00) (0.14) 284 87 (90) (89)Portugal 3,882 4,002 4,116 4,201 4,268 0.78 0.49 0.28 119 115 84 67 Republic of Moldova 1,275 1,324 1,343 1,340 1,335 0.80 0.12 (0.02) 48 19 (2) (5)Romania 8,292 8,633 8,731 8,721 8,714 0.75 0.10 (0.01) 342 98 (10) (7)Russian Federation 69,526 73,116 74,237 74,818 74,640 1.15 0.23 (0.31) 3,589 1,121 581 (178)Serbia and Montenegro 3,529 3,639 3,715 3,768 3,813 0.73 0.35 0.26 110 76 54 45 Slovakia 2,143 2,239 2,311 2,342 2,379 0.96 0.45 0.26 96 72 31 37 Slovenia 753 774 782 784 783 0.66 0.12 (0.06) 21 8 2 (1)Spain 13,585 13,856 14,046 14,144 14,209 0.60 0.21 0.08 272 189 98 65 Sweden 4,432 4,687 4,937 5,117 5,246 0.96 0.88 0.45 255 250 180 129 Switzerland 3,334 3,462 3,577 3,653 3,694 0.76 0.54 0.13 128 115 76 40 TFYR Macedonia 580 609 634 658 679 1.07 0.77 0.60 29 25 23 22 Ukraine 15,972 16,354 16,475 16,437 16,361 0.46 0.05 (0.11) 382 121 (38) (76)United Kingdom 26,356 28,073 29,792 31,395 32,956 1.23 1.12 0.99 1,718 1,719 1,603 1,560 LATIN AMERICA 144,416 161,162 177,484 193,332 208,475 2.31 1.82 1.42 16,746 16,321 15,848 15,143 Argentina 11,635 12,727 13,848 15,002 16,134 1.86 1.64 1.38 1,092 1,121 1,154 1,132 Bahamas 72 74 76 78 79 0.59 0.57 0.05 2 3 2 1 Barbados 89 93 98 100 103 1.04 0.70 0.40 4 4 3 2 Belize 56 64 75 86 95 2.86 2.91 1.82 8 11 11 9 Bolivia 1,794 2,003 2,233 2,486 2,744 2.16 2.16 1.88 208 230 253 258 Brazil 51,679 57,224 62,103 66,596 70,828 2.25 1.52 1.18 5,546 4,879 4,493 4,231 Chile 4,680 5,309 5,950 6,609 7,258 2.49 2.19 1.77 628 642 659 649 Colombia 10,004 11,347 12,817 14,282 15,721 2.62 2.30 1.82 1,343 1,470 1,465 1,439 Costa Rica 1,201 1,408 1,602 1,795 1,993 3.40 2.43 2.00 207 194 193 198 Cuba 4,357 4,714 5,017 5,268 5,455 1.51 1.11 0.62 357 303 251 187 Dominica 20 22 23 23 24 1.23 0.79 0.66 1 1 1 1 Dominican Republic 2,338 2,646 2,942 3,217 3,472 2.53 1.95 1.44 308 296 275 255 Ecuador 3,541 4,042 4,574 5,109 5,632 2.81 2.34 1.79 501 532 535 523 El Salvador 1,920 2,184 2,473 2,788 3,122 2.75 2.44 2.14 264 289 315 334 Guadeloupe 141 150 158 165 172 1.32 1.00 0.74 9 9 7 7 Guatemala 2,056 2,342 2,661 3,022 3,399 2.65 2.55 2.22 286 320 360 378 Guyana 165 166 165 161 154 0.34 (0.32) (0.90) 1 (1) (4) (7)Haiti 1,735 1,967 2,157 2,354 2,557 2.44 1.80 1.70 232 190 198 203 Honduras 1,405 1,657 1,935 2,219 2,504 3.39 2.92 2.27 252 277 284 284
196 Statistical annex

Jamaica 522 539 558 573 581 0.63 0.62 0.21 17 19 15 8 Martinique 131 139 147 154 160 1.20 1.01 0.68 8 8 7 6 Mexico 25,973 28,997 31,998 34,823 37,345 2.32 1.83 1.25 3,024 3,001 2,825 2,522 Netherlands Antilles 74 81 88 95 100 1.82 1.60 1.13 7 7 7 6 Nicaragua 996 1,174 1,389 1,633 1,893 3.44 3.29 2.80 178 214 244 260 Panama 848 978 1,111 1,243 1,371 2.91 2.40 1.84 130 133 132 128 Paraguay 1,401 1,678 1,985 2,315 2,675 3.70 3.22 2.79 277 307 330 360 Peru 6,424 7,187 7,944 8,678 9,363 2.29 1.89 1.39 763 758 734 685 Puerto Rico 1,230 1,288 1,349 1,406 1,455 1.03 0.88 0.58 58 62 57 49 Suriname 115 120 127 132 136 1.23 0.97 0.52 4 7 5 4 Trinidad and Tobago 317 331 335 334 333 1.17 0.09 (0.03) 14 4 (1) (2)Uruguay 1,085 1,150 1,216 1,287 1,355 1.15 1.12 0.99 65 66 71 69 Venezuela 6,160 7,083 8,023 8,964 9,903 2.88 2.36 1.85 923 940 941 939 NORTHERN AMERICA 133,819 145,895 158,218 169,815 180,848 1.76 1.52 1.22 12,076 12,323 11,597 11,033 Canada 13,801 15,058 16,321 17,440 18,520 1.83 1.47 1.18 1,258 1,263 1,119 1,080 United States 119,959 130,775 141,831 152,306 162,257 1.74 1.52 1.22 10,815 11,057 10,475 9,951 OCEANIA 11,504 12,565 13,621 14,674 15,739 1.84 1.56 1.39 1,060 1,056 1,053 1,065 Australia 8,090 8,810 9,517 10,189 10,841 1.78 1.45 1.21 720 706 673 652 Fiji 169 181 191 199 207 1.53 0.92 0.72 12 10 8 9 French Polynesia 59 66 72 78 83 2.10 1.73 1.10 7 6 6 5 Guam 37 40 44 47 49 1.33 1.72 0.75 3 4 3 2 New Caledonia 63 70 78 87 94 2.32 2.07 1.45 7 8 8 7 New Zealand 1,509 1,627 1,737 1,846 1,949 1.51 1.27 1.02 118 110 109 102 Papua New Guinea 1,290 1,449 1,623 1,828 2,073 2.39 2.32 2.43 160 174 206 245 Samoa 36 39 43 48 53 1.38 2.03 1.88 3 4 5 5 Solomon Islands 84 99 114 131 149 3.22 2.81 2.54 14 15 17 18 Vanuatu 40 45 50 55 60 2.44 1.98 1.74 5 5 5 5
Source: UN-Habitat, 2005.
TABLE B.4Household’s Consumption Indicators
Household final consumption expenditure Female-headed Share of households consumption
Annual rate of change Proportion of GDP Lowest Highest 10% 10%
Total Total Per capita US$ millions (%) (%) (%) (%) (%)
1990 2002 1980– 1990– 1980– 1990– 1990 20021990 2002 1990 2002
AFRICA Algeria 35,265 24,745 1.5 0.9 (1.4) (0.9) 57 44 ... 1995 2.8 26.8Angola 3,674 ... (3.6) ... ... ... 36 61 ... ... ...Benin 1,602 2,183 1.9 3.4 (1.2) 0.7 87 81 2001 20 ... ...Botswana 1,260 1,537 6.3 4.1 2.7 1.5 33 28 ... 1993 0.7 56.6Burkina Faso 2,284 2,556 2.6 3.9 0.1 1.4 82 82 1998-99 6 1998 1.8 46.3Burundi 1,070 655 3.4 (1.7) 0.5 (3.7) 95 92 ... 1998 1.7 32.8Cameroon 7,423 6,394 3.5 3.5 0.6 0.9 67 71 1998 22 2001 2.3 35.4Central African Republic 1,274 815 1.5 ... ... ... 86 78 1994-95 21 1993 0.7 47.7Chad 1,538 1,719 2.9 2.0 0.2 (1.1) 88 86 1996-97 21 ... ...Congo 1,746 955 2.3 1.7 (0.9) (1.5) 62 32 ... ... ...Côte d’Ivoire 7,766 7,048 1.5 3.1 (2.1) 0.2 72 60 1998-99 14 1998 2.2 35.9Democratic Republic of the Congo 7,398 5,269 3.4 (2.9) 0.4 (5.4) 79 92 ... ... ...Egypt 30,933 71,236 4.6 4.3 2.0 2.3 73 79 2000 11 1999 3.7 29.5Eritrea 496 592 ... (0.3) ... (2.9) 104 92 1995 30 ... ... ...Ethiopia 6,382 4,756 0.7 5.6 (2.4) 3.2 74 78 2000 23 2000 3.9 25.5Gabon 2,961 3,040 1.5 2.1 (1.6) (0.6) 50 52 2000 25 ... ...Gambia 240 296 (2.4) 5.3 (5.9) 1.8 76 83 ... 1998 1.5 38.0Ghana 5,016 5,093 2.8 1.3 (0.6) (1.1) 85 83 ... 1999 2.1 30.0Guinea 2,068 2,625 ... 3.6 ... 1.1 73 82 1999 12 1994 2.6 32.0Guinea-Bissau 212 213 0.8 1.5 (1.9) (1.4) 87 105 ... 1993 2.1 39.3Kenya 5,320 8,819 4.7 2.2 1.2 (0.3) 67 71 1998 31 1997 2.3 36.1Lesotho 746 585 1.3 (0.4) (0.8) (1.5) 121 82 ... 1995 0.5 48.3Liberia ... ... ... ... ... ... ... ... ... ... ...Libyan Arab Jamahiriya 13,999 10,970 ... ... ... ... 48 58 ... ... ...Madagascar 2,663 3,703 (0.7) 2.3 (3.4) (0.6) 86 84 1997 21 2001 1.9 36.6Malawi 1,345 1,665 1.5 4.9 (1.7) 2.9 72 88 2000 26 1997 1.9 42.2Mali 1,943 2,230 0.6 3.2 (1.9) 0.7 80 77 2001 11 1994 1.8 40.4Mauritania 705 762 1.4 3.9 (0.9) 1.1 69 79 2000-01 29 2000 2.5 29.5Mauritius 1,519 2,983 6.2 4.8 5.3 3.6 64 66 ... ... ...Morocco 16,833 23,952 4.3 2.7 2.0 0.9 65 62 1992 16 1998-99 2.6 30.9Mozambique 2,481 2,124 (1.6) 1.5 (3.1) (0.7) 101 59 1997 26 1996-97 2.5 31.7Namibia 1,204 1,377 1.3 5.1 (1.9) 2.2 51 48 1992 30 1993 0.5 64.5Niger 2,079 1,814 0.0 1.8 (3.1) (1.7) 84 84 1998 13 1995 0.8 35.4Nigeria 15,816 24,135 (2.6) 0.2 (5.5) (2.7) 56 55 1999 16 1996-97 1.6 40.8Rwanda 2,162 1,503 1.2 2.2 (1.8) 0.8 84 87 2000 36 1983-85 4.2 24.2Senegal 4,353 3,820 2.1 2.9 (0.8) 0.2 76 76 1997 18 1995 2.6 33.5Sierra Leone 546 728 (2.7) (5.2) (4.7) (7.3) 83 93 ... 1989 0.5 43.6Somalia ... ... 1.3 ... ... ... 112 ... ... ... ...South Africa 64,251 64,741 2.4 2.7 (0.2) 0.5 57 62 1998 41 1995 0.7 46.9Sudan ... 8,339 0.0 ... ... ... ... 79 ... ... ...Swaziland 547 883 5.3 3.5 2.1 0.4 62 74 ... 1994 1.0 50.2Togo 1,158 1,184 4.7 3.6 1.3 0.8 71 86 1998 24 ... ...Tunisia 7,152 13,152 2.9 4.5 0.3 2.9 58 63 ... 2000 2.3 31.5
197Data tables
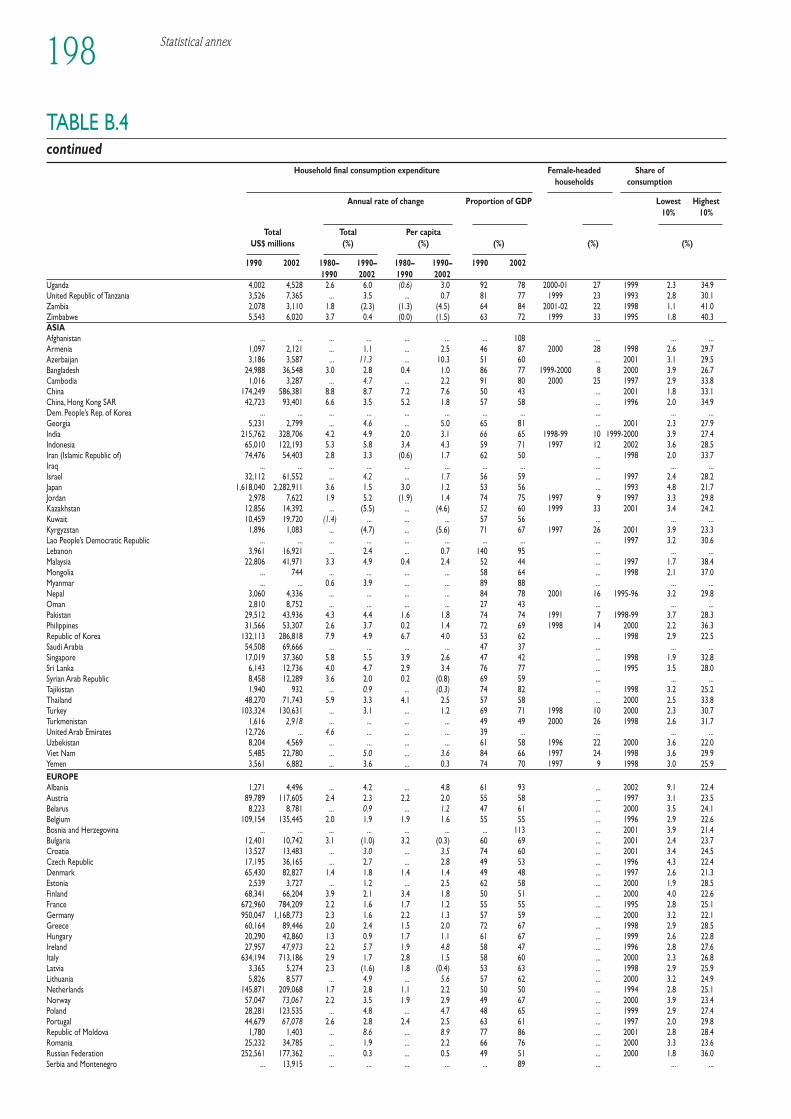
TABLE B.4continued
Household final consumption expenditure Female-headed Share of households consumption
Annual rate of change Proportion of GDP Lowest Highest 10% 10%
Total Total Per capita US$ millions (%) (%) (%) (%) (%)
1990 2002 1980– 1990– 1980– 1990– 1990 20021990 2002 1990 2002
Uganda 4,002 4,528 2.6 6.0 (0.6) 3.0 92 78 2000-01 27 1999 2.3 34.9United Republic of Tanzania 3,526 7,365 ... 3.5 ... 0.7 81 77 1999 23 1993 2.8 30.1Zambia 2,078 3,110 1.8 (2.3) (1.3) (4.5) 64 84 2001-02 22 1998 1.1 41.0Zimbabwe 5,543 6,020 3.7 0.4 (0.0) (1.5) 63 72 1999 33 1995 1.8 40.3ASIA Afghanistan ... ... ... ... ... ... ... 108 ... ... ...Armenia 1,097 2,121 ... 1.1 ... 2.5 46 87 2000 28 1998 2.6 29.7Azerbaijan 3,186 3,587 ... 11.3 ... 10.3 51 60 ... 2001 3.1 29.5Bangladesh 24,988 36,548 3.0 2.8 0.4 1.0 86 77 1999-2000 8 2000 3.9 26.7Cambodia 1,016 3,287 ... 4.7 ... 2.2 91 80 2000 25 1997 2.9 33.8China 174,249 586,381 8.8 8.7 7.2 7.6 50 43 ... 2001 1.8 33.1China, Hong Kong SAR 42,723 93,401 6.6 3.5 5.2 1.8 57 58 ... 1996 2.0 34.9Dem. People’s Rep. of Korea ... ... ... ... ... ... ... ... ... ... ...Georgia 5,231 2,799 ... 4.6 ... 5.0 65 81 ... 2001 2.3 27.9India 215,762 328,706 4.2 4.9 2.0 3.1 66 65 1998-99 10 1999-2000 3.9 27.4Indonesia 65,010 122,193 5.3 5.8 3.4 4.3 59 71 1997 12 2002 3.6 28.5Iran (Islamic Republic of) 74,476 54,403 2.8 3.3 (0.6) 1.7 62 50 ... 1998 2.0 33.7Iraq ... ... ... ... ... ... ... ... ... ... ...Israel 32,112 61,552 ... 4.2 ... 1.7 56 59 ... 1997 2.4 28.2Japan 1,618,040 2,282,911 3.6 1.5 3.0 1.2 53 56 ... 1993 4.8 21.7Jordan 2,978 7,622 1.9 5.2 (1.9) 1.4 74 75 1997 9 1997 3.3 29.8Kazakhstan 12,856 14,392 ... (5.5) ... (4.6) 52 60 1999 33 2001 3.4 24.2Kuwait 10,459 19,720 (1.4) ... ... ... 57 56 ... ... ...Kyrgyzstan 1,896 1,083 ... (4.7) ... (5.6) 71 67 1997 26 2001 3.9 23.3Lao People’s Democratic Republic ... ... ... ... ... ... ... ... ... 1997 3.2 30.6Lebanon 3,961 16,921 ... 2.4 ... 0.7 140 95 ... ... ...Malaysia 22,806 41,971 3.3 4.9 0.4 2.4 52 44 ... 1997 1.7 38.4Mongolia ... 744 ... ... ... ... 58 64 ... 1998 2.1 37.0Myanmar ... ... 0.6 3.9 ... ... 89 88 ... ... ...Nepal 3,060 4,336 ... ... ... ... 84 78 2001 16 1995-96 3.2 29.8Oman 2,810 8,752 ... ... ... ... 27 43 ... ... ...Pakistan 29,512 43,936 4.3 4.4 1.6 1.8 74 74 1991 7 1998-99 3.7 28.3Philippines 31,566 53,307 2.6 3.7 0.2 1.4 72 69 1998 14 2000 2.2 36.3Republic of Korea 132,113 286,818 7.9 4.9 6.7 4.0 53 62 ... 1998 2.9 22.5Saudi Arabia 54,508 69,666 ... ... ... ... 47 37 ... ... ...Singapore 17,019 37,360 5.8 5.5 3.9 2.6 47 42 ... 1998 1.9 32.8Sri Lanka 6,143 12,736 4.0 4.7 2.9 3.4 76 77 ... 1995 3.5 28.0Syrian Arab Republic 8,458 12,289 3.6 2.0 0.2 (0.8) 69 59 ... ... ...Tajikistan 1,940 932 ... 0.9 ... (0.3) 74 82 ... 1998 3.2 25.2Thailand 48,270 71,743 5.9 3.3 4.1 2.5 57 58 ... 2000 2.5 33.8Turkey 103,324 130,631 ... 3.1 ... 1.2 69 71 1998 10 2000 2.3 30.7Turkmenistan 1,616 2,918 ... ... ... ... 49 49 2000 26 1998 2.6 31.7United Arab Emirates 12,726 ... 4.6 ... ... ... 39 ... ... ... ...Uzbekistan 8,204 4,569 ... ... ... ... 61 58 1996 22 2000 3.6 22.0Viet Nam 5,485 22,780 ... 5.0 ... 3.6 84 66 1997 24 1998 3.6 29.9Yemen 3,561 6,882 ... 3.6 ... 0.3 74 70 1997 9 1998 3.0 25.9EUROPE Albania 1,271 4,496 ... 4.2 ... 4.8 61 93 ... 2002 9.1 22.4Austria 89,789 117,605 2.4 2.3 2.2 2.0 55 58 ... 1997 3.1 23.5Belarus 8,223 8,781 ... 0.9 ... 1.2 47 61 ... 2000 3.5 24.1Belgium 109,154 135,445 2.0 1.9 1.9 1.6 55 55 ... 1996 2.9 22.6Bosnia and Herzegovina ... ... ... ... ... ... ... 113 ... 2001 3.9 21.4Bulgaria 12,401 10,742 3.1 (1.0) 3.2 (0.3) 60 69 ... 2001 2.4 23.7Croatia 13,527 13,483 ... 3.0 ... 3.5 74 60 ... 2001 3.4 24.5Czech Republic 17,195 36,165 ... 2.7 ... 2.8 49 53 ... 1996 4.3 22.4Denmark 65,430 82,827 1.4 1.8 1.4 1.4 49 48 ... 1997 2.6 21.3Estonia 2,539 3,727 ... 1.2 ... 2.5 62 58 ... 2000 1.9 28.5Finland 68,341 66,204 3.9 2.1 3.4 1.8 50 51 ... 2000 4.0 22.6France 672,960 784,209 2.2 1.6 1.7 1.2 55 55 ... 1995 2.8 25.1Germany 950,047 1,168,773 2.3 1.6 2.2 1.3 57 59 ... 2000 3.2 22.1Greece 60,164 89,446 2.0 2.4 1.5 2.0 72 67 ... 1998 2.9 28.5Hungary 20,290 42,860 1.3 0.9 1.7 1.1 61 67 ... 1999 2.6 22.8Ireland 27,957 47,973 2.2 5.7 1.9 4.8 58 47 ... 1996 2.8 27.6Italy 634,194 713,186 2.9 1.7 2.8 1.5 58 60 ... 2000 2.3 26.8Latvia 3,365 5,274 2.3 (1.6) 1.8 (0.4) 53 63 ... 1998 2.9 25.9Lithuania 5,826 8,577 ... 4.9 ... 5.6 57 62 ... 2000 3.2 24.9Netherlands 145,871 209,068 1.7 2.8 1.1 2.2 50 50 ... 1994 2.8 25.1Norway 57,047 73,067 2.2 3.5 1.9 2.9 49 67 ... 2000 3.9 23.4Poland 28,281 123,535 ... 4.8 ... 4.7 48 65 ... 1999 2.9 27.4Portugal 44,679 67,078 2.6 2.8 2.4 2.5 63 61 ... 1997 2.0 29.8Republic of Moldova 1,780 1,403 ... 8.6 ... 8.9 77 86 ... 2001 2.8 28.4Romania 25,232 34,785 ... 1.9 ... 2.2 66 76 ... 2000 3.3 23.6Russian Federation 252,561 177,362 ... 0.3 ... 0.5 49 51 ... 2000 1.8 36.0Serbia and Montenegro ... 13,915 ... ... ... ... ... 89 ... ... ...
198 Statistical annex
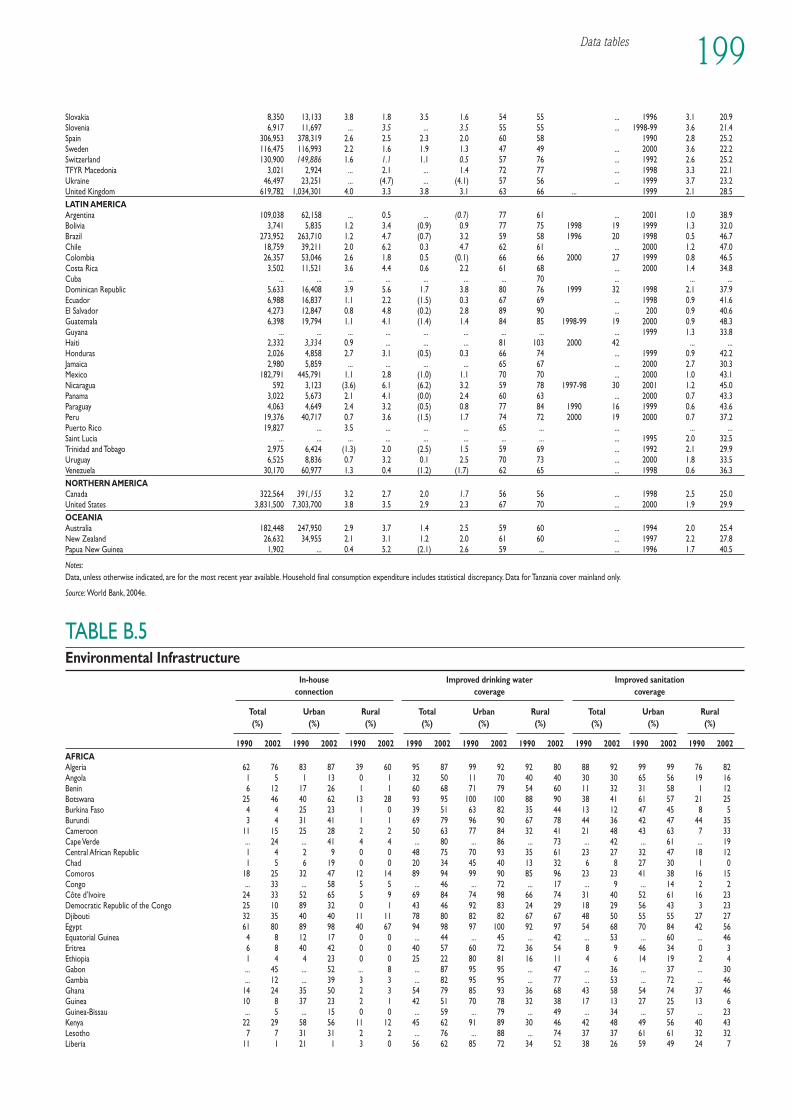
Slovakia 8,350 13,133 3.8 1.8 3.5 1.6 54 55 ... 1996 3.1 20.9Slovenia 6,917 11,697 ... 3.5 ... 3.5 55 55 ... 1998-99 3.6 21.4Spain 306,953 378,319 2.6 2.5 2.3 2.0 60 58 1990 2.8 25.2Sweden 116,475 116,993 2.2 1.6 1.9 1.3 47 49 ... 2000 3.6 22.2Switzerland 130,900 149,886 1.6 1.1 1.1 0.5 57 76 ... 1992 2.6 25.2TFYR Macedonia 3,021 2,924 ... 2.1 ... 1.4 72 77 ... 1998 3.3 22.1Ukraine 46,497 23,251 ... (4.7) ... (4.1) 57 56 ... 1999 3.7 23.2United Kingdom 619,782 1,034,301 4.0 3.3 3.8 3.1 63 66 ... 1999 2.1 28.5LATIN AMERICA Argentina 109,038 62,158 ... 0.5 ... (0.7) 77 61 ... 2001 1.0 38.9Bolivia 3,741 5,835 1.2 3.4 (0.9) 0.9 77 75 1998 19 1999 1.3 32.0Brazil 273,952 263,710 1.2 4.7 (0.7) 3.2 59 58 1996 20 1998 0.5 46.7Chile 18,759 39,211 2.0 6.2 0.3 4.7 62 61 ... 2000 1.2 47.0Colombia 26,357 53,046 2.6 1.8 0.5 (0.1) 66 66 2000 27 1999 0.8 46.5Costa Rica 3,502 11,521 3.6 4.4 0.6 2.2 61 68 ... 2000 1.4 34.8Cuba ... ... ... ... ... ... ... 70 ... ... ...Dominican Republic 5,633 16,408 3.9 5.6 1.7 3.8 80 76 1999 32 1998 2.1 37.9Ecuador 6,988 16,837 1.1 2.2 (1.5) 0.3 67 69 ... 1998 0.9 41.6El Salvador 4,273 12,847 0.8 4.8 (0.2) 2.8 89 90 ... 200 0.9 40.6Guatemala 6,398 19,794 1.1 4.1 (1.4) 1.4 84 85 1998-99 19 2000 0.9 48.3Guyana ... ... ... ... ... ... ... ... ... 1999 1.3 33.8Haiti 2,332 3,334 0.9 ... ... ... 81 103 2000 42 ... ...Honduras 2,026 4,858 2.7 3.1 (0.5) 0.3 66 74 ... 1999 0.9 42.2Jamaica 2,980 5,859 ... ... ... ... 65 67 ... 2000 2.7 30.3Mexico 182,791 445,791 1.1 2.8 (1.0) 1.1 70 70 ... 2000 1.0 43.1Nicaragua 592 3,123 (3.6) 6.1 (6.2) 3.2 59 78 1997-98 30 2001 1.2 45.0Panama 3,022 5,673 2.1 4.1 (0.0) 2.4 60 63 ... 2000 0.7 43.3Paraguay 4,063 4,649 2.4 3.2 (0.5) 0.8 77 84 1990 16 1999 0.6 43.6Peru 19,376 40,717 0.7 3.6 (1.5) 1.7 74 72 2000 19 2000 0.7 37.2Puerto Rico 19,827 ... 3.5 ... ... ... 65 ... ... ... ...Saint Lucia ... ... ... ... ... ... ... ... ... 1995 2.0 32.5Trinidad and Tobago 2,975 6,424 (1.3) 2.0 (2.5) 1.5 59 69 ... 1992 2.1 29.9Uruguay 6,525 8,836 0.7 3.2 0.1 2.5 70 73 ... 2000 1.8 33.5Venezuela 30,170 60,977 1.3 0.4 (1.2) (1.7) 62 65 ... 1998 0.6 36.3NORTHERN AMERICA Canada 322,564 391,155 3.2 2.7 2.0 1.7 56 56 ... 1998 2.5 25.0United States 3,831,500 7,303,700 3.8 3.5 2.9 2.3 67 70 ... 2000 1.9 29.9OCEANIA Australia 182,448 247,950 2.9 3.7 1.4 2.5 59 60 ... 1994 2.0 25.4New Zealand 26,632 34,955 2.1 3.1 1.2 2.0 61 60 ... 1997 2.2 27.8Papua New Guinea 1,902 ... 0.4 5.2 (2.1) 2.6 59 ... ... 1996 1.7 40.5
Notes:Data, unless otherwise indicated, are for the most recent year available. Household final consumption expenditure includes statistical discrepancy. Data for Tanzania cover mainland only.
Source: World Bank, 2004e.
TABLE B.5Environmental Infrastructure
In-house Improved drinking water Improved sanitationconnection coverage coverage
Total Urban Rural Total Urban Rural Total Urban Rural(%) (%) (%) (%) (%) (%) (%) (%) (%)
1990 2002 1990 2002 1990 2002 1990 2002 1990 2002 1990 2002 1990 2002 1990 2002 1990 2002AFRICAAlgeria 62 76 83 87 39 60 95 87 99 92 92 80 88 92 99 99 76 82Angola 1 5 1 13 0 1 32 50 11 70 40 40 30 30 65 56 19 16Benin 6 12 17 26 1 1 60 68 71 79 54 60 11 32 31 58 1 12Botswana 25 46 40 62 13 28 93 95 100 100 88 90 38 41 61 57 21 25Burkina Faso 4 4 25 23 1 0 39 51 63 82 35 44 13 12 47 45 8 5Burundi 3 4 31 41 1 1 69 79 96 90 67 78 44 36 42 47 44 35Cameroon 11 15 25 28 2 2 50 63 77 84 32 41 21 48 43 63 7 33Cape Verde ... 24 ... 41 4 4 ... 80 ... 86 ... 73 ... 42 ... 61 ... 19Central African Republic 1 4 2 9 0 0 48 75 70 93 35 61 23 27 32 47 18 12Chad 1 5 6 19 0 0 20 34 45 40 13 32 6 8 27 30 1 0Comoros 18 25 32 47 12 14 89 94 99 90 85 96 23 23 41 38 16 15Congo ... 33 ... 58 5 5 ... 46 ... 72 ... 17 ... 9 ... 14 2 2Côte d’Ivoire 24 33 52 65 5 9 69 84 74 98 66 74 31 40 52 61 16 23Democratic Republic of the Congo 25 10 89 32 0 1 43 46 92 83 24 29 18 29 56 43 3 23Djibouti 32 35 40 40 11 11 78 80 82 82 67 67 48 50 55 55 27 27Egypt 61 80 89 98 40 67 94 98 97 100 92 97 54 68 70 84 42 56Equatorial Guinea 4 8 12 17 0 0 ... 44 ... 45 ... 42 ... 53 ... 60 ... 46Eritrea 6 8 40 42 0 0 40 57 60 72 36 54 8 9 46 34 0 3Ethiopia 1 4 4 23 0 0 25 22 80 81 16 11 4 6 14 19 2 4Gabon ... 45 ... 52 ... 8 ... 87 95 95 ... 47 ... 36 ... 37 ... 30Gambia ... 12 ... 39 3 3 ... 82 95 95 ... 77 ... 53 ... 72 ... 46Ghana 14 24 35 50 2 3 54 79 85 93 36 68 43 58 54 74 37 46Guinea 10 8 37 23 2 1 42 51 70 78 32 38 17 13 27 25 13 6Guinea-Bissau ... 5 ... 15 0 0 ... 59 ... 79 ... 49 ... 34 ... 57 ... 23Kenya 22 29 58 56 11 12 45 62 91 89 30 46 42 48 49 56 40 43Lesotho 7 7 31 31 2 2 ... 76 ... 88 ... 74 37 37 61 61 32 32Liberia 11 1 21 1 3 0 56 62 85 72 34 52 38 26 59 49 24 7
199Data tables
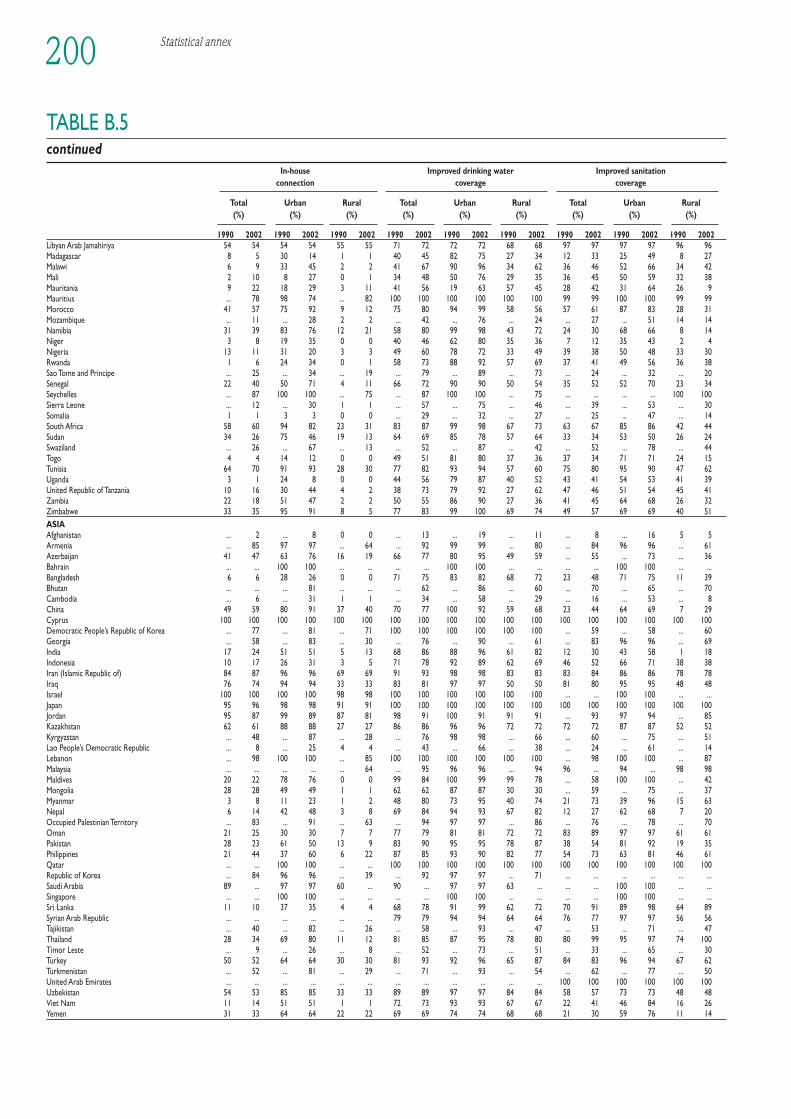
TABLE B.5continued
In-house Improved drinking water Improved sanitationconnection coverage coverage
Total Urban Rural Total Urban Rural Total Urban Rural(%) (%) (%) (%) (%) (%) (%) (%) (%)
1990 2002 1990 2002 1990 2002 1990 2002 1990 2002 1990 2002 1990 2002 1990 2002 1990 2002Libyan Arab Jamahiriya 54 54 54 54 55 55 71 72 72 72 68 68 97 97 97 97 96 96Madagascar 8 5 30 14 1 1 40 45 82 75 27 34 12 33 25 49 8 27Malawi 6 9 33 45 2 2 41 67 90 96 34 62 36 46 52 66 34 42Mali 2 10 8 27 0 1 34 48 50 76 29 35 36 45 50 59 32 38Mauritania 9 22 18 29 3 11 41 56 19 63 57 45 28 42 31 64 26 9Mauritius ... 78 98 74 ... 82 100 100 100 100 100 100 99 99 100 100 99 99Morocco 41 57 75 92 9 12 75 80 94 99 58 56 57 61 87 83 28 31Mozambique ... 11 ... 28 2 2 ... 42 ... 76 ... 24 ... 27 ... 51 14 14Namibia 31 39 83 76 12 21 58 80 99 98 43 72 24 30 68 66 8 14Niger 3 8 19 35 0 0 40 46 62 80 35 36 7 12 35 43 2 4Nigeria 13 11 31 20 3 3 49 60 78 72 33 49 39 38 50 48 33 30Rwanda 1 6 24 34 0 1 58 73 88 92 57 69 37 41 49 56 36 38Sao Tome and Principe ... 25 ... 34 ... 19 ... 79 ... 89 ... 73 ... 24 ... 32 ... 20Senegal 22 40 50 71 4 11 66 72 90 90 50 54 35 52 52 70 23 34Seychelles ... 87 100 100 ... 75 ... 87 100 100 ... 75 ... ... ... ... 100 100Sierra Leone ... 12 ... 30 1 1 ... 57 ... 75 ... 46 ... 39 ... 53 ... 30Somalia 1 1 3 3 0 0 ... 29 ... 32 ... 27 ... 25 ... 47 ... 14South Africa 58 60 94 82 23 31 83 87 99 98 67 73 63 67 85 86 42 44Sudan 34 26 75 46 19 13 64 69 85 78 57 64 33 34 53 50 26 24Swaziland ... 26 ... 67 ... 13 ... 52 ... 87 ... 42 ... 52 ... 78 ... 44Togo 4 4 14 12 0 0 49 51 81 80 37 36 37 34 71 71 24 15Tunisia 64 70 91 93 28 30 77 82 93 94 57 60 75 80 95 90 47 62Uganda 3 1 24 8 0 0 44 56 79 87 40 52 43 41 54 53 41 39United Republic of Tanzania 10 16 30 44 4 2 38 73 79 92 27 62 47 46 51 54 45 41Zambia 22 18 51 47 2 2 50 55 86 90 27 36 41 45 64 68 26 32Zimbabwe 33 35 95 91 8 5 77 83 99 100 69 74 49 57 69 69 40 51ASIAAfghanistan ... 2 ... 8 0 0 ... 13 ... 19 ... 11 ... 8 ... 16 5 5Armenia ... 85 97 97 ... 64 ... 92 99 99 ... 80 ... 84 96 96 ... 61Azerbaijan 41 47 63 76 16 19 66 77 80 95 49 59 ... 55 ... 73 ... 36Bahrain ... ... 100 100 ... ... ... ... 100 100 ... ... ... ... 100 100 ... ...Bangladesh 6 6 28 26 0 0 71 75 83 82 68 72 23 48 71 75 11 39Bhutan ... ... ... 81 ... ... ... 62 ... 86 ... 60 ... 70 ... 65 ... 70Cambodia ... 6 ... 31 1 1 ... 34 ... 58 ... 29 ... 16 ... 53 ... 8China 49 59 80 91 37 40 70 77 100 92 59 68 23 44 64 69 7 29Cyprus 100 100 100 100 100 100 100 100 100 100 100 100 100 100 100 100 100 100Democratic People’s Republic of Korea ... 77 ... 81 ... 71 100 100 100 100 100 100 ... 59 ... 58 ... 60Georgia ... 58 ... 83 ... 30 ... 76 ... 90 ... 61 ... 83 96 96 ... 69India 17 24 51 51 5 13 68 86 88 96 61 82 12 30 43 58 1 18Indonesia 10 17 26 31 3 5 71 78 92 89 62 69 46 52 66 71 38 38Iran (Islamic Republic of) 84 87 96 96 69 69 91 93 98 98 83 83 83 84 86 86 78 78Iraq 76 74 94 94 33 33 83 81 97 97 50 50 81 80 95 95 48 48Israel 100 100 100 100 98 98 100 100 100 100 100 100 ... ... 100 100 ... ...Japan 95 96 98 98 91 91 100 100 100 100 100 100 100 100 100 100 100 100Jordan 95 87 99 89 87 81 98 91 100 91 91 91 ... 93 97 94 ... 85Kazakhstan 62 61 88 88 27 27 86 86 96 96 72 72 72 72 87 87 52 52Kyrgyzstan ... 48 ... 87 ... 28 ... 76 98 98 ... 66 ... 60 ... 75 ... 51Lao People’s Democratic Republic ... 8 ... 25 4 4 ... 43 ... 66 ... 38 ... 24 ... 61 ... 14Lebanon ... 98 100 100 ... 85 100 100 100 100 100 100 ... 98 100 100 ... 87Malaysia ... ... ... ... ... 64 ... 95 96 96 ... 94 96 ... 94 ... 98 98Maldives 20 22 78 76 0 0 99 84 100 99 99 78 ... 58 100 100 ... 42Mongolia 28 28 49 49 1 1 62 62 87 87 30 30 ... 59 ... 75 ... 37Myanmar 3 8 11 23 1 2 48 80 73 95 40 74 21 73 39 96 15 63Nepal 6 14 42 48 3 8 69 84 94 93 67 82 12 27 62 68 7 20Occupied Palestinian Territory ... 83 ... 91 ... 63 ... 94 97 97 ... 86 ... 76 ... 78 ... 70Oman 21 25 30 30 7 7 77 79 81 81 72 72 83 89 97 97 61 61Pakistan 28 23 61 50 13 9 83 90 95 95 78 87 38 54 81 92 19 35Philippines 21 44 37 60 6 22 87 85 93 90 82 77 54 73 63 81 46 61Qatar ... ... 100 100 ... ... 100 100 100 100 100 100 100 100 100 100 100 100Republic of Korea ... 84 96 96 ... 39 ... 92 97 97 ... 71 ... ... ... ... ... ...Saudi Arabia 89 ... 97 97 60 ... 90 ... 97 97 63 ... ... ... 100 100 ... ...Singapore ... ... 100 100 ... ... ... ... 100 100 ... ... ... ... 100 100 ... ...Sri Lanka 11 10 37 35 4 4 68 78 91 99 62 72 70 91 89 98 64 89Syrian Arab Republic ... ... ... ... ... ... 79 79 94 94 64 64 76 77 97 97 56 56Tajikistan ... 40 ... 82 ... 26 ... 58 ... 93 ... 47 ... 53 ... 71 ... 47Thailand 28 34 69 80 11 12 81 85 87 95 78 80 80 99 95 97 74 100Timor Leste ... 9 ... 26 ... 8 ... 52 ... 73 ... 51 ... 33 ... 65 ... 30Turkey 50 52 64 64 30 30 81 93 92 96 65 87 84 83 96 94 67 62Turkmenistan ... 52 ... 81 ... 29 ... 71 ... 93 ... 54 ... 62 ... 77 ... 50United Arab Emirates ... ... ... ... ... ... ... ... ... ... ... ... 100 100 100 100 100 100Uzbekistan 54 53 85 85 33 33 89 89 97 97 84 84 58 57 73 73 48 48Viet Nam 11 14 51 51 1 1 72 73 93 93 67 67 22 41 46 84 16 26Yemen 31 33 64 64 22 22 69 69 74 74 68 68 21 30 59 76 11 14
200 Statistical annex
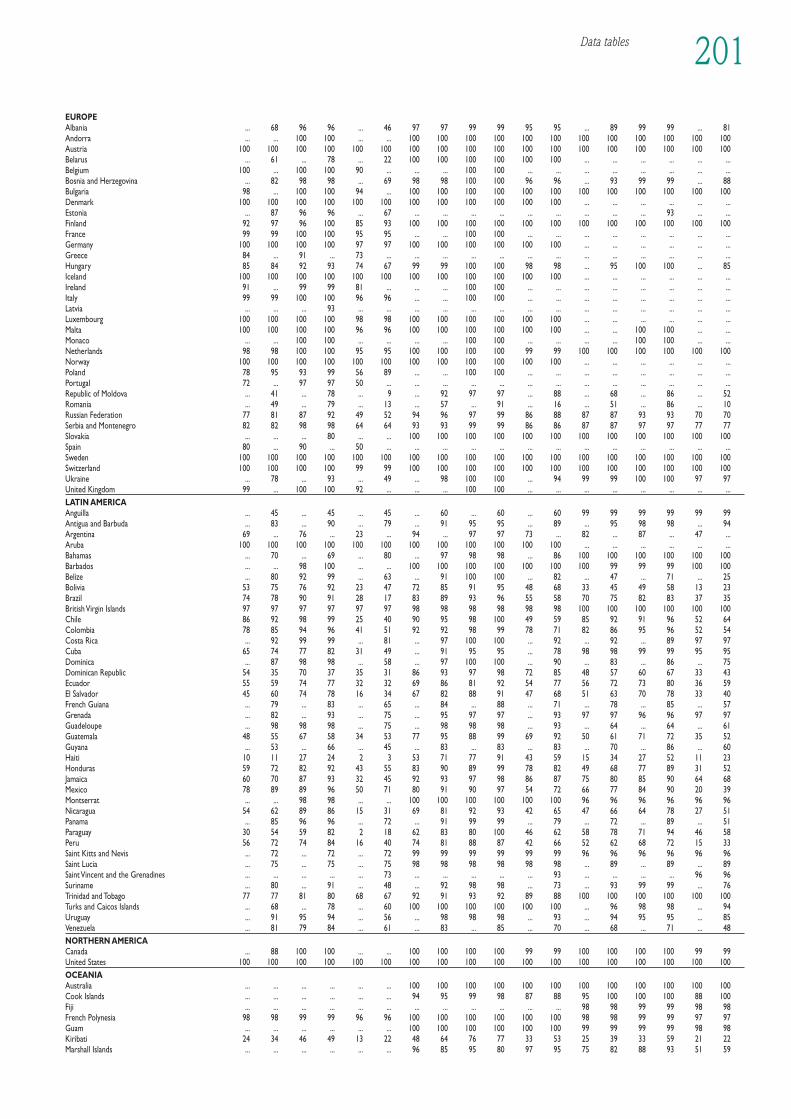
EUROPEAlbania ... 68 96 96 ... 46 97 97 99 99 95 95 ... 89 99 99 ... 81Andorra ... ... 100 100 ... ... 100 100 100 100 100 100 100 100 100 100 100 100Austria 100 100 100 100 100 100 100 100 100 100 100 100 100 100 100 100 100 100Belarus ... 61 ... 78 ... 22 100 100 100 100 100 100 ... ... ... ... ... ...Belgium 100 ... 100 100 90 ... ... ... 100 100 ... ... ... ... ... ... ... ...Bosnia and Herzegovina ... 82 98 98 ... 69 98 98 100 100 96 96 ... 93 99 99 ... 88Bulgaria 98 ... 100 100 94 ... 100 100 100 100 100 100 100 100 100 100 100 100Denmark 100 100 100 100 100 100 100 100 100 100 100 100 ... ... ... ... ... ...Estonia ... 87 96 96 ... 67 ... ... ... ... ... ... ... ... ... 93 ... ...Finland 92 97 96 100 85 93 100 100 100 100 100 100 100 100 100 100 100 100France 99 99 100 100 95 95 ... ... 100 100 ... ... ... ... ... ... ... ...Germany 100 100 100 100 97 97 100 100 100 100 100 100 ... ... ... ... ... ...Greece 84 ... 91 ... 73 ... ... ... ... ... ... ... ... ... ... ... ... ...Hungary 85 84 92 93 74 67 99 99 100 100 98 98 ... 95 100 100 ... 85Iceland 100 100 100 100 100 100 100 100 100 100 100 100 ... ... ... ... ... ...Ireland 91 ... 99 99 81 ... ... ... 100 100 ... ... ... ... ... ... ... ...Italy 99 99 100 100 96 96 ... ... 100 100 ... ... ... ... ... ... ... ...Latvia ... ... ... 93 ... ... ... ... ... ... ... ... ... ... ... ... ... ...Luxembourg 100 100 100 100 98 98 100 100 100 100 100 100 ... ... ... ... ... ...Malta 100 100 100 100 96 96 100 100 100 100 100 100 ... ... 100 100 ... ...Monaco ... ... 100 100 ... ... ... ... 100 100 ... ... ... ... 100 100 ... ...Netherlands 98 98 100 100 95 95 100 100 100 100 99 99 100 100 100 100 100 100Norway 100 100 100 100 100 100 100 100 100 100 100 100 ... ... ... ... ... ...Poland 78 95 93 99 56 89 ... ... 100 100 ... ... ... ... ... ... ... ...Portugal 72 ... 97 97 50 ... ... ... ... ... ... ... ... ... ... ... ... ...Republic of Moldova ... 41 ... 78 ... 9 ... 92 97 97 ... 88 ... 68 ... 86 ... 52Romania ... 49 ... 79 ... 13 ... 57 ... 91 ... 16 ... 51 ... 86 ... 10Russian Federation 77 81 87 92 49 52 94 96 97 99 86 88 87 87 93 93 70 70Serbia and Montenegro 82 82 98 98 64 64 93 93 99 99 86 86 87 87 97 97 77 77Slovakia ... ... ... 80 ... ... 100 100 100 100 100 100 100 100 100 100 100 100Spain 80 ... 90 ... 50 ... ... ... ... ... ... ... ... ... ... ... ... ...Sweden 100 100 100 100 100 100 100 100 100 100 100 100 100 100 100 100 100 100Switzerland 100 100 100 100 99 99 100 100 100 100 100 100 100 100 100 100 100 100Ukraine ... 78 ... 93 ... 49 ... 98 100 100 ... 94 99 99 100 100 97 97United Kingdom 99 ... 100 100 92 ... ... ... 100 100 ... ... ... ... ... ... ... ...LATIN AMERICAAnguilla ... 45 ... 45 ... 45 ... 60 ... 60 ... 60 99 99 99 99 99 99Antigua and Barbuda ... 83 ... 90 ... 79 ... 91 95 95 ... 89 ... 95 98 98 ... 94Argentina 69 ... 76 ... 23 ... 94 ... 97 97 73 ... 82 ... 87 ... 47 ...Aruba 100 100 100 100 100 100 100 100 100 100 100 100 ... ... ... ... ... ...Bahamas ... 70 ... 69 ... 80 ... 97 98 98 ... 86 100 100 100 100 100 100Barbados ... ... 98 100 ... ... 100 100 100 100 100 100 100 99 99 99 100 100Belize ... 80 92 99 ... 63 ... 91 100 100 ... 82 ... 47 ... 71 ... 25Bolivia 53 75 76 92 23 47 72 85 91 95 48 68 33 45 49 58 13 23Brazil 74 78 90 91 28 17 83 89 93 96 55 58 70 75 82 83 37 35British Virgin Islands 97 97 97 97 97 97 98 98 98 98 98 98 100 100 100 100 100 100Chile 86 92 98 99 25 40 90 95 98 100 49 59 85 92 91 96 52 64Colombia 78 85 94 96 41 51 92 92 98 99 78 71 82 86 95 96 52 54Costa Rica ... 92 99 99 ... 81 ... 97 100 100 ... 92 ... 92 ... 89 97 97Cuba 65 74 77 82 31 49 ... 91 95 95 ... 78 98 98 99 99 95 95Dominica ... 87 98 98 ... 58 ... 97 100 100 ... 90 ... 83 ... 86 ... 75Dominican Republic 54 35 70 37 35 31 86 93 97 98 72 85 48 57 60 67 33 43Ecuador 55 59 74 77 32 32 69 86 81 92 54 77 56 72 73 80 36 59El Salvador 45 60 74 78 16 34 67 82 88 91 47 68 51 63 70 78 33 40French Guiana ... 79 ... 83 ... 65 ... 84 ... 88 ... 71 ... 78 ... 85 ... 57Grenada ... 82 ... 93 ... 75 ... 95 97 97 ... 93 97 97 96 96 97 97Guadeloupe ... 98 98 98 ... 75 ... 98 98 98 ... 93 ... 64 ... 64 ... 61Guatemala 48 55 67 58 34 53 77 95 88 99 69 92 50 61 71 72 35 52Guyana ... 53 ... 66 ... 45 ... 83 ... 83 ... 83 ... 70 ... 86 ... 60Haiti 10 11 27 24 2 3 53 71 77 91 43 59 15 34 27 52 11 23Honduras 59 72 82 92 43 55 83 90 89 99 78 82 49 68 77 89 31 52Jamaica 60 70 87 93 32 45 92 93 97 98 86 87 75 80 85 90 64 68Mexico 78 89 89 96 50 71 80 91 90 97 54 72 66 77 84 90 20 39Montserrat ... ... 98 98 ... ... 100 100 100 100 100 100 96 96 96 96 96 96Nicaragua 54 62 89 86 15 31 69 81 92 93 42 65 47 66 64 78 27 51Panama ... 85 96 96 ... 72 ... 91 99 99 ... 79 ... 72 ... 89 ... 51Paraguay 30 54 59 82 2 18 62 83 80 100 46 62 58 78 71 94 46 58Peru 56 72 74 84 16 40 74 81 88 87 42 66 52 62 68 72 15 33Saint Kitts and Nevis ... 72 ... 72 ... 72 99 99 99 99 99 99 96 96 96 96 96 96Saint Lucia ... 75 ... 75 ... 75 98 98 98 98 98 98 ... 89 ... 89 ... 89Saint Vincent and the Grenadines ... ... ... ... ... 73 ... ... ... ... ... 93 ... ... ... ... 96 96Suriname ... 80 ... 91 ... 48 ... 92 98 98 ... 73 ... 93 99 99 ... 76Trinidad and Tobago 77 77 81 80 68 67 92 91 93 92 89 88 100 100 100 100 100 100Turks and Caicos Islands ... 68 ... 78 ... 60 100 100 100 100 100 100 ... 96 98 98 ... 94Uruguay ... 91 95 94 ... 56 ... 98 98 98 ... 93 ... 94 95 95 ... 85Venezuela ... 81 79 84 ... 61 ... 83 ... 85 ... 70 ... 68 ... 71 ... 48NORTHERN AMERICACanada ... 88 100 100 ... ... 100 100 100 100 99 99 100 100 100 100 99 99United States 100 100 100 100 100 100 100 100 100 100 100 100 100 100 100 100 100 100OCEANIAAustralia ... ... ... ... ... ... 100 100 100 100 100 100 100 100 100 100 100 100Cook Islands ... ... ... ... ... ... 94 95 99 98 87 88 95 100 100 100 88 100Fiji ... ... ... ... ... ... ... ... ... ... ... ... 98 98 99 99 98 98French Polynesia 98 98 99 99 96 96 100 100 100 100 100 100 98 98 99 99 97 97Guam ... ... ... ... ... ... 100 100 100 100 100 100 99 99 99 99 98 98Kiribati 24 34 46 49 13 22 48 64 76 77 33 53 25 39 33 59 21 22Marshall Islands ... ... ... ... ... ... 96 85 95 80 97 95 75 82 88 93 51 59
201Data tables
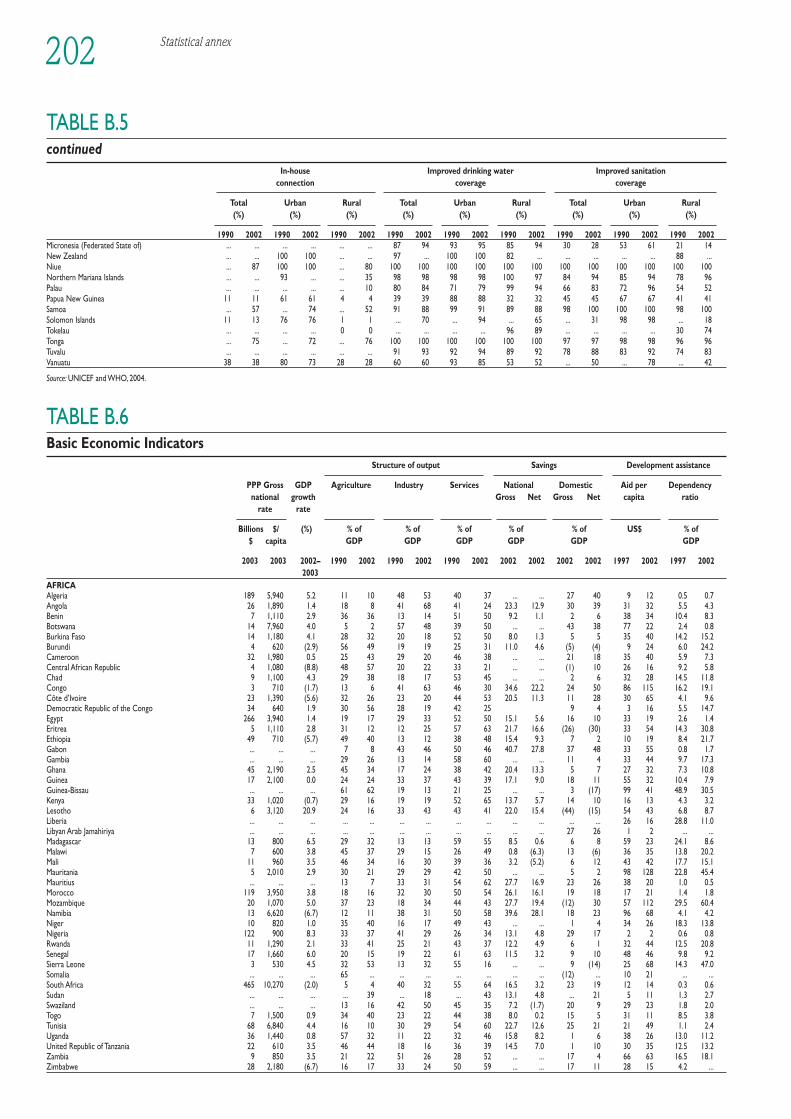
TABLE B.5continued
In-house Improved drinking water Improved sanitationconnection coverage coverage
Total Urban Rural Total Urban Rural Total Urban Rural(%) (%) (%) (%) (%) (%) (%) (%) (%)
1990 2002 1990 2002 1990 2002 1990 2002 1990 2002 1990 2002 1990 2002 1990 2002 1990 2002Micronesia (Federated State of) ... ... ... ... ... ... 87 94 93 95 85 94 30 28 53 61 21 14New Zealand ... ... 100 100 ... ... 97 ... 100 100 82 ... ... ... ... ... 88 ...Niue ... 87 100 100 ... 80 100 100 100 100 100 100 100 100 100 100 100 100Northern Mariana Islands ... ... 93 ... ... 35 98 98 98 98 100 97 84 94 85 94 78 96Palau ... ... ... ... ... 10 80 84 71 79 99 94 66 83 72 96 54 52Papua New Guinea 11 11 61 61 4 4 39 39 88 88 32 32 45 45 67 67 41 41Samoa ... 57 ... 74 ... 52 91 88 99 91 89 88 98 100 100 100 98 100Solomon Islands 11 13 76 76 1 1 ... 70 ... 94 ... 65 ... 31 98 98 ... 18Tokelau ... ... ... ... 0 0 ... ... ... ... 96 89 ... ... ... ... 30 74Tonga ... 75 ... 72 ... 76 100 100 100 100 100 100 97 97 98 98 96 96Tuvalu ... ... ... ... ... ... 91 93 92 94 89 92 78 88 83 92 74 83Vanuatu 38 38 80 73 28 28 60 60 93 85 53 52 ... 50 ... 78 ... 42
Source: UNICEF and WHO, 2004.
TABLE B.6Basic Economic Indicators
Structure of output Savings Development assistance
PPP Gross GDP Agriculture Industry Services National Domestic Aid per Dependencynational growth Gross Net Gross Net capita ratio
rate rate
Billions $/ (%) % of % of % of % of % of US$ % of $ capita GDP GDP GDP GDP GDP GDP
2003 2003 2002– 1990 2002 1990 2002 1990 2002 2002 2002 2002 2002 1997 2002 1997 20022003
AFRICAAlgeria 189 5,940 5.2 11 10 48 53 40 37 ... ... 27 40 9 12 0.5 0.7 Angola 26 1,890 1.4 18 8 41 68 41 24 23.3 12.9 30 39 31 32 5.5 4.3 Benin 7 1,110 2.9 36 36 13 14 51 50 9.2 1.1 2 6 38 34 10.4 8.3 Botswana 14 7,960 4.0 5 2 57 48 39 50 ... ... 43 38 77 22 2.4 0.8 Burkina Faso 14 1,180 4.1 28 32 20 18 52 50 8.0 1.3 5 5 35 40 14.2 15.2 Burundi 4 620 (2.9) 56 49 19 19 25 31 11.0 4.6 (5) (4) 9 24 6.0 24.2 Cameroon 32 1,980 0.5 25 43 29 20 46 38 ... ... 21 18 35 40 5.9 7.3 Central African Republic 4 1,080 (8.8) 48 57 20 22 33 21 ... ... (1) 10 26 16 9.2 5.8 Chad 9 1,100 4.3 29 38 18 17 53 45 ... ... 2 6 32 28 14.5 11.8 Congo 3 710 (1.7) 13 6 41 63 46 30 34.6 22.2 24 50 86 115 16.2 19.1 Côte d’Ivoire 23 1,390 (5.6) 32 26 23 20 44 53 20.5 11.3 11 28 30 65 4.1 9.6 Democratic Republic of the Congo 34 640 1.9 30 56 28 19 42 25 9 4 3 16 5.5 14.7 Egypt 266 3,940 1.4 19 17 29 33 52 50 15.1 5.6 16 10 33 19 2.6 1.4 Eritrea 5 1,110 2.8 31 12 12 25 57 63 21.7 16.6 (26) (30) 33 54 14.3 30.8 Ethiopia 49 710 (5.7) 49 40 13 12 38 48 15.4 9.3 7 2 10 19 8.4 21.7 Gabon ... ... ... 7 8 43 46 50 46 40.7 27.8 37 48 33 55 0.8 1.7 Gambia ... ... ... 29 26 13 14 58 60 ... ... 11 4 33 44 9.7 17.3 Ghana 45 2,190 2.5 45 34 17 24 38 42 20.4 13.3 5 7 27 32 7.3 10.8 Guinea 17 2,100 0.0 24 24 33 37 43 39 17.1 9.0 18 11 55 32 10.4 7.9 Guinea-Bissau ... ... ... 61 62 19 13 21 25 ... ... 3 (17) 99 41 48.9 30.5 Kenya 33 1,020 (0.7) 29 16 19 19 52 65 13.7 5.7 14 10 16 13 4.3 3.2 Lesotho 6 3,120 20.9 24 16 33 43 43 41 22.0 15.4 (44) (15) 54 43 6.8 8.7 Liberia ... ... ... ... ... ... ... ... ... ... ... ... ... 26 16 28.8 11.0 Libyan Arab Jamahiriya ... ... ... ... ... ... ... ... ... ... ... 27 26 1 2 ... ...Madagascar 13 800 6.5 29 32 13 13 59 55 8.5 0.6 6 8 59 23 24.1 8.6 Malawi 7 600 3.8 45 37 29 15 26 49 0.8 (6.3) 13 (6) 36 35 13.8 20.2 Mali 11 960 3.5 46 34 16 30 39 36 3.2 (5.2) 6 12 43 42 17.7 15.1 Mauritania 5 2,010 2.9 30 21 29 29 42 50 ... ... 5 2 98 128 22.8 45.4 Mauritius ... ... ... 13 7 33 31 54 62 27.7 16.9 23 26 38 20 1.0 0.5 Morocco 119 3,950 3.8 18 16 32 30 50 54 26.1 16.1 19 18 17 21 1.4 1.8 Mozambique 20 1,070 5.0 37 23 18 34 44 43 27.7 19.4 (12) 30 57 112 29.5 60.4 Namibia 13 6,620 (6.7) 12 11 38 31 50 58 39.6 28.1 18 23 96 68 4.1 4.2 Niger 10 820 1.0 35 40 16 17 49 43 ... ... 1 4 34 26 18.3 13.8 Nigeria 122 900 8.3 33 37 41 29 26 34 13.1 4.8 29 17 2 2 0.6 0.8 Rwanda 11 1,290 2.1 33 41 25 21 43 37 12.2 4.9 6 1 32 44 12.5 20.8 Senegal 17 1,660 6.0 20 15 19 22 61 63 11.5 3.2 9 10 48 46 9.8 9.2 Sierra Leone 3 530 4.5 32 53 13 32 55 16 ... ... 9 (14) 25 68 14.3 47.0 Somalia ... ... ... 65 ... ... ... ... ... ... ... (12) ... 10 21 ... ...South Africa 465 10,270 (2.0) 5 4 40 32 55 64 16.5 3.2 23 19 12 14 0.3 0.6 Sudan ... ... ... ... 39 ... 18 ... 43 13.1 4.8 ... 21 5 11 1.3 2.7 Swaziland ... ... ... 13 16 42 50 45 35 7.2 (1.7) 20 9 29 23 1.8 2.0 Togo 7 1,500 0.9 34 40 23 22 44 38 8.0 0.2 15 5 31 11 8.5 3.8 Tunisia 68 6,840 4.4 16 10 30 29 54 60 22.7 12.6 25 21 21 49 1.1 2.4 Uganda 36 1,440 0.8 57 32 11 22 32 46 15.8 8.2 1 6 38 26 13.0 11.2 United Republic of Tanzania 22 610 3.5 46 44 18 16 36 39 14.5 7.0 1 10 30 35 12.5 13.2 Zambia 9 850 3.5 21 22 51 26 28 52 ... ... 17 4 66 63 16.5 18.1 Zimbabwe 28 2,180 (6.7) 16 17 33 24 50 59 ... ... 17 11 28 15 4.2 ...
202 Statistical annex

ASIAAfghanistan ... ... ... ... 52 ... 24 ... 24 ... ... ... (16) 10 46 ... ...Armenia 12 3,770 11.9 17 26 52 37 31 37 13.9 5.3 36 3 52 96 9.6 12.0 Azerbaijan 28 3,380 10.5 30 16 33 52 37 32 21.5 6.5 31 25 23 43 4.7 6.1 Bangladesh 258 1,870 3.5 30 23 21 26 48 51 28.5 22.7 10 18 8 7 2.3 1.8 Cambodia 28 2,060 5.8 ... 36 ... 28 ... 36 18.5 11.2 2 14 30 39 10.1 12.7 China 6,435 4,990 8.4 27 15 42 51 31 34 43.7 34.7 38 43 2 1 0.2 0.1 China, Hong Kong SAR 196 28,810 2.9 0 0 25 13 74 87 32.1 19.2 36 32 1 1 0.0 0.0 Democratic People’s Rep. of Korea ... ... ... ... ... ... ... ... ... ... ... ... ... 4 12 ... ...Georgia 13 2,540 9.4 32 21 33 23 35 56 15.0 (0.7) 25 9 45 60 6.5 9.2 India 3,068 2,880 6.4 31 23 28 27 41 51 22.3 12.6 23 22 2 1 0.4 0.3 Indonesia 689 3,210 2.8 19 17 39 44 41 38 18.2 12.7 32 21 4 6 0.4 0.8 Iran (Islamic Republic of) 477 7,190 4.4 24 12 29 39 48 49 38.9 29.2 27 37 3 2 0.2 0.1 Iraq ... ... ... ... ... ... ... ... ... ... ... ... ... 10 5 ... ...Israel 128 19,200 (0.8) ... ... ... ... ... ... 13.4 0.2 14 9 205 115 1.2 0.7 Japan 3,641 28,620 2.7 8 2 28 26 64 72 27.2 11.4 34 26 .. .. .. ..Jordan 23 4,290 0.5 ... ... ... ... ... ... 26.2 15.6 1 3 104 103 6.6 5.8 Kazakhstan 92 6,170 8.7 27 9 45 39 29 53 25.5 15.5 30 28 9 13 0.6 0.8 Kuwait 42 17,870 (3.3) 1 ... 52 ... 47 ... 19.4 12.7 4 18 0 2 0.0 0.0 Kyrgyzstan 8 1,660 3.9 34 39 36 26 30 35 17.4 9.2 4 15 51 37 14.1 12.0 Lao People’s Democratic Republic 10 1,730 2.6 61 51 15 23 24 26 ... ... ... ... 67 50 19.3 17.3 Lebanon 22 4,840 1.4 ... 12 ... 21 ... 67 2.1 (8.2) (64) (9) 61 103 1.6 2.5 Malaysia 222 8,940 3.2 15 9 42 47 43 44 34.5 22.8 34 42 (11) 4 (0.3) 0.1 Mongolia 4 1,800 3.4 17 30 30 16 52 54 26.7 14.6 9 16 108 85 28.1 18.6 Myanmar ... ... ... 57 57 11 10 32 33 12.4 ... 11 12 1 2 ... ...Nepal 35 1,420 0.7 52 41 16 22 32 38 22.1 19.8 7 12 19 15 8.2 6.6 Oman ... ... ... 3 ... 58 ... 39 ... ... ... 35 34 29 16 0.4 0.2 Pakistan 306 2,060 3.3 26 23 25 23 49 53 25.6 17.9 11 14 5 15 1.0 3.6 Philippines 379 4,640 2.5 22 15 34 33 44 53 24.5 16.5 18 19 10 7 0.8 0.7 Republic of Korea 859 17,930 2.4 9 4 43 41 48 55 27.3 15.3 37 27 (3) (2) 0.0 0.0 Saudi Arabia 281 12,850 (1.8) 6 5 49 51 45 44 28.9 18.9 24 37 1 1 0.0 0.0 Singapore 103 24,180 (1.0) ... 0 ... 36 ... 64 42.7 28.3 43 45 1 2 0.0 0.0 Sri Lanka 72 3,730 4.3 26 20 26 26 48 54 19.9 14.8 14 14 19 18 2.2 2.1 Syrian Arab Republic 60 3,430 0.0 28 23 24 28 48 49 24.3 13.9 17 30 13 5 1.4 0.4 Tajikistan 7 1,040 7.8 33 24 38 24 29 52 5.0 (2.5) 17 10 14 27 8.0 14.6 Thailand 462 7,450 6.1 12 9 37 43 50 48 30.4 15.5 34 31 11 5 0.4 0.2 Turkey 473 6,690 4.2 18 13 30 27 52 60 16.7 9.8 20 16 0 9 0.0 0.4 Turkmenistan 28 5,840 15.3 32 29 30 51 38 20 36.3 26.6 28 36 3 8 0.4 ...United Arab Emirates ... ... ... 2 ... 64 ... 35 ... ... ... 45 ... 1 1 0.0 ...Uzbekistan 44 1,720 3.0 33 35 33 22 34 44 17.2 7.3 13 24 6 7 1.3 2.4 Viet Nam 202 2,490 6.1 39 23 23 39 39 38 33.6 25.4 3 28 13 16 3.8 3.6 Yemen 16 820 0.7 24 15 27 40 49 44 24.1 14.6 9 16 22 31 5.6 6.3 EUROPEAlbania 15 4,700 6.9 36 25 48 19 16 56 13.8 4.7 21 (1) 53 101 7.5 6.4 Austria 239 29,610 0.6 4 2 34 32 62 66 21.4 7.0 26 23 .. .. .. ..Belarus 59 6,010 6.1 24 11 47 37 29 52 18.6 9.3 29 18 5 4 0.4 0.3 Belgium 299 28,930 1.0 2 1 33 27 65 72 23.4 8.9 24 23 .. .. .. ..Bosnia and Herzegovina 26 6,320 3.0 ... 18 ... 37 ... 45 7.5 (1.0) ... (13) 236 143 26.1 10.0 Bulgaria 60 7,610 4.9 17 13 49 28 34 59 15.4 5.1 22 13 26 48 2.2 2.5 Croatia 48 10,710 4.0 10 8 34 30 56 62 21.2 9.7 2 18 9 37 0.2 0.8 Czech Republic 160 15,650 2.9 6 4 49 40 45 57 23.0 10.7 28 26 11 38 0.2 0.6 Denmark 168 31,213 0.2 4 3 27 27 69 71 23.4 8.0 25 26 .. .. .. ..Estonia 17 12,480 5.3 17 5 50 30 34 65 20.2 6.0 22 22 47 51 1.5 1.1 Finland 141 27,100 1.7 6 3 35 33 59 64 27.0 11.0 29 28 .. .. .. ..France 1,640 27,460 (0.3) 4 3 30 25 66 72 21.1 8.7 22 21 .. .. .. ..Germany 2,267 27,460 (0.1) 2 1 39 30 59 69 20.4 5.5 24 22 .. .. .. ..Greece 213 19,920 4.2 11 7 28 22 61 70 19.7 11.0 13 17 .. .. .. ..Hungary 139 13,780 0.7 15 4 39 31 46 65 23.5 11.7 28 22 18 46 0.4 0.7 Ireland 120 30,450 1.1 9 3 35 42 56 54 28.0 15.5 26 38 .. .. .. ..Italy 1,543 26,760 0.4 4 3 34 29 63 69 19.8 6.1 22 21 .. .. .. ..Latvia 24 10,130 8.1 22 5 46 25 32 71 19.6 8.9 39 17 33 37 1.4 1.0 Lithuania 38 11,090 7.0 27 7 31 31 42 62 17.4 7.2 24 17 29 42 1.1 1.1 Netherlands 464 28,600 (0.9) 4 3 30 26 65 71 22.2 7.2 27 26 .. .. .. ..Norway 170 37,300 (0.2) 4 2 36 38 61 60 32.0 16.1 30 33 .. .. .. ..Poland 437 11,450 4.9 8 3 50 30 42 66 16.6 5.4 33 16 22 30 0.6 0.6 Portugal 183 17,980 (0.9) 9 4 32 30 60 66 19.3 4.0 21 18 .. .. .. ..Republic of Moldova 7 1,750 6.5 43 24 33 25 24 51 14.4 7.2 23 (3) 15 33 3.3 8.0 Romania 159 7,140 5.6 24 13 50 38 26 49 19.9 10.0 21 17 10 31 0.6 1.5 Russian Federation 1,279 8,920 7.8 17 6 48 34 35 60 30.6 20.1 30 32 5 9 0.2 0.4 Serbia and Montenegro ... ... 5.5 ... 15 ... 32 ... 53 ... ... ... (7) 9 237 ... 12.4 Slovakia 72 13,420 4.8 7 4 59 29 33 67 23.2 12.0 24 24 13 35 0.3 0.8 Slovenia 38 19,240 3.5 6 3 46 36 49 61 25.2 13.5 26 25 50 87 0.5 0.8 Spain 905 22,020 1.9 6 3 35 30 59 66 24.0 11.1 23 24 .. .. .. ..Sweden 238 26,620 1.2 4 2 32 28 64 70 21.4 8.0 25 23 .. .. .. ..Switzerland 235 32,030 (1.2) ... 1 ... 27 ... 72 26.8 12.0 29 24 .. .. .. ..TFYR Macedonia 14 6,720 2.5 9 12 46 30 46 57 12.9 3.1 9 0 49 136 2.7 7.4 Ukraine 262 5,410 10.2 26 15 45 38 30 47 27.1 8.1 26 24 5 10 0.5 1.2 United Kingdom 1,639 27,650 2.1 2 1 35 26 63 73 14.4 3.1 18 14 .. .. .. ..LATIN AMERICAArgentina 419 10,920 3.3 8 11 36 32 56 57 22.3 11.2 20 27 3 0 0.0 0.0 Bolivia 22 2,450 (0.8) 17 15 39 33 44 52 12.2 3.1 11 10 89 77 9.1 9.0 Brazil 1,322 7,480 (1.4) 8 6 39 21 53 73 19.7 8.9 21 22 2 2 0.0 0.1 Chile 155 9,810 2.0 9 9 41 34 50 57 24.5 14.4 28 27 9 (1) 0.2 0.0 Colombia 290 6,520 2.0 17 14 38 30 45 56 13.7 3.2 24 14 5 10 0.2 0.6 Costa Rica 36 9,040 3.9 18 8 29 29 53 62 15.1 9.2 21 17 (2) 1 (0.1) 0.0 Cuba ... ... ... ... 7 ... 46 ... 47 ... ... ... 7 6 5 0.3 ...Dominican Republic 54 6,210 (2.2) 13 12 31 33 55 55 20.4 15.1 15 15 9 18 0.5 0.8 Ecuador 45 3,440 0.9 13 9 38 28 49 63 ... ... 22 20 13 17 0.7 1.0 El Salvador 32 4,890 1.8 17 9 27 30 56 61 14.2 3.8 1 2 47 36 2.5 1.7
203Data tables

TABLE B.6continued
Structure of output Savings Development assistance
PPP Gross GDP Agriculture Industry Services National Domestic Aid per Dependencynational growth Gross Net Gross Net capita ratio
rate rate
Billions $/ (%) % of % of % of % of % of US$ % of $ capita GDP GDP GDP GDP GDP GDP
2003 2003 2002– 1990 2002 1990 2002 1990 2002 2002 2002 2002 2002 1997 2002 1997 20022003
Guatemala 50 4,060 (0.5) 26 22 20 19 54 58 14.8 4.7 10 7 25 21 1.5 1.1 Haiti 14 1,630 (1.8) ... ... ... ... ... ... ... ... 11 (3) 43 19 9.9 4.5 Honduras 18 2,580 (0.5) 22 13 26 31 51 56 23.3 17.7 20 12 50 64 6.6 6.8 Jamaica 10 3,790 1.1 7 6 40 31 52 63 20.7 9.1 22 13 28 9 1.1 0.3 Mexico 915 8,950 (0.1) 8 4 28 27 64 69 18.3 7.8 22 18 1 1 0.0 0.0 Nicaragua 13 2,400 (0.2) 31 18 21 25 48 57 11.2 ... (2) 6 88 97 24.1 13.6 Panama 19 6,310 2.3 9 6 15 14 76 80 24.2 16.6 21 24 17 12 0.5 0.3 Paraguay 27 4,740 (0.3) 28 22 25 29 47 49 14.2 5.2 17 8 22 10 1.1 1.0 Peru 138 5,090 2.4 9 8 27 28 64 64 17.2 6.7 18 18 16 18 0.7 0.9 Puerto Rico ... ... ... 1 1 42 43 57 56 ... ... 21 ... ... ... ... ...Trinidad and Tobago ... ... ... 3 2 46 42 51 56 28.9 17.0 29 20 26 (6) 0.6 (0.1)Uruguay 27 7,980 1.9 9 9 35 27 56 64 13.5 2.4 18 14 11 4 0.2 0.1 Venezuela 121 4,740 (10.9) 5 3 50 43 44 54 26.6 19.2 29 29 0 2 0.0 0.1 NORTHERN AMERICACanada 941 29,740 0.9 3 ... 32 ... 65 ... 23.2 10.2 21 25 .. .. .. ..United States 10,914 37,500 2.0 2 2 28 23 70 75 14.4 2.6 16 14 .. .. .. ..OCEANIAAustralia 563 28,290 1.2 4 4 29 26 67 71 19.7 3.5 22 22 .. .. .. ..New Zealand 85 21,120 0.9 7 ... 28 ... 65 ... 19.4 8.6 20 22 .. .. .. ..Papua New Guinea 12 2,240 0.2 29 27 30 42 41 32 ... ... 16 ... 73 38 7.4 7.5
Source: World Bank, 2004e.
TABLE B.7Investment in Infrastructure and Foreign Direct Investment
Domestic credit Investment in infrastructure projects Foreign directto private sector with private participation investment
Telecommunications Energy Transport Water and sanitation In Out
% of GDP US$ millions % of GDP
1990 2002 1990– 1996– 1990– 1996– 1990– 1996– 1990– 1996– 2003 2003 1990 20021995 2002 1995 2002 1995 2002 1995 2002
AFRICAAlgeria 44.4 6.8 ... 501.5 2,300.0 ... ... ... ... ... 634 14 0.0 1.9 Angola ... 4.7 ... 75.3 ... ... ... ... ... ... 1,415 ... (3.3) 11.7 Benin 20.3 11.8 ... 90.4 ... ... ... ... ... ... 51 3 3.4 1.5 Botswana 9.4 18.4 ... 80.0 ... ... ... ... ... ... 86 40 2.5 0.7 Burkina Faso 16.8 13.5 ... 36.6 ... 5.6 ... ... ... ... 11 ... 0.0 0.3 Burundi 12.7 26.1 0.5 15.6 ... ... ... ... ... ... ... ... 0.1 0.0 Cameroon 26.7 10.2 ... 266.1 ... 91.9 30.8 95.0 ... ... 215 3 (1.0) 1.0 Central African Republic 7.2 5.7 1.1 ... ... ... ... ... 0.7 ... 4 ... 0.0 0.4 Chad 7.3 4.1 ... 13.0 ... ... ... ... ... ... 837 ... 0.5 45.0 Comoros ... ... ... ... ... ... ... ... ... ... 1 ... ... ...Congo 15.7 2.9 4.6 111.9 ... 325.0 ... ... ... ... 386 2 0.0 11.0 Côte d’Ivoire 36.5 14.8 ... 827.4 147.2 223.0 ... 178.0 ... ... 389 ... 0.4 2.0 Democratic Republic of the Congo 1.8 0.7 ... 369.7 ... ... ... ... ... ... 158 ... (0.2) 0.6 Djibouti ... ... ... ... ... ... ... ... ... ... 11 1 ... ...Egypt 30.6 60.6 ... 2,895.4 ... 1,378.0 ... 1,057.2 6.0 ... 237 14 1.7 0.7 Equatorial Guinea ... ... ... ... ... ... ... ... ... ... 1,431 ... ...Eritrea ... 32.4 ... 40.0 ... ... ... ... ... ... 22 ... ... 3.3 Ethiopia 19.5 26.7 ... ... ... ... ... ... ... ... 60 25 0.1 1.2 Gabon 13.0 12.0 ... 35.0 ... 624.8 ... 46.7 ... ... 53 ... 1.2 2.5 Gambia 11.0 17.3 ... 6.6 ... ... ... ... ... ... 60 7 0.0 12.0 Ghana 4.9 12.0 25.0 436.1 ... 132.8 ... 10.0 ... ... 137 55 0.3 0.8 Guinea 3.5 3.8 45.0 75.3 36.4 ... ... ... ... ... 8 2 0.6 0.0 Guinea-Bissau 22.0 3.0 ... ... 23.2 ... ... ... ... ... 2 ... 0.8 0.5 Kenya 32.8 23.4 ... 107.0 ... 171.5 ... 53.4 ... ... 82 2 0.7 0.4 Lesotho 15.8 14.3 ... 33.5 ... ... ... ... ... ... 42 ... 2.8 11.3 Liberia 30.9 3.2 ... ... ... ... ... ... ... ... - 130 0.0 (11.6)Libyan Arab Jamahiriya 31.0 18.0 ... ... ... ... ... ... ... ... 700 100 ... ...Madagascar 16.9 9.3 5.0 10.1 ... ... ... 20.3 ... ... 50 ... 0.7 0.2 Malawi 10.9 4.1 8.0 25.5 ... ... ... 6.0 ... ... 23 3 1.2 0.3 Mali 12.8 17.6 ... 42.7 0.1 747.0 ... ... ... ... 129 13 0.2 3.0 Mauritania 43.5 31.7 ... 99.6 ... ... ... ... ... ... 214 ... 0.7 1.2 Mauritius 35.6 61.3 ... 365.6 ... 109.3 ... 42.6 ... ... 70 41 1.7 0.6 Morocco 34.0 54.4 ... 3,643.0 2,300.0 4,819.9 ... ... ... 1,000.0 2,279 12 0.6 1.2 Mozambique 17.6 2.1 ... 44.0 ... 1,200.0 ... 959.7 ... 0.6 337 ... 0.4 11.3
204 Statistical annex

Namibia 22.6 48.4 18.0 4.0 ... 5.0 ... 450.0 ... ... 84 (6) ... ...Niger 12.3 5.0 ... 52.7 ... ... ... ... ... 4.9 31 (1) 1.6 0.4 Nigeria 9.4 17.8 ... 982.7 ... 225.0 ... 22.8 ... ... 1,200 93 2.1 2.9 Rwanda 6.9 10.3 ... 15.6 ... ... ... ... ... ... 5 ... 0.3 0.2 Senegal 26.5 19.6 ... 406.8 ... 124.0 ... ... ... 6.3 78 11 1.0 1.9 Seychelles ... ... ... ... ... ... ... ... ... ... 58 8 ... ...Sierra Leone 3.2 3.5 ... 23.5 ... ... ... ... ... ... 8 ... 5.0 0.6 Somalia ... ... ... 2.0 ... ... ... ... ... ... 1 ... 0.6 ...South Africa 81.0 131.7 1,072.8 10,654.8 3.0 1,244.3 ... 1,874.1 ... 212.5 762 720 ... 0.7 Sudan 4.8 5.0 ... 6.0 ... ... ... ... ... ... 1,349 ... 0.0 4.7 Swaziland 20.7 14.3 ... 33.6 ... ... ... ... ... ... 44 ... 3.4 3.8 Togo 22.6 13.3 ... 5.0 ... ... ... ... ... ... 20 (2) 1.1 5.4 Tunisia 66.2 68.6 ... 277.0 627.0 265.0 ... ... ... ... 584 1 0.6 3.8 Uganda 4.0 6.7 8.8 204.1 ... ... ... ... ... ... 283 (15) 0.0 2.6 United Republic of Tanzania 13.9 6.3 30.1 321.0 6.0 490.0 ... 23.0 ... ... 248 ... 0.0 2.6 Zambia 8.9 6.2 ... 56.9 ... 289.4 ... ... ... ... 100 ... 6.2 5.3 Zimbabwe 23.0 37.0 ... 46.0 ... 603.0 18.0 70.0 ... ... 20 5 (0.1) 0.3 ASIAAfghanistan ... ... ... 70.0 ... ... ... ... ... ... 1 ... ... ...Armenia 40.4 6.9 ... 468.4 ... 12.0 ... 50.0 ... ... 155 ... ... 4.7 Azerbaijan 10.8 5.6 14.0 144.6 ... 375.2 ... ... ... ... 3,285 933 ... 22.9 Bahrain ... ... ... ... ... ... ... ... ... ... 517 741 ... ...Bangladesh 16.7 28.9 146.0 594.4 ... 1,040.2 ... 25.0 ... ... 121 8 0.0 0.1 Brunei Darussalam ... ... ... ... ... ... ... ... ... ... 2,009 5 ... ...Cambodia ... 6.8 31.6 155.7 ... 123.2 120.0 72.2 ... ... 87 10 0.0 1.3 China 87.7 136.5 ... 13,024.7 6,113.5 14,301.6 6,219.8 15,849.8 104.0 1,992.4 53,505 1,800 1.0 3.9 China, Hong Kong SAR 163.7 150.1 ... ... ... ... ... ... ... ... 13,561 3,769 ... 7.9 China, Macao SAR ... ... ... ... ... ... ... ... ... ... 350 24 ... ...Cyprus ... ... ... ... ... ... ... ... ... ... 830 345 ... ...Democratic People’s Republic of Korea ... ... ... ... ... ... ... ... ... ... -5 ... ... ...Georgia ... 8.1 21.6 43.8 ... 36.0 ... ... ... ... 338 4 0.0 4.9 India 25.2 32.6 720.5 14,950.0 2,888.5 9,680.5 126.9 1,969.1 ... 216.0 4,269 913 0.1 0.6 Indonesia 46.9 22.3 3,549.0 9,215.5 3,202.5 7,534.7 1,204.9 2,314.6 3.8 919.5 -597 130 1.0 (0.9)Iran (Islamic Republic of) 32.5 34.3 5.0 28.0 ... ... ... ... ... ... 120 1,486 (0.3) 0.0 Iraq ... ... ... ... ... ... ... ... ... ... ... ... ...Israel 57.6 97.8 ... ... ... ... ... ... ... ... 3,745 1,774 0.3 1.6 Japan 195.1 175.3 ... ... ... ... ... ... ... ... 6,324 28,800 0.1 0.2 Jordan 72.3 73.5 43.0 967.9 ... ... ... 182.0 ... 209.0 379 3 0.9 0.6 Kazakhstan ... 18.6 30.0 1,849.5 ... 2,125.0 ... ... ... 40.0 2,068 4 0.4 10.5 Kuwait 52.1 73.8 ... ... ... ... ... ... ... ... 67 (4,989) 0.0 0.0 Kyrgyzstan ... 4.2 ... 94.0 ... ... ... ... ... ... 25 5 0.0 0.3 Lao People’s Democratic Republic 1.0 8.4 ... 185.5 ... 535.5 ... 100.0 ... ... 19 76 0.7 1.5 Lebanon 79.4 90.8 100.0 550.9 ... ... ... 200.0 ... ... 358 97 0.2 1.5 Malaysia 108.5 146.1 2,630.0 3,241.6 6,909.5 2,131.6 4,657.6 7,919.0 3,986.7 1,105.5 2,474 1,370 5.3 3.4 Maldives ... ... ... ... ... ... ... ... ... ... 12 ... ... ...Mongolia 19.0 18.8 13.1 20.4 ... ... ... ... ... ... 132 ... ... 7.0 Myanmar 4.7 12.1 4.0 ... 394.0 ... ... 50.0 ... ... 128 ... ... ...Nepal 12.8 30.7 ... 45.6 131.4 137.2 ... ... ... ... 30 ... 0.0 0.2 Oman 22.9 38.6 ... ... 204.5 998.3 ... 546.1 ... ... 138 97 1.4 0.2 Pakistan 27.7 27.9 602.0 343.0 3,417.3 2,519.7 299.6 118.7 ... ... 1,405 19 0.6 1.4 Philippines 22.3 36.4 1,279.0 6,700.0 6,831.3 7,013.1 300.0 2,007.5 ... 5,867.7 319 158 1.2 1.4 Qatar ... ... ... ... ... ... ... ... ... ... 400 71 ... ...Republic of Korea 65.5 115.6 2,650.0 17,600.0 ... 2,690.0 2,280.0 5,950.0 ... ... 3,752 3,429 0.3 0.4 Saudi Arabia 54.7 58.2 ... ... ... ... ... ... ... ... 208 54 ... ...Singapore 96.8 115.5 ... ... ... ... ... ... ... ... 11,409 5,536 15.1 7.0 Sri Lanka 19.6 28.5 43.6 849.6 21.7 286.6 ... 240.0 ... ... 229 4 0.5 1.5 Syrian Arab Republic 7.5 8.0 ... 130.0 ... ... ... ... ... ... 150 ... 0.6 1.1 Tajikistan ... 18.8 ... 1.0 ... ... ... ... ... ... 32 ... 0.5 0.7 Thailand 83.4 102.5 4,814.0 5,116.2 2,059.6 6,981.0 2,395.9 546.4 153.0 347.5 1,802 557 2.9 0.7 Turkey 16.7 14.9 190.3 7,875.4 2,478.0 5,167.2 ... 724.8 ... 942.0 575 499 0.5 0.6 Turkmenistan ... 2.3 ... ... ... ... ... ... ... ... 100 ... ... 1.3 United Arab Emirates 37.4 55.9 ... ... ... ... ... ... ... ... 480 992 ... ...Uzbekistan ... ... 2.5 367.4 ... ... ... ... ... ... 70 ... 0.1 0.8 Viet Nam 2.5 43.1 128.0 18.0 ... 2,215.5 10.0 115.0 ... 212.8 1,450 ... 2.8 4.0 Yemen 6.1 6.2 25.0 340.0 ... ... ... 190.0 ... ... -89 ... (2.7) 1.1 EUROPEAlbania ... 6.8 ... 283.2 ... 8.0 ... ... ... ... 180 3 0.0 2.8 Austria 91.6 106.4 ... ... ... ... ... ... ... ... 6,855 7,083 0.4 0.4 Belarus ... 9.1 10.0 180.3 ... 500.0 ... ... ... ... 171 2 ... 1.7 Belgium 37.0 76.3 ... ... ... ... ... ... ... ... 29,484 36,646 4.1 ...Bosnia and Herzegovina ... 36.3 ... ... ... ... ... ... ... ... 381 ... ... 5.2 Bulgaria 7.2 18.4 64.0 547.3 ... ... ... ... ... 152.0 1,419 22 0.5 3.9 Croatia ... 51.6 ... 1,425.5 ... 375.6 ... 672.2 ... 298.7 1,713 62 ... 4.4 Czech Republic ... 33.4 876.0 7,960.9 356.0 4,718.9 263.7 126.7 36.5 314.6 2,583 232 ... 13.4 Denmark 52.2 146.4 ... ... ... ... ... ... ... ... 2,608 1,158 0.8 3.7 Estonia 20.2 29.2 211.7 629.0 ... 26.5 ... 299.4 ... 81.0 891 148 2.1 4.4 Finland 86.5 60.0 ... ... ... ... ... ... ... ... 2,765 (7,370) 0.6 6.2 France 96.1 87.2 ... ... ... ... ... ... ... ... 46,981 57,279 1.1 3.6 Germany 90.6 118.9 ... ... ... ... ... ... ... ... 12,866 2,560 0.2 1.9 Gibraltar ... ... ... ... ... ... ... ... ... ... 20 ... ... ...Greece 36.3 67.1 ... ... ... ... ... ... ... ... 47 586 1.2 0.0 Hungary 46.6 35.3 3,510.9 5,298.9 2,156.7 1,906.1 1,004.0 135.0 10.9 167.6 2,470 1,581 0.9 1.3 Iceland ... ... ... ... ... ... ... ... ... ... 147 168 ... ...Ireland 47.6 110.3 ... ... ... ... ... ... ... ... 25,497 1,911 1.3 20.3 Italy 56.5 82.3 ... ... ... ... ... ... ... ... 16,421 9,121 0.6 1.2 Latvia ... 29.0 230.0 894.9 ... 177.1 ... 75.0 ... ... 360 32 0.6 4.5 Lithuania ... 14.2 74.0 1,345.0 ... 20.0 ... ... ... ... 179 37 0.0 5.2 Luxembourg ... ... ... ... ... ... ... ... ... ... 87,557 95,991 ... ...Malta ... ... ... ... ... ... ... ... ... ... 380 24 ... ...
205Data tables
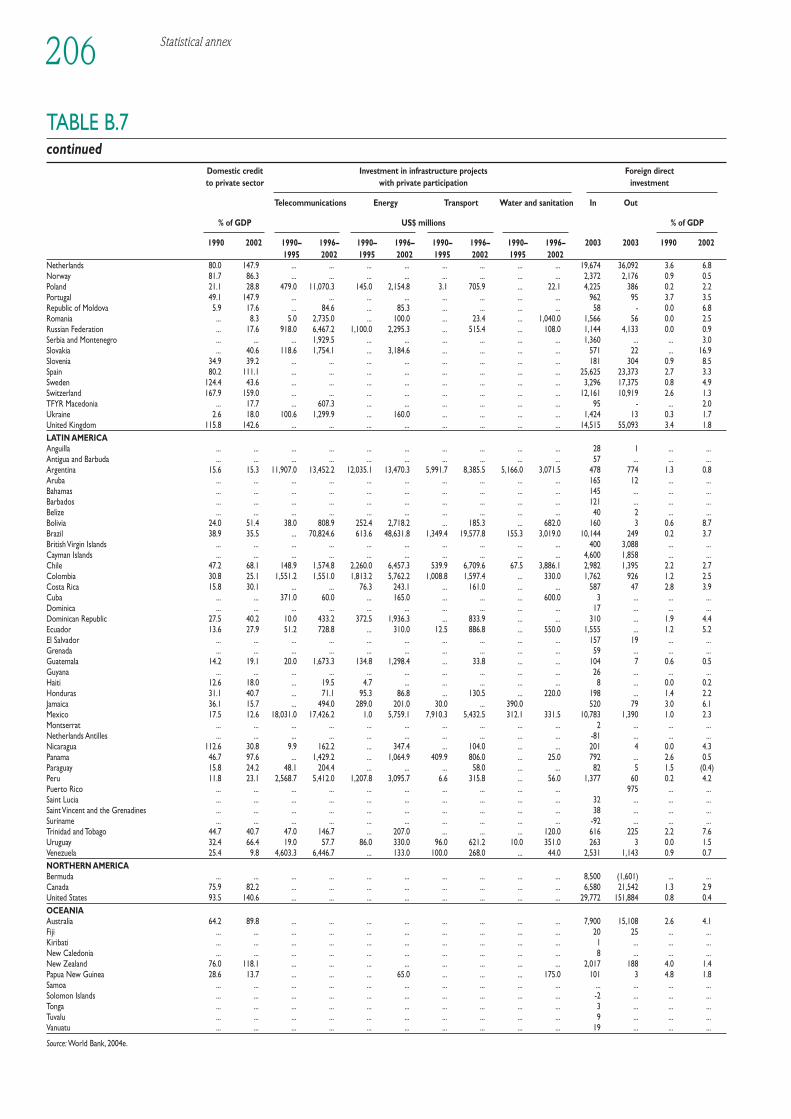
TABLE B.7continued
Domestic credit Investment in infrastructure projects Foreign directto private sector with private participation investment
Telecommunications Energy Transport Water and sanitation In Out
% of GDP US$ millions % of GDP
1990 2002 1990– 1996– 1990– 1996– 1990– 1996– 1990– 1996– 2003 2003 1990 20021995 2002 1995 2002 1995 2002 1995 2002
Netherlands 80.0 147.9 ... ... ... ... ... ... ... ... 19,674 36,092 3.6 6.8 Norway 81.7 86.3 ... ... ... ... ... ... ... ... 2,372 2,176 0.9 0.5 Poland 21.1 28.8 479.0 11,070.3 145.0 2,154.8 3.1 705.9 ... 22.1 4,225 386 0.2 2.2 Portugal 49.1 147.9 ... ... ... ... ... ... ... ... 962 95 3.7 3.5 Republic of Moldova 5.9 17.6 ... 84.6 ... 85.3 ... ... ... ... 58 - 0.0 6.8 Romania ... 8.3 5.0 2,735.0 ... 100.0 ... 23.4 ... 1,040.0 1,566 56 0.0 2.5 Russian Federation ... 17.6 918.0 6,467.2 1,100.0 2,295.3 ... 515.4 ... 108.0 1,144 4,133 0.0 0.9 Serbia and Montenegro ... ... ... 1,929.5 ... ... ... ... ... ... 1,360 ... ... 3.0 Slovakia ... 40.6 118.6 1,754.1 ... 3,184.6 ... ... ... ... 571 22 ... 16.9 Slovenia 34.9 39.2 ... ... ... ... ... ... ... ... 181 304 0.9 8.5 Spain 80.2 111.1 ... ... ... ... ... ... ... ... 25,625 23,373 2.7 3.3 Sweden 124.4 43.6 ... ... ... ... ... ... ... ... 3,296 17,375 0.8 4.9 Switzerland 167.9 159.0 ... ... ... ... ... ... ... ... 12,161 10,919 2.6 1.3 TFYR Macedonia ... 17.7 ... 607.3 ... ... ... ... ... ... 95 - ... 2.0 Ukraine 2.6 18.0 100.6 1,299.9 ... 160.0 ... ... ... ... 1,424 13 0.3 1.7 United Kingdom 115.8 142.6 ... ... ... ... ... ... ... ... 14,515 55,093 3.4 1.8 LATIN AMERICAAnguilla ... ... ... ... ... ... ... ... ... ... 28 1 ... ...Antigua and Barbuda ... ... ... ... ... ... ... ... ... ... 57 ... ... ...Argentina 15.6 15.3 11,907.0 13,452.2 12,035.1 13,470.3 5,991.7 8,385.5 5,166.0 3,071.5 478 774 1.3 0.8 Aruba ... ... ... ... ... ... ... ... ... ... 165 12 ... ...Bahamas ... ... ... ... ... ... ... ... ... ... 145 ... ... ...Barbados ... ... ... ... ... ... ... ... ... ... 121 ... ... ...Belize ... ... ... ... ... ... ... ... ... ... 40 2 ... ...Bolivia 24.0 51.4 38.0 808.9 252.4 2,718.2 ... 185.3 ... 682.0 160 3 0.6 8.7 Brazil 38.9 35.5 ... 70,824.6 613.6 48,631.8 1,349.4 19,577.8 155.3 3,019.0 10,144 249 0.2 3.7 British Virgin Islands ... ... ... ... ... ... ... ... ... ... 400 3,088 ... ...Cayman Islands ... ... ... ... ... ... ... ... ... ... 4,600 1,858 ... ...Chile 47.2 68.1 148.9 1,574.8 2,260.0 6,457.3 539.9 6,709.6 67.5 3,886.1 2,982 1,395 2.2 2.7 Colombia 30.8 25.1 1,551.2 1,551.0 1,813.2 5,762.2 1,008.8 1,597.4 ... 330.0 1,762 926 1.2 2.5 Costa Rica 15.8 30.1 ... ... 76.3 243.1 ... 161.0 ... ... 587 47 2.8 3.9 Cuba ... ... 371.0 60.0 ... 165.0 ... ... ... 600.0 3 ... ... ...Dominica ... ... ... ... ... ... ... ... ... ... 17 ... ... ...Dominican Republic 27.5 40.2 10.0 433.2 372.5 1,936.3 ... 833.9 ... ... 310 ... 1.9 4.4 Ecuador 13.6 27.9 51.2 728.8 ... 310.0 12.5 886.8 ... 550.0 1,555 ... 1.2 5.2 El Salvador ... ... ... ... ... ... ... ... ... ... 157 19 ... ...Grenada ... ... ... ... ... ... ... ... ... ... 59 ... ... ...Guatemala 14.2 19.1 20.0 1,673.3 134.8 1,298.4 ... 33.8 ... ... 104 7 0.6 0.5 Guyana ... ... ... ... ... ... ... ... ... ... 26 ... ... ...Haiti 12.6 18.0 ... 19.5 4.7 ... ... ... ... ... 8 ... 0.0 0.2 Honduras 31.1 40.7 ... 71.1 95.3 86.8 ... 130.5 ... 220.0 198 ... 1.4 2.2 Jamaica 36.1 15.7 ... 494.0 289.0 201.0 30.0 ... 390.0 520 79 3.0 6.1 Mexico 17.5 12.6 18,031.0 17,426.2 1.0 5,759.1 7,910.3 5,432.5 312.1 331.5 10,783 1,390 1.0 2.3 Montserrat ... ... ... ... ... ... ... ... ... ... 2 ... ... ...Netherlands Antilles ... ... ... ... ... ... ... ... ... ... -81 ... ... ...Nicaragua 112.6 30.8 9.9 162.2 ... 347.4 ... 104.0 ... ... 201 4 0.0 4.3 Panama 46.7 97.6 ... 1,429.2 ... 1,064.9 409.9 806.0 ... 25.0 792 ... 2.6 0.5 Paraguay 15.8 24.2 48.1 204.4 ... ... ... 58.0 ... ... 82 5 1.5 (0.4)Peru 11.8 23.1 2,568.7 5,412.0 1,207.8 3,095.7 6.6 315.8 ... 56.0 1,377 60 0.2 4.2 Puerto Rico ... ... ... ... ... ... ... ... ... ... 975 ... ...Saint Lucia ... ... ... ... ... ... ... ... ... ... 32 ... ... ...Saint Vincent and the Grenadines ... ... ... ... ... ... ... ... ... ... 38 ... ... ...Suriname ... ... ... ... ... ... ... ... ... ... -92 ... ... ...Trinidad and Tobago 44.7 40.7 47.0 146.7 ... 207.0 ... ... ... 120.0 616 225 2.2 7.6 Uruguay 32.4 66.4 19.0 57.7 86.0 330.0 96.0 621.2 10.0 351.0 263 3 0.0 1.5 Venezuela 25.4 9.8 4,603.3 6,446.7 ... 133.0 100.0 268.0 ... 44.0 2,531 1,143 0.9 0.7 NORTHERN AMERICABermuda ... ... ... ... ... ... ... ... ... ... 8,500 (1,601) ... ...Canada 75.9 82.2 ... ... ... ... ... ... ... ... 6,580 21,542 1.3 2.9 United States 93.5 140.6 ... ... ... ... ... ... ... ... 29,772 151,884 0.8 0.4 OCEANIAAustralia 64.2 89.8 ... ... ... ... ... ... ... ... 7,900 15,108 2.6 4.1 Fiji ... ... ... ... ... ... ... ... ... ... 20 25 ... ...Kiribati ... ... ... ... ... ... ... ... ... ... 1 ... ... ...New Caledonia ... ... ... ... ... ... ... ... ... ... 8 ... ... ...New Zealand 76.0 118.1 ... ... ... ... ... ... ... ... 2,017 188 4.0 1.4 Papua New Guinea 28.6 13.7 ... ... ... 65.0 ... ... ... 175.0 101 3 4.8 1.8 Samoa ... ... ... ... ... ... ... ... ... ... ... ... ... ...Solomon Islands ... ... ... ... ... ... ... ... ... ... -2 ... ... ...Tonga ... ... ... ... ... ... ... ... ... ... 3 ... ... ...Tuvalu ... ... ... ... ... ... ... ... ... ... 9 ... ... ...Vanuatu ... ... ... ... ... ... ... ... ... ... 19 ... ... ...
Source: World Bank, 2004e.
206 Statistical annex
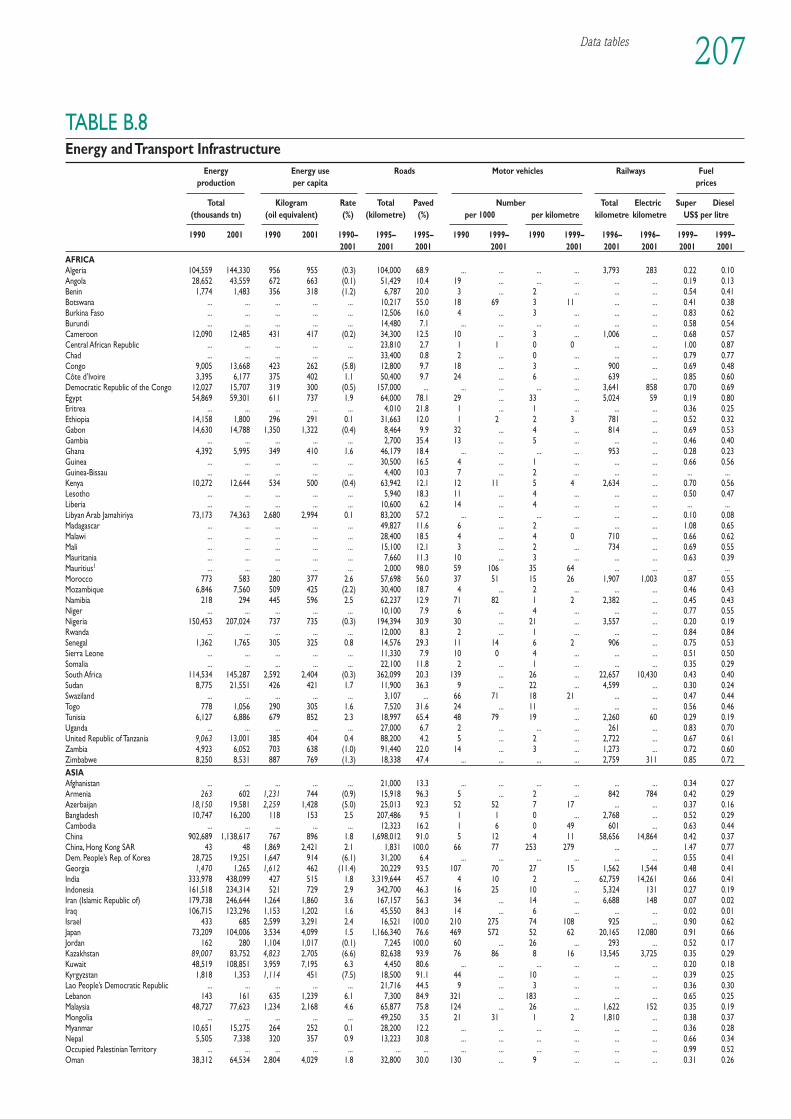
TABLE B.8Energy and Transport Infrastructure
Energy Energy use Roads Motor vehicles Railways Fuelproduction per capita prices
Total Kilogram Rate Total Paved Number Total Electric Super Diesel(thousands tn) (oil equivalent) (%) (kilometre) (%) per 1000 per kilometre kilometre kilometre US$ per litre
1990 2001 1990 2001 1990– 1995– 1995– 1990 1999– 1990 1999– 1996– 1996– 1999– 1999–2001 2001 2001 2001 2001 2001 2001 2001 2001
AFRICAAlgeria 104,559 144,330 956 955 (0.3) 104,000 68.9 ... ... ... ... 3,793 283 0.22 0.10 Angola 28,652 43,559 672 663 (0.1) 51,429 10.4 19 ... ... ... ... ... 0.19 0.13 Benin 1,774 1,483 356 318 (1.2) 6,787 20.0 3 ... 2 ... ... ... 0.54 0.41 Botswana ... ... ... ... ... 10,217 55.0 18 69 3 11 ... ... 0.41 0.38 Burkina Faso ... ... ... ... ... 12,506 16.0 4 ... 3 ... ... ... 0.83 0.62 Burundi ... ... ... ... ... 14,480 7.1 ... ... ... ... ... ... 0.58 0.54 Cameroon 12,090 12,485 431 417 (0.2) 34,300 12.5 10 ... 3 ... 1,006 ... 0.68 0.57 Central African Republic ... ... ... ... ... 23,810 2.7 1 1 0 0 ... ... 1.00 0.87 Chad ... ... ... ... ... 33,400 0.8 2 ... 0 ... ... ... 0.79 0.77 Congo 9,005 13,668 423 262 (5.8) 12,800 9.7 18 ... 3 ... 900 ... 0.69 0.48 Côte d’Ivoire 3,395 6,177 375 402 1.1 50,400 9.7 24 ... 6 ... 639 ... 0.85 0.60 Democratic Republic of the Congo 12,027 15,707 319 300 (0.5) 157,000 ... ... ... ... ... 3,641 858 0.70 0.69 Egypt 54,869 59,301 611 737 1.9 64,000 78.1 29 ... 33 ... 5,024 59 0.19 0.80 Eritrea ... ... ... ... ... 4,010 21.8 1 ... 1 ... ... ... 0.36 0.25 Ethiopia 14,158 1,800 296 291 0.1 31,663 12.0 1 2 2 3 781 ... 0.52 0.32 Gabon 14,630 14,788 1,350 1,322 (0.4) 8,464 9.9 32 ... 4 ... 814 ... 0.69 0.53 Gambia ... ... ... ... ... 2,700 35.4 13 ... 5 ... ... ... 0.46 0.40 Ghana 4,392 5,995 349 410 1.6 46,179 18.4 ... ... ... ... 953 ... 0.28 0.23 Guinea ... ... ... ... ... 30,500 16.5 4 ... 1 ... ... ... 0.66 0.56 Guinea-Bissau ... ... ... ... ... 4,400 10.3 7 ... 2 ... ... ... ... ...Kenya 10,272 12,644 534 500 (0.4) 63,942 12.1 12 11 5 4 2,634 ... 0.70 0.56 Lesotho ... ... ... ... ... 5,940 18.3 11 ... 4 ... ... ... 0.50 0.47 Liberia ... ... ... ... ... 10,600 6.2 14 ... 4 ... ... ... ... ...Libyan Arab Jamahiriya 73,173 74,363 2,680 2,994 0.1 83,200 57.2 ... ... ... ... ... ... 0.10 0.08 Madagascar ... ... ... ... ... 49,827 11.6 6 ... 2 ... ... ... 1.08 0.65 Malawi ... ... ... ... ... 28,400 18.5 4 ... 4 0 710 ... 0.66 0.62 Mali ... ... ... ... ... 15,100 12.1 3 ... 2 ... 734 ... 0.69 0.55 Mauritania ... ... ... ... ... 7,660 11.3 10 ... 3 ... ... ... 0.63 0.39 Mauritius1 ... ... ... ... ... 2,000 98.0 59 106 35 64 ... ... ... ...Morocco 773 583 280 377 2.6 57,698 56.0 37 51 15 26 1,907 1,003 0.87 0.55 Mozambique 6,846 7,560 509 425 (2.2) 30,400 18.7 4 ... 2 ... ... ... 0.46 0.43 Namibia 218 294 445 596 2.5 62,237 12.9 71 82 1 2 2,382 ... 0.45 0.43 Niger ... ... ... ... ... 10,100 7.9 6 ... 4 ... ... ... 0.77 0.55 Nigeria 150,453 207,024 737 735 (0.3) 194,394 30.9 30 ... 21 ... 3,557 ... 0.20 0.19 Rwanda ... ... ... ... ... 12,000 8.3 2 ... 1 ... ... ... 0.84 0.84 Senegal 1,362 1,765 305 325 0.8 14,576 29.3 11 14 6 2 906 ... 0.75 0.53 Sierra Leone ... ... ... ... ... 11,330 7.9 10 0 4 ... ... ... 0.51 0.50 Somalia ... ... ... ... ... 22,100 11.8 2 ... 1 ... ... ... 0.35 0.29 South Africa 114,534 145,287 2,592 2,404 (0.3) 362,099 20.3 139 ... 26 ... 22,657 10,430 0.43 0.40 Sudan 8,775 21,551 426 421 1.7 11,900 36.3 9 ... 22 ... 4,599 ... 0.30 0.24 Swaziland ... ... ... ... ... 3,107 ... 66 71 18 21 ... ... 0.47 0.44 Togo 778 1,056 290 305 1.6 7,520 31.6 24 ... 11 ... ... ... 0.56 0.46 Tunisia 6,127 6,886 679 852 2.3 18,997 65.4 48 79 19 ... 2,260 60 0.29 0.19 Uganda ... ... ... ... ... 27,000 6.7 2 ... ... ... 261 ... 0.83 0.70 United Republic of Tanzania 9,063 13,001 385 404 0.4 88,200 4.2 5 ... 2 ... 2,722 ... 0.67 0.61 Zambia 4,923 6,052 703 638 (1.0) 91,440 22.0 14 ... 3 ... 1,273 ... 0.72 0.60 Zimbabwe 8,250 8,531 887 769 (1.3) 18,338 47.4 ... ... ... ... 2,759 311 0.85 0.72 ASIAAfghanistan ... ... ... ... ... 21,000 13.3 ... ... ... ... ... ... 0.34 0.27 Armenia 263 602 1,231 744 (0.9) 15,918 96.3 5 ... 2 ... 842 784 0.42 0.29 Azerbaijan 18,150 19,581 2,259 1,428 (5.0) 25,013 92.3 52 52 7 17 ... ... 0.37 0.16 Bangladesh 10,747 16,200 118 153 2.5 207,486 9.5 1 1 0 ... 2,768 ... 0.52 0.29 Cambodia ... ... ... ... ... 12,323 16.2 1 6 0 49 601 ... 0.63 0.44 China 902,689 1,138,617 767 896 1.8 1,698,012 91.0 5 12 4 11 58,656 14,864 0.42 0.37 China, Hong Kong SAR 43 48 1,869 2,421 2.1 1,831 100.0 66 77 253 279 ... ... 1.47 0.77 Dem. People’s Rep. of Korea 28,725 19,251 1,647 914 (6.1) 31,200 6.4 ... ... ... ... ... ... 0.55 0.41 Georgia 1,470 1,265 1,612 462 (11.4) 20,229 93.5 107 70 27 15 1,562 1,544 0.48 0.41 India 333,978 438,099 427 515 1.8 3,319,644 45.7 4 10 2 ... 62,759 14,261 0.66 0.41 Indonesia 161,518 234,314 521 729 2.9 342,700 46.3 16 25 10 ... 5,324 131 0.27 0.19 Iran (Islamic Republic of) 179,738 246,644 1,264 1,860 3.6 167,157 56.3 34 ... 14 ... 6,688 148 0.07 0.02 Iraq 106,715 123,296 1,153 1,202 1.6 45,550 84.3 14 ... 6 ... ... ... 0.02 0.01 Israel 433 685 2,599 3,291 2.4 16,521 100.0 210 275 74 108 925 ... 0.90 0.62 Japan 73,209 104,006 3,534 4,099 1.5 1,166,340 76.6 469 572 52 62 20,165 12,080 0.91 0.66 Jordan 162 280 1,104 1,017 (0.1) 7,245 100.0 60 ... 26 ... 293 ... 0.52 0.17 Kazakhstan 89,007 83,752 4,823 2,705 (6.6) 82,638 93.9 76 86 8 16 13,545 3,725 0.35 0.29 Kuwait 48,519 108,851 3,959 7,195 6.3 4,450 80.6 ... ... ... ... ... ... 0.20 0.18 Kyrgyzstan 1,818 1,353 1,114 451 (7.5) 18,500 91.1 44 ... 10 ... ... ... 0.39 0.25 Lao People’s Democratic Republic ... ... ... ... ... 21,716 44.5 9 ... 3 ... ... ... 0.36 0.30 Lebanon 143 161 635 1,239 6.1 7,300 84.9 321 ... 183 ... ... ... 0.65 0.25 Malaysia 48,727 77,623 1,234 2,168 4.6 65,877 75.8 124 ... 26 ... 1,622 152 0.35 0.19 Mongolia ... ... ... ... ... 49,250 3.5 21 31 1 2 1,810 ... 0.38 0.37 Myanmar 10,651 15,275 264 252 0.1 28,200 12.2 ... ... ... ... ... ... 0.36 0.28 Nepal 5,505 7,338 320 357 0.9 13,223 30.8 ... ... ... ... ... ... 0.66 0.34 Occupied Palestinian Territory ... ... ... ... ... ... ... ... ... ... ... ... ... 0.99 0.52 Oman 38,312 64,534 2,804 4,029 1.8 32,800 30.0 130 ... 9 ... ... ... 0.31 0.26
207Data tables
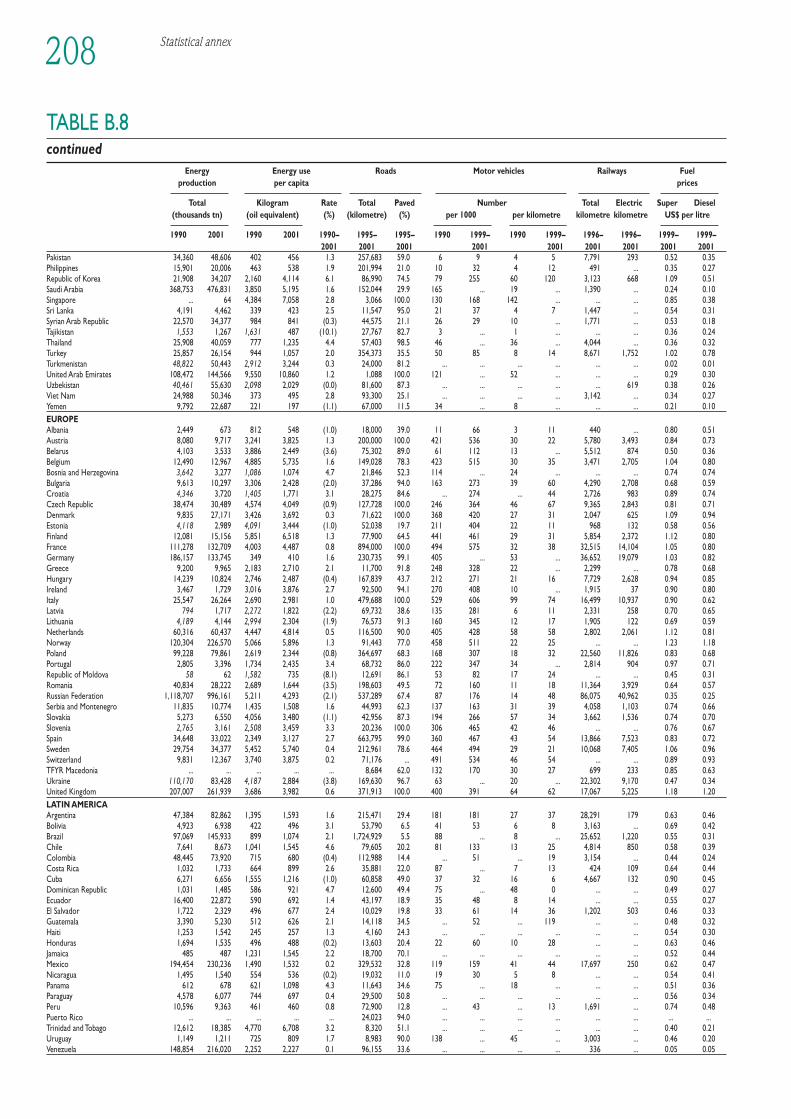
TABLE B.8continued
Energy Energy use Roads Motor vehicles Railways Fuelproduction per capita prices
Total Kilogram Rate Total Paved Number Total Electric Super Diesel(thousands tn) (oil equivalent) (%) (kilometre) (%) per 1000 per kilometre kilometre kilometre US$ per litre
1990 2001 1990 2001 1990– 1995– 1995– 1990 1999– 1990 1999– 1996– 1996– 1999– 1999–2001 2001 2001 2001 2001 2001 2001 2001 2001
Pakistan 34,360 48,606 402 456 1.3 257,683 59.0 6 9 4 5 7,791 293 0.52 0.35 Philippines 15,901 20,006 463 538 1.9 201,994 21.0 10 32 4 12 491 ... 0.35 0.27 Republic of Korea 21,908 34,207 2,160 4,114 6.1 86,990 74.5 79 255 60 120 3,123 668 1.09 0.51 Saudi Arabia 368,753 476,831 3,850 5,195 1.6 152,044 29.9 165 ... 19 ... 1,390 ... 0.24 0.10 Singapore ... 64 4,384 7,058 2.8 3,066 100.0 130 168 142 ... ... ... 0.85 0.38 Sri Lanka 4,191 4,462 339 423 2.5 11,547 95.0 21 37 4 7 1,447 ... 0.54 0.31 Syrian Arab Republic 22,570 34,377 984 841 (0.3) 44,575 21.1 26 29 10 ... 1,771 ... 0.53 0.18 Tajikistan 1,553 1,267 1,631 487 (10.1) 27,767 82.7 3 ... 1 ... ... ... 0.36 0.24 Thailand 25,908 40,059 777 1,235 4.4 57,403 98.5 46 ... 36 ... 4,044 ... 0.36 0.32 Turkey 25,857 26,154 944 1,057 2.0 354,373 35.5 50 85 8 14 8,671 1,752 1.02 0.78 Turkmenistan 48,822 50,443 2,912 3,244 0.3 24,000 81.2 ... ... ... ... ... ... 0.02 0.01 United Arab Emirates 108,472 144,566 9,550 10,860 1.2 1,088 100.0 121 ... 52 ... ... ... 0.29 0.30 Uzbekistan 40,461 55,630 2,098 2,029 (0.0) 81,600 87.3 ... ... ... ... ... 619 0.38 0.26 Viet Nam 24,988 50,346 373 495 2.8 93,300 25.1 ... ... ... ... 3,142 ... 0.34 0.27 Yemen 9,792 22,687 221 197 (1.1) 67,000 11.5 34 ... 8 ... ... ... 0.21 0.10 EUROPEAlbania 2,449 673 812 548 (1.0) 18,000 39.0 11 66 3 11 440 ... 0.80 0.51 Austria 8,080 9,717 3,241 3,825 1.3 200,000 100.0 421 536 30 22 5,780 3,493 0.84 0.73 Belarus 4,103 3,533 3,886 2,449 (3.6) 75,302 89.0 61 112 13 ... 5,512 874 0.50 0.36 Belgium 12,490 12,967 4,885 5,735 1.6 149,028 78.3 423 515 30 35 3,471 2,705 1.04 0.80 Bosnia and Herzegovina 3,642 3,277 1,086 1,074 4.7 21,846 52.3 114 ... 24 ... ... ... 0.74 0.74 Bulgaria 9,613 10,297 3,306 2,428 (2.0) 37,286 94.0 163 273 39 60 4,290 2,708 0.68 0.59 Croatia 4,346 3,720 1,405 1,771 3.1 28,275 84.6 ... 274 ... 44 2,726 983 0.89 0.74 Czech Republic 38,474 30,489 4,574 4,049 (0.9) 127,728 100.0 246 364 46 67 9,365 2,843 0.81 0.71 Denmark 9,835 27,171 3,426 3,692 0.3 71,622 100.0 368 420 27 31 2,047 625 1.09 0.94 Estonia 4,118 2,989 4,091 3,444 (1.0) 52,038 19.7 211 404 22 11 968 132 0.58 0.56 Finland 12,081 15,156 5,851 6,518 1.3 77,900 64.5 441 461 29 31 5,854 2,372 1.12 0.80 France 111,278 132,709 4,003 4,487 0.8 894,000 100.0 494 575 32 38 32,515 14,104 1.05 0.80 Germany 186,157 133,745 349 410 1.6 230,735 99.1 405 ... 53 ... 36,652 19,079 1.03 0.82 Greece 9,200 9,965 2,183 2,710 2.1 11,700 91.8 248 328 22 ... 2,299 ... 0.78 0.68 Hungary 14,239 10,824 2,746 2,487 (0.4) 167,839 43.7 212 271 21 16 7,729 2,628 0.94 0.85 Ireland 3,467 1,729 3,016 3,876 2.7 92,500 94.1 270 408 10 ... 1,915 37 0.90 0.80 Italy 25,547 26,264 2,690 2,981 1.0 479,688 100.0 529 606 99 74 16,499 10,937 0.90 0.62 Latvia 794 1,717 2,272 1,822 (2.2) 69,732 38.6 135 281 6 11 2,331 258 0.70 0.65 Lithuania 4,189 4,144 2,994 2,304 (1.9) 76,573 91.3 160 345 12 17 1,905 122 0.69 0.59 Netherlands 60,316 60,437 4,447 4,814 0.5 116,500 90.0 405 428 58 58 2,802 2,061 1.12 0.81 Norway 120,304 226,570 5,066 5,896 1.3 91,443 77.0 458 511 22 25 ... ... 1.23 1.18 Poland 99,228 79,861 2,619 2,344 (0.8) 364,697 68.3 168 307 18 32 22,560 11,826 0.83 0.68 Portugal 2,805 3,396 1,734 2,435 3.4 68,732 86.0 222 347 34 ... 2,814 904 0.97 0.71 Republic of Moldova 58 62 1,582 735 (8.1) 12,691 86.1 53 82 17 24 ... ... 0.45 0.31 Romania 40,834 28,222 2,689 1,644 (3.5) 198,603 49.5 72 160 11 18 11,364 3,929 0.64 0.57 Russian Federation 1,118,707 996,161 5,211 4,293 (2.1) 537,289 67.4 87 176 14 48 86,075 40,962 0.35 0.25 Serbia and Montenegro 11,835 10,774 1,435 1,508 1.6 44,993 62.3 137 163 31 39 4,058 1,103 0.74 0.66 Slovakia 5,273 6,550 4,056 3,480 (1.1) 42,956 87.3 194 266 57 34 3,662 1,536 0.74 0.70 Slovenia 2,765 3,161 2,508 3,459 3.3 20,236 100.0 306 465 42 46 ... ... 0.76 0.67 Spain 34,648 33,022 2,349 3,127 2.7 663,795 99.0 360 467 43 54 13,866 7,523 0.83 0.72 Sweden 29,754 34,377 5,452 5,740 0.4 212,961 78.6 464 494 29 21 10,068 7,405 1.06 0.96 Switzerland 9,831 12,367 3,740 3,875 0.2 71,176 ... 491 534 46 54 ... ... 0.89 0.93 TFYR Macedonia ... ... ... ... ... 8,684 62.0 132 170 30 27 699 233 0.85 0.63 Ukraine 110,170 83,428 4,187 2,884 (3.8) 169,630 96.7 63 ... 20 ... 22,302 9,170 0.47 0.34 United Kingdom 207,007 261,939 3,686 3,982 0.6 371,913 100.0 400 391 64 62 17,067 5,225 1.18 1.20 LATIN AMERICAArgentina 47,384 82,862 1,395 1,593 1.6 215,471 29.4 181 181 27 37 28,291 179 0.63 0.46 Bolivia 4,923 6,938 422 496 3.1 53,790 6.5 41 53 6 8 3,163 ... 0.69 0.42 Brazil 97,069 145,933 899 1,074 2.1 1,724,929 5.5 88 ... 8 ... 25,652 1,220 0.55 0.31 Chile 7,641 8,673 1,041 1,545 4.6 79,605 20.2 81 133 13 25 4,814 850 0.58 0.39 Colombia 48,445 73,920 715 680 (0.4) 112,988 14.4 ... 51 ... 19 3,154 ... 0.44 0.24 Costa Rica 1,032 1,733 664 899 2.6 35,881 22.0 87 ... 7 13 424 109 0.64 0.44 Cuba 6,271 6,656 1,555 1,216 (1.0) 60,858 49.0 37 32 16 6 4,667 132 0.90 0.45 Dominican Republic 1,031 1,485 586 921 4.7 12,600 49.4 75 ... 48 0 ... ... 0.49 0.27 Ecuador 16,400 22,872 590 692 1.4 43,197 18.9 35 48 8 14 ... ... 0.55 0.27 El Salvador 1,722 2,329 496 677 2.4 10,029 19.8 33 61 14 36 1,202 503 0.46 0.33 Guatemala 3,390 5,230 512 626 2.1 14,118 34.5 ... 52 ... 119 ... ... 0.48 0.32 Haiti 1,253 1,542 245 257 1.3 4,160 24.3 ... ... ... ... ... ... 0.54 0.30 Honduras 1,694 1,535 496 488 (0.2) 13,603 20.4 22 60 10 28 ... ... 0.63 0.46 Jamaica 485 487 1,231 1,545 2.2 18,700 70.1 ... ... ... ... ... ... 0.52 0.44 Mexico 194,454 230,236 1,490 1,532 0.2 329,532 32.8 119 159 41 44 17,697 250 0.62 0.47 Nicaragua 1,495 1,540 554 536 (0.2) 19,032 11.0 19 30 5 8 ... ... 0.54 0.41 Panama 612 678 621 1,098 4.3 11,643 34.6 75 ... 18 ... ... ... 0.51 0.36 Paraguay 4,578 6,077 744 697 0.4 29,500 50.8 ... ... ... ... ... ... 0.56 0.34 Peru 10,596 9,363 461 460 0.8 72,900 12.8 ... 43 ... 13 1,691 ... 0.74 0.48 Puerto Rico ... ... ... ... ... 24,023 94.0 ... ... ... ... ... ... ... ...Trinidad and Tobago 12,612 18,385 4,770 6,708 3.2 8,320 51.1 ... ... ... ... ... ... 0.40 0.21 Uruguay 1,149 1,211 725 809 1.7 8,983 90.0 138 ... 45 ... 3,003 ... 0.46 0.20 Venezuela 148,854 216,020 2,252 2,227 0.1 96,155 33.6 ... ... ... ... 336 ... 0.05 0.05
208 Statistical annex

NORTHERN AMERICACanada 273,680 379,207 7,524 7,985 0.8 901,903 35.3 605 580 20 20 39,400 ... 0.51 0.43 United States 1,650,408 1,711,814 7,728 7,996 0.4 6,304,193 58.8 758 779 30 34 160,000 484 0.40 0.39 OCEANIAAustralia 157,712 250,436 5,130 5,956 1.5 811,603 38.7 530 ... 11 ... ... ... 0.50 0.48 New Zealand 12,256 14,932 4,065 4,714 1.6 92,207 63.1 524 696 19 ... 3,913 519 0.55 0.33 Papua New Guinea ... ... ... ... ... 19,600 3.5 ... ... ... ... ... ... 0.53 0.34
Notes:Data are for the most recent year in the indicated intervals. Road and railway data for China include Hong Kong, China SAR.
Source: World Bank, 2004e.
TABLE B.9Social Indicators
Inequality Poverty Vital data Health services Communications
Gini (below US$/day) Life Under Expend- Physicians Hospital Adult Radios TV PC Mobileindex US$1 US$2 expect- five iture beds literacy sets phones
ancy mortality
(%) (%) (years) /1000 US$/ per 1000 per 1000 (%) /1000 /1000 /1000 /1000capita
1995– 1995–2002 2002 2001 1980 2002 1980 2002 2002 2001 2002 2002 2002
AFRICAAlgeria 1995 35.3 <2 15.1 71 49 73 ... 1.0 ... 2.1 69 244 114 8 13Angola ... ... ... 47 260 31 ... 0.1 ... ... ... 78 52 2 9Benin ... ... ... 53 151 16 0.1 0.1 1.5 ... 40 445 12 2 32Botswana 1993 63.0 23.5 50.1 38 110 190 0.1 ... 2.4 ... 79 150 44 41 241Burkina Faso 1998 48.2 44.9 81.0 43 207 ... 0.0 0.0 ... 1.4 ... 433 79 2 8Burundi 1998 33.3 58.4 89.2 42 208 4 ... ... ... ... 50 220 31 1 7Cameroon 2001 44.6 17.1 50.6 48 166 20 ... 0.1 ... ... 68 161 75 6 43Central African Republic 1993 61.3 66.6 84.0 42 180 12 0.0 0.0 1.6 ... 49 80 6 2 3Chad ... ... ... 48 200 5 ... ... ... ... 46 233 2 2 4Congo ... ... ... 52 108 18 ... 0.3 ... ... 83 109 13 4 67Côte d’Ivoire 1998 45.2 15.5 50.4 45 191 41 ... 0.1 ... ... ... 185 61 9 62Democratic Republic of the Congo ... ... ... 45 205 5 ... 0.1 ... ... ... 385 2 ... 11Egypt 1999 34.4 3.1 43.9 69 39 46 1.1 1.6 2.0 2.1 ... 339 229 17 67Eritrea ... ... ... 51 80 10 ... 0.0 ... ... ... 464 50 3 0Ethiopia 2000 30.0 26.3 80.7 42 171 3 0.0 ... 0.3 ... ... 189 6 2 1Gabon ... ... ... 53 85 127 ... ... ... ... ... 488 308 19 215Gambia 1998 38.0 59.3 82.9 53 126 19 ... 0.0 ... ... ... 394 15 14 73Ghana 1999 30.0 44.8 78.5 55 97 12 ... 0.1 ... ... 74 695 53 4 21Guinea 1994 40.3 ... ... 46 165 13 ... 0.1 ... ... ... 52 47 0 12Guinea-Bissau 1993 47.0 ... ... 45 211 8 0.1 0.2 1.9 ... ... 178 36 ... 0Kenya 1997 44.5 23.0 58.6 46 122 29 ... 0.1 ... ... 84 221 26 6 42Lesotho 1995 63.2 36.4 56.1 38 132 23 ... 0.1 ... ... 81 61 35 ... 42Liberia ... ... ... 47 235 1 ... 0.0 ... ... ... 274 25 ... 1Libyan Arab Jamahiriya ... ... ... 72 19 143 1.3 1.3 ... 4.3 ... 273 137 23 13Madagascar 2001 47.5 49.1 83.3 55 135 6 ... 0.1 ... 0.4 ... 216 25 4 10Malawi 1997 50.3 41.7 76.1 38 182 13 ... ... ... 1.3 62 499 4 1 8Mali 1994 50.5 72.8 90.6 41 222 11 0.0 0.1 ... 0.2 19 180 33 1 5Mauritania 2000 39.0 25.9 63.1 51 183 12 ... 0.1 ... ... 41 148 99 11 92Mauritius 1996-97 ... ... ... 73 19 128 0.5 0.9 3.1 ... ... 379 299 117 289Morocco 1998-99 39.5 <2 14.3 68 43 59 ... 0.5 ... 1.0 51 243 167 24 209Mozambique 1996-97 39.6 37.9 78.4 41 205 11 0.0 ... 1.1 ... 46 44 14 5 14Namibia 1993 70.7 34.9 55.8 42 67 110 ... 0.3 ... ... 83 134 269 71 80Niger 1995 50.5 61.4 85.3 46 264 6 ... 0.0 ... 0.1 17 122 10 1 1Nigeria 1996 50.6 70.2 90.8 45 201 15 0.1 ... 0.9 ... 67 200 103 7 13Rwanda 1983-85 28.9 35.7 84.6 40 203 11 0.0 ... 1.5 ... 69 85 ... ... 14Senegal 1995 41.3 26.3 67.8 52 138 22 ... 0.1 ... 0.4 39 128 78 20 55Sierra Leone 1989 62.9 57.0 74.5 37 284 7 0.1 0.1 1.2 ... ... 259 13 ... 13Somalia ... ... ... 47 225 6 0.0 0.0 ... ... ... 60 14 ... 3South Africa 1995 59.3 7.1 23.8 46 65 222 ... 0.6 ... ... 86 336 177 73 304Sudan ... ... ... 58 94 14 0.1 0.1 0.9 ... ... 461 386 6 6Swaziland 1994 60.9 ... ... 44 149 41 ... 0.2 ... ... ... 161 34 24 61Togo ... ... ... 50 140 8 0.1 0.1 ... ... 60 263 123 31 35Tunisia 2000 39.8 <2 6.6 73 26 134 0.3 0.7 2.1 1.7 73 158 207 31 52Uganda 1999 43.0 ... ... 43 141 14 ... ... ... ... 69 122 18 3 16United Republic of Tanzania 1993 38.2 19.9 59.7 43 165 12 ... 0.0 1.4 ... 77 406 45 4 19Zambia 1998 52.6 63.7 87.4 37 182 19 0.1 0.1 ... ... 80 179 51 8 13Zimbabwe 1995 56.8 36.0 64.2 39 123 45 0.2 0.1 3.0 ... 90 362 56 52 30ASIAAfghanistan ... ... ... 43 257 8 ... 0.1 ... ... ... 114 14 ... 1Armenia 1998 37.9 12.8 49.0 75 35 28 3.2 2.9 8.4 4.3 99 264 229 16 19Azerbaijan 2001 36.5 3.7 9.1 65 96 8 3.4 3.6 9.7 8.5 ... 22 332 ... 107Bangladesh 2000 31.8 36.0 82.8 62 73 12 0.1 0.2 0.2 ... 41 49 59 3 8Cambodia 1997 40.4 34.1 77.7 54 138 30 ... 0.3 ... ... 69 119 8 2 28China 2001 44.7 16.6 46.7 71 38 49 1.2 1.4 2.2 2.5 91 339 350 28 161China, Hong Kong SAR 1996 43.4 ... ... 80 ... ... 0.8 1.3 4.0 ... ... 686 504 422 942Dem. People’s Rep. of Korea ... ... ... 62 55 22 ... 3.0 ... ... ... 154 162 ... ...Georgia 2001 36.9 2.7 15.7 73 29 22 4.1 3.9 10.2 4.3 ... 568 357 32 102India 99-2000 32.5 34.7 79.9 63 90 24 0.4 ... 0.8 ... 61 120 83 7 12
209Data tables

TABLE B.9continued
Inequality Poverty Vital data Health services Communications
Gini (below US$/day) Life Under Expend- Physicians Hospital Adult Radios TV PC Mobileindex US$1 US$2 expect- five iture beds literacy sets phones
ancy mortality
(%) (%) (years) /1000 US$/ per 1000 per 1000 (%) /1000 /1000 /1000 /1000capita
1995– 1995–2002 2002 2001 1980 2002 1980 2002 2002 2001 2002 2002 2002
Indonesia 2002 34.3 7.5 52.4 67 43 16 ... ... ... ... 88 159 153 12 55Iran (Islamic Republic of) 1998 43.0 <2 7.3 69 41 363 ... 0.9 1.5 1.6 77 281 173 75 33Iraq ... ... ... 63 125 225 0.6 0.6 1.9 1.5 222 83 8 1Israel 1997 35.5 ... ... 79 6 1,641 3.1 3.7 6.8 6.2 95 526 330 243 955Japan 1993 24.9 ... ... 82 5 2,627 1.3 1.9 13.7 16.5 ... 956 785 382 637Jordan 1997 36.4 <2 7.4 72 33 163 0.8 1.7 1.3 1.8 91 372 177 38 229Kazakhstan 2001 31.3 <2 8.5 62 99 44 3.0 3.6 13.1 7.0 99 411 338 ... 64Kuwait ... ... ... 77 10 630 1.7 1.9 4.1 2.8 83 570 418 121 519Kyrgyzstan 2001 29.0 <2 27.2 65 61 12 2.6 2.6 12.0 5.5 ... 110 49 13 10Lao People’s DemocraticRepublic 1997 37.0 26.3 73.2 55 100 10 ... 0.2 ... ... 66 148 52 3 10Lebanon ... ... ... 71 32 ... ... 2.1 ... 2.7 ... 182 357 81 227Malaysia 1997 49.2 <2 9.3 73 8 143 0.3 0.7 ... 2.0 89 420 210 147 377Mongolia 1998 44.0 13.9 50.0 65 71 25 ... 2.4 11.2 ... 98 50 79 28 89Myanmar ... ... ... 57 108 197 ... 0.3 0.9 ... 85 66 8 5 1Nepal 1995-96 36.7 37.7 82.5 60 83 12 0.0 0.0 0.2 0.2 44 39 8 4 1Oman ... ... ... 74 13 225 0.5 1.3 1.6 2.2 ... 621 553 35 171Pakistan 1998-99 33.0 13.4 65.6 64 101 16 0.3 0.6 0.6 ... ... 105 150 4 8Philippines 2000 46.1 14.6 46.4 70 37 30 0.1 1.2 1.7 ... 93 161 182 28 191Republic of Korea 1998 31.6 <2 <2 74 5 532 ... 1.4 1.7 6.1 ... 1,034 363 556 679Saudi Arabia ... ... ... 73 28 375 ... 1.7 ... 2.3 78 326 265 130 217Singapore 1998 42.5 ... ... 78 4 816 0.9 1.6 4.0 ... 93 672 303 622 796Sri Lanka 1995 34.4 6.6 45.4 74 19 30 0.1 0.4 2.9 ... 92 215 117 13 49Syrian Arab Republic ... ... ... 70 28 65 0.4 1.3 1.1 1.4 83 276 182 19 23Tajikistan 1998 34.7 10.3 50.8 67 116 6 ... 2.1 ... 6.4 99 141 357 ... 2Thailand 2000 43.2 <2 32.5 69 28 69 0.1 0.4 1.5 2.0 93 235 300 40 260Turkey 2000 40.0 <2 10.3 70 41 ... 0.6 1.3 2.2 2.6 87 470 423 45 347Turkmenistan 1998 40.8 12.1 44.0 65 86 57 2.8 3.0 10.5 7.1 ... 279 182 ... 2United Arab Emirates ... ... ... 75 9 849 1.1 1.8 2.8 2.6 ... 330 252 129 696Uzbekistan 2000 26.8 21.8 77.5 67 65 17 2.7 2.9 9.2 5.3 99 456 280 ... 7Viet Nam 1998 36.1 17.7 63.7 70 26 21 0.2 0.5 3.5 1.7 ... 109 197 10 23Yemen 1998 33.4 15.7 45.2 57 114 20 ... 0.2 ... 0.6 49 65 308 7 21EUROPEAlbania 2002 28.2 <2 11.8 74 24 48 1.4 1.4 4.3 3.3 99 260 318 12 276Austria 1997 30.0 ... ... 79 5 1,866 1.6 3.2 11.2 8.6 ... 763 637 369 786Belarus 2000 30.4 <2 <2 68 20 68 3.0 4.5 12.5 12.6 100 199 362 ... 47Belgium 1996 25.0 ... ... 79 6 1,983 2.3 3.9 9.4 7.3 ... 793 541 241 786Bosnia and Herzegovina 2001 26.2 ... ... 74 18 85 1.0 1.4 4.8 3.2 95 243 116 ... 196Bulgaria 2001 31.9 4.7 16.2 72 16 81 2.5 3.4 8.9 7.2 99 543 453 52 333Croatia 2001 29.0 <2 <2 74 8 394 1.7 2.4 7.2 6.0 98 339 293 174 535Czech Republic 1996 25.4 <2 <2 75 5 407 2.3 3.4 11.3 8.8 ... 803 538 177 849Denmark 1997 24.7 ... ... 77 4 2,545 2.2 3.4 8.1 4.5 1,400 859 577 833Estonia 2000 37.2 <2 5.2 71 12 226 2.9 3.1 12.2 6.7 100 1,136 502 210 650Finland 2000 26.9 ... ... 78 5 1,631 1.7 3.1 15.6 7.5 ... 1,624 670 442 867France 1995 32.7 ... ... 79 6 2,109 2.0 3.3 11.1 8.2 ... 950 632 347 647Germany 2000 28.3 ... ... 78 5 2,412 2.3 3.3 11.5 9.1 ... 570 661 431 727Greece 1998 35.4 ... ... 78 5 1,001 2.4 4.4 6.2 4.9 97 478 519 82 845Hungary 1999 24.4 <2 7.3 72 9 345 2.3 2.9 9.1 8.2 99 690 475 108 676Ireland 1996 35.9 ... ... 77 6 1,711 ... 2.4 13.0 9.7 ... 695 694 421 763Italy 2000 36.0 ... ... 78 6 1,584 2.6 4.3 9.6 4.9 99 878 494 231 939Latvia 1998 32.4 <2 8.3 70 21 210 3.6 2.9 13.9 8.2 100 700 850 172 394Lithuania 2000 31.9 <2 13.7 73 9 206 ... 4.0 12.1 9.2 100 524 487 110 475Netherlands 1994 32.6 ... ... 78 5 2,138 1.9 3.3 12.3 10.8 ... 980 648 467 745Norway 2000 25.8 ... ... 79 4 2,981 2.0 3.0 16.5 14.6 ... 3,324 884 528 844Poland 1999 31.6 <2 <2 74 9 289 1.8 2.2 5,6 4.9 ... 523 422 106 363Portugal 1997 38.5 <2 <0.5 76 6 982 2.0 3.2 5.2 4.0 93 301 413 135 825Republic of Moldova 2001 36.2 22.0 63.7 67 32 18 2.8 2.7 12.1 5.9 99 758 296 18 77Romania 2000 30.3 2.1 20.5 70 21 117 1.5 1.9 8.8 7.5 97 358 697 69 236Russian Federation 2000 45.6 6.1 23.8 66 21 115 ... 4.2 ... 10.8 100 418 538 89 120Serbia and Montenegro ... ... ... 73 19 103 ... 2.1 ... 5.3 ... 297 282 27 257Slovakia 1996 25.8 <2 <2.4 73 9 216 ... 3.6 ... 7.8 100 965 409 180 544Slovenia 1998-99 28.4 <2 <2 76 5 821 1.8 2.2 7.0 5.2 100 405 366 301 835Spain 1990 32.5 ... ... 78 6 1,088 ... 3.3 5.4 4.1 98 330 564 196 824Sweden 2000 25.0 ... ... 80 3 2,150 2.2 3.0 15.1 3.6 ... 2,811 965 621 889Switzerland 1992 33.1 ... ... 80 6 3,779 2.4 3.5 ... 17.9 ... 1,002 552 709 789TFYR Macedonia 1998 28.2 <2 4.0 73 26 115 1.3 2.2 5.2 4.8 ... 205 282 ... 177Ukraine 1999 29.0 2.9 45.7 68 20 33 3.5 3.0 12.1 8.7 100 889 456 19 84United Kingdom 1999 36.0 ... ... 77 7 1,835 1.3 2.0 8.1 4.1 ... 1,445 950 406 841LATIN AMERICAArgentina 2001 52.2 3.3 14.3 74 19 679 ... 2.7 ... 3.3 97 681 326 82 178Bolivia 1999 44.7 14.4 34.3 64 71 49 ... 1.3 ... 1.7 87 667 121 23 105Brazil 1998 59.1 8.2 22.4 69 37 222 ... 1.3 ... 3.1 86 433 349 75 201Chile 2000 57.1 <2 9.6 76 12 296 ... 1.1 3.4 2.7 96 759 523 119 428
210 Statistical annex
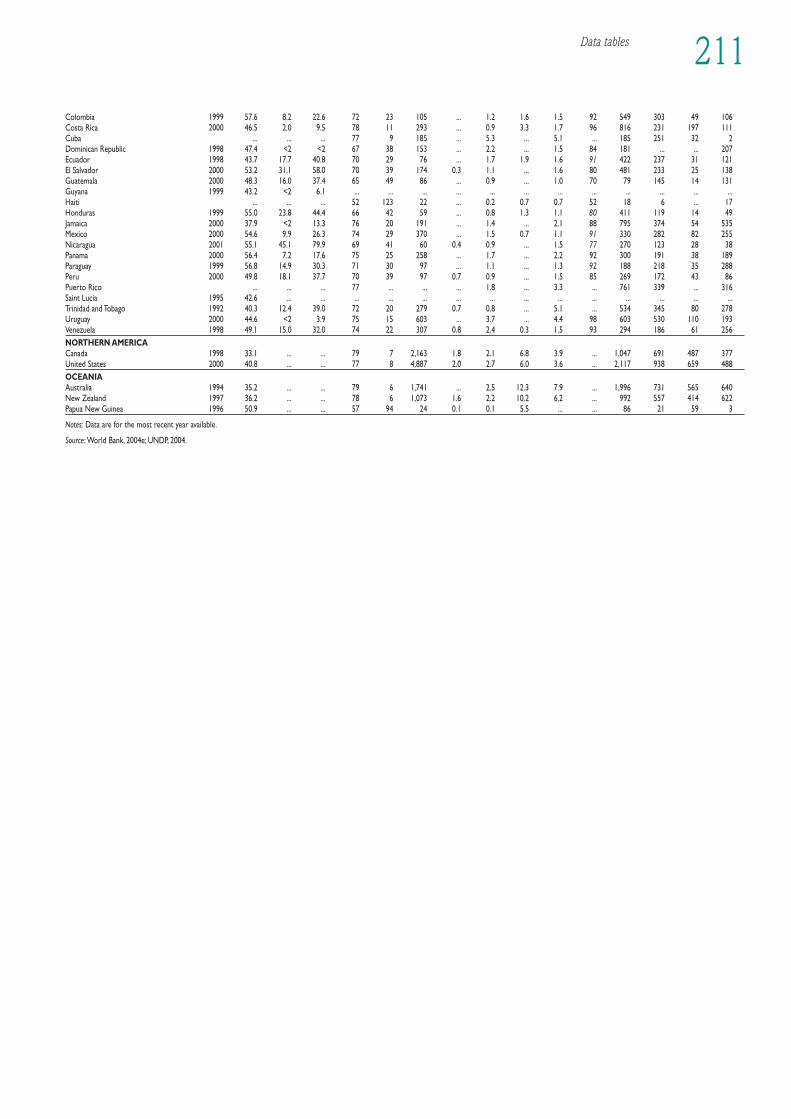
Colombia 1999 57.6 8.2 22.6 72 23 105 ... 1.2 1.6 1.5 92 549 303 49 106Costa Rica 2000 46.5 2.0 9.5 78 11 293 ... 0.9 3.3 1.7 96 816 231 197 111Cuba ... ... ... 77 9 185 ... 5.3 ... 5.1 ... 185 251 32 2Dominican Republic 1998 47.4 <2 <2 67 38 153 ... 2.2 ... 1.5 84 181 ... ... 207Ecuador 1998 43.7 17.7 40.8 70 29 76 ... 1.7 1.9 1.6 91 422 237 31 121El Salvador 2000 53.2 31.1 58.0 70 39 174 0.3 1.1 ... 1.6 80 481 233 25 138Guatemala 2000 48.3 16.0 37.4 65 49 86 ... 0.9 ... 1.0 70 79 145 14 131Guyana 1999 43.2 <2 6.1 ... ... ... ... ... ... ... ... ... ... ... ...Haiti ... ... ... 52 123 22 ... 0.2 0.7 0.7 52 18 6 ... 17Honduras 1999 55.0 23.8 44.4 66 42 59 ... 0.8 1.3 1.1 80 411 119 14 49Jamaica 2000 37.9 <2 13.3 76 20 191 ... 1.4 ... 2.1 88 795 374 54 535Mexico 2000 54.6 9.9 26.3 74 29 370 ... 1.5 0.7 1.1 91 330 282 82 255Nicaragua 2001 55.1 45.1 79.9 69 41 60 0.4 0.9 ... 1.5 77 270 123 28 38Panama 2000 56.4 7.2 17.6 75 25 258 ... 1.7 ... 2.2 92 300 191 38 189Paraguay 1999 56.8 14.9 30.3 71 30 97 ... 1.1 ... 1.3 92 188 218 35 288Peru 2000 49.8 18.1 37.7 70 39 97 0.7 0.9 ... 1.5 85 269 172 43 86Puerto Rico ... ... ... 77 ... ... ... 1.8 ... 3.3 ... 761 339 ... 316Saint Lucia 1995 42.6 ... ... ... ... ... ... ... ... ... ... ... ... ... ...Trinidad and Tobago 1992 40.3 12.4 39.0 72 20 279 0.7 0.8 ... 5.1 ... 534 345 80 278Uruguay 2000 44.6 <2 3.9 75 15 603 ... 3.7 ... 4.4 98 603 530 110 193Venezuela 1998 49.1 15.0 32.0 74 22 307 0.8 2.4 0.3 1.5 93 294 186 61 256NORTHERN AMERICACanada 1998 33.1 ... ... 79 7 2,163 1.8 2.1 6.8 3.9 ... 1,047 691 487 377United States 2000 40.8 ... ... 77 8 4,887 2.0 2.7 6.0 3.6 ... 2,117 938 659 488OCEANIAAustralia 1994 35.2 ... ... 79 6 1,741 ... 2.5 12.3 7.9 ... 1,996 731 565 640New Zealand 1997 36.2 ... ... 78 6 1,073 1.6 2.2 10.2 6.2 ... 992 557 414 622Papua New Guinea 1996 50.9 ... ... 57 94 24 0.1 0.1 5.5 ... ... 86 21 59 3
Notes: Data are for the most recent year available.
Source: World Bank, 2004e; UNDP, 2004.
211Data tables

TABLE C.1Urban Agglomerations: Population Size and Rate of Change
Estimates and Projections Annual rate of change Share in urban population
(000) (%) (%)
1990 1995 2000 2005 2010 2015 1990– 1995– 2000– 2005– 2010– 2000 20151995 2000 2005 2010 2015
AFRICAAlgeria Algiers 1,908 2,295 2,761 3,260 3,739 4,165 3.69 3.69 3.32 2.74 2.16 16.0 16.7 Angola Luanda 1,597 1,958 2,341 2,839 3,487 4,271 4.07 3.58 3.86 4.11 4.05 56.6 49.4 Burkina Faso Ouagadougou 594 689 764 870 1,038 1,292 2.95 2.06 2.61 3.53 4.38 38.4 30.0 Cameroon Douala 1,001 1,324 1,663 1,980 2,254 2,481 5.59 4.56 3.49 2.59 1.92 22.5 22.0 Cameroon Yaoundé 823 1,123 1,438 1,727 1,970 2,171 6.22 4.95 3.66 2.64 1.94 19.4 19.2 Congo Brazzaville 704 830 980 1,153 1,361 1,609 3.31 3.32 3.25 3.33 3.34 54.4 52.1 Côte d’Ivoire Abidjan 2,102 2,535 3,057 3,516 3,975 4,432 3.74 3.74 2.80 2.46 2.18 44.3 43.8 Democratic Republic of the Congo Kinshasa 3,392 4,099 4,745 5,717 7,096 8,686 3.79 2.92 3.73 4.32 4.05 32.2 29.5 Democratic Republic of the Congo Lubumbashi 660 783 906 1,102 1,384 1,714 3.41 2.91 3.92 4.56 4.28 6.2 5.8 Egypt Alexandria 3,063 3,277 3,506 3,760 4,074 4,469 1.35 1.35 1.40 1.61 1.85 12.3 11.1 Egypt Cairo 9,061 9,707 10,398 11,146 12,036 13,123 1.38 1.38 1.39 1.54 1.73 36.4 32.5 Ethiopia Addis Ababa 1,791 2,157 2,491 2,899 3,429 4,138 3.72 2.88 3.04 3.36 3.76 25.5 22.3 Ghana Accra 1,197 1,415 1,674 1,970 2,289 2,607 3.35 3.35 3.26 3.00 2.61 19.4 19.3 Ghana Kumasi 584 664 755 862 986 1,121 2.57 2.57 2.65 2.69 2.56 8.8 8.3 Guinea Conakry 877 1,041 1,234 1,465 1,769 2,138 3.41 3.41 3.43 3.76 3.79 46.6 43.0 Kenya Nairobi 1,380 1,755 2,233 2,818 3,443 4,016 4.81 4.81 4.66 4.00 3.08 20.4 21.0 Libyan Arab Jamahiriya Benghazi 636 800 912 1,033 1,149 1,256 4.58 2.61 2.50 2.12 1.79 20.4 20.5 Libyan Arab Jamahiriya Tripoli 1,500 1,678 1,877 2,093 2,300 2,497 2.24 2.24 2.18 1.89 1.64 42.0 40.8 Madagascar Antananarivo . 948 1,212 1,494 1,808 2,166 2,598 4.91 4.18 3.82 3.61 3.64 36.0 35.2 Mali Bamako 737 906 1,114 1,379 1,729 2,178 4.13 4.13 4.28 4.52 4.62 31.0 28.0 Morocco Casablanca 2,685 2,994 3,344 3,743 4,168 4,579 2.18 2.21 2.25 2.15 1.88 20.7 19.4 Morocco Fès 684 787 904 1,032 1,165 1,293 2.82 2.76 2.66 2.43 2.08 5.6 5.5 Morocco Marrakech 580 693 818 951 1,082 1,203 3.54 3.34 3.01 2.58 2.12 5.1 5.1 Morocco Rabat 1,161 1,374 1,610 1,859 2,102 2,325 3.36 3.17 2.87 2.46 2.02 10.0 9.8 Mozambique Maputo 776 921 1,094 1,316 1,588 1,880 3.43 3.43 3.71 3.76 3.37 19.1 17.2 Niger Niamey 447 577 752 997 1,327 1,753 5.11 5.33 5.63 5.71 5.57 34.0 32.3 Nigeria Benin City 738 824 824 1,022 1,153 1,318 2.22 2.15 2.15 2.41 2.68 1.8 1.5 Nigeria Ibadan 1,782 1,965 1,965 2,375 2,649 3,001 1.95 1.90 1.90 2.18 2.50 4.3 3.3 Nigeria Kaduna 961 1,073 1,194 1,329 1,498 1,711 2.21 2.14 2.14 2.39 2.66 2.4 1.9 Nigeria Kano 2,095 2,337 2,596 2,884 3,242 3,689 2.18 2.10 2.10 2.34 2.58 5.1 4.1 Nigeria Lagos 4,764 6,434 6,434 11,135 14,037 17,036 6.01 5.95 5.02 4.63 3.87 17.1 19.0 Nigeria Ogbomosho 623 716 716 959 1,117 1,301 2.78 2.93 2.93 3.03 3.06 1.6 1.4 Nigeria Port Harcourt 680 760 760 942 1,063 1,216 2.21 2.15 2.15 2.41 2.69 1.7 1.4 Senegal Dakar 1,461 1,690 1,968 2,313 2,716 3,140 2.90 3.05 3.22 3.21 2.90 44.2 41.2 Sierra Leone Freetown 581 682 802 1,007 1,202 1,402 3.21 3.25 4.54 3.55 3.07 49.5 46.1 Somalia Mogadishu 757 896 1,061 1,257 1,488 1,787 3.38 3.38 3.38 3.38 3.65 36.5 27.4 South Africa Cape Town 2,155 2,394 2,715 3,103 3,205 3,239 2.10 2.52 2.67 0.65 0.21 11.1 11.7 South Africa Durban 1,673 2,081 2,370 2,643 2,696 2,709 4.36 2.60 2.18 0.40 0.10 9.7 9.8 South Africa East Rand (Ekurhuleni) 1,531 1,894 2,392 3,043 3,276 3,439 4.26 4.67 4.81 1.47 0.98 9.8 12.4 South Africa Johannesburg 1,878 2,265 2,732 3,288 3,539 3,666 3.74 3.75 3.70 1.47 0.70 11.2 13.2 South Africa Port Elizabeth 828 911 958 998 1,018 1,023 1.93 1.00 0.82 0.40 0.10 3.9 3.7 South Africa Pretoria 911 951 1,084 1,282 1,363 1,405 0.85 2.61 3.36 1.23 0.61 4.4 5.1 South Africa Vereeniging 743 800 897 1,033 1,075 1,095 1.48 2.30 2.82 0.80 0.37 3.7 3.9 Sudan Khartoum 2,360 3,242 3,949 4,495 5,044 5,638 6.35 3.95 2.59 2.30 2.23 34.8 27.6 Tunisia Tunis 1,568 1,722 1,891 2,063 2,215 2,360 1.87 1.87 1.74 1.42 1.27 31.7 31.2 Uganda Kampala 755 918 1,111 1,345 1,635 2,022 3.91 3.82 3.81 3.91 4.24 39.3 36.2 United Republic of Tanzania Dar es Salaam 1,316 1,668 2,116 2,683 3,371 4,123 4.75 4.75 4.75 4.56 4.03 18.8 19.2 Zambia Lusaka 974 1,131 1,307 1,450 1,605 1,792 2.98 2.90 2.07 2.04 2.20 35.7 34.7 Zimbabwe Harare 1,047 1,257 1,386 1,527 1,670 1,801 3.65 1.95 1.95 1.78 1.52 32.6 33.4 ASIAAfghanistan Kabul 1,565 2,047 2,549 3,288 4,305 5,362 5.37 4.39 5.09 5.39 4.39 54.4 49.5 Armenia Yerevan 1,173 1,136 1,100 1,066 1,036 1,019 (0.64) (0.64) (0.64) 0.56 (0.34) 54.4 53.6 Azerbaijan Baku 1,733 1,766 1,798 1,830 1,878 1,962 0.37 0.37 0.35 0.52 0.88 43.6 40.4 Bangladesh Chittagong 2,023 2,565 3,271 4,171 5,168 6,223 4.75 4.86 4.86 4.29 3.71 10.2 11.6 Bangladesh Dhaka 6,526 8,217 10,159 12,560 15,156 17,907 4.61 4.24 4.24 3.76 3.34 31.8 33.4 Bangladesh Khulna 900 1,066 1,264 1,497 1,752 2,045 3.40 3.40 3.39 3.14 3.09 3.9 3.8 Cambodia Phnom Penh 594 836 1,108 1,174 1,292 1,496 6.84 5.63 1.17 1.91 2.93 49.8 31.1 China1 Anshan 1,442 1,448 1,453 1,459 1,464 1,499 0.08 0.08 0.08 0.08 0.47 0.3 0.2 China Anshun 658 720 789 864 947 1,040 1.82 1.82 1.82 1.82 1.88 0.2 0.1 China Baotou 1,229 1,273 1,319 1,367 1,416 1,488 0.71 0.71 0.71 0.71 0.98 0.3 0.2 China Beijing 10,819 10,829 10,839 10,849 10,859 11,060 0.02 0.02 0.02 0.02 0.37 2.4 1.6 China Benxi 938 947 957 967 976 1,005 0.20 0.20 0.20 0.20 0.58 0.2 0.1 China Changchun 2,192 2,604 2,881 3,092 3,319 3,582 3.44 2.02 1.42 1.42 1.52 0.6 0.5 China Changde 1,180 1,273 1,374 1,483 1,600 1,735 1.52 1.52 1.52 1.52 1.62 0.3 0.2 China Changsha 1,329 1,536 1,775 2,051 2,370 2,713 2.89 2.89 2.89 2.89 2.71 0.4 0.4 China Changzhou 730 804 886 976 1,076 1,187 1.94 1.94 1.94 1.94 1.97 0.2 0.2 China Chengdu 2,955 3,120 3,294 3,478 3,672 3,910 1.09 1.09 1.09 1.09 1.25 0.7 0.6 China Chifeng 987 1,036 1,087 1,140 1,196 1,269 0.96 0.96 0.96 0.96 1.18 0.2 0.2 China Chongqing 3,123 4,073 4,635 4,975 5,340 5,758 5.31 2.59 1.42 1.42 1.51 1.0 0.8 China Dalian 2,472 2,549 2,628 2,709 2,793 2,918 0.61 0.61 0.61 0.61 0.88 0.6 0.4 China Daqing 997 1,035 1,076 1,117 1,160 1,221 0.76 0.76 0.76 0.76 1.02 0.2 0.2 China Datong 1,277 1,220 1,165 1,113 1,062 1,085 (0.92) (0.92) (0.92) (0.92) 0.42 0.3 0.2 China Dongguan 1,737 1,514 1,319 1,150 1,002 1,023 (2.75) (2.75) (2.75) (2.75) 0.42 0.3 0.1 China Fushun 1,388 1,400 1,413 1,425 1,438 1,478 0.18 0.18 0.18 0.18 0.55 0.3 0.2 China Fuxin 743 764 785 807 829 866 0.55 0.55 0.55 0.55 0.86 0.2 0.1 China Fuyu 945 984 1,025 1,068 1,112 1,173 0.81 0.81 0.81 0.81 1.07 0.2 0.2
212 Statistical annex
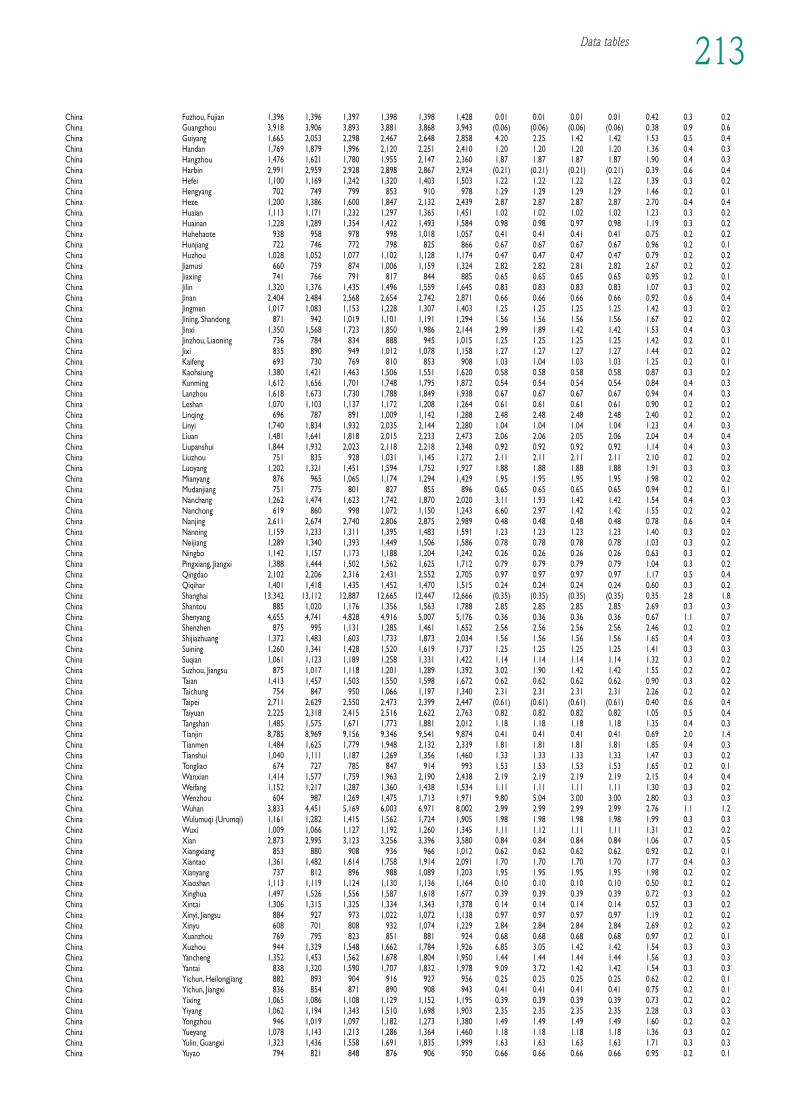
China Fuzhou, Fujian 1,396 1,396 1,397 1,398 1,398 1,428 0.01 0.01 0.01 0.01 0.42 0.3 0.2 China Guangzhou 3,918 3,906 3,893 3,881 3,868 3,943 (0.06) (0.06) (0.06) (0.06) 0.38 0.9 0.6 China Guiyang 1,665 2,053 2,298 2,467 2,648 2,858 4.20 2.25 1.42 1.42 1.53 0.5 0.4 China Handan 1,769 1,879 1,996 2,120 2,251 2,410 1.20 1.20 1.20 1.20 1.36 0.4 0.3 China Hangzhou 1,476 1,621 1,780 1,955 2,147 2,360 1.87 1.87 1.87 1.87 1.90 0.4 0.3 China Harbin 2,991 2,959 2,928 2,898 2,867 2,924 (0.21) (0.21) (0.21) (0.21) 0.39 0.6 0.4 China Hefei 1,100 1,169 1,242 1,320 1,403 1,503 1.22 1.22 1.22 1.22 1.39 0.3 0.2 China Hengyang 702 749 799 853 910 978 1.29 1.29 1.29 1.29 1.46 0.2 0.1 China Heze 1,200 1,386 1,600 1,847 2,132 2,439 2.87 2.87 2.87 2.87 2.70 0.4 0.4 China Huaian 1,113 1,171 1,232 1,297 1,365 1,451 1.02 1.02 1.02 1.02 1.23 0.3 0.2 China Huainan 1,228 1,289 1,354 1,422 1,493 1,584 0.98 0.98 0.97 0.98 1.19 0.3 0.2 China Huhehaote 938 958 978 998 1,018 1,057 0.41 0.41 0.41 0.41 0.75 0.2 0.2 China Hunjiang 722 746 772 798 825 866 0.67 0.67 0.67 0.67 0.96 0.2 0.1 China Huzhou 1,028 1,052 1,077 1,102 1,128 1,174 0.47 0.47 0.47 0.47 0.79 0.2 0.2 China Jiamusi 660 759 874 1,006 1,159 1,324 2.82 2.82 2.81 2.82 2.67 0.2 0.2 China Jiaxing 741 766 791 817 844 885 0.65 0.65 0.65 0.65 0.95 0.2 0.1 China Jilin 1,320 1,376 1,435 1,496 1,559 1,645 0.83 0.83 0.83 0.83 1.07 0.3 0.2 China Jinan 2,404 2,484 2,568 2,654 2,742 2,871 0.66 0.66 0.66 0.66 0.92 0.6 0.4 China Jingmen 1,017 1,083 1,153 1,228 1,307 1,403 1.25 1.25 1.25 1.25 1.42 0.3 0.2 China Jining, Shandong 871 942 1,019 1,101 1,191 1,294 1.56 1.56 1.56 1.56 1.67 0.2 0.2 China Jinxi 1,350 1,568 1,723 1,850 1,986 2,144 2.99 1.89 1.42 1.42 1.53 0.4 0.3 China Jinzhou, Liaoning 736 784 834 888 945 1,015 1.25 1.25 1.25 1.25 1.42 0.2 0.1 China Jixi 835 890 949 1,012 1,078 1,158 1.27 1.27 1.27 1.27 1.44 0.2 0.2 China Kaifeng 693 730 769 810 853 908 1.03 1.04 1.03 1.03 1.25 0.2 0.1 China Kaohsiung 1,380 1,421 1,463 1,506 1,551 1,620 0.58 0.58 0.58 0.58 0.87 0.3 0.2 China Kunming 1,612 1,656 1,701 1,748 1,795 1,872 0.54 0.54 0.54 0.54 0.84 0.4 0.3 China Lanzhou 1,618 1,673 1,730 1,788 1,849 1,938 0.67 0.67 0.67 0.67 0.94 0.4 0.3 China Leshan 1,070 1,103 1,137 1,172 1,208 1,264 0.61 0.61 0.61 0.61 0.90 0.2 0.2 China Linqing 696 787 891 1,009 1,142 1,288 2.48 2.48 2.48 2.48 2.40 0.2 0.2 China Linyi 1,740 1,834 1,932 2,035 2,144 2,280 1.04 1.04 1.04 1.04 1.23 0.4 0.3 China Liuan 1,481 1,641 1,818 2,015 2,233 2,473 2.06 2.06 2.05 2.06 2.04 0.4 0.4 China Liupanshui 1,844 1,932 2,023 2,118 2,218 2,348 0.92 0.92 0.92 0.92 1.14 0.4 0.3 China Liuzhou 751 835 928 1,031 1,145 1,272 2.11 2.11 2.11 2.11 2.10 0.2 0.2 China Luoyang 1,202 1,321 1,451 1,594 1,752 1,927 1.88 1.88 1.88 1.88 1.91 0.3 0.3 China Mianyang 876 965 1,065 1,174 1,294 1,429 1.95 1.95 1.95 1.95 1.98 0.2 0.2 China Mudanjiang 751 775 801 827 855 896 0.65 0.65 0.65 0.65 0.94 0.2 0.1 China Nanchang 1,262 1,474 1,623 1,742 1,870 2,020 3.11 1.93 1.42 1.42 1.54 0.4 0.3 China Nanchong 619 860 998 1,072 1,150 1,243 6.60 2.97 1.42 1.42 1.55 0.2 0.2 China Nanjing 2,611 2,674 2,740 2,806 2,875 2,989 0.48 0.48 0.48 0.48 0.78 0.6 0.4 China Nanning 1,159 1,233 1,311 1,395 1,483 1,591 1.23 1.23 1.23 1.23 1.40 0.3 0.2 China Neijiang 1,289 1,340 1,393 1,449 1,506 1,586 0.78 0.78 0.78 0.78 1.03 0.3 0.2 China Ningbo 1,142 1,157 1,173 1,188 1,204 1,242 0.26 0.26 0.26 0.26 0.63 0.3 0.2 China Pingxiang, Jiangxi 1,388 1,444 1,502 1,562 1,625 1,712 0.79 0.79 0.79 0.79 1.04 0.3 0.2 China Qingdao 2,102 2,206 2,316 2,431 2,552 2,705 0.97 0.97 0.97 0.97 1.17 0.5 0.4 China Qiqihar 1,401 1,418 1,435 1,452 1,470 1,515 0.24 0.24 0.24 0.24 0.60 0.3 0.2 China Shanghai 13,342 13,112 12,887 12,665 12,447 12,666 (0.35) (0.35) (0.35) (0.35) 0.35 2.8 1.8 China Shantou 885 1,020 1,176 1,356 1,563 1,788 2.85 2.85 2.85 2.85 2.69 0.3 0.3 China Shenyang 4,655 4,741 4,828 4,916 5,007 5,176 0.36 0.36 0.36 0.36 0.67 1.1 0.7 China Shenzhen 875 995 1,131 1,285 1,461 1,652 2.56 2.56 2.56 2.56 2.46 0.2 0.2 China Shijiazhuang 1,372 1,483 1,603 1,733 1,873 2,034 1.56 1.56 1.56 1.56 1.65 0.4 0.3 China Suining 1,260 1,341 1,428 1,520 1,619 1,737 1.25 1.25 1.25 1.25 1.41 0.3 0.3 China Suqian 1,061 1,123 1,189 1,258 1,331 1,422 1.14 1.14 1.14 1.14 1.32 0.3 0.2 China Suzhou, Jiangsu 875 1,017 1,118 1,201 1,289 1,392 3.02 1.90 1.42 1.42 1.55 0.2 0.2 China Taian 1,413 1,457 1,503 1,550 1,598 1,672 0.62 0.62 0.62 0.62 0.90 0.3 0.2 China Taichung 754 847 950 1,066 1,197 1,340 2.31 2.31 2.31 2.31 2.26 0.2 0.2 China Taipei 2,711 2,629 2,550 2,473 2,399 2,447 (0.61) (0.61) (0.61) (0.61) 0.40 0.6 0.4 China Taiyuan 2,225 2,318 2,415 2,516 2,622 2,763 0.82 0.82 0.82 0.82 1.05 0.5 0.4 China Tangshan 1,485 1,575 1,671 1,773 1,881 2,012 1.18 1.18 1.18 1.18 1.35 0.4 0.3 China Tianjin 8,785 8,969 9,156 9,346 9,541 9,874 0.41 0.41 0.41 0.41 0.69 2.0 1.4 China Tianmen 1,484 1,625 1,779 1,948 2,132 2,339 1.81 1.81 1.81 1.81 1.85 0.4 0.3 China Tianshui 1,040 1,111 1,187 1,269 1,356 1,460 1.33 1.33 1.33 1.33 1.47 0.3 0.2 China Tongliao 674 727 785 847 914 993 1.53 1.53 1.53 1.53 1.65 0.2 0.1 China Wanxian 1,414 1,577 1,759 1,963 2,190 2,438 2.19 2.19 2.19 2.19 2.15 0.4 0.4 China Weifang 1,152 1,217 1,287 1,360 1,438 1,534 1.11 1.11 1.11 1.11 1.30 0.3 0.2 China Wenzhou 604 987 1,269 1,475 1,713 1,971 9.80 5.04 3.00 3.00 2.80 0.3 0.3 China Wuhan 3,833 4,451 5,169 6,003 6,971 8,002 2.99 2.99 2.99 2.99 2.76 1.1 1.2 China Wulumuqi (Urumqi) 1,161 1,282 1,415 1,562 1,724 1,905 1.98 1.98 1.98 1.98 1.99 0.3 0.3 China Wuxi 1,009 1,066 1,127 1,192 1,260 1,345 1.11 1.12 1.11 1.11 1.31 0.2 0.2 China Xian 2,873 2,995 3,123 3,256 3,396 3,580 0.84 0.84 0.84 0.84 1.06 0.7 0.5 China Xiangxiang 853 880 908 936 966 1,012 0.62 0.62 0.62 0.62 0.92 0.2 0.1 China Xiantao 1,361 1,482 1,614 1,758 1,914 2,091 1.70 1.70 1.70 1.70 1.77 0.4 0.3 China Xianyang 737 812 896 988 1,089 1,203 1.95 1.95 1.95 1.95 1.98 0.2 0.2 China Xiaoshan 1,113 1,119 1,124 1,130 1,136 1,164 0.10 0.10 0.10 0.10 0.50 0.2 0.2 China Xinghua 1,497 1,526 1,556 1,587 1,618 1,677 0.39 0.39 0.39 0.39 0.72 0.3 0.2 China Xintai 1,306 1,315 1,325 1,334 1,343 1,378 0.14 0.14 0.14 0.14 0.52 0.3 0.2 China Xinyi, Jiangsu 884 927 973 1,022 1,072 1,138 0.97 0.97 0.97 0.97 1.19 0.2 0.2 China Xinyu 608 701 808 932 1,074 1,229 2.84 2.84 2.84 2.84 2.69 0.2 0.2 China Xuanzhou 769 795 823 851 881 924 0.68 0.68 0.68 0.68 0.97 0.2 0.1 China Xuzhou 944 1,329 1,548 1,662 1,784 1,926 6.85 3.05 1.42 1.42 1.54 0.3 0.3 China Yancheng 1,352 1,453 1,562 1,678 1,804 1,950 1.44 1.44 1.44 1.44 1.56 0.3 0.3 China Yantai 838 1,320 1,590 1,707 1,832 1,978 9.09 3.72 1.42 1.42 1.54 0.3 0.3 China Yichun, Heilongjiang 882 893 904 916 927 956 0.25 0.25 0.25 0.25 0.62 0.2 0.1 China Yichun, Jiangxi 836 854 871 890 908 943 0.41 0.41 0.41 0.41 0.75 0.2 0.1 China Yixing 1,065 1,086 1,108 1,129 1,152 1,195 0.39 0.39 0.39 0.39 0.73 0.2 0.2 China Yiyang 1,062 1,194 1,343 1,510 1,698 1,903 2.35 2.35 2.35 2.35 2.28 0.3 0.3 China Yongzhou 946 1,019 1,097 1,182 1,273 1,380 1.49 1.49 1.49 1.49 1.60 0.2 0.2 China Yueyang 1,078 1,143 1,213 1,286 1,364 1,460 1.18 1.18 1.18 1.18 1.36 0.3 0.2 China Yulin, Guangxi 1,323 1,436 1,558 1,691 1,835 1,999 1.63 1.63 1.63 1.63 1.71 0.3 0.3 China Yuyao 794 821 848 876 906 950 0.66 0.66 0.66 0.66 0.95 0.2 0.1
213Data tables

TABLE C.1continued
Estimates and Projections Annual rate of change Share in urban population
(000) (%) (%)
1990 1995 2000 2005 2010 2015 1990– 1995– 2000– 2005– 2010– 2000 20151995 2000 2005 2010 2015
China Yuzhou 1,073 1,122 1,173 1,226 1,282 1,357 0.89 0.89 0.89 0.89 1.13 0.3 0.2 China Zaoyang 962 1,039 1,121 1,210 1,306 1,418 1.53 1.53 1.53 1.53 1.64 0.2 0.2 China Zaozhuang 1,793 1,916 2,048 2,189 2,339 2,516 1.33 1.33 1.33 1.33 1.46 0.4 0.4 China Zhangjiakou 720 796 880 973 1,076 1,191 2.01 2.01 2.01 2.01 2.03 0.2 0.2 China Zhangjiangang 793 838 886 936 990 1,056 1.11 1.11 1.11 1.11 1.31 0.2 0.2 China Zhanjiang 1,049 1,198 1,368 1,562 1,783 2,024 2.65 2.66 2.65 2.65 2.53 0.3 0.3 China Zhaodong 797 824 851 879 908 952 0.65 0.65 0.65 0.65 0.94 0.2 0.1 China Zhengzhou 1,752 1,905 2,070 2,250 2,445 2,666 1.67 1.67 1.66 1.67 1.73 0.5 0.4 China Zibo 2,484 2,578 2,675 2,775 2,879 3,024 0.74 0.74 0.74 0.74 0.98 0.6 0.4 China Zigong 977 1,023 1,072 1,123 1,176 1,246 0.93 0.93 0.92 0.93 1.16 0.2 0.2 China, Hong Kong SAR Hong Kong2 5,677 6,183 6,807 7,182 7,537 7,872 1.71 1.92 1.07 0.97 0.87 100.0 100.0 Democratic People’s Republic of Korea Nampho 580 808 1,022 1,179 1,272 1,329 6.62 4.71 2.85 1.52 0.89 7.6 8.5 Democratic People’s Republic of Korea Pyongyang 2,473 2,865 3,124 3,284 3,399 3,504 2.94 1.73 1.00 0.69 0.61 23.3 22.5 Georgia Tbilisi 1,227 1,162 1,100 1,042 997 971 (1.09) (1.09) (1.09) (0.87) (0.52) 39.7 39.8 India Agra 933 1,095 1,293 1,526 1,758 1,996 3.20 3.32 3.32 2.83 2.54 0.5 0.5 India Ahmadabad 3,255 3,790 4,427 5,171 5,897 6,632 3.04 3.11 3.11 2.63 2.35 1.6 1.7 India Allahabad 830 928 1,035 1,153 1,270 1,404 2.23 2.17 2.17 1.92 2.02 0.4 0.3 India Amritsar 726 844 990 1,162 1,332 1,510 3.00 3.20 3.19 2.74 2.50 0.4 0.4 India Asansol 727 891 1,065 1,272 1,480 1,691 4.06 3.56 3.56 3.03 2.67 0.4 0.4 India Aurangabad 568 708 868 1,065 1,265 1,465 4.38 4.09 4.08 3.45 2.94 0.3 0.4 India Bangalore 4,036 4,744 5,567 6,532 7,474 8,416 3.23 3.20 3.20 2.69 2.38 2.0 2.1 India Bhopal 1,046 1,228 1,426 1,656 1,884 2,122 3.21 3.00 2.99 2.57 2.38 0.5 0.5 India Calcutta 10,890 11,924 13,058 14,299 15,462 16,798 1.82 1.82 1.82 1.56 1.66 4.6 4.2 India Chandigarh 564 658 768 896 1,024 1,159 3.09 3.09 3.09 2.66 2.47 0.3 0.3 India Chennai (Madras) 5,338 5,836 6,353 6,915 7,450 8,092 1.78 1.70 1.70 1.49 1.65 2.3 2.0 India Coimbatore 1,088 1,239 1,420 1,628 1,831 2,050 2.60 2.73 2.73 2.36 2.26 0.5 0.5 India Delhi 8,206 10,092 12,441 15,334 18,226 20,946 4.14 4.18 4.18 3.46 2.78 4.4 5.2 India Dhanbad 805 915 1,046 1,195 1,342 1,502 2.56 2.67 2.67 2.32 2.25 0.4 0.4 India Durg-Bhilainagar 670 780 905 1,051 1,195 1,348 3.03 2.98 2.98 2.57 2.41 0.3 0.3 India Faridabad 593 779 1,018 1,330 1,663 1,983 5.47 5.35 5.35 4.46 3.52 0.4 0.5 India Ghaziabad 492 675 928 1,277 1,663 2,033 6.30 6.38 6.38 5.28 4.02 0.3 0.5 India Guwahati 564 675 797 941 1,085 1,234 3.60 3.32 3.32 2.85 2.58 0.3 0.3 India Gwalior 706 779 855 939 1,022 1,123 1.97 1.88 1.87 1.69 1.89 0.3 0.3 India Hubli-Dharwad 639 705 776 854 932 1,026 1.95 1.93 1.93 1.73 1.92 0.3 0.3 India Hyderabad 4,193 4,825 5,445 6,145 6,816 7,536 2.81 2.42 2.42 2.07 2.01 1.9 1.9 India Indore 1,088 1,314 1,597 1,941 2,289 2,633 3.77 3.91 3.90 3.29 2.80 0.6 0.7 India Jabalpur 879 981 1,100 1,234 1,364 1,512 2.19 2.29 2.29 2.01 2.06 0.4 0.4 India Jaipur 1,478 1,826 2,259 2,796 3,341 3,871 4.23 4.26 4.26 3.57 2.95 0.8 1.0 India Jamshedpur 817 938 1,081 1,246 1,409 1,583 2.75 2.84 2.84 2.46 2.33 0.4 0.4 India Jodhpur 654 743 842 954 1,065 1,188 2.54 2.51 2.51 2.19 2.19 0.3 0.3 India Kanpur 2,001 2,294 2,641 3,040 3,429 3,838 2.73 2.82 2.82 2.41 2.25 0.9 1.0 India Kochi (Cochin) 1,103 1,229 1,340 1,461 1,579 1,726 2.17 1.73 1.72 1.56 1.78 0.5 0.4 India Kozhikode (Calicut) 781 835 875 917 961 1,033 1.33 0.94 0.94 0.94 1.44 0.3 0.3 India Lucknow 1,614 1,906 2,221 2,589 2,949 3,322 3.33 3.06 3.06 2.61 2.38 0.8 0.8 India Ludhiana 1,006 1,183 1,368 1,583 1,794 2,017 3.24 2.91 2.91 2.50 2.34 0.5 0.5 India Madurai 1,073 1,132 1,187 1,245 1,305 1,402 1.07 0.95 0.95 0.95 1.43 0.4 0.3 India Meerut 824 975 1,143 1,340 1,535 1,738 3.36 3.18 3.17 2.72 2.48 0.4 0.4 India Mumbai (Bombay) 12,308 14,111 16,086 18,336 20,468 22,645 2.73 2.62 2.62 2.20 2.02 5.7 5.6 India Mysore 640 708 776 851 925 1,017 2.01 1.85 1.85 1.67 1.88 0.3 0.3 India Nagpur 1,637 1,849 2,089 2,359 2,622 2,911 2.44 2.44 2.44 2.11 2.09 0.7 0.7 India Nashik 700 886 1,117 1,408 1,709 2,003 4.71 4.63 4.63 3.88 3.17 0.4 0.5 India Patna 1,087 1,331 1,658 2,066 2,484 2,892 4.05 4.40 4.40 3.69 3.04 0.6 0.7 India Pune (Poona) 2,430 2,978 3,655 4,485 5,321 6,130 4.07 4.09 4.09 3.42 2.83 1.3 1.5 India Rajkot 638 787 974 1,205 1,442 1,677 4.21 4.26 4.26 3.59 3.01 0.3 0.4 India Ranchi 607 712 844 999 1,155 1,316 3.21 3.39 3.39 2.90 2.61 0.3 0.3 India Solapur 613 720 853 1,012 1,171 1,334 3.20 3.41 3.41 2.91 2.62 0.3 0.3 India Srinagar 730 833 954 1,093 1,230 1,379 2.62 2.72 2.72 2.36 2.28 0.3 0.3 India Surat 1,468 1,984 2,699 3,671 4,732 5,731 6.01 6.16 6.16 5.08 3.83 1.0 1.4 India Thiruvananthapuram 801 853 885 918 954 1,021 1.25 0.73 0.73 0.78 1.35 0.3 0.3 India Tiruchchirapalli 705 768 837 913 989 1,083 1.71 1.74 1.74 1.58 1.83 0.3 0.3 India Vadodara 1,096 1,273 1,465 1,686 1,903 2,134 2.99 2.81 2.81 2.42 2.29 0.5 0.5 India Varanasi (Benares) 1,013 1,106 1,199 1,300 1,399 1,526 1.75 1.62 1.62 1.47 1.74 0.4 0.4 India Vijayawada 821 914 999 1,093 1,184 1,298 2.14 1.79 1.79 1.61 1.83 0.4 0.3 India Visakhapatnam 1,018 1,168 1,309 1,468 1,624 1,799 2.73 2.29 2.29 2.01 2.05 0.5 0.4 Indonesia Bandung 2,460 2,896 3,409 4,020 4,687 5,315 3.26 3.26 3.30 3.07 2.51 3.8 3.7 Indonesia Jakarta 7,650 9,161 11,018 13,194 15,477 17,498 3.60 3.69 3.60 3.19 2.46 12.4 12.1 Indonesia Malang 620 698 787 898 1,032 1,170 2.40 2.40 2.64 2.77 2.52 0.9 0.8 Indonesia Medan 1,537 1,699 1,879 2,109 2,392 2,690 2.01 2.01 2.31 2.52 2.35 2.1 1.9 Indonesia Palembang 1,032 1,212 1,422 1,675 1,957 2,229 3.20 3.20 3.27 3.11 2.60 1.6 1.5 Indonesia Semarang 804 795 787 816 885 982 (0.21) (0.21) 0.73 1.62 2.08 0.9 0.7 Indonesia Surabaja 2,061 2,252 2,461 2,735 3,082 3,453 1.77 1.77 2.11 2.39 2.27 2.8 2.4 Indonesia Tegal 550 650 762 898 1,052 1,202 3.34 3.19 3.28 3.15 2.67 0.9 0.8 Indonesia Ujung Pandang 816 926 1,051 1,205 1,387 1,573 2.53 2.53 2.74 2.81 2.51 1.2 1.1 Iran (Islamic Republic of) Ahvaz 685 784 871 967 1,071 1,183 2.69 2.10 2.10 2.04 1.98 2.0 2.0 Iran (Islamic Republic of) Esfahan 1,094 1,230 1,381 1,547 1,719 1,898 2.33 2.33 2.26 2.11 1.97 3.2 3.2 Iran (Islamic Republic of) Karaj 693 903 1,063 1,235 1,405 1,566 5.30 3.25 3.01 2.57 2.17 2.5 2.6
214 Statistical annex
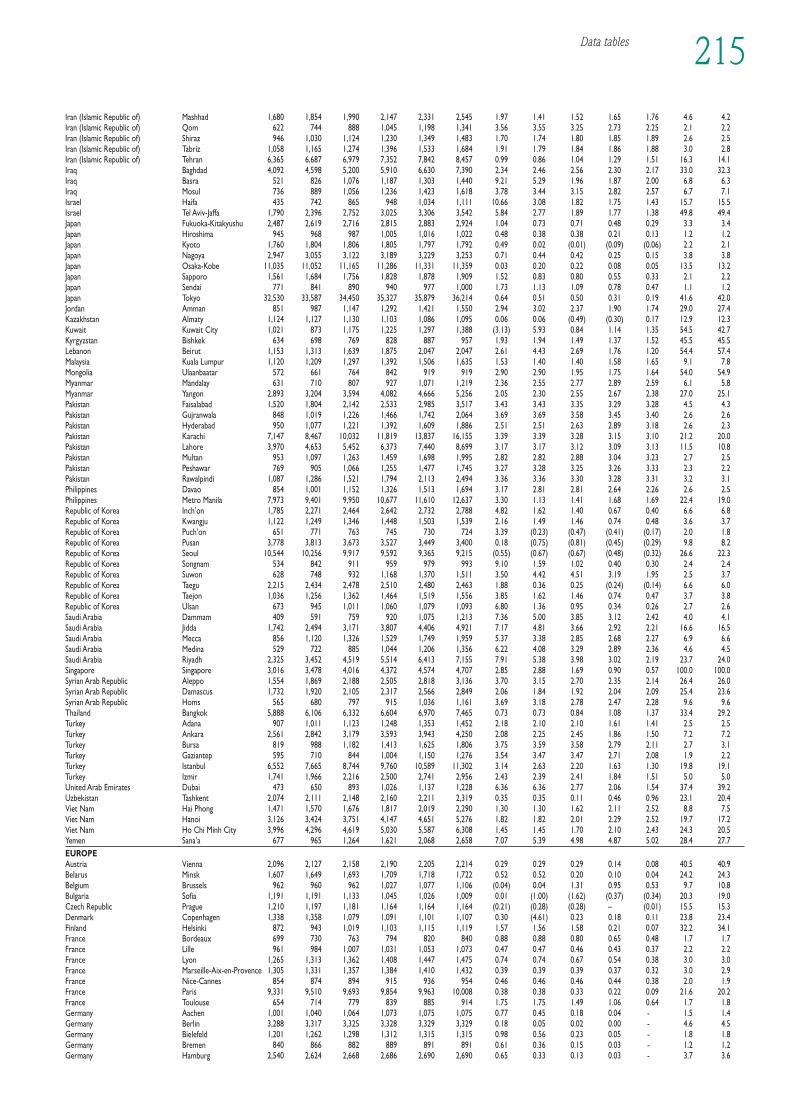
Iran (Islamic Republic of) Mashhad 1,680 1,854 1,990 2,147 2,331 2,545 1.97 1.41 1.52 1.65 1.76 4.6 4.2 Iran (Islamic Republic of) Qom 622 744 888 1,045 1,198 1,341 3.56 3.55 3.25 2.73 2.25 2.1 2.2 Iran (Islamic Republic of) Shiraz 946 1,030 1,124 1,230 1,349 1,483 1.70 1.74 1.80 1.85 1.89 2.6 2.5 Iran (Islamic Republic of) Tabriz 1,058 1,165 1,274 1,396 1,533 1,684 1.91 1.79 1.84 1.86 1.88 3.0 2.8 Iran (Islamic Republic of) Tehran 6,365 6,687 6,979 7,352 7,842 8,457 0.99 0.86 1.04 1.29 1.51 16.3 14.1 Iraq Baghdad 4,092 4,598 5,200 5,910 6,630 7,390 2.34 2.46 2.56 2.30 2.17 33.0 32.3 Iraq Basra 521 826 1,076 1,187 1,303 1,440 9.21 5.29 1.96 1.87 2.00 6.8 6.3 Iraq Mosul 736 889 1,056 1,236 1,423 1,618 3.78 3.44 3.15 2.82 2.57 6.7 7.1 Israel Haifa 435 742 865 948 1,034 1,111 10.66 3.08 1.82 1.75 1.43 15.7 15.5 Israel Tel Aviv-Jaffa 1,790 2,396 2,752 3,025 3,306 3,542 5.84 2.77 1.89 1.77 1.38 49.8 49.4 Japan Fukuoka-Kitakyushu 2,487 2,619 2,716 2,815 2,883 2,924 1.04 0.73 0.71 0.48 0.29 3.3 3.4 Japan Hiroshima 945 968 987 1,005 1,016 1,022 0.48 0.38 0.38 0.21 0.13 1.2 1.2 Japan Kyoto 1,760 1,804 1,806 1,805 1,797 1,792 0.49 0.02 (0.01) (0.09) (0.06) 2.2 2.1 Japan Nagoya 2,947 3,055 3,122 3,189 3,229 3,253 0.71 0.44 0.42 0.25 0.15 3.8 3.8 Japan Osaka-Kobe 11,035 11,052 11,165 11,286 11,331 11,359 0.03 0.20 0.22 0.08 0.05 13.5 13.2 Japan Sapporo 1,561 1,684 1,756 1,828 1,878 1,909 1.52 0.83 0.80 0.55 0.33 2.1 2.2 Japan Sendai 771 841 890 940 977 1,000 1.73 1.13 1.09 0.78 0.47 1.1 1.2 Japan Tokyo 32,530 33,587 34,450 35,327 35,879 36,214 0.64 0.51 0.50 0.31 0.19 41.6 42.0 Jordan Amman 851 987 1,147 1,292 1,421 1,550 2.94 3.02 2.37 1.90 1.74 29.0 27.4 Kazakhstan Almaty 1,124 1,127 1,130 1,103 1,086 1,095 0.06 0.06 (0.49) (0.30) 0.17 12.9 12.3 Kuwait Kuwait City 1,021 873 1,175 1,225 1,297 1,388 (3.13) 5.93 0.84 1.14 1.35 54.5 42.7 Kyrgyzstan Bishkek 634 698 769 828 887 957 1.93 1.94 1.49 1.37 1.52 45.5 45.5 Lebanon Beirut 1,153 1,313 1,639 1,875 2,047 2,047 2.61 4.43 2.69 1.76 1.20 54.4 57.4 Malaysia Kuala Lumpur 1,120 1,209 1,297 1,392 1,506 1,635 1.53 1.40 1.40 1.58 1.65 9.1 7.8 Mongolia Ulaanbaatar 572 661 764 842 919 919 2.90 2.90 1.95 1.75 1.64 54.0 54.9 Myanmar Mandalay 631 710 807 927 1,071 1,219 2.36 2.55 2.77 2.89 2.59 6.1 5.8 Myanmar Yangon 2,893 3,204 3,594 4,082 4,666 5,256 2.05 2.30 2.55 2.67 2.38 27.0 25.1 Pakistan Faisalabad 1,520 1,804 2,142 2,533 2,985 3,517 3.43 3.43 3.35 3.29 3.28 4.5 4.3 Pakistan Gujranwala 848 1,019 1,226 1,466 1,742 2,064 3.69 3.69 3.58 3.45 3.40 2.6 2.6 Pakistan Hyderabad 950 1,077 1,221 1,392 1,609 1,886 2.51 2.51 2.63 2.89 3.18 2.6 2.3 Pakistan Karachi 7,147 8,467 10,032 11,819 13,837 16,155 3.39 3.39 3.28 3.15 3.10 21.2 20.0 Pakistan Lahore 3,970 4,653 5,452 6,373 7,440 8,699 3.17 3.17 3.12 3.09 3.13 11.5 10.8 Pakistan Multan 953 1,097 1,263 1,459 1,698 1,995 2.82 2.82 2.88 3.04 3.23 2.7 2.5 Pakistan Peshawar 769 905 1,066 1,255 1,477 1,745 3.27 3.28 3.25 3.26 3.33 2.3 2.2 Pakistan Rawalpindi 1,087 1,286 1,521 1,794 2,113 2,494 3.36 3.36 3.30 3.28 3.31 3.2 3.1 Philippines Davao 854 1,001 1,152 1,326 1,513 1,694 3.17 2.81 2.81 2.64 2.26 2.6 2.5 Philippines Metro Manila 7,973 9,401 9,950 10,677 11,610 12,637 3.30 1.13 1.41 1.68 1.69 22.4 19.0 Republic of Korea Inch’on 1,785 2,271 2,464 2,642 2,732 2,788 4.82 1.62 1.40 0.67 0.40 6.6 6.8 Republic of Korea Kwangju 1,122 1,249 1,346 1,448 1,503 1,539 2.16 1.49 1.46 0.74 0.48 3.6 3.7 Republic of Korea Puch’on 651 771 763 745 730 724 3.39 (0.23) (0.47) (0.41) (0.17) 2.0 1.8 Republic of Korea Pusan 3,778 3,813 3,673 3,527 3,449 3,400 0.18 (0.75) (0.81) (0.45) (0.29) 9.8 8.2 Republic of Korea Seoul 10,544 10,256 9,917 9,592 9,365 9,215 (0.55) (0.67) (0.67) (0.48) (0.32) 26.6 22.3 Republic of Korea Songnam 534 842 911 959 979 993 9.10 1.59 1.02 0.40 0.30 2.4 2.4 Republic of Korea Suwon 628 748 932 1,168 1,370 1,511 3.50 4.42 4.51 3.19 1.95 2.5 3.7 Republic of Korea Taegu 2,215 2,434 2,478 2,510 2,480 2,463 1.88 0.36 0.25 (0.24) (0.14) 6.6 6.0 Republic of Korea Taejon 1,036 1,256 1,362 1,464 1,519 1,556 3.85 1.62 1.46 0.74 0.47 3.7 3.8 Republic of Korea Ulsan 673 945 1,011 1,060 1,079 1,093 6.80 1.36 0.95 0.34 0.26 2.7 2.6 Saudi Arabia Dammam 409 591 759 920 1,075 1,213 7.36 5.00 3.85 3.12 2.42 4.0 4.1 Saudi Arabia Jidda 1,742 2,494 3,171 3,807 4,406 4,921 7.17 4.81 3.66 2.92 2.21 16.6 16.5 Saudi Arabia Mecca 856 1,120 1,326 1,529 1,749 1,959 5.37 3.38 2.85 2.68 2.27 6.9 6.6 Saudi Arabia Medina 529 722 885 1,044 1,206 1,356 6.22 4.08 3.29 2.89 2.36 4.6 4.5 Saudi Arabia Riyadh 2,325 3,452 4,519 5,514 6,413 7,155 7.91 5.38 3.98 3.02 2.19 23.7 24.0 Singapore Singapore 3,016 3,478 4,016 4,372 4,574 4,707 2.85 2.88 1.69 0.90 0.57 100.0 100.0 Syrian Arab Republic Aleppo 1,554 1,869 2,188 2,505 2,818 3,136 3.70 3.15 2.70 2.35 2.14 26.4 26.0 Syrian Arab Republic Damascus 1,732 1,920 2,105 2,317 2,566 2,849 2.06 1.84 1.92 2.04 2.09 25.4 23.6 Syrian Arab Republic Homs 565 680 797 915 1,036 1,161 3.69 3.18 2.78 2.47 2.28 9.6 9.6 Thailand Bangkok 5,888 6,106 6,332 6,604 6,970 7,465 0.73 0.73 0.84 1.08 1.37 33.4 29.2 Turkey Adana 907 1,011 1,123 1,248 1,353 1,452 2.18 2.10 2.10 1.61 1.41 2.5 2.5 Turkey Ankara 2,561 2,842 3,179 3,593 3,943 4,250 2.08 2.25 2.45 1.86 1.50 7.2 7.2 Turkey Bursa 819 988 1,182 1,413 1,625 1,806 3.75 3.59 3.58 2.79 2.11 2.7 3.1 Turkey Gaziantep 595 710 844 1,004 1,150 1,276 3.54 3.47 3.47 2.71 2.08 1.9 2.2 Turkey Istanbul 6,552 7,665 8,744 9,760 10,589 11,302 3.14 2.63 2.20 1.63 1.30 19.8 19.1 Turkey Izmir 1,741 1,966 2,216 2,500 2,741 2,956 2.43 2.39 2.41 1.84 1.51 5.0 5.0 United Arab Emirates Dubai 473 650 893 1,026 1,137 1,228 6.36 6.36 2.77 2.06 1.54 37.4 39.2 Uzbekistan Tashkent 2,074 2,111 2,148 2,160 2,211 2,319 0.35 0.35 0.11 0.46 0.96 23.1 20.4 Viet Nam Hai Phong 1,471 1,570 1,676 1,817 2,019 2,290 1.30 1.30 1.62 2.11 2.52 8.8 7.5 Viet Nam Hanoi 3,126 3,424 3,751 4,147 4,651 5,276 1.82 1.82 2.01 2.29 2.52 19.7 17.2 Viet Nam Ho Chi Minh City 3,996 4,296 4,619 5,030 5,587 6,308 1.45 1.45 1.70 2.10 2.43 24.3 20.5 Yemen Sana’a 677 965 1,264 1,621 2,068 2,658 7.07 5.39 4.98 4.87 5.02 28.4 27.7 EUROPEAustria Vienna 2,096 2,127 2,158 2,190 2,205 2,214 0.29 0.29 0.29 0.14 0.08 40.5 40.9 Belarus Minsk 1,607 1,649 1,693 1,709 1,718 1,722 0.52 0.52 0.20 0.10 0.04 24.2 24.3 Belgium Brussels 962 960 962 1,027 1,077 1,106 (0.04) 0.04 1.31 0.95 0.53 9.7 10.8 Bulgaria Sofia 1,191 1,191 1,133 1,045 1,026 1,009 0.01 (1.00) (1.62) (0.37) (0.34) 20.3 19.0 Czech Republic Prague 1,210 1,197 1,181 1,164 1,164 1,164 (0.21) (0.28) (0.28) – (0.01) 15.5 15.3 Denmark Copenhagen 1,338 1,358 1,079 1,091 1,101 1,107 0.30 (4.61) 0.23 0.18 0.11 23.8 23.4 Finland Helsinki 872 943 1,019 1,103 1,115 1,119 1.57 1.56 1.58 0.21 0.07 32.2 34.1 France Bordeaux 699 730 763 794 820 840 0.88 0.88 0.80 0.65 0.48 1.7 1.7 France Lille 961 984 1,007 1,031 1,053 1,073 0.47 0.47 0.46 0.43 0.37 2.2 2.2 France Lyon 1,265 1,313 1,362 1,408 1,447 1,475 0.74 0.74 0.67 0.54 0.38 3.0 3.0 France Marseille-Aix-en-Provence 1,305 1,331 1,357 1,384 1,410 1,432 0.39 0.39 0.39 0.37 0.32 3.0 2.9 France Nice-Cannes 854 874 894 915 936 954 0.46 0.46 0.46 0.44 0.38 2.0 1.9 France Paris 9,331 9,510 9,693 9,854 9,963 10,008 0.38 0.38 0.33 0.22 0.09 21.6 20.2 France Toulouse 654 714 779 839 885 914 1.75 1.75 1.49 1.06 0.64 1.7 1.8 Germany Aachen 1,001 1,040 1,064 1,073 1,075 1,075 0.77 0.45 0.18 0.04 - 1.5 1.4 Germany Berlin 3,288 3,317 3,325 3,328 3,329 3,329 0.18 0.05 0.02 0.00 - 4.6 4.5 Germany Bielefeld 1,201 1,262 1,298 1,312 1,315 1,315 0.98 0.56 0.23 0.05 - 1.8 1.8 Germany Bremen 840 866 882 889 891 891 0.61 0.36 0.15 0.03 - 1.2 1.2 Germany Hamburg 2,540 2,624 2,668 2,686 2,690 2,690 0.65 0.33 0.13 0.03 - 3.7 3.6
215Data tables
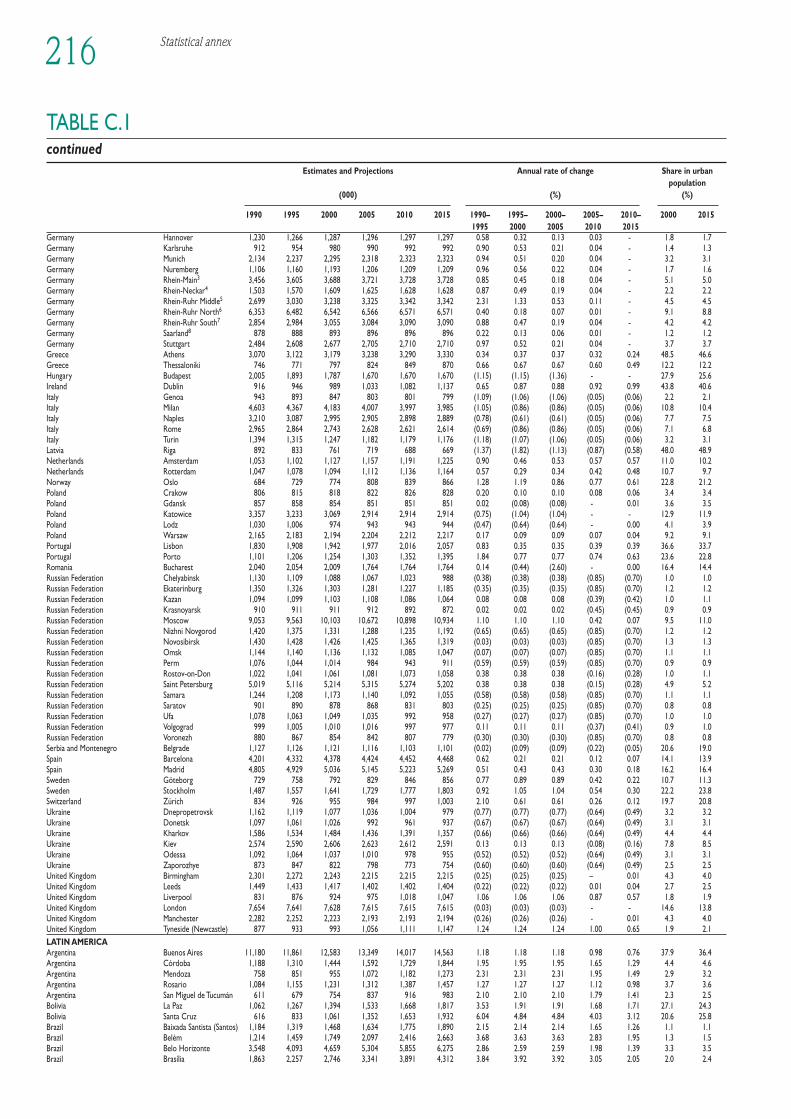
TABLE C.1continued
Estimates and Projections Annual rate of change Share in urban population
(000) (%) (%)
1990 1995 2000 2005 2010 2015 1990– 1995– 2000– 2005– 2010– 2000 20151995 2000 2005 2010 2015
Germany Hannover 1,230 1,266 1,287 1,296 1,297 1,297 0.58 0.32 0.13 0.03 - 1.8 1.7 Germany Karlsruhe 912 954 980 990 992 992 0.90 0.53 0.21 0.04 - 1.4 1.3 Germany Munich 2,134 2,237 2,295 2,318 2,323 2,323 0.94 0.51 0.20 0.04 - 3.2 3.1 Germany Nuremberg 1,106 1,160 1,193 1,206 1,209 1,209 0.96 0.56 0.22 0.04 - 1.7 1.6 Germany Rhein-Main3 3,456 3,605 3,688 3,721 3,728 3,728 0.85 0.45 0.18 0.04 - 5.1 5.0 Germany Rhein-Neckar4 1,503 1,570 1,609 1,625 1,628 1,628 0.87 0.49 0.19 0.04 - 2.2 2.2 Germany Rhein-Ruhr Middle5 2,699 3,030 3,238 3,325 3,342 3,342 2.31 1.33 0.53 0.11 - 4.5 4.5 Germany Rhein-Ruhr North6 6,353 6,482 6,542 6,566 6,571 6,571 0.40 0.18 0.07 0.01 - 9.1 8.8 Germany Rhein-Ruhr South7 2,854 2,984 3,055 3,084 3,090 3,090 0.88 0.47 0.19 0.04 - 4.2 4.2 Germany Saarland8 878 888 893 896 896 896 0.22 0.13 0.06 0.01 - 1.2 1.2 Germany Stuttgart 2,484 2,608 2,677 2,705 2,710 2,710 0.97 0.52 0.21 0.04 - 3.7 3.7 Greece Athens 3,070 3,122 3,179 3,238 3,290 3,330 0.34 0.37 0.37 0.32 0.24 48.5 46.6 Greece Thessaloniki 746 771 797 824 849 870 0.66 0.67 0.67 0.60 0.49 12.2 12.2 Hungary Budapest 2,005 1,893 1,787 1,670 1,670 1,670 (1.15) (1.15) (1.36) - - 27.9 25.6 Ireland Dublin 916 946 989 1,033 1,082 1,137 0.65 0.87 0.88 0.92 0.99 43.8 40.6 Italy Genoa 943 893 847 803 801 799 (1.09) (1.06) (1.06) (0.05) (0.06) 2.2 2.1 Italy Milan 4,603 4,367 4,183 4,007 3,997 3,985 (1.05) (0.86) (0.86) (0.05) (0.06) 10.8 10.4 Italy Naples 3,210 3,087 2,995 2,905 2,898 2,889 (0.78) (0.61) (0.61) (0.05) (0.06) 7.7 7.5 Italy Rome 2,965 2,864 2,743 2,628 2,621 2,614 (0.69) (0.86) (0.86) (0.05) (0.06) 7.1 6.8 Italy Turin 1,394 1,315 1,247 1,182 1,179 1,176 (1.18) (1.07) (1.06) (0.05) (0.06) 3.2 3.1 Latvia Riga 892 833 761 719 688 669 (1.37) (1.82) (1.13) (0.87) (0.58) 48.0 48.9 Netherlands Amsterdam 1,053 1,102 1,127 1,157 1,191 1,225 0.90 0.46 0.53 0.57 0.57 11.0 10.2 Netherlands Rotterdam 1,047 1,078 1,094 1,112 1,136 1,164 0.57 0.29 0.34 0.42 0.48 10.7 9.7 Norway Oslo 684 729 774 808 839 866 1.28 1.19 0.86 0.77 0.61 22.8 21.2 Poland Crakow 806 815 818 822 826 828 0.20 0.10 0.10 0.08 0.06 3.4 3.4 Poland Gdansk 857 858 854 851 851 851 0.02 (0.08) (0.08) - 0.01 3.6 3.5 Poland Katowice 3,357 3,233 3,069 2,914 2,914 2,914 (0.75) (1.04) (1.04) - - 12.9 11.9 Poland Lodz 1,030 1,006 974 943 943 944 (0.47) (0.64) (0.64) - 0.00 4.1 3.9 Poland Warsaw 2,165 2,183 2,194 2,204 2,212 2,217 0.17 0.09 0.09 0.07 0.04 9.2 9.1 Portugal Lisbon 1,830 1,908 1,942 1,977 2,016 2,057 0.83 0.35 0.35 0.39 0.39 36.6 33.7 Portugal Porto 1,101 1,206 1,254 1,303 1,352 1,395 1.84 0.77 0.77 0.74 0.63 23.6 22.8 Romania Bucharest 2,040 2,054 2,009 1,764 1,764 1,764 0.14 (0.44) (2.60) - 0.00 16.4 14.4 Russian Federation Chelyabinsk 1,130 1,109 1,088 1,067 1,023 988 (0.38) (0.38) (0.38) (0.85) (0.70) 1.0 1.0 Russian Federation Ekaterinburg 1,350 1,326 1,303 1,281 1,227 1,185 (0.35) (0.35) (0.35) (0.85) (0.70) 1.2 1.2 Russian Federation Kazan 1,094 1,099 1,103 1,108 1,086 1,064 0.08 0.08 0.08 (0.39) (0.42) 1.0 1.1 Russian Federation Krasnoyarsk 910 911 911 912 892 872 0.02 0.02 0.02 (0.45) (0.45) 0.9 0.9 Russian Federation Moscow 9,053 9,563 10,103 10,672 10,898 10,934 1.10 1.10 1.10 0.42 0.07 9.5 11.0 Russian Federation Nizhni Novgorod 1,420 1,375 1,331 1,288 1,235 1,192 (0.65) (0.65) (0.65) (0.85) (0.70) 1.2 1.2 Russian Federation Novosibirsk 1,430 1,428 1,426 1,425 1,365 1,319 (0.03) (0.03) (0.03) (0.85) (0.70) 1.3 1.3 Russian Federation Omsk 1,144 1,140 1,136 1,132 1,085 1,047 (0.07) (0.07) (0.07) (0.85) (0.70) 1.1 1.1 Russian Federation Perm 1,076 1,044 1,014 984 943 911 (0.59) (0.59) (0.59) (0.85) (0.70) 0.9 0.9 Russian Federation Rostov-on-Don 1,022 1,041 1,061 1,081 1,073 1,058 0.38 0.38 0.38 (0.16) (0.28) 1.0 1.1 Russian Federation Saint Petersburg 5,019 5,116 5,214 5,315 5,274 5,202 0.38 0.38 0.38 (0.15) (0.28) 4.9 5.2 Russian Federation Samara 1,244 1,208 1,173 1,140 1,092 1,055 (0.58) (0.58) (0.58) (0.85) (0.70) 1.1 1.1 Russian Federation Saratov 901 890 878 868 831 803 (0.25) (0.25) (0.25) (0.85) (0.70) 0.8 0.8 Russian Federation Ufa 1,078 1,063 1,049 1,035 992 958 (0.27) (0.27) (0.27) (0.85) (0.70) 1.0 1.0 Russian Federation Volgograd 999 1,005 1,010 1,016 997 977 0.11 0.11 0.11 (0.37) (0.41) 0.9 1.0 Russian Federation Voronezh 880 867 854 842 807 779 (0.30) (0.30) (0.30) (0.85) (0.70) 0.8 0.8 Serbia and Montenegro Belgrade 1,127 1,126 1,121 1,116 1,103 1,101 (0.02) (0.09) (0.09) (0.22) (0.05) 20.6 19.0 Spain Barcelona 4,201 4,332 4,378 4,424 4,452 4,468 0.62 0.21 0.21 0.12 0.07 14.1 13.9 Spain Madrid 4,805 4,929 5,036 5,145 5,223 5,269 0.51 0.43 0.43 0.30 0.18 16.2 16.4 Sweden Göteborg 729 758 792 829 846 856 0.77 0.89 0.89 0.42 0.22 10.7 11.3 Sweden Stockholm 1,487 1,557 1,641 1,729 1,777 1,803 0.92 1.05 1.04 0.54 0.30 22.2 23.8 Switzerland Zürich 834 926 955 984 997 1,003 2.10 0.61 0.61 0.26 0.12 19.7 20.8 Ukraine Dnepropetrovsk 1,162 1,119 1,077 1,036 1,004 979 (0.77) (0.77) (0.77) (0.64) (0.49) 3.2 3.2 Ukraine Donetsk 1,097 1,061 1,026 992 961 937 (0.67) (0.67) (0.67) (0.64) (0.49) 3.1 3.1 Ukraine Kharkov 1,586 1,534 1,484 1,436 1,391 1,357 (0.66) (0.66) (0.66) (0.64) (0.49) 4.4 4.4 Ukraine Kiev 2,574 2,590 2,606 2,623 2,612 2,591 0.13 0.13 0.13 (0.08) (0.16) 7.8 8.5 Ukraine Odessa 1,092 1,064 1,037 1,010 978 955 (0.52) (0.52) (0.52) (0.64) (0.49) 3.1 3.1 Ukraine Zaporozhye 873 847 822 798 773 754 (0.60) (0.60) (0.60) (0.64) (0.49) 2.5 2.5 United Kingdom Birmingham 2,301 2,272 2,243 2,215 2,215 2,215 (0.25) (0.25) (0.25) – 0.01 4.3 4.0 United Kingdom Leeds 1,449 1,433 1,417 1,402 1,402 1,404 (0.22) (0.22) (0.22) 0.01 0.04 2.7 2.5 United Kingdom Liverpool 831 876 924 975 1,018 1,047 1.06 1.06 1.06 0.87 0.57 1.8 1.9 United Kingdom London 7,654 7,641 7,628 7,615 7,615 7,615 (0.03) (0.03) (0.03) - - 14.6 13.8 United Kingdom Manchester 2,282 2,252 2,223 2,193 2,193 2,194 (0.26) (0.26) (0.26) - 0.01 4.3 4.0 United Kingdom Tyneside (Newcastle) 877 933 993 1,056 1,111 1,147 1.24 1.24 1.24 1.00 0.65 1.9 2.1 LATIN AMERICAArgentina Buenos Aires 11,180 11,861 12,583 13,349 14,017 14,563 1.18 1.18 1.18 0.98 0.76 37.9 36.4 Argentina Córdoba 1,188 1,310 1,444 1,592 1,729 1,844 1.95 1.95 1.95 1.65 1.29 4.4 4.6 Argentina Mendoza 758 851 955 1,072 1,182 1,273 2.31 2.31 2.31 1.95 1.49 2.9 3.2 Argentina Rosario 1,084 1,155 1,231 1,312 1,387 1,457 1.27 1.27 1.27 1.12 0.98 3.7 3.6 Argentina San Miguel de Tucumán 611 679 754 837 916 983 2.10 2.10 2.10 1.79 1.41 2.3 2.5 Bolivia La Paz 1,062 1,267 1,394 1,533 1,668 1,817 3.53 1.91 1.91 1.68 1.71 27.1 24.3 Bolivia Santa Cruz 616 833 1,061 1,352 1,653 1,932 6.04 4.84 4.84 4.03 3.12 20.6 25.8 Brazil Baixada Santista (Santos) 1,184 1,319 1,468 1,634 1,775 1,890 2.15 2.14 2.14 1.65 1.26 1.1 1.1 Brazil Belém 1,214 1,459 1,749 2,097 2,416 2,663 3.68 3.63 3.63 2.83 1.95 1.3 1.5 Brazil Belo Horizonte 3,548 4,093 4,659 5,304 5,855 6,275 2.86 2.59 2.59 1.98 1.39 3.3 3.5 Brazil Brasília 1,863 2,257 2,746 3,341 3,891 4,312 3.84 3.92 3.92 3.05 2.05 2.0 2.4
216 Statistical annex

Brazil Campinas 1,693 1,954 2,264 2,640 2,974 3,233 2.86 2.94 3.07 2.38 1.67 1.6 1.8 Brazil Curitiba 1,829 2,156 2,494 2,871 3,200 3,456 3.28 2.92 2.81 2.17 1.54 1.8 1.9 Brazil Fortaleza 2,226 2,542 2,875 3,261 3,591 3,849 2.66 2.46 2.52 1.93 1.39 2.1 2.2 Brazil Goiânia 1,132 1,369 1,609 1,878 2,119 2,308 3.80 3.22 3.10 2.41 1.71 1.2 1.3 Brazil Grande São Luís 672 778 876 982 1,074 1,150 2.93 2.36 2.30 1.79 1.37 0.6 0.6 Brazil Grande Vitória 1,052 1,221 1,398 1,602 1,781 1,923 2.97 2.72 2.72 2.11 1.54 1.0 1.1 Brazil João Pessoa 652 737 827 931 1,022 1,096 2.44 2.31 2.37 1.85 1.41 0.6 0.6 Brazil Maceió 660 798 952 1,137 1,307 1,441 3.77 3.55 3.54 2.78 1.96 0.7 0.8 Brazil Manaus 955 1,159 1,392 1,673 1,932 2,134 3.87 3.68 3.67 2.88 1.99 1.0 1.2 Brazil Natal 692 793 909 1,049 1,172 1,272 2.72 2.74 2.85 2.23 1.63 0.7 0.7 Brazil Norte/Nordeste
Catarinense 603 709 815 936 1,044 1,131 3.22 2.78 2.78 2.18 1.61 0.6 0.6 Brazil Pôrto Alegre 2,934 3,236 3,505 3,795 4,027 4,220 1.96 1.59 1.59 1.19 0.93 2.5 2.4 Brazil Recife 2,690 2,958 3,230 3,527 3,768 3,965 1.90 1.76 1.76 1.32 1.02 2.3 2.2 Brazil Rio de Janeiro 9,595 10,174 10,803 11,469 11,961 12,364 1.17 1.20 1.20 0.84 0.66 7.7 6.9 Brazil Salvador 2,331 2,644 2,968 3,331 3,638 3,880 2.53 2.31 2.31 1.76 1.29 2.1 2.2 Brazil São Paulo 14,776 15,948 17,099 18,333 19,256 19,963 1.53 1.39 1.39 0.98 0.72 12.3 11.2 Brazil Teresina 614 699 789 895 989 1,065 2.58 2.42 2.54 1.98 1.49 0.6 0.6 Chile Santiago 4,571 4,931 5,266 5,623 5,979 6,297 1.52 1.31 1.31 1.23 1.03 40.2 38.7 Colombia Barranquilla 1,244 1,396 1,683 1,918 2,125 2,305 2.29 3.74 2.62 2.05 1.62 5.3 5.4 Colombia Bucaramanga 648 776 937 1,069 1,187 1,292 3.61 3.75 2.64 2.10 1.69 3.0 3.0 Colombia Cali 1,591 1,818 2,233 2,583 2,884 3,134 2.67 4.11 2.91 2.21 1.66 7.1 7.4 Colombia Cartagena 576 667 845 1,002 1,140 1,252 2.96 4.72 3.42 2.57 1.88 2.7 3.0 Colombia Cucuta 520 637 772 883 983 1,072 4.07 3.82 2.70 2.15 1.73 2.4 2.5 Colombia Medellín 2,147 2,403 2,866 3,236 3,561 3,842 2.25 3.53 2.43 1.91 1.52 9.1 9.1 Colombia Santa Fé de Bogotá 4,970 5,716 6,771 7,594 8,301 8,900 2.80 3.39 2.30 1.78 1.39 21.5 21.0 Costa Rica San José 737 867 998 1,145 1,299 1,441 3.25 2.80 2.75 2.51 2.09 43.1 42.9 Cuba Havana 2,108 2,183 2,187 2,192 2,197 2,200 0.69 0.04 0.05 0.05 0.03 26.0 24.4 Dominica Santo Domingo 1,522 1,653 1,781 1,920 2,049 2,185 1.65 1.50 1.50 1.30 1.28 36.6 33.4 Ecuador Guayaquil 1,572 1,808 2,077 2,387 2,679 2,953 2.80 2.78 2.78 2.31 1.95 27.7 28.8 Ecuador Quito 1,088 1,217 1,357 1,514 1,660 1,806 2.25 2.18 2.18 1.84 1.70 18.1 17.6 El Salvador San Salvador 970 1,140 1,339 1,472 1,596 1,718 3.24 3.21 1.90 1.61 1.47 36.9 35.4 Guatemala Guatemala City 803 839 908 982 1,077 1,204 0.89 1.57 1.57 1.85 2.23 17.6 14.3 Haiti Port-au-Prince 1,134 1,427 1,767 2,090 2,427 2,765 4.60 4.27 3.36 2.99 2.60 62.0 62.7 Honduras Tegucigalpa 710 812 928 1,061 1,199 1,349 2.68 2.68 2.68 2.45 2.35 32.4 30.0 Mexico Ciudad Juárez 809 997 1,239 1,469 1,659 1,800 4.19 4.34 3.40 2.44 1.63 1.7 1.9 Mexico Culiacán 606 690 750 799 849 901 2.60 1.67 1.28 1.20 1.19 1.0 1.0 Mexico Guadalajara 3,011 3,431 3,697 3,905 4,105 4,309 2.61 1.50 1.09 1.00 0.97 5.0 4.6 Mexico León 961 1,127 1,293 1,438 1,564 1,671 3.19 2.75 2.13 1.68 1.33 1.7 1.8 Mexico Mérida 664 765 849 919 985 1,048 2.83 2.07 1.60 1.39 1.25 1.1 1.1 Mexico Mexicali 607 690 771 840 904 964 2.57 2.22 1.72 1.46 1.29 1.0 1.0 Mexico Mexico City 15,311 16,790 18,066 19,013 19,854 20,647 1.84 1.47 1.02 0.87 0.78 24.4 21.9 Mexico Monterrey 2,594 2,961 3,267 3,517 3,741 3,947 2.65 1.97 1.47 1.23 1.07 4.4 4.2 Mexico Puebla 1,699 1,932 1,888 1,880 1,911 1,987 2.57 (0.46) (0.09) 0.34 0.77 2.6 2.1 Mexico Querétaro 561 671 798 913 1,011 1,090 3.58 3.45 2.70 2.05 1.51 1.1 1.2 Mexico San Luis Potosí 665 774 857 927 993 1,057 3.04 2.05 1.58 1.37 1.24 1.2 1.1 Mexico Tijuana 760 1,017 1,297 1,570 1,796 1,957 5.82 4.86 3.82 2.69 1.72 1.8 2.1 Mexico Toluca 835 981 1,455 1,987 2,442 2,735 3.22 7.89 6.23 4.12 2.27 2.0 2.9 Mexico Torreón 882 954 1,012 1,057 1,108 1,169 1.55 1.18 0.88 0.95 1.06 1.4 1.2 Nicaragua Managua 735 870 1,009 1,159 1,323 1,497 3.37 2.98 2.77 2.65 2.47 35.4 33.9 Panama Panama City 845 875 905 950 1,019 1,109 0.68 0.68 0.97 1.40 1.69 54.6 47.4 Paraguay Asunción 928 1,140 1,457 1,750 2,002 2,290 4.12 4.92 3.66 2.70 2.68 48.2 46.5 Peru Lima 5,825 6,667 7,454 8,180 8,822 9,365 2.70 2.23 1.86 1.51 1.20 39.5 37.5 Puerto Rico San Juan 1,539 1,855 2,237 2,357 2,386 2,398 3.74 3.74 1.04 0.25 0.10 62.0 59.9 Uruguay Montevideo 1,274 1,299 1,324 1,353 1,384 1,413 0.38 0.38 0.43 0.46 0.41 43.1 40.6 Venezuela Barquisimeto 742 828 923 1,009 1,094 1,178 2.18 2.18 1.78 1.61 1.48 4.4 4.2 Venezuela Caracas 2,867 3,007 3,153 3,276 3,432 3,628 0.95 0.95 0.77 0.93 1.11 14.9 12.9 Venezuela Maracaibo 1,351 1,603 1,901 2,182 2,429 2,634 3.41 3.42 2.75 2.15 1.62 9.0 9.4 Venezuela Maracay 766 881 1,015 1,138 1,252 1,355 2.82 2.82 2.29 1.91 1.58 4.8 4.8 Venezuela Valencia 1,129 1,462 1,893 2,330 2,705 2,982 5.17 5.17 4.15 2.99 1.95 9.0 10.6 NORTHERN AMERICACanada Calgary 738 809 927 1,074 1,211 1,319 1.84 2.72 2.93 2.41 1.70 3.8 4.6 Canada Edmonton 831 859 924 1,005 1,078 1,139 0.67 1.47 1.67 1.40 1.11 3.8 4.0 Canada Montréal 3,154 3,305 3,409 3,511 3,600 3,691 0.94 0.62 0.59 0.50 0.50 14.0 12.9 Canada Ottawa 918 988 1,052 1,120 1,182 1,236 1.48 1.25 1.26 1.07 0.90 4.3 4.3 Canada Toronto 3,807 4,197 4,607 5,060 5,458 5,762 1.95 1.86 1.87 1.52 1.08 18.9 20.1 Canada Vancouver 1,559 1,789 1,959 2,125 2,273 2,393 2.75 1.81 1.63 1.34 1.03 8.0 8.3 United States Atlanta 2,184 2,781 3,542 4,284 4,883 5,260 4.84 4.84 3.80 2.62 1.48 1.6 1.9 United States Austin 569 720 913 1,101 1,258 1,365 4.73 4.73 3.76 2.67 1.62 0.4 0.5 United States Baltimore 1,849 1,962 2,083 2,178 2,281 2,382 1.19 1.19 0.90 0.92 0.87 0.9 0.9 United States Boston 3,428 3,726 4,049 4,313 4,555 4,760 1.66 1.66 1.26 1.09 0.88 1.8 1.7 United States Bridgeport-Stamford 714 799 894 977 1,052 1,115 2.25 2.25 1.77 1.49 1.16 0.4 0.4 United States Buffalo 955 966 977 985 1,011 1,051 0.23 0.23 0.16 0.52 0.78 0.4 0.4 United States Charlotte 461 596 769 942 1,086 1,183 5.10 5.10 4.06 2.86 1.71 0.3 0.4 United States Chicago 7,374 7,839 8,333 8,711 9,080 9,411 1.22 1.22 0.89 0.83 0.72 3.7 3.4 United States Cincinnati 1,335 1,419 1,508 1,580 1,657 1,734 1.22 1.22 0.93 0.95 0.91 0.7 0.6 United States Cleveland 1,680 1,734 1,789 1,831 1,892 1,968 0.63 0.63 0.46 0.66 0.78 0.8 0.7 United States Columbus, Ohio 950 1,040 1,138 1,222 1,301 1,372 1.81 1.81 1.42 1.26 1.06 0.5 0.5 United States Dallas-Fort Worth 3,219 3,665 4,172 4,612 4,981 5,249 2.59 2.59 2.00 1.54 1.05 1.9 1.9 United States Denver-Aurora 1,528 1,747 1,998 2,219 2,408 2,550 2.68 2.68 2.10 1.63 1.15 0.9 0.9 United States Detroit 3,703 3,804 3,909 3,980 4,094 4,234 0.54 0.54 0.36 0.56 0.68 1.7 1.5 United States Hartford 783 818 853 882 919 962 0.86 0.86 0.66 0.82 0.91 0.4 0.3 United States Houston 2,922 3,353 3,849 4,283 4,644 4,904 2.76 2.76 2.14 1.62 1.09 1.7 1.8 United States Indianapolis 921 1,063 1,228 1,375 1,501 1,597 2.87 2.87 2.26 1.76 1.24 0.5 0.6 United States Jacksonville, Florida 742 811 886 950 1,012 1,068 1.78 1.78 1.40 1.26 1.08 0.4 0.4 United States Kansas City 1,233 1,297 1,365 1,419 1,482 1,549 1.02 1.02 0.78 0.87 0.89 0.6 0.6 United States Las Vegas 708 973 1,335 1,717 2,036 2,237 6.34 6.34 5.03 3.41 1.88 0.6 0.8 United States Los Angeles-Long Beach
Santa Ana 10,883 11,339 11,814 12,146 12,522 12,904 0.82 0.82 0.55 0.61 0.60 5.2 4.7 United States Louisville 757 810 866 913 963 1,012 1.34 1.34 1.05 1.06 1.00 0.4 0.4
217Data tables
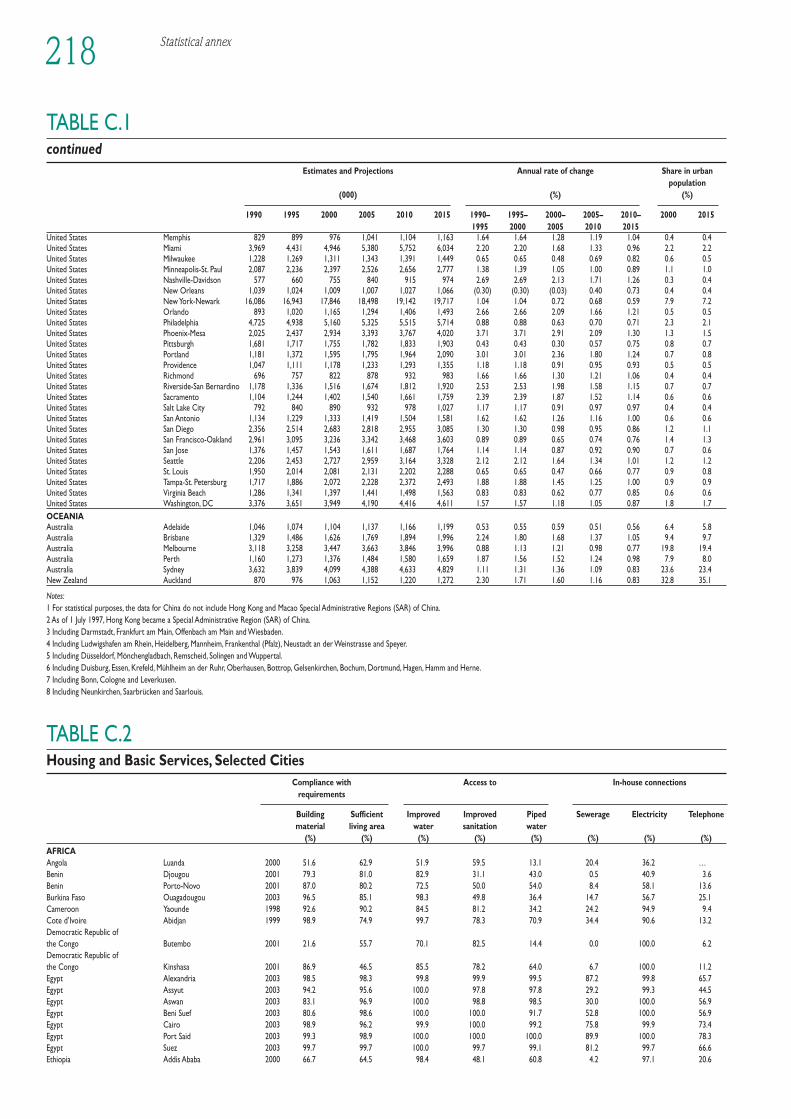
TABLE C.1continued
Estimates and Projections Annual rate of change Share in urban population
(000) (%) (%)
1990 1995 2000 2005 2010 2015 1990– 1995– 2000– 2005– 2010– 2000 20151995 2000 2005 2010 2015
United States Memphis 829 899 976 1,041 1,104 1,163 1.64 1.64 1.28 1.19 1.04 0.4 0.4 United States Miami 3,969 4,431 4,946 5,380 5,752 6,034 2.20 2.20 1.68 1.33 0.96 2.2 2.2 United States Milwaukee 1,228 1,269 1,311 1,343 1,391 1,449 0.65 0.65 0.48 0.69 0.82 0.6 0.5 United States Minneapolis-St. Paul 2,087 2,236 2,397 2,526 2,656 2,777 1.38 1.39 1.05 1.00 0.89 1.1 1.0 United States Nashville-Davidson 577 660 755 840 915 974 2.69 2.69 2.13 1.71 1.26 0.3 0.4 United States New Orleans 1,039 1,024 1,009 1,007 1,027 1,066 (0.30) (0.30) (0.03) 0.40 0.73 0.4 0.4 United States New York-Newark 16,086 16,943 17,846 18,498 19,142 19,717 1.04 1.04 0.72 0.68 0.59 7.9 7.2 United States Orlando 893 1,020 1,165 1,294 1,406 1,493 2.66 2.66 2.09 1.66 1.21 0.5 0.5 United States Philadelphia 4,725 4,938 5,160 5,325 5,515 5,714 0.88 0.88 0.63 0.70 0.71 2.3 2.1 United States Phoenix-Mesa 2,025 2,437 2,934 3,393 3,767 4,020 3.71 3.71 2.91 2.09 1.30 1.3 1.5 United States Pittsburgh 1,681 1,717 1,755 1,782 1,833 1,903 0.43 0.43 0.30 0.57 0.75 0.8 0.7 United States Portland 1,181 1,372 1,595 1,795 1,964 2,090 3.01 3.01 2.36 1.80 1.24 0.7 0.8 United States Providence 1,047 1,111 1,178 1,233 1,293 1,355 1.18 1.18 0.91 0.95 0.93 0.5 0.5 United States Richmond 696 757 822 878 932 983 1.66 1.66 1.30 1.21 1.06 0.4 0.4 United States Riverside-San Bernardino 1,178 1,336 1,516 1,674 1,812 1,920 2.53 2.53 1.98 1.58 1.15 0.7 0.7 United States Sacramento 1,104 1,244 1,402 1,540 1,661 1,759 2.39 2.39 1.87 1.52 1.14 0.6 0.6 United States Salt Lake City 792 840 890 932 978 1,027 1.17 1.17 0.91 0.97 0.97 0.4 0.4 United States San Antonio 1,134 1,229 1,333 1,419 1,504 1,581 1.62 1.62 1.26 1.16 1.00 0.6 0.6 United States San Diego 2,356 2,514 2,683 2,818 2,955 3,085 1.30 1.30 0.98 0.95 0.86 1.2 1.1 United States San Francisco-Oakland 2,961 3,095 3,236 3,342 3,468 3,603 0.89 0.89 0.65 0.74 0.76 1.4 1.3 United States San Jose 1,376 1,457 1,543 1,611 1,687 1,764 1.14 1.14 0.87 0.92 0.90 0.7 0.6 United States Seattle 2,206 2,453 2,727 2,959 3,164 3,328 2.12 2.12 1.64 1.34 1.01 1.2 1.2 United States St. Louis 1,950 2,014 2,081 2,131 2,202 2,288 0.65 0.65 0.47 0.66 0.77 0.9 0.8 United States Tampa-St. Petersburg 1,717 1,886 2,072 2,228 2,372 2,493 1.88 1.88 1.45 1.25 1.00 0.9 0.9 United States Virginia Beach 1,286 1,341 1,397 1,441 1,498 1,563 0.83 0.83 0.62 0.77 0.85 0.6 0.6 United States Washington, DC 3,376 3,651 3,949 4,190 4,416 4,611 1.57 1.57 1.18 1.05 0.87 1.8 1.7 OCEANIAAustralia Adelaide 1,046 1,074 1,104 1,137 1,166 1,199 0.53 0.55 0.59 0.51 0.56 6.4 5.8 Australia Brisbane 1,329 1,486 1,626 1,769 1,894 1,996 2.24 1.80 1.68 1.37 1.05 9.4 9.7 Australia Melbourne 3,118 3,258 3,447 3,663 3,846 3,996 0.88 1.13 1.21 0.98 0.77 19.8 19.4 Australia Perth 1,160 1,273 1,376 1,484 1,580 1,659 1.87 1.56 1.52 1.24 0.98 7.9 8.0 Australia Sydney 3,632 3,839 4,099 4,388 4,633 4,829 1.11 1.31 1.36 1.09 0.83 23.6 23.4 New Zealand Auckland 870 976 1,063 1,152 1,220 1,272 2.30 1.71 1.60 1.16 0.83 32.8 35.1
Notes:1 For statistical purposes, the data for China do not include Hong Kong and Macao Special Administrative Regions (SAR) of China.2 As of 1 July 1997, Hong Kong became a Special Administrative Region (SAR) of China.3 Including Darmstadt, Frankfurt am Main, Offenbach am Main and Wiesbaden.4 Including Ludwigshafen am Rhein, Heidelberg, Mannheim, Frankenthal (Pfalz), Neustadt an der Weinstrasse and Speyer.5 Including Düsseldorf, Mönchengladbach, Remscheid, Solingen and Wuppertal.6 Including Duisburg, Essen, Krefeld, Mühlheim an der Ruhr, Oberhausen, Bottrop, Gelsenkirchen, Bochum, Dortmund, Hagen, Hamm and Herne.7 Including Bonn, Cologne and Leverkusen.8 Including Neunkirchen, Saarbrücken and Saarlouis.
TABLE C.2Housing and Basic Services, Selected Cities
Compliance with Access to In-house connectionsrequirements
Building Sufficient Improved Improved Piped Sewerage Electricity Telephonematerial living area water sanitation water
(%) (%) (%) (%) (%) (%) (%) (%)AFRICAAngola Luanda 2000 51.6 62.9 51.9 59.5 13.1 20.4 36.2 …Benin Djougou 2001 79.3 81.0 82.9 31.1 43.0 0.5 40.9 3.6Benin Porto-Novo 2001 87.0 80.2 72.5 50.0 54.0 8.4 58.1 13.6Burkina Faso Ouagadougou 2003 96.5 85.1 98.3 49.8 36.4 14.7 56.7 25.1Cameroon Yaounde 1998 92.6 90.2 84.5 81.2 34.2 24.2 94.9 9.4Cote d’Ivoire Abidjan 1999 98.9 74.9 99.7 78.3 70.9 34.4 90.6 13.2Democratic Republic of the Congo Butembo 2001 21.6 55.7 70.1 82.5 14.4 0.0 100.0 6.2Democratic Republic of the Congo Kinshasa 2001 86.9 46.5 85.5 78.2 64.0 6.7 100.0 11.2Egypt Alexandria 2003 98.5 98.3 99.8 99.9 99.5 87.2 99.8 65.7Egypt Assyut 2003 94.2 95.6 100.0 97.8 97.8 29.2 99.3 44.5Egypt Aswan 2003 83.1 96.9 100.0 98.8 98.5 30.0 100.0 56.9Egypt Beni Suef 2003 80.6 98.6 100.0 100.0 91.7 52.8 100.0 56.9Egypt Cairo 2003 98.9 96.2 99.9 100.0 99.2 75.8 99.9 73.4Egypt Port Said 2003 99.3 98.9 100.0 100.0 100.0 89.9 100.0 78.3Egypt Suez 2003 99.7 99.7 100.0 99.7 99.1 81.2 99.7 66.6Ethiopia Addis Ababa 2000 66.7 64.5 98.4 48.1 60.8 4.2 97.1 20.6
218 Statistical annex

Ethiopia Nazret 2000 22.7 61.2 85.7 34.9 16.0 0.3 79.7 5.3Gambia Banjul 2000 … … 100.0 96.0 45.4 30.5 … …Ghana Accra 2003 98.8 80.5 97.1 81.5 51.6 41.5 84.3 31.9Guinea Conakry 1999 98.7 72.4 93.7 42.5 39.2 11.2 71.4 7.2Lesotho Maseru 2000 85.4 90.2 90.3 45.2 42.0 5.5 18.1 …Mali Bamako 2001 74.1 77.1 89.4 43.6 39.9 22.0 55.8 15.7Morocco Casablanca 1995 99.6 74.7 99.8 91.1 81.9 78.6 87.0 44.7Morocco Fes 1995 98.1 73.1 98.9 98.1 89.6 86.5 93.4 34.9Morocco Marrakech 1995 98.1 73.1 98.9 98.1 89.6 86.5 93.4 34.9Morocco Meknès 1995 98.4 68.3 95.4 95.4 86.8 88.2 92.7 26.0Morocco Rabat 1995 99.6 74.7 99.8 91.1 81.9 78.6 87.0 44.7Morocco Tangier 1995 98.4 68.3 95.4 95.4 86.8 88.2 92.7 26.0Mozambique Maputo 1997 83.2 81.7 96.7 46.3 65.4 22.1 39.2 6.9Nigeria Akure 2003 100.0 75.1 84.5 51.1 13.8 10.8 95.5 8.3Nigeria Ibadan 2003 96.9 69.9 62.6 67.3 3.0 38.0 98.9 14.8Nigeria Lagos 2003 99.8 61.2 88.5 74.8 9.0 49.2 99.8 31.8Nigeria Ogbomosho 2003 94.4 84.9 73.0 37.5 2.8 19.7 94.4 7.7Nigeria Zaria 2003 98.7 68.3 100.0 57.9 58.6 15.8 100.0 12.4Rwanda Kigali 2000 71.6 86.7 81.8 72.1 33.4 4.5 44.4 8.6Senegal Dakar 1997 99.8 70.1 94.7 70.6 77.8 27.2 80.2 …South Africa Cape Town 1999 97.2 85.7 98.8 94.7 95.7 93.8 92.0 45.2South Africa Durban 1999 78.5 85.1 72.3 42.2 44.8 37.9 58.5 24.5South Africa Johannesburg 1999 99.0 90.9 98.3 90.5 87.1 87.5 84.9 47.7South Africa Port Elizabeth 1999 57.8 79.9 61.4 35.8 36.9 28.4 38.2 17.6South Africa Pretoria 1999 99.0 90.9 98.3 90.5 87.1 87.5 84.9 47.7South Africa West Rand 1999 98.4 81.9 98.4 83.4 84.5 78.8 78.2 41.5Sudan Juba 2000 19.6 58.7 90.7 15.0 10.9 0.0 30.0 …Sudan Kassala 2000 8.4 43.4 75.0 23.0 47.4 0.0 39.4 …Sudan Khartoum 2000 25.9 54.9 96.0 18.0 63.6 1.0 54.2 …Sudan Nyala 2000 16.0 57.3 69.9 14.5 25.7 0.0 26.5 …Sudan Port Sudan 2000 28.7 54.9 96.2 32.9 30.9 0.0 35.1 …Sudan Wad Medani 2000 19.2 63.6 89.7 17.0 81.0 0.0 73.1 …Sudan Waw 2000 16.1 59.7 69.1 16.3 0.0 0.0 6.3 …Uganda Kampala 2001 86.3 62.7 93.1 60.7 14.6 11.9 55.2 20.3United Republic of Tanzania Arusha 1999 51.5 78.3 97.8 51.1 23.7 0.0 32.6 100.0United Republic of Tanzania Dar es Salaam 1999 86.5 84.5 85.9 52.0 78.8 3.2 46.9 100.0Zambia Chingola 2002 92.6 79.7 89.1 92.0 74.3 84.8 75.7 3.0Zambia Ndola 2002 83.5 76.2 88.0 83.4 66.1 71.2 52.8 16.8Zimbabwe Harare 1999 96.4 85.0 98.7 97.1 92.1 90.9 81.9 20.9ASIAArmenia Yerevan 2000 98.9 99.4 93.6 99.2 93.0 99.1 81.6Azerbaijan Baku 2000 99.4 88.2 91.6 85.3 81.6 64.8 96.0Bangladesh Dhaka 1999 71.0 60.2 99.5 90.4 52.0 60.1 88.2 0.0Bangladesh Rajshahi 1999 42.9 55.5 99.1 73.8 3.9 38.9 57.8 0.0Cambodia Phnom Penh 2000 96.9 … 81.2 95.4 76.4 81.1 97.6 39.9Cambodia Siem Reab 2000 100.0 … 57.9 45.8 29.0 55.7 16.8China Anqing 2000 … 92.3 … … 21.7 10.5 … …China Beijing 2000 … 92.3 … … 97.7 47.6 … …China Changzhi 2000 … 92.4 … … 49.3 12.6 … …China Chifeng 2000 … 92.2 … … 33.4 10.3 … …China Dandong 2000 … 92.2 … … 51.3 25.6 … …China Datong 2000 … 92.3 … … 63.3 22.7 … …China Dezhou 2000 … 92.4 … … 20.6 7.2 … …China Guangzhou 2000 … 92.2 … … 86.3 45.5 … …China Harbin 2000 … 92.2 … … 65.9 31.7 … …China Hegang 2000 … 92.2 … … 71.3 18.5 … …China Huaibei 2000 … 92.5 … … 30.7 12.7 … …China Lanzhou 2000 … 92.4 … … 69.1 44.3 … …China Leshan 2000 … 92.3 … … 31.5 13.0 … …China Shanghai 2000 … 92.3 … … 99.3 66.2 … …China Shaoguan 2000 … 92.3 … … 52.4 10.8 … …China Xuzhou 2000 … 92.3 … … 34.6 12.4 … …China Yiyang 2000 … 92.3 … … 23.8 9.8 … …China Yongzhou 2000 … 92.3 … … 20.4 6.7 … …China Yueyang 2000 … 92.3 … … 30.5 16.5 … …China Yulin 2000 … 92.3 … … 17.3 9.6 … …China Zhengzhou 2000 … 92.3 … … 66.8 32.6 … …India Agartala 1999 … 72.0 97.0 83.0 32.7 65.6 81.5 18.9India Akola 1999 … 65.8 93.1 72.0 73.2 46.2 95.5 19.6India Amritsar 1999 … 71.1 100.0 97.2 85.1 87.2 100.0 39.0India Coimbatore 1999 … 78.6 97.0 90.1 36.0 50.3 89.6 19.1India Delhi 1999 … 73.3 99.2 95.4 80.8 77.9 97.6 45.4India Gadag-Betigeri 1999 … 74.9 95.4 73.9 46.2 44.9 89.6 17.6India Hisar 1999 … 69.5 99.7 78.5 71.6 74.5 97.7 35.7India Hyderabad 1999 … 78.9 100.0 90.6 87.5 51.5 96.1 29.7India Jaipur 1999 … 78.5 100.0 93.0 83.7 66.6 98.0 28.5India Jalna 1999 … 94.8 99.6 95.4 25.1 44.6 90.4 25.9India Jodhpur 1999 … 77.9 98.6 91.3 81.9 75.2 97.3 19.6India Kanpur 1999 … 64.8 100.0 84.8 48.2 31.8 93.9 18.9India Karnal 1999 … 82.9 99.8 87.4 72.9 62.1 95.5 34.0India Kharagpur 1999 … 68.2 96.7 92.8 40.4 68.8 82.6 15.0India Kochi (Cochin) 1999 … 93.5 96.1 98.0 27.5 27.5 87.3 35.3
219Data tables

TABLE C.2continued
Compliance with Access to In-house connectionsrequirements
Building Sufficient Improved Improved Piped Sewerage Electricity Telephonematerial living area water sanitation water
(%) (%) (%) (%) (%) (%) (%) (%)India Kolkota 1999 … 73.0 98.6 94.8 35.1 43.5 93.8 25.6India Krishnanagar 1999 … 73.3 96.7 79.0 51.6 47.6 91.3 20.1India Mumbai 1999 … 59.0 99.7 97.9 76.7 36.9 99.0 31.6India Pune (Poona) 1999 … 68.9 98.4 76.8 55.2 27.1 92.3 9.0India Rajahmundry 1999 … 80.2 96.4 56.9 35.9 39.5 87.0 13.0India Srinagar 1999 … 77.1 98.1 86.0 87.9 66.7 99.3 20.3India Vijayawada 1999 … 80.5 97.8 75.5 39.2 49.3 96.8 13.2India Yamunanagar 1999 … 74.2 100.0 83.0 59.7 67.2 98.3 27.0Indonesia Bandung 2002 99.1 … 98.6 90.5 42.9 51.2 99.4 …Indonesia Bitung 2002 95.1 … 98.9 88.5 52.4 63.7 96.3 …Indonesia Bogor 2002 98.0 … 99.2 83.6 11.9 48.1 98.6 …Indonesia Denpasar 2002 100.0 … 100.0 100.0 53.6 92.1 100.0 …Indonesia Dumai 2002 99.1 … 97.7 86.1 17.2 38.6 85.8 …Indonesia Jakarta 2002 99.5 … 100.0 96.7 35.6 59.5 99.9 …Indonesia Jambi 2002 99.4 … 100.0 99.4 53.0 80.9 98.7 …Indonesia Jaya Pura 2002 96.3 … 94.1 88.4 61.1 59.2 88.0 …Indonesia Kediri 2002 88.6 … 100.0 61.6 17.9 38.1 98.6 …Indonesia Medan 2002 99.6 … 100.0 98.8 68.0 81.4 92.5 …Indonesia Palembang 2002 99.6 … 100.0 98.7 81.2 79.0 100.0 …Indonesia Palu 2002 97.1 … 100.0 83.2 39.7 47.9 92.1 …Indonesia Pekan Baru 2002 100.0 … 100.0 99.1 51.8 68.1 97.9 …Indonesia Purwokerto 2002 81.7 … 95.2 71.4 21.3 51.1 95.1 …Indonesia Surabaja 2002 99.0 … 100.0 100.0 71.0 56.3 100.0 …Indonesia Surakarta 2002 93.4 … 100.0 100.0 48.6 63.9 98.7 …Indonesia Ujung Pandang 2002 98.0 … 100.0 98.6 36.3 79.7 98.4 …Iraq Amara 2000 … 88.8 93.1 88.8 88.3 75.0 … …Iraq Baghdad 2000 … 93.3 99.4 98.1 97.2 96.7 … …Iraq Mosul 2000 … 87.8 99.8 98.0 99.6 95.1 … …Kazakhstan Chimkent 1999 37.4 … 82.2 80.2 76.9 60.9 99.6 44.8Kazakhstan Dzhezkazgan 1999 43.0 … 100.0 99.8 100.0 99.5 100.0 69.3Mongolia Ulaanbaatar 2000 98.4 44.1 97.0 75.3 49.4 49.1 99.0 …Myanmar Yangon 2000 93.0 44.8 95.3 81.4 36.8 31.3 … …Pakistan Faisalabad 1991 98.6 39.5 98.1 87.2 78.1 87.2 98.7 …Pakistan Islamabad 1991 98.9 49.1 94.1 70.3 80.3 70.3 97.8 …Pakistan Karachi 1991 99.6 42.3 96.6 90.0 77.4 90.0 96.8 …Philippines Bacolod 1998 57.9 71.3 92.7 75.0 31.1 62.2 78.7 12.8Philippines Cagayan de Oro 1998 63.2 68.4 86.8 97.4 28.9 78.9 86.8 7.9Philippines Cebu 1998 62.7 76.0 88.0 88.4 42.1 52.4 85.6 21.6Philippines Metro Manila 1998 84.7 73.2 91.0 97.0 65.9 72.5 98.7 45.7Syrian Arab Republic Damascus 2000 … … 99.7 99.1 … … … …Tajikistan Dushanbe 2000 94.2 90.4 99.7 89.1 93.3 69.6 99.0 …Turkey Adana 1998 99.0 88.7 100.0 98.0 100.0 83.3 … 71.6Turkey Aksaray 1998 50.0 76.2 97.6 70.2 40.5 21.4 … 69.0Turkey Ankara 1998 96.3 97.4 97.4 99.5 96.1 99.0 … 90.3Turkey Antakya 1998 74.0 94.8 92.7 90.6 87.0 19.3 … 83.3Turkey Bursa 1998 89.5 96.3 92.0 99.1 91.4 88.3 … 82.7Turkey Gaziantep 1998 100.0 64.7 96.8 90.4 94.9 89.1 … 73.1Turkey Istanbul 1998 94.9 95.1 90.0 99.3 55.8 98.7 … 79.9Turkey Izmir 1998 85.6 95.2 100.0 100.0 95.8 98.1 … 84.0Uzbekistan Tashkent 1996 99.7 97.1 100.0 90.7 98.7 79.4 … 64.5Viet Nam Da Nang 2002 100.0 70.9 99.0 100.0 88.8 98.5 100.0 80.0Viet Nam Ha Noi 2002 98.5 80.0 100.0 97.9 74.1 88.3 100.0 72.9Viet Nam Hai Phong 2002 97.8 92.0 100.0 95.5 95.5 88.0 100.0 39.0Viet Nam Ho Chi Minh City 2002 99.4 75.1 98.7 98.1 88.8 94.7 99.8 74.5Yemen Aden 1997 87.6 56.7 97.0 93.6 93.3 83.1 95.6 …Yemen Sana’a 1997 91.0 65.9 93.9 77.9 78.7 24.8 98.8 …Yemen Taiz 1997 91.5 58.0 85.6 77.1 84.0 39.9 95.2 …LATIN AMERICABrazil Belo Horizonte 1996 97.6 91.2 94.1 98.6 84.4 78.9 100.0 …Brazil Brasilia 1996 99.6 88.7 94.2 86.4 89.8 69.0 99.6 …Brazil Curitiba 1996 96.8 96.1 97.3 95.9 84.2 55.4 100.0 …Brazil Fortaleza 1996 95.3 90.5 88.6 80.2 76.8 19.8 97.2 …Brazil Goiânia 1996 99.1 92.0 97.8 89.2 93.4 73.8 98.3 …Brazil Rio de Janeiro 1996 99.6 89.7 97.1 98.0 88.5 63.3 99.6 …Brazil Sao Paolo 1996 99.6 83.3 99.2 99.4 93.8 79.9 99.6 …Brazil Vitoria 1996 97.1 87.9 96.2 95.4 90.4 82.1 99.2 …Colombia Bogotá 2000 95.5 90.8 100.0 100.0 100.0 100.0 99.8 100.0Colombia Medellín 2000 99.9 93.8 100.0 99.7 100.0 99.5 99.9 100.0Colombia Neiva 2000 96.9 91.2 100.0 99.5 100.0 95.4 98.7 100.0Colombia Valledupar 2000 99.6 82.0 99.6 99.8 99.6 98.7 99.6 100.0Guatemala Guatemala City 2000 80.0 71.6 97.4 73.0 52.7 65.3 91.0 31.9
Source: UN-Habitat, Urban Indicators Programme III: Preliminary results, 2005.
220 Statistical annex
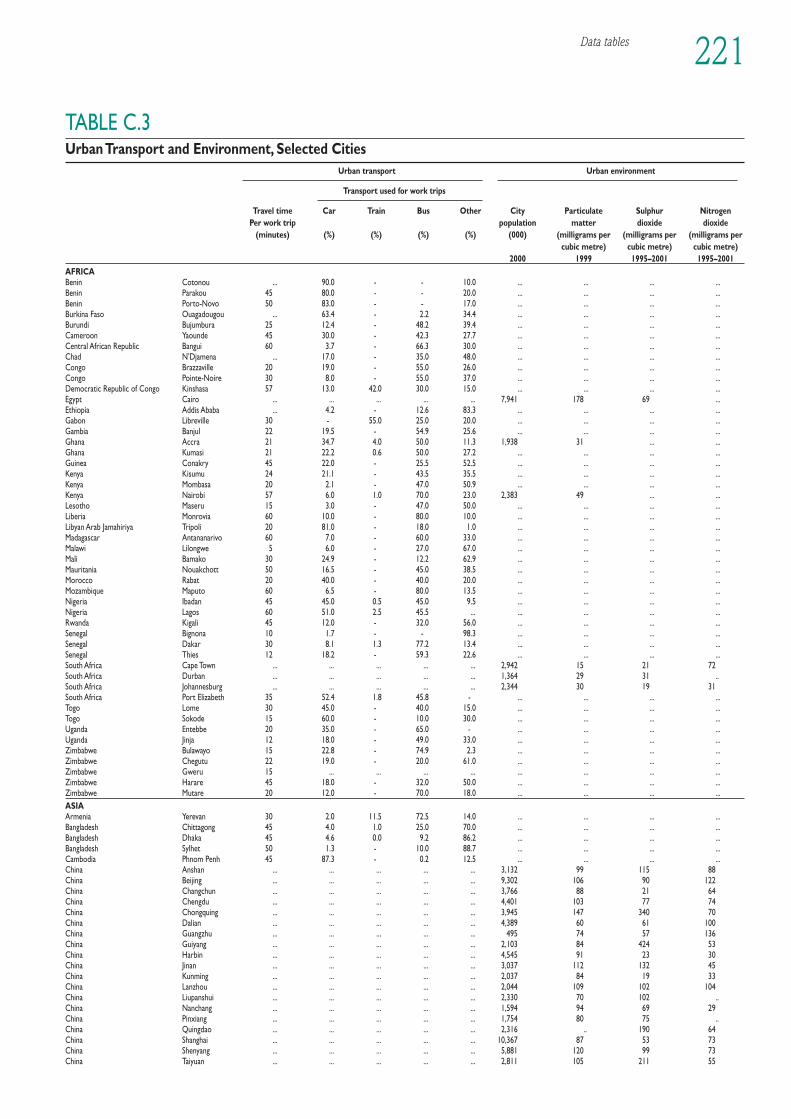
TABLE C.3Urban Transport and Environment, Selected Cities
Urban transport Urban environment
Transport used for work trips
Travel time Car Train Bus Other City Particulate Sulphur Nitrogen Per work trip population matter dioxide dioxide
(minutes) (%) (%) (%) (%) (000) (milligrams per (milligrams per (milligrams per cubic metre) cubic metre) cubic metre)
2000 1999 1995–2001 1995–2001AFRICABenin Cotonou ... 90.0 - - 10.0 ... ... ... ...Benin Parakou 45 80.0 - - 20.0 ... ... ... ...Benin Porto-Novo 50 83.0 - - 17.0 ... ... ... ...Burkina Faso Ouagadougou ... 63.4 - 2.2 34.4 ... ... ... ...Burundi Bujumbura 25 12.4 - 48.2 39.4 ... ... ... ...Cameroon Yaounde 45 30.0 - 42.3 27.7 ... ... ... ...Central African Republic Bangui 60 3.7 - 66.3 30.0 ... ... ... ...Chad N’Djamena ... 17.0 - 35.0 48.0 ... ... ... ...Congo Brazzaville 20 19.0 - 55.0 26.0 ... ... ... ...Congo Pointe-Noire 30 8.0 - 55.0 37.0 ... ... ... ...Democratic Republic of Congo Kinshasa 57 13.0 42.0 30.0 15.0 ... ... ... ...Egypt Cairo ... ... ... ... ... 7,941 178 69 ...Ethiopia Addis Ababa ... 4.2 - 12.6 83.3 ... ... ... ...Gabon Libreville 30 - 55.0 25.0 20.0 ... ... ... ...Gambia Banjul 22 19.5 - 54.9 25.6 ... ... ... ...Ghana Accra 21 34.7 4.0 50.0 11.3 1,938 31 ... ...Ghana Kumasi 21 22.2 0.6 50.0 27.2 ... ... ... ...Guinea Conakry 45 22.0 - 25.5 52.5 ... ... ... ...Kenya Kisumu 24 21.1 - 43.5 35.5 ... ... ... ...Kenya Mombasa 20 2.1 - 47.0 50.9 ... ... ... ...Kenya Nairobi 57 6.0 1.0 70.0 23.0 2,383 49 ... ...Lesotho Maseru 15 3.0 - 47.0 50.0 ... ... ... ...Liberia Monrovia 60 10.0 - 80.0 10.0 ... ... ... ...Libyan Arab Jamahiriya Tripoli 20 81.0 - 18.0 1.0 ... ... ... ...Madagascar Antananarivo 60 7.0 - 60.0 33.0 ... ... ... ...Malawi Lilongwe 5 6.0 - 27.0 67.0 ... ... ... ...Mali Bamako 30 24.9 - 12.2 62.9 ... ... ... ...Mauritania Nouakchott 50 16.5 - 45.0 38.5 ... ... ... ...Morocco Rabat 20 40.0 - 40.0 20.0 ... ... ... ...Mozambique Maputo 60 6.5 - 80.0 13.5 ... ... ... ...Nigeria Ibadan 45 45.0 0.5 45.0 9.5 ... ... ... ...Nigeria Lagos 60 51.0 2.5 45.5 ... ... ... ... ...Rwanda Kigali 45 12.0 - 32.0 56.0 ... ... ... ...Senegal Bignona 10 1.7 - - 98.3 ... ... ... ...Senegal Dakar 30 8.1 1.3 77.2 13.4 ... ... ... ...Senegal Thies 12 18.2 - 59.3 22.6 ... ... ... ...South Africa Cape Town ... ... ... ... ... 2,942 15 21 72South Africa Durban ... ... ... ... ... 1,364 29 31 ..South Africa Johannesburg ... ... ... ... ... 2,344 30 19 31South Africa Port Elizabeth 35 52.4 1.8 45.8 - ... ... ... ...Togo Lome 30 45.0 - 40.0 15.0 ... ... ... ...Togo Sokode 15 60.0 - 10.0 30.0 ... ... ... ...Uganda Entebbe 20 35.0 - 65.0 - ... ... ... ...Uganda Jinja 12 18.0 - 49.0 33.0 ... ... ... ...Zimbabwe Bulawayo 15 22.8 - 74.9 2.3 ... ... ... ...Zimbabwe Chegutu 22 19.0 - 20.0 61.0 ... ... ... ...Zimbabwe Gweru 15 ... ... ... ... ... ... ... ...Zimbabwe Harare 45 18.0 - 32.0 50.0 ... ... ... ...Zimbabwe Mutare 20 12.0 - 70.0 18.0 ... ... ... ...ASIAArmenia Yerevan 30 2.0 11.5 72.5 14.0 ... ... ... ...Bangladesh Chittagong 45 4.0 1.0 25.0 70.0 ... ... ... ...Bangladesh Dhaka 45 4.6 0.0 9.2 86.2 ... ... ... ...Bangladesh Sylhet 50 1.3 - 10.0 88.7 ... ... ... ...Cambodia Phnom Penh 45 87.3 - 0.2 12.5 ... ... ... ...China Anshan ... ... ... ... ... 3,132 99 115 88China Beijing ... ... ... ... ... 9,302 106 90 122China Changchun ... ... ... ... ... 3,766 88 21 64China Chengdu ... ... ... ... ... 4,401 103 77 74China Chongquing ... ... ... ... ... 3,945 147 340 70China Dalian ... ... ... ... ... 4,389 60 61 100China Guangzhu ... ... ... ... ... 495 74 57 136China Guiyang ... ... ... ... ... 2,103 84 424 53China Harbin ... ... ... ... ... 4,545 91 23 30China Jinan ... ... ... ... ... 3,037 112 132 45China Kunming ... ... ... ... ... 2,037 84 19 33China Lanzhou ... ... ... ... ... 2,044 109 102 104China Liupanshui ... ... ... ... ... 2,330 70 102 ..China Nanchang ... ... ... ... ... 1,594 94 69 29China Pinxiang ... ... ... ... ... 1,754 80 75 ..China Quingdao ... ... ... ... ... 2,316 .. 190 64China Shanghai ... ... ... ... ... 10,367 87 53 73China Shenyang ... ... ... ... ... 5,881 120 99 73China Taiyuan ... ... ... ... ... 2,811 105 211 55
221Data tables
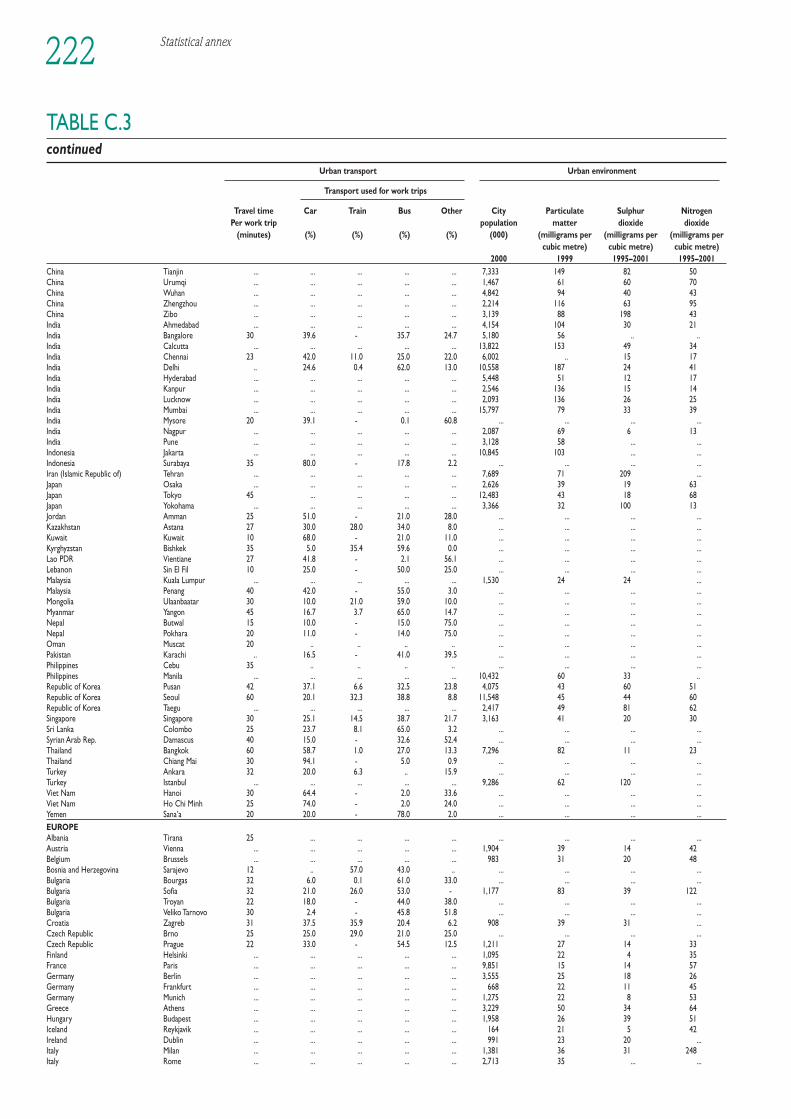
TABLE C.3continued
Urban transport Urban environment
Transport used for work trips
Travel time Car Train Bus Other City Particulate Sulphur Nitrogen Per work trip population matter dioxide dioxide
(minutes) (%) (%) (%) (%) (000) (milligrams per (milligrams per (milligrams per cubic metre) cubic metre) cubic metre)
2000 1999 1995–2001 1995–2001China Tianjin ... ... ... ... ... 7,333 149 82 50China Urumqi ... ... ... ... ... 1,467 61 60 70China Wuhan ... ... ... ... ... 4,842 94 40 43China Zhengzhou ... ... ... ... ... 2,214 116 63 95China Zibo ... ... ... ... ... 3,139 88 198 43India Ahmedabad ... ... ... ... ... 4,154 104 30 21India Bangalore 30 39.6 - 35.7 24.7 5,180 56 .. ..India Calcutta ... ... ... ... ... 13,822 153 49 34India Chennai 23 42.0 11.0 25.0 22.0 6,002 .. 15 17India Delhi .. 24.6 0.4 62.0 13.0 10,558 187 24 41India Hyderabad ... ... ... ... ... 5,448 51 12 17India Kanpur ... ... ... ... ... 2,546 136 15 14India Lucknow ... ... ... ... ... 2,093 136 26 25India Mumbai ... ... ... ... ... 15,797 79 33 39India Mysore 20 39.1 - 0.1 60.8 ... ... ... ...India Nagpur ... ... ... ... ... 2,087 69 6 13India Pune ... ... ... ... ... 3,128 58 ... ...Indonesia Jakarta ... ... ... ... ... 10,845 103 ... ...Indonesia Surabaya 35 80.0 - 17.8 2.2 ... ... ... ...Iran (Islamic Republic of) Tehran ... ... ... ... ... 7,689 71 209 ...Japan Osaka ... ... ... ... ... 2,626 39 19 63Japan Tokyo 45 ... ... ... ... 12,483 43 18 68Japan Yokohama ... ... ... ... ... 3,366 32 100 13Jordan Amman 25 51.0 - 21.0 28.0 ... ... ... ...Kazakhstan Astana 27 30.0 28.0 34.0 8.0 ... ... ... ...Kuwait Kuwait 10 68.0 - 21.0 11.0 ... ... ... ...Kyrghyzstan Bishkek 35 5.0 35.4 59.6 0.0 ... ... ... ...Lao PDR Vientiane 27 41.8 - 2.1 56.1 ... ... ... ...Lebanon Sin El Fil 10 25.0 - 50.0 25.0 ... ... ... ...Malaysia Kuala Lumpur ... ... ... ... ... 1,530 24 24 ...Malaysia Penang 40 42.0 - 55.0 3.0 ... ... ... ...Mongolia Ulaanbaatar 30 10.0 21.0 59.0 10.0 ... ... ... ...Myanmar Yangon 45 16.7 3.7 65.0 14.7 ... ... ... ...Nepal Butwal 15 10.0 - 15.0 75.0 ... ... ... ...Nepal Pokhara 20 11.0 - 14.0 75.0 ... ... ... ...Oman Muscat 20 .. .. .. .. ... ... ... ...Pakistan Karachi .. 16.5 - 41.0 39.5 ... ... ... ...Philippines Cebu 35 .. .. .. .. ... ... ... ...Philippines Manila ... ... ... ... ... 10,432 60 33 ..Republic of Korea Pusan 42 37.1 6.6 32.5 23.8 4,075 43 60 51Republic of Korea Seoul 60 20.1 32.3 38.8 8.8 11,548 45 44 60Republic of Korea Taegu ... ... ... ... ... 2,417 49 81 62Singapore Singapore 30 25.1 14.5 38.7 21.7 3,163 41 20 30Sri Lanka Colombo 25 23.7 8.1 65.0 3.2 ... ... ... ...Syrian Arab Rep. Damascus 40 15.0 - 32.6 52.4 ... ... ... ...Thailand Bangkok 60 58.7 1.0 27.0 13.3 7,296 82 11 23Thailand Chiang Mai 30 94.1 - 5.0 0.9 ... ... ... ...Turkey Ankara 32 20.0 6.3 .. 15.9 ... ... ... ...Turkey Istanbul ... ... ... ... ... 9,286 62 120 ...Viet Nam Hanoi 30 64.4 - 2.0 33.6 ... ... ... ...Viet Nam Ho Chi Minh 25 74.0 - 2.0 24.0 ... ... ... ...Yemen Sana’a 20 20.0 - 78.0 2.0 ... ... ... ...EUROPEAlbania Tirana 25 ... ... ... ... ... ... ... ...Austria Vienna ... ... ... ... ... 1,904 39 14 42Belgium Brussels ... ... ... ... ... 983 31 20 48Bosnia and Herzegovina Sarajevo 12 .. 57.0 43.0 .. ... ... ... ...Bulgaria Bourgas 32 6.0 0.1 61.0 33.0 ... ... ... ...Bulgaria Sofia 32 21.0 26.0 53.0 - 1,177 83 39 122Bulgaria Troyan 22 18.0 - 44.0 38.0 ... ... ... ...Bulgaria Veliko Tarnovo 30 2.4 - 45.8 51.8 ... ... ... ...Croatia Zagreb 31 37.5 35.9 20.4 6.2 908 39 31 ...Czech Republic Brno 25 25.0 29.0 21.0 25.0 ... ... ... ...Czech Republic Prague 22 33.0 - 54.5 12.5 1,211 27 14 33Finland Helsinki ... ... ... ... ... 1,095 22 4 35France Paris ... ... ... ... ... 9,851 15 14 57Germany Berlin ... ... ... ... ... 3,555 25 18 26Germany Frankfurt ... ... ... ... ... 668 22 11 45Germany Munich ... ... ... ... ... 1,275 22 8 53Greece Athens ... ... ... ... ... 3,229 50 34 64Hungary Budapest ... ... ... ... ... 1,958 26 39 51Iceland Reykjavik ... ... ... ... ... 164 21 5 42Ireland Dublin ... ... ... ... ... 991 23 20 ...Italy Milan ... ... ... ... ... 1,381 36 31 248Italy Rome ... ... ... ... ... 2,713 35 ... ...
222 Statistical annex

Italy Torino ... ... ... ... ... 969 53 ... ...Lithuania Vilnius 37 22.3 29.1 23.2 25.5 ... ... ... ...Netherlands Amsterdam ... ... ... ... ... 1,131 37 10 58Norway Oslo ... ... ... ... ... 805 23 8 43Poland Bydgoszcz 18 42.5 10.5 24.0 .. ... ... ... ...Poland Gdansk 20 43.0 32.9 23.4 0.7 ... ... ... ...Poland Katowice 36 46.2 9.4 19.9 24.6 ... ... ... ...Poland Lodz ... ... ... ... ... 873 45 21 43Poland Poznan 25 33.0 30.0 21.0 16.0 ... ... ... ...Poland Warsaw ... ... ... ... ... 1,716 49 16 32Portugal Lisbon ... ... ... ... ... 3,318 30 8 52Republi of Moldova Chisinau 23 15.0 - 80.0 5.0 ... ... ... ...Romania Bucharest ... ... ... ... ... 2,070 25 10 71Russian Federation Astrakhan 35 16.0 31.0 35.0 18.0 ... ... ... ...Russian Federation Kostroma 20 5.0 19.5 48.0 27.5 ... ... ... ...Russian Federation Moscow 62 15.0 63.7 21.0 0.3 8,811 27 109 ...Russian Federation Nizhny Novgorod 35 17.0 37.3 41.7 4.0 ... ... ... ...Russian Federation Novomoscowsk 25 5.0 22.5 38.9 33.6 ... ... ... ...Russian Federation Omsk 43 9.5 16.5 69.0 5.0 1,206 28 20 34Russian Federation Pushkin 15 6.0 - 60.2 33.8 ... ... ... ...Russian Federation Surgut 57 1.5 - 81.0 17.5 ... ... ... ...Russian Federation Veliky Novgorod 30 9.5 - 75.0 15.5 ... ... ... ...Serbia and Montenegro Belgrade 40 12.5 18.8 53.0 ... ... ... ... ...Slovakia Bratislava ... ... ... ... ... 456 22 21 27Slovenia Ljubljana 30 43.0 0.1 20.0 36.9 ... ... ... ...Spain Barcelona 1,645 43 11 43Spain Madrid 32 60.0 - 16.0 24.0 3,068 37 24 66Sweden Stockholm 28 35.1 34.5 13.8 16.6 916 15 3 20Sweden Umea 16 ... ... ... ... ... ... ... ...Switzerland Zurich ... ... ... ... ... 980 24 11 39Ukraine Kiev ... ... ... ... ... 2,622 45 14 51United Kingdom Birmingham 20 73.9 1.4 9.1 15.6 2,344 17 9 45United Kingdom Cardiff 20 81.0 0.3 5.7 13.0 ... ... ... ...United Kingdom Edinburgh 20 69.9 2.4 13.0 14.7 ... ... ... ...United Kingdom London 24 ... ... ... ... 7,812 23 25 77United Kingdom Manchester 19 71.8 1.9 8.1 18.0 2,325 19 26 49LATIN AMERICA AND CARIBBEANArgentina Buenos Aires 42 33.5 16.4 42.2 ... ... ... ... ...Argentina Comodoro Rivadavia 29 44.0 - 36.0 20.0 ... ... ... ...Argentina Córdoba 32 26.5 2.9 40.9 ... 1,370 52 ... 97Brazil Icapui 30 6.0 ... 1.0 93.0 ... ... ... ...Brazil Maranguape 20 5.0 - 30.0 .. ... ... ... ...Brazil Recife 35 28.6 1.8 44.2 25.4 ... ... ... ...Brazil Rio de Janeiro ... ... ... ... ... 5,902 40 129 ...Brazil São Paulo 40 42.0 6.0 37.0 15.0 9,984 46 43 83Chile Gran Concepcion 35 19.6 - 56.5 23.9 ... ... ... ...Chile Santiago de Chile 38 14.1 4.0 55.8 26.2 4,522 73 29 81Chile Valparaiso .. 42.0 19.0 36.0 3.0 ... ... ... ...Colombia Armenia 60 31.0 - 41.9 27.2 ... ... ... ...Colombia Bogotá ... ... ... ... ... 5,442 33 ... ...Colombia Marinilla 15 14.3 - 18.4 67.3 ... ... ... ...Colombia Medellín 35 21.9 4.8 33.1 40.2 ... ... ... ...Cuba Camaguey 60 2.5 - 2.1 95.4 ... ... ... ...Cuba Havana 6.5 1.0 57.1 35.4 2,270 28 1 5Cuba Santa Clara 48 30.3 3.2 4.1 62.4 ... ... ... ...Ecuador Cuenca 25 .. .. .. .. ... ... ... ...Ecuador Guayaquil 45 10.7 - 89.3 - 2,120 26 15 ...Ecuador Manta 30 .. .. .. .. ... ... ... ...Ecuador Puyo 15 .. .. .. .. ... ... ... ...Ecuador Quito 33 .. .. .. .. 1,598 34 22 ...El Salvador San Salvador .. 29.0 .. .. 2.0 ... ... ... ...Mexico Ciudad Juarez 23 51.3 - 23.7 25.0 ... ... ... ...Mexico Mexico City ... ... ... ... ... 18,017 69 74 130Nicaragua Leon 15 .. .. 56.0 .. ... ... ... ...Panama Colon 15 ... ... ... ... ... ... ... ...Paraguay Asuncion 25 49.8 ... .. .. ... ... ... ...Peru Cajamarca 20 22.0 ... 20.0 58.0 ... ... ... ...Peru Huanuco 20 17.5 ... 45.0 .. ... ... ... ...Peru Huaras 15 ... ... ... ... ... ... ... ...Peru Iquitos 10 35.0 - 25.0 40.0 ... ... ... ...Peru Lima ... 16.9 - 82.2 0.9 ... ... ... ...Peru Tacna 25 37.5 ... 66.0 1.0 ... ... ... ...Peru Tumbes 20 25.0 ... .. 5.0 ... ... ... ...Trinidad and Tobago Port of Spain ... 56.2 - 43.8 - ... ... ... ...Uruguay Montevideo 45 26.9 - 59.6 13.5 ... ... ... ...Venezuela Caracas ... ... ... ... ... 3,488 18 33 57NORTHERN AMERICACanada Hull ... 73.3 - 16.3 10.4 ... ... ... ...Canada Montreal ... ... ... ... ... 3,519 22 10 42Canada Toronto ... ... ... ... ... 4,535 26 17 43Canada Vancouver ... ... ... ... ... 1,880 15 14 37United States Atlanta 26 ... ... ... ... ... ... ... ...United States Birmingham-US 23 ... ... ... ... ... ... ... ...United States Boston 25 ... ... ... ... ... ... ... ...United States Chicago ... ... ... ... ... 9,024 27 14 57United States Des Moines 18 ... ... ... ... ... ... ... ...United States Hartford 21 ... ... ... ... ... ... ... ...United States Los Angeles ... ... ... ... ... 16,195 38 9 74
223Data tables
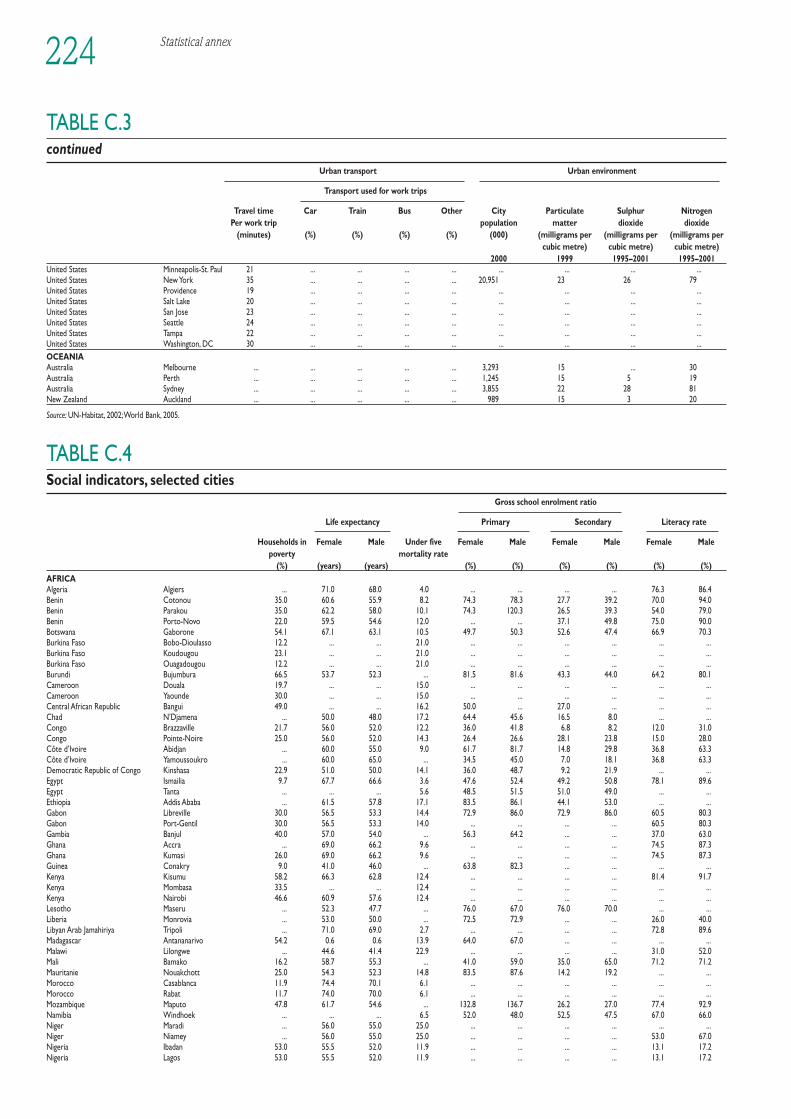
TABLE C.3continued
Urban transport Urban environment
Transport used for work trips
Travel time Car Train Bus Other City Particulate Sulphur Nitrogen Per work trip population matter dioxide dioxide
(minutes) (%) (%) (%) (%) (000) (milligrams per (milligrams per (milligrams per cubic metre) cubic metre) cubic metre)
2000 1999 1995–2001 1995–2001United States Minneapolis-St. Paul 21 ... ... ... ... ... ... ... ...United States New York 35 ... ... ... ... 20,951 23 26 79United States Providence 19 ... ... ... ... ... ... ... ...United States Salt Lake 20 ... ... ... ... ... ... ... ...United States San Jose 23 ... ... ... ... ... ... ... ...United States Seattle 24 ... ... ... ... ... ... ... ...United States Tampa 22 ... ... ... ... ... ... ... ...United States Washington, DC 30 ... ... ... ... ... ... ... ...OCEANIAAustralia Melbourne ... ... ... ... ... 3,293 15 ... 30Australia Perth ... ... ... ... ... 1,245 15 5 19Australia Sydney ... ... ... ... ... 3,855 22 28 81New Zealand Auckland ... ... ... ... ... 989 15 3 20
Source: UN-Habitat, 2002;World Bank, 2005.
TABLE C.4Social indicators, selected cities
Gross school enrolment ratio
Life expectancy Primary Secondary Literacy rate
Households in Female Male Under five Female Male Female Male Female Malepoverty mortality rate
(%) (years) (years) (%) (%) (%) (%) (%) (%)AFRICAAlgeria Algiers ... 71.0 68.0 4.0 ... ... ... ... 76.3 86.4Benin Cotonou 35.0 60.6 55.9 8.2 74.3 78.3 27.7 39.2 70.0 94.0Benin Parakou 35.0 62.2 58.0 10.1 74.3 120.3 26.5 39.3 54.0 79.0Benin Porto-Novo 22.0 59.5 54.6 12.0 ... ... 37.1 49.8 75.0 90.0Botswana Gaborone 54.1 67.1 63.1 10.5 49.7 50.3 52.6 47.4 66.9 70.3Burkina Faso Bobo-Dioulasso 12.2 ... ... 21.0 ... ... ... ... ... ...Burkina Faso Koudougou 23.1 ... ... 21.0 ... ... ... ... ... ...Burkina Faso Ouagadougou 12.2 ... ... 21.0 ... ... ... ... ... ...Burundi Bujumbura 66.5 53.7 52.3 ... 81.5 81.6 43.3 44.0 64.2 80.1Cameroon Douala 19.7 ... ... 15.0 ... ... ... ... ... ...Cameroon Yaounde 30.0 ... ... 15.0 ... ... ... ... ... ...Central African Republic Bangui 49.0 ... ... 16.2 50.0 ... 27.0 ... ... ...Chad N’Djamena ... 50.0 48.0 17.2 64.4 45.6 16.5 8.0 ... ...Congo Brazzaville 21.7 56.0 52.0 12.2 36.0 41.8 6.8 8.2 12.0 31.0Congo Pointe-Noire 25.0 56.0 52.0 14.3 26.4 26.6 28.1 23.8 15.0 28.0Côte d’Ivoire Abidjan ... 60.0 55.0 9.0 61.7 81.7 14.8 29.8 36.8 63.3Côte d’Ivoire Yamoussoukro ... 60.0 65.0 ... 34.5 45.0 7.0 18.1 36.8 63.3Democratic Republic of Congo Kinshasa 22.9 51.0 50.0 14.1 36.0 48.7 9.2 21.9 ... ...Egypt Ismailia 9.7 67.7 66.6 3.6 47.6 52.4 49.2 50.8 78.1 89.6Egypt Tanta ... ... ... 5.6 48.5 51.5 51.0 49.0 ... ...Ethiopia Addis Ababa ... 61.5 57.8 17.1 83.5 86.1 44.1 53.0 ... ...Gabon Libreville 30.0 56.5 53.3 14.4 72.9 86.0 72.9 86.0 60.5 80.3Gabon Port-Gentil 30.0 56.5 53.3 14.0 ... ... ... ... 60.5 80.3Gambia Banjul 40.0 57.0 54.0 ... 56.3 64.2 ... ... 37.0 63.0Ghana Accra ... 69.0 66.2 9.6 ... ... ... ... 74.5 87.3Ghana Kumasi 26.0 69.0 66.2 9.6 ... ... ... ... 74.5 87.3Guinea Conakry 9.0 41.0 46.0 ... 63.8 82.3 ... ... ... ...Kenya Kisumu 58.2 66.3 62.8 12.4 ... ... ... ... 81.4 91.7Kenya Mombasa 33.5 ... ... 12.4 ... ... ... ... ... ...Kenya Nairobi 46.6 60.9 57.6 12.4 ... ... ... ... ... ...Lesotho Maseru ... 52.3 47.7 ... 76.0 67.0 76.0 70.0 ... ...Liberia Monrovia ... 53.0 50.0 ... 72.5 72.9 ... ... 26.0 40.0Libyan Arab Jamahiriya Tripoli ... 71.0 69.0 2.7 ... ... ... ... 72.8 89.6Madagascar Antananarivo 54.2 0.6 0.6 13.9 64.0 67.0 ... ... ... ...Malawi Lilongwe ... 44.6 41.4 22.9 ... ... ... ... 31.0 52.0Mali Bamako 16.2 58.7 55.3 ... 41.0 59.0 35.0 65.0 71.2 71.2Mauritanie Nouakchott 25.0 54.3 52.3 14.8 83.5 87.6 14.2 19.2 ... ...Morocco Casablanca 11.9 74.4 70.1 6.1 ... ... ... ... ... ...Morocco Rabat 11.7 74.0 70.0 6.1 ... ... ... ... ... ...Mozambique Maputo 47.8 61.7 54.6 ... 132.8 136.7 26.2 27.0 77.4 92.9Namibia Windhoek ... ... ... 6.5 52.0 48.0 52.5 47.5 67.0 66.0Niger Maradi ... 56.0 55.0 25.0 ... ... ... ... ... ...Niger Niamey ... 56.0 55.0 25.0 ... ... ... ... 53.0 67.0Nigeria Ibadan 53.0 55.5 52.0 11.9 ... ... ... ... 13.1 17.2Nigeria Lagos 53.0 55.5 52.0 11.9 ... ... ... ... 13.1 17.2
224 Statistical annex
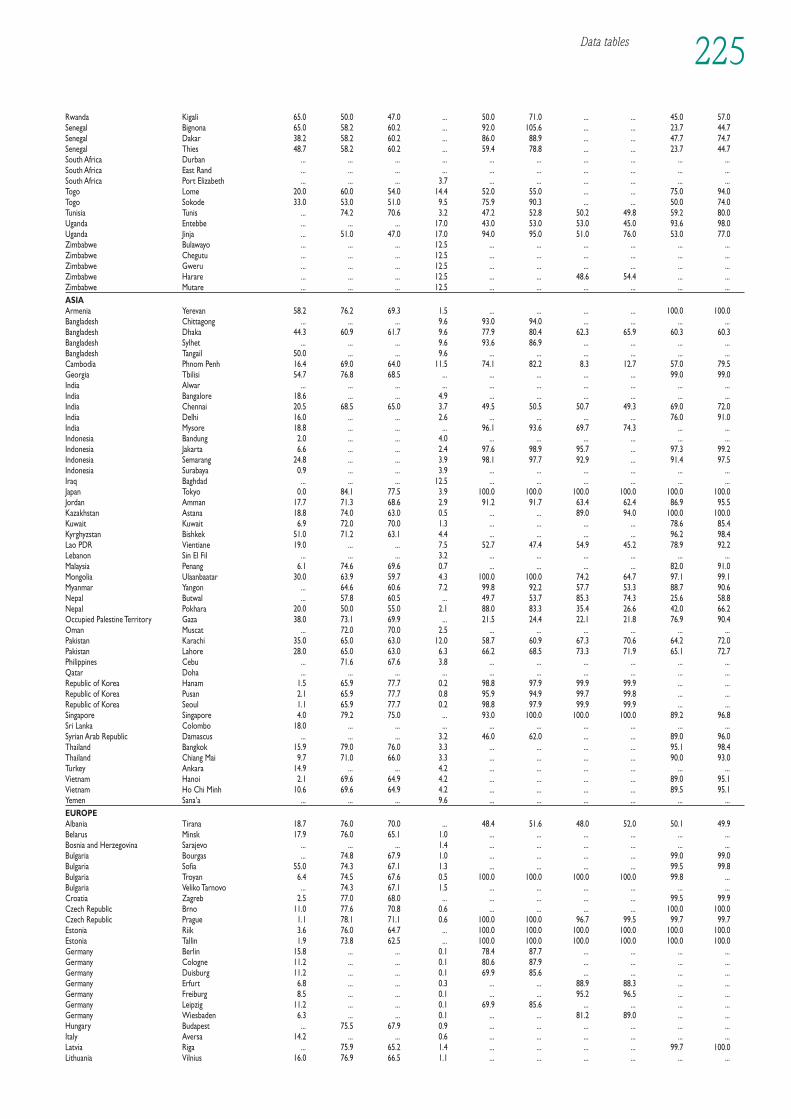
Rwanda Kigali 65.0 50.0 47.0 ... 50.0 71.0 ... ... 45.0 57.0Senegal Bignona 65.0 58.2 60.2 ... 92.0 105.6 ... ... 23.7 44.7Senegal Dakar 38.2 58.2 60.2 ... 86.0 88.9 ... ... 47.7 74.7Senegal Thies 48.7 58.2 60.2 ... 59.4 78.8 ... ... 23.7 44.7South Africa Durban ... ... ... ... ... ... ... ... ... ...South Africa East Rand ... ... ... ... ... ... ... ... ... ...South Africa Port Elizabeth ... ... ... 3.7 ... ... ... ... ... ...Togo Lome 20.0 60.0 54.0 14.4 52.0 55.0 ... ... 75.0 94.0Togo Sokode 33.0 53.0 51.0 9.5 75.9 90.3 ... ... 50.0 74.0Tunisia Tunis ... 74.2 70.6 3.2 47.2 52.8 50.2 49.8 59.2 80.0Uganda Entebbe ... ... ... 17.0 43.0 53.0 53.0 45.0 93.6 98.0Uganda Jinja ... 51.0 47.0 17.0 94.0 95.0 51.0 76.0 53.0 77.0Zimbabwe Bulawayo ... ... ... 12.5 ... ... ... ... ... ...Zimbabwe Chegutu ... ... ... 12.5 ... ... ... ... ... ...Zimbabwe Gweru ... ... ... 12.5 ... ... ... ... ... ...Zimbabwe Harare ... ... ... 12.5 ... ... 48.6 54.4 ... ...Zimbabwe Mutare ... ... ... 12.5 ... ... ... ... ... ...ASIAArmenia Yerevan 58.2 76.2 69.3 1.5 ... ... ... ... 100.0 100.0Bangladesh Chittagong ... ... ... 9.6 93.0 94.0 ... ... ... ...Bangladesh Dhaka 44.3 60.9 61.7 9.6 77.9 80.4 62.3 65.9 60.3 60.3Bangladesh Sylhet ... ... ... 9.6 93.6 86.9 ... ... ... ...Bangladesh Tangail 50.0 ... ... 9.6 ... ... ... ... ... ...Cambodia Phnom Penh 16.4 69.0 64.0 11.5 74.1 82.2 8.3 12.7 57.0 79.5Georgia Tbilisi 54.7 76.8 68.5 ... ... ... ... ... 99.0 99.0India Alwar ... ... ... ... ... ... ... ... ... ...India Bangalore 18.6 ... ... 4.9 ... ... ... ... ... ...India Chennai 20.5 68.5 65.0 3.7 49.5 50.5 50.7 49.3 69.0 72.0India Delhi 16.0 ... ... 2.6 ... ... ... ... 76.0 91.0India Mysore 18.8 ... ... ... 96.1 93.6 69.7 74.3 ... ...Indonesia Bandung 2.0 ... ... 4.0 ... ... ... ... ... ...Indonesia Jakarta 6.6 ... ... 2.4 97.6 98.9 95.7 ... 97.3 99.2Indonesia Semarang 24.8 ... ... 3.9 98.1 97.7 92.9 ... 91.4 97.5Indonesia Surabaya 0.9 ... ... 3.9 ... ... ... ... ... ...Iraq Baghdad ... ... ... 12.5 ... ... ... ... ... ...Japan Tokyo 0.0 84.1 77.5 3.9 100.0 100.0 100.0 100.0 100.0 100.0Jordan Amman 17.7 71.3 68.6 2.9 91.2 91.7 63.4 62.4 86.9 95.5Kazakhstan Astana 18.8 74.0 63.0 0.5 ... ... 89.0 94.0 100.0 100.0Kuwait Kuwait 6.9 72.0 70.0 1.3 ... ... ... ... 78.6 85.4Kyrghyzstan Bishkek 51.0 71.2 63.1 4.4 ... ... ... ... 96.2 98.4Lao PDR Vientiane 19.0 ... ... 7.5 52.7 47.4 54.9 45.2 78.9 92.2Lebanon Sin El Fil ... ... ... 3.2 ... ... ... ... ... ...Malaysia Penang 6.1 74.6 69.6 0.7 ... ... ... ... 82.0 91.0Mongolia Ulaanbaatar 30.0 63.9 59.7 4.3 100.0 100.0 74.2 64.7 97.1 99.1Myanmar Yangon ... 64.6 60.6 7.2 99.8 92.2 57.7 53.3 88.7 90.6Nepal Butwal ... 57.8 60.5 ... 49.7 53.7 85.3 74.3 25.6 58.8Nepal Pokhara 20.0 50.0 55.0 2.1 88.0 83.3 35.4 26.6 42.0 66.2Occupied Palestine Territory Gaza 38.0 73.1 69.9 ... 21.5 24.4 22.1 21.8 76.9 90.4Oman Muscat ... 72.0 70.0 2.5 ... ... ... ... ... ...Pakistan Karachi 35.0 65.0 63.0 12.0 58.7 60.9 67.3 70.6 64.2 72.0Pakistan Lahore 28.0 65.0 63.0 6.3 66.2 68.5 73.3 71.9 65.1 72.7Philippines Cebu ... 71.6 67.6 3.8 ... ... ... ... ... ...Qatar Doha ... ... ... ... ... ... ... ... ... ...Republic of Korea Hanam 1.5 65.9 77.7 0.2 98.8 97.9 99.9 99.9 ... ...Republic of Korea Pusan 2.1 65.9 77.7 0.8 95.9 94.9 99.7 99.8 ... ...Republic of Korea Seoul 1.1 65.9 77.7 0.2 98.8 97.9 99.9 99.9 ... ...Singapore Singapore 4.0 79.2 75.0 ... 93.0 100.0 100.0 100.0 89.2 96.8Sri Lanka Colombo 18.0 ... ... ... ... ... ... ... ... ...Syrian Arab Republic Damascus ... ... ... 3.2 46.0 62.0 ... ... 89.0 96.0Thailand Bangkok 15.9 79.0 76.0 3.3 ... ... ... ... 95.1 98.4Thailand Chiang Mai 9.7 71.0 66.0 3.3 ... ... ... ... 90.0 93.0Turkey Ankara 14.9 ... ... 4.2 ... ... ... ... ... ...Vietnam Hanoi 2.1 69.6 64.9 4.2 ... ... ... ... 89.0 95.1Vietnam Ho Chi Minh 10.6 69.6 64.9 4.2 ... ... ... ... 89.5 95.1Yemen Sana’a ... ... ... 9.6 ... ... ... ... ... ...EUROPEAlbania Tirana 18.7 76.0 70.0 ... 48.4 51.6 48.0 52.0 50.1 49.9Belarus Minsk 17.9 76.0 65.1 1.0 ... ... ... ... ... ...Bosnia and Herzegovina Sarajevo ... ... ... 1.4 ... ... ... ... ... ...Bulgaria Bourgas ... 74.8 67.9 1.0 ... ... ... ... 99.0 99.0Bulgaria Sofia 55.0 74.3 67.1 1.3 ... ... ... ... 99.5 99.8Bulgaria Troyan 6.4 74.5 67.6 0.5 100.0 100.0 100.0 100.0 99.8 ...Bulgaria Veliko Tarnovo ... 74.3 67.1 1.5 ... ... ... ... ... ...Croatia Zagreb 2.5 77.0 68.0 ... ... ... ... ... 99.5 99.9Czech Republic Brno 11.0 77.6 70.8 0.6 ... ... ... ... 100.0 100.0Czech Republic Prague 1.1 78.1 71.1 0.6 100.0 100.0 96.7 99.5 99.7 99.7Estonia Riik 3.6 76.0 64.7 ... 100.0 100.0 100.0 100.0 100.0 100.0Estonia Tallin 1.9 73.8 62.5 ... 100.0 100.0 100.0 100.0 100.0 100.0Germany Berlin 15.8 ... ... 0.1 78.4 87.7 ... ... ... ...Germany Cologne 11.2 ... ... 0.1 80.6 87.9 ... ... ... ...Germany Duisburg 11.2 ... ... 0.1 69.9 85.6 ... ... ... ...Germany Erfurt 6.8 ... ... 0.3 ... ... 88.9 88.3 ... ...Germany Freiburg 8.5 ... ... 0.1 ... ... 95.2 96.5 ... ...Germany Leipzig 11.2 ... ... 0.1 69.9 85.6 ... ... ... ...Germany Wiesbaden 6.3 ... ... 0.1 ... ... 81.2 89.0 ... ...Hungary Budapest ... 75.5 67.9 0.9 ... ... ... ... ... ...Italy Aversa 14.2 ... ... 0.6 ... ... ... ... ... ...Latvia Riga ... 75.9 65.2 1.4 ... ... ... ... 99.7 100.0Lithuania Vilnius 16.0 76.9 66.5 1.1 ... ... ... ... ... ...
225Data tables
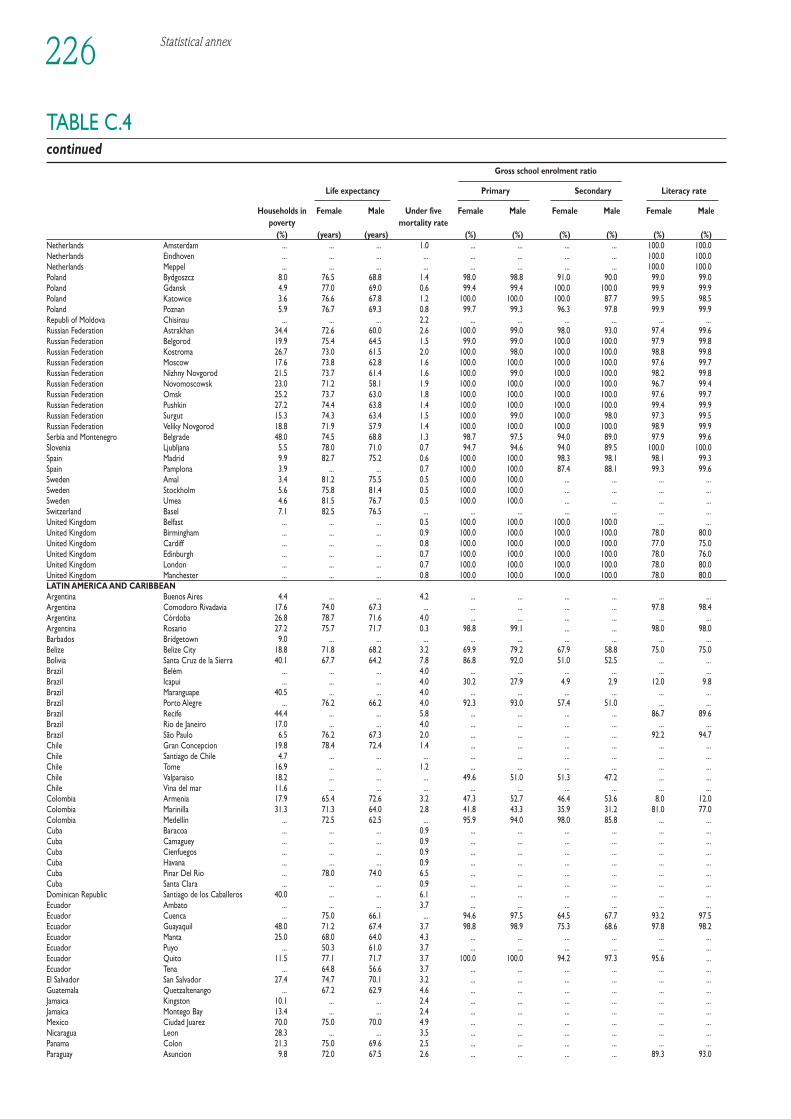
TABLE C.4continued
Gross school enrolment ratio
Life expectancy Primary Secondary Literacy rate
Households in Female Male Under five Female Male Female Male Female Malepoverty mortality rate
(%) (years) (years) (%) (%) (%) (%) (%) (%)Netherlands Amsterdam ... ... ... 1.0 ... ... ... ... 100.0 100.0Netherlands Eindhoven ... ... ... ... ... ... ... ... 100.0 100.0Netherlands Meppel ... ... ... ... ... ... ... ... 100.0 100.0Poland Bydgoszcz 8.0 76.5 68.8 1.4 98.0 98.8 91.0 90.0 99.0 99.0Poland Gdansk 4.9 77.0 69.0 0.6 99.4 99.4 100.0 100.0 99.9 99.9Poland Katowice 3.6 76.6 67.8 1.2 100.0 100.0 100.0 87.7 99.5 98.5Poland Poznan 5.9 76.7 69.3 0.8 99.7 99.3 96.3 97.8 99.9 99.9Republi of Moldova Chisinau ... ... ... 2.2 ... ... ... ... ... ...Russian Federation Astrakhan 34.4 72.6 60.0 2.6 100.0 99.0 98.0 93.0 97.4 99.6Russian Federation Belgorod 19.9 75.4 64.5 1.5 99.0 99.0 100.0 100.0 97.9 99.8Russian Federation Kostroma 26.7 73.0 61.5 2.0 100.0 98.0 100.0 100.0 98.8 99.8Russian Federation Moscow 17.6 73.8 62.8 1.6 100.0 100.0 100.0 100.0 97.6 99.7Russian Federation Nizhny Novgorod 21.5 73.7 61.4 1.6 100.0 99.0 100.0 100.0 98.2 99.8Russian Federation Novomoscowsk 23.0 71.2 58.1 1.9 100.0 100.0 100.0 100.0 96.7 99.4Russian Federation Omsk 25.2 73.7 63.0 1.8 100.0 100.0 100.0 100.0 97.6 99.7Russian Federation Pushkin 27.2 74.4 63.8 1.4 100.0 100.0 100.0 100.0 99.4 99.9Russian Federation Surgut 15.3 74.3 63.4 1.5 100.0 99.0 100.0 98.0 97.3 99.5Russian Federation Veliky Novgorod 18.8 71.9 57.9 1.4 100.0 100.0 100.0 100.0 98.9 99.9Serbia and Montenegro Belgrade 48.0 74.5 68.8 1.3 98.7 97.5 94.0 89.0 97.9 99.6Slovenia Ljubljana 5.5 78.0 71.0 0.7 94.7 94.6 94.0 89.5 100.0 100.0Spain Madrid 9.9 82.7 75.2 0.6 100.0 100.0 98.3 98.1 98.1 99.3Spain Pamplona 3.9 ... ... 0.7 100.0 100.0 87.4 88.1 99.3 99.6Sweden Amal 3.4 81.2 75.5 0.5 100.0 100.0 ... ... ... ...Sweden Stockholm 5.6 75.8 81.4 0.5 100.0 100.0 ... ... ... ...Sweden Umea 4.6 81.5 76.7 0.5 100.0 100.0 ... ... ... ...Switzerland Basel 7.1 82.5 76.5 ... ... ... ... ... ... ...United Kingdom Belfast ... ... ... 0.5 100.0 100.0 100.0 100.0 ... ...United Kingdom Birmingham ... ... ... 0.9 100.0 100.0 100.0 100.0 78.0 80.0United Kingdom Cardiff ... ... ... 0.8 100.0 100.0 100.0 100.0 77.0 75.0United Kingdom Edinburgh ... ... ... 0.7 100.0 100.0 100.0 100.0 78.0 76.0United Kingdom London ... ... ... 0.7 100.0 100.0 100.0 100.0 78.0 80.0United Kingdom Manchester ... ... ... 0.8 100.0 100.0 100.0 100.0 78.0 80.0LATIN AMERICA AND CARIBBEANArgentina Buenos Aires 4.4 ... ... 4.2 ... ... ... ... ... ...Argentina Comodoro Rivadavia 17.6 74.0 67.3 ... ... ... ... ... 97.8 98.4Argentina Córdoba 26.8 78.7 71.6 4.0 ... ... ... ... ... ...Argentina Rosario 27.2 75.7 71.7 0.3 98.8 99.1 ... ... 98.0 98.0Barbados Bridgetown 9.0 ... ... ... ... ... ... ... ... ...Belize Belize City 18.8 71.8 68.2 3.2 69.9 79.2 67.9 58.8 75.0 75.0Bolivia Santa Cruz de la Sierra 40.1 67.7 64.2 7.8 86.8 92.0 51.0 52.5 ... ...Brazil Belém ... ... ... 4.0 ... ... ... ... ... ...Brazil Icapui ... ... ... 4.0 30.2 27.9 4.9 2.9 12.0 9.8Brazil Maranguape 40.5 ... ... 4.0 ... ... ... ... ... ...Brazil Porto Alegre ... 76.2 66.2 4.0 92.3 93.0 57.4 51.0 ... ...Brazil Recife 44.4 ... ... 5.8 ... ... ... ... 86.7 89.6Brazil Rio de Janeiro 17.0 ... ... 4.0 ... ... ... ... ... ...Brazil São Paulo 6.5 76.2 67.3 2.0 ... ... ... ... 92.2 94.7Chile Gran Concepcion 19.8 78.4 72.4 1.4 ... ... ... ... ... ...Chile Santiago de Chile 4.7 ... ... ... ... ... ... ... ... ...Chile Tome 16.9 ... ... 1.2 ... ... ... ... ... ...Chile Valparaiso 18.2 ... ... ... 49.6 51.0 51.3 47.2 ... ...Chile Vina del mar 11.6 ... ... ... ... ... ... ... ... ...Colombia Armenia 17.9 65.4 72.6 3.2 47.3 52.7 46.4 53.6 8.0 12.0Colombia Marinilla 31.3 71.3 64.0 2.8 41.8 43.3 35.9 31.2 81.0 77.0Colombia Medellín ... 72.5 62.5 ... 95.9 94.0 98.0 85.8 ... ...Cuba Baracoa ... ... ... 0.9 ... ... ... ... ... ...Cuba Camaguey ... ... ... 0.9 ... ... ... ... ... ...Cuba Cienfuegos ... ... ... 0.9 ... ... ... ... ... ...Cuba Havana ... ... ... 0.9 ... ... ... ... ... ...Cuba Pinar Del Rio ... 78.0 74.0 6.5 ... ... ... ... ... ...Cuba Santa Clara ... ... ... 0.9 ... ... ... ... ... ...Dominican Republic Santiago de los Caballeros 40.0 ... ... 6.1 ... ... ... ... ... ...Ecuador Ambato ... ... ... 3.7 ... ... ... ... ... ...Ecuador Cuenca ... 75.0 66.1 ... 94.6 97.5 64.5 67.7 93.2 97.5Ecuador Guayaquil 48.0 71.2 67.4 3.7 98.8 98.9 75.3 68.6 97.8 98.2Ecuador Manta 25.0 68.0 64.0 4.3 ... ... ... ... ... ...Ecuador Puyo ... 50.3 61.0 3.7 ... ... ... ... ... ...Ecuador Quito 11.5 77.1 71.7 3.7 100.0 100.0 94.2 97.3 95.6 ...Ecuador Tena ... 64.8 56.6 3.7 ... ... ... ... ... ...El Salvador San Salvador 27.4 74.7 70.1 3.2 ... ... ... ... ... ...Guatemala Quetzaltenango ... 67.2 62.9 4.6 ... ... ... ... ... ...Jamaica Kingston 10.1 ... ... 2.4 ... ... ... ... ... ...Jamaica Montego Bay 13.4 ... ... 2.4 ... ... ... ... ... ...Mexico Ciudad Juarez 70.0 75.0 70.0 4.9 ... ... ... ... ... ...Nicaragua Leon 28.3 ... ... 3.5 ... ... ... ... ... ...Panama Colon 21.3 75.0 69.6 2.5 ... ... ... ... ... ...Paraguay Asuncion 9.8 72.0 67.5 2.6 ... ... ... ... 89.3 93.0
226 Statistical annex

Peru Cajamarca 60.0 68.0 70.0 5.0 ... ... ... ... ... ...Peru Huanuco ... ... ... 5.5 ... ... ... ... ... ...Peru Huaras ... 82.0 75.0 4.7 ... ... ... ... ... ...Peru Iquitos 46.3 67.5 62.4 5.0 39.7 36.0 37.0 41.0 41.1 48.4Peru Lima ... 80.0 74.0 4.7 ... ... ... ... ... ...Peru Tacna 14.7 70.9 65.9 ... 49.0 51.1 49.8 50.2 92.0 92.0Peru Tumbes 26.0 75.0 80.0 3.7 ... ... ... ... ... ...Trinidad and Tobago Port of Spain ... ... ... 2.8 ... ... ... ... 89.8 85.8Uruguay Montevideo 15.4 76.1 68.6 1.9 100.0 100.0 100.0 93.9 98.3 98.6NORTHERN AMERICACanada Hull ... 81.4 75.7 0.1 ... ... ... ... ... ...United States Atlanta 11.0 ... ... 0.2 ... ... ... ... ... ...United States Birmingham-US 13.2 ... ... 0.3 ... ... ... ... ... ...United States Boston 9.3 ... ... 0.1 ... ... ... ... ... ...United States Des Moines 8.2 ... ... 0.2 ... ... ... ... ... ...United States Hartford 9.3 ... ... 0.2 ... ... ... ... ... ...United States Minneapolis-St. Paul 7.7 ... ... 0.2 ... ... ... ... ... ...United States New York 20.4 ... ... 0.2 ... ... ... ... ... ...United States Providence 11.5 ... ... 0.2 ... ... ... ... ... ...United States Salt Lake 8.9 ... ... 0.2 ... ... ... ... ... ...United States San Jose 9.0 ... ... 0.1 ... ... ... ... ... ...United States Seattle 7.8 ... ... 0.1 ... ... ... ... ... ...United States Tampa 13.6 ... ... 0.2 ... ... ... ... ... ...United States Washington, DC 8.2 ... ... 0.2 ... ... ... ... ... ...OCEANIASamoa Apia 38.9 71.9 65.4 1.9 92.7 95.5 89.6 76.0 98.9 99.1
Source: UN-Habitat, 2002.
227Data tables
Abrams, C. (1964) Man’sStruggle for Shelter inan Urbanizing World.MIT Press, Cambridge,MA
ACHR (Asian Coalition forHousing Rights) (2002)ACHR Newsletter,Special Issue onCommunityDevelopment Funds,14, February, Bangkok
ACHR (2004) ‘Negotiatingthe right to stay in thecity’ Environment andUrbanization 16(1):9–25
ACHR, CODI (CommunityOrganizationDevelopment Institute)and IIED (InternationalInstitute forEnvironment andDevelopment) (2004)‘Catalysing pro-poordevelopment: The roleof savings and savingsorganizations’, Keyissues arising from anInternational Workshopon Housing Financeand Poverty, Bangkok,June, InternationalInstitute forEnvironment andDevelopment, London
Ahn, H. H. (2002)‘“Global capitalism”and the transition inSouth Korean housingfinance’ in G. Dymskiand D. Isenberg (eds)Seeking Shelter on thePacific Rim: FinancialGlobalization, SocialChange and theHousing Market. M.E.Sharpe, London andNew York
Albee, A. and N. Gamage(1996) Our Money,Our Movement.IntermediateTechnologyPublications, London.
Alimuddin, S., A. Hasanand A. Sadiq (2004)‘The work of theAnjuman Samaji
Behbood in Faisalabad’in D. Mitlin and D.Satterthwaite (eds)Empowering SquatterCitizen. Earthscan,London, pp139–161
Alm, J., J. A. Holman andR. M. Neumann(2002) Globalizationand State/LocalGovernment Finances.World Bank,Washington, DC
Al-Mansoori, M. A. J.(1997) ‘Governmentlow-cost housing in theUnited Arab Emirates:The Example of theFederal GovernmentLow-Cost HousingProgramme’ PhDthesis, University ofNewcastle upon Tyne,Newcastle upon Tyne,UK
Angel, S. (2002) HousingPolicy Matters. OxfordUniversity Press,London and New York
Anzonera, J., J. Bolnick, S.Boonyabancha, Y.Cabannes, A. Hardoy,A. Hassan, C. Levy, D.Mitlin et al (1998)‘Reducing urbanpoverty: Some lessonsfrom experience’Environment andUrbanization 10(1):167–186
Aphimeteetamrong, V. andB. Kritayanavaj (1998)‘Integrating housingfinance and capitalmarkets in Thailand’ inM. Watanabe (ed) NewDirections in AsianHousing Finance.International FinanceCorporation,Washington, DC,pp221–235
Arimah, B. C. (2000)‘Housing sectorperformance in globalperspective: A cross-city investigation’Urban Studies 37(13):2551–2579
Arrossi, S., F. Bombarolo,J. Hardoy, D. Mitlin, L.P. Coscio and D.Satterthwaite (1994)Funding CommunityInitiatives. Earthscan,London
Ashworth, A. (1993) ‘Howlife cycle costing canimprove existingcosting’ in J. W. Bull(ed) Life Cycle Costingfor Construction.Blackie Academic andProfessional, Glasgow
Avault, J., Consalvo, R.and Lewis, G. (2000)Survey of LinkagePrograms in Other U.S.Cities withComparisons to Boston.Boston RedevelopmentAuthority, Boston
Baëta Ansah, S. (2002)‘Financing adequateshelter for all in Africa’in UN-Habitat (ed)Financing AdequateShelter for All:Addressing the HousingFinance Problem inDevelopmentCountries. UN-Habitat,Nairobi, pp55–61
Baken, R.-J. and P. Smets(1999) ‘Better a “hut”on the ground than acastle in the air:Formal and informalhousing finance for theurban poor in India’ inK. Datta and G. Jones(eds) Housing Financein DevelopingCountries. Routledge,London, pp101–118
Ballesteros, M. M.(2002)‘Rethinking institutionalreforms in thePhilippine housingsector’ Discussion PaperSeries No 2002–16,Philippine Institute forDevelopment Studies(PIDS)
Ballesteros, M. M. and D.C. Vertido (2004) ‘Cangroup credit work forhousing loans? Some
evidence from theCMP’ Policy Notes No2004–05, PhilippineInstitute forDevelopment Studies(PIDS)
Bamberger, M., B. Sanyaland N. Valverde (1982)Evaluation of Sites andServices Projects: TheExperience fromLusaka, Zambia. WorldBank, Washington, DC
Basu, A., R. Blavy andM.Yulek (2004)‘Microfinance inAfrica: Experience andlessons from selectedAfrican countries’ IMFWorking Paper NoWP/04/174
Batley, R. (1996)‘Public–privaterelationships andperformance in serviceprovision’ UrbanStudies 33(4–5):723–752
Baumann, T. (2003)‘Housing policy andpoverty in SouthAfrica’ in F. Khan andP. Thring (eds) HousingPolicy and Practice inPost-apartheid SouthAfrica. Heinemann,Johannesburg
Baumann, T. (2004)Housing Finance inSouth Africa, mimeo
Baumann, T. and J.Bolnick (2001) ‘Out ofthe frying pan into thefire; the limits of loanfinance in a capitalsubsidy context’Environment andUrbanization 13(2):103–116
Baumann, T., J. Bolnickand D. Mitlin (2004)‘The age of cities andorganizations of theurban poor: The workof the South AfricanHomeless People’sOrganization’ in D.Mitlin and D.Satterthwaite (eds)
REFERENCES

Empowering SquatterCitizen. Earthscan,London, pp193–215
Baumann, T. and D. Mitlin(2003) ‘The SouthAfrican HomelessPeople’s Federation:Investing in the poor’Small EnterpriseDevelopment 14(1):32–41
Beier, G., A. Churchill, M.Cohen and B. Renaud(1976) ‘The task aheadfacing developingcountries: 1975–2000’World Development 4(5): 314–332
Bird, R. and E. Slack(2003) Fiscal Aspectsof MetropolitanGovernance. Inter-American DevelopmentBank, Washington, DC
Birdsall, N. (2001) ‘Whyinequality matters:Some economic issues’Ethics andInternational Affairs15(2):3–28
Biswas, S. (2003),‘Housing is aproductive asset –housing finance forself-employed womenin India’ SmallEnterpriseDevelopment14(1):49–55
Boonyabancha, S. (2004)‘A decade of change:From the UrbanCommunityDevelopment Office tothe CommunityOrganizationDevelopment Institutein Thailand’ in D.Mitlin and D.Satterthwaite (eds)Empowering SquatterCitizen. Earthscan,London, pp25–53
Boston Housing Authority(2000) Leading theWay – A Report onBoston’s HousingStrategy FY2001–FY2003. BostonRedevelopmentAuthority, Boston
Boston Housing Authority(2002) Leading theWay – A Report onBoston’s HousingStrategy FY 2001-FY2003-A MidpointProgress Report.Boston RedevelopmentAuthority, Boston
Boston Housing Authority(2004) Leading theWay 11 – A Report onBoston’s HousingStrategy FY2004–FY2007. BostonRedevelopmentAuthority, Boston
Boston MunicipalResearch Bureau(1998) Boston’sLinkage Program: ANew Approach toManaging LinkageFunds for Housing andJob Training. City ofBoston, Boston
Brakarz, J. (2003) Laconvergencia de losfondos de créditomunicipal y deinversión social: El casode Bolivia. BancoInteramericano deDesarrollo,Washington, DC
Buckey, R. (1996) HousingFinance in DevelopingCountries. MacMillanPress Ltd., London
Buckley, R. M. (1999)‘Housing finance indeveloping countries:A review of the WorldBank’s experience’ inK. Datta and G. Jones(eds) Housing andFinance in DevelopingCountries. Routledge,London
Buckley, B. and J.Kalarickal (2004)‘Shelter strategies forthe urban poor:Idiosyncratic andsuccessful but hardmysterious’, WorldBank Policy ResearchWorking Paper 3427,World Bank,Washington, DC
Buckley, R. and S. Mayo(1989) ‘Housing policyin developingeconomies: Evaluatingthe macro-economicimpacts’ Review ofUrban and RegionalDevelopment Studies2: 27–46
Buechler, S. (2000) ‘Thegrowth of the informalsector in São Paulo,Brazil’ Paper preparedfor National Academyof Sciences Panel onUrban PopulationDynamics, New York
Bugie, S. (2004) ‘The keyto the development of
mortgage funding inemerging markets’ inIntroducing the Issues:16 Expert Views.Presented atInternational Union ofHousing Finance 25thWorld Congress, June2004, pp32–33
Burgess, R. (1982) ‘Self-help housing advocacy:A curious form ofradicalism – a critiqueof the work of John F.C. Turner’ in P. M.Ward (ed) Self-helpHousing: A Critique.Mansell, London.
Burgess, R. (1985) ‘Thelimits of self-helphousing’ Developmentand Change 16(2):271–312
Cabannes, Y. (2002)‘Overview ofcommunity finance inLatin America’ HiFiNews 10: 6–7
Cabannes, Y. (2004)‘Participatorybudgeting: Asignificant contributionto participatorydemocracy’Environment andUrbanization 16(1):27–46
Calderón, J. (2004) ‘Theformalisation ofproperty in Peru2001–2002: The caseof Lima’ HabitatInternational 28:289–300
Carmon, N. (1992)‘Housing renovationsin moderatelydeterioratedneighbourhoods:Public–individualpartnership in Israeland its lessons’Housing Studies 7(1):56–73
Carney, D. (1998)‘Implementing thesustainable rurallivelihoods approach’in D. Carney (ed)Sustainable RuralLivelihoods: WhatContribution Can WeMake? Department forInternationalDevelopment, London,pp3–23
Carolini, G. Y. (2004) AsGood As It Gets? ASurvey of the USHousing Finance
System and itsClientele, mimeo
Cavalcanti, D., O.Marques and T. H.Costa (2004)‘Municipal programmefor the report andextension of homes:Casa Melhor/PAACCearah Periferia, Brazil’in D. Mitlin and D.Satterthwaite (eds)Empowering SquatterCitizen. Earthscan,London, pp165–192
Center for UrbanDevelopment Studies(2000) HousingMicrofinanceInitiatives. Center forUrban DevelopmentStudies, University ofHarvard GraduateSchool of Design,Harvard
CGAP (ConsultativeGroup to Assist thePoor) (2004) HousingMicrofinance, DonorBrief No 20. CGAP,Washington, DC
Chernyavsky, A. V.(undated) Review ofthe Municipal FinanceDevelopment in Russiain 1992-2002. Institutefor Urban Economics,Washington DC
Chi-Man Hui, E. and B.Seabrooke (2000) ‘Thehousing allowancescheme in Guangzhou’Habitat International24: 19–29
Chin Beng, Y. (2002) ‘Theexperience ofSingapore in financinghousing for the middleand low-incomegroups’, InternationalConference on SocialHousing, UnitedNations HumanSettlementsProgramme, Ministryof Construction ofPeople’s Republic ofChina and BaotouMunicipalGovernment, Baotou,People’s Republic ofChina
Chiquier, L., O. Hasslerand M. Lea (2004)‘Mortgage securities inemerging markets’,World Bank PolicyResearch WorkingPaper 3370. WorldBank, Washington, DC
229References

Christen, R. P. (2004)‘Foreward’ in F.Daphnis and B.Ferguson (eds) HousingMicro-finance: A Guideto Practice. KumarianPress Ltd., Bloomfield,US, ppix–xiv
Cities Alliance (2000)‘Cities Alliance: Citieswithout slums’,www.citiesalliance.org/citiesalliancehomepage.nsf/, accessed 30November 2004
Cities Alliance (2002)‘Sewa Bank’s housingmicrofinance programin India’ ShelterFinance for the PoorSeries. Cities Alliance,Washington, DC
Cleaver, F. (2004) ‘Thesocial embeddednessof agency and decision-making’ in S. Hickeyand G. Mohan (eds)Participation: FromTyranny toTransformation. ZedBooks, London,271–276
CMP (CommunityMortgage Programme)Bulletin (2004)‘National Congress ofCMP Originators andSocial DevelopmentOrganizations for Low-income Housing’,January
CODI (CommunityOrganizationDevelopment Institute)(2004) Codi Update 4(June)
Cohen, M. (1987)‘Macroeconomicadjustment and thecity’ Cities 7(1): 49–59
Cohen, M. A. (1998)‘Stock and flow inmetropolitaninvestment’ BrookingsReview 16(4): 37–39
Cohen, M. A. and D.Debowicz (2004) ‘Thefive cities of BuenosAires: Poverty andinequality’ in S. Sassen(ed) UNESCOEncyclopedia ofSustainableDevelopment.UNESCO, Paris
Collyns C. and A. Senhadji(2002) ‘Lendingbooms, real estatebubbles and the AsianCrisis’ IMF Working
Paper WP/02/20.International MonetaryFund, Washington, DC
Connolly, P. (2004a) ‘TheMexican NationalPopular Housing Fund’in D. Mitlin and D.Satterthwaite (eds)Empowering SquatterCitizen. Earthscan,London, pp82–111
Connolly, P. (2004b)Housing Finance inMexico, mimeo
Co-operative HousingFoundation (1993)‘Supporting shelter andcommunityimprovements for low-income families inCentral America’Environment andUrbanization 5(1):38–51
Coovadia, C. (2004)‘Housing finance inAfrica’ in Introducingthe Issues: 16 ExpertViews. Presented atInternational Union ofHousing Finance 25thWorld Congress, June2004, pp10–11
Costa, R. (2002) ‘Hogarde Cristo – Ecuador:30 Years!’ SELAVIPNewsletter (2002)April: 39–40
Cotton, A. P., M. Souhailand W. K. Taylor (1998)Community Initiativesin UrbanInfrastructure. Water,Engineering andDevelopment Centre,University ofLoughborough,Loughborough, UK
Counts, A. (1996). GiveUs Credit: HowMuhammad Yunus’sMicro LendingRevolution IsEmpowering Womenfrom Bangladesh toChicago. RandomHouse, New York
Cummings, J. and D. DiPasquale (1997) TheSpatial Implications ofHousing Policy in Chile,mimeo. City Research,Boston
D’Arista, A. (1998)‘Comment on“Housing finance inthe age ofglobalization: Fromsocial housing to life-cycle risk”’ in D. Baker,
G. Epstein and R.Pollin (eds)Globalization andProgressive EconomicPolicy. CambridgeUniversity Press,Cambridge
D’Cruz, C. (2004a)‘Securitization ofmortgage portfolios inLatin America: TheChilean case’ HousingFinance InternationalMarch: 15–20
D’Cruz, C. (2004b) SlumDwellers International:Local Voices, GlobalGoals, mimeo. YaleUniversity, US
D’Cruz C. and D. Mitlin(2005) ‘Shack/SlumDwellers International:One experience of thecontribution ofmembershiporganizations to pro-poor urbandevelopment’, Paperpresented to theconference onMembership BasesOrganizations of thePoor: Theory,Experience and Policy,17–21 January 2005,Ahmedabad, India
Dale-Johnson, D. and G.Towle (2002) ‘TheMexican mortgagemarket: Has the shipcome in?’ HousingFinance InternationalJune, 19(2): 19–32
Daphnis, F. (2004a)‘Housing micro-finance: Toward adefinition’ in F.Daphnis and B.Ferguson (eds) HousingMicro-finance: A Guideto Practice. KumarianPress Ltd., Bloomfield,pp1–14
Daphnis, F. (2004b)‘Elements of productdesign for housingmicro-finance’ in F.Daphnis and B.Ferguson (eds) HousingMicro-finance: A Guideto Practice. KumarianPress Ltd., Bloomfield,pp85–114
Daphnis, F. and B.Ferguson, (2004) (eds)Housing Micro-finance:A Guide to Practice.Kumarian Press Ltd.,Bloomfield, US
Datta, K. (1999), ‘Agendered perspectiveon formal and informalhousing finance inBotswana’ in G. Jonesand K. Datta (eds)Housing and Finance inDeveloping Countries.Routledge, London,pp192–212
David, P. (2004) ‘Publicmortgage experience:The Canadianexperience’ inIntroducing the Issues:16 Expert Views.Presented atInternational Union ofHousing Finance 25thWorld Congress, June2004, pp26–27
Davies, G. and E. Mahony(2001) HousingMicrofinance: Buildingthe Assets of the Poor,One Room at a Time.John F Kennedy Schoolof Government,Harvard University, US
De Soto, H. (2002) TheMystery of Capital:Why CapitalismTriumphs in the Westand Fails EverywhereElse. Basic Books, NewYork
Department of Housing(2003) A SocialHousing Policy forSouth Africa,www.housing.gov.za/Content/legislation_policies/Social%20Housing%20Policy.pdf
DFID (UK Department forInternationalDevelopment) (2004a)Financial SectorDevelopment: APrerequisite for Growthand Poverty Reduction?,www.dfid.gov.uk/pubs/files/fsdbriefingnote.pdf, accessed 2September 2004
DFID (2004b) PovertyReduction Support: ADFID Policy Paper.Department forInternationalDevelopment, London
Diko, J. and A. G. Tipple(1992) ‘Migrants buildat home: Long distancehousing developmentby Ghanaians inLondon’ Cities 9 (4):288–294
Dillinger, W. et al (1994)Study on Ciudad
230 Financing Urban Shelter
Juarez. World Bank,Washington, DC
Douglass, M. (1997)‘Structural change andurbanization inIndonesia: From the“Old” to the “New”international divisionof labour’ in G. W.Jones and P. Visara(eds) Urbanization inLarge DevelopingCountries: China,Indonesia, Brazil, andIndia. Clarendon Press,Oxford
Dübel, A. (2004) ‘Capitalmarket funding formortgages: Where dowe stand, where do wego?’ in Introducing theIssues: 16 ExpertViews. Presented atInternational Union ofHousing Finance 25thWorld Congress, June2004: 28–29
Dymski, G. and D.Isenberg (1998)‘Housing finance in theage of globalization:From social housing tolife-cycle risk’ in D.Baker, G. Epstein andR. Pollin (eds)Globalization andProgressive EconomicPolicy. CambridgeUniversity Press,Cambridge
Dymski, G. and D.Isenberg (eds) (2002)Seeking Shelter on thePacific Rim: FinancialGlobalization, SocialChange and theHousing Market. M.E.Sharpe, London andNew York
Earley, F. (2004a)‘Challenges in theEuropean housingmarkets’ in Introducingthe Issues: 16 ExpertViews. Presented atInternational Union ofHousing Finance 25thWorld Congress, June2004, pp14–15
Earley, F. (2004b) ‘Thehousing and mortgagemarkets in 2003’ inEuropean MortgageFederation (ed)Hypostat 2003:European HousingFinance Review.European MortgageFederation, Brussels,pp4–13
ECLAC (EconomicCommission for LatinAmerica and theCaribbean) (2003)Statistical Yearbook.ECLAC, Santiago
The Economist (2004)‘The global housingmarket: Flimsyfoundations’ TheEconomist, 11December, pp77–78
Edwards, M. (1995)‘Public/private sectorpartnerships in housingprovision: What are thePossibilities?’ HabitatDebate 1(4): 5
Environment andUrbanization (1993)Special issue on‘Funding communitylevel initiatives: Therole of NGOs andother intermediaryinstitutions in fundingand supporting low-income households toimprove shelter,infrastructure andservices’ April 5 (1)
Environment andUrbanization (2001)Special issue on ‘Civilsociety in action –transformingopportunities for theurban poor’ October:13 (2)
Escalante, C. (2004)‘Towards decentralisedhousing improvementspolicies in Peru’ Journalof Low-income Housingin Asia and the World,April: 56–60
ESCAP (Economic andSocial Commission forAsia and the Pacific)(1991), Guidelines onCommunity BasedHousing Finance andInnovative CreditSystems for Low-income Households.United Nations,Bangkok
Escobar, A. (undated) Part 1. Microfinance ofHousing: State of thePractice, mimeo
Escobar, A. and S. R.Merrill (2004)‘Housing micro-finance: The state ofthe practice’ in F.Daphnis and B.Ferguson (eds) HousingMicro-finance: A Guideto Practice, Kumarian
Press Ltd., Bloomfield,US, pp33–68
EMF (European MortgageFederation) (2004)Hypostat 2003:European HousingFinance Review. EMF,Brussels
Farha, L. and R. Goba(2003) ‘Access denied:Canada’s housingcrisis’ Journal of Low-income Housing in Asiaand the WorldOctober: 21–23
Ferguson, B. (1999)‘Micro-finance ofhousing: A key tohousing the low ormoderate incomemajority?’ Environmentand Urbanization11(1): 185–200
Ferguson, B. (2002) ‘Ahousing paradigm andnew programmes fordevelopmentcountries: The LatinAmerica case’ in UN-Habitat (ed) FinancingAdequate Shelter forAll: Addressing theHousing FinanceProblem inDevelopmentCountries. UN-Habitat,pp165–170
Ferguson, B. (2003)‘Housing microfinance– a key to improvinghabitat and thesustainability ofmicrofinanceinstitutions’ SmallEnterprise Development14(1): 21–31
Ferguson, B. (2004a) ‘Thekey importance ofhousing micro-finance’in F. Daphnis and B.Ferguson (eds) HousingMicro-finance: A Guideto Practice. KumarianPress Ltd., Bloomfield,US, pp15–32
Ferguson, B. (2004b)‘Scaling up housingmicro-finance: A guideto practice’ HousingFinance International,September: 3–13
Ferguson, B. and J.Navarrete (2003) ‘Afinancial framework forreducing slums:Lessons fromexperience in LatinAmerica’ Environmentand Urbanization15(2): 201–216
Fernandez, V. (2004)Housing Finance – theCase of Chile, mimeo
Flood, J. (2004) CostEstimate forMillenniumDevelopment Goal 7,Target 11 on Slums,Background Reportprepared for UNMillennium ProjectTask Force 8 and UN-Habitat, available atwww.unmillenniumproject.org
Forero, E. (2004)‘Evolution of themortgage system inColombia: From theUPAC to the UVRsystem’ HousingFinance International,March: 32–41.
Forrest, R., P. Kennett andM. Izuhara (2003)‘Home ownership andeconomic change inJapan’ Housing Studies18(3): 277–293
Frank, D. (2004) ‘Amarket-based housingimprovement systemfor low-income families– the HousingIncentive System (SIV)in Ecuador’Environment andUrbanization 16(1):171–184
Freedom to Build (2004)‘Freedom to Build’Journal of Low-incomeHousing in Asia andthe World April: 75–78
Freire, M. and M. Polese(2003) ConnectingCities with Macro-economic Concerns:The Missing Link.World Bank,Washington, DC
Freire, M. et al (2004)Sub-sovereign CreditAccess andInfrastructureFinancing in Four EastAsian Countries:China, Philippines,Indonesia, and Vietnam– Phase One: AReconnaissance. WorldBank, Washington, DC
Fruet, G. M. (2005) ‘Thelow-income housingcooperatives in PortoAlegre, Brazil: Astate/communitypartnership’ HabitatInternational 29:303–324
231References
Fry, M. and Drew, J.(1964) TropicalArchitecture in aHumid Zone. Batsford,London
Fujita, K. (2000) ‘Asiancrisis, financial systemsand urbandevelopment’ UrbanStudies 37(12):2197–2216
Gadzama, H. M. (2002)‘Experiences ofhousing financeoperations in Nigeriaand lessons to belearnt from theseexperiences’ in UN-Habitat (ed) FinancingAdequate Shelter forAll: Addressing theHousing FinanceProblem inDevelopmentCountries. UN-Habitat,Nairobi: 68–82
Gallarado, J. (1998)‘Rationalising housingfinance and developingcapital markets in thePhilippines’ in M.Watanabe (ed) NewDirections in AsianHousing Finance.International FinanceCorporation,Washington, DC:199–221
Gaye, M. and F. Diallo(1997) ‘Communityparticipation in themanagement of theurban environment inRufisque’ Environmentand Urbanization 9(1):9–30
Ghouri, N. S. and H. Nihal(1993) ‘The housingloan programme of theCatholic SocialServices in Karachi’Environment andUrbanization 5(1):18–25
Gibb, K. (2002) ‘Trendsand change in socialhousing finance andprovision within theEuropean Union’Housing Studies 17(2):325–336
Gilbert, A. (1999) ‘Ahome is for ever?Residential mobilityand home ownershipin self-helpsettlements’,Environment andPlanning A:1073–1091
Gilbert, A. (2000) ‘Whatmight South Africahave learned abouthousing subsidies fromChile?’ South AfricanGeographical Journal82 (1): 21–29
Gilbert, A. (2002a)‘Power, ideology andthe WashingtonConsensus: Thedevelopment andspread of Chileanhousing policy’Housing Studies 17(2):305–324
Gilbert, A. (2002b) ‘Onthe mystery of capitaland the myths ofHernando de Soto’InternationalDevelopment PlanningReview 24(1): 1–19
Gilbert, A. (2004)‘Helping the poorthrough housingsubsidies: Lessonsfrom Chile, Colombiaand South Africa’Habitat International28: 13–40
Gitau, S. (2004) Part C:Housing FinanceConditions and Trendsin Africa, mimeo
Goetz, M. and R. SenGupta (1996) ‘Whotakes the credit?Gender power andcontrol over loan usein rural creditprograms inBangladesh’ WorldDevelopment 24 (1):45–64
Gold, J., A. Muller and D.Mitlin (2002) ‘Theprinciples of LocalAgenda 21inWindhoek: Collectiveaction and the urbanpoor’, Working Paperon Local Agenda 21sand UrbanEnvironmental ActionPlans No 9.International Institutefor Environment andDevelopment, London
Gonzáles de Kauffman, M.and H. Rincón (2004)‘Information on micro-credit experience:Programma CiudadaníaPlena, Maracaibo,Venezuela’,Presentation to anInternational Workshopon Housing Financeand poverty, June
2004, BangkokGordon, A. (1999)
‘Informal finance andwomen’s survivalstrategies: Case studiesfrom Cameroon andZambia’ in G. Jonesand K. Datta (eds)Housing and Finance inDeveloping Countries.Routledge, London:181–191
Gough, K. (1999),‘Affording a home: Thestrategies of self-helpbuilders in Colombia’in G. Jones and K.Datta (eds) Housingand Finance inDeveloping Countries.Routledge, London:119–135
Government of Tanzaniaand UN-Habitat(United NationsHuman SettlementsProgramme) (2003) Re-establishingEffective HousingFinance Mechanisms in Tanzania: ThePotentials and theBottlenecks. UN-Habitat, Nairobi
Graham, S. and S. Marvin(2001) SplinteringUrbanism: NetworkedInfrastructures,TechnologicalMobilities and theUrban Condition.Routledge, London
Grameen Bank (2004)Newsletter July,www.grameen-info.org
Groves, R. (2004)‘Challenges facing theprovision of affordablehousing in Africancities’ Housing FinanceInternational June:26–31
Gulyani, S. and G.Connors (2002) ‘Urbanupgrading in Africa: Asummary of rapidassessment in tencountries’, available athttp://web.mit.edu/urbanupgrading/upgrading/case-examples/overview-africa/country-assessments/index.html
Guttentag, J. (2004)‘Protection of themortgage borrowers inthe US’ in Introducingthe Issues: 16 ExpertViews. Presented at
International Union ofHousing Finance 25thWorld Congress, June2004, p17
Ha, S. (2002a) ‘Theevolving role of theKorean government inlow-income housing’ inG. Dymski and D.Isenberg (eds) SeekingShelter on the PacificRim: FinancialGlobalization, SocialChange and theHousing Market. M.E.Sharpe, London andNew York
Ha, S. (2002b) ‘The urbanpoor, rentalaccommodations andhousing policy inKorea’ Cities 19(3):195–203
Hanchett, S., S. Akhterand M. Hoque Khan(2003) ‘Water,sanitation and hygienein Bangladesh slums:An evaluation of theWaterAid–Bangladeshurban programme’Environment andUrbanization 15(2):43–56
Hardoy, J. and D.Satterthwaite (1989)Squatter Citizen.Earthscan Publications,London
Harris, J. R. and M. P.Todaro (1970)‘Migration,unemployment anddevelopment: A two-sector analysis’American EconomicReview 60:126–142
Harris, R. and G. Arku(2004) Housing andEconomicDevelopment: TheHistory of an Idea.School of Geographyand Geology,McMaster University,Hamilton, Ontario
Hart, K. (1973) ‘Informalincome opportunitiesand urban employmentin Ghana’ Journal ofAfrican Studies March:151–164
Hegedüs, J. (2002)Housing Finance inSouth-eastern Europe.Metropolitan ResearchInstitute, Budapest.
Hegedüs, J. (2004) ‘Socialhousing experiences inEast European
232 Financing Urban Shelter
transition countries’,Paper presented at theEHNR (EuropeanNetwork for HousingResearch) InternationalHousing Conference,2–4 July, Cambridge,UK
Hegedüs, J. and N. Teller(2003) ‘Managementof the housing stock insouth-eastern Europe’,Paper prepared for thejoint programme of theCouncil ofEurope–Council ofEurope DevelopmentBank to thepreparation of a high-level conference onhousing in SouthernEurope, mimeo
Helao, A. N. (2004)‘Ministry regional andlocal government andhousing: The BuildTogether program’,Presentation to anInternational Workshopon Housing Financeand Poverty, June,Bangkok
HiFi News (2002) Issueno 9, InternationalInstitute forEnvironment andDevelopment, London
Ho, M. H. C. (2004)‘Privatisation of publichousing in Hong Kong:A genuine agenda orpropaganda’ HabitatInternational 28:481–494
Hoek-Smit, M. (1998)‘Housing finance inBangladesh: Improvingaccess to housingfinance by middle andlower income groups’,Prepared for theGovernment ofBangladesh (Ministryof Local Government,Rural Development andCooperatives) andUNDP/UNCHS(Habitat), Nairobi
Hoek-Smit, M. C. and D.B. Diamond (2003)‘Subsidies for housingfinance’ HousingFinance International17(3): 3–13
Hogar de Cristo (undated)Our Mission,www.hogardecristo.com/navegacion/home.asp, accessed 10February 2005
Huchzermeyer, M. (2003)‘A legacy of control:The capital subsidy forhousing and informalsettlementintervention in SouthAfrica’ InternationalJournal of Urban andRegional Research27(3): 591–612
Hulme, D. (2000) ‘Ismicrodebt good forpoor people? A note onthe dark side ofmicrofinance’ SmallEnterpriseDevelopment 11(1):26–28
IADB (Inter-AmericanDevelopment Bank)(1998) Facing Up toInequality in LatinAmerica. IADB,Washington, DC
IADB (2003) Colombia:Urban Social HousingProgram – LoanProposal. IADB,Washington, DC
ILO (International LabourOrganization) (1972).Employment, Incomeand Equality: AStrategy for IncreasingProductive Employmentin Kenya. ILO, Geneva
IMF (InternationalMonetary Fund)(2004) WorldEconomic Outlook.IMF, Washington, DC
IMF and IDA(InternationalDevelopmentAssociation) (2004)‘Debt sustainability inlow-income countries:Proposal for anoperational frameworkand policyimplications’, 3February, IMF andIDA, Washington, DC
Itoh, M. (2002) ‘Housingfinance in Japanesefinancial instability’ inG. Dymski and D.Isenberg (eds) SeekingShelter on the PacificRim: FinancialGlobalization, SocialChange and theHousing Market. M.E.Sharpe, London andNew York: 150–168
Jacobs, M. and W. D.Savedoff (1999)‘There’s more thanone way to get ahouse: Housing
strategies in Panama’,Working Paper No 392.Inter-AmericanDevelopment Bank,Washington, DC
Jain, A. K. (2003)‘Actioning newpartnerships for Indiancities’, Cities 20:353–359
Jiminez, E. (1982) ‘Theeconomics of self helphousing: Theory andsome evidence from adeveloping country’,Journal of UrbanEconomics 2: 205–228
Jiron, M. P. and G. Fadda(2003) ‘A quality of lifeassessment to improveurban and housingpolicies in Chile’,Paper presented to theWorld Bank UrbanResearch Symposium,December 2003,Washington, DC
Joint Center for HousingStudies at theUniversity of Harvard(2004) The State ofMexico’s HousingFinance. Joint Centerfor Housing Studies atthe University ofHarvard, Harvard, US
Jones, G. and K. Datta(eds) (1999) Housingand Finance inDeveloping Countries.Routledge, London:26–43
Jones, G. and D. Mitlin(1999) ‘Housingfinance andnon–governmentalorganizations indeveloping countries’in G Jones and K. Datta(eds) Housing andFinance in DevelopingCountries Routledge.London: 26–43.
Jones, G. A. and R. A. Pisa(2000) ‘Public–privatepartnerships for urbanland development inMexico: A victory forhope versusexpectation? Chartingchanges in governancein the Mexicanmunicipality’ HabitatInternational 24(1):1–18
Kabir, A. H. M. (2002)‘Development andhuman rights:Litigating the right toadequate housing’
Asia–Pacific Journal onHuman Rights and theLaw 1: 97–119
Karley, N. K. (2002)‘Alternative options tomortgages in Ghana’Housing FinanceInternational 17(2):26–30
Karley, N. K. andWhitehead, C. (2002)‘The mortgage-basedsecurities market inthe UK: Developmentsover the last few years’Housing FinanceInternationalDecember: 31–36
Kamete, A. Y. (2000) ‘Thepractice of costrecovery in urban low-income housing: Adiscourse withexperiences fromZimbabwe’ HabitatInternational 24:241–260
Karnad, R. S. (2004)‘Housing finance andthe economy: Regionaltrends, South Asiaperspectives’,Presentation to the25th World Congress,International Union forHousing Finance, June
Kasongo, B. A. and A. G.Tipple (1990) ‘Ananalysis of policytowards squatters inKitwe, Zambia’, ThirdWorld Planning Review12 (1): 27–46
Keare, D. H. (1983)‘Assessing projectimpacts’ in Y. M.Yeung (ed) A Place toLive: More EffectiveLow-cost Housing inAsia. Ottawa, IDRC
Keare, D. H. and S. Parris(1982) Evaluation ofShelter Programs forthe Urban Poor:Principal Findings.World Bank,Washington, DC
Keivani, R. and E. Werna(2001) ‘Refocusing thehousing debate indeveloping countriesfrom a pluralisticperspective’ HabitatInternational 25(2):191–208
Kessides, C. (1997)‘World Bankexperience with theprovision ofinfrastructure services
233References
for the urban poor:Preliminaryidentification andreview of bestpractices’,www.worldbank.org/urban/publicat/alpha.html, accessed 10September 2004
Kevane, M. and B. Wydick(2001)‘Microenterpriselending to femaleentrepreneurs:Sacrificing economicgrowth for povertyalleviation?’ WorldDevelopment 29(7):1225–1236
Kim, K.-H. (1997)‘Improving localgovernment finance ina changingenvironment’, HabitatInternational 21(1):17–28
Kim, S. H. and H. H. Ahn(2002) ‘The peculiar“publicness” ofhousing in SouthKorea’ in G. Dymskiand D. Isenberg (eds)Seeking Shelter on thePacific Rim: FinancialGlobalization, SocialChange and theHousing Market. M.E.Sharpe, London andNew York
Klaassen, L. H., J. G. D.Hoogland and M. J. vanPelt (1987) ‘Economicimpact andimplications of shelterinvestments’ in L.Rodwin (ed) Shelter,Settlement andDevelopment. Allenand Unwin, Boston
Klopfer, E. (2004) ‘Twocheers for privatemortgage insurance’ inIntroducing the Issues:16 Expert Views.Presented atInternational Union ofHousing Finance 25thWorld Congress, June2004: 24–25
Koenigsberger, O. (1973)Manual of TropicalHousing and Building.Longmans, London
Kosareva, N. and A.Puzanov (2000) TheImplications ofGlobalization andPrivatization for theProvision of and Accessto Housing and UrbanDevelopment in
Transition Economies:Poverty, Inequity,Polarization. Reportprepared forUN–Habitat, Nairobi
Kritayanavaj, B. (2002)‘Financing affordablehomeownership inThailand: Roles of thegovernment housingbank since theeconomic crisis(1997–2002)’ HousingFinance International17(2): 15–25
Kumar Garg, Y. (1998)‘New directions inhousing finance inIndia’ in M. Watanabe(ed) New Directions inAsian Housing Finance.International FinanceCorporation,Washington, DC:83–112
La Grange, A. and N. NamJung (2004) ‘Thecommodification ofland and housing: Thecase of South Korea’Housing Studies 19(4):557–580
Lai, O.-K. (1998)‘Governance and thehousing question in atransitional economy:The political economyof housing policy inChina reconsidered’Habitat International22(3): 231–243
Lall, S. and V. D Lall(2003) ‘ITDGintegrated urbanhousing strategyexperiences of asecondary town –Alwar’, Paperpresented to theInternational Workshopon Integrated HousingDevelopment, 16–18March 2003, Rugby,UK
Lambert, A. (2004)‘Consumer protectionin the European Union’in Introducing theIssues: 16 ExpertViews. Presented atInternational Union ofHousing Finance 25thWorld Congress, June2004: 18–19
Lamoreaux, P. (1998)‘Housing finance andcapital markets: TheHong Kong experience’in M. Watanabe (ed)New Directions inAsian Housing Finance.
International FinanceCorporation,Washington, DC:50–82
Laquian, A. A. (1983a)Basic Housing: Policiesfor Urban Sites,Services and Shelter inDeveloping Countries.InternationalDevelopment ResearchCentre, Ottawa,Canada
Laquian, A. A. (1983b)‘Sites, services andshelter – an evaluation’Habitat International7(5/6): 291–301
Lea, M. (2000) ‘The roleof the primarymortgage market in thedevelopment of asuccessful secondarymortgage market’,SustainableDevelopmentDepartment TechnicalPapers Series, Inter-American DevelopmentBank, Washington, DC
Lea, M. (2004a) ‘The USmortgage market,progress and prospects’in Introducing theIssues: 16 ExpertViews. Presented atInternational Union ofHousing Finance 25thWorld Congress, June2004: 12–14
Lea, M. (2004b) ‘Housingfinance in theaccession countries’ inEuropean MortgageFederation (ed)Hypostat 2003:European HousingFinance Review.European MortgageFederation, Brussels:21–24
Lee, J. (2003) ‘Mortgagesecuritization in Korea’Housing FinanceInternational March:24–30
Lee, J. and S. Lee (1998)‘Restructuring thehousing finance systemand broadening thelinkage with capitalmarkets in theRepublic of Korea’ inM. Watanabe (ed) NewDirections in AsianHousing Finance.International FinanceCorporation,Washington, DC:157–183
Lee, K. S., A. Anas and G.T. Oh (1999) ‘Costs ofinfrastructuredeficiencies inmanufacturing inIndonesia, Nigeria andThailand’ UrbanStudies 36(12):2135–2149
Lewis, B. D. and Chakeri,J. (2004)‘Decentralized LocalGovernment Budgetsin Indonesia: WhatExplains the LargeStock of Reserves?’Unpublishedmanuscript, WorldBank, Jakarta
Lincoln Institute of LandPolicy (2002) Access toLand by the UrbanPoor. Lincoln Instituteof Land Policy,Cambridge,Massachusetts, US
Litvack, J., J. Ahmad andR. Bird (1998)‘Rethinkingdecentralization indeveloping countries’,Sector Studies Series,World Bank,Washington, DC
Lohse, U. H. (2002)‘Housing finance –overview’ in UN-Habitat (ed) FinancingAdequate Shelter forAll: Addressing theHousing FinanceProblem inDevelopmentCountries. UN-Habitat,Nairobi: 41–47
Lykova, T., E. Petrova, S.Sivaev and R. Struyk(2004) ‘Participation ina decentralised housingallowance programmein a transitioneconomy’ HousingStudies 19(4):617–634
Mahanga, M. M. (2002)‘Legislative andregulatory roadblocksto the effective andsustainable functioningof the housing financesystem in Africancountries: The case ofTanzania’, InternationalConference on SocialHousing, UnitedNations HumanSettlementsProgramme, Ministryof Construction ofPeople’s Republic ofChina and Baotou
234 Financing Urban Shelter
MunicipalGovernment, Baotou,People’s Republic ofChina
Malhotra, M. (2003)‘Financing her home,one wall at a time’Environment andUrbanization 15(2):217–228
Malpezzi, S. and G. Ball(1991) Rent Control inDeveloping Countries.World Bank,Washington, DC
Malpezzi, S. J., A. G.Tipple and K. G. Willis(1990) Costs andBenefits of RentControl: A Case Studyin Kumasi, Ghana.World Bank,Washington, DC
Martin, R. (1983)‘Upgrading’ in R. J.Skinner and M. J.Rodell (eds) People,Poverty and Shelter:Problems of Self-helpHousing in the ThirdWorld. Methuen,London
Mathur, O. P. and Thakur,S. (2004) India’sMunicipal Sector. Astudy for the 12thFinance Commission(TFC). NationalInstitute of PublicFinance and Policy,New Delhi
Mayo, S. (1999)‘Subsidies in housing’,SustainableDevelopmentDepartment TechnicalPapers Series, Inter-American DevelopmentBank, Washington, DC
Mayo, S. K. and D. Gross(1987) ‘Sites andservices – andsubsidies: Theeconomics of low-costhousing in developingcountries’ The WorldBank Economic Review1 (2): 305–335
McAuslan, P. (1997) ‘Themaking of the UrbanManagementProgramme: Memoirsof a mendicantbureaucrat’ UrbanStudies 34(10):1705–1727
McLeod, R. (2002)‘Experiences of linkingcommunity-basedhousing finance in
formal financemechanisms’ in UN-Habitat (ed) FinancingAdequate Shelter forAll: Addressing theHousing FinanceProblem inDevelopmentCountries.UN–Habitat, Nairobi:190–221
Meier, G. M. and J. E.Stiglitz (2000)Frontiers ofDevelopmentEconomics. World Bankand Oxford UniversityPress, New York
Menon, B. et al (2003)Cities in Transition: AnUrban Sector Review ofIndonesia. Mimeo
Merrill, S. and D.Whiteley (2003)‘Establishing amortgage guaranteeinsurance in transitionand emerging markets:A case study ofKazakhstan’ HousingFinance InternationalSeptember: 10–19
Mersmann, H. (2004)‘Mortgage guaranteesystems around theworld’ in Introducingthe Issues: 16 ExpertViews. Presented atInternational Union ofHousing Finance 25thWorld Congress, June2004: 22–23
Milbert, I. and V. Peat(1999) What Future forUrban Cooperation?Swiss Agency forDevelopment andCooperation, Bern
Ministry of Regional,Local Government andHousing (2003) BuildTogether NationalHousing ProgrammeImplementationProgramme, ThirdRevision. Ministry forRegional, LocalGovernment andHousing, Windhoek,Namibia
Mintz, G. (2003)‘Mortgage financing indeveloping countries’,Paper presented to theAnnual Meeting of theAssociation ofDevelopmentFinancing Institutionsin Asia and the Pacific,www.citysailor.com/talks/Mortgage1.htm
Mitlin, D. (1997)‘Building with credit:housing finance forlow-incomehouseholds’, ThirdWorld Planning Review,19(1), February:21–50
Mitlin, D. (2003) ‘Financefor shelter: Recenthistory, futureperspectives’ SmallEnterpriseDevelopment 14(1):11–20
Mitlin, D. and A. Muller(2004) ‘Windhoek,Namibia – towardsprogressive urban landpolicies in SouthernAfrica’ InternationalDevelopment PolicyReview 26(2):167–186
Mitlin, D. and S. Patel(2005) ‘Reinterpretingthe rights basedapproach – a grassrootsperspective on rightsand development’,Paper presented at theWinners and Losersfrom Rights-basedApproaches toDevelopment,Manchester University,Manchester, UK,21–22 February
Mitlin, D. and D.Satterthwaite (2004a)(eds) EmpoweringSquatter Citizen.Earthscan, London
Mitlin, D, and D,Satterthwaite (2004b)‘Introduction’ in D.Mitlin and D.Satterthwaite (eds)Empowering SquatterCitizen. Earthscan,London: 3–24
Mohamed, S.-I. (1997)‘Tenants and tenure inDurban’ Environmentand Urbanization 9(2):101–118
Montgomery, M. R.,Stren, R., Cohen, B.and Reed, H. E. (2004)Cities Transformed:Demographic Changesand Its Implications inthe Developing World.Earthscan, London
Mosha, A. C. (2004) ‘Thechallenges of cityfinancing: TheBotswana experience’,Paper presented at thepanel on Cities: CrossRoads of Culture,
Inclusiveness andIntegration in theSecond World UrbanForum, Barcelona,Spain, 13–17September 2004
Mosley, P. and D. Hulme(1998)‘Microenterprisefinance: Is there aconflict betweengrowth and povertyalleviation?’ WorldDevelopment 26(5):783–790
Moss, V. (2001) ‘The stateof housing finance inSouth Africa’ HousingFinance International,11: 30–35
Moss, V. (2003)‘Understanding thereasons to the causesof defaults in the socialhousing sector ofSouth Africa’ HousingFinance InternationalSeptember: 20–26
Mukhija, V. (2004a) ‘Thecontradictions inenabling privatedevelopers ofaffordable housing: Acautionary case fromAhmedabad, India’Urban Studies 41(11):2231–2244
Mukhija, V. (2004b) ‘Howis housing financed?The case of a group oftenants who becameproperty developers inMumbai, India’InternationalDevelopment PlanningReview 26(3):287–304
Mulenga, C. (2003)Responding to theHousing Problems ofthe Urban Poor inZambia. MA thesis,University ofManchester,Manchester, UK
Murcia de López, E. andL. Castillo (1997) ‘ElSalvador: A case ofurban renovation andrehabilitation ofmesones’ Environmentand Urbanization 9(2):161–179
Mutagwaba, H. C. (2002)‘The challenges of re-starting a market-basedhousing finance systemin Tanzania:Constraints, lessonsand the way forward’in UN-Habitat (ed)
235References
Financing AdequateShelter for All:Addressing the HousingFinance Problem inDevelopmentCountries. UN-Habitat,Nairobi: 83–92
Mutua, K., P. Nataradol,M. Otero and B. R.Chung (1996) ‘Theview from the field:Perspectives frommanagers ofmicrofinanceinstitutions’ Journal ofInternationalDevelopment 8(2):179–194
Napier, M., A. G. Tipple,N. Majija, R. Beän andK. Wall (2003) UrbanSector Network PhaseII Mid-term EvaluationReport: Global Reportfor the Period January2000–December 2002.Mid-term Evaluation ofFinancing Agreement(SA/73200–99/20)between the EuropeanUnion and the UrbanSector Network.Council for Scientificand Industrial Researchand University ofNewcastle upon Tyne,Pretoria
National Academy ofScience (2004)Proceedings of theNational Academy ofSciences. NationalAcademics Press,Washington, DC
National Research Council(2003) CitiesTransformed. NationalAcademy of SciencePress, Washington, DC
Nell, M., R. Gordon andA. Bertoldi (2004)Final Report: Findings,Conclusions andImplications. Workingsof the TownshipResidential PropertyMarket Project.Rosebank, SouthAfrica, ShisakaDevelopmentManagement Services(Pty) Ltd. for FinMarkTrust, Ford Foundation,Micro FinanceRegulatory Council/USAID, South AfricanNational Treasury andthe National HousingFinance Corporation,South Africa
Ng’ayu, M. (2003)‘Integrated urbanhousing project(IUHP), Nakuru,Kenya: Project impactassessment’, Paperpresented to theInternational Workshopon Integrated HousingDevelopment, Rugby,UK, 16–18 March2003
Nozdrina, N. and G.Sternik (1999)‘Housing markets andmigration in cities ofRussia’. ExecutiveReports No 6, MoscowCarnegie Center,Moscow
Nuri Erbas, S. and F. ENothaft (2002)‘Improving livingstandards andstimulating growth: Asurvey of MENAcountries’ IMFWorking Paper NoWP/02/17,International MonetaryFund, Washington, DC
ODPM (Office of theDeputy PrimeMinister) (2003) ‘Themortgage backedsecurities market inthe UK: Overview andprospects’ HousingResearch Summary No201, ODPM, London
OECD (Organisation forEconomic Co-operationand Development)(1992) Cities and NewTechnologies. OECD,Paris
OECD (2002) ReportingDirectives for theCreditor ReportingSystem, www.oecd.org/dataoecd/16/53/1948102.pdf, accessed14 March 2005
OECD (2003) Ageing,Housing and UrbanDevelopment. OECD,Paris
OECD (2004) ‘Final ODAdata for 2003’,www.oecd.org/dataoecd/19/52/34352584.pdf,accessed 9 March2005
Ogu, V. I. and J. E.Ogbuozobe (2001)‘Housing policy inNigeria: Towardsenablement of privatehousing development’
Habitat International25: 473–492
Oizumi, E. (2002)‘Housing provision andmarketization in 1980sand 1990s Japan: Anew stage of theaffordability problem?’in G. Dymski and D.Isenberg (eds) SeekingShelter on the PacificRim: FinancialGlobalization, SocialChange and theHousing Market. M.E.Sharpe, London andNew York
Okonkwo, O. (2002)‘Financing of housingfor low and middleincome groups inAfrica: The role ofgovernment’, Paperpresented at theInternationalConference on SocialHousing, UnitedNations HumanSettlementsProgramme, Ministryof Construction ofPeople’s Republic ofChina and BaotouMunicipalGovernment, Baotou,People’s Republic ofChina
Okpala, D. (1994)‘Financing housing indeveloping countries:A review of the pitfallsand potentials in thedevelopment of formalhousing financesystems’ Urban Studies31(9): 1571–1586
Okwir, N. J. (2002)‘Lessons learnt so farfrom housing financeoperations experiencesin Uganda: What theseexperiences portendfor the realisation ofadequate shelter forall’ in UN-Habitat (ed)Financing AdequateShelter for All:Addressing the HousingFinance Problem inDevelopmentCountries, UN-Habitat,Nairobi: 93–98
Pacheco, M. F. (2003) ‘Co-financed housingimprovement program’SELAVIP Journal ofLow-income Housing inAsia and the World,October: 40–44
Pardo, C. A. (2000)‘Housing finance inChile: The experiencein primary andsecondary mortgagefinancing’, SustainableDevelopmentDepartment TechnicalPapers Series, Inter-American DevelopmentBank, Washington, DC
Patel, S. and C. D’Cruz(1993) ‘The MahilaMilan crisis creditscheme: From a seedto a tree’ Environmentand Urbanization 5(1):9–17
Patel, S., C. D’Cruz and S.Barra (2002) ‘Beyondevictions in a globalcity: People-managedresettlement inMumbai’ Environmentand Urbanization14(1): 159–172
Patel, S. and D. Mitlin(2004) ‘Grassroots-driven development:The alliance of SPARC,the National SlumDwellers Federationand Mahila Milan’ inD. Mitlin and D.Satterthwaite (eds)Empowering SquatterCitizen. Earthscan,London: 216–244
Payne, G. and M. Majale(2004) The UrbanHousing Manual:Making RegulatoryFrameworks Work forthe Poor. Earthscan,London
PDM (Programme deDéveloppementMunicipal) (1998)‘L’équilibre financierdes collectivitéslocales’, Observatoiredes Finances Locales,Cotonou, Benin, 16p
PDM (1999a) ‘Regard surles finances localesdans les pays del’UEMOA’ Programme1999, Cotonou, Benin,p19
PDM (1999b) ‘L’équilibrefinancier descollectivités locales’,mimeo,16p.
PDM (2000) ‘L’équilibre’financier descollectivités locales,Observatoire desFinances Locales,Cotonou, 2000, p16
236 Financing Urban Shelter
PDM (2001a) Gérerl’économie localementen Afrique – Evaluationet prospective del’économie locale.Manuel, Tome 1, p64
PDM (2001b) ‘Regard surles économies locales,Une approcherenouvelée sur lesstratégies dedéveloppement enAfrique de l’ouest’ LesCahiers du PDM, No. 3Avril
Pettis, M. (2001) TheVolatility Machine.Oxford UniversityPress, New York
Pickering, N. (2000), TheSOFOLES: NicheLending or NewLeaders in the MexicanMortgage Market?Joint Center forHousing Studies at theUniversity of Harvard,Harvard, US
Pitt, M. and S. Khandker(1998) ‘The impact ofgroup-based creditprograms on poorhouseholds inBangladesh: Does thegender of participantmatter?’ Journal ofPolitical Economy106(5): 958–995
Porio, E. (1998)ReexaminingPartnerships in SocialHousing: State–CivilSociety Dynamics inSoutheast Asia.Proceedings of theInternationalConference on theOccasion of the FirstGeneral Assembly ofthe Forum of Researchon HumanSettlements, Geneva,6–8 July,www.gruppo–cerfe.org/pdf/porio.pdf
Porio, E. with C. S. Crisol,N. F. Magno, D. Cidand E. N. Paul (2004)‘The CommunityMortgage Programme:An innovative socialhousing programme inthe Philippines and itsoutcomes’ in D. Mitlinand D. Satterthwaite(eds) EmpoweringSquatter Citizen.Earthscan, London:54–81
Priemus, H. and F.Dieleman (2002)‘Social housing policyin the EuropeanUnion: Past, presentand perspectives’Urban Studies 39(2):191–200
PRODEL (Programa deDesarollo Local) (2002)Newsletter: ImprovingLivelihoods, PRODEL,Managua
PRODEL (2004)Newsletter April,PRODEL, Managua
Proxenos, S. (2002)‘Homeownership rates:A global perspective’Housing FinanceInternational17(December): 3–7
Prugl, E. (1996) ‘Biases inlabour law: A critiquefrom the standpoint ofhome-based workers’in E. Boris and E. Prugl(eds) Homeworkers inGlobal Perspective:Invisible No More.Routledge, New Yorkand London: 203–217
Pugh, C. (1994)‘Development ofhousing finance andthe global strategy forshelter’ Cities 11(6):384–392
Pugh, C. (1995) ‘The roleof the World Bank inhousing’ in B. C.Aldrich and R. S.Sandhu (eds) Housingthe Urban Poor: Policyand Practice inDeveloping Countries.Zed Books, London
Pugh, C. (1997) ‘Povertyand progress?Reflections on housingand urban policy indeveloping countries’Urban Studies 34(10):1547–1595
Pugh, C. (2001) ‘Thetheory and practice ofhousing sectordevelopment fordeveloping countries,1950–1999’ HousingStudies 16(4):399–423
Rahman, A. (1999)‘Micro-creditInitiatives for equitableand sustainabledevelopment: Whopays?’ WorldDevelopment 27(1):67–82
Rakodi, C. and T. Lloyd-Jones (eds) (2002)Urban Livelihoods: APeople-centredApproach to ReducingPoverty. Earthscan,London
Ratha, D. (2003) Workers’Remittances: AnImportant and StableSource of ExternalDevelopment Finance.World Bank,Washington, DC
Rees, W. (1992)‘Ecological footprintsand appropriatedcarrying capacities:What urban economicsleaves out’Environment andUrbanization 4(2):121–130
Renaud, B. (1984)‘Housing and financialinstruments indeveloping countries:An overview’, WorldBank Staff WorkingPapers No 658, WorldBank, Washington DC
Renaud, B. (1999) ‘Thefinancing of socialhousing in integratingfinancial markets: Aview from developingcountries’ UrbanStudies 36(4): 755–773
Republic of South Africa(1996) TheConstitution of theRepublic of SouthAfrica. Republic ofSouth Africa, availableat www.acts.co.za/constitution/
Roberts, B. and M. A.Cohen (2002)‘Enhancing sustainabledevelopment by triplevalue adding to thecore business ofgovernment’ EconomicDevelopment Quarterly16(2): 127–137
Roberts, J. (2005)‘MilleniumDevelopment Goals:Are internationaltargets now morecredible?’ Journal ofInternationalDevelopment 17(1):113–129
Robinson, K. (2001) ‘Bigplayers jockey forposition inmicrolending market’The Banker 151(903):80
Rodwin, L. and B. Sanyal(1987) ‘Shelter,settlement anddevelopment: Anoverview’ in L. Rodwin(ed) Shelter, Settlementand Development.Allen and Unwin,Boston
Rogaly, B. (1996) ‘Micro-finance evangelism,“destitute women” andthe hard selling of anew anti-povertyformula’ Developmentin Practice 6(2):100–112
Rojas, E. (2004) ‘Housingfinance in LatinAmerica’, Presentationto the 25th WorldCongress, InternationalUnion for HousingFinance, Brussels, June
Rome, A (2001) TheBulldozer in theCountryside: SuburbanSprawl and the Rise ofAmericanEnvironmentalism.Cambridge UniversityPress, New York
Rubenstein, J. (2002)‘Regional overview ofLatin America’ in UN-Habitat (ed) FinancingAdequate Shelter forAll: Addressing theHousing FinanceProblem inDevelopment Countries.UN-Habitat, Nairobi:15–16, 141–146
Sahn, D. E. and D. C.Stifel (2003) ‘Progresstowards theMillenniumDevelopment Goals inAfrica’ WorldDevelopment 31 (1):23–53
Sánchez-Campos, T.(2004) Revolving Fundfor the Promotion ofSmall Hydro ElectricSchemes: A PublicPrivate InvestmentModel, mimeo, ITDG,Los Angelos
Sassen, S. (2001) TheGlobal City. PrincetonUniversity Press,Princeton
Sassen, S. (ed) (2002)Global Networks,Linked Cities.Routledge, for theUnited NationsUniversity andInstitute for AdvancedStudies, New York
237References
Satterthwaite, D. (2000)‘The roles of donorsand developingagencies in combatingpoverty, inequity andpolarization in aglobalizing world’,Background paperprepared for the 2001Global Report onHuman Settlements
Satterthwaite, D. (2004a)‘The MillenniumDevelopment Goalsand poverty reduction’in D. Satterthwaite(ed) The MillenniumDevelopment Goals andLocal Processes: Hittingthe Target or Missingthe Point? IIED,London
Satterthwaite, D. (2004b)‘The under-estimationof urban poverty in lowand middle-incomenations’, PovertyReduction in UrbanAreas Series WorkingPaper 14, IIED, London
Scanlon, K. and C.Whitehead (2004)‘Cross country trendsin tenure and finance’in European MortgageFederation (ed)Hypostat 2003:European HousingFinance Review.European MortgageFederation, Brussels:14–20
Schlyter, A. (2003) ‘Multi-habitation: Urbanhousing and everydaylife in Chitungwiza,Zimbabwe’, ResearchReport No 123,NordiskaAfrikainstitutet,Uppsala
Schumacher, E. F. (1973)Small Is Beautiful: AStudy of Economics asif People Mattered.Harper and Row, NewYork
Seki. M. and M. Watanabe(1998) ‘Housingfinance and capitalmarkets in Indonesia’in M. Watanabe (ed)New Directions inAsian Housing Finance.International FinanceCorporation,Washington, DC:113–126
SELAVIP (ServicioLatinamericano y
Asiatico de ViviendaPopular) (2003) Journalof Low-income Housingin Asia and the World,October
SELAVIP (2004) ‘TheGungano Fundreconsidered’ Journalof Low-income Housingin Asia and the World,April: 129–134.
Septanti, D. (2004)‘Micro-credit systemfor housing finance incomprehensive KIP andsocial rehabilitation onslums area program inSurabaya’, Paperprepared for anInternational Workshopon Housing Finance,ACHR/IIED/CODI,Bangkok, June
Serageldin, M. (1990) TheImpact of Investmentsin Urban Infrastructureon Municipal Revenuesand the Integration ofInformal SectorActivities, reportprepared for TheOffice of Housing andUrban Programs USAgency forInternationalDevelopment.Cambridge, MA
Serageldin, M. et al(2003a) ‘Assessment ofParticipatory Budgetingin Brazil’. Paperprepared for the Inter-American DevelopmentBank, Cambridge, MA
Serageldin, M. et al(2003b) ‘LocalAuthority DrivenInterventions andProcesses’. Paperprepared for the UNMillennium ProjectTask Force 8 onImproving the Lives ofSlum Dwellers,Cambridge, MA
Serageldin M. (teamleader), Jones, D.,Vigier, F. and Solloso,E. with the assistanceof S. Bassett, B.Menon and L.Valenzuela (2004)Municipal FinanceConditions and Trends.Background paper forthe 2005 GlobalReport. Center forUrban DevelopmentStudies. HarvardSchool of Design,Cambridge, MA
Shah, A. and T. Thompson(2004) ImplementingDecentralized LocalGovernance: A Treacherous Roadwith Potholes, Detoursand Road Closures.Policy ResearchWorking Paper Series3353, World Bank,Washington, DC
Sharma, N. (2005) ‘Britishtech to help DJB stemhuge losses’,www.timesofindia.indiatimes.com/articleshow/990046.cms, accessed14 February 2005
Shelter Afrique (2002)‘Housing financeoperations in theAfrica region: Lessonslearnt and prospectsfor the realisation ofthe goal of adequateshelter for all’ in UN-Habitat (ed) FinancingAdequate Shelter forAll: Addressing theHousing FinanceProblem inDevelopmentCountries. UN-Habitat,Nairobi: 49–54
Shukla, V (1996)Urbanization andEconomic Growth.Oxford UniversityPress, New Delhi
Silas, J. (2004) ‘Housingfinance and the KIPmodel’, Paper preparedfor an InternationalWorkshop on HousingFinance,ACHR/IIED/CODI,Bangkok, June
Singh Maini, T. (2004)‘Tamil Nadu UrbanDevelopment Fund’IADF Bulletin, 1(1),March: available atwww.developmentfunds.org/news.htm
Skinner, R. J. and M. J.Rodell (1983) People,Poverty and Shelter.Methuen, London
Smets, P. (2002) HousingFinance and the UrbanPoor: Building andFinancing Low-incomeHousing in Hyderabad,India. Vrije University,India
Solis, E. and E. Ortiz(2002) ‘Cities andsocial housingdevelopment andmanagement:
Successful models,Mexico City’s housingpolicy – new focuses’in UN-Habitat (ed)Financing AdequateShelter for All:Addressing the HousingFinance Problem inDevelopmentCountries, UN-Habitat,Nairobi: 155–164
Sood, R. (2003) ‘A NewDelhi slum residentworks to improve herneighbourhood’ HabitatDebate, 9(1),April:14–15
Speak, S. and G. Tipple(2004) ‘Housing andhomelessness indeveloping countries’in D. Levinson (ed)Encyclopedia ofHomelessness. SagePublications, ThousandOaks, California, andLondon: 270–277
Steffensen, J. and P.Tidemand (2004) A Comparative Analysisof Decentralisation inKenya, Tanzania andUganda: Final SynthesisReport. Reportprepared for the WorldBank, Washington, DC
Stein, A. (2004)‘Participation andsustainability in socialprojects: Theexperience of the LocalDevelopmentProgramme inNicaragua’ in D. Mitlinand D. Satterthwaite(eds) EmpoweringSquatter Citizen.Earthscan, London:112–138
Stein, A. with L. Castillo(2005) ‘Innovativefinancing for low-income housingimprovement: Lessonsfrom programmes inCentral America,Environment andUrbanization 17(1):25–39
Stephens, M. (2002)‘International modelsof housing finance:Housing systems inWestern and TransitionEconomies’ in HousingFinance in TransitionEconomies. OECD,Paris: 175–182
Stephens, M. (2003)‘Globalisation and
238 Financing Urban Shelter

housing financesystems in advancedand transitioneconomies’ UrbanStudies 40(5–6):1011–1026
Stephens, M. (2004)Housing Finance,‘Reach’ and Access toOwner-Occupation inWestern Europe,mimeo, York
Struyk, R. (ed) (1997)Restructuring Russia’sHousing Sector:1991–1997. The UrbanInstitute, Washington,DC
Stuart, I., B. Badcock, A.Clapham and R.Fitzgerald (2004)‘Changing tenure:Housing trends,financial deregulationand housing policy inNew Zealand since1990’ Housing FinanceInternational June:3–10
Suresh, V. (2002)‘Strategies forfinancing housing forlow-income groups andthe poor: Experiencesfrom Asian countries’in UN-Habitat (ed)Financing AdequateShelter for All:Addressing the HousingFinance Problem inDevelopmentCountries, UN-Habitat,Nairobi: 107–135
Susilastuti, D. H. (1996)‘Home-based work as arural survival strategy:A central Javaneseperspective’ in E. Borisand E. Prugl (ed)Homeworkers in GlobalPerspective: InvisibleNo More. Routledge,New York and London:129–141
Tacoli, C. (1998).‘Bridging the divide:Rural–urbaninteractions andlivelihood strategies’London, GatekeeperSeries, No 77, IIEDSustainable Agricultureand Rural LivelihoodsProgramme,International Institutefor Environment andDevelopment, London
Taylor-Hayford, K. (2002)‘Funding mechanismsfor low income housing
in the United States ofAmerica’, Paperpresented at theInternationalConference on SocialHousing, UnitedNations HumanSettlementsProgramme, Ministry ofConstruction ofPeople’s Republic ofChina and BaotouMunicipal Government,Baotou, People’sRepublic of China
Thorp, R., F. Stewart andA. Heyer (2005)‘When and how far isgroup formation aroute out of chronicpoverty?’ WorldDevelopment 33(6):907–920
Tipple, A. G. (1988) TheHistory and Practice ofRent Controls inKumasi, Ghana. WorldBank, Washington, DC
Tipple, A. G. (1994) ‘Amatter of interface:The need for a shift intargeting housinginterventions’ HabitatInternational 18(4):1–15
Tipple, A. G. (1995) ‘DearMr President, housingis good fordevelopment’ NorskGeografisk Tidsschrift49(4): 175–186
Tipple, A. G. (2000)Extending Themselves:User InitiatedTransformations ofGovernment BuiltHousing in DevelopingCountries. LiverpoolUniversity Press,Liverpool, UK
Tipple, A. G. (2005) ‘Theplace of home-basedenterprises in theinformal sector:Evidence fromCochabamba, NewDelhi, Surabaya andPretoria’ Urban StudiesApril: 42(4): 1–15
Tipple, A. G. and D.Korboe (1998)‘Housing policy inGhana: Towards asupply-orientedapproach’ HabitatInternational 22(3):245–257
Tipple, A. G., D. Korboe,G. Garrod and K. Willis(1999) ‘Housing supply
in Ghana: A study ofAccra, Kumasi andBerekum’ Progress inPlanning D 51: 324
Tipple, A. G. and K. G.Willis (1991) ‘Tenurechoice in a WestAfrican city’ ThirdWorld Planning Review13(1): 27–45
Tjonneland, E. N., H.Harboe, A. M. Jerveand N. Kanji (1998)The World Bank andPoverty in Sub-SaharanAfrica: A Study ofOperationalizingPolicies for PovertyReduction. ChrMichelsen Institute incooperation withCROP, Bergen
Tomlinson, M. R. (2001)‘New housing deliverymodel: Thepresidential jobsummit housing pilotproject’ HousingFinance InternationalDecember: 24–29
Tucker, R. and M.Tomlinson (2000) TheImplications ofGlobalisation onHousing Finance forLow-incomeHouseholds in SouthAfrica. Report preparedfor UNCHS (Habitat),Nairobi
Turner, B. (ed) (1988)Building Community: AThird World Casebook.Habitat InternationalCoalition, London
Turner, B. and C.Whitehead (2002)‘Reducing housingsubsidy: Internationallessons from theexperience of Sweden’in UN-Habitat (ed)Financing AdequateShelter for All:Addressing the HousingFinance Problem inDevelopmentCountries, UN-Habitat,Nairobi: 171–189
Turner, J. F. C. (1967)‘Barriers and channelsfor housingdevelopment inmodernizing countries’Journal of theAmerican Institute ofPlanners May:167–181
Turner, J. F. C. (1968)‘Housing priorities,
settlement patternsand urbandevelopment inmodernising countries’Journal of theAmerican Institute ofPlanners November:354–363
Turner, J. F. C. (1972)‘Housing issues andthe standardsproblems’ Ekistics 196:152–158
Turner, J. F. C. (1976)Housing by People:Towards Autonomy inBuilding Environments.Ideas in Progress.Marion Boyars, London
Turner, J. F. C. and R.Fichter (eds) (1972)Freedom to Build.Macmillan, London
UN (United Nations)(1948) UniversalDeclaration of HumanRights. United Nations,New York
UN (1966) InternationalCovenant onEconomic, Social andCultural Rights. UnitedNations Committee onEconomic, Social andCultural Rights,General AssemblyResolution 2200A(XXI) of 16 December,New York
UN (1976) Report ofHabitat: United NationsConference on HumanSettlements. UnitedNations, New York
UN (1987) Realization ofthe Right to AdequateHousing: Resolution42/146. UnitedNations GeneralAssembly, New York, 7December.
UN (1992) RioDeclaration. UnitedNations Conference onEnvironment andDevelopment(UNCED), Rio deJaneiro, Brazil, 3–14June
UN (1993) ViennaDeclaration. WorldConference on HumanRights, Vienna, Austria,14–25 June
UN (1995a) BeijingDeclaration. FourthWorld Conference onWomen, Beijing,Peoples Republic ofChina, 4–15 September
239References

UN (1995b) Programmeof Action of the WorldSummit on SocialDevelopment. WorldSummit for SocialDevelopment,Copenhagen,Denmark, 6–12 March
UN (1996a) Report of theUnited NationsConference on HumanSettlements (HabitatII). United NationsSales publication, SalesNo E.97.IV.6, NewYork
UN (1996b) HabitatAgenda and IstanbulDeclaration. SecondUnited NationsConference on HumanSettlements (HabitatII), Istanbul, Turkey,3–14 June
UN (2000) United NationsMillenniumDeclaration. A/55/L.2adopted at 55thsession under agendaitem 61(b) called ‘TheMillennium Assemblyof the United Nations’
UN (2001a) DurbanDeclaration on Racism,Racial Discrimination,Xenophobia andRelated Intolerance.World Conferenceagainst Racism, RacialDiscrimination,Xenophobia andRelated Intolerance,Durban, South Africa,31 August–8September
UN (2001b) Declarationon Cities and OtherHuman Settlements inthe New Millennium,available atwww.unhabitat.org/istanbul+5/declaration_cities.htm
UN (2002) Financing forDevelopment: Buildingon Monterey. UnitedNations, New York
UN (United Nations)Millennium Project(2003) ‘Backgroundpaper of the Task Forceon Improving the Livesof Slum Dwellers’,April 18
UN Millennium Project(2005a) Task Force 8Report: A Home in theCity. UNDP, New York
UN Millennium Project(2005b) Investing in
Development: APractical Plan toAchieve the MillenniumDevelopment Goals.Overview. UNDP, NewYork
UN Millennium Report(2000) We the Peoples:The Role of the UnitedNations in the 21stCentury. Report of theSecretary-General ofthe United Nations,available atwww.un.org/millennium/sg/report/
UN Population Division(2004) WorldUrbanization Prospects:The 2003 Revision.United Nations, NewYork
UNCED (United NationsConference onEnvironment andDevelopment) (1992)Agenda 21, ‘Chapter 7:Promoting sustainablehuman settlementdevelopment’. UNCED,Rio de Janeiro, 14 June
UNCHS (United NationsConference on HumanSettlements) (1976)The VancouverDeclaration on HumanSettlements and theVancouver Action Plan.UNCHS (Habitat),Nairobi
UNCHS (1987) GlobalReport on HumanSettlements 1986.Oxford UniversityPress for UNCHS(Habitat), Oxford
UNCHS (1990a) TheGlobal Strategy forShelter to the Year2000. UNCHS(Habitat), Nairobi
UNCHS (1990b) Shelterfor All: The GlobalStrategy for Shelter tothe Year 2000, UNCHS(Habitat), Nairobi
UNCHS (1993a)Public/PrivatePartnerships inEnabling ShelterStrategies. UNCHS(Habitat), Nairobi,www.hq.unhabitat.org/programmes/housingpolicy/publications.asp
UNCHS (1993b) ShelterSector PerformanceIndicators. UNCHS(Habitat), Nairobi
UNCHS (1994)Sustainable HumanSettlementsDevelopment:Implementing Agenda21. Report prepared forthe Commission onSustainableDevelopment, UNCHS(Habitat), Nairobi
UNCHS (1996) AnUrbanising World:Global Report onHuman Settlements1996. OxfordUniversity Press,Oxford
UNCHS (1997) Shelter forAll: The Potential ofHousing Policy in theImplementation of theHabitat Agenda,UNCHS (Habitat),Nairobi,www.unhabitat.org/programmes/housingpolicy/publications.asp
UNCHS (1998a)Implementation of theHabitat Agenda:Guidelines for theUnited NationsResident CoordinatorSystem. UNCHS(Habitat), Nairobi,www.unchs.org/unchs/english/hagenda/guide1/contents.htm
UNCHS (1998b)Financing Cities forSustainableDevelopment: WithSpecific Reference toEast Africa. UNCHS,Nairobi
UNCHS (2001) Cities in aGlobalising World:Global Report onHuman Settlements,2001. UNHCS/Earthscan, London
UNCHS/ILO (InternationalLabour Organization)(1995) ShelterProvision andEmploymentGeneration. UnitedNations Centre forHuman Settlements(Habitat), Nairobi;International LabourOffice, Geneva
UNCTAD (United NationsConference on Tradeand Development)(2003) Trade andDevelopment Report.United Nations, NewYork and Geneva
UNCTAD (2004) Tradeand DevelopmentReport. UnitedNations, New York andGeneva
UNDP (United NationsDevelopmentProgramme) (1991)Cities, Poverty andPeople: UrbanDevelopmentCooperation for the1990s. UNDP, NewYork
UNDP (2004) HumanDevelopment Report.UNDP/OxfordUniversity Press, NewYork
UNDP (undated) GlobalLearning Network,www.undp.org/pppue/gln/, accessed on 11December 2004
UN-Habitat (2002)Housing RightsLegislation: Review ofInternational andNational LegalInstruments. UN-Habitat and Office ofthe HighCommissioner forHuman Rights, Nairobi
UN-Habitat (2003a) TheChallenge of Slums:Global Report onHuman Settlements.Earthscan/UN-Habitat,London
UN-Habitat (2003b) Slumsof the World: The Faceof Urban Poverty in theNew Millennium. UN-Habitat, Nairobi
UN-Habitat (2003c) RentalHousing: An EssentialOption for the UrbanPoor in DevelopingCountries. UN-Habitat,Nairobi
UN-Habitat (2004) Stateof the World’s Cities:Globalization andUrban Culture.Earthscan/UN-Habitat,London
United Nations Handbook2003 (2003) NewZealand Ministry ofForeign Affairs andTrade, Wellington
USAID (US Agency forInternationalDevelopment) (1996)The Housing IndicatorsProgram: RegionalHousing IndicatorsDatabase in theTransitional Countries
240 Financing Urban Shelter
of Central and EasternEurope. USAID,Washington, DC
Van der Rest, J. (2003)‘The poor first dwell,then build’ SELAVIPNewsletter, Journal ofLow-income Housing inAsia and the World,10: 5–8
Van Order, R. (2001) ‘Thestructure andevolution of Americansecondary mortgagemarkets, with someimplications fordeveloping markets’Housing FinanceInternationalSeptember: 16–31
Van Rooyan, O. (2004)The Kuyasa Fund,mimeo
Vance, I. (2004) ‘Land andcollateral issues: Theasset dimension ofhousing micro-finance’in F. Daphnis and B.Ferguson (eds) HousingMicro-finance: A Guideto Practice. KumarianPress Ltd., Bloomfield,US: 123–150
Wahba, S. (2001) ‘Fromland redistribution tointegrateddevelopment: Theevolution and impactof shelter and povertyalleviation strategies inmarginalizedsettlements inNouakchott,Mauritania’, Paperpresented to the ThirdAnnual GlobalDevelopment NetworkConference, Brazil9–12 December
Ward, P. M. (ed) (1982)Self–help Housing: aCritique. Mansell,London
Watanabe, M. (ed) (1998)New Directions inAsian Housing Finance.International FinanceCorporation,Washington, DC
WCED (WorldCommission onEnvironment andDevelopment) (1987)Our Common Future.Oxford UniversityPress, Oxford
Weru, J. (2004)‘Communityfederations and city
upgrading: The work ofPamoja Trust andMuungano in Kenya’Environment andUrbanization 16(1):47–62
Whitehead, C. M. E.(2003) ‘Financingsocial housing inEurope’ HousingFinance InternationalJune: 3–8
Whittington, D., D. T.Lauria and X. Mu(1990) Paying forUrban Services: AStudy of Water Vendingand Willingness to Payfor Water in Onitsha,Nigeria. World Bank,Washington, DC
Williams, P. (2004) ‘Thechallenges ofaffordable housing’ inIntroducing the Issues:16 Expert Views.Presented atInternational Union ofHousing Finance 25thWorld Congress, June2004: 20–21
Willis, K. G. and A. G.Tipple (1991)‘Economics ofmultihabitation:Housing conditions,household occupancyand householdstructure under rentcontrol, inflation andnonmarketability ofownership rights’World Development19(12): 1705–1720
World Bank (1980)Shelter, Poverty andBasic Needs. WorldBank, Washington, DC
World Bank (1983)Learning by Doing.World Bank,Washington, DC
World Bank (1989)Financial Systems andDevelopment. OxfordUniversity Press forthe World Bank,Oxford
World Bank (1991) UrbanPolicy and EconomicDevelopment: AnAgenda for the 1990s.World Bank,Washington, DC
World Bank (1992) WorldDevelopment Report.Oxford UniversityPress, New York
World Bank (1993)Housing: EnablingMarkets to Work.World Bank PolicyPaper, World Bank,Washington, DC
World Bank (1994) WorldDevelopment Report.Oxford UniversityPress, New York
World Bank (1999) ‘Newstudy confirmsbenefits ofBangladesh’smicrocredit programs’,www.worldbank.org/html/extdr/extme/2063.htm, accessed on2 May 2002
World Bank (2003a) Sub-Sovereign CreditAccess andInfrastructureFinancing In Four EastAsian Countries:China, Philippines,Indonesia, and Vietnam– Phase One: AReconnaissance. WorldBank, Washington, DC
World Bank (2003b)‘Tamil Nadu UrbanDevelopment Fund(TNUDF)’, Power pointpresentation graciouslycontributed byprogram officers,March 2003
World Bank (2004a) IBRDProgram Document fora ProposedProgrammatic Loan tothe Amount of US$100Million to the UnitedMexican States forAffordable Housing andUrban Poverty SectorAdjustment Loan,Report no 27627–MX.World Bank,Washington, DC
World Bank (2004b)Project InformationDocument, ConceptStage – PakistanHousing FinanceProject. World Bank,Washington, DC
World Bank (2004c) ‘TotalGDP 2003’,www.worldbank.org/data/databytopic/GDP.pdf, accessed 8 March2005
World Bank (2004d)Concept Memoranda(CM) ProposedRepeater Project, ThirdTamil Nadu Urban
Development Project(TNUDP III). WorldBank, Washington, DC,7 May 2004
World Bank (2004e) WorldDevelopment Indicators2004. World Bank,Washington, DC
World Bank (2005) GlobalEconomic Prospects2005. World Bank,Washington, DC
Yasui, T. (2002a)‘Summary of themeeting’ in HousingFinance in TransitionEconomies. OECD,Paris: 7–16
Yasui, T. (2002b) ‘Housingfinance in transitioneconomies’ in HousingFinance in TransitionEconomies, OECD,Paris: 17–36
Yunus, M. (1997) ‘TheGrameen Bank story:Rural credit inBangladesh’ in A.Krishna, N. Uphoff andM. J. Esman (ed)Reasons for Hope:Instructive Experiencesin Rural Development.Kumarian Press,London: 9–24
Zaltzman, M. (2003)‘Mexican mortgagemarket – access tohousing’ HousingFinance InternationalDecember: 21–24
Zaman, H. (2004) ‘Thescaling up of micro-finance in Bangladesh:Determinants, impactsand lessons’, WorldBank Policy ResearchWorking Paper 3398,World Bank,Washington, DC
Zehnder, A. (2004)‘Savings mobilizationthrough contractualsavings schemes forhousing’ in Introducingthe Issues: 16 ExpertViews. Presented atInternational Union ofHousing Finance 25thWorld Congress, June2004: 30–31
Zhao, Y. and S. C.Bourassa (2003)‘China’s urban housingreform: recentachievements and newinequities’ HousingStudies 10(5):721–744
241References
Abidjan, Côte D’Ivoire,revenue serviceconcessions 48
accessfinancial institutions 41–2financial services 99–101infrastructure services 12mortgage finance 154–5mortgage finance loans
76–7accountability
municipal spendingpatterns 45–7
see also financeadequate housing,
affordability 165adequate shelter 163–4affordability
housing 79, 81–3microfinance 117shelter xlvshelter finance systems
assessments 140–2Africa
basic economic indicators(B.6) 202
demographic indicators(A.1) 186
energy and transportinfrastructure (B.8) 207
environmentalinfrastructure (B.5)199–200
growth 4households
consumption indicators(B.4) 197–8total and rate of change(B.3) 195
investment; infrastructureand foreign direct (B.7)204–5
population; size and rate ofchange (B.2) 192
shelter indicators (A.2)187
social indicators (A.3)188, (B.9) 209
urban agglomerations;population size and rateof change (C.1) 212
urbanization; urbanpopulation; urban slumdwellers (B.1) 189
aid, internationaldevelopment 7–8
Asiabasic economic indicators
(B.6) 202demographic indicators
(A.1) 186energy and transport
infrastructure (B.8)207–8
environmentalinfrastructure (B.5) 200
householdsconsumption indicators(B.4) 198total and rate of change(B.3) 195–6
investment; infrastructureand foreign direct (B.7)205
population; size and rate ofchange (B.2) 192–3
shelter indicators (A.2)187
social indicators (A.3)188, (B.9) 209–10
urban areas; populationand rate of change(C.1) 212–15
urbanization; urbanpopulation; urban slumdwellers (B.1) 189–90
assets, urban valuation 8
Bangkok, infrastructure 6Bangladesh
Grameen Bank loanpackage 116, 141
House Building FinanceCorporation 73
basic economic indicators(B.6) 202–4
betterment levies 149betterment taxes, municipal
finance 37, 40Bolivia, shelter loans 104‘booms and busts’, housing
market 84borrowing
challenges 41management 149–50municipal finance 40–2
Boston, United States,linkage fees 37
Brazilfiscal responsibility law 46foreign investment 14National Fund for Popular
Housing 92participatory budgeting 44
bridging finance, communityfunds 127–8
Brown agenda, sustainability25–6
budgeting participatory,resource improvement150
budgets, public 14Build Together Programme,
Namibia 126building codes 9–10building materials
credit 160higher incomes 170sustainable shelter 166
building research 19business, taxes 38–9
Cambodia, Urban PoorDevelopment Fund 121
capitalhigher incomes 169–70lower house prices
169–70sustainable shelter 165
capital budgets, multi-year,municipal spendingpatterns 44
capital finance, sources xlii,112–13
capital markets, borrowing41–2
charging, local services 150charity, low-income housing
160Chile, housing subsidies 93,
96China
foreign direct investment14
Guangzhou Province,homeownership 73
housing finance 73Housing Provident Fund
73population forecasts 4right to buy 91SPVs 37
citieseconomic growth 6financial needs 6maintenance improvement
150population 3
citizens, project beneficiaries23
city authorities 147–8city life, costs 163CMP see Community
Mortgage Programmeco-operative housing 167collateral
community funds 131–2microfinance 114–15
collective action, savings 130Columbia, housing subsidies
93commercial centres, income
generation 133–4Community based finance,
lowest income groups30
community fund electricityservices, Peru 125
community funds 120–36long term strategy 134shelter xxvi
Community MortgageProgramme (CMP) 141
Philipines 124, 132, 161community-based
funding mechanisms160–1
housing finance xxvi
initiatives, joint funding48
Community-led InfrastructureFinancing Facility(CLIFF) 108, 159, 161
construction industry 19–20project beneficiaries 23
Consultative group to Assistthe Poor (CGAP) 102
contractor financing 153contractual savings schemes
78corruption elimination,
resource improvement151
cost of lending, reduction154
Costa Rica, subsidies 94Côte d’Ivoire, taxation 40credit enhancement,
borrowing 41–2
debtfinancial constraint
reduction 153–4management 149–50service 13swaps 149
decentralizationmunicipal finance 50service delivery 50
default, low-incomeborrowers 159
deforestation, Africa 7delayed repayment,
community funds128–9
delivery, sustainable shelter167–8
demographic framework 3–4demographic indicators (A.1)
186design
higher incomes 170sustainable shelter 167
developed/developing regionsdemographic indicators
186shelter indicators 187social indicators 188
developers, development153
developing countriesdemographic growth 3–4economic growth 11financial systems 36
developmentassistance, official 16exactions, municipal
finance 40sustainable 3–18
directcapital grants 154construction mortgage
finance 62–3subsidies community funds
127
INDEXNote: Prefix letters before page numbers 186 to 227 refer to detailed tables in the Statistical Annex.

direct-demand subsidies 95domestic resources,
sustainable shelter 172domestic savings xxiv
gross 13
Earth Summit, Rio de Janeiro1992 27
East Africa, local authoritytaxing powers 38
economic framework 5–7economic growth patterns
10–11economics, exogenous factors
6economies, urbanization 17Economist house price index
80Ecuador, Step-by-Step
programme 105El Salvador, land development
108–9emerging markets 16employment 6
poverty 12–13enabling strategy
1985–1987, housingpolicy 25
energy and transportinfrastructure (B.8)207–9
environment funds,municipal finance 42
environmental framework,sustainabledevelopment 7
environmental infrastructure(B.5) 199–202
EU see European UnionEurope
basic economic indicators(B.5) 202
demographic indicators(A.1) 186
energy and transportinfrastructure (B.8) 208
environmentalinfrastructure (B.5) 201
householdsconsumption indicators(B.4) 198–9total and rate of change(B.3) 196
investment; infrastructureand foreign direct (B.7)205–6
population; size and rate ofchange (B.2) 193
shelter indicators (A.2)187
social indicators (A.3)188, 210
urban areas; populationand rate of change(C.1) 215–16
urbanization; urbanpopulation (B.1) 190
European Union (EU)housing finance 145–6social housing funding 90
financeagencies, links 104–5capital global strategy 28framework, sustainable
development 7globalization 29–30homeownership Singapore
63
income generation 156mobilizing 9mortgage sources 58–9pro-poor systems 156providers, risks 10relationship-building
142–4resources, mobilization
xxx–xxxirisk assessment 144shelter for the poor 163small-scale contractors
xxivsocial housing xxvsocial and rental housing
87–97sustainability 1980–1989
23–4urban development 34–51
financial institutions,community funds 129
financial services, access99–101
financial shortage, location96–7
financing schemeslarge scale contractors
xxivsmall scale landlords xxiv
fiscal decentralizationprocess, Indonesia 36
fiscal responsibility law, Brazil46
Fondo Nacional deHabitaciones(FONHAPO), Mexico123
funding mechanisms,sustainable shelter 172
funding sources xliiifunds, shortage for
maintaining existingassets 44–5
gender, inclusion challenge135
global economy, volatility 6global outlook, summary 11globalization
connections and diversityxlvi
finance 29–30governance framework 9government, local authority
creditor 150–1Grameen Bank loan package,
Bangladesh 116, 141residential debt 66
guarantee funds, small loans105
guarantees xxvihousing microfinance 159mortgage finance 64–5
Habitat Agendanew millennium policies
30shelter finance
commitments 31health, improvement 118high-end poaching, shelter
policies 170–1higher incomes, lower house
prices 169–70Hogar de Cristo, Chile, social
housing 158homeownership xl–xli
Asia 71–4
China, Guangzhouprovince 73
encouragement xxivfinance 91–5Latin America 74–5northern countries 66–7rates 66southern countries 69–71sub-Saharan Africa 75–6transition countries 67–9young people 80–1
house building, supplyprocess 147
house improvement xxiiihouseholds
consumption indicators(B.4) 197–9
decision-making 152total and rate of change
(B.3) 195–7housing
finance 19, 29, 87–97house prices 79–80infrastructure 6lack of finance 145–6new, price elasticity 80policy 19–32requirements 5rights 30–2sector, SAPs 24services, institutional
capacity 27–8subsidies 56, 64, 93, 96
housing and basic services,selected cities (C.2)218–20
housing costs xxiii, 55, 155abatement l, 165increased demand 80reduction 152
housing development,lending strategies 101
Housing Development andFinance Corporation(HDFC), India 17
housing financeassessing demand 106low-income households,
India 100lower income households
79–84Mexico 74Peru 103scope 159–60small loans 109South Africa 57, 75state support 61–2see also microfinance;
mortgageshousing finance institutions,
funds 76housing and infrastructure,
finance 3housing market
informality problem 83systemic risks assessment
84housing microfinance, small
loans 158–9Housing Microfinance
Institutions (HMFIs)158–9
human capital development20
human developmentdemographic indicators
186shelter indicators 187
social indicators 188Hungary, subsidized
mortgage rate 64
incentives, taxation-related,mortgage finance 63
inclusion challenge,community funds134–5
incomedemographic indicators
186distribution 11–12regional inequality patterns
12shelter indicators 187social indicators 188
income and employment,urban development151
income generationcommunity funds 133–4microfinance 116–17
income-generatingenterprises, borrowing42
incremental development,shelter 99
incremental loans 156India
Housing Development andFinance Corporation 17
housing finance low-income households 100
mortgage rate 64municipal finance transfers
38politicization of housing
finance 92population forecasts 4Self Employed Women’s
Association (SEWA)102, 114, 115
Indonesiaborrowing 41fiscal decentralization
process 36inequality, income
distribution 11–12informal development,
financial constraintreduction 153
informality problem, housingmarket 83
infrastructurehigher incomes 170housing 6standards 9–10sustainable shelter 166urban services, joint
funding 48infrastructure development,
savings 130institutional capacity, housing
services 27–8insurance
mortgage default 65mortgage finance 64–5
interest rate subsidiescommunity funds 128Mexico 64mortgage finance 63–4
interest ratescommunity funds 131microfinance 115mortgage finance 78–9
International FinanceCorporation, study 106
243Index
investment; infrastructureand foreign direct (B.7)204–6
investmentforeign 8, 14–15national public 8patterns 14–17private 15–16public 15
Kenyahousing co-operative 112sanitation fund 103
key issues findings andmessages xxiii–xxvi
Koreahousing finance
deregulation 72mortgage lending growth
72Kuyasa Fund, South Africa
159
land, sustainable shelter 166land delivery, municipal
finance 49–50land development,
microfinance 108–12land purchase, savings 130land-use planning, sustainable
shelter 166Latin America
basic economic indicators(B.6) 203–4
demographic indicators(A.1) 186
energy and transportinfrastructure (B.8) 208
environmentalinfrastructure (B.5) 201
growth 4homeownership 74–5households
consumption indicators(B.4) 198–9total and rate of change(B.3) 196–7
investment; infrastructureand foreign direct(B.7)206
population; size and rate ofchange (B.2) 193–4
shelter indicators (A.2)187
social indicators (A.3)188, (B.9) 210–11
urban areas; populationand rate of change(C.1) 216–17
urbanization; urbanpopulation, slumdwellers (B.1) 191
lenders increase xxvlending, characteristics 28lending strategies, housing
development 101linkage fees, Boston, United
States 37loan-to-value ratios (LTVs)
xxivmortgage finance 76–7
loansmortgage finance 62–3periods xxiv, 155
community funds132–3microfinance 115mortgage finance 76–7
small loans
housing xxvhousing microfinance158–9housing strategies 109shelter microfinance98–119short term xxv
Urban CommunityDevelopment Fund 133
local expenditure, structure45
local finance, balancing148–9
local government budgeting43–5
local organization, financesystems 144
local services, charging 150location
financial shortage 96–7market choice 96–7sustainable shelter 167
low incomes xxiiilow wages, sustainable
shelter 168–9low-income groups,
community funds 121lower house prices, higher
incomes 169–70lower housing prices, higher
incomes l
macroeconomic context,urban shelterdevelopment 10–18
macroeconomic orthodoxy24–5
macroeconomic performance,external factors 17
maintenance improvement,cities 150
Mali, foreign investment 8market choice, location 96–7market poaching, shelter
policies 170–2MDGs see millenium
development goalsMexico
Fondo Nacional deHabitaciones(FONHAPO) 123
housing finance 74housing interventions 104housing stock 70interest rate subsidies 64reducing lender risk 75remittances 111
Mibanco, Peru, microfinanceinstitution 103
microfinance 101–4collateral 114–15growth xliinterest rates 115loan periods 115savings 114security 114–15technical assistance
115–16women orientation 116see also finance
microfinance institution(MFI) 105–6
microlenders 110Millenium Development
Goals (MDGs)developing countries
targeted 4economic framework 7loans, affordability 146
local engagement 172,173
microfinance strategies,limitations 141
monitoring tools 32poverty reduction, report
166slum targets xxvii–xxxi
Millenium HousingCommission UnitedStates, affordablehousing 165–6
Millenium Project 166, 172millenium strategy xxxvMillenium Towns and Cities
Campaign 172mobilizing resources,
constraints 10money management, savings
130–1mortgage, default insurance
65mortgage availability, Western
Europe 83mortgage delivery system
home bundled 60unbundled 60
mortgage facilities xxivmortgage finance xxiv,
xxxvi–xxxvii, 55–86access 154–5capital access xlvdevelopment 28poaching shelter policies
171poverty 55–6recent trends 56–65regional analysis 65–76sources 58–9terms and conditions
76–8mortgage lending 59–79
terms and conditionsxxxviii–xxxix, 76
mortgage markets extensionxxiv
mortgages, lengths 77multi-occupancy housing
development xxivmunicipal capital finance
fund, importance 149municipal development
funds, borrowing 42municipal expenditure,
management 45municipal finance
effectiveness and impacts49–51
main issues 34–5national systems 35–6sources xxxv, 37–43
municipal services,privatization 47–9
municipal spending patternsxxxv–xxxvi, 43–7
municipalities, projectbeneficiaries 23
Namibia, Build TogetherProgramme 126
national financing, balancing148–9
National Fund for PopularHousing, Brazil 92
natural resources 7neighbourhood improvement
xli–xlii, 106–8see also slum upgrading
new millenium policies 30–1
New York, public housing 89NGOs (non-government
organizations)collateral and security 132community based funding
mechanisms 160–1community funds 121–4funding provision 157housing finance 103–4long term strategies,
community funds 134trust 19
Nicaragua, local development107
north, state rental housing88–90
Northern Americabasic economic indicators
(B.6) 204demographic indicators
(A.1) 186energy and transport
infrastructure (B.8) 209environmental
infrastructure (B.5) 201households
consumption indicators(B.4) 199total and rate of change(B.3) 97
investment; infrastructureand foreign (B.7) 206
population; size and rate ofchange (B.2) 194
shelter indicators (A.2)187
social indicators (A.3)188, (B.9) 211
urban areas; population,rate of change (C.1)217–18
urbanization; population;slum dwellers (B.1) 191
northern countries,homeownership 66–7
Oceaniabasic economic indicators
(B.6) 204demographic indicators
(A.1) 186energy and transport
infrastructure (B.8) 209environmental
infrastructure (B.5)201–2
householdsconsumption indicators(B.4) 199total and rate of change(B.3) 197
investment;infrastrucuture andforeign direct (B.7) 206
population; size and rate ofchange (B.2) 194
shelter indicators (A.2)187
social indicators (A.3)188, (B.9) 211
urban areas; populationand rate of change(C.1) 218
urbanization; urbanpopulation; urban slumdwellers B.1) 191
owner occupation, WesternEurope 1990–2000 67
244 Financing Urban Shelter
Pakistanwater improvements
funding 128participatory budgeting,
municipal spendingpatterns 44
partnerships for localdevelopment, newtrends 48–9
performance andproductivity, sectors 11
Perucommunity fund electricity
services 125housing microfinance 103land titles 69mortgage finance 69Step-by-Step programme
105Philippines
community mortgageprogramme 124, 132
housing subsidiesdistribution 64
Poland, contractual savingsschemes 78
policy directions, sustainableshelter finance systems147–62
policy reform, sustainableshelter 171–2
political commitment,sustainable shelter171–2
poor people, shelter financesystems assessments140–2
populationbelow poverty line 12,
(B.9) 209–11urban agglomerations
(C.1) 212–8urban growth 6 (B.1)world and regions; size
and rate of change(B.2) 192–4
poverty reduction,community funds 121
poverty reduction strategypapers (PRSPs) 32, 149
private financecosts 90urban development 150
privatizationmunicipal finance 51municipal services xxxvi,
47–9service delivery 51
productionhigher incomes 170sustainable shelter 167–8
programmes and budgetsmulti-year, resourceimprovement 150
project approachmunicipal finance trends
21shelter trends 21
project beneficiariesmunicipal finance 22–3shelter trends 22–3
property, taxes 38–9property tax systems,
strengthening 149providers
mortgage finance 56–8small loans 109–12
provincial finance, balancing148–9
public goods, financing 148public housing, New York 89public resources, sustainable
shelter 172public utilities, privatization
47public-sector deficits 148purchasing power, increasing
168–9purchasing power increase l
regional analysis, mortgagefinance 65–76
regional highlightsxxxvii–xxxviii
regulationspolicies 88subsidies 88
relocation alternatives,Thailand 130
remittances, small loans 160rental accommodation need
152–3rental housing 168
finance 87–97northern countries
xxxix–xlsouthern countries xl, 91transition countries xl
residential debt, GDP 66residential poaching, shelter
policies 171right to buy, China 91risks, low income households
10risks assessment, housing
market 84Russia, borrowing 41
sanitation fund, Kenya 103SAPs see structural
adjustment programmessavings
community funds 129–31financial constraint
reduction 153–4microfinance 114mortgage finance 77–8national economies 13
savings and collateral xliiSchultz, Theodore 20secondary markets, mortgage
finance 59–61secondary mortgage markets
154securing capital, microfinance
117–18security
community funds 131–2microfinance 114–15
Self Employed Women’sAssociation (SEWA),India 102, 114, 115
self helpmunicipal finance 21–2shelter trends 21–2
self-help housing 167service delivery, municipal
finance 49–50service providers, finance
148Shack or slum Dwellers
Federation (SDI) 160,161
shelterglobal strategy 26–7improvement 118incremental development
99
loans Bolivia 104new millenium policies
30–1policy and finance 19–34standards 9–10subsidies, reasons 87–8trends 1972–2004 21–8
shelter financeassessment of trends
xxxvi–xlivepilogue xlix–lHabitat Agenda 1996 31
shelter finance systemsassessment 139–46sustainability xlvii–xlix
shelter improvementstrategies, Thailand124–5
shelter indicators (A.2) 187shelter microfinance
challenges xlii–xliii, xlivsmall loans 98–119subsidies 113terms and conditions xliv
shelter policiesmarket poaching avoidance
170–2mortgage finance poaching
171residential poaching 171
Singapore, homeownershipfinance 63
Slovakia, contractual savingsschemes 78
slumsfamilies, New Delhi 168finance xxviipopulation 4, (B.1)upgrading xxix–xxx,
164–5microfinance 106–8projects 10
small loans see loanssmall loans, see also
microfinancesocial housing xl–xli, 157–8,
167–8finance xxv
social housing finance 87–97European Union (EU) 90
social indicators (A.3) 188,(B.9) 209–11
selected cities 224–7socio-behavioural framework
5South Africa
housing finance 57, 75housing market 79housing rights 32housing subsidies 93loan finance 112mortgage bond registration
costs 71mortgage finance down-
marketing problems 84uTshani fund 127
southern cities, rental market102
southern countrieshome ownership 69–71rental housing 91
special purpose vehicles(SPVs), China 37
SPVs see special purposevehicles
standards, sustainable shelter166–7
state agencies, communityfunds 121
state engagement, savings130
state funds, interest rates131
state rental housingnorth 88–90transition countries 90–1
state support, housingfinance 61–2
statistical analysis tables186–224
Step-by-Step programmeEcuador 105Peru 105
structural adjustmentprogrammes (SAPs) 24
sub-Saharan Africaborrowing 41homeownership 75–6
subsidiarity, principle 9subsidies xxv
Chile 93, 96Colombia 93Costa Rica 94pro-poor systems 156–7regulations 88shelter, reasons 87–8shelter microfinance 113South Africa 93
subsidized loans 157summary, executive xxxii–lsupply process, house
building 147sustainable development
3–18sustainable shelter,
mechanisms 164sustainable shelter finance
systems xliv–lsustainable urban shelter
163–73sustainablilty, Brown agenda
25–6Sweden, interest rate
subsidies 64systemic risks assessment,
housing market 84Szczecin, Poland, multi-year
capital investmentplanning 45
Tamil Nadu UrbanDevelopment Fund(TNUDF), India 43
target 11 realignmentxxviii–xxix
tax collection improvement149
tax yield, developingcountries 38–9
taxation, Côte d’Ivoire 40taxation related incentives
xxxviiitaxes
business 38–9property 38–9
technical assistancecommunity funds 133microfinance 115–16
tenure systems 39Thailand
government housing bank59
mortgage lending growth58
relocation alternatives130
shelter improvementstrategies 124–5
245Index

Urban CommunityDevelopment Office(UCDO) 132
transaction costs, reduction151
transfers, municipal finance37–8
transition countries, staterental housing 90–1
transparency, municipalspending patterns 45–7
UEMOA see West AfricanEconomic and MonetaryUnion
UMP see Urban ManagementProgramme
United Nations Conferenceon Human Settlements,Vancouver, first 1976 3
United Nations regionalgroups
demographic indicators186
shelter indicators 187social indicators 188
United States,homeownershipexpansion 69
urban areas; population andrate of change (C.1)212–18
urban assets, valuation 8–9Urban Community
DevelopmentFund loans 133Office (UCDO) Thailand
132urban housing cost xxiiiurban infrastructure 6urban infrastrucuture and
services xlvi–xlviiiUrban Management
Programme (UMP) 27Urban Poor Development
Fund, Cambodia 121urban poverty, community
funds 121urban services
accounting 46cost reduction 151infrastructure, joint
funding 48urban settings, economic
context xxxii–xxxviurban shelter development
3–10challenges xxxii–xxxiii
macroeconomic contextxxxiii–xxxiv, 10–18
urban transport andenvironment, selectedcities (C.3) 221–4
urbanization 3urbanization; urban
population; urban slumdwellers (B.1) 189–91
urbanization, income levelsxxviii
user fees, municipal revenues39–40
utilities agencies, projectbeneficiaries 23
uTshani fund, South Africa127
Vienna Declaration on HumanRights 31
waste, human, management7
water, management 7water improvements funding,
Pakistan 128West Africa, municipal
operating revenue 39West African Economic and
Monetary Union(UEMOA) 38
Western Europehousing affordability 79mortgage availability 83mortgage lending
1990–2003 68owner occupation
1990–2000 67whole-sector development,
1987 onwards 26women orientation,
microfinance 116world
demographic indicators186
households; total and rateof change 195
population; size and rate ofchange 192
shelter indicators 187social indicators 188urbanization; urban
population; urban slumdwellers 189
Zambia, housing finance,state involvement 58
246 Financing Urban Shelter