Settlements of Embankments in Soft Soils
18
Geotechnical Engineering Journal of the SEAGS & AGSSEA Vol 41 No.2 June 2010 ISSN 0046-5828 61 Settlements of Embankments in Soft Soils A. S. Balasubramaniam, H. Cai, D. Zhu, C. Surarak and E. Y. N. Oh Griffith School of Engineering Griffith University, Gold Coast, Australia E-mail: [email protected], [email protected], [email protected], [email protected], [email protected] ABSTRACT: The major part of this paper is on the challenges in predicting settlements in highway embankments and reclamation works in marine, deltaic and estuarine type of deposits. The emphasis is on practical aspects and the difficulties experienced in confidently estimating settlements even after a century of developments and contributions. The influence of the general geology and soil conditions is discussed in relation to the site investigation works and the establishment of soil profile models. The fundamentals of preloading techniques with and without prefabricated drains (PVD) as ground improvement measures are also included. The observational approach in evaluating PVD performance and settlement estimations is then made with emphasis on curtailing residual settlements. Finally, the latter part of the paper is devoted to the analytical and numerical solutions of the behaviour of piled supported approach embankments with transfer layers. Geogrid reinforced pile supported (GRPS) embankment system is studied with the analytical approaches of Terzaghi, BS8006 method and Hewlett and Randolph method. Additionally, numerical analyses are also made with the Plaxis software. 1. INTRODUCTION The major part of the work presented in this paper relates to the challenges in predicting settlements in marine, deltaic and estuarine type of soft soils under road and highway embankments and during reclamation works. The early work on Soft Bangkok Clay is described by Muktabhant et al. (1967), Moh et al. (1969) and Eide (1968 and 1977). A comparison is then made with the practice in SE Asia and in Australia wherever possible. Concentration is made on the use of preloading with and without prefabricated vertical drains (PVD) and the restriction of post-construction settlements. Most of the material presented here is related to actual project works where the first author is involved over a period of forty years. In these activities classical and simple theories in Soil Mechanics are used and lesser emphasis is given to the recent excellent developments of more refined approaches. The primary and secondary settlements are calculated using the notable and well established works of Terzaghi, Mesri and Hansbo. The first comprehensive volume on soft clay engineering was by Brand and Brenner (1981) at AIT as based on the International Symposium on Soft clays held in Bangkok in 1977. The ground improvement conference held in 1983 at AIT also gave great impetus in the development of this field in SE Asia (see Balasubramaniam et al., 1984). Bergado et al. (1996) had an excellent volume on soft ground improvement. The recent volume on case histories by Indraratna and Chu (2005) has excellent contributions by Hansbo, Moh and Lin, Indratana, Hsi, Wong, Chu, Massarsch, Terashi, Kitazume, and others, which are very valuable for practicing geotechnical engineers. The First Author’s experience generally lies in an observational approach and in interpreting laboratory test data and small scale and large scale field tests. The extensive use of CPT and CPTu have somewhat reduced the earlier emphasis made on the use of large number of boreholes to delineate the soft soil layer thicknesses. Also, it is the practice in SE Asia to conduct large number of index tests and water content determination and to use such data indirectly in estimating the soft clay layer thicknesses. While quality of undisturbed samples for laboratory tests and sophisticated triaxial stress path and other type of laboratory tests have been extensively researched, the current practice seems to avoid these sampling and testing procedures with a view to minimise the expenses on site investigation and design phases of the projects. However large scale field tests with the use of test embankments with and without PVD are still used heavily in practice. Here again perhaps the instrumentation used for the measurement of surface and sub-surface settlements, pore pressures and lateral movements are somewhat minimised to cope with the limited funds made available in site investigation works. Differential settlement is also a major issue in approach embankments adjacent to bridge abutments, culverts and other structures founded on piles. Such settlements will affect the performance of the pavement and can cause negative skin friction which imposes additional loads on the piles. Stringent settlement criteria are now imposed on many major highway and expressway projects and this then led to the latter part of the paper in studying the available closed form solutions and numerical methods on the design of pile supported approach embankments with transfer layers. Geogrid reinforced pile supported (GRPS) embankment system is studied with the analytical approaches of Terzaghi, BS8006 method and Hewllett and Randolph method. Numerical analyses are also made with the Plaxis software. 2. GENERAL GEOLOGY OF MARINE, DELTAIC AND ESTUARINE CLAYS The Soft Bangkok Clay (see Muktabant et al., 1967, Moh et al, 1969, Bergado et al., 1990, Moh and Lin, 2005, Seah, 2005) and the Muar Flat clays (Chan and Chin 1972, Ting and Ooi, 1977, Ting et al., 1987, Ting et al., 1989, Poulos et al., 1989, Nakase and Takemura, 1989; and Brand and Premchitt, 1989; Indraratna et al., 1992; and Loganathan et al., 1993) in Malaysia are marine clays and are very homogeneous and extend to great depths over a very large area. These deposits are studied extensively. The whole of Bangkok Plain has a carpet of soft clay spaning some 200 to 300km east west and some 400km north-south. Also, the thickness is relatively high. The estuarine clays in Queensland differ markedly from the marine deposits in. (i) They usually occur close to creeks and vary substantially in thicknesses and composition. (ii) The strength is very low. Notable highway projects in Thailand such as the Thon Buri Pak Tho Highway, the Bangna-Bangpakong Highway, Bangkok- Siracha Highway, Nakon Sawan Highway and others in the Bangkok Plain are such that the whole stretch of highway passes over the flat deltaic plain where the subsoil is soft marine clay. The age of this marine deposit is about 2000 years and it is considered as a recent deposit. The thickness of the soft clay in the Bangna- Bangpakong project varies from 15m at Bangna to 25m at km 28 from Bangpakong. This layer is underlain by stiff clay of 4 to 10m thick, followed by a dense to very dense sand. A weathered crust of varying thickness 1 to 3m forms the topmost layer. A longitudinal section of the Nakon Sawan Highway as presented by Eide (1977) is shown in Fig. 1. The Queensland Department of Main Roads in Herston, under the leadership of Vasantha Wijekulasooriya has accumulated valuable wealth of Geotechnical information on Highway and Motorway construction. Similarly, the Port of Brisbane (POB) has done award winning work on reclamation works (see Ameratunga, 2010). Excellent expertises on the engineering geological aspects of soft soils in SE Queensland are there in well established geotechnical companies such as Coffey Geotechnics among others.
Transcript of Settlements of Embankments in Soft Soils

Geotechnical Engineering Journal of the SEAGS & AGSSEA Vol 41 No.2 June 2010 ISSN 0046-5828
61
Settlements of Embankments in Soft Soils
A. S. Balasubramaniam, H. Cai, D. Zhu, C. Surarak and E. Y. N. Oh
Griffith School of Engineering
Griffith University, Gold Coast, Australia
E-mail: [email protected], [email protected], [email protected], [email protected],
ABSTRACT: The major part of this paper is on the challenges in predicting settlements in highway embankments and reclamation works in
marine, deltaic and estuarine type of deposits. The emphasis is on practical aspects and the difficulties experienced in confidently estimating
settlements even after a century of developments and contributions. The influence of the general geology and soil conditions is discussed in
relation to the site investigation works and the establishment of soil profile models. The fundamentals of preloading techniques with and
without prefabricated drains (PVD) as ground improvement measures are also included. The observational approach in evaluating PVD
performance and settlement estimations is then made with emphasis on curtailing residual settlements. Finally, the latter part of the paper is
devoted to the analytical and numerical solutions of the behaviour of piled supported approach embankments with transfer layers. Geogrid
reinforced pile supported (GRPS) embankment system is studied with the analytical approaches of Terzaghi, BS8006 method and Hewlett
and Randolph method. Additionally, numerical analyses are also made with the Plaxis software.
1. INTRODUCTION
The major part of the work presented in this paper relates to the
challenges in predicting settlements in marine, deltaic and estuarine
type of soft soils under road and highway embankments and during
reclamation works. The early work on Soft Bangkok Clay is
described by Muktabhant et al. (1967), Moh et al. (1969) and Eide
(1968 and 1977). A comparison is then made with the practice in SE
Asia and in Australia wherever possible. Concentration is made on
the use of preloading with and without prefabricated vertical drains
(PVD) and the restriction of post-construction settlements. Most of
the material presented here is related to actual project works where
the first author is involved over a period of forty years. In these
activities classical and simple theories in Soil Mechanics are used
and lesser emphasis is given to the recent excellent developments of
more refined approaches. The primary and secondary settlements
are calculated using the notable and well established works of
Terzaghi, Mesri and Hansbo. The first comprehensive volume on
soft clay engineering was by Brand and Brenner (1981) at AIT as
based on the International Symposium on Soft clays held in
Bangkok in 1977. The ground improvement conference held in 1983
at AIT also gave great impetus in the development of this field in SE
Asia (see Balasubramaniam et al., 1984). Bergado et al. (1996) had
an excellent volume on soft ground improvement. The recent
volume on case histories by Indraratna and Chu (2005) has excellent
contributions by Hansbo, Moh and Lin, Indratana, Hsi, Wong, Chu,
Massarsch, Terashi, Kitazume, and others, which are very valuable
for practicing geotechnical engineers.
The First Author’s experience generally lies in an
observational approach and in interpreting laboratory test data and
small scale and large scale field tests. The extensive use of CPT and
CPTu have somewhat reduced the earlier emphasis made on the use
of large number of boreholes to delineate the soft soil layer
thicknesses. Also, it is the practice in SE Asia to conduct large
number of index tests and water content determination and to use
such data indirectly in estimating the soft clay layer thicknesses.
While quality of undisturbed samples for laboratory tests and
sophisticated triaxial stress path and other type of laboratory tests
have been extensively researched, the current practice seems to
avoid these sampling and testing procedures with a view to
minimise the expenses on site investigation and design phases of the
projects. However large scale field tests with the use of test
embankments with and without PVD are still used heavily in
practice. Here again perhaps the instrumentation used for the
measurement of surface and sub-surface settlements, pore pressures
and lateral movements are somewhat minimised to cope with the
limited funds made available in site investigation works.
Differential settlement is also a major issue in approach
embankments adjacent to bridge abutments, culverts and other
structures founded on piles. Such settlements will affect the
performance of the pavement and can cause negative skin friction
which imposes additional loads on the piles. Stringent settlement
criteria are now imposed on many major highway and expressway
projects and this then led to the latter part of the paper in studying
the available closed form solutions and numerical methods on the
design of pile supported approach embankments with transfer
layers. Geogrid reinforced pile supported (GRPS) embankment
system is studied with the analytical approaches of Terzaghi,
BS8006 method and Hewllett and Randolph method. Numerical
analyses are also made with the Plaxis software.
2. GENERAL GEOLOGY OF MARINE, DELTAIC AND
ESTUARINE CLAYS
The Soft Bangkok Clay (see Muktabant et al., 1967, Moh et al,
1969, Bergado et al., 1990, Moh and Lin, 2005, Seah, 2005) and the
Muar Flat clays (Chan and Chin 1972, Ting and Ooi, 1977, Ting et
al., 1987, Ting et al., 1989, Poulos et al., 1989, Nakase and
Takemura, 1989; and Brand and Premchitt, 1989; Indraratna et al.,
1992; and Loganathan et al., 1993) in Malaysia are marine clays and
are very homogeneous and extend to great depths over a very large
area. These deposits are studied extensively. The whole of Bangkok
Plain has a carpet of soft clay spaning some 200 to 300km east west
and some 400km north-south. Also, the thickness is relatively high.
The estuarine clays in Queensland differ markedly from the
marine deposits in.
(i) They usually occur close to creeks and vary substantially in
thicknesses and composition.
(ii) The strength is very low.
Notable highway projects in Thailand such as the Thon Buri
Pak Tho Highway, the Bangna-Bangpakong Highway, Bangkok-
Siracha Highway, Nakon Sawan Highway and others in the
Bangkok Plain are such that the whole stretch of highway passes
over the flat deltaic plain where the subsoil is soft marine clay. The
age of this marine deposit is about 2000 years and it is considered as
a recent deposit. The thickness of the soft clay in the Bangna-
Bangpakong project varies from 15m at Bangna to 25m at km 28
from Bangpakong. This layer is underlain by stiff clay of 4 to 10m
thick, followed by a dense to very dense sand. A weathered crust of
varying thickness 1 to 3m forms the topmost layer. A longitudinal
section of the Nakon Sawan Highway as presented by Eide (1977) is
shown in Fig. 1.
The Queensland Department of Main Roads in Herston, under
the leadership of Vasantha Wijekulasooriya has accumulated
valuable wealth of Geotechnical information on Highway and
Motorway construction. Similarly, the Port of Brisbane (POB) has
done award winning work on reclamation works (see Ameratunga,
2010). Excellent expertises on the engineering geological aspects of
soft soils in SE Queensland are there in well established
geotechnical companies such as Coffey Geotechnics among others.

Geotechnical Engineering Journal of the SEAGS & AGSSEA Vol 41 No.2 June 2010 ISSN 0046-5828
62
References can be made to the important pioneering works of
Whitaker and Green (1980), Robertson (1984), Litwinowicz and
Smith (1988) and Wijekulasooriya et al. (1999). The coastal plain in
Australia has a low elevation and over the last 2 million years the
coastline has changed as a result of sea level changes. The geology
of the coastal area is substantially influenced by climate, water,
tectonic and geological activity and vegetation. Along the
alignments of highways and motorways in SE Queensland, the soft
soils include a combination of alluvial, coastal and estuarine
sediments; with sands, silts, and clays. The soil stratigraphy in some
areas is very variable within very short stretches. Under these
circumstances the evaluation of the thickness of the soft soil and its
compressibility and drainage characteristics is a major challenge.
Some of the routes comprised of extensive areas of Quaternary
alluvial material forming tidal mangrove and mud flats. Also,
embankments are situated on tidal flat of estuarine sediments with
sandy beach ridges of Holocene age, which is underlain by older
Pleistocene sediments. Basically two types of alluvium have been
encountered in Brisbane area. Young alluvium consisting mainly of
dark grey, soft to firm organic silty clay (OH); old alluvium consists
of a series of layers including silty clay, sandy silt, silty sand, sand
and gravel. Young alluvium is a very recent deposit and comprises
mainly of soft silty clay (undrained strength 5 to 15kN/m2). This in
turn overlies a young alluvial deposit of soft to firm silty clay and
older alluvium consisting of stiff to very stiff silty clay/sandy silty
clay. This layer is assumed to have no effect on embankment
stability or settlement.
The soft soils in Southeast Queensland and in New South
Wales bordering with Queensland are of very low strength and high
compressibility (see Wijekulasooriya et al., 1999; Hsi and Martin,
2005), thus there are potential risks with slope failures during the
construction period. Additionally, there can be high settlements
during the construction and service periods of the road. This will
cause an increase in fill quantity during construction and problems
of serviceability of the road under long term conditions due to
residual (and differential) settlement. The low drainage
characteristics of the soft soil will delay the consolidation process
resulting in longer construction time.
There can be acid sulphate soils (ASS) as well and potential
acid sulphate soils (PASS) present along the route. In such an
environment, care should be taken to avoid the effects due to the
formation of sulphuric acid and its impact during flood inundation
periods, and potential degradation of structural elements, such as
culverts, foundation piles, footings etc (Hsi and Martin, 2005,
Ameratunga, 2009).
3. SOIL PROFILE MODEL
Before the introduction of CPT and CPTu, soil profiles in soft soils
are entirely relied upon from borehole data and in-situ vane tests.
Also, natural water content, liquid limit and plastic limit tests are
carried out and these data are valuable in separating the soft clay
from medium stiff and stiff clay. In the classical work at AIT and
NGI (see Moh et al., 1969; Eide, 1977) the soft Bangkok clay is
described as so homogeneous (at the Bangkok airport site and along
the Nakhon Sawan Highway and the Bangkok Siracha Highway),
they felt the undrained shear strength contours as established from
vane shear tests will not vary more than 10 percent of the values.
The soil profile as established from boreholes and the vane strength
profiles are given in Figures 1 and 2. Also, profiles of water content
are plotted along the longitudinal section of the routes (see Figure
3). Over the years, there seems to be a drastic reduction in the basic
laboratory tests such as the Index tests and natural water content
determination. These tests are most valuable when the quality of
undisturbed soft clay samples is questionable when used in
Oedometer tests to determine the compressibility characteristics.
Recent work on Bangkok Clays by Sambhandharaksa (2006), Seah
and Juirnarongrit (2003), Seah and Lai (2003), Seah and Koslanant
(2003), Seah et al., (2004a and 2004b) has been based on good
quality samples and refined testing methods.
CPT and CPTu tests are now used extensively in estuarine
clays. The data are used in soil profiling as well. The undrained
strength of the soft clay is established from the measured cone
resistance and overburden pressure, together with the use of a cone
factor Nk in the range of 15 to 20. In SE Queensland, the soft clay
thicknesses as established from CPT and CPTu are found to be
successful in line with those established from borehole profiles and
in-situ vane tests. In some instances the strength derived from CPT
are found to be lesser than those obtained from vane tests conducted
in tube samples. Recently, T-bar tests were found to give more
reliable strength than the CPT. But these tests are only carried out in
limited projects.
-20
-15
-10
-5
0
5
53 58 63 68 73
Chainage (km)
Ele
va
tio
n (
m)
Stiff Clay
Soft Clay
Ground water level Ground water levelGround surface
Soft Clay
Stiff Clay
Figure 1. Longitudinal section of the Nakon Sawan Highway
(Eide, 1977)
-30
-25
-20
-15
-10
-5
0
5
0 10 20 30 40 50 60
Ele
va
tio
n (
m)
Chainage (km)
Ground water level 1.2m Ground water level 1.7mGround surface
15 kN/m2
20
30
40
10
10
8 8
10
8
Soft Clay
Very stiff clay
Figure 2. Vane strength profiles (Eide, 1977)
-30
-25
-20
-15
-10
-5
0
5
10
0 10 20 30 40 50 60
Chainage (km)
Ele
va
tion
(m
)
Design HWL
1.2mNatural terrain
Design HWL 1.7m
Soft Clay
Very Stiff Clay
w=120-140% 140-150%100-120%
w=80-100%
Figure 3. Water content profile (Eide, 1977)
Figures 4(a) and (b) indicate the use of water content and index
tests in delineating the stiffnesses of clays as soft, medium soft and
stiff.
In marine and deltaic deposits of Bangkok and Muar Clays etc.,
the soil model of the subsurface is generally of weathered crust and
soft clay. The thicknesses of these layers are the same over very

Geotechnical Engineering Journal of the SEAGS & AGSSEA Vol 41 No.2 June 2010 ISSN 0046-5828
63
large areas with little variation. However, when estuarine clays are
experienced, there can be more than one or two layers interbedded
with layers of sand and firm clay etc. In reclamation works, some
time the number of layers encountered can even range up to six or
more. Also within very short distances, the layer thicknesses can
change substantially. The CPTu tests are found more reliable in
identifying the various layers encountered and their types. Figure 5
shows the soil profile as established from CPTu and Boreholes.
(a) Bangkok Swarnabhumi Airport site
(Moh et al., 1969, Moh and Woo, 1987)
(b) RTN Dockyard site in Bangkok Plain
(Balasubramaniam et al., 1980)
Figure 4. Profiles of water content and index tests
Soil Profile from CPTu, Boreholes
-30
-25
-20
-15
-10
-5
0
5
10
0 100 200 300 400 500 600 700 800 900 1000
Chainage (m)
Rela
tiv
e l
ev
el,
RL
(m
)
BH2BH1 BH3
BH4
Fill Soft Clay Stiff Clay
Soft Clay
FillCPT1
CPT2 CPT3
CPT4CPT5
CPT6CPT7
CPT8CPT9
CPT10 CPT11
CPT11
Stiff Clay
Figure 5. Soil profile as established from CPTu and Boreholes
4. PRE-LOADING TECHNIQUE IN GROUND
IMPROVEMENT
Pre-loading is a common method used to improve soft clayey soil
deposits. The effective surcharge pressure for preloading can arise
from either the weight of the imposed fill material (example an
embankment) and or the application of a vacuum pressure applied to
a soil. Excellent contributions on the use preloading with PVD have
been made by Hansbo (1960, 1979, 1981 and 1987); Holtz et al.
(1988); Mesri (1991, 1994); Balasubramaniam et al. (1995);
Bergado et al., (1991, 1998, 1999 and 2002); Sambhandharaksa et
al. (1987); Moh and Lin, (2005); Choa et al. (1979a and 1979b);
Lee et al. (1985); Tan et al. (1987); Yong and Lee (1997); Chu et al.
(2004); Bo and Choa (2004); Arulrajah et al. (2007); Chu et al.
(2009a and 2009b); Ooi and Yee (1997); Yee (2000); Masse et al.
(2002); Varaksin and Yee (2007); Indraratna et al. (2005a and
2005b); Balasubramaniam et al., (2004); Oh et al. (2004); Long et
al. (2006) among others in many countries.
4.1 Primary Consolidation
The magnitude of primary consolidation settlement under
embankment loading is calculated now for many decades, using
classical theory of one-dimensional consolidation and the strain-
based recompression ratio (RR) and the compression ratio (CR). The
existing vertical stresses and the anticipated increase in stress under
embankment loads were calculated in a classical manner from layer
thicknesses, position of ground water table and unit weights as well
as simple expressions on stress distribution based on elastic soil
behaviour.
4.2 Secondary Consolidation
Classical and scholarly contributions on primary and secondary
consolidation are made by Mesri and Castro (1987), Mesri (2001),
and Mesri and Vardhanabhuti (2005) among other authors.
Secondary compression is the slow compression of soil that occurs
under constant effective stress after the excess pore pressures in the
soil dissipated.
The magnitude of secondary compression is a direct relation
both to the soil’s susceptibility to secondary compression as
measured by the secondary compression index (Cε) and by the time
ratio (ratio of total time from load application to the time required to
complete primary consolidation). By shortening the time required to
complete primary consolidation (tp) with the use of PVD, the ratio of
total time (design life) to time for primary consolidation increases
and would by itself cause the amount of secondary compression to
increase.
Data gathered from the field and laboratory test program in SE
Queensland showed considerable scatter in Cε with elevation. In
general Cε ranged from 0.5 to 0.25%, and the ratio of Cε to CR
varied from 0.015 to 0.07. Cε generally increased with Liquid limit
and natural water content. One of the factors reported for the scatter
of Cε was that the time interval was short as adopted in practice to
determine this parameter from laboratory consolidation tests.
4.3 Reducing Secondary Consolidation Effects by
Surcharging
When a clay soil is subjected to increased stress under new loading
and also receives a surcharge loading, there will be some amount of
rebound when the surcharge is removed. At some time after the
rebound occurred, the clay will experience creep compression under
constant effective stress, but the rate of secondary compression is
slower than that would have occurred without surcharge. Thus when
the secondary compression resumes, the secondary compression
ratio Cε will be less than Cε of the clay before the surcharge was
removed, and less than that would be present for, if no surcharge
had been applied. It demonstrates that the longer the surcharge can
be left in place, the greater the effect of the surcharge in delaying the
time to onset of post-surcharge secondary compression until a time
after the rebound has occurred, when the surcharge has been left in
place for some time after its t100. Therefore, two factors must be
determined in applying the surcharge to reduce later secondary
compression. The magnitude of reduction in Cε must be estimated
and the time of delay in the on set of secondary compression.
Figure 6 illustrates the e-log p' curve and the time effects. In
this figure:
(a) Point A represents the initial in-situ stress conditions where
voids ratio is e0.
(b) Point B represents the final stress condition after applying the
surcharge.

Geotechnical Engineering Journal of the SEAGS & AGSSEA Vol 41 No.2 June 2010 ISSN 0046-5828
64
(c) Point C corresponds to field settlement matched point on AB,
prior to the removal of excess surcharge.
(d) Point M corresponds to the swelling line when the service load
and the stresses due to the ground water lowering are
incorporated (M is mostly in an over-consolidated state).
e
log p
A
B
CM
0 A
eA
eMeC
eB
M CB
e
log p
A
B
CM
0 A
eA
eMeC
eB
M CB Figure 6. e-log p' relationships
Residual settlement is calculated as the difference of the creep
settlement for 20 year period from the state M and the swelling due
to stress release CM.
In this idealisation, if normally consolidated Cε is used, it is
very conservative as Cε is very much dependent even on low values
of OCR.
5. SETTLEMENT CALCULATION WITH AND
WITHOUT PVD
5.1 Ultimate Primary Settlement without Using PVD
In natural deposits of lightly overconsolidated soft clays, the
primary settlements are calculated using the traditional expressions:
Table 1. Expressions for primary consolidation settlement with
stress history
Stress history Primary consolidation settlement
i + <p 0
log1
ir
i
σ ΔσCρ H
e σ
(1)
i p <i + 0 0
log log1 1
p c ir
i p
σ C σ ΔσCρ ( )H
e σ e σ
(2)
p <i 0
log1
c i
i
C σ Δσρ H
e σ
(3)
The major issue is then in determining the compression ratio
CR (0/(1 )cC e ) and the recompression ratio RR (
0/(1 )rC e ).
These values are determined from laboratory consolidation and
swelling tests, but the values are found to have very large scatter in
estuarine clays.
5.2 Calculation of Settlement after Time t Prior to PVD
Installation
The settlement at any time t is calculated using the expression;
Uρρt (4)
The degree of consolidation varies with the time factor Tv for
one dimensional consolidation with vertical drainage as:
6
1
32
11
1
vT
U
(5)
2
e
vv
h
tcT (6)
5.3 Calculation of Settlement at Time t after PVD Installation
The currently adopted common expressions in ground improvement
works with PVD are well established and generally the work of
Hansbo (1981) is cited in using these expressions.
ρUρt (7)
)U)(U(U vh 111 (8)
F
T
h
h
eU
8
1
(9)
2
e
hh
D
tcT (10)
The value of F is given by:
F(r)F(s)F(n)F (11)
2
2
2
2
4
13
1
ln
n
n
n
nnF(n)
(12)
)/d(d))/k((kF(s) wssh ln1 (13)
ms dd 2 (14)
wlπ
dm
4
(15)
)/qz)(kπz(LF whr (16)
5.4 Calculation of Residual Settlement (RS)
The RS values are calculated by two methods - (1) The RS values
depend on the effective stress before stress removal with the
appropriate DOC and the final stress level; the RS values are
generally high as calculated by this method; (2) This method uses
the Cε value in the over-consolidated range and it is noted that Cε
in the over-consolidated range reduce sharply even with small
values of OCR. The RS values depend on the structures built; typical
values can be 150mm settlement under 15kPa service load in 20
years; these values can increase to 250mm settlement under 25kPa
service load in 20 years.
)t
tt(
e
Cρ
p
pα
log
1 0
sec
(17)
Table 2. Residual settlement calculation by two methods
Method I Method II
0
0
1
log1
10e
C
σ
σ
e
C
p
α
M
Cc
t (18)
0
0
1
log1
10e
C
σ
σ
e
C
p
α
M
Cc
t (19)
me
m
C
C)n(OCR
αε(nc)
αε(oc)
1
1 (20)
(m = 0.05, n = 6) (Wong, 2008)

Geotechnical Engineering Journal of the SEAGS & AGSSEA Vol 41 No.2 June 2010 ISSN 0046-5828
65
sec
0
log1
pα
p
t tCρ ( )
e t
(21)
sec
0
log1
α(oc) p
p
C t tρ ( )
e t
(22)
6. PRELOADING WITH AND WITHOUT PVD
Two approaches are adopted in highway and motorway construction
for preloading with and without the use of PVD. Some time it is
wrongly conceived that settlement can be specified as the criterion
for the removal of surcharge after pre-loading. It is emphasised that
the DOC values must be generally higher than 90 pc and even as
much as 95 pc or so prior to the surcharge removal. Otherwise
substantial left over primary settlement can add to the secondary
settlement and makes the post-construction settlement much higher.
Before proceeding with the estimate of the post construction
settlement (PCS), the need for the preloading time as based on DOC
is important. These cases are illustrated below.
6.1 Preloading without PVD
Figure 7 illustrates the total stress due to the application of
embankment and surcharge loading, the undissipated pore pressure
at the time of removal of the preload. In this explanation:
(a) Double end drainage, of a clay layer of thickness Hc is
considered;
(b) The horizontal axis refers to the stresses;
(c) The vertical axis AD refers to the layer thickness;
(d) AB = DC is the total stress from embankment load and
additional surcharge during preloading: He is embankment
height; h is surcharge height during preloading; unit
weight of embankment material;
(e) Curve AGKD represents the excess pore pressure before
removing preload h;
(f) At that time when the preload h is removed, the effective
stress increase is represented by the hatched area
AEBCFD;
(g) The settlement at this time is due to the increase in
effective stress as represented by the area AEBCFD;
(h) However it must be ensured that the effective stress
increase as represented by EB and FC should be higher
than the value He γ.
Such a criterion seems logical to be adopted in practice.
6.2 Preloading with PVD
(a) Figure 8(a) shows the elevation and plan of the clay bounded
between adjacent drains AD and BC (in elevation).
(b) The soil bounded by EH and FG (in elevation) shows the
central annulus where the DOC is less than target 90 pc. The
Ring of clay bounded between the boundaries ABCD and
EFGH will have DOC higher than 90 pc.
(c) The plan view in Figure 8(a) shows the effective stress Heγ,
due to embankment load is reached at the boundaries dm and
cl; but at the edges of the central annulus the values hp and gq
correspond to values smaller than Heγ.
(d) In Figure 8(b), the settlement time graph OABC corresponds
to embankment load Heγ. Point A in this graph is at 90 pc
DOC. Point D on AD corresponds to the settlement at 90 pc
DOC, with the embankment load Heγ, while Point E on EC
corresponds to the settlement at 100 pc DOC under the
embankment load Heγ.
(e) If the primary settlement beyond 90 pc DOC is not to be
included in the residual settlement, then the embankment
height must be increased by an additional surcharge h (that is
total load corresponds to (He+h)), so that the settlement -
time plot OFGJ will have a 90 pc consolidation settlement
corresponding to the Point F on this graph; the settlement at F
is the same as the settlement at E under 100 pc DOC for the
embankment load Heγ only.
(f) Further to erase the creep settlement by a prescribed amount
then an additional surcharge hcreep must be added, so that the
total load is (He+h+hcreep) γ. The time settlement graph for this
loading is OKLM.
In practice the DOC before the removal of surcharge must be
higher than 90 pc even as much as 95 pc.
Drain
boundary
σstress
Hc
B
CD
E
F
G
K
Undissipated
pore pressure
Increase in
effective stress
Drain
boundary
A
(He+h)
σ
He-Embankment height
h-Surcharge
He
Figure 7. Total stress due to the application of embankment and
surcharge loading, the undissipated pore pressure at the time of
removal of the preload
H
A B
CD
E F
GH
d c
h g
lm
p q
He
Drainage
boundary
A B
CD
E F
GH
d c
h g
lm
Zone with U
less than 90%
Elevation
Plan
Zone with U
greater than 90%
p q
Drainage
boundary
H
A B
CD
E F
GH
d c
h g
lm
p q
He
Drainage
boundary
A B
CD
E F
GH
d c
h g
lm
Zone with U
less than 90%
Elevation
Plan
Zone with U
greater than 90%
p q
Drainage
boundary
Figure 8(a) Elevation and plan of the clay bounded between
adjacent drains AD and BC
He
(He+h)
(He+h+hcreep)
D
E
0
r
tt90
A
B C
F
G JK
L M
Figure 8. (b) Settlement-time graph corresponds to embankment
load Heγ

Geotechnical Engineering Journal of the SEAGS & AGSSEA Vol 41 No.2 June 2010 ISSN 0046-5828
66
7. OBSERVATIONAL APPROACH IN EVALUATING
PVD PERFORMANCE AND RESIDUAL
SETTLEMENTS
Infrastructure developments in soft clays have always been based on
observational approaches with test embankments constructed on full
scale. Extensive studies were made with such embankments in
Bangkok clays (Moh et al., 1969; Balasubramaniam et al., 1995)
and Muar clays (Poulos et al., 1989; Brand and Premchitt, 1989).
These test embankments are also fully instrumented. In Southeast
Queensland as well (see Wijekulasooriya et al., 1999; Ameratunga,
2010), there are many instances in which test embankments were
built and the data analysed and used in design and construction
monitoring.
It is common in such studies with test embankments to measure
surface settlements, sub-surface settlements and sub-surface pore
pressures. The deep settlements are measured with settlement
gauges and magnetic extensometers. The test embankments can use
surcharge as fill material or partial surcharge and vacuum. Early
studies carried out in Bangkok with vacuum consolidation
experienced substantial difficulties in maintaining the vacuum, but
lately the sealing techniques have improved substantially and the
vacuum can be maintained satisfactorily over a very long period of
even a year or more. The surface settlement measurements are
always found to be more reliable and accurate than the sub-surface
measurements.
The sub-surface measurements do indicate that the full soil
profile is consolidating in any project with wick drains. Extensive
studies carried out with the Second International Airport works in
Bangkok has clearly indicated that very little differences are noted
in the performance of most drains when selected in a proper manner
following the specifications and with guaranteed performance. In
Southeast Queensland as well, studies have revealed similar
observations.
In evaluating the PVD performance and the influence of the
installation pattern and spacing, the degree of consolidation (DOC)
and the rate of pore pressure dissipation are used as indices to
compare the relative merits of each drain and the spacing adopted.
There are a number of methods for predicting the 100pc primary
consolidation settlement. Asaoka (1978) Method and Hyperbolic
Methods are the most widely used methods by engineers. Asaoka
plots are found to be more reliable to estimate the ultimate
settlements both from the surface and sub-surface settlement
measurements. Undoubtedly, the surface measurements are more
accurate while the sub surface measurements are also important as
they are useful in the estimation of the consolidation settlements in
the deeper layers. The pore pressure measurements and their rate of
dissipation though very consistent in their values, can at times be
subject to doubts if the measurements are taken very close to the
drains. The RS calculations need the DOC of the sub-soils at the
removal times and this is achieved by using the Hansbo theory and
matching the measured surface settlements with the predicted
values.
0
0.5
1
1.5
2
2.5
3
0 200 400 600 800 1000 1200 1400
Time (days)
Set
tem
ent
(m)
Calculated
Measured
Figure 9. Calculated and measured settlement
Figure 9 presents typical calculated (using Hansbo theory) and
measured settlement used to estimate the hundred percent primary
settlements for DOC estimation.
In planning such field trial, the earlier studies indicated that it is
good to separate the test embankments, rather than having them all
side by side, but still many prefer to have them side by side. The
trials are generally carried out like a parametric study, where one
variable is change at one time, to see the influence of this variable.
When triangular and square pattern of drains are used, the
equivalent diameter De of the drain is found to be a good parameter
to quantify the drain spacing and drain pattern.
8. DETERMINATION OF GEOTECHNICAL
PARAMETERS
8.1 Geotechnical Parameters
Even though extensive site investigation works are carried out,
engineers nowadays tend to keep the variation of each geotechnical
parameter to a minimum degree.
In Brisbane (SE Queensland), the natural clay profile is divided
into an Upper Holocene Clay and a Lower Holocene Clay. The
compression ratio for these clays are generally 0.235, lower values
can be encountered if the OCR values are high and these values can
be as low as 0.18. Basic studies carried out on soft clays generally
indicate that the recompression index RR range from 0.2 to 0.1 of
CR in these clays. Generally a lower value of 0.1 is adopted. The
greatest variation is noted in the coefficient of consolidation cv. In
most instances, the laboratory consolidation test values of cv are
always very low. CPTu tests at times seem to give very high ch
values. The realistic estimation of this parameter is always difficult;
this is where the field settlement-time plots from test embankments
could help in estimating field cv values. It appears the field values
are generally taken as 5 to 10 times the lab values. Long term
consolidation tests are seldom performed and as such the estimation
of C values also have great uncertainty. The C values seem to
range from 0.005 to 0.008.
8.2 Soil Parameter Determination
This section is discussed under two sub-headings. First the
commonly carried out laboratory tests and secondly the in-situ tests.
8.2.1 Soil Parameters from Laboratory Tests
There seems a substantial reduction in the laboratory tests
performed. Even the natural water content and index tests are
trimmed to the very minimum; and also, particle size distribution.
Continuous borehole logging is also not any more in practice.
Consolidation tests are mainly stress controlled tests. But
triaxial tests are seldom or never carried out. Even if there is some,
it is multi-stage triaxial tests. Stress paths tests and even Ko
consolidated triaxial tests are virtually not done. The Index tests are
used primarily to determine the strength and compressibility
parameters from empirical correlations.
(a) Water content vs. compression index correlations
When the laboratory consolidation tests are few and also, the results
are affected by sample disturbance, empirical correlations are often
used as fall back to estimate compression ratios. Four such
correlations of CR with water content are by Simons and Menzies
(1975), Simons (1957), Wilkes (1974) and Lambe and Whitman
(1969). The expressions are summarised in Table 3 for CR values.
(b) Empirical equations for OCR from Plasticity index
When there are doubts on the quality of samples and the reliability
of Oedometer results, empirical relations are relied on for the
estimation of OCR values in settlement calculations. Three such
classical relations are by Skempton and Henkel (1953), Osterman
(1959) and Bjerrum and Simons (1960).

Geotechnical Engineering Journal of the SEAGS & AGSSEA Vol 41 No.2 June 2010 ISSN 0046-5828
67
Table 3. Compression Ratio from moisture content
Compression Ratio from moisture content
Authors Formula Range of wn
Simons and
Menzies (1975)
CR = 0.006wn-0.03
20 ≤ wn ≤ 140
(23)
Simons (1957) CR = 0.006wn1.68
28 ≤ wn ≤ 57
(24)
Wilkes (1974) CR = 0.26ln(wn)-0.83
30≤ wn ≤ 90
(25)
Lamb and
Whitman (1969)
CR = 0.12ln(wn)-0.28
10 ≤ wn ≤ 100
(26)
(c) Values of C/Cc for Geotechnical Materials
In geotechnical engineering practice the scholarly work of Mesri et
al. (1994) is used extensively in estimation of primary and
secondary settlements. Values of C/Cc as given by Mesri et al.
(1994) are given in Table 4.
Table 4. OCR from Plasticity index
OCR from Plasticity index
Authors Formulae
Skempton and Henkel
(1953)
OCR = 0.0017IP+0.5
(27)
Osterman (1959) OCR = 2×10⁻⁶IP3-3×10⁻⁴IP
2
+3.1×10⁻²IP+0.41
(28)
Bjerrum and Simons
(1960)
OCR = 2×10⁻⁶IP3-4×10⁻⁴IP
2
+3.35×10⁻²IP+0.28
(29)
(d) Secondary consolidation parameter from Compression ratio
(Mesri et al., 1994)
The secondary compression ratio is estimated from the work of
Mesri et al. (1994) as follows:
0 0
0 04 0 011 1
α cC C( . . )
e e
(30)
Lambe and Whitman (1969) also estimated the secondary
compression ratio from water content as follows:
0
0 002 0 011 100
α nC w %( . to . )
e
(31)
Table 5. Values of C/Cc for Geotechnical Materials
(Mesri et al., 1994)
Material C/Cc
Granular soils including rockfill
Shale and mudstone
Inorganic clays and silts
Organic clays and silts
Peat and muskeg
0.02 ± 0.01
0.03 ± 0.01
0.04 ± 0.01
0.05 ± 0.01
0.06 ± 0.01
(e) Empirical equations for undrained shear strength from
Plasticity index
For shear strength the mostly used empirical formula is from
Skempton and Henkel (1953). The other classical relations are by
Osterman (1959) and Bjerrum and Simons (1960). These
expressions are given in Table 6.
0
0.1
0.2
0.3
0.4
0.5
0.6
0.7
0.8
0.9
0% 50% 100% 150%Moisture Content
Cc/
(1+
e0)
Simons and Menzies (1975) Lamb and Whitman (1969)
Simons (1957) Wilkes (1974)
Figure 10. Relationship between Cc/(1+e0) and natural moisture
content, after Simons (1974)
0
0.05
0.1
0.15
0.2
0.25
0.3
0.35
0.4
0 10 20 30 40 50 60 70 80
Plasticity Index (Ip)
s u/p
' ra
tio
Figure 11. Relationship between su/p and plasticity index, after
Bjerrum and Simons (1960)
Table 6. Undrained shear strength from plasticity index
Undrained shear strength from plasticity index
Authors Formulae
Skempton and Henkel
(1953)
su/σ'vo= 0.004IP+0.1
(32)
Osterman (1959) su/σ'vo= 5×10⁻⁷IP3-8×10⁻⁵IP
2
+6.8×10⁻³IP+0.08
(33)
Bjerrum and Simons (1960) su/σ'vo= 5×10⁻⁷IP3-8×10⁻⁵IP
2
+7.4×10⁻³IP+0.06
(34)
8.2.2 Soil parameter from In-situ tests
Because of sample disturbance in soft soils, in-situ tests are more
relied on in practice than laboratory tests. Vane shear tests are
traditionally relied upon for undrained shear strength. In the last two
to three decades CPT and CPTu are well advanced and heavily
relied upon for the estimation of strength and compressibility
parameters in soft soils, Lunne et al. (2002), Mayne (1986, 1991,
1993).
(a) Coefficient of volume change from CPT
CPT and CPTu tests data are used to obtain the coefficient of
volume decrease. The cone resistance qc and a parameter defined as
αm are used as:
M = 1/mv = αm. qc (35)
(b) Compression index from coefficient of volume change
The coefficient of volume decrease is related to the compression
index, Cc as:

Geotechnical Engineering Journal of the SEAGS & AGSSEA Vol 41 No.2 June 2010 ISSN 0046-5828
68
va
cv
)σe(
C.m
01
4350
(36)
(c) T-Bar tests
T- bar tests are relatively new in onshore geotechnical engineering
practice. They are claimed to give better performance than the CPT
and CPTu and the results compare well with the strengths obtained
from vane tests.
Table 7. Relationship of qc and qm (Mitchell and Gardner, 1975)
Soil type qc (MPa) 3< m<8
Low plasticity clay
qc<0.7 2<m <5
0.7<qc<2.0 1<m<2.5
qc>2.0 3< m<6
Silts of low plasticity qc>2 1<m <3
qc<2.0 2<m <6
Highly plastic silts and clays qc<2.0 2<m <8
Organic silts qc<1.2 qc<0.7
Peat and organic clay
qc<0.7
50<w<100 1<m <1.5
100<w<200 0.4<m <1
w>200 3< m<8
(d) Undrained shear strength from CPT
CPT and CPTu tests are first used to estimate the undrained shear
strength su in clays. In this paper, the compressibility parameters are
first presented and then the strength. The expression used for su
determination is as follows:
kt
vtu
N
σqs 0 (37)
Nkt varies from 15 to 20.
(e) Undrained shear strength of inorganic soft clay and silt
deposits
There is a correlation to estimate su (Mesri, 1975) from the
maximum past pressure or conversely the maximum past pressure
from su as
su = 0.22 σ′p (38)
(g) Undrained shear strength of organic soft clay and silt
deposits
The coefficient varies from soil to soil (Mesri, 1993), for organic
soils, the expression is:
su = 0.26 σ′p (39)
9. TYPICAL SETTLEMENT AND STABILITY
EVALUATIONS IN ESTUARINE CLAYS
9.1 Geotechnical Parameters
(a) Compression ratio (CR)
Figure 12 gives the compression ratio. In this plot the laboratory CR
values and the values determined from water content are shown. The
design CR values are estimated from these data and often compared
with back calculated CR values from the test embankment.
(b) Overconsolidation ratio (OCR)
The OCR values are determined from the consolidation tests and
CPT, CPTu. The values are presented in Figure 13. The CPT tests
are found to give higher OCR values than the laboratory
consolidation tests.
0
5
10
15
20
25
0.15 0.20 0.25 0.30 0.35 0.40
CR
Dep
th (
m)
CR (from Oedometer test) CR (water content)
Figure 12. Compression ratio - CR
(c) Coefficient of consolidation (cv)
The coefficient of consolidation is the most difficult parameter to be
reliably estimated. The laboratory tests normally under-estimate the
cv values while the cv values as obtained by scaling down the CPTu
ch values are always found to be much higher. In the test
embankment, the back calculated values are found to be higher than
the laboratory values but generally smaller than the CPTu values.
These results are presented in Figure 14.
(d) Secondary compression parameters (Cαε)
The Cαε values were determined from the water content as well as
from the CR values as obtained in the laboratory tests. A Mesri
coefficient of 0.035 was used to multiply the CR values to obtain
Cαε. These values are presented in Table 8. Generally lower Cα values are used in practice and is in the
range 0.003 to 0.0045.
0
5
10
15
20
25
30
0.0 0.5 1.0 1.5 2.0 2.5 3.0
OCR
Dep
th (
m)
OCR (From Oedometer tests)
OCR (From CPT2)
OCR (From CPT3)
OCR (From CPT4)
Figure 13. OCR with depth

Geotechnical Engineering Journal of the SEAGS & AGSSEA Vol 41 No.2 June 2010 ISSN 0046-5828
69
0
5
10
15
20
25
30
0 1 2 3 4 5 6 7
cv (m2/year)
Dep
th (
m)
Cv (from Oedometer test)
Figure 14. Coefficient of consolidation (cv) with depth
Table 8 Cαε values
Cαε =0.035×(CR from
water content)
Cαε =0.035×(CR from
consolidation test)
0.0104
0.0095
0.0098
0.0088
9.2 Calculation for Settlement
9.2.1 Time to reach ninety percent consolidation
Generally, the cv values of soft clays encountered in estuarine clays
are low and the normal time taken for 90 pc DOC is found to be
very high and exceeds the surcharge period adopted in practice as
nine months. Figure 15 illustrates that even for a surcharge height of
2m; the time for 90 pc DOC exceeds 9 months. If the post
construction settlement is limited to 100mm, then it is noted PVD
with spacing of 1.5 m is needed to limit the post construction
settlement with 1m surcharge.
9.3 Residual Settlement Criteria
9.3.1 Methods to calculate residual settlement
The RS values are calculated generally by two methods - (1) In
Method 1, the RS values depend on the effective stress before stress
removal with the appropriate DOC and the final stress level; the RS
values are generally high as calculated by this method. (2) This
method uses the C -consolidated range and it is
noted that C in the over-consolidated range reduce sharply even
with small values of OCR. Method 2 normally gives much lower
values of RS. The RS values depend on the structures built; typical
values for building works are 150mm settlement under 15kPa
service load in 20 years; these values increase to 250mm settlement
under 25kPa service load in 20 years.
9.3.2 Embankment settlement criteria
The critical factors governing the design of road embankments are:
stability, total/differential settlement and time for settlement.
The settlement criteria will be discussed herein. Normally
settlement criteria for embankments are defined in terms of the
allowable total settlement and differential settlement over a given
time frame. The time frame is typically the design life of the
embankment. The embankment change in grade due to differential
settlement is generally anywhere within 20m of the approach of any
structure (the “structure zones”) must be limited to 0.5% in both the
longitudinal direction and transverse direction of the embankment.
The settlement criteria adopted by different countries are
summarised in Appendix.
0.0
0.5
1.0
1.5
2.0
0 1 2 3 4 5
Thickness (m)
t 90 (
yea
r)
Cv=1 m2/year
Cv=2 m2/year
Cv=3 m2/year
Cv=4 m2/year
t=0.75 year
Figure 15. t90 with layer thickness for different cv values
0
50
100
150
200
250
300
350
400
450
0 100 200 300 400 500 600 700 800 900 1000
Chainage(m)
PC
S (
mm
)
without any Surcharge 0.5 m Surcharge
1 m Surcharge Limit
Figure 16. PCS under different surcharge
9.3.3 Zones of approach embankments
The region which extends from structures such as bridges to the
normal highway embankment is normally divided into three zones
especially when the approaches involve high embankments. Zone 3
is on the side close to the low embankment side. Zone 1 is closer to
the structure. In Zone 1, it is recognised that the differential
settlement limits may not be met, and the design will be based on
total settlement only. However, a hinged approach slab, and possibly
with other measures such as reinforced mattress, the differential
settlement can to reduced.
9.4 Stability analyses
Stability analyses were carried out on the embankments along the
motorway and at the interchange alignments. The side slopes of the
embankment are 1V:2H. Both short term and long term stability
analyses are carried out for the worst case scenarios in terms of
embankment height, water table and underlying soil layers.
Figure 17. Zones of approach embankment close to bridge culvert
and other structures (Hsi and Martin, 2005)
For soft clay stability under short term conditions, the
undrained strengths are used in the analysis. For long term
conditions, the drained strength is used after taking into account of
the effective vertical stress under the embankment loading. The
construction loading is taken as 10kN/m2 under short term
conditions and the traffic loading under long term conditions is

Geotechnical Engineering Journal of the SEAGS & AGSSEA Vol 41 No.2 June 2010 ISSN 0046-5828
70
taken as 20kN/m2. The factor of safety under short term and long
term stability are taken as 1.3 and 1.5 respectively. In the case where
geotextile reinforcement is used a line load is applied at the base
equivalent to the ultimate strength of the membrane.
A typical result carried out from Slope/W is presented in Table
9.
Table 9. Slope/W parameters for stability analysis
Embankment
height (m)
Surcharge
height (m) Soft clay (m)
FOS
2.5 0 5.6 1.83
1.834
Figure 18. Stability analyses from Slope/W
In most instances circular type of failure is appropriate for both
types of analyses. The FOS values are generally the same for
Slope/W and Plaxis. However, the Plaxis analyses gave lower FOS
values especially when wedge type of failures occurred. Wedge
failure occurs when soft clay layer is thin (see Table 10). Figure 15
shows wedge type of failure in Plaxis.
For the cases where the FOS is lower than the stipulated design
values, stage loading with waiting periods is recommended. Typical
recommendations are contained in Table 11.
Table 10. Embankment details for Plaxis analyses
Embank-
ment
height (m)
Sur-
charge
(m)
Berm
height
(m)
Berm
width (m)
Reinforcem
ent FOS
9.3 0 3.5
6m of berm
+3.5 of
Rock
armour
150 kN
@1m above
ground
surface
<1
Figure 19. Wedge type of failure from Plaxis
Table 11. Recommendation for FOS<1
Stage Loading
(m)
Loading period
including waiting
time 30 days (days)
FOS
Short-
term
Long-
term
1 3.5 45
1.77 1.72 2 3 45
3 2.8 -
9.5 Reinforced Embankment
The early works carried out on reinforced embankments at AIT are
those of Bergado et al. (1993a and 1993b) and Long et al. (1996).
Ting el al. (1984), Ting et al. (1989), Ting et al. (1994), Broms
(1986), Chin et al. (1989), Jones et al. (1990), Han (1999) and Han
and Wayne (2000), Poulos (1998), Li et al. (2002) have also done
pioneering works on reinforced embankments.
9.5.1 Load transfer mechanism for Geogrid reinforced pile
supported embankment
In Geogrid Reinforced Pile Supported (GRPS) Embankment system,
the load from the embankment fill due to its self-weight will be
transferred onto the underlain layers following four paths (shown in
Figure 20). The loads are transferred as: load (W1) transfer to pile
supports directly; load transferred to pile supports through arching
effect; loads transferred to the pile supports through the geotextile
membrane or grid and the load transferred to soil masses under the
embankment fill between the pile supports.
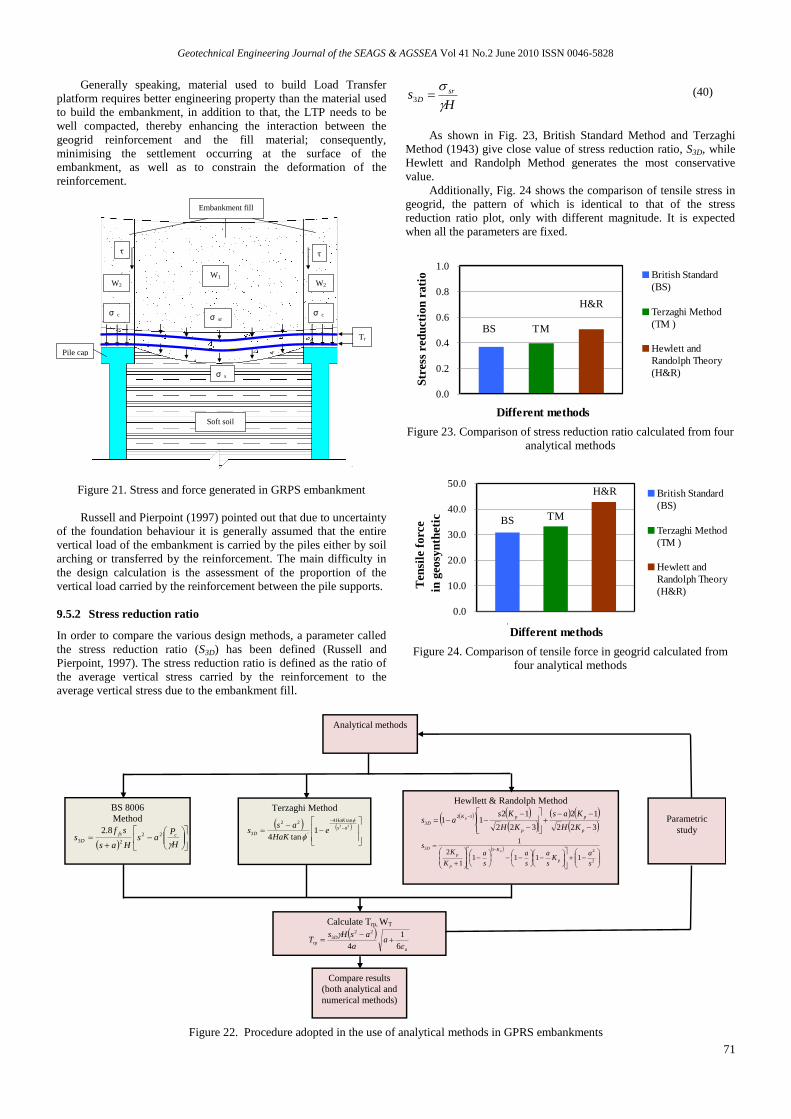
Figure 21 shows the stress generated in GRPS embankment, σc,
τ, σsr and σs, representing stresses due to the force carried by the pile
supports, the soil arching, geogrid and soil masses under
embankment between pile supports respectively. Trp is the tensile
force in the geogrid due to the vertical load.
The column supported embankments consist of vertical
columns that are designed to transfer the load of the embankment
through the soft compressible soil layer to a firm foundation. The
selection of the type of column used for column supported
embankments will depend on the design load, the constructability of
the column, the cost, etc. The load from the embankment must be
effectively transferred to the column to prevent punching of the
column through embankment fill creating differential settlement at
the surface of the embankment. If the columns are placed close
enough together, soil arching will occur and the load will be
transferred to the columns. In order to minimize the number of
columns required to support the embankment and increase the
efficiency of the design, a load transfer platform reinforced with
geogrid reinforcement is being used on a regular basis. The load
transfer platform consists of one or more layers of geogrid
reinforcement placed between the top of the columns and the bottom
of the embankment (Collin, 2007).
W2
W1 W1
2
1 1 3
4
2
Embankment fill
Geosynthtic
Soft soil
Pile cap
W3
W4
Figure 20. Load transfer mechanisms of GRPS embankment
where:
1 Load (W1) transfer to pile supports directly.
2 Load transfer to pile supports through arching effect.
3 Load transfer to pile supports through geogrid.
4 Load transfer to soil masses under embankment fill between
pile supports
Geotechnical Engineering Journal of the SEAGS & AGSSEA Vol 41 No.2 June 2010 ISSN 0046-5828
71
Generally speaking, material used to build Load Transfer
platform requires better engineering property than the material used
to build the embankment, in addition to that, the LTP needs to be
well compacted, thereby enhancing the interaction between the
geogrid reinforcement and the fill material; consequently,
minimising the settlement occurring at the surface of the
embankment, as well as to constrain the deformation of the
reinforcement.
W1 W2 W2
τ
σ c σ sr
σ s
τ
Embankment fill
Tr
p
Soft soil
Pile cap
σ c
Figure 21. Stress and force generated in GRPS embankment
Russell and Pierpoint (1997) pointed out that due to uncertainty
of the foundation behaviour it is generally assumed that the entire
vertical load of the embankment is carried by the piles either by soil
arching or transferred by the reinforcement. The main difficulty in
the design calculation is the assessment of the proportion of the
vertical load carried by the reinforcement between the pile supports.
9.5.2 Stress reduction ratio
In order to compare the various design methods, a parameter called
the stress reduction ratio (S3D) has been defined (Russell and
Pierpoint, 1997). The stress reduction ratio is defined as the ratio of
the average vertical stress carried by the reinforcement to the
average vertical stress due to the embankment fill.
Hs sr
D
3
(40)
As shown in Fig. 23, British Standard Method and Terzaghi
Method (1943) give close value of stress reduction ratio, S3D, while
Hewlett and Randolph Method generates the most conservative
value.
Additionally, Fig. 24 shows the comparison of tensile stress in
geogrid, the pattern of which is identical to that of the stress
reduction ratio plot, only with different magnitude. It is expected
when all the parameters are fixed.
0.0
0.2
0.4
0.6
0.8
1.0
1Different methodsS
tress
red
ucti
on
rati
o 11
British Standard
(BS)
Terzaghi Method
(TM )
Hewlett and
Randolph Theory
(H&R)
BS TM
H&R
Figure 23. Comparison of stress reduction ratio calculated from four
analytical methods
0.0
10.0
20.0
30.0
40.0
50.0
Terzaghi Method (TM )Different methods
Ten
sile
forc
e
i
n g
eosy
nth
eti
c 1
1
British Standard
(BS)
Terzaghi Method
(TM )
Hewlett and
Randolph Theory
(H&R)
BS TM
H&R
Figure 24. Comparison of tensile force in geogrid calculated from
four analytical methods
Compare results
(both analytical and
numerical methods)
Calculate Trp, WT
a
Drp a
a
asHsT
6
1
4
22
3
Parametric
study
Analytical methods
BS 8006
Method
H
Pas
Has
sfs cfs
D
22
23
8.2
Terzaghi Method
22
'tan4
'
22
3 1tan4
as
HaK
D eHaK
ass
Hewllett & Randolph Method
322
12
322
1211
12
3
p
p
p
pK
DKH
Kas
KH
Ksas p
2
213
11111
2
1
s
aK
s
a
s
a
s
a
K
Ks
p
K
p
p
Dp
Figure 22. Procedure adopted in the use of analytical methods in GPRS embankments

Geotechnical Engineering Journal of the SEAGS & AGSSEA Vol 41 No.2 June 2010 ISSN 0046-5828
72
Figure 25 illustrates the procedure adopted in numerical
analysis using the Plaxis program.
Settlements
Numerical
modelling
Tensile force
Stress
concentration
ratios
Parametric
study
Compare
results
Figure 25. Illustration of the numerical procedure
9.5.3 Influence of support spacing
To analysis the influence of support spacing on stress reduction
ratio, the support spacing was varied from 0.5 to 2.5 while other
parameters are fixed. Then stress reduction ratio was calculated by
using the three analytical methods, and results are plotted below in
Fig. 26.
The graph suggests that there is a positive relationship between
stress reduction ratio and support spacing. Terzaghi Method (1943)
and Hewlett and Randolph Method (1988) produce similar trend in
S3D versus support spacing plot. When British Standard Method was
used, the calculated stress reduction ratio is sensitive to spacing
changing.
0
0.2
0.4
0.6
0.8
1
0 0.5 1 1.5 2 2.5
Support spacing (m)
Str
ess
red
ucti
on
rati
o 11
British standard
Terzaghi method
Hewlett and Randolph
Theory
Figure 26. Influence of support spacing on stress reduction ratio
9.5.4 Influence of s/a ratio
As discussed before, to control the design value of tensile force in
the geogrid, larger support should be used corresponding to larger
spacing, especially when spacing exceeds 2m. Analysis was
conducted to check S3D under fixed s/a ratio condition (see Figure
27).
S3D of Hewlett and Randolph Method experienced a sudden
increase after spacing reaches 2m. It is because S3D at top of support
dominates the results until the spacing exceeds 2m, and S3D at top of
the support is subject to s/a ratio, therefore it remains the same
provided that s/a ratio is fixed. On the other hand, S3D at the crown
of arching soil keep increasing as the spacing of the support
increase, and beyond the constant value at the top of the support
after 2m spacing; then becomes the larger of the two values and take
control of final S3D.
0
0.2
0.4
0.6
0.8
1
0 0.5 1 1.5 2 2.5
Support spacing (m)
Str
ess
red
ucti
on
rati
o 11
British standard
Terzaghi method
Hewlett and Randolph
Theory
Figure 27. Influence of support spacing on stress reduction ratio
with fixed s/a ratio
9.5.5 Influence of embankment material
Only Terzaghi Method (1943) and Hewlett and Randolph Method
(1988) consider the effect of embankment fill material on S3D, hence
only those two methods were studied by varying friction angle of
embankment fill, results are demonstrated in Figure 28.
9.5.6 Results from numerical method (Plaxis)
(a) Axi-symmetric model
The axi-symmetric model is adopted in the Plaxis analysis to
perform a parametric study. The four important materials involved
in the geometry are the piles, the geogrids, the foundation soil and
the embankment fill as shown in Figure 30. Input parameters are
shown in Table 11.
0.0
0.2
0.4
0.6
0.8
1.0
28 30 32 34 36 38 40
Friction angle of embankment fill (Degrees)
Str
ess
red
ucti
on
rati
o 11
Terzaghi method
Hewlett and Randolph Theory
Figure 28. Influence of friction angle of embankment on S3D
20
30
40
50
60
28 30 32 34 36 38 40
Friction angle of embankment fill (degrees)
Ten
sion
forc
e i
n g
eosy
nth
eti
c 1
1
(kN
/m)
Terzaghi method
Hewlett and Randolph Theory
Figure 29. Influence of friction angle of embankment on tensile
force in geogrids
Geotechnical Engineering Journal of the SEAGS & AGSSEA Vol 41 No.2 June 2010 ISSN 0046-5828
73
Embankment fill
Geosynthetic
Foundation soil
Support
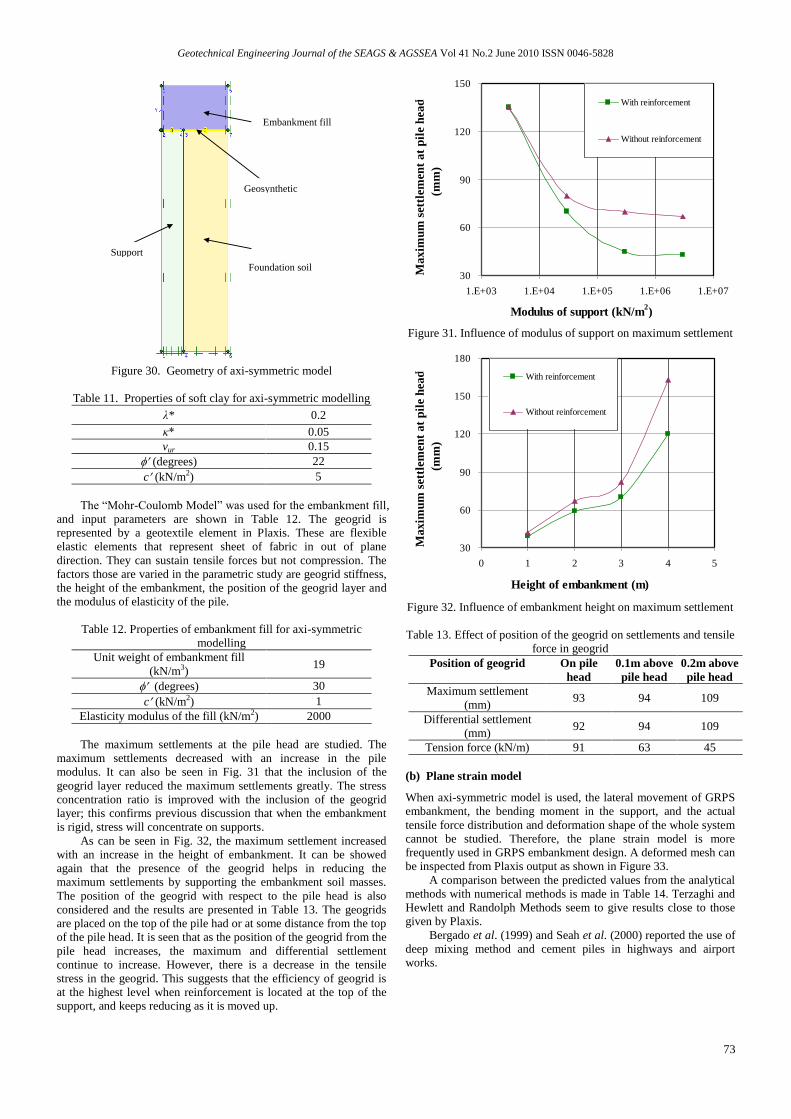
Figure 30. Geometry of axi-symmetric model
Table 11. Properties of soft clay for axi-symmetric modelling
λ* 0.2
κ* 0.05
vur 0.15
(degrees) 22
c (kN/m2) 5
The “Mohr-Coulomb Model” was used for the embankment fill,
and input parameters are shown in Table 12. The geogrid is
represented by a geotextile element in Plaxis. These are flexible
elastic elements that represent sheet of fabric in out of plane
direction. They can sustain tensile forces but not compression. The
factors those are varied in the parametric study are geogrid stiffness,
the height of the embankment, the position of the geogrid layer and
the modulus of elasticity of the pile.
Table 12. Properties of embankment fill for axi-symmetric
modelling
Unit weight of embankment fill
(kN/m3) 19
(degrees) 30
c (kN/m2) 1
Elasticity modulus of the fill (kN/m2) 2000
The maximum settlements at the pile head are studied. The
maximum settlements decreased with an increase in the pile
modulus. It can also be seen in Fig. 31 that the inclusion of the
geogrid layer reduced the maximum settlements greatly. The stress
concentration ratio is improved with the inclusion of the geogrid
layer; this confirms previous discussion that when the embankment
is rigid, stress will concentrate on supports.
As can be seen in Fig. 32, the maximum settlement increased
with an increase in the height of embankment. It can be showed
again that the presence of the geogrid helps in reducing the
maximum settlements by supporting the embankment soil masses.
The position of the geogrid with respect to the pile head is also
considered and the results are presented in Table 13. The geogrids
are placed on the top of the pile had or at some distance from the top
of the pile head. It is seen that as the position of the geogrid from the
pile head increases, the maximum and differential settlement
continue to increase. However, there is a decrease in the tensile
stress in the geogrid. This suggests that the efficiency of geogrid is
at the highest level when reinforcement is located at the top of the
support, and keeps reducing as it is moved up.
30
60
90
120
150
1.E+03 1.E+04 1.E+05 1.E+06 1.E+07
Modulus of support (kN/m2)
Maxim
um
sett
lem
en
t at
pil
e h
ead
11
(mm
)
With reinforcement
Without reinforcement
Figure 31. Influence of modulus of support on maximum settlement
30
60
90
120
150
180
0 1 2 3 4 5
Height of embankment (m)
Ma
xim
um
sett
lem
en
t a
t p
ile h
ead
1
(mm
)
With reinforcement
Without reinforcement
Figure 32. Influence of embankment height on maximum settlement
Table 13. Effect of position of the geogrid on settlements and tensile
force in geogrid
Position of geogrid On pile
head
0.1m above
pile head
0.2m above
pile head
Maximum settlement
(mm) 93 94 109
Differential settlement
(mm) 92 94 109
Tension force (kN/m) 91 63 45
(b) Plane strain model
When axi-symmetric model is used, the lateral movement of GRPS
embankment, the bending moment in the support, and the actual
tensile force distribution and deformation shape of the whole system
cannot be studied. Therefore, the plane strain model is more
frequently used in GRPS embankment design. A deformed mesh can
be inspected from Plaxis output as shown in Figure 33.
A comparison between the predicted values from the analytical
methods with numerical methods is made in Table 14. Terzaghi and
Hewlett and Randolph Methods seem to give results close to those
given by Plaxis.
Bergado et al. (1999) and Seah et al. (2000) reported the use of
deep mixing method and cement piles in highways and airport
works.

Geotechnical Engineering Journal of the SEAGS & AGSSEA Vol 41 No.2 June 2010 ISSN 0046-5828
74
Figure 33. Deformed meshes after calculation (Plane strain model)
Table 14. Comparison between predicted values for tensile force in
geogrid reinforcement
Methods Tensile force (kN/m)
Terzaghi 55
Hewlett and Randolph 47
Plaxis with void between supports 33
10. CONCLUSIONS
The major part of this paper is devoted to the evaluation of
settlements in embankments constructed in marine, deltaic and
estuarine soft soils. The estuarine deposits are more heterogeneous
with the soft soil layer thicknesses relatively small and at times the
thicknesses change rapidly within short distances. Over the years,
there is a substantial reduction in boreholes and laboratory tests as
carried out in site investigation works in soft soils. In situ tests and
in particular CPT and CPTu tests now play a dominant role in all
site investigation works. A simple voids ratio-logarithmic effective
stress relationship is shown to be very helpful in understanding the
degree of consolidation (DOC) and the OCR during removal of
surcharge and in estimating residual settlement arising from
secondary settlement. The classical expressions used in the
evaluation of settlements with and without PVD are tabulated. The
role of DOC in curtailing excessive residual settlement for
preloading with and without PVD is shown with diagrammatic
sketches using the pore pressure isochrones. The observational
approach in designing embankments and reclamation works as
based on fully instrumented test embankments is recommended. The
Asaoka method of estimating ultimate settlement from measured
surface settlement and then estimating DOC is recommended. The
Hansbo method is found to be adequate in works related to
preloading with PVD. The current geotechnical practice seem to
need the classical work done on shear strength and compressibility
of soft soils as there is a drastic reduction in traditional laboratory
tests in estimating these parameters and also the doubt on the quality
of samples. The use of CPT and CPTu tests is also emphasised. In
analysing the slopes of embankments, wedge type of analysis is
recommended when the thickness of the soft soil is relatively small
and the soft soils are underlain by hard layers.
Preliminary works on the geogrid reinforced pile supported
(GRPS) embankments is presented. BS8006, Terzaghi and Hewllett
and Randolph methods are found to make similar predictions in line
with the numerical analyses using Plaxis software for the behaviour
of GRPS embankments as used in approaches closed to structures.
ACKNOWLEDMENTS
It is very difficult and impossible for the first author to acknowledge
the long list of people on whom he relies for advice and help. First
the organisers of the conference and in particular Dr. Za-Chieh Moh,
Dr. John Li, Dr. CT Chin and Dr. DW Chang are thanked for their
kindness in inviting the first author to give this Tan Sri Prof. Chin
Lecture. Thanks are also due to Messrs Vasantha Wijekulasooriys,
Dr. Jayantha Ameratunga, Ian Hosking, Geoff Charlesworth, Dr.
Richard Gong, Peter Boyle, Cynthia Bok, Dr. Jeff Hsi, Patrick
Wong, Choo Chai Yong, Kenny Yee, Dr. Chu Jan , Dr. T. A. Ooi,
Dr. T. A. Seah and Prof. K.Y. Yong. Thanks are also due to Dr.
Ting Wen Hui, a long standing friend, who is always ready to help.
Prof. Sven Hansbo, Drs. Masaki Kitazume, Masaaki Terashi and
Rainer Massarsch are thanked for their great patience in answering
many of the queries. Finally, Prof. Harry Poulos and Prof.
Buddhima Indraratna are thanked for working as a team over an
extended period with many stimulating discussions. The first author
gratefully acknowledges the most valued help from the industry
colleagues and the professional societies AGS, SEAGS, AGSSEA
and ISSMGE, which makes him to be active in the geotechnical
circles and to continuously learn from many lectures given by
authoritative persons both at AIT and at Griffith University.
It is always a rewarding experience to learn so much from these
lecturers who are numerous in numbers.
11. REFERENCES
Ameratunga, J., (2010), Private communication, 2010
Ameratunga, J., Private communication, 2009.
Arulrajah, A., Bo, M. W., Nikraz, H. and Balasubramaniam A. S.,
“Geotechnical instrumentation monitoring of land reclamation
projects on soft soil foundations”, Proceedings of the 10th
Australia New Zealand Conference on Geomechanics, Volume
2, 2007, pp36-41.
Asaoka, A., “Observation procedure of settlement prediction”, Soils
and Foundations, Volume 18, Issue 4, 1978, pp87-101.
Balasubramaniam, A. S., Bergado, D.T., Wijekulasuriya, V., and
Oh, Y., “The influence of piezometric draw down on the test
embankment with vertical drains and surcharge in the Bangkok
sub-soils”, Proceedings of the 9th Australia New Zealand
Conference on Geomechanics, Auckland, New Zealand,
Volume 1, 2004, pp446-452.
Balasubramaniam, A.S., Bergado, D.T. and Phienwej, N., “The Full
Scale Field Test of Prefabricated Vertical Drains for The
Second Bangkok International Airport (SBIA), Final Report”,
Div. of Geotech. and Trans. Eng. AIT, Bangkok, Thailand,
1995, pp259.
Balasubramaniam, A.S., Brenner, R.P., Mallawarachy, R.V. and
Kuvijitjaru, S., “Performance of Sand Drains on Bangkok
Clays”, Sixth Southeast Asian Conference on Soil Engineering,
Volume 1, 1980, pp447-468.
Balasubramaniam, A.S., Chandra, S., and Bergado, D.T, "Recent
Developments in Ground Improvement Techniques", A.A.
Balkema Publishers, The Netherlands, 1984, pp587.
Bergado, D. T., Balasubramaniam, A. S., Chishti, I. A.,
Ruenkrairergsa, T., and Taesiri, Y., “Evaluation of the PVD
Performance at the Second Bangkok Chonburi Highway
(SBCH) Project”, Lowland Technology International, Volume
1, Issue2, 1999, pp 55-75.
Bergado, D. T., Balasubramaniam, A. S., Fannin, R. J. and Holtz, R.
D., “Prefabricated Vertical Drain (PVD) on Soft Bangkok
Clay”, Canadian Geotechnical Journal, Volume 39, Issue4,
2002, pp304-315.
Bergado, D. T., Chai, J. C., Miura, N. and Balasubramaniam, A. S.
“PVD Improvement of soft Bangkok Clay with Combined
Vacuum and Reduced Sand Embankment Preloading”,
Geotechnical Engineering, Journal of Southeast Asian
Geotechnical Engineering Society, Volume 28, Issue 1, 1998,
pp95-122.
Bergado, D. T., Rruenkrirergsa, T., Taesiri, Y. and
Balasubramaniam, A. S., “Deep Soil Mixing Used to Reduce
Embankment Settlement”, Ground Improvement, Volume 3,
1999, pp145-162.

Geotechnical Engineering Journal of the SEAGS & AGSSEA Vol 41 No.2 June 2010 ISSN 0046-5828
75
Bergado, D.T., Anderson, L.R., Miura, N., and Balasubramaniam,
A.S., "Soft Ground Improvement ", American Society of Civil
Engineers, 1996, 427 pages.
Bergado, D.T., Chai, J.C., Abiera, H.O., Alfaro, M.C. and
Balasubramaniam, A.S., “Interaction between Cohesive
Frictional Soil and Various Grid Reinforcements”, Geotextiles
and Geomembranes, Volume 12, 1993a, pp327-349.
Bergado, D.T., Hiroshi A., Alfaro, M.C. and Balasubramaniam,
A.S., “Smear Effects of Vertical Drains on Soft Bangkok
Clay”, Journal of Geotechnical Engineering, ASCE, Volume
117, Issue 10, 1991, pp1509-1530.
Bergado, D.T., Sayeed Ahmed, Sampaco, C.L., and
Balasubramaniam, A.S, "Settlement of Bangna-Bangpakong
Highway on Soft Bangkok Clay", Journal of the Geotechnical
Engineering Division, ASCE, Volume 116, Issue 1, 1990,
pp136-155.
Bergado, D.T., Shivashankar, R., Alfaro, M.C., Chai, J.C. and
Balasubramaniam, A.S., “Interaction Behaviour of Steel Grid
Reinforcements in a Clayey Sand”, Geotechnique, Volume 43,
Issue 4, 1993b, pp589-603
Bjerrum, L., and Simons, N.E., “Comparison of shear strength
characteristics of normally consolidated clays”, Proc. of
research conference on shear strength of cohesive soils,
Boulder, Colorado, 1960, pp771-724.
Bo, M.W., and Choa, V., “Reclamation and Ground Improvement”,
Thomson Press, Singapore, 2004.
Brand, E.W. and Brenner, R.P., Soft clay engineering, Elsevier
Publications, 1981.
Brand, E.W. and Premchitt, J., “Moderator’s report for the predicted
performance of the Muar test embankment”, Proc. Trial
Embankments on Malaysian Marine Clays, Volume 2, The
Malaysian Highway authority, 1989.
British standard 8006, Code of practice for strengthened/reinforced
soils and other fills, British Standard Institution, London.
Broms, B.B., “Embankment piles”, Proc. Int. Conf. on deep
foundations, Beijing, China, Volume 2, Issue 1, 1986, pp118-
128.
Chan, S.F., and Chin, F.K., “Engineering Characteristics of the Soils
along the Federal Highway in Kuala Lumpur, 6th -10th May
1972, Volume 2, 1972, pp41-45.
Chin, F.K., Chan, S.F., Faisal, A. and Tee, H.E., “The use of a
Reinforced Soil Wall in Rehabilitation of a High Slope
Failure”, Proc. Symposium on Application of Geosynthetics
and Geofibres in Southeast Asia, Petaling Jaya, August 1989,
pp2-10 to 2-18.
Choa, V., et al., “Pilot test for soil stabilization at Changi Airport”,
Proc. Sixth Asian Regional Conf. Soil Mech. And Foundation
Engrg., 1, Singapore, 1979b, pp141-144.
Choa, V., Vijiaratnam, A., Karunaratne, G.P., Ramaswamy, S.D.,
and Lee, S.L., “Consolidation of Changi marine clay using
flexible drains”, The European Conf Soil Mech and Found.
Eng., Brighton, Volume 3, 1979a, pp29-36.
Chu, J., Bo, M.W., and Arulrajah, A., “Reclamation of a slurry pond
in Singapore”, Proceedings of the Institution of Civil
Engineers, Geotechnical Engineering 162, Issue GE1, February
2009b, pp13-20.
Chu, J., Bo, M.W., and Arulrajah, A., “Soil improvement works for
an offshore land reclamation, Proceedings of the Institution of
Civil Engineers, Geotechnical Engineering 162, Issue GE,
February 2009a, pp21-32.
Chu, J., Bo, M.W., and Choa, V., “Practical considerations for using
vertical drainsin soil improvement projects”, Geotextiles and
Geomembranes, Volume 22, 2004, pp101-117
Collin, J.G., “U.S. State-of-practice for the design of the
geosynthetic reinforced load transfer platform in column
supported embankments”, Proceeding of Geo-Denver’2007,
New peaks in geotechnics, Denver, 2007.
Eide, O., “Exploration, sampling and in-situ testing of soft clay in
the Bangkok area”, Proc. of International Symposium on Soft
Clay, Thailand, 1977, pp122-137.
Eide, O., “Geotechnical engineering problems with soft Bangkok
clay on the Nakhon Sawan highway project”, Pub. No 78,
Norwegian Geotechnical Institute, Norway, 1968.
Han, J. and Wayne, M.H., “Pile-soil-geosynthetic interactions in
geosynthetic reinforced platform/piled embankments on soft
soil”, The 79th Annual Transportation Research Board
Meeting, January 2000.
Han, J., “Design and construction of embankments on geosynthetic
reinforced platforms supported on piles”, SCE/PaDOT,
Geotechnical Seminar in Hershey, April 1999.
Hansbo, S., “Conslidation of clay by band-shaped prefabricated
drains”, Ground Eng., Volume 12, Issue 5, 1979, pp16-25.
Hansbo, S., “Consolidation of clay with special reference to
influence of vertical sand drains”, Swedish Geotechnical
Institute, Proc., Issue 18, 1960, pp160.
Hansbo, S., “Consolidation of fine-grained soils by prefabricated
drains”, Proc. 10th Int. Conf. SMFE., Stockholm, Volume 3,
1981, pp677-682.
Hansbo, S., “Design aspects of vertical drains and lime column
installation”, Proc. 9th Southeast Asian Geotechnical
Conference, Volume 2, Issue 8, 1987, pp1-12.
Hewllett, W.J., and Randolph, M.F., “Analysis of piled
embankments”, Ground Engineering, Volume 21, Issue 3,
1988, pp12-18.
Holtz, R.D., Jamiolkowski, M., Lancellotta, R., and Pedroni, S.,
“Behaviour of Pre-prefabricated vertical drains”, Proc. 12th
ICSMFE, Rio de Janeiro, Volume 3, 1988, pp1657-1660.
Hsi, J., and Martin, J., “Soft ground treatment and performance,
Yelgun to Chinderah freeway, NSW, Australia”, Ground
Improvement Case histories. Edited by B. Indraratna and Jian
Chu, 2005.
Indraratna, B., and Chu, J., Ground Improvement-Case Histories,
2005.
Indraratna, B., Balasubramaniam, A. S., and Balachandran, S.,
“Performance of test embankment constructed to failure on soft
marine clay”, J. Geotech. Eng., ASCE, Issue 118, 1992, pp12-
33.
Indraratna, B., Rujikiatkamjorn C., Balasubramaniam, A. S., and
Wijeyakulasuriya, V., “Chapter 7 - Predictions and
observations of soft clay foundations stabilized with
geosynthetic drains and vacuum surcharge”, Ground
Improvement-Case Histories (ISBN 0-080-44633-7, edited by
Indraratna, B., and Chu, J.), 2005b, pp199-230.
Indraratna, B., Sathananthan, I., Bamunawita, C., and
Balasubramaniam, A. S., “Chapter 2 - Theoretical and
numerical perspectives and field observations for the design
and performance evaluation of embankments constructed on
soft marine clay”, Ground Improvement-Case Histories (ISBN
0-080-44633-7, Edited by Indraratna and Chu), 2005a, pp51-
90.
Jones, C.J.F.P., Lawson, C.R. and Ayres, D.J., “Geotextiles
reinforced piled embankment”, Proc. Geotextiles,
Geomembranes and related products, DenHoedt, A.A.Balkema,
Rotterdam, The Netherlands, 1990, pp155-160.
Lambe, T.W., and Whitman, R.V., Soil Mechanics, John Wiley and
sons, Inc., 1969, pp553.
Lee, S.L., Karunaratne, G.P., Lo, K.W., Yong, K.Y., and Choa, V.,
“Developments in soft ground engineering in Singapore”, Proc.
11th ICSMFE, San Francisco, 1985, pp1661-1666.
Li,Y, Aubeny, C and Briaud, Jean Louis, Geosynthetic reinforced
pile supported embankment, Private communication on draft
document, 2002.
Litwinowicz, A. and Smith, I.K., “A brief review of geotechnical
aspects and monitoring of Gateway Arterial roadworks north of
the Brisbane River”, Proceedings of 5th Australia - New
Zealand Conference on Geomechanics, Sydney, August 1988,
pp 298-304.
Loganathan, N., Balasubramanaim, A. S., and Bergado, D. T.
“Deformation analysis of embankments”, Journal of

Geotechnical Engineering Journal of the SEAGS & AGSSEA Vol 41 No.2 June 2010 ISSN 0046-5828
76
Geotechnical Engineering, ASCE, Volume 119, Issue 8, 1993,
pp1185-1206.
Long, P. V., Bergado, D. T., Giao, P. H., Balasubramaniam, A. S.
and Quang, N.C., “Back analyses of compressibility and flow
parameters of PVD improved soft ground in Southern
Vietnam”, Geosynthetics (ISBN 90 5966 044 7), Rotterdam,
2006, pp465-468.
Long, P.V., Bergado, D.T. and Balasubramaniam, A.S., “Stability
Analysis of Reinforced and Unreinforced Embankment on Soft
Ground”, Geosynthetics International Journal, Volume 3, Issue
5, 1996.
Lunne, T., Robertson, P.K., and Powell J.J.M., “Interpretation of
CPT/Piezocone Data”, Cone Penetration Testing in
Geotechnical Practice, 2002, pp57-72.
Masse, F., Yee, K., Jullienne, D., and Varaksin, S. “Application of
Vacuum Consolidation Method on Bangkok Clay to Road
Embankment”, Proceedings of IES Conference on Case Studies
in Geotechnical Engineering, Nanyang Technological
University, Singapore, 4 - 5 July 2002.
Mayne, P.W., “CPT indexing of in situ OCR in clays”, Proceedings
of the American Society f Engineers (ASCE) Specialty
Conference on In- Situ ’86: Use of In- Situ Tests in
Geotechnical Engineering, Blacksburg, 1986, pp780-93.
Mayne, P.W., “Determination of OCR in clays by piezocone tests
using cavity expansion and critical state concepts”, Soils and
Foundations, Volume 31, Issue 2, 1991, pp65-76.
Mayne, P.W., “In-situ Determination of Clay Stress History by
Piezocone. Predictive Soil Mechanics”, Proceedings of the
Wroth Memorial Symposium, Thomas Telford, London, 1993,
pp483-95.
Mesri, G, and Castro, A., “Cα/Cc concept and K0 during secondary
compression”, J. Geotech Eng., Volume 113, Issue3, 1987,
pp230-247.
Mesri, G., “Initial investigation of the soft clay test site at
Bothkennar”, Discussion, Geotechnique, Volume 43, Issue 3,
1993, pp503-504.
Mesri, G., “New design procedure for stability of soft clays”,
Discussion, J. of the Geotech. Eng. Div., ASCE, Volume 101,
Issue 4, 1975, pp409-412
Mesri, G., “Prediction and performance of earth structures on soft
clay”, Proc. First Int. Conf. on Coastal Development, Volume
2, Yokohama Japan, 1991, ppG2.1-G2.16.
Mesri, G., “Primary compression and secondary compression”,
Proc. Soil Behaviour and soft Ground construction, Geotech.
Spec. Publ. Issue119, ASCE, Reston, Va., 2001, pp122-166.
Mesri, G., and Vardhanabhuti, B., “Secondary compression”,
Journal of Geotechnical and Geoenvirinmental Engineering,
March 2005, pp398-401
Mesri, G., LO, D.O.K., and Feng, T.W., “Settlement of embankment
on soft clay”, Keynote Lecture, Settlement” 94,Geotch. Spec.
Publ. Issue 40, 1, Texas A and M University, College Station,
Tex., 1994, pp8-56.
Mitchell, J.K. and Gardner, W.S. “In Situ Measurement of volume
change characteristics”. Proceedings of the ASCE specialty
Conference on In Situ Measurements of Soil Properties,
Raleigh, North Carolina, 2, 1975, pp279-345, American
Society of Engineers (ASCE).
Moh, Z. C., Nelson, J. D., and Brand, E. W., “Strength and
deformation behaviour of Bangkok clay”, Proc. of 7th Int.
Conf. on Soil Mechanics and Foundation Engineering, Mexico,
1, 1969, pp287-295.
Moh, Z.C., and Lin, P., “Chapter 6 - Case Study of Ground
Improvement Work at the Suvarnabhumi Airport of Thailand”,
Ground Improvement-Case Histories (ISBN 0-080-44633-7,
edited by Indraratna and Chu), 2005, 159-198.
Moh, Z.C., and Woo, S.M., “Preconsolidation of Soft Bangkok Clay
by Non-Displacement Sand Drains and Surcharge”,
Proceedings of 9th Southeast Asian Geotechnical Conference,
Volume 2, 1987, pp8/171-8/184.
Muktabhant, C., Teerawong, P., and Tengamnuay, V., “Engineering
properties of Bangkok subsoils”, Proc. of Southeast Asian
Conference on Soil Engineering, Bangkok, 1, 1967, pp1-7.
Nakase, A. and Takemura, J, “Prediction of trial embankment built
to failure”, Proc. Trial Embankments on Malaysian Marine
Clays, Volume 2, The Malaysian Highway authority, 1989.
Oh, E. Y. N., Balasubramaniam, A. S., Bolton, M., Chai, G. W. K.,
Braund, M, Wijeyakulasuriya, V., Nithiraj, R., Bergado, D. T.,
“Soft Clay Properties and Their Influence in Preloading with
PVD and Sur-charge”, Proceedings of 15th Southeast Asian
Geotechnical Engineering Conference, Bangkok, Thailand,
Volume 1, 2004, pp79-84.
Ooi, T.A. and Yee, K., “Some Recent Development of Ground
Improvement Technology in Southeast Asia”, Proceedings of
the 30th Year Anniversary Symposium of the Southeast Asian
Geotechnical Society on Deep Foundations, Excavations,
Ground Improvements and Tunnelling, Bangkok, Thailand,
November 1997.
Osterman, J., “Notes on the shearing resistance of soft clays”, Acta
Polytechnica Scandinavica, Issue 263, 1959.
Poulos, H.G., “A method for analysing piled embankments”, Proc.
13th SEAGC, Taipei, Volume 1, 1998, pp. 551-556.
Poulos, H.G., Lee, C.Y., and Small, J.C., “Predicted behaviour of a
test embankment on a Malaysian marine clay”, Proc. Trial
Embankments on Malaysian Marine Clays, Volume 2, The
Malaysian Highway authority, 1989.
Robertson, N.F. “The use of monitoring for roadworks construction
control”, Proceedings of 4th Australia - New Zealand
Conference on Geomechanics, Perth, May 1984, pp 321-328.
Russell, D., and Pierpoint, N., “An assessment of design methods
for piled embankments”, Ground Engineering, Volume 30,
Issue 11, 1997, pp39-44.
Sambhandharaksa, S., “Engineering properties of soft Bangkok
clay”, keynote lecture, Proc. Of the International Symposium
on Geotechnical Aspects of the Second Bangkok International
(Suvarnabhumi) Airport in Thailand, Bangkok, 2006, pp23-29.
Sambhandharaksa, S., et al., “Settlement of structures and their
prediction in Bangkok subsoil”, Proc. Of the 9th Southeast
Asian Geotechnical Conference, Volume 1, Bangkok, 1987,
pp4-25-4-39.
Seah, T. H. and Suzuki, K., “Soil Cement Design of East Outer
Bangkok Ring Road”, Third Seminar on Ground Improvement
on Highways, Thailand, 2000, pp151-167.
Seah, T.H. “Design and Construction of Ground Improvement Work
at Suvarnabhumi Airport”, 2005.
Seah, T.H. and Juirnarongrit, T., “Constant Rate of Strain
Consolidation with Radial Drainage”, Geotechnical Testing
Journal, American Society for Testing and Materials, Volume
26, Issue 4, 2003, pp432-443.
Seah, T.H., and Koslanant, S., “Anisotropic Consolidation
Behaviour of Soft Bangkok Clay”. Geotechnical Testing
Journal, American Society for Testing and Materials, Volume
26, Issue 3, 2003, pp.266-276.
Seah, T.H., and Lai, K.C., “Strength and Deformation Behaviour of
Soft Bangkok Clay”, Geotechnical Testing Journal, American
Society for Testing and Materials, Volume 26, Issue 4, 2003,
pp.421-431.
Seah, T.H., Sangtian, N., and Chan, I.C., “Vane Shear Behaviour of
Soft Bangkok Clay”, Geotechnical Testing Journal, American
Society for Testing and Materials, Volume 27, Issue 1, 2004b,
pp57-66.
Seah, T.H., Tangthansup B., and Wongsatian, P., “Horizontal
Coefficient of Consolidation of Soft Bangkok Clay”,
Geotechnical Testing Journal, American Society for Testing
and Materials, Volume 27, Issue 5, 2004a, pp430-440.
Simons, N.E., “General Report, Session 2”, Conference on
settlement of structures, Cambridge, 1974.
Simons, N.E., “Settlement studies on two structures in Norway”, 4th
I.C. S.M.F.E., London, Volume 1, 1957, pp431-436.

Geotechnical Engineering Journal of the SEAGS & AGSSEA Vol 41 No.2 June 2010 ISSN 0046-5828
77
Simons, N.E., and Menzies, B.K., “Chapter 5 Settlement analysis”,
A short course in foundation engineering, GDS instrument
Ltd., England, 1975, pp85-103
Skempton, A. W., and Henkel, D.J., “The Post-Glacial Clays of the
Thames Estuary at Tilbury and Shellhaven”, Proc. 3rd Inter.
Conf. Soil Mech. Found. Eng. (Switzerland), Volume I, 1953,
pp302.
Tan, S.A., Karunaratne, G.P., Lee, S.L., and Choa, V., “Design of
drains and surcharge in reclamations”, Soils and Foundations,
Volume 27, Issue 4, 1987, pp88-98.
Terzaghi, K., Theoretical Soil Mechnics, John Wiley and Sons, New
York, 1943.
Ting, W.H., and Ooi, T.A., “Some properties of the Coastal
alluvium of Peninsular Malaysia”, Proc. International
Symposium on soft clays, Bangkok, 1977, pp89-101.
Ting, W.H., Chan, S.F. and K. Kassim, “Embankment with geogrid
and vertical drains”, Proc. Trial Embankments on Malaysian
Marine Clays, Volume 2, The Malaysian Highway authority,
1989.
Ting, W.H., Chan, S.F., and Kassim, K., “Embankment with
Geogrid and Vertical Drains”, International Symp. on Trial
Embankments on Malaysian Marine Clays, Kuala Lumpur,
November 6-8, 1989.
Ting, W.H., Chan, S.F., and Ooi, T.A., "Design Methodology and
Experiences with Pile Supported Embankments", Symposium
on Development in Geotechnical Engineering (From Harvard
to New Delhi), Thailand, 12 - 16 January 1994.
Ting, W.H., Toh C.T., and Chan, S.F., “Pile Supported Earth
Structures”, Conf. on Fn. Engineering and Construction
Practice, Singapore, January 1984.
Ting, W.H., Wong, T.F., and Toh, C.T., “Design Parameters for Soft
Grounds in Malaysia”, Proc. 9th S.E.A. Geotechnical
Conference, Bangkok, December 1987.
Varaksin, S., and Yee, K., “Challenges in Ground Improvement
Techniques for Extreme Conditions: Concept and
Performance” Keynote Paper, Proceedings of the 16th
Southeast Asian Geotechnical Conference, Kuala Lumpur,
Malaysia, 8 - 11 May 2007.
Whitaker, W.G., and Green, P.M., “Moreton Geology”, Department
of Mines, Queensland, 1980, [Online] Available:
http://www.ga.gov.au/map/ [26 July 2003]
Wijeyakulasuriya, V., Hobbs, G., and Brandon, A., “Some
experiences with performance monitoring of embankments on
soft clays”, Proc. 8th Australia New Zealand Conference on
Geomechanics, Institution of Engineers Australia: Hobart,
1999, pp 783-788.
Wilkes, P.F., “A geotechnical study of a trial embankment at Kings
Lynn”, Ph.D. Thesis, University of Surrey, 1974.
Wong, P., “Design and Monitoring of Preloads in Deep Soil Soils”,
Presentation in G30 1.15, Griffith University, Gold Coast
Campus, Australia, 2008.
Yee, K., “Consolidation of Soft Clay by Vertical Drainage Method”,
Proceedings of the International Conference on Soft Clay
Engineering, Institute of Engineers, Malaysia and University of
Technology, Malaysia, Kuala Lumpur, May 2000.
Yong, K. Y., and Lee, S.L., “Improvement of soft ground by vertical
drains, surcharge and high energy impact in highway
embankment construction” In Proceedings of International
Conference on Ground Improvement Techniques, 1997, pp13-
25.
12. NOTATION
12.1 Notations for settlement
cv Coefficient of consolidation in vertical direction
Cr Recompression index
Cc Compression index
CR Compression ratio
Ce Secondary compression parameter
C(oc) Overconsolidated secondary compression
parameter
dm Equivalent diameter of mandrel
ds Diameter of the cylinder of influence of the
drain (drain influence zone)
dw Equivalent diameter of mandrel
De Diameter of a circular drain
e0 Initial voids ratio
F
F(n) Drain spacing factor
F(r) Drain resistance factor
F(s) Soil disturbance factor
h Surcharge height during preloading
hcreep Surcharge to erase creep settlement
he Drainage height/length
H Layer thickness
Hc Layer thickness
He Embankment height
Ip Plasticity index
kh Coefficient of permeability in the horizontal
direction in the undisturbed soil
ks Coefficient of permeability in the horizontal
direction in the disturbed soil
l Width of vertical drain
m Power
mv Coefficient of volume compressibility
Nkt Cone factors
OCR Overconsolidation ratio
qt Corrected cone resistant
qT-Bar T-bar resistance
su Undrained shear strength
t100 Time for 100% primary consolidation
tp Time to complete primary consolidation
T Consolidation time
Th Time factor for horizontal consolidation
Tv Time factor for vertical consolidation
U Degree of consolidation
Uh Degree of consolidation due to horizontal
drainage
Uv Degree of consolidation due to vertical drainage
w Thickness of vertical drain
wn Natural water content
v Initial vertical stress
va Average vertical stress
12.2 Notations for GPRS embankment
a the size of the pile caps
c Cohesion
Cc Arching coefficient
ffs Partial factor for soil unit weight
H Height of embankment
K0 Coefficient of earth pressure at rest
Kp Coefficient of Passive earth pressure
S3D Stress reduction ratio
s Spacing of piles
Axial strain
Friction angle
Unit weight of soil
κ* Modified swelling index
λ* Modified compression index
ur Unloading reloading Poisson ratio
σc Load supported by column
σs Load supported by foundation soil
σsr Load supported by reinforcement
τ Shear stress

The 17th
Southeast Asian Geotechnical Conference Taipei, Taiwan, May 10~13, 2010
78
13. APPENDIX
Country Settlement Criteria
USA
(a) A slope of 1 in 200 is typically accepted. Such a slope tends to create a bump generating a dynamic factor for trucks of the order of 1.5 at most at
highway speeds when the truck “takes off” and lands on the bridge deck. The bridge beams should be designed for this increase in dynamic transient load. It
is not easy to minimize the bump.
(b) 0.5% is typical for an approach relative gradient in the design even though a lot of approach embankments in practice do not meet this criterion. Studies
showed that 0.5 in (12mm) differential settlement at the interface likely require maintenance but not intolerable.
Australia There are standard criteria for the RTA and QMR highways with a design speed greater than 100 km/hr. Essentially these criteria are to satisfy the riders’
comfort which is governed by change in grade of the pavement. They are indeed tight and have to be met.
Singapore
In Singapore, the post construction settlement for road embankment should not be more than 50mm (the above criteria is 100mm - 0.5% of 20m) and
differential not more than 1:200 Since the magnitude is small, in all projects, near 100% consolidation under design load is emphasised- this is achieved
either by more surcharge, closer drain spacing, longer consolidation time or a combination these three design factors - i.e. easier and cheaper to “over-treat”
than to do remedial measures when post-construction settlement exceeds the design criteria. If the soils are prone to secondary compression, treatment must
also mitigate the secondary settlement.
Malaysia
North- South
Highway
Concessionaire's)
design criteria
The design of embankments, particularly in areas of soft ground for which special ground treatment is either shown in the existing design or is indicated as
a result of supplementary soils investigations, is to be reviewed. The minimisation of ground treatment work and expense are the prime objectives consistent
with providing a satisfactory level of service in terms of acceptable post-construction settlements of the pavement, both differential and overall. In this
regard the following criteria shall apply.
Total Settlement:
(i) Following the opening of the Expressway for public use the settlement within the first seven years of service shall not exceed 10% of the sum of the total
theoretical primary consolidation settlement and secondary settlement, the latter being assessed for a period of 20 years;
(ii) In addition, settlement within the first seven years of service shall nowhere exceed 400mm.
Differential Settlement:
(i) In areas of transition between piled approach embankments and general low embankments differential settlement within the first seven years of service
shall not exceed 100mm within a length of 50m; and
(ii) In areas remote from structures and transition zones differential settlement shall not exceed 100mm within a length of 100m.
JKR (PWD)
design criteria
Total post construction settlement < 250mm except for approach embankment. For embankment within 10m from bridge abutment, the above settlement
criteria should be reduced to 15%.