Waste Management in Informal Settlements in Masvingo City ...
Upload
khangminh22Category
view
0download
0
Limpopo: Informal settlements status
research series published by the housing development agency
research reports

LIMPOPO research report
the housing development agency (hda)Block A, Riviera Office Park,
6 – 10 Riviera Road,
Killarney, Johannesburg
PO Box 3209, Houghton,
South Africa 2041
Tel: +27 11 544 1000
Fax: +27 11 544 1006/7
Acknowledgements• Eighty 20
© The Housing Development Agency 2012
disclaimerReasonable care has been taken in the preparation of this report. The information contained herein has been derived from sources believed to be accurate and reliable. The Housing Development Agency does not assume responsibility for any error, omission or opinion contained herein, including but not limited to any decisions made based on the content of this report.

LIMPOPO research report
page 1
contentsPart 1: Introduction 3
Part 2: Data sources and definitions 4
2.1 Survey and Census data 4
2.2 Other data from Stats SA 7
2.3 National Department of Human Settlements (NDHS) and LaPsis 8
2.4 Eskom’s Spot Building Count (also known as the Eskom Dwelling Layer) 8
Part 3: the number and size of informal settlements
in Limpopo 9
3.1 Estimating the number of households who live in informal settlements 9
3.2 Estimating the number of informal settlements 12
Part 4: profiling informal settlements in Limpopo 13
4.1 Basic living conditions and access to services 13
4.2 Profile of households and families 15
4.3 Age of settlements and permanence 16
4.4 Education 18
Part 5: conclusions 19
Part 6: contacts and references 20
Part 7: appendix: statistics south africa surveys 21
7.1 Community Survey 2007 21
7.2 General Household Survey 21
7.3 Income and Expenditure Survey 2005/6 22
7.4 Census 2001 22
7.5 Enumerator Areas 22

page 2LIMPOPO research report
corc Community Organisation Resource Centre
ea Enumeration Area
ghs General Household Survey
gis Geographical Information Systems
gti GeoTerraImage
hda Housing Development Agency
hh Households
ies Income and Expenditure Survey
lapsis Land and Property Spatial Information System
ndhs National Department of Human Settlements
psu Primary Sampling Unit
stats sa Statistics South Africa
List of abbreviations

page 3LIMPOPO research report
In terms of the HDA Act No. 23, 20081, the Housing Development Agency (HDA), is mandated
to assist organs of State with the upgrading of informal settlements. The HDA therefore
commissioned this study to investigate the availability of data and to analyse this data relating to
the profile, status and trends in informal settlements in South Africa, nationally and provincially
as well as for some of the larger municipalities. This report summarises available data for the
province of Limpopo.
part 1
Introduction
1 The HDA Act No.23, 2008, Section 7 (1) k.

page 4LIMPOPO research report
A number of data sources have been used for this study. These include household level data
from the 2001 Census and the 2007 Community Survey conducted by Statistics South Africa
(Stats SA). Settlement level data was also reviewed, including data from the NDHS, the HDA and
Eskom.
There is no single standard definition of an informal settlement across data sources, nor is there
alignment across data sources with regard to the demarcation of settlement areas. It is therefore
expected that estimates generated by various data sources will differ.
It is critical when using data to be aware of its derivation and any potential biases or weaknesses
within the data. Each data source is therefore discussed briefly and any issues pertaining to the
data are highlighted. A more detailed discussion on data sources is provided in the national report
on informal settlements prepared for the HDA.
2.1 survey and census data
Household-level data for this report was drawn from the 2001 Census and the 2007 Community
Survey (CS)2. Sample sizes for the General Household Survey (GHS) and the 2005/6 Income and
Expenditure Survey (IES)3 were too small to generate robust estimates4.
The census defines an informal settlement as ‘An unplanned settlement on land which has not
been surveyed or proclaimed as residential, consisting mainly of informal dwellings (shacks)’.
In turn, the census defines an ‘informal dwelling’ as: ‘A makeshift structure not erected according
to approved architectural plans’. In the 2001 Census all residential Enumeration Areas (EAs)5
are categorised as either Informal Settlements, Urban Settlements, Tribal Settlements or Farms.
In addition, dwellings are categorised as either formal dwellings6 or informal dwellings, including
shacks not in backyards, shacks in backyards and traditional dwellings. There are therefore two
potential indicators in the 2001 Census that can be used to identify households who live in
informal settlements, one based on enumeration area (Informal Settlement EA) and the other
based on the type of dwelling (shack not in backyard).
part 2
Data sources and definitions
2 The Community Survey is a nationally representative, large-scale household survey. It provides demographic and socio-economic information such as the extent of poor households, access to facilities and services, levels of employment/unemployment at national, provincial and municipal level.
3 The Income and Expenditure Survey was conducted by Statistics South Africa (Stats SA) between September 2005 and August 2006 (IES 2005/2006). It is based on the diary method of capture and was the first of its kind to be conducted by Stats SA.
4 There are 57 observations for households living in shacks not in backyards in the 2009 GHS and 56 observations in the 2005/6 IES.5 An EA is the smallest piece of land into which the country is divided for enumeration, of a size suitable for one fieldworker in an allocated period
of time. EA type is then the classification of EAs according to specific criteria which profiles land use and human settlement in an area.6 Formal dwellings include house or brick structure on a separate stand, flat in a block of flats, town/cluster/semi-detached house, house/flat/room
in backyard and a room/flatlet on a shared property.

page 5LIMPOPO research report
According to the 2001 Census, 56,000 households in Limpopo (5% of households) lived in an
informal dwelling or shack not in a backyard in 2001 while 24,000 households (2% of households)
lived in enumeration areas that are characterised as Informal Settlements. Just under 16,000
households live in both.
Unlike census data, survey data does not provide an EA descriptor. However, surveys do provide
an indication of dwelling types, aligned with the main categories defined in the census. In the
absence of an EA descriptor for informal settlements, the analysis of survey data relies on a
proxy indicator based dwelling type, namely those who live in an ‘Informal dwelling/shack, not in
backyard e.g. in an informal/squatter settlement’.
Census data can provide an indication of the suitability of this proxy. According to the Census,
of those households in Limpopo who live in EAs categorised as Informal Settlements, 66% live in
shacks not in backyards. A further 12% of households in these EAs live in formal dwellings, 11%
live in shacks in backyards (it is not clear whether the primary dwelling on the property is itself a
shack) and 10% live in traditional dwellings.
Conversely the data indicates that only 28% of all households in Limpopo who live in shacks not
in a backyard live in EAs categorised as Informal Settlements. 39% live in EAs categorised as Tribal
Settlements and 16% live in Urban Settlement EAs.
c h a r t 1
cross-over of type of dwelling and enumeration area: limpopo
EA: Informal Settlement 23 666
(2% of LP households)
66% of households who live in EAs classified as Informal Settlements, live in shacks not in backyards
28% of households who live in shacks not in backyards, live in EAs classified as Informal Settlements
Main dwelling: Informal dwelling/ shack not in backyard56 489
(5% of LP households)
15 644
(1% of LP households)
total households who live in an informal settlement or in a shack not in a backyard: 64 511
Source: Census 2001.

page 6LIMPOPO research report
The analysis based on surveys using the dwelling type indicator ‘shack not in backyard’ to identify
households who live in informal settlements should therefore be regarded as indicative as there is
insufficient data in the surveys to determine whether these households do, in fact, live in informal
settlements as defined by local or provincial authorities.
A further challenge with regard to survey data relates to the sampling frame. In cases where
survey sample EAs are selected at random from the Census 2001 frame, newly created or rapidly
growing settlements will be under-represented. Given the nature of settlement patterns, informal
settlements are arguably the most likely to be under-sampled, resulting in an under-count of
the number of households who live in an informal settlement. Further, if there is a relationship
between the socio-economic conditions of households who live in informal settlements and the
age of the settlement (as it seems plausible there will be) a reliance on survey data where there is
a natural bias towards older settlements will result in an inaccurate representation of the general
conditions of households who live in informal settlements. This limitation is particularly important
when exploring issues relating to length of stay, forms of tenure and access to services. A second
word of caution is therefore in order: survey data that is presented may under-count households
in informal settlements and is likely to have a bias towards older, more established settlements.
c h a r t 2
breakdowns of type of dwelling and enumeration area: limpopo
housing type breakdown for Informal settlement eas(Limpopo)
ea breakdown for shacks not in backyards(Limpopo)
Shack not in backyard 66%
Formal dwelling 12%
Traditional dwelling 10%
Shack in backyard 11%
Other 2%
Tribal settlement 39%
Informal Settlement 28%
Farm 15%
Other areas 2%
Source: Census 2001.Note: Formal dwelling includes flat in a block of flats, dwelling on a separate stand, backyard dwelling, room/flatlet, and town/cluster/semi-detached house.
Urban settlement 16%

page 7LIMPOPO research report
A final consideration relates to the underlying unit of analysis. Survey and census data sources
characterise individuals or households rather than individual settlements. These data sources
provide estimates of the population who live in informal settlements as well as indications of
their living conditions. The data as it is released cannot provide an overview of the size, growth
or conditions at a settlement level7 although it is possible to explore household-level data at
provincial and municipal level depending on the data source and sample size.
The definition of a household is critical in understanding household level data. By and large
household surveys define a household as a group of people who share a dwelling and financial
resources. According to Statistics SA ‘A household consists of a single person or a group of people
who live together for at least four nights a week, who eat from the same pot and who share
resources’. Using this definition, it is clear that a household count may not necessarily correspond
to a dwelling count; there may be more than one household living in a dwelling. Likewise a
household may occupy more than one dwelling structure.
From the perspective of household members themselves the dwelling-based household unit may
be incomplete. Household members who share financial resources and who regard the dwelling
unit as ‘home‘ may reside elsewhere. In addition, those who live in a dwelling and share resources
may not do so out of choice. Household formation is shaped by many factors, including housing
availability. If alternative housing options were available the household might reconstitute itself
into more than one household. Thus, while the survey definition of a household may accurately
describe the interactions between people who share a dwelling and share financial resources for
some or even most households, in other cases it may not. The surveys themselves do not enable
an interrogation of this directly.
2.2 other data from stats sa
A dwelling frame count was provided by Stats SA for the upcoming 2011 Census. The Dwelling
Frame is a register of the spatial location (physical address, geographic coordinates, and place
name) of dwelling units and other structures in the country8. It has been collated since 2005
and is approximately 70% complete. The Dwelling Frame is used to demarcate EAs for the 2011
Census9.
There are 40 sub-places in Limpopo with at least one EA classified as ‘Informal Residential’10,
totalling 119 EAs (covering a total area of 25.82 square kilometres). There are Dwelling Frame
estimates for 33 (83%) of these ‘Informal Residential’ EAs, totalling 11,978 Dwelling Frames.
Since the Dwelling Frame is only approximately 70% complete, and not all units are counted
within certain dwelling types, the count should not be seen as the official count of dwellings or
households within the EA type.
7 It may be possible for Statistics South Africa to match EA level data from the 2001 Census to settlements to provide an overview of specific settlements. Given that the Census data is ten years old, and that conditions in informal settlements are likely to have changed significantly since then, the feasibility of this analysis was not established.
8 Bhekani Khumalo (2009), ‘The Dwelling Frame project as a tool of achieving socially-friendly Enumeration Areas‘ boundaries for Census 2011, South Africa‘, Statistics South Africa.
9 An EA is the smallest piece of land into which the country is divided for enumeration, of a size suitable for one fieldworker in an allocated period of time. EA type is then the classification of EAs according to specific criteria which profiles land use and human settlement in an area.
10 The EA descriptor for informal settlements in the 2011 Census is ‘Informal Residential’; in 2001 the EA type was ‘Informal Settlement’.

page 8LIMPOPO research report
2.3 National Department of human settlements (NDhs) and Lapsis
The 2009/2010 Informal Settlement Atlas compiled by the NDHS indicates there are 135 informal
settlement polygons in Limpopo. No household estimates are provided.
LaPsis (Land and Property spatial information systems), an online system developed by the
HDA, builds on the data gathered by the NDHS and overlays onto it land and property data
including cadastre, ownership, title documents and deeds (from the Deeds Office), administrative
boundaries (from the Demarcation Board) and points of interest from service providers such
as AfriGIS11. The data indicates there are 151 informal settlements in Limpopo. No household
estimates are provided.
2.4 eskom’s spot Building count (also known as the eskom Dwelling Layer)
Eskom has mapped and classified structures in South Africa using image interpretation and manual
digitisation of high resolution satellite imagery. Where settlements are too dense to determine
the number of structures these areas are categorised as dense informal settlements. Identifiable
dwellings and building structures are mapped by points while dense informal settlements are
mapped by polygons.
Shape files provided by Eskom revealed 13 polygons categorised as Dense Informal Settlements
in Limpopo, covering a total area of 0.8 square kilometres. The dataset does not characterise
the areas, nor does it match areas to known settlements. Latest available data is based on 2008
imagery. Eskom is currently in the process of mapping 2009 imagery and plans to have mapped
2010 imagery by the end of the year.
11 AfriGIS was given informal settlements data by the provincial departments of housing to create the map layers.

page 9LIMPOPO research report
3.1 estimating the number of households who live in informal settlements
According to the Census, 24,000 households in Limpopo (2% of households in the province)
lived in EAs classified as Informal Settlements in 200112. 75% lived in enumeration areas classified
as Tribal Settlements and a further 11% in EAs classified as Urban Settlements. Limpopo province
accounts for 2% of all households in informal settlement EAs in the country (it accounts for 11%
of all households overall).
Census data at a municipal level is summarised below for Limpopo.
households living in informal settlement eas in limpopo
Municipality Number of hh in Informal settlement ea
% of hh in municipality/province that live in Informal settlement eas
Bohlabela
(now eliminated)
0 0%
Capricorn 8 949 3.1%
Mopani 2 062 0.9%
Greater Sekhukhune 0 0%
Vhembe 552 0.2%
Waterberg 12 103 7.2%
limpopo 23 666 1.9%
Source: Census 2001.
Note: The 12th amendment to the Constitution in December 2005 reduced the number of districts from 53 to 52 (Bohlabela was eliminated), and
also eliminated cross-border districts (each district is now completely contained within a province). With regards to Limpopo, Sekhukune was in 2001
also in Mpumalanga province. Those households are not included in the estimates above.
t a B L e 1
part 3
the number and size of informal settlements in Limpopo
12 With regards to settlement type, Informal Settlement is one of the ten EA descriptors used.

page 10LIMPOPO research report
According to the 2007 Community Survey 44,000 households (approximately 4% of households
in Limpopo) live in shacks not in backyards, down from 57,000 households (5% of households)
in 2001 as reported by the Census. In terms of absolute numbers there was a decrease of around
13,000 in the number of households living in shacks not in backyards between 2001 and 2007.
According to the Community Survey roughly 4% of households in shacks not in backyards live in
this province (roughly 10% of all households in the country live in this province).
According to the Community Survey, at over 12,500 the Waterberg Municipality has the highest
number of households living in shacks not in backyards in Limpopo. The chart below summarises
municipal-level data for Limpopo for all shacks, including shacks not in backyards and shacks
in backyards.
households living in shacks (by municipality): limpopo
Source: Community Survey 2007 HH.
% of HH living in shacks not in backyard
14 –
12 –
10 –
8 –
6 –
4 –
2 –
0 –
Number of households
(000s)
shack not in backyard
% of HH living in shacks in backyard
9 –
8 –
7 –
6 –
5 –
4 –
3 –
2 –
1 –
0 –Waterberg Greater
Sekhukhune
Capricorn Mopani
Vhembe
13
8%
12
4%
11
6
5%
3
2% 1%Number of households
(000s)
Capricorn Vhembe
Waterberg Greater Sekhukhune
Mopani
8
3%
6
4%
4 4
1%
2
2% 1%
shack in backyard
c h a r t 3
page 11LIMPOPO research report
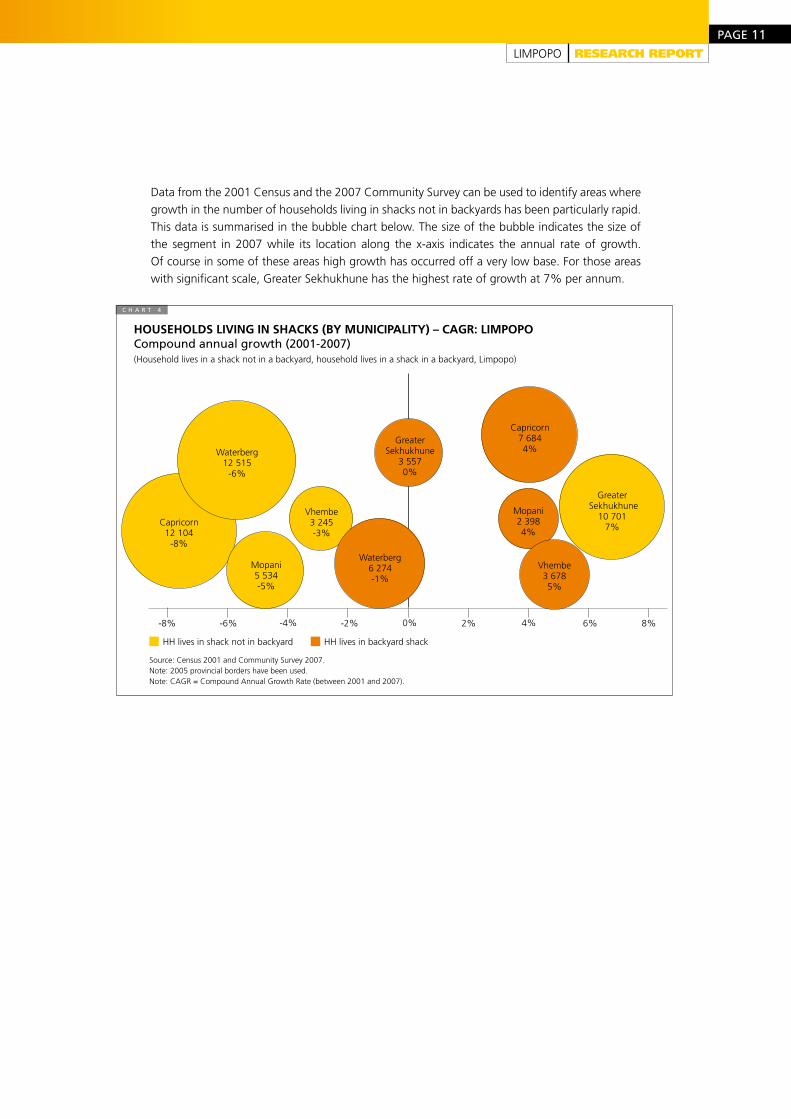
Data from the 2001 Census and the 2007 Community Survey can be used to identify areas where
growth in the number of households living in shacks not in backyards has been particularly rapid.
This data is summarised in the bubble chart below. The size of the bubble indicates the size of
the segment in 2007 while its location along the x-axis indicates the annual rate of growth.
Of course in some of these areas high growth has occurred off a very low base. For those areas
with significant scale, Greater Sekhukhune has the highest rate of growth at 7% per annum.
Vhembe3 245-3%
households living in shacks (by municipality) – cagr: limpopocompound annual growth (2001-2007)(Household lives in a shack not in a backyard, household lives in a shack in a backyard, Limpopo)
2%0% 6% 8%4%-2%-4%-6%-8%
Source: Census 2001 and Community Survey 2007.Note: 2005 provincial borders have been used.Note: CAGR = Compound Annual Growth Rate (between 2001 and 2007).
HH lives in shack not in backyard HH lives in backyard shack
c h a r t 4
Capricorn12 104
-8%
Waterberg6 274-1%
Capricorn7 6844%
Greater Sekhukhune
10 7017%
Mopani5 534-5%
Waterberg12 515
-6%
Greater Sekhukhune
3 5570%
Mopani2 3984%
Vhembe3 6785%

page 12LIMPOPO research report
3.2 estimating the number of informal settlements
While survey and census data provide an estimate based on households, various data sources
provide estimates of the number of informal settlements. LaPsis reports 151 informal settlements
across the province while the Informal Settlements Atlas dataset from the NDHS indicates
135 informal settlement polygons.
Available data sources at a ‘settlement‘ level are summarised below together with household
level data based on the 2001 Census and the 2007 Community Survey. Note that settlements are
identified and defined differently in these data sources.
estimates and/or counts of informal settlements and households
Number of informal settlements Number of households in informal
settlements
LaPsis: Informal settlements
Atlas: Informal settlement polygons
Stats SA: Sub Places with at least one EA classified as ‘Informal Residential’
Eskom: Polygons classified as ‘Dense Informal’
Census 2001: HH in informal settlement EA
Census 2001: HH in shacks not in backyards
Community Survey 2007: HH in shacks not in backyards
Bohlabela (now eliminated)
– – 0 2 240 –
Capricorn 12 12 8 949 19 576 12 104
Mopani 20 6 2 062 7 331 5 534
Greater Sekhukhune
4 – 0 4 941 10 701
Vhembe 9 5 552 3 963 3 245
Waterberg 106 101 12 103 18 437 12 515
limpopo 151 135 40 13 23 666 56 489 44 099
* Households in informal settlements to be upgraded between 2010/11 and 2013/14 (Outcome 813): 31,200 in Limpopo.
t a B L e 2
13 Outcome 8 relates to Sustainable Human Settlements and Improved Quality of Life. National government has agreed on twelve outcomes as a key focus of work between 2010/11 and 2013/14.

page 13LIMPOPO research report
part 4
profiling informal settlements in Limpopo
The analysis of survey data investigates the characteristics of the dwellings and the profile of
households and individuals living in shacks not in backyards. As noted this variable is a proxy
for households who live in informal settlements. Where available, Census 2001 data relating
to households who live in Informal Settlement EAs has been summarised in the introductory
comments at the start of each sub-chapter.
4.1 Basic living conditions and access to services
In 2001, 16% of households living in informal settlement EAs had piped water in their dwelling or
on their yard. A further 25% could obtain piped water within 200 metres of their dwellings. 52%
had access to piped water in excess of 200 metres from their dwellings (there is no indication of
how far away the water source is) while 7% had no access at all. 7% of households in informal
settlement EAs had flush toilets, 45% used pit latrines, 1% used bucket latrines and 2% had
chemical toilets; the remaining 44% had no access to toilet facilities. 10% of households in
informal settlement EAs used electricity for lighting and 26% had their refuse removed by the
local authority.

page 14LIMPOPO research report
Key trends relating to access to services for households living in shacks not in backyards are
summarised in the chart below.
2%1%
30%42%
Source: Census 2001 and Community Survey 2007 HH.* Other toilet facilities includes Chemical toilet and Dry toilet facility.** Other water source incudes Borehole, Flowing water, Stagnant water, Well, Spring and Other.*** Other energy sources includes Gas, Solar and Other.Note: In the 2007 CS, refuse removed by local authority also includes refuse removed by private company.
Communal refuse dump
Removed by local authority less often
No rubbish disposal
Removed by local authority at least
once a week
Own refuse dump
Candles
Electricity
Paraffin
Other***
%
Census 2001
Community Survey 2007
65%
50%
25%
38%
9% 11%
1%
energy used for lighting
Pit latrine
Flush
Other*
Bucket latrine
None
100 –
80 –
60 –
40 –
20 –
0 –
%
Census 2001
Community Survey 2007
47%55%
2%8%
9%5%
toilet facility
%
Census 2001
Community Survey 2007
62% 66%
17%
16%
2%2%
12%
18%
refuse collection
Piped water in dwelling
Other**
Piped water in yard
Piped water on community stand
%
Census 2001
Community Survey 2007
56% 54%
22% 22%
20%
2%
source of drinking water
7%
18%
access to services: household lives in shack not in backyard in limpopo
c h a r t 5
100 –
80 –
60 –
40 –
20 –
0 –
100 –
80 –
60 –
40 –
20 –
0 –
100 –
80 –
60 –
40 –
20 –
0 –
1%
4%

page 15LIMPOPO research report
14 A household is considered over-crowded if there are more than two people per room. It is possible that this estimate is understated in the case where more than one household inhabits the same dwelling.
Access to services appears to have improved between 2001 and 2007; the proportion of
households who live in shacks not in backyards who say they have no toilet facilities declined from
42% in 2001 to 30% in 2007. Drinking water access improved slightly while use of electricity for
lighting increased from 25% to 38% between 2001 and 2007. An exception is refuse removal.
In 2001, 20% of households that live in shacks not in a backyard had their refuse removed by the
local authority. In 2007, 12% of households that live in a shack not in a backyard had their refuse
removed by the local authority or a private company.
As has been highlighted, a word of caution is required in interpreting this data given potential
biases in the sample design towards more established settlements where service provision is
better.
4.2 profile of households and families
In 2001, 26% of Limpopo households living in informal settlement EAs were single person
households. The average household size was 3.1. The majority of households were headed by
males (58%).
According to the 2007 Community Survey, 28% of households in Limpopo living in shacks
not in backyards comprise a single individual. This is slightly higher than the national average
for households living in shacks not in backyards where 23% comprise a single individual. It is
noteworthy that 29% of these individuals who live on their own are married.
According to the Community Survey 38% of Limpopo households living in shacks not in backyards
comprise four or more persons. The average household size of households living in shacks not in
backyards in 2007 is 3.3 (in 2001 this was 3.2), which is slightly lower than the provincial average
of 4.2 for those living in formal dwellings (in 2001 this was 4.3). 34% of households living in
shacks not in backyards live in over-crowded conditions14.
Household heads in shacks not in backyards are noticeably younger than those in formal dwellings;
40% are under the age of 35 compared to 21% in households who live in formal dwellings.
67,000 children under the age of 18 live in shacks not in backyards corresponding to 44% of the
population who live in these dwellings. According to the Community Survey 58% of households
in shacks not in backyards have one or more children.

page 16LIMPOPO research report
4.3 age of settlements and permanence
In 2001, just over half of households living in informal settlement EAs in Limpopo (55%) were
living there five years previously. In 2001, 33% of households living in informal settlement EAs
claimed to own their dwelling; 14% rented and 51% occupied the dwelling rent-free. 15% of
Limpopo households in informal settlement EAs had another dwelling aside from their main
dwelling.
Analysis of data from the 2007 Community Survey indicates that the majority of people living in
Limpopo in a shack not in a backyard in 2007 had been living there for an extended period of
time. Across the province, 58% said they had not moved since 2001. Those who have moved
since 2001 mainly moved from within the province though a small proportion of people moved
from surrounding provinces and from the Eastern Cape.
There may be some basis for a degree of scepticism when looking at this data. As noted in the
overview of data sources, there may well be a sampling bias towards older, more established
settlements. In addition, if households in informal settlements believe there is a link between the
duration of their stay in that settlement and their rights either to remain in the settlement or to
benefit from any upgrading programmes they may well have an interest in over-stating the length
of time they have lived in their dwellings.
year and province moved from: limpopo
Source: Community Survey 2007 Persons. Note*: Sample sizes for some provinces less than 40.
c h a r t 6
Year person moved into this dwelling(Lives in an informal dwelling / shack not in backyard,
Limpopo)
province lived in before moving to this dwelling*(Lives in an informal dwelling / shack not in backyard,
moved in after 2001, Limpopo)
2007
2006
2005
2004
2001-2003
Born after October 2001
Have not moved since October 2001
NC0%
WC0%
NW2%
EC4%
FS0%
LP82%
GA3%
MP5%
KZN0%
Outside RSA3%
58%
2%
5%
8%
6%
15%
5%

page 17LIMPOPO research report
Data on tenure status can also provide an indication of permanence. The primary survey categories
include rental, ownership (with or without a mortgage or other form of finance) and rent free
occupation. Survey data on tenure is summarised below.
dwelling tenure across different surveys: limpopo
Source: Census 2001 (10% sample), Community Survey 2007, GHS 2009; Household databases.Note: The breakdown of ownership does not include ‘Other’ due to small sample sizes.
Owned Occupied rent-free Rented
100 –
80 –
60 –
40 –
20 –
0 –
38%49%
55%35%
8%16%
Total number of households
hh lives in an informal dwelling/ shack not in backyard: Limpopo
56,489
Census 2001 Census 2001
59% 58%
25% 27%
15% 14%
44,099
CS 2007 CS 2007
% proportion of households
100 –
80 –
60 –
40 –
20 –
0 –
21,214 23,592
hh lives in an informal dwelling/ shack in backyard: Limpopo
c h a r t 7

page 18LIMPOPO research report
There has been a noticeable increase both in stated ownership and in rentals for those who live in
shacks not in backyards. However, data on tenure status can be difficult to interpret. There is no
indication whether ownership is formal (i.e. whether there is a title deed). Further, it is not entirely
clear what ‘ownership‘ means to the household. On the one hand those who say they own
their dwellings may be communicating a strong sense of belonging and permanence despite the
informal nature of the dwelling. They may also reflect growing official recognition of their rights
despite the lack of formal title. Alternatively those who say they own their dwellings may simply
be referring to their ownership of the building materials used to construct their dwellings. Data
on rentals is also difficult to interpret. Some households who say they rent their shacks may own
the building materials but rent the land; if they were to be evicted from the land they would still
retain possession of the physical structure. Other renter households may rent both the structure
and the land. The proportion of those who live in shacks in backyards who say they rent their
dwellings is noticeably lower than the national average of 48%. It is not clear whether those who
say they own backyard shacks mean they own the structure and rent access to land or whether
they own the main dwelling on the property and have rented it out.
4.4 education
In 2001, 26% of adults aged 18 and above living in informal settlement EAs had no schooling;
15% had a Matric and a further 2% completed Technikon, University or other Post Matric.
According to the 2007 Community Survey 14% of adults aged 18 and above living in shacks not
in backyards in Limpopo had no schooling. This is noticeably lower than the 2001 Census which
found that 26% had no schooling.

page 19LIMPOPO research report
part 5
conclusionsBy their nature, informal settlements are difficult to monitor. They can change more rapidly than the
systems designed to monitor them. Nevertheless, there is some data available, although it is far less
detailed in the case of Limpopo than it is for many other provinces.
The schema below summarises some of the most common indicators associated with individuals,
households, dwellings and settlements. While the importance of the indicators depends on the
analysis required, those indicators in red are thought to be particularly important to track over time
in order to assess priorities for upgrading purposes. To populate this data, a range of data sources is
required, including photography, household surveys, municipal data relating to services provided and
available infrastructure as well as location and capacity indicators relating to facilities such as schools,
hospitals and law enforcement.
Individuals household level Dwelling level settlement level
• Number• Age • Gender• Place of birth• Highest level of education• School attendance• Occupation• Marital status• Spouse live in the dwelling• Relationship to household
head• Perception of key risks• Experience of key risks• Health levels• Experience of crime• Date moved to the
settlement• Date moved into the
dwelling
• Number of households• Household size• Household composition• Household income• Year household moved to
the settlement• Year household moved into
the dwelling• Household level access to
water, sanitation, electricity and refuse removal
• Rental/ownership of land• Basis of land ownership
(formal title or other)• Rental/ownership of
dwelling• Number of people employed
in the household• Number of grant recipients
in the household
• Number of dwellings• Dwelling size (rooms
and squ. meterage) • Type of dwelling• Materials used to
construct the dwelling
• Number of settlements• Boundary and square meterage• Dwelling count and densities• Household count• Key community based
organisations active in the settlement
• Facilities, density and capacity indicators within/near settlement
– Health – Safety – Social services – Education – Transport and roads – Commercial facilities• Proximity to and capacity of bulk
service infrastructure• Burden of disease (as per health
records)• Reported crime (as per police
records or community forums)• Reported incidents of fire• Reported incidents of flooding• Land ownership• Geo technical characteristics
Household survey Household survey Household surveyAerial photography
Satellite photographyAerial photographyHousehold surveysMunicipal dataOther agency data
informal settlement indicators
c h a r t 8

page 20LIMPOPO research report
List of key contacts
Alwyn Esterhuizen, AfriGIS (email and telephone)
Isabelle Schmidt Dr., Statistics South Africa (telephone and email)
Maria Rodrigu, Chamber of Mines Information Services (email and telephone)
Niel Roux, Statistics South Africa (email and telephone)
Pieter Sevenshuysen, Remote Sensing and GIS Applications, GTI (email and telephone)
Rob Anderson, Statistics South Africa (email and telephone)
Stuart Martin, GTI (email and personal interview)
other sources
Census 2001, Statistics South Africa
Community Survey 2007, Statistics South Africa
General Household Survey (various years), Statistics South Africa
http://www.info.gov.za/events/2011/sona/supplement_poa.htm
Income and Expenditure Survey 2005/6, Statistics South Africa
Labour Force Survey 2004, Statistics South Africa
2009 National Housing Code, Incremental Interventions: Upgrading Informal Settlements (Part 3)
Bhekani Khumalo (2009), ‘The Dwelling Frame project as a tool of achieving socially-friendly
Enumeration Areas boundaries for Census 2011, South Africa’, Statistics South Africa
Catherine Cross (2010), ‘Reaching further towards sustainable human settlements’, Presentation
to DBSA 2010 Conference, 20 October 2010, HSRC
Land and Property Spatial Information System (LaPsis) data, provided by the HDA
National Department of Human Settlement 2009/2010 Informal Settlement Atlas, provided by
the HDA
part 6
contacts and references

page 21LIMPOPO research report
part 7
appendix: statisticssouth africa surveys
7.1 community survey 2007
The 2007 Community Survey, the largest survey conducted by Stats SA, was designed to bridge
the gap between the 2001 Census and the next Census scheduled for 2011. A total of 274,348
dwelling units were sampled across all provinces (238,067 completed a questionnaire, 15,393 were
categorised as non-response and 20,888 were invalid or out of scope). There is some rounding of
data (decimal fractions occurring due to weightings are rounded to whole numbers, therefore the
sum of separate values may not equal the totals exactly) in deriving final estimates. In addition,
imputation was used in some cases for responses that were unavailable, unknown, incorrect or
inconsistent. Imputations include a combination of logical imputation, where a consistent value is
calculated using other information from households, and dynamic imputation, where a consistent
value is calculated from another person or household having similar characteristics.
Several cautionary notes on limitations in the data were included with the release of reports on
national and provincial estimates in October 200715. The October 2007 release adjusted estimates
of the survey at national and provincial levels to ensure consistency by age, population group
and gender. Estimates at a municipal level were reviewed due to systematic biases (as a result
of small sample sizes). These revisions used projected values from the 1996 and 2001 Censuses.
Adjustments were made to the number of households separately to the number of individuals.
Direct estimates from the Community Survey are therefore not reliable for some municipalities.
However, measurement using proportions rather than numbers is less prone to random error.
Therefore the Community Survey is useful for estimating proportions, averages and ratios for
smaller geographical areas.
7.2 general household survey
The target population of the General Household Survey consists of all private households in
South Africa as well as residents in workers‘ hostels. The survey does not cover other collective
living quarters such as students‘ hostels, old age homes, hospitals, prisons and military barracks.
It is therefore representative of non-institutionalised and non-military persons or households in
South Africa.
15 More details on this can be found in the Community Survey statistical release provided by Stats SA (P0301.1).

page 22LIMPOPO research report
The sample was selected by stratifying by province and then by district council. Primary Sampling
Units (PSUs) were randomly selected from the strata and then Dwelling Units were randomly
selected from within the PSUs. For the 2007 GHS, a total of 34,902 households were visited
across the country and 29,311 were successfully interviewed during face-to-face interviews. For
the 2009 GHS, a total of 32,636 households were visited across the country and 25,361 were
successfully interviewed during face-to-face interviews. To arrive at the final household estimate
the observations were weighted up to be representative of the target population.
7.3 Income and expenditure survey 2005/6
The Income and Expenditure Survey is a survey of the income and expenditure patterns of 21,144
households. This survey was conducted by Stats SA between September 2005 and August 2006.
It is based on the diary method of capture. It is the most comprehensive nationally representative
source for data on household income; however income estimates in this survey are lower than
estimates in the national income accounts reported by the Reserve Bank. The Analysis of Results
report published by Stats SA highlights that respondents will under-report income ‘either through
forgetfulness or out of a misplaced concern that their reported data could fall into the hands of
the taxation authority’16. No adjustments have been made.
7.4 census 2001
The Statistical Act in South Africa regulates the country‘s Censuses. In general a census should
be conducted every five years unless otherwise advised by the Statistics Council and approved by
the Minister in charge. The Act also allows the Minister to postpone a census. In the case of the
census meant to follow that of 2001, a postponement was granted in order to examine the best
approach to build capacity and available resources for the next census. Consequently the next
Census will only take place in late 2011.
7.5 enumerator areas
All EAs, which are mapped during the dwelling frame and listing process for Census, have a
chance to be selected for the master sample used in the Stats SA sample surveys. Once an EA is
listed, the listing is maintained, and it has a chance to be selected for a survey based on the Stats
SA stratification criteria. Thus, the EA is chosen regardless of the classification that was done in
Census 2001.
16 Statistics South Africa (2008), Income and Expenditure of Households 2005/2006: Analysis of Results, Report No. 01-00-01, 2008.
page 23LIMPOPO research report
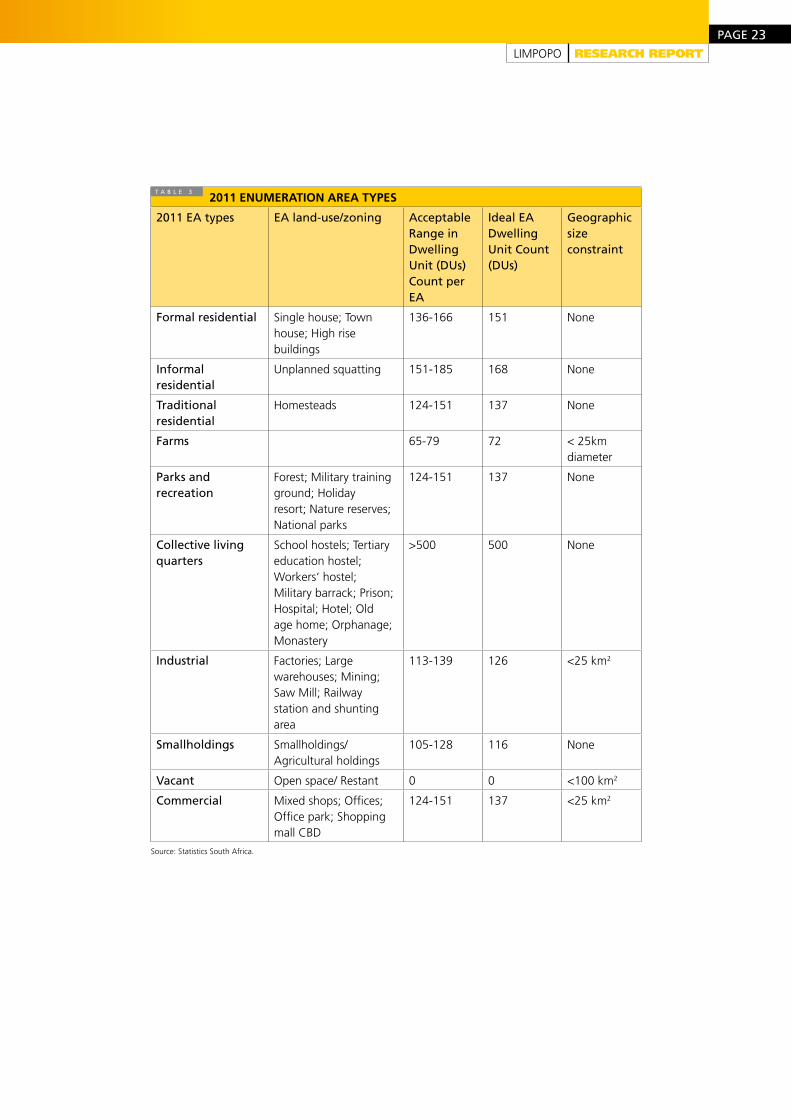
2011 enumeration area types
2011 ea types ea land-use/zoning acceptable range in Dwelling Unit (DUs) count per ea
Ideal ea Dwelling Unit count (DUs)
geographic size constraint
Formal residential Single house; Town house; High rise buildings
136-166 151 None
Informal residential
Unplanned squatting 151-185 168 None
traditional residential
Homesteads 124-151 137 None
Farms 65-79 72 < 25km diameter
parks and recreation
Forest; Military training ground; Holiday resort; Nature reserves; National parks
124-151 137 None
collective living quarters
School hostels; Tertiary education hostel; Workers‘ hostel; Military barrack; Prison; Hospital; Hotel; Old age home; Orphanage; Monastery
>500 500 None
Industrial Factories; Large warehouses; Mining; Saw Mill; Railway station and shunting area
113-139 126 <25 km2
smallholdings Smallholdings/Agricultural holdings
105-128 116 None
Vacant Open space/ Restant 0 0 <100 km2
commercial Mixed shops; Offices; Office park; Shopping mall CBD
124-151 137 <25 km2
Source: Statistics South Africa.
t a B L e 3

page 24LIMPOPO research report

LIMPOPO research report

the housing development agency (hda)Block A, Riviera Office Park,
6 – 10 Riviera Road,
Killarney, Johannesburg
PO Box 3209, Houghton,
South Africa 2041
Tel: +27 11 544 1000
Fax: +27 11 544 1006/7
www.thehda.co.za
Copyright © 2022 FDOKUMEN