use of national currencies in international settlements ...
114
USE OF NATIONAL CURRENCIES IN INTERNATIONAL SETTLEMENTS. EXPERIENCE OF THE BRICS COUNTRIES Moscow RISS 2017 JOINT RESEARCH PAPER
-
Upload
khangminh22 -
Category
Documents
-
view
0 -
download
0
Transcript of use of national currencies in international settlements ...

USE OF NATIONAL CURRENCIES IN INTERNATIONAL SETTLEMENTS.EXPERIENCE OF THE BRICS COUNTRIES
MoscowRISS2017
JOINT RESEARCH PAPER

2
USE OF NATIONAL CURRENCIES IN INTERNATIONAL SETTLEMENTS. EXPERIENCE OF THE BRICS COUNTRIES
AuthorsUallace Moreira Lima (Federal University of Bahia); Marcelo Xavier do Nascimento (Federal University of Pernambuco);
Sergey Karataev, Nikolay Troshin, Pavel Zakharov, Natalya Gribova, Ivan Bazhenov (Russian Institute for Strategic Studies);
Shekhar Hari Kumar, Ila Patnaik (National Institute of Public Finance and Policy);
Liu Dongmin, Xiao Lisheng, Lu Ting, Xiong Aizong, Zhang Chi (Institute of World Economics and Politics, Chinese Academy of Social Sciences);
Ronney Ncwadi (Nelson Mandela Metropolitan University); Jaya Josie (Human Sciences Research Council)
EditorsSergey Karataev, Nikolay Troshin, Ivan Bazhenov, Jaya Josie
Design and PublicationOleg Strizhak, Olga Farenkova (Russian Institute for Strategic Studies)
AbstractFinancial crises of the past decades revealed the instability of the modern international monetary system based on a single dominant currency. Increasing the role and turnover of national currencies in international economic transactions and payments would contribute to redressing the existing imbalance. BRICS countries’ experience indicates that effi cient currency internationalization can be reached by both forming a number of prerequisites and fi nancial and economic policies pursued by the authorities. Strengthening the BRICS countries’ collaboration and implementation of joint initiatives should help create favorable conditions for promoting a wider use of their currencies in international settlements.
KeywordsBRICS – Currency internationalization – Emerging markets – International monetary system – International settlements
Th e views expressed in this survey are those of the authors and do not necessarily represent the views of the Russian Institute for Strategic Studies.
All rights reserved. Reproduction is authorised provided the source is acknowledged.
ISBN 978-5-7893-0271-2 © Russian Institute for Strategic Studies, 2017

Contents
Abbreviations and acronyms ........................................................................................4
Executive summary ........................................................................................................7
Introduction ..................................................................................................................10
Chapter 1. Theoretical Aspects of National Currencies’ Internationalization ...11
Chapter 2. The Recent Evolution of the Local Currency Payments Systemof the Brazilian Economy ............................................................................................23
Chapter 3. Russia’s Deal on Promoting the Regional Status of the Ruble ....36
Chapter 4. Internationalization of the Indian Rupee ..........................................57
Chapter 5. The Internationalization of RMB: China’s Experience ..................76
Chapter 6. Towards National Currency Usage in International TransactionSettlements: Specific Experiences in BRICS — the Case of South Africa .....97
Conclusion ................................................................................................................... 109

4
USE OF NATIONAL CURRENCIES IN INTERNATIONAL SETTLEMENTS. EXPERIENCE OF THE BRICS COUNTRIES
ADR American Depository Receipt
AED United Arab Emirates dirham
APAC Asia-Pacifi c
ASEAN Association of Southeast Asian Nations
BCB Brazilian Central Bank
BIS Bank for International Settlements
BRIC Brazil, Russia, India, China
BRICS Brazil, Russia, India, China, South Africa
BRIS Brazil, Russia, India, South Africa
BRL Brazilian Real
BYN Belarusian Ruble
CIPS Cross-Border Interbank Payment System
CIS Commonwealth of Independent States
CISCA Collective Investment Schemes Control Act (South Africa)
CMA Common Monetary Area
CME Chicago Mercantile Exchange
CNAE National Register of Economical Activities (Brazil)
CNAPS China National Advanced Payment System
CNY Chinese Yuan (Renminbi)
COFER Currency Composition of Offi cial Foreign Exchange Reserves
CRA Contingent Reserve Arrangement
CSRC China Securities Regulatory Commission
EAEU Eurasian Economic Union
EBRD European Bank for Reconstruction and Development
ECB External Commercial Borrowings
EM Emerging Market
EMDE Emerging Market and Developing Economy
EU European Union
EUR Euro
FATF Financial Action Task Force
FCS Federal Customs Service (Russia)
FDI Foreign Direct Investment
FED US Federal Reserve System
FEMA Foreign Exchange Management Act (India)
FHC Fernando Henrique Cardoso, 34th President of Brazil (1995-2003)
ABBREVIATIONS AND ACRONYMS

5
EXECUTIVE SUMMARY
FOB Free On Board
FPI Foreign Portfolio Investment
FX Foreign Exchange
GBP Pound Sterling
GDP Gross Domestic Product
GFC Global Financial Crisis
HK Hong Kong Special Administrative Region
HVPS High Value Payment System (China)
IEI International Economic Integration
IFC International Financial Center
IMF International Monetary Fund
INR Indian Rupee
IT Information Technology
ITC International Trade Centre
JPY Japanese Yen
KRW South Korean Won
LCY Local Currency
LSE London Stock Exchange
MCAP Market Capitalization
MERCOSUR Southern Common Market (Mercado Comun del Sur)
MICEX Moscow Interbank Currency Exchange
MoF Ministry of Finance
MP Monetary Policy
MXN Mexican Peso
NCM Common Nomenclature of the MERCOSUR
NDC National Depository Center (Russia)
NDF Non-Deliverable Forwards
OTC Over-Th e-Counter
PBC People's Bank of China
QE Quantitative Easing
RBI Reserve Bank of India
RFDI Renminbi Foreign Direct Investment
RMB Renminbi; see CNY
RODI Renminbi Overseas Direct Investment
ROW Rest of the World
RQDII Renminbi Qualifi ed Domestic Institutional Investor

6
USE OF NATIONAL CURRENCIES IN INTERNATIONAL SETTLEMENTS. EXPERIENCE OF THE BRICS COUNTRIES
RQFII Renminbi Qualifi ed Foreign Institutional Investor
RUB Russian Ruble
SA South Africa
SAARC South Asian Association for Regional Cooperation
SARS South African Revenue Service
SARB South African Reserve Bank
SDR Special Drawing Right
SEBI Securities and Exchange Board of India
SEZ Special Economic Zone
SML Local Currency Payment System (Sistema de Pagamentos em Moeda Local)
SOE State-Owned Enterprise
SWIFT Society for Worldwide Interbank Financial Telecommunication
TRY Turkish Lira
UAE United Arab Emirates
UK United Kingdom
US United States (United States of America)
USD US Dollar
WDI World Development Indicator (World Bank)
WTO World Trade Organization
ZAR South African Rand

7
EXECUTIVE SUMMARY
Executive summary
1. Th e modern international monetary system based on the US dollar is being strongly criticized for its shortcomings. Th e US Federal Reserve᾽s monetary policy runs counter to the emerging market and developing economies’ monetary policy objectives aimed at controlling exchange rates, lowering infl ation and interest rates, and stimulating economic growth and employment. Financial systems in EMDEs frequently suff er the spillover eff ects of the US monetary policy that provokes capital infl ows/outfl ows. Research in this area resulted in a well-founded academic opinion pointing that risks of sudden USD liquidity drop may be smoothed by a wider use of national currencies in international settlements.
2. Using national currencies in international settlements presumes a long and com-plicated transition to their internationalization. Th at means a step-by-step promotion of a national currency as a unit of account, medium of exchange and store of value at the international level. A national currency becomes a unit of account when a foreign contract᾽s price is invoiced in such currency. It serves as a medium of exchange when fi nal settlements are made and as a store of value when non-residents purchase assets denominated in this currency.
3. Th e internationalization of a currency off ers some benefi ts to the issuing country, but also poses certain risks. As early as in the 1960s, R. Triffi n proved that infl ation risks are fostering, while a national currency᾽s share in international settlements is growing, thus jeopardizing its exchange rate stability and credibility among the global market participants.
4. To avoid negative consequences emerging in the course of internationalization, it is necessary to meet the following preconditions:
— an issuing country should achieve a signifi cant share in the global economy and international trade (within its region, at least);
— macroeconomic stability should be ensured, thus presuming predictability of the monetary policy, consistently low level of infl ation and mild exchange rate fl uctuations;
— a country should have a well developed and liquid fi nancial market providing a wide range of FX and stock instruments;
— foreign exchange regulations should be investor-friendly and not restrictive to in-ternational settlements in the national currency.
5. Monetary policy objectives and economic conditions in BRICS member states vary signifi cantly as do their strategies and results in promoting the internationalization of their local currencies. In this respect, the Chinese renminbi is ahead of the pack, e.g. in terms of interbank transfers turnover — its global share amounts to 1.68% as of December 2016 (recorded by SWIFT). Th e "top twenty" of currencies in this rating also include the South African rand (0.38%) and the Russian ruble (0.25%).
Th e RMB᾽s share is also bigger than of other BRICS currencies in foreign trade turnover — it amounts to approximately 22% of the Chinese foreign trade volume. Th e Russian ruble follows closely behind (20%) — so that the two currencies are well ahead of the currencies of India, Brazil and South Africa.
6. Th e current state of internationalization progress by the BRICS currencies is linked both to above-mentioned preconditions and to fi nancial and economic policies pursued by their authorities.
7. China began promoting the RMB internationalization later than the other BRICS countries, but managed to achieve a bigger success. So, the IMF added the RMB to the basket of SDR currencies from October 1, 2016. Th e pursuit by the government

8
USE OF NATIONAL CURRENCIES IN INTERNATIONAL SETTLEMENTS. EXPERIENCE OF THE BRICS COUNTRIES
of China of deliberate monetary policy objectives, with concomitant policy targets and instruments, was the driving force behind the Chinese accomplishments. Following the internationalization of the RMB, China experienced a currency depreciation and faced the confl ict between capital account opening and domestic fi nancial stability because of the capital outfl ow, forcing the country’s policymakers to make appropriate adjustments to capital account convertibility and the RMB internationalization.
8. Russia has opted for removing nearly all restrictions on the ruble᾽s transactions with non-residents (both current and capital accounts) by now. However, such measures have not yet proven benefi cial for widening its usage at the international level. Th e Russian experience has shown the limits and constrains of a partial internationalization exacerbated by the underdevelopment of fi nancial market and a country᾽s relatively small share in the world trade and economy. Th e Russian experience also demonstrates the risks of internationalization for macroeconomic stability caused by increasing vulnerability and exposure to external shocks.
9. Th e monetary authorities of three other BRICS countries have not yet managed to establish suffi cient prerequisites for a wide usage of their respective currencies in in-ternational settlements. Despite the formal permission to receive export proceeds in a national currency, the regulators in practice discourage market participants from making such payments. Regulators᾽ viewpoints on the subject are considerably aff ected by concerns about the US monetary policy᾽s spillovers emanating from possible interest rates hikes and following capital outfl ows from the developing economies.
10. India’s monetary authorities within the current macroeconomic framework focused on facilitating access to the internal FX market for non-residents and on developing the off shore bonds market denominated in Indian rupees. Th eir intention is to lower the foreign exchange requirements for servicing foreign debt and to promote the development of hedging market. Th ereby the preconditions for the gradual expansion of the usage of the Indian rupee in international settlements are being created in the long term.
11. Brazil presents an interesting example in respect to the internationalization of its currency. In 2009 the country was among the initiators and participants of the pioneering regional payment system — Sistema de Pagamentos em Moeda Local — created for settlements using local currencies in the region. At the time SML continues to operate smoothly and eff ectively in servicing the trade fl ows between Brazil and Argentina. However, its functioning is constrained by remaining foreign exchange restrictions and incomplete convertibility of the Brazilian real and the Argentine peso. Despite the small share of payments made under the system in relation to the total volume of bilateral trade, both countries keep being committed to using the SML. Moreover, in 2015 Uruguay joined this payment system, thus underscoring the importance of promoting intra-regional trade using national currencies to mitigate the risks of external and macroeconomic shocks emanating from the use of the US dollar.
12. Th e South Africa᾽s experience has clearly showed that even a relatively developed fi nancial market (the fi nancial assets to GDP ratio of the country exceeds the corresponding variables in all the other BRICS countries and are tantamount to advanced economy levels) does not completely safeguard from the problems inherent for a resource-based economy. Th erefore, further diversifi cation of the national economy is needed to ensure macroeconomic stability and enhance national currencies’ use in international settlements still more.
13. Th e BRICS countries’ experience presented in this report shows that a balanced development of all necessary and suffi cient preconditions have to be in place for a na-

9
EXECUTIVE SUMMARY
tional currency internationalization to establish the solid basis for its considerable share in international settlements. Nonetheless, even under the current situation of under-developed preconditions, the BRICS member states should continue discussing and developing policy targets and instruments in pursuit of widening the use of BRICS national currencies in international settlements for promoting the goal of increasing intra-BRICS trade, investment and economic cooperation. In particular, BRICS governments could consider multilateral policy instruments for removing administrative barriers and fostering fi nancial market development to promote wider use of national BRICS currencies in cross-border settlements within the pre-existing internationalization currency framework in the BRICS countries.
10
USE OF NATIONAL CURRENCIES IN INTERNATIONAL SETTLEMENTS. EXPERIENCE OF THE BRICS COUNTRIES
Introduction
Th e International Monetary Systems’ dependence on the US Federal Reserve’s monetary policy has always been a con-cern for EMDEs. Th ey are wary of the negative spillover eff ects of the FED’s monetary policy that places the US national economic interests above the interests of other countries. Aft er the Asian crisis of 1997, EMDEs raised the issue of extending the use of national currencies to cover a wider spectrum of international settlements. Th e glo-bal fi nancial crisis confi rmed their concerns about risks emanating from the US dollar’s dominant role in the global economy and fi nancial markets, and induced strong reaction from the international community which resulted in a large number of policy researches aimed at increasing the role and turnover of national currencies in international economic transactions and payments.
With the BRICS countries’ signifi cant increase in their share of global GDP and international trade during the 2000s, international fi nancial markets began to take a greater interest in their national currencies. Most of the BRICS countries have recently fully or partially lift ed the restrictions on foreign exchange transactions (at least with respect to cur-rent account transactions). Moreover, dynamic economic growth allowed the group member-countries to enhance macroeconomic stability and further develop their fi nancial markets.
Th e need for measures to stabilize the international fi nancial system following the GFC was underscored at the 2nd BRIC Heads of State Summit held in Brasilia (Brazil) in 2010, where the leaders of the group declared "a greater need for a more stable, predictable and diversifi ed international monetary system" and showed their readiness to study the possibilities of international
settlements in their local currencies1. Th e 2010 declaration was given greater urgency in the BRICS Ufa (Russia) Summit Declaration of 2015, in which leaders of the group acknowledged and supported initial expert fi ndings that "the potential for expanding the use" of such settlements in BRICS national currencies was indeed a matter of importance for promoting further economic and fi nancial cooperation among the BRICS member states to mitigate current instability in the international fi nancial system2.
Th is joint research paper prepared by experts and academics from the BRICS member states was undertaken to analyze the experience, and assess the use of BRICS national currencies for international settlements. Th e First Chapter summarizes the results of theoretical studies on internationalization of national currencies. Chapters 2—6 present expert analysis of the current state of BRICS currencies’ adaption to international settlements. Th e Con-clusion summarizes the fi ndings of the research, and proposes further steps for consideration by the BRICS academic community, policy makers and public authorities.
1 2nd BRIC Summit of Heads of State and Government: Joint Statement. 2010. April 15 // President of Russia: offi cial website. URL: http://en.kremlin.ru/supplement/524
2 VII BRICS Summit. Ufa Declaration // Offi cial website of Russia`s presidency in BRICS. 2015. July 9 URL: http://en.brics2015.ru/ load/381158

11
THEORETICAL ASPECTS OF NATIONAL CURRENCIES INTERNATIONALIZATION
InternationalMonetary Systems and settlements in national currencies
Th e modern world economy is cha-racterized by an unparalleled level of fi nancial services markets’ development, increase in cross-border investment fl ows as well as integration of national and regional capital markets. Investors are able to move huge amount of funds swift ly from one country to another in search of the highest returns or "safe havens" for periods of increased turbulence.
Financial globalization is deeply aff ec-ting the functioning of national fi nancial systems. International capital fl ows’ fl uc-tuations may have a powerful impact on national markets. Th ey could lead to dramatic increases or decreases in assets values, exchange rates and stock market indices. Rising volume of international transactions creates additional challenges for regulators. It complicates the task of achieving targeted infl ation parameters, GDP growth and desired level of inte-rest rates.
Th e reasons for drastic changes in capital fl ows and high volatility in fi nancial markets lie in the fact that the modern global fi nancial system is based on the US dollar serving as the world currency. Most companies use the USD as an intermediate currency for transactions with counterparties from foreign countries. According to SWIFT, 40.7% of international settlements are made in the USD while the United States’ share in world trade in goods
and services does not exceed 12% (Figure 1).
Th e USD serves as a transmission mechanism of the US Federal Reserve’s monetary policy on the global economy and fi nancial markets. Th us, heavy reliance on the dollar in international settlements signifi cantly impairs the EMDEs’ monetary authorities’ ability to counter external shocks and to achieve desirable targets of national monetary policy.
Th e FED’s interventions have led to diverse changes in global capital fl ows. Th ey were directed to emerging markets as well as developing economies during the periods of easing the United States’ monetary policy and provided them with excessive and cheaper liquidity. However, the tightening periods have had the opposite eff ect and provoked sharp and painful capital outfl ows resulting in emerging currencies’ depreciation, fi nancial fl uctuation and economic output decrease. Combating the GFC, the FED resorted to unconventional MP tools dubbed "Quantitative Easing". A number of studies have recently showed that the series of QE’s (1–3) have signifi cantly increased the FED’s infl uence on the global fi nancial system (Gilchrist, Yue, Zakrajsek, 2014).
In this situation, developing countries are facing the challenge of fi nding ade-quate ways to neutralize the negative eff ects of the global fi nancial cycle (Rey, 2013) and its waves of capital infl ow-outfl ow. A natural solution to the pro-blem is through avoiding the excessive dependence on the USD by expanding
Chapter 1
Theoretical Aspects of National Currencies’ Internationalization

12
USE OF NATIONAL CURRENCIES IN INTERNATIONAL SETTLEMENTS. EXPERIENCE OF THE BRICS COUNTRIES
Figure 1. Shares of countries and currencies in global trade and in the total amount of payments, % Source: SWIFT. RMB Tracker, February 2017; WDI, World Bank
0 United
States
UnitedKingdom
Eurozone Japan China SwitzerlandCanada
5
10
15
20
25
30
35
40
45 40.7
32.9
24.2
7.5 3.8 2.4 3.7 3.1 1.9 1.7 1.5 1.8
13.7 12
Share of FX in the total amount of payments
Share of country in global trade
the circulation of national currencies in international settlements.
Nakamura (Nakamura, Ueda, Matsui, 2012) specifi ed that the value of the USD and EUR fl uctuated wildly during the global fi nancial and debt crises in 2008, and shortfalls of liquidity frequently arose. Although the impact from fl uc-tuations in these currencies could not be completely eliminated, the use of a home country currency or more direct transactions in currencies other than the USD and EUR may reduce impacts in the event of similar crises in the future. Furthermore, Nakamura opined that alleviating exchange rate fl uctuation risk for emerging countries through a currency’s internationalization could contribute to stability of EM’s fi nances and to extension of international fi nance.
Th e dominant role of the USD creates problems for the entire global fi nancial system, especially for developing coun-tries. Specifi cally, it was emphasized in certain studies made by the IMF experts (IMF, 2011). Th ey consider that in a multipolar system the risk
of protracted exchange rate misalign-ments and persistent global imbalances would likely be reduced due to increasing policy discipline among the core economies.
Even a number of prominent US ana-lysts (Bergsten, 2009) are now arguing that the dollar’s global dominance is no longer in the national interest of the United States, and they have urged the US government should explore ways of "downsizing" the dollar’s international role. Th ey have expressed concerns about how the dollar’s international role undermines the US export com-petitiveness, contributes to the country’s payments defi cits and increases the country’s vulnerability to overseas offi cial dollar holders.
Th e IMF experts denote that limited role of EM currencies in international transactions stands in sharp contrast to their growing weight in the global economy, which is in itself a source of stress to the functioning of the international monetary system (IMF, 2011). While fi nancial fl ows continue

13
THEORETICAL ASPECTS OF NATIONAL CURRENCIES INTERNATIONALIZATION
to be dominated by advanced economies, in the longer run, EM currencies show potential to achieve wider international use similar to some advanced economies. For instance, currencies of commodity exporters (e.g., the Russian ruble and the Brazilian real) could play larger regional roles and become part of reserve assets similar to the Australian or Canadian dollar; while the RMB could achieve global use due to the economic size and trade-related centrality of the Chinese economy.
According to the IMF executives, the greater use of multiple currencies has the potential to diversify risks, enable gradual global adjustments, and provide incentives for sustainable policies. It can also help creating a more stable environment for capital fl ows — thus enhancing systemic stability. Th is can be achieved by reducing tensions between domestic policies in reserve-issuing countries and the liquidity needs of the global economy (Furusawa, 2017).
What is currency internationalization?
Th ere is a well-established literature to denote the meaning of a currency internationalization (Eichengreen and Flandreau, 2012). According to Kenen (2011), an international currency is one that is used and held beyond the borders of the issuing country, not merely for transactions with that country’s residents
but also, and importantly, for transactions between non-residents.
According to Nakamura’s defi nition, internationalizing does not necessarily mean expanded usage throughout the entire world, but rather usage spanning borders and among countries and regions with strong economic interdependence. As such, the internationalization of a cur-rency does not mean that a currency becomes a key currency.
Chinn and Frankel have developed a framework based on international functions of a currency to determine the level of its internationalization. Table 1 shows the various roles of an internatio-nal currency in private and offi cial sector.
National currency may be used as a unit of account where a foreign contract’s price is denominated in such currency (invoicing currency) or invoice is issued in such currency (account currency). National currency may serve as a medium of exchange if a contract (e.g. dollar- denominated) is paid using a diff erent currency (settlement currency). However, an invoicing currency is more important because settlements (payments) may actually be made in any currency using exchange rate at the payment date. National currency may also act as a store of value when it is used for purchase of assets (primarily securities) denominated in this currency.
According to Kenen (2011), nati-onal currency may be recognized as
Table 1 Roles of an international currency
Function of money Governments Private sectors
Store of value International Reserves Currency substitution and investment
Medium of exchange Vehicle currency for FX intervention
Invoicing trade and fi nancial transactions
Unit of account Anchor for local currency pegging
Denominating trade and fi nancial transactions
Source: Based on Chinn and Frankel (2008)

14
USE OF NATIONAL CURRENCIES IN INTERNATIONAL SETTLEMENTS. EXPERIENCE OF THE BRICS COUNTRIES
process and may go on without full implementation of the Kenen conditions. Of course, the more functions a national currency performs in the international level, the higher its attractiveness is as an invoicing currency. However, it may merely act as a settlement currency without necessarily being acclaimed as a reserve currency — i.e. without being widely deposited in international reserves of other countries.
Benefits and risks of currency internationalization
Currency internationalization has notalways been seen as a benefi t for the issuing country. In a number of cases, fi nancial authorities deliberately limited using their currency abroad (e.g. China before the GFC).
Th e Western countries have, at times, also tried to discourage the use of the domestic currency internationally because of the perceived costs that may be associated with such use. For example, during the time when the Deutsche Bundesbank and the Swiss National Bank focused their monetary policy strategies on the control of monetary aggregates, there was fear that greater international use of the Deutsche mark or the Swiss franc would render the demand for money less stable and therefore complicate the setting of the appropriate target growth rate for the supply. It may also be argued that international use of the currency could render the exchange rate more volatile and therefore complicates the task of fi nding the appropriate level of the policy interest rates (Genberg, 2011).
However, the USD dominance in foreign trade payments, loans and inve-stments has been recently viewed as a factor of vulnerability that is desirable to be reduced. As a result, many countries set a goal of decreasing dependence on the USD in foreign settlements
internationalized when most of the fo-llowing conditions are met.
1. Th e government must remove all restrictions on the freedom of any entity, domestic or foreign, to buy or sell its country’s currency, whether in the spot or forward market.
2. Domestic fi rms are able to invoice some, if not all, of their exports in their country’s currency, and foreign fi rms are likewise able to invoice their exports in that country’s currency, whether to the country itself or to third countries.
3. Foreign fi rms, fi nancial institutions, offi cial institutions and individuals are able to hold the country’s currency and fi nancial instruments denominated in it, in amounts that they deem useful and prudent.
4. Foreign fi rms and fi nancial instituti-ons, including offi cial institutions, are able to issue marketable instruments in the country’s currency.
5. Th e issuing country’s own fi nancial institutions and non-fi nancial fi rms are able to issue on foreign markets instruments denominated in their country’s own currency.
6. International fi nancial institutions, such as the World Bank and regional development banks, are able to issue debt instruments in a country’s market and to use its currency in their fi nancial operations.
7. Th e currency may be included in the currency baskets of other countries, which they use in making their own exchange rate policies.It should be noted that implementation
of the fi rst paragraph presumes the complete revocation of foreign exchange restrictions. In the case of remaining barriers for capital account transactions, the internationalization may develop mainly by increasing the share of national currency in bilateral trade settlements.
Th us, the use of national currency in international settlements constitutes a section in its internationalization

15
THEORETICAL ASPECTS OF NATIONAL CURRENCIES INTERNATIONALIZATION
and expanding the use of their national currencies.
Now the common view is that the internationalization of a national currency brings important benefi ts to the issuing country. Eichengreen et al. (2015) explain that internationalization of a national currency would (1) reduce exchange rate risks for the country’s enterprises, (2) reduce the need for holding more foreign exchange reserves, (3) promote trade by reducing transaction costs, and (4) improve the competitiveness of the currency-issuing country’s fi nance sectors.
Nakamura (2012) opines that inter-nationalization of a currency off ers several merits for the home country in terms of private sector economic activity.
1. Reduces the risk of exchange rate fl uctuations in trade. Companies bear less risk of exchange rate fl uctuations particularly when trade and settlements are conducted in the currency of the home country.
2. Makes fi nancial institutions more competitive internationally. Th e com-petitiveness of fi nancial institutions strengthens when the home country currency is used more widely in fi nancial transactions. Under these circumstances business opportunities are likely to increase. Furthermore, liquidity risk related to raising funds in foreign currencies is alleviated for fi nancial institutions as a country’s currency internationalizes.
3. Contributes to the development of the country’s fi nancial and capital markets.
4. Internationalized currencies are also advantageous during extraordinary times. Th e impact of exchange rate fl uctuations against key currencies like USD and EUR as well as other major currencies diminishes.Th e IMF experts agree that benefi ts
from internationalization include poten-tially lower transaction costs and reduced exchange rate risk, and the ability to issue
international debt in more competitive terms. But they note that this may also complicate monetary management and strain the domestic fi nancial system’s ability to absorb capital fl ows due to potential for increased volatility and large shift s in portfolio fl ows (IMF, 2011).
Genberg (2011) argues that the benefi t of currency internationalization to the issuing country is the seigniorage gains associated with the additional demand for the physical currency. Th e benefi t to the user includes a relatively high real value of a readily accepted note (e.g. the USD 100 bill), the widespread international acceptance of the currency for transactions, and the relative stability as a store of value. He also notes that full and partial currency internationaliza-tion can reduce borrowing costs due to the larger size of the market for debt denominated in a particular currency and to the potential diversifi cation gains.
Th e establishment and liberalization of domestic markets improve the competitiveness of fi nancial institutions by promoting open and competitive markets, and this strengthens the ability of domestic fi nancial and capital markets to handle expanded capital infl ows and outfl ows anticipated aft er the currency becomes more international.
Despite the benefi ts promised by in-ternationalization, central banks of deve-loping countries are wary of lift ing restrictions on transactions of non-residents with national currency. Th is is because the international status of a currency brings not only benefi ts, but also certain obligations and vulnerabilities (Helleiner, 2013).
Large amount of a national currency begins to circulate abroad as it is being internationalized. As a result, the na-tional fi nancial system is exposed to certain risks, i.e. the central bank will loosen its control over monetary parameters, so that not only demand but also supply of the currency will to some extent be governed by non-residents.

16
USE OF NATIONAL CURRENCIES IN INTERNATIONAL SETTLEMENTS. EXPERIENCE OF THE BRICS COUNTRIES
needs confi dence in both the value of its currency and the political stability of the country concerned. And secondly country should maintain the convertibility of its own currency. It should also possess well-developed fi nancial markets; broad, in that they contain a large assortment of fi nancial instruments; deep, in that they have well-developed secondary markets; and free of controls on fi nancial transactions.
Th e breadth and depth of the nati-onal fi nancial market is a necessary benchmark indicator of the ability of a currency to be utilized as an international currency. However, it is not a suffi cient condition to achieve this status as other factors play equally important roles as was demonstrated in the fi nal ascension of the Chinese renminbi to international reserve currency status in 2016 aft er many years of trying.
Nakamura (2012) specifi es that there are two main preconditions for a currency to internationalize. One is the development of a country’s economic activities, particularly outward trade, to a certain level within the world or a given region. In order for this to happen, economic mutual dependence with the relevant region must increase and cross-border transactions — current account transactions and capital transactions —must expand.
Th e second precondition is the ab-sence of restrictions or regulations in usage of a country’s currency in activities; that is, the liberalization of the currency. Furthermore, in order for a currency to be used by the economic entities of other countries, domestic fi nancial and capital markets must be equipped and open in order for economic entities both within and outside the country to make fi nancial and capital transactions. Specifi cally, (1) interest rates and fi nancial services must be liberalized; (2) interest rate and exchange rate futures markets must be established; and (3) short-term fi nancial
Such allegation regarding the USD was specifi ed by R.Triffi n in the early 1960s, when he formulated his famous paradox (Th e Triffi n Dilemma). He noted that the USD stock is limited by the amount of the United States gold reserve. At the same time, the dollar should be emitted in volumes that meet the needs of the glo-bal trade.
It is well known that the paradox led to the Bretton Woods system’s collapse. Despite the demonetization of gold, the Triffi n Dilemma remains relevant even nowadays both for the USD and for any other currency in the process of internationalization. An issuing country must have a balance of payments defi cit in order to provide participants of inter-national trade and investments with suffi cient stock of a currency. At the same time, a constant and/or growing ba lance of payments defi cit causes increasing infl ationary expectations that undermine confi dence in the national currency and lead to its depreciation.
Historical experience shows us that the dilemma cannot always been avoided. Successful internationalization of a nati-onal currency presumes the existence of certain preconditions.
Prerequisites for currency internationalization
Th ere is an academic consensus that success of a currency internationalization is impossible without the following factors: a currency-issuing country must have a considerable volume of international trade; its share in global trade must be substantial; appropriate infrastructure (a developed banking sector, highly liquid fi nancial markets etc.) must be available for international participants.
Tavlas and Ozeki (1992) and Tavlas (1992) postulate that a currency to gain reserve status must meet the following preconditions. First, there

17
THEORETICAL ASPECTS OF NATIONAL CURRENCIES INTERNATIONALIZATION
markets and bond markets must be nurtured.
Genberg (2011) postulates that inter-nationalization of a currency needs some pre-requisites as follows, (1) no restrictions on cross-border transfers of funds, (2) no restrictions on third party use of the currency in contracts and settlements of trade in goods or assets, (3) no restrictions on transactions of assets denominated in the currency in private or offi cial portfolios, (4) existence of a deep and dynamic domestic fi nancial market, (5) a well-respected legal framework for contract enforcement, (6) stable and predictable macro and micro-economic policies.
Cohen (2012) recites four economic determinants for internationalization. First, currencies are more likely to be used internationally if foreigners have confi dence in their stable value, a confi dence usually cultivated by a record of low and stable infl ation as well as a steady external value. Second, international currencies are usually characterized by "exchange convenience" and "capital certainty" because they can be held in liquid fi nancial markets that are broad, deep, resilient and open to foreigners. Th ird, support by broad transactional networks, stemming from the issuing country’s prominent size in the world economy.
Economic inertia is the fourth factor that can sustain the international role of a currency. When a well-established transactional network already exists, the switching of currencies can be econo-mically costly. Cohen argues that inertia may also be a product of conservative and risk-adverse behaviour among economic actors when faced with uncertainties involved in choosing an alternative currency.
Such inertia is based on network ex-ternalities that can be defi ned as addi-tional value received by a benefi ciary where the total number of such benefi ciaries has increased (Katz and Shapiro, 1985).
In other words, the more economic agents use this currency in settlements, the more oft en it will be used by others.
In particular, the USD is more essential compared to other currencies because of the ability to aff ect signifi cantly more transactions. Th is can be explained by scale economy due to the huge number of operations performed with the USD. It leads to a reduction in spreads between the quotations for buying and selling the USD as well as reduction in bank transfer fees. As a result, the US currency pro-vides an exporting company with lower transaction costs.
Of course, even if all the prerequisites are met, there is no guarantee that currency internationalization will spon-taneously follow. Genberg (2011) notes that economies of scale in the use of an international currency suggest that the world can sustain only a limited number of international currencies.
IMF experts underline that only a few EM currencies, led by the Chinese renminbi, show potential for internationalization on a global scale, albeit many more could achieve some degree of international use. In their opinion, economic size — including trade networks — macroeconomic stabi-lity, and policy support are impor-tant determinants of currency interna-tionalization (IMF, 2011).
Eichengreen, Hausmann and Panizza (2002 and 2003) advocate the hypothesis known as "original sin", according to which the international monetary system is characterized by asymmetries among the currencies of peripheral and central countries. Most countries are unable to issue debt in local currencies in the international market and also do not produce fountains of long-term fi nancing in domestic markets, so they are constrained to borrowing in major foreign currencies, especially USD. As a result, these countries are characterized by elevated degree of volatility of their fi nancial markets, fl ows of capitals

18
USE OF NATIONAL CURRENCIES IN INTERNATIONAL SETTLEMENTS. EXPERIENCE OF THE BRICS COUNTRIES
and cannot be traded between third parties.
Empirical observations also indicate that an increasing number of new currencies are entering international fi nancial markets. Th ere is a general growth in the turnover of these markets including through securities denominated in "exotic" currencies.
Summarizing the international studies’ experience, we can state that for the wider use of a national currency in international settlements, it is necessary to work in the following fi elds.
1. Foreign trade. Th e development of payments in national currencies is possible between countries that have a signifi cant amount of mutual trade. Th is will allow exporters and importers to accumulate foreign exchange when they deal with their foreign counterparties, and then invest it in goods, services and fi nancial instruments of partner countries.
2. Financial markets. Companies should be able to purchase/sell a currency quickly and without additional costs to make settlements in such currency. Th is presumes the existence of highly developed and liquid interbank and forex markets with large numbers of participants and convertible fi nancial instruments. Along with this, it is necessary to develop a deep and liquid stock market that is able to absorb temporarily cash liquidity.
3. Foreign exchange regulation. It is important to create a favorable legal and regulatory environment supporting the wider use of a national currency in cross-border transactions as well as to remove restrictions and barriers to foreign exchange transactions. Agreements with other countries are also required to ensure the implementation of relevant fi nancial transactions (payment agreements, swap lines etc.).
4. Maintenance of macro-economic stability is perhaps the most important precondition. Stable economic growth, predictable monetary policy, consistently
and also limited degree of autonomy of their respective monetary policies.
Th e authors explain the elevated volatility and macroeconomic instability of developing countries by the following factors.
1. Limited capacity of authorities to undertake countercyclical policies.2. Low capacity of the central bank to carry out one of its basic functions — to act as a lender of last resort (because much liabilities are in USD).3. Dollar-denominated debt increases the costs of currency depreciations, which, in the event of a currency crisis, may lead to large falls in out-put. To address this fragility issue, governments are forced to accumulate big foreign reserves to intervene in the foreign exchange market in order to prevent a national currency from moving and/or to enable it to act as debt servicer of last resort in moments of reversion of the economical cycles and capital outfl ows.Th at implies some kind of hierarchy of
currencies in the international monetary system. It is hard for any new currency to get fully internationalized, because it has to crowd out some other currency from portfolio of global fi nancial investors. Each successful country raises the bar to others, insofar as the addition of its securities to the global portfolio will reduce the diversifi cation benefi ts of ad-ding yet another currency (Eichengreen, Hausmann and Panizza, 2002 and 2003).
However, many authors oppose such determinism regarding the limitation of the number of currencies in the international fi nancial market. In particular, Genberg (2011) notes growing opportunities for partial internationalization in the present context. Many countries increasingly provide access to their debt markets (e.g. public bonds) for foreign investors, even though these securities are not convertible in the international market

19
THEORETICAL ASPECTS OF NATIONAL CURRENCIES INTERNATIONALIZATION
low infl ation expectations and high level of confi dence in the national currency provide better opportunities for its wider use in international settlements.
Factors affecting the choice of settlement currency
Th e IMF experts opine that speed and shape of progress toward a more multi-currency system will be largely market-driven, but there is also a scope for policy action to facilitate this transition (IMF, 2011). Domestic policies could support the creation of prerequisites for currency internationalization (such as macroeconomic stability and fi nancial markets’ depth) and help building of market infrastructure. At the same time, it is necessary to take into account that in addition to macroeconomic conditions, there are also a number of microeconomic factors infl uencing private corporative choice of an invoicing currency.
It has been presumed under economic theory that e xporters prefer their national currency for trade invoicing (so-called Grassmann’s law). Th at can be explained by the exporter’s desire to mitigate exchange risks. However, it has been discovered that in the case of fl oating exchange rates regime, the supplier’s currency choice is aff ected not only by this desire but also by consumers’ demand and by prices level ratio between external and internal markets. According to Donnenfeld and Zilcha (1991), it may be more profi table for an exporter to denominate contract price in the currency of importing country — in a case of signifi cant decrease in demand caused by prices increase due to unfavorable changes in the currency exchange rates. Th e correlation between a choice of invoicing currency and price elasticity of demand was confi rmed later in the
works of Bachetta (2002) and Goldberg (2005).
An important independent result of Goldberg was the conclusion that exporters of similar goods, such as oil or iron ore, will seek to establish the contract price in the same currency as their competitors. Th at allows them to neutralize more successfully the adverse exchange rate fl uctuations resulting in considerable price changes and therefore prevent the risk of reducing demand. As a result, the market price of such goods is denominated mostly in the US dollar. According to the authors, the global commodities exchange trade in these goods plays a signifi cant role. Th ey argue that if the global commodities market’s impact on the pricing model will decrease, the use of the USD as invoicing currency will decline too.
Industry infl uence factor on the choice of invoicing currency is clearly demonstrated by the Australian sta-tistics. For instance, 99.2% of the contracts purchasing iron ore, 99.9% — coal and 88.9% — natural gas supplied from Australia in the fi scal year of 2015/2016 were invoiced in the USD. At the same time, only 29.6% of medicine and pharmaceutical products’ exports, 30.1% of general engineering products and 55.4% of road vehicles were denominated in the USD1. Th us, the higher variety of supplied goods (e.g. such as products of engineering or pharmaceuticals), the more opportunities for companies to denominate the price in national currency without fear of fl uctuations in demand. Th at is because
1 See International Trade in Goods and Services, Australia, October 2016 // Australian Bureau of Statistics. URL: http://www.abs.gov.au/AUSSTATS/ [email protected]/Previousproducts/5368.0Feature%20 Article1Oct%202016?opendocument&tabnam e=Summary&prodno=5368.0&issue=Oct%20 2016&num=&view=

20
USE OF NATIONAL CURRENCIES IN INTERNATIONAL SETTLEMENTS. EXPERIENCE OF THE BRICS COUNTRIES
diff erent brands of goods are perceived by consumers as independent products.
A similar situation occurs in the case of imports. However, the commodities-dominated orientation of Australian exports leads to the low share of national currency — it does not exceed 15% in the exports compared with more than 31% in the imports.
High exchange rate fl uctuations should be named among other factors that determine an entity’s choice of currency. Exporters will seek to denominate their contracts in foreign exchange when their national currency is devaluing. It will allow them to receive additional profi ts in the national currency. At the same time, importers shall be encouraged to invoice a contract price in their national currency in order to reduce costs and prevent a decline in demand as a result of rising prices.
Th us, development of internal competition together with fostering of a highly diversifi ed range of export products help expanding the use of a national currency in international settlements.
References
1. Bachetta P., van Wincoop E. A Th e-ory of the Currency Denomination of International Trade // European Central Bank . Working Paper. 2002. No. 177.
2. Bergsten C. F. Th e Dollar and the Defi cits: How Washington Can Prevent the Next Crisis // Foreign Aff airs. 2009. Vol. 88. No. 6. P. 20–38.
3. Chinn M., Frankel J. Why the Euro Will Rival the Dollar // International Fi-nance. 2008. No. 11(1). P. 49–73.
4. Cohen B. J. Th e Benefi ts and Costs of an International Currency: Getting the Calculus Right // Open Economies Review. 2012. Vol. 23. No. 1. P. 13–31.
5. Dixon C. Th e New BRICS Bank: Challenging the International Financial Order? // Th e Global Policy Institute.
London Metropolitan University. 2015. No. 28. URL: http://www.gpilondon.com/wp-content/uploads/PP28-The-New-BRICS-Bank.pdf
6. Donnenfeld S., Zilcha I. Pricing of Exports and Exchange Rate Uncertainty // International Economic Review. 1991. Vol. 32. No. 4. P. 1009–1022.
7. Eichengreen B., Chitu L., Mehl A. Stability or Upheaval? Th e Currency Composition of International Reserves in the Long Run // European Central Bank. Working Paper. 2014. No. 1715. URL: http://www.ecb.europa.eu/pub/pdf/scpwps/ecbwp1715.pdf?485e29e6bbcff 9684dfb 4cc545b2aefc
8. Eichengreen B., Flandreau M. Th e Federal Reserve, the Bank of England, and the rise of the dollar as an international currency, 1914–39 // BIS. Working Paper. 2010. No. 328. URL: http://www.bis.org/publ/work328.pdf
9. Eichengreen B., Hausmann R., Panizza U. Currency mismatches, debt intolerance and original sin: why they are not the same and why it matters // National Bureau of Economic Research. Working Paper. 2003. No. 10036. URL: http://www.nber.org/papers/w10036.pdf
10. Eichengreen B. Number One Coun-try, Number One Currency? // Th e World Economy. 2013. Vol. 36(4). P. 363–374.
11. Eichengreen B., Hausmann R., Panizza U. Original sin: Th e Pain, the Mystery and the Road to Redemption. Conference “Currency and Maturity Matchmaking: Redeeming Debt from Original Sin”. Washington, D.C. 2002. November 21–22. URL: http://www.financialpolicy.org/financedev/hausmann2002.pdf
12. Furusawa M. Strengthening the International Monetary System. IMF Deputy Managing Director Remarks to a Conference on the Future of International Monetary System for Asia. 2017. March 8. URL: http://www.imf.org/en/News/Articles/2017/03/08/

21
THEORETICAL ASPECTS OF NATIONAL CURRENCIES INTERNATIONALIZATION
S P 0 3 0 8 1 7 - S t r e n g t h e n i n g - t h e -International-Monetary-System
13. Gao H., Yu Y. Internationalization of the renminbi // Currency inter-nationalisation: lessons from the global fi nancial crisis and prospects for the future in Asia and the Pacifi c // BIS. BIS Papers. 2011. No. 61. P. 105–124. URL: http://www.bis.org/publ/bppdf/bispap61.pdf
14. Genberg H. Currency interna-tionalisation: analytical and policy issues // Currency internationalisation: lessons from the global fi nancial crisis and prospects for the future in Asia and the Pacifi c // BIS. BIS Papers. 2011. No. 61. P. 221–230. URL: http://www.bis.org/publ/bppdf/bispap61.pdf
15. Gilchrist S., Yue V., Zakrajsek E. U.S. Monetary Policy and Foreign Bond Yields. IMF 15th Jacques Polak Annual Research Conference. 2014. November 11. URL: http://www.imf.org/external/np/res/seminars/2014/arc/pdf/gilchrist.pdf
16. Gopinath S. An Internationalised Rupee? // BIS. 2009. URL: http:// www.bis.org/repoffi cepubl/arpresearch200903.10.pdf
17. Helleiner E. Reluctant Monetary Leaders? // Th e BRICS and Asia, Currency Internationalization and International Monetary Reform // Asian Development Bank. Working Paper. 2013. No. 6. URL: http://www.adb.org/sites/default/files/publication/30198/brics-asia-paper-no6.pdf
18. Ito T. A New Financial Order in Asia: Will a RMB bloc emerge? // National Bureau of Economic Research. Working Paper. 2016. No. 22755. URL: http://www.nber.org/papers/w22755.pdf
19. Kenen P. Currency internationa-lisation: an overview // Currency inter-nationalisation: lessons from the global fi nancial crisis and prospects for the future in Asia and the Pacifi c // BIS. BIS Papers.
2011. No. 61. P. 9–18. URL: http://www.bis.org/publ/bppdf/bispap61.pdf
20. Lee J.-W. Will the renminbi emerge as an international reserve currency? // Th e World Economy. 2014. Vol. 37. P. 42–62.
21. Maziad S., et al. Internationalization of Emerging Market Currencies: A Balance between Risks and Rewards // IMF. Staff Discussion Note. 2011. No. SDN/11/17. URL: http://www.imf.org/external/pubs/ft /sdn/2011/sdn1117.pdf
22. Nakamura A., Ueda K., Matsui K. Th e Internationalization of Emerging Eco-nomy Currencies: Some Th oughts on the Internationalization of the Chinese Renminbi, Brazilian Real, and Russian Ruble // Institute for International Monetary Aff airs. International Economic and Financial Review. 2012. No. 2. URL: http://www.iima.or.jp/Docs/report/2012/no2_2012_e.pdf
23. Ranjan R., Prakash A. Internatio-nalization of Currency: Th e case of the Indian Rupee and Chinese Renminbi // Reserve Bank of India Report. RBI Staff Studies. 2010. No. 3. URL: http://rbidocs.rbi.org.in/rdocs/PublicationReport/Pdfs/RRSS180510F.pdf
24. Renminbi internationalization: Achievements, prospects and challenges / B. J. Eichengreen, M. Kawai (eds.) // Asian Development Bank Institute. Brookings Institution. Tokyo, 2015. URL: http://www.adb.org/sites/default/files/publication/159835/adbi-renminbi-internationalization-achievements-prospects-challenges.pdf
25. Rey H. Dilemma not Trilemma: Th e Global Cycle and Monetary Policy Independence // National Bureau of Economic Research. Working Paper. 2016. No. 21162. URL: http://www.nber.org/papers/w21162.pdf
26. Shu C., He D., Cheng X. One cur-rency, two markets: the renminbi’s growing infl uence in Asia-Pacifi c // BIS.

22
USE OF NATIONAL CURRENCIES IN INTERNATIONAL SETTLEMENTS. EXPERIENCE OF THE BRICS COUNTRIES
Working Paper. 2014. No. 446. URL: http://www.bis.org/publ/work446.pdf
27. Tavlas G. S., Ozeki Y. Th e Inter-nationalization of Currencies: An Appraisal of the Japanese Yen // IMF. Occasional Paper. 1992. No. 90.
28. Tavlas G. S. Vehicle Currencies // Th e New Palgrave Dictionary of Money and Finance / P. Newman, M. Milgate, J. Eatwell (eds.). L.: Macmillan, 1992. P. 754–757.
29. Zhou X. Reform the international monetary system // People’s Bank of China. 2009. March 23. URL: http://www.pbc.gov.cn/english/130724/2842945/index.html

23
THE RECENT EVOLUTION OF THE LOCAL CURRENCY PAYMENTS SYSTEM OF THE BRAZILIAN ECONOMY
Th e purpose of this chapter is to analyze the Brazilian Local Currency Payments System with Argentina, regarding its economic and institutional aspects, and to evaluate the legal aspects of the Brazilian fi nancial system in order to consider possible steps for providing the basis for the integration of the BRICS local currencies.
In the recent years the discussion concerning the international monetary system and the convertibility of currencies has been gathering pace, pointing that deepening of both production and fi nancial globalization makes signifi cant diffi culties for developing countries in gaining long-term fi nancing and implementing the monetary policy. Because of inconvertibility their currencies do not carry out the basic functions of the currency in the international monetary system. Is should be noticed that there is no international quotation of goods in inconvertible currencies, as well as they do not serve as a currency of denomination for mercantile or fi nancial contracts and reserve assets.
Th is restraint has stimulated Brazilian policymakers to search mechanisms for the construction of a Local Currency Payments System between Brazil and Argentina, with fi nal cause to reduce the dependence from the main reserve
Chapter 2
The Recent Evolution of the Local Currency Payments System of the Brazilian Economy1
currency of the world economy. Although there is equal system between Brazil and Uruguay2, the available data are scarce, so the registers of the fi rst business are only of 2015, according to Brazilian Central Bank.
Th e Brazilian export variable was chosen because it refl ects simultaneously the preference of the Argentinean im-porters and of the Brazilian exporters in invoicing their business in real inside the SML. Both start to recognize advantages in transacting without the intermediation of the US currency, and they gradually begin to elect voluntarily the BRL as a currency of bilateral commerce. So, the Brazilian currency stops carrying only its classic functions internally and sketches some properties in the international plan.
Financial opening of Brazilian economy
Biancareli (2010) analyses the main reforms in the Brazilian National Financial System, pointing to three levels of opening adopted by the Brazilian economy. Th e fi rst opening level began in the 1990s, under the Collor government and within the fi rst mandate of FHC, when the search started for a process of liberalization of the means and conditions of external debt through the diversifi cation of instruments existed. Within the second mandate of FHC, there was a deepening of the liberalization process in 1999 involving the alterations in the legislation regarding the treatment
1 Uallace Moreira Lima — Federal University of Bahia; Marcelo Xavier do Nascimento — Federal University of Pernambuco.
2 Th e agreement between the Central banks of Brazil and of Uruguay was signed in the end of 2014. Operations began only in 2015. We consider it as a very short historical series, therefore we decided not to include it in this report.

24
USE OF NATIONAL CURRENCIES IN INTERNATIONAL SETTLEMENTS. EXPERIENCE OF THE BRICS COUNTRIES
to the foreign investors in the local fi nancial market.
Th e second opening level was con-nected with modifi cations in the legi-slation referring to possession of extern assets, to the transfer of capital and to the internal debt of non-residents. Th is level included the period from the end of the government of FHC till the fi rst mandate of the Lula’s government. Th e third opening level is associated with the convertibility of the local currency. According to Biancareli (2010), measures for opening of the Brazilian economy were implemented abruptly, in so far as some macroeconomical variables started to present higher level of instability and dependence regarding the internatio-nal scenery.
For Freitas and Prates (2001), the measures for promoting the fi nancial opening in the 1990s took as main objectives the relaxation of the foreign investors’ entering the national fi nancial market and the adaptation of the regulatory landmark of fi nancing. According to the authors, the immediate result of these measures was the liberalization of the portfólio foreign investments both in the domestic and international capital markets, causing a favorable environment for the predominance of the process of speculation to the detriment of the productive investments.
Th e process of fi nancial opening of the Brazilian economy was associated with the turn of the international liquidity. Th us, the fi nancial liberalization, allied with elevated interest rates, has provided a substantial capital infl ow since 1991, which increased of the local reserves.
Th e liquidity cycle in the world-wide market entered the stage of decline aft er a crisis in the international market had begun in the 1970s. Th at was the result of the external sector crisis caused by oil price increase, and the crisis of fi nancing in 1973 — that marked the end of a long cycle of prosperity for the capitalism managed by Bretton Woods’ System.
Th e situation had been getting worse from 1979 with two external shocks which aff ected not only the Brazilian economy, but all countries that had depended from external capital fi nancing. Th e fi rst shock was the elevation of the price for the oil barrel, which had raised the prices from USD 12 to USD 30 per barrel in the end of 1978 and beginning of 1980. Th e second shock was the elevation of the international interest rate, as a consequence of changes in the US’ economic policy.
Aft er the successive exchange crises that reached Mexico (1995), Asia (1997) and Russia (1998), the Brazilian exchange regime was changed in 1999, shift ing from the regime of fi xed exchange to the regime of fl oating exchange, in order to maintain the increase in the currency value caused by the expressive escape of capitals, besides the signifi cant untenable imbalance of the swinging of payments. Th is change of exchange regime inaugurated a new phase of the neoliberal economic model in Brazil, where the exports became a variable of extreme importance as a mechanism for external agreement and remuneration of the fi nancial capital. Th is phase was also marked by the adoption of two new orthodox measures in the economic policy: infl ation targeting regime and getting elevated primary surpluses. Both measures set that the control of infl ation and is the main objective of the economic policy in Brazil, to the detriment of measures that provide a sustainable long-term economic growth. In fact, the economic tripod — infl ation marks, fl oating exchange and fi scal surplus — can be understood through economic policy which guarantees the remuneration of the fi nancial capital.
Th e evolution of the investment fl ow in stock market and foreign direct investment for Brazil confi rms the hypothesis presented by Biancareli (2007), according to which during the rising phase of the cycle of international

25
THE RECENT EVOLUTION OF THE LOCAL CURRENCY PAYMENTS SYSTEM OF THE BRAZILIAN ECONOMY
liquidity investment in stock markets is of the biggest importance for developing countries. During the descending phase it is the foreign direct investment that leads the movement of fall. Th e fact is that the indicators of the Brazilian economy point to the fact that the Brazilian option of being incorporated in the international market through the predominance of the fi nancial globalization process (capital account) turned to the creation of a much more favorable economic environment for speculative short-term investing and the patrimonial direct investment, thus aggravating the country’s position in the international monetary system as peripheral economy with an inconvertible currency.
Th e strategy adopted by Brazil to reduce this vulnerability is to build a mechanism of payment system using local currencies in its commercial relations with other countries of the South America. It is possible through the strengthening and deepening of the MERCOSUR3.
The Local Currency Payments System
Th e Local Currency Payments System is a tool inserted along with the set of political measures of incitement to the integration within the MERCOSUR countries. Th e mechanism allows the economic agents from diff erent countries to invoice the bilateral business in local currencies, thus reducing the costs of transaction asso-ciated to the operation exchange and the tax on fi nancial operations.
According to the Central Bank of Brazil, the objectives of the system are: to
3 All countries of South America participate in MERCOSUR, either as a Member State, or as an Associated State. 1) Member States: Argentina, Brazil, Paraguay, Uruguay (from March 26, 1991) and Venezuela (from August 12, 2012). 2) States in the process of incorporation: Bolivia (from December 7, 2012). Associated states: Chile (from 1996), Peru (from 2003), Colombia, Ecuador (from 2004), Guyana and Surinam (both from 2013).
stimulate the commerce for the reduction of the costs of transaction, to make easy the access of new small- and middle-sized economic agents, as well as to strengthen the local currencies through the rea-lization of regional business without the intermediation of the dollar.
Creating of this system inside Brazil started with the publication of prescriptive acts of the Central Bank, the National Monetary Advice and of the Chamber of Exterior Commerce of the Presidency of the República4. However, such acts were preceded by decisions of the Council of the Common Market of MERCOSUR5, where the bases of the SML were launched between Brazil and Argentina.
Although the formation of the SML has demanded the convergence of decisions of several persistence, the operation of the system is carried out under an agreement (BCB and BCBRA, 2008) signed between the Brazilian and Argentinean Central banks. Th e regulation sets that the payments in local currencies are allowed to any type of operation between residents in both countries. However, there is an authorization requirement, so that the Central bank at present restricts the operations in common agreement contented by the monetary fl ows of import and export of goods and services.
Th e system does not work totally without the US dollar, nevertheless it transmits to the economic agents enga-ged the perception of which exchange operation does not exist. It removes the embarrassment of the cost of transaction of the purchase of the currency and the eventual fl uctuations that can compromise the income of the operation,
4 Prescriptive circular of the Central Bank of Brazil No. 3.406/2008, Resolution of the National Monetary Advice No. 3.08/2008 and Resolution of the Chamber of Exterior Commerce 12/2007 respectively.
5 Decision of the Council of the Market Common (MERCOSUR) No. 38/2006 and 25/2007.

26
USE OF NATIONAL CURRENCIES IN INTERNATIONAL SETTLEMENTS. EXPERIENCE OF THE BRICS COUNTRIES
besides dispensing the payment of the tax on fi nancial operations in case of Brazil.
Two important characteristics of the Local Currency Payments System are distinctive: the voluntary character of joining the system and the position of an economic agent inside the commercial relationship between Brazil and Argentina. Being a volunteer to transact under the SML, the economic agent needs incentives to feel attracted. To a large extent, the abolition of the exchange operation removes barriers and stimulates the entry of agents, earlier repelled by high operational costs. In general, operating inside the system approaches to the internal commerce, stimulates the competition and induces the effi ciency of the economic agents.
Every external commercial rela-tionship has the stage of commercial agreement, boarding and the liquidation by means of the payment. Th e traditional mechanisms of commercial liberalization include both tariff and non-tariff barriers (for stages of commercial agreement and board). It does not predict changes in the rate of a currency that will be used for the turnover and liquidation (in general — the USD).
Th e Local Currency Payments System operates exactly at the stage of the turnover and liquidation, substituting the turnover in foreign currency for the local currencies of the wrapped countries. Incentives for the economic agents, as mentioned above, are the abolition of the exchange cost and the possibility to eff ectuate the operational calculation in a familiar currency, knowing in advance the value of the bill that will be received. By the side of the importer, according to the rules of the system, the paid value will not be known in advance, since it depends on the Tax SML for the day of making the operation. Nevertheless, these exchange rates use the local currencies without the straight intermediation of
the conventional exchange in the per-ception of the importing agent.
Evolution of the SMLin data
Th e Table 1 presents a synthesis of the Brazilian exports to Argentina during the last six years. Th e fi rst more general observation is that the total value of exports in dollars had been raising till 2011 and then decreasing, with reaching the same landing of the beginning of the series. On the other side, the volume of exports under the SML (in Brazilian currency) grew along the years, despite being relatively stagnant from 2012. Still so, the exports invoiced in BRL increased more than fi ve times, in a tendency diff erent from the total exports invoiced in USD.
It can seem fearful to compare the same variable in completely diff erent monetary unities, in special because the SML is a new instrument of voluntary use. Nevertheless, aft er conversion to US dollars by the annual average exchange rate, it is extracted a near value in BRL that makes possible the comparison between the two forms of exportation.
With the values adjusted to the same monetary unity it is seen that despite of the accented devaluation of the real, that reduces the quotient in dollars, the share of the exports under SML has reached little more than 6%. In fact, this may look negligible, but, if compared with the quantity of operations of export contracted from 2009, it becomes clear that there was a signifi cant growth of the voluntary use of the SML. In accordance with the Central Bank of Brazil, the growth was tenfold, reaching the mark of almost eleven thousand operations in 2015.
Aft er six years of eff ective functioning the SML between Brazil and Argentina results achieved make clear that there is a growing interest of the economic

27
THE RECENT EVOLUTION OF THE LOCAL CURRENCY PAYMENTS SYSTEM OF THE BRAZILIAN ECONOMY
agents wrapped in carrying out extern transactions without the intermediation of the dollar. How the turnover is made with national currencies under the SML, it is worth observing with attention to the evolution of value in BRL, because these value, being converted in dollar, serves only to estimate the SML share in the total exports.
Th e opposite takes place when we observe the Brazilian imports with origin in Argentina. Th ough there had been more than nine-time growth during six presented years, the biggest imported value hasn’t reached BRL 40 million and USD 9 million when converted. Th e same
Year Value exported, USD (A)
Value exportedunder SML, BRL
Exchangerate,
BRL/USD
Value exportedunder SML, USD
(B)
B/A, %
2009 12,784,699,502 451,061,104.78 1.74 259,170,940.46 2.02010 18,522,520,610 1,252,700,533.25 1.67 752,191,997.87 4.12011 22,709,344,431 1,623,201,038.91 1.88 865,661,052.16 3.82012 17,997,706,375 2,277,897,217.86 2.04 1,115,031,189.91 6.22013 19,615,414,342 2,581,447,704.82 2.34 1,102,240,693.77 5.62014 14,281,998,035 2,313,261,335.97 2.66 871,088,016.26 6.12015 12,800,015,447 2,504,490,534.16 3.90 641,486,228.72 5.0
Year Value imported, USD (A)
Value importedunder SML, BRL
Exchangerate,
BRL/USD
Value importedunder SML, USD
(B)
B/A, %
2009 10,955,256,800 4,296,941.53 1.74 2,468,939.05 0.0232010 14,434,593,883 8,998,129.07 1.67 5,402,983.71 0.0372011 16,906,351,476 8,736,895.69 1.88 4,659,429.20 0.0282012 16,444,158,185 17,245,299.73 2.04 8,441,578.02 0.0512013 16,462,685,523 10,525,643.55 2.34 4,494,296.99 0.0272014 14,142,927,904 5,033,622.97 2.66 1,895,474.83 0.0132015 10,284,589,084 37,573,226.81 3.90 9,623,796.63 0.094
Source: Ministry of Development, Industry and Foreign Trade; Central Bank of Brazil Note: Th e exchange rate used is an annual medium calculated by Central Bank of Brazil
Source: Ministry of Development, Industry and Foreign Trade; Central Bank of Brazil Note: Th e exchange rate used is an annual medium calculated by Central Bank of Brazil
thing goes for the share in total imports by Brazil, which does not reach 1%.
Th e discrepancy between the dynamic bilateral of commerce between Brazil and Argentina under the SML refl ects, fi rst of all, the preferences of the economic agents, that can be caused by a set of reasons concerning the each country’s internal order. Th e lack of interest of the Argentinean exporters in invoicing in their local currency and keeping on negotiating in the US currency, though it is not the object of the current analysis, can be a sign of low internationalization of the Peso. Besides, such an asymmetry can mean that the SML works well only for one of the countries. Th at might be reduced
Table 1Exports to Argentina
Table 2Imports from Argentina

28
USE OF NATIONAL CURRENCIES IN INTERNATIONAL SETTLEMENTS. EXPERIENCE OF THE BRICS COUNTRIES
NCM Goods Value in USD (FOB)
87032310 Vehicles; with only spark-ignition internal combustion recipocating piston engine, cylinder capacity 1,699,472,906
87032210 Vehicles; with only spark-ignition internal combustion recipocating piston engine, cylinder capacity 705,061,215
87042210 Vehicles; compression-ignition internal combustion piston engine (diesel or semi-diesel), for transport 305,948,970
87012000 Tractors; road, for semi-trailers 285,784,532
26011210 Iron ores and concentrates; agglomerated (excluding roasted iron pyrites) 214,469,174
87082999 Vehicles; parts and accessories, of bodies, other then safety seat belts 211,825,702
87043190 Vehicles; spark-ignition internal combustion piston engine, for transport of goods (of a g.v.w. not exceeding 5t) 205,826,452
84073490Engines; reciprocating piston engine, of a kind used for the propulsion of vehicles of chapter 87, of a cylinder capacity exceeding 1000cc
198,081,154
87085080Vehicle parts; drive-axles with diff eretial, whether or not provided with other transmission components, and non-driving axles; parts thereof
192,830,872
87042190 Vehicles; compression-ignition internal combustion piston engine(diesel or semi-diesel), for transport 181,504,093
87089990 Vehicle parts and accessories; n.e.c. in heading No. 8708 161,167,572
87060010 Chassis; fi tted with engines, for the motor vehicles of heading No. 8701 to 8705 153,672,563
26011100 Iron ores and concentrates; non-agglomerated 134,797,017
40112090 Rubber; new pneumatic tyres, of a kind used on buses or lorries 133,579,090
28182010 Aluminium oxide; other than artifi cial corundum 130,045,78787083090 Vehicle parts; brakes, servo-brakes and parts thereof 114,317,652
87032100 Vehicles; with only spark-ignition internal combustion recipocating piston engine,cylinder capacity 111,053,346
39012029 Ethylene polymers; in primary forms, polyethylene having a specifi c gravity of 0.94 or more 102,612,249
87084080 Vehicle parts; gear boxes and parts thereof 93,167,775
87088000 Vehicle parts; suspension systems and parts thereof(including shock-absorbers) 91,229,752
Total 5,426,448,173Total exports to Argentina 12,800,015,447
Table 3Twenty principal goods exported to Argentina in 2015
Source: Ministry of Development, Industry and Foreign Trade; Central Bank of Brazil

29
THE RECENT EVOLUTION OF THE LOCAL CURRENCY PAYMENTS SYSTEM OF THE BRAZILIAN ECONOMY
by more eff ective policy providing diff e-rent incentives for using the system.
In the Table 3 and Table 4 twenty main goods exported to Argentina in 2015 are listed, both in USD (Table 3) and under the SML (Table 4). Th e separation of the activities follows the CNAE standards with regard to the SML and NCM to the exports in dollar. Although the classifi cations diff er from the qualitative observation of the subsectors, it is possible to identify the exporting activities that follow certain standards.
Th e group of activities presented in the Table 3 corresponds to 42% of the Brazilian exports to Argentina. It shows that the most dynamic group of exports is the automotive industry (code 87), which holds more than 30% of the total volume presented in the Table, being followed to the distance by the mining and chemical products (Codes 26 and 28).
Th e list of Brazilian exports under SML presented in the Table 4 still shows a predominance of the automotive industry (code 29), where only nine goods holds 28% of all the exports invoiced in BRL and more than 50% of the used sample. On the other side there is a rea sonable diversifi cation in many products like the sector of metallurgy (code 24), which production is most exported under the SML.
Eleven remaining sectors of the selected list add up nearly 40% of the local sales in Argentina with foodstuff s, paved, material to offi ce, glass and wholesale commerce. Th ese data contrasts with the Table 3, in which the goods connected with the motor sector occupy almost the whole list (in dollars).
Th e existence of the SML reveals a subtle alteration in the list of twenty main products exported from Brazil to Argentina. Th e predominance of the automotive industry sector and associated sectors is incontestable, although its weight inside the SML is relatively less. Th e appearance of other sectors with greater distinction in the SML can
indicate that there is a positive answer to advantages from invoicing business in BRL, and that there are exporting sectors in Brazil interested in transacting without the mediation of the dollar exchange.
The national financial system after 2003
Th e changes of the 1980s in the national fi nancial system and in the Brazilian economy deepened the participation of foreign capitals in the home market, along with changes in the Federal Constitution6. Aft er the beginning of Real Plan in 1994 the currency board was adopted, aiming at fi ghting against infl ation and creating conditions for the captivation of external fi nancing. Th e fi xed exchange rate put the new national currency in equality with the US dollar. Th is added to the commercial opening and intensifi ed the trabe balance defi cit7. Th e Fernando Henrique Cardoso government tried to counterbalance this imbalance through a passive monetary politics executed to adjust the Swinging of Payments on the Capital account. Th e elevated interest rates of the public titles linked to the dollar attracted signifi cant volumes of capitals for short-term investment.
Lack of control over the infl ation in the 1980s and beginning of the 1990s made diffi cult for the national currency to carry out its basic functions, and when the context of restriction of the balance of payments was given it was a need for external emblems to balance the internal environment. Within this period there was no discussion, more or less initiative,
6 Th e Correction to the Constitution number 40/2003 moved several legal restrictions of the national fi nancial system.
7 Between 1995 and 1999 the balance of that of the Commercial Swinging was negative, a period in which the government supported an exchange politics of equality with the US dollar. Th e surplus began in the next year strongly infl uenced by the devaluation of the real in 1999.

30
USE OF NATIONAL CURRENCIES IN INTERNATIONAL SETTLEMENTS. EXPERIENCE OF THE BRICS COUNTRIES
Table 4Twenty principal goods exported to Argentina in 2015 under the SML
CNAE code Goods Value in BRL Value in USD
2422901 Production of carbon steel fl at rolled products 179,213,201.68 45,952,102.99
2949299Vanufacture of other parts and accessories for motor vehicles no elsewhere classifi ed
138,388,603.22 35,388,603.22
2910701 Manufacture of cart, vans and buses 117,871,466.96 30,223,453.07
2942500Manufacture of parts and accessories for the systems of running and transmission of motor vehicles
96,189,530.76 24,663,982.25
2422901 Production of fl at-rolled carbon steel, whether or not coated 79,025,765.52 20,263,016.80
2949201 Manufacture of benches and upholstery for motor vehicles 69,147,111.98 17,730,028.71
2063100 Manufacture of cometics, perfumery and toilet preparationa 68,182,002.51 17,482,564.75
2211100 Manufacture of tires and inner tubes 65,677,109.85 16,840,284.58
8211300 Combined offi ce and administrative support services 59,381,983.54 15,226,149.63
2949299Manufacture of other parts and accessories for motor vehicles not elsewhere classifi ed
51,915,966.20 13,311,786.21
2942500Manufacture of parts and accessories for the systems of running and transmission of motor vehicles
48,173,893.14 12,352,280.29
2311700 Manufacture of fl at glass and security glass 43,534,154.12 11,162,603.62
1533500Manufacture of synthetic leather footwear 38,673,607.36 9,916,309.58
2949299
Manufacture of other parts and accessories for motor vehicles not elsewhere classifi ed 31,427,863.35 8,058,426.50
1531901 Manufacture of leather footwear 31,081,668.37 7,969,658.56
2311700Manufacture of fl at glass and security glass 30,566,479.01 7,837,558.72
1531901 Manufacture of leather footwear 29,874,766.70 7,660,196.594530702 Manufacture of tires and inner tubes 29,147,946.69 7,473832.48
1020102Manufacture of preserved fi sh, crustaceans and molluscs 27,636,372.18 7,086,249.28
2941700Manufacture of parts and accessories for motor vehicles 26,625,892.91 6,827,152.03
Total 1,261,362,335.37 323,426,239.84Total exported to Argentina under the SML 2,329,925,757.49 597,416,860.89
Source: Central Bank of Brazil Note: Th e exchange rate used is an annual medium calculated by Central Bank of Brazil

31
THE RECENT EVOLUTION OF THE LOCAL CURRENCY PAYMENTS SYSTEM OF THE BRAZILIAN ECONOMY
concerning using Brazilian currency in the turnover of the international commerce, mainly because the Brazilian economy had suff ered in the previous decade with elevated infl ation rates and successive plans of monetary stabilization that did not work.
Th e external imbalance produced by the economic management of the FHC government became an impetus to force the adoption of measures for attraction and maintenance of foreign emblems through high interest and restriction of the internal demand. Only in 2007, under the Squid government, it was allowed to receive the export revenues in reals8. Th e use of the Brazilian currency was stimulated also by the Resolution 3844/2010 that allowed fi nancial transfers for the outside in any currency, and by the circular 3691/2103 that allowed the liquidation of promises abroad with national currency.
Th e participation of enterprises and foreign institutions in the Brazilian market was enlarged with the permission to have accounts in reals under Circular Letter No. 3691/2013 of the Brazilian Central Bank, but only for foreign exchange operations9. In the same sense, the law 11.803/2008 authorised the Central Bank of Brazil to maintain counts of deposit in reals of property of foreign Central Banks, foreign institutions and enterprises that work with compensation, liquidation and custody in the international market. In case of the foreign Central banks, the Resolution 4.202/2013 determined that the counts in Brazilian currency could be opened and maintained exclusively in the name of foreign Central Banks with which the Central Bank of Brazil had celebrated contracts of swap of local currency.
For the aims of this report, weight of the BRICS countries’ currencies is
8 Resolution No. 12/2007 of Chamber of exterior commerce of the Ministry of Industry Development and exterior Commerce.
9 We did not obtain an answer from the Central Bank of Brazil on the data availiable.
not signifi cant in the total amount of the Brazilian reserves held in foreign currencies. Th e USD still represents 83% of the reserves10. Th at suggests that only a small part of business is in currencies of the developing countries. Nevertheless, the Resolution 3844/2010 allows fi nancial transfers for the outside in any currency, in other words, there is a legal authorization for the remittance of currencies without distinction11. Such a prescriptive act can open space for circulation of the currencies of the BRICS among the countries. In case of real, its use for promises liquidation abroad is allowed by the Circular 3691/2103 (articles 6 and 8). So, the Brazilian legislation allows so much the possession of bank accounts for foreign offi cial institutions and enterprises, both for exchange operations, and interbank transfers in any currency.
Th e activity of foreign fi nancial institutions in the Brazilian market depends on authorization from the Central Bank of Brazil and from the Federal Executive Power (law 4.595/1964). Non-fi nancial enterprises in Brazil need to ask for authorization the Ministry of Industry Development and Exterior Commerce to establish branches or agencies, if they want to operate in the country. Meantime, there is an instrument called Brazilian Depositary Receipt that allows the foreign enterprises to operate in the Brazilian market with local currency (BM&F Bovespa, 2011).
Th e issuance of marketable securities is authorized only to companies that constitute the capital in national currency (article 5 of Law 6.404/1976) and submit to the regulation of the National Mone-tary Council and the Brazilian Securities and Exchange Commission. Th us, there
10 In December 2015, the structure of reserves was as follows: US dollar — 83%, euro — 4.6%, Canadian dollar — 4.3% in euro, pound sterling — 3%, Australian dollar — 2.7%, yen — 1.8% and gold — 0.7%.
11 Currencies of China and of South Africa are traded at the Stock Exchange of São Paulo.
32
USE OF NATIONAL CURRENCIES IN INTERNATIONAL SETTLEMENTS. EXPERIENCE OF THE BRICS COUNTRIES
is a restriction for foreign fi nancial companies and institutions wishing to operate in the Brazilian securities market.
In the case of Brazilian companies, they may trade in the United States through American Depositary Receipts, which are securities issued by the US Securities and Exchange Commission of the United States. According to consultancy Economática, which tracks the actions of 28 Brazilian companies traded at the Stock Exchange of New York, in 2016 the value of transactions was equal to the half of the turnover volume of the Stock Exchange of Sao Paulo, and 10 Brazilian enterprises have business volume above the average of the actions of the US enterprises (Economática, 2016).
Th e Brazilian multinationals in condi-tions of giving out marketable papers abroad can be analyzed by their degree of internationalization12. In accordance with a study of the Dom Cabral Foundation (2016), which measures and monitors the internationalization of the Brazilian multinational enterprises, from a sample of 63 enterprises, 49 they act out of Brazil with own unities (the remainder — through franchises). Within the used sample, nearly 10 multinationals obtain more than 50% of receipts beyond Brazil. Another important fact is a geographical distribution of the branches: they are presented in almost all continents and, for the aims of this study, there are branches of Brazilian multinationals in all BRICS countries.
Final considerations
Th e brief exhibition of the data concerning SML agreement between Brazil and Argentina shows that the system works by means of encouraging in the fi nancial sphere of the operation of
12 Th e Foundation Dom Cabral uses the rate of internationalization of the UNCTAD. It is calculated according to the next form: (total assets outside / total income + number of employees outside / total of employees)/3.
export and import. It is clear that there is a mismatch in the use of the system for the economic agents of two countries. Perhaps it is only a refl ection of the size of the internal economies, which is refl ected to be the total exported. Meantime, as soon as the stimuli policies are equivalent, aft er six years of operation the low turnover value in Peso also can expose a situation in which the local currency is not much accepted for international operations, even inside a robust institutional outline as it is the MERCOSUR.
Th e appearance of eleven diff erent sectors in the exports under the SML indicates that the incentives in Brazil were eff ective in the direction of encouraging new economic agents. Th e change in the group of goods exported under the SML (Table 4) also is an indicator of changes in the perception on the Brazilian currency, which assumes to some extent the function of unity of account for the regional commerce.
Th e experience of the Local Currency Payment System as a public policy is restricted by abolishing the transaction cost of the exchange operation and the wrapped taxation. Th ere is no special treatment for the stage of shipment or customs, which continues similar to exporting in US dollars. Th e mapping of this stage and the identifi cation of some item susceptible to the abolition would bring probably an additional stimulus to the adhesion to the system.
Th e discrepancy between exports and imports inside the SML produces an imbalance of the SML’s balance of payments. In the case open to question, there is a great imbalance in favor of Brazil in every year of the series. Th at depends on the incentives for economic agents; that may require specifi c policies of encouraging. Opposite case, with the system only bringing benefi ts to a side the interest of the country in unfavorable situation of the agreement can be short.
From the data shown in the Table 4, it is worth to plan a policy plan to stimulate
33
THE RECENT EVOLUTION OF THE LOCAL CURRENCY PAYMENTS SYSTEM OF THE BRAZILIAN ECONOMY
those sectors that use the SML like road of alternative export, by undertaking the more accurate analysis of the profi le of such economic agents and the reasons that led them to opting for the SML, besides those already known ones. Also for those more powerful sectors within the SML, just like the motor one, it is worth thinking about policies to drive more still the use of the system.
Th e experience of a Local Currency Payments System already existent and reasonably consolidated was related brie-fl y. Th e mechanisms for construction and management respond to the peculiarities of the MERCOSUR, however they can become a model of stimulus to the regionalism. Besides, it induces the reduction of the dependence regarding the dollar, which is in the root of the imbalances of the swinging of payments of the most of the developing countries.
At the time the dollar remains the main currency of international negotiation, and a reference unity for intermediating the exchange with non-convertible currencies. Th ere are attempts of reducing this dependence through mechanisms that put the non-convertible local currencies in face one of other one. A good example is the SML between Bra-zil and Argentina, which works well and volume of business grows. However, this one does not do without the US dollar as a calculated parameter. Th e exchange rate of the SML is obtained from the relation of the respective currencies of Brazil and Argentina with the US dollar. So, that does not protect the tax SML from eventual abrupt exchange oscillations. On the contrary, it will be going to refl ect them in the local currencies, and the economic agents do not realize the eff ect pass-through for the tax SML.
Th e construction of an alternative system of payments, in a fi rst observation, passes by the substitution for another currency or commodity. Th us, in the XXth century the gold standard was initially replaced by a dollar-gold one,
and then — by dollar as the main reference currency. Herewith, there were always doubts on the question which one could be the main reference point, accompanied with eff orts to create an appropriate payment system.
To give support to the BRICS claims for comparing the infl uence of the US currency without repeating the mis-takes of this system, it is necessary: to reduce the volatility of the exchange rates between the currencies wrapped in order to avoid speculative positions and establish a collective action of the Central banks for avoiding exchange war between the countries. Th e choice of just one currency is not in the core of the political objectives of the BRICS, so the main idea is: to stimulate the use of the local currency circulating freely, building an exchange rate that refl ects the combination to historical average of the commercial transactions between the countries, the GDP, the degree of in-ternationalization of the currency and the productivity of the factors. Initially, the dollar would be still a parameter of comparison, subsequently substituted by the local currencies themselves. Th e strongest savings and the most present currencies in other markets would have his most valued currencies and vice-versa.
Th e internationalization of the BRICS-currencies depends on the liquidity and on the degree of opening of BRICS` fi nancial markets: depth, elasticity and elevated volume of the wholesale markets, confi dence in the fi nancial power of the markets and standards regulatórios aligned. Th ese agreements suff ered more deep alterations (BCB’s Resolution 3844/2010 (it allows fi nancial transfers for the outside in any currency and Circular Letter 3691/2103 that al-lows the liquidation of promises abroad with national currency) in the internal and political stimulus legislation to the use of the local currency (in case of Brazil) in other markets, besides the reciprocity

34
USE OF NATIONAL CURRENCIES IN INTERNATIONAL SETTLEMENTS. EXPERIENCE OF THE BRICS COUNTRIES
of these last ones to accept business in real.
Th e experience of the SML between Brazil and Argentina demonstrates that there is already some degree of internationalization of the real and adhesion of Brazilian enterprises in invoicing in the Brazilian currency, since there is a policy set that stimulates the participation the system. Th e Brazilian multinationals operating abroad, under more several forms, also are an evidence of the internationalization of the pro-duction and penetration in the foreign fi nancial markets (in the case of the Stock Exchange of New York). It is risked to answer these enterprises they would be disposed in substituting the BRL at the receiving of his bills, at last they operate in several markets with diff erent currencies. Meantime, it is reasonable to believe that when a stimulus is in the form of public politics, mainly what withdraws the unpredictability of the exchange relation in the current system, the adhesion will take place in the similar form to the SML Brazil-Argentina.
Th e foreign enterprises that act in Brazil, under the local laws, have been demonstrating interest in invoicing in BRL, just like the motor enterprises (all foreigners multinationals) which use transacting under SML. Nevertheless, while joining the Brazilian market such enterprises become national in accordance with the legislation in force and since the treatment was already reported to the foreign enterprises with thirst abroad the same thing is not, though it could dispose of counts near the Central Bank of Brazil in BRL for exchange operations and remit any currency for the outside.
References
1. ADR's brasileiros movimentam US$ 1 bilhão em média por dia nos USA —As ADR's equivalem a mais de 50% da Bovespa — 10 ADR's têm movimento maior nos USA em comparação com o Mercado local // ECONOMÁTICA. 2016. October 4. URL: http://economatica.com/estudos/data/20161004a.pdf
2. Biancareli A. A abertura fi nanceira no Brasil: um balanço crítico // Sistema fi nanceiro e desenvolvimento no Brasil: do Plano Real à crise fi nanceira / Org. L. C. Marcolino, R. Carneiro. São Paulo: Publisher Brasil e Editora Gráfi ca Atitude, 2010. P. 55–88.
3. Biancareli A. Integração, ciclos e fi -nanças domésticas: o Brasil na globali-zação fi nanceira: Tese de Doutoramento. IE/Unicamp, 2007.
4. Brazilian Depositary Receipts (BDRs) // BM&F Bovespa. 2011. URL: http://www.bmfbovespa.com.br/pt-br/servicos/download/BDR_Patrocinados_Portugues.pdf
5. Carneiro R. Globalização e inconver-sibilidade monetária // IE/Unicamp. Texto para Discussão. 2006. No. 120. URL: http://www.eco.unicamp.br/docprod/downarq.php?id=1750&tp=a
6. Carvalho C. E., Vidotto C. A. Aber-tura do Setor Bancário ao Capital Estrangeiro nos Anos 1990: os objetivos e o discurso do governo e dos banqueiros // Nova Economia. 2007. Vol. 17. No. 3.P. 395–425. URL: http://www.scielo.br/scielo.php?script=sci_arttext&pid=S0103-63512007000300002
7. Convênio do Sistema de Pagamentos em Moeda Local entre a República Argentina e a República Federativa do Brasil // Banco Central Do Brasil. 2008. September 8. URL: http://www.bcb.gov.br/rex/sml/convenio-sml-pt.pdf
8. Eichengreen B., Hausmann R., Panizza U. Currency mismatches, debt intolerance and original sin: why they

35
THE RECENT EVOLUTION OF THE LOCAL CURRENCY PAYMENTS SYSTEM OF THE BRAZILIAN ECONOMY
are not the same and why it matters // National Bureau of Economic Research. Working Paper. 2003. No. 10036. URL: http://www.nber.org/papers/w10036.pdf
9. Eichengreen B., Hausmann R., Panizza U. Original sin: Th e Pain, the Mystery and the Road to Redemption. Conference “Currency and Maturity Matchmaking: Redeeming Debt from Original Sin”. Washington, D.C. 2002. November 21–22. URL: http://www.financialpolicy.org/financedev/hausmann2002.pdf
10. Filgueiras L. História do Plano Real. São Paulo: Boitempo, 2000.
11. Freitas M.C.P., Prates D.M. A aber-tura fi nanceira no governo FHC: impactos e conseqüências // Economia e Sociedade. 2001. Vol. 17. P. 81–111.
12. Ranking de Multinacionais brasi-leiras 2015 // Fundação Dom Cabral. 2016. URL: http://www.fdc.org.br/blogespacodialogo/Documents/2015/r a n k i n g _ f d c _ m u l t i n a c i o n a i s _brasileiras2015.pdf
13. SML — Sistema de Pagamentos em Moeda Local // Banco Central Do Brasil. 2016. URL: http://www.bcb.gov.br/pt-br/#!/n/sml

36
USE OF NATIONAL CURRENCIES IN INTERNATIONAL SETTLEMENTS. EXPERIENCE OF THE BRICS COUNTRIES
In the 1990s-2000s Russian ruble has evolved from almost inconvertible unit into a currency with no restrictions on both current and capital account convertibility in terms of national legislation. Th is process (along with the results achieved) is represented here with regard to changes in foreign exchange regulation, using the ruble in foreign trade, and developing both the FX and fi nancial markets.
Foreign exchange regulation
In Russia partial current account convertibility of the ruble was guaranteed as early as in the mid of 1990s. Even the fi rst edition of the act on Foreign Exchange Regulation and Foreign Exchange Con-trol dated October 9, 1992 stipulated the removal of restrictions on using the Russian currency for current payments and transfers for residents. In June 1996 aft er Russia accessed to Article VIII of the IMF’s Articles of Agreement this regime was extended to non-residents as well.
At the height of the 1998 crisis, the Russian government strengthened foreign exchange control. However, as fi nancial stability grew most of the restrictions introduced in 1998–99 were either eased or cancelled.
Resumption of economic growth and substantial improvement of the payments balance in the early 2000s gave rise to further liberalization of foreign
Chapter 3
Russia’s Deal on Promoting the Regional Status of the Ruble1
1 Sergey Karataev, Nikolay Troshin, Nataliya Gribova, Pavel Zakharov, Ivan Bazhenov — Russian Institute for Strategic Studies.
2 Annual Address to the Federal Assembly of the Russian Federation // President of Russia: offi cial website. 2003. May 16. URL: http://en.kremlin. ru/events/president/transcripts/21998
3 Annual Address to the Federal Assembly of the Russian Federation // President of Russia: offi cial website. 2006. May 10. URL: http://en.kremlin. ru/events/president/transcripts/23577
exchange regulation and transition to a full convertibility of the ruble including capital transactions. Th is aim was set in President Vladimir Putin’s Address to the Federal Assembly in May 20032.
New revision of the Federal Law on Foreign Exchange Regulation and Control passed in December 2003 (dated Decem-ber 10, 2003, No. 173-FZ) proclaimed free exercise of foreign exchange transactions between residents and non-residents. Restrictive administrative measures could only be imposed on certain transactions associated with capital fl ows and only in cases stipulated explicitly by the law. Almost all restrictions were supposed to be removed from January 1, 2007. However, this process was subsequently modifi ed.
In the Address to the Federal Assembly on May 10, 2006 President Vladimir Putin noted the progress made by the Government in promoting a full convertibility of the ruble and recommended to accelerate this process with removing all remaining restrictions from July 1, 20063. Since the mid-2006, the requirement of the Bank of Russia obliging to reserve funds while performing foreign exchange capital transactions was abolished. Moreover, the Federal Law on Foreign Exchange Regulation and Control (No. 131-FZ dated July

37
RUSSIA’S DEAL ON PROMOTING THE REGIONAL STATUS OF THE RUBLE
26, 2006) was amended to remove the power previously granted to the Rus-sian Government and the Bank of Russia, to restrict foreign exchange transactions.
Since that moment, the ruble can be offi cially regarded as fully convertible. Non-residents were entitled to carry out any transactions with the Russian currency without limitations: open accounts, perform cross-border trans-fers, purchase securities etc.
Still the Russian legislation (parti-cularly, bylaws) contains a number of provisions, mostly in the fi eld of foreign exchange control, signifi cantly hindering the ruble global turnover. Th us, the rule of export proceeds’ compulsory repatriation is still in force (i.e. crediting these proceeds to an authorized bank’s account within the territory of the Russian Federation), which also applies to ruble revenues. Th e requirement for making
a transaction certifi cate remains intact in case of the transaction occurred between Russian resident and non-resident4.
Th ese requirements are not only burdensome for business but also work discouraging on using the Russian currency in international transactions. Moreover, such requirements run con-trary to the goal of internalization of the ruble by inducing ruble infl ows back into Russia.
4 Currently, a transaction certifi cate (deal passport) is needed only if the amount of obligations under the agreement is equal to or exceeds the equivalent of USD 50, 000. In May 2017 the Ministry of fi nance representatives announced the cancellation of trans-action certifi cates that could be probably put into force in several months. See Minfi n: pasporta sdelok s nerezidentami otmenyat // Vesti Ekonomika. 2017. May 11. URL: http://www. vestifi nance.ru/articles/85249
Exports Imports
1, 600, 000
1, 400, 000
1, 200, 000
1, 000, 000
800, 000
600, 000
400, 000
200, 000
02005 2006 2007 2008 2009 2010 2011 2012 2013 2014 2015
Figure 1. Volumes of cross-border ruble payments with Belarus, Kazakhstan, Kyrgyzstan and Tajikistan, bn rubles Source: Interstate Bank; authors’ calculations

38
USE OF NATIONAL CURRENCIES IN INTERNATIONAL SETTLEMENTS. EXPERIENCE OF THE BRICS COUNTRIES
Using the ruble in foreign trade in goods and services
Liberalization of foreign exchange regulation and removal of restrictions on capital fl ow led to growth of cross-border transactions in rubles. Primarily, the Russian currency began to regain position in the post-Soviet countries. National companies started to accept payments in rubles for their supplies to the CIS states more willingly. For example, according to the Interstate Bank’s data collected from the central banks of Belarus, Kazakhstan, Kyrgyzstan and Tajikistan, the volume of ruble payments for Russian goods in the period from 2005 to 2008 grew from 247.5
Figure 2. Volumes of cross-border payments in rubles with the whole world and non-CIS countries, bn rubles Source: Bank of Russia; authors’ calculations
billion rubles to 445.2 billion rubles, or by 80% (Figure 1).
Th e volume of ruble payments for the goods imported to Russia from these countries also increased, but in a lesser degree. Demand of the CIS states for freely convertible currency to form their international reserves determined their opting for the US dollar as a means of payment for their goods. Nevertheless, the volumes of ruble capital transfers, received by companies of the four-abovementioned countries grew from 204.3 billion rubles in 2005 to 292.2 bil-lion rubles in 2008 or by 43%.
In 2009 the world economy crisis froze ruble transactions growth, but it resumed subsequently. In 2015, the volume of ruble payments for the Russian exports
Exports (whole world)
Imports (whole world)
Exports (non-CIS states)
Imports (non-CIS states)
1, 600
1, 400
1, 200
1, 000
800
600
400
200
0
Q120
13
Q320
13
Q120
14
Q320
14
Q120
15
Q320
15
Q120
16
Q320
16

39
RUSSIA’S DEAL ON PROMOTING THE REGIONAL STATUS OF THE RUBLE
reached 1,417.8 billion rubles, while payments for imports reached 909.5 billion rubles. Th e Bank of Russia data generally confi rms these dynamics, though the data on capital transfers for the goods imported by Russia still diverge in some cases. In particular, it concerns the crisis year of 2009, when the volume of ruble transfers increased, while national central banks documented its decrease, according to the Russian regulator.
Th e Bank of Russia has recently started to disclose data on currency structure of foreign trade in goods and services. Th e Figure 2 highlights quarterly data on the ruble, US dollar and euro share in exports receipts and imports payments, starting from Q1 20135. Together with data from
5 See Currency Composition of Settlements for Goods and Services // Bank of Russia. URL: http:// www.cbr.ru/statistics/?PrtId=svs
the balance of payments concerning absolute values of trade volume, this aff ords to assess (with more or less accuracy) the ruble payments volume not only in the trade with the CIS countries, but also with the whole world.
Th e share of ruble receipts for the exports from Russia amounted to 1.9 trillion rubles in 2013, 37.4% of which represented Belarus, Kazakhstan, Kyrgyz-stan and Tajikistan, while payments for imports amounted to 4.2 trillion rubles (the share of Belarus, Kazakhstan, Kyrgyzstan and Tajikistan was 14.3%). Th erefore, unlike settlements with the CIS countries, settlements with non-CIS states show preponderance of ruble payments for the imports over ruble receipts for the exports, resulting in the development of external ruble market. In 2015, ruble receipts for the Russian
Figure 3. Currency structure of the Russian exports receipts, % Source: Bank of Russia; authors’ calculations
RUB share in the exports receipts USD share in the exports receipts
EUR share in the exports receipts
80
90
70
60
50
40
30
20
10
0
Q120
13
Q220
13
Q220
14
Q320
13
Q420
13
Q320
14
Q420
14
Q320
15
Q420
15
Q320
16
Q120
14
Q120
15
Q220
15
Q120
16
Q220
16
40
USE OF NATIONAL CURRENCIES IN INTERNATIONAL SETTLEMENTS. EXPERIENCE OF THE BRICS COUNTRIES
exports increased almost to 3 trillion rubles, while payments for imports increased to 4.8 trillion rubles. Along with it, the share of the abovementioned four countries grew insignifi cantly to 40.9% and 15.4% respectively. Th is was basically caused by stagnation (and even cut-down) of ruble settlements with other CIS states — mainly with Ukraine.
However, the deterioration of political situation did not actually aff ect the volume of ruble settlements with non-CIS states (Figure 2). Despite the anti-Russian economic sanctions imposed by the United States and their allies, the volume of ruble settlements with non-CIS states continued its growth almost at such rate as it was with Belarus, Kazakhstan, Kyrgyzstan and Tajikistan. Only for the fi rst 9 months of 2016, the volume of receipts for the Russian exports to non-CIS states amounted to 1.24 trillion rubles, and payments for the imports — 2.91 trillion rubles, thus showing a growth of 27.6% and 9.8% respectively as compared to the same period in 2015.
At the same time, absolute values do not provide a broad picture of using the ruble in international settlements. For more precise assessment of its place and role in the total fl ow of cross-border receipts and payments of Russian companies, we should address the Russian foreign trade currency structure.
According to offi cial statistics, the ruble share in receipts for the exports of goods and services from Russia is relatively low, amounting to 10—15% of the total receipts volume6. Th e main body of foreign exchange earnings is formed by the US dollar. Th e share of euro in receipts for the exports is comparable to the share of the ruble, though Euro-area countries account for 40% of the Russian exports at least (Figure 3).
Such receipts structure is attributed to resource-based nature of the Russian
6 See Currency Composition of Settlements for Goods and Services // Bank of Russia. URL: http:// www.cbr.ru/statistics/?PrtId=svs
exports. In particular, in 2013 the share of oil and other energy and fuel recourses amounted to over 70% of the total value of the Russian exports. Together with ferrous and nonferrous metals, as well as gold the share of raw materials increases up to 82%. Prices for most of these goods are set mainly in the US dollars. As a result, the share of the US dollar in the receipts for the Russian exports in the same year of 2013 amounted to 79.6%. Relatively large share of the ruble in the settlements with the CIS states as compared to non-CIS states can be also attributed to reliance of the foreign exchange structure of the exports receipts on its commodity structure. In 2013 export of energy and fuel recourses to non-CIS states amounted to 74.5%, raw materials in whole — 85.7% from the total value of the exports7. 84.2% of the exports were settled in the US dollars, while rubles amounted only to 5.5%. However, in the trade with the CIS states the share of oil as well as other raw materials in whole was signifi cantly less (47% and 59.5% respectively)8. As a result, the US dollar accounts for only 44.4% of the total value of receipts for the exports to the CIS states. Th e share of the ruble in the exports settlements is amounting to 47%.
Th us, there is a clear direct correlation between the share of raw materials (primarily, oil) in the Russian exports and the share of the US dollar in the receipts. It does not however mean that the share of the ruble in the receipts for the exports would grow automatically with the decrease of the share of energy and fuel recourses in the Russian exports structure. Th is notably appears from its movements in recent times. While the raw materials share in the Russian exports in the fi rst three quarters of 2013 decreased by 10.5 pp (oil and gas — even 14.5%).
7 See Exports commodity structure for January 2013 — December 2013 // Federal customs service. URL: http://stat.customs.ru/apex/ f?p=201:7:2854010855712102::NO
8 Ibid.

41
RUSSIA’S DEAL ON PROMOTING THE REGIONAL STATUS OF THE RUBLE
Th e share of the ruble grew only by 7.2 pp (Figure 4).
Th us, the ruble has the potential for expansion of its usage in the export settlements. Its share may be increased without reference to the export of raw materials, let alone the export of oil and gas, but this will imply promotion of those industries that off er wider product diff erentiation9. International experience shows that the share of national currency (e.g. in the receipts for the export of pharmaceutical products) can reach 70% to 80%.
Unlike the exports, the Russian imports are more diff erentiated and
9 Th e diff erentiation will be higher, where the goods of diff erent sellers on the market are less perfect substitutes. Th e diff erentiation is based on the experience-based preferences of consumers who consider diff erent brands as diff erent goods.
therefore its share is signifi cantly less, though the US dollar still remains the leading foreign exchange for settlements. Settlements in rubles amount to at least 25% of the total value of payments for imported goods and services, while the share of euro being slightly higher (Figure 5). As was the case of the exports settlements, the share of the ruble is higher in the settlements for the goods imported from the CIS states and the EAEU states. Here it exceeds 60%. Nevertheless, the share of the ruble in the settlements of imports from the EU is also high. It amounts to 26% of payments on average.
However, unlike the exports receipts, the imports transfers do not expose a clear tendency of growth of the ruble transactions share. In trade with non-CIS states as well as with the CIS states,
Figure 4. Share of the ruble and non-resource products in the Russian exports, %Source: Bank of Russia; FCS; authors’ calculations
Share of the ruble in the exports receipts
Share of non-resource products in exports
Share of non-oil exports
40
30
35
45
20
25
15
5
0
10
Q120
13
Q220
13
Q220
14
Q320
13
Q420
13
Q320
14
Q420
14
Q320
15
Q420
15
Q320
16
Q120
14
Q120
15
Q220
15
Q120
16
Q220
16

42
USE OF NATIONAL CURRENCIES IN INTERNATIONAL SETTLEMENTS. EXPERIENCE OF THE BRICS COUNTRIES
the share of the ruble in the imports transfers remains stable in general. Th is can indicate weakness of market positions of the Russian importers impelled to use foreign exchange as well as insuffi cient attractiveness of the ruble.
Strengthening the ruble could con-tribute to it signifi cantly. Its depre-ciation leads to reduction of the volume and the share of the ruble in foreign trade. Th is applies both to the exports receipts (Figure 6) and to the imports transfers (Figure 7).
Th e fi rst quarter of 2015 is represen-tative in this regard. Exchange rate of the ruble to the US dollar fell sharply by 32% compared to the previous quarter. Th is resulted in reduction of the exports receipts volume by 27.9% and its share in the total amount of receipts by 29.6%. Th e same fl uctuations emerged in the volume and share of the ruble in the imports transfers. Moreover, in the latter case foreign
suppliers had begun being reluctant to use the ruble in settlements ever earlier — once the tendency of its reduction had come into view.
Th is process could be in some way aff ected by tensions in relationships between Russia and the West countries in the aft ermath of the Ukrainian crisis and subsequent economic sanctions imposed by the United States and their allies in relation to some Russian top companies and banks. However, once the ruble started to strengthen, its share in foreign settlements and volumes of transactions were on the rise. New signifi cant depreciation of the ruble in Q1 2016 once again caused reduction of the ruble volume and share in both the exports and imports settlements.
Such dependence can be considered as one more symptom of weakness of Russian companies in the internal market mentioned above. In foreign markets,
Figure 5. Foreign exchange structure of payments for the Russian imports, %Source: Bank of Russia; authors’ calculations
RUB share in the imports payments USD share in the imports payments
EUR share in the imports payments50
40
30
35
45
20
25
Q120
13
Q220
13
Q220
14
Q320
13
Q420
13
Q320
14
Q420
14
Q320
15
Q420
15
Q320
16
Q120
14
Q120
15
Q220
15
Q120
16
Q220
16

43
RUSSIA’S DEAL ON PROMOTING THE REGIONAL STATUS OF THE RUBLE
national exporters making contracts in US dollars with the growth of its exchange rate are able to get additional profi t in rubles. On the contrary, in the internal market, setting prices on imported goods in US dollars in these circumstances leads to cost growth and profi t reduction. Hence, investment capacity of Russian producers also declines.
Th e use of the ruble in settlements with the BRICS countries is inferior to those positions that the Russian currency generally occupies in the foreign trade of the country (Figure 8, Figure 9). Th ough the share of raw materials in the Russian exports to the BRICS countries is insignifi cantly less than that in total exports of Russia, the US dollar is dominant in bilateral settlements between the BRICS states. It accounts for more than 80% of mutual trade. For the fi rst 9 months of 2016, only 7.6% of the Russian exports to the BRICS countries and 3.5% of the imports were settled in rubles, while the value of the ruble in trade
within the BRICS amounted to 7% and 3.5% respectively.
However, it is worth mentioning that the value of the ruble in the Russian exports receipts within the BRICS increases faster than those with other countries. While the share of the ruble in settlements with non-CIS countries grew by 5.4 pp including the EU countries by 6.8 pp, its share in payments from the BRICS states increased by 8 pp Th e largest growth accounted for the share of the ruble in receipts from India: from 1.1% in 2013 to 14.8% in 2015. However, it began to decline in 2016. Th e share of the ruble in receipts for the Russian exports to China grew from 1.5% in January–September 2015 to 6.7% in January–September 2016.
On the other hand, the value of the ruble in transfers for the imports from the BRICS countries fell insignifi cantly. It was due to increase of the use of other BRICS countries’ currencies in settlements, pri-marily the Chinese renminbi. While in Q1 2013 its share amounted only to 2.1% of the Russian imports transfers from China,
Changes inRUB/USD rate
Changes in theshare of the ruble in the exports receipts
Changes in thevolume of receipts in rubles
-40
40
50
-30
30
-20
20
-10
10
0
Q220
13
Q220
14
Q320
13
Q420
13
Q320
14
Q420
14
Q320
15
Q420
15
Q320
16
Q120
14
Q120
15
Q220
15
Q120
16
Q220
16
Figure 6. Movements of the RUB to USD rate, volume and share of the ruble in the exports receipts from Russia, % Source: Bank of Russia; authors’ calculations

44
USE OF NATIONAL CURRENCIES IN INTERNATIONAL SETTLEMENTS. EXPERIENCE OF THE BRICS COUNTRIES
Figure 7. Movements of the RUB to USD rate, volume and share of the ruble in the import payments, %Source: Bank of Russia; authors’ calculations
Figure 8. Foreign exchange structure of exports from Russia to other BRICS countries, %Source: Bank of Russia; authors’ calculations
Changes in
RUB/USD rate
Changes in theshare of the ruble
in the import payments
Changes in the
volume of payments in rubles
-40
-30
30
-20
20
-10
10
0 Q2
2013
Q220
14
Q320
13
Q420
13
Q320
14
Q420
14
Q320
15
Q420
15
Q320
16
Q120
14
Q120
15
Q220
15
Q120
16
Q220
16
RUB share in the exports receipts EUR share in the exports receipts
USD share in the exports receipts (right scale)
Other currencies share in the exports receipts
0
1
2
3
4
5
6
7
8
9
10
0
10
20
30
40
50
60
70
80
90
100
Q220
13
Q120
13
Q220
14
Q320
13
Q420
13
Q320
14
Q420
14
Q320
15
Q420
15
Q320
16
Q120
14
Q120
15
Q220
15
Q120
16
Q220
16

45
RUSSIA’S DEAL ON PROMOTING THE REGIONAL STATUS OF THE RUBLE
it grew to 15.8% of the total amount of transfers to China in Q3 201610. Th us, the mutual trade of the BRICS countries assumes a rule, under which the exporter specifi es the transaction currency. While seeking to mitigate foreign exchange risk, the exporter usually decides in favour of the national currency.
Apart from bilateral trade, the ruble is used by third countries for settlements among each other, which in general refl ects a high level of internationalization of the Russian currency. According to the statistics of the Interstate Bank since 2005, the largest use of the ruble is fi xed in the settlements between Belarus and Kazakhstan as well as between Kyrgyzstan and Tajikistan. In general, the share of the
10 Th e Bank of Russia does not separate a share of the Chinese renminbi in its statistics. "Other currencies" column was taken as a reference data.
ruble in the mutual trade between these four countries in 2015 accounted for 10.5% of all payments (Figure 10). Th e largest amount (14.8%) was reached in 2013. However, signifi cant depreciation in the subsequent years led to reduction of its use and therefore of its share in settlements11.
Development of trade in the RUB on FX markets
An important condition for using the ruble in international settlements is the presence of a developed FX market. Such market allows quickly and with minimal costs buying or converting rubles into
11 See Payments providing mutual trade turnover // Interstate Bank. URL: http://www.isbnk. info/analytics_payments.html
Figure 9. Foreign exchange structure of the Russian imports from other BRICS, %Source: Bank of Russia; authors’ calculations
RUB share in the imports payments EUR share in the imports payments
USD share in the imports payments
(right scale)
Other currencies share in imports payments
0
2
4
6
8
10
12
14
16
70
95
90
85
80
75
Q220
13
Q120
13
Q220
14
Q320
13
Q420
13
Q320
14
Q420
14
Q320
15
Q420
15
Q320
16
Q120
14
Q120
15
Q220
15
Q120
16
Q220
16

46
USE OF NATIONAL CURRENCIES IN INTERNATIONAL SETTLEMENTS. EXPERIENCE OF THE BRICS COUNTRIES
any other currency. Currently, Russia has a suffi ciently large and liquid FX market (both the internal and external one) with a well-formed institutional structure and modern trade technologies.
Th e internal FX market in Russia developed primarily as an exchange. Moscow Interbank Currency Exchange (Moscow Exchange since 2012) was established in January 1992 on which trades were eff ected in auction mode until 1998. Unifi ed rates were established for all participants during the auction. In 1997, MICEX proposed to the banks a system of electronic lot trading allowed to conclude transactions during the entire operational day at the current exchange rates.
Since July 1992, the Bank of Russia uses the results of exchange trades to determine the offi cial exchange rate of the ruble against the US dollar. For that purpose, a weighted average of 11:30 Moscow time is
used for the USD/RUB currency pair with calculations "tomorrow".
In 2002, the average daily volume of transactions in the internal FX market was 5.6 billion US dollars. Only 72% accounted for transactions with the ruble (Figure 11). Moreover, the main instrument of trade in the interbank market was the RUB/USD pair amounted to 71.2% of the total volume of the FX market or 99% of the volume of trade in the ruble segment12.
Completion of the liberalization of foreign exchange regulation gave a new burst of the development of the internal market. In 2007, the average daily turnover increased by 88% in comparison with 2006 and amounted to 54.2 billion US dollars. In July 2008, the market recorded
12 See Main indicators of the Russian Federation’s foreign exchange market turnover (by methodology of the Bank of Russia) // Bank of Russia. URL: http://www.cbr.ru/statistics/?PrtId=fi nr
Volume of payments RUB share in the total volume of payments (right scale)
0
2
4
6
8
10
12
14
16
18
2O
16
14
12
10
8
6
4
2
0 2005 2006 2007 2008 2009 2010 2011 2012 2013 2014 2015
Figure 10. Use of the ruble in mutual trade of Belarus, Kazakhstan, Kyrgyzstan and Tajikistan: volume (bn rubles) and share of the ruble (%) Source: Interstate Bank; authors’ calculations

47
RUSSIA’S DEAL ON PROMOTING THE REGIONAL STATUS OF THE RUBLE
a maximum trade volume of 84.1 billion US dollars per day. Trade in rubles for other currencies beside the US dollar also intensifi ed. As a result, the share of the RUB/USD pair slightly decreased to 96.2% of the total volume of transactions with the ruble in 2007 as well as to 94.6% in 200813.
In 2009, the global fi nancial crisis caused a decrease in the daily turnover in the Russian internal FX market to 40.2 billion US dollars. In 2013, the average daily trade volumes began to grow again and amounted to 63.6 billion US dollars, as the consequences of the crisis were
13 See Main indicators of the Russian Federation’s foreign exchange market turnover (by methodology of the Bank of Russia) // Bank of Russia. URL: http://www.cbr.ru/statistics/?PrtId=fi nr
Figure 11. Internal FX market in Russia: volume (bn US dollars) and structure (%) Source: Bank of Russia; authors’ calculations
overcome14. Against this background, the Russian currency continued its internationalization. Th e share of trans-actions with the ruble in the total volume of currency transactions increased to 81%. Th e share of the RUB/USD pair (to 88.7% in 2013) continued to decrease due to expansion of transactions with other currencies.
However, in 2014, the positive deve-lopment of the FX market stalled due to the infl uence of a number of external and internal factors. As a result, in 2016, the total turnover of trade in the Russian internal FX market fell to 37 billion US dollars per day, and the share of the RUB/USD pair in the ruble segment rose to 89.1% (73% of the total market volume). At the same time, the share of transactions
14 Ibid.
70
Volume of trade(right scale)
Share ofinstrumentsin rubles
Share ofRUB/USD pair
60
50
40
30
20
10
0
8090
80
70
60
50
40
30
20
10
0
2002 2004 2006 2008 2010 2012 2014 2016

48
USE OF NATIONAL CURRENCIES IN INTERNATIONAL SETTLEMENTS. EXPERIENCE OF THE BRICS COUNTRIES
with the ruble slightly increased and amounted to 82% of total turnover.
Serious changes underwent the correlation between the exchange and interbank foreign exchange markets. Th e increased stability and strength of Russian banks led to the fact that the role of exchange trade in the ruble segment declined signifi cantly. According to experts, in April 2008, over 80% of conversion transactions with the ruble were eff ected between commercial banks in the OTC market (Mishina, 2016). Th e global fi nancial crisis facilitated a partial return of transactions to the exchange. Aft er the introduction of economic sanctions in 2014, this trend has only intensifi ed.
On the one hand, many foreign companies cut their limits on Russian banks or completely stopped working with Russian clients. In late 2014 — early 2015, in conditions of high volatility of the ruble exchange rate, a number of foreign trading systems even stopped trading in ruble. At the same time, Moscow Exchange traded in normal mode, which facilitated the movement of transactions with the Russian currency to the organized market. Th e growth of exchange trade is also promoted by the policy of the Moscow Exchange aimed at providing foreign banks’ clients with direct access to trading (Direct Market Access).
In general, the exchange turnover increased from 96 trillion rubles in 2009 to 330 trillion rubles in 2016, i.e. it grew more than 3 times for the specifi ed period. At the same time, the average daily trading volume exceeded 1.3 trillion rubles in 2016. Th us, Moscow Exchange accounted for 53% of the Russian internal FX market15.
Currently, Moscow Exchange allows making transactions for rubles with eight currencies: US dollar, euro, pound
15 Moscow Exchange Group Markets Statistics: Monthly trading volumes // Moscow Exchange. URL: http://moex.com/s867
sterling, Kazakh tenge, Belarusian ruble, Hong Kong dollar and Ukrainian hryvnia. However, the main turnover falls on the RUB/USD pair the share of which amounts to 84.4% of the exchange trading in 2016. Another 13.1% accounted for the RUB/EUR pair16. Th us, the share of all other instruments does not exceed 3%, which, of course, limits the possibility of a wider use of the ruble in international settlements.
Th e maturity of the Russian FX market was evidenced by the decision taken in July 2016 by the Emerging Markets Traders Association and Chicago Mercantile Exchange to use the fi xing of Moscow Exchange for settlements on futures and forward contracts for the Russian currency instead of its own reference rate (Fox, 2016). Th us, the participants of the global fi nancial market demonstrated increased confi dence in the mechanism for determining the ruble exchange rate formed as a result of changes in the policy of the Bank of Russia related to the refusal to maintain the FX band and the transfer of the ruble into free fl oat mode.
Trade in ruble futures on the Chicago Mercantile Exchange began in April 1998. However, it has been ceased already in October 1998, because of the crisis. Only in 2003, CME began to quote ruble futures again. Th e growth of foreign investors’ interest in the Russian currency was facilitated by an increase in global oil prices and further liberalization of foreign exchange regulation in Russia. Since 2006, the ability to perform transactions with ruble-denominated instruments was provided by trading systems such as LavaFX Interbank (New York, the United States) and ICAP EBS (London, the United Kingdom). Th e ruble is regularly quoted by large international banks. Th rough Clearstream and Euroclear systems, the possibility to settle in rubles
16 Ibid.

49
RUSSIA’S DEAL ON PROMOTING THE REGIONAL STATUS OF THE RUBLE
was received by international participants of the Russian securities market.
According to the surveys held every six months by London Foreign Exchange Joint Standing Committee, the volume of transactions with the Russian ruble in the UK demonstrated a constant increase. For 6 years (from April 2008 to April 2013) it has grown from 10.1 billion US dollars to 34.4 billion US dollars, or in 2.4 times. Th e ruble’s share in the total volume of FX transactions in the London market increased from 0.6% to 1.4%17. Transactions with the ruble are also fi xed by the Bank of Japan, which includes them in its semi-annual surveys of the FX market. Th e volume of transactions with the ruble in Tokyo is signifi cantly lower than in London, but even here, it also showed rapid growth reaching a peak in April 2013 (890 million US dollars in comparison with 10–20 million US dollars in 2009–10). However, the reduction followed next (Table 1).
Th is dynamic is mainly due to the impact of external factors on the market (internal factors play a secondary role). Leading factor among them is the world fi nancial cycle and a closely related cycle of the United States Monetary Policy. Th us, in the period 2008–13 there was a progressive easing the US Federal
17 Th e London Foreign Exchange Joint Standing Committee turnover surveys // Bank of England. URL: http://www.bankofen-gland.co.uk/ markets/Pages/forex/FXjsc/default.aspx
Reserve’s MP known as Quantitative Easing, which contributed to the fl ow of capital from USD instruments to EMDE instruments including those denominated in rubles. During the same period, the real exchange rate of the Russian currency was strengthened due to high oil prices, which together resulted in an increase in the ruble’s turnover in external markets, particularly in the UK.
However, in 2013, aft er the an-nouncement of the beginning of the tightening the United States MP, there was a massive outfl ow of capital from EMDEs and depreciation of many currencies (this process is well-known as taper tantrum). As a result, there was a decrease in the volume of FX trades, as it is calculated in US dollars. Th is trend was further intensifi ed in the following year. Th e outlined strengthening of the US dollar led to a decline in prices for commodities denominated in this currency (oil, gas, gold, metals etc.) that form the basis of exports of many developing countries. As a result, their currencies continued to decline. Th e collapse in oil prices at the end of 2014 led to a depreciation of the ruble by more than 40%.
An additional negative factor for the ruble was the introduction of economic and fi nancial sanctions against Russia by the United States and its Western allies. Fearing the huge penalties easily enforced by the US authorities not only in respect of their own, but also foreign
Table 1Average daily volume of trade in the ruble abroad, USD million
2013 2014 2015 2016April October April October April October April October
United Kingdom 34,400 23,200 28,700 27,500 18,900 13,400 17,700 20,100
United States n/a n/a n/a n/a n/a n/a 3,756 4,227
Japan 890 380 220 70 80 130 160 230
Source: Monetary committees of London, Tokyo and New YorkNote: Regarding the United Kingdom and the United States — the volume of trade in the RUB/USD pair; regarding Japan — against all currencies

50
USE OF NATIONAL CURRENCIES IN INTERNATIONAL SETTLEMENTS. EXPERIENCE OF THE BRICS COUNTRIES
companies for their possible violation of the sanctions, many foreign banks and fi nancial institutions have decided to minimize transactions with the ruble.
According to Russian experts, the share of the off shore transactions with the ruble fell in April 2015 to 9% of the total volume of the ruble market compared to 20% in October 2014 (Mishina, 2016). However, in 2016, there was an interest in the Russian ruble again. It is noteworthy that since April 2016 the Monetary Committee of New York began to publish data on transactions with the ruble, which was not previously allocated to a separate column in the committee surveys18.
Th e beginning of the restoration of interest in the Russian currency on global markets is also refl ected in the recovery of growth in the volume of trade in instruments denominated in the ruble. In October 2016, the volume increased by 13.6% in London and by 12.5% in New York compared with April 201619. Th e largest increase in average daily volumes of ruble trade was demonstrated by the Tokyo FX market, where it accounted for 43.8%20.
Th us, the total volume of average daily turnover in the ruble market reached 62.6 billion US dollars in October 201621. More than 60% of this sum fall on the internal Russian market (Figure 12). About a third of transactions with instruments denominated in the ruble, are made in
18 See FX Volume Survey // Federal Reserve Bank of New York: the Foreign Exchange Committee. URL: http://www. newyork-fed.org/fxc/volumesurvey/data.html
19 See Th e London Foreign Exchange Joint Standing Committee turnover surveys // Bank of England. URL: http://www.bankofengland.co.uk/ markets/Pages/forex/FXjsc/default.aspx; FX Vo-lume Survey // Federal Reserve Bank of New York: the Foreign Exchange Committee. URL: http://www. newyorkfed.org/fxc/volumesurvey/data.html
20 See Tokyo Foreign Exchange Market Committee. URL: http://www.fxcomtky.com/index_e.html
21 Includes a certain dual account for transactions between residents and non-residents.
London. Th e role of the US market, not to mention the Asian market, is not yet great, which can hamper the progress of the ruble in foreign trade with APAC countries.
Attention is also drawn to the relatively low share of the ruble in the total volume of FX transactions in external markets (0.4% in the US, 1% in the UK). Another constraining factor for the use of the ruble in international settlements is the absence of direct quotations for most currencies.
Th us, the markets of the EAEU countries usually use the US dollar or euro as an intermediary when performing conversion operations with the ruble, which signifi cantly increases the cost of transactions. Only in Belarus, trades in the BYN/RUB pair have a relatively high level of liquidity, and its volume has stabilized at 15% of the total turnover of foreign currency in the Republic.
A similar situation takes place in the BRICS countries. Direct quotes for the ruble are applied only to the Chinese renminbi. Trade in this pair on the interbank market of China began in November 2010, but its turnover still does not correspond to the scale of mutual trade between the countries. According the offi cial representative of the State Administration of Foreign Exchange, Wang Chunying, the volume of trading of the RMB to the RUB amounted to 1.8 billion US dollars in 2016 or less than 3% of the total turnover between Russia and China (TASS, 2017). On average, the daily volume of ruble trade in the Chinese trading system slightly exceeded 7 milli-on US dollars.
Development of the financial market
Wide use of the ruble in international settlements is impossible without a de-veloped market of fi nancial instruments

51
RUSSIA’S DEAL ON PROMOTING THE REGIONAL STATUS OF THE RUBLE
Figure 12. Structure of global market of transactions made in the ruble, % Source: Bank of Russia; Monetary Committees of London, New York and Tokyo
Moscow Exchange
OTC market in Russia
OTC market in London
OTC market in New York
OTC market in Tokyo
26
3532
Less than 1
7
denominated in rubles and open access to the market by foreign investors.
Back in 1996–98, foreign investors were granted limited access to transactions with Russian government securities. Aft er the fi nal stage of liberalization of foreign exchange regulation in 2007, non-residents were able to purchase state and corporate securities freely on the internal market. However, their activity in the public debt market was relatively small. As of January 1, 2012 non-residents’ investments in the Federal Bonds amounted to only 107 billion rubles (less than 4% of their total volume)22.
In an eff ort to further attract investors, the Bank of Russia decided to remove infrastructure barriers and allowed to make OTC transactions with the Federal Bonds through Euroclear and Clear-stream from the beginning of 2012. However, it did not cause much enthusiasm among foreign investors. Growth of non-residents’ investments in the Federal Bonds started only in Summer 2012, when it was decided that these
22 See Non-residents’ holdings of Russian internal government debt (OFZ) and non-residents’ market share // Bank of Russia. URL: http://www.cbr.ru/ analytics/print.aspx?fi le=fi n_stab/table_ofz.htm
institutions may open custodian accounts at the National Depository Center.
In fact, the opening of a Euroclear custodian account with the NDC took place only on December 27, 2012 and Clearstream’s account was opened in February 2013. However, this delay did not aff ect the growing infl ow of investments, due to which the share of non-residents in the Federal Bonds market reached its maximum of 28.1% of the nominal value of outstanding bonds in May 2013 (Figure 13). Further, the share of non-residents declined slightly and stabilized at approximately 24%.
Foreign holders of Russian govern-ment bonds reacted on the Ukrainian crisis with a small sale resulted in the share of non-residents in the Federal Bonds market dropped to 22.2% in March 2014. Nevertheless, it regained the former level again.
Th e introduction of economic san-ctions against Russia led to new sales on the Federal Bonds market in July 2014. Restraining measures regarding the access for Russian companies and banks to foreign fi nancial markets caused foreign investors to fear that Russia will not be able to maintain loans received given the upcoming repayments to them
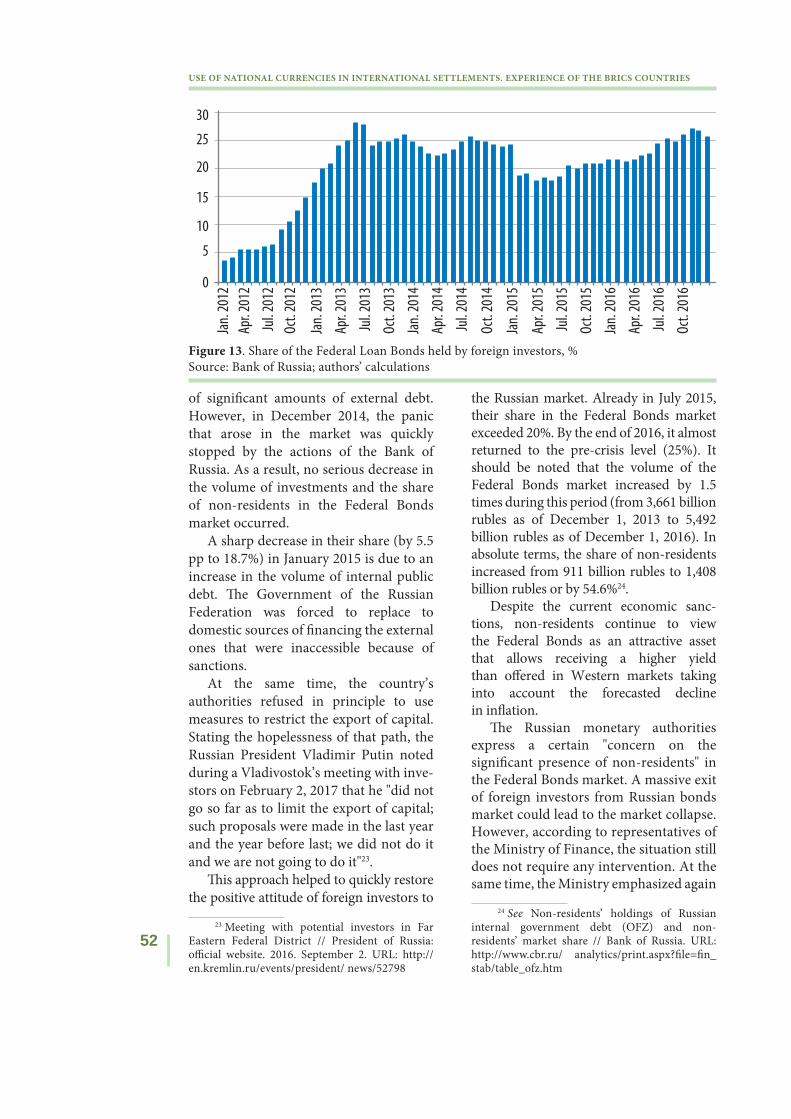
52
USE OF NATIONAL CURRENCIES IN INTERNATIONAL SETTLEMENTS. EXPERIENCE OF THE BRICS COUNTRIES
of signifi cant amounts of external debt. However, in December 2014, the panic that arose in the market was quickly stopped by the actions of the Bank of Russia. As a result, no serious decrease in the volume of investments and the share of non-residents in the Federal Bonds market occurred.
A sharp decrease in their share (by 5.5 pp to 18.7%) in January 2015 is due to an increase in the volume of internal public debt. Th e Government of the Russian Federation was forced to replace to domestic sources of fi nancing the external ones that were inaccessible because of sanctions.
At the same time, the country’s authorities refused in principle to use measures to restrict the export of capital. Stating the hopelessness of that path, the Russian President Vladimir Putin noted during a Vladivostok’s meeting with inve-stors on February 2, 2017 that he "did not go so far as to limit the export of capital; such proposals were made in the last year and the year before last; we did not do it and we are not going to do it"23.
Th is approach helped to quickly restore the positive attitude of foreign investors to
23 Meeting with potential investors in Far Eastern Federal District // President of Russia: offi cial website. 2016. September 2. URL: http://en.kremlin.ru/events/president/ news/52798
the Russian market. Already in July 2015, their share in the Federal Bonds market exceeded 20%. By the end of 2016, it almost returned to the pre-crisis level (25%). It should be noted that the volume of the Federal Bonds market increased by 1.5 times during this period (from 3,661 billion rubles as of December 1, 2013 to 5,492 billion rubles as of December 1, 2016). In absolute terms, the share of non-residents increased from 911 billion rubles to 1,408 billion rubles or by 54.6%24.
Despite the current economic sanc-tions, non-residents continue to view the Federal Bonds as an attractive asset that allows receiving a higher yield than off ered in Western markets taking into account the forecasted decline in infl ation.
Th e Russian monetary authorities express a certain "concern on the signifi cant presence of non-residents" in the Federal Bonds market. A massive exit of foreign investors from Russian bonds market could lead to the market collapse. However, according to representatives of the Ministry of Finance, the situation still does not require any intervention. At the same time, the Ministry emphasized again
24 See Non-residents’ holdings of Russian internal government debt (OFZ) and non-residents’ market share // Bank of Russia. URL: http://www.cbr.ru/ analytics/print.aspx?fi le=fi n_stab/table_ofz.htm
Jan.
201
2
Apr.
2012
Jul.
2012
Oct
. 201
2
Jan.
201
3
Apr.
2013
Jul.
2013
Oct
. 201
3
Jan.
201
4
Apr.
2014
Jul.
2014
Oct
. 201
4
Jan.
201
5
Apr.
2015
Jul.
2015
Oct
. 201
5
Jan.
201
6
Apr.
2016
Jul.
2016
Oct
. 201
60
30
25
15
5
20
10
Figure 13. Share of the Federal Loan Bonds held by foreign investors, %Source: Bank of Russia; authors’ calculations

53
RUSSIA’S DEAL ON PROMOTING THE REGIONAL STATUS OF THE RUBLE
"there is no question of any measures of prohibition or restrictions" (Vestifi nance, 2017).
Ruble-denominated bonds of Russian companies cause less interest for foreign investors. Despite of the fact that starting from January 30, 2014 Euroclear and Clearstream started providing services to non-residents on settlements in the internal market of corporate bonds, their share in the turnover on the secondary market of Moscow Exchange remained at the level of 19%, as in 2013. In absolute terms, it even decreased due to a decline in trading volume from 6.7 trillion rubles in 2013 to 4.7 trillion rubles in 201425. Such low activity of non-residents in the corporate debt market denominated in rubles is mainly due to the low number of instruments qualifi ed for investment purposes, which is generally a typical situation for most developing countries.
Th e participation of non-residents in the Russian stock market has always been relatively signifi cant. In 2012, their share in the total trading volume on Moscow Exchange was 37%. Nevertheless, the management of the exchange continued to pursue a policy of removing infrastructure restrictions on foreign investors’ access.
In 2013, Moscow Exchange intro-duced a more usual trading mode for non-residents with settlements for the second day, which did not imply the need to pre-reserve funds for 100%. In addition, foreign banks registered on the exchange were entitled to open direct access to trading for their clients. Most of them used this opportunity (Mishina, 2016). As a result, in 2013, the volume of trading of foreign investors in Moscow Exchange
25 See Annual reports and reports on related-party transactions // Moscow Exchange. URL: http:// moex.com/s1346
increased by 39%, and their share in the total trading volume increased to 40%26.
Since July 1, 2014, Euroclear and Clearstream were authorized to settle transactions with equities of Russian companies, which contributed to the further expansion of non-residents’ access to this market. To a certain extent, this decision neutralized the negative consequences for foreign investors from the imposition of economic sanctions against Russia. In 2014, the volume of net sales amounted to only 17.4 billion US dollars, and their share in the total turnover of Moscow Exchange’s stock market even increased to 46% (Mesropyan, 2017).
In 2015, the share of non-residents in turnover in the secondary market of equities decreased to 44%. Th is does not mean that they began to sell Russian assets. According to Moscow Exchange’s experts, in 2015, non-residents increased their positions in Russian securities. Th eir net purchases amounted to 51.9 billion rubles.
However, facilitating the access of foreign investors to the Russian stock market did not lead to an increase in the volume of trade on Moscow Exchange. In 2013, the turnover in secondary trading fell by 25.8% compared to 2012, and reached 8.6 trillion rubles. In 2015, the decline in activity on the stock market resumed. Aft er an increase of 18.6% in 2014, the volume of secondary trades decreased by 8.8% to 9.4 trillion rubles in 2015, and remained approximately at the same level in 201627.Th e low liquidity level of the Russian securities market is closely related to a small number of instruments that are traded on the internal stock market (Mishina, 2011). In January 2016, only 252 companies
26 See 2013 annual report // Moscow Exchange. URL: http://www.moex.com/ru/Report/2013/
27 See Moscow Exchange Group Markets Statistics: Monthly trading volumes // Moscow Exchange. URL: http://moex.com/s867

54
USE OF NATIONAL CURRENCIES IN INTERNATIONAL SETTLEMENTS. EXPERIENCE OF THE BRICS COUNTRIES
were listed in Moscow Exchange. Th eir number dropped to 245 by January 2017, which was 10 companies more than in January 2009.
Moreover, Russian companies have low free fl oat. It can be confi rmed indirectly by the relatively low listing requirements on Moscow Exchange. It has to be a free fl oat of only 10% in order to be included in the quotation list of the fi rst (higher) level. Where it falls below 4%, the equity is transferred to the second-level list. In fact, the median value of the free fl oat for the equities of 96 companies traded on Moscow Exchange is 21% (authors’ calculations)28. For comparison, London Stock Exchange has raised the requirements for a free fl oat from 15% to 25% since January 1, 2012.
Th e level of internationalization achieved by the Russian currency by the mid-2000s led to the appearance of internationally traded debt obligations denominated in rubles. Th e fi rst was the Russian Bank of Development (currently, SME Bank) issued ruble-denominated credit linked notes for 2.5 billion rubles in March 2005. In 2006, such debt instruments were issued by eight Russian banks and companies for 45.4 billion rubles (Gubeidullina, 2007).
By the end of 2011, 84 issues of ruble-denominated Eurobonds and credit linked notes were registered for a total of 350 billion rubles. However, more than 80% of this market is accounted for by the securities issued by Russian companies and banks (Kondratov, 2012).
International and national deve-lopment institutions (World Bank, EBRD, European Investment Bank, Nordic Investment Bank, KfW) were the most active in the issue of ruble-denominated Eurobonds among non-residents. Th ese institutions used them both to fund their operations in Russia and to develop a new segment of the market. By 2011, they
28 See Data for free-fl oat index // Moscow Exchange. URL: http://moex.com/ru/listing/free-fl oat.aspx
organized about 30 issues of Eurobonds amounted to 50 billion rubles.
Another group comprised interna-tional (JP Morgan Chase Bank) and major regional banks (ABN Amro, Rabobank, Danske Bank) that issued such Eurobonds primarily for their clients interested in placing their accumulated rubles.
A defi nite milestone in the deve-lopment of the off shore market of ruble-denominated bonds was the access to it by the Russian Government that attracted two tranches of 90 billion rubles for a period of 7 years at an average rate of 7.5% in 2011. Th e current yield was even slightly lower than in the internal market. However, despite the promise of Finance Minister A.V. Kudrin, there was no further issues, apparently, in order not to create competition with the Federal Bond market.
Th e crisis in relations with the Western countries led to a sharp increase in the risks associated with investing in ruble-denominated assets, which was refl ected in high interest rates for the Russian currency. FX risk also showed a signifi cant increase. It took time for market participants to adapt to the new policy of the Bank of Russia announced in November 2014 that it waived targeting the exchange rate of the ruble and switched targeting the infl ation instead. As a result, the issue of off shore ruble-denomina-ted bonds almost ceased.
Strengthening the ruble by the end of 2016 by almost 17% on the background of a relative recovery in oil prices contributed to a revival of interest both to the Russian currency and to the ruble-denominated bonds.
Th e volume of primary placements in the internal debt market exceeded 5 trillion rubles in 2016 (Finam, 2017). At the same time, the issue volume of corporate bonds almost doubled and amounted to 3.9 trillion rubles. Th e off shore market also revived. In September 2016, Russian Railways placed ruble-denominated Eurobonds amounted to 15 billion rubles

55
RUSSIA’S DEAL ON PROMOTING THE REGIONAL STATUS OF THE RUBLE
for a period of 7 years with coupon payment of 9.2%. Th e company informed its readiness to continue borrowing in rubles on the international market in 2017 (Rusbonds, 2017). A number of other Russian companies and banks announced similar plans. At the same time, the diff erence in interest rates may become a certain deterrent to the revival of the off shore market of ruble-denominated bonds.
Summary
We may summarize that the Rus-sian ruble has a quite high scale of internationalization. A share of the ruble in the total volume of payments on national foreign trade in goods and services with other countries is comparable to the level of Chinese renminbi: it amounted to 23% for Q3 2016, while the share of the RMB dropped to 22% aft er the achieved maximum (26%).
Th e ruble is also used in mutual settlements of Belarus, Kazakhstan, Kyrgyzstan and Tajikistan. At least 10% of that trade is currently carried out in the Russian currency. Moreover, the Russian ruble is a part of the Belorussian National Bank’s international reserves.
To a certain extent, the Russian ruble is already acting as an international currency in Eurasian region. And there is a potential for its further internationalization.
1. Russian economy has adapted to low energy prices and demonstrates sustainable recovery. Th e Bank of Russia showed an effi cient policy when waived targeting the exchange rate of the ruble and switched targeting the infl ation instead.
2. Th ere are no restrictions on transactions with the Russian currency (opening of accounts, cross-border transfers, trade in securities etc.)
3. Expansion of settlements in rubles is facilitated by the increase of
non-resource products’ share in Russian exports29.
4. Russia has a suffi ciently large and liquid FX market (both the internal and external one) with a well-formed institutional structure and modern trade technologies. Foreign companies are allowed to invest their rubles’ liquidity in a large number of fi nancial instruments.
References
1. Fox M. CME set to replace Ruble reference rate to Moscow Exchange // LeapRate. 2016. July 6. URL: http://www.leaprate.com/news/cme-set-to-replace-ruble-reference-rate-to-moscow-exchange/
2. Gosupravlenie KNR: situaciya na mirovom rynke ne otrazitsya na valyutnom sotrudnichestve s RF // TASS news agency. 2017. January 30. URL: http://tass.ru/ mezhdunarodnaya-panorama/3981175
3. Gubeidullina G. Modnie rubli // Ve-domosti. 2007. May 23. URL: http://w w w . v e d o m o s t i . r u / l i b r a r y / articles/2007/05/23/modnye-rubli
4. Kondratov D. Stanovlenie rossijskogo rublya kak mazhdunarodnoj valyuti // Ekonomicheskij zhurnal VSHE. 2012. No. 3. P. 367–403. URL: http://ej.hse.ru/data/2013/02/28/1307112581/16_03_05.pdf
5. Mesropyan M. Dolya inostrannih investorov na rossijskom fi nansovom rynke ne sokraschaetsya // Vedomosti. 2016. March 22. URL: http://www.vedomosti.ru/fi nance/ articles/2016/03/22/634550-inostrannihinvestorov
6. Minfi n nashel riski v vysokoj dole inostrancev // Vesti Ekonomika. 2017.
29 According to Russian Export Center, non-resource products’ share has increased in the total exports amount by more than 11 per cent over the past year (34.3% in 2015; and 38.2% in 2016, respectively).

56
USE OF NATIONAL CURRENCIES IN INTERNATIONAL SETTLEMENTS. EXPERIENCE OF THE BRICS COUNTRIES
February 22. URL: http://www.vestifi nance.ru/articles/81737
7. Mishina V. Rublevoe “importozame-schenie” vmesto “dollarizacii” // INP RAN. 2016. March 31. URL: http://ecfor.ru/wp-content/ uploads/2016/03/Rubl-i-EAES_statya_022616_Mishina.pdf
8. Mishina V. Stanet li ruble valiutoj mezhdunarodnikh raschetov? // Bankovskoe delo. 2011. No. 1. P. 76–81. URL: http://www.mbka.ru/price/bank.delo_012010.pdf
9. OFZ — bezuslovnij favorit goda, no porencial ne ischerpan // Finam. 2017. January 18. URL: http://bonds.finam.ru/comments/item/bk-region-ofz-bezuslovnyiy-favorit-goda-no-potencial-ne-ischerpan/
10. RZD interesni rublevie evrobondi, v 2017 g. мogut vipustit vechnie obligacii // RusBonds. 2017. January 18. URL: http://www.rusbonds.ru/nwsinf.asp?id=4452651

57
INTERNATIONALIZATION OF THE RUPEE
Th e GFG, for a variety of complex reasons, prompted emerging markets to reconsider the role of their currencies as global alternatives to the "big four" currencies (US dollar, euro, British pound and Japanese yen).
China’s policy pivot prompted policy makers in India to consider the possibility of internationalizing the Indian rupee. Th e Reserve Bank of India commissioned two studies in 2010 and 2011 (Ranjan and Prakash, 2010; Gopinath, 2011) to examine the issues surrounding the internationalization of the INR. Both studies recommended a cautious approach towards currency internationalization given the size of the Indian GDP, lower presence in global trade and partial capital account convertibility. Th ey also add that while the rupee is a natural contender for transitioning into a global currency, policymakers should start by increasing the role of the INR in its local region where the renminbi has taken a lead over the rupee. In spite of an early interest in pursuing a policy of currency internationalization, both the Indian government2 and the RBI3 do not consider it to be a priority in the short to medium term.
Rise of rupee trading
We shift gears and look at market outcomes to get a sense of what drives growth of currency markets and how internationalized is the rupee compared to the BRICS currencies. For purposes of cross-country comparison we use the BIS measure.
Th e triennial Central Bank Survey of Foreign Exchange and Derivatives Market Activity published by BIS is currently the most comprehensive source of information on trading in foreign exchange markets (BIS, 2010, 2013, 2016). Th e survey provides consistent comparison on the size and structure of FX and OTC derivatives markets, and has been conducted every 3 years since 1995. In the latest edition of the survey, data was collated for 53 currencies, encompassing instruments such as spot transactions, outright forwards, foreign exchange and currency swaps and options. Central banks collect data from various banks and other dealers within their jurisdictions, which is reported to BIS and used to calculate global aggregates. For the fi rst time since 2001, global FX trading declined between two consecutive surveys. Global FX turnover fell to USD 5.1 trillion per day in April 2016, from USD 5.4 trillion in April 2013. However, trading in EM currencies grew over this period with the renminbi gaining market share (Moore et al., 2016). Th e "big four" currencies maintained their market shares and remain the only currencies which account for more than 10% in market share of all trades4.
4 As of 2016; USD: 88%, EUR: 31%, JPY: 22%, GBP: 13% is on the other side of all the reported currency trades.
Chapter 4
Internationalization of the Indian Rupee1
1 Shekhar Hari Kumar, Ila Patnaik — National Institute of Public Finance and Policy.
2 See Internationalisation of Rupee // Business Standard. 2016. May 7. URL: http://www.business-standard.com/article/government-press-release/internationalisation-of-rupee-116050601065_1.html
3 See Raghuram Rajan says no "big bang jump" for Rupee onto world stage // Th e Economic Times. 2015. December 1. URL: http:// economictimes.indiatimes.com/markets/forex/ raghuram-rajan-says-no-big-bang-jump-for-rupee-onto-world-stage/articleshow/49998048.cms
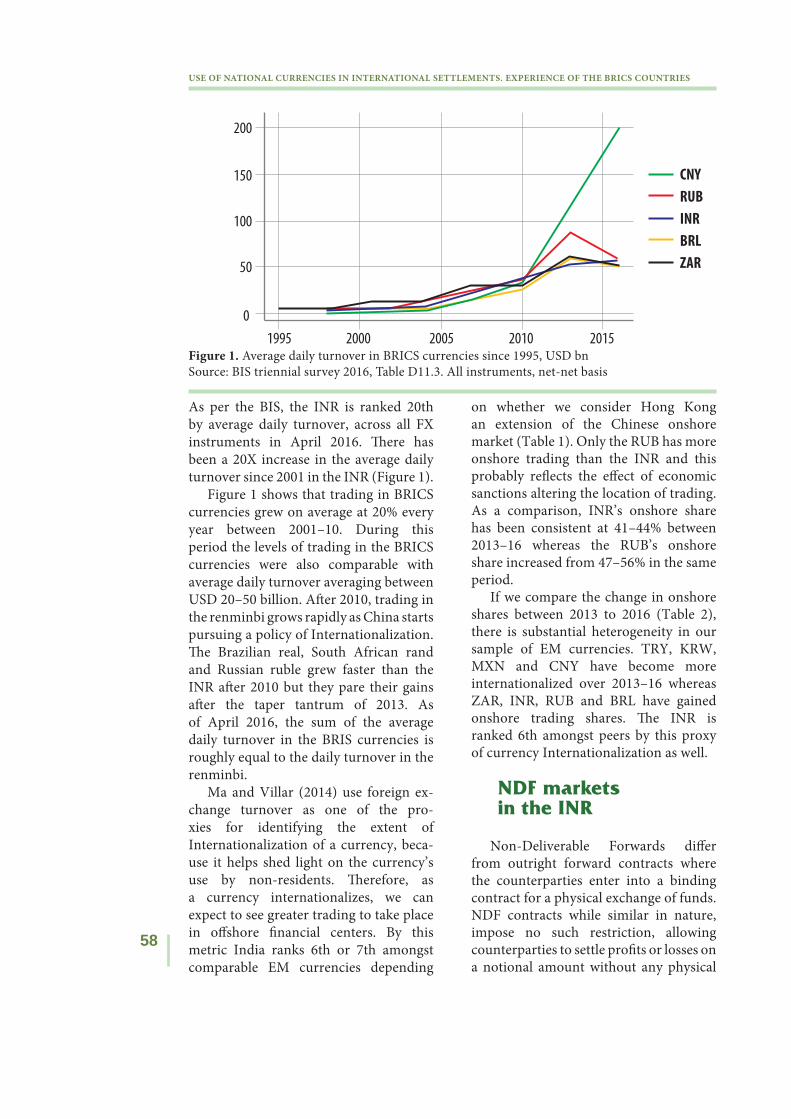
58
USE OF NATIONAL CURRENCIES IN INTERNATIONAL SETTLEMENTS. EXPERIENCE OF THE BRICS COUNTRIES
As per the BIS, the INR is ranked 20th by average daily turnover, across all FX instruments in April 2016. Th ere has been a 20X increase in the average daily turnover since 2001 in the INR (Figure 1).
Figure 1 shows that trading in BRICS currencies grew on average at 20% every year between 2001–10. During this period the levels of trading in the BRICS currencies were also comparable with average daily turnover averaging between USD 20–50 billion. Aft er 2010, trading in the renminbi grows rapidly as China starts pursuing a policy of Internationalization. Th e Brazilian real, South African rand and Russian ruble grew faster than the INR aft er 2010 but they pare their gains aft er the taper tantrum of 2013. As of April 2016, the sum of the average daily turnover in the BRIS currencies is roughly equal to the daily turnover in the renminbi.
Ma and Villar (2014) use foreign ex-change turnover as one of the pro-xies for identifying the extent of Internationalization of a currency, beca-use it helps shed light on the currency’s use by non-residents. Th erefore, as a currency internationalizes, we can expect to see greater trading to take place in off shore fi nancial centers. By this metric India ranks 6th or 7th amongst comparable EM currencies depending
on whether we consider Hong Kong an extension of the Chinese onshore market (Table 1). Only the RUB has more onshore trading than the INR and this probably refl ects the eff ect of economic sanctions altering the location of trading. As a comparison, INR’s onshore share has been consistent at 41–44% between 2013–16 whereas the RUB’s onshore share increased from 47–56% in the same period.
If we compare the change in onshore shares between 2013 to 2016 (Table 2), there is substantial heterogeneity in our sample of EM currencies. TRY, KRW, MXN and CNY have become more internationalized over 2013–16 whereas ZAR, INR, RUB and BRL have gained onshore trading shares. Th e INR is ranked 6th amongst peers by this proxy of currency Internationalization as well.
NDF markets in the INR
Non-Deliverable Forwards diff er from outright forward contracts where the counterparties enter into a binding contract for a physical exchange of funds. NDF contracts while similar in nature, impose no such restriction, allowing counterparties to settle profi ts or losses on a notional amount without any physical
Figure 1. Average daily turnover in BRICS currencies since 1995, USD bnSource: BIS triennial survey 2016, Table D11.3. All instruments, net-net basis
1995
0
50
100
150
200
2000 2005 2010 2015
CNY
INRBRLZAR
RUB

59
INTERNATIONALIZATION OF THE RUPEE
exchange of funds. Th ese contracts are usually cash settled, denominated in USD, and traded on currencies which are not readily available to trade globally. EM currencies, characterized by partial capital account convertibility, form a bulk of NDF markets mainly because participants engaged in trade and capital fl ows with these countries face barriers in access to domestic foreign exchange markets.
In 2013, the estimated average daily turnover of NDF markets was USD 127 billion, accounting for 19% of all outright forwards contracts traded globally (BIS,
2013). Th is fi gure has grown by 5.3% in dollar terms to 134 billion in 2016 (BIS, 2016). Four BRICS currencies (excluding South Africa) contributed 36% to this turnover in 2016, down from 42% in 2013. Th e decline has mainly been on account of China’s decreasing share (approximately 40% decline) of NDF markets, with their off shore NDF markets being replaced with off shore, deliverable forwards owing to renminbi’s internationalization in the recent years.
India’s turnover in the NDF market was reported to be at USD 16.5 billion in 2016, up 16.7% from 2013 in FX adjusted
Location INR TRY ZAR RUB MXN KRW BRL CNYBrazil 0 0 0 0 1 0 25 0China 0 0 0 0 0 0 0 22Hong Kong SAR 8 1 1 0 1 16 2 31India 44 0 0 0 0 0 0 0Korea 0 0 0 0 0 38 0 0Mexico 0 16 0 0 0Russia 0 0 56 0 0 0Singapore 24 2 2 0 1 21 0 17South Africa 0 0 24 0 0 0Turkey 0 13 0 0 0United Kingdom 13 61 44 29 29 13 21 16United States 8 15 19 8 43 9 45 9ROW 3 9 10 7 9 3 6 5Total 100 100 100 100 100 100 100 100
Table 1 Location of currency trading by EM currency, %
Table 2 Change in percentage of onshore trading since 2013, %
Currency 2013 2016 ChangeINR 41 44 7.32TRY 19 13 -31.58ZAR 23 24 4.35RUB 48 56 16.67MXN 20 16 -20.00KRW 53 38 -28.30BRL 20 25 25.00CNY (Including HK) 57 53 -7.02
Source: Authors’ calculations.
Source: BIS triennal survey, 2016.

60
USE OF NATIONAL CURRENCIES IN INTERNATIONAL SETTLEMENTS. EXPERIENCE OF THE BRICS COUNTRIES
Figure 3. Drivers of FX market turnover in EM currencies (USD bn): Openness Source: BIS triennial survey (2016); Fernandez et al. (2015)
1.00
0.50
0.20
0.10
0.05
5 10 20 50 100 200
Daily Turnover 2016
Ope
nnes
s PE
PH
TH
GL
MY
ZA
KR
BR
RU
TRMX
CN
IN
IDCO PL
CZ
HU
Figure 2. Drivers of FX market turnover in EM currencies (USD bn): GDP (USD bn) Source: BIS triennial survey (2016), Table D11.3; WDI
500
2, 000
10, 000
200
5 10 20 50 100 200
Daily Turnover 2016
GDP
2015
PEPH
THGL MY ZA
KR
BRRU
TRMX
CN
ID
COPL
CZHU
terms (BIS, 2016). Th e INR/USD NDF instrument trades exclusively in off shore markets, forming approximately 60% of all turnover in INR off shore markets. Comparison with the onshore currency derivatives market’s average daily tur-
nover of USD 17 billion underscores the growing demand for the rupee abroad. Th e highly liquid off shore NDF market is a symptom of growing international interest in a currency that is not fully convertible. Cut-off from access to the

61
INTERNATIONALIZATION OF THE RUPEE
domestic INR markets, participants compensate for their forex risk by trading heavily in the off shore NDF markets. Historical empirical evidence seems to suggest that the onshore-off shore forward premium gap for the INR was always lower than the RMB (Hutchison et al., 2012), suggesting greater fi nancial integration in INR markets as compared to the RMB (Ma and McCauley, 2013). Th is may be changing as China internationalists the RMB and allows for greater participation of non-residents in an off shore deliverable forward market (McCauley and Shu, 2016).
What determines forex market turnover?
Forex market turnover is a function of EM fundamentals like size of the economy, share in global trade, fi nancial depth and capital account openness (Eichengreen and Kawai, 2015). He and Yu (2016) fi nd that share of a country in world trade has a clear positive eff ect on the turnover of its currency in FX markets, but the eff ect of capital fl ows appears insignifi cant. Th ey also fi nd that share of currency trade is signifi cantly associated with the fi nancial depth measured by size of stock market size to GDP. He and Yu (2016) take the full sample of BIS reporting currencies while conducting their analysis. We restrict our sample to the 19 largest EMs5 in the BIS reporting group and look at correlations between forex market size and various fundamentals. Th is exercise pins down which fundamentals are important for growth in EM forex market turnover. Moreover, it helps us evaluate whether forex market turnover is higher or lower compared to the level predicted by the country fundamental.
Figure 2 shows the relationship between level of real GDP and forex market turnover. Th e correlation bet-
5 See Appendix for the list of countries.
ween these two variables is positive and signifi cant. By this metric, INR, BRL, RUB and RMB have smaller forex market turnover than predicted by their GDP level. We look at the relationship between level of capital account openness as proxied by the Fernandez et al. (2015) measure and forex market turnover in Figure 3. Th e Fernandez et al. (2015) measure is rescaled from 0 to 1 with zero meaning a completely closed capital account and one meaning a completely open capital account. Th e correlation between forex market turnover and capital account openness is negative and insignifi cant. Th is is primarily because INR and RMB are large EM currencies who are signifi cantly in spite of being fairly closed capital account economies. However, the negative and insignifi cant correlation is opposite to what is predicted by the literature.
Figure 4 evaluates the relationship between volume of trade proxied by the value of imports and exports from the WDI and forex market turnover. Th e relationship between these variables is positive and signifi cant. By this metric, the BRL and ZAR have larger forex market sizes as predicted by their volume of trade whereas the INR, RUB and RMB have smaller forex markets. We fi nally evaluate the relationship between fi nancial depth as proxied by market capitalization to GDP to forex market turnover in Figure 5. We fi nd a negative and insignifi cant correlation between these two variables, similar to capital account openness.
Th is parsimonious correlation exer-cise tells us that level of GDP and volume of trade are the most important fundamentals driving EM forex market turnover. Th is is a little diff erent to advanced countries where fi nancial depth and capital account openness are signifi cant factors determining forex market turnover. Th is is most likely due to the fact that a majority of EM currency demand comes through current account

62
USE OF NATIONAL CURRENCIES IN INTERNATIONAL SETTLEMENTS. EXPERIENCE OF THE BRICS COUNTRIES
Figure 5. Drivers of FX market turnover in EM currencies (USD bn): size of fi nancial market (MCAP to GDP, %) Source: BIS triennial survey (2016), Table D11.3; WDI
100
50
20
5 10 20 50 100 200
%
Daily Turnover 2016
PE
PH THGLMY ZA
KR
INBR
RUTR
MX CNID
CO
PL
CZ HU
Figure 4. Drivers of FX market turnover in EM currencies (USD bn): Trade turnover (USD bn) Source: BIS triennial survey (2016), Table D11.3; WDI
5, 000
2, 000
500
100
5 10 20 50 100 200
Daily Turnover 2016
Volu
me
of Tr
ade
2015
PE
PH
TH
GL
MY
ZA
KR
BR
RU
TR
MX
CN
ID
CO
PLCZ
HU
linkages rather than fi nancial account linkages given the presence of capital controls in large EMs. Th e presence of capital controls seems to dampen currency demand in the case of INR
and RMB, as forex market turnover is lower than what is predicted by level of GDP and volume of trade. Th is is also indication that these currencies have additional room to grow as international

63
INTERNATIONALIZATION OF THE RUPEE
currencies once there is grea-ter capital account liberalization (Ma and Villar, 2014).
Role of INR as international currency
A. Official sectorWe switch gears and evaluate the
internationalization of the rupee in terms of its roles as an international currency in the tradition of Chinn and Frankel (2008) and Ito (2016). We fi rst look at the role of the INR as an international currency in the offi cial sector. According to the IMF Currency Composition of Offi cial Foreign Exchange Reserves, as of Q2 2016, around 93% of all forex reserves are denominated in the "big-four" currencies. Th e BRICS currencies are part of claims in other currencies which at best amount to 3% of global reserve holding. As part of the inclusion of the RMB in the Standard Drawing Rights, COFER will report breakdown of RMB reserves from Ap-ril 20176.
To supplement the COFER, the IMF conducted an ad-hoc survey of 130 member countries on their holding of currencies in offi cial foreign currency assets (IMF, 2015). Th e country level information was classifi ed but the IMF released summary information regarding the global distribution of reserve assets along with their associated magnitudes. Table 3 shows that 6 countries claimed that they use INR in their offi cial sector assets as of 2014. Only the BRL has lower reserve asset penetration than the INR. Th ere is a clear diff erence between the RMB and the BRIS currencies. BRIS
6 See Chinese Renminbi to be Identifi ed in the IMF’s Currency Composition of Foreign Exchange Reserves // IMF. Press Release No. 16/90.2016. March 4. URL: http://www.imf.org/en/News/Articles/ 2015/09/14/01/49/pr1690 or Separate Identifi cation of the Chinese Renminbi in the COFER survey // IMF. Staff Report. 2016. March. URL: http://www.imf.org/ exter-nal/np/pp/eng/2016/021816.pdf
countries are used as reserve currencies in their economic area of infl uence whereas the RMB had much wider usage in reserve assets.
Table 4 shows the magnitude of re-serve assets holding in various currencies. By this metric the INR is ranked second last amongst all major currencies. Th e volume of INR held as reserve assets has increased from 2013 to 2014 to around a billion dollars. Th ere is some anecdotal evidence that Indian rupee is accepted in Singapore, Malaysia, Indonesia, Hong Kong, Sri Lanka and the UK. Th e Central Bank of Nepal, Nepal Rastra Bank, also holds Government of India Treasury Bills (Ranjan 2010). Th e INR is also a historical outlier, given the fact that INR was legal tender in Qatar, Bahrain, UAE, Kuwait, Oman and Malaysia till the mid 1960’s (Ranjan and Prakash, 2010).
Another mode of offi cial sector cur-rency internationalization goes through bilateral swap lines. Aft er the GFC, use of swap lines between central banks has become a popular mode for sharing dollar funding (liquidity) risk as well as currency internationalization. Th e RBI has utilized the swap line channel to mitigate dollar funding risks rather than build bilateral ties to internationalize the rupee. Table 5 shows bilateral swap arrangements entered into by the RBI. Th e RBI has four swap lines of note, out of which 3 are active. Th e swap line with the Bank of Japan is now inactive. Out of the 4 swap lines, the swap line with the Central bank of UAE is the only one denominated in local currency7. All the other swap lines have a dollar transaction leg.
7 See RBI and Central Bank of UAE sign MoU to consider Currency Swap Agreement // Reserve Bank of India. 2016. February 12. URL: http://www.rbi.org.in/Scripts/BS_ PressReleaseDisplay.aspx?prid=36229

64
USE OF NATIONAL CURRENCIES IN INTERNATIONAL SETTLEMENTS. EXPERIENCE OF THE BRICS COUNTRIES
B. Use of INR by private actorsCurrency substitution and investment
India has a liberalized framework for foreign portfolio investment since the notifi cation of the Foreign Institutional Investor framework8 in 1995. Th e Indian securities regulator, Securities and Exchange Board of India liberalized the foreign investment framework recently in July 20149. Over 1000 new foreign investors registered with SEBI during the period from June 2014 to August 2015, marking a 12% increase in the number of investors registered with SEBI. On average, 19–20% of Indian equities are held by foreign investors10. Foreign portfolio investment in debt is subject to limits. Th ere is total cap of USD 84 billion for FPI-debt with
8 See Foreign Institutional Investors Regulations // Securities and Exchange Board of India. 1995. URL: http://www.sebi.gov.in/acts/fi iregu2009.pdf
9 See Foreign Portfolio Investors Regulations // Securities and Exchange Board of India. 2014. URL: http://www.sebi.gov.in/cms/sebi_data/attach-docs/1389083605384.pdf
10 Market capitalization of Indian equities: USD 1.5 trillion, FPI-Equity: USD 300 billion.
2013 2014Total Currency Holdings 130 130US dollar 127 127Pound sterling 108 109Euro 109 108Japanese yen 87 88Canadian dollar 84 85Australian dollar 79 78Swiss franc 73 69Swedish krona 45 48Norwegian krone 45 40Chinese renminbi 27 38New Zealand dollar 27 29Singapore dollar 16 18South Africa rand 11 12Russian ruble 5 8Indian rupee 4 6Brazilian real 5 5Other currencies 81 80
Table 3 Role of INR in international reserves, distribution
Source: IMF Survey on the Holdings of Currencies in Offi cial Foreign Currency Assets, 2015
a sub limit of USD 33 billion for sovereign debt and USD 51 billion for corporate debt. Prior to 2016, most of the FPI-debt limit for sovereign debt was fully utilized with some room in the corporate bond segment. Given the changing stance of global monetary policy, there has been a sell-off in EM bonds and current utilization of the FPI-debt stands at 67% for both sovereign and corporate segment11. Th e INR is actively used for currency substitution and investment.
Rupee-denominated bonds
Liberalization of the external com-mercial borrowings framework in 201512 and 2016 allowed Indian corporates to issue INR-denominated bonds overseas.
11 See Debt Utilisation Status // National Securities Depository Ltd. URL: http://www.fpi.nsdl.co.in/Reports/Re-portDetail.aspx?RepID=1 (for the latest number)
12 See External Commercial Borrowings (ECB) Policy - Issuance of Rupee denominated bonds overseas // Reserve Bank of India. 2015. September 29. URL: http://www.rbi.org.in/Scripts/Notifi cationUser.aspx?Id=10049

65
INTERNATIONALIZATION OF THE RUPEE
a billion dollars each (LSE, 2016). Th e uptake of Masala bonds is also low as a percentage outstanding international debt securities issued by Indian national entities.
Invoicing and settlement of trade in INR
Currency invoicing in trade is an important fi rst step for any national currency to become an international currency. Local currency invoicing of trade in the rupee is less than 2.5% of total trade as of the last release of currency invoicing data by the RBI13 in 2014.
13 See Foreign Trade Statistics // Reserve Bank of India. 2014. August 06. URL: http://rbi.org.in/Scripts/BS_PressRele-aseDisplay.aspx?prid=31788
2013 2014Amount,
USD millionPer cent of total
Amount,USD million
Per cent of total
Total Holdings in Currencies 6,779,830.42 100.00 6,738,534.06 100.00SDR Basket Currencies 6,276,718.91 92.58 6,214,838.24 92.23US dollar 4,158,921.34 61.34 4,290,575.54 63.67Euro 1,603,466.98 23.65 1,417,328.09 4.03Pound sterling 287,966.45 4.25 274,564.80 4.07Japanese yen 226,364.14 3.34 232,369.81 3.45Non-SDR Basket Currencies 503,111.51 7.42 523,695.81 7.77Australian dollar 151,026.62 2.23 142,451.37 2.11Canadian dollar 133,863.09 1.97 133,869.60 1.99Chinese renminbi 45,358.87 0.67 74,611.87 1.11Swiss franc 16,077.82 0.24 15,365.62 0.23New Zealand dollar 16,805.46 0.25 15,213.97 0.23Swedish krona 13,819.59 0.20 13,224.57 0.20Norwegian krone 13,956.93 0.21 12,050.16 0.18Singapore dollar 4,388.19 0.06 3,912.38 0.06Brazillian real 3,416.08 0.05 3,335.65 0.05South Africa rand 2,687.69 0.04 3,140.54 0.05Indian rupee 495.23 0.01 1,000.11 0.01Russian ruble 360.81 0.01 355.97 0.01Other currencies 100,891.13 1.49 105,164.00 1.56
Table 4 Role of INR in international reserves, magnitude
Source: IMF Survey on the Holdings of Currencies in Offi cial Foreign Currency Assets, 2015
Th ese bonds are commonly referred to as "Masala bonds". Th e rupee-denominated bond is an attempt to shield issuers from currency risk and instead transfer the risk to investors buying these bonds. Th e currency risk is borne by the investor and hence, during repayment of bond coupon and maturity amount, if rupee depreciates, RBI will realize a marginal saving. Many commentators have pointed out the issuance of rupee- denominated bonds overseas is a major step in internationalizing the INR. As of November 2016, there are 13 active Masala bonds listed in LSE, raising USD 2 billion. Out of these 13 bonds, 10 Masala bonds have been raised by multilateral organizations and remaining 3 by Indian corporates. Both multilateral organizations and corporates have raised

66
USE OF NATIONAL CURRENCIES IN INTERNATIONAL SETTLEMENTS. EXPERIENCE OF THE BRICS COUNTRIES
Table 5 RBI swap linesCounterparty Last renewal Size, USD bn Objective
Bank of Japan 2014-01-01 50 Mitigation of US dollar funding risk
SAARC countries 2016-02-01 2 Mitigation of US dollar funding risk
Central Bank of UAE 2016-02-01 - Bilateral swap line, management of INR/AED mismatch
BRICS (Contingent Reserve Arrangement) 2015-07-01 18 Mitigation of US dollar
funding risk
Table 6 Invoicing of exports, %
Currency 2008–09 2009–10 2010–11 2011–12 2012–13Pounds sterling 2.77 2.81 2.47 2.31 2.31US dollar 84.06 84.75 86.41 87.01 88.41Japanese yen 0.48 0.35 0.22 0.26 0.15Euro 10.85 10.13 8.88 8.14 6.97All other Currencies 1.84 1.96 2.02 2.28 2.16
Table 7 Invoicing of imports,%
Currency 2008–09 2009–10 2010–11 2011–12 2012–13Pounds sterling 0.89 0.66 0.71 0.5 0.42US dollar 86.06 83.91 85.38 88.67 86.06Japanese yen 2.3 1.98 1.73 1.41 1.47Euro 9.82 12.61 11.13 8.29 9.44All other Currencies 0.93 0.84 1.05 1.13 2.61
50
60
70
80
90
40
30 20
10 0
DK/NAOtherTurkishlira
Japa-neseyen
Indianrupee
Cana-dian
dollar
USdollar
Swissfrank
Britishpound
Rus-sian
ruble
Chineserenminbi
Figure 6. Indirect evidence of rupee invoicing, %Source: Langedijk S., et al. (2016) Note: DK/NA denotes "Dont'know/No answer"
Source: RBI (2014)
Source: RBI (2014)
Source: RBI (2014)

67
INTERNATIONALIZATION OF THE RUPEE
Most of the trade invoicing in India goes through USD and EUR (Table 6).
Th is structure of invoicing is a refl ection of the transaction costs faced by external trade partners and local traders in invoicing trade in local currency. Around 22% of all Chinese trade is now settled using the RMB14, which is down from a high of 26% prior to the RMB’s devaluation.
Goldberg and Tille (2008) and Ito and Chinn (2014) argue that hedging costs are a primary driver aft er "size" of a country in explaining local currency use in invoicing. Th is assertion is backed by recent survey evidence from European traders (Langedijk et al., 2016). Th e survey fi nds that only a small number of fi rms invoice in currencies (Figure 6) outside the "big four" and the levels of local currency invoicing of trade in RMB and INR are similar for European fi rms. Moreover, hedging costs are the primary determinants of local currency use aft er size of recipient country (Figure 7).
In spite of this facility being proposed in 2012, it has not been notifi ed by the
14 China: Renminbi stalls on road to being a global currency // Financial Times. 2016. Decem-ber 11. URL: http://www.ft .com/content/e480f d92-bc6a-11e6-8b45-b8b81dd5d080
RBI. As of the writing of this paper, only Bhutan and Nepal have access to direct invoicing and settlement of their trade in rupees. For all other countries, as per the last notifi cation issued by the RBI15, trade from and to India may be invoiced in "freely convertible currencies" or rupees. Amongst the BRICS currencies, only the South African rand is considered a freely convertible currency by the RBI. Th is limits the invoicing and settlement possibilities of trade partners who do not have freely convertible currencies. Bilateral trade deals provide a work-around and allow for limited local currency settlement. President Putin and Prime Minister Modi announced a push towards bilateral settlements in the ruble and rupee during President Putin’s visit in December 2014. Aft er initial excitement surrounding this arrangement limited bilateral banking presence, small volume of trade between both countries, limitations in availability of hedging instruments and continued depreciation of the INR/RUB currency
15 See Notifi cation FEMA 14(R)/2016-RB // Reserve Bank of India. 2016. May 02. URL: http://rbidocs.rbi.org.in/rdocs/notifi cation/ PDFs/FNT14RBBC96EA1D8574325AF4314261D E5133A.PDF
60
%
50
40
30
20
10
0Competitors
use othercurrencies
Sectorcharacteristics
Exchange riskmanagement
DK/NAOtherLargerecipientcountry
Figure 7. Factors driving utilisation of LCY in invoicing, %Source: Langedijk S. et al. (2016)Note: DK/NA denotes "Dont' know/No answer"

68
USE OF NATIONAL CURRENCIES IN INTERNATIONAL SETTLEMENTS. EXPERIENCE OF THE BRICS COUNTRIES
pair against the dollar16 have eff ectively put a stop to bilateral settlement17.
According to (non-publicly available data) SWIFT18, in April 2016 80% of trade to India was settled in USD. Th is followed by 7.2% in INR, 6.3% in EUR with the remaining 6.5% split over all other currencies. Th is percentage share indicates approximately USD 50–70 billion of trade settled in rupees. However, the INR does not make the top 20 international settlement currency list (according to SWIFT) indicating that there is a great potential in improving settlement of trade using the INR.
Th e INR is more actively used by private actors than the offi cial sector. Th e bulk of INR’s international utilization comes from the usage of INR in currency substitution and investment activity by private actors. Table 8 summarizes INR’s role as international currency across both offi cial and private sectors and we can see that it has a negligible role as an international currency.
Looking ahead
Internationalization of rupee will facilitate greater degree of integration of Indian economy with rest of the
16 See Russia and India move to settle in own currencies // Russia Beyond. 2015. November 19. URL: http://www.rbth.com/economics/ fi -nance/2015/11/18/rusia-and-india-move-to-settle-in-own-currencies_541991
17 Given evolving global macroeconomic conditions and expectations of US dollar appreciation, India’s foreign trade policy for 2015–20 does not mention any explicit incentive for LCY invoicing and settlement. MoF note F.No.20/15/2012 — BO.II was proposed at a time when the rupee was relatively stronger compared to the current macroeconomic situation. See Foreign Trade Policy [1st April, 2015 – 31st March, 2020] // Government of India. URL: http://dgft .gov.in/ exim/2000/ft p2015-20E.pdf
18 See Rapoza K. Sorry British Pound, India Prefers Chinese Yuan In Trade Deals // Forbes. 2016. May 27. URL: http://www.forbes.com/sites/kenrapoza/ 2016/05/27/india-increasingly-using-chinese-yuan-in-trade-deals/
world in terms of foreign trade and international capital fl ows. Key benefi ts of internationalization of rupee include savings on foreign exchange transactions for Indian residents, reduced foreign exchange exposure for Indian corporate, reduction in dependence on foreign exchange reserves for balance of payment stability etc. One of the important drivers for internationalization of a currency is the countries share in global merchandise and commercial services trade. India’s percentage share in the global trade is still on the lower side and it limits the pricing ability of domestic businesses in Indian rupee. Moreover, the share of Indian rupee in the global foreign exchange market turnover at present is also very low. Internationalization of Indian currency would also require full capital account convertibility. As a policy, we have followed a gradual and cautious approach in opening up the capital account. Th e capital account is being progressively liberalized in accordance with the evolving macro-economic conditions and requirements of the Indian industries, individuals and fi nancial sectors19.
It is more likely that Indian poli-cymakers will choose a gradual move towards internationalization in the medium term. As of writing this paper India only satisfi es the size of GDP and political stability pre-conditions for currency internationalization.
Restrictions on currency conver-tibility, both on the current and capital account hamper growth of INR as a global currency. Th e framework for exchange controls in India comes from the Foreign Exchange Management Act, which was passed in December 1999 and enacted in 2000. FEMA categorizes transactions into current account and
19 See Internationalisation of Rupee // Busi-ness Standard. 2016. May 7. URL: http://www.business-standard.com/article/government-press-release/internationalisation-of-rupee-116050601065_1.html

69
INTERNATIONALIZATION OF THE RUPEE
Table 8Roles of INR as an international currency
Function of money Governments Private actors
Store of valueInternational Reserves Currency substitution and
investmentNegligible FPI framework
Medium of exchange
Vehicle currency for FX intervention
Invoicing trade and fi nancial transactions
None Negligible
Unit of accountAnchor for local currency pegging Denominating trade and
fi nancial transactionsNone Negligible
capital account transactions and has specifi c rules and restrictions for across classes of individuals and investors; based on residence, size of transaction, instruments used, tenor of instrument and vehicle currency. For the purposes of India’s ascension to the WTO, the rupee is a fully convertible currency on the current account. However, as we described in the previous section, simple transactions like realization of payments for exports and imports cannot be in rupees unless its specifi cally approved. Current account transactions exceeding USD 250,000 for individuals20 require RBI approval. Rupee accounts cannot be held abroad21 and therefore overseas cash settlement in rupee is not currently possible. Th e documentary requirements along with delays in approvals dis-incentivize
20 See Master Direction - Liberalised Remittance Scheme (LRS) // Reserve Bank of India. 2016. January 1. URL: http://rbi.org.in/Scripts/Notifi cation User.aspx?Id=10192
21 Rupee Drawing arrangements exist with Gulf countries, Hong Kong, Singapore, Malaysia and other FATF compliant countries. Th ese accounts can be used for channeling cross-border inward remittances into India primarily on private account up to INR 1,500,000 per transaction. Th ese accounts cannot be used for trade settlement, even though in theory they may be utilised to do so. See Master Direction – Opening and Maintenance of Rupee/Foreign Currency Vostro Accounts of Non-resident Exchange Houses) // Reserve Bank of India. 2016. January 1. URL: http://www.rbi.org.in/ Scripts/BS_ViewMasDirections.aspx?id=10205
both residents and non-residents from using the rupee for current account transactions.
As far as the capital account is concerned there is a large framework of controls split by residency, instrument, transaction size and investor category. Th e power to regulate capital account transactions currently vests with the RBI. Th is power has been conferred on it by Section 6(3) (b) of FEMA. A general overview of the framework is as follows (Patnaik and Shah, 2012; Sengupta, 2016):
• Outward fl ows by fi rms: Outbound FDI by a fi rm is capped at a multiple of its net worth;
• Foreign Banks: RBI restricts the growth of foreign banks by permitting all foreign banks, put together, to open 20 branches a year;
• Foreign borrowing by fi rms: Maturity of loan, amount, interest rate, end-use and the sector to which the debtor fi rm belongs, are prescribed. Th e aggregate borrowing by all fi rms in a year is subject to a ceiling;
• Debt investment by foreign portfolio investors: Th e aggregate investment by all foreign investors is subject to one ceiling for government bonds, and another for corporate bonds;
• Equity investments by foreign portfolio investors: Only registered "foreign

70
USE OF NATIONAL CURRENCIES IN INTERNATIONAL SETTLEMENTS. EXPERIENCE OF THE BRICS COUNTRIES
portfolio investors" are permitted to buy shares in India. Th eir investments are subject to sectoral and fi rm level ceilings;
• FDI: Foreign ownership in certain sectors (e.g. telecom, insurance, banking) is capped at various levels.Th e FEMA reform process in terms
of both current and capital account transactions has tended to drift towards greater openness. Current account out-fl ow restrictions on individuals have been eased in 4 incremental steps22 between 2004–15 with the limits being increased from USD 25,000 to USD 250,000 over the 11 year period23. In terms of foreign portfolio investment, India moved to a unifi ed portfolio investment framework for institutional investors, nonresident individuals and venture capital funds in 201424. Recent developments in the FPI framework for investment in rupee- denominated bonds and the external commercial borrowing framework for foreign borrowing by fi rms gives us some insight about the current state of the capital account reform process.
Th e introduction of the FPI25 frame-work marked a structural change in regulation of inward portfolio fl ows. Th is allowed for rationalization of documentary requirements, merging of investor categories, clarifi cations on tax treatment and a reduction in processing time for foreign investor
22 Th ese limits were partially reversed during the taper tantrum.
23 See Master Direction — Liberalised Remittance Scheme (LRS) // Reserve Bank of India. 2016. January 1. URL: http://rbi.org.in/Scripts/Notifi cation User.aspx?Id=10192
24 See Frequently Asked Questions (FAQs): SEBI Foreign Portfolio Investors Regulations, 2014 // Securities and Exchange Board of India. URL: http://www.sebi.gov.in/cms/sebi_data/attachdocs/1467282054952.pdf
25 See Foreign Portfolio Investors Regulations // Securities and Exchange Board of India. 2014. URL: http://www.sebi.gov.in/cms/sebi_data/attachdocs/1389083605384.pdf
registration26. Th is was followed a year later by announcement of a medium term framework27 for investment in onshore rupee-denominated govern-ment securities. Th e key announcement was that limits for FPI investment in the Central Government securities28 will be increased in phases to reach 5% of the outstanding stock by March 2018 along with limit enhancements announced every March and September. Th is announcement along with the introduction of the FPI framework was made to provide foreign investors a more predictable investment regime in rupee-denominated assets. Th is marks the fi rst instance of the RBI committing to a glide-path or a medium term plan for capital account liberalization similar to PBC’s announcements regarding the renminbi. Th e ECB framework also saw large scale changes in 2015 with the introduction of off shore rupee trade credit29 and off shore rupee-denominated bonds30 in September. Th ese changes are an integral part of internationalizing the rupee and allow for deepening of rupee liquidity in off shore centers. Th is was
26 See Gupta R. India: Foreign Portfolio Investment In India: SEBI Creates A New Class Of Investors // Mondaq. 2014. 3 September. URL: http://www.mondaq.com/india/x/ 338010/Commodities+Derivatives+Stock+Exchan ges/Foreign+Portfolio+Investment+In+India+SEB I+Creates+A+New+Class+Of+Investors
27 See Investment by Foreign Portfolio Investors (FPI) in Government Securities // Reserve Bank of India. 2015. October 6. URL: http://www.rbi.org.in/scripts/NotificationUser.aspx?Id=10059
28 Additionally, a separate limit for investment by all FPIs in the State Development Loans was also announced, to be increased in phases to reach 2% of the outstanding stock by March 2018.
29 See Trade Credit Policy — Rupee (INR) Denominated trade credit // Reserve Bank of India. 2015. September 10. URL: http://www.rbi.org.in/Scripts/Notifi -cationUser.aspx?Id=10023
30 See External Commercial Borrowings (ECB) Policy — Issuance of Rupee denominated bonds overseas // Reserve Bank of India. 2015. September 29. URL: http://www.rbi.org.in/Scripts/Notifi cationUser.aspx?Id=10049

71
INTERNATIONALIZATION OF THE RUPEE
followed by a rationalization of the ECB framework in November 201531 with the introduction of a unifi ed framework for rupee-denominated debt for Indian fi rms encompassing both onshore and off shore issuances, across a range of instruments including trade credit, loans and bonds. Around one-fi ft h of Indian corporate fi nancing needs are met by foreign currency borrowing. Almost all trade credit is denominated in foreign currency. Permitting international banks and capital markets to raise rupee debt marks a small but important step in solving the problem of "original sin" faced by fi rms and the government (Hausmann and Panizza, 2003).
In this context, it is important to highlight the role of hedging markets. Th e presence of hedging markets allows for internationalization of a currency as both a vehicle for invoicing trade as well as fi nancial portfolio diversifi cation. In India’s case exchange traded currency derivatives were introduced in 2008 but foreigners were not allowed to participate on exchanges till June 2014. Th eir participation is also limited by detailed documentation requirements to show a demonstrable exposure along with restrictive margin requirements on exchanges. Th ere are position limits of USD 15 million on exchange traded derivatives and foreigners can only hedge up to their underlying exposure in the over the counter markets. Th is problem is accentuated by restrictions on types of products, lack of overlap between Indian trading hours and global trading times and regulatory risk (Standing Council on International Competitiveness of the Indian Financial System, 2015).
Th e existence of such large NDF markets for the INR should be of concern for domestic policymakers. Th e fi rst rea-
31 Track III in the revised ECB framework, See External Commercial Borrowings (ECB) Policy — Revised framework // Reserve Bank of India. 2015. November 30. URL: http://www.rbi.org.in/Scripts/Notifi cationUser.aspx?Id=10153
son is a simple revenue loss argument. IGIDR Finance Research Group (2016) estimates that based on the trade volumes in these markets, Indian fi nancial fi rms are potentially losing out on revenues worth USD 500 billion annually. Th e second argument is from the perspective of market regulators and effi cient exchange rate management. Th e ineff ectiveness of a host of capital controls mounted by the RBI for its currency defence during the "taper tantrum" period of 2013 is well-documented (Tayal, Rajat, 2013). Denied access to the domestic markets, the participants shift ed to the off shore NDF markets which are subject to limited scrutiny by the domestic regulators. Th is had possible spillover eff ects on the domestic rates. Additionally, the RBI had to resort to abandoning its monetary policy objectives in wake of the sharp depreciation, raising domestic interest rates by 400 bps in a period of muted growth. Lastly, fragmented markets face more dispersed price discovery. Divergence of rates in off shore NDF markets and the onshore currency markets can be frequently observed and stresses the importance of a single market for effi cient price discovery (Hutchison et al., 2012).
Dealing with off shore NDF mar-kets has to be central to any policy deliberation for the development of INR hedging markets. India can learn signifi cantly from the experience of the China and Russia — two BRICS countries which have charted divergent paths towards internationalization of their currencies. Th e Russian ruble was made fully convertible in mid-2006. Subsequently, the off shore NDF markets for ruble shift ed to onshore currency markets. Currently, the ruble NDF has the smallest share out of the BRICS currencies in the global NDF market. China on the other hand, has charted a completely diff erent route. Chinese authorities, while administrating strict capital controls, have permitted a pool

72
USE OF NATIONAL CURRENCIES IN INTERNATIONAL SETTLEMENTS. EXPERIENCE OF THE BRICS COUNTRIES
of off shore renminbi instruments that can be freely traded and delivered. Th e result has been a thriving market for off shore deliverable forwards which has eclipsed the renminbi NDF market. Th e leakiness of these capital controls were exposed during the renminbi depreciation in August 2015. Th e volume of renminbi NDF trading almost quadrupled on August 11, 2015. Similar revivals were seen in the ruble NDF markets following events of political uncertainty and credit constraints in Russia (McCauley and Shu, 2016).
Increasing access to onshore hedging markets for foreigners and allowing access to off shore markets to residents is an easy fi rst step towards improving INR currency risk management. Standing Council on International Competitiveness of the Indian Financial System (2015) off shore NDF markets. Improvement in INR risk management is likely to increase the utilization of the INR as a trade currency. Th e government can continue its policy eff orts in promoting use of the INR as trade invoicing currency, especially for South-South trade and subsequently look at a gradual extension of off shore INR settlement (deposits) and trade credit. Th e RBI however, is taking a calibrated approach32 to rupee internationalization and does not mention any changes in local currency invoicing and settlement for 2016–17; its policy focus is on slowly improving hedging markets and increasing use of INR as a currency for raising debt from foreign counterparties. RBI’s reluctance to allow for LCY invoicing and settlement is understandable for two reasons. First, India’s trade exposure to nonconvertible currency trade partners is less than 10% excluding China and oil producing countries. Second, there is a lack of risk management facilities
32 See Annual Report. Financial Markets and Foreign Exchange Management // Reserve Bank of India. 2016. August 29. URL: http://www.rbi.org.in/scripts/AnnualReportPublications.aspx?Id=1178
in partially convertible currencies and there are associated country risks in dealing with banks from these countries in making bilateral currency markets33. Th is is unlikely to change soon given the reversals in capital account liberalization in the emerging world aft er the taper tantrum in 2013 (Gallagher, 2014). Th e BRICS agenda needs to focus on decentralized risk management at fi rm level, both fi nancial and non-fi nancial, if it wants to move towards LCY settlement of trade amongst its member countries along with initiatives like the CRA.
Th ere is no consensus in India about capital account convertibility and it is diffi cult to judge whether India will follow the Russian or the Chinese model of currency internationalization as there have been proposals for both greater capital account convertibility34 and fi nancial centers similar to Hong Kong35. Indian policymakers demonstrated a preference for a mix of both strategies, liberalization and setting up an international fi nancial center, but there has been very little synergy between both eff orts36.
As of the writing of this paper the share of INR in global currency turnover is just 1% whereas India contributes almost 3% to global GDP. We anticipate a slow internationalization of the INR, given the current path of exchange control and capital account liberalization continues until 2018. Given China’s experience with
33 See Iyer P.V. Why BRICS trade in local currency doesn’t work for India // Th e Indian Express. 2015. July 13. URL: http://indianexpress.com/article/explai-ned/why-brics-trade-in-local-currency-doesnt-work-for-india-2/
34 See Committee on Fuller Capital Account Convertibility, 2006.
35 See Setting up of IFSC Banking Units (IBUs) // Reserve Bank of India. 2015. April 1. URL: http://rbi.org.in/Scripts/Notifi cationUser.aspx?Id=9636 (for notifi ed legal framework).
36 See Nair A. RBI Governor suggests single regulator for GIFT City // Th e Indian Express. 2017. January 12. URL: http://indianexpress.com/article/business/business-others/rbi-governor-suggests-single-regulator-for-gift -city/

73
INTERNATIONALIZATION OF THE RUPEE
Hong Kong, an international fi nancial center in Gandhinagar is likely accelerate the process of INR internationalization and fi nancial sector reform. Th e RBI will continue to remain cautious and is unlikely to shift from its "wait and watch" approach before committing to the next phase of INR internationalization reforms. We do not expect any "big bang" changes before the next policy cycle begins in 2020. Given recent changes in regulatory frameworks, we also anticipate a clear medium to long term plan articulated by the RBI in conjunction the Ministry of Finance, if and when they decide to pursue rupee internationalization.
References
1. Dixon C. Th e New BRICS Bank: Challenging the International Financial Order? // Th e Global Policy Institute. London Metropolitan University. 2015. No. 28. URL: http://www.gpilondon.com/wp-content/uploads/PP28-The-New-BRICS-Bank.pdf
2. Features and trends of NDF markets for Emerging Economy Currencies: A study of the Indian Rupee // IGIDR Finance Research Group. 2016. March. URL: http://www.ifrogs.org/POLICY/ndfReport.html
3. Fernandez A., et al. Capital Control Measures: A New Dataset / A. Fernandez, M. W. Klein, A. Rebucci, M. Schindler, M. Uribe // National Bureau of Economic Research. Working Paper. 2015. No. 20970. URL: http://www.nber.org/papers/w20970.pdf
4. Gallagher K. P. Ruling capital: Emer-ging markets and the reregulation of cross-border fi nance. Cornell University Press, 2014.
5. Gao H., Yu Y. Internationalization of the renminbi // Currency interna-tionalisation: lessons from the global fi nancial crisis and prospects for the
future in Asia and the Pacifi c // BIS. BIS Papers. 2011. No. 61. P. 105–124. URL: http://www.bis.org/publ/bppdf/bispap61.pdf
6. Goldberg L. S., Tille C. Vehicle currency use in international trade // Journal of international Economics. 2008. No. 76(2). P. 177–192.
7. Hausmann R., Panizza U. On the determinants of Original Sin: an empirical investigation // Journal of International Money and Finance. 2003. No. 22(7). P. 957–990.
8. Hutchison M. M., Pasricha G. K., Singh N. Eff ectiveness of capital controls in India: Evidence from the off shore NDF market // IMF Economic Review. 2012. No. 60 (3). P. 395–438.
9. Ito H., Chinn M. Th e Rise of the “Redback” and the People’s Republic of China’s Capital Account Liberalization: An Empirical Analysis of the Deter-minants of Invoicing Currencies // Asian Development Bank Institute. Working Paper. 2014. No. 473. URL: http://www.adb.org/sites/default/files/publication/156328/adbi-wp473.pdf
10. Ito T. A New Financial Order in Asia: Will a RMB bloc emerge? // National Bureau of Economic Research. Working Paper. 2016. No. 22755. URL: http://www.nber.org/papers/w22755.pdf
11. Langedijk S., Karagiannis S., Evangelia P. Invoicing Currencies in Interna-tional Trade — Drivers and Obstacles to the Use of the Euro // Joint Research Centre. Scientifi c and Technical Research Report. 2016. URL: http://publications.jrc.ec.europa.eu/repository/bitstream/JRC96913/lbna27754enn.pdf
12. Ma G., McCauley R. N. Is China or India more fi nancially open? // Journal of International Money and Finance. 2013. No. 39. P. 6–27.
13. Ma G., Villar A. Internationalisation of emerging market currencies // Th e transmission of unconventional monetary policy to the emerging markets // BIS.
74
USE OF NATIONAL CURRENCIES IN INTERNATIONAL SETTLEMENTS. EXPERIENCE OF THE BRICS COUNTRIES
BIS Papers. 2014. No. 78. P. 71–87. URL: http://www.bis.org/publ/bppdf/bispap78.pdf
14. Masala Bond List // London Stock Exchange. 2016. URL: http://www.lseg.com/masala
15. McCauley R. N., Shu C. Non-deli-verable forwards: impact of currency internationalisation and derivatives reform // BIS. BIS Quarterly Review. 2016. December. URL: http://www.bis.org/publ/qtrpdf/r_qt1612h.pdf
16. Moore M., Schrimpf A., Sushko V. Downsized FX markets: causes and implications // BIS. BIS Quarterly Review. 2016. December. URL: http://www.bis.org/publ/qtrpdf/r_qt1612e.pdf
17. Patnaik I., Shah A. Did the Indian Capital Controls Work as a Tool of Macroeconomic Policy&quest? // IMF Economic Review. 2012. No. 60(3). P. 439–464.
18. Ranjan R., Prakash A. Interna-tionalization of Currency: Th e case of the Indian Rupee and Chinese Renminbi // Reserve Bank of India Report. RBI Staff Studies. 2010. No. 3. URL: http://rbidocs.rbi.org.in/rdocs/PublicationReport/Pdfs/RRSS180510F.pdf
19. Renminbi internationalization: Achievements, prospects and challenges / B. J. Eichengreen, M. Kawai (eds.) // Asian Development Bank Institute. Brookings Institution. Tokyo, 2015. URL: http://www.adb.org/sites/default/fi les/publication/159835/adbi-renminbi-internationalization-achievements-prospects-challenges.pdf
20. Report of the Committee on Fuller Capital Account Convertibility // Reserve Bank of India. 2006. July 31. URL: http://rbidocs.rbi.org.in/rdocs/PublicationReport/Pdfs/72250.pdf
21. Report of the Standing Council on International Competitiveness of the Indian Financial Sector // Ministry of Finance. 2015. Vol. 1. URL: http://fi nmin.
nic.in/reports/Standing%20Council%20Report%20IFS.pdf
22. Sengupta R. Th e impossible trinity: Where does India stand? // International Trade and International Finance / M. Roy, S. Sinha Roy (eds.). Springer India, 2016. P. 511–523.
23. Shu C., He D., Cheng X. One currency, two markets: the renminbi’s growing infl uence in Asia-Pacifi c // BIS. Working Paper. 2014. No. 446. URL: http://www.bis.org/publ/work446.pdf
24. Survey on the holdings of cur-rencies in offi cial foreign currency assets // IMF. 2015. URL: http://www.imf.org/~/media/Images/IMF/Data/080415.ashx
25. Tayal R. Impact of restrictions on currency derivatives on market quality // IGIDR Finance Research Group. 2013. October. URL: http://ifrogs.org/PDF/201309_restrictionsOnCurrencyDerivatives.pdf
26. Triennial Central Bank Survey. Foreign exchange and derivatives market activity in April 2010. Preliminary results // BIS. 2010. URL: http://www.bis.org/publ/rpfx10.pdf
27. Triennial Central Bank Survey of foreign exchange and derivatives market activity in 2013 // BIS. 2013. URL: http://www.bis.org/publ/rpfx13.htm
28. Triennial Central Bank Survey of foreign exchange and OTC derivatives markets in 2016 // BIS. 2016. URL: http://www.bis.org/publ/rpfx16.htm

75
INTERNATIONALIZATION OF THE RUPEE
Appendix
List of countriesCountry Code Country
IN IndiaBR BrazilCN ChinaRU RussiaKR South KoreaPE PeruCZ Czech RepublicHU HungaryCL ChileID IndonesiaTH Th ailandMY MalaysiaCO ColombiaMX MexicoTR TurkeyZA South AfricaPL PolandPH Philippines

76
USE OF NATIONAL CURRENCIES IN INTERNATIONAL SETTLEMENTS. EXPERIENCE OF THE BRICS COUNTRIES
Th e Chinese government has be-gun to gradually promote RMB inter-nationalization since the GFC. Th e pressing need for the reform of the international monetary system, the steady growth of the Chinese economy, the government’s support and the RMB appreciation expectation over the past several years have worked together to propel RMB internationalization. In October 2016, RMB was offi cially included into the SDR currency basket by the International Monetary Fund, highlighting global recognition of the achievements of RMB internationalization over the past years.
Between 2009 and 2016, RMB internationalization made remarkable progress. In summary, the achievements include following aspects.
Encouraging enterprises to use RMB settlement in cross-border trade and investment
Pilot program on RMB settlement in trade in goods started in December 2008. In June 2010, People’s Bank of China, Ministry of Finance, Ministry of Commerce, General Administration of Customs, State Administration of Taxation and China Banking Regulatory Commission jointly issued "Notice on issues concerning the expansion of
pilot program on RMB settlement in cross-border trade", extending the pi-lot regions from Shanghai and four cities of Guangdong to more than 20 provinces and municipalities including Beijing, Tianjin, Jiangsu, Zhejiang and Fujian. Th en, in August 2011, the six government departments jointly issued "Notice on enlarging regions for RMB settlement in cross-border trade", extending the pilot regions to the whole country. It is noteworthy that, instead of putting forward the idea of RMB internationalization, the aim for the central government to advance this pilot program at that time was to help enterprises avoid exchange rate risk and reduce exchange loss. It showed that, during that period, the Chinese government was very cautious about RMB internationalization.
For the purpose of further expanding the use of RMB in cross-border trade and investment and regulating the banks and overseas investors in carrying out settlement for RMB-denominated foreign direct investment, the People’s Bank of China had formulated "Administrative Rules on Settlement of RMB-denominated Foreign Direct Investment" on October 14, 2011.Th is means that overseas investors and the banks can carry out settlement for RMB-denominated foreign direct investment according to the new administrative rules, eff ectively expanding the cross-border use of RMB and substantially facilitating trade and investment while advancing the progress of RMB internationalization. On June 14, 2012,
Chapter 5
The Internationalization of RMB: China’s Experience1
1 Liu Dongmin, Xiao Lisheng, Lu Ting, Xiong Aizong, Zhang Chi — Institute of World Economics and Politics, Chinese Academy of Social Sciences.

77
THE INTERNATIONALIZATION OF RMB: CHINA’S EXPERIENCE
for the purpose of implementing "Administrative Rules on Settlement of RMB-denominated Foreign Direct Investment", facilitating RMB-deno-minated foreign direct investment by overseas investors and regulating the banks and fi nancial institutions in carrying out settlement for RMB-denominated foreign direct investment, the People’s Bank of China issued "Notice on Specifying Operating Rules on Settlement of RMB-denominated Foreign Direct Investment".
In addition, the People’s Bank of China also made joint eff orts with other related departments to adopt a series of supportive measures to facilitate the use RMB in cross-border settlement. On July 1, 2009, the People’s Bank of China, Ministry of Finance, Ministry of Commerce, General Administration of Customs, State Admi-nistration of Taxation and China Banking Regulatory Commission jointly issued "Administrative Rules for the Pilot Program on RMB Settlement of Cross-Border Trade" to regulate the behaviors of pilot enterprises and commercial banks and prevent related business risks so as to promote trade facilitation and ensure smooth implementation of the pilot program on RMB settlement in cross-border trade. To implement
"Administrative Rules on Pilot Program of RMB Settlement of Cross-border Trade Transactions", the People’s Bank of China and the State Administration of Foreign Exchange had issued in July 2009 respectively "Regulations for Implementing the Administrative Rules on Pilot Program of RMB Settlement of Cross-border Trade Transactions" and "Notice on related issues concerning the declaration and statistics on international receipts and payments in RMB settlement of cross-border trade transactions", so as to facilitate implementation and progress of the use of RMB in cross-border settlement.
RMB cross-border settlement has been accelerating as China’s international trade and direct investment keep growing. Currently, RMB cross-border settlement has been expanded to all regions in the country, with no geographic restrictions in overseas markets. According to statistics from People’s Bank of China, RMB cross-border settlement has covered more than 210 foreign countries and regions.
RMB cross-border settlement under current account has developed rapidly (Figure 1).
Th e absolute size of RMB settlement in cross-border trade has soared from 3.6 billion yuan in the fi rst quarter of 2009
Figure 1. Cross-border fl ow of RMB fund, bn yuanSource: Wind Database
2011
-03
2011
-06
2011
-09
2011
-12
2012
-03
2012
-06
2012
-09
2012
-12
2013
-03
2013
-06
2013
-09
2013
-12
2014
-03
2014
-06
2014
-09
2014
-12
2015
-03
2015
-06
2015
-09
2015
-12
2016
-03
RMB settlement in cross-border trade: actual receipts
RMB settlement in cross-border trade: actual payments
3, 000
2, 000
1, 000
0

78
USE OF NATIONAL CURRENCIES IN INTERNATIONAL SETTLEMENTS. EXPERIENCE OF THE BRICS COUNTRIES
Trade in goods
Trade in services
and other current account
Outbound direct investment
Foreign direct investment
18
14 54
14
to 1.3 trillion yuan in the third quarter of 2016. Due to impact of the European debt crisis, the growth of RMB settlement in cross-border trade had stopped between the second half of 2011 and early 2012 but rebounded rapidly between 2012 and 2013. In March, 2014, aft er the daily range of RMB exchange rate fl uctuation was enlarged from 1% to 2%, the size of RMB settlement in cross-border trade began to fl uctuate vehemently. Since the "August 11" foreign exchange rate reform in 2015, the growth of RMB settlement in cross-border trade has decelerated signifi cantly. As a key base of intermediary trade for domestic enterprises to take part in the global trade, Hong Kong has played a major role in RMB settlement in cross-border trade. Between the fourth quarter of 2009 and the fi rst quarter of 2015, about 80% of RMB settlements in cross-border trade are done through Hong Kong.
In terms of capital account, the amount of actual receipts and payments had both increased year by year before the "August 11" foreign exchange rate reform in 2015. Aft er that, the actual receipts of RMB settlement in cross-border trade
had begun to decline while the actual payments had fl uctuated.
Th e aggregate amount of RMB settlement in cross-border trade has reached 6.47 trillion yuan in the fi rst ten months of 2016 among which trade in goods, standing at 3.46 trillion yuan, accounted for 54% of the total; foreign direct investment, 1.15 trillion yuan, 18%; trade in service and other current accounts, 931.6 billion yuan, 14%; outbound direct investment, 921.1 billion yuan, 14% (Figure 2).
To support implementation of RMB cross-border settlement, China’s banks have set up RMB clearing mechanism in 21 countries and regions by the end of September, 2016, covering Southeast Asia, West Europe, Middle East, North Аmerica, South America and Oceania.
Currency swap and direct currency trading with RMB
Th e purpose for People’s Bank of China to sign currency swap agreements with overseas monetary authorities is not only to maintain regional fi nancial stability but, more importantly, to facilitate development of bilateral trade
Figure 2. Cross-border fl ow of RMB settlement in the fi rst 10 months of 2016, %Source: People’s Bank of China

79
THE INTERNATIONALIZATION OF RMB: CHINA’S EXPERIENCE
and investment. Th e amount of money for currency swap can be used to support local enterprises’ trade and investment so as to promote use of the two sides’ currencies in bilateral trade and investment, which will help not only lower the exchange risk that the fl uctuation of the dollar will cause in the bilateral international eco-nomic activities between both sides of currency swap but also reduce exchange cost to boost bilateral trade and investment.
Since the GFC, China has kept pro-moting currency cooperation and signing and renewing bilateral currency swap agreements with overseas central banks or monetary authorities. China has so far signed bilateral currency swap agreements with central banks or monetary autho-rities from 36 countries and regions including Hong Kong, Malaysia, Belarus, Indonesia and South Korea. By the end of 2016, the amount of money that those currency swap agreements actually involved has exceeded 3.1 trillion yuan (Table 1).
In terms of the currency swap agreements that are currently eff ective, most countries and regions that have signed currency swap agreements with People’s Bank of China come from Asia and Pacifi c area. But in recent years, the number of such countries from Europe, Africa and Latin America also increased gradually. China has signed currency swap agreements with other BRICS countries such as Brazil (expired), Russia and South Africa, creating favorable conditions for further promotion of use of their own currencies among BRICS countries.
Direct currency trading between RMB and foreign currencies represents another major step forward during the course of RMB internationalization that helps increasing RMB settlement in bilateral trade and investment and raises the international status of RMB. Meanwhile, direct currency trading with RMB can avoid the cost of denominating with
the third party currency and reduce the exchange cost of transaction to facilitate bilateral trade, investment and fi nancial cooperation.
Direct currency trading has been developed between RMB and 21 non-US dollar currencies. Since the establishment of the Bretton Woods system, the US dollar has played a central role in the international monetary system as the most important global currency for trade, investment and reserve. Th erefore, in the beginning, direct currency trading was developed only between RMB and the US dollar on the back of which indirect currency trade had then been developed between RMB and other currencies. However, the use of US dollar as the medium of exchange both adds to the cost and inconvenience of currency trading between RMB and other foreign currencies and increases the exchange risk for both sides. Th erefore, as RMB internationalization presses ahead and foreign economic and trade relations keep growing, it is urgent to establish a direct currency trading mechanism between RMB and other currencies. Hence, since 2010 China Foreign Exchange Trade System has fi rst opened direct currency trading between RMB and Malaysian ringgit and then developed direct currency trading between RMB and 21 non-US dollar currencies including Russian rubble, Japanese yen, Australian dollar, New Zealand dollar, pound, euro, Singapore dollar, Swiss franc, South African rand, Korean won, UAE dirham, Saudi riyal, Canada dollar (Table 2).
Construction of off-shore RMB financial centers
Construction of off shore RMB mar-kets is proceeding apace. Off shore RMB markets develop rapidly. Hong Kong has become the most important RMB off shore center in the world and RMB

80
USE OF NATIONAL CURRENCIES IN INTERNATIONAL SETTLEMENTS. EXPERIENCE OF THE BRICS COUNTRIES
Th e otherparty of Swap
Signing time Swap size Term
Hong Kong2009.1.202011.11.22 (renewed)2014.11.22 (renewed)
200 bn yuan/ 227 bn HK dollar400 bn yuan/490 bn HK dollar (renewed)400 bn yuan / 505 bn HK dollar (renewed)
3 yrs
Malaysia
2009.2.82012.2.8 (renewed)
2015.4.17 (renewed)
80 bn yuan / 40 bn Malaysian ringgit180 bn yuan/ 90 bn Malaysian ringgit (renewed)180 bn yuan / 90 bn Malaysian ringgit (renewed)
3 yrs3 yrs
Belarus 2009.3.11 2015.5.10 (renewed)
20 bn yuan / 8 trn Belarusian ruble 7 bn yuan /16 trn Belarusian ruble (renewed)
3 yrs
Indonesia2009.3.23 2013.10.1 (renewed)
100 bn yuan/ 175 trn Indonesian rupiah100 bn yuan/175 trn Indonesian rupiah (renewed)
3 yrs
Argentina2009.4.2 2014.7.18 (renewed)
70 bn yuan/38 bn Argentine peso70 bn yuan / 90 bn Argentine peso (renewed)
3 yrs
South Korea
2009.4.202011.10.26 (renewed)
2014.10.11 (renewed)
180 bn yuan / 38 trn South Korean won360 bn yuan/64 trn South Korean won (renewed)360 bn yuan / 64 trn South Korean won (renewed)
3 yrs
Iceland2010.6.9 2013.9.11 (renewed)
3.5 bn yuan/66 bn Icelandic krona3.5 bn yuan / 66 bn Icelandic krona (renewed)
3 yrs
Singapore
2010.7.232013.3.7 (renewed)
2016.3.7 (renewed)
150 bn yuan/30 Singapore dollar300 bn yuan / 60 bn Singapore dollar (renewed)300 bn yuan/60 bn Singapore dollar (renewed)
3 yrs
New Zealand2011.4.18 2014.4.25 (renewed)
25 bn yuan/5 bn New Zealand dollar25 bn yuan/5 bn New Zealand dollar (renewed)
3 yrs
Uzbekistan (expired)
2011.4.19 0.7 bn yuan / 167 bn Uzbekistan som 3 yrs
Table 1 Bilateral local currency swap agreements signed between People’s Bank of China and other central banks or monetary authorities
Mongolia
2011.5.62012.3.20 (supplemental)
2014.8.21 (renewed)
5 bn yuan/1 trn Mongolian tugrik 10 bn yuan / 2 trn Mongolian tugrik (expanded) 15 bn yuan/4.5 trn Mongolian tugrik (renewed)
3 yrs
Kazakhstan 2011.6.132014.12.14 (renewed)
7 bn yuan/150 bn Kazakhstani Tenge7 bn yuan/200 bn Kazakhstani Tenge (renewed)
3 yrs
Th ailand 2011.12.22 2014.12.22 (renewed)
70 bn yuan/320 bn Th ailand baht70 bn yuan/370 bn Th ailand baht (renewed)
3 yrs

81
THE INTERNATIONALIZATION OF RMB: CHINA’S EXPERIENCE
Table 1 (Th e completion)
business is booming in Singapore, Taipei, London, Luxembourg, Paris and Frankfurt. RMB clearing banks can be found in major fi nancial trading market in Asia, Europe, America, Africa and Oceania. In October 2015, People Bank of China set up CIPS, a key infrastructure for RMB internationalization, to facilitate RMB cross-border and off shore business for domestic and foreign fi nancial institutions. Th e amount of RMB deposits
in Hong Kong had increased from less than 100 billion yuan in July 2010 to 662.5 billion yuan in October 2016. Th is is a result of the cooperation between People’s Bank of China and Hong Kong Monetary Authority to substantially expand the scope for RMB business in Hong Kong by adopting a series of supportive policies. However, like RMB settlement in cross-border trade, the growth of RMB deposits in Hong Kong
Table 2Direct trading between China and non-US-dollar currencies
Time Direct trading currency Time Direct trading currency2010.8.19 Ringgit (Malaysia) 2016.9.23 Dihram (UAE)2010.11.22 Ruble (Russia) 2016.9.23 Riyal (Saudi Arabia)2012.5.29 Yen (Japan) 2016.11.11 Canada dollar (Canada)2013.4.9 Australian dollar (Australia) 2016.12.9 Swedish krona (Sweden)
2014.3.18 New Zealand dollar (New Zealand) 2016.12.9 Norwegian krone (Norway)
2014.6.18 GB pound (UK) 2016.12.9 Turkish lira (Turkey)2014.9.29 Euro (Euro zone) 2016.12.9 Mexican peso (Mexico) 2014.10.27 Singapore dollar (Singapore) 2016.12.9 Hungarian forint (Hungary)2015.11.9 Swiss franc (Switzerland) 2016.12.9 Danish krone (Denmark)2016.6.17 Rand (South Africa) 2016.12.9 Polish zloty (Poland)2016.6.24 Won (South Korea)
Source: China Foreign Exchange Trade System
Pakistan 2011.12.23 2014.12.23 (renewed)
10 bn yuan/140 bn Pakistani rupee10 bn yuan/165 bn Pakistani rupee (renewed)
3 yrs
UAE 2012.1.17 2015.12.14 (renewed)
35 bn yuan/20 bn UAE dirham35 bn yuan/20 bn UAE dirham (renewed)
3 yrs
Turkey 2012.2.21 2015.9.26 (renewed)
10 bn yuan/3 bn Turkish lira12 bn yuan/5 bn Turkish lira (renewed)
3 yrs
Australia2012.3.22 2015.3.30 (renewed)
200 bn yuan/30 bn Australian dollar200 bn yuan/40 bn Australian dollar (renewed)
3 yrs
Ukraine2012.6.26 2015.5.15 (renewed)
15 bn yuan/19 bn Ukrainian hryvna15 bn yuan / 54 bn Ukrainian hryvna (renewed)
3 yrs
Brazil (expired)
2013.3.26 190 bn yuan/60 bn Brazilian real 3 yrs
UK 2013.6.22 2015.10.20 (renewed)
200 bn yuan/20 bn GB pound350 bn yuan/35 bn GB pound (renewed)
3 yrs
Source: People’s Bank of China

82
USE OF NATIONAL CURRENCIES IN INTERNATIONAL SETTLEMENTS. EXPERIENCE OF THE BRICS COUNTRIES
had once turned negative between the second half of 2011 and early 2012. Aft er the "August 11" foreign exchange reform in 2015, RMB deposits in Hong Kong witnessed massive negative growth. It is noteworthy that among RMB deposits in Hong Kong, the proportion of term deposits climbed from 30% in 2009 to about 83% in 2016, indicating that RMB deposits in Hong Kong originate from the outfl ow of fund from cross-border trade settlement and have inadequate fi nancial investment instruments.
RMB cross-border business under capital account has been making break-throughs. Th ere are more and more channels for inward RMB cross-border fl ow including RMB Qualifi ed Foreign Institutional Investor, RMB foreign direct investment, the entry of three types of foreign institutions into the interbank bond market, RMB cross-border loans and Shanghai-Hong Kong Stock Connect. Channels for outward RMB cross-border fl ow under capital account mainly include RMB Qualifi ed Domestic Institutional Investor, RMB Overseas Direct Investment and enterprises’ RMB loans to overseas subsidiary companies
among which RFDI and RQFII are the main channels for inward fl ow of overseas RMB under capital account. In the third quarter of 2016, China’s RMB settlement in cross-border direct investment amounted to 1.8 trillion yuan among which RODI and RFDI accoun-ted for 830 billion and 1.004 trillion yuan respectively. By now, the Chinese mainland has approved an aggregate RQFII quota of 329.8 billion yuan for 6 countries and regions. China Securities Regulatory Commission will further deepen reform of the RQFII mechanism to break the quota limit of 1 billion dollar and facilitate inward and outward fl ow of capital.
Fundamentally speaking, to achieve full RMB internationalization, China must realize fi nancial liberalization and full convertibility of capital account. But the reform of fi nancial liberalization must be carried out step by step. To promote RMB internationalization under the condition of incomplete convertibility of capital account, it is very important to develop off shore RMB fi nancial markets because such off shore markets are needed to provide non-residents holding RMB
200
180
160
140
120
100
80
60
40
20
0
2007 2008 2009 2010 2011 2012 2013 2014 2015 2016
Figure 3. Issuance of Dim Sum bonds, bn yuanSource: Wind Database (by December 5, 2016)

83
THE INTERNATIONALIZATION OF RMB: CHINA’S EXPERIENCE
a platform for RMB-denominated trade, investment and settlement. And off shore markets should be properly separated from onshore markets. By now, RMB off shore fi nancial centers have been set up in Hong Kong, Taiwan, Singapore, London, Frankfurt, Paris, Luxembourg and Toronto to provide RMB investment products in off shore markets through Dim Sum bonds, RQFII, cross-border loans, Shanghai-Hong Kong Stock Connect program and Shenzhen-Hong Kong Stock Connect program. During this process, China expands convertibility of capital account in an orderly and prudential approach.
A. Dim Sum bondsDim Sum bonds refer to off shore
bonds issued in Hong Kong by domestic fi nancial institutions and enterprises. China Development Bank issued the fi rst off shore RMB bond in Hong Kong in June 2007, ushering in a new chapter in the development of Dim Sum bond market. Aft er the initial phase of development, Dim Sum bond market witnessed a period of explosive growth between 2010 and 2014. In 2014, issuance of Dim Sum bonds in Hong Kong totaled 183.1 billion yuan, up 89% year-on-year, of which 90% were fi nancial bond and corporate bond and more than 75% 1–3 year short-term bonds.
Aft er years of stable growth, Dim Sum bonds face new challenges against the pressure of RMB devaluation. Issuance of Dim Sum bonds plummeted between 2015 and 2016. Th e total Dim Sum issuance volume was 91.7 billion yuan in 2015, roughly half of that in 2014. It declined further in 2016. By December 5, the total Dim Sum issuance volume has reached only 32.7 billion yuan in 2016, basically as much as that in 2010. Th is fact shows that changing expectation on the foreign exchange rate of RMB is the major
driving force behind the fl uctuation of the Dim Sum issuance volume (Figure 3).
Dim Sum bonds issued in Hong Kong face three key challenges. Th e fi rst is lack of liquidity and a secondary market. Because of its limited market size, Dim Sum bond market is short of market-makers. According to data from the bond quotation website of the Central Money markets Unit with the Hong Kong Monetary Authority, all RMB-denominated bonds are not actively traded except the national bonds issued by China’s Ministry of Finance, which is traded in the OTC market.
Th e second challenge is lack of bond ratings and short maturity, and investors usually prefer to hold short-term bonds. Under these circumstances, off shore RMB-denominated bonds do not have a yield curve of RMB for reference and Hong Kong fi nancial market cannot provide RMB bonds with high liquidity and reasonable duration structure.
Th e third is that bond issuance is aff ected by the exchange rate of RMB. As long as the current devaluation expectation exists, investors’ enthusiasm can hardly return. Inclusion of RMB into SDR and gradually more convertibility under capital account will add to the diffi culties of keeping exchange rate stable and thus Dim Sum bond market might shrink further.
B. RQFIIRQFII refers to RMB Qualifi ed
Foreign Institutional Investors. Th rough RQFII mechanism, overseas institutions can make use of RMB fund raised in off shore markets to invest in China’s domestic capital market. On August 17, 2011, then Vice Premier Li Keqiang said at a forum in Hong Kong that RMB Qualifi ed Foreign Institutional Investors will be allowed to invest in the domestic securities market with a starting quota of 20 billion yuan (Figure 4).
Since then, qualifi ed foreign insti-tutional investors have gradually acce-

84
USE OF NATIONAL CURRENCIES IN INTERNATIONAL SETTLEMENTS. EXPERIENCE OF THE BRICS COUNTRIES
lerated their participation in the dome-stic securities market under RQFII mechanism. In recent years, as RMB internationalization moves ahead and restrictions on asset allocation are gradually removed, investment through RQFII has increased steadily. RQFII invested 4,599.2 billion yuan in 2015, on average 383.2 billion yuan per month, while having opened 942 accounts in Chi-na’s A-share market by the end of 2015. In 2016, RQFII basically continued the momentum of steady growth of the previous year, investing 4,947.9 billion yuan in the fi rst ten months and having opened 1,067 accounts in the A-share market by the end of October.
During the two-day China-US Strate-gic and Economic Dialogue in June 2016, Yi Gang, deputy governor of People’s Bank of China, indicated that China would provide the US with RQFII quota of 250 billion yuan (USD 38 billion). Th is is the fi rst time that China has provided the US with such a quota, a milestone for RMB internationalization and RQFII mechanism.
Research shows that most quota of RQFII are used by institutional investors from Hong Kong. Th ere are mainly two
explanations. One is that Hong Kong funds tend to allocate most of their assets in Asia Pacifi c areas and have high demand for domestic RQFII while funds from UK, France and Germany prefer to global asset allocation and have relatively few demand for the domestic stock market. Th e other is that investors from other regions can hardly understand complex regulatory measures over RQFII. According to the approval process of RQFII, China Securities Regulatory Commission is responsible for approving the qualifi cation of RQFII and the State Administration of Foreign Exchange will approve the total quota for a certain region and specifi c quota for each fi nancial institution. For overseas investors, each RQFII business will face restrictions over institutional qualifi cation, approval of quota and structure of products. Since Hong Kong banks and investors have done more businesses related to the domestic market, they are able to interpret such regulations in a more fl exible way. If the RQFII mechanism is to be further expanded, it is necessary to further streamline its regulatory and approval system.
600
500
400
300
200
100
2011
-12
2012
-12
2012
-03
2012
-06
2012
-09
2013
-12
2013
-03
2013
-06
2013
-09
2014
-12
2014
-03
2014
-06
2014
-09
2015
-12
2015
-03
2015
-06
2015
-09
2016
-03
2016
-06
2016
-09
0
Figure 4. RQFII investment, bn yuanSource: Wind Database

85
THE INTERNATIONALIZATION OF RMB: CHINA’S EXPERIENCE
C. Cross-border RMB LoansCross-border RMB loans is one of the
measures that the Chinese government has taken to enable overseas fi nancial institutions to channel overseas RMB back into the domestic market, ensuring use of RMB as a settlement currency to meet real trade and investment demand. In January 2013, Qianhai has become the fi rst region in China to provide cross-border RMB loans, marking a new milestone in RMB internationalization. With construction of Qianhai being accelerated, the scope and procedure of RMB settlement in cross-border trade has been gradually expanded and optimized and the size of cross-border RMB loans has grown rapidly in Qianhai. By the end of March, 2015, the registered volume of cross-border RMB loans in Qianhai had reached 91.1 billion yuan with 22.8 billion yuan having been withdrawn. Th e two fi gures in 2013 were 14.8 billion yuan and 3.36 billion yuan respectively. By now, more than 30 central SOEs and industrial leaders including China Everbright Internatio-nal, China General Nuclear Power Group, China Resources (Holdings), China Shipbuilding Industry Company, the S.F Express Company, Industrial Bank Financial Leasing Company, Chi-na Poly Group, China Gezhouba Group, HSAE, Guangxi Nonferrous Metals Group, Shenzhen MTC, Shen-zhen Tianyuan Dic Information Tech-nology Company, Longgang City Inves-tment&Development, Baoan Con-struction Investment Group, and China Aerospace Science and Industry Corp have entered Qianhai to engage in cross-border loan business for the support of low-cost capital. Based on the pilot program of cross-border RMB loans in Qianhai, the Chinese government has since extended such pilot programs to Xiamen, Quanzhou Experimental Area
of Comprehensive Financial Reform and Fujian (Pilot) Free Trade Zone.
In December 2014, Qianhai Financial Holdings and 6 fi nancial institutions from Shenzhen and Hong Kong arranged the fi rst cross-border RMB syndicated loan in Qianhai, marking the debut and pricing of "Qianhai Concept" and cross-border RMB syndicated loan in Hong Kong interbank market, another milestone in cross-border RMB loans. Now, enterprises in Qianhai can not only raise funds from Hong Kong banks through overseas loans under domestic guarantee and direct loans but also obtain cross-border fi nancing through syndicated loans. Th e arrangement of cross-border fi nancing can signifi cantly cut loan interest rates for enterprises. RMB loans that enterprises obtained from overseas fi nancial institutions are priced according to market interest rates in Hong Kong the level of which is about 10% below the benchmark interest rates set by the central bank in the domestic market. And such loans have opened a channel of overseas fi nancing for enterprises, especially large enterprises.
In comparison with registered volume, the actual amount of loans that have been withdrawn are yet to be increased. In fact, as overseas RMB interest rates climb, the cost of cross-border RMB fi nancing has also risen to shrink the price advantage of cross-border RMB loans.
In addition, the target clients of cross-border loans in Qianhai are enterprises registered in Qianhai most of which are newly set up and have only limited size and credit. Hong Kong banks usually can provide loans to them only with guarantee from domestic banks. Hence, it is more than oft en that only enterprises with high qualifi cations can obtain loans while small and medium-sized enterprises have little access to low-cost loans. In principle, it takes only two work weeks to get loans registered and granted. But the actual procedure for enterprises to withdraw loans is much more time-consuming.
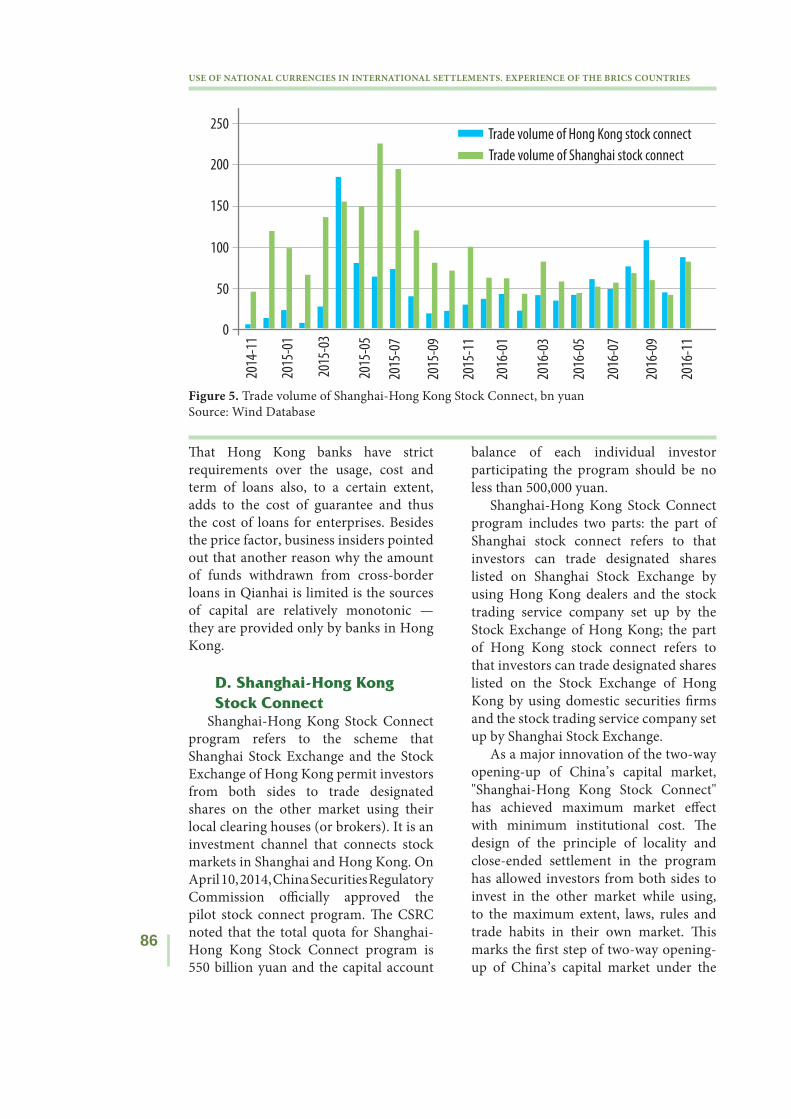
86
USE OF NATIONAL CURRENCIES IN INTERNATIONAL SETTLEMENTS. EXPERIENCE OF THE BRICS COUNTRIES
Th at Hong Kong banks have strict requirements over the usage, cost and term of loans also, to a certain extent, adds to the cost of guarantee and thus the cost of loans for enterprises. Besides the price factor, business insiders pointed out that another reason why the amount of funds withdrawn from cross-border loans in Qianhai is limited is the sources of capital are relatively monotonic — they are provided only by banks in Hong Kong.
D. Shanghai-Hong Kong Stock Connect
Shanghai-Hong Kong Stock Connect program refers to the scheme that Shanghai Stock Exchange and the Stock Exchange of Hong Kong permit investors from both sides to trade designated shares on the other market using their local clearing houses (or brokers). It is an investment channel that connects stock markets in Shanghai and Hong Kong. On April 10, 2014, China Securities Regulatory Commission offi cially approved the pilot stock connect program. Th e CSRC noted that the total quota for Shanghai-Hong Kong Stock Connect program is 550 billion yuan and the capital account
balance of each individual investor participating the program should be no less than 500,000 yuan.
Shanghai-Hong Kong Stock Connect program includes two parts: the part of Shanghai stock connect refers to that investors can trade designated shares listed on Shanghai Stock Exchange by using Hong Kong dealers and the stock trading service company set up by the Stock Exchange of Hong Kong; the part of Hong Kong stock connect refers to that investors can trade designated shares listed on the Stock Exchange of Hong Kong by using domestic securities fi rms and the stock trading service company set up by Shanghai Stock Exchange.
As a major innovation of the two-way opening-up of China’s capital market, "Shanghai-Hong Kong Stock Connect" has achieved maximum market eff ect with minimum institutional cost. Th e design of the principle of locality and close-ended settlement in the program has allowed investors from both sides to invest in the other market while using, to the maximum extent, laws, rules and trade habits in their own market. Th is marks the fi rst step of two-way opening-up of China’s capital market under the
250
200
150
100
50
Trade volume of Hong Kong stock connect
Trade volume of Shanghai stock connect
2014
-11
2015
-01
2015
-03
2015
-09
2015
-07
2016
-11
2016
-09
2016
-07
2016
-05
2016
-03
2016
-01
2015
-11
2015
-05
0
Figure 5. Trade volume of Shanghai-Hong Kong Stock Connect, bn yuanSource: Wind Database

87
THE INTERNATIONALIZATION OF RMB: CHINA’S EXPERIENCE
condition of regulatory transparency and rick control (Figure 5).
By November 2016, Shanghai-Hong Kong Stock Connect has had an aggregate trade volume of 3,565.751 billion yuan among which Hong Kong stock connect contributed 1,263.908 billion yuan and Shanghai stock connect 2,301.843 billion yuan. A review of the achievement of "Shanghai-Hong Kong Stock Connect" shows that, though the overall trade volume is not as large as expected, the program has operated smoothly, standing the test of the volatile fl uctuation in the A-share market while providing a replicable sample for other programs such as Shenzhen-Hong Kong Stock Connect and Shanghai-London Stock Connect.
E. Shenzhen-Hong Kong Stock Connect
Shenzhen-Hong Kong Stock Connect refers to the technology connect built between Shenzhen Stock Exchange and the Stock Exchange of Hong Kong that enable domestic and Hong Kong investors to trade designated shares on the other market by using local securities fi rms or dealers. On December 5, 2016, Shenzhen-Hong Kong Stock Connect was offi cially launched. It has replicated the successful experience of the pilot Shanghai-Hong Kong Stock Connect and served as another connectivity mechanism between the domestic stock exchange and that in Hong Kong. Th e launch of Shenzhen-Hong Kong Stock Connect is another major and meaningful step forward in boosting inter-connectivity between the domestic fi nancial market and that of Hong Kong.
According to offi cial statement, Shenzhen Stock Exchange announced on November 25 altogether 417 shares under Shenzhen-Hong Kong Stock Connect program including 100 from Hong Seng Composite Largecap Index, 193 from Hong Seng Composite Midcap Index,
95 from Hong Seng Composite Smallcap Index and 29 A+H shares beyond these indexes. Th ese shares accounted for 87% of the total market valuation of the Stock Exchange of Hong Kong and 91% of the average daily trade volume. On the same day, the Stock Exchange of Hong Kong announced 881 shares under Shenzhen-Hong Kong Stock Connect program including 267 from the Main Board of Shenzhen Stock Exchange, 411 from the Small and Medium Enterprise Board and 203 from the Growth Enterprise Board, altogether accounting for 71% of the total market valuation of Shenzhen’s A-Share market and 66% of the average daily trade volume.
Till the end of October 2016, more than 1,860 companies have been listed in Shenzhen Stock Exchange with a total market valuation of about 23 trillion yuan. By now, the trade volume has reached 64 trillion yuan, ranking high among all stock exchanges around the world. And the collective characteristic of listed companies in Shenzhen Stock Exchange is innovation and growth.
In retrospect, on the opening day of Shanghai-Hong Kong Stock Connect, investors’ great interest to buy shares at Shanghai stock market contrasts sharply with their lack of interest about buying shares at Hong Kong Stock market. Th e former indicated that the attraction of the A-share market was far bigger than the Hong Kong stock market at that time and a leveraged bull had just started. Two years later, against the background of mounting deprecation pressure on RMB, it is hard to tell where the A-share market will go and if the old success can be repeated.

88
USE OF NATIONAL CURRENCIES IN INTERNATIONAL SETTLEMENTS. EXPERIENCE OF THE BRICS COUNTRIES
Opening-up of interbank market and issuance of Panda bond
By analyzing the opening-up of interbank market, we can clearly see cooperation between RMB interna-tionalization and opening-up of capital account.
China’s interbank market is composed of bond market (including securitization products), paper market, foreign exchange market and interbank loan market. For RMB internationalization, bond market is the most important one. Hence, the interbank market discussed below is mainly about bond market. During the course of RMB internationalization, a key problem has arisen as more and more RMB fl ew into overseas markets and were held by non-residents that is how to provide non-residents with ample RMB investment channels. Inter-national experience indicates that the most important investment channel for an international currency is the capital market of the issuing country including the bond market and the stock market. In terms of promoting RMB internationalization, opening-up of China’s interbank market is to provide non-residents with investment channel to RMB-denominated bonds.
For currency internationalization, the more important value of opening-up of interbank market is to promote the currency to become an international reserve currency. One of the key symbols of successful currency internationalization is that the currency has become an international reserve currency as the US dollar, euro and pound did. Most international reserve currencies will not be saved in the form of cash but exist in the form of bonds denominated with these currencies. And these bonds have three characteristics: First, they have high credit rating and low default risk; Second,
they have better return on investment than cash; Th ird, they boasts high liquidity and can be easily converted into cash. Bonds with these three characteristics will become global safe assets and thus investment targets for many countries as international reserves. From a long-term perspective, opening-up of China’s interbank market is also the process to promote RMB-denominated bonds to become global safe assets and thus make RMB an international reserve currency.
A. Policies to promote opening-up of the interbank bond marketChina began to open the domestic
bond market to overseas institutions in August 2010 when People’s Bank of China adopted a pilot policy to allow foreign central banks or monetary authorities, overseas clearing banks for RMB business, and overseas participating banks for RMB settlement of cross-border trade to invest in the interbank bond market with RMB funds. Th e scope of investors has since been gradually expanded.
Between 2011 and 2012, China Secu-rities Regulatory Commission and People’s Bank of China have released new rules to allow QFII/RQFII to enter the interbank market but the approval procedure remains time-consuming. In March, 2013, aft er issuing "Notice on issues concerning investment in the interbank bond market by qualifi ed foreign institutional investors", People’s Bank of China began to accelerate approval of the entry of QFII/RQFII into the interbank market.
In June 2015, People’s Bank of China allowed overseas clearing banks for RMB business and overseas participating banks for RMB settlement of cross-border trade to invest in repo. In July 2015, People’s Bank of China loosened rules on investment in the interbank bond market by three types of sovereign institutions including foreign

89
THE INTERNATIONALIZATION OF RMB: CHINA’S EXPERIENCE
800 2.7
1.8
0.9
0
600
400
200
Government bond Policy bank bond
Mid-term note
Share of the interbank market (right scale)
Corporate bond
Others
2014
-06
2014
-07
2014
-08
2014
-09
2014
-10
2014
-11
2014
-12
2015
-06
2015
-01
2015
-02
2015
-03
2015
-04
2015
-05
2015
-07
2015
-08
2015
-09
2015
-10
2015
-11
2015
-12
2016
-06
2016
-01
2016
-02
2016
-03
2016
-04
2016
-05
2016
-07
2016
-08
2016
-09
2016
-10
2016
-11
0
central banks or monetary authorities, international fi nancial organization and sovereign wealth funds by abolishing ex-ante approval of access and quota and expanding the scope of investment to include cash bond, bond repurchase, securities lending, bond forward, interest rate swap and forward rate agreement.
Since the beginning of 2016, People’s Bank of China has considerably accelerated opening-up of the interbank bond market in terms of expanding the scope of investors and investment products. In February 2016, China extended access to the interbank bond market to more foreign institutional investors including overseas commercial banks, insurance companies, securities fi rms, fund management companies and other asset management agencies. It also clarifi ed the entry procedure and regulatory measures for foreign central banks and similar institutions, restating that overseas institutional investors are subject to registration management; quota approval is abolished; foreign central banks and similar institutions do not need authorization or approval for outward remittances of funds related to their securities and foreign exchange investment. In April, China’s central bank issued the procedure for foreign
central banks and similar institutions to enter the interbank bond market and foreign exchange market, including more opening-up in terms of investment quota, investment products and free remittance of funds. By October 2016, 207 foreign commercial banks, non-bank fi nancial institutions, investment managers of fi nancial institutions and other institutional investors have entered China’s interbank bond market.
B. Transactions of foreign institutional investors in the interbank market
As China accelerated the pace of RMB internationalization and opened up its interbank market, the number of foreign investors in China’s interbank market has increased rapidly since 2010. By analyzing statistics from People’s Bank of China, we fi nd that the open interest held by foreign institutions and their trade volume are growing amid fl uctuation. In terms of the type of bonds, foreign institutional investors mainly hold rate securities among which government bonds and policy bank bonds accounted for more than 90%. In terms of trade volume, foreign investors have taken an increasingly big share of the interbank
Figure 6. Bonds held by overseas institutions (bn yuan) and their market share (%) Source: People’s Bank of China
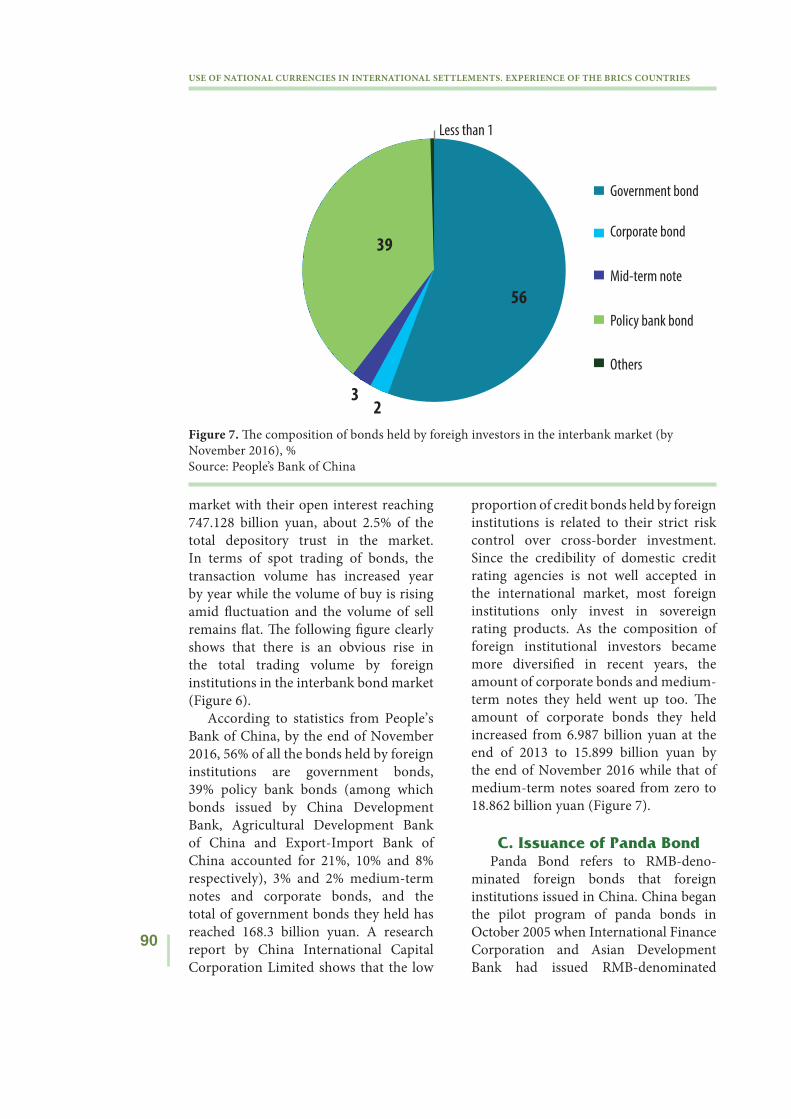
90
USE OF NATIONAL CURRENCIES IN INTERNATIONAL SETTLEMENTS. EXPERIENCE OF THE BRICS COUNTRIES
Government bond
Policy bank bond
Mid-term note
Corporate bond
Others
39
56
Less than 1
3 2
Figure 7. Th e composition of bonds held by foreigh investors in the interbank market (by November 2016), %Source: People’s Bank of China
market with their open interest reaching 747.128 billion yuan, about 2.5% of the total depository trust in the market. In terms of spot trading of bonds, the transaction volume has increased year by year while the volume of buy is rising amid fl uctuation and the volume of sell remains fl at. Th e following fi gure clearly shows that there is an obvious rise in the total trading volume by foreign institutions in the interbank bond market (Figure 6).
According to statistics from People’s Bank of China, by the end of November 2016, 56% of all the bonds held by foreign institutions are government bonds, 39% policy bank bonds (among which bonds issued by China Development Bank, Agricultural Development Bank of China and Export-Import Bank of China accounted for 21%, 10% and 8% respectively), 3% and 2% medium-term notes and corporate bonds, and the total of government bonds they held has reached 168.3 billion yuan. A research report by China International Capital Corporation Limited shows that the low
proportion of credit bonds held by foreign institutions is related to their strict risk control over cross-border investment. Since the credibility of domestic credit rating agencies is not well accepted in the international market, most foreign institutions only invest in sovereign rating products. As the composition of foreign institutional investors became more diversifi ed in recent years, the amount of corporate bonds and medium-term notes they held went up too. Th e amount of corporate bonds they held increased from 6.987 billion yuan at the end of 2013 to 15.899 billion yuan by the end of November 2016 while that of medium-term notes soared from zero to 18.862 billion yuan (Figure 7).
C. Issuance of Panda BondPanda Bond refers to RMB-deno-
minated foreign bonds that foreign institutions issued in China. China began the pilot program of panda bonds in October 2005 when International Finance Corporation and Asian Development Bank had issued RMB-denominated
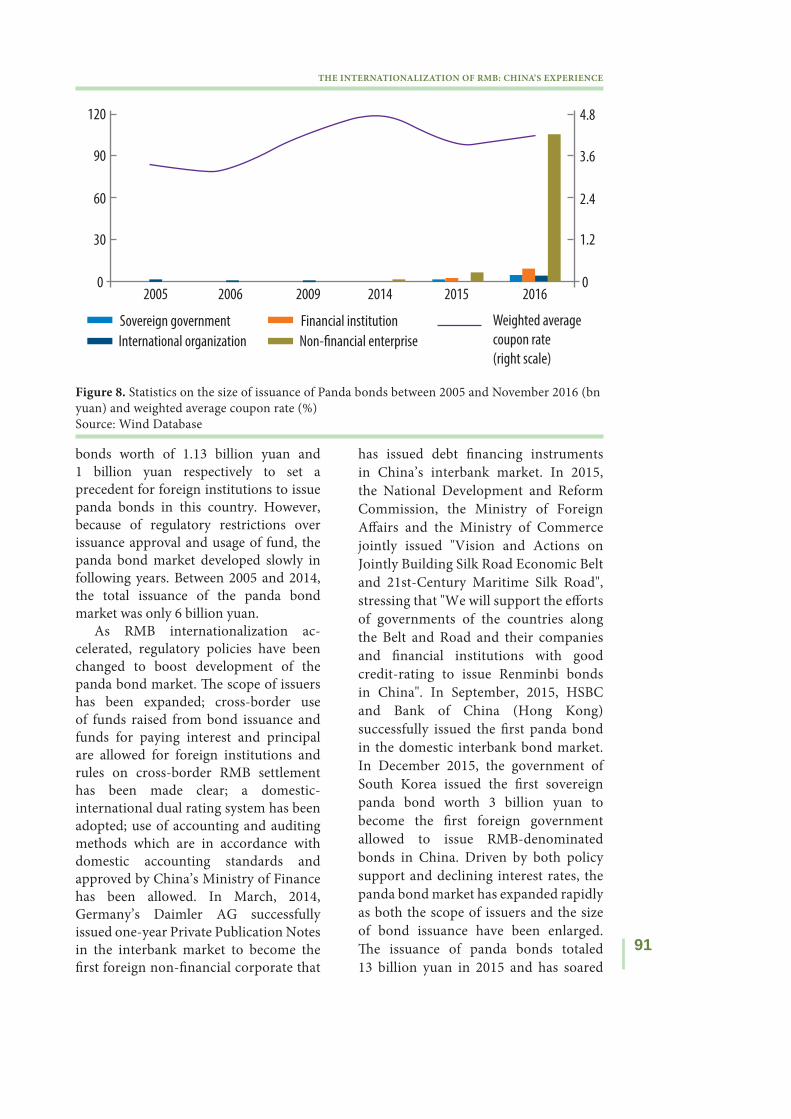
91
THE INTERNATIONALIZATION OF RMB: CHINA’S EXPERIENCE
bonds worth of 1.13 billion yuan and 1 billion yuan respectively to set a precedent for foreign institutions to issue panda bonds in this country. However, because of regulatory restrictions over issuance approval and usage of fund, the panda bond market developed slowly in following years. Between 2005 and 2014, the total issuance of the panda bond market was only 6 billion yuan.
As RMB internationalization ac-celerated, regulatory policies have been changed to boost development of the panda bond market. Th e scope of issuers has been expanded; cross-border use of funds raised from bond issuance and funds for paying interest and principal are allowed for foreign institutions and rules on cross-border RMB settlement has been made clear; a domestic-international dual rating system has been adopted; use of accounting and auditing methods which are in accordance with domestic accounting standards and approved by China’s Ministry of Finance has been allowed. In March, 2014, Germany’s Daimler AG successfully issued one-year Private Publication Notes in the interbank market to become the fi rst foreign non-fi nancial corporate that
has issued debt fi nancing instruments in China’s interbank market. In 2015, the National Development and Reform Commission, the Ministry of Foreign Aff airs and the Ministry of Commerce jointly issued "Vision and Actions on Jointly Building Silk Road Economic Belt and 21st-Century Maritime Silk Road", stressing that "We will support the eff orts of governments of the countries along the Belt and Road and their companies and fi nancial institutions with good credit-rating to issue Renminbi bonds in China". In September, 2015, HSBC and Bank of China (Hong Kong) successfully issued the fi rst panda bond in the domestic interbank bond market. In December 2015, the government of South Korea issued the fi rst sovereign panda bond worth 3 billion yuan to become the fi rst foreign government allowed to issue RMB-denominated bonds in China. Driven by both policy support and declining interest rates, the panda bond market has expanded rapidly as both the scope of issuers and the size of bond issuance have been enlarged. Th e issuance of panda bonds totaled 13 billion yuan in 2015 and has soared
120
90
60
30 1.2
2.4
3.6
4.8
0 0200920062005
Sovereign government
International organization
Weighted average
coupon rate
(right scale)
Financial institution
Non-financial enterprise
2014 2015 2016
Figure 8. Statistics on the size of issuance of Panda bonds between 2005 and November 2016 (bn yuan) and weighted average coupon rate (%)Source: Wind Database

92
USE OF NATIONAL CURRENCIES IN INTERNATIONAL SETTLEMENTS. EXPERIENCE OF THE BRICS COUNTRIES
to 124.82 billion yuan in the fi rst 11 months of 2016.
By the end of November in 2016, altogether 36 foreign enterprises, international organizations and sove-reign governments have issued 79 panda bonds through public or private publication in the interbank bond market and the exchange bond market, including commercial paper, medium-term note, private publication note, commercial bank bond, international institutional bond, corporate bond and private bond. Panda bonds have gradually developed into a new channel of diversifi ed fi nancing for foreign institutions (Figure 8).
In terms of the industrial distribution of the issuers of panda bonds, the issuers have covered 9 major industries including real estate sector, construction, transportation, warehouse and postal service, fi nance and manufacturing. Among them, real estate sector, manu-facturing and fi nance rank among the largest issuers while the number of their issuance accounted for 34%, 20% and 19% of the total and the size of their issuance 42%, 21% and 14% of the total respectively (Figure 9).
More eff orts are needed to explore how to attract more countries and foreign
institutions to issue bonds in the panda bond market, diversify the structure of issuers and promote use of RMB settlement in cross-border trade.
Construction of RMB Settlement System for Cross-border Transaction
A settlement system for cross-border payment is infrastructure construction for internationalization of a currency. China’s original RMB settlement for cross-border payment relied mainly on the two channels of clearing banks for RMB business in Hong Kong and Macao and domestic agency banks both of which would settle accounts by using China National Advanced Payment System, a system consisting of High Value Payment System and Bulk Electronic Payment System. Overseas banks will open RMB settlement accounts in agency banks or clearing banks and transmit cross-border payment information via SWIFT. Due to factors such as the time lapse for running the system and translation of code, the original channel for RMB cross-border settlement is not very effi cient. Besides,
Figure 9. Th e industrial distribution (issuance) of Panda bonds, %Source: Wind Database
Electricity, heat, gas and waterproduction and supply
Real estate
Construction
Transportation, warehouseand postal service
3 4 7
2142
11
14
6
Sovereign government
Manufacturing
Comprehensive trade
Leasing and business service
Finance

93
THE INTERNATIONALIZATION OF RMB: CHINA’S EXPERIENCE
CNAPS cannot separate domestic interbank payment from cross-border RMB payment settlement to ensure the safety of the system.
Since it launched pilot cross-border RMB business in 2009, China has already done cross-border RMB payment bus-iness with 174 countries. Th e amount of RMB settlement in cross-border trade has soared from less than 200 billion yuan in 2010 to 4.4 trillion yuan in the fi rst ten months of 2016, making it impossible to fully meet the need for development of RMB business with CNAPS. It is necessary to integrate the existing RMB payment clearing channel and resources and enhance infrastructure construction for the fi nancial system. To ensure safety, stability and effi ciency of RMB cross-border payment settlement, People’s Bank of China has begun to establish Cross-Border Interbank Payment System in 2012 in line with "Principles for Financial Infrastructure". Th e CIPS (Phase I) was offi cially put into operation on October 8, 20152.
Th e main functions of CIPS (Pha-se I) include providing settlement for RMB cross-border payment by domestic and foreign institutions and supporting RMB cross-border settlement, cross-border direct investment, cross-border fi nancing and personal remittance in the fi nancial market. CIPS can provide participants with highly effi cient cross-border, cross-time-zone, cross-currency payment settlement via its connection with HVPS.
CIPS (Phase I) has raised effi ciency of settlement in following aspects: First, CIPS processes client remittances and remittances by fi nancial institutions in real-time gross settlement with liquidity
2 Construction of CIPS is carried out in two phases, and CIPS (Phase I) provides real-time gross settlement for cross-border trade settlement, cross-border direct investment and other cross-border RMB settlement. CIPS (Phase II) will provide mixed settlement that is more liquidity-saving to comprehensively support RMB cross-border and off shore settlement.
support from HVPS and interbank lending. Second, CIPS provide domestic direct participants with special line access that allows them to have one-point access, concentrate settlement and shorten path of settlement. Th ird, by adopting the internationally-recognized ISO20022 standard for fi nancial services messaging and using the unifi ed and standardized Chinese Commercial Code, CIPS has taken into full consideration the need of code switching with the current SWIFT code to support transmission in both Chinese and English so as to raise the speed of code-switching. Fourth, the operation period of CIPS has been extended from 9:00 to 20:00 to meet the need of the development of RMB business in multiple time zones.
Summary
RMB internationalization faces many challenges today as the country has not yet achieved full capital account convertibility and RMB depreciation expectation is rising. Strengthening cooperation among BRICS countries to promote internationalization of their currencies is not only of vital importance for RMB internationalization but also a major step to propel diversifi ed development of the international monetary system.
Between 2009 and 2016, RMB internationalization has achieved remarkable progress but its foundation for development is not solid. According to statistics from SWIFT, RMB has become the fi ft h largest global payment currency, ranking only behind dollar, euro, pound and yen and boasting a market share of 4%. According to a survey by Bank for International Settlement, the proportion of RMB in global transaction volume has increased from 0.1% in 2004 to 4% in 2016 while its ranking rose from the 35th to the 8th. Clearly, RMB has assumed a crucial role in the international monetary system. But one of the key driving forces to promote RMB

94
USE OF NATIONAL CURRENCIES IN INTERNATIONAL SETTLEMENTS. EXPERIENCE OF THE BRICS COUNTRIES
internationalization under the condition of incomplete convertibility of capital account is the spread of foreign exchange rates and interest rates between domestic and overseas markets. As the exchange rate of RMB approaches the equilibrium level, the spread of foreign exchange rates between domestic and overseas markets gradually disappeared. And the expansion of the daily range of RMB exchange rate fl uctuation has further diminished the room for exchange rate arbitrage between domestic and overseas markets. Before RMB internationalization has an inherent driving force, it is unavoidable that the process will suff er short-term turbulence and even setbacks.
Aft er the "August 11" foreign ex-change rate reform in 2015, RMB internationalization has been in the doldrums for a while. Th e average growth rate of RMB settlement in cross-border trade was 55% between 2010 and 2014 while that of RMB deposits in Hong Kong reached 120%. Nevertheless, between the "August 11" foreign exchange reform and October 2016, the monthly total of RMB cross-border settlement declined from 775 billion yuan to 360 billion, on average down 30% per month over the same period last year. Meanwhile, the amount of RMB deposits in Hong Kong dropped from 1 trillion yuan to 662.5 billion yuan, on average down 25% per month over the same period last year. Th e new issuance of dim sum bonds in 2016 was 46.9 billion yuan and its growth rate declined by 50%. Th ere are mainly three reasons why RMB internationalization was in the doldrums.
First, expansion of the daily range of RMB exchange rate fl uctuation and the change of expectation over RMB appreciation narrowed cross-border exchange rate arbitrage space. Between September 2012 and March 2014, RMB central parity was fi xed relatively lower than onshore and off shore spot rates and onshore spot rate was also relatively lower than off shore spot rate, indicating strong expectation over RMB appreciation.
In March 2014, the daily range of RMB exchange rate fl uctuation enlarged to 2% in both directions. Since then, RMB appreciation expectation has plummeted. Aft er the "August 11" foreign exchange reform, onshore spot rate began to be higher than off shore exchange rate and RMB depreciation expectation emerged. Within just a year, RMB appreciation expectation was replaced by strong devaluation expectation, and a large part of RMB internationalization business based on cross-border arbitrage also declined.
Th ough the proportion of RMB settlement in cross-border trade keeps rising, RMB settlement does not necessarily mean that the trade is RMB-denominated. When the exchange rate of RMB turned from appreciation to depreciation, many domestic importers who had used RMB for settlement would be required by their foreign counterparts to pay in US dollar while domestic exporters were required by foreign counterparts to allow payment in RMB. Besides, when off shore RMB is cheaper, many domestic exporters incline to use US dollar for settlement in off shore markets and then recycle RMB back into the domestic market. Historical data shows that the accumulation of off shore RMB deposits in Hong Kong is largely a result of RMB cross-border arbitrage. As RMB appreciation expectation is gone and two-way fl uctuation of RMB exchange rate widens, there will be less such arbitrage and hence less off shore RMB deposits in Hong Kong.
Second, the cyclical rise of US dollar will reduce the attractiveness of RMB while both domestic and overseas players will tend to hold more US dollars. In 2015, the third quarter statistics showed that the proportion of banks buying foreign exchange to their total foreign receipts declined to 43% while their selling foreign exchange accounted for 67% of their total foreign payment. Th is indicates that enterprises were more willing to hold

95
THE INTERNATIONALIZATION OF RMB: CHINA’S EXPERIENCE
US dollars. On one hand, because the US dollar is on the track of appreciation and overseas exporters prefer settlement in US dollar, Chinese enterprises and importers need to buy foreign exchange from banks for payment and the proportion of bank selling foreign exchange to their foreign payment has thus signifi cantly increased. On the other hand, because of the relative depreciation of off shore RMB in Hong Kong against onshore RMB, it pays for enterprises to buy foreign exchange in the Chinese mainland. As a result, the purchase of foreign exchange by enterprises has increased while their sale of foreign exchange to banks declined.
Th ird, as the RMB fi nancing cost gap between overseas and domestic markets narrows, dim sum bonds become less attractive to domestic enterprises. In the international monetary system, RMB is still a risk currency. In their currency arbitrage strategies, investors tend to use Japanese yen or US dollar as the fi nancing currency and choose Australian dollar or emerging market currencies as the investment currency. As a high-yield risk currency, RMB is more than oft en an investment currency. When expectation on RMB appreciation is strong, investors who hold dim sum bonds can obtain not only interest income but also the potential benefi t of appreciation. When expectation on RMB depreciation prevails, investors who hold dim sum bonds will require higher interest income to make up for the potential exchange rate loss in the future. Hence, the interest rate of dim sum bonds will rise with the depreciation expectation.
Liquidity in China’s monetary market was quite tight in 2013 and many enterprises inclined to issue dim sum bonds in the off shore market. Because of RMB appreciation expectation at that time and relatively higher domestic interest rates, these enterprises were enthusiastic about issuance of dim sum bonds. But as RMB depreciation expectation prevails and domestic short-term interest rates
remain low, onshore and off shore RMB interest rates have gradually converged and domestic enterprises lost their interest in bond issuance in Hong Kong. Th e issuance of dim sum bonds in 2016 was only 46.9 billion yuan, down by 50%. If RMB depreciation expectation persists, the market of dim sum bonds will continue to shrink.
RMB internationalization has entered a new development phase. In a long-term view, China’s huge economic development potential and room for market-oriented reforms as well as the need of a diversifi ed monetary system to support global fi nancial stability would be the fundamental driving forces behind RMB internationalization. However, in the short term, RMB internationalization faces many challenges and needs to adjust its development mode. Whether market players will use and hold RMB is determined by whether they can obtain benefi t or lower risk. Th e recent trend of market change keeps reducing the marginal benefi t of holding RMB. On one hand, there is limited room for RMB appreciation in the short term as China’s economic growth is slowing down, import and export becomes balanced, and RMB exchange rate has basically reached an equilibrium level. On the other hand, there is an about-turn in global liquidity and RMB liquidity and the divergence between China’s monetary policy and the US monetary policy will widen in the future. As a result, the narrowed interest rate gap between China and the US and the rise of US dollar will keep reducing the attraction of RMB. Moreover, since processing trade still accounts for a large share of China’s trade and domestic exporters generally don’t have much pricing power, it is diffi cult to further increase the ratio of RMB-denominated trade. In terms of channels for capital fl ow, offi cial development aids or investments may, to a certain extent, unleash RMB liquidity. But domestic fi nancial institutions’ lack

96
USE OF NATIONAL CURRENCIES IN INTERNATIONAL SETTLEMENTS. EXPERIENCE OF THE BRICS COUNTRIES
of international competitiveness and experience in managing exchange risks has limited their role in promoting RMB internationalization. All evidences show that RMB internationalization has entered a new phase of stable development. China needs to gradually upgrade industrial and trade structure of its real economy in the future to raise the potential of RMB internationalization. Also, during the course to realize full convertibility of capital account, China needs to maintain ample prudential regulatory tools to prevent excessive cross-border capital fl ow.
References
1. Cermeno J. S. Blockchain in fi nan-cial services: Regulatory landscape and future challenges for its commercial application // BBVA Research. Working paper. 2016. No. 16/20. URL: http://www.bbvaresearch.com/wp-content/uploads/2016/12/WP_16-20.pdf
2. Digital Currency // BIS. Committee on Payments and Market Infrastructures. 2015. URL: http://www.bis.org/cpmi/publ/d137.pdf
3. Gao H., Yu Y. Internationalization of the renminbi // Currency inter-nationalisation: lessons from the global fi nancial crisis and prospects for the future in Asia and the Pacifi c // BIS. BIS Papers. 2011. No. 61. P. 105–124. URL: http://www.bis.org/publ/bppdf/bispap61.pdf
4. He D., Habermeier K., et al. Virtu-al Currencies and Beyond: Initial Consi-derations // IMF. Staff Discussion Note. 2016. No. SDN/16/03. URL: http://www.imf.org/external/pubs/ft/sdn/2016/sdn1603.pdf
5. Lagarde C. Fintech — A Brave New World for the Financial Sector? // IMF. IMFBlog. 2017. March 21. URL: http://blogs.imf.org/2017/03/21/
fintech-a-brave-new-world-for-the-fi nancial-sector/
6. Liu D., Gao H., Xu Q., Li Y., Song S. Th e ‘Belt and Road’ Initiative and the London Market – the Next Steps in Renminbi Internationalization. Part 1:Th e View from Beijing // Chatham House. Research Paper. 2017. January. URL: http://www.chathamhouse.org/sites/files/chathamhouse/publications/r e s e a r c h / 2 0 1 7 - 0 1 - 1 7 - b e l t - r o a d -renminbi-internationalization-liu-gao-xu-li-song.pdf
7. Liu D. Internationalization of Chi-na’s Bonds Markets, Development of Off shore RMB Center and Provision of Global Safe Assets // Enter the Dragon: China in the International Financial System / D. Lombardi, H. Wang (eds.) // CIGI Press. 2016. P. 259–290.
8. Liu D. Off shore issuance of China’s Local Government Bond // Zhongguo Jinrong (China Finance). 2016. No. 17. P. 76–77.
9. Song S., Liu D. Th e EIB’s NonCredit Business for Small and Medium Enterprises and Its Implication for the AIIB // Yinhangjia (Th e Chinese Bankers). 2016. No. 10. P. 108–111.
10. Th e future of fi nancial infra-structure. An ambitious look at how blockchain can reshape fi nancial ser-vices // World Economic Forum. An Industry Project of the Financial Services Community. 2016. August. URL: http://www3.weforum.org/docs/WEF_The_future_of_fi nancial_infrastructure.pdf
11. Th orsten K., Jeremy K. Blockchain Technology — What’s in Store for Canada’s Economy and Financial Markets? // C.D. Howe Institute. Com-mentary. 2017. No. 468. URL: http://www.cdhowe.org/sites/default/files/attachments/research_papers/mixed/Commentary_468_0.pdf
12. Wu Y. Analysis of the currency swap approach of the RMB internationalization // Shanghai Jinrong (Shanghai Finance). 2013. No. 4. P. 32–36.

97
TOWARDS NATIONAL CURRENCY USAGE IN INTERNATIONAL TRANSACTION SETTLEMENTS...
Chapter 6
Towards National Currency Usage in International Transaction Settlements: Specific Experiences in BRICS - the Case of South Africa1
The case for SA financial control
South African Reserve Bank exercises fi nancial control in the country (Table 1). Foreign fi rms, fi nancial institutions, offi cial institutions and individuals can hold rand and rand-denominated instruments in amounts they deem useful and prudent. Th ere are no restrictions on foreigners for holding South African rand and rand-denominated instruments. Th e section on capital transactions in Table 1 outlines the requirements for foreigners to hold South African rand and rand- denominated instruments. Th e desire to hold rand and rand-denominated fi nancial instruments stems from the need to access a store of value as a function of the rand (Tavlas, 1992). If this were the case the rand could assume international reserve currency status for those who hold these instruments as a store of value. Th e breadth and depth of the national fi nancial market is a necessary benchmark indicator of the ability of a currency to be utilized as a reserve currency. However, it is not a suffi cient condition to achieve this status as other factors play an equally important role as was demonstrated in the fi nal ascension of the Chinese renminbi to international reserve currency status in 2016 aft er many years of trying.
Any foreign entity wishing to list instruments on the Johannesburg Stock
Exchange requires prior approval of the offi cial Financial Surveillance Department. Any Authorised Dealer wishing to facilitate transactions of the nature outlined above, requires the approval of the Financial Surveillance Department and will have to comply with the specifi c reporting requirements prior to approval being granted.
Institutional investors may not transfer rand off shore. In order for an institutional investor to participate in rand-denominated instrument issued off shore, the rand value would have to be converted to a foreign currency, and the equivalent foreign currency value has to be reconverted back to rand in an off shore market to purchase the desired instrument. Th e initial conversion of rand to foreign currency for the purchase of rand-denominated instruments issued off shore could be hedged locally but the subsequent conversion back to rand to purchase rand-denominated instruments issued off shore poses a price risk and may be hedged either in foreign market or on the JSE by utilising approved foreign-referenced derivative products traded in rand and issued by the JSE2.
All fi nancial institutions should ensure that their investments are in com-pliance with the Financial Services Boards requirements and regulations. Institutional investors are permitted to invest in rand-denominated products
1 Ronney Ncwadi — Nelson Mandela Metropolitan University; Jaya Josie — Human Sciences Research Council.
2 See Corporates // South African Re-serve Bank. URL: http://www.resbank.co.za/RegulationAndSupervision/FinancialSurveillanceAndExchangeControl/FAQs/Pages/Corporates.aspx

98
USE OF NATIONAL CURRENCIES IN INTERNATIONAL SETTLEMENTS. EXPERIENCE OF THE BRICS COUNTRIES
Table 1South African Reserve Bank Summary of Financial Controls
Legal Basis Exchange Control Regulations 1961 (with amendments)Exchange rate agreement Floating Exchange rate
Exch
ange
cont
rol
Residents
A South African resident over the age of 18 years is entitled to special discretionary allowance within an overall limit of ZAR 1 million per calendar year.Th e special Discretionary allowance can also be used for purposes of investment
Resident accounts
A natural person can open a foreign currency account for permissible purposes
Non-Residents Any income earned on investments can be transferred abroad
Non-Resident Accounts Foreign fi rms can open rand accounts
Bank Notes All forex brought from abroad must be exchanged for rand within 30 days of arrival
Export-Import transactions
Transactions settled by an Authorised dealer, usually bank supported by an invoice and customs clearance certifi cation for goods received.Advance payments possible on the strength of an invoice but SARS (Customs) documentation also required if goods exceed ZAR 50,000
Capi
tal T
rans
actio
ns
Residents
Residents can invest up to ZAR 1,000,000 abroad without SARB approval. Outward capital investment of ZAR 1–10 million per calendar year requires clearance from the SARB and SARS (tax).Funds and collective investment schemes cannot invest more than 25% of their portfolios outside of South Africa.An additonal 5% allowance of their total retail is granted for foreign currency denominated African securities. Corporates can invest up to ZAR 1 billion per annum.Any investments > ZAR 1 billion per annum require SARB approval. Also at least 10% of the targets voting rights must be acquired
Non-Residents
Non-residents may freely invest in South Africa, provided that suitable documentary evidence is viewed by the bank concerned, in order to ensure that such transactions are concluded at arm’s length, at fair market related prices and are fi nanced in an approved manner*.(ii) Such fi nancing must be in the form of the introduction of foreign currency or rand from a Non-Resident account (i.e. a rand account opened by a non-resident at a South African bank). (iii) Any income earned on the investment may be transferred abroad.(iv) Should a non-resident disinvest from this country, the local sale or redemption proceeds of non-resident owned assets in South Africa would be regarded as freely transferable. (SARB, 2016)
Resident Loans
Residents can borrow from abroad with conditions**.Can issue loans outside of the CMA provided they are not reinvested or reintroduced as loans in the CMA
Non-Resident outward loans
Local Subsidiaries of foreign companies can only give parent companies loans in lieu of dividends or profi ts and under SARB approval

99
TOWARDS NATIONAL CURRENCY USAGE IN INTERNATIONAL TRANSACTION SETTLEMENTS...
Note: * Foreign fi rms can hold fi nancial instruments provided their schemes are registered with Collective Investment Schemes SA. A foreign investment fund which is so registered may be marketed publicly in South Africa. In order to qualify for South African registration, a foreign fund must have an investment policy which is consistent with the requirements set out under CISCA (Norton Rose Fulbright 2016).** Th e term of the loan must be at least one month. (ii) Th e interest rate in respect of third party foreign denominated loans may not exceed base lending rate plus 2% and in respect of shareholders’ loans the base lending rate of the country of denomination. (iii) Interest rate in respect of rand denominated loans may not exceed prime lending rate plus 3% on third party loans or the base rate, in the case of shareholders’ loans. (iv) In respect of trade fi nance facility loans, interest payments of up to prime plus 10%, which includes shipping and confi rming fees, handling costs, administration fees, bank charges, commissions and raising fees (all-in costs) will be approved. (v) Th e loan funds to be introduced may not be sourced from a South African resident's foreign capital allowance, foreign earnings retained abroad, funds for which amnesty had been granted and/or foreign inheritances. (vi) Th ere may not be any direct/indirect South African interest in the foreign lender. (vii) Th e loan funds may not be invested in Sinking Funds. (viii) No upfront payment of commitment fees, raising fees and/or any other administration fees are payable by the borrower (SARB).
Source: IMF (2014); BIS (2016); SARB (2017)
Table 1 (Th e completion)Li
quid
ity
Spot Transaction
Good
Forward transaction Good (1–6 months)
3 See Guidelines: South African Institutional Investors // South African Reserve Bank. 2016. August 10. URL: http://www.resbank.co.za/RegulationAndSupervision/FinancialSurveillanceAndExchangeCon-trol/Guidelines/Guidelines%20and%20public%20awareness/Guidelines%20South%20African%20Institutional%20Investors.pdf
4 Ibid.
issued abroad, or foreign currency denominated instruments issued by local entities as part of their foreign portfolio investment allowances on a condition that the requirements of the fi nancial services board are met as is the case with respect to investments in any other fi nancial product3.
It should be noted that compliance with the foreign exposure limits on foreign portfolio investment does not preclude an institution from also having to comply with any relevant prudential regulations as administered by the Financial Services Board4.
Foreign assets, for exchange control purposes, are defi ned as the sum of foreign-currency denominated assets and rand-denominated foreign assets acquired indirectly through investment with another domestic institution. To
ensure the consistent classifi cation of fo-reign exposure, institutions are required to report their assets on a look-through basis.
Non-residents may freely invest in South Africa, provided that suitable documentary evidence is viewed by the bank concerned, in order to ensure that such transactions are concluded at arm’s length, at fair market-related prices and are fi nanced in an approved manner. (ii) Such fi nancing must be in the form of the introduction of foreign currency or rand from a Non-Resident account (i.e. a rand account opened by a non-resident at a South African bank). (iii) Any income earned on the investment may be transferred abroad. (iv) Should a non-resident disinvest from this country, the local sale or redemption proceeds of non-resident owned assets in South Africa would be regarded as freely transferable5.
5 See Inward listings by foreign entities on South African exchanges // South African Reserve Bank. Exchange control manual. 2016. URL: http://www.resbank.co.za/RegulationAndSupervision/FinancialSurveillanceAndExchangeControl/EXCMan/Section%20W/Section%20W.pdf

100
USE OF NATIONAL CURRENCIES IN INTERNATIONAL SETTLEMENTS. EXPERIENCE OF THE BRICS COUNTRIES
The case for SA foreign currency management
Th e forex governing authority in SA is the National Treasury under the Minister of Finance and any designated offi ce in the Treasury. Th e exchange controls regulate and restrict the outfl ow and infl ow of capital in South Africa. All forex transactions are subject to these regulations, whether you are traveling, emigrating, immigrating, investing, returning to South Africa, importing or exporting goods and services (Norton Rose Fulbright, 2017). Th e policy applies to the Non-Resident Area being any countries falling outside of the CMA (Swaziland, Namibia, Lesotho).
Exchange controls can take many forms, but their immediate aim is to restrict the buying and selling of a national currency or to preserve foreign currency reserves. Controls might include a ban on the conversion of proceeds of certain assets or by certain categories of person, an obligation to surrender foreign
Table 2Banks authorised to deal in foreign currency in SA
ABSA Bank Limited Investec Bank Limited Albaraka Bank Limited Habib Overseas Bank Limited Bank of Baroda JP Morgan Chase Bank (Johannesburg Branch) Bank of China Johannesburg Branch Nedbank Limited
Bank of India Mercantile Bank Limited Bank of Taiwan South Africa Branch Société Générale
Bidvest Bank Limited Standard Chartered Bank — Johannesburg Branch BNP Paribas SA–South Africa Branch State Bank of India
Canara Bank Th e South African Bank of Athens Limited China Construction Bank, Johannesburg Branch Sasfi n Bank Limited
Citibank, N.A., South Africa Standard Chartered Bank — Johannesburg BranchDeutsche Bank AG, Johannesburg Branch State Bank of India
FirstRand Bank Limited Th e Standard Bank of South Africa Limited
ex-change proceeds to the central or local bank, authorization requirements, quantitative limits or indirect methods. Exchange controls are most commonly imposed because of concerns about outward fl ows, but controls can also be imposed to restrict inward fl ows for e.g. an infl ux of funds that could hurt the economy.
In South Africa, foreign currency is handled by what the Central Bank has designated as Authorised dealers and Authorised dealers with limited authority. Authorised dealers are banks and those with limited authority handle travelling and tourism arrangements. As such the bulk of trading is done by the banks. Most forex trading takes place in the banking sector. Most Authorised dealers are banks, and that it is where forex trading takes place. Below is a list of Authorised Dealers (Table 2).
Th ere is a limited number of Banks that off er direct ZAR/RUB and ZAR/BRL currency pairs. Th e Table 3 is in general agreement with the notion that real and ruble are the least traded currencies
Source: SARB (2016)

101
TOWARDS NATIONAL CURRENCY USAGE IN INTERNATIONAL TRANSACTION SETTLEMENTS...
among the BRIC in South Africa. Th ese are the off erings of the top 5 local banks in South Africa as far as their forex trade is concerned.
Th e explanations of why there are few ZAR/RUB and ZAR/BRL direct trades lie in the calculation the rand foreign currency basket and in sphere of trade in general. Th e trade weights utilised to calculate the rand foreign currency basket attest to the size of ruble trade that takes place because of trade between South Africa and Russia. Th e diagram below refers. Th e Russian ruble is not included in the rand currency basket. Th is might explain why there is weak ruble trade on South African Markets. China, Brazil and India represent 12.46%, 1.37% and 2.01% of the index respectively. Th ese currencies are traded without the aid of a vehicle currency in South African Markets.
Th is diagram illustrates the biggest trading partners for South Africa. China, India, and Brazil are signifi cant in the weighting of the currency index, whereas Russia is not included (Figure 1).
Th e succeeding diagram illustrates a snapshot of rand exchange with BRICS countries for the month of April 2016 (Figure 2). China holds the bulk of the volume, with 79% of rand trade within the BRICS. India and Brazil have 15% and 6% of rand trade respectively in the month. Russia only has 0.6% of rand trade in the
Table 3Direct currency pair for top 5 forex Banks
Bank Ruble Rupee Real Renminbi
ABSA ● ●Standard ● ● ●
Nedbank ● ●FNB ● ●
Capitec
Bidvest ● ● ●
● — Represents where currencies are traded directly. Th e ruble and real are traded via a vehicle currency predominantly the US dollar.
BRICS for the month of April 2016. Th is might explain why Banks do not trade real and ruble without a currency vehicle (US dollar).
Rand as a reserve currency
Being able to invoice South African exports in rand to export partners and third parties constitutes making the rand a reserve currency. A cursory look at the requirements for this and the level of currency restrictions on rand trade shows that as a currency it might not have suffi cient credentials to be a reserve currency anytime soon.
Th e confi dence in the stability of a currency is obviously a necessary qualifi cation. If a currency in question is quite unstable and tends to fl uctuate substantially, it will not work as a store of value. It will also be avoided to use a currency as a unit of account and a medium of exchange in trade and fi nancial transactions due to a signifi cant risk of exchange rate changes. Moreover, once a currency becomes a dominant vehicle currency in foreign exchange markets, the currency will be used as a major international currency due to economies of scale. Specifi cally, the larger the volume of transactions is in foreign

102
USE OF NATIONAL CURRENCIES IN INTERNATIONAL SETTLEMENTS. EXPERIENCE OF THE BRICS COUNTRIES
Figure 1. SA main trade partners: share of total trade, % Source: Authors' calculations based on SARB data (2016)
Figure 2. Average daily rand traded turnover for BRICS economies as of April 2016, % Source: BIS triennal survey (2016)
Euro area
35
United States
15
11
United Kingdom10
Japan
3
Switzerland
2
10
Australia
1
Zambia
Other countries
China
13
79
6
Less than 1
15 China
Brazil
India
Russia
exchange markets, the lower the cost of transactions.
While the world is moving towards integrated fi nancial markets, some restrictions on foreign exchange and capital accounts transactions persist. Th ese restrictions include:
1. Some economies prohibit cross-border trade settlement in their own currency. For example, 3 currencies
used in cross-border settlements include the Hong Kong dollar, Singapore dollar, and Th ai baht.
2. Many economies have some restrictions on foreign exchange or capital transfer, although the level of the strength of the constraints diff er by country.
3. Some economies uphold the real demand principle for foreign exchange

103
TOWARDS NATIONAL CURRENCY USAGE IN INTERNATIONAL TRANSACTION SETTLEMENTS...
hedging in the domestic market and require documentary evidence of underlying transactions.
4. Some economies control the foreign exchange positions of the authorized banks and fi nancial institutions (ASEAN, 2010).South Africa has good macro-
prudential policies. Th e Reserve Bank and treasury are perceived to be independent (Bravura, 2017). Cross-border settlement transactions in South African rand is not prohibited; however, the SARB prefers to have such transactions settled in US dollars instead. Th ere is a level of restriction on foreign exchange and capital transfer as Table 1 illustrates. In addition, the relative small volumes of South African rand used in international trade and other transaction limit its viability as an international reserve currency, and, in fact, presents an important reason for the rand to become part of a BRICS currency and/or payment mechanism for trade and/or other international transactions.
Bilateral trade transactions between South Africa and BRICS economies
South Africa has a large economy in Africa and joining BRICS boosted its geopolitical signifi cance. South Africa is endowed with abundant minerals and natural resources and some sectors are well developed unlike other African countries, these sectors include energy, transport sectors, fi nancial sectors and etc. South Africa’s endowment of natural resources and mineral resource complements BRICS countries such as Brazil’s specialisation in agriculture and raw materials, Russia as a major player specialising in agriculture and raw materials, Russia’s position as a role player in the commodity market, India’s services exporting economy and China’s
recognition as a world’s factory (Galvao, 2013).
South Africa and India share a strong bilateral relationship and the main objective is to expand and diversify trade and economic relations (Lucey and Makokera, 2015). India and China emerged as South Africa’s most important trading partners in BRICS (Onyikwena, Taiwo and Uneze, 2014).
Th e strong trade ties between South Africa and India are linked to its historical and cultural ties. Th ese two countries had a long relationship during South Africa’s liberation struggle. India was the fi rst to enact trade sanctions against the apartheid government in 1946 and established a complete embargo on South Africa. India actively worked for the AFRICA Fund to help sustain the struggle through support to the frontline states (High Commission of India, 2016).
In 1993, at the opening of a cultural centre and consulate in Johannesburg formal relations between South Africa and India was restored. Join Ministerial commission was established by India and South Africa in 1994 in order to identify areas of mutual benefi cial cooperation. Th ree agreements on custom cooperation, science and technology and visa free travel for diplomatic passport holders were signed during the commission seven session that was held in 2008 in Pretoria (High Commission of India, 2016).
Bilateral engagements between South Africa and India have been extended in many ways. In 2010, memorandum of understanding on cooperation in the fi elds of agriculture, air services, and diplomatic academics was signed. President Zuma’s visit to India in 2010 led to the recovery of negotiations on preferential trade area between India and Southern African Customs Union (Sidiropolous, 2011).
Th e bilateral trade between South Africa and India shows that during the GFC, the value of SA trade with India dipped and has recovered in the

104
USE OF NATIONAL CURRENCIES IN INTERNATIONAL SETTLEMENTS. EXPERIENCE OF THE BRICS COUNTRIES
post-crisis period (Figure 3). Notably, South Africa’s exports (goods) to India recovered even though India’s exports (goods) to South Africa were reaching SA’s exports to India.
In the past India has been SA’s most important export destination, as India’s strong demand for gold as a major product (Alves, 2009). China overtook India as a result of its strong demand for primary resources connected to the expansion of the Chinese economy and South Africa’s exports to China grew progressively since the late 2000s.
Between 2013 and 2014, the Export-Import Bank of India reported that South Africa had a share of 3.5% as an export destination of pharmaceuticals (Exim, 2014). A major growth area is pharmaceuticals. In 2013/2014 the Export-Import Bank of India repor-ted that South Africa had a share of 3.5% as an export destination for phar-maceuticals. Nineteen Major Indian investors in South Africa include Tata (automobiles, IT, hospitality and ferrochrome products); the United Breweries Group (breweries, hotels); Mahindra (automobiles); a number of pharmaceutical companies (including
Ranbaxy and CIPLA); and IT companies. Th ere is also Indian investment in South Africa’s mining sector (Ministry of External Aff airs, 2013).
Below Figure 4 shows the values of South African imports from India and India’s imports from South Africa. Since 2004 India’s exports from South Africa were below 4 million US dollars and in 2008, imports started to increase. Th e increase was largely due to South Africa’s rapidly growing demand for its pharmaceutical products and decrease in 2009 due to the global fi nancial crisis (Onyikwena, Taiwo and Uneze, 2014). Th e balance of trade between South Africa and India is largely in favour of India with Indian exports to South Africa much higher.
Bilateral trade between South Africa and India increased by 135% between 2007/08 and 2011/12 and Indian companies have invested USD 328.25 million in South Africa for the period of 2008–12 (Campbell, 2013). In 2016, South Africa and India signed the memorandum of understanding and the focus areas include the establishment of innovation in the area of science and
Figure 3. Values of South Africa’s exports to India and India’s export to South Africa, US dollarsSource: ITC calculations based on UN COMTRADE statistics
7,000,000
6,000,000
5,000,000
2004 2007 2008 200920062005 2010 2011 2012 2013 2014 2015
4,000,000
3,000,000
2,000,000
1,000,000
SA`s exports to IndiaIndia`s exports to SA

105
TOWARDS NATIONAL CURRENCY USAGE IN INTERNATIONAL TRANSACTION SETTLEMENTS...
technology, tourism and program of cultural cooperation (Kilian, 2016).
President Zuma and Prime Minister Modi discussed the historical relations that the two countries share as well as the mutual struggle against colonialism and oppression which has served to forge a strong bond that is further underpinned by a shared worldview (Ministry of External Aff airs, 2016). President Zuma and Prime Minister Modi expressed satisfaction with the current status of bilateral relations. However they emphasised that there is still scope for the further strengthening and deepening of relations in the political, economic, scientifi c and socio-cultural spheres and it was agreed that frequent and sustained contact between South Africa and India in mutually identifi ed areas will serve to maintain the momentum of the bilateral relationship (Ministry of External Aff airs, 2016).
In the discussion, it was mentioned that there is a need to intensify collaboration in the sectors such as defense, energy, agro-processing, human resource development, infrastructure development, science plus technology and innovation. President
Zuma and Prime Minister Modi (2016) further refl ected on the huge potential to increase bilateral trade and to expand investment and agreed that both countries should examine obstacles to the promotion of mutual trade and investment. Th e leaders underlined the importance of strengthening cooperation between business entities of South Africa and India. Th ey identifi ed focus areas for deeper cooperation including manufacturing, mines and minerals, information technology, renewable energy, pharmaceuticals, tourism and fi nancial services. Both leaders invited private sectors to invest in both countries. According to Kilian (2016), President Zuma indicated that both countries set a target of advancing bilateral trade to 18 billion US dollars by 2018. Th ese targets can be achieved if private sector commitments increase while the government focuses on resolving barriers and address constraints related to infrastructure and trade.
Data from the Indian government and the African Development Bank show that bilateral trade between India and Africa rose from 1 billion US dollars in 1995 to
16, 000, 000
14, 000, 000
12, 000, 000
10, 000, 000
2004 2007 2008 200920062005 2010 2011 2012 2013 2014 2015
8, 000, 000
6, 000, 000
4, 000, 000
2, 000, 000
SA`s imports from India India`s imports from SA
Figure 4. Values of South Africa imports from India and India’s imports from South Africa, US dollars Source: ITC calculations based on UN COMTRADE statistics, 2016

106
USE OF NATIONAL CURRENCIES IN INTERNATIONAL SETTLEMENTS. EXPERIENCE OF THE BRICS COUNTRIES
USD 75 billion in 2015. From 2010 to 2015, Nigeria was India’s largest trading partner in Africa with 1.6 billion US dollars export-import volume, followed by South Africa with 1.1 billion US dollars, while Kenya came third and Mozambique fourth (Rao and Kuwonu, 2016). A tight bilateral trade relationship between India and South Africa is visible on the continent with Tata Africa Holding being a highly recognizable Indian company in Johannesburg (Rao and Kuwonu, 2016). Its vehicles, including trucks, semi-trucks and public transportation buses, branded with its red-and-white logos, are common on African roads.
Modi (2016) argued that more than 150 Indian companies were currently operating in South Africa, and both countries had to look at techniques to expand this trade basket.
In 2015, trade between India and South Africa reached ZAR 95 billion and trade with India represented 4.9% of South African imports and 4.1% of exports. South Africa’s trade statistics also showed that India’s exports to South
Africa increased from ZAR 29 billion in 2011 to ZAR 54 billion in 2015, while South Africa’s exports to India increased from ZAR 24 billion in 2011 to ZAR 41 billion in 2015 (Kilian, 2016).
South Africa is pleased with this positive relationship with India as both countries benefi t from this bilateral trade. Both countries value the importance of their bilateral relationship and multilateral engagements through the BRICS engagements. To improve trade relationships between South and India challenges that impede the ease of doing business that are faced in both countries must fi rst be addressed.
In general the major export partners of South Africa are China, United States, European economy, India, Zimbabwe, Namibia, Botswana, Mozambique (Work-man, 2017). Figure 5 shows that despite the debilitating eff ects of the the fi nancial crisis on international trade among BRICS economies, South Africa’s trade with China remained relatively high. During the global fi nancial crisis in 2008 export growth for South Africa with
14, 000, 000
12, 000, 000
10, 000, 000
2006 2007 2008 2009 2010 2011 2012 2013 2014 2015
8, 000, 000
6, 000, 000
4, 000, 000
2, 000, 000
Exports from SA
to Brazil
Exports from SA
to Russia
Exports from SA
to China
Figure 5. Export from South Africa to Brazil, Russia and China, US dollarsSource: ITC calculations based on UN COMTRADE statistics 2016

107
TOWARDS NATIONAL CURRENCY USAGE IN INTERNATIONAL TRANSACTION SETTLEMENTS...
China fell slightly and rose again in 2010. However for the rest of BRICS countries export growth with South Africa has been falling since 2012 until 2015.
Measuring the degree of BRICS multi-lateral international economic integration however, requires a more nuanced network systems approach than a linear bilateral measure of indicators that do not show how integrated the group is as a whole. Kali and Reyes (2007) have developed an IEI systems approach to examine the extent of global integration of a multilateral network. Th e approach may be applied to the BRICS as it measures the network density ratio of all possible links and relationships that are in the group, and reveals the proportion of multilateral relationships relative to bilateral relationships.
Ideally, in a globalized network, the share of multilateral relations relative to bilateral ones should be higher than in a balkanized network. In other words, the sum of the whole of intra-BRICS IEI should be greater than the sum of its parts. Th e extent of multilateralism can be seen through the property of network transitivity, sometimes called clustering, and measures the probability that ‘the partner of my partner is also my partner’. Th e measure provides insight into what is referred to as the "neighborhood" structure of the network. Transitivity in the network means the presence of a heightened number of complex relationships and subnetworks each of which is connected to the others in the system as a whole. Th e measure uses trade statistics to show the structure and evolution of global trade for the number of actual and potential trading partners. It can also show the structure of regional trading, and the infl uence of individual countries and groups in a multilateral network. Th e HSRC BRICS Research Centre is currently adapting the Kali and Reyes (2007) IEI model for application to BRICS multilateral trade and economic relationships. Th e idea is to develop a
measure that can be used to assess the degree of intra-BRICS international economic integration.
References
1. Alves P. India and South Africa: Shift ing priorities // South African Journal of International Aff airs. 2009. Vol. 14. P. 86–109.
2. Annual Report on Exchange Arrangements and Exchange Restrictions // IMF. 2014. September.
3. Asset management in South Africa. Ten things to know // Norton Rose Fulbright. 2014. September 8. URL: http://www.nortonrosefulbright.com/files/asset-management-ten-things-to-know-120505.pdf
4. Forex rates in South Africa // Bidvest Bank Limited. URL: http://www.bidvestbank.co.za/business-banking/forex-services/retail-foreign-exchange-rates.aspx
5. Galvão M. Brazil, Russia, India and China: brand BRIC brings change. 2013.
6. Genberg H. Currency interna-tionalization: analytical and policy issues // Hong Kong Institute for Monetary Research Working Paper. 2009. No. 31.
7. India-Africa: South-South Trade and Investment for Development // Confederation of Indian Industry & World Trade Organisation. 2013.
8. India-South Africa Joint Statement during the visit of Prime Minister to South Africa (July 08, 2016) // Ministry of External Aff airs. Government of India. 2016. July 08. URL: http://www.mea.gov.in/bilateral-docu-ments.htm?dtl/27001/IndiaSouth_Africa_Joint_Statement_during_the_visit_of_Prime_Minister_to_South_Africa_July_08_2016
9. India South Africa Relations // High Commission of India. 2016. February.

108
USE OF NATIONAL CURRENCIES IN INTERNATIONAL SETTLEMENTS. EXPERIENCE OF THE BRICS COUNTRIES
Appendix
Weights for Rand Currency Basket
Country/Area Revised weight
Euro area 34.82
United States 14.88China 12.49United Kingdom 10.71
Japan 10.12Switzerland 2.83Australia 2.04Sweden 1.99India 2.01Republic of Korea 1.96China, Hong Kong SAR 1.48
Singapore 1.40
Brazil 1.37Israel 1.11Zambia 0.80Canada -Total 100
URL: http://www.hcisouthafrica.in/hc. php?id=India-SA
10. Inward Listings // Bravura. URL: http://www.bravura.net/ service/inward-listings/
11. Jianhua G., Zongxin Q., Chao Z., Jiarui Z. Th e Eff ect of Changes in the U.S. Monetary Policy on China’s Capital Market Stability and Trade between China and Korea // International Monetary Review. 2016. Vol. 3. No. 2. P. 14–51.
12. Kali R., Reyes J. Th e Architecture of Globalization: A Network Approach to International Economic Intgration // Journal of International Business Studies. 2007. Vol. 38. No. 4. P. 595–620.
13. Kilian A. South Africa, India boast ‘enormous’ bilateral trade, invest-ment potential — Zuma // Engineering News. 2016. July 8. URL: http://w w w . e n g i n e e r i n g n e w s . c o . z a /a r t i c l e / s o u t h - a f r i c a - i n d i a - b o a s t -enormous-bilateral-trade-investment-p o t e n t i a l - z u m a - 2 0 1 6 - 0 7 - 0 8 /rep_id:4136
14. Lucey A., Makokera C. G. Deepe-ning South Africa–India private-sector relations // Institute for Security studies. ISS Paper. 2015. No. 284.
15. Onyekwena C., Taiwo O., Uneze E. South Africa in BRICS: a Bilateral Trade Analysis // South African Institute of International Aff airs. 2014. Occasional paper. No. 181.
16. Rao P., Kuwonu F. India, Africa rekindle trade ties // Africa Renewal. 2016. November. URL: http://www.un.org/africarenewal/magazine/august-2016/india-africa-rekindle-trade-ties
17. Sidiropoulos E. India and South Africa as partners for development in Africa? // Chatham House. Briefi ng Paper. 2011. March.
18. Tavlas G. S. Vehicle Currencies // Th e New Palgrave Dictionary of Money and Finance / P. Newman, M. Milgate,
J. Eatwell (eds.). L.: Macmillan, 1992. P. 754–757.
19. Tavlas G. S., Ozeki Y. Th e Inter-nationalization of Currencies: An Appraisal of the Japanese Yen // IMF. Occasional Paper. 1992. No. 90.
20. Workman D. Top South African Trading Partners // World’s Top Exports. URL: http://www.worldstopexports.com/top-south-african-import-partners/

109
CONCLUSION
BRICS experience shows that as economic development of its member countries progressed, prerequisites for their local currencies’ internationalization were being formed. Th e GFC once again revealed the instability of a monetary system based on the US dollar and caused an interest in wider usage of BRICS national currencies for this purpose as its member countries (except for South Africa)1 entered the top ten of the world’s largest economies with a total GDP exceeding one trillion US dollars.
However, this idea didn’t gain substantial support, as the share of the BRICS countries in world trade has increased at a slower pace, compared with high growth rates demonstrated by national economies. China is the only BRICS country in the top ten in terms of exports (1st place with 2.3 trillion US dollars or 14.02% in 2015). By the end of 2015, Russia took 15th place (2.11%), India — 19th place (1.62%), Brazil — 24th place (1.17%) and South Africa — 37th place (0.5%)2. In this context, monetary authorities of several BRICS countries preferred to encourage their national exporters for receiving revenue denominated mainly in US dollars or euros. Th is intention was also based on a predominance of resource-based commodity exports priced primarily in US dollars.
Hence, a demand for the currencies of most BRICS countries on international markets was relatively insignifi cant. Moreover, only Russia and South Africa
1 Back then, South Africa was the largest economy in Africa competing for this place with Nigeria.
2 See UN Comtrade Database // United Nations Statistics Division. URL: http:// comtrade.un.org/data
lift ed restrictions on capital transactions by non-residents. However, as can be seen through the experience of South Africa (which has the most developed stock market among the BRICS countries), investment demand alone does not suffi ce for ensuring signifi cant use of a national currency in international settlements.
In summary, the BRICS countries experience allows us to contend that only a well-balanced economic development ensuring an equal implementation of all the prerequisites necessary for an internationalization of national currencies, will provide a solid basis for a substantial increase in their use in international settlements. At the same time, a requirement of meeting the set of preconditions does not preclude governments from implementing of a more active policy aimed both at creation of such conditions and removal of existing administrative barriers that impede a wider use of national currencies in cross-border settlements.
However, practical steps in this di-rection primarily depend on the interest of BRICS monetary authorities in promoting their currencies on the global market. More work is required to convince politicians and policy makers that it is a useful goal to pursue. Nonetheless, the only way BRICS nations can challenge the existing international monetary order is through coordination. Th e BRICS fi nancial regulatory bodies and central banks could be tasked to gauge the feasibility of policy coordination and build consensus towards this goal.
Th e authors of the study consider that following steps could be taken initially on this issue. Firstly, it seems appropriate to focus joint eff orts on pro-
Conclusion

110
USE OF NATIONAL CURRENCIES IN INTERNATIONAL SETTLEMENTS. EXPERIENCE OF THE BRICS COUNTRIES
viding companies engaged in foreign trade from BRICS countries with the same, or lower transaction (compliance) costs, guarantees of settlement and risk management that they currently have in utilizing the dollar, euro or yen. To achieve this goal it will be necessary to encourage trading directly in BRICS currencies that will signifi cantly contribute to lowering costs. At the time direct trading is available only for "RUB/CNY" and "CNY/RND" currency pairs. However, it could be further enriched in the near future with currency pairs characterized by signifi cant volumes of bilateral trade. Th is step has to be augmented with creation and use of hedging instruments in BRICS currency pairs which might allow to reduce risk management costs. During the fi rst stage leading public banks of BRICS countries may function as market makers on currency pairs to provide necessary liquidity.
Widening of Swap Agreements is also of signifi cant interest for foreign exchange. Th ough the BRICS countries have established a Contingent Reserve Arrangement, this arrangement aims to maintain fi nancial stability by providing short-term liquidity support when member countries face international payment pressure. Meanwhile, the currency swap under this arrangement is one between US dollar and local currencies of BRICS, not one among the BRICS currencies. Currently, there are few local currency swap agreements in force (between Russia and China, China and the South Africa). Th is could be the occasion to ensure greater stability to BRICS FX markets. For instance, central banks may utilize swap agreements to anchor expectations in this fl edgling market and limit worries of liquidity risk.
Another avenue of cooperation could be the development of bond markets. BRICS have relied heavily on banks (such as China and Russia) or international capital (such as India and Brazil) for boosting economic growth while the
bond markets of their local currencies are all less developed. Th ough China and Russia boast huge foreign exchange reserves, most of these reserves are invested in the sovereign bonds of the western developed countries. Th is led to currency and maturity mismatching in national fi nancial systems. If eff orts can be made to develop the bond markets of their local currencies and enhance the investment and fi nancing functions of these markets, BRICS will signifi cantly reduce their excessive dependence not only on banks or international capital for fi nancing but also on dollar assets for outbound fi nancial investment.
Th e development of local currencies bond markets contributes both to BRICS economic advancement and the internationalization of their currencies. If there are high-capacity bond markets, non-residents will be confident of opportunity for unrestricted placing their funds in BRICS currencies. This will additionally heighten the interest for making settlements in these currencies. Furthermore, this would meet collateral criteria required for a currency to function as a store of value for other countries. Strengthening BRICS local bond markets also will spur cross-border investments made in local currencies. Th is might redress foreign trade imbalances (at least in part) among BRICS countries. Th e principles of such mechanism are presented in Figure 1.
Joint eff orts to provide interconnected development of BRICS bond markets growth would require coordinated capital account liberalization amongst the BRICS countries. Th is involves, fi rst and foremost, countries having substantial trade surplus with other partners and consequently enjoying the opportunity to accumulate substantial surplus on currency balances. Th e majority of BRICS countries have an experience of issuing such bonds (Indian "masala bonds", Chinese "dim sum bonds", etc.) on Western markets or in Japan (South Africa). It seems appropriate to attract

111
CONCLUSION
their emissions to BRICS stock exchanges. Th is would increase competitive ability of national investment banks responsible for placement of securities.
Along with that, investors from the BRICS countries (institutional investors, fi rst of all) should have an opportunity to buy bonds that are being traded in any other BRICS country. What is more, foreign companies should be allowed to place bonds denominated in BRICS currencies in the internal BRICS markets. At the time China only provides non-residents with such an opportunity (so-called "panda bonds").
For investors, the attraction of local-currency bond markets is determined by multiple factors. Among them, the
risk and yield of bonds is a fundamental factor. In this regard, the rating of credit rating agencies will directly defi ne both whether the bond issuance would be successful, and the cost of bond fi nancing. International credit rating agencies’ activity causes fair criticism from developing countries. Th ere are many examples of politically driven decisions concerned with their credit rating assessments. However, it is these ratings that foreign investors take into account, and this can hardly be changed in the near future even if the BRICS joint rating agency is launched. Within this framework, the use of guarantee-based mechanism looks promising, as it contributes to upgrade ratings of the
FX market
Payments for goods(in the amount of 500 million)
Bond market
Payments for goods (in the amount of 300 million)
Foreign trade
Country B currency purchase (500 million), own currency selling (500 million)
BRICS country A
Revenue (200 million)
Country A currency purchase (500 million), own currency selling (500 million)
BRICS country В
Investments in bonds (200 million)
Figure 1. BRICS internal interaction scheme. Note: currency exchange rates are conditionally assumed at 1:1Alternative bond placement options:а) A company from country А places bonds denominated in the country A currency on the country A market. Investors from country B (fi nancial institutions, primarily) are allowed to acquire them;b) A company from country А places bonds denominated in the country A currency on the country B market. Investors from country B (institutional investors, primarily) are allowed to acquire them. Th e revenue received can be freely repatriated to the country А;c) A company from country А places bonds denominated in the country B currency on the country B market. Th e revenue received can be freely repatriated to the country А

112
USE OF NATIONAL CURRENCIES IN INTERNATIONAL SETTLEMENTS. EXPERIENCE OF THE BRICS COUNTRIES
BRICS companies’ bonds. In this regard, it is worth learning from the experience of the European Investment Bank and its subsidiary European Investment Fund. It also could be advisable for the BRICS countries to set up investment funds with local currencies (operated by the New Development Bank, for instance), with their investment direction and business mode designed according to the actual demand of each BRICS country.
Such practices are already being developed, marking a moving-off in the specifi ed direction. In June 2017 BRICS Ministers of Finance agreed to set up a common sovereign bond Fund totaling USD 10 billion in order to support the BRICS debt markets. Th is was confi rmed at the ninth BRICS Summit held in September: in the Xiamen Declaration leaders of the BRICS countries agreed "to promote the development of BRICS Local Currency Bond Markets and jointly establish a BRICS Local Currency Bond Fund, as a means of contribution to the capital sustainability of fi nancing in BRICS countries..."3.
Th e development of an exchange market and the building of a common BRICS bond market will require wide-ning of cross-border interbank con-nections. Within this framework it would be benefi cial for the BRICS countries to strengthen interbank market cooperation through setting an effi cient BRICS cross-border clearing settlement system (probably, establishing a special company modeled aft er Euroclear) and improving compatibility among national accounting and auditing standards as well as related laws and regulations through consultation.
Launching of a Commodity Exchange or some type of an e-trading platform for trade in goods and derivatives of various kinds can be one more instrument
3 See BRICS Leaders Xiamen Declaration // BRICS 2017 China. 2017. September 4. URL: http : / /br ics2017.org/Engl ish/Documents/ Summit/201709/t20170908_2021.html
contributing to enhancing LCY use in settlements in the BRICS countries. Within BRICS, China and India are major importers of raw materials while Russia and Brazil are major exporters of raw materials. Th is fact could help connect supply and demand among BRICS countries. Consequently, raw material trade could be mediated by setting market prices denominated in local currencies. With appreciable quantity of foreign investors trading on the exchange, this will lead to internationalization of contracts denominated in local currencies.
It is also important to study the views of entities engaged in foreign economic aff airs for a further promotion of the BRICS currencies on the global market. Such studies have been carried out by certain ASEAN and EU countries. Th ese surveys help to identify factors aff ecting a choice of the invoicing and payment currency and contribute to revealing the remaining administrative barriers and other issues that companies may face when using national currencies in their settlements. Data obtained from the aforementioned studies assists to clarify practical steps proposed in this study. For instance, it allows to determine both the FX and fi nancial market instruments which business may need.
Along with the above-mentioned fi elds of cooperation shared by all study authors a number of particular proposals were also made by individual research participants.
Brazil
Brazillian experts advocate for creating an intra-BRICS joint payment system based on the SML principles. Companies integrated to supply chains within BRICS could be fi rst to drive a pilot implementation of this system.
Granting to companies the right to use a currency which is most suitable for them (including US dollar) is regarded as an essential condition for putting this

113
CONCLUSION
initiative into practice. Further widening the practice of using national currencies in international settlements is associated with providing users of the payment system with additional incentives from government, including tax benefi ts.
Russia
Experts from the Russian Institute for Strategic Studies propose to reach a common understanding within the BRICS on an issue whether the currency of exporter or importer will be accepted as an invoicing currency. When that issue is solved it will greatly simplify a development of instruments aimed at encouraging settlements in national currencies.
Using the importer’s currency has certain benefi ts but also creates additional risks. First of all, it requires ensuring eff ective absorption of a national currency amount that remains abroad. Otherwise its massive exchange may have a destabilizing eff ect on the FX market and lead to a multiple depreciation.
Within this framework, the most suitable principle is that the price of foreign trade contracts should be established in the exporter’s currency. Risks of accumulating local currency balances in this case are mitigated to a certain extent as the volume of exports limits the demand for foreign exchange. Taking into account dependence of export revenues from extractive industries (Brazil, Russia, South Africa), one more necessary condition for a large-scale shift of the BRICS countries to settlements in their national currencies is exports diversifi cation.
India
Experts from National Institute of Public Finance and Policy, New Delhi, take the view that it may not be feasible to enhance LCY use on a large scale due to
the lack of capital account convertibility of BRICS currencies in the coming years.
Th erefore as a fi rst step, BRICS countries could follow the Hong Kong example and pilot such a scheme as a fi nancial special economic zone or international fi nancial center where capital controls are relaxed. Th e SEZ/IFC based approach seems to be the best way to proceed as it allows countries to move towards capital account openness at their own pace while permitting quick market development with limited downside risk. Joint development of fi nancial SEZs/IFCs for the purposes of currency internationalization in the BRICS countries also provides an opportunity to additionally pilot a unifi ed regulatory framework that could be matched to global standards to enable fi rms to easily adopt the new LCY settlement and risk management.
China
Experts from the Institute of World Economics and Politics, the Chinese Academy of Social Sciences are of opinion that establishing the BRICS cross-border interbank payment system on the basis of Blockchain technology might be a key step of BRICS cross-border fi nancial infrastructural construction. Such infrastructure would not only signifi cantly improve the effi ciency of cross-border interbank payment among the BRICS countries but also exert a fundamental impact on the international monetary and fi nancial system.
Given that Blockchain is safe, trans-parent, distributed and tamper resistant, the trust model between fi nancial systems would no longer rely on intermediation and many banks will establish "decentralized" ties and realize real-time digital transactions. Th e removal of the intermediary link of the third-party fi nancial institution means cross-border

114
USE OF NATIONAL CURRENCIES IN INTERNATIONAL SETTLEMENTS. EXPERIENCE OF THE BRICS COUNTRIES
payment will no longer depend on such systems as SWIFT and CHIPS.
South Africa
Experts from Nelson Mandela Metropolitan University and Th e BRICS Research Center, Human Sciences Research Council agree that exploring the feasibility of a common payment mechanism in and amongst the BRICS countries is important. Th is will not only start a long way to consolidating intra-BRICS trade and investment rela-tions, but also promote a more balanced multilateral trade, investment and international fi nancial regime from which other emerging and developing economies may benefi t.
As a long-run objective adopting a BRICS single currency could be regarded. Th is would take integration a step further towards much closer economic alliance. Consequently, it demands extensive preparations — economic and legal con-vergence. In that regard this research could be seen as a starting point for a multilateral project which will draw upon expertise from various fronts including political, legal, central banks, fi nancial and other relevant institutions.