IFC Bulletin - Bank for International Settlements
968
Irving Fisher Committee on Central Bank Statistics IFC Bulletin No 52 Bridging measurement challenges and analytical needs of external statistics: evolution or revolution? Proceedings of the IFC Conference on external statistics, Lisbon, Portugal, 17-18 February 2020 October 2020
-
Upload
khangminh22 -
Category
Documents
-
view
1 -
download
0
Transcript of IFC Bulletin - Bank for International Settlements

Irving Fisher Committee on Central Bank Statistics
IFC Bulletin No 52
Bridging measurement challenges and analytical needs of external statistics: evolution or revolution?
Proceedings of the IFC Conference on external statistics, Lisbon, Portugal, 17-18 February 2020
October 2020

Proceedings of the IFC Conference on external statistics on “Bridging measurement challenges and analytical needs of external statistics: evolution or revolution?”, co-organised with the Bank of Portugal and the European Central Bank, in Lisbon, Portugal, on 17-18 February 2020.
The views expressed are those of the authors and do not necessarily reflect the views of the IFC, its members, the BIS and the institutions represented at the meeting.
This publication is available on the BIS website (www.bis.org).
© Bank for International Settlements 2020. All rights reserved. Brief excerpts may be reproduced or translated provided the source is stated.
ISSN 1991-7511 (online)
ISBN 978-92-9259-421-3 (online)

IFC Bulletin No 52 iii
Bridging measurement challenges and analytical needs of external statistics: evolution or revolution? IFC Bulletin no 52 October 2020 Proceedings of the IFC Conference on external statistics, co-organised with the Bank of Portugal and the European Central Bank (ECB) Lisbon, Portugal, 17-18 February 2020
Conference overview Central banks and external statistics: evolution or revolution? Paula Menezes, Bank of Portugal Fausto Pastoris, Carmen Picon-Aguilar, Martin Schmitz and Nuno Silva, ECB Bruno Tissot, Bank for International Settlements (BIS)
Introductory speech Carlos da Silva Costa, Governor, Bank of Portugal
Keynote The analytical contribution of external statistics: addressing the challenges Philip R Lane, Member of the Executive Board, ECB
1. Evolution or revolution?Need for new satellite accounts in international accounts statistics Mher Barseghyan, Central Bank of Armenia
Revisiting the investment income balance. What makes some EU countries different? Duncan van Limbergen, Netherlands Bank
The system of the presentations of the external sector statistics, strategy and the way of future development Natalia Kupriianova and Nataliya Osiptsova, Bank of Russia
Double-entry bookkeeping and the balance of payments: the need for a substantial, conceptual reform Edoardo Beretta and Alvaro Cencini, Università della Svizzera italiana and Franklin University Switzerland
The weight of a Libra: are stablecoins a new challenge for external statistics compilers? Alessandro Croce, Marco Langiulli and Giuseppina Marocchi, Bank of Italy
Early Warning System (EWS) informative flow weaknesses and opportunities – the Italian experience Chiara Orsini and Simone Ambroselli, Italian National Institute of Statistics

iv IFC Bulletin No 521
Foreign exchange derivatives and currency mismatch in Irish investment funds Benedetta Bianchi and Giovanna Bua, Central Bank of Ireland
Issues in the compilation and analysis of remittances in BPM6 Blessing Adada Gaiya, Central Bank of Nigeria
2. Addressing users’ needs International integration and statistical challenges: the intersection between policy and measurement needs Paul Austin, Gabriel Quirós-Romero and Jennifer Ribarsky, International Monetary Fund
Globalisation and communication – addressing user needs and making our external economy data more comprehensible Caroline Bo and Casper Winther, Statistics Denmark
Macroprudential liquidity stress tests using BIS locational banking statistics Nikolaos Georgiopoulos and Carnell Lambert, Bermuda Monetary Authority
What value added in the trade balances of euro area financial centres? Virginia Di Nino and Anna Ekstam, European Central Bank
3. Compilation practices Developing an extended and more agile external accounts program Jennifer Withington, Statistics Canada
Empowering external statistics – how to deal with blurred data sources? Ana Mitreska, Sultanija Bojcheva-Terzijan, Dejan Stankov and Boban Neshkovikj, National Bank of the Republic of North Macedonia
The advantages of data sharing: the use of mirror data and administrative data to improve the estimation of household assets/liabilities Daniel Sánchez, Bank of Spain
Measuring digital trade in bop – a supplementary estimate of private households’ digital purchases using internet data Annette Meinusch and Benny Hessel, Deutsche Bundesbank
Changes in the structure of multinational groups – a challenge for external statistics compilers Nadia Accoto, Giuseppina Marocchi and Silvia Sabatini, Bank of Italy
4. Multinational enterprises Understanding the presence of MNEs in Ireland as an end user Jenny Osborne-Kinch, Caroline Mehigan and Maria Woods, Central Bank of Ireland

IFC Bulletin No 52 v
Bilateral capital flows: gravity, push, and pull Rogelio Mercado Jr, The South East Asian Central Banks SEACEN Research and Training Centre
Special purpose entities: a visit outside of the common set of residency and economic ownership Péter Bánhegyi, Magyar Nemzeti Bank
On the re-evaluation of the air transport activity in a globalised environment Marios Papaspyrou, Bank of Greece
Globalisation and the reach of multinationals: implications for portfolio exposures, capital flows, and home bias Carol Bertaut, Beau Bressler and Stephanie Curcuru, Board of Governors of the Federal Reserve System
5. Foreign direct investment Luxembourg, the chain of direct investment ownership and the residence principle Paul Feuvrier, Central Bank of Luxembourg
Foreign direct investment – using network analysis to understand the position of Portugal in a global FDI network Filipa Lima, Flávio Pinheiro, João Falcão Silva and Pedro Matos, Bank of Portugal
Differences in measuring FDI: do they matter for our economic conclusions? Konstantin M. Wacker, University of Groningen
Asymmetries along the chain of round-tripping investment Krzysztof Makowski, Narodowy Bank Polski

IFC Bulletin No 52 1
Central banks and external statistics: evolution or revolution?
Paula Menezes,1 Fausto Pastoris, Carmen Picon-Aguilar, Martin Schmitz, Nuno Silva2 and Bruno Tissot3
Executive summary
Globalisation is posing important challenges to external statistics. The removal of national barriers induced by economic and financial liberalisation has made it harder for statisticians to promptly and correctly capture trade and cross-border financial and capital flows. These measurement challenges have been reinforced in recent decades by rapid digital innovation, the complexity and limited transparency of multinational corporate structures, and the increased importance of global financial centres.
A prominent feature has been the fragmentation of global production chains, which has altered the relevance of “traditional” residency-based statistics, while also affecting national economic indicators. Another important consequence of globalisation has been the changing nature of foreign direct investment (FDI): today, dominant FDI transactions are often financial in nature, instead of being motivated by “real production” considerations as in the past.
Promoting constant interaction between compilers and users of data is the key to understanding and addressing these kinds of challenges. Such an exchange of views is crucial, not only on a daily basis to respond to urgent requests, but also structurally to address medium- and long-term data requirements. As both producers and users of external statistics, central banks are ideally placed to foster this dialogue and facilitate a mutual understanding of the evolving needs to support policymaking.
One fundamental question is whether the multipurpose analytical tool provided by external statistics should be simply adapted or radically transformed to address the above-mentioned issues. The experience of central banks suggests that a progressive and flexible approach might be a preferred option, considering in particular the limited resources devoted to official statistics, competing priorities, and the fact that the challenges faced differ across countries. Another important consideration is that a number of alternative ways can be effectively developed in the medium term to adapt the current external statistics compilation framework.
1 Statistics Department, Bank of Portugal ([email protected]). 2 External Statistics & Sector Accounts Division, Directorate General Statistics, European Central Bank
(ECB) ([email protected]; [email protected]; martin.schmitz@ ecb.europa.eu; [email protected]).
3 Head of Statistics & Research Support, Bank for International Settlements (BIS), and Head of the Secretariat of the Irving Fisher Committee on Central Bank Statistics (IFC) ([email protected]).
We very much thank Peter van de Ven and Gabriel Quirós-Romero for their helpful comments and suggestions.

2 IFC Bulletin No 52 1
First, the ongoing review of international standards represents a key opportunity to facilitate the development and compilation of supplementary data to better measure international flows in goods and services, as well as cross-border financial transactions and positions. Particular attention could be devoted to the type of nationality-based information derived from consolidated accounting frameworks, which can usefully complement the residency-based structure underpinning official statistics.
Second, the infrastructure supporting statistical compilation work needs to be enhanced. The search for additional information sources should go hand in hand with new compilation methods to increase the scope and quality of the statistics produced. This would also benefit from the development of global identifiers, the better interlinking of the different data sets available, and the increased sharing of information between compilers – including confidential data. In particular, effective data-sharing possibilities are essential to make use of the information collected for administrative/supervisory purposes that is not collected primarily for the compilation of official statistics. At the international level, stronger cooperation among national authorities and with international organisations could also be instrumental to support “mirror data” exercises or compile nationality-based indicators.
Third, official statisticians should devote specific attention to the analysis of large and global corporate groups/structures. A key reason has been the ability of such entities to swiftly adapt their global operations in response to business conditions, especially in terms of economic, financial, fiscal and regulatory factors. This calls for the ability to isolate and precisely measure multinational enterprises (MNEs), possibly through the organisation of comprehensive data collections, at both national and international levels.
Fourth, compilers of external sector statistics should be invited to present more granular data for the aggregates currently compiled – for instance by separately identifying special purpose entities (SPEs) as well as foreign-controlled corporations in the sectoral accounts, and by providing greater currency composition information. To facilitate this, the production of macro-level statistics would need to better integrate available micro-level sources. And a better use could be made of “alternative” data that are already collected but not integrated into the current central statistical framework.
Fifth, the FDI concept should be revisited in order to maintain its relevance as an analytical tool. A better understanding of the (new) role of FDI requires going beyond its standard analysis and promoting different presentations, especially through a better identification of ultimate investors and of the role of SPEs.

IFC Bulletin No 52 3
Introduction – Globalisation and external statistics
Globalisation poses important challenges to external sector statistics, from their compilation to their use. Reflecting easier and faster transport and communication, increased trade and financial liberalisation, and the establishment of global value chains (GVCs), globalisation could be a cyclical process and may well recede. In particular, the impact of the Covid-19 pandemic remains to be seen and could lead to some corrections down the road. But the difficulties posed to statisticians and policymakers are unlikely to disappear soon, not least because they have been reinforced by digitalisation and the dematerialisation of various economic activities (BIS (2017)).
Against this backdrop, the Bank of Portugal, the European Central Bank (ECB) and the Irving Fisher Committee on Central Bank Statistics (IFC) of the Bank for International Settlements (BIS) organised a conference on “Bridging measurement challenges and analytical needs of external statistics: evolution or revolution?” (Lisbon, 17–18 February 2020). Participants from about 70 organisations including central banks, national statistical institutes/offices, international organisations, the private sector and academia convened to jointly analyse current challenges in this area and exchange their experience.
The conference proved to be another important milestone in the IFC’s ongoing work to explore issues posed by external sector statistics to central bank statisticians – especially in finding appropriate sources, developing new methodological concepts and techniques, compiling policy-relevant indicators and making use of them (IFC (2017a, 2018)). From this perspective, the event provided a welcome opportunity to highlight existing best practices and potential opportunities, as well as to take stock of the challenges to be addressed as a priority in the context of the forthcoming revision of the international statistical standards, particularly as regards the balance of payments (BoP).4
A key point, emphasised in the introductory speech by Bank of Portugal Governor Carlos da Silva Costa, is that the best way to understand and address the above issues is to promote constant interaction between users and producers of statistics. This is essential, in particular, to explain the concepts behind external sector data, underpin a mutual understanding of the evolving needs, adapt the statistical production chain to address the user demand for new indicators, and facilitate the functioning of the entire network of data compilers, researchers, analysts and policymakers relying on this kind of information.
Yet another fundamental point is whether the multipurpose analytical tool provided by external sector statistics should be simply adapted or radically transformed. In other words, would a progressive evolution be sufficient or is a revolution warranted? The senior panel of users invited at the conference to answer this question provided a mixed view. They acknowledged that the current statistical framework faces a difficult “trilemma”: it cannot adequately encompass good data to measure all at the same time globalisation, regional trade aggregates and national
4 In March 2020, the UN Statistical Commission and the IMF Committee on Balance of Payments
Statistics (BOPCOM) decided to launch, respectively, the revision of the SNA 2008 (with a specific focus on globalisation; digitalisation; and welfare and sustainability) and of the Balance of Payments and International Investment Position Manual Sixth Edition (BPM6), with a target date of 2025; see also European Commission et al (2009) and IMF (2009).

4 IFC Bulletin No 52 1
indicators. But they also felt that the framework could be properly adapted to address the challenges and opportunities brought by the past decades of increased globalisation. The way to go is to focus on a few key areas: taking a global perspective when measuring the footprint of MNEs; extending and reinventing the FDI concept; better measuring ultimate exposures and the transfer of risks across national boundaries; and providing a comprehensive view of the global flow of funds5 underpinning the functioning of the world economy.
Looking forward, what should be the medium-term strategy to make progress on all these objectives and enhance the external statistics compilation framework? In his keynote speech, Philip Lane, member of the ECB Executive Board, outlined the following main action points (Lane (2020)):
(i) Enhancing the infrastructure supporting statistical compilation work. For instance, the use of global identifiers for firms, such as the legal entity identifier (LEI) developed under the auspices of the G20, would bring transparency and facilitate the distinct identification of legal entities and their link to ultimate parents (LEIROC (2016)). Another avenue would be to develop the use for statistical purposes of “alternative” data derived from administrative and business registers (Bean (2016)).
(ii) Improving the exchange of confidential statistical data, including by reviewing the underlying legal basis. In the European Union, for instance, current confidentiality frameworks could be adapted to facilitate the sharing of data for statistical purpose within the European System of Central Banks (ESCB)/European Statistical System (ESS).
(iii) Organising a comprehensive data collection for the largest MNEs. Reflecting the importance of these firms in the global economy and the associated measurement challenges, one could for instance develop a centralised collection of data covering the top 500 MNEs in the European Union – similar to what is already done for the financial sector as regards the 120 significant and 4,000 less significant banks within the framework of the EU’s banking supervision.
(iv) Enhancing the granularity of the external sector aggregates currently compiled. This would facilitate the analysis of risk exposures as well as of the activities of purely internationally oriented entities, for instance by separately identifying SPEs as well as foreign-controlled corporations in the sectoral accounts and by refining the breakdown of the non-bank financial sector.
(v) Complementing the residency-based framework underpinning the System of National Accounts (SNA) with information derived from consolidated accounting frameworks. The upcoming revision of the international statistical standards opens up the opportunity to make better use of the consolidated information available for corporate groups. In particular, nationality-based statistics could be developed, by which each affiliate of a given group would be assigned not to its own country of residence but to the country of this group’s headquarters. Such an approach would be helpful in analysing the role of MNEs and identifying the transfer of risks as well as ultimate risk exposures (IAG (2015)).
5 See Zhang and Xiuzhen (2019) for a recent measurement exercise of the global flow of funds.

IFC Bulletin No 52 5
A. Evolution or revolution?
Is the current framework of external statistics outdated?
The challenges brought about by globalisation are manifold (UNECE (2011), OECD (2013)). First, well established statistical concepts have become blurred and may sometimes lead to misinterpretation, for instance due to the impact of sizeable intragroup operations on the measurement of FDI, the consequences of production segmentation on the recording of trade flows, and the implications of MNEs’ cross-border operations on economic growth aggregates. Second, complexity is increasing, making it more and more difficult for official statisticians to properly measure important economic developments because of intertwined trade flows, firms’ opaque balance sheet structures and complicated financial transactions. Yet a third important challenge is the diminishing ability of traditional economic indicators to answer acute policy questions – to assess, for instance, the impact of global developments on the domestic economy, the associated vulnerabilities for resident units etc. As argued by Withington (2020) in the area of trade, statisticians must not only measure specific variables (eg what is exported?), but also need to provide information on the interrelations between economic agents (eg who is trading with whom?) and the associated impact (eg what are the associated vulnerabilities and risks?). Globalisation is clearly making these tasks more challenging.
While the ebbs and flows of globalisation might be cyclical, the challenges posed to statisticians are unlikely to disappear. In fact, these challenges may well get bigger. As analysed by Croce and Langiulli (2020), the emergence of digital currencies has the potential to fundamentally modify money and payment systems – with associated new financial instruments influencing statistical measures in a full range of areas, including international remittances, trade, taxes, banking intermediation etc. Attention has also focused on the difficulties posed to the assessment of countries’ external positions, a key source of potential financial crises if history is any guide. One example is how to interpret the very large and growing imbalances in current accounts and net international investment positions (IIPs) recorded over the past few decades. While this could reflect an underlying increase in vulnerabilities, it may also be caused by statistical artefacts. In any case, such issues need to be carefully analysed given the potentially important policy implications that are at stake.
Certainly, official statisticians have made important efforts to try to address these issues. Compared with only a few decades ago, policymakers and researchers have at their disposal richer and more granular external statistics, leading to diversified insights and providing the needed agility to answer new demands. In particular, a wealth of additional information from geographical and sectoral breakdowns has been made available in recent years in non-financial and financial accounts, which can help when studying and assessing the causes and effects of globalisation and related policy implications (IFC (2020b)). For instance, the bilateral geographical information now published by several countries in their BoP data sets can be used to analyse the role of the factors driving financial flows and regional integration, such as gravity and push/pull factors (Mercado (2020)).
Yet important challenges remain, underlining several shortcomings in the current framework for compiling external statistics. The recording of the trade balance has become particularly difficult because of the high share of imported products used as inputs in the production of exported goods and services, and the

6 IFC Bulletin No 52 1
rising importance of cross-border production arrangements and merchanting (ie goods bought and sold by a resident unit without crossing the merchant’s economy). Another limitation relates to the measurement of income in the current account balance. This is linked to the fact that accounting for the external wealth of the residents of an economic territory is increasingly difficult given the growing role of third-party holders of financial assets – in particular, investment funds and global custodians located in offshore financial centres, often characterised by relatively limited statistical infrastructure and strong data confidentiality practices. Moreover, and unlike the methodology followed for FDI,6 retained earnings may not be allocated to the ultimate holders of other cross-border investments, even if they are reflected in the accumulation of external wealth. Furthermore, while the measurement of IIPs exclusively follows the residency-based SNA approach, information on an ultimate owner basis would be needed to fully understand the true balance sheets and exposures of domestic units. This challenge has been accentuated in recent decades by the increased complexity of cross-border corporate structures and the growing importance of global financial centres hosting firms‘ headquarters/fund-raising affiliates.
A brand new framework for external statistics?
In view of these challenges, one may wish to adopt a revolutionary approach and build a new, better-suited framework for external statistics. As argued in the presentation by Beretta and Cencini (2020), such a conceptual reform could be needed because the statistical principles underlying the SNA framework – especially the double-entry bookkeeping convention, by which all imports of trades and financial transactions should match exports – may not work in practice, due to the heterogeneity in data sources and compilation methods. This has led to a sharp expansion of net errors and omissions in the past few decades, and the related surge in the global current account balance (which should ideally be at zero). One (expensive) proposal would be to compile the BoP based on a bookkeeping account of all the external transactions of a country, with a centralised body being tasked to report all the commercial payments and their related financial operations so as to ensure full accounting identity at all times.
Another revolutionary approach would be to disregard the current residency-based approach underlying the SNA, which relies on the assumption that in compiling national GDP, it is possible to adequately define both the decision-making unit and the currency area. However this “triple coincidence” of national territory, decision-making unit and currency area is increasingly being questioned with the fading of the division line between resident and non-resident units (Avdjiev et al (2015)). One alternative approach would be to compile so-called nationality-based statistics – the nationality of a firm being defined as the country of residence of its controlling entity (Tissot (2016)). This would allow corporate balance sheets to be considered on a consolidated basis, by including all the activities performed by groups of a given nationality, independently of the location of their controlled affiliates. Such information could be instrumental in facilitating the monitoring of global, “borderless” corporate indicators and in tracking GVCs, elucidating MNEs’ role in channelling investment across borders, and assessing the distribution of financial
6 See SNA 2008 #12.113-21.40 for the specific treatment of undistributed earnings in FDI as reinvested
earnings and thus direct investment.

IFC Bulletin No 52 7
exposures at the global level. For instance, this approach would help to overcome the challenges resulting from the treatment of SPEs as domestic institutional units separated from their foreign parent groups as well as from the assessment of economic ownership in the case of intragroup transfers of intangible assets (eg intellectual property products (IPPs); see SNA 2008, #15.148).
While a number of arguments support radical changes in the framework for external sector statistics, several factors suggest that a more progressive and flexible approach would be preferable. A first point relates to resources. There are many pressing priorities for official statistics, and it is not clear whether the benefits of a fundamentally new framework would outweigh its costs. The implementation of current international statistical standards has required important capacity-building efforts, and many countries have yet to adopt the existing manuals. Building a completely new framework would be quite costly and would presumably be considered as a low priority in view of competing policy needs (eg environmental and sustainable development issues, and more recently the consequences of the Covid-19 pandemic).
A second, related point is that the challenges faced by external sector statisticians are not the same across countries, as emphasised by Austin, Quirós-Romero and Ribarsky (2020). The distortions posed by globalisation are particularly felt by the large advanced economies, small open economies, and the most important emerging market economies (EMEs); but these issues may not be so relevant for the less developed countries that are barely involved in globalisation. This heterogeneity is compounded by very diverse national situations in terms of resources, available data sources, and statistical literacy; developing a flexible approach would thus appear to be quite effective to adapt to such domestic features.
A third factor to consider is that there are alternative ways of adapting the current framework and addressing, at least to some extent, some of the challenges facing external sector statistics. The conference proved a useful opportunity to discuss national experience in this area and highlight the various actions that can be taken to support such an “evolutionary” approach.
Adapting the current framework in an evolutionary way
A first “evolutionary” recommendation to official statisticians is to focus their analysis on large corporate groups (eg MNEs), which have proved to be the key vehicles driving non-financial and financial international integration, and which tend to have complex organisational structures often involving SPEs. As recalled by Orsini and Ambroselli (2020), several European countries have already set up specific “large cases units” (LCUs) that focus on global businesses. The information collected can effectively support the understanding of GVCs and the impact of MNEs on the economy, shedding light on the role played by SPEs in their parent groups’ activities, intrafirm investments, and profit-shifting mechanisms (for instance, through changes in the ownership of intangible assets, intragroup interest payments and determination of transfer prices between affiliates). The aim is also to facilitate the national and international harmonisation of statistical methods and techniques when dealing with such large groups and to make more timely “profiler-type” assessments, especially in case of “corporate events” (eg restructuring, merger and acquisition). This information could also be used to compile indicators with systematic

8 IFC Bulletin No 52 1
breakdowns between foreign-controlled groups, domestic MNEs and other domestic firms.
A second avenue is to provide more granular insights to the current framework, using all the possibilities offered by existing statistical standards to develop and present “sub-item information”. For instance, to have more detailed breakdowns for the statistics compiled on imports (eg share of intermediate consumption of foreign goods and services) or on the IIP (eg currency composition, remaining maturity, derivative type – see Bianchi and Bua (2020) for the work conducted to shed more light on the currency composition and use of FX derivatives for Irish investment funds). Similarly, a key objective in Canada has been to develop “more agile external accounts”, based on a centralised business register and showing statistics with various perspectives/different components: for instance, trade data reported by importers vs exporters; presentation on a custom basis vs contractual (eg consignee) basis; publication of detailed groupings of key macro indicators (by eg foreign ownership, sector, region etc); etc. In Europe, attention has focused on a more granular analysis of international transactions to better identify the contribution of offshore financial centres in globalisation. Van Limbergen et al (2020) have suggested looking at investment income balances, which should be positive for centres with large net external assets – although this may not always be the case because of the impact of profit-shifting mechanisms (see above).
A further step would be to make better use of the data that are already collected but not integrated into the central statistical framework underpinning the compilation of external sector statistics; for instance, information on external debt statistics, reserve assets, FX liquidity etc. Statisticians may in particular focus on making use of the wealth of “untapped” data available, including by building on advanced technologies to collect data from alternative sources (eg internet-based, administrative registers; see IFC (2017b, 2020a)). The key is to follow a “user- centric” approach, so as to focus on the information that could usefully complement existing data sets to respond to users’ needs. Of course, assembling a wealth of complementary but disparate information can be challenging. As highlighted by Kupriianova and Osiptsova (2020), this puts a premium on reliable documentation (eg metadata, methodology guidance) and effective data-sharing arrangements, not just with domestic counterparts but also with other countries (see Section C).
Yet a further, perhaps more decisive, step would be to take the opportunity of the ongoing review of international standards (eg preparation of the post-BPM6 and SNA 2008 manuals) to facilitate the use of complementary information in the external, and domestic, statistics framework. Cases in point include the consideration of consolidated statistics, the provision of supplementary information by degree of foreign ownership, and indicators on Trade in Value Added (TiVA) to complement gross export figures. As argued by Barseghyan (2020), one way to do so without adding too much complexity to the (already quite detailed) statistical framework is to further develop satellite accounts (see SNA 2008, Chapter 29: “Satellite accounts and other extensions”). This might be useful from two key perspectives: first, the complementary data collected are compatible with the underlying SNA-based framework; second, the approach could be flexible and progressively applied depending on actual user needs and resources available – reducing the need for a compulsory, one-size-fits-all framework. The satellite accounts approach would thus be helpful, for instance, to cover the digital economy (eg e-commerce, digital intermediation and production) as well as FDI-related information (eg GVCs, distribution of income). Another example of particular importance for the less

IFC Bulletin No 52 9
developed economies is the need to compile more comprehensive information on remittances, given the difficulties of capturing the related transactions in the BoP framework (Gaiya (2020)). A specific account could be designed to provide information on the country of origin of these transfers, the financial channels involved, the associated costs and seasonality etc.
B. Addressing users’ needs: complementing instead of substituting
One of the stated objectives of the conference was to bring together users and producers of external statistics to exchange views on outstanding data needs to support policymaking. Such exchanges are crucial, not only on a daily basis to respond to urgent requests, but also in a longer perspective to address more structural shifts in data requirements.
The experience of organisations in charge of domestic and international financial surveillance is particularly insightful from this user perspective. To fulfil their mandates, these institutions are among the most interested in having “fit-for-purpose” external sector statistics. This is particularly true for central banks. As stressed by Lane (2020) in the case of the ECB, the availability of high-quality data on cross-border flows and external positions is crucial to understanding the exposures of domestic entities to potential external shocks as well as policy transmission mechanisms. Similarly, the external position of a financial institution is an important element to consider for supervisory authorities conducting their regular “stress tests” (see Georgiopoulos and Lambert (2020) in the case of Bermuda banks). Turning to those global institutions involved in external surveillance, these rely on external accounts data for their monitoring and assessment exercises – for instance to identify excessive imbalances, as argued by Austin et al (2020) in the case of the International Monetary Fund (IMF), whose key mandate is to promote stability in the global international economy and monetary system.
Of course, user needs are not static and evolve with changes in the economy, reflecting in particular the impact of globalisation and digitalisation. This does not imply that new statistics should be developed and substitute for existing ones, but rather that they should be made available in a complementary way.
A first example relates to the measurement of traded goods. As argued by Bo and Winther (2020), it is becoming more and more difficult for users to understand and interpret these statistics due to the complex nature of GVCs; for instance, a large part of Denmark’s exports does not cross the Danish border, and close interaction between statisticians and economists is needed to interpret published trade data. In addition, important discrepancies have emerged between the various trade statistics compiled, say between BoP and customs data – especially in the euro area, partly reflecting the challenges posed by the existence of large financial centres with a high presence of MNEs. To address such issues, one often needs to look beyond the standard statistical sources available. For instance, di Nino and Ekstam (2020) used the World Input-Output Table data set developed by Timmer et al (2015) to enhance the analysis of the trade surplus registered by euro area financial centres and to

10 IFC Bulletin No 52 1
measure the contributions played by “foreign value added”.7 Similarly, it can be useful to consider complementary information to the “standard” BoP framework, such as GVC-based indicators and breakdowns of MNEs’ transactions.
A second area where user needs are rapidly evolving relates to the services account. Recent developments in Europe show that it is increasingly difficult for users to interpret the related statistics. A key factor has been the role of MNEs’ transactions as regards IPPs and their impact on the services component of current account balances (see Section D). In order to carry out meaningful economic analysis, users need to be able to swiftly obtain information on the drivers of such developments to complement the raw statistical data they receive.
Turning to statistics on financial transactions and IIPs, user needs have increasingly focused on two areas. One relates to FDI statistics, which should be made available in a more diversified format and for a larger number of countries (Section E). A second area concerns cross-border securities holdings. To gain additional insights into investors’ risk exposures, it would be useful to develop a matrix linking ultimate investors and ultimate issuers of financial instruments. For instance, (nationality-based) data on the ultimate exposures of US investors through mutual funds point to a significantly different picture than the one portrayed by residency-based IIPs data – especially because of the impact of those securities issued by emerging market economies’ borrowers through an affiliate residing in an offshore centre (Bertaut et al (2020)). Similarly, the BIS banking and international debt securities statistics provide complementary information on both a locational and a nationality basis, helping users to analyse the developments observed in cross-border credit flows and exposures (BIS (2015)).
Overall, a consensus has emerged that new types of data set (eg based on consolidated accounting frameworks and/or on the nationality criteria) need to be developed further, but should in any case be seen as a complement rather than a substitute for the current residency-based information framework. At the end of the day, the choice of the relevant data should depend on the specific purpose of the analysis.
C. Compilation practices: looking for new guidelines, sources, tools and sharing arrangements
Another important objective of the conference was to look at the implications of the above challenges for the compilers of external statistics and to assess whether the methodological framework remains suitable for the statistical obligations assigned to them – noting that this task is typically delegated to central banks in the vast majority of countries in the world. Clearly, the statistical system always had to adapt to a changing and dynamic world to remain relevant. This also applies to the current situation: globalisation and digitalisation have raised the diversity of (formal and informal) cross-border flows, with the opening of new channels and the setup of inventive financial instruments that need to be correctly captured. To do so, and as noted by Mitreska et al (2020), compilers need to understand the nature, function and purpose of these novelties in order to revise their methodological guides
7 The World Input-Output Database covers 43 countries and 56 sectors (see www.wiod.org/home).

IFC Bulletin No 52 11
accordingly – for instance, by refining the coverage and classification of financial instruments.
Statisticians also need to rely more on alternative information as a complement to their conventional data sources – to incorporate, for instance, payment transactions data derived from settlement systems, or supervisory data. One telling example relates to the measurement of the supply and acquisition of services, which are growing rapidly but are not well captured by the “traditional” statistical apparatus. Enhancing their measurement calls for actively searching alternative sources, available either internally or externally. To this end, Statistics Canada has reduced its primary reliance on surveys as the collection vehicle supporting the compilation of official statistics and embraced an approach mostly based on administrative data (see also Eurostat (2019) for the situation in Europe). In addition, new alternative data sources can be useful for users looking for more timely/frequent indicators, as highlighted during the Covid-19 pandemic (Ducharme et al (2020)).
The search for additional data sources goes hand in hand with using new compilation methods to increase the scope and quality of the information produced. Attention has in particular focused on artificial intelligence (AI)/big data tools, such as machine learning, web scraping and other data mining techniques (Wibisono et al (2019)). One relevant example presented by Meinusch and Hessel (2020) relates to the measurement of digital trade in the German BoP: a step-by-step procedure has been set up to compile statistics on digital micro-transactions, using data freely available on the web. It allows for a timely provision of the information needed without requiring the implementation of a costly data collection method, such as household surveys. Yet this experience shows that specific attention should be devoted to quality issues, especially as regards the representativeness (eg sample size) and reputation of internet data sources.
Another implication of the search for new statistical sources is the need to link different data sets together and hence to facilitate the sharing of information between compilers, both within and across countries (IFC (2015)).
At the domestic level, good data-sharing practices are required to make use of the information collected for administrative purposes but not primarily for the compilation of official statistics. In Spain, the measurement of household assets and liabilities has been greatly enhanced by accessing the records of the Tax Agency (Sánchez (2020)). In Canada, an innovative statistical infrastructure has been set up to maximise the use of existing micro-data sets, put together the various files, ensure a direct connection between detailed granular records and macro aggregates, and develop data linkage techniques8 (Withington (2020)). This has proved an effective approach from a cost-benefit perspective, by providing economies of scale and more analytical opportunities once the initial investment has been made. A key element behind this strategy was the decision to modernise the way of dealing with confidential data, with a revision in the related requirements to provide for more flexibility.
At the international level, stronger cooperation among national authorities and with international organisations can be instrumental for sharing the information that is necessary to enhance the compilation of external sector statistics, with two main
8 That is, bringing together different information sources to create a richer data set with more
dimensions.

12 IFC Bulletin No 52 1
options. The first is that bilateral data exchanges can enhance the measurement of domestic aggregates by comparing the data on cross-border transactions and positions compiled by two different countries. In Spain, this “mirror data approach” has been useful to enhance the measurement of households´ cross-border bank loans and deposits (Sánchez (2020)).
A second solution is to rely on data collections organised on a multinational basis, such as the IMF Coordinated Portfolio Investment Survey (CPIS) (IMF (2018a)) and the BIS international banking statistics (IBS) (BIS (2015)). This information can be useful to both enhance the quality of bilateral BoP and IIP data and fill existing gaps in national statistics by using “mirror” estimates available from other jurisdictions.9 A multinational approach has also been pursued at the Bank of Greece for implementing a centralised global model to estimate air transport in collaboration with other international organisations and associations, such as the International Air Transport Association (IATA) (Papaspyrou (2020)). Another example relates to the actual measurement of the activities of MNEs. International cooperation has already started in this area, in particular in the OECD context10 – and also at the BIS for large financial firms (Bese Goksu and Tissot (2018)). In Europe, the Early Warning System (EWS) initiative facilitates information-sharing among the relevant European Statistical System (ESS) members and Eurostat, allowing for the provision of “early warnings” in cases of MNE restructuring events (Eurostat (2020)). The associated sharing of data on the structures and activities of large firms is reported to have significantly helped to enhance the quality of ISTAT’s data estimates for Italy (Accoto et al (2020)).
D. Isolating and measuring MNEs
MNEs have played a major role in the growing economic integration of recent decades. A key reason has been their ability to swiftly adapt their global operations in response to the developments taking place in various locations, especially in terms of economic, financial, fiscal and regulatory factors. Their expansion has increased the scale and complexity of cross-border trade and financial flows, reinforcing the measurement challenges brought by globalisation for producers of external sector statistics.
Impact on cross-border flows
Yet the removal of national barriers induced by economic and financial globalisation has made it harder for statisticians to promptly and correctly capture trade and capital cross-border flows. These challenges have been reinforced by rapid digital innovation and the increased complexity and limited transparency in MNE activities. In particular, the difficulty of dealing with large and growing intragroup flows has altered the measurement of economies’ current and financial accounts. For instance,
9 For the use of mirror data in the case of international financial statistics, see Pradhan and Silva (2019). 10 See the global Analytical Database on Individual Multinationals and Affiliates (ADIMA) developed by
the OECD (www.oecd.org/sdd/its/measuring-multinational-enterprises.htm), as well as the related guidelines set up to deal with MNEs (OECD (2011)).

IFC Bulletin No 52 13
statisticians have to deal with the fact that MNEs make an active use of transfer pricing to shift revenues. Compilers will need to establish a market-equivalent price for such intragroup transactions, but this can be almost impossible in practice, especially in the case of the transfer of intangible assets (eg IPPs), and even more so when the transactions are conducted through complex accounting and financial structures.
The resulting uncertainty can affect the measurement of the various constituents of the current account, in particular investment income, as well as of the IIP and its components. Examples of such challenges comprise the (in)consistencies of valuation methods across the main functional categories of investment broken down in international accounts; the different treatment of retained earnings depending on these categories; and flows/stocks reconciliation issues. Another issue relates to the impact of corporate events. In particular, cross-border mergers and acquisitions and intragroup restructuring can have a sizeable impact on BoP and IIP indicators (Accoto et al (2020)). Such events are difficult to grasp since they often comprise multiple steps, with the establishment of several corporate layers and the involvement of group entities from different economies.
Lower relevance of residency-based statistics
Another consequence of MNE activities is the fragmentation of production, altering the relevance of the domestic economy concept. In fact, correctly measuring the geographical footprint of MNEs has become increasingly difficult, reflecting a highly globalised world and the growing role played by financial centres in the international allocation of capital (Bertaut et al (2020)). In particular, a number of MNEs have relocated their headquarters into low-tax jurisdictions and offshore financial centres due to regulatory and tax optimisation strategies. As a result, the geographical allocation of bilateral financial flows and positions in external statistics, which is mainly based on the country of incorporation of the affiliated firms involved, may mask the true geography of investors’ exposures.
Moreover, MNEs’ production chains have diminished the analytical relevance of measured gross trade flows. While in the past the goods consumed in one place were either produced locally or imported from another country where they were manufactured, a significant part of the goods exported nowadays comprises foreign-imported intermediate inputs, reflecting the global nature of GVCs intermediated by MNEs. To address this point, traditional statistics on bilateral trade balances may need to be supplemented with additional, more granular measures.
Furthermore, consumers’ purchasing habits have rapidly evolved with digitalisation, and a significant part of the provision and sale of services supplied by global firms is now done “online”, making their geographical allocation more challenging. The air transport industry provides a typical example of this evolution, as most travel tickets are now issued online. This may have many benefits for customers, but it raises issues for statisticians compiling “real economy” statistics. One way to go, as argued by Papaspyrou (2020), is to leverage existing centralised airline data collections and make use of the embedded micro-data level information. Yet making sense of these data from a macro perspective requires setting up innovative tools, developing standardised definitions, and finding ways to allow for an effective exchange of information between compilers.

14 IFC Bulletin No 52 1
Distortions in domestic economic aggregates
A final, and related, consequence of the growing economic role played by MNEs is the potential distortion, from a traditional macroeconomic perspective, of countries’ domestic aggregates/indicators, such as GDP, productivity, and even employment. This is especially the case when MNEs’ activities are disproportionately large compared with the size of the domestic economy. Ireland is a textbook case, being a small, open economy, part of the EU and the global markets, and characterised by the operating presence of large foreign multinationals. In recent years, events linked to corporate restructuring and the relocation of IPPs and related global operations by foreign-owned MNEs have raised volatility in Irish domestic demand and GDP, while their impact on underlying economic patterns are presumably smaller (OECD (2016)). This created the need for developing alternative measures/indicators that could be “cleaned” from such effects.
To do so, one needs to carefully analyse the impact of MNEs on national statistics by considering additional pieces of information (Osborne-Kinch et al (2020)) – for instance, by collecting market intelligence, developing a specific monitoring of MNEs with so-called LCUs, and analysing case studies as in the context of the European EWS initiative. In particular, this requires MNEs to be precisely isolated and measured, possibly through the organisation of comprehensive and consistent data collections at both the national and the international levels, including a separate breakdown for SPEs.
Yet one consequence for official statisticians producing macro-level statistics is the need to better integrate the additional micro-level data sources considered, including entity identifiers, accounting information on corporate structure, and security-by-security/loan-by-loan databases.11 Such granular information is essential to track MNEs’ financial interlinkages, understand the nature and scope of their operations, and assess the associated impact on the economy and the potential risks. It calls for an efficient statistical collection and analytical system to be designed, so as to combine data with different levels of granularity and format (eg structured and non-structured data, for instance textual information).12
Another key requirement is to have effective data-sharing possibilities among statistical compilers. As noted above, official statisticians require access to timely information on MNEs’ corporate events, putting a premium on exchanging with their colleagues in other countries and agreeing on sound and consistent methodologies. This is needed to limit the occurrence of statistical asymmetries that would result from different national approaches. Yet it is also a challenge, because MNEs’ operations typically represent “complex cases” for statisticians. In particular, large groups often use SPEs to play very specific roles (eg to hold participations, raise capital, own intellectual property rights etc) under complicated arrangements. As noted by Banhegyi (2020), the correct measurement and analysis of these activities may require
11 For the security-by-security (CSDB) and loan-by-loan (AnaCredit) databases developed in Europe, see
ECB (2010, 2019). 12 See IFC (2016) for the opportunities/challenges brought about by the combination of micro and
macro data in the financial stability area.

IFC Bulletin No 52 15
significant judgment,13 for instance to apply the concept of economic vs legal ownership (which is a key distinction underpinning the assessment of control relationships in the SNA framework). Strong international cooperation is therefore required to avoid excessive differences between countries in applying the related methodologies.
E. The future of foreign direct investment as an analytical tool
Better understanding the (new) role of FDI
The nature of FDI has gone hand-in-hand with the increase in financial integration in recent decades. For many countries today, the dominant FDI transactions have a mainly financial purpose, instead of being motivated by “real production” considerations as in the past, when groups’ cross-border investment decisions were driven mainly by the establishment of a subsidiary from the ground up (“greenfield investment”). This traditional FDI component still exists, but the entailed volumes are much lower and in many occasions difficult to isolate from the enormous amounts that arise from the restructuring of MNEs and/or the creation of complex financial structures relying on a network of affiliates based in financial centres but with minimal physical presence (Austin et al (2020)). This trend has been reinforced by the shift in global credit intermediation from the banking sector to the debt securities market in recent decades. One particular issue is that borrowing/lending transactions between affiliated entities of the same non-financial corporate are considered as “direct investment”, in contrast to the treatment of debt transactions between unrelated parties (and also to similar operations but within financial groups like commercial banks). As a result, the expanding amounts of within-company loans financed through the offshore issuance of debt securities are classified as FDI, whereas they could also be viewed as portfolio flows masked as FDI (Avdjiev et al (2014)).
Reflecting the above developments, the main countries involved in FDI operations today are frequently small open economies and financial and offshore centres (in addition to the large advanced economies such as the United States). For example, Luxembourg is among the countries with the largest FDI in terms of transactions and positions, reflecting the specific role played by captive financial institutions (Feuvrier (2020)). Following the current SNA statistical standards, this type of SPE should be considered as an institutional unit if it does not reside in the same economy as its parent, even though it may not act independently (ie when the affiliate is simply a passive holder of assets and liabilities). This makes the economic interpretation of the information compiled quite spurious. A nationality-based presentation of these institutions, ie consolidated with their parents, would likely improve the economical meaning of the FDI data reported for Luxembourg. However, compiling such estimates is challenging for national statisticians, as those entities are usually integrated into complex international structures.
13 In fact, the SNA standards recognise that “there is no common definition of an SPE”, although some
specific characteristics may apply (eg absence of employees, little physical presence etc); see SNA 2008, #4.55-58. However, the IMF has now published additional guidance on SPEs based on the report of a dedicated Task Force (IMF (2018b)).

16 IFC Bulletin No 52 1
Different FDI presentations: all very useful
The standard presentation of FDI statistics is based on showing the country/sector of the immediate counterparty (OECD (2008)). This presentation seems the most convenient for producing internationally comparable figures, but it lacks the relevant information required for other purposes. For instance, policymakers and analysts need to understand the origin of FDI flows, ie who is behind certain investments, in particular when these are in strategic sectors. Likewise, risk analysis considerations require a good understanding of the final destination of residents’ investments and exposures. These elements put a premium on better understanding the various financial and tax considerations influencing FDI decisions as well as the specific channels of the related investments.
There is also an increased push to look at FDI data on an ultimate basis, with the ultimate investor defined as the one with control over the investment decision. This interest has been reinforced by the growing role played by “pass-through funds”/“funds in transit” associated with FDI flows – ie with funds passing through an enterprise resident in one economy to an affiliate in another economy, so that the funds do not stay in the economy of the affiliate. Hence, an important requirement is to enhance the presentation of FDI data by ultimate source and destination country – not least to better illuminate the role played by international financial centres in the expansion of FDI positions and external imbalances observed in recent years.
However, identifying ultimate investors is not always straightforward. One way explored by the Bank of Portugal is to rely on network analysis tools to identify/estimate the ultimate direct investors and intermediaries in FDI chains (Lima et al (2020)). In particular, data from the IMF Coordinated Direct Investment Survey (CDIS) (IMF (2015)) can be used to assess investment patterns, identify economies that are frequently involved as intermediaries in FDI flows, and track their evolution over time. Another approach followed at the University of Groningen is gravity modelling (Wacker (2020)). Its application to the different types of FDI data sets available from the IMF, the OECD and UNCTAD suggests, on average, little difference between the immediate and ultimate investor concepts as regards the general picture of global FDI. However, there are important differences for specific country pairs, reflecting that some jurisdictions are mostly acting as intermediaries in global FDI chains.
A particular issue is when the (ultimate) FDI investor behind an inward investment in a country is in fact a resident of the same country. This so-called “round-tripping” phenomenon involves in most cases foreign SPEs: for instance, the major routes for round-tripping in Poland’s FDI appear to be through Luxembourg, Cyprus and the Netherlands (Makowski (2020)). In principle, this type of investment should be quite neutral for the economy it passes through, as inward and outward flows should be equal. But they may be valued differently because of accounting or fiscal reasons (or simply because of practical measurement difficulties), leading to bilateral asymmetries in statistics and distortions in IIP measurements.
Looking ahead, the above considerations underline the need to revisit the FDI concept in order to maintain its relevance as an analytical tool. An enhanced understanding of the (new) role of FDI requires going beyond its standard analysis and promoting different presentations. The way to go is to develop various complementary indicators to assess the development and impact of FDI, provide

IFC Bulletin No 52 17
more granular details in the statistics published – eg identify better SPEs as well as foreign-controlled corporations and the related control relationships. Needless to say, international cooperation is also essential, not least to correctly track global group structures as well as to facilitate information-sharing and mirror data exercises. Lastly, compilers need to interact closely with users to continuously adjust their statistical offerings to evolving analytical needs.

18 IFC Bulletin No 52 1
References
Avdjiev, S, R N McCauley and H S Shin (2015): “Breaking free of the triple coincidence in international finance”, BIS Working Papers, no 524, October.
Avdjiev, S, M Chui and H S Shin (2014): “Non-financial corporations from emerging market economies and capital flows”, BIS Quarterly Review, December, pp 67–77.
Bank for International Settlements (2015): “Introduction to BIS statistics”, BIS Quarterly Review, September, pp 35–51.
——— (2017): 87th Annual Report, “Understanding globalisation”, Chapter VI, pp 97–124.
Bean, C (2016): Independent review of UK economic statistics, March.
Bese Goksu, E and B Tissot (2018): “Monitoring systemic institutions for the analysis of micro-macro linkages and network effects”, Journal of Mathematics and Statistical Science, vol 4, no 4, April.
Ducharme, LM, J Tebrake and Z Zhan (2020): “Keeping economic data flowing during COVID-19”, IMF Blog, 26 May.
European Central Bank (2010): The “Centralised Securities Database” in brief, February.
——— (2019): AnaCredit Reporting Manual Part I – General Methodology, second edition, May.
European Commission, International Monetary Fund, Organisation for Economic Cooperation and Development, United Nations and World Bank (2009): System of National Accounts 2008.
Eurostat (2019): Building the System of National Accounts – administrative sources, Statistics Explained, 13 November.
——— (2020): An Early-warning System (EWS) for the correct and consistent statistical treatment of restructuring events of multinational enterprise groups and their enterprises in European statistics – Information for national correspondents, March.
Inter-Agency Group on Economic and Financial Statistics (2015): Consolidation and corporate groups: an overview of methodological and practical issues, IAG reference document, October.
International Monetary Fund (2009): Balance of Payments and International Investment Position Manual – Sixth Edition (BPM6).
——— (2015): The Coordinated Direct Investment Survey Guide – 2015.
——— (2018a): Coordinated Portfolio Investment Survey Guide, Third Edition, September.
——— (2018b): Final Report of the Task Force on Special Purpose Entities, BOPCOM–18/03, October.
Irving Fisher Committee (2015): “Data-sharing: issues and good practices”, IFC Report, January.
——— (2016): “Combining micro and macro statistical data for financial stability analysis”, IFC Bulletin, no 41, May.

IFC Bulletin No 52 19
——— (2017a): “Assessing international capital flows after the crisis”, IFC Bulletin, no 42, February.
——— (2017b): “Big data”, IFC Bulletin, no 44, September.
——— (2018): “External sector statistics: current issues and new challenges”, IFC Bulletin, no 48, November.
——— (2020a): “Computing platforms for big data analytics and artificial intelligence”, IFC Report, no 11, April.
——— (2020b): “Using financial accounts“, IFC Bulletin, no 51, February.
Legal Entity Identifier Regulatory Oversight Committee (2016): Collecting data on direct and ultimate parents of legal entities in the Global LEI System – Phase 1, March.
OECD (2008): OECD Benchmark Definition of Foreign Direct Investment (BMD4), Fourth Edition.
——— (2011): OECD Guidelines for Multinational Enterprises, OECD Publishing.
——— (2013): Economic Globalisation – Origins and consequences, April.
——— (2016): Irish GDP up by 26.3% in 2015?, October.
Pradhan, S-K and J-F Silva (2019): “Using mirror data to track international banking”, IFC Working Papers, no 19, December.
Timmer, M, E Dietzenbacher, B Los, R Stehrer and G de Vries (2015): “An Illustrated User Guide to the World Input–Output Database: the Case of Global Automotive Production”, Review of International Economics, vol 23, no 3, pp 575–605.
Tissot, B (2016): “Globalisation and financial stability risks: is the residency-based approach of the national accounts old-fashioned?”, BIS Working Papers, no 587, October.
United Nations Economic Commission for Europe (UNECE) (2011): The impact of globalization on national accounts.
Wibisono, O, H Ari, A Widjanarti, A Zulen and B Tissot (2019): “The use of big data analytics and artificial intelligence in central banking”, The Capco Institute Journal of Financial Transformation, Data analytics, 50th edition, November.
Zhang, N and Z Xiuzhen (2019): “Measuring global flow of funds: focus on China, Japan, and the United States”, Economic Systems Research, vol 31, no 4, pp 520–50.

1/1
IFC Conference on external statistics "Bridging measurement challenges and analytical needs of external statistics: evolution or revolution?", co-organised with the Bank of Portugal (BoP) and the European Central Bank (ECB)
17-18 February 2020, Lisbon, Portugal
Introductory speech1
Carlos da Silva Costa,
Governor of Bank of Portugal
1 This introductory speech was prepared for the meeting. The views expressed are those of the author and do not
necessarily reflect the views of the BIS, IFC, BoP, ECB or the central banks and other institutions represented at the meeting.


1/1
IFC Conference on external statistics "Bridging measurement challenges and analytical needs of external statistics: evolution or revolution?", co-organised with the Bank of Portugal (BoP) and the European Central Bank (ECB)
17-18 February 2020, Lisbon, Portugal
The analytical contribution of external statistics: addressing the challenges1
Philip R Lane,
Member of the Executive Board of the European Central Bank
1 This keynote was prepared for the meeting. The views expressed are those of the author and do not necessarily
reflect the views of the BIS, IFC, BoP, ECB or the central banks and other institutions represented at the meeting.

SPEECH
The analytical contribution of external statistics: addressing the challengesKeynote speech by Philip R. Lane, Member of the Executive Board of the ECB, at the Joint European Central Bank, Irving Fisher Committee and Banco de Portugal conference on “Bridging measurement challenges and analytical needs of external statistics: evolution or revolution?”
Lisbon, 17 February 2020
IntroductionIt is a pleasure to speak at this first edition of the conference on external statistics, which is jointly organised by Banco de Portugal, the Irving Fisher Committee and the European Central Bank.[1]
Not only as a central banker but also during my time in academia, I have spent much of my time analysing data on external transactions and international investment position. So it should come as no surprise that I take a very active interest in the programme of this event and look forward to the discussions today.
It is fair to say that the richness and availability of external statistics has increased considerably over the last 20 years. At the same time, the measurement challenges have increased, meaning that there are still many analytical hurdles to overcome when interpreting external statistics.
For the ECB, high-quality measurement of cross-border statistics is centrally important to the ECB for several reasons. First, the euro area is closely integrated into the global economy, both on the real side – via trade linkages and participation in global value chains (Chart 1) – but also on the financial side – as indicated by the size of euro area external assets and liabilities (Chart 2). Second, the current account balance of the euro area is a primary macroeconomic variable and the underlying shifts in the current account have widespread implications for the overall real and nominal dynamics of the euro area.
It follows that accurately measuring the external sector of the euro area is central to understanding exposures to external shocks and the international transmission of the ECB’s policies.
In my remarks, I will first discuss some of the globalisation-related measurement challenges that are affecting the real side of external statistics, before turning to the financial side. I will then highlight some of the ongoing initiatives to address these measurement challenges and outline some ideas to enhance the external statistics compilation framework, with a focus on the euro area.
Chart 1
Euro area trade and global value chain participation
(percentages of euro area GDP (left side); percentages of total exports (right side))

Sources: ECB, Eurostat and World Input-Output Database.Notes: The data refer to extra-euro area trade. The exports and import data account for goods and services. Global value chain participation is measured as the share of gross exports that cross at least three borders. The latest observation for trade is 2018 and for global value chain participation is 2014.
Chart 2
Euro area external assets and liabilities
(percentages of euro area GDP)
Sources: ECB and Eurostat.Notes: The data refer to positions vis-à-vis extra-euro area counterparts. The latest observation is for 2018.
Measuring the real side of globalisationThe increase in international trade has been accompanied by the rise of complex production chains involving firms specialising in different stages of production. The global production network includes both multinational enterprises (MNEs) – large, profitable global firms – and also smaller and often highly specialised firms.[2]
By now, it is well recognised that MNEs have complex organisational structures which frequently involve numerous legal entities, including special-purpose entities (SPEs). This complexity influences balance of payments (b.o.p.) statistics in various ways. The size of transactions related to MNEs, which are often intra-firm, poses challenges to the interpretation of balance of payments and national accounts statistics. The impact in terms of the magnitude and volatility of statistical indicators is especially visible in financial centres and small, very open economies where global firms are large relative to the size of the domestic economy. However, these factors are also increasingly relevant in understanding the external statistics of the aggregate euro area and other large economies.
In relation to measuring international trade, cross-border production arrangements, such as contract manufacturing, have considerable implications for concepts that are central to the b.o.p. and national accounts.[3]
Such arrangements may involve foreign subsidiaries (offshoring) or an arms-length relationship with an unrelated company (outsourcing). The extent to which such production arrangements matter for the euro area trade balance can be seen by comparing data on trade in goods between the b.o.p and international

trade statistics. This is possible because of an important methodological difference between the two datasets: b.o.p data are based on the concept of change in economic ownership, while trade statistics measure all goods crossing a border. In terms of the goods trade balance for the euro area, the gap between these two datasets has been growing over time, in particular since 2015 (Chart 3).[4] This divergence has been driven by euro area financial centres with a high presence of MNEs.[5]
Chart 3
Euro area goods trade balance
(EUR billions)
Sources: Di Nino, V., Habib, M.M. and Schmitz, M. (forthcoming) based on ECB and Eurostat. Notes: The blue area shows the net exports of the euro area as recorded in trade statistics. The yellow and orange areas depict the difference between b.o.p. and trade statistics in financial centres and other euro area economies, respectively. The group of financial centres includes Belgium, Cyprus, Ireland, Luxembourg, Malta, Netherlands. Four-quarter moving sums. The latest observation is for the second quarter of 2019.
This episode illustrates how b.o.p data and, by extension, also national accounts statistics can be affected by exports of goods that are not produced domestically and also do not cross the border of the domestic economy. In line with this, recent ECB research (already presented in session 2 of this event) finds that the trade surplus of euro area financial centres is mainly generated by foreign value added.[6]
Notably, the pricing of the various transactions involved in cross-border production arrangements, in particular if these are intra-firm, substantially affects the amount and location of profits booked, reflecting the well-established concept of transfer pricing.
Over time, the location of corporate structures has become increasingly mobile. This is partly driven by the redomiciliation of headquarters and the increased relevance of intangible assets, such as patents and copyrights. These intellectual property products (IPPs) are particularly important for digital companies, but are also relevant in other industries such as the pharmaceutical sector. IPPs can easily be moved across borders, including to jurisdictions that offer favourable tax treatment for profits arising from such assets. Typically, one entity of an MNE group owns the IPP assets of the group, while other entities in the same group pay licence fees and royalties for their use.
Over the past few years, IPP-related transactions have had a marked effect on the services component of the euro area current account balance. In particular, there have been three large spikes in IPP-related imports (Chart 4).
Chart 4
Euro area services trade balance
(EUR billions)

Source: ECB. Notes: Quarterly data. The latest observation is for the third quarter of 2019.
These episodes – which reflect the transactions of a small number of large companies – are also visible in the euro area national accounts, where they show up as large imports of services and, commensurately, high gross fixed capital formation (Chart 5). Importantly, this increase in investment has also translated into a larger measured level of euro area domestic demand, although the associated change in the underlying euro area domestic production patterns is likely to be quite minor.
Chart 5
Euro area national accounts: selected components
(quarter-on-quarter growth rates in percentages)
Source: Eurostat.Notes: Seasonally and working day adjusted quarterly data. The latest observation is for the third quarter of 2019.
Such episodes highlight the dichotomy between the residency principle underlying macroeconomic statistics and the global footprint of MNEs. Data on the numerous entities belonging to MNE groups are not consolidated across borders with the home country of the parent MNE. Instead, they are recorded in the national statistics of the economy where the entities reside, even if their effect on domestic economic activity may in fact be small.
This dichotomy also extends to the way statistics are still collected and compiled nowadays, which is not much different from a century ago: these are gathered nationally and subject to strict data confidentiality rules, which often prevent cross-border data sharing. For global companies, this implies that the information sets available to national statisticians differ across countries, which gives rise to both gaps and overlaps at the same time. This, in turn, has negative implications for cross-country comparability and overall data quality, including for the euro area. It also enables the emergence of large bilateral asymmetries. A case in point is the sizeable differences recorded for the bilateral current account balance between the euro area and the United States based on US and euro area data (Chart 6). This discrepancy gives rise to several interpretations, which I will come back to later on.[7]

Chart 6
Bilateral euro area-US current account
(EUR billions; 2018)
Sources: ECB and US Bureau of Economic Analysis.Note: Positive balance indicates a surplus for the euro area.
Measuring the financial side of globalisation Let me turn to the financial side of globalisation. While the post-crisis environment was generally marked by a halt in financial globalisation, foreign direct investment (FDI) positions continued to expand until recently.[8]
A striking pattern that I identified in collaboration with Gian Maria Milesi-Ferretti of the International Monetary Fund is that the post-crisis expansion was concentrated in positions vis-à-vis international financial centres (Chart 7). This can, in turn, be linked to the increased complexity of the corporate structures of MNEs, as I just mentioned.
Chart 7
Evolution of external assets
(percentages of world GDP)
Sources: External Wealth of Nations database (Lane and Milesi-Ferretti) and ECB staff calculations. Notes: Aggregates for advanced economies, financial centres and emerging and developing countries are defined as in Lane, P. R. and Milesi-Ferretti, G. M. (2018), “The External Wealth of Nations Revisited: International Financial Integration in the Aftermath of the Global Financial Crisis”, IMF Economic Review, Vol. 66, No 1, International Monetary Fund, pp. 189-222.
Due to these trends, interpreting headline FDI data has become increasingly difficult, including for the aggregate euro area. Notably, there is a high presence of SPEs in a number of euro area countries. In these economies, SPEs account for sizeable shares of cross-border financial transactions and positions, not only in terms of FDI but also in terms of portfolio investment and other investment. SPEs located in

euro area financial centres typically hold equities, manage debt issuance, and allocate funding across parent and subsidiaries.[9]
Statistics on SPEs are, however, not yet sufficiently developed: these are only available for a limited set of countries, largely focus on FDI and do not follow a harmonised international definition.
Large changes to the international balance sheet and financial flows of an economy may also arise from redomiciliations of headquarters. Common patterns associated with moving the headquarters of an MNE to a financial centre economy are increases in net FDI assets of the financial centre, while portfolio equity liabilities increase if the shareholders remain unchanged.
In relation to FDI of the euro area, it is notable that, in recent years, gross FDI transactions of euro area financial centres have been so large that these have driven aggregate euro area developments (Chart 8). Another defining feature of FDI is the strong positive correlation between gross assets and liabilities, especially in financial centres, which hints at the importance of the pass-through of financial flows for the evolution of FDI data.
Chart 8
Euro area foreign direct investment assets and liabilities transactions
(percentages of euro area GDP)
Sources: ECB and Eurostat.Notes: Financial centres refer to Belgium, Cyprus, Ireland, Luxembourg, Malta, Netherlands. Inverted values for liabilities. Four-quarter moving sums.The latest observation is for the second quarter of 2019.
Data on bilateral FDI assets of US companies in the euro area offer insights on the changing nature of euro area FDI liabilities.[10]
Between 2003 and 2018, US FDI positions in the euro area increased by a factor of 4.5 (Chart 9). A striking pattern is that this increase was largely driven by US investment in holding companies in the euro area, which are often SPEs, while US FDI in other, more traditional sectors such as manufacturing, grew more modestly.
Chart 9
US foreign direct investment assets in the euro area by industry of euro area affiliate
(USD billions)

Source: US Bureau of Economic Analysis.Notes: The euro area is based on data available for Austria, Belgium, Finland, France, Germany, Greece, Ireland, Italy, Luxembourg, Netherlands, Portugal and Spain. The latest observation is for 2018.
A forthcoming ECB study suggests that the income recorded on US FDI assets in the euro area plays a decisive role in the asymmetries observed in the bilateral euro area-US current account balance (Chart 10) that I mentioned earlier.[11]
The likely drivers of asymmetries in FDI income are, first, the difficulty in recording reinvested earnings of US MNEs with complex ownership chains (including holding companies) and, second, the problems in properly allocating the income flows geographically. Differences in the information set on MNEs available to European and US statisticians may be an important factor behind these patterns.
Chart 10
Bilateral euro area-US foreign direct investment income flows
(EUR billions; 2018)
Sources: ECB and US Bureau of Economic Analysis data.Note: Positive balance indicates a surplus for the euro area.
Going beyond FDI, a careful interpretation of cross-border statistics is also needed for appropriate risk assessments and policy analysis related to international financial exposures.[12]
Data on international financial transactions and positions have improved significantly over the past decade, both in terms of coverage and available details as regards instruments, sectors and geographic breakdowns.[13] Such data are helpful for identifying the holders and issuers of financial instruments. This, in turn, matters for the analysis of the transmission of shocks and the stability of investment positions over time.[14]
However, even these additional details cannot fully reveal the matrix of linkages between the ultimate investors and the ultimate issuers of financial instruments. The identification of ultimate exposures has been further complicated in recent years by the rise of international financial intermediation chains, which often involve non-bank entities in international financial centres. Recent research on US investors and

mutual funds shows that ultimate exposures – for example with regard to securities issued by emerging market economies – may differ significantly from those observed in international investment positions data.[15]
These patterns point to the need to improve the statistical information available for the analysis of interconnectedness. Another way of helping to complete the analysis of exposures would be to integrate the sectoral information of the external balance sheet in domestic sectoral data. This would enable the identification of the domestic sectors that ultimately drive external imbalances.[16]
A further important dimension in measuring international balance sheet risks relates to the transmission of financial shocks through the valuation channel arising from exchange rates and other asset price movements.[17]
In the past, data on the valuation channel could only be roughly estimated, resulting in substantial measurement errors. However, such data are now available in the official statistics for many economies, including the euro area, with a considerable degree of detail (Chart 11). For some economies, security-level data that provide highly granular insights into the trading of individual assets are now available. For example, granular datasets such as the ESCB’s Securities Holdings Statistics enable analysts to zoom in on refined dimensions of security holdings and draw up an ad hoc analysis of specific exposures.[18]
Studies exploiting these data show that different investor types respond differently to asset price fluctuations.[19]
Chart 11
Valuation changes in euro area portfolio investment assets
(EUR billions)
Source: ECB.Notes: Quarterly data. The latest observation is for the third quarter of 2019.
Official statistics that provide a comprehensive picture of foreign currency exposures in international balance sheets are still relatively sparse. Such data are important, however, since the full analysis of the transmission of exchange rate movements needs to take into account net foreign currency exposures. The lack of official statistics on the currency dimension of the international balance sheet has prompted the assembly of research-based datasets. Plausible estimates can be constructed by carefully merging a range of datasets, together with some estimates of the currency positions in different financial instruments (Chart 12).[20]
Chart 12
Cumulative distribution of net foreign currency exposures
(y-axis: cumulative distribution; x-axis: units of net foreign currency exposure measure)

Sources: Bénétrix, A., Gautam, D., Juvenal, L. and Schmitz, M. (2019), “Cross-Border Currency Exposures. New evidence based on an enhanced and updated dataset”, IMF Working Papers, No 19/299, International Monetary Fund.Notes: Net foreign currency exposures shown on the horizontal axis range between -1 and 1. The vertical axis presents the cumulative distribution (the proportion of countries) below each value on the horizontal axis for 1997, 2007, 2012 and 2017. The sample includes 50 advanced (ADV) and emerging (EME) countries.
International initiatives to address measurement challengesThe measurement challenges that I have discussed are well recognised in the international statistical community. A number of data initiatives – both at European and global level – point to progress in addressing these problems, as for instance recognised in the G20 Data Gaps Initiative. I am sure that, over these two days, you will have the opportunity to become familiar with many of these initiatives.
I would like to turn to what I consider to be required in order to enhance the relevance of cross-border and national accounts statistics. In general, the statistical system needs to become more agile to keep pace with the rapidly evolving activities of multinational firms and financial intermediaries.
To this end, the international statistical infrastructure needs to be enhanced. A key pillar in this infrastructure is the Legal Entity Identifier (LEI), which will bring transparency and facilitate the distinct identification of legal entities and link them to the ultimate parent entity. The ECB is actively engaged in this project, since it not only supports the statistical process, but also brings transparency to financial markets and to the exercise of prudential supervision.
Moreover, a concentric system of administrative and business registers can be a promising avenue for reconciling statistical and non-statistical needs. As the core of this system of registers, one could develop a single (near) real time EU business register, containing non-confidential information. This register could be made available as a public good for all administrative purposes. Establishing such a core register would require intensive cooperation among the operators of administrative, statistical and commercial business registers and should draw on the initiatives to enforce the universal use of the LEI. Ideally, it should support all non-statistical needs, including those of the EU Commission and those arising from the ECB’s functions (including banking supervision). In concentric circles around the core business register, one could first add the necessary statistical variables, which would be the reference for European System of Central Banks (ESCB) and European Statistical System (ESS) statistical production. Further separate concentric circles could add variables for other administrative purposes such as tax administration.
I acknowledge the sizeable initial investment implied by such a system. This requires thinking big and establishing EU law to bring it to life. Without these changes, however, I see little chance of keeping European statistics fit for purpose in the digital age.[21]
I also think that the existing data confidentiality framework in the EU needs to be urgently reviewed. The sharing of confidential data for statistical purpose within the ESCB/ESS should be facilitated by creating a solid legal basis. While the exchange of confidential information for statistical purposes is already enabled

under EU statistical law, the experience of the last decade shows that this is not enough in a number of Member States.[22]
Some legal initiatives will be required, possibly to replace some enabling clauses with mandatory ones. For instance, a single statistical business register would never be possible without such an enhanced data confidentiality framework.
These infrastructure developments would create a world of opportunities. For example, given the importance of MNEs and the associated measurement challenges, the centralised collection of data on, for instance, the top 500 MNEs in the EU could be envisaged, as is already the case in the financial sector for the 120 significant and 4,000 less significant banks within the framework of banking supervision. Such data, which could be made accessible to the relevant statistical authorities in the EU, have the potential to eliminate information gaps and overlaps across countries and hence ensure a more complete and consistent cross-country recording of the activities of MNEs. Moreover, this offers the prospect of significantly improving timeliness. At the same time, I am convinced that such an approach would be a win-win situation for MNEs in terms of the statistical reporting burden. Instead of receiving questionnaires from 27 Member States in 20-plus languages, a coordinated approach across the EU could significantly reduce reporting burdens. In individual Member States, like my own, the centralised approach to the biggest MNEs is bundled in large case units, which are often responsible for all reporting obligations and serve as a one-stop contact point for MNEs. Such an idea could also be considered at the euro area or EU level to the benefit of reporters and statistical authorities.
Turning to data wishes, as outlined earlier, further sectoral detail is necessary for an adequate analysis of risk exposures and to account for the activities of purely internationally oriented entities. There are important ongoing initiatives in this direction, both at a global level and within the ESCB. With regard to the need for a harmonised recording of SPEs in cross-border statistics, the definition provided by the dedicated task force of the IMF Committee on Balance of Payments Statistics is welcome and will be helpful in ensuring the availability of internationally consistent statistics with a separate breakdown for SPEs.[23]
The ESCB’s work programmes on external statistics and financial accounts also seek to separately identify foreign-controlled corporations in financial accounts and provide more refined breakdowns of the non-bank financial sector. Moreover, the euro area datasets on b.o.p. and domestic sector accounts will achieve full consistency over the next year, with important benefits for the analysis of interconnectedness.
Taking a longer time horizon, the next review and update of the statistical manuals (in particular the Balance of Payments Manual and the System of National Accounts) offers an opportunity to rethink the key concepts of macroeconomic statistics. One avenue is the consolidated framework in which all entities belonging to a corporate group are assigned to the country of the headquarters. Such an approach has the potential to provide a useful alternative perspective, in particular on MNEs and in the identification of ultimate financial exposures. However, such a consolidated accounting framework should be considered as complementary rather than as a substitute for the residence-based framework. As both approaches have their merits, their usefulness depends on the specific purpose of the analysis.
ConclusionsIn this speech I have focused on the topic of measurement challenges for external statistics. In particular, I have highlighted the role that measurement issues play in determining the analytical value of the statistics on euro area trade and the national accounts. On the financial side, key issues relate to the changing nature of FDI and to the proper measurement of exposures and risks.
I have also discussed some of the ongoing initiatives to address these measurement challenges, both at a global and European level. I would like to highlight once more that further efforts are needed to improve the analytical value of external statistics. This relates, for instance, to facilitating the sharing of confidential data for statistical purposes across borders and to exploring avenues to collect data on internationally active, large institutions in a centralised way, at the EU rather than national level.
As a long-standing user of external statistics, I very much look forward to the discussion today and will closely follow future enhancements to the data on cross-border statistics.
[1] I am grateful to Martin Schmitz for his contribution to this speech.
[2] See Avdjiev, S., Everett, M., Lane, P. R. and Shin, H. S. (2018), “ Tracking the international footprints of global firms”, BIS Quarterly Review, Bank for International Settlements, March.

[3] In contract manufacturing, a firm hires a foreign company to produce a good but retains the ownership of the inputs. In merchanting, a company purchases a good from an entity that is resident abroad and subsequently sells it to a foreign buyer, without the good crossing the border of the country where the merchant is based.
[4] See Di Nino, V., Habib, M. M. and Schmitz, M. (2020), “Multinational enterprises, financial centres and their implications for external imbalances: a euro area perspective”, forthcoming in Economic Bulletin, Issue 2, ECB.
[5] Following Lane, P. R. and Milesi-Ferretti, G. M. (2018), “The External Wealth of Nations Revisited: International Financial Integration in the Aftermath of the Global Financial Crisis”, IMF Economic Review, Vol. 66, No 1, International Monetary Fund, pp. 189-222, financial centre economies are selected on the basis of their ratios of external assets and liabilities to GDP. Among the euro area Member States, this group includes Belgium, Cyprus, Ireland, Luxembourg, Malta and Netherlands.
[6] Di Nino, V. (2020), “Decomposing the euro area trade balance: where does the value added of conduit economies go?”, mimeo, European Central Bank.
[7] Indeed, a factor contributing to asymmetries between the euro area and the United States may be related to methodological differences, in particular as the US current account statistics are not fully aligned with the standard presentation of the sixth edition of the International Monetary Fund’s “Balance of payments and international investment position manual” (BPM6). See Eurostat (2019), Current account asymmetries in EU-US statistics.
[8] See Lane, P. R. and Milesi-Ferretti, G. M. (2018), “The External Wealth of Nations Revisited: International Financial Integration in the Aftermath of the Global Financial Crisis,” IMF Economic Review, Vol. 66, No 1, International Monetary Fund, pp. 189-222; and McQuade, P. and Schmitz, M. (2017), “The Great Moderation in International Capital Flows: A Global Phenomenon?”, Journal of International Money and Finance, Vol. 73, pp. 188-212.
[9] See Galstyan, V., Maqui, E. and McQuade, P. (2019), “International debt and Special Purpose Entities: evidence from Ireland”, Working Paper Series, No 2301, ECB, Frankfurt am Main, July.
[10] The United States accounts for around 25 percent of extra-euro area FDI liabilities.
[11] See Pastoris, F. and Schmitz, M. (2020), “Euro area-US current account asymmetries: the role of foreign direct investment income in the presence of multinational enterprises”, forthcoming in Economic Bulletin, Issue 2, ECB.
[12] See Lane, P. R. (2015), “Risk Exposures in International and Sectoral Balance Sheet Data", World Economics, Vol. 16, No 4, pp. 55-76.
[13] Cross-country datasets providing a geographic breakdown of investment positions include the BIS data on cross-border banking, the IMF’s Coordinated Portfolio Investment Survey (CPIS) data on cross-border portfolio assets and the IMF’s Coordinated Direct Investment Survey (CDIS) on FDI.
[14] See Galstyan, V., Lane, P. R., Mehigan, C. and Mercado, R. (2016), “The Holders and Issuers of International Portfolio Securities,” Journal of the Japanese and International Economies, Vol. 42, pp. 100-108.
[15] See Bertaut, C. C., Bressler, B. and Curcuru, S. (2019), “ Globalization and the Geography of Capital Flows,” FEDS Notes, Washington: Board of Governors of the Federal Reserve System; and Coppola, A., Maggiori, M., Neiman, B. and Schreger, J. (2020), “Redrawing the Map of Global Capital Flows: The Role of Cross-Border Financing and Tax Havens”, mimeo, Stanford University.
[16] See Allen, C. (2019), “Revisiting External Imbalances: Insights from Sectoral Accounts”, Journal of International Money and Finance, Vol. 96, pp. 67-101.
[17] See Lane, P. R. and Milesi-Ferretti, G. M. (2007), “A Global Perspective on External Positions”, in Clarida, R. H. (ed.), G7 Current Account Imbalances: Sustainability and Adjustment, National Bureau of Economic Research, pp. 67-102.
[18] See Bergant, K., Fidora, M. and Schmitz, M. (2018), “ International capital flows at the security level – evidence from the ECB’s asset purchase programme”, ECMI Working Papers, No 7, Centre for European Policy Studies.
[19] Timmer, Y. (2018), “Cyclical Investment Behaviour Across Financial Institutions,” Journal of Financial Economics, Vol. 129, No 2, pp. 268-286; and Bergant, K. and Schmitz, M. (2019), “Valuation Effects and Capital Flows – Security Level Evidence from Euro Area Investors,” mimeo, International Monetary Fund and European Central Bank.
[20] See Lane, P. R. and Shambaugh, J. C. (2010), “Financial Exchange Rates and International Currency Exposures,” American Economic Review, Vol. 100, No 1, pp. 518-540; and Bénétrix, A., Gautam, D., Juvenal, L. and Schmitz, M. (2019), “Cross-Border Currency Exposures. New evidence based on an enhanced and updated dataset”, IMF Working Papers, No 19/299, International Monetary Fund.
[21] Ongoing initiatives include the Register of Institutions and Affiliates Database (RIAD) – which is a business register, operated by the ESCB – and the EuroGroups Register (EGR), which is used for statistical purposes on MNEs in the EU and operated by the ESS.
[22] For more details please consult Council Regulation 2533/98 (as amended) and Regulation (EC) No 223/2009.
[23] See the IMF Committee on Balance of Payments Statistics’ Final Report of the Task Force on Special Purpose Entities, 2018.
European Central Bank
Directorate General Communications
Sonnemannstrasse 20, 60314 Frankfurt am Main, Germany

Tel.: +49 69 1344 7455, E-mail: [email protected]
Website: www.ecb.europa.eu
Reproduction is permitted provided that the source is acknowledged.
Media contacts
Copyright 2020, European Central Bank

1/1
IFC Conference on external statistics "Bridging measurement challenges and analytical needs of external statistics: evolution or revolution?", co-organised with the Bank of Portugal (BoP) and the European Central Bank (ECB)
17-18 February 2020, Lisbon, Portugal
Need for new satellite accounts in international accounts statistics1
Mher Barseghyan,
Central Bank of Armenia
1 This paper and presentation were prepared for the meeting. The views expressed are those of the author and do not necessarily reflect the views of the BIS, IFC, BoP, ECB or
the central banks and other institutions represented at the meeting.

Need for new “satellite” accounts in International Accounts Statistics 1
Need for new “satellite” accounts in International Accounts Statistics
Mher Barseghyan1
Currently BPM6 manual gives a perfect framework to compile canonical statistics in general framework and logic of National Accounts Statistics. But the reality is that users need more and more data that diverge from official statistical data in some specific way. Digital economy statistics is an example of how different treatment of transactions in official statistics is and what users actually want to see. And this is not a single example: many other aspects of our life are recognized differently in different metrics. Therefore, there is ongoing demand for alternative data. On one hand, official statistics can argue that it is not possible to cover everything, and we are in charge of compiling right statistics. On the other hand, users are not capricious children. Different view on common economic phenomena are needed to analyse and understand what is happening and has happened in economy. National accounts compilers have such statistical frameworks like Tourism satellite accounts or Health satellite accounts. In principle, there are several tables in external accounts statistics, designed to reflect additional data that might be interesting to users. Reserve template and foreign currency liquidity or External debt tables are examples that emphasize the importance of collecting data not covered by central framework.
The paper discusses the need in such additional presentations of External Sector Statistics, as well as the possible areas of their implementation.
Keywords: new data, data gaps, balance of payments, satellite accounts, remittances.
JEL classification: C82, F39.
1 Central Bank of Armenia, Statistics department, External sector statistics division.

2 Need for new “satellite” accounts in International Accounts Statistics
Contents
Introduction ............................................................................................................................................... 3
Current system of external sector indicators ................................................................................ 3
User needs .................................................................................................................................................. 4
Existing supplementary frameworks ................................................................................................ 5
External debt ..................................................................................................................................... 5
International merchandise trade statistics and Statistics of international trade in services ..................................................................................... 5
Data Template on International reserves and foreign currency liquidity ................. 6
OECD Benchmark Definition of Foreign Direct Investment ........................................... 6
External sector satellite accounts....................................................................................................... 6
Conclusion .................................................................................................................................................. 9
References ............................................................................................................................................... 10
Appendix 1 .............................................................................................................................................. 10

Need for new “satellite” accounts in International Accounts Statistics 3
Introduction
Russian statistician Chuprov brought example of correlations between fire and firemen, concluding that possibly firemen organize fires themselves to create new jobs for themselves. In analogy the feeling when one looks into data presented on our websites is that statistical system is very poorly covered or very difficult to explore to underline the need of development and new work.
On one hand, there is a system of national accounts (including BOP, GFS, etc) which gives a comprehensive view on how economic values are created, exchanged, stored. More, the indicators provide very clear explanations of processes. On the other hand, there is ongoing demand not only to traditional canonical indicators, but also for alternative, supplementary and even non-quantitative indicators.
Many users are happy with the data that system provides. Generally, for the most users it is enough to know that the export totalled some 25 bln USD and the annual growth is 1.2 % against the same period of previous year. Some detailed geographical distribution in this context seems to be a very granular data that explains everything. There are other users, however, in official, academic and financial areas who feel the current granularity and datasets not being sufficient to understand and analyze the economy.
External sector is one of most important and complex areas of economy, taking into account the fact that globalization and additional data that will accompany existing datasets are crucial for economic analysis.
Current system of external sector indicators
Current statistical system of external accounts is generally based on two whales. One is system of national accounts and as a part of the system, system of BOP-IIP. It represents tables on output, transactions in financial instruments, and corresponding stocks of financial positions with nonresidents. Statistics is based on several principles most important one is residency principle. This one of crucial differences that users would wish to be supplemented. Though residency principle is used to make differentiation between internal and external world, and is reasonable, some extensions or some exclusions (for example some data that do not include SPE’s transactions) are required by users. The other principle that sometimes needs to be ‘transformed’ is the accrual principle. Sometimes cash accounting data are needed for analysis. As it was mentioned BOP standard components provide more than average details on external economic transactions. The supplementary items and the tables in the BPM6 manual provide (or better to say could provide) even more. Maybe that is the case that the publications in most of countries web sites are so short. Most users probably would be lost in a long set of indicators. Among other principles that users want to change may be the valuation principle, but to a lesser extent.
To supplement main data current manual and related statistical guides offer some additional tables that relate to accumulation of arears, currency composition of IIP, etc. Well known are supplementary data that are collected for external debt statistics purposes.
Of course, the way that the general framework construct statistics has some limitations that brought to development of some new indicators that add a new look on international economic relations. Trade-in-value-added indicators, for example, create new possibility for analysis.

4 Need for new “satellite” accounts in International Accounts Statistics
User needs
Similar to Oliver Twist - users need ‘some more’. Unlike Oliver Twist - they usually do not say ՛please՛. Different articles periodically appear in press where, instead of blaming statisticians2, they state that official statistics
a) Does not cover new phenomena in existing framework
b) Inclusion of new economic transactions into existing framework does not reflect reality; neither provides any projections of reality on outdated and old-fashioned map
c) The data is not enough to analyse current situation (neither it is enough to analyse events in the past)
d) And last, but not least the fact that current statistical framework does not mean anything at all. The latter is very popular and even some articles describe the types of shortcomings the framework has, nevertheless they do not try to suggest a solution (there are even some statements that although the indicators fail to describe reality, there is no substitute of GDP3 indicator).
Economy is changing all the time, it is a continuing process, economy and its structure change all the time, therefore this type of criticism usually addresses statisticians rather than statistical framework. No one can require the framework to forecast the reality twenty years forward.
The main point that is worth to discuss, is whether statistical framework needs to be changed, as well as the kind of changes users need in order to be satisfied with the data. While changing general SNA framework is problematic, the user satisfaction is possible to be reached easier. Most users just need more data rather than changing existing framework. After all, statistical framework is accepted with main category and most users. We should keep this statement in mind while discussing any additional data or dataset needs.
The other thing that is misleading for the analysts or users with more simple requirements, is that they want to find a single indicator to understand developments in economy. Meanwhile use of number of indicators is capable of solving most of their problems. The main target is again GDP, but the external accounts statistics also has its part of criticism (for example, the FDI does not give real picture of investments). While some of them understand deeper the problems that exist in current data4, others may have some false understanding of what is required under methodology and why5.
2 The main target for criticism is GDP of course. A few articles could be found on separate problems of external sector statistics
concentrating on data quality more than on framework itself. Some examples are brought in article to illustrate how users criticize or look for more data.
3 See Diane Coyle, Why GDP Statistics Are Failing Us, https://www.uschamberfoundation.org/article/why-gdp-statistics-are-failing-us.
4 See for example Konstantin M. Wacker (2013), On the Measurement of Foreign Direct Investment and its Relationship to Activities of Multinational Corporations, Working Paper Series NO 1614.
5 Иван Ткачев (2019), Тихая «революция» в анализе иностранных инвестиций.

Need for new “satellite” accounts in International Accounts Statistics 5
Existing supplementary frameworks
Understanding, that the set of BOP-IIP components do not cover significant area of users’ needs is not new. For that reason, there are some additional data sets/extensions that cover different needs for statistical data. Examples of well-known frameworks/datasets are brought below. Besides, these examples there are some other datasets on different topics, covering wide range of economic areas from globalization to migration. Discussion of each is out of scope of the paper. These cases are just examples of how the existing system satisfies data needs.
External debt
Probably the most developed set of indicators concerns external debt statistics, taking into consideration that the problems with external debt in different countries started even before first macro economical tables were compiled.
The other reason is that users of this data were more powerful to demand different granularity of data on external debt. It is one thing when a researcher asks for nominal and market values of companies’ shares and another when a government (or even group of governments) requires data on bonds issued internationally.
The importance of external debt statistics was in focus of different groups, so even on national level each country compiled data based on own considerations. Introduction to first guide on external debt is very interesting and worth to be cited here (see Appendix 1). It can be used as a short guide/introduction to any new statistical initiative.
The data that are included in several tables explains in detail the structure of external debt, debt service, any other valuation changes, arears or whatever the users might need. Maybe some qualitative data can be presented as well like debt burden indicators or interest rates6, but generally the external debt statistics tables cover different user needs quite well.
International merchandise trade statistics and Statistics of international trade in services
IMTS is example how the two concepts on the same item supplement each other. Transfer of ownership in BPM6 framework is one of the basic principles. At the same time, IMTS is generally based on cross-border movement of goods. This might be more practical and easy to understand for many users. Usually the data is collected through customs and supplemented through various surveys. Data gives operative picture of development in external sector. Different granularity is available immediately.
Nevertheless, the IMTS data is treated as some raw, operational or preliminary data. For most of analysts BOP data on external trade are treated as more ‘complete’ or ‘meaningful’.
SITS also provides some additional details on international services, one of the most important things in which is the provision of the four GATS modes of supply.
6 Can be calculated based on data included in tables. Such calculations are present on World Bank data page.

6 Need for new “satellite” accounts in International Accounts Statistics
Data Template on International reserves and foreign currency liquidity
Here we have other situation, when data based on general statistical system was not sufficient to estimate vulnerabilities. Therefore, here we have data that in some cases are based not on residency principle but on liquid foreign currency characteristic instead.
Table I.B in Template suggested that a liquid asset against resident institutions can be recorded in this section. This is just item that would not be included in external sector statistics but might have significant role in assessing foreign exchange liquidity. The same applies to predetermined flows. Flows that affect reserve assets would be recorded in template. Template also asks for some more granular information on reserve assets, predetermined flows that may require information about resident-resident transaction and positions.
The need of such data is objective and based on specific view on positions and flows through the prism of international reserves and ability of country to meet its future obligations.
It should be stated clearly, that the template does not give a full picture of liquidity of country. International reserves are only one part of such indicators. Estimates can be done taking into account more indicators. But the template provides analyst with data that would play central role in such assessment. Of course, it provides enough data for narrower analysis of international reserves and sovereign positon dynamics.
Reserve template is an excellent example of a ‘satellite’ account in external sector statistics framework, that provides users with additional data and have a informative way of presenting data.
OECD Benchmark Definition of Foreign Direct Investment
The Benchmark definition is the base for FDI data calculation in BPM6 manual and at the same time it suggests another point of view on FDI presentation. While BPM6 asks to present data on assets liabilities principle both in BOP and IIP, the benchmark definition suggests to use directional principle. It also gives detailed explanaiton on FDI chain and FDI related transactions. It is worth to mention, that OECD produces a lot of data sets, from activities of multinational enterprises to transportation costs and different statistics on environment issues. Benchmark definition is well integrated in external sector statistics, but it is another example of how additional data and explanations help to describe the developments in economy.
External sector satellite accounts
Returning to the question on whether a simple data should be presented to users or more sophisticated data can be delivered to them, we should mention that it took a lot of time from researcher to find and systemize data for analysis. For cross-country comparison, it takes even more.
We can look into examples of international assistance. A very good database is kept by OECD, which allows users explore the data, however the data are formed from point of view of providers of financial assistance. At the same time, it will not cost too much to compile data for such transaction based on the existing data that all compilers have. Some more granularity can be added, like distinction between types of goods or services, arears on development flows. Such data exists already in datasets of compilers. Previously it would take a lot of time to compile such statistics, but currently IT solutions can be applied to have the data at any time it is necessary. More, BOP standard components include such items, nevertheless such details are not available on regular publications. It can be requested from statistic producers, but this means

Need for new “satellite” accounts in International Accounts Statistics 7
an additional effort for a user. There is also a need for reverse information: how much a country participates in international assistance directly and through providing finance to international organizations. Adding recipient data will bring something new to the data. Again, the data are compiled already, main donor countries already provide such information to OECD database. But this can be collected with participation of all countries both recipients and donors. And with all respect to the great work on constructing such statistics, I found some empty data for Armenia, that should be treated as official assistance. There would be also additional input if we have a harmonized definition that meet all user needs (not only from point of view of official donors).
This is an example of additional data that can be produced and delivered to public on systematic base covering all users. The experience of OECD in this case can be merged with statistical principles, which will create dataset with improved quality.
There exists another example of data that, which do not fit in the framework. Data on remittances and migration can be combined in a single tables’ group to provide a complete picture of migration and remittances. There are some initiatives to gather such information, for example by International labour organization. However, if this information is gathered in BPM6 framework, it would be economic data supplemented with some qualitative indicators. When the data are built by an organization focused on social and legal aspects of migration, it would look more a social picture supplemented with some economic indicators. One of the most problematic issues in calculating compensation of employees is compiling data on accrual basis when compilation is based on cash transfers from abroad. Analytics very often need both data, and sometimes cash inflow is more important than calculation of compensation of employees based on accrual accounting principles. Additional data like the average length of stay and the average amount of salary might be useful for analysts.
Of course, all country specific issues should form an indicator (or separate table). In Armenia we have a situation when large number of ‘new’ migrants exists, and the public wants to know information on ‘new’ migrants with the same details as for seasonal workers. I would suggest that probably this is a country specific issue, that can be identified in country’s own publication.
This is an example of data that is an extension to the existing framework.
There can be a large list of such areas that different statisticians may want to have. With obvious positive moments, several questions need to be answered before considering introduction of such indicators.
If we go back to user requirements, we can classify the need for additional/alternative data as follows:
a) Some additional granularity of data (we want to know FDI structure with traded\not traded on market breakdown)
b) Conversion matrixes with some preliminary data (we know the figures of external merchandize trade and we want to know conversion between BOP and IMTS data)
c) Additional data, that might be either extension (exclusion) from principles, or qualitative (we want to know how much average single traveller spend abroad and how long they stay there)
d) Reflection and underlining new phenomenon in economy, and how they are treated in economic statistics (for example rapid globalization).
A solution to these requirements can be setting up several satellite accounts to most important areas, that may deliver a comprehensive information on the topic. The user will benefit full picture of the selected area of economic relations. The fact, that a large set of indicators are available already, is not a strong argument. Existence of such indicators independently from each other lower their usefulness, users have to make additional significant efforts to find, understand and combine data, while the same can be done by

8 Need for new “satellite” accounts in International Accounts Statistics
statisticians easier. The author himself experienced difficulties bringing in one set information from different sources, though as a compiler he knows the principles and the sources where to look for data. Other users experience various types of difficulties, which could easily be overcome with existence of single data source.
An option should be discussed whether such information should be compiled in framework of external sector statistics or can be integrated to one common satellite account. Data on Tourism satellite accounts cover most important aspects for external accounts statistics in that area as well. A ‘Digital trade (or digital economy)’ satellite accounts in SNA can contain some tables or items concerning external digital trade in a single set of data presentation. Otherwise the users may ask for so many details, that it would be more appropriate to have a separate account for external transactions. Even in the first case the data required would be large enough to require significant participation of external sector statisticians.
However, most important areas that would have strong support by public are FDI statistics and of course digital economy. Especially in the FDI statistics field, there are many datasets and rich experience of understanding of what can be delivered to users. Recent initiatives on MNE-s, SPE’s and global value chain indicators statistics will benefit the data. Users ask for more information about FDI related production, distribution and related statistics. The author would add also transactions in international financial cooperation and remittances.
Specific data sets may be compiled with less periodicity. We should not forget about cost/benefit analysis should not be forgotten while choosing whether a new data collection system can be introduced. The coverage, quality and granularity of existing datasets (for example the same OECD database on ODA) may be enough for users and thus the additional efforts may be unjustified.
There indeed needs to be a balance between providing more information, corresponding statistical burden and user needs. Data collection and processing automatization has created a lot of possibilities for the provision of large number of statistical data to users. Current data collection, coding, storing and processing possibilities makes it possible to compile complex and very granular data on periodical bases. In future we will see even more possibilities to compile granular data. Digitalization of reporters accounting systems and implementation of artificial intelligence may create even more possibilities to compile and provide complex data. This is very important aspect in planning and considering new statistical works.
There are two important arguments against adding additional data. The first one is that there are already many separate supplementary tables and items in standard presentation in BPM6 manual that are not filled (even if the data is existing). This is a very strong argument. Probably the authors of statistical manuals had discussed different user needs and statistical capacity of different countries. If we keep going this way, there will be a need for “a guide for statistical manuals” (maybe even an academic course to learn the list of the data available). This is the reason that many countries publish not the standard presentation but the shorter version of BOP (generally hiding supplementary items). Other countries publish both long and short versions of BOP components. In case of European countries, there is a detailed version on Eurostat website which can be used directly or via automated systems.
The second one is that official statistics usually follows both international standards and internal user requirements. If a country thinks that some item or data is important for their users, it can compile and publish data on their own. If other countries want to compile additional statistics, there are no restrictions to compile the data. Going back to the example of international assistance, Japan identifies this item in their balance of payments separately due to the importance of indicating how much the country contributes to international financial aid. The counter argument is that the standard sets allow to have data on the same basis representing the same indicators. One of the main objectives of such indicators are cross country comparison. Thus, although specific data may not be important for one country, statistics should still be compiled to make possibility of cross-country comparison. Here international organizations can play central

Need for new “satellite” accounts in International Accounts Statistics 9
role in both encouraging countries to compile and bringing together data received from countries. They already have an experience, credibility and IT infrastructure to implement such tasks.
Finally, the last remark. The author of course does not suggest unification of all the indicators across all the organizations and datasets. Regardless of the discussions about the correctness and usefulness of such indicators, it seems impossible to come to an agreement to have a single set of indicators.
Conclusion
Users always need more data, and researchers are currently switching from using common datasets to using a large number of more granular data, including raw data. Growing interest in economic situation and differentiated economic structure, globalization and digitalization are pushing users to asking for more and more granularity to understand the modern complex world. By analogy of blind men trying to guess what they are touching we try to describe economy by looking into some figures. In opposite to those blind men we do not have the idea of an elephant in our mind. To understand and describe the more complex international economy we need to have data projections on different system of coordinateеs, bringing together data that is out of current SNA framework. Not only qualitative, but also some non-monetary data may help to clarify the picture of economic relations. Absence of such supplementary data makes users to apply their own figures and rely on simpler data instead of official statistics. Current IT solutions, especially database managing software and data processing techniques allow to bring not only data compilation but also delivery of statistics into a new level. It should be taken into account that statistics not only describes, but also leads users to apply and find appropriate indicators. One option is whether international organizations and especially IMF and World Bank can bring together different data sets and provide users with database as it is done for example for external debt. As mentioned before, OECD construct several supplementary data on external sector. Finally, most data (for example the data that describe globalization) cannot be constructed by any other means than cooperation between countries under coordination of supranational statistical authorities.
In addition, the experience of satellite in SNA accounts or population census can be used to compile additional data. Data, that require additional efforts can be compiled once in 2-3-5 years. This may reduce the burden of construction of additional data.

10 Need for new “satellite” accounts in International Accounts Statistics
References
William Davies (2017), „How statistics lost their power – and why we should fear what comes next”, The Guardian.
Diane Coyle, „Why GDP Statistics Are Failing Us”.
External debt: Definition, Statistical Coverage and Methodology, IMF, 1988.
Иван Ткачев (2019), Тихая «революция» в анализе иностранных инвестиций.
Konstantin M Wacker (2013), On the Measurement of Foreign Direct Investment and its Relationship to Activities of Multinational Corporations, Working Paper Series NO 1614.
Appendix 1
External debt: Definition, Statistical Coverage and Methodology, IMF, 1988
Part I, DEFINING EXTERNAL DEBT, Chapter I, SEEKING A COMMON DEFINITION OF EXTERNAL DEBT
1. THE OBJECTIIVE
The first consideration in formulating a definition of countries’ external debt is that it should respect the requirements of a wide range of users. Major users include: banks and export credit guarantee agencies for their work on risk analysis; officials involved in international financial co-operation, especially those concerned with the negotiation of debt agreements; and economic analysts in general. These and other potential users must find statistics derived from the definition relevant and realistic.
At the same time, it has to be recognised that statistics used in the assessment of external debt have already been collected and published for many years by a number of organisations, each with its own constraints and objectives. While any statistical system should be geared to the needs of the final user, the organisations are themselves among those users, and any definition is therefore bound to take into account their own practical needs.
The definition should also embody an internally consistent methodological approach to the concept of debt, capable of being articulated into some of the broader statistical systems dealing with financial stocks and flows.
It must also take into account, as far as possible, the practical problems involved in the reporting, aggregation and presentation of the statistics obtained.
This last aspect will be raised at various points in latter chapters, but it will be useful, before proceeding in Chapter II to the definition adopted by the Group, to discuss briefly the historical background to the role and purposes of the existing systems, and the methodological framework in which the definition is placed.

Need for “new” satellite accounts in external sector statistics
Bridging measurement challenges and analytical needs of external statistics: evolution or revolution?
Lisbon 2020
Mher Barseghyan, Central bank of Armenia

User needs for data
User needs moved from simple ‘more granularity’ to use of complex and differently compiled data
– Additional granularity of data – Conversion matrixes between primary and compiled
data– Supplementary data that is out of scope of the main
framework– Data on new phenomenon

How to deal with such needs
• Let the users find the data that they need– Existence of large datasets in different areas,
including those constructed by World bank, OECD, BIS
– Provide additional guidance and data that cover new economic reality
• Lead users to use specific data on selected topics– Bringing together different aspects of economic
phenomena in one data set

Current system of statistical indicators of external sector
• System of canonic data based of BOP-IIP– Standard components that are strongly follow the
logic of SNA– Supplementary components, including external debt
statistics– Indicators based on general principles of the system,
for example BIS data on banking statistics• Indicators that use some other principles due to
practical issues (external trade) or do not cross the system (real effective exchange rate)

Supplementary data in BPM6
• Many sub items in BOP-Interest before FISIM, spending of seasonal workers, indication of ultimate controlling parent in FDI related items, etc.
• More tables for IIP decomposition– Currency composition of different items, on
remaining maturity, financial derivatives, etc.
Many countries do not compile or do not publish these data

Examples of additional data sets in external sector statistics area
• External debt– Data set was developed and fully based on BPM6
principles• Data template on reserve assets and foreign
exchange liquidity– Based not only on BPM6 principles, but also on
foreign currency criteria ignoring residency criteria• International trade
– IMTS, SITS different principles

Reserve template
BPM6 compatible data
Total reserve assets
Credit lines provided by international organizations
Currency composition of reserves, some data on
securities
Data out of BPM6 scope
Other foreign assets
Foreign currency flows
Foreign currency derivatives
All other data

Satellite account: areas of interest
• Digital economy/digital trade– E-commerce, digital goods and services, digital
intermediation, details on production chain
• FDI and related statistics– FDI chains, FDI enterprises’ production,
distribution of income, role of resident UPC units, transfer of intellectual property products, etc
• International assistance, remittances

Satellite accounts on remittances
• Remittances according to balance of payments, country distribution of remittances
• Expenditures in country of destination, sectors of economy in which seasonal workers are engaged
• Data on compilation base: number of migrants/seasonal workers, cash flows, average salary, average length of stay
• Channels of remittances, cost of remittances, remittances in kind

Satellite accounts: objections
• Statistical data follow user needs• Additional burden on reporters, compilers and
international organizations• Enough data are exist in different datasets
already• Allocation of resources to areas that are in center
of interest of users rather than allocating them to make existing data in one set
• Countries do not want to compile and provide detailed data even to international organizations

Satellite accounts: arguments in favor
• Official statistics is not only about data construction, but also insuring compatibility among countries– Fit existing data into compatible framework– Make cross country comparison even if the topic is not
important to several economies • IT solutions in data management and processing allow
to construct and share detailed data with almost same periodicity
• Bringing together different aspects of economic phenomena in one set will provide users with snapshots on the topic from different point of view

Answers to your possible comments and questions
Should all data around the world be in one set No
Is it possible to bring together all the data No
Is there need to have different data compiled by different institutions
Yes
Is it possible to have additional data without strong support of international organizations
No
Will the data be usefull if not all countries will participate Partially

Thank you

1/1
IFC Conference on external statistics "Bridging measurement challenges and analytical needs of external statistics: evolution or revolution?", co-organised with the Bank of Portugal (BoP) and the European Central Bank (ECB)
17-18 February 2020, Lisbon, Portugal
Revisiting the investment income balance. What makes some EU countries different?1
Duncan van Limbergen,
Netherlands Bank
1 This paper was prepared for the meeting. The views expressed are those of the author and do not necessarily reflect the views of the BIS, IFC, BoP, ECB or the central banks and other institutions represented at the meeting.

1
Revisiting the investment income balance. What makes some EU countries
different? (Duncan van Limbergen)1
Disclaimer: The information and views set out in this article are those of the authors and do not
necessarily reflect the official opinion of the European Commission.
Abstract
The investment income balance of EU countries varies widely, with sizeable outliers often not
explained by conventional fundamentals such as the external asset stock. At the same time, tax rules
in a number of EU Member States can be used for Aggressive Tax Planning (ATP) by companies,
which may be associated with their investment income balance outturns. By comparing EU countries
potentially exposed to ATP behaviour to other EU Member States, we determine which time-varying
features, likely associated with incidence of ATP behaviour, make these countries different.
Therefore, we study various macroeconomic and other variables and use Principal Component
analysis to create a “dissimilarity score”, which marks a significant difference between the countries
potentially exposed to ATP and other countries. The dissimilarity score can help explaining current
account developments.
1. Introduction and motivation
Studies aimed at explaining current account developments, which are important for the external
sustainability analysis, use a set of conventional factors such as the net external asset position
and GDP per capita (Coutinho at al, 2018). However, for a few EU countries, a considerable part
of their current account balance dynamics remains unexplained by the standard explanatory
variables, as some of their specific characteristics are not accounted for. At the same time,
according to the European Commission’s Country-Specific Recommendations (CSRs) from 2019
and 2020, some of these countries’ tax rules can be used for Aggressive Tax Planning (ATP) by
companies, including tax rules in Cyprus, Hungary, Ireland, Luxembourg, Malta and the
Netherlands.2 This may lead to substantial activities and transactions of multinational enterprises
(MNEs), which may have only weak links to local real economic activity in these countries, but
may strongly affect their (external sector) macroeconomic statistics. The goal of this paper is to
identify a set of time-variant markers that should capture the specific characteristics of such
countries, potentially exposed to ATP.3
1 I thank Goran Vukšić and Stefan Zeugner for valuable cooperation on the paper. 2 For 2019 CSRs please see: https://ec.europa.eu/info/publications/2019-european-semester-country-specific-recommendations-commission-recommendations_en, and for 2020 CSRs please see: https://ec.europa.eu/info/publications/2020-european-semester-country-specific-recommendations-commission-recommendations_en. We note that in many instances, the CSRs recognise measures taken by these countries against the risk of ATP, but generally find that further steps are needed to fully address the features of their tax systems that facilitate ATP, and which can vary across the six Member States. European Commission (2017) provides a detailed analysis of ATP indicators. 3 In this text, we use the terms ‘countries exposed to ATP’, ‘countries vulnerable to ATP’, or simply ‘ATP countries’, to describe the countries whose tax rules can be used for ATP according to CSRs, but also generally the countries whose tax codes are seen as possibly facilitating ATP.

2
Current account balances vary widely across EU countries, with the investment income balance
sometimes being an important driver. Moreover, investment income balances are persistently in
deficit in a certain set of EU Member States. These countries can be broadly divided into two
groups. The first group consists of catching-up countries, which are mostly Central and Eastern
EU economies. The second group comprises countries found by the European Commission to have
tax rules that can be used for ATP practices, which, in general, may be related to profit shifting by
MNEs, often using Special Purpose Entities (SPEs).
Figure 1 shows the investment income balances over a longer term for 28 EU countries. Examples
of the catching-up group are the Czech Republic and Slovakia, with a long-term average income
deficit of 6% of GDP. This is broadly comparable in size to deficits in countries exposed to ATP,
such as Malta and Luxembourg (with income deficits of respectively 5% and 9% of GDP on
average).4
While both groups of countries are characterised by persistent deficits, the reasons for deficits
across the groups differ. In the catching-up economies, foreign-owned firms move into an
economy and engage in real economic activities, such as establishing production facilities in order
to benefit from, among other factors, relatively cheaper labour, or from market access in non-
tradable sectors. Their business activities in the host economy usually require substantial local
labour inputs, depending on the exact labour intensity of their activities. Subsequently, the profits
of foreign-owned firms are repatriated to the home economy, which lowers the income balance
and the current account via income outflows on foreign liabilities.
Figure 1: Investment income balance, % of GDP (average 2005-2018)
Source: Eurostat.
Note: Yellow bars pertain to countries exposed to ATP. Data for Cyprus are missing in 2005, 2006 and
2007.
In contrast, in many countries vulnerable to ATP, foreign investments often have only very weak
links to the local real economy and are likely to be largely motivated by tax planning. In such
economies, the difference between the yield on external assets and external liabilities may be
4 Note that the Netherlands is somewhat different in this respect, despite being considered a country exposed to ATP – it recorded a long-term average investment income surplus.

3
artificially low due to profit shifting, as transfer pricing and other practices increase returns on
external liabilities and depress the yield differential (see e.g. Tørsløv et al, 2018; Vicard, 2019).
Indeed, as profits are shifted to the ATP country, often in ways that do not immediately affect the
investment income account, and subsequently repatriated to the parent company, an investment
income deficit emerges.5
Figure 1 also shows that the Netherlands and to some extent Cyprus, record different average
values of investment income balance from other countries exposed to ATP, as well as from
catching-up economies. Thus, the group of ATP countries may also be quite heterogeneous in
some important aspects, which are unlikely to be well captured using a single indicator. Even if
one would fully rely only on the tax planning aspects to account for differences across countries,
using only a single variable, such as statutory corporate income tax (CIT) rate, would hardly be
sufficient. As noted by Crivelli et al (2015), the attractiveness of tax rules in some countries does
not stem only from possibly lower tax rates – the statutory tax rates actually need not be (much)
lower than in other countries. Other aspects of the special tax regimes and arrangements also
matter, including the possibility of taking advantage of potential loopholes using innovative tax
engineering techniques (Damgaard et al, 2019a). Most of these additional aspects are, however,
very difficult to measure with the available data.
Still, results from the related research indicate some of the potential candidate variables that
might be useful in identifying specific characteristics of countries exposed to ATP and building an
ATP incidence indicator. For example, Damgaard et al (2019b) try to decompose total FDI into
real and phantom investment, with the latter defined as investments into empty corporate shells
(i.e. SPEs) with no, or with very weak links to the local real economy. They find that phantom
investment accounts for nearly 40% of total global FDI in 2017, growing from around 30% in
2009, and that these are largely hosted by ATP countries, most notably Luxembourg, the
Netherlands and Ireland (out of EU countries vulnerable to ATP). One should note, however, that
also this type of investment has some, although weak links to local economy, which may be quite
specific, such as relatively high demand for services of local lawyers or accountants, as compared
to other local inputs. Thus, in order to identify distinct features of EU ATP countries, we use,
among others, proxies for the real activities of MNEs in host economies and the characteristics of
the local economy that may be related to the specific types of MNEs’ local activities. In a similar
way, using insights from other related research as well as stylized facts about ATP countries’
shared characteristics, we choose a number of variables (presented in the next section) that could
be helpful in identifying the ATP incidence.
We focus on the investment income balance and on the above observation in Figure 1 showing
large investment income deficits in most EU ATP countries over a longer period. That the
investment income balance has gained importance as a driver of the current account balance is
to large extent related to the build-up of gross external asset and liability positions over recent
decades, which have been driven also by profit shifting and SPEs (Adler et al, 2019; Damgaard et
al, 2019b). While in some cases this item may be large, it can be (partly) offset in the overall
5 The three forms of profit shifting used by MNEs include i) transfer pricing, i.e. manipulation of intra-firm exports and import prices; ii) profit shifting using intra-group debt, i.e. interest payments; and iii) (re-) locating intangible, income-generating assets to a country whose tax system may facilitate ATP, including e.g. patents, algorithms, or financial portfolios (Tørsløv et al, 2018). Heckemeyer and Overesch (2017) provide a survey of empirical literature on profit shifting and conclude, inter alia, that non-financial shifting techniques are the dominant methods.

4
current account. This is true for both country groups with investment income deficits identified
above.6
This paper aims to pinpoint which variables are related to the investment income deficit and
which variables differentiate between EU countries labelled as countries exposed to ATP and
others. Indeed, as the deficit emerges in two sets of countries, we should be able to find markers
that have a similar effect on the investment income balance for the two groups, and markers
which differentiate between catching-up countries and ATP countries. The aim is to find specific
markers for the latter group. Our work is related to the literature on finding indicators of
countries with tax systems potentially facilitating ATP behaviour, such as European Commission
(2017). As we test for the importance of a number of markers, also the heterogeneity within the
group of EU ATP countries can potentially be explained.
Partly, this research is the mirror image of the debate on excess returns on foreign assets, i.e.
higher returns on net external assets than explained by conventional standards. Indeed, a
longstanding debate in the literature pertains to excess returns or the “exorbitant privilege” a
country like the US enjoys on its foreign assets, contrary to e.g. the euro area (e.g. Habib, 2010).
The debate on these excess returns leads to diverging explanations ranging from risk-taking and
dollar dominance to profit shifting (Setser, 2018 and Wright and Zucman, 2018). Bruner et al
(2018) follow the latter explanation and estimate US foreign income to be inflated by 1/3rd due
to profit shifting. EU countries are major counterparts for these profit shifting operations, as
evidenced by profit repatriation flows following the US tax reform in 2017 (CBI, 2018). This paper
thus takes the opposite perspective and looks at economies with potentially unexplained
investment income deficits. In other words, we look for the excess negative returns given certain
economic fundamentals, such as the net international investment position (NIIP).7
The remainder of the paper is structured as follows. Section 2 gives a data overview and explains
the various markers used to build an ATP score. Section 3 presents the methodology and results,
while section 4 concludes.
2. Data overview
We select markers that explain the investment income balance, which can be classified in two
groups. The first group captures conventional determinants, such as the NIIP or the foreign-
owned share of gross value added. Indeed, a higher NIIP or less foreign-owned share of value
added should increase the investment income balance (e.g. Alberola et al, 2018).
The second group consists of less conventional markers with the aim to capture specific
characteristics of countries exposed to ATP. These markers relate to MNEs (e.g. merchanting) and
SPE (e.g. gross financial asset ratios) activity, but also to statistical discrepancies (such as the
difference between trade balances calculated using different methodologies). Corporate
6 For the catching-up economies, an income deficit is often offset by a trade surplus in goods. This may hold true also for the countries vulnerable to ATP, if foreign investors engage in profit shifting to these locations using transfer pricing in intra-firm international trade transactions. This would increase the host countries trade balance, while lowering its investments income balance. Similarly, the intangible assets relocated to an ATP country by foreign investors may lead to higher exports (of services) from that ATP country (see e.g. IMF, 2018, for the case of Ireland). 7 Related to our perspective, Knetsch and Nagengast (2017) dissect the seemingly low investment income on Germany’s external assets by analysing the individual components (yield level effect, portfolio composition effect and net stock effect).

5
offshoring may affect current account data via numerous channels, such as overestimation of
exports and accompanying divergence between trade flows records based on varying
methodology (BIS, 2018). In addition, we observe a striking correlation between production and
sales abroad (i.e. merchanting and contract manufacturing) and large investment income deficits
in some ATP countries. This is the case in Ireland (IMF, 2018). As Adler et al (2019) put forward,
the activity of merchanting can both capture “true” merchanting and profit shifting. The latter
form would coincide with higher income outflows.
Data sources include Eurostat, IMF, OECD, World Bank and ZEW. Data is not always available for
all countries and in some cases the time span is limited, often caused by a change in definition
(BPM5, BPM6) or a change in the survey method.
Conventional markers
Net international investment position (NIIP): in theory, a higher NIIP should lead to an increase
of the investment income surplus. Expressed in % of GDP.
Share of domestic value added in gross exports: This marker aims to capture the position of the
country in the value chain structure. A country which is higher up in the value chain uses more
domestic value added in the own gross’ exports. More domestic value added in the exports in
principle entails less foreign ownership of the domestic capital stock and production. It is thus
less dependent on foreign firms, which usually repatriate profits out of the economy back to
the headquarters, thereby lowering the income balance and current account balance (Brumm
et al, 2019). As such, this marker should be positively correlated with the income balance and
current account balance. In principle, this marker is unrelated to ATP behaviour.
Foreign-owned share of gross value added: When a higher share of the gross value added
realized in an economy is accounted for by foreign-owned production factors, we expect
bigger profit repatriation. As such, a higher degree of foreign ownership should negatively
correlate with the income balance. Note that this is in line with the NIIP rationale, where
income outflows are linked to external liabilities. This correlation should in principle not
depend on the country being exposed to ATP or not, and thus be a comparable marker for
both sets of countries. Yet, in case MNEs engage in profit shifting, for instance via transfer
pricing, income outflows may be outsized (Tørsløv et al, 2018). As a proxy for the marker, we
use the foreign-owned share of the gross operating surplus, available in the FATS database
(Statistics on the structure and activity of foreign affiliates) in Eurostat.
ATP markers
Merchanting: Merchanting is goods trade that does not cross the border of the firm’s resident
country. The difference between receipts from goods sold abroad and expenses for goods
purchased abroad is recorded as net exports of goods in the Balance of Payments of the firm’s
economy (Beusch et al, 2017). Merchanting is often sizeable in smaller, open economies
hosting many MNE headquarters, such as Sweden (Riksbank, 2017). It is a phenomenon that
alters the current account in possible significant ways, for example by having a substantial
upward effect in the Swedish case. At the same time, significant merchanting revenues are
prevalent also in countries that are generally considered to have tax systems potentially
facilitating ATP behaviour, such as Luxembourg and Ireland. In this vein, Adler et al (2019)

6
put forward that merchanting activity can capture both “true” merchanting as well as profit
shifting. Expressed in % of GDP.
BoP G1-FTS difference: Trade statistics are recorded according different methodologies. This
variable captures the difference between the G1 entry in the Balance of Payments (BoP),
which indicates the “general merchandise” trade balance8 and the merchandise trade balance
under the Foreign Trade Statistics (FTS) rules. The BoP method focuses on international
transactions, while FTS is based on the declaration of external trade. The FTS data only
records goods trade that crosses the country’s own physical borders, while the BoP method
also includes international transactions which involve transactions outside the country’s own
borders. An example of the latter is contract manufacturing, where goods are produced
overseas on behalf of a firm (in the resident economy) which holds blueprints or Intellectual
Property assets. This variable can loosely be regarded as a proxy for the globalization of an
economy and its current account. A bigger G1-FTS difference (thus, a higher value for the
marker) indicates that a higher share of a country’s net exports are realized outside of its
borders. The BoP G1-FTS difference can correlate with ATP incidence if it reflects MNE
offshoring via e.g. contract manufacturing arrangements, such as in the case of Ireland
(Department of Finance, 2019).
Gross external assets and liabilities: countries with tax systems that may facilitate ATP
behaviour are often associated with unconventionally high external asset and liability
positions (EC, 2017 and Van ‘t Riet and Lejour, 2018). As these countries often exhibit
investment income deficits, we expect a negative correlation between this marker and the
income balance. The correlation for other countries should in principle be less clear. Yet, a
relatively high gross external asset position may also indicate a “leveraged investor” position,
which could correlate with a higher income surplus if the investing country takes on more
risk. Expressed in % of GDP.
Direct investment share in foreign assets: Profit shifting and phantom investments, such as
those channelled via SPEs, often take the form of direct investment (Damgaard et al, 2019a).
A higher share of direct investment in the total foreign asset composition may thus correlate
with ATP incidence and a lower income balance. Conversely, genuine direct investment may
yield a higher return than other types of investment such as portfolio-held. Insofar the higher
relative return holds, a higher share of direct investment may correlate with a higher relative
investment income balance.
Statutory corporate tax rate: One of the potentially most important aspects of the ATP is low
corporate tax rates. In principle, a higher domestic tax rate could increase the investment
income balance due to profit shifting, as production and assets are shifted to the low-tax
country and subsequently repatriated back via income account. The investment income
balance should thus be positively correlated with the tax rate. For relatively high-tax
countries such as the US and France, this is evidenced by Setser (2018), Wright and Zucman
(2018) and Vicard (2019). Dowd et al (2017) show that the elasticity of MNE profits to tax
changes is disproportionally high in low-tax countries.
Effective average tax rate (EATR): The effective average tax rate is often used to consider
discrete investment choices for (mutually exclusive) hypothetical investment projects across
potential locations. It is measured by the proportion of total income taxed away in specific
locations (see European Commission, 2019, pp. 296-297; more details of calculation
methodology are available in Devereux and Griffith, 1999). In principle, this variable should
8 Merchanting and “branding and non-monetary gold” are not taken into account.

7
better capture the true taxation than the statutory tax rate. However, effective (average) tax
rates should be more relevant for investment-location decisions of investors, while MNE’s
decisions on where to report generated profits is likely to be determined primarily by the
statutory tax rates (Deveraux, 2007). The two rates are positively and relatively strongly
correlated. Again, we expect the correlation with the investment income balance to be
positive in case of profit shifting and repatriation.
Share of corporate tax revenue in total tax revenue: countries with tax systems possibly
facilitating ATP generally collect more of their total tax revenue from corporate taxes (Tørsløv
et al, 2018). As such, there should be a negative correlation between this marker and the
income balance. As the government collects a larger share of tax revenue from corporations
(a possible indication of higher ATP incidence), the income balance should decrease.
Lawyer prevalence: This indicator aims to capture relative overrepresentation of lawyers and
accountants in a country, based on their employment share in a country’s total employment.
Data are collected from the detailed Labour Force Survey in Eurostat. More lawyers and
accountants as share of total employment could for instance indicate a higher degree of shell
firms or SPEs in an economy. Indeed, one of the few “real” economic effects of SPEs in an
economy is higher employment of lawyers. In order to correct for the need of more lawyers
due to a relatively complex legal system and relatively less rule of law, we divide the
lawyer/employment ratio by the World Bank Rule of Law indicator. The Rule of Law score
(indicating a more efficient legal system and lower demand for lawyers) should even out
relative overrepresentation of lawyers in countries with less efficient legal systems. As a
result, a higher number indicates an elevated presence of lawyers and accountants
(controlled for legal system efficiency) which may be linked to more SPE activity in an
economy and indicate ATP incidence.
Share of legal activities in gross value added: The rationale for this variable is similar to the
lawyer prevalence indicator. In this alternative, the share of the “legal and accounting
activities, head office activities and management consultancy activities” in an economy’s
gross value added proxies prevalence of legal and accounting activities. A higher number
could be an indicator for elevated SPE activity in an economy.
Retained earnings balance: The trade balance on retained earnings may serve as a proxy for
ATP incidence if foreign-owned firms retain an outsized amount of profits, for example in a
low-tax economy. In that case, a large deficit on FDI retained earnings occurs. An example of
this is the retaining of profits by US MNEs in EU economies, linked to the tax treatment of
foreign profits before the 2017 UX tax reform (CBI, 2019).
Turnover per person employed in foreign-controlled firms: An unconventionally high
turnover/worker number in foreign-owned firms may be an indicator for profit shifting to
countries with tax rules that can be used for ATP. In this case, profits are shifted to low-tax
economies, where turnover increases on paper while profits are repatriated in turn. This
indicator should correlate positively with ATP incidence and lower the income balance. The
data source is FATS (see above).
Specific services trade balances: Profit shifting can be realized by strategic placement of e.g.
Intellectual Property (IP) assets and corresponding royalty flows (EC, 2017). If this is the case,
outsized income flows (i.e. a higher trade imbalance in percentage of GDP) can indicate higher
ATP incidence. Two subcategories of services trade balances are considered: “other business
services” and “charges for the use of intellectual property”. Instead of the trade balance, one
can also consider gross credit or debit flows.

8
Ratio of financial flows to real trade flows: A strong prevalence of financial flows over real
trade flows may indicate widespread ATP behaviour (Avdijiev et al, 2018), for example via
the outsized role of MNE profit shifting and SPEs in an economy. Avdijiev et al show that this
ratio can be five times higher in financial centres compared to the all-country sample.
Current account fit: This is the fitted current account value from the regressions in Coutinho
et al (2018).
To conclude, we present an overview of several markers, where we highlight data outliers (red
cells in Table 1). These outliers are based on the long-term average of the marker being larger
than median plus one standard deviation of the unweighted EU average. This approach allows for
a first ordering of EU countries by ATP incidence. Ireland, Cyprus and Luxembourg show up as
largest outliers with five or more markers deviating from the EU median. Malta and the
Netherlands also display potential ATP incidence with more than two highlighted markers.
Table 1: Overview of selected markers by outliers
Note: Cell is highlighted in red if long-term average is larger (resp. smaller for EATR and RE_Bal) than (median+st.dev) of EU sample.
3. Methodology and results
We start by performing regressions in order to get a first overview of potential markers affecting
the investment income balance. Table 2 shows the coefficients of six estimation methods, being
(1) pooled OLS for all EU countries, (2) country fixed effects OLS for all EU countries, (3) pooled
OLS for the 22 non-ATP countries (excluding NL, IE, LU, CY, MT and HU), (4) country fixed effects
OLS for the 22 non-ATP countries, (5) Bayesian Model Averaging (BMA) for all EU countries and
(6) BMA for the 22 non-ATP countries. The direct investment share in total assets, the corporate
income tax revenue share, the lawyer prevalence indicator, the gross value added of the legal
sector and the reinvested earnings balance seem to show up as relevant indicators in most
methods. Furthermore, the inclusion of the six countries vulnerable to ATP matters strongly for
the results. In terms of both magnitude, significance and sign, omitting the ATP countries group
affects the relationship between the markers and the income balance substantially.

9
Table 2: Estimation results based on (fixed-effects) OLS and Bayesian Model Averaging, with the
investment income balances as the dependent variable
Note: OLS significance denotes Driscoll and Kraay standard errors. BMA based on full enumeration of alternatives, using a hyper-g
prior and a Ley and Steel (2008) random model prior.
We proceed to choose the most relevant markers by BMA based on the 22 non-ATP countries
(column 6 in Table 2). Figure 3 shows the variables which provide the best fit to determine the
investment income balance based on the 500 model variants with the most explanatory power.
This agnostic approach determines which variables would ideally be included in the model to
explain the investment income balance. Apparently, variables such as the NIIP, the retained
earnings balance, the G1-FTS difference and the effective average tax rate show up as having the
most explanatory power for the investment income balance bases on these 500 model variants.
Dependent: IB
pooled 28 fixed effects 28 pooled 22 fixed effects 22 BMA 28 BMA 22
(1) (2) (3) (4) (5) (6)
(Intercept) 4.61 -4.87 *** 4.30 (1.00) -5.03 (1.00)
niip 0.03 *** -0.01 ** 0.02 *** 0.04 *** 0.03 (1.00) 0.02 (1.00)
cafit 0.27 *** 0.15 0.09 *** 0.00 0.24 (0.98) 0.05 (0.57)
l.tax -5.05 ** -1.47 -0.07 4.58 *** -3.32 (0.70) 0.15 (0.22)
log.gross_position. -0.66 -0.61 1.26 *** -0.84 ** -0.39 (0.62) 1.21 (1.00)
l.foreign_gva -2.00 *** -0.62 -0.08 -0.66 -1.98 (1.00) -0.03 (0.17)
l.DI_share 0.07 -1.84 ** -0.21 * -0.36 0.07 (0.39) -0.12 (0.37)
G1FTS 0.24 *** 0.04 0.13 ** 0.01 0.23 (1.00) 0.14 (0.99)
l.merchanting 0.24 *** 0.10 ** 0.04 0.02 0.17 (0.73) 0.00 (0.14)
l.EATR 5.09 ** 5.73 ** 2.62 *** -0.40 3.36 (0.70) 2.21 (0.91)
l.CIT_TOT 0.13 -0.15 -1.64 *** -1.37 ** 0.01 (0.36) -1.73 (1.00)
lawyers -0.61 *** -1.41 *** -0.51 *** -0.05 -0.51 (0.83) -0.32 (0.70)
l.legalGVA 1.33 ** -0.97 ** -0.47 ** 0.56 * 1.13 (0.85) -0.18 (0.30)
RE_bal 0.45 *** 0.40 *** 0.81 *** 0.76 *** 0.46 (1.00) 0.85 (1.00)
sh_deb 0.55 *** 0.40 *** 0.66 ** 0.48 0.53 (1.00) 0.73 (0.89)
l.fin2tradflow 0.45 *** 0.22 * 0.06 0.10 ** 0.31 (0.74) 0.01 (0.15)
R2 0.85 0.59 0.93 0.75 0.85 0.93
Adj. R2 0.84 0.48 0.92 0.68 0.84 0.92
Nb. Obs. 194 194 154 154 194 154
Incl. 6 ATP YES YES NO NO NO YES
Fixed eff. NO YES NO YES NO NO

10
Figure 3: Variables to be included in investment income balance regression based on BMA using
500 model variants with most explanatory power
Note: BMA based on full enumeration of alternatives, using a hyper-g prior and a Ley and Steel (2008) random model prior.
The six identified ATP countries are vastly different from the 22 non-ATP countries. Figure 4
shows the observed and predicted (based on BMA for 22 non-ATP countries) income balance.
While the income balance of the 22 non-ATP countries (grey) have a well-predicted income
balance, the six countries exposed to ATP (blue) display huge difference between predicted and
actual income balances. The difference is very pronounced in the cases of Luxembourg and
Ireland, the countries with the largest average income deficit (see above). Interestingly, we find a
correlation between the absolute value of the current account residual based on Coutinho et al
(2018) and the absolute value of the income balance residual (Figure 4b). As such, there is a link
between the unexplained components of the investment income balance and the current account
balance. The unexplained parts are the largest for the six ATP countries.
Figure 4a: Predicted and observed income balance

11
Figure 4b: Absolute values of the income balance residual and current account residual
Next, we introduce Principal Component analysis (PCA) in order to find common trends within
the group of markers. Especially for countries exposed to ATP, finding common components
between markers can give rise to an “ATP score”. We find evidence that components might be
intertwined, for example between the merchanting balance and the BoP G1-FTS difference
(Figure 5). Taking this example, this would mean that a higher merchanting balance coincides
with a bigger difference between the G1 and FTS merchandise trade balance (as a proxy for the
globalization of the current account).
Figure 5: Merchanting balance and BoP G1-FTS difference
The PCA method creates several principal components ranked by explained variance and
indicates that notably taxation and legal markers share a similar component in the first principal
component. The statutory and effective average corporate income tax, the lawyer score and legal
gross value added, the direct investment share, the gross international investment position and
the merchanting balance show up as the most relevant variables in the first principal component
(Figure 6). We choose to proceed considering only the first principal component, which already
explains 41% of the variance in the data set. Other components might already pick up exposure
to ATP behaviour, which is unwanted for our ATP score, as the latter should reflect the distance
to principal component based on values of markers typical for non-ATP countries.

12
Figure 6: Principal Component Analysis of non-ATP countries, first and second eigenvector
This allows us to create a “dissimilarity score”, i.e. ATP score, to pinpoint which countries are
most dissimilar with respect to the first principal component based on the restricted non-ATP
sample and the full set of markers (blue bars in Figure 7). The ATP score or dissimilarity score
measures the Euclidean distance between the observations for each country with respect to the
first principal component. Ireland stands out as being the most dissimilar, while the other five
countries vulnerable to ATP (LU, NL, HU, CY and MT) also have a relatively higher score.
Interestingly, the dissimilarity score correlates with a score based on the absolute income balance
residual (yellow bars in Figure 7), i.e. the unexplained component of the income balance based
on the BMA for the sample of 22 non-ATP countries. Note that the income balance residual can be
read in % of GDP.
Figure 7: “Dissimilarity score” and score based on the income balance residual

13
We view the dissimilarity score as a proxy for ATP incidence, i.e. a large score correlates with a
higher possibility of having characteristics of a country whose tax rules can be used for, or may
facilitate, ATP behaviour. In addition to this, the dissimilarity score might help in explaining the
current account balance better and thus aid in external sustainability analysis. This is backed by
the positive correlation between (the log of) the dissimilarity score and the current account
regression residual based on Coutinho et al (2018) (Figure 8).
Figure 8: Dissimilarity score and current account regression residual
4. Conclusion
We develop a “Dissimilarity score” to gauge ATP incidence of EU countries based on a set of
economic, statistical and legal markers. While the investment income deficits of catching up EU
economies can be predicted well using these markers, the large income deficit of countries
exposed to ATP cannot. We use Principal Component analysis to find common components
between the markers and create a dissimilarity index, which we regard as a proxy for ATP
incidence or “ATP score”. Mostly taxation and legal markers and the direct investment share in
foreign assets have similar components. The ATP score differentiates between countries based
on the set of markers and correlates with the unexplained part of the income balance. The index
indicates Ireland as having the largest ATP incidence, while the other five EU countries vulnerable
to ATP also display relatively high values. The developed ATP score correlates with current
account regression residuals and may thus help in external sector sustainability analysis.

14
References
Adler, G., Garcia-Macia, D. and Krogstrup, S. (2019), “The Measurement of External Accounts”, IMF
Working Paper 19/132.
Avdijiev, S., Everett, M., Lane, P. and Shin, H. (2018), “Tracking the International Footprints of
Global Firms”, BIS Quarterly Review March 2018.
Alberola, E., Estrada, A. and Viani, F. (2018), “Global Imbalances from a Stock Perspective. The
asymmetry Between Creditors and Debtors”, BIS Working Paper No. 707.
Beusch, E., Barbara Döbeli, B., Fischer, A. and Yeşin, P. (2017), “Merchanting and Current Account
Balances”, The World Economy, 40 (1), pp. 140‒167.
Brumm, J., Georgiadis, G., Gräbb, J. and Trottner, F. (2019), “Global value chain participation and
current account imbalances”, Journal of International Money and Finance, 97, pp. 111‒124.
Bruner, J., Rassier, D. and Ruhl, K. (2018), “Multinational Profit Shifting and Measures Throughout
Economic Accounts”, NBER Working Paper 24915.
Central Bank of Ireland (2019), “US Profit Repatriations and Ireland’s Balance of Payment
Statistics”, Quarterly Bulletin 02, April 2019.
Coutinho, L., Turrini, A. and Zeugner, S. (2018), “Methodologies for the Assessment of Current
Account Benchmarks”, European Commission Discussion Paper 086.
Crivelli, E., De Mooij, R. and Keen, M. (2016), “Base Erosion, Profit Shifting and Developing
Countries”, FinanzArchiv/Public Finance Analysis, 72 (3), pp. 268–301.
Damgaard, J., Elkjaer, T. and Johannesen, N. (2019a), “The Rise of Phantom Investments”, Finance
and Development, September 2019.
Damgaard, J., Elkjaer, T. and Johannesen, N. (2019b), “What Is Real and What Is Not in the Global
FDI Network?”, IMF Working Paper 19/274.
Department of Finance (2019), “Balance of Payments in Ireland”,
https://www.gov.ie/en/publication/7b9c21-balance-of-payments-in-ireland/.
Devereux, M.P. and Griffith, R. (1999), “The taxation of discrete investment choices”, Institute for
Fiscal Studies Working Paper 98/16 (Revision 2), London: Institute for Fiscal Studies.
Devereux, M.P. (2007), “The Impact of Taxation on the Location of Capital, Firms and Profit: a
Survey of Empirical Evidence”, Oxford University Centre for Business Taxation Working Papers,
07/02.
Dowd, T., Landefeld, P. and Moore, A. (2017), “Profit Shifting of U.S. Multinationals”, Journal of
Public Economics, 148, pp. 1‒13.
European Commission (2017), “Aggressive tax planning indicators. Final Report”.
European Commission (2019). Taxation Trends in the European Union. DG Taxation and Customs
Union, 2019 Edition. Luxembourg: Publications Office of the European Union, 2019.
Habib, M. M. (2010), “Excess Returns on Net Foreign Assets”, ECB Working Paper No. 1158.
Heckemeyer, J.H. and Overesch, M. (2017), “Multinationals' profit response to tax differentials:
Effect size and shifting channels”, Canadian Journal of Economics/Revue canadienne
d’ economique, 50 (4), pp. 965–994.

15
IMF (2018), Ireland 2018 Article IV Consultation, Annex II. External Stability Assessment.
Knetsch, T. and Nagengast, A. (2017), “Penny Wise and Pound Foolish? On the Income from
Germany’s Foreign Investments”, Review of World Economics, 153 (4), pp. 753‒778.
Riksbank (2017), “Merchanting and multinational enterprises – important explanations for
Sweden’s current account surplus”
Setser, B. (2018), “Understand the U.S. Investment Income Balance”, Council on Foreign Relations.
Tørsløv, T., Wier, L. and Zucman, G. (2018), “The Missing Profits of Nations”, NBER Working Paper
24701
Van ’t Riet, M. and Lejour, A. (2018), “Optimal tax routing: Network analysis of FDI diversion”,
International Tax and Public Finance 25 (5), 1321‒1371.
Vicard, V. (2019), “The Exorbitant Privilege of High Tax Countries”, CEPII Working Paper No.
2019-06 – March.
Wright, T. and Zucman, G. (2018), “The Exorbitant Tax Privilege”, NBER Working Paper 24983.

16
Annex with additional figures
Figure 1: Investment income balance and net international investment position
Figure 2: Merchanting balance and current account balance, % of GDP (2017)
Figure 3: Difference between BoP G1 and FTS trade balance, % of GDP (2017)

17
Figure 4: Direct investment share in foreign assets
Figure 5: Lawyer prevalence
Figure 6: Lawyer prevalence indicator and the investment income balance

18
Figure 7: Retained earnings balance, % of GDP (average 2005-2018)
Figure 8: Turnover per person employed in foreign-controlled firms, in thousands of euros (2017)
Figure 9: Services trade balance on subcomponents, % of GDP (long-term average)

19
Figure 10: Ratio of financial flows to real trade flows
Figure 11: Dissimilarity index and score based on investment income balance regression residual

20
Figure 12: Dissimilarity index and current account regression residual variance

1/1
IFC Conference on external statistics "Bridging measurement challenges and analytical needs of external statistics: evolution or revolution?", co-organised with the Bank of Portugal (BoP) and the European Central Bank (ECB)
17-18 February 2020, Lisbon, Portugal
The system of the presentations of the external sector statistics, strategy and the way of future development1
Natalia Kupriianova and Nataliya Osiptsova,
Bank of Russia
1 This presentation was prepared for the meeting. The views expressed are those of the authors and do not necessarily reflect the views of the BIS, IFC, BoP, ECB or the central
banks and other institutions represented at the meeting.

The system of the presentations of the external sector statistics, strategy and the way of future development 1
The system of the presentations of the external sector statistics, strategy and the way of future development
Natalia Kupriianova, Nataliya Osiptsova, Bank of Russia
Abstract
Rapidly growing technical capabilities, the changing demand of the users for the timely and high-quality data, including the growth of the international integration and the emergence of new financial instruments, increase attention at both international and national levels to timely statistical information with a high level of detail. The external sector statisticians are tasked to broaden the range of published data without losing the quality of regular reports under the international standards. The important aspect is the development of advanced technologies in the field of data transmission, the expansion of the formats of punished information and improving the visibility of the information.
The paper describes the existing system of the presentation building of the external sector statistics taking into consideration the basic international principals of the formation of the external sector statistics and national standards (formats) of the data presentation. A brief overview of the methodological principals and regulatory framework for the construction of the external sector statistics in the Russian Federation is given. The current trends in the balance of payments, international investment position and external debt of Russian Federation and their reflection in the regular publications of the Bank of Russia are revealed. Recent achievements in the field of improving the quality of published data and future development of statistics is described.
Keywords: external sector statistics, balance of payments statistics, data collection, international investment position, external debt
Contents Abstract ....................................................................................................................................................... 1
Introduction ............................................................................................................................................... 3
Conceptual framework of external sector statistics ................................................................... 3
System of the statistical data presentations ................................................................................. 4
Principles of formation of external sector accounts of the Russian Federation ............. 7
Presentation of data on the Bank of Russia website ................................................................. 8
The strategy of statistical activity: improving the quality and direction of development ..................................................................................................................................... 9

The system of the presentations of the external sector statistics, strategy and the way of future development 2
Results of modernization of external sector statistics in order to expand user information support ..................................................................................................................... 10
Conclusion ................................................................................................................................................ 15

The system of the presentations of the external sector statistics, strategy and the way of future development 3
Introduction
Fast-growing technical capacities, changing demands for operational and quality data, associated with increased international integration and the advent of new financial instruments, increase attention both at the international and national level to timely statistical information with a high level of detail. The compilers of external sector statistics are tasked with expanding the set of published data without sacrificing the quality of regular reporting in accordance with international standards. An important aspect is the development of advanced technologies in the field of data transmission, the expansion of the formats of published information and the improvement of the visibility of the presentation of information.
Conceptual framework of external sector statistics
The compilation of Russian external sector statistics is based on the basic principles of official statistics, established by the United Nations, international statistical standards and recommendations, best practices and experience of statistical offices of foreign countries. The main principles include:
-high level of transparency;
-accuracy and efficiency of the information submitted;
-high requirements for the quality of statistical materials;
-close interaction with suppliers and consumers of information;
-the relationship between individual types of statistics;
-harmonization with other statistical systems;
-implementation of international comparisons.
An international framework for generating statistics on operations and a country's position in relation to the rest of the world is “Balance of Payments and International Investment Position Manual”, International Monetary Fund (BPM6).
In accordance with BPM6 the concept of the relationship between sets of accounts characterizing individual economic processes is defined, as well as the main indicators that allow for an in-depth analysis of the financial and economic condition of the country.
The study of accounts of foreign economic activity provides a direction for the policy of managing the national currency and the international reserves of the Russian Federation, helps in determining the vulnerabilities of the financial situation.
The main components of accounts of foreign economic activity are: balance of payments, which reflects the country's operations with other countries for a certain period of time, international investment position as the value of financial assets of residents of the country in the form of claims on residents of other countries (non-residents) plus reserves in the form of gold bullion and obligations of residents to

The system of the presentations of the external sector statistics, strategy and the way of future development 4
non-residents, as well as other changes in assets and liabilities not related to balance of payments transactions, market and exchange rate revaluations. Other changes
Other changes allow us to link the balance of payments and international investment position indicators into a single structure, which can be schematically presented as follows:
Interconnection of external sector accounts Diagram 1
In addition to BPM6, compilers of external sector statistics use the principles and recommendations outlined in the following guides: “Manual on Statistics of International Trade in Services”, UN, 2010; “OECD Benchmark Definition of Foreign Direct Investment - 4th Edition” (BMD4, 2008); “International Transactions in Remittances: Guide for Compilers and Users”, IMF, 2009; “International Reserves and Foreign Currency Liquidity: Guidelines for a Data Template”, IMF, 2012; “External Debt Statistics: Guide for Compilers and Use”, IMF, 2013.
Analysis of the financial account in conjunction with the current account and the capital account allows to determine the sources of financing the current account deficit or show the areas of use of their surplus. It is also possible to carry out comparisons of operations within a financial account and determine the relationships between the functional categories of the financial account.
System of the statistical data presentations
From the point of view of presentations of external sector statistics, the following main groups are proposed: by type of operations, by institutional sector, by functional category. Additional groupings include the data presentation on the maturity of financial instruments, on the currency structure of assets and liabilities. Also, depending on the relevance of the data and user requests, certain indicators of the balance of payments or international investment position are published for the main groups of countries or the main partner-countries. Particular attention is paid to mirror comparisons with the main partner-countries and the formation of the bilateral balance of payments, due to the complexity of its preparation and harmonization of individual indicators between countries.
The balance of assets and
liabilities at the beginning of the period
Transactions reflected in the
balance of payments
Valuation changes
Other changes
The balance of assets and
liabilities at the end of the
period

The system of the presentations of the external sector statistics, strategy and the way of future development 5
Main groupings of external sector statistics Table 1
By type of operation By institutional sector By functional categories
1. Current account transactions. They are reflected in the current account, these include operations of the trade balance and the balance of services, the balance of primary income (remuneration of labor, investment income, rent) and the balance of secondary income (for instance, personal transfers, taxes)
2. Financial account transactions are operations with assets and liabilities.
3. Net lending to the rest of the world (current account balance and capital account) should be equal in absolute value to the balance of the financial account
1. General government 2. Central bank 3. Banks 4. Other sectors (other financial
corporations, nonfinancial corporations, households and NPISHs are indicated separately)
1. Direct investment 2. Portfolio
investments 3. Other investments 4. Financial
derivatives 5. International
reserves
In terms of the presentation of external sector statistics, various representations are used to highlight particular features of the structure and dynamics of indicators and their impact on the national economy. For this, data sets are formed in which articles are grouped according to the goals of economic analysis.
Standard Components. The presentation of standard components is consistent with the principles of the SNA and other macroeconomic statistics accounts. As part of this presentation, two main balances are formed - for the current account and for the financial account (net lending / net borrowing). In addition, indicators on a net basis for various functional categories are calculated within accounts. The presentation of standard components is formed for the balance of payments and the international investment position of the Russian Federation.
Analytical Presentation. It is formed on the basis of standard components of the balance of payments. Its main purpose is to reflect relevant aspects of changes in current and financial accounts. Articles of most interest to users are indicated separately. The presentation is designed in such a way as to reveal the sectoral distribution of lending and borrowing in relation to the outside world. An indicator of net lending / borrowing, with the exception of reserve assets, is separately formed. The analytical presentation is formed for the balance of payments of the Russian Federation.
Main Components. Another presentation in the framework of external sector statistics is the publication of data within the framework of the main components. If the presentation of the current account in this format does not differ much from the analytical presentation, the financial account indicators are disclosed with the allocation of financial instruments that are of the greatest analytical value to users. The presentation of main components is formed for the balance of payments and the international investment position of the Russian Federation.
Additional presentations also include detailed breakdown by sector of economy: central bank, general government, banks, other sectors. To this end, sectors are disaggregated: general government is divided into federal government and local government; other sectors are divided into other financial corporations, nonfinancial

The system of the presentations of the external sector statistics, strategy and the way of future development 6
corporations and households and NPISHs. Moreover, indicators are aggregated to consolidated sectors, namely, the private sector is formed as the sum of the banking sector and other sectors. For analytical purposes in case of individual presentations, sectors are formed on the principle of state participation in the activities of private companies. For instance, in the framework of detailed analytical presentation of external debt of the Russian Federation public sector external debt covers liabilities of the general government, the central bank, and those entities in the banking and other sectors that are public corporations, i.e. non-financial or financial corporations which are subject to control by government and the central bank.
An important feature of qualitative statistics is the availability of structured and detailed metadata that contains information about the sources of information, the methods used to evaluate indicators. The obligation to inform users about data dissemination formats, publication dates and frequency in accordance with the Official Statistics Release Calendar is assigned to countries that have approved the Special Data Dissemination Standard (SDDS). The Russian Federation has adopted a tougher version of the SDDS plus, in which it takes part in the Coordinated Portfolio Investment Survey and Coordinated Direct Investment Survey.
Financial Transactions of Private Sector
(Based on the Balance of Payments, Flows Data) Table 2
1.Financial transactions of private sector
(net lending (+) / net borrowing (-))
(2+5)
Banks Other sectors
2.Financial transactions
(net lending (+) / net borrowing (-))
(3-4)
3.Net acquisitio
n of financial assets
4.Net incurrence of liabilities
5.Financial transactions (net lending
(+) / net borrowing (-))
(6-7-8)
6.Net acquisition of financial
assets
7.Net incurrence of liabilities
8."Net errors and
omissions" of balance of payments
An important statistical presentation that is not included in the main set of submissions recommended by the IMF is the «Financial Transactions of Private Sector» table developed by the compilers of the balance of payments of the Russian Federation. It is one of the most requested information by Russian users. Its indicators are included in the reporting and estimated data of the balance of payments and published in main editions of the Bank of Russia. From the point of view of methodology, the indicator is a calculated value developed on the basis of the components of the financial account of the balance of payments. The private sector refers to a set of institutional units that are not related to government and the central bank. Since the balance of payments of the Russian Federation has a stable current account surplus, most attention is paid to the net private capital outflow associated with it.

The system of the presentations of the external sector statistics, strategy and the way of future development 7
Principles of formation of external sector accounts of the Russian Federation
The historical prototype of the modern balance of payments can be called the currency plan in the USSR, which was relevant in the Soviet planned economy. Vneshtorgbank of the USSR from 1924 to 1991 was responsible for its compilation. In 1994, the authority to compile external sector statistics was transferred to the Bank of Russia, where a specialized department was formed. Since 2013, the functions of external sector statistics compiling have been assigned to the Department of Statistics and Data Management of the Bank of Russia.
In the framework of external sector statistics, the Bank of Russia compiles the balance of payments, international investment position and external debt, as well as related indicators of foreign trade in goods and services, direct and portfolio investments and other statistical data sets. The Bank of Russia regulates the mechanism of interaction of the Bank of Russia with other state agencies and legal entities that are required to provide the necessary data in the process of data collection and compilation. Compilation and dissemination of the balance of payments are governed by the Federal Law “On the Central Bank of the Russian Federation (Bank of Russia)” and other Federal Laws. The BPM6 and other international guidelines in this area constitute the methodological basis for external sector statistics.
All indicators of external sector statistics are formed in US dollars. Recalculation of financial transactions in US dollars is carried out using the rate established by the Bank of Russia at the date of the transaction, or the cross rate.
Sources of information are the reporting data on foreign economic operations of residents of Russia, regularly received by the Bank of Russia from administrative sources (customs service, various ministries and other government bodies) and through bank reporting forms. Also, in order to improve the quality of data collection and expand statistical coverage, the Bank of Russia conducts regular and ad-hoc surveys of enterprises and households involved in foreign economic activity. To determine the volume of a number of indicators that are not taken into account in official data sources, the Bank of Russia has developed a system of estimates and models. This is how the volumes of exports and imports of goods that are not included in official customs statistics are calculated. For example, operations for the purchase of goods by individuals in foreign online stores, the cost of which is below the threshold values established for registration of import of goods, are calculated.
Most of the presentations of external sector statistics are presented quarterly; the most requested data are published on a monthly basis. In particular, such publications include Monthly External Trade of the Russian Federation in Services, Cross-border Remittances via Payment Systems.
To promptly inform users, the main presentations of external sector statistics are published on the last working day of the quarter following the reporting. It includes: Balance of Payments of the Russian Federation (Standard Components), Balance of Payments of the Russian Federation (Main Components), International Investment Position of the Russian Federation (Standard Components. At a Reference Date), External Debt of the Russian Federation by Maturity and Financial Instruments, External Debt of the Russian Federation in Domestic and Foreign Currencies. The

The system of the presentations of the external sector statistics, strategy and the way of future development 8
remaining presentations are formed as they are ready, usually during the second quarter following the reporting quarter.
For analytical purposes, seasonally adjustment is performed for individual components of the current account. Aggregated indicators (trade balance, balance of services, balances of primary and secondary income and current account balance) are obtained by summing the components cleared of seasonality.
Presentation of data on the Bank of Russia website
The vast majority of data is posted on the official website of the Bank of Russia. About 150 presentations on the site are updated at various intervals. Operational data, such as estimates of the balance of payments and external debt, data on reserves are published in a short time in accordance with user requests.
Appearance of the section "External Sector Statistics" Diagram 2
In the “External Sector Statistics” section, information is distributed in separate blocks. Operational data and comments on them are presented in the “Publications” section. More than 10 thousand statistical indicators are grouped in the subsection "Statistical Data" by headings: Balance of Payments, International Investment Position, External Debt (Balance of Payments Methodology), External Trade in Goods (Balance of Payments Methodology), External Trade in Services, Cross-border Transfers of Individuals, Direct Investment, Portfolio and Other Foreign Investment, International Reserves, Ruble’s Exchange Rates.

The system of the presentations of the external sector statistics, strategy and the way of future development 9
Information is available in the form of statistical tables, some of which are grouped according to the principle of time series for the convenience of users. The published methodological data contain a description of the methods used for calculating data and evaluating indicators for which there are no direct reporting data. Additionally, short comments on the spreadsheets and full-fledged analytical materials in the framework of regular publications of the Bank of Russia are issued.
Bank of Russia Bulletin, Bank of Russia Statistical Bulletin, Bank of Russia Annual Report, Yearbook on Balance of Payments, International Investment Position, and External Debt of the Russian Federation, Yearbook on External Trade of the Russian Federation in Services, Balance of Payments of the Union state are published in printed publications and in electronic form on the website of the Bank of Russia.
For the convenience of users, as well as within the framework of the SDDS, the calendar of statistical information is posted and regularly updated on the Bank of Russia website. The minimum depth of the available period is 9 months in advance. Publications distributed under the SDDS are marked separately.
The relevance and practical utility of existing statistics to meet user needs is monitored through an electronic user survey. The website of the Bank of Russia provides the possibility of user calls through the Internet reception. Using these tools, data users submit suggestions for improving data quality. The opinion of users about the quality of the information provided and the emerging requirements for data sets is studied and taken into account when generating and publishing external sector statistics. Users are consulted and informed about specific aspects of current information through official press releases, as well as through seminars, lectures, and organizing meetings with media representatives with active feedback. For questions and suggestions, the Bank of Russia website contains contact information such as phone numbers and email addresses.
The strategy of statistical activity: improving the quality and direction of development
On the basis of the fundamental principles of official statistical accounting, international statistical standards and recommendations, best practices of the statistical units of foreign central banks, the Bank of Russia adopted the Strategy for Statistical Activities for 2016-2020. It is based on the following principles (values):
- focus on results and proactivity in interaction with respondents and users and understanding of current and future needs for statistical data;
- systematic and consistent development;
- willingness to cooperate and interaction.
In the framework of the Strategy the following areas of development of external sector statistics can be distinguished.
1. Development along with standard data sets of additional indicators of external sector statistics in accordance with presentation templates recommended by international organizations (including the currency structure of the international investment position, data on liabilities to non-residents for debt instruments, classified on the basis of the remaining maturity, individual indicators of external

The system of the presentations of the external sector statistics, strategy and the way of future development 10
sector statistics, compiled on a national basis, data on the sector of non-financial enterprises, additional indicators of statistics of direct investments, foreign trade in services).
2. Regular formation and submission of improved data of international banking statistics to the Bank for International Settlements.
3. Improving the methodology for the formation of bilateral balance of payments and the development of a methodology for compiling a bilateral international investment position.
4. Development of methodological principles for the formation of a system of indicators of the state and movement of foreign investment in relation to the economy of the constituent entities of the Russian Federation.
5. Improving the methodology for evaluating cash transfers.
6. Maintaining up-to-date retrospective data series of macroeconomic statistics.
The strategy determined that forms of communication with users of macroeconomic statistics will develop in the course of the relevant work, as well as active interaction with government bodies, foreign central banks, international organizations will be carried out in order to improve the quality of macroeconomic statistics, generate additional data sources and improve its compilation methodology.
In the field of using integrated solutions based on a modern IT component for the preparation and presentation of data to users in the required forms and formats, they will be carried out to centralize and further improve data dissemination processes.
Data will be provided to users in a centralized and improved format using integrated solutions through the implementation of Warehouse, which will present complete data sets and a variety of tools for downloading and processing data that are convenient for users. For these purposes, it is planned to improve information interaction with international organizations through the development and implementation of a unified electronic data exchange format based on the international standard for the exchange of statistical data and metadata (SDMX); to continue working on the development of the statistics section on the official website of the Bank of Russia regarding the consolidation of statistical information and the provision of access to databases.
Results of modernization of external sector statistics in order to expand user information support
The implementation of improving the quality of external sector statistics occurs in the following areas:
- increasing the efficiency of data provided;
- data detailing;
- the formation of regional statistics.
Improving data responsiveness. In order to inform about the state of the balance of payments and the amount of external debt on a more timely basis, the Bank of

The system of the presentations of the external sector statistics, strategy and the way of future development 11
Russia, in addition to publishing regular reports, began to carry out monthly and quarterly estimation of these indicators of the external sector statistics. To estimate, all operational information available at the Bank of Russia is used, including information on the banking sector and customs data. Key indicators of the balance of payments are estimated monthly by the compilers of the statistics and published simultaneously for all users on the 7th working day of the month at 16:00 on the Bank of Russia website. Quarterly estimates are available in tabular form as part of the analytical presentation of the balance of payments and external debt.
In order to monitor and analyze social and economic situation of the country as part of the implementation of the work of state authorities on economic development management analytical material on the estimate of the balance of payments and external debt is prepared.
To expand the information support of users, in August 2018, the Bank of Russia supplemented the list of publications on external sector statistics with monthly data on foreign trade in services. The new publication was developed taking into account the actual needs of users of statistical information, including those related to the implementation of state programs for economic development. The publication format contains monthly (starting from January 2017) volumes of exports and imports of the most significant categories of services. In order to inform users about the current situation in the sphere of foreign trade in services, the publication includes operational estimates of the months of the current and previous quarters.
Data detailing. As part of the implementation of the Strategy for Statistical Activities, the Bank of Russia has expanded the composition of published statistical information. At the end of 2016, a new publication was presented detailing the international investment position of the banking sector of the Russian Federation. It contains information on the geographical distribution of foreign assets and liabilities of the banking sector of the Russian Federation. Published data provide additional opportunities for the analysis of international activity and country risks of Russian credit organizations
In the framework of fulfillment of obligations to implement the second stage of the G20 Initiative to fill in gaps in statistics, the Bank of Russia has supplemented the list of published statistical information with information about the currency structure of external debt claims and obligations. Moreover, indicators of short-term external debt based on the remaining maturity and the non-financial corporations sector were formed and non-financial corporations sector is singled out in the framework of international investment position. New publications is an extension of the standard sets of external sector statistics. Publications provide additional opportunities for macroeconomic analysis and allow a more systematic assessment of the currency risks of the external sector of the Russian Federation.
Regional statistics. In order to improve information support of users, the Bank of Russia has expanded the composition of published indicators of regional statistics of the external sector. Regional sections of data on direct investment and debt on loans and borrowings attracted abroad by business entities in the regions of the Russian Federation have already been implemented. The proposed data presentations provide an opportunity to analyze the impact of foreign investment on the economy of the regions of the Russian Federation and the level of debt burden of business entities.
In addition to the above areas, the data on the Bank of Russia website was structured in order to visualize them for the convenience of users. Tables and

The system of the presentations of the external sector statistics, strategy and the way of future development 12
databases were grouped into sections and subsections. Methodological comments are highlighted in a separate block of information.
Change of the “External Sector Statistics” section on the Bank of Russia website Diagram 3
In the framework of the further implementation of the Strategy for Statistical Activities in the near future it is planned:
- further development of regional statistics, in particular, publication of data on the banking sector by regions of the Russian Federation;
- expansion of data reporting sets on banking statistics, the formation of international assets and liabilities of Russian banks on a consolidated basis.
When working on improving statistical information, the Bank of Russia pays great attention to the relevance of publications among users, as well as their interest in certain types of prepared documents.
To analyze these trends, the Department of Statistics and Data Management contacts the official service of the Bank of Russia, which is responsible for publishing statistics on the Bank of Russia website, in order to obtain statistics on downloads of

The system of the presentations of the external sector statistics, strategy and the way of future development 13
published information on the balance of payments, international investment position and external debt.
Based on this, we have analyzed the most representative data at the end of 2018, and the following conclusions were made:
- the most sought-after among Russian-speaking visitors to the Bank of Russia website were publications of the balance of payments, of which Estimate of the Balance of Payments of the Russian Federation (66% of downloads), Financial Transactions of Private Sector (10%), Balance of Payments of the Russian Federation (Standard Components) (7%), Balance of Payments of the Russian Federation (Main Components) (5%);
- the most sought-after among foreign users of information were the publication of external debt, of which External Debt of the Russian Federation in Domestic and Foreign Currencies (38% downloads), External Debt of the Russian Federation by Maturity and Financial Instruments (34%), Payment Schedule of External Debt of the Russian Federation (11%), External Debt of the Russian Federation in Domestic and Foreign Currencies (Detailed Analytical Presentation) (10%);
- the next most sought-after among users were the publication of external debt for Russian-speaking visitors to the website (External Debt of the Russian Federation in Domestic and Foreign Currencies (Detailed Analytical Presentation) (20% downloads), Estimate of the External Debt of the Russian Federation (18,5%), Payment Schedule of External Debt of the Russian Federation (15%)) and the publications of the balance of payments for foreign users — Financial Transactions of Private Sector (39%), Estimate of the Balance of Payments of the Russian Federation (Analytical Presentation) (32%), Balance of Payments of the Russian Federation (Standard Components) (22%);
- publications of international investment position have become the least downloaded. Among foreign users of statistical information, 86.5% of downloads were accounted for International Investment Position of the Russian Federation (Standard Components. At a Reference Date). While among Russian-speaking users, the most sought-after are International Investment Position of the Russian Federation (Standard Components. At a Reference Date) (65%) and International Investment Position of the Russian Federation (Standard Components) (26,5%).

The system of the presentations of the external sector statistics, strategy and the way of future development 14
Statistics of downloads of publications among Russian-speaking users Diagram 4
From the presented data, it is clear that the residents of the Russian Federation are more interested in operational data, i.e. estimated indicators of external debt, balance of payments and international investment position, as well as detailed analytical presentations, while presentations of standard components of external debt, balance of payments and international investment position are most in demand among foreign users of statistical information.
In the case of foreign users of statistical information of the Russian Federation, the following is observed:

The system of the presentations of the external sector statistics, strategy and the way of future development 15
Statistics of downloads of publications among foreign users Diagram 5
These findings allow compilers of statistical publications to see which presentations receive the most attention from users and require refinement, improvement and updating.
Conclusion
The need of responsiveness to the growing needs of users of statistical information makes it a difficult task for compilers of external sector statistics to expand the data sets provided without losing the quality of regular reporting generated in accordance with international standards. Based on the Strategy of statistical activity, the main directions of further development of statistics were identified, such as increasing the detail of published data and the formation of regional statistics. Coordination between statisticians and reporting respondents will contribute to the successful implementation of these plans. Expanding the list of transmitted statistical data should not increase the burden on respondents, which will be facilitated by modern IT technologies.

The system of the presentations of the external sector statistics, strategy and the way of future developmentNatalia Kupriianova, Nataliya Osiptsova17 – 18 February 2020Lisbon, Portugal

Structure
Conceptual framework of external sector statistics
System of the statistical data presentations
Principles of formation of external sector accounts of the Russian Federation
Presentation of data on the Bank of Russia website
The strategy of statistical activity: improving the quality and direction of development
Results of modernization of external sector statistics
Analysis of users demands
Conclusion
1

Principles of compilation
high level of transparency
accuracy and efficiency of the information submitted
high requirements for the quality of statistical materials
close interaction with suppliers and consumers of information
the relationship between individual types of statistics
harmonization with other statistical systems
implementation of international comparisons
2

Interconnection of external sector accounts
The balance of assets and liabilities at
the beginning
of the period
Transactions reflected in the balance of payments
Valuation changes
Other changes
The balance of assets and liabilities at the end of the period
3

System of statistical data presentations:
recommended by international organizations
Presentations recommended by
international organization
Standard Components Analytical Presentation Main Components
Main groupings of external sector statistics
By type of operation By institutional sector By functional categories
1. Current account transactions. They are reflected in the current account, these include operations of the trade balance and the balance of services, the balance of primary income (remuneration of labor, investment income, rent) and the balance of secondary income (for instance, personal transfers, taxes)
2. Financial account transactions are operations with assets and liabilities.
3. Net lending to the rest of the world (current account balance and capital account) should be equal in absolute value to the balance of the financial account
1. General government2. Central bank3. Banks4. Other sectors (other
financial corporations, nonfinancial corporations, households and NPISHs are indicated separately)
1. Direct investment2. Portfolio
investments3. Other investments4. Financial derivatives5. International
reserves
4

Breakdown by sector of economy
General government
Federal government
Local government
Central bank Banks Other
sectors
Financial corporations
Nonfinancial corporations
Households and NPISHs
System of statistical data presentations: additional presentations
5

Financial Transactions of Private Sector (Based on the Balance of Payments, Flows Data)
1.Financial transactions of private sector
(net lending (+) / net borrowing (-))
(2+5)
Banks Other sectors
2.Financial transactions
(net lending (+) / net borrowing
(-)) (3-4)
3.Net acquisition of
financial assets
4.Net incurrence of
liabilities
5.Financial transactions
(net lending (+) / net borrowing (-
)) (6-7-8)
6.Net acquisition of
financial assets
7.Net incurrence of liabilities
8."Net errors and
omissions" of balance of payments
6

Principles of compilation of external sector accounts of the Russian Federation
The historical prototype — the currency plan in the USSR, classified document
Data series since 1993, account balances since 2001
All indicators in US dollars
Source — administrative sources, reporting forms, estimates and models
Publications are presented quarterly
The most requested data are published monthly
Estimate of the Balance of Payments of the Russian Federation —unique publication most requested by users
7

“External Sector Statistics” on the Bank of Russia website
8

The strategy of statistical activity: improving the quality and direction of development
Development of additional indicators of external sector statistics along with standard data sets
Regular formation and submission of improved international banking statistics to the Bank for International Settlements
Development and improving the methodology for the formation of bilateral balance of payments and international investment position
Development of a system of indicators of the state and movement of foreign investment to the Russian economy
Improving the methodology for evaluating cash transfers
Maintaining up-to-date retrospective data series of macroeconomic statistics
9

Results of modernization of external sector statistics in order to expand user information support
Improving data responsiveness• monthly and quarterly estimation of the balance of payments and external debt • analytical material on the estimate of the balance of payments and external debt• supplementation of the list of publications on external sector statistics with monthly data on foreign trade in
services• preparation of new publications
Data detailing• detailing the international investment position of the banking sector of the Russian Federation • the geographical distribution of foreign assets and liabilities of the banking sector of the Russian Federation• the currency structure of external debt claims and liabilities• indicators of short-term external debt based on the remaining maturity• the non-financial corporations sector is singled out in the framework of international investment position
Regional statistics• Regional sections of data on direct investment and debt on loans and credits 10

Change of the “External Sector Statistics” section on the Bank of Russia website
11

Statistics of downloads of publications among Russian users
12

Statistics of downloads of publications among foreign users
13

Conclusion
The need of responsive-ness to the growing needs of users
Task for compilers to expand the data sets without losing
qualityIncrease of data detailing
Development of regional statistics
Coordination between statisticians and reporting
respondentsModern IT technologies
14

1/1
IFC Conference on external statistics "Bridging measurement challenges and analytical needs of external statistics: evolution or revolution?", co-organised with the Bank of Portugal (BoP) and the European Central Bank (ECB)
17-18 February 2020, Lisbon, Portugal
Double-entry bookkeeping and the balance of payments: the need for a substantial, conceptual reform1
Edoardo Beretta and Alvaro Cencini,
Università della Svizzera italiana and Franklin University Switzerland
1 This presentation was prepared for the meeting. The views expressed are those of the authors and do not necessarily reflect the views of the BIS, IFC, BoP, ECB or the central
banks and other institutions represented at the meeting.

Double-entry bookkeeping and the balance of payments: the need for a substantial, conceptual reform 1
Double-entry bookkeeping and the balance of payments: the need for a substantial, conceptual reform.
Edoardo Beretta1; Alvaro Cencini2
Abstract
On the basis of the identity between each country’s global imports and exports, which is one of the fundamental economic principles of the balance of payments, the paper highlights why the leading account of transactions from/to the rest of the world needs to be reformed. As a strategic goal, the balance of payments should finally move beyond its current purely statistical and simple-entry bookkeeping approach in order to improve its macroeconomic relevance. The creation of an economic account of the nation as a whole and the introduction of a consistent way of recording transactions following a truly double-entry bookkeeping would also erase statistical discrepancies ex ante and reflect the necessary equality (identity) of credits and debits both for all transactions taken together and for each of them separately.
Keywords: balance of payments; double-entry bookkeeping; nation’s economic account; reserve assets.
JEL classification: B27; F32; F33; P33.
1. Introduction
We can preliminarily state that the balance of payments (BoP), namely “a statistical statement that systematically summarizes, for a specific time period, the economic transactions of an economy with the rest of the world” (IMF 1997, p. 6), is the most relevant external statistical document registering all international (traceable) commercial and financial transactions between countries. It is common knowledge that this statistical tool can be separated into a “current account” (CA) and a “capital and financial account” (CFA). “Reserve assets”, which are a subcategory of the capital and financial account, mainly keep track of variations in official reserves made up of foreign currencies, precious metals and SDRs. Moreover, “every recorded transaction is represented by two entries with equal values. One entry of these pairs is designated
1 Edoardo Beretta, Dr. sc. ec. Dr. rer. pol.: Università della Svizzera italiana (USI), Faculty of Economics, Via
Giuseppe Buffi 13, 6904 Lugano, Switzerland, [email protected]. 2 Alvaro Cencini, Prof. em. Dr. rer. pol. PhD: Università della Svizzera italiana (USI), Faculty of Economics, Via
Giuseppe Buffi 13, 6904 Lugano, Switzerland, [email protected].

2 Double-entry bookkeeping and the balance of payments: the need for a substantial, conceptual reform
a credit with a positive arithmetic sign, the other is designated a debit with a negative sign” (IMF 1997, p. 6). So far, nothing new or original. And this is the risk with today’s view of the BoP, that it may be interpreted (wrongly) as a mere tautological statement. To avoid this risk let us analyse critically the double-entry bookkeeping logic behind the BoP.
We begin by analyzing the current notion of BoP: its equilibrium results from “real” flows (CA) matching “financial” flows (CFA). Under these conditions “[t]he balance of payments must accordingly be looked at as a whole rather than in terms of its individual parts” (Stern 1973, p. 2). However, a similar approach appears to be somewhat reductive since a situation of equilibrium between two distinct transactions reflects a simple-entry rather than double-entry bookkeeping logic. It would be simplistic – therefore, wrong – to claim that our purchase is our foreign correspondent’s sale (which is a truism), when the logic of double-entry bookkeeping requires both his and our purchases to be matched by simultaneous and equivalent sales. Hence, a second approach (point 2.) should be explored, namely one reflecting a truly double-entry bookkeeping approach. The paper will:
- show that every net buyer (seller) on the commercial market (goods/services) must be a net seller (buyer) on the financial market (securities);
- re-imagine the role of the “reserve assets” item and, more generally, of international reserves in the BoP itself.
The article will explain why today’s system of international payments fails to recognize the existence of countries as sets of their residents. The methodological approach adopted will be mainly logical-analytical, supported by insights from statistical evidence.
2. The identity between each country’s global imports (IM) and its global exports (EX).
The starting point of the discussion is that “countries’ international transactions have to comply with the BoP identity IM ≡ EX, where IM stands for the totality of a country’s imports, financial and commercial, and EX represents the totality of its exports, both commercial and financial” (Cencini 2017, p. 150). Even where a CA surplus (deficit) represents a positive (negative) disequilibrium of the transactions recorded therein over those registered in the CFA, the BoP itself is balanced. This means that all the operations in all the accounts taken together are necessarily equal to zero. “As with any other account, the total receipts of a country are bound be equal to the total payments of that country, if one includes all the receipts and all the payments of the country in the account” (Meade 1970, pp. 3-4).
Bearing in mind that “gold” is no longer used to settle international transactions and that the “purchasing power” used to cover a commercial imports surplus derives from corresponding excess financial exports (CA deficits are financed by an equivalent sale

Double-entry bookkeeping and the balance of payments: the need for a substantial, conceptual reform 3
of financial claims as registered in the CFA), total receipts (+) are necessarily equal to total payments (-). Or, as formulated by Krugman and Obstfeld (1997, p. 314), “this principle of payments accounting holds true because every transaction has two sides: if you buy something from a foreigner you must pay him in some way, and the foreigner must then somehow spend or store your payment”. In other words, “[l]ooked at more closely […] Krugman and Obstfeld’s quote discloses the presence of a fundamental law guaranteeing the necessary duality between each resident’s sales and purchases. In fact, if the foreigner from whom a resident buys must spend his payments – if he stores it, he spends it for the purchase of claims on bank deposits –, this means that the purchase of a resident is necessarily matched by an equivalent sale and that, reciprocally, the sale of the foreign correspondent is balanced by a purchase of the same amount” (Citraro 2004, p. 44). Both individuals are commercial and/or financial buyers and purchasers at the same time and within every transaction. Because of the flow nature of money, the law of the necessary equality of sales and purchases applies also when transactions concern countries considered as sets of their residents.
Money conveys reciprocal payments the terms of which are real goods and financial assets.
Although bank money continues to be misinterpreted as an asset or a commodity, it is a fact (“[money is] a circular flow […]. [T]he instantaneous reflux of money to its point of origin cannot be identified with an equilibrium condition that might be satisfied (or not). It is, in fact, a fundamental law of bank money that will always be logically true, regardless of the behavior of economic agents” (Pilkington 2007, p. 150)). But let us suppose that money is an asset: if so, (inter)national exchanges would split up into two non-simultaneous transactions. Goods/services/financial claims of resident A in country A against a sum of money of resident B in country B would mean a sale for the former and a purchase for the latter. “Money being also considered as a simple veil, the seller will later become a purchaser, yet sale and purchase will be equivalent only at equilibrium (which is but one possible outcome of economic agents’ behaviour), and they will remain two chronologically distinct events” (Cencini 2005, p. 247). In reality, issued by banks as a spontaneous acknowledgement of debt of zero intrinsic value, money is a vehicular means by which payments are carried out and not the object of these payments. By its own nature, money is a flow and not a stock. So, payments that are conveyed by money must have a real stock of produced goods and services as their real content. As monetary payments obey the principle of double-entry bookkeeping; each agent entering an exchange is simultaneously credited and debited by the same amount of money, whose circular flow is instantaneous. Money is present in each payment and flows immediately back to its point of injection as soon as the payment is completed. Finally, the terms of any exchange are real goods, present and future, conveyed through the flow of money. Being at the same time credited (debited) and debited (credited) for the same amount of money, economic agents are, simultaneously, sellers (buyers) and buyers (sellers) of real goods (either in the form of produced goods and services or in that of financial claims).

4 Double-entry bookkeeping and the balance of payments: the need for a substantial, conceptual reform
The formulations above describe the so-called “law of the identity between each agent’s sales and purchases” formulated by Bernard Schmitt (1975). Based on the circular essence of bank money, every net buyer (seller) on the commercial market (goods/services) must be a net seller (buyer) on the financial market (securities). Put another way, an economic subject has to finance his purchases by a concurrent sale and – each time he sells – he must concurrently purchase. If this holds true for the individual agent, it is possible to treat the country itself (the set of its residents) as “a single macroeconomic agent acting on the commodity and financial markets. Hence, as any single resident can finance his purchases only through equivalent sales, a country can finance its commercial and financial imports only through equivalent sales of goods, services, and financial assets” (Cencini 2005, S. 248). This is confirmed by the IMF Balance of payments manual stating that “[m]ost entries in the balance of payments refer to transactions in which economic values are provided or received in exchange for other economic values. These values consist of real resources (goods, services, and income) and financial items. Therefore, the offsetting credit and debit entries called for by the recording system are often the result of equal amounts having been entered for the two items exchanged” (IMF 1993, p. 7). The terms “goods, services, and income” refer to the CA, while “financial items” refer to the CFA.
Let us take the example of the payment of a reserve currency country’s net imports (e.g. the case of the US). The American nation would pay for its net purchases of goods and services by transferring a certain amount of its domestic currency ($100) to its foreign creditors in the rest of the world (RW). Apparently, U.S. net commercial purchases are not matched by any sale. However, this conclusion cannot be right since it openly contravenes the fundamental reciprocity implied by double-entry bookkeeping. Since money is a circular flow, there cannot be any net transfer of US Dollars to the RW. This means that the payment by the American banking system does not prevent the immediate reflux of US Dollars to their point of departure. But, once again, is this not another way of saying that US net commercial purchases remain unmatched by equivalent sales? It is not. In fact, if on the one hand money units ($100) are immediately recovered by the American banking system, on the other hand the rest of the world obtains, through the circular flow of US Dollars, a financial asset (a claim on US bank deposits) while the American nation obtains an equivalent amount of domestic output of RW. This example may be expressed in numerical terms (Table 1). On the one hand, US importers pay for their outstanding commercial transactions ($100). On the other hand, exporters from RW receive the countervalue in domestic money (x units of MRW) on their bank accounts. This is the way any transaction is settled from an individual perspective. Thus, the debtor pays and gets rids of his liability by means of his domestic currency ($100) – regardless of whether the country is a reserve currency or a non-reserve currency one – while the creditor is paid domestic currency (x units of MRW). The U.S. central Bank takes over the payment of its local importers and transfers it to the banking system of RW. The central Bank’s monetary intermediation makes it possible for US importers to pay in their local currency ($100) while the payee gets the countervalue in his local currency. What happens in between is the “monetization of an external gain” by the banking system (represented by its central bank) of RW, which stores the US-Dollar amount in its foreign currency reserves while it creates the countervalue in local money units to the benefit of RW’s exporters.

Double-entry bookkeeping and the balance of payments: the need for a substantial, conceptual reform 5
Table 1: Payment of a reserve-currency country’s net imports.
Source: representation based on Cencini (2005, p. 248)
Therefore, US importers pay $100 while exporters from RW receive x units of MRW. The transaction is settled from a microeconomic perspective. Let us now look at what happens on a macroeconomic level, namely between countries as sets of residents. Even though the US can pay for its net imports in US dollars, their payment obeys the same rule applying to any other country. The flow nature of money and the compliance with double-entry bookkeeping are such that the dollars paid to RW flow immediately back to the US banking system. Net purchaser of commercial goods from RW, the USA is therefore, at the same time and for the same value, a net seller of financial claims on US bank deposits. Hence, each country’s purchases, commercial and financial, are funded by equivalent and simultaneous sales.
If mainstream economics remarks that “[a]lthough the balance of payments accounts are, in principle, balanced, imbalances result in practice from imperfections in source data and compilation” (IMF 2009, p. 11) and the aggregate sum of debts and credits has to be specifically offset by an item called “net errors and omissions”, it is because it is de facto neglecting that the BoP is not based on an equilibrium, but on an “identity” (IMF 2009, p. 224). In other words, CAB + CFAB ≡ 0 where CAB corresponds to the CA and CFAB to the CFA balance (“Alternatively, it could be said that the current account balance is equal to the sum of balances on the capital and financial accounts (with signs reversed, if necessary, depending on the presentation used) including reserve assets” (IMF 2009, p. 224). Yet, accepting that today’s balance-of-payments entries are derived independently from different sources (with consequent risk of time lags) confirms the implicitly underlying single-entry bookkeeping conception and reduces the BoP itself to a mere collection of statistical data instead of being a clear-cut T-account of all external transactions.
3. The involvement of CA and CFA in countries’ external transactions.
Carried out by countries’ residents, cross-border payments concern the systems of national and of international payments. Both are founded on the use of bank money, hence on the necessary equality, the identity, of credit and debit. Economists all over the world accept this identity. Within nations, national banking systems

6 Double-entry bookkeeping and the balance of payments: the need for a substantial, conceptual reform
function consistently with this principle, while at the international level BoPs are, at least in theory, assumed to adopt it as a reference. Can double-entry be considered as a point of equilibrium that can be approximated but hardly or very seldom reached? In no way can logical identity be avoided; but neither can it ever become a condition of equilibrium. If, nonetheless, it is not complied with, a disorder ensues.
International payments comply with the logical identity between any economic agent’s sales and purchases.
Cross-border transactions take place between the residents of any given country and those of the rest of the world. This is true even in the case of public transactions, for the simple reason that public institutions are residents of their own country. Whether public or private, international payments are carried out by banks in compliance with the double-entry bookkeeping rule establishing the necessary correspondence of credits and debits. If a resident a of country A purchases commercial goods or financial assets of a value equal to x units of money A, MA, from a resident b of country B, it is tautological to say that a’s purchases are b’s sales. It is also a truism to claim that the payment of a’s purchases defines the debit of a’s bank account and the equivalent credit of b’s bank account. If nothing more could be said about this payment, we would have to conclude that double-entry is the matching of two separate entries in two distinct accounts, each entry being in all respects simple. Reality is far richer: double-entry entails both the debit and the credit of each agent involved in any transaction, national or international. Agent a can pay for its international purchases only if it holds the income required to finance them. Either a is the holder of a previously earned income deposited in its bank account, or it obtains it through a sale of claims on the financial market (we leave aside gifts and inheritance, because irrelevant here). In both cases the identity credit-debit applies to each single economic agent and to each single transaction. A transposition of the principle of double-entry bookkeeping, this identity can also be expressed, as Schmitt did (1975), as the law of the necessary equality between each single agent’s sales and purchases. This means that every transaction on any market is necessarily balanced by an immediate reverse transaction on another market. When agent a is a purchaser on the trade market of b’s goods, Schmitt’s law states that a is also, at the same time, a seller on the financial market. Bank deposits are financial claims, so that when a gives back to its bank the rights on its bank deposits it is indeed selling an amount of financial assets. Finally, a’s net commercial purchases of b’s real goods are financed by equivalent and simultaneous sales of financial claims. Agent b balances its commercial sales to a with an equivalent purchase of financial assets, claims on the bank where the proceeds of its sales are deposited.
It is thus confirmed that payments between residents, whether of the same country or of different countries, comply with the identity of their debits and credits, each purchase being financed by an equivalent and simultaneous sale. In other words, this means that money intervenes to convey reciprocal exchanges the objects of which are commercial and financial assets. Perfectly in line with Adam Smith’s definition of money as the ‘great wheel of circulation’ (Smith [1776] 1978, p. 385), this notion of money as a ‘vehicle’ is the only one compatible with double-entry bookkeeping. In our example, MA and MB convey the payments between a and b;

Double-entry bookkeeping and the balance of payments: the need for a substantial, conceptual reform 7
yet, neither MA, nor MB are an object of exchange. What agent a gives in exchange for a sum of goods sold by b is not a sum of MA, nor is it a sum of MB in which MA is transformed. Both MA and MB are vehicular means of payment; through their circular flow a and b exchange commercial goods against financial assets. Does the circular flow of money occur also when countries take over the foreign payments of their residents? This question calls for an analysis of the involvement of countries in the cross-border payments of their residents, State included.
The payment of a country’s external transactions and its implications for the BoP.
The need to transfer abroad the cross-border payments made in national currency by their residents, leads to the involvement of their countries. If residents of country A are net importers of commercial goods from RW, it is country A that is a net commercial importer, even though A’s imports may not be traced back to any specific importer or exporter. The role of countries, or of their central banks, is to convert the payment in national money of their residents into a payment in foreign currency. In other words, they must convey through the ‘international space’ the external payments initially carried out in domestic currency. As officially recognized by international institutions such as the IMF and the World Bank, international transactions carried out by countries must comply with the BoP identity between entries in CA and entries in the CFA, the CA being the mirror image of the CFA. The necessary equilibrium between the transactions entered in the CA and those entered in the CFA means that a country’s net commercial imports (resp., exports) must be balanced by equivalent net financial exports (resp., imports). Hence, A’s net trade surplus is immediately matched by an equivalent deficit of its CFA. This is so because the payment of A’s net imports gives rise to an inflow of foreign currencies into RW, which are immediately invested in A. It is thanks to this investment, corresponding to the purchase by RW of an equal amount of A’s financial assets, that A can finance its net commercial purchases from RW.
Expressed as the identity between each country’s global imports, IM, commercial and financial, and its global exports, EX, commercial and financial, the BoP identity is a logical principle accepted worldwide. If it were duly complied with, it would guarantee the vehicular use of any currency used to carry out international payments. The IM ≡ EX identity establishes the fact that the terms of any international exchange are always and necessarily real goods, either in the form of commercial goods or of financial assets. If the trade balance is in equilibrium, both terms of the exchange are actual goods. If it is not, the difference is an exchange between present goods and future goods, the latter being the object of the financial claims the export of which matches the net import of commercial goods. Being carried out in bank money, international payments taken over by countries are made through debits-credits and credits-debits, which implies that money is never the object of any payment. As in the case of payments analysed from the viewpoint of (non-)residents, each country entering international exchange is debited-credited or credited-debited anytime it carries out, or is the beneficiary of, a foreign payment. Let us consider the case where country A is paid by RW, in MRW, for its sales of part of its domestic output. As soon as A is credited by R of a sum of MRW it is debited by the same amount: issued by

8 Double-entry bookkeeping and the balance of payments: the need for a substantial, conceptual reform
the banks of RW, MRW flows immediately back to its point of departure (double-entry bookkeeping requires it), and in exchange for its commercial exports, A is credited with an equivalent claim on RW’s banks, that is, with a claim on a bank deposit in RW. It is thus confirmed that, between countries, ‘each commercial payment is a financial payment of inverse algebraic sign, [and] each financial payment is a zero-sum transaction unless it is founded on a commercial payment of opposite sign’ (Schmitt 2008, p. 3 [our translation]). As a consequence of the identity IM ≡ EX, money is an intermediary, a circular means of payment that never replaces the real terms, commercial and financial, of any international transaction.
Actually, the preceding conclusion describes the logical nature of international payments and not the way the present system works. IMF and World Bank experts say that ’[i]n principle, the current and capital accounts should be mirror images’ (IMF 1987, p. 12). What is emphasized here is the existence of a discrepancy between theory and practice, between the way the system of international payments should work and the way it actually works. In its present form, the BoP is a collection of statistical data and not a true bookkeeping representation of countries’ foreign transactions and payments. We are thus confronted with a number of inconsistencies, such as those denounced by the IMF Working Party in 1987 and concerning the non-zero amount of the world’s CA indicating a disorder the consequences of which, countries’ over-indebtedness, are disastrous for countries and their residents.
By erroneously identifying double-entry with simple double-entry (a mere tautology) rather than with double double-entry, each entry being simultaneously a debit-credit or a credit-debit, economists have failed to fully recognize the flow nature of money. The BoP in its present form is a direct implication of this truncated conception of double-entry, an analytical instrument not entirely fit for purpose and that must be re-elaborated according to the true principle of debits-credits and to Schmitt’s law of sales-purchases.
4. The reserve account is the account of a country taken as a whole.
We have already mentioned that the economic (monetary) definition of “country” or “nation” relies on the money unit involved (US Dollar, Euro, Swiss franc, etc.) and the corresponding banking system the American, European, Swiss, etc.). By way of example, “the United States of America are a single country from an economic viewpoint, since a common money unit has legal validity within this geographical region. […] In each country, banks are organized according to a pyramidal scheme while the central bank tops this banking structure” (Schmitt 1990, pp. 34-36 [our translation]). Hence, the monetary unit of physical production, which is used in the payment of wages, has a crucial role in defining each country’s monetary space.

Double-entry bookkeeping and the balance of payments: the need for a substantial, conceptual reform 9
Net foreign currency flows modify the IIP of countries defined as “sets of their residents”.
Foreign currencies play a major role in external trade. Not surprisingly, the BoP also records a statistical item called “reserve assets”, which “are readily available to and controlled by monetary authorities for meeting balance of payments financing needs, for intervention in exchange markets to affect the currency exchange rate, and for other related purposes (such as maintaining confidence in the currency and the economy, and serving as a basis for foreign borrowing)” (IMF 2009, p. 111). At the same time, “foreign currency liquidity” represents a broader concept than “reserve assets” or “international reserves”, because it “concerns foreign currency resources and drains on such resources of the monetary authorities and the central government […], relates to the authorities’ foreign currency claims on and obligations to residents and nonresidents and […] encompasses inflows and outflows of foreign currency that result from both on- and off-balance-sheet activities of the authorities” (IMF 2013, p. 4). Regardless of whether “reserve assets” or “foreign currency liquidity” are involved, it remains true that the flows of net foreign currencies modify the International Investment Position (IIP) of countries defined as “sets of their residents”.
Let us separate this assertion into two distinct parts, of which the first is the more intuitive. Since “the difference between the assets and liabilities is the net position in the IIP and represents either a net claim or a net liability to the rest of the world” (IMF 2019, Internet), it goes without saying that net foreign currency outflows (resp., inflows) reduce (resp., increase) the net claims of a country as whole. The second part of the previous statement is equally true, but needs an more explanation. In fact, we have to demonstrate why countries have to be conceived as “whole sets of their residents” instead of the more intuitive formulation of “aggregate or sum of their residents”. More precisely, countries or nations are monetarily speaking the “set of their private/public economic subjects (including the State)”. Why "State" is not synonymous with "nation" or "country" is plain to see, since the public sector is nothing more than a part, a component, of the economy as a whole (which includes also private, financial and non-financial subjects). But, why would it be wrong to claim that countries do not correspond to the aggregate of all (private and public) economic subjects? While the concept of “sum” implies that all economic actors (S1, ..., Sn) of the nation are to be taken together:
country = ∑(𝑆𝑆1, … . , 𝑆𝑆𝑛𝑛),
a “set” is not limited to their aggregation. If we represent the macroeconomic concept of “country” by means of an ellipse or a circle containing several elements (national private-public residents), the “set” would correspond to the ellipse/circle as a whole (all its components, including its perimeter):
country = {𝑆𝑆1, … , 𝑆𝑆𝑛𝑛}.

10 Double-entry bookkeeping and the balance of payments: the need for a substantial, conceptual reform
As reminded by Cencini (1997, p. 341), “[i]n the same way as the set is richer than its constitutive elements, the nation is a whole which acquires an existence which is partially autonomous from that of its residents. […] However, if it is correct to claim that a set cannot be reduced to the sum of its elements, this does not mean that the situation of the set has to be cumulated with that of its elements”. For instance, a major logical-analytical proof that the country as a whole is – economically speaking – distinct from the sum of its elements is provided by the essence of international reserves themselves, which are, indeed, owned by countries.
International reserves are owned by countries. A new conception of the official reserves account is needed too.
Obviously, trade with the rest of the world is the first source of accumulation of foreign exchange reserves. For example, suppose that country A records a commercial export surplus (+100 MA) with country B, a net commercial importer (-100 MB) and that the exchange rate is of 1 MA to 1 MB. What happens as soon as the residents of country B settle their excess purchases of goods and services from A? The payment of B’s importers is made possible by the existence of bank deposits owned by the commercial importers in country B. Then, the payment is taken over by the central bank and the corresponding banking system. If MB is a key currency, the latter send this amount (100 MB) to the central bank of country A, which in turn is responsible for crediting the banking deposits of the commercial exporters in country A. The central bank of nation A – after recording the 100 MB received from B in its international reserves, which confirms that net commercial exports contribute to the accumulation of foreign exchange reserves – issues 100 MA to the benefit of its commercial banks. There is no doubt that bank customers always make and receive payments in the currency denomination of their bank deposit. This occurs because of the banking intermediation of the central bank at the top of each national monetary space. In other words, the central bank of country A monetizes the external profit deriving from A’s trade surplus (100 MB) by issuing the countervalue in local currency (100 MA) accruing to commercial exporters.
Hence, international reserves are managed by the central bank on behalf of the country as a whole. Commercial exporters in country A having been credited with the due amount of 100 MA no longer have any outstanding claims. The fact that "underlying the BPM5 concept of reserves are the notions of “effective control" by the monetary authorities of the assets and the "usability" of the assets by the monetary authorities" (Kester 2001, p. 14) does not contradict the conclusion that international reserves do not (monetarily speaking) pertain to any specific resident. Neither do they belong to the State, which might have contributed to their accumulation by transacting with the rest of the world and which administers them through the central bank. The BoP should, therefore, distinguish between the “origin” (residents of the country), “administration” (the central bank) and “economic ownership” (the country as a whole, namely as “set of its residents”) of foreign exchange reserves. A similar distinction is necessary, because countries are not just identifiable with the aggregate of all physical/legal persons, defined as their residents.

Double-entry bookkeeping and the balance of payments: the need for a substantial, conceptual reform 11
Ad absurdum, if a country were solely represented by the sum of its residents, having settled the above-mentioned commercial transaction the nation as a whole would not record any net commercial surplus (deficit) in the BoP. In reality, the external profit of country A from excess trade with RW represents a claim against country B and, therefore, a (spontaneous recognition of) debt of the corresponding banking system. The fact that country B still enters a net commercial deficit (-100 MB) even though commercial exporters in nation A have been finally paid constitutes the stringent proof that "a nation can be creditor[/debtor] independently of the creditor[/debtor] position of its residents. [...] once they have been paid by their banks, A's exporters no longer own any credit on their foreign correspondents and yet country A is a net creditor” (Cencini 2005, p. 249). Even legally there is no doubt that international reserves do not belong to a central bank or any other specific resident, as art. 3 of the Bundesbank Act reminds us (“[the Deutsche Bundesbank] hold[s] and manage[s] the foreign reserves of the Federal Republic of Germany“ (Deutsche Bundesbank 2013, Internet). Even when international reserves are owned by the central, the central bank is acting on behalf of the undifferentiated set of the country’s residents. This does not alter the claims according to which net foreign currencies’ flows modify the IIP and this affects the country (not any specific private or public individual).
The existence of countries as sets of their residents should lead to a new conception of the official reserves account. Re-imagining the role of “reserve assets” would be a necessary step. Today, reserve assets appear to be involved merely in a limited number of transactions, mostly carried out by monetary authorities. Besides, – at least, in key-currency countries, whose means of payments are internationally accepted – they appear to have compensatory features rather than being a systematic account recording all transactions modifying the external position of the economy altogether. Since commercial and financial transactions recorded in the BoP pertain to private and public agents (residents) but contribute to modifying the nation’s position as a whole, a country’s economic account should also be created. This account would represent a new version of the already existing IIP and, by means of a double-entry bookkeeping approach, would highlight the involvement of the economy as a whole. The official reserves account would mainly deal with foreign reserves (as it already does) and it would represent the account of the country taken as a whole. Closely related to the inflows and outflows of foreign currencies, the reserve account would be directly involved in every current, CFA transaction. Hence, for example, a commercial export would entail an increase in the country’s official reserves caused by the inflow of a sum of foreign currency. Substantially, the reserve account would mirror the evolution of an important part of the country’s IIP and represent the country’s external financial position as defined by its net stock of financial assets and liabilities. Such reform step would imply a new way of recording cross-border payments, paving the way for a new international payments system. The BoP is, even today, a powerful tool, but in order to display its “true” macroeconomic significance adjustments must be made by reformulating the official reserves account in a money-consistent way. As explained in Part 5, a profound reform is needed so that the BoP can be finally transformed into a bookkeeping instrument belonging both to the country as a whole (macroeconomic dimension) and its residents (microeconomic dimension). This would also prevent the persistence of imbalances in the CA (Figure 1).

12 Double-entry bookkeeping and the balance of payments: the need for a substantial, conceptual reform
Figure 1: CA imbalances (current US$) for 191 countries (1990-2018)
Source: calculations based on The World Bank (2019a)
Undoubtedly, the commercial exports of any country are necessarily, and tautologically, the commercial imports of other countries. Yet, global CAs show the presence of persistent discrepancies between deficits and surpluses (“What can explain these discrepancies? Was the Earth a net importer of goods and services from other planets before 2005 and a net exporter afterwards? […] The IMF’s projection for the next five years is that these discrepancies will decrease (as they have been since 2012) and that the world current account will be negative. Accounting for the magnitude of these errors is difficult and still important to understand the existence of global imbalances around the world” (Federal Reserve Bank of St. Louis 2016). What makes things worse is that the cumulated CFA should also be equal to zero for the world taken as a whole, but it is not. This is shown (though subject to statistical discrepancies) in Figure 2. Although these data are biased by insufficient transparency (at least, for some countries) and by the presence of the “net errors and omissions” item (see Figure 3), not a negligible component, the picture is pretty clear: statistical discrepancies are very evident, enduring and – more relevantly – symptomatic of the fragmentary approach to the recording of transactions, whereas they should be registered in a simultaneous and identical-in-value way.
-300,000,000,000
-200,000,000,000
-100,000,000,000
0
100,000,000,000
200,000,000,000
300,000,000,000
400,000,000,000

Double-entry bookkeeping and the balance of payments: the need for a substantial, conceptual reform 13
Figure 2: CFA imbalances (current US$) for 186 and 192 countries (1990-2018)
Source: calculations based on The World Bank (2019b; 2019d)
A similar mechanism is needed for the settlement of cross-border transactions. Since the monetary concept of "nation” corresponds to the set of its private/public economic subjects (including the State itself), it is crucial that the workings of the BoP itself should duly reflect it (see Part 5).
5. Today’s system of international payments does not recognize the existence of countries as sets of their residents.
In this last section we start from the factual observation that nations or countries exist as monetary entities, note that money is still wrongly identified with a positive asset, analyse the implications of this erroneous notion of money, and end by advocating the institution of a National Bureau responsible for carrying out the external payments of the country’s residents according to the law of debit-credit and credit-debit.
The monetary existence of countries is incontrovertible. The totality of any country’s external transactions is carried out by its residents, State included. The country, as the set of its residents, is no autonomous economic agent. It neither imports or exports either commercial goods or financial assets. While it is true that countries are involved by implication, since the cross-border transactions of their residents require their monetary intermediation, it is also true that the end result
-800,000,000,000
-600,000,000,000
-400,000,000,000
-200,000,000,000
0
200,000,000,000
400,000,000,000
600,000,000,000
800,000,000,000
Net financial account (BoP,current US$)
Net capital account (BoP,current US$)

14 Double-entry bookkeeping and the balance of payments: the need for a substantial, conceptual reform
of these transactions concerns the country as a whole as well as its individual residents. Hence, although net exports cannot be attributed to any particular exporter or importer, they define a net gain for the country. Transferred to the country’s official reserves, this gain is that of the undifferentiated set of residents, of the country as a whole. It is monetary sovereignty that determines the economic existence of countries as such. Insofar as countries maintain their national currencies, they exist as distinct economic entities. At the same time, countries act as monetary intermediaries in the foreign payments of their residents. For these two reasons, they should be endowed with a mechanism accounting for their commercial and financial situation (the BoP) and allowing for their payments to be carried out in compliance with double-entry bookkeeping.
Money is wrongly identified with an asset and international payments are faced with the forceful purchase of the monetary vehicle to convey them.
The net asset definition of money is unfortunately still widespread and a major obstacle to the understanding of its vehicular use, the only one compatible with double-entry. To claim that banks can issue money already endowed with a positive purchasing power is pure nonsense. Fortunately, double-entry comes to our rescue and guides us toward a modern conception of money. The necessary equality of debits and credits is the guiding principle, our lodestar. Money is spontaneously issued by banks, lent to the economy, and recovered in payments entered by banks in conformity with that equality.
Nationally, money is associated to production via the payment of productive services and plays the double role of unit of account and of numerical means of payment. Internationally, the intervention of money is limited to its vehicular role. Suppose, as is the case today, that the structure of the system of payments is inadequate: money will necessarily still obey the logic of those accounting identities. It is therefore already the case today that the monetary payment of a country’s net commercial imports transfers to the exporting country an amount of financial claims (deposit certificates) and not a sum of money. If this fact were recognized and if cross-border payments were entered in the respective balance sheets, everything would be perfect.
A negative consequence of the lack of an orderly structure of international payments is the fact that, although money ‘moves’, of necessity in an instantaneous circular flow, countries have to purchase at a cost the vehicular money that is not explicitly provided by the system. Now, while it is true that when international payments are reciprocal these costs cancel each other out, there is an important case where this equalisation does not occur: the payment of interest on external debts. As clearly demonstrated by Schmitt (2012), interests are a spontaneous debt the payment of which, defined by the IMF and the World Bank as an unrequited transfer, is uncompensated. As absurd as it may seem, indebted countries pay twice their

Double-entry bookkeeping and the balance of payments: the need for a substantial, conceptual reform 15
interests on debt3. One payment is microeconomic in nature and rests on the indebted country’s residents. This payment is entirely justified. The second, pathological payment rests on the country taken as a whole, the set of its residents. This payment is macroeconomic and it is due to an anomaly of the system of international payments, which does not provide countries with a mechanism guaranteeing the circular use of a vehicular money. Indebted countries have to purchase the vehicular money required to convey abroad the object (national resources) of their payment, which should be provided cost free by the system of international payments.
A reform is needed to transform the BoP into a bookkeeping instrument for both the country and its residents.
The current international payments system is flawed because it is at odds with the flow nature of money and with the double-entry principle. This is also true of the BoP. Being a mere collection of separate statistical data, the BoP hardly complies with the bookkeeping identity on which it should be founded. Billion-high net errors and omissions on the national as well as global level are a consequence (Figure 3). The correspondence between CA and CFA (with a reverse sign) cannot be the unstable and highly unlikely result of an equilibrium between separate transactions. It is only by entering each single transaction as a debit-credit or a credit-debit that the BoP can be considered as a bookkeeping representation of the foreign exchanges, both commercial and financial, of a country. Like its residents, a country can finance its purchases only through equivalent and simultaneous sales, its imports through its exports. This does not at all mean that each country does or should necessarily balance its commercial imports with equivalent commercial exports. A country can perfectly well run a trade deficit on condition that it bankrolls it through an equal financial surplus, that is, through a sale of financial claims. The reciprocity of exchanges subsumes both the commercial and the financial markets, any net commercial purchase being covered by a net sale of claims on part of the country’s future output. It is not the trade balance of any single country that must be in equilibrium, but its monetary balance, its overall inflows and outflows of foreign currencies. The identity of IM and EX corresponds to the identity between each country’s global sales and purchases. Its corollary is the necessary equilibrium of their monetary balances, the vehicular use of the currency used to convey their reciprocal payments.
3 Beretta (2012; 2017) has argued the same about some historical cases of war reparation payments, since
they are unilateral and have to be provided in internationally accepted currencies.

16 Double-entry bookkeeping and the balance of payments: the need for a substantial, conceptual reform
Figure 3: Net errors and omissions (current US$) in the BoPs of 192 countries (1990-2018)
Source: calculations based on The World Bank (2019c)
In practice, the reform needed to transform the BoP into a bookkeeping account of the external transactions of countries consists in creating, in each country, a national Bureau responsible for all the payments by and in favour of the country’s residents. The Bureau must be conceived as a ‘dual’ institution, Janus-faced as it were: one face, its internal department, turned toward the country’s domestic economy, and the other face, its external department, turned toward the rest of the world. In this new scenario, each payment request made by a resident in favour of a non-resident is submitted to the country’s national Bureau, which represents the country. Using the country’s domestic currency, each payment initiated by the country’s residents is carried out as a double double-entry procedure. Thus, for example, importers are credited-debited by their banks: their purchases, which imply a debit, are matched by sales of financial claims (deposit certificates or securities), for the amount with which they will be credited. At the same time, the Bureau’s internal department is credited by the sum of national currency spent by importers and debited for an equal amount to the benefit of its external department. Responsible for payments to the rest of the world for their exports, the external department will purchase financial claims from its domestic economy and sell them abroad in order to finance its external payment on behalf of country’s importers. Every inflow of national or foreign currencies to each department of the Bureau will thus be balanced by equivalent outflows. Currencies will be used as a means to convey payments, and real goods, present and future, will be the only content or object of these payments.
The analytical description above encapsulates the gist of the reform advocated by Bernard Schmitt (2014). The principles of the reform derive directly from double-entry bookkeeping and imply a radical change in the way BoPs are constructed. What must be changed is the way entries are recorded. Every transaction must be entered twice, once as a credit (debit) and once as a debit (credit). This is the essence of the radical change necessary to turn the BoP from a statistical collection of data into an
-400,000,000,000.00
-300,000,000,000.00
-200,000,000,000.00
-100,000,000,000.00
0.00
100,000,000,000.00
200,000,000,000.00

Double-entry bookkeeping and the balance of payments: the need for a substantial, conceptual reform 17
instrument delivering a clear picture of a country’s commercial and financial relationships with the rest of the world.
6. Concluding remarks
A country’s BoP accounts for its international commercial and financial transactions with the rest of the world. Its significance is not only due to its far-reaching history, since data on goods, services, and financial claims have been published, quite systematically, from the 19th century onwards, but also to the underlying double-entry bookkeeping mechanisms. Today, despite being still a powerful tool indicating the external position of a country towards the rest of the world, it lacks an approach structurally based on double-entry bookkeeping. Double-entry bookkeeping logic (which necessarily implies the identical balance between CA and CFA) is openly neglected, turning the BoP into a mere statistical (and, therefore, less reliable) instrument.
Despite introducing structural changes in terms of systematicity, countries could adopt and implement them relatively easily. This would also drastically simplify the recording process, now complicated by valuation and time issues (leading to massive, cumulative inaccuracies). A win-win solution, therefore, while times are ripe for a conceptually macroeconomic approach in line with double-entry bookkeeping, that is, with the fundamental principles of the BoP itself.
7. Annex
We have devised an example to illustrate what would occur once the BoP had been reformed. Let us suppose this simplified scenario:
- country A exports 100 MA, imports 200 MA in terms of goods and services and has a CA deficit of 100 MA;
- country B exports 200 MB, imports 100 MB in terms of goods and services and has a CA surplus of 100 MB;
- countries A and B are the only nations (and MA and MB the only currencies)4;
- countries A and B are allowed to use their currencies internationally5.
Each commercial and financial transaction is balanced by an equivalent one with opposite sign. CA surpluses (deficits) are matched by equivalent purchases (sales) of financial claims, which offset the BoP of the countries involved. The Internal and External Department of country A register each three transactions (1a.,4a.: commercial exports / 2a., 5a.: (excess) commercial imports / 3a., 6a.: imports of financial claims).

18 Double-entry bookkeeping and the balance of payments: the need for a substantial, conceptual reform
The same transactions, with reverse sign, are entered by the Internal and External Departments of country B, which enters an additional transaction (3b., 6b.). In fact, country B has to monetize the external gain (+100) from having commercially exported more than it has imported.
Registrations in country A (CA deficit)
Table 2: The registrations of the National Bureau CA-deficit country A (Internal Department)
Table 3: The registrations of the National Bureau in CA-deficit country A (External Department)
Registrations in country B (CA surplus)

Double-entry bookkeeping and the balance of payments: the need for a substantial, conceptual reform 19
Table 4: The registrations of the National Bureau in CA-surplus country B (Internal
Department)
Table 5: The registrations of the National Bureau in CA-surplus country B (External Department)
8. Bibliographic references
Beretta, E. (2012): ‘The economics of external debt: a Damocles' Sword hanging over the Emergent and the Virtuous (Germany)’, Banks and bank systems, 7(2), pp. 79-86.
‒‒‒ (2017): ‘From reparations to (net) interest payments on external debt. Same script, different cast’, in: Bailly, J.-L; Cencini, A.; Rossi, S. (eds.): Quantum Macroeconomics. The legacy of Bernard Schmitt, Routledge: London and New York.
Cencini, A. (1997): Monetary theory, national and international, Routledge Frontiers of Political Economy: London and New York.
‒‒‒ (2005): Macroeconomic foundations of macroeconomics, Routledge Frontiers of Political Economy: London and New York.

20 Double-entry bookkeeping and the balance of payments: the need for a substantial, conceptual reform
‒‒‒ (2017): ‘The sovereign debt crisis’, in: Bailly, J.-L; Cencini, A.; Rossi, S. (eds.): Quantum Macroeconomics. The legacy of Bernard Schmitt, Routledge: London and New York.
Citraro, M. (2004): World discrepancies in the balance of payments – PhD Dissertation, Università della Svizzera italiana: Lugano.
Deutsche Bundesbank (2013): ‘Bundesbank Act’, http://www.bundesbank.de/resource/blob/618304/6d6986cbc43dff11cf78d56b2c29502b/mL/bundesbank-act-data.pdf.
Federal Reserve Bank of St. Louis (2016): ‘Global current account surplus: is there trade with other planets?’, http://www.stlouisfed.org/on-the-economy/2016/february/global-current-account-surplus-trade-other-planets.
IMF (1987): Report on the world current account discrepancy, IMF: Washington, D.C.
‒‒‒ (1993): Balance of payments manual – fifth edition, IMF: Washington, D.C.
‒‒‒ (1997): The balance of payments manual – fifth edition, IMF: Washington, D.C.
‒‒‒ (2009): Balance of payments and international investment position manual – sixth edition (BPM6), IMF: Washington, D.C.
‒‒‒ (2013): International reserves and foreign currency liquidity. Guidelines for a data template, IMF: Washington, D.C.
‒‒‒ (2019): ‘Balance of Payments and International Investment Position Statistics (BOP/IIP)’, http://data.imf.org/?sk=7A51304B-6426-40C0-83DD-CA473CA1FD52.
Kester, A. Y. (2001): International reserves and foreign currency liquidity: guidelines for a data template, IMF: Washington, D.C.
Krugman, R. P.; Obstfeld, M. (1997): International economics: theory and policy – fourth edition, Addison-Wesley Longman, Inc.: Boston.
Meade, E. J. (1970): The balance of payments, Oxford University Press: London, New York and Toronto.
Pilkington, M. (2007): ‘A macroeconomic analysis of the role of trans-national corporations in a monetary theory of production’, in: Esen, O.; Ogus Binatly, A. (eds.): Proceedings of the SUNY Cortland Conference on globalization and its discontents, Izmir University of Economics: Izmir.
Schmitt, B. (1975): Théorie unitaire de la monnaie, nationale et internationale, Castella: Albeuve.
‒‒‒ (1990): L’Écu et les souverainetés nationales en Europe, Dunod: Paris.
‒‒‒ (2008): Brésil en 2008. Les médias donnent une image fortement lénifiante de son passif financier envers le reste du monde, Université de Fribourg: Fribourg, mimeo.
‒‒‒ (2012): ‘Sovereign debt and interest payments’, in: Gnos, C.; Rossi, S. (eds.): Modern monetary macroeconomics, Edward Elgar Publishing: Cheltenham.
‒‒‒ (2014): ‘The formation of sovereign debt. Diagnosis and remedy’, http://ssrn.com/abstract=2513679.
Smith, A. (1978) [1776]: The wealth of nations, Pelican Classics: Harmondsworth.
Stern, R. M. (1973): The balance of payments. Theory and economic policy, Macmillan: London and Basingstoke.

Double-entry bookkeeping and the balance of payments: the need for a substantial, conceptual reform 21
The World Bank (2019a) ‘Current account balance (BoP, current US$)’, http://data.worldbank.org/indicator/BN.CAB.XOKA.CD.
‒‒‒ (2019b): ‘Net capital account (BoP, current US$)’, https//data.worldbank.org/indicator/BN.TRF.KOGT.CD.
‒‒‒ (2019c): ‘Net errors and omissions (BoP, current US$)’, http://data.worldbank.org/indicator/BN.KAC.EOMS.CD.
‒‒‒ (2019d): ‘Net financial account (BoP, current US$)’, http://data.worldbank.org/indicator/BN.FIN.TOTL.CD.

1
DOUBLE-ENTRY BOOKKEEPING AND THEBALANCE OF PAYMENTS: THE NEED FOR A
SUBSTANTIAL, CONCEPTUAL REFORM.by
Edoardo Beretta (Dr. sc. ec. Dr. rer. pol.),Alvaro Cencini (Prof. em. Dr. PhD)
*****
Joint Banco de Portugal, Irving Fisher Committee on Central Bank Statistics and European Central Bank Conference “Bridging measurement challenges and analytical needs of external statistics:
evolution or revolution?”
*****
February 17-18, 2020, Banco de Portugal – Largo de São Julião, Lisbon

2
INTRODUCTION: THE PAPER’S METHODOLOGICAL
APPROACH AND AIM
Presentation by Edoardo Beretta (Dr. sc. ec. Dr. rer. pol.)
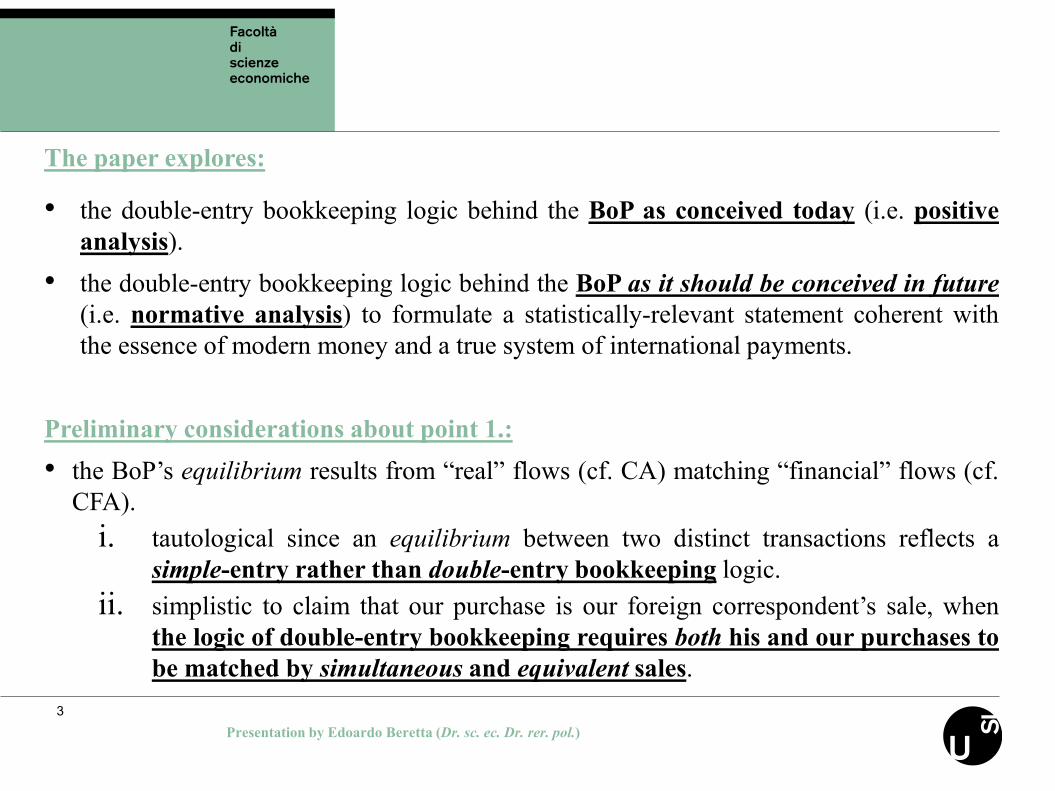
3
The paper explores:
• the double-entry bookkeeping logic behind the BoP as conceived today (i.e. positiveanalysis).
• the double-entry bookkeeping logic behind the BoP as it should be conceived in future(i.e. normative analysis) to formulate a statistically-relevant statement coherent withthe essence of modern money and a true system of international payments.
Preliminary considerations about point 1.:• the BoP’s equilibrium results from “real” flows (cf. CA) matching “financial” flows (cf.
CFA).i. tautological since an equilibrium between two distinct transactions reflects a
simple-entry rather than double-entry bookkeeping logic.ii. simplistic to claim that our purchase is our foreign correspondent’s sale, when
the logic of double-entry bookkeeping requires both his and our purchases tobe matched by simultaneous and equivalent sales.
Presentation by Edoardo Beretta (Dr. sc. ec. Dr. rer. pol.)

4
A second approach (cf. point 2.) should be explored toreflect a truly double-entry bookkeeping approach. Thepaper will hence:• demonstrate the theorem according to which – based on the
circular essence of bank money – every net purchase (sale)on the commercial market must be instantaneouslymatched by a net sale (purchase) on the financial market.
• re-imagine international reserves in the BoP itself. Sincecommercial/financial transactions recorded in the BoP pertainto private/public agents (i.e. residents) but they modify thenation’s position as a whole, a nation’s economic accountshould be created too.
Presentation by Edoardo Beretta (Dr. sc. ec. Dr. rer. pol.)

5
THE IDENTITY BETWEEN EACHCOUNTRY’S TOTAL IMPORTS (IM) AND
TOTAL EXPORTS(EX), COMMERCIAL AND FINANCIAL.
Presentation by Edoardo Beretta (Dr. sc. ec. Dr. rer. pol.)

6
Some fundamental relations (see Cencini 2007, p. 150):• countries’ international transactions have to comply with the balance of payments identity IM
≡ EX:i. IM totality of a country’s imports, financial and commercial;ii. EX totality of a country’s exports, financial and commercial”.
“[There is] a fundamental law guaranteeing the necessary duality between each resident’s sales and purchases. In fact, if the foreigner from whom a resident buys must spend his payments – if he stores it, he spends it for the purchase of claims on bank deposits –, […] the purchase of a resident
is necessarily matched by an equivalent sale and that, reciprocally, the sale of the foreign correspondent is balanced by a purchase of the same amount” (Citraro 2004, p. 44).
Presentation by Edoardo Beretta (Dr. sc. ec. Dr. rer. pol.)
Otherwise
stated:

7
What the BoP identity IM ≡ EX implies:• if country A buys goods, services or financial claims from country B, it
necessarily sells goods, services or financial claims to country B tofinance its commercial or financial purchases;
• conversely, if country B sells goods, services or financial claims tocountry A, it necessarily buys goods, services or financial claims fromcountry A to finance A’s commercial or financial purchases.
Both countries are, inevitably, commercial and/or financial buyers andpurchasers at the same time and within every transaction.
Presentation by Edoardo Beretta (Dr. sc. ec. Dr. rer. pol.)

8
The formulations enounced before describe the so-called “law of the identitybetween each agent’s sales and purchases” formulated by Bernard Schmitt (1975),which:• is one of the most relevant implications of the BoP and is based on the circular
essence of bank money.• states that an economic subject has to finance his purchases by a concurrent sale
and – each time he sells – he must concurrently purchase. For example:i. US importers:
• net purchase of goods/services -$100;• net sale of a claim on the importers’ income (i. e. national bank deposits)
+$100;ii. exporters in the rest of the world (RW):
• net purchase of a claim on the importers’ income (i. e. national bank deposits) -$100;
• net sale of goods/services +$100.
Presentation by Edoardo Beretta (Dr. sc. ec. Dr. rer. pol.)

9
The paradox of today’s BoP:“• “[a]lthough the balance of payments accounts are, in principle, balanced,
imbalances result in practice from imperfections in source data and compilation”(IMF 2009, p. 11). Therefore, the aggregate sum of debts and credits has to be offsetby an item called “net errors and omissions”.
(1) The BoP is not based on an equilibrium, but on an “identity” (IMF 2009, p. 224): CAB + CFAB ≡ 0. (2) An equilibrium is just a particular (not always a given) condition, which has to be reached ex post. (3) Accepting that today’s BoP entries are often derived independently from different sources (with time lags) confirms its implicitly underlying single-entry bookkeeping conception and reduces the BoP to a collection of statistical
data instead of being a clear-cut T-account of all external transactions.
Presentation by Edoardo Beretta (Dr. sc. ec. Dr. rer. pol.)
How-ever:

10
Net errors and omissions (current US$) in the balances of payments of 192 countries(1990-2018)Source: own calculations on the basis of The World Bank (2019c)
-400’000’000’000.00
-300’000’000’000.00
-200’000’000’000.00
-100’000’000’000.00
0.00
100’000’000’000.00
200’000’000’000.00
19901991199219931994199519961997199819992000200120022003200420052006200720082009201020112012201320142015201620172018
Presentation by Edoardo Beretta (Dr. sc. ec. Dr. rer. pol.)

11
Current account imbalances (current US$) for 191 countries (1990-2018)Source: own calculations on the basis of The World Bank (2019a)
Presentation by Edoardo Beretta (Dr. sc. ec. Dr. rer. pol.)
-300’000’000’000
-200’000’000’000
-100’000’000’000
0
100’000’000’000
200’000’000’000
300’000’000’000
400’000’000’000
1990 1991 1992 1993 1994 1995 1996 1997 1998 1999 2000 2001 2002 2003 2004 2005 2006 2007 2008 2009 2010 2011 2012 2013 2014 2015 2016 2017 2018

12
Capital and financial account imbalances (current US$) for respectively 186 and 192countries (1990-2018)Source: own calculations on the basis of The World Bank (2019b; 2019d)
Presentation by Edoardo Beretta (Dr. sc. ec. Dr. rer. pol.)
-800’000’000’000
-600’000’000’000
-400’000’000’000
-200’000’000’000
0
200’000’000’000
400’000’000’000
600’000’000’000
800’000’000’00019
9019
9119
9219
9319
9419
9519
9619
9719
9819
9920
0020
0120
0220
0320
0420
0520
0620
0720
0820
0920
1020
1120
1220
1320
1420
1520
1620
1720
18
Net financial account (BoP, current US$)
Net capital account (BoP, current US$)

13
THE RESERVE ACCOUNT (INCL. SO-CALLED “RESERVE ASSETS”) AS
THE ACCOUNT OF A COUNTRY TAKENAS A WHOLE.
Presentation by Edoardo Beretta (Dr. sc. ec. Dr. rer. pol.)

14
Monetary definition of “country” or “nation”:• based on the money unit involved and the corresponding banking system (i. e.
a country’s national currency is an acknowledgment of debt of the whole system).• “sets of their residents” ( 𝑆𝑆1, … , 𝑆𝑆𝑛𝑛 ) macroeconomic approach.• “aggregate or sum of their residents” (∑(𝑆𝑆1, … . , 𝑆𝑆𝑛𝑛) microeconomic approach.
The totality of any country’s external transactions is carried out by its residents,State included. The country itself, as the set of its residents, is no autonomouseconomic agent. However:• international reserves are managed by the central bank on behalf of the country as
a whole.• the BoP should distinguish between “origin” (i.e. residents of the country),
“administration” (i.e. the central bank) and “economic ownership" (i.e. thecountry as set of its residents) of foreign exchange reserves.
Presentation by Edoardo Beretta (Dr. sc. ec. Dr. rer. pol.)

15
How to highlight the country’s involvement from an accountingperspective:• commercial and financial transactions in the BoP pertain to private and
public agents (i.e. residents) but modify the nation’s position as a whole:i. a country’s economic account (i. e. a new version of the existing
IIP) should be created.ii. the official reserves account would mainly deal with foreign
reserves (as it already does) and represent the account of thecountry taken as a whole.
iii. the reserve account would be directly involved in every current,capital and financial account transaction (for example, acommercial export would lead to an increase in the country’s officialreserves because of the positive inflow of a sum of foreigncurrency).
Presentation by Edoardo Beretta (Dr. sc. ec. Dr. rer. pol.)

16
TODAY’S SYSTEM OF INTERNATIONALPAYMENTS DOES NOT RECOGNIZE THEEXISTENCE OF COUNTRIES AS SETS OF
THEIR RESIDENTS.
Presentation by Edoardo Beretta (Dr. sc. ec. Dr. rer. pol.)

17
The BoP should be transformed into a bookkeeping instrument forboth the country as a whole and its residents:• the system of international payments in its current form is flawed
because it is at odds with the flow nature of money;• the BoP is a mere collection of separate statistical data and hardly
complies with the bookkeeping identity on which it should be founded.
It is not the trade balance of any single country that must be inequilibrium, but its monetary balance, its overall inflows and outflowsof foreign currencies:• the corollary to IM ≡ EX (i.e. the identity between each country’s
global sales and purchases) is the necessary equilibrium of theirmonetary balances.
Presentation by Edoardo Beretta (Dr. sc. ec. Dr. rer. pol.)

18
The reform steps:
• BoP to become a bookkeeping account of the external transactions of countries;• creation, in each country, of a national Bureau responsible for all the payments by and in favour
of the country’s residents;i. internal department (ID) turned toward the country’s domestic economy;ii. external department (ED) turned toward the rest-of-the-world;
• using the country’s domestic currency, each payment initiated by the country’s residents iscarried out as a double double-entry procedure;
• example:i. importers are credited-debited by their banks: their purchases imply a debit and are
matched by equivalent sales of financial claims (deposit certificates or securities), for theamount with which they will be credited;
ii. the Bureau’s ID is credited by the sum of national currency spent by importers anddebited for an equal amount to the benefit of its ED;
iii. the ED will first purchase financial claims from its domestic economy and then sell themabroad in order to finance its external payment on behalf of country’s importers. Everyinflow of national or foreign currencies to each department of the Bureau will thus bebalanced by equivalent outflows.
Presentation by Edoardo Beretta (Dr. sc. ec. Dr. rer. pol.)

19
CONCLUDING REMARKS
Presentation by Edoardo Beretta (Dr. sc. ec. Dr. rer. pol.)

20
Some reflections about the reasons for the status quo:• money wrongly identified with a positive asset and vehicular essence
neglected:i. this principle alone necessarily imposes that any single agent
involved in a transaction is credited (debited) and debited(credited) by the same amount. No accounting discrepancies canoccur.
• “countries” or “nations” are monetarily speaking considered “sum oftheir residents” instead of “set of their residents”.
• Implicitly underlying simple- instead of double-entry-bookkeepinglogic.
• BoP identity wrongly turned into a condition of equilibrium.
Presentation by Edoardo Beretta (Dr. sc. ec. Dr. rer. pol.)

21
• BoP’s significance due to far-reaching history from the 19th centuryonwards, but also to underlying double-entry bookkeeping mechanisms.
• Every transaction must be entered twice, once as a credit (debit) andonce as a debit (credit). But, since commercial and financialregistrations are recorded separately, the BoP is exposed to billion-high inaccuracies. By doing so, the double-entry bookkeeping logicis openly neglected, turning the BoP into a mere statistical instrument.
• This paper as a plea for a substantial, conceptual reformimplementing the double-entry bookkeeping already recognized to be apillar of the BoP. This would simplify the recording process, nowcomplicated by valuation and time issues (leading in turn to massive,cumulative inaccuracies).
Presentation by Edoardo Beretta (Dr. sc. ec. Dr. rer. pol.)

22
THANK YOU!FOR FURTHER INFORMATION:
[email protected] [email protected]
SEE ALSO THE NUMERICAL(POST-REFORM) EXAMPLE IN THE ANNEX.
Presentation by Edoardo Beretta (Dr. sc. ec. Dr. rer. pol.)

1/1
IFC Conference on external statistics "Bridging measurement challenges and analytical needs of external statistics: evolution or revolution?", co-organised with the Bank of Portugal (BoP) and the European Central Bank (ECB)
17-18 February 2020, Lisbon, Portugal
The weight of a Libra: are stablecoins a new challenge for external statistics compilers?1
Alessandro Croce, Marco Langiulli and Giuseppina Marocchi,
Bank of Italy
1 This presentation was prepared for the meeting. The views expressed are those of the authors and do not necessarily reflect the views of the BIS, IFC, BoP, ECB or the central
banks and other institutions represented at the meeting.

The weight of a “Libra”: are stablecoins a new challenge for external statistics compilers? 1
The weight of a “Libra”: are stablecoins a new challenge for external statistics compilers?
Alessandro Croce, Marco Langiulli and Giuseppina Marocchi1
Abstract
In June 2019, Facebook released a White paper, providing details about a new digital asset called Libra, to be launched in the first half of 2020. Libra is conceived as a low volatility digital coin (stablecoin), fully backed by a reserve of liquid assets and managed by an independent organization. Other Big-Tech companies could follow suit with similar initiatives, eventually reshaping the financial sector: given their (alleged) capacity to preserve value over time and the reputation of their proponents, these coins could rise as global payment instruments as well as novel reserves of value. Regardless of any technical details and contingent regulatory requirements, the purpose of this paper is to evaluate and highlight the impacts of such instruments on external statistics compilation. After a brief digression on digital assets’ features and classification, the potential effects on a few Balance of Payments’ items are discussed: workers’ remittances, digital trading and financial account.
Keywords: crypto-assets, stablecoins, Libra, balance of payments, remittances, payment services.
1 Bank of Italy, Directorate General for Economics, Statistics and Research.
The authors wish to thank Riccardo De Bonis and Giuseppe Ferrero for their helpful comments. The views expressed in the article are those of the authors and do not involve the responsibility of the Bank of Italy.

2 The weight of a “Libra”: are stablecoins a new challenge for external statistics compilers?
Contents
The weight of a “Libra”: are stablecoins a new challenge for external statistics compilers? .......................................................................................................................................... 1
1 Introduction ....................................................................................................................................... 3
2 New digital forms of money ....................................................................................................... 4
2.1 Crypto-assets .......................................................................................................................... 5
2.2 Stablecoins .............................................................................................................................. 5
2.3 Global Stablecoins ................................................................................................................ 6
3 Impact on External statistics........................................................................................................ 8
3.1 Digital assets in the context of macro-statistics ....................................................... 8
3.2 Remittances ............................................................................................................................. 9
3.3 Trade in goods and services ........................................................................................... 12
3.4 Financial account ................................................................................................................. 13
4 Concluding remarks ..................................................................................................................... 17
References ................................................................................................................................................ 19
Annex A: Libra ......................................................................................................................................... 20

The weight of a “Libra”: are stablecoins a new challenge for external statistics compilers? 3
1 Introduction
In June 2019, Facebook released a White paper2, describing the main features of a new digital currency named Libra. According to promoters, this new instrument for international payments and transactions should hit the market during the first half of 2020.
In the days following the announcement, financial institutions, politicians and regulatory agencies began raising concerns on issues such as: privacy, money laundering, consumer protection and financial stability.
Facebook is already too big and too powerful, and it has used that power to exploit users’ data without protecting their privacy. We
cannot allow Facebook to run a risky new cryptocurrency out of a Swiss bank account without oversight.
Sherrod Brown, American Senate Banking Committee
Even though details are still unavailable at current time, regulators have been analyzing the project to cope with any possible risk and opportunity related to the innovation3. For instance, Bank of Italy’s working group on financial innovation set up a task force to evaluate implications on some of its institutional functions (payments system, supervisory activities, financial stability and monetary policy). Hence, as compilers of the Italian Balance of Payments and International Investment Position, we would like to follow the work done by our colleagues and focus on the effects for data collection and production of external statistics.
Libra has been conceived as a “stablecoin”, a digital coin that will be backed by a basket of fiat currencies. While media have concentrated on Facebook’s project, other collateralized coins with similar features could reach scale in the near future. For an accurate investigation on stablecoins’ present stage of development, see G7 Working Group on Stablecoins (2019).
The paper is divided into 4 sections; after this introduction, section 2 provides a brief overview on digital assets (with a focus on the novelty of stablecoins). Section 3, which is the bulk of the paper, discusses about the treatment of digital assets in external statistics and the ways to record them in the Balance of Payments. Concluding remarks are included in section 4.
2 https://libra.org/en-US/wp-content/uploads/sites/23/2019/06/LibraWhitePaper_en_US.pdf 3 For a comprehensive view, see G7 Working Group on Stablecoins (2019): Investigating the impact of
global stablecoins.

4 The weight of a “Libra”: are stablecoins a new challenge for external statistics compilers?
2 New digital forms of money
Digitalization is transforming money and payments systems; innovative forms of “currencies” wax and wane at an unprecedented speed, so that it is impossible to make sense of any innovation without a solid conceptual framework.
Waiting for Libra (or related coins), digital money has already surfaced in a variety of contexts. WeChat and Alipay dominate the payments system in China while in Africa mobile providers such as M-Pesa have successfully launched money transfer services. Finally, thousands of digital currencies already exist, enabled by the use of cryptography and Distributed Ledger Technology (Brunnermeier et al., 2019). What do these means of payments have in common? Not much, except the fact that they are digital assets, usable as private means of payments (money) with no backstop from Government or public authorities.
Stemming from Adrian and Griffoli (2019), we propose a simplified taxonomy for these digital assets, based on three attributes: Underlying technology, Issuer characteristics and Redemption value. The classification of Figure 1 is neither innovative nor comprehensive, but introduces a basic framework and a reference vocabulary for the rest of the paper.
Digital Money Tree
Figure 1
The first attribute is technology: transactions using centralized technology go through a central proprietary server, while decentralized ones are settled among several nodes. We will focus only on the latter type, as e-money centralized

The weight of a “Libra”: are stablecoins a new challenge for external statistics compilers? 5
transactions are no big deal for statistics compilers, as they use existing payment infrastructures - such as debit or credit cards.
The second attribute pertains to the issuer: digital assets having no issuer or representing no claim on the issuer are called crypto-assets, in line with the definition provided by ECB (2019)4.
The last attribute is about value: when there is a private entity committed to redeem the digital asset, redemption can occur at either a fixed price or a variable price; in the first case, any possible risk is on the issuer, while in the second case there is no such backstop.
2.1 Crypto-assets
In principle, any asset recorded in digital form and enabled by the use of cryptography and Distributed Ledger Technology (DLT) could be deemed a crypto-asset. However, these instruments are at their initial stage of development and undergoing fast changes: even definitions are somewhat inconsistent across time and organizations. As previously said, the ECB points out that the use of DLT technology is a necessary but not sufficient element to characterize this asset class: the distinctive feature of crypto-assets is the lack of an underlying claim/matching liability.
Crypto-assets derive their high volatility from the absence of an underlying fundamental value, which hinders their capacity of performing the three functions of money: acting as a store of value, a means of payment and a unit of account. Today, these assets are actually held as investments by people who expect their value to rise, the most notorious example being Bitcoin and Ethereum.
2.2 Stablecoins
Inspired by Libra’s vicissitude, we conceived this paper to focus on so-called stablecoins, i.e. digital assets whose design should reduce price-volatility, favoring their adoption as means of payments. Terms used hereinafter follow those used by Facebook to describe Libra’s ecosystem and the entities involved.5
Stablecoins achieve price stability through different mechanisms: some of them are collateralized to a reserve of liquid assets (either traditional financial instruments or crypto-assets) while others implement an algorithm that adjusts their supply to maintain price stability. We will focus on the first class, as algorithmic stablecoins are more a theoretical possibility than a reality at the time of writing.6
Launched in 1996, E-gold can be considered the first example of a stablecoin: before the service was suspended in 2009 due to legal issues, E-gold holdings could be converted into physical gold. Tether (USDT), born in 2015, is the greatest stablecoin in terms of market capitalization and was originally designed to maintain a 1-to-1 ratio with the US dollar in terms of value; nevertheless, Tether Ltd. states that owners
4 We prefer using the word crypto-assets instead of crypto-currencies, because these instruments do
not have the typical features of a currency. 5 Annex A offers a short overview of Libra’s project. 6 Moreover, most algorithmic stablecoins could be considered crypto-assets, as they do not represent
a claim on the issuer (if any).

6 The weight of a “Libra”: are stablecoins a new challenge for external statistics compilers?
of Tethers have no contractual right, other legal claims, or guarantee that Tethers will be redeemed or exchanged for dollars. Other popular stablecoin initiatives include TrueUSD, which is similar to Tether but does offer legal protection to token holders, and Dai, which is backed by a portfolio of crypto-assets.
In most cases, an independent entity purchases and sells assets as a collateral for the coins issued. The amount of assets moves according to the circulating supply of the stablecoin, which in turn reflects users’ conversion demands.
As previously mentioned, stablecoins can have different characteristics in terms of backing reserve and redemption value.
• Reserve assets can fully back the amount of the outstanding coins or they can be just a fraction of the liabilities issued.
• Stablecoins may be backed by any kind of assets (deposits in fiat currencies, metals, crypto-assets and so on). Of course, the more liquid the reserve is the more “stable” is the value of the issuance, even though holding short-term deposits can be extremely costly.
• Coins can be redeemed at a fixed (pre-determined) or at a variable conversion price, dependent on reserve’s market fluctuations. In the second instance, stablecoins have the typical features of investment fund shares (for this reason, Adrian and Griffoli (2019) call these instruments i-money instead of e-money).
A precise scrutiny on stability and convertibility issues can be found in Ferrari and Ferrero (2019). According to the authors, there is a trade-off between the stability of coins’ value and the stability of the system as a whole: if coins can be redeemed at a fixed conversion price, the issuer internalises any possible loss, which eventually could lead to its default; on the contrary, if no-par convertibility is guaranteed, coins’ value may vary over time depending on the composition of the reserve.
2.3 Global Stablecoins
The impact of stablecoins on the financial system has been negligible so far, as the most popular assets are linked to a single currency and have failed to become widespread means of payment. For this reason, many “Big-Tech” companies are preparing to issue “second-generation” assets, defined in literature as Global Stablecoins (GSC), having the following features:
• They will be accessible to everyone, in several jurisdictions;
• They will run on standalone independent payment systems.7
• In most cases, they will be “collateralized stablecoins”, backed by a portfolio of very liquid assets, much like an exchange-traded fund (ETF).
On the one hand, Big-tech companies can draw on huge amounts of data and count on billions of users, to be involved in profit-generating activities. On the other hand, payment services provide Big-tech companies with the opportunity to enhance their relevance in people’s lives and generate valuable data on the transactions between users (Bilotta and Botti, 2019). This unique combination represents a crucial advantage for them to leverage on.
7 Unlike platforms like Apple Pay, Alipay, PayPal etc., which use existing payment infrastructures.

The weight of a “Libra”: are stablecoins a new challenge for external statistics compilers? 7
As stated above, Facebook has recently taken the first step along these lines by presenting its own stablecoin, called Libra. Yet, most of the thoughts and reflections in this paper are not limited to this initiative but applies to similar (global) stablecoins that will eventually reach scale in the near future. At the time of writing, examples include Walmart’s Units, Telegram’s Gram, as well as an alleged move by Amazon, which bought up a number of crypto-assets related domain names.
Global stablecoins could gradually emerge as an alternative to fiat money, having the potential to foster the development of faster, cheaper and more inclusive payment arrangements (G7 WG on Stablecoins, 2019). Moreover, these coins can benefit from the reputation of their proponents and the network effects created by their huge customer base.
Indeed, regardless of any contingent impediments and slowdowns, digitalization of money seems able to address most of the limitations of existing financial systems, reshape their traditional structures and redefine the roles of banks and central banks. For that reason, statistics compilers should anticipate the most predictable issues, in order to cope with this advent as smoothly as possible.

8 The weight of a “Libra”: are stablecoins a new challenge for external statistics compilers?
3 Impact on External statistics
Treatment of digital assets is still neglected in the statistical framework of Balance of Payments and International Investment Position.
A first reason for this is their limited value in relative terms: according to ECB (2019), total market capitalization of crypto-assets was 96 billion euros in January 2019,8 around 1% of euro area GDP. When compared to traditional monetary aggregates, the capitalization of crypto-assets is 1.2% of euro area M1 and 0.8% of M3. In addition, these assets are so volatile that this amount was less than one sixth of the market capitalization reached just one year before, in January 2018.
A second issue is that these assets enable electronic payments without relying on third parties such as banks or clearinghouses; so national authorities in charge for compilation of statistics have no reliable data sources.
If digital assets become widely used as payment instruments or store of value, this shall have both direct and indirect impacts on external statistics. However, compilers will struggle to find a suitable item to include these assets in, using current definitions.
3.1 Digital assets in the context of macro-statistics
Even though digital assets do not (currently) serve the basic functions of money, they have a monetary value and a price on the market where they are traded. Ipso facto, these instruments are to be considered economic assets but, depending on their specific features, they might fit better in the category of non-financial assets or financial assets.
In line with the guidelines issued by the IMF (2018), crypto-assets like Bitcoin should be considered produced non-financial assets, because they are the outputs of a production process and they do not represent a liability for any institutional unit.9 In particular, these assets are to be included in the sub-category of valuables, much like precious metals and stones (in fact, they come into existence through a process called “mining”).10
In the Balance of Payments (BoP), transactions in valuables are recorded indistinctly under general merchandise: in this regard, a separate identification of transactions in crypto-assets might be useful in order to help monitor trends and isolate impacts on the current account (Figure 2).
On the contrary, stablecoins should be considered financial assets to the extent that they represent a claim on the issuer and the issuer recognise a liability vis-à-vis the holders. Insofar they are backed by fiat currencies and reserve assets, these coins could be considered very similar to investment fund shares / units and could be recorded accordingly in the Balance of Payments. Under this treatment, any
8 According to the definition used in the paper, stablecoins having an identified issuer are not included
among crypto-assets. 9 Non-financial assets can be non-produced as well: examples include land and natural resources in
general. 10 See also 2008 SNA, Chapter 11 and OECD (2018), to draw a parallel with National Accounts.

The weight of a “Libra”: are stablecoins a new challenge for external statistics compilers? 9
transactions in GSCs would have a direct impact on the financial account as well as an indirect impact on the current account.
Digital assets impacts on BoP accounts and IIP
Figure 2
With no claim to completeness, in the next paragraphs we will focus on selected items and situations.
3.2 Remittances
Workers’ remittances are payments made by migrants employed in new economies to non-resident households and are included in the item called Personal transfers.
In latest years, the growth of international mobility has led to a significant increase in value of the flows of remittances registered worldwide.11 Nonetheless, these retail payments remain slow, expensive and opaque as operators charge significant transfers fees. Besides, there are 1.7 billion people globally who are unbanked or underserved with respect to financial services, even though 1.1 billion of them have a mobile phone (G7 Working Group on Stablecoins, 2019). Digital assets are able to address most of these shortcomings, as they can be quickly transferred peer-to-peer and converted in any currency; it is no surprise then that Big-tech and Fin-tech companies are turning their attention on these assets as they try to make their way into financial markets.
In the Italian Balance of Payments, both inward and outward remittances are estimated using supervisory reports transmitted by official intermediaries (Money Transfer Operators and banks) on a quarterly basis. While incoming flows are almost negligible, outward ones represent the largest type of transfer, accounting for more than 6 billion euros in 2019 (see Table 1).
11 According to the World Bank, global remittances are worth little less than 700 billion dollars a year.
Even considering the fact that the definition of remittances used by the institution is broader- including both personal transfers and compensation of employees – this figure is still impressive. For many developing countries, the amount of inbound remittances exceeds the value of foreign direct investments.

10 The weight of a “Libra”: are stablecoins a new challenge for external statistics compilers?
Outward remittances by country of destination Year 2019, EUR Million Table 1
Value
BANGLADESH 856.07
ROMANIA 613.60
PHILIPPINES 414.93
PAKISTAN 411.86
SENEGAL 376.10
MAROCCO 328.19
INDIA 312.80
SRI LANKA 278.34
PERU 218.88
GEORGIA 196.21
UKRAINE 173.77
ECUADOR 147.32
ALBANIA 137.14
DOMINICAN REPUBLIC 114.92
NIGERIA 108.27
MOLDOVA 107.78
OTHER COUNTRIES 1282.66
TOTAL 6078.86
Sources: Bank of Italy
This should be regarded as a lower bound for the actual amount of remittances, as migrants could prefer using cheaper informal channels under certain circumstances (e.g. direct delivery of money when returning home).12
The World Bank calculates and tracks the costs for sending remittances worldwide; we analysed its database to find out that in 2018 the average global fee for sending 500 dollars from Italy amounted to about 4.4% and was even higher for payments of 200 dollars (around 6%).13 Global average has been declining over the years and has settled around 5% (see Figure 3), also thanks to a project promoted by G8/G20 in 2009.14 In any case, payments are not usually processed in real time: in 40% of the instances, remittances were not available to the receiver until the next day.
12 In one of the few empirical works attempting to estimate the size of informal flows, Magnani et al.
(2016) estimate informal outflows from Italy at between 10 and 30%. 13 These figures include any fees charged on both the sender and the receiver; on average, the exchange
rate margin applied by service providers was calculated between 1.5% and 2%. 14 The project, called 5x5 Objective, was aimed at reducing remittances’ average costs by 5 percentage
points in 5 years (De Bonis and Vangelisti, 2019).

The weight of a “Libra”: are stablecoins a new challenge for external statistics compilers? 11
Average % cost of remitting 500 USD from selected G20 countries
Figure 3
Source: The World Bank (2019).
Should the fees charged by authorized resellers be low, Global Stablecoins could be an appealing alternative to existing operators, while crowding out informal channels as well. Intuitively, amounts remitted through the informal channel are lower when travel costs are higher, the risks entailed in informal intermediation are more significant, fees and exchange rate mark-up are lower (Ferriani and Oddo, 2019).
Considering that most recipient countries can count on a medium-to-high digital inclusion and that recourse to the informal channel is expensive or inconvenient for all main destinations (but Romania and Ukraine), it is not far-fetched to assume a significant shift between money transfer operations and digital-assets payment solutions in the near future. If the “substitution rate” were in the range of 15-20%, we would miss almost 1 billion euros a year of transactions that we are not able to track at present times.
Box 1
Money Laundering
Remittances can be difficult to track and potentially sensitive to money laundering and terrorism financing concerns. Though no serious risk should be associated with migrants sending money to their families, misuse of the financial system remains a serious issue.
Controls on Money Transfers operations are usually carried out by national Financial Intelligence Units (FIUs), together with central banks and / or law enforcement authorities. Coordinated efforts to uncover illicit conducts has increased the cost of sending remittances and has set constraints on users. For instance, in Italy these operations are individually recorded while cash payments cannot exceed 1,000 euros.
On the contrary, transactions in digital assets are still unregulated and must not comply with any Anti-Money Laundering regulations. This circumstance, which is not expected to change in the short term, could divert more and more remitters from regulated markets, even though their

12 The weight of a “Libra”: are stablecoins a new challenge for external statistics compilers?
income was not generated by irregular activities. Indeed privacy and confidentiality concerns could play a role in such circumstances.
Service providers might be required to conduct due-diligence checks on their users, which could prove extremely problematic due to the anonymity or pseudo-anonymity enjoyed by their users. These concerns also arise in relation to tax compliance.
According to a statement sent by the Libra Association to CoinDesk, for instance, “it will be the responsibility of developers building on the Libra Blockchain to comply with the laws and regulations in the jurisdictions in which they operate”.
Practical considerations
Data collection for this item is already quite challenging, as in some corridors a sizable amount of remittances is sent through informal channels. Future cooperation from the entities involved in the GSC system (wallet providers and authorized resellers, in the case of Libra) will be more important than ever in order to correctly assess the phenomenon. Alternatively, we might rely on supervisory reports – as it happens today for official operators – in case these new entities will be asked to comply with supervisory requirements.
3.3 Trade in goods and services
In the Italian Balance of Payments import and export of goods are estimated by the national statistical institute (ISTAT) using data on border passage coming from national customs. As means of payments are not relevant in this regard, there should be no impact on Balance of Payments if goods are paid using digital assets instead of national currencies.
International trade in services is more complex to assess because there are no physical cross-border passages involved. Transactions between companies (B2B) should be covered by the direct reporting system in place whilst transactions involving private customers (B2C) are estimated thanks to the information reported to the MOSS system (Mini One Stop Shop). This system was implemented within the European Union to redistribute the VAT paid by non-taxable persons to enterprises providing some types of digital services15, registered in one member State.
In this regard, as long as the selling company is registered to MOSS, its transactions can be retrieved by its fiscal records and means of payment are not relevant either. Of course, if the company is not registered to MOSS and/or is resident outside the European Union, no data on transactions are available at present.
Practical considerations
Current account of the BoP could be indirectly influenced by Global Stablecoins, which are likely to stimulate global trade in both goods and services. In particular, as a side effect, such instruments could foster extra-EU digital trade as long as payments with digital assets will prove cheaper and smoother than traditional foreign-currency operations. In this case, compilers will need supplementary sources of information, as in the case of remittances.
15 I.e. telecommunication, broadcasting and electronic services.

The weight of a “Libra”: are stablecoins a new challenge for external statistics compilers? 13
3.4 Financial account
Besides the indirect effects on the current account, the rise of Global Stablecoins would have a substantial effect on the financial account, in particular on the functional categories of Portfolio Investment and Other Investment.
Portfolio investment is defined in BPM616 as cross-border transactions and positions involving debt or equity securities, other than those included in direct investment or reserve assets.
Other investment is a residual category including, among other things, currency – which consists of notes and coins of fixed nominal values issued or authorized by central banks or governments - and deposits. Even though no private digital assets can be classified as a currency itself, the basket of instruments underpinning Global Stablecoins will arguably include currencies.
As already stated, stablecoins may be fully or partially backed by any kind of assets, from commodities to digital assets. However, for a global stablecoin to be used with trust by the public as a substitute of legal money, chances are that issuers will maintain 100% guaranteed reserves invested in a basket consisting of the most important currencies, at least at the initial stage.17
To evaluate the possible repercussions on the Financial Account, let us assume the following:
• The representative fund holding the assets purchased as collateral (Reserve, using Facebook’s nomenclature) is headquartered in country A (e.g. Switzerland); for the sake of simplicity, collateral includes only bank deposits and/or short-term government securities in euros and US dollars (in fixed and equal quantities).
• The representative holder (Holder 1) of the GSC and his bank are resident in country B (Italy).
• Reserve holds accounts with a geographically distributed network of depositary banks/custodians, which includes intermediaries from Country B.
• Holders of GSCs do not receive any remuneration.
• The Issuer (Libra Association, using Facebook’s nomenclature) defines the investment strategy and commits to convert coins in fiat money, but the actual amount at redemption will vary according to the EUR / USD exchange rate.
Case 1: Reserve basket consisting of deposits
In the simplest possible case, Reserve deposits all the funds it receives from Holder 1 in one or more accounts with Italian and non-Italian banks. Looking at the global banking system as a whole, account deposits would just change hands, with a liability vis-à-vis Households in Italy becoming a liability vis-à-vis Other financial corporations in Switzerland - assuming Reserve will be considered similar to an investment fund. Nevertheless, while the initial set-up is not relevant for external statistics, the purchase produces cross-border transactions and moves the financial account.
16 IMF (2009): Balance of Payments and International Investment Position Manual, sixth edition. 17 As a matter of fact, in a letter responding to a question from a German legislator, Facebook said the
dollar would make up 50% of its basket, followed by the euro with 18%, the yen with 14%, the British pound with 11% and the Singapore dollar with 7%.

14 The weight of a “Libra”: are stablecoins a new challenge for external statistics compilers?
In general, if the pool of depositary banks is less geographically diversified than the pool of GSC users, there are some redistributive effects as deposits will concentrate in some countries. However, with regard to developed economies, it is likely that stablecoins will not substitute the current payment system (which revolves around banks) but will integrate it. This means that users are not expected to hold reserves of these assets but would rather purchase stablecoins right before a disbursement and would recollect fiat money right after a receipt.18
Case 2: Reserve basket consisting of deposits and securities
In this (more realistic) instance, Reserve invests part of the funds it received from Holder 1 in Short-Term government bonds, basically acting like a monetary fund. In addition to the effects sketched out in the previous section, compilers would record potential purchases and sales of domestic securities under Portfolio Investment. The complexity of registrations depends crucially on the investment strategy defined (up-front) by the Association: a portion of the deposits drained from the banking system may revert to domestic bank deposits and short-term government securities, provided that these assets can be part of the reserve.
As an example, let us illustrate the strategy summarized in Figure 4, where the Association issues GSCs for a total amount of 250 euros (of which 130 purchased by Italian residents), recording it on the liability side of its balance sheet. On the asset side, the funds received are partly held in deposits (100, of which 40 with Italian banks), while the remaining part is invested in securities (150, of which 30 in short term debt securities issued by Italian Government).
Accounting records from the GSC issuer’s balance sheet Figure 4
GSC ISSUER Assets Liabilities
Bank deposits 100 Coins 250 vis-a-vis IT 40 vis-a-vis IT 130 vis-a-vis CH 60 vis-a-vis CH 120
Portfolio investments 150 IT debt securities 30 CH debt securities 20 US debt securities 100
From the Italian perspective, these transactions reflect in the BoP in the way described in Figure 5. In detail: the purchase of 130 euros of GSCs generates an increase of assets vis-à-vis Switzerland, in a specific item named GSC. The purchase of Italian securities (30 euros) made by Reserve gives rise to an increase of liabilities in the item Portfolio investment – debt securities. The increase in MFIs deposits
18 On the contrary, if users hold GSCs in deposit-like accounts, retail deposits at banks may decline
permanently, increasing bank dependence on more costly and volatile sources of funding (G7 WG on Stablecoins, 2019).

The weight of a “Libra”: are stablecoins a new challenge for external statistics compilers? 15
liabilities item (100 euros) is due to: the “new” 40-euros account opened by the Association (for Reserve); the settlement of the GSCs purchased by Italian resident (90 = 130 – 40 deposited in the account); the settlement of the securities issued by the Italian Government and purchased by the Swiss entity (-30).
Simplified BoP/IIP recordings of GSCs from an Italian perspective
Figure 5
ITALY – COUNTRY B Transactions Closing position Assets Liabilities Assets Liabilities Financial account 130 130 132 131
Portfolio investment 30 31 Other investment - Deposits MFIs 100 100
Deposits vis-a-visa Other fin. Corp. 40 Securities settlement -30 GSC settlement 90
GSC 130 132 Net E&O / Net IIP 0 1
Transactions involving MFIs deposits are considered by convention as increase/decrease in liabilities; they might have been considered as decrease/increase in assets, with the same final results.
In both cases, the IIP at the end of the period reflects the transactions occurred: the net IIP should not significantly change because any transaction is balanced by a financial settlement. However, the position can vary as a result of valuation changes: securities’ prices and GSC’s price and exchange rate fluctuations, since we supposed that coins are not guaranteed to maintain a fixed value. In our example, Italian debt securities revaluated by 3% while GSCs revaluated by 1.5% (see “Closing Position” columns in Figure 5).
Practical considerations
In theory, BoP/IIP correct recordings are possible, provided that comprehensive data is available for each period, referring to all the phenomena.
In practice, the task of external statistics’ compilers will be subject to:
1. the regulatory requirements that are going to be introduced and
2. the technical features of the blockchain.
The first point mainly concerns compilers of the economy where Reserve will be headquartered: they should be placed in a position to obtain data on its investments by means of supervisory reportings, as in the case of financial institutions, and/or other disclosure statements.
The second point concerns compilers of other economies, too. The sine qua non condition for a proper assessment of GSCs holdings is that e-wallet providers reveal some information on users (their residency in aggregate form, at the very least), in breach of the pseudo-anonymity associated to digital assets using DLT. However, it is not yet definite if these data will be technically available and to what extent public agencies will be allowed to access the blockchain to analyse transactions (Bilotta and Botti, 2019).

16 The weight of a “Libra”: are stablecoins a new challenge for external statistics compilers?
As an alternative, compilers must settle for best-effort estimates, based on different sources such as household surveys, direct reporting from enterprises, administrative sources and tax records. Starting this year, for instance, Italian taxpayers are asked to declare the overall amount of “virtual currencies”19 they own within the tax statement used to disclose foreign assets. Anyway, it is clear that these solutions would be particularly prone to under-reporting and misreporting, if no controls can be enforced by authorities.
However, a good starting point would be a widespread agreement on the main definitions, giving unambiguous answers to at least these questions: in which BoP item should GSCs be classified? Which is the sector of GSCs issuer? In which country is the issuer considered to be resident? Where should compilers collect data on GSCs prices/exchange rates?
19 “Valute virtuali” in the original form, with no further partition.

The weight of a “Libra”: are stablecoins a new challenge for external statistics compilers? 17
4 Concluding remarks
The paper focuses on the digital assets phenomenon with a twofold purpose: providing a general overview of such instruments in the context of external statistics and highlighting the expected effects of global stablecoins’ success on BoP/IIP items.
Digital assets transactions and positions are not comprehensively captured within the current BOP / IIP framework. Even though some guidelines for classification exist, very few compilers include them in their statistical production. The main reason for this hiatus is related to their limited diffusion: even so called stablecoins are still tailored to niche audiences and are not used as a substitute of money for everyday operations.20
Circumstances are likely to change in case some initiatives of this kind are launched by Big-Tech companies, thanks to their ubiquitous presence and impressive customer base. On occasion, digital assets conceived by these players are called Global Stablecoins, to stress their ambitions to become widespread systems of financial intermediation. Facebook’s Libra was the first such initiative to be revealed to the general public last year, being immediately caught in a crossfire by regulators, authorities, politicians and pundits. Perhaps the pilot project was “too ambitious, too soon” and will never become operational, at least in its initial form. However, several experiments are on the launching pad and it would be a surprise if other companies do not follow suit in the short-medium term, to take advantage of the shortcomings of the financial system, particularly in the field of cross-border payments.
Global Stablecoins could have controversial implications in many fields (from privacy protection to tax compliance, from accounting to financial supervision, and so on), requiring international coordination to ensure common sets of rules and standards as well as a level playing field. Moreover, GSCs could increase vulnerabilities in the broader financial system through several channels, especially in those countries whose currencies are not part of the reserve. However, analysing the systemic implications of stablecoins’ possible success was outside the scope of this document.
Digital assets representing a claim on the issuer are financial assets, to be included in the financial account of the BoP; crypto-assets, instead, should be treated as non-financial assets, with an impact limited to the current account. Since definitions are still vague and inconsistent, we expect the relevant authorities to find a solid agreement on the classification of digital assets and the economic activity of stablecoins’ issuers.
We anticipate that a widespread use of digital assets could have relevant impacts on remittances and, in general, on any kind of personal transfers - which may benefit from faster and cheaper conditions. However, repercussions are expected on other items as well, notably taxes on income and wealth, generated by these digital transactions. Further assessments of this topic could be carried out in the future, when the regulatory and fiscal frameworks will be set up.
When it comes to stablecoins, effects on financial account will be twofold, relating both to the assets used as reserve and to the coins themselves (held by users). Assets used as collateral for stablecoins can be estimated as long as they are kept by
20 Stablecoins still represent a small fraction of digital assets universe as their total value amounted to
around 4.3 billion of euros in July 2019. (Bullmann et al., 2019)

18 The weight of a “Libra”: are stablecoins a new challenge for external statistics compilers?
custodians providing data to the relevant National Competent Authorities (NCAs). Stablecoins’ holdings, instead, are more difficult to ascertain without ad-hoc reports coming from wallet providers, which act as coins’ custodians: these subjects should be invited/forced to cooperate, similarly to financial institutions. Alternative solutions (based, for instance, on surveys or administrative sources) are likely to be inadequate, due to underreporting issues.

The weight of a “Libra”: are stablecoins a new challenge for external statistics compilers? 19
References
Adrian, T and T Mancini-Griffoli (2019): “The Rise of Digital Money”, IMF FinTech Notes, No 19/001.
Bilotta, N and F Botti (2019): “Libra and the Others: The Future of Digital Money”, IAI Papers 2019, November 2019.
Bullmann, D, J Klemm and A Pinna (2019): “In search for stability in crypto-assets: are stablecoins the solution?”, ECB Occasional Paper Series, No. 230.
Brunnermeier, M K, H James and J Landau (2019): “The digitalization of money”, NBER Working paper series, No. 26300.
De Bonis, R and M I Vangelisti (2019): “Moneta - Dai buoi di Omero ai Bitcoin”, Collana Universale Paperbacks il Mulino.
ECB Crypto-Assets Task Force (2019): “Crypto-Assets: Implications for financial stability, monetary policy, and payments and market infrastructures”, ECB Occasional Paper Series, No. 223.
Ferrari, A and G Ferrero (2019): “Moneta pubblica e privata in un sistema economico moderno” (mimeo).
Ferriani, F and G Oddo (2019): “More distance, more remittance? Remitting behavior, travel cost, and the size of the informal channel”, Economic Notes. 2019; 1–23.
G7 Working Group on Stablecoins (2019): Investigating the impact of global stablecoins.
IMF (2009): Balance of Payments and International Investment Position Manual, sixth edition.
IMF Committee on Balance of Payments Statistics (2018): Treatment of Crypto Assets in Macroeconomic Statistics, presented at the Thirty-First Meeting of the Committee, October 2018.
Libra (2019): “An introduction to Libra”, https://libra.org/en-US/wp-content/uploads/sites/23/2019/06/LibraWhitePaper_en_US.pdf
Magnani, M, G Oddo, R Settimo and S Zappa (2016): “Le rimesse dei lavoratori stranieri in Italia: Una stima dei flussi invisibili del canale informale”, Bank of Italy Occasional Paper, 332.
OECD (2018): How to deal with Bitcoin and other cryptocurrencies in the System of National Accounts?, presented at the Meeting of the Working Party on Financial Statistics, November 2018.
The World Bank (2019): Remittances Prices Worldwide - Issue 31, September 2019.

20 The weight of a “Libra”: are stablecoins a new challenge for external statistics compilers?
Annex A: Libra
Libra is the first Global Stablecoins presented so far and its advent made the term itself popular for the general public. Hence, we believe that it is worth reporting its main features, as described in the White Paper, even though support for Facebook’s initiative is slowly slipping away. In fact, understanding the “ecosystem” sketched out in the White Paper allows to make some educated assumptions about the diverse entities involved in cross-border transactions.
Promoters claim that Libra should facilitate payments and make easier and more cost-effective moving money around the world. Additionally, it could provide a broader financial inclusion because these services should allow all users having a digital device to move money immediately.
Preserving value over time is a key requirement for every money to be accepted by users as a payment instrument and as a safe financial asset. Libra can be defined a “stablecoin”, meaning its value should not change much over time, as it will be fully backed by a reserve of real asset and actual fiat money.
The blockchain
Similar to other crypto-currencies, Libra blockchain is a technology implemented to allow transactions among users with no need of a central institution. At least at the first stage, this should be a permissioned blockchain with Libra Association’s members working as validators.
The Libra Association
The Libra Association is an independent and not-for-profit membership organization headquartered in Switzerland, which maintains the blockchain and defines Reserve’s investment strategy. The association is governed by the Libra Association Council, which is comprised of diverse and independent members. It is the only party able to create (mint) and destroy (burn) Libra coins, whenever authorized resellers purchase or sell those coins from the association.
The Reserve
The Reserve is an investment fund holding all the assets purchased as a collateral for Libra. Jointly with the Libra Association, it is in charge of issuing and converting the currency at customer demand. Reserve will not actively control the amount of money, as it will just accommodate the demand of Libras coming from end users through authorized resellers. Reserve’s balance sheet should include Libra coins on the liabilities side and these should be fully backed by financial instruments.
The assets in the Libra Reserve will be held by a geographically distributed network of custodians with investment-grade credit rating to provide both security and decentralization of the assets. Low-volatility assets included in the Reserve should be bank deposits and short-term government securities issued by the Central banks of the most important countries. Financial instruments included in the Reserve should be extremely liquid in order to accommodate all the conversion requests.
Interest on the reserve assets will be used to cover the costs of the system and, secondly, to pay dividends to the investors.

The weight of a “Libra”: are stablecoins a new challenge for external statistics compilers? 21
Authorized resellers
Reserve will work solely with a list of authorized resellers, who are unknown at the moment; other entities (i.e. would-be users and service providers) will have to buy their Libra coins from such third parties. In fact, resellers will be provided with a privileged status and thus be entitled to potentially very lucrative arbitrage windfalls, depending on the number of operators and the degree of market competition.
Finally, it is important to notice that Reserve undertakes to exchange Libra coins with authorized resellers only, who in turn have no obligation towards end users. This means that a situation of panic selling could severely undermine Libra’s liquidity.
Calibra
Calibra, a Facebook’s regulated subsidiary, has registered as a Money Service Business with the U.S. Department of the Treasury and is obtaining licenses in U.S. states that treat cryptocurrencies as the equivalent of money. It will be in charge of collecting all users’ information and providing the upcoming digital wallet of Libra coins. This entity is arguably of little interest for statistics compilers, since it will not be involved in transactions.
End users
It is certain that Facebook will ensure the possibility of using Libra as a payment instrument for operations on its own platform (and on its subsidiaries, like WhatsApp or Instagram). In addition, this possibility should be granted by the most important financial services corporations, sitting in the Council of Libra Association. Final users will not be able to purchase and sell Libra coins directly from the Reserve, but there should be some authorized resellers providing these services.
The following diagram shows a schematic representation of Libra’s structure.
Libra’s Ecosystem
Figure A.1
Source: Libra White Paper

The weight of a Libra: are stablecoins a new challenge for external statistics compilers?
Bridging measurement challenges and analytical needs of external statistics: evolution or revolution? (Lisbon, 17-18 February 2020)
Alessandro Croce, Marco Langiulli and Giuseppina Marocchi Bank of Italy - Statistical Analysis Directorate

Introduction
1
Digital assets Stablecoins Remittances and Current Account
Financial account Conclusions
In June 2019, Facebook released a White paper, describing the main features of a new digitalcurrency named .Libra is conceived as a stablecoin, a digital asset that is generally backed by a basket ofassets and fiat currencies. While media have concentrated on this project, othercollateralised coins with similar features could reach scale in the near future.The paper wants to explore stablecoins from the POV of external statistics compilers, with afocus on the possible impacts they could have on selected BoP items.

Digitalization is transforming moneyand payments systems. Waiting forLibra (or similar coins), digital moneyhas already surfaced in a variety ofcontexts.3 attributes for classification:1. Technology
Centralized vs decentralized2. Issuer
Claim vs No claim3. Redemption Value
Fixed vs Variable
2
Digital assets Stablecoins Remittances and Current Account Financial account Conclusions

Digital assets Stablecoins Remittances and Current Account Financial Account Conclusions
Crypto-assets (as defined by ECB Crypto-Assets Task Force) have two distinctive features: the use ofDistributed Ledger Technology (DLT) and the lack of an underlying claim/matching liability → highvolatile, incapable of performing the three functions of money.In the context of external statistics, they should be considered Produced non-financial assets.Our work focuses on collateralisedstablecoins: decentralized digital assetsrepresenting a claim → low volatile,potential means of payments.Stablecoins may be backed by any kind ofassets (deposits in fiat currencies, metals,crypto-assets and so on). Of course, themore liquid the reserve is the more “stable”is the value of the issuance.In the context of external statistics, theyshould be considered Financial assets.
3

4
Digital assets Stablecoins Remittances and Current Account Financial Account Conclusions
The impact of stablecoins onthe financial system has beennegligible so far, as the mostpopular assets are linked to asingle currency (USD) andhave failed to becomewidespread means ofpayment. For this reason,some “Big-Tech” companiesare preparing to issue“second-generation” assets,defined in literature as GlobalStablecoins (GSC).
Trust
Network effects
Transactioncosts
Integration / Convenience
Several reasons to believe they can get serious in theshort-medium term:

Digital assets Stablecoins Remittances and Current Account Financial Account Conclusions
In particular, stablecoins may foster the development of faster, cheaper and more inclusivepayment arrangements (G7 WG on Stablecoins), with particular regard to cross-bordertransfers and remittances.
Destination Value (EUR MLN)
Bangladesh 719.5Romania 611.2Pakistan 398.3Philippines 383.1Senegal 373.7Morocco 327.1India 311.7Sri Lanka 241.0Peru 215.6Georgia 195.6Ukraine 173.4Ecuador 146.6Albania 137.1Other countries 1602.5Total 5836.6
In the Italian Balance of Payments, both inward andoutward remittances are estimated using supervisoryreports transmitted by official intermediaries (MTOs andbanks). While incoming flows are almost negligible,outward ones accounted for about 6 billion euros in2019.This should be regarded more as a lower bound for theactual amount of remittances, as migrants could preferusing cheaper informal channels under certaincircumstances.
5

Digital assets Stablecoins Remittances and Current Account Financial Account Conclusions
Traditional channels are expensive, opaque and slow. The World Bank calculates and tracks the costsfor sending remittances worldwide; in 2018 the average global fee for sending 500 USD from Italyamounted to about 4.4% and was even higher for payments of 200 USD (around 6%). Global averagehas been declining over the years and has settled around 5%, but payments are hardly processed inreal time.
Most recipient countries can count on amedium-to-high digital inclusion while recourseto the informal channel is inconvenient → asignificant shift between money transferoperations and digital-assets payment solutionsis possible.If the “substitution rate” were in the range of15-20%, we would miss 1 billion of transactions.
6

Digital assets Stablecoins Remittances and Current Account Financial Account Conclusions
Other Current account items that could be affected by stablecoins’ predicted success:• Any personal transfer, regardless of the source of income and the relationship between the parties
• Other types of transfers, e.g. taxes on capital gains arising from trading
• Trade in goods and services (thanks to a spur to digital trade)
• Compensation of employees
7
Money Laundering concernsRemittances are difficult to track and sensitive to money laundering concerns. Efforts to uncover illicit conducts has increasedthe cost of sending remittances and has set constraints on users; on the contrary, transactions in digital assets are stillunregulated and must not comply with AML regulations. This could divert more and more remitters from regulated markets.

Digital assets Stablecoins Remittances and Current Account Financial Account Conclusions
In developed economies, chances are that bank money and decentralized coins will coexist,even though we expect some repercussions on banks’ funding → as users withdraw moneyfrom their deposits to buy coins, retail funding could be partially swapped by moreexpensive wholesale funding (for instance, Certificate of Deposits).
These flows and those relatedto collateral-investment wouldhave a substantial effect on thefinancial account of the Balanceof Payments, in particular onPortfolio Investment and OtherInvestment.We will get into it, through acouple of examples.
Bank
Bonds
Loans
Wholesale
Deposits
Stablecoin Issuer
Bank CDs Coins
Deposits outlfow
Collateral
8

Digital assets Stablecoins Remittances and Current Account Financial Account Conclusions
Baseline case: Reserve basket consisting of depositsAccount deposits would just change hands, with a liability vis-à-vis Households in Italybecoming a liability vis-à-vis Other financial corporations in Switzerland →if the pool of depositary banks is less geographically diversified than the pool of GSC users,there are some redistributive effects as deposits will concentrate in some countries.
Our hypotheses: The representative fund holding the collateral (Reserve) is headquartered in Switzerland Reserve holds accounts with a diversified network of custodians, including Italian banks Collateral includes only bank deposits and short-term gov. bonds in EUR and USD The representative holder (Holder) of the GSC and his bank are resident in Italy Holder receives no remuneration and redemption value is variable
9

Digital assets Stablecoins Remittances and Current Account Financial Account Conclusions
Realistic case: Reserve basket consisting of deposits and bondsReserve invests part of the funds inshort-term government bonds, actinglike a cross between an investmentfund and an e-money institution. Thecomplexity of registrations forcompilers depends on the investmentstrategy defined →Issuer might recycle part of its clients’funds back to Italy, not only in the formof bank deposits but also acquiringgovernment bonds.
Example: Balance sheetStablecoin issuer
Bank deposits 100vis-à-vis IT 40vis-à-vis CH 60
Portfolio investments 150
IT bonds 30CH bonds 20US bonds 100
Coins 250vis-à-vis IT 130vis-à-vis CH 120
10

Digital assets Stablecoins Remittances and Current Account Financial Account Conclusions
Example: Simplified BoP/IIP recordings • The purchase of GSC by Holder generatesan increase of assets vis-à-vis Switzerland
• The purchase of Italian securities byReserve gives rise to an increase inPortfolio liabilities
• The increase in Other investment liabilitiesis due to: the account opening by Reserve(40); the settlement of the Italian bonds;the settlement of the GSCs purchased byHolder (90 = 130 – 40 deposited)
• IIP should not change dramatically as longas any transaction is balanced by afinancial settlement. However, net positioncan vary as a result of valuation changes
ItalyTransactions Closing
PositionA L A L
Financial account 130 130 132 131Portfolio investment 30 31Other investment 100 100
Deposits 40Securities settlement -30GSC settlement 90
GSC 130 132Net E&O / Net IIP 0 1
11

12
CONs: naïve estimates, poor reliability, compelling revisions)
Digital assets Stablecoins Remittances and Current Account Financial Account Conclusions
In theory, correct recordings are possible provided that complete data is available.In practice, the task of external statistics’ compilers will be subject to:1. the regulatory requirements that are going to be introduced2. the technical features of the DLT
First-best solution
02OPTIONSThis is dummy text it is not here to be read. The is just text to show where you could insert text. This is dummy text.
e-wallet providers reveal some information on users(e.g., their residency in aggregate) → Is this feasible?
Alternative sources Household surveys, direct reporting from enterprises,tax records, etc. → Is this reliable?Formal guidance to assets’ classification andstatistical treatment of the entities involvedA starting point

Thanks for your attention!
Bridging measurement challenges and analytical needs of external statistics: evolution or revolution? (Lisbon, 17-18 February 2020)
Alessandro [email protected]

15
Annex: Libra ecosystem
Source: Libra White Paper
AC1

Slide 15
AC1 Alessandro Croce; 27.01.2020

16
ReferencesAdrian, T and T Mancini-Griffoli (2019): “The Rise of DigitalMoney”, IMF FinTech Notes, No 19/001.Bilotta, N and F Botti (2019): “Libra and the Others: The Future ofDigital Money”, IAI Papers 2019, November 2019.Bullmann, D, J Klemm and A Pinna (2019): “In search for stabilityin crypto-assets: are stablecoins the solution?”, ECB OccasionalPaper Series, No. 230.Brunnermeier, M K, H James and J Landau (2019): “Thedigitalization of money”, NBER Working paper series, No. 26300.De Bonis, R and M I Vangelisti (2019): “Moneta - Dai buoi diOmero ai Bitcoin”, Collana Universale Paperbacks il Mulino.ECB Crypto-Assets Task Force (2019): “Crypto-Assets: Implicationsfor financial stability, monetary policy, and payments and marketinfrastructures”, ECB Occasional Paper Series, No. 223.Ferrari, A and G Ferrero (2019): “Moneta pubblica e privata in unsistema economico moderno” (mimeo).Ferriani, F and G Oddo (2019): “More distance, more remittance?Remitting behavior, travel cost, and the size of the informalchannel”, Economic Notes. 2019; 1–23.
G7 Working Group on Stablecoins (2019): Investigating theimpact of global stablecoins.IMF (2009): Balance of Payments and International InvestmentPosition Manual, sixth edition.IMF Committee on Balance of Payments Statistics (2018):Treatment of Crypto Assets in Macroeconomic Statistics,presented at the Thirty-First Meeting of the Committee, October2018.Libra (2019): “An introduction to Libra”, https://libra.org/en-US/wp-content/uploads/sites/23/2019/06/LibraWhitePaper_en_US.pdfMagnani, M, G Oddo, R Settimo and S Zappa (2016): “Le rimessedei lavoratori stranieri in Italia: Una stima dei flussi invisibili delcanale informale”, Bank of Italy Occasional Paper, 332.OECD (2018): How to deal with Bitcoin and other cryptocurrenciesin the System of National Accounts?, presented at the Meetingof the Working Party on Financial Statistics, November 2018.The World Bank (2019): Remittances Prices Worldwide - Issue 31,September 2019.

1/1
IFC Conference on external statistics "Bridging measurement challenges and analytical needs of external statistics: evolution or revolution?", co-organised with the Bank of Portugal (BoP) and the European Central Bank (ECB)
17-18 February 2020, Lisbon, Portugal
Early Warning System (EWS) informative flow weaknesses and opportunities – the Italian experience1
Chiara Orsini and Simone Ambroselli,
Italian National Institute of Statistics
1 This presentation was prepared for the meeting. The views expressed are those of the authors and do not necessarily reflect the views of the BIS, IFC, BoP, ECB or the central banks and other institutions represented at the meeting.

Early Warning System (EWS) informative flow weaknesses and opportunities 1
Early Warning System (EWS) informative flow
weaknesses and opportunities
The Italian experience
Simone Ambroselli, Chiara Orsini1
Abstract
Globalisation is a new challenge for official statistics. Multinational enterprise (MNE)
business decisions such as incorporation and restructuring events go beyond the EU
Member State national borders, by affecting business statistics and National Accounts
statistics. To cope with the new statistical needs on globalization issues, the Italian
National Institute of Statistics (Istat) is committed to several projects regarding
business statistics on globalization related statistics in cooperation with National
Statistical Institutes and International Organisations. Particularly, since 2017 Istat has
been participating in the Eurostat initiative named Early Warning System (EWS),
whereby the relevant Member States of the European Statistical System (ESS) and
Eurostat exchange information, by providing an early warning of MNE restructuring
events.
The main objective of this paper is to explore how and to what extent the close
cooperation among National Statistical Systems in the EWS framework has
contributed so far to the development of harmonized statistical methodological
treatment, in order to produce reliable and consistent statistics across various
domains. Particularly, the paper draws the attention to the outward and inward flows
of statistical information between Istat correspondent and EWS Secretariat. Moreover,
the paper explores also the key elements of the system, in terms of weaknesses and
strengths, EWS Istat Team has addressed so far, such as the EWS Team composition,
statistical domain interrelations, statistical information reporting, and relations with
other National Authorities dealing with statistics.
Finally, the paper highlights the further development and challenges towards the
methodological approach on globalisation event based statistical treatment, data
collection and indicators.
Keywords: Globalisation, Multinational enterprise groups (MNEs), Early Warning
System (EWS), Official statistics, Practice sharing.
JEL classification: C10, C18, F23, F60, M00.
1 The views expressed here are those of the authors and do not necessarily reflect those of the Italian
Institute of Statistics. Contacts: Simone Ambroselli; E-mail: [email protected]; Chiara Orsini; E-mail:

2 Early Warning System (EWS) informative flow weaknesses and opportunities
CONTENTS
Early Warning System (EWS) informative flow weaknesses and opportunities............. 1
The Italian experience................................................................................................................ 1
Abstract ........................................................................................................................................ 1
1. INTRODUCTION ........................................................................................................................ 3
2. BACKGROUND .......................................................................................................................... 4
3. EARLY WARNING SYSTEM......................................................................................................... 5
4. ISTAT COMMITMENT IN EWS.................................................................................................... 6
5. KEY ELEMENTS OF THE APPROACH...........................................................................................11
6. CONCLUSIONS........................................................................................................................13
REFERENCES ..................................................................................................................................15

Early Warning System (EWS) informative flow weaknesses and opportunities 3
1. INTRODUCTION
Large-scale economic, financial and political crises, new forms of organising
economic production through global value chains has been affecting the global
economies. To support national and regional policy making, National statistical
Institutes and international organizations have been developing innovative statistical
products while increasing geographical details and enhancing co-operation. The
methodological development stated in the Framework Regulation on European
business statistics (FRIBS)2 reflects the need of measuring the changing economic
environment and the increasing globalisation and complexity of the business
landscape through producing reliable business statistics. In this contest enhancing
awareness on MNE Groups (MNEs) plays a key role in understanding globalisation
issues. Multinational enterprise group economic decisions, crossing national borders,
have sizeable effect on European business statistics and National Accounts. Recording
and properly measuring MNE events such as incorporation, ownership of assets and
economic control are the main statistical challenges for European National Statistical
Institutes (NSIs).
The paper3 explores how and to what extent the Italian National Institute of
Statistics (Istat) is committed to supporting international and European initiatives
dealing with globalization issues (Paragraph 2). Particularly, the paper considers Istat
experience in contributing to the EWS mechanism as two sides of the same coin
(Paragraph 3). We draw the attention to the outward and inward flows of statistical
information, by describing the methodological activities and sharing techniques
developed by Istat EWS team. On the one hand, the Team identify MNE restructuring
events with sizeable effects on statistical domains and on Principal European
Economic Indicators (PEEIs) to trigger EWS, on the other hand, they manage the MNE
cases across all different domains and they draft proposal for treatment, when EWS
Istat Team receives the business case by EWS Secretariat (Paragraph 4).
By considering the comprehensive mechanism and the multidimensional process
behind EWS, the paper explores also the key elements of the system, in terms of
weaknesses and strengths, EWS Istat Team has addressed so far, such as Team
personnel, statistical domain interrelations, statistical information reporting, relations
with other National Authorities dealing with statistics, in order to facilitate
harmonized statistical procedures and methods across the relevant Member States
(Paragraph 5).
Moreover, in line with EWS strategy focused on ensuring a timely, consistent and
coordinated communication towards National and European Statistical Entities, the
paper highlights the possible further development and challenges towards the
methodological approach on globalisation event statistical treatment, data collection
and indicators (Paragraph 6).
2 Official Journal of the European Union, Regulation (EU) 2019/2152 of the European Parliament and of the
Council of 27 November 2019 on European business statistics, repealing 10 legal acts in the field of
business statistics.
3 This Paper is the result of the joint work of Chiara Orsini and Simone Ambroselli. However, each chapter
was drafted by a lead author and subsequently reviewed by the other. The lead author of the
paragraphs 1, 2, 3, 4 is Chiara Orsini and the paragraphs 5, 6 were drafted by Simone Ambroselli.

4 Early Warning System (EWS) informative flow weaknesses and opportunities
2. BACKGROUND
Globalisation is a historic process of increasing interaction between national
economies on a world-wide scale. While not new, interconnectedness has accelerated
in recent years due to political developments and technical enablers, such as
informatics and new communication tools. Globalization presents conceptual
difficulties and measurement challenges in providing data for policy purposes. As
shown by Sturgeon in his Report to Eurostat (2013) on Global Value Chain and
Globalization, some statistics are related to the globalization phenomenon by their
nature such as, International Trade of goods and services, Foreign Affiliates (FATS)
and Foreign Direct Investments (FDI) statistics and International Sourcing (IS). In
addition, considering the micro data level, the EuroGroup Register (EGR) and the
European System of Business Registers (ESBRs) play an undeniable role in analysing
global economic dynamics.
The impact of globalization and the measurement of the activities of
multinational enterprises4 (MNEs) in statistics represents one of the largest
“measurement” challenges facing producers of economic statistics today. It is
indisputable that statisticians need to understand MNE activities to produce relevant
economic statistics. Sharing data on the structures and activities of MNEs nationally
and internationally among producers of official statistics has become an imperative
to guarantee the high quality of official statistics. When an enterprise re-organizes its
own business activities at the International level, National Statistical compilers
measure only part of their global activities. The treatment of local entities in different
Countries as individual enterprise can hide the real relationship between units in
MNEs. Identifying the real dimensions of the enterprises and understanding the
structural market effects are challenging for National Statistical Institutes. When
approaching to MNE, NSIs need to analyse the events beyond national borders in
order to ensure consistency in statistical treatment.
Following the approach of the Guidelines on Integrated Economic statistics5,
which underlines the importance of creating a consistent framework for measuring
an increasingly interconnected global economy, the Italian National Institute of
Statistics is strive for excellence with regard to increasing statistical information and
providing high quality products. To meet the new statistical needs on globalization,
Istat is committed to several International and European projects. Particularly, Istat is
member of the European System of Interoperable Statistical Business Registers
(ESBRs) which aims to address the challenges of measuring globalization by
harmonizing statistical methods and techniques among National Statistical Institutes.
By consolidating the Eurogroups Register (EGR) 2.0 and profiling developments,
ESBRs contributes to increase statistical quality on globalisation and interoperability
while reducing duplications and errors. Moreover, to understand MNE global
business activities, their structures and their international ownership chains, Istat has
been working on Global/European Profiling activities, which analyses the economic
and operational structure of Multinational Groups irrespective of geographical
borders. At the National level, a Large Cases Unit (LCU), in charge to analyse statistical
4 In this Guide multinational enterprise is understood as a group of (two or more) enterprises producing
goods or delivering services in more than one country under a management headquarters in one (or
rarely in more than one) country.
5 United Nations, Department of Economic and Social Affairs Statistics Division, Guidelines on Integrated
Economic Statistics, New York, 2013.

Early Warning System (EWS) informative flow weaknesses and opportunities 5
data across all different domains referred to a Multinational Enterprise Group was
established. It is also worth mentioning is the International Sourcing project which
aims to increase the efficiency and effectiveness of statistical production processes
and to provide statistics on existing functions and activities that are performed in-
house or domestically sourced to either non-affiliated or affiliated enterprises located
abroad. A common vision for statistical data sharing is crucial and Istat is involved in
the UNECE Task Force on Exchange and Sharing of Economic Data which develops
guidance, tools and principles to facilitate the exchange of economic data, including
granular data and information on business structures by NSIs. As global efforts are
needed to address the challenges of measuring globalization, the guidance objective
is also to facilitate the analysis of asymmetries and encourage coordinated economic
data sharing while increasing the quality, coherence and granularity of statistics and
the ability to better analyse the activities of MNEs. Even National Accounts Directorate
Team is engaged to several international Task Forces addressing globalization-related
issues, such as Integrated Global Accounts, land and non-financial assets, maritime
transactions and International trade statistics.
3. EARLY WARNING SYSTEM
In the implementation of the ESS Vision 20206 which is intended to explore new
collaboration instruments to enhance consistency in the methodological approach
and technical solutions for statistical purpose, in 2017 Eurostat, strengthening
cooperation among its partners7, launched the Early Warning System Task Force
(EWS). The main objective of the initiative is to respond to globalisation events in a
timely and consistent way across all Member States through facilitating the exchange
of information on MNE restructuring cases which may affect other Member States.
EWS aims to establish a structured and light procedure among involved National
Statistical Institutes as well as International Organizations and Central Banks to ensure
consistent methodological statistical treatment of major globalisation cases. Based
on the voluntary cooperation between national data compilers and Eurostat, as well
as between business statisticians and national accountants, EWS has been designed
to facilitate a timely, consistent and interlinked communication among Member
States towards relevant MNE cases affecting European statistics while enhancing
European statistical comparability and supporting data reconciliation for EU NSIs.
Particularly, EWS deals with restructuring within MNEs as the relevant information are
difficult to obtain. Coordinated and supervised by Eurostat, the EWS process has been
continuously improving over time though handling restructuring MNE cases across
UE Countries and reporting the agreed treatment. The Eurostat purpose is to achieve
consistency in the statistical treatment among Member States and a coordinated
timing in the publication of statistical results and revisions, while strengthening the
exchange of information among relevant NSIs. Within the EWS, the cases shared
among Eurostat and Member States are anonymised and the information shared are
preferably of a public nature.
6 The European Statistical System, ESS Vision 2020, https://ec.europa.eu/eurostat/web/ess/about-us/ess-
vision-2020
7 Eurostat, Strategic Plan 2016-2020, https://ec.europa.eu/info/publications/strategic-plan-2016-202 0-
eurostat_en

6 Early Warning System (EWS) informative flow weaknesses and opportunities
In compliance of the BSDG decisions8 a network of contacts at national and
Eurostat level has been established. As member of the system, each EU NSI has
selected a correspondent and backup-correspondent who can trigger the EWS in case
of MNE restructuring affects other EU or non-EU Countries. Restructuring of MNEs
identifies a change of group structure or distribution of business model across
Countries, including the creation of new branches or other entities, the transfer of
assets across borders, the changes of global production arrangements as contract
manufacturing, for instance. Mainly focused on restructuring within MNEs, the EWS
members may take into account the sizeable effects on European statistics over time,
the published data, such as National Accounts main aggregates, the PEEIs, as well as
the economic size and structure of the Countries concerned. Moreover, EWS can be
consulted when national compilers have methodological doubts on treating MNE
restructuring cases and even if the own Country is not directly concerned.
In case of the above-mentioned events, the Member State triggers EWS through
drafting an initial summary note containing the significant information such as
detailed facts of event, public source references, the main effects on business
statistics, the national statistical domains concerned, the list of the other Countries
affected, the proposal for treatment and plan for publication. Once the restructuring
case is reported to the EWS secretariat, Eurostat informs only the Countries concerned
by MNE event. In close cooperation with the concerned Member States, Eurostat
drafts a methodological summary note containing an anonymised summary of the
case and methodological treatment. Eurostat coordinates the communication and
manages all the shared and anonymized documents such as the methodological note
and Member state opinions through a collaborative platform named S-CIRCABC with
restricted access. S-CIRCA is accessed via a two-step authentication procedure,
password and code sent to registered mobile phone. This exchange system allows to
share confidential information while storing relevant documents. EWS secretariat
discusses the case with the concerned Member States and they prepare a first opinion
on statistical treatment. When interpretation questions remain, the EWS may acquire
comments on draft opinion from competent ESS bodies. Afterwards, the agreed
opinion containing the coordinated dissemination of the statistical result and the
anonymised summary of the case are shared with the other Member States, which
may offer their additional views. Finally, in case of a visible impact on the data
released, an anonymised explanatory note on the specific case is released to create
consistency in statistical treatment while enhancing the response to similar cases.
4. ISTAT COMMITMENT IN EWS
In meeting the needs of an ever-changing society and the new requests for
information on MNE related issues, the Italian Institute of statistics is committed to
Early Warning System through the Large Cases Unit (LCU). Established in 2017, the
main objective of LCU is to enhance Istat capacity to consistently manage MNE
incoming data at the very beginning of the production process of economic statistics,
in order to ensure a prompt reaction to the resolution of anomalies before they are
processed by any of the statistical domains. In liaison with the other Istat Directorates,
8 Director of Macro-Economic Statistics (DMES) and the Business Statistics Directors Group (BSDG), The
joint BSDG/DMES Task Force on globalization, meeting 03/2017

Early Warning System (EWS) informative flow weaknesses and opportunities 7
as National Accounts and Data Collection for instance, LCU aims to identify potential
inconsistencies in the early stages of the statistical production process, while ensuring
statistical quality and containing the burden on enterprises. According to the Istat
Modernisation Programme9, focused on developing and sharing a new model of
cross-cutting and cooperative work, LCU strives to strengthen the cooperation across
the various statistical domains, by informing the internal users on the main
restructuring events and by promptly identifying methods to cope with consistency
problems. The Figure 1 shows the structure of the LCU positioning within Istat
framework.
Large Cases Unit positioning
Istat Figure 1
Sources: Istat
By dealing with restructuring events, mergers and acquisitions concerning the
main MNE Groups, the LCU activity is carried out by a team of experts who keep
working in different statistical domains. The establishment of the specialized, part-
time team has played a key role in enhancing the quality, consistency and coherency
of MNE data, as well as in ensuring the information sharing among the statistical
areas. The selected team members mainly work in the following statistical areas:
Business registers (SBR), Structural business statistics (SBS), Short-term statistics (STS),
Foreign affiliates statistics (FATS) and Foreign Trade statistics. Hence, Istat decided to
establish LCU within the Directorate of Business statistics while liaising with the
representatives of the National Accounts Directorate in the relevant activities. The
LCU team daily task is to analyse the signals of the MNEs target by carrying out several
monitoring activities. The MNE events to monitor are Business Groups’ restructuring
which may arise either from strategic business plans or from new business
9 Istat, Istat’s Modernisation Programme, 28 January 2016,
https://www.istat.it/it/files//2011/04/IstatsModernistionProgramme_EN.pdf

8 Early Warning System (EWS) informative flow weaknesses and opportunities
opportunities in other Countries, for instance. Concerning monitoring activities,
significant to evaluate the MNE events at ex post stage are the information collected
from the Istat Business Portal, which is the web platform to retrieve data and to
manage the contact with the enterprises. Whereas at ex ante stage, the activity of
‘public news scrapers’ is crucial to gather relevant information concerning MNE from
specialized newspapers and magazines. The MNE shared public news are monitored
and they produce effects from an identifiable date by influencing statistical data
production. Also, the activity of analysing Foreign trade data is conducted for
monitoring purpose. Concerning the external work stream with MNEs (Yon and
Walter, 2018), generally, an expert from the LCU is responsible for contact with the
MNE in order to build trust and efficiency in data collection and solve complex cases.
Internationally speaking, LCU is engaged in EWS through Istat correspondents
who coordinate the relations with the EWS members, manage effectively the outward
and inward flows of signals, actively participate to the case discussion as well as draft
concise and punctual report concerning the relevant cases. At the end of 2019, EWS
network analyzed 21 cases (of which 12 closed cases). At national level, Istat has
received 6 inward cases and Istat correspondents have produced 2 outward cases
triggering EWS secretariat. Although the numbers may seem small, the management
of information flows resulting from the commitment to the EWS activities within the
broader context of the LCU framework has led EWS correspondents to develop some
significant operating procedures to assess the impact of corporate reorganizations
across the statistical domains. The specific Istat triggering processes for Outward and
Inward MNE case flows are described below (Figure 2 and 3).
In October 2017, the Italian Institute of Statistics correspondents triggered the
EWS secretariat by drafting the first outward MNE case for Italy (Figure 2). The EWS
process started in the second trimester of 2017 when Large Cases Unit received a
signal from Turnover Survey expert within Short Term Business Statistics (1). LCU
investigated the trend of MNE Industry Turnover and the relevant domains were
involved such as Structural Business Statistics (SBS), the Statistical Business Register
(BR), the Foreign Affiliates Statistics (FATS), the Statistics of industrial goods and
services (Prodcom) and Foreign Trade statistics. In the third quarter of 2017, Short
Term Business Statistics expert needed to delve into MNE financial statement while
contacting directly MNE reference person in the business portal (2). By receiving a
data confirmation related to the MNE restructuring, also National Accounts experts
were involved, and the statistical revisions was coherently implemented across
domains, accordingly (3). After acquiring information on public sources, Istat
correspondents triggered the EWS secretariat (4) by drafting a case summary,
containing the MNE event details (new greenfield investment in Italy), the signal (the
company turnover and the number of employees have significantly grown), effects in
statistical domains (Industry Turnover Index, SBR, SBS), Countries potentially affected
(investment and reconversion plan for manufacturing plants in other Member States).
Moreover, Istat correspondents suggested to EWS also a proposal for treatment and
plans for publication in order to harmonize statistical procedures and methods. EWS
secretarial triggered the concerned Member States through sharing the MNE case
and asking for a contribution in terms of statistical impact and data publication (5).
Once the Opinions by the involved Countries were gathered (6), EWS produced a
Methodological summary note containing the recommendations on treating the
relevant statistics, shared with the involved Member states. Finally, an Anonymised
explanatory note is drafted with the case description and the agreed methodological
treatment for statistical unbalances has been shared among EWS members (7).

Early Warning System (EWS) informative flow weaknesses and opportunities 9
Outward MNE case flow
Istat triggering process Figure 2
Sources: Istat
With regard to the inward MNE cases, at the beginning of 2018 Istat
correspondents received from EWS Secretariat a signal about an MNE reorganization
containing MNE public and descriptive information (1). The Figure 3 shows the flow
of inward MNE case.
EWS inquired also, whether the impact on national statistics was significant in the
Country (2). The signal regarded the MNE decision to move to a local selling structure
in several Countries triggered an internal consultation within LCU (3). The relevant
statistical domain experts were involved, particularly those working on Business
register, to acquire the main enterprise characteristics, Short-term statistics and
National accounts, to analyse the effects on in short-term surveys. Some detailed
information were also asked about monthly balance-of-payments data but the
statistical data were not available as the Italian Central Bank is in charge of producing
that. Moreover, the public news scraping activity was conducted to find relevant
information on the MNE planned reorganisation and business strategy. Istat
responded to EWS with a brief note containing an overview on the MNE statistical
profile and questioning about the economic activity classification (4). The EWS final
methodological note was available at the end of 2018, by underlining the need of a
harmonized and comprehensive treatment of economic activity among Member
States in order to assign the same NACE code to the several subsidiaries, in
compliance with the new business model (5). The EWS mechanism has strengthened
the information exchanged by keeping the Member States informed about MNE case
further developments.

10 Early Warning System (EWS) informative flow weaknesses and opportunities
Inward MNE case flow
EWS triggering process Figure 3
Sources: Istat
The analysis of the EWS inward case allowed Istat to include the enterprise unit
in the Quarterly Survey on Turnover of the services in 2018 as well as to change,
eventually, the MNE Economic Activity (NACE code).
For internal users LCU produced a comprehensive report of the MNE case
containing the following items:
the description of the events, signal types (EWS signal) and data available;
the impact evaluation for the statistical production in terms of statistical units
(Groups, enterprises, legal units and partially local units) and variables
(particularly employment, turnover, economic activity, location);
the outcome of the preliminary analysis such as the potential impact and the
proposals/decisions for the involved domains;
the list of the involved statistical units (names and Register codes).
Through Early Warning System, Istat LCU strives to adopt a comprehensive
approach in dealing with the MNE cases, by streamlining the response to statistical
inconsistency and by aligning methodology procedure. However, the application of
existing statistical methods does not automatically guarantee a consistent treatment
of restructuring cases by all concerned data compilers. Hence, in some cases the
restructuring events may require different statistical treatment and some Countries
affected may still have different information about the MNEs.

Early Warning System (EWS) informative flow weaknesses and opportunities 11
5. KEY ELEMENTS OF THE APPROACH
By analysing the steps described for outward and inward MNE case flows (Figure 2
and 3), four elements are considered as crucial in determining the degree of success
of the process: EWS team personnel, statistical domain inter-relations, statistical
information reporting, and co-operation with other National Authorities dealing with
statistics. The above-mentioned elements are closely connected, professional skills,
type of the relationships and tools available for data sharing are key elements in
pursuing effective actions (see Figure 4).
Success of the action
Key elements Figure 4
Sources: Istat
Concerning the EWS team structure, Istat has decided to establish a small team
composed by business statistics experts (a correspondent and a back-up
correspondent) who take part in LCU monitoring activities concerning active MNEs
in Italy. The main advantage of this structure is the timely dissemination of
information cases to the domains mainly concerned, in order to quickly obtain a
relevant feedback while following the assessment of other statistical domains to be
investigated. However, the main critical aspect is the lack of automatic mechanism to
identify the statistical domains to be involved. The case analysis and the personnel
participation depend on a priori knowledge of the domains to be involved case by
case, while a large team of experts would require more time to properly respond to a
single case (see below for the comments related to statistical domains and other
Authorities). Hence, a small group of experts as counterpart for EWS activities has
resulted an “agile” solution to immediately identify experts to be involved on the
Business statistics side and to cooperate with the National Accounts Team.

12 Early Warning System (EWS) informative flow weaknesses and opportunities
As mentioned in the paragraph 4, triggering procedure on restructuring within
MNEs is conducted taking into account the sizeable effects on European statistics
over time as well as the published data, such as National Accounts main aggregates,
the PEEIs, the economic size and structure of the Countries concerned. This
mechanism implies that several statistical domains are involved to analyse MNE case,
hence statistical domain inter-relations development is crucial to have a
comprehensive overview of economic implications. At first instance, restructuring of
the businesses has consequences in terms of statistical Registers both for enterprises
and Groups. Some MNE decisions may also have impact at the local level such as
offshoring and reshoring business activities and functions. Concerning the PEEIs, this
process affects different areas such as Balance of payments, Business, Industry and
services statistics, International trade, Labour market, National accounts and prices.
In many Countries, analysing the statistical implications in the all the above-
mentioned areas may require the participation of both the National Statistical
Organizations and the National Central Bank. At the EWS level, the European Central
Bank (ECB) is a member of the System while Italian National Central Bank is not
currently participating to the case analysis. Particularly, from Istat perspective, PEEIs
are produced by three different Directorates and statistical production is carried out
by 8 Divisions, at least. From an operational point of view, a reference table has been
developed in order to “give a name” (a reference person) to the PEEIs. In addition to
SBR and NA reference persons, each statistical output is linked to the focal point in
charge of carrying out the activities, the head of division and the head of the
Directorate in order to facilitate the internal information sharing concerning the MNE
cases.
With regards to the statistical information reporting, the internal triggering of
the process is conducted via e-mails, as EWS cases do not require micro-data sharing
and generally exchange of information details are restrained. If further discussions on
the case are needed also meetings on site can be scheduled. However, an impact
assessment is internally conducted by all the domains concerned and this mechanism
may require a quantitative analysis. When micro-data sharing is needed, secure
environments are used. Each expert involved in the case contributes by sending data
and drafting methodological proposals. Moreover, each member of the Team is able
to enhance the expertise on MNE-related issues by learning from the information
available and by cooperating with other experts. Through this participatory approach,
EWS Istat team drafts Case national opinion to be shared with Eurostat by gathering
all the contributions received from the statistical experts in an effective manner.
Regarding to the cooperation activities among the statistical domain experts,
need to meet comprehensively the EWS goals is a challenging point. Responding
promptly to Eurostat with National contributions is crucial to enhance consistency in
statistical procedure at the European level. Having a small team focused on these
activities determines the need to collect the main information available from the
specialized experts on the statistical domains. While the option of having an “official”
large team would require a “mandatory” involvement established by EWS.
Nevertheless, the voluntary mechanism developed by Istat has allowed EWS
correspondents to provide information at the different stages. However, the phase
of the case follow ups and the analysis of the Eurostat methodological outputs result
harder to pursue.
Finally, another aspect worth mentioning is the relation with other National
Authorities when MNE case arisen from EWS mechanism. From the Italian perspective,
the other Authority managing statistics relevant to the EWS cases is the National

Early Warning System (EWS) informative flow weaknesses and opportunities 13
Central Bank, named Bank of Italy. As seen in the inward MNE case, in the framework
of EWS Istat is not currently sharing micro data with National Central Bank, even
though Istat and Bank of Italy have a long tradition in cooperating together. At the
moment, a mechanism to jointly - Istat and Bank of Italy - analyse the cases is missing.
The lack of inter-institutional cooperation in dealing with MNE cases leads to wonder
how and to what extent Istat and Bank of Italy may exchange and analyse micro-data:
in this process the use of informal arrangements is not feasible.
The key elements of Istat approach, in terms of strengths and weaknesses, are
shown in Figure 5.
Istat approach
Key elements, strengths and weaknesses Figure 5
Sources: Istat
The Figure 5 highlights Istat strategy in dealing with MNE cases by prioritizing
prompt actions and being flexible in conducting statistical analysis. In the above-
mentioned cases (Figures 2 and 3), the process guarantees a prompt responsiveness
in sharing information with EWS, even when Istat internal consultation covers
different domains.. In the meanwhile, this “soft” mechanism of inter-relations, useful
at the first stage for case statistical treatment, is not always enough to follow the MNE
event developments. Moreover, the final methodological treatment notes
disseminated by Eurostat are not mandatory for Member States. The Figure 5 also
underlines the most critical element, which is lack of NCB involvement in the EWS
mechanism: Istat joint analysis with Bank of Italy experts about MNE cases would
provide a more comprehensive statistical overview.
6. CONCLUSIONS
The paper explores Istat experience in contributing to the EWS network. The
analysis draws the attention to the statistical information flows in the framework of
the EWS, by showing the inward and outward triggering processes. The internal
mechanisms to share and treat the cases are explored, by underlying the role of EWS
Team in monitoring concerning MNEs complex restructuring and changes. Four key

14 Early Warning System (EWS) informative flow weaknesses and opportunities
elements are considered as crucial in providing successful outcome of the
mechanism: EWS Istat Team personnel, statistical domain inter-relations, statistical
information reporting, and co-operation with other National Authorities dealing with
statistics. In Italy an agile and flexible approach has been adopted, based on the
domain experts’ participation and the cooperation on a voluntary basis, having a
positive effect in the first two years of the network activities. EWS Istat Team
coordinates the activities to gather the experts’ contributions and they draft the final
responses to share information with EWS secretariat, accordingly. In the last years,
however, the analysis of the cases has shown some weaknesses linked to the lack of
participation of the NCB and the micro data and confidential information protection.
Further developments and challenges of the EWS are needed to improve the
statistical treatment of restructuring events. By our experience, the inter-institutional
cooperation and legal framework play a key role in consolidating the EWS process. In
the light of the experience gained with new globalization cases, Eurostat has planned
some developments for the EWS mechanism. The lessons learned underline that the
cooperation between National Statistical Authorities (inter-institutional work stream,
according to Yon and Walter, 2018) as well as between the Member States are crucial.
In addition, to facilitate the exchange of information among Member States, as well
as to ensure consistency among Member States also a legal framework is needed.
Establishing a legal basis for EWS should facilitate the exchange of micro data
between National Authorities dealing with statistics, as well as to have a
comprehensive overview of MNE event impact on statistics. Moreover, to enhance
the expertise of EWS correspondents in dealing with MNE cases, also training
initiatives should be realized by Eurostat. EWS Training would enhance the expertise
of correspondents about EWS case management, as well as that would enhance the
consistent use of statistical methods and procedures among Member States.
Concerning the National level, strengthening the participation in the EWS cases,
new procedure to facilitate the inter-institutional joint analyses of the cases should
be identified. From our point of view, informal mechanism to involve the NCB is not
a feasible solution especially in sharing and analysing data and methodological
information exchange. A compulsory and recognized procedure between Istat and
Bank of Italy needs to be established in order to facilitate Istat ESW team role in
providing a comprehensive overview by collecting information as far as balance of
payments and financial accounts are concerned. In the meanwhile, a parallel
mechanism should be implemented allowing NCB experts to trigger EWS Istat Team
when statistical unbalances reveal MNE restructuring event.
As Globalisation means increasing interdependence, integration and interaction
between institutions, people and companies in disparate locations, also statistical
Authorities need to respond to the growth of cross border data flows by co-operating
together in increasing the number of standards applied globally and finding new
tools for comprehensive statistical information sharing.

Early Warning System (EWS) informative flow weaknesses and opportunities 15
REFERENCES
Amante, S., Ambroselli, S., Bilotta, E., Orsini, C., Gentili, B., “Large Cases Unit (LCU)
monitoring activities: quick and complete assessment for complex restructuring
cases”, Vorrburg Group, Rome 24-18 September 2018.
Ambroselli, S., “A consistency unit for a consistent picture of the Italian economy”,
25th Meeting of the Wiesbaden Group on Business Registers - International
Roundtable on Business Survey Frames Tokyo, 8 – 11 November 2016.
European Commission, Official Journal of the European Union, Regulation (EU)
2019/2152 of the European Parliament and of the Council of 27 November 2019 on
European business statistics, repealing 10 legal acts in the field of business statistics.
Eurostat, Director of Macro-Economic Statistics (DMES) and the Business
Statistics Directors Group (BSDG), The joint BSDG/DMES Task Force on globalization,
meeting 03/2017.
Eurostat, Document IV/5 - The impact of globalisation in statistical processes:
Opportunities for the ESS.
Eurostat, Business Registers Recommendation Manual (BRRM 2010), 2010.
Eurostat, Early Warning System Cases and internal documents, 2017-2020.
The European Statistical System, ESS Vision 2020,
https://ec.europa.eu/eurostat/web/ess/about-us/ess-vision-2020
Eurostat, Strategic Plan 2016-2020,
https://ec.europa.eu/info/publications/strategic-plan-2016-2020-eurostat_en
Hussain, M. Peltola, R., Mahajan, S., Measuring activities of multinational
enterprise groups via large cases units, EURONA — Eurostat Review on National
Accounts and Macroeconomic Indicators, 1/2019.
Istat, Istat’s Modernisation Programme, 28 January 2016,
https://www.istat.it/it/files//2011/04/IstatsModernistionProgramme_EN.pdf
Sturgeon, T.J., “Global Value Chains and Economic Globalization - Towards a new
measurement framework”, Report to Eurostat, 2013.
UN - Department of Economic and Social Affairs - Statistics Division, Guidelines
on Integrated Economic Statistics, 2013.
UNECE/Eurostat/OECD Group of Experts on the Impact of Globalization on
National Accounts (GGNA), Impact of globalization on national accounts, 2011.
UNECE, Guide to Measuring Global Production, 2015.
Yon, T. M., Walter, J., “Sharing of data reported by complex multinational
enterprises: a cooperative approach between Deutsche Bundesbank and Banque de
France”, IFC Bulletin No 48 External Sector Statistics: current issues and new
challenges, Proceedings of the IFC-Central Bank of Armenia Workshop in Dilijan,
Armenia, 11-12 June 2018

Early Warning System (EWS) informative flow weaknesses and opportunities The Italian experience
Bridging measurement challenges and analytical needs of external statistics: evolution or revolution?Session 6: Dealing with Multinational EnterprisesLisbon, 18 February 2020
Authors: Simone Ambroselli, Chiara OrsiniIstat– Business Statistics Directorate
Presenter: Chiara Orsini

2EWS informative flow weaknesses and opportunities – the Italian experienceLisbon, 18 February 2020
Content
o BACKGROUND
o EARLY WARNING SYSTEM
o LARGE CASE UNIT
o OUTWARD AND INWARD FLOWS
o ISTAT APPROACH: STRENGTHS AND WEAKNESSES
o STEP FORWARD

3EWS informative flow weaknesses and opportunities – the Italian experienceLisbon, 18 February 2020
Globalisation presents conceptual difficulties and measurement challenges in providing data for policy purposes
o Growing cross-border interactions and increasing in openness of nations bringmeasurement challenges for suppliers of micro and macroeconomic data
o The dividing line between resident and non-resident economic units – a majordistinction for macroeconomic statistics is fading.
o Statistics are usually bound to national borders, but the economic events go beyondnational borders
Globalisation is a new challenge for NSIs
Globalisation and official statistics

4EWS informative flow weaknesses and opportunities – the Italian experienceLisbon, 18 February 2020
Istat commitment in measuring globalisation
globalizationItalian National Institute of Statistics is committed to creating a consistent harmonized framework for measuring the inter-connected global economy through:
International projects:
o EuroGroups register (EGR) o International profilingo UNECE Task Force on Exchange and
Sharing of Economic Datao Early Warning System
National Statistical production associatedto globalisation:
o International Trade of goods and serviceso Foreign Affiliates (FATS)o Foreign Direct Investments (FDI) statisticso International Sourcing (IS)
o Focusing on Global business actors: Multinational enterprise groups (MNE)
o Identifying the real dimensions of the enterprises and understanding the structural market effects
o harmonizing statistical methods and techniques among National Statistical Institutes

5EWS informative flow weaknesses and opportunities – the Italian experienceLisbon, 18 February 2020
o BACKGROUND
o EARLY WARNING SYSTEM
o LARGE CASE UNIT
o OUTWARD AND INWARD FLOWS
o ISTAT APPROACH: STRENGTHS AND WEAKNESSES
o STEP FORWARD

6EWS informative flow weaknesses and opportunities – the Italian experienceLisbon, 18 February 2020
Early Warning System (EWS)
MNE economic decisions crossing national borders have sizeableeffect on European business statistics and National Accounts
o to ensure a consistent treatment of globalisation events in statistics;o to timely exchange information regarding globalisation events with cross-
border effects on business statistics and National Accounts;o to contribute to the need of identifying and realizing standards for statistical
production;o to enhance European statistical comparability and supporting data
reconciliation for EU NSIs;o to increase responsiveness to emerging globalization issues;o to harmonize Statistical procedure and methods.

7EWS informative flow weaknesses and opportunities – the Italian experienceLisbon, 18 February 2020
Early Warning System implementation
PILLARSo structured and light procedure among NSIs as well as International
Organizations and Central Banks
o Based on the voluntary cooperation
o Anonymized case description: collaborative platform named S-CIRCABC with restricted access
o Exchange information: Eurostat methodological note and Member state opinions
o Selected a correspondent and backup-correspondent by NSIs
Restructuring of MNEs identifies a change of group structure or distribution of businessmodel across Countries, including the creation of new branches or other entities, thetransfer of assets across borders, the changes of global production arrangements
OPINION
o Detailed facts of event
o Impact
o Statistical domain/indicators
o Other Countries affected
o Proposal for treatment
o Plans for publication

8EWS informative flow weaknesses and opportunities – the Italian experienceLisbon, 18 February 2020
o BACKGROUND
o EARLY WARNING SYSTEM
o LARGE CASE UNIT
o OUTWARD AND INWARD FLOWS
o ISTAT APPROACH: STRENGTHS AND WEAKNESSES
o STEP FORWARD

9EWS informative flow weaknesses and opportunities – the Italian experienceLisbon, 18 February 2020
Large Case Unit
o by strengthening cooperation across the various domains;
o by sharing information of restructuring cases;
o by creating specific data reporting for single Groups;
o by developing methods to promptly identify consistency problems.

10EWS informative flow weaknesses and opportunities – the Italian experienceLisbon, 18 February 2020
o BACKGROUND
o EARLY WARNING SYSTEM
o LARGE CASE UNIT
o OUTWARD AND INWARD FLOWS
o ISTAT APPROACH: STRENGTHS AND WEAKNESSES
o STEP FORWARD

11EWS informative flow weaknesses and opportunities – the Italian experienceLisbon, 18 February 2020
Outward MNE case
IstatLCU
SBR
SBS Prodcom
FATS
Further reseach in June 2017: - Financial statement 2016- NA involvement
EurostatEWS
Exchange of information among concerned MS:
TRIGGERING
Case summaryin Sept 2017
- Methodological summary note (S-CIRCA) - Anonymised explanatory note
Feedback collection: Opinion from MS
- Initial summary note- Opinion

12EWS informative flow weaknesses and opportunities – the Italian experienceLisbon, 18 February 2020
Inward MNE case
SBR STSNA
Methodological summary note (S-CIRCA)
TRIGGERING
Initial summaryin March 2018
Opinion (S-CIRCA) in April 2018
Feedback collection: Opinions from MSs
(S-CIRCA)
Internal consultation
Unit inclusion in the Quarterly Survey on
Turnover of the services in 2018
IstatLCU
EurostatEWS

13EWS informative flow weaknesses and opportunities – the Italian experienceLisbon, 18 February 2020
o BACKGROUND
o EARLY WARNING SYSTEM
o LARGE CASE UNIT
o OUTWARD AND INWARD FLOWS
o ISTAT APPROACH: STRENGTHS AND WEAKNESSES
o STEP FORWARD

14EWS informative flow weaknesses and opportunities – the Italian experienceLisbon, 18 February 2020
Istat approach in EWS processBUSINESS STATISTICS EXPERTSSMALL TEAMPART-TIME STAFF
PARTICIPATION CASE BY CASE
BRIDGING TABLE «DOMAIN-REFERENCE PERSON» NO JOINT ANALYSIS
-
SECURE COMMUNICATION WHEN NEEDED
- Description of the events, signal types;- Assessment for statistical units (Groups,
enterprises, legal units, local units) and variables(employment, turnover, economic activity, location);- Outcome of the preliminary analysis => potential
impact and the proposals/decisions for theinvolved domains;
- List of the involved statistical units (names andRegister codes).

15EWS informative flow weaknesses and opportunities – the Italian experienceLisbon, 18 February 2020
Istat approach assessment
• Agile• Skilled staff
• LCU focal point for case treatment
• Complete mapping of the internal experts
• Flexible• Case oriented
• N/D
• Highly dependent on experts
• No mandatory• Different Directorates
and Divisions
• Lower participation for follow ups
• Tracking over time
• No comprehensivepicture
TEAM PERSONNEL
STATISTICAL DOMAININTER-RELATIONS
STATISTICAL INFOREPORTING
CO-OPERATION WITH OTHERSTATISTICAL AUTHORITIES

16EWS informative flow weaknesses and opportunities – the Italian experienceLisbon, 18 February 2020
Content
o BACKGROUND
o EARLY WARNING SYSTEM
o LARGE CASE UNIT
o OUTWARD AND INWARD FLOWS
o ISTAT APPROACH: STRENGTHS AND WEAKNESSES
o STEP FORWARD

17EWS informative flow weaknesses and opportunities – the Italian experienceLisbon, 18 February 2020
Step forward in implementing EWS
o LEGAL BASIS NEEDED
o INTER-INSTITUTIONAL WORK STREAM AND CO-OPERATION AMONGMEMBER STATES TO BE ENHANCED
o EWS CORRESPONDENTS TRAINING TO BE FOSTERED
o CO-OPERATION WITH BANK OF ITALY (NATIONAL CENTRAL BANKS) TO BEESTABLISHED
o SECURE FRAMEWORK FOR EXCHANGING DATA AND INFORMATION TO BESETTLED

18
Thank you for your attention
Chiara OrsiniBusiness Statistics [email protected]
EWS informative flow weaknesses and opportunities – the Italian experienceLisbon, 18 February 2020

1/1
IFC Conference on external statistics "Bridging measurement challenges and analytical needs of external statistics: evolution or revolution?", co-organised with the Bank of Portugal (BoP) and the European Central Bank (ECB)
17-18 February 2020, Lisbon, Portugal
Foreign exchange derivatives and currency mismatch in Irish investment funds1
Benedetta Bianchi and Giovanna Bua,
Central Bank of Ireland
1 This paper and presentation were prepared for the meeting. The views expressed are those of the authors and do not necessarily reflect the views of the BIS, IFC, BoP, ECB or
the central banks and other institutions represented at the meeting.

Foreign exchange derivatives and currency mismatch in Irish investment funds 1
Foreign exchange derivatives and currency mismatch in Irish investment funds
Benedetta Bianchi & Giovanna Bua1
Abstract
This paper has two goals. First, we study the currency composition of assets and liabilities in Irish-domiciled investment funds. Second, we analyse valuation gains and losses in the foreign exchange derivatives position, and the relation with gains and losses from currency mismatch in the balance sheet. A positive relation indicates amplifying the currency position on balance sheet, while a negative relation indicates hedging. Focusing on two periods of currency turbulence, we find that the proportion of hedging funds and the proportion of amplifying funds are stable. However, those funds amplifying tend to do so relatively more in the first quarter of turbulence, while the hedging rates of hedgers increase in the subsequent quarters. The main novelty of our study is to build a financially-weighted exchange rate index at micro-level and to develop a framework to analyse currency risk strategies of investment funds, taking into account the use of derivatives.
Contents
Foreign exchange derivatives and currency mismatch in Irish investment funds .......... 1
1. Introduction........................................................................................................................................ 2
2. Empirical framework ....................................................................................................................... 3
3. Data analysis ...................................................................................................................................... 5
3.1 Overview of the data ............................................................................................................ 5
3.2 Event study ............................................................................................................................... 8
4. Conclusion .......................................................................................................................................... 9
Bibliography ............................................................................................................................................ 10
Tables and figures................................................................................................................................. 12
1 The views expressed are those of the authors and not necessarily those of the Central Bank of Ireland or the European Central
Bank. Any errors remain the responsibility of the authors.

2 Foreign exchange derivatives and currency mismatch in Irish investment funds
1. Introduction
This paper has two goals. First, we study the currency composition of assets and liabilities in Irish-domiciled investment funds. Second, we analyse valuation gains and losses in the foreign exchange derivatives position, and the relation to gains and losses from the currency mismatch on balance sheet. Our contribution is twofold. First, we illustrate the potential use of the financially-weighted exchange rate index developed in the macro literature on currency exposure (Lane and Shambaugh, 2010) to analyse entity-level micro data. Second, we extend the framework commonly used to study currency exposures in international balance sheets, by introducing the financial derivatives dimension.
By providing detail on the balance sheet of a globally active sector, we contribute to the literature on the size of international balance sheets. The seminal papers by Lane and Milesi-Ferretti (1999, 2007) have pioneered the analysis of international assets and liabilities. The authors propose a measure of international financial integration based on the sum of external assets and liabilities. In more recent work, Lane and Milesi-Ferretti (2018) document the growing importance of financial centres in global external assets and liabilities, highlighting the need to separate pure international financial intermediation from financial market integration. In a similar spirit, Galstyan (2019) delved into the complexity of the Irish international investment position to strip out the intermediation component that arises from the activities of investment funds and other entities with little domestic activity.
At the same time, analysing the currency risk profile of international balance sheets is important. Currency mismatches can have a significant impact on the dynamics of external balance sheets (Gourinchas and Rey, 2014; Forbes et al., 2017). For example, Tille (2003) showed that the strong dollar has a sizable role in the acceleration of the net indebtedness of the Unites States toward the end of the Century. Stoffels and Tille (2018) have constructed data on the Swiss external investment position and have showed that Switzerland has faced sizable losses from the strength of the franc. Using a larger sample of countries, Benetrix et al. (2015) and Lane and Shambaugh (2010) have studied the sensitivity of the net IIP to exchange rates movements.
In translating our analysis of Irish investment funds to the IIP context, it is important to keep in mind that, due to the balance sheet structure of investment funds, any valuation impact of the currency mismatch translates in a change in price of the fund’s shares. Since the bulk of Irish investment funds assets and liabilities are international, valuation effects impact the size of the Irish external balance sheet, but have no direct impact on the net IIP. Nevertheless, our analysis improves our understanding of the balance sheet of an internationally-active financial centre, as well as the role of derivatives.
In the absence of granular data, researchers have estimated the currency shares of international assets and liabilities to infer the impact of exchange changes. Compiling a new dataset on the currency composition of the IIP, recent research has shed light on the cross-country distribution of foreign currency exposures (Benetrix et al., 2015; Benetrix et al., 2020). Using the methodology developed in Lane and Shambaugh (2010), the authors construct estimates on international currency over 1990-2017 by drawing on a range of datasets and inferential techniques. They also trace out the scale of valuation changes due to exchange changes. As discussed in their paper, the dataset suffers some limitations: it provides a breakdown only for portfolio debt; it tracks currency exposure based on geographical exposure; and it does not consider the use of derivatives and hedging behaviour. As the authors suggest, better availability of actual data is key for further improving the accuracy of the dataset.
While the impact of currency-driven valuation changes on external imbalances has been documented, the overall picture including the role of financial derivatives is missing due to lack of data. In order to include the impact of financial derivatives, an internationally agreed set of rules and methodologies to record and analyse these complex instruments in the context of international capital flows is missing.

Foreign exchange derivatives and currency mismatch in Irish investment funds 3
To contribute to this debate, we employ quarterly investment funds balance sheet information collected by the Central Bank of Ireland to study the currency profile of the balance sheet and the use of foreign exchange derivatives in relation to it. Specifically, we first estimate the valuation effect due to currency mismatch on balance sheet based on the currency shares at the beginning of each quarter, following the methodology in Lane and Shambaugh (2010). Secondly, we calculate the assets appreciation rate, or the percentage change in the value of assets given by the change in the relevant exchange rates. We then use this metric to explain the currency composition of investment funds, and to look at their behaviour around two episodes of currency turbulence in our sample: the announcement of the Asset Purchase Programme (APP) and the Brexit referendum.
Our study relates to the micro literature that examines a firm’s decision to hedge foreign currency exposure. Most of these studies estimate the total impact of exchange movements on firms’ returns looking at the impact on share prices. Results are not conclusive and suggest a limited relationship between the two variables. Despite some authors argue that these results may reflect hedging behaviour, only few studies explicitly incorporate derivatives in their analysis, often using binary variables or notional value as a proxy for the use of derivatives (Becker et al., 2006; Geczy et al, 1997; Allayannis et al, 2001; Cowan et al. 2005; Adkins et al., 2007, Bartram, 2019). Using this indirect method, the findings in Nguyen and Faff (2010) and Allayannis et al. (2001) suggest that the use of foreign derivatives is used predominantly for hedging purposes, rather than for speculation motives. Only one recent study by the Nederlandsche Bank looks at the revaluation of assets due to exchange rate changes including the change in value of derivatives directly (Hillebrand, 2016).
Comparing valuation effects on balance sheets with valuation effects on the derivatives position, our findings indicate a significant amount of hedging, but also instances where the currency mismatch is increased via the derivatives book – a speculative behaviour. We differentiate between normal times and special events, such as the Asset Purchase Programme of the ECB, which was accompanied by a depreciation of the euro, and the Brexit referendum, which was accompanied by a depreciation of the sterling. The proportion of hedging funds and the proportion of speculating funds are stable in the periods of currency turbulence compared to normal periods. However, those funds speculating tend to do so relatively more in the first quarter of turbulence, while the hedging rates of hedgers increase in the subsequent quarters.
2. Empirical framework
The balance sheet of investment funds is such that funds are not themselves exposed to currency risk, like they are not exposed to their invested assets, because they pass all gains and losses onto unit holders. However, to maximise the value of units, investment funds should minimise the negative impact of currency movements on the value of the balance sheet. One way funds can decrease the impact of currency movements is by matching the currency composition of assets and liabilities. This can be done by issuing units in the same currencies as the denomination of invested assets, or by investing in assets in the same currency of the units, whichever decision is taken first. Similarly, when funds use leverage, debt can be raised in a currency which the fund is long to reduce the mismatch. We call this behaviour matching.
Furthermore, funds can use foreign exchange derivatives to hedge the currency mismatch. We measure hedging through derivatives as follows. When the change in the replacement value of foreign exchange derivatives runs in the opposite direction to the valuation effect due to currency mismatch on balance sheet, we say that derivatives are used for hedging. Conversely, when the change in replacement value of currency derivatives runs in the same direction as the valuation effect due to currency mismatch, then we say that the derivatives are amplifying currency risk.

4 Foreign exchange derivatives and currency mismatch in Irish investment funds
We estimate the valuation effect due to currency mismatch based on the currency shares at the beginning of each quarter, following the methodology in Lane and Shambaugh (2010). Specifically, we follow four steps. Firstly, we calculate the currency shares in total assets and the currency shares in total liabilities. We exclude assets and liabilities deriving from foreign exchange derivatives, therefore total assets may not equal total liabilities. We calculate the shares in the following currencies: EUR, USD, GBP, JPY, and group the remaining ones in the category “Others”. The difference between the share of assets and the share of liabilities, the net share, indicates whether the fund is long or short in a given currency.
Secondly, we calculate the assets appreciation rate, measuring the percentage change in the value of assets given by the change in the relevant exchange rates. Similarly, we calculate the liabilities appreciation rate, based on the currency shares in the liabilities. Given that the concept of domestic currency is not relevant in our setting, we adapt the methodology in Lane and Shambaugh (2010) as follows. We assign an arbitrary currency to each fund, amongst the currencies in which the fund is active. We then multiply the percentage exchange rate change of each non-base currency vis-à vis the base currency by the share of the respective currency. The sum across all non-base currencies gives the appreciation rate. The formulas are given below.
𝐴𝐴𝐴𝐴𝐴𝐴𝐴𝐴𝐴𝐴𝐴𝐴𝐴𝐴𝑖𝑖𝑖𝑖 = �(𝑆𝑆ℎ𝑎𝑎𝐴𝐴𝑎𝑎 𝑜𝑜𝑜𝑜 𝐴𝐴𝐴𝐴𝐴𝐴𝑎𝑎𝐴𝐴𝐴𝐴 𝑖𝑖𝑖𝑖 𝑐𝑐𝑐𝑐𝐴𝐴𝐴𝐴𝑎𝑎𝑖𝑖𝑐𝑐𝑐𝑐 𝑥𝑥𝑖𝑖𝑖𝑖 ∗ %∆𝐸𝐸𝑥𝑥𝑖𝑖)𝑥𝑥
Similarly,
𝐿𝐿𝑖𝑖𝐴𝐴𝐴𝐴𝐴𝐴𝐴𝐴𝐴𝐴𝑖𝑖𝑖𝑖 = �(𝑆𝑆ℎ𝑎𝑎𝐴𝐴𝑎𝑎 𝑜𝑜𝑜𝑜 𝐿𝐿𝑖𝑖𝑎𝑎𝐿𝐿𝑖𝑖𝐿𝐿𝑖𝑖𝐴𝐴𝑖𝑖𝑎𝑎𝐴𝐴 𝑖𝑖𝑖𝑖 𝑐𝑐𝑐𝑐𝐴𝐴𝐴𝐴𝑎𝑎𝑖𝑖𝑐𝑐𝑐𝑐 𝑥𝑥𝑖𝑖𝑖𝑖 ∗ %∆𝐸𝐸𝑥𝑥𝑖𝑖)𝑥𝑥
where %∆𝐸𝐸𝑥𝑥𝑖𝑖 is the percentage change in the end-of-period nominal exchange rate between currency 𝑥𝑥 and the base currency. By construction, the choice of the base currency does not affect the appreciation rates. An appreciation of the assets implies that the value of assets increases due to exchange changes; an appreciation of the liabilities implies that the value of liabilities increases.
Thirdly, we calculate the net asset appreciation index, given by the following formula.
𝑁𝑁𝐴𝐴𝐴𝐴𝐴𝐴𝐴𝐴𝑁𝑁𝑖𝑖𝑖𝑖 = 𝐴𝐴𝐴𝐴𝐴𝐴𝐴𝐴𝐴𝐴𝐴𝐴𝐴𝐴𝑖𝑖𝑖𝑖 ∗𝐴𝐴
𝐴𝐴 + 𝐿𝐿𝑖𝑖𝑖𝑖 − 𝐿𝐿𝑖𝑖𝐴𝐴𝐴𝐴𝐴𝐴𝐴𝐴 𝐴𝐴𝑖𝑖𝑖𝑖 ∗
𝐿𝐿𝐴𝐴 + 𝐿𝐿𝑖𝑖𝑖𝑖
where A and L are total assets and total liabilities, excluding foreign exchange derivatives. This is a financially-weighted exchange rate change index, corresponding to the percentage change in the net financial index of Lane and Shambaugh (2010).
Finally, we calculate the currency-driven valuation effect on balance sheet as the net asset appreciation index multiplied by the sum of assets and liabilities.
𝐵𝐵𝑎𝑎𝐿𝐿𝑎𝑎𝑖𝑖𝑐𝑐𝑎𝑎 𝐴𝐴ℎ𝑎𝑎𝑎𝑎𝐴𝐴 𝑉𝑉𝑎𝑎𝐿𝐿 𝑎𝑎𝑜𝑜𝑜𝑜𝑖𝑖𝑖𝑖 = 𝑁𝑁𝐴𝐴𝐴𝐴𝐴𝐴𝐴𝐴𝑁𝑁𝑖𝑖𝑖𝑖 ∗ (𝐴𝐴 + 𝐿𝐿)
To include derivatives in our analysis, we compute the change in replacement value (sometimes called market value) of foreign exchange derivatives. This is given by the difference between closing and opening positions, plus net transactions. We include net transactions to account for changes in the replacement value which have been settled via variation margin payments, for example in a clearing

Foreign exchange derivatives and currency mismatch in Irish investment funds 5
house.2 We refer to the change in value of foreign exchange derivatives as the derivatives valuation effect, or the valuation effect off-balance sheet.
𝐷𝐷𝑎𝑎𝐴𝐴𝑖𝑖𝐷𝐷𝑎𝑎𝐴𝐴𝑖𝑖𝐷𝐷𝑎𝑎𝐴𝐴 𝑉𝑉𝑎𝑎𝐿𝐿 𝑎𝑎𝑜𝑜𝑜𝑜𝑖𝑖𝑖𝑖 = �(𝐶𝐶𝐿𝐿𝑜𝑜𝐴𝐴𝑖𝑖𝑖𝑖𝐶𝐶 − 𝑂𝑂𝐴𝐴𝑎𝑎𝑖𝑖𝑖𝑖𝑖𝑖𝐶𝐶 + 𝑁𝑁𝑎𝑎𝐴𝐴 𝐴𝐴𝐴𝐴𝑎𝑎𝑖𝑖𝐴𝐴𝑎𝑎𝑐𝑐𝐴𝐴𝑖𝑖𝑜𝑜𝑖𝑖𝐴𝐴)𝑑𝑑𝑖𝑖𝑖𝑖𝑑𝑑
where 𝑑𝑑 represents each foreign exchange derivatives contract.
Finally, the total valuation effect is equal to the sum of the valuation effects on and off balance sheet:
𝑇𝑇𝑜𝑜𝐴𝐴𝑎𝑎𝐿𝐿 𝑉𝑉𝑎𝑎𝐿𝐿 𝑎𝑎𝑜𝑜𝑜𝑜𝑖𝑖𝑖𝑖 = 𝐵𝐵𝑎𝑎𝐿𝐿𝑎𝑎𝑖𝑖𝑐𝑐𝑎𝑎 𝐴𝐴ℎ𝑎𝑎𝑎𝑎𝐴𝐴 𝑉𝑉𝑎𝑎𝐿𝐿 𝑎𝑎𝑜𝑜𝑜𝑜𝑖𝑖𝑖𝑖 + 𝐷𝐷𝑎𝑎𝐴𝐴𝑖𝑖𝐷𝐷𝑎𝑎𝐴𝐴𝑖𝑖𝐷𝐷𝑎𝑎𝐴𝐴 𝑉𝑉𝑎𝑎𝐿𝐿 𝑎𝑎𝑜𝑜𝑜𝑜it
Comparing the sign of valuation effects on and off balance sheet allows us to identify whether a fund is hedging or speculating on exchange changes. Figure 1 illustrates the intuition. The horizontal axis measures the derivatives valuation effect; the vertical axis measures the balance sheet valuation effect. When a fund sits in the top-left or bottom-right quadrants, derivatives are compensating for valuation changes on balance sheet. We thus consider this fund as hedging the currency mismatch. Conversely, a fund in the top-right or the bottom-left quadrants has valuation changes on balance sheet and in derivatives going in the same direction. We call this latter behaviour speculating, or amplifying the currency mismatch, because the fund is increasing balance sheet currency exposure via derivatives.
The 45 degree line indicates full hedging. Points above this line in the top-left quadrant indicate that derivatives compensate partially for balance-sheet valuation gains, while points below it in the same quadrant indicate over-compensation. Conversely, points above the 45 degree line in the lower-right quadrant indicate over-compensation, whereas points below the line indicate partial hedging.
The optimal hedging strategy depends on the correlation between currency effects and other price effects: when the correlation is negative, it is optimal to partially hedge; when correlation is positive, it is optimal to over-compensate. We do not attempt to define the optimal strategy here, rather we simply show hedging rates, defined as the ratio between valuation effect on balance sheet and valuation effect off balance sheet.
3. Data analysis
3.1 Overview of the data
We start with an overview of the investment fund sector in Ireland. We then show aggregated currency shares and currency-driven valuation effects, to illustrate how macro-level statistics can be enriched by granular micro data. We differentiate between sub-sectors, and between funds using or not using foreign exchange derivatives. Finally, we then turn to cross-fund distributions to analyse differences in currency risk management across funds.
The total asset value of Irish non-MMF investment funds is EUR 2,588 billion at Q1 2019 (Figure 2).3 Our sample contains investment funds with total asset value of EUR 2,211 billion at Q1 2019,
2 Variation margin proxies for the change in replacement value, although it sometimes includes other factors, for example
volatility adjustments. Net transactions in this dataset also include options premium payments. The structure of the underlying dataset does not allow to strip out premium payments; however, the distortion caused is likely small since options represent a small share of foreign exchange derivatives.
3 https://www.centralbank.ie/statistics/data-and-analysis/other-financial-sector-statistics/investment-funds

6 Foreign exchange derivatives and currency mismatch in Irish investment funds
representing 85% of the total in that quarter. Coverage ranges between 85% and 100% depending on the quarter.4 Figure 2 shows that the largest sub-sectors in terms of total assets are bond funds and equity funds. The size of the hedge fund sector may be underestimated due to their often large use of off-balance sheet instruments, including derivatives. The investment fund sector has doubled over the period between Q2 2014 and Q1 2019, with largest growth rates in real estate funds (314%), other funds (280%), and mixed funds (114%). The slowest-growing bond fund sub-sector grew by 50% over the period. For a more detailed overview of market-based finance in Ireland, see Cima et al. (2019).
The investment fund sector domiciled in Ireland has an international nature (see also Lane and Moloney, 2018). Approximately 93% of the liabilities are held by foreign residents, while 90% of the assets are invested abroad (approximately EUR 2,300 billion and EUR 2,400, respectively). The industry accounts for approximately half of the Irish international balance sheet. As such, the data collected by the Central Bank of Ireland on investment funds assets and liabilities are an important source of detailed information on the Irish International Investment position. One important application of these data, which we pursue in this study, is uncovering the currency composition of the financial intermediation industry based in Ireland.
Recent research has made important advances in the mapping of international currency exposures (Benetrix et al., 2015; Benetrix et al., 2020). However, data gaps remain, and the assumptions made to fill the gaps may not always be appropriate, especially for financial centres. For example, in the dataset compiled by Benetrix et al. (2020), USD-denominated liabilities of Irish resident are approximately EUR 524 billion in 2017. In our data, USD foreign liabilities of non-MMF investment funds alone are approximately EUR 720 billion. The discrepancy is likely due to the assumption made in Benetrix et al. (2020), whereby when macro data is missing, portfolio equity liabilities are assumed to be in the domestic currency. This illustrates the potential for Irish funds data to be incorporated in external statistics on the currency composition of the IIP.
Figure 3 shows the time series of currency shares in Irish investment funds assets and liabilities. The shares are remarkably stable during the sample period.5 The dollar is the most common currency in both assets and liabilities, accounting for a share of approximately 40% respectively, followed by the sterling. The yen represents a small share of the assets, and an even smaller share of liabilities. Other currencies account for 10% of assets and a negligible share of liabilities. Overall, Irish investment funds have a short position in EUR, GBP and JPY, and a long position in USD.
Figure 4 provides a breakdown of currency shares by type of fund. Real Estate funds and Other funds have a relatively balanced currency position. The other types of funds replicate the overall exposures, except for equity funds, which are short USD. Equity funds tend to raise funds in the international currencies and invest globally: the “Other” currency assets and JPY assets are relatively large in equity funds.
Figure 5 compares funds using foreign exchange derivatives with funds not using these derivatives. Total assets of derivatives users are larger, except for real estate funds and other funds. Foreign exchange derivatives users tend to have more pronounced currency mismatch than non-users, except equity funds. However, to the extent that equity funds invest in assets denominated in currencies pegged to an international currency, the chart may overestimate the currency mismatch in this type of fund.
The lower degree of currency mismatch in funds not using currency derivatives is also evident in Figure 6. The figure depicts the time series of balance-sheet valuation effects in funds not using currency
4 We exclude funds which do not have assets or liabilities in any one of the five currencies analysed in this study. We also drop
observations with data quality issues in at least one of the variables used in this study. This reduces the amount of observations compared to public statistics, which rely on a smaller number of variables.
5 Cross-fund distributions, not shown here, as also stable over time.

Foreign exchange derivatives and currency mismatch in Irish investment funds 7
derivatives on the left panel, and in funds using currency derivatives on the right panel. On the right panel, the derivatives valuation effect is also depicted, along with the total valuation effect. At an aggregate level, users of foreign exchange derivatives have wider valuation effects than non-users, although users tend to reduce on-balance sheet currency exposure via derivatives.
In Figure 7, we focus only on derivative users. A split of valuation effects by fund type shows heterogeneity. Three observations emerge. First, in bond funds, mixed funds, hedge funds and other funds, aggregate valuation effects on balance sheet tend to be reduced by derivatives positions. Conversely, equity funds and real estate funds often amplify aggregate balance sheet exposures via derivatives. Second, the impact of derivatives is relatively small in real estate funds, while in hedge funds derivatives play an important role, often compensating balance sheet valuation effects. Third, there are differences in specific periods. During the euro depreciation in Q1 2015, bond funds amplified gains on balance sheet with the derivatives position, whereas equity funds had losses on both fronts. Conversely, during the quarter of the Brexit referendum (Q2 2016), all fund types hedged currency risk at least to some extent.
We now turn to cross-fund distributions. In Figure 8, we look at matching. Blue boxes represent the distribution of the asset shares (excluding funds with no assets denominated in the currency); the orange boxes represent the distribution of the net asset shares (asset share minus liability share). The top right panel shows that the median share of euro-denominated assets is 17%. In contrast, the median net euro share is zero. This indicates that the median balance sheet mismatch in euro is null. The interquartile range also shrinks, with 50% of funds invested in euro having a net share between -19% and 6%. A similar picture for the dollar: the median asset share is 50%, but the median mismatch is zero. From Figure 8 it is also evident that there are relatively more funds with dollar mismatch than funds with mismatch in euro or sterling.
Going from distributions to tracking individual funds, Table 1 adds information on the frequency of funds matching the currencies shares in their assets and liabilities. The first column contains the percentage of funds where the net share is lower than the asset share, but still positive, indicating partial matching. The second column is the percentage of funds with a positive asset share completely matched by liabilities; the third column is the share of funds with zero liabilities share in the currency (but positive asset share). The fourth column reports the percentage of funds “over-matching”, that is, where the liability share is larger than the asset share, so the net asset share is negative.
Summing the first two cells in the euro row suggests that 29% of the funds reduce their euro exposure by issuing liabilities in euro. Of this, 6% completely match their euro asset exposure with euro liabilities. In the second row, 37% of funds match some of their dollar exposure, but only 3% with a complete offset. Matching is less frequent in sterling and yen, though 5% of funds have both assets and liabilities completely denominated in sterling. The last column shows that it is not uncommon for funds to turn their long positions into short positions, that is, to issue more liabilities in a currency than the invested assets in that currency.
Next, we show the cross-fund distributions of the net asset appreciation index, for funds not using foreign exchange derivatives (left panel of Figure 9), compared to derivatives users (right panel). The net asset appreciation index measures the change in the value of net assets given by the exchange rate change occurred in the period, taking into account the effects of matching and diversification, but not derivatives. The interquartile range of the net appreciation index is between -2% and 2%, with the exception of q1 2015, in both distributions, with a small difference between derivative users and non-users. There are some differences in the tails, but the distributions are quite similar except for the year 2016. The same distribution weighted by total assets in Figure 10 suggests that funds not using derivatives are smaller, since similar net asset appreciation indices lead to much smaller valuation effects.
Figure 11 focuses on funds using derivatives. It shows the distribution of the balance sheet valuation effect in the left panel, and the distribution of the total valuation effect (including derivatives) in the left

8 Foreign exchange derivatives and currency mismatch in Irish investment funds
panel. The use of derivatives shrinks the distribution of valuation effects between 10th and 90th percentile. However, the tails become longer; gains of funds above the 90th percentile tend to be larger, and losses of funds below the 10th percentile tend to be larger. Fund-level analysis – not shown here – confirms that funds in the centre of the distribution of the total appreciation index tend to use derivatives to hedge, whereas funds in the tails tend to increase their exposure via derivatives.
Figure 11 suggests that the aggregated valuation effects shown in Figure 6 mask some heterogeneity. The finding in Figure 6 that aggregate valuation effects are reduced by the use of derivatives is the reflection of two effects. On the one hand, a large mass of funds hedge currency exposure. On the other hand, the funds in the tails of the distribution amplify currency exposure, but those with valuation gains largely compensate those with valuation losses. In the next section, we study the behaviour of hedging funds and amplifying funds more closely, focusing on two events associated with large currency movements.
3.2 Event study
In this section, we focus on funds using foreign exchange derivatives. We analyse hedging and amplifying behaviour during two episodes of currency turbulence in our sample: the announcement of the Asset Purchase Programme (APP) and the Brexit referendum. We consider the quarters of the announcements (Q1 2015 for the APP and Q1 2016 for the Brexit), the quarter when the Brexit referendum actually took place (Q2 2016), and the following quarters (Q2 2015 and Q3 2016), where we observe further exchange rate adjustment. Table 2 recaps currency movements during those periods. EUR depreciates vis-à-vis GBP in APP quarters (Q1 and Q2 2015), but overshoots vis-à-vis USD. GBP depreciates every quarter during Brexit quarters (Q1, Q2 and Q3 2016), except a small recovery vis-à-vis the dollar in Q2 2016.
As described in section 2 and illustrated in Figure 1, we define hedging funds as those with the valuation effects off balance sheet of opposite sign to the valuation effects on balance sheet. We define amplifying funds, or speculating funds, as those where the sign of the valuation effects is the same. For hedgers, we calculate aggregate hedging rates as the ratio between the two types of valuation effects – the slope of Figure 1.
Table 1 shows the percentage of funds hedging and the percentage of funds amplifying currency mismatch with derivatives. On average in normal times (outside our shock periods), 53% of the funds reduce currency exposure via derivatives, whereas 37% amplify it. The proportion is similar when weighing by assets. This is stable during the shock periods, except for the quarter when the Brexit referendum took place (Q2 2016), when relatively more funds hedged at least some of their currency mismatch. More specifically, in Q2 2016 hedgers account for 60% of total assets, amplifiers 33%. Table 4 shows that also hedging rates were higher in that quarter.
In Table 4, we differentiate between funds gaining from the balance sheet mismatch and funds losing from the mismatch. The table shows hedging rates and total valuation effects (on and off balance sheet) of hedging funds. In the quarters outside the shock periods, hedging rate is approximately 60% for both funds whose currency mismatch led to a valuation gain, and those with valuation losses. There are lower hedging rates in the quarter of the news shock (Q1 2015q1 and Q1 2016); higher hedging rates in the quarter following the news shock (Q2 2015 and Q2 2016). In the quarter following the Brexit referendum (Q3 2016), there is significantly larger hedging in those funds which were losing from the sterling depreciation, and lower hedging of funds which were gaining from the depreciation. This is consistent with some degree of confidence in expecting a further sterling depreciation.
Table 5 shows valuation effects on and off balance sheet of those funds amplifying on-balance sheet currency exposure via derivatives. Not surprisingly, valuation gains and losses on balance sheet are large when there are large currency movements. However, valuation losses are also large in Q2 2015, when

Foreign exchange derivatives and currency mismatch in Irish investment funds 9
exchange rates movements are not sharp, though the euro depreciated against the sterling while appreciating against the dollar. The detrimental effect of this combination is also visible in Table 4, where the valuation losses in this quarter are relatively large notwithstanding 77% hedging rate.
Turning to the use of derivatives, from Table 5 it appears that speculating tends to be more intense in the quarters of the event announcement. In Q1 2015, funds which successfully amplified their currency exposure increased the valuation gain by 35% through derivatives, gaining close to EUR 11 billion overall. Conversely, funds which were losing on balance sheet mismatch only increased exposure via derivatives by 13%, for a total loss of close to EUR 4 billiion. This suggests that there was some degree of confidence in the expectation of a depreciating euro. Conversely, in the quarter of announcement of the Brexit referendum (Q1 2016), speculating in both directions was relatively intense.
In summary, Irish investment funds decreased hedging rates and increased speculation in the quarter when the APP was announced, and so they did in the quarter when the Brexit referendum was announced. This suggests that these news were somewhat expected, although expectations on the direction of the exchange rate impact were mixed. After the announcements, the hedging rates increase. The increase in hedging rates seems to be particularly evident after shocks where the direction of the impact was less predictable (Brexit).
4. Conclusion
Given the growing importance of financial centres in global external assets and liabilities, it is important to understand the behaviour of financial intermediaries. To the extent that currency mismatches can have an impact on the dynamics of external balance sheets, analysing the currency risk profile of financial institutions is fundamental. Interesting and important questions are whether investment funds shareholders are exposed to foreign currency shocks and whether investment funds reduce such risks through the use of derivatives or other strategies (such as matching).
Our contributions are manifold. First, we give an improved picture of the currency composition of the investment-fund component of the Irish IIP, adding to the recent work of Benetrix et al. (2020). Second, we describe the currency risk strategies of investment funds, by combining in an innovative way the financially-weighted exchange rate index developed by Lane and Shambaugh (2010) with the replacement value of foreign exchange derivatives. Finally, we provide insights to regulators and policy makers about the behaviour of investment funds around policy decision events.
Our analysis suggests that foreign exchange derivatives users tend to have more pronounced currency mismatch than non-users. At an aggregate level, users of foreign exchange derivatives have wider valuation effects than non-users, even if the former tend to reduce on-balance sheet currency exposure via derivatives. Interestingly, our data also highlight differences amongst type of funds. Bond funds, mixed funds, hedge funds and other funds tend to reduce aggregate valuation effects by using derivatives. Conversely, equity funds and real estate funds tend to amplify aggregate balance sheet exposures via derivatives.
Finally, our analysis of specific events suggests that funds are not idle when policies are likely to affect the exchange rate. In the quarter of announcement of the APP and the quarter of announcement of the Brexit referendum, there is more speculation and less hedging. In the subsequent quarters, speculation decreases and hedging increases.

10 Foreign exchange derivatives and currency mismatch in Irish investment funds
Bibliography
Adkins, L.. C., D.. A. Carter, and W.. G. Simpson (2007). “Managerial incentives and the use of foreign-exchange derivatives by banks”. The Journal of Financial Research. Allayannis, G. and E.. Ofek (2001).”Exchange rate exposure, hedging, and the use of foreign currency Derivatives”. Journal of International Money and Finance. Bartram S. M. (2019). “Corporate hedging and speculation with derivatives”. Journal of Corporate Finance. Becker, C. and D.. Fabro (2006). “Limiting foreign exchange exposure through hedging: the Australian Experience”. Reserve Bank of Australia. Bénétrix, A.S, P.R. Lane, and J. Shambaugh (2015). “International currency exposures, valuation effects and the global financial crisis”. Journal of International Economics. Bénétrix, A.S., D. Gautam, and L. Juvenal and M.Schmitz (2020). “Cross-border currency exposure. New evidence based on an enhanced and updated dataset”. Trinity Economics Paper tep0120, Trinity College Dublin, Department of Economics. ” Cima, S., N. Killeen, and V. Madouros (2019). "Mapping Market-Based Finance in Ireland" Central Bank of Ireland. Financial Stability Notes, No. 17, 2019. Cowan, K., E.. Hansen, and L.. O. Herrera (2005). “Exchange rate exposure, hedging, and the use of foreign currency derivatives”. Inter-American development bank Working Paper. Forbes, Kristin, Ida Hjortsoe, and Tsvetelina Nenova. "Current account deficits during heightened risk: menacing or mitigating?." The Economic Journal 127.601 (2017): 571-623. Galstyan, V., 2019. Estimates of Foreign Assets and Liabilities for Ireland. Journal of the Statistical and Social Inquiry Society of Ireland, forthcoming. Geczy, C., B.. A. Minton, and C.. Schrand (1997). “Why firms use currency derivatives?” The Journal of Finance. Gourinchas, P.-O. and H.. Rey (2014). “External adjustment, global imbalances and valuation effects”. Handbook of International Economics. Hillebrand R. (2016). “Experience in compiling data on financial derivatives”. Twenty-Ninth Meeting of the IMF Committee on Balance of Payments Statistics. International Monetary Fund. Lane, P.R. and Milesi-Ferretti, G.M., 2001. “The external wealth of nations: Measures of foreign assets and liabilities for industrial and developing countries.” Journal of international Economics, 55(2), pp.263-294. Lane, P.R. and Milesi-Ferretti, G.M., 2007. “The external wealth of nations mark II: Revised and extended estimates of foreign assets and liabilities, 1970–2004.” Journal of international Economics, 73(2), pp.223-250.

Foreign exchange derivatives and currency mismatch in Irish investment funds 11
Lane, P.R. and G.M.Milesi-Ferretti (2018). “International Financial Integration in the Aftermath of the Global Financial Crisis”. IMF Economic Review 66 (1), pp. 189-222. Lane, P.R. and K. Moloney (2018). "Market-based finance: Ireland as a host for international financial intermediation." In Banque de France Financial Stability Review No. 22, April 2018. Lane, P. R., and J.C. Shambaugh (2010) "Financial exchange rates and international currency exposures." American Economic Review 100.1 (2010): 518-40. Nguyen, H., Faff, R. (2010). “Are firms hedging or speculating? The relationship between financial derivatives and firm risk”. Appl. Financ. Econ. 20, 827–843. Stoffels N. and C. Tille (2018). “Do Swiss foreign assets hedge the business cycle?” Aussenwirtschaft 69.1. pp. 1-44. Tille C. (2003). “The Impact of Exchange Rate Movements on U.S. Foreign Debt”. Current Issues in Economics and Finance, 9(1).

12 Foreign exchange derivatives and currency mismatch in Irish investment funds
Tables and figures
Figure 1 Illustration of hedging and speculating via derivatives
Notes: The horizontal axis measures the change in replacement value of foreign exchange derivatives. The vertical axis measures valuation effects on balance sheet.

Foreign exchange derivatives and currency mismatch in Irish investment funds 13
Figure 2 Total assets by investment fund type, 2014q2 to 2019q1

14 Foreign exchange derivatives and currency mismatch in Irish investment funds
Figure 3 Currency shares of assets and liabilities of Irish investment funds, 2014q1 to 2019q1

Foreign exchange derivatives and currency mismatch in Irish investment funds 15
Figure 4 Currency shares by type of fund, 2019q1

16 Foreign exchange derivatives and currency mismatch in Irish investment funds
Figure 5 Assets of users and non-users of foreign exchange derivatives, by currency (Q1 2019)

Foreign exchange derivatives and currency mismatch in Irish investment funds 17
Figure 6 Valuation effects of users and non-users of foreign exchange derivatives, 2014q2 to 2019q1

18 Foreign exchange derivatives and currency mismatch in Irish investment funds
Figure 7 Valuation effects by type of fund, 2014q2 to 2019q1

Foreign exchange derivatives and currency mismatch in Irish investment funds 19
Figure 8 Distribution of asset shares and distribution of net asset shares, by currency (Q1 2019)
Notes: Blue bars represent the distribution of the net asset share. Orange bars represent the distribution of the net share (asset share minus liability share).

20 Foreign exchange derivatives and currency mismatch in Irish investment funds
Figure 9 Distribution of net asset appreciation index of users and non-users of foreign exchange derivatives, 2014q1 to 2019q1

Foreign exchange derivatives and currency mismatch in Irish investment funds 21
Figure 10 Distribution of valuation effects on balance sheet, 2014q2 to 2019q1
Notes: The distribution in the right panel refers to funds using foreign exchange derivatives. The distribution on the left panel refers to funds not using foreign exchange derivatives.

22 Foreign exchange derivatives and currency mismatch in Irish investment funds
Figure 11 Distribution of balance sheet and total valuation effects, 2014q2 to 2019q1

Foreign exchange derivatives and currency mismatch in Irish investment funds 23
Table 1 Currency matching: percentage of funds (Q1 2019)
Currency Partially matched
Completely matched
No matching
Over-matched (short overall)
EUR 23% 6% 4% 33% USD 34% 3% 4% 31% GBP 19% 5% 4% 23% JPY 14% 0% 2% 2%

24 Foreign exchange derivatives and currency mismatch in Irish investment funds
Table 2 Exchange changes
GBP-EUR USD- EUR USD-GBP
Average 0 1% 1%
2015q1 7% 13% 3%
2015q2 2% -4% -2%
2016q1 -7% -4% 5%
2016q2 -4% 3% -0.3%
2016q3 -4% -1% 12% Notes: Average excludes the selected quarters.

Foreign exchange derivatives and currency mismatch in Irish investment funds 25
Table 3 Hedgers and amplifiers: percentage of funds
Number of Funds Asset weighted
Hedge Amplify Hedge Amplify Average 53% 37% 51% 40% 2015q1 53% 35% 49% 43% 2015q2 56% 32% 51% 42% 2016q1 51% 37% 46% 48% 2016q2 58% 31% 60% 33% 2016q3 54% 34% 53% 39% Notes: Percentages do not add up to one because there are funds with no asset mismatch and funds with balanced derivatives positions (or not using derivatives). Average excludes the selected quarters.

26 Foreign exchange derivatives and currency mismatch in Irish investment funds
Table 4 Hedging rates of the funds hedging the currency mismatch, selected quarters
Valuation gain Valuation loss Hedging rate Total FX effect Hedging rate Total FX effect
Average -60% 1,166 -58% -1,044 2015q1 -52% 3,797 -38% -3,605 2015q2 -90% 146 -77% -1,098 2016q1 -49% 1,630 -53% -1,532 2016q2 -74% 1,777 -67% -519 2016q3 -51% 1,422 -84% -127 Notes: Hedging rate = derivatives valuation loss (gain) over asset valuation gain (loss). Average excludes the selected quarters.

Foreign exchange derivatives and currency mismatch in Irish investment funds 27
Table 5 Valuation effects of the funds amplifying the currency mismatch, selected quarters
Valuation gain Valuation loss
On BS Off BS Total On/Off On BS Off BD Total On/Off
Average 1,970 984 2,954 50% - 1,835 - 781 - 2,617 43% 2015q1 8,010 2,836 10,846 35% - 3,501 - 461 - 3,962 13% 2015q2 1,168 279 1,446 24% - 3,146 - 961 - 4,108 31% 2016q1 3,959 1,246 5,206 31% - 1,687 - 1,563 - 3,250 93% 2016q2 2,784 552 3,336 20% - 637 - 885 - 1,522 139% 2016q3 1,516 418 1,934 28% - 514 - 374 - 888 73% Note: % Assets is the total valuation gain / loss as a percentage of total assets of funds in each group. Average excludes the selected quarters.

Foreign exchange derivatives and currency mismatch in Irish investment funds
Benedetta Bianchi and Giovanna Bua
The views expressed are of the authors and not necessarily those of the Central Bank of Ireland or the European Central Bank. Any errors remain the responsibility of the authors.

2
Goals and contributions
1. Currency composition of assets and liabilities of Irish-domiciled investment funds
Micro data improve existing statistics
2. Use of foreign exchange derivatives: Hedging or amplifying currency risk?
Empirical method extends framework on currency exposures

3
Estimating the impact of exchange changes
𝐴𝑠𝑠𝑒𝑡𝑠 𝐴𝑝𝑝𝑟𝑒𝑐𝑖𝑎𝑡𝑖𝑜𝑛 𝑅𝑎𝑡𝑒𝑖𝑡 = σ𝑥 𝑆ℎ𝑎𝑟𝑒 𝑜𝑓 𝐴𝑠𝑠𝑒𝑡𝑠 𝑖𝑛 𝑐𝑢𝑟𝑟𝑒𝑛𝑐𝑦 𝑥𝑖𝑡 ∗ %∆𝐸𝑥𝑡
𝐿𝑖𝑎𝑏𝑖𝑙𝑖𝑡𝑖𝑒𝑠 𝐴𝑝𝑝𝑟𝑒𝑐𝑖𝑎𝑡𝑖𝑜𝑛 𝑅𝑎𝑡𝑒𝑖𝑡 = σ𝑥 𝑆ℎ𝑎𝑟𝑒 𝑜𝑓 𝐿𝑖𝑎𝑏𝑖𝑙𝑖𝑡𝑖𝑒𝑠 𝑖𝑛 𝑐𝑢𝑟𝑟𝑒𝑛𝑐𝑦 𝑥𝑖𝑡 ∗ %∆𝐸𝑥𝑡
𝑁𝑒𝑡 𝐴𝑝𝑝𝑟𝑒𝑐𝑖𝑎𝑡𝑖𝑜𝑛 𝐼𝑛𝑑𝑒𝑥𝑖𝑡 = 𝐴𝑠𝑠𝑒𝑡 𝐴𝑝𝑝𝑟𝑒𝑐𝑖𝑎𝑡𝑖𝑜𝑛 𝑅𝑎𝑡𝑒𝑖𝑡 ∗𝐴
𝐴+𝐿𝑖𝑡− 𝐿𝑖𝑎𝑏𝑖𝑙𝑖𝑡𝑖𝑒𝑠 𝐴𝑝𝑝𝑟𝑒𝑐𝑖𝑎𝑡𝑖𝑜𝑛 𝑅𝑎𝑡𝑒𝑖𝑡∗
𝐿
𝐴+𝐿𝑖𝑡
𝐵𝑎𝑙𝑎𝑛𝑐𝑒 𝑆ℎ𝑒𝑒𝑡 𝑉𝑎𝑙𝑢𝑎𝑡𝑖𝑜𝑛 𝐸𝑓𝑓𝑒𝑐𝑡𝑖𝑡 = 𝑁𝑒𝑡 𝐴𝑠𝑠𝑒𝑡 𝐴𝑝𝑝𝑟𝑒𝑐𝑖𝑎𝑡𝑖𝑜𝑛 𝐼𝑛𝑑𝑒𝑥𝑖𝑡 ∗ 𝐴 + 𝐿 𝑖𝑡
(Adaptation of Lane and Shambaugh, 2010)

4
Extension to include foreign exchange derivatives
𝐷𝑒𝑟𝑖𝑣𝑎𝑡𝑖𝑣𝑒𝑠 𝑉𝑎𝑙𝑢𝑎𝑡𝑖𝑜𝑛 𝐸𝑓𝑓𝑒𝑐𝑡𝑖𝑡 = σ𝑑(𝐶𝑙𝑜𝑠𝑖𝑛𝑔 − 𝑂𝑝𝑒𝑛𝑖𝑛𝑔 + 𝑁𝑒𝑡 𝑡𝑟𝑎𝑛𝑠𝑎𝑐𝑡𝑖𝑜𝑛𝑠)𝑑𝑖𝑡
Change in market value
Settled and un-settled (incl. variation margin)
𝑇𝑜𝑡𝑎𝑙 𝑉𝑎𝑙𝑢𝑎𝑡𝑖𝑜𝑛 𝐸𝑓𝑓𝑒𝑐𝑡𝑖𝑡 = 𝐵𝑎𝑙𝑎𝑛𝑐𝑒 𝑆ℎ𝑒𝑒𝑡 𝑉𝑎𝑙𝑢𝑎𝑡𝑖𝑜𝑛 𝐸𝑓𝑓𝑒𝑐𝑡𝑖𝑡 + 𝐷𝑒𝑟𝑖𝑣𝑎𝑡𝑖𝑣𝑒𝑠 𝑉𝑎𝑙𝑢𝑎𝑡𝑖𝑜𝑛 𝐸𝑓𝑓𝑒𝑐𝑡it

5
Hedging and speculating: Definitions

6
Currency shares of Irish investment funds assets and liabilities
Existing estimates of dollar-denominated
foreign liabilities: EUR 524 billion
(including all sectors)
Our estimates: EUR 720 billion
(non-MMF investment funds only)

7
Valuation effects by type of fund

8
Valuation effects: Cross-fund distribution

9
Event study
Two episodes of large exchange changes
Q1 and Q2 2015 (ECB’s Asset Purchase Programme)
Q1, Q2 and Q3 2016 (The Brexit referendum)
GBP-EUR USD-EUR USD-GBPAverage 0 1% 1%2015q1 7% 13% 3%2015q2 2% -4% -2%2016q1 -7% -4% 5%2016q2 -4% 3% -0.3%2016q3 -4% -1% 12%

10
Hedgers and amplifiers: percentage of funds
Number of Funds Asset weighted Hedge Amplify Hedge Amplify
Average 53% 37% 51% 40%2015q1 53% 35% 49% 43%2015q2 56% 32% 51% 42%2016q1 51% 37% 46% 48%2016q2 58% 31% 60% 33%2016q3 54% 34% 53% 39%

11
Hedging rates of the funds hedging the currency mismatch
Valuation gain Valuation loss
Hedging rate Total FX effect Hedging rate Total FX effect
Average -60% 1,166 -58% -1,044
2015q1 -52% 3,797 -38% -3,605
2015q2 -90% 146 -77% -1,098
2016q1 -49% 1,630 -53% -1,532
2016q2 -74% 1,777 -67% -519
2016q3 -51% 1,422 -84% -127

12
Valuation effects of the funds amplifying the currency mismatch
Valuation gain Valuation lossOn BS Off BS Total On/Off On BS Off BS Total On/Off
Average 1,970 984 2,954 50% - 1,835 - 781 - 2,617 43%
2015q1 8,010 2,836 10,846 35% - 3,501 - 461 - 3,962 13%
2015q2 1,168 279 1,446 24% - 3,146 - 961 - 4,108 31%
2016q1 3,959 1,246 5,206 31% - 1,687 - 1,563 - 3,250 93%
2016q2 2,784 552 3,336 20% - 637 - 885 - 1,522 139%
2016q3 1,516 418 1,934 28% - 514 - 374 - 888 73%

13
Conclusions
Macro statistics
Currency composition of IIP can be improved with micro data
Intermediation: Where are the shareholders based?
Hedging or amplifying
Hedging increases after large exchange changes
Valuation effects reduced by derivatives, but increased in the tails

1/1
IFC Conference on external statistics "Bridging measurement challenges and analytical needs of external statistics: evolution or revolution?", co-organised with the Bank of Portugal (BoP) and the European Central Bank (ECB)
17-18 February 2020, Lisbon, Portugal
Issues in the compilation and analysis of remittances in BPM61
Blessing Adada Gaiya,
Central Bank of Nigeria
1 This presentation was prepared for the meeting. The views expressed are those of the author and do not necessarily reflect the views of the BIS, IFC, BoP, ECB or the central
banks and other institutions represented at the meeting.

Issues in the Compilation and Analysis of Remittances in BPM6 1
Issues in the Compilation and Analysis of Remittances in BPM6
Blessing Adada Gaiya1
Abstract
Global remittance flows have increased rapidly in recent years and are considered by many governments as being of high policy interest particularly in analysing their impact on economic development and security. Remittances are defined as representing household income from foreign economies arising mainly from the temporary or permanent movement of people to those economies. Compilation of remittance aggregates can be a very tricky job because no single data item in the balance of payments framework comprehensively captures transactions in remittances. This note intends to take a critical look at some of the issues in compilation and analysis of remittances in BPM6. Issues that arise from compilation and analysis of remittances include, difficulty in obtaining migration and other statistics, identification of transaction channels, and lack of coordination between regulatory authorities.
Keywords: International Economics, Balance of Payments, Compilation, BPM6
JEL Classification: F3 C190
1 The author is a staff of the External Sector Division, Research Department, Central Bank of Nigeria.
Opinions expressed in the paper are those of the author and do not represent the views and policies of the Central Bank of Nigeria.

2 Issues in the Compilation and Analysis of Remittances in BPM6
Contents
Issues in the Compilation and Analysis of Remittances in BPM6 ........................................ 1
1. Introduction ....................................................................................................................................... 3
2. Conceptual Issues ............................................................................................................................ 4
2.1 The Balance of Payments ................................................................................................... 4
2.2 Balance of Payments and International Investment Position Manual ............. 5
2.3 Remittances ............................................................................................................................. 5
2.4 Channels and Types of Remittances ............................................................................. 6
3. Treatment of Remittances ............................................................................................................ 6
3.1 Remittances in BPM5 ........................................................................................................... 6
3.2 Treatment Remittances in BPM6 .................................................................................... 7
3.2.1 Standard Component ............................................................................................... 7
3.2.2 Personal Remittances ............................................................................................... 8
3.2.3 Total Remittances....................................................................................................... 8
3.2.4 Total Remittances and Transfers to Non-Profit Institutions Serving Households .................................................................................................................... 9
3.3 Some Identified Differences between BPM5 and BPM6 ....................................... 9
4. Issues in the Compilation and Analysis of Remittances ................................................. 11
4.1 Interpretation of Concepts .............................................................................................. 11
4.2 Migration Statistics ............................................................................................................. 12
4.3 Identifying Transaction Channels ................................................................................. 12
4.4 Lack of Coordination between Regulatory Authorities ....................................... 13
4.5 Lack of Appropriate Framework for Harnessing Remittances .......................... 13
4.6 Low Capacity in BOP Compilation especially in Developing Countries ........ 13
4.7 Digital Currencies ................................................................................................................ 13
5. Conclusion ........................................................................................................................................ 13
References ................................................................................................................................................ 14

Issues in the Compilation and Analysis of Remittances in BPM6 3
1. Introduction
Remittances are a rapidly growing and stable source of foreign exchange inflow to several economies across the world. Remittances through official sources far exceed the size of official development assistance (ODA) and are more stable than foreign private flows such as portfolio investments which are characterised by high volatility and distortionary tendencies due to their short life cycle.
The World Bank records that in 2018, global remittance flows grew by 9.0 per cent to US$689.00 billion while remittances to low and middle income countries grew by 9.6 per cent to $529.00 billion dollars, making it the largest source of foreign exchange earnings in low and middle income countries except China. Of this amount, East Asia and Pacific received US$143.00 billion; Europe and Central Asia, US$59.00 billion; Latin America and the Caribbean received US$88.00 billion; Middle East and North Africa , US$62.00 billion; South Asia, US$131.00 billion; and Sub-Saharan Africa, US$46.00 billion. Of the total remittances going to SSA, two-thirds was remitted to Nigeria, making Nigeria the highest recipient of remittances in SSA. Nigeria is the 6th remittance receiving country globally after India, China, Mexico, the Philippines, and Egypt (World Bank, 2019). The importance of remittances from Nigerians in Diaspora can therefore not be overestimated.
The size of remittances is driven largely by migration and therefore by the size of the migrant stock. Also, the economic condition of both the host and recipient country will determine the size and flow of remittances. The benefits of remittances to the remitter’s family, community and country of origin cannot be discounted. At the household level, remittances serve as an additional disposable income which then translates into funding education, providing healthcare and feeding, assisting families to invest in lands, farms, livestock, and businesses. Remittances are a significant source of reducing extreme poverty and improving human development. They could also be used as collateral for assessing loans at the micro level. From a macroeconomic perspective, remittances could bridge the inequality gap and lower the Gini coefficient particularly if they flow to the rural areas. Remittances also improve the overall productivity of the receiving economy when used for better nutrition and healthcare. They are also a key source of foreign exchange earnings which help to bridge the domestic savings gap (Freund and Spatafora, 2005). In some countries like Tonga, Haiti, Tajikistan, Krygz Republic, remittances makes up nearly 30 per cent of the GDP thus helping to build resilience to shocks by absorbing the impact of external economic shocks and acting as a major counterbalance when capital flows weaken (World Bank, 2019). This underscores the importance of remittances as a catalyst to development and welfare of the individual’s family, community and country of origin.
On the flip side, some studies such as Amuedo-Dorantes (2014) have shown that remittances can influence the recipients to remain dependent and unproductive thus inhibiting economic growth, decreasing exports and reducing the country’s competitiveness in world markets. In other words, remittances can discourage youths from engaging in productive employment due to the cheap funds received from their relatives outside the country. In some developing countries such as Nigeria, remittances have been mismanaged and partly responsible for youth involvement in drugs and narcotics. The notion that relatives in diaspora are wealthy and that they would always be available to support their lifestyles fuels irresponsible behaviour.

4 Issues in the Compilation and Analysis of Remittances in BPM6
Figure 1. Trends in Remittances
Source: World Bank Migration and Remittances Data Portal
This paper looks at the issues in compilation of remittances particularly with respect to Balance of Payments Manual sixth edition (BPM6). To this end, the paper is structured into 5 sections with section 1 as the introduction, section 2 discusses conceptual issues and Section 3 looks at the treatment of remittances in BPM6 and compares this with BPM5. Section 4 identifies a few issues in the analysis of remittances data while section 5 concludes the paper.
2. Conceptual Issues
2.1 The Balance of Payments
Remittances are an integral part of one of the major macroeconomic accounts called the Balance of Payment (BOP). The BOP is an account that records transactions between residents of a country with residents of other countries. The main factor that determines if a transaction is captured in the BOP is the issue of residency. If it is established that the transaction is between a resident and a non-resident, then the transaction is recorded in the BOP. The BOP is divided into three different accounts namely the current, capital and financial accounts. The current account records import and export of goods and services between residents and non-residents. It also consists of a primary income account which records the returns that accrues to institutional units for their contribution to the production process or for the provision of financial assets and renting natural resources to other institutional units. The primary income could arise as proceeds of the production process or compensation of employees, and could also be associated with the ownership of financial and other non-produced assets such as property income, dividends, reinvested earnings and interest. The secondary income account is also a part of the current account, and captures further redistribution of income through current transfers such as governments or charitable organisations.
The capital account is defined in section 13.1 of the BOP manual as the capital transfers receivable and payable between residents and non- residents and the acquisition and disposal of non-produced, nonfinancial assets between residents and

Issues in the Compilation and Analysis of Remittances in BPM6 5
non-residents. Non-produced, non-financial assets include natural resources; contracts, leases and licenses; and marketing assets such as trademarks, brand names, logos and domain heads. Capital transfers are transfers in which ownership of an asset changes from one party to another; or which obliges one party or the other to acquire or dispose of an asset; or where a liability is forgiven by the creditor. Transfers generally infer the provision of goods, services, financial assets, or other non-produced assets from one unit to another without the corresponding return of an asset of economic value. This differentiates it from an exchange which is a transaction that requires the corresponding return of an asset of economic value. Household to household capital transfers may be included in the capital account as personal remittances if they are significant.
The financial account records the transactions that have to do with financial assets and liabilities between residents and non-residents. Entries in the financial account may be corresponding to entries in the goods and services, income, capital account or other financial account entries.
2.2 Balance of Payments and International Investment Position Manual
The Balance of Payments and International Investment Position Manual, 6th edition (BPM6), provides guidance to IMF member countries on the compilation of BOP and IIP statistics. The Manual also aims to enhance comparability of data across countries through the promotion of standards adopted internationally. The BPM6 manual was released in 2009 as an update to BPM5 to reflect changes that had taken place in the international economic and financial environment and to coincide with the update of the System of National Account SNA from SNA 1993 to SNA 2008. The BPM6 has a high degree of continuity with BPM5 but provides more clarifications on issues that were identified with BPM5. It also identifies stronger theoretical foundations and linkages to other macroeconomic statistics particularly SNA and the Monetary and Financial Statistics (MFS)
2.3 Remittances
International remittances are cross-border earnings, goods, or funds transferred by migrants to their relatives, friends or acquaintances in their home countries. They represent household income from foreign economies arising mainly from the temporary or permanent movement of people to those economies (IMF, 2009). The remitter is usually an individual who has migrated to a country other than his country of origin as a resident, seasonal or short-term worker. By definition therefore, the question of residency where residence of each institutional unit is the economic territory with which it has the strongest connection, expressed as its center of predominant economic interest, does not apply to the issue of remittances. Indeed as noted, BOP account definition of remittances are somewhat broader than those resulting from movement of persons because they are not based on the concepts of migration, employment or family relationships. They consist of funds and non-cash items sent by individuals who have migrated to a new economy and become residents there as well as the net compensation of border, seasonal or other short-term workers who are employed in an economy in which they are not resident. Remittances could also be compensation of workers employed by non-resident employers in the home country of origin. According to Levitt (1998), remittances are not only money but

6 Issues in the Compilation and Analysis of Remittances in BPM6
ideas, identities, practices, and social capital that flow from receiving to sending countries. They make up a significant part of international capital flows in a country and could be a life wire to the beneficiaries who often need it for their sustenance. Global remittance flows have increased rapidly in recent years and are considered by many governments as being of high policy interest particularly in analysing their impact on economic development and security.
2.4 Channels and Types of Remittances
Remittance transactions involve a sender, a recipient, intermediaries in both countries, and the payment interface used by the intermediaries. These comprise the remittance channel and range from the formal to the informal. Formal channels are those officially authorised to operate in the money transfer business and may include commercial banks, post offices, non-bank financial institutions, bureaux de change and money transfer operators like Western Union and MoneyGram (Freund and Spatafora, 2005). Formal remittances are eased by a well-developed financial infrastructure and the availability of financial products and incentives. However, the informal remittances are transferred through channels other than the formal one, usually through human couriers such as friends and family members or other carriers (IMF, 2008). Money or goods taken by the migrant on seasonal visits to their homeland and funds sent via unlicensed money transfer operators using traditional networks such as hawala are also classified as informal remittances. The informal channel is more popular as it is cheaper and requires little documentation. According to World Bank (2011), more than 50.0 per cent of the remittances to Sub-Saharan Africa is through the informal channel. In between the formal and informal channels, semi-formal channels also exist. These include formal institutions that provide money transfer services outside the purview of the regulatory authority. The choice of channel to be used depends on a number of factors which include the institutional infrastructure available in the sending and receiving economies, ease of access to formal financial institutions, cost associated with the use of the channels and the demographic characteristics of the sender and receiver.
Remittances are categorized as cash or in-kind. Cash remittances are usually in foreign currency and are sent through the formal or the informal channels while in-kind remittances are items sent by the diaspora other than cash, which may include clothing, food items, jewelleries, electronics, books, etcetera. There is also social remittance, which are voluntary services rendered by the diaspora to home countries.
3. Treatment of Remittances
Compilation of remittance aggregates can be a very tricky job because no single data item in the balance of payments framework comprehensively captures transactions in remittances. BPM6 revises the treatment of remittances in BPM5. The following outlines the differences in treatment of remittances.
3.1 Remittances in BPM5
Under BPM5, the line items that relate to remittances are compensation of employees, workers remittances, and migrants transfers (Reinke, 2007).

Issues in the Compilation and Analysis of Remittances in BPM6 7
Compensation of employees is a component of income in the BPM5 framework while workers remittances are a component of current transfers. Both income and current transfers are a part of the current account. Migrants transfers are a part of capital transfers which is found in the capital account. It is related to all the financial and non-financial assets that migrants take to the host country when visiting or when they finally return to their home country (Balance of Payments Manual, 5th Edition). Under BPM6, they are no longer considered as Balance of Payments transactions. Compensation of employees records the reward for work done while workers remittances and migrants transfers are transfers which are provisions of a resource, whether cash or in kind, without a quid pro quo. The Balance of Payments textbook makes a clear distinction between workers remittances and current transfers. “Workers remittances consist of goods or financial instruments transferred by migrants living and working in new economies to residents of the economies in which the migrants formerly resided”(IMF, 1996). Workers remittances arise form paid employment while transfers of self-employed migrants are current transfers.
3.2 Treatment Remittances in BPM6
Remittances are mainly derived from two items in the BOP framework: income earned by workers in economies where they are not resident (compensation of employees) and personal transfers from residents of one economy to residents of another (IMF, 2008). These are the standard items in the BOP framework. All other definitions are supplementary items which compiling countries are not required to compile but are encouraged to do. These supplementary items include personal remittances, total remittances, and total remittances and transfers to non-profit institutions serving households.
3.2.1 Standard Component
Section 11.10 of the BPM6, defines compensation of employees as remuneration given in exchange for labour input to the production process contributed by an individual in an employer-employee relationship with the enterprise when the employer and employee are resident in different economies. This implies that if the producing unit or the employer is resident, then compensation of employees is the total remuneration, either in cash or in kind, paid to an employee that is residing in another economy. The status of a worker has important implications for the international accounts. Section 11.11 further clarifies that an employer-employee relationship exists when there is a voluntary agreement, either formal or informal, whereby an individual works for an entity in return for remuneration in cash or kind. The remuneration could be based on either time spent at work or some other indicator such as the production of a desired output, especially in the case of a service contract. This definition may however pose difficulties in interpretation particularly where services are concerned. When an entity decides to purchase a service from a self-employed worker rather than hire an employee, the payment would then constitute a purchase of services rather than compensation of employees. Purchase of services is well treated in chapter 10 and does not constitute part of remittances. Criteria for defining employer-employee relationships include:
The right to control or to direct what should be done and how it should be done is vested in the employer (however, this may also apply to the purchase of services albeit in a limited sense).

8 Issues in the Compilation and Analysis of Remittances in BPM6
If the individual is solely responsible for social contributions, this indicates he is a self-employed service provider. Payment by the employer shows that an employer-employee relationship exists.
Payment of taxes on the provision of services by the individual is an indication that the individual is a self-employed service provider.
Personal transfers is a new standard component in the BPM6 and replaces workers remittances in BPM5. However, workers remittances are included as a supplementary item in BPM6. Personal transfers are included in the computation of remittances and consists of all current transfers in cash or in kind, made or received from a resident household to a non-resident household. This is independent of the source of income, and the relationship between the households. It usually originates from migrants sending resources back to their country of origin to support their relatives back home. The concept is not based on either migration or employment status, is simpler and avoids some of the problems and inconsistencies of the previous concept in BPM5 (Oputa, 2019).
In determining whether a personal transfer is involved, the connection to the residence status of the person concerned is important. There are also some personal transfers which might be financial and are excluded from the computation of remittances. Investment in real estate for instance is treated as a direct investment in the country of origin and not as a remittance. If however, some relatives of the remitter live in the property, and do not pay rent or pay less than the market value, then the estimated market price of the lease or the difference between the paid amount and the market prices are recorded as remittances, while the amount paid by relatives for the rent is recorded as income from direct investment.
3.2.2 Personal Remittances
Personal remittances are the net compensation of employees working in economies in which they are not resident, current and capital transfers in cash or kind between resident and non-resident households.
3.2.3 Total Remittances
Total remittances includes personal remittances and social benefits. By implication, it includes all household income obtained from working abroad. Now in the computation of what constitutes total remittances, compensation of employees less expenses related to border, seasonal, and other short term workers is taken from the primary account. Added to this is a personal transfer which is taken from the secondary account. Capital transfers between households and social benefits are also included in the computation of remittances. Social benefits include benefits payable under social security funds and pension funds either in cash or kind.
Total Remittances is therefore captured as TR=NCE +PT+KT+SB…..(1)
NCE = CE – TT-TSC……….(2)
Where TR is total remittances
NCE is net compensation of employees
CE is compensation of employees
TT is travel and transportation related to temporary employment

Issues in the Compilation and Analysis of Remittances in BPM6 9
TSC is taxes and social contributions related to temporary employment
PT is personal transfers
KT is capital transfers between households
SB is social benefits
3.2.4 Total Remittances and Transfers to Non-Profit Institutions Serving Households
This includes Total Remittances and all current and capital transfers to Non-profit Institutions Serving Households (NPISHs) from any sector of the sending economy i.e households, corporations, governments, and non-profit institutions. According to the Remittances Compilation Guide (RCG), “it includes all transfers benefitting households directly or indirectly through NPISHs as well as the earnings of short term workers abroad”. It could thus include donations, private and official aid, scholarships. This is the broadest definition of remittances, but is very challenging due to the identification of NPISHs from the sending economy (IMF, 2009)
3.3 Some Identified Differences between BPM5 and BPM6
Table 1 below highlights the major differences between BPM5 and BPM6 as far as compilation of remittances is concerned.

10 Issues in the Compilation and Analysis of Remittances in BPM6
Differences in Treatment of Remittances in BPM5 and BPM6 Table 1
Description BPM6 Treatment BPM5 Treatment
1 Migrants personal effects Are not classified as transactions and so are no longer included in goods, nor elsewhere in the international accounts; see BPM6 10.22 (b).
Classified as transactions under goods
2 General merchandise Goods bought abroad for own use or to give away that exceed customs thresholds are included in general merchandise; see BPM6 10.19.
In BPM5, these goods are recorded in travel; see BPM5 212 and 250
3 Transport services Referred to as transport services BPM6 10.61 Referred to as transportation
4 Transport (Passenger) air, sea, other modes of transport
Amount payable by border, seasonal, and other short-term workers clearly delineated because it is needed as a supplementary item in the compilation of personal remittances BPM6 12.51 and appendix 5
“payable by border, seasonal, and other short-term workers” Captured as a block amount under passenger
5 Travel (business) Acquisition of goods and services by border, seasonal, and other short-term workers clearly delineated because it is needed as a supplementary item in the compilation of personal remittances BPM6 12.51 and appendix 5
“acquisition of goods and services by border, seasonal, and other short-term workers” captured as a block amount under travel (business)
6 Services Several reclassifications introduced in BPM6 Several reclassifications
7 Primary income Renamed from income to be consistent with SNA 2008 BPM6 11.1
Referred to as income
8 Primary income Rent and taxes/subsidies on products and production are included in primary income BPM6 tables 11.1, 11.2, 11.3
Rent and taxes/subsidies on products and production are not explicitly captured as primary income
9 Compensation of Employees The employer-employee relationship is clarified to distinguish between compensation of employees and payment for services in BPM6 11.12.
A clarification to BPM5 and in accordance with its general principles.
10 Investment income direct investment income is broken down by type of FDI relationships; see BPM6 6.37.
Direct investment is not broken down
12 Investment income in bpm6, dividends on direct investment are recorded when the shares go ex-dividend; see BPM6 11.31;
Dividends on direct investment are recorded when payable; see BPM5 282, 284.
13 Investment income BPM6 describes super-dividends, which should be recorded as withdrawals of equity, direct investor in direct investment enterprises not primary income; see BPM6, 11.27.
The term 'super-dividends' is not discussed in BPM5, but the treatment in bpm6 is in line with the general principals of BPM5 (notably direct investment enterprises in direct investor (reverse investment) liquidating dividends; see BPM5 290).
14 Taxes and subsidies on products and production
Classified as primary income BPM6 11.90-11.93 Classified as secondary income (current transfers)
15 Secondary income The term secondary income is introduced to be consistent with the SNA and is clarified in BPM6 12.1 - 12.4. More detailed types of current transfers are introduced on a supplementary balance on secondary income (+ surplus; - deficit) basis; see BPM6 12.21 - 12.24.
Called current transfers
16 Refunds of taxes to taxpayers Refunds of taxes to taxpayers are treated as negative taxes, i.e., the amount of taxes is reduced by tax refunds; see BPM6 12.21.
In BPM5, tax refunds are recorded under government transfers; see BPM5 299.
17 Current taxes on income, wealth etc
Of which payable by border, seasonal, and other short-term workers clearly delineated as a supplementary data used in the compilation of personal remittances BPM6 12.51 and appendix 5
“payable by border, seasonal, and other short-term workers” Captured as a block amount under current taxes on income, wealth, etc

Issues in the Compilation and Analysis of Remittances in BPM6 11
4. Issues in the Compilation and Analysis of Remittances
Several issues have been identified as being inimical to the compilation of remittances. These are discussed as interpretation of concepts, Migration statistics, digital currencies, identification of transaction channels, Lack of Coordination Between Regulatory Authorities, Lack of Appropriate Framework for Harnessing Remittances and Low Capacity in BOP Compilation Especially in Developing Countries.
4.1 Interpretation of Concepts
Some clauses in BPM6 are not very clear. This includes the treatment of social contributions in remittances compilation and the question of residence. This definition creates some ambiguity in practice. For instance, if an employee (resident of the host economy) of the US embassy in Nigeria (non-resident of the host economy) is paid compensation, the transaction is easily captured as a BOP item under compensation of employees. Now if this same employee sends part of the compensation to his wife’s account, should it be captured as a remittance or not? Section 11.14 states that because embassies, consulates, military bases and so on are considered extra-terrestrial to the economies to which they are located, the compensation receivable by local staff of these institutional entities is classified as payable to resident entities by non-resident entities. Compensation receivable by
17 Social contributions Of which payable by border, seasonal, and other short-term workers clearly delineated as a supplementary data used in the compilation of personal remittances BPM6 12.51 and appendix 5
“payable by border, seasonal, and other short-term workers” captured as a block amount under social contributions
18 Personal transfers BPM6 introduces the concept of personal transfers, which is broader than workers' remittances (in both BPM5 and BPM6) because it includes all transfers between individuals, not just those of migrants who are employed in new economies and considered residents there; see BPM6 12.47 - 12.51 and appendix
Workers remittances used rather than personal transfers
19 Miscellaneous current transfers (D545)
Of which current transfers to NPISHS (D545) is introduced as a supplementary data related to current transfers of NPISHs used to compile personal remittances BPM6 12.51
Included as part of “other current transfers of other sectors” in BPM5
20 Migrants transfers The personal effects, financial assets, and liabilities of persons changing residences are no longer recorded as capital transfers BPM6 13.3, 9.19-9.20and 10.22b
Recorded under capital transfers BPM5 352-353
21 Capital transfers Supplementary data on capital transfers between households is needed to compile personal remittances BPM6 12.48 and appendix 5
No personal remittances in BPM5
22 Capital transfers Supplementary data on capital transfers between households is needed to compile personal remittances BPM6 12.48 and appendix 5
No personal remittances in BPM5
Source: Extracted From IMF Statistics Department, BPM5 to BPM6 Conversion Matrix (2008)

12 Issues in the Compilation and Analysis of Remittances in BPM6
employees from international organisations which are extraterritorial entities, represents receipts from non-resident entities.
Again if I work in the US but am not resident there (by reason of the definition of residency, I am a seasonal or short term worker) so I get compensation of employees which is recorded as a BOP item. Suppose I send part of my income home, does this mean it is recorded as a BOP item twice? The point I am trying to make here is that if it is recorded in the BOP as compensation of employees then it cannot still be recorded as personal transfers. This would amount to double counting of the transaction.
Social contributions are deducted in computing remittances. Section 11.22 of BPM6 defines employer’s social contributions as payable by employers to social security funds or other employment related social insurance schemes to secure social benefits for their employers. These include pension contributions, life insurance, health insurance, education allowance, medicals and so on. These are to be deducted from the total remittances on the assumption, so to speak, of it being paid in the country of residence of the institutional unit but in reality this may not be the case. In practice therefore the social contributions is actually a remittance where the employer is non-resident, and should be recorded as such, not deducted from the compensation of employees.
4.2 Migration Statistics
Problems of obtaining remittance data can arise in neighbouring countries particularly where the number of seasonal or illegal workers is large. Illegal workers tend to shy away from censuses or from the formal modes of bank transfers because of “know your customer” requirements and also the fear of apprehension by security personnel. It thus becomes hard to track these remittances or even estimate remittances through informal channels. When migrant or short term workers visit home frequently, they may decide to take the money or goods themselves or send them through a friend. In addition, poor data base of migrants makes it difficult to conduct survey on informal remittances.
4.3 Identifying Transaction Channels
Remittance transaction channels are wide and varied and the choice of channel depends on a number of factors including cost of sending money abroad, speed of delivery, information technology infrastructure at the senders and recievers locations, hidden costs in foreign exchange transactions, safety of the funds and so on. Compilers of remittance statistics may however find it difficult to know all sources especially the informal sources through which remittances are sent. Remittance service providers are also quite innovative and new transaction channels are being developed consistently. There are some money transfer businesses in all parts of the world that are often not registered or licensed and are not subject to any form of regulation. Reliable data and information on these channels are often lacking making it hard to track remittances through these channels.
In addition, as noted by the RCG 3.24, identifying NPISHs from partner economies may prove problematic particularly because the definition is “partially based on identifying the sector of the transacting party in the partner economy”.

Issues in the Compilation and Analysis of Remittances in BPM6 13
4.4 Lack of Coordination between Regulatory Authorities
Different channels pose different challenges to compilers and the ease with which data may be obtained from these various channels depends on the institutional and legal environment governing remittance transactions and data compilation. A poor legal and communication technology infrastructure hinders the regulation of some entities and by extension reporting of remittances data. Still there is sometimes overlap of responsibilities between government institutions with poor coordination thus data reported are divergent leaving the compiler and analyst confused. In addition, a clear assignment of responsibility is necessary to know which agency is to generate remittance statistics whether the Central Bank or the Bureau for Statistics.
4.5 Lack of Appropriate Framework for Harnessing Remittances
Lack of attention to remittance statistics could emanate from the inability of most developing countries to develop appropriate framework for tapping the potentials of remittances for growth and development. In addition, most of the IMTOs don’t have their own outlets for remitting monies but rather use the platforms of banks. This adds to the cost of remittances thus discouraging remitters from using formal channels and preferring to go through informal channels.
4.6 Low Capacity in BOP Compilation especially in Developing Countries
Due to the complications in compiling BOP numbers, several developing countries are yet to fully migrate to the use of BPM6. Nigeria, for instance is still using BPM6 alongside BPM5 in carry out its analysis. The use of different approaches to compilation renders it hard to compare remittances across countries. This problem will be accentuated with the move to BPM7 when several countries are still struggling to migrate fully to BPM6.
4.7 Digital Currencies
The growing need for safer, secure and quicker international money transfers has increased the need for digital payments and receipts globally. Digital currencies offer an obvious advantage for remittances as an alternative to the expensive and burdensome money transfer system currently available. However, the low level of financial inclusion and the cyber security threats digital currencies are exposed to invigorate the reluctance with which regulatory authorities are willing to accept the use of digital currencies within their ambit.
5. Conclusion
Remittances remain a stable and sustainable source of foreign exchange earnings too huge to be ignored. Its benefits far outweigh the few disadvantages that have been pointed out. On the whole, remittances could salvage a whole family, community, or economy if used for the right purposes. Being able to correctly identify the channels through which remittances flow and converting them to productive uses through

14 Issues in the Compilation and Analysis of Remittances in BPM6
formalisation of remittances and proper financial literacy could boost the economy and must therefore be pursued vigorously. This implies that regulatory agencies must also work together to achieve harmonisation in recording remittances. It is my hope that this paper would have contributed to that in a small way.
References
Amuedo-Dorantes C., (2014) The Good and the Bad in Remittance Flows. IZA World of Labor 2014: 97, doi: 10.15185/izawol.97, wol.iza.org 11.
Freund, C., & Spatafora, N. (2005). Remittances: Transaction Costs, Determinants, and Informal Flows.
IMF (1996), Balance of Payments Textbook.
IMF (2008), Chapter 2 Understanding Remittances: Demography, Transaction Channels, and Regulatory Aspects in International Transactions in Remittances: Guide for Compilers and Users, https://www.imf.org/external/np/sta/bop/2008/rcg/ pdf/ch2.pdf.
IMF(2009), International Transactions in Remittances: Guide for Compilers and Users, Washington D.C.
IMF, (2009), Balance of Payments and International Investment Position, Sixth Edition (BPM6) Manual.
Levitt, P. (1998). Social Remittances: Migration Driven Local-Level Forms of Cultural Diffusion. The International Migration Review, 32(4), 926-948. doi:10.2307/2547666.
Oputa,N. C. (2019) Measurement of Remittances, Being a presentation made at the International Training Institute (ITI) of the Central Bank of Nigeria (CBN), Abuja, 10-21 June, 2019.
Reinke J. (2007), Remittances in the Balance of Payments Framework: Current Problems and Forthcoming Improvements, Seminar on Remittance Statistics, Center of Excellence in Finance, Slovenia, February 26 to March 2, 2007.
Statistics Department, IMF (2008), BPM5-to-BPM6 Conversion Matrix, BOPCOM-08/10B, Twenty-First Meeting of the IMF Committee on Balance of Payments Statistics Washington D.C.
World Bank (2019), Migration and Remittances Data, available at https://www.worldbank.org/en/topic/migrationremittancesdiasporaissues/brief/migration-remittances-data.

ISSUES IN THE COMPILATION AND ANALYSIS OF REMITTANCES IN BPM6
• BLESSING ADADA GAIYA
• CENTRAL BANK OF NIGERIA
• EXTERNAL STATISTICS CONFERENCE ON BRIDGING MEASUREMENT CHALLENGES AND ANALYTICAL NEEDS OF EXTERNAL STATISTICS: EVOLUTION OR REVOLUTION?
• JOINTLY ORGANIZED BY IRVING FISHER COMMITTEE ON CENTRAL BANK STATISTICS, EUROPEAN CENTRAL BANK, BANCO DE PORTUGAL LISBON, PORTUGAL,
• 17 - 18 FEBRUARY 2020

OUTLINE
• Introduction• Conceptual Issues
• Balance of Payments• Balance of Payments and International Investment Position
Manual• Remittances• Channels and Types of Remittances
• Treatment of Remittances• Some Identified Differences Between BPM5 and BPM6• Issues in Compilation and Analysis of Remittances• Conclusion

INTRODUCTION
• Remittances are a rapidly growing and stable source of foreign exchange inflow.
• The World Bank records that in 2018, global remittances flow grew by 9.0 per cent to US$689.00 billion while remittances to low and middle income countries grew by 9.6 per cent to $529.00 billion dollars, making it the largest source of foreign exchange earnings in low and middle income countries except China.
• Nigeria is the 6th remittance receiving country globally after India, China, Mexico, the Philippines, and Egypt. The importance of remittances from Nigerians in Diaspora can therefore not be overstated.

INTRODUCTION
•
Figure 1. Trends in Remittances
Source: World Bank Migration and Remittances Data Portal

INTRODUCTION
• Remittances are beneficial in so many ways
• serve as an additional disposable income
• a significant source of reducing extreme poverty and improving human development.
• could be used as collateral for assessing loans at the micro level.
• From a macroeconomic perspective, remittances could bridge the inequality gap and lower the Gini coefficient particularly if they flow to the rural areas.
• improve the overall productivity of the receiving economy when used for better nutrition and healthcare.
• are a key source of foreign exchange earnings which help to bridge the domestic savings gap.
• On the flip side, some studies such as Amuedo-Dorantes (2014) have shown that remittances can influence the recipients to remain dependent and unproductive thus inhibiting economic growth, decreasing exports and reducing the country’s competitiveness in world markets.

BALANCE OF PAYMENTS
.
Remittances are an integral part of one of the major macroeconomic accounts called the Balance of Payment (BOP).
The BOP is an account that records transactions between residents of a country with residents of other countries.
The main factor that determines if a transaction is captured in the BOP is the issue of residency
The BOP is made up of three accounts: current, capital and financial account

BALANCE OF PAYMENTS AND INTERNATIONAL INVESTMENT POSITION MANUAL
•
The Balance of Payments and International Investment Position Manual, 6th edition (BPM6), provides guidance to IMF member countries on the compilation of BOP and IIP statistics.
The Manual also aims to enhance comparability of data across countries through the promotion of standards adopted internationally.
The BPM6 manual was released in 2009 as an update to BPM5 to reflect changes that had taken place in the international economic and financial environment and to coincide with the update of the System of National Account SNA from SNA 1993 to SNA 2008.

REMITTANCES
•
International remittances are cross-border earnings, goods, or funds transferred by migrantsto their relatives, friends or acquaintances in their home countries. They representhousehold income from foreign economies arising mainly from the temporary orpermanent movement of people to those economies (IMF, 2009).
They consist of funds and non-cash items sent by individuals who have migrated to a neweconomy and become residents there as well as the net compensation of border, seasonalor other short term workers who are employed in an economy in which they are notresident. Remittances could also be compensation of workers employed by non-residentemployers in the home country of origin.
According to Levitt (1996), remittances are not only money but ideas, identities, practices,and social capital that flow from receiving to sending countries.

TREATMENT OF REMITTANCES
•
Under BPM5, the line items that relate to remittances are compensation of employees, workersremittances, and migrants transfers (Reinke, 2007).
Under BPM6 standard treatment, Remittances are mainly derived from two items in the BOPframework: income earned by workers in economies where they are not resident(compensation of employees) and personal transfers from residents of one economy toresidents of another (IMF, 2008).
Personal remittances are the net compensation of employees working in economies in whichthey are not resident, current and capital transfers in cash or kind between resident and non-resident households.
Total remittances includes personal remittances and social benefits. By implication, it includes allhousehold income obtained from working abroad.
Total Remittances and Transfers to Non-Profit Institutions Serving Householdsincludes “ all transfers benefitting households directly or indirectly through NPISHs as well as theearnings of short term workers abroad” (Remittances Compilation Guide).

DIFFERENCES BETWEEN TREATMENT OF REMITTANCES IN BPM5 AND BPM6
•
Description BPM6 Treatment BPM5 Treatment
1 Migrants personal effects Are not classified as transactions and so are no longer included in goods, nor elsewhere in the international accounts; see BPM6 10.22 (b).
Classified as transactions under goods
2 Travel (business) Acquisition of goods and services by border, seasonal, and other short term workers clearly delineated because it is needed as a supplementary item in the compilation of personal remittances BPM6 12.51 and appendix 5
“acquisition of goods and services by border, seasonal, and other short term workers” captured as a block amount under travel (business)
3 Compensation of Employees The employer-employee relationship is clarified to distinguish between compensation of employees and payment for services in BPM6 11.12.
A clarification to BPM5 and in accordance with its general principles.
4 Social contributions Of which payable by border, seasonal, and other short term workers clearly delineated as a supplementary data used in the compilation of personal remittances BPM6 12.51 and appendix 5
“payable by border, seasonal, and other short term workers” captured as a block amount under social contributions
5 Personal transfers BPM6 introduces the concept of personal transfers, which is broader than workers' remittances (in both BPM5 and BPM6) because it includes all transfers between individuals, not just those of migrants who are employed in new economies and considered residents there; see BPM6 12.47 - 12.51 and appendi
Workers remittances used rather than personal transfers
6 Miscellaneous current transfers (D545) Of which current transfers to NPISHS (D545) is introduced as a supplementary data related to current transfers of NPISHs used to compile personal remittances BPM6 12.51
Included as part of “other current transfers of other sectors” in BPM5
7 Migrants transfers The personal effects, financial assets, and liabilities of persons changing residences are no longer recorded as capital transfers BPM6 13.3, 9.19-9.20and 10.22b
Recorded under capital transfers BPM5 352-353
8 Capital transfers Supplementary data on capital transfers between households is needed to compile personal remittances BPM6 12.48 and appendix 5
No personal remittances in BPM5
9 Capital transfers Supplementary data on capital transfers between households is needed to compile personal remittances BPM6 12.48 and appendix 5
No personal remittances in BPM5
1 TableNote
Source: IMF BPM5 to BPM6 Conversion Matrix

ISSUES IN THE COMPILATION AND ANALYSIS OF REMITTANCES
•
Interpretation of Concepts
Migration Statistics
Identifying Transaction Channels
Lack of Coordination between Regulatory Authorities
Lack of Appropriate Framework for Harnessing Remittances

CONCLUSION
•
Remittances remain a stable and sustainable source of foreign exchange earnings too huge to be ignored.
Its benefits far outweigh the few disadvantages that have been pointed out. On the whole, remittances could salvage a whole family, community, or economy if used for the right purposes.
Being able to correctly identify the channels through which remittances flow and converting them to productive uses through formalisation of remittances and proper financial literacy could boost the economy and must therefore be pursued vigorously. This implies that regulatory agencies must also work together to achieve harmonisation in recording remittances.
It is my hope that this paper would have contributed to that in a small way.

This Photo by Unknown Author is licensed under CC BY-NC-ND

1/1
IFC Conference on external statistics "Bridging measurement challenges and analytical needs of external statistics: evolution or revolution?", co-organised with the Bank of Portugal (BoP) and the European Central Bank (ECB)
17-18 February 2020, Lisbon, Portugal
International integration and statistical challenges: the intersection between policy and measurement needs1
Paul Austin, Gabriel Quirós-Romero and Jennifer Ribarsky,
International Monetary Fund
1 This presentation was prepared for the meeting. The views expressed are those of the authors and do not necessarily reflect the views of the BIS, IFC, BoP, ECB or the central
banks and other institutions represented at the meeting.

1
International Integration and Statistical Challenges. The Intersection between Policy and Measurement Needs
Paul Austin, Gabriel Quirós-Romero and Jennifer Ribarsky1
Abstract
At the core of the International Monetary Fund’s (IMF) mandate is the stability of the international monetary system and promoting sustainable economic growth. This requires understanding and monitoring external—large current account and international investment position—imbalances. In this context, distinguishing between healthy and excessive imbalances is key to the IMF’s surveillance operations and to its global and country policy advice on financial stability. Among the key challenges is how multinational enterprises (MNEs) impact measurement and interpretation of the international accounts. Growing international integration in trade and finance—with MNEs as key drivers—raise the challenges to the international accounts. In the past, the impact of MNEs on the international accounts was mainly through transfer pricing—impacting the allocation between trade in goods and services versus income (gross domestic product (GDP) versus gross national income (GNI)). Nowadays, the growth of MNEs has also increasingly impacted the financial account, including through the complexity of balance sheet structures, such as the use of special purpose entities (SPEs) and their significant role in foreign direct investment (FDI) positions, and the ease of shifting intangible capital across borders. What statistics are needed for effective policy analysis? This paper will revisit the statistics needed and will look into potential future directions for the next generation of international statistical standards.
Keywords: Globalization, Multinational Enterprises, Balance of Payments, International Investment Position, Measurement
JEL classification: F40, F60
1 International Monetary Fund, Statistics Department. The views expressed are those of the authors
and do not necessarily represent the views of the International Monetary Fund (IMF), its Executive Board, or IMF management.

2
Contents International Integration and Statistical Challenges. The Intersection between
Policy and Measurement Needs ................................................................................................ 1
Introduction ............................................................................................................................................... 3
1. Activities of MNEs ........................................................................................................................... 3
2. IMF Policy Needs ............................................................................................................................. 7
3. How can international accounts meet emerging policy analysis needs? ................ 11
Special Purpose Entities ............................................................................................................. 12
MNEs and GVCs ............................................................................................................................ 14
Other statistical considerations .............................................................................................. 15
4. Final comments .............................................................................................................................. 15
References ................................................................................................................................................ 17

3
Introduction
Since its inception, the International Monetary Fund (IMF) has had a compelling interest in developing guidelines for the compilation of consistent and internationally comparable balance of payments statistics in support of its primary role of ensuring the stability of the international monetary system. This requires understanding and monitoring external—large current account and international investment position—imbalances. In this context, distinguishing between healthy and excessive imbalances is key to the IMF’s surveillance operations and to its global and country policy advice on financial stability. While there has been substantial improvement in data availability, users of the data point to an increased disconnect between data and economic linkages. Among the key factors are globalization and the growing international integration of trade and finance—with multinational enterprises (MNEs) as key drivers—bringing new challenges in measuring and interpreting the international accounts.
Globalization usually refers to the increased economic integration of world economies. Over the last decades the trend in reducing trade barriers has led to an increase in cross-border trade. Production chains now span across countries allowing firms to organize their processes for opportunities to maximize production efficiency. Furthermore, there has been an increase in financial flows due to liberalization of domestic and foreign capital markets. All this is facilitated by advancement in science and technology allowing for reduction in the cost of communication and transport.
The update of the Balance of Payments and International Investment Position, 6th edition (BPM6), published in 2009, was made in the context of such progressive economic and financial integration. A decade after its publication, the underlying conceptual framework of BPM6 remains robust, but the continuous, fast-evolving economic and financial integration makes it advisable to review the framework. At the heart of the statistical challenges are activities of MNEs, profit shifting, the growing importance of intangible assets, innovative cross-border payments, intellectual property rights, and special purpose entities (SPEs).
This paper discusses what statistics are needed for effective policy analysis and what this means for the review of the next generation of international statistical standards. Section 1 briefly describes the activities of MNEs and how they impact the statistics. Section 2 focuses on the resulting policy needs of the IMF and its membership, and what types of response statistical methodology and compilation practises can provide. Section 3 discusses key areas in the international accounts—the balance of payments and international investment position—that would be reviewed. Section 4 concludes.
1. Activities of MNEs
MNEs are key drivers in the growing international integration in trade and finance. MNEs aim to maximize production efficiency across boundaries and their company-wide global after-tax profits, not necessarily their profits in each of the countries in which they operate. For these reasons, MNE groups often arrange for a wide variety of services to be shared within the group, or intra-group services. Such arrangements depend on the organizational structure of the group and the kind of

4
business but in general they may include services such as planning, coordination, budgetary control, financial services and advice, accounting, auditing, legal, computer services, research and development (R&D) centers, buying, distribution, marketing and human resources. Artificial transfer pricing (i.e., the non-market price at which related parties of the global MNE transact with each other) can result in a misalignment between the location where the firm records its financial transactions and the actual location of production. This has increased the complexity of compiling cross border economic statistics, not least because of the challenges of disaggregating production activities and consolidated balance sheets on a country-by-country basis.
Transfer pricing can cause measurement distortions in the international accounts. MNEs can manipulate transfer prices in order to shift profits to low tax regions. To remedy this, international tax guidelines have tried to enforce an arm’s length principle (i.e., the amount charged by one related party to another for a given good or service must be the same as if the parties were not related, i.e. a market price must be charged). The use of the arm’s length principle is an attempt to provide a consistent basis for determining the income and expenses– and therefore profit– of a company or permanent establishment that is part of an MNE group that should be taken into account within a tax jurisdiction. Such guidelines have been developed to help avoid the taxation of the same item of income by more than one tax jurisdiction. Such double or multiple taxation can create an impediment to cross-border transactions in goods and services and the movement of capital.2 However, despite these guidelines, MNEs have leeway because intra-group transactions often consist of specialized components or intellectual property where it can be difficult to establish a market price.
Statisticians rely on data reported by MNEs that follow tax and legal requirements. To the extent that MNEs overstate or understate the economic value of a transaction through misleading transfer prices, there is a misallocation between statistics on trade in goods and services versus statistics on income. For example, if a parent company in a high-tax country sets an artificially low price on its exports of intermediate goods to an affiliate in a lower-tax country and an artificially high price on its overseas affiliate’s exports of final goods back to the parent, it will artificially lower exports, raise imports and lower gross domestic product (GDP) in the higher-tax country (and artificially raise GDP in the low-tax country). However, because the earnings of MNEs reflect income from foreign (including reinvested earnings)3 as well as domestic operations, gross national income (gross national income (GNI), equal to GDP plus net receipts of income from the rest of the world) is less affected.
Prospects for addressing transfer pricing problems are likely to come from reforms to international tax rules. Initiatives such as base erosion and profit shifting (BEPS) emerged to put an end to tax avoidance strategies that exploit gaps and
2 The United Nations Model Double Taxation between developed and developing countries
https://www.un.org/esa/ffd/wp-content/uploads/2014/09/UN_Model_2011_Update.pdf and OECD Model Tax Convention on Income and Capital https://www.oecd.org/tax/treaties/model-tax-convention-on-income-and-on-capital-condensed-version-20745419.htm
3 In the example, the domestic investor’s share in the added earnings (including reinvested earnings) attributed to the foreign affiliate in the low-tax country will be included in the GNI of the high tax country, offsetting the reduction in earnings attributable to the parent.

5
mismatches in tax rules to avoid paying tax.4 However, some criticize that the BEPS initiative, while helping to mitigate the worst practices, are not adequate, especially for high tech, digital economy firms. Arguably as cross-border trade increased, in particular trade in services and as intangible assets have grown in importance, MNEs have gotten better at exploiting the tax system. Critics point to a better alternative than arm’s length principle called “formulary apportionment”. This system considers an MNE to be a single entity and apportions profits geographically according to a formula intended to reflect economic activity which could be a mix of sales, employment and tangible assets (Shaxson 2019, Stiglitz 2019). Yet, international tax guidelines5 reject the use of a global formulary apportionment because of concerns such as using a predetermined formula that may disregard market conditions and produce an allocation of profits that may bear no sound relationship to the specific facts surrounding the transaction.6
More recently, the operations of MNEs have increasingly impacted the financial account. MNEs are driven to create more complex financing structures, consistent with management needs of global production networks but also due to the aim of minimizing tax and regulatory burdens in the context of mostly international capital markets. Toward the latter goal, they utilize the cross-border mobility of corporate assets, in particular intangible assets such as intellectual property, the ability to easily change the legal domicile of a firm to another country and other activities as part of a group-wide strategy to minimize corporate taxes. These strategies have direct impact on GDP, as well as GNI7 and countries’ financial accounts. These complex structures often involve the use of SPEs to channel investments through several countries before reaching their final destinations.
SPEs are playing roles beyond traditional investment or pass-through activities. SPEs are now being set up to manage intellectual property rights, research and development, trade, and other activities. The common denominator of these activities is again tax arbitrage among jurisdictions in the context of free capital movements. While SPEs are legal entities that are typically located in jurisdictions
4 https://www.oecd.org/tax/beps/ 5 https://www.oecd.org/tax/transfer-pricing/oecd-transfer-pricing-guidelines-for-multinational-
enterprises-and-tax-administrations-20769717.htm 6 Global formulary apportionment would use a formula that is predetermined for all taxpayers to
allocate profits. More specifically, a formula based on a combination of cost, assets, payroll, and sales implicitly imputes a fixed rate of profit per currency unit (e.g. dollar, euro, yen) of each component to every member of the group and in every tax jurisdiction, regardless of differences in functions, assets, risks, and efficiencies among members of the MNE group. The global formulary apportionment method is different from the transactional profit method which compares, on a case-by-case basis, the profits of one or more associated enterprises with the profit experience that comparable independent enterprises would have sought to achieve in comparable circumstances. Global formulary apportionment also should not be confused with the selected application of a formula developed by both tax administrations in cooperation with a specific taxpayer or MNE group after careful analysis of the particular facts and circumstances, such as might be used in a mutual agreement procedure, advance pricing agreement, or other bilateral or multilateral determination. Such a formula is derived from the particular facts and circumstances of the taxpayer and thus avoids the globally pre-determined and mechanistic nature of global formulary apportionment.
7 GNI can be affected by certain aspects of globalization namely the depreciation related to movable corporate assets (e.g. IP assets and aircraft). Irish Economic Statistics Review Group recommended a measure of GNI* which excludes the depreciation related to foreign-owned IP assets and aircraft. In addition, retained earnings of corporate inversions or redomiciled public limited companies (PLCs) headquartered in Ireland are also excluded.

6
other than where their parent enterprises are located, the economic relevance of SPEs in terms of their contribution to GDP in the country in which they are located tends to be small, although now there are more non-financial SPEs that may have production in the host country. SPEs tend to have large financial stocks and flows associated with large income flows.
For cross-border statistics there are a range of issues including the measurement of direct investment, SPEs, pass through funds, and the relationship between investment income and positions. One concern is the current measurement of direct investment is based on the first known counterpart rather than on the origin and final destination of investments. The scale of the issue was highlighted in a recent article by Damgaard, Elkjaer, and Johannesen (2019) which suggests that “nearly 40 percent of worldwide foreign direct investment (FDI) worth a total of $15 trillion passes through empty corporate shells with no real business activities” (figure 1).
Figure 1. Phantom and Genuine FDI, 2009-2017
Source: Damgaard, J., T. Elkjaer, and N. Johannesen, September 2019, Finance and Development “The Rise of Phantom Investments”
Many branches of economic literature look at the activity of MNEs from different perspectives: international corporate taxation and transfer pricing; taxation of activity arising from intangibles; global allocation of production (supply chains); and macroeconomic statistics. The next section specifically looks at what statistics are particularly relevant in IMF policy analysis.

7
2. IMF Policy Needs
The IMF’s primary purpose is to ensure global stability of the international monetary system which includes addressing macroeconomic and financial sector issues that bear on global stability and country specific external balances and positions. The IMF does this in three ways: economic surveillance, lending, and capacity development. The economic and financial information needed for surveillance is spelled out in the Articles of Agreement of which Article VIII, Section 5 is a central pillar. Statistics are an important component for ensuring sound policy analysis and appropriate evidence-based policy responses.
Accurate external sector statistics are important for policy analysis. From the multilateral surveillance standpoint, the dominant user interests related to the balance of payments and the international investment position (IIP) are those that affect the IMF’s External Sector Report (ESR) and other multilateral surveillance needs. The ESR analyzes global external developments and provides multilaterally consistent assessments of external positions of the world’s largest economies, representing over 90 percent of global GDP in the 2019 report.8 The ESR, produced annually since 2012, relies on estimates from the External Balance Assessment approach9 as well as country-specific evidence and judgment. Key statistical inputs in this analysis are accurate current account balances, especially income balance, as well as more granular data on the IIP [including breakdowns by currency composition], as well as reconcilable data on stocks and flows.
Globalization and the associated increase in global external imbalances observed since the early 2000s have triggered a body of analytical work seeking to explain their drivers, persistence and related developments in net foreign asset positions (e.g. Dooley et al (2004), Lane and Milesi-Ferretti (2007), Gourinchas and Rey (2007)). Global current account surpluses and deficits narrowed in the aftermath of the global financial crisis and have become increasingly concentrated in advanced economies (figure 2).
8 IMF External Sector Report available at https://www.imf.org/en/Publications/SPROLLs/External-
Sector-Reports#sort=%40imfdate%20descending 9 External Balance Assessment methodology available at
https://www.imf.org/en/Publications/WP/Issues/2019/03/19/The-External-Balance-Assessment-Methodology-2018-Update-46643

8
Figure 2. Evolution of Current Account Balances, 1990-2018
Source: IMF External Sector Report July 2019: The Dynamics of External Adjustment
While global current account imbalances have narrowed since the global financial crisis, in sharp contrast, stock imbalances have continued to widen to reach record levels. At 40 percent of world GDP, the world’s net international investment position (NIIP)—defined as the sum of net creditor and net debtor positions—is now at a historical peak and four times larger than in the early 1990s (Figure 3, graph 1).
Figure 3. Net International Investment Position and valuation changes, 1990 -2018
Source: IMF External Sector Report July 2019: The Dynamics of External Adjustment
The ESR attributes the wider stock positions to the increased concentration of current account deficits (surpluses) in debtor (creditor) countries (with few exceptions, such as most euro area debtor countries), which has been partly mitigated by valuation effects in most cases, both in the form of exchange rate and asset price

9
movements (Figure 3, graph 2). This shows the importance of integrated international accounts and the need to understand stock and flow reconciliations.
Distinguishing between excessive and healthy imbalances is critical. Imbalances can be appropriate, even necessary, such as surpluses for countries whose populations are aging rapidly and need to accumulate funds that they can draw down when their workers retire. Yet, sometimes external imbalances can point to macroeconomic and financial stress if they are deemed excessive relative to the level implied by a country’s fundamentals and desirable policies.10 To determine what constitutes excessive imbalances the IMF uses the aforementioned External Balance Assessment approach that relies on current account balances and IIP statistics. Distinguishing excessive from healthy imbalances is key but it is complicated by the fact that some of the literature has questioned whether current statistical measures of the current and financial accounts provide an accurate view of external imbalances (e.g. Adler et al. (2019)).
Certain statistical treatments may not be ideal for policy analysis. Adler et al. (2019) framework highlights two distinct types of measurement issues: measurement distortions and definitional measurement issues. The definitional issues relate to the exclusion of capital gains on investments from income in national accounting and are not considered distortions. In the conceptual framework of the accounts, income is generated by production or received from transactions that distribute the income generated by production. Therefore, capital gains (and losses) are excluded from income because they do not arise from production or transactions. Instead capital gains or losses are accounted for in the “other flows” (revaluation account). This means that returns to foreign investments driven by real exchange rates or asset price changes, while affecting the IIP are not recorded as investment income in the current account of the investor home country. When such returns are predictable they can be perceived by investors as income; however, it remains a broader and unsettled discussion on whether such definitional issues should be accounted for when conducting a comprehensive assessment of a country’s external balances. On the other hand, the measurement distortions cited by Adler et al. (2019) formed the basis of measurement refinements of the IMF’s External Balance Assessment in 2018 (Cubeddu et al. (2019)), which comprise accounting treatments that shift the recording of financial returns on foreign investment positions they say arbitrarily between the income balance and net IIP valuation changes. Included in this category is the treatment of retained earnings on portfolio equity and interest rate compensation for expected inflation and default.
Gross international financial flows and positions are also central to assessing financial stability risks. Obstfeld (2012) states that the balance sheet mismatches of leveraged entities provide the most direct indicators of potential instability. The 2007-2008 global financial crisis led to a renewed interest in balance sheet analysis and the IMF’s 2014 Triennial Surveillance Review called for incorporating macro-financial analysis and the balance sheet approach into regular IMF surveillance.
Cross-border FDI positions have continued to expand since the global financial crisis. Lane and Milesi-Ferreti (2017) document how these have continued to expand since the financial crisis, unlike positions in portfolio instruments and other investment (Figure 4). This increase is primarily explained by FDI positions vis-à-vis
10 https://www.imf.org/external/np/g20/pdf/2019/060519b.pdf

10
financial centers, which include a prominent role for special purpose entities. They attribute this development to the increased complexity in cross-border corporate structures of large MNEs, as well as with their choices of domiciliation for headquarters. More generally, they state that the disproportionate role of international assets and liabilities intermediated by financial centers makes it extremely difficult to separate “genuine” financial integrations/cross-border diversification from positions reflecting MNE corporate structures or the domicile of investment fund vehicles.
Figure 4. Changes in External Assets and Liabilities, 2007 – 2015
(percent of world GDP)
Source: Lane and Milesi-Ferretti (2017) International Financial Integration in the Aftermath of the Global Financial Crisis
The size of cross-border claims implies a multiplication of apparent financial links and often involve “round-tripping”. Round-tripping occurs when investment that has been channeled abroad is returned to the domestic economy in

11
the form of direct investment (Borga, 2016). In this respect, a disproportionate importance is given to financial centers in international financial linkages. Fund economists point to the need for a link between external positions and domestic financial accounts; banking statistics on a consolidated basis; portfolio investment geographical “distortions” implied by investment fund holdings, and the need for FDI statistics to have (i) separate reporting of SPEs, (ii) statistics by ultimate source/destination, and (iii) how to allocate “consolidated data” geographically. The next section addresses how the international accounts can meet some of these emerging user needs keeping in mind the tension between user needs and statistical capacity of IMF member countries.
3. How can international accounts meet emerging policy analysis needs?
As reviewed in the previous section, assessing external sector imbalances places continuous demands on statistical methodologists and compilers. As the economic and financial systems evolve, information needs change. Avdjiev et al (2018) note that “as the global economy becomes more integrated, there is a growing tension between the nature of economic activity and the measurement system that attempts to keep up with it.” Moreover, as noted by Heath & Bese Goksu (2016), “looking back in history, crisis events have always acted as triggers to question the nature, quality, and availability of data needed for policy making.” All the issues mentioned form the backbone of a strategy for updating the BPM11 and are primarily linked to the impact of globalization, digitalization, and the evolution of payments systems—with some dominant interconnected themes, including the treatment of SPEs, MNEs and global value chains (GVCs). Addressing these themes are viewed as critical for ensuring statistical measurement remains relevant.
Since the publication of BPM6 much guidance has been provided on the statistical challenges emerging from globalization to assist national statistical compilers.12 However, some issues warrant further research to see if changes to the fundamentals of the framework–the “core”– are needed or if user demands could be met with more detailed data. The level of detail may be classified into three groups: (i) granular, meaning more disaggregated data consistent with the core framework; (ii) supplemental, meaning granular data that may for example, require a rearrangement of classifications to present alternative views; and (iii) extensions, which are data compiled outside the BPM6 conceptual framework and may be based on alternative concepts to facilitate deeper analysis. One overarching key issue is whether the impact of globalization can be addressed by more granular or supplemental data in the current framework or through extensions of the core framework.
11 See Backbone Strategy for Updating the BPM6 https://www.imf.org/external/
pubs/ft/bop/2019/pdf/19-10.pdf 12 UNECE (2011) “The Impact of Globalization on National Accounts”
http://www.unece.org/fileadmin/DAM/stats/groups/wggna/Guide_on_Impact_of_globalization_on_national_accounts_FINAL21122011.pdf; UNECE (2015) “Guide to Measuring Global Production” http://www.unece.org/index.php?id=42106

12
Many analytical needs could be met with more granular data, if feasible. The most recent discussions at the IMF’s Committee on Balance of Payments Statistics (BOPCOM) have focused on meeting user demands by providing more detailed data. Two groups, the Task Force on SPEs (TFSPE) and the Working Group on Balance of Payments Statistics relevant for GVCs (WG-GVC), have done much work in identifying what additional detailed is needed for policy analysis and is discussed in more detail in the sections below. Additionally, BOPCOM has recently established a Task Force on Intellectual Property Products (TFIPP) to work on reviewing cross-border related issues of intangible capital especially since attributing economic ownership to a particular unit of an MNE is a statistical challenge.
Special Purpose Entities
Identifying separately the activities of SPEs is essential for market analysts and policy makers to analyze cross-border interconnectedness and associated risks. While certain international initiatives have advanced somewhat the availability of separate data on SPEs, the absence of an internationally agreed SPE definition to collect cross-country comparable data has in the past hindered progress. The TFSPE developed a definition for cross-border statistics to assist compilers in properly identifying SPEs and a data collection framework for reporting cross-country comparable data on resident SPEs.
In formulating the definition of SPEs, BOPCOM considered several key aspects: (i) whether it should focus on identifying certain (SPE) institutions or rather certain SPE-like or “pass-through” activities (i.e. that could be undertaken by any institution); (ii) whether it should encompass only financial or also nonfinancial entities; (iii) which kinds of identifying criteria should be used, e.g. employment, physical presence, production, residence of the direct or indirect controlling entity, balance sheet structure (i.e. only financial or also nonfinancial assets, only cross-border positions or also domestic), etc.
Considering all these factors, the definition endorsed by BOPCOM is as follows:
An SPE, resident in an economy, is a formally registered and/or incorporated legal entity recognized as an institutional unit; with no or little employment — up to maximum of five employees; no or little physical presence; and no or little physical production in the host economy. SPEs are directly or indirectly controlled by nonresidents. SPEs are established to obtain specific advantages provided by the host jurisdiction with an objective to (i) grant its owner(s) access to capital markets or sophisticated financial services; and/or (ii) isolate owner(s) from financial risks; and/or (iii) reduce regulatory and tax burden; and/or (iv) safeguard confidentiality of their transactions and owner(s). SPEs transact almost entirely with nonresidents and a large part of their financial balance sheet typically consists of cross-border claims and liabilities.
Identifying also nonresident SPEs (e.g., domestic parents that own SPEs in foreign countries) in cross-border statistics is important in some economies. In countries such as Brazil, Russia, the United Kingdom, and the United States concern

13
for non-resident SPEs is prominent. For example, many U.S. MNEs have direct investment relationships with SPEs abroad. Such SPEs cover holding companies (including intellectual property holding companies), offshore entities associated with investment funds or insurance companies, and the foreign owners of domestic firms that have moved their legal domicile abroad (corporate inversions). Noonan (2019) uses the TFSPE definition of SPEs and data from the U.S. Bureau of Economic Analysis (BEA) to understand the prevalence of SPEs and their use of pass-through equity in U.S. FDI statistics. Noonan finds that in 2016, around 20% of the 78,413 majority-owned foreign affiliates (MOFAs) of U.S. MNEs met the SPE criteria and accounted for 39.7 percent (10 trillion USD) of total affiliates (SPE and non-SPE) assets (25.3 trillion USD), of which the majority of those MOFAs (85%) were classified under the holding company category. While recognizing the benefits and the rationale of collecting separate data on non-resident SPEs, the TFSPE recommended giving priority to initiating international data collection only for resident SPEs at this stage; once data collection is more widespread the possibility of international data collection on non-resident SPEs may be revisited.
The IMF’s data collection on SPEs will go beyond direct investment. Since SPEs have evolved to include nonfinancial specialized entities established by MNEs, the proposed reporting template will single out selected balance of payments and IIP components of resident SPEs, including information on components beyond direct investment activities. As transactions in goods would be relevant for merchanting SPEs, a separate line for net merchanting by SPEs is included. Regarding services, four distinct components of services have been included in the reporting list where SPEs can be of relevance: transport, financial services, charges for the use of intellectual property, and other business services. In addition to the more detailed service components the template also encourages direct investment data to be further disaggregated to distinguish income by the residency of the ultimate controlling parent. Such additional information can assist in compiling the supplemental statistics on who ultimately receives the income, although this template does not collect any geographical breakdown.13 The data collection targets the release of 2020 annual data by end of 2021. To assist with compilation, the IMF is working closely with other international agencies, including the European Central Bank (ECB) to advance data accessibility and the IMF will also release operational guidelines for implementing national data collection frameworks during 2020.
While recognizing that separate identification of SPEs would facilitate a clearer view of pass-through funds, BOPCOM acknowledged that not all pass-through capital can be captured through identifying and separating SPEs. In several countries, the phenomenon of pass-through capital also occurs outside SPEs, either captured through near SPEs or in other entities. The possibility of separately identifying pass-through activities not related to domestic activities, regardless of the statistical status of the entities (SPE, near SPE, or non-SPE), also emerged. One approach for such identification would lie in a further disaggregation of institutional sectors into foreign-controlled and non-foreign controlled entities (domestic MNEs and other domestic enterprises). This option may be worth exploring in the process of updating the BPM6. This would allow for certain financial flows within foreign
13 The TFSPE reflected on the feasibility of enhancing the Coordinated Direct Investment Survey (CDIS)
to collect data on SPEs but it did not recommend doing this in the short term. There was concern on data confidentiality by reporting countries because of the individual country details of the CDIS pointing to the impracticality of such a collection at this stage.

14
controlled entities to be interpreted as pass-through activities. This option also aligns with recommendation 8 on institutional sector accounts of the G20 Data Gaps Initiative (DGI) that disaggregates the financial corporations and non-financial corporations’ institutional sectors along the same recommended breakdowns (domestic MNEs, foreign controlled corporations, and other domestic enterprises) for both financial stocks and flows and non-financial transactions. Such consistent breakdowns between the national, including the domestic financial accounts, and international accounts would bolster analysis of how MNEs impact domestic activity (e.g., value-added of foreign controlled non-financial corporations) as well as cross-border activity.
MNEs and GVCs
Beyond matters directly related to the financial account, policy demand for more statistical information on GVCs has also grown significantly in recent years. As GVCs continue to develop, the IMF’s World Economic Outlook (April 2019) 14 points to the increased importance of differentiating between gross (i.e., exports minus imports from the same country) and value-added (i.e., the value each country adds in the production of goods and services that are consumed worldwide) bilateral trade balances. BPM6 provides a useful framework for additional information that would be helpful in bridging detailed trade statistics and accounting frameworks to improve the quality of inter country input-output (ICIO) tables that are the basis for GVC analysis. The availability of detailed information (such as geographical or product) required at the data source level, the quality of the output data, compilation cost, confidentiality, and reporters’ burden are strong impediments to produce relevant GVC data. Nevertheless, BOPCOM supported the final recommendations of the WG-GVC that the IMF and Organization for Economic Co-operation and Development (OECD) should develop a GVC data collection template. Acknowledging compilation challenges and considering difficulties for the implementation in countries with low statistical capacity, the proposal will identify two reporting levels with (i) core or minimum set of items and (ii) encouraged data that more statistically developed economies are able to report.
Identifying MNEs in the current account can also address the treatment of income. Value-added consists of the return to capital (i.e., operating surplus) and labor (i.e., compensation of employees).15 While the return to labor is expected to largely remain in the host economy, the profits (i.e., return to capital) of the direct invest enterprise ultimately accrue to the foreign parent. In addition, domestic MNEs will benefit from the profits they receive from their foreign affiliates.
A deeper and wider review of MNE activity should be sought in the next update to the international standards. The further breakdown of the current account to better highlight MNE activity should be considered in the next update to the international standards. Furthermore, investigation on whether other components useful for highlighting MNEs activities—such as retained earnings of MNE portfolio investors, intragroup transfers of IPPs and intragroup trade— prompted calls for exploring the possibility of introducing a sub-sectorization distinguishing between domestic MNEs that have affiliates abroad, foreign controlled enterprises and other
14 https://www.imf.org/en/Publications/WEO/Issues/2019/03/28/world-economic-outlook-april-2019 15 It also includes taxes and subsidies on production.

15
domestic enterprises, which re-joins the idea of adding sub-sectors in the current framework discussed by the TFSPE.
Other statistical considerations
Augmenting residency-based cross border investment statistics could draw on the experiences of the Bank of International Settlements (BIS) international banking statistics (IBS).16 As risks to financial stability may come from the activities of domestically-owned individual institutions in foreign markets, cross-border consolidated statistics of domestically-owned individual institutions (incorporating foreign branches and subsidiaries) located in an economy are relevant for assessing financial stability. In this context, as noted by Heath and Bese Goksu (2017) “there has been the longstanding use of BIS IBS data on a cross-border consolidated basis that captures the nationality of international banking activities, and so can help identify potential risks and vulnerabilities to the domestic economy arising from the foreign activities of domestically headquartered international banks where the ultimate risk lies”. Tissot (2016) posits that because the consolidated IBS build on measures used by banks in their internal risk management systems and are broadly consistent with the consolidation scope followed by banking supervisors the data yield a comprehensive picture of the national lenders’ risk exposures.
There is also policy demand for more integrated international accounts to facilitate a better understanding of stock and flow reconciliations. As figure 3 underscores, it is important to have an integrated and consistent balance of payments and IIP. The next manual would aim to give more attention to stock-flow reconciliation by strengthening guidance on (i) IIP valuation changes; and (ii) the nexus between returns on financial assets and liabilities and their corresponding positions.
Currency composition. Analysis of risks related to movements among major currencies, including possible sectoral imbalances, and balance sheet risks is an intrinsic part of the continuous effort to develop a deeper understanding of the implications of growing financial integration. The need to better inform this analysis by addressing data gaps involving foreign currency exposures is included in the current phase of the G-20 DGI. A detailed currency breakdown of the IIP is already encouraged in BPM6. To this end, the IMF has expanded its online database to facilitate the re-dissemination of such data. However, compilation of currency composition data remains challenging for many countries; and as of September 2019, only 13 countries have reported such data for re-dissemination at the IMF’s website.
4. Final comments
Policy relevance should drive what should be considered when updating the next generation of statistical standards. To address what data are needed for policy, the issues highlighted in this paper have thus far pointed to providing more
16 The data collected by BIS covers both residency- based (locational banking statistics) and nationality-
based (consolidated banking statistics). The consolidated banking statistics measure international banking activity focusing on the country where the banking group’s parent is headquartered. https://www.bis.org/statistics/about_banking_stats.htm

16
granular, supplementary or extended measures, allowing the flexibility needed for countries of varying statistical capacity.
In strengthening its member countries’ statistical capabilities, the IMF provides guidance to a wide range of countries with very different economic structures and statistical systems. This requires a pragmatic approach to developing and implementing methodological standards, not least because the aspiration of one-statistical-standard-fits-all is difficult to implement.
The international standards should be a roadmap for what can be practically done. There is a tension between being able to meet the various user needs and not stretching the framework too thin. For issues that may touch the core principles, a wider view on the benefits versus the costs of the potential changes as well as considering extensions to the core accounts would be required. The latter would avoid the risk of stretching too much the core accounting framework by trying to serve competing requests and possibly putting at risk fundamental principles. Thus, any proposed solutions should be tested by several critical restrictions. Among the most important are: (i) statistical compilation feasibility; (ii) data source availability and accessibility; (iii) objectivity; (iv) and flexibility to implement second-best solutions, due to differences across countries related to their economic structure and statistical capacity. As such, the conceptual guidance should provide a roadmap for what can be done by central banks and national statistical offices, considering existing as well as new and innovative good statistical compilation practices.

17
References
Adler, G., D. Garcia-Macia, and S. Krogstrup, 2019, “The Measurement of External Accounts,” IMF Working Paper WP/19/132 (https://www.imf.org/en/Publications/ WP/Issues/2019/06/28/The-Measurement-of-External-Accounts-46949)
Avdjiev, S., M. Everett, P. Lane, and H. Shin, 2018, “Tracking the International Footprint of Global Firms,” BIS Quarterly Review March 2018 (https://www.bis.org/ publ/qtrpdf/r_qt1803f.htm)
Borga, Maria (2016), “Not All Foreign Direct Investment is Foreign: The Extent of Round-tripping,” Columbia FDI Perspectives, No. 172, New York, New York. (https://academiccommons.columbia.edu/doi/10.7916/D8WM1DMQ)
Cubeddu L., S. Krogstrup, G. Adler, P. Rabanal, M. Dao, S. Hannan, L. Juvenal, N. Li, C. Osorio Buitron, C. Rebillard, D. Garcia-Macia, C. Jones, J. Rodriguez, K. Chang, D. Gautam, and Z. Wang, 2019, “The External Balance Assessment Methodology: 2018 Update,” IMF Working Paper WP/19/65 (https://www.imf.org/en/Publications/ WP/Issues/2019/03/19/The-External-Balance-Assessment-Methodology-2018-Update-46643)
Damgaard, J., T. Elkjaer, and N. Johannesen, September 2019, Finance and Development “The Rise of Phantom Investments” (https://www.imf.org/external/pubs/ft/fandd/2019/09/the-rise-of-phantom-FDI-in-tax-havens-damgaard.htm)
Dooley, M., D. Folkerts-Landau, and P. Garber, 2004, “The revived Bretton Woods system." International Journal of Finance & Economics, 9(4): 307-313.
Gourinchas, P., and H. Rey, 2007, “From world banker to world venture capitalist: US external adjustment and the exorbitant privilege.” In G7 Current Account Imbalances: Sustainability and Adjustment: University of Chicago Press, 11-66.
Heath, R., and E. Bese Goksu, 2016, “G-20 Data Gaps Initiative II: Meeting the Policy Challenge,” IMF Working Paper WP/16/43 https://www.imf.org/en/Publications/ WP/Issues/2016/12/31/G-20-Data-Gaps-Initiative-II-Meeting-the-Policy-Challenge-43760
Heath, R., and E. Bese Goksu, 2017, “Financial Stability Risks: What are the Data Needs?” IMF Working Paper WP/17/153 https://www.imf.org/en/Publications/ WP/Issues/2017/07/10/Financial-Stability-Analysis-What-are-the-Data-Needs-45013
International Monetary Fund (2009) “Balance of Payments and International Investment Position Manual, sixth edition” (https://www.imf.org/external/ pubs/ft/bop/2007/pdf/BPM6.pdf).
International Monetary Fund, 2019, “External Sector Report: The Dynamics of External Adjustment” (https://www.imf.org/en/Publications/SPROLLs/External-Sector-Reports#sort=%40imfdate%20descending).
Lane, P., and G. Milesi-Ferretti, 2007, “A Global Perspective on External Positions." In G7 Current Account Imbalances: Sustainability and Adjustment “National Bureau of Economic Research, Inc, 67-102.

18
Lane, P. and G. Milesi-Ferretti, 2017, “International Financial Integration in the Aftermath of the Global Financial Crisis,” IMF Working Paper WP/17/115 (https://www.imf.org/en/Publications/WP/Issues/2017/05/10/International-Financial-Integration-in-the-Aftermath-of-the-Global-Financial-Crisis-44906).
Noonan, R. (2019) “Special Purpose Entities and Pass-Through Equity: A Micro-Analysis with BEA Data”, 62nd ISI World Statistics Conference https://unstats.un.org/unsd/nationalaccount/aeg/2019/M13_2_2_3_SPE.pdf
Obstfeld, M., 2012, "Does the Current Account Still Matter?" American Economic Review, 102 (3): 1-23 (https://www.aeaweb.org/articles?id=10.1257/aer.102.3.1).
Shaxson, N. September 2019, Finance and Development, “Tackling Tax Havens” (https://www.imf.org/external/pubs/ft/fandd/2019/09/tackling-global-tax-havens-shaxon.htm)
Stiglitz, J., 2019, “No More Half Measures on Corporate Taxes” (https://www.project-syndicate.org/commentary/oecd-proposal-multinational-tax-avoidance-by-joseph-e-stiglitz-2019-10)
Tissot, B., 2016, "Globalisation and financial stability risks: is the residency-based approach of the national accounts old-fashioned?" https://www.bis.org/ publ/work587.htm

INTERNATIONAL MONETARY FUND 1
International Integration and Statistical Challenges
The Intersection between Policy and Measurement Needs
Joint European Central Bank, Irving Fisher Committee and Banco de Portugal Conference
Lisbon, Portugal17 – 18 February 2020
Paul Austin, Gabriel Quirós-Romero and Jennifer RibarskyStatistics Department, International Monetary Fund
* The views expressed are those of the authors and should not be attributed to the IMF, its management or its Executive Directors.

IMF | Statistics 2
Content
International integration Multinationals and distortions to well-established statistics Assessment of external balances: policy analysis needs Challenges to the international accounts Statistical priorities. Next review of international standards Concluding comments

INTERNATIONAL MONETARY FUND 3
International Integration: key features
Reduction in trade barriers: Growing scale of cross-border trade
Removal of restrictions on movement of capital: increased flows of capital
Production chains spanning to developing countries: opportunities to maximize production efficiency
FACILITATED BY ADVANCES IN SCIENCE AND TECHNOLOGY; REDUCED COST OF COMMUNICATION AND TRANSPORT

INTERNATIONAL MONETARY FUND 4
Key vehicle: Multinational Enterprises (MNEs)
Challenges for external sector statistics:
CURRENT ACCOUNT and increasingly the FINANCIAL ACCOUNT
• Treatment of intra-MNE flows:• Transfer pricing• Increasing role of intangible assets– ease of relocation • Complex accounting and financial structures
• Global Value Chains (GVCs) – fragmentation of production across borders (international integration)
• Ease of changing legal domicile – tax and regulatory
MNEs are key vehicles in the growing non-financial and financial international integration.
• Economic, financial, tax and regulatory drivers.
Presenter
Presentation Notes
Transfer Pricing- the non-market price at which related parties of the global MNE transact with each other. Can result in a misalignment between the location where the firm records its financial transactions and the actual location of production. MNEs can manipulate transfer prices in order to shift profits to low tax regions. To the extent that MNEs overstate or understate the economic value of a transaction through misleading transfer prices, there is a misallocation between statistics on trade in goods and services versus statistics on income. For example, if a parent company in a high-tax country sets an artificially low price on its exports of intermediate goods to an affiliate in a lower-tax country and an artificially high price on its overseas affiliate’s exports of final goods back to the parent, it will artificially lower exports, raise imports and lower gross domestic product (GDP) in the higher-tax country (and artificially raise GDP in the low-tax country). However, because the earnings of MNEs reflect income from foreign (including reinvested earnings) as well as domestic operations, gross national income (gross national income (GNI), equal to GDP plus net receipts of income from the rest of the world) is less affected. In the example, the domestic investor’s share in the added earnings (including reinvested earnings) attributed to the foreign affiliate in the low-tax country will be included in the GNI of the high tax country, offsetting the reduction in earnings attributable to the parent. Prospects for addressing transfer pricing problems are likely to come from reforms to international tax rules (e.g. OECD BEPS initiative). Intangible assets- broadly defined, are assets that are not physical in nature. They include computer software, patents, copyrights, trademarks, licenses. Note that the intellectual property products (produced capital assets) as defined in the national accounts covers only outcomes of research & development, mineral exploration and evaluation, computer software and databases, and entertainment, literary, and artistic originals (e.g., original movies, books, music) Global Value Chains- the creation of value in the various places (or countries) in the global supply network. Note the terms global supply chain, global value chain and global production chain are used when discussing globalization and the fragmenting of production across countries. Sometimes they are used interchangeably, but they are not exactly the same concepts. Global Supply Chains focus on the movement of goods and services through the various stages of the network (e.g., a system of organization, technology, activities, information and resources involved in moving a good or service from supplier to customer). Global Value Chains is on the creation of value in the various places (or countries) in the network. Global Production Chains focus on the production of goods and services and typically end at the point after the goods and services have been produced for the lead enterprise.

INTERNATIONAL MONETARY FUND 5
Some well established statistics become less useful…criticism• “…Net DI inflows and outflows are highly correlated,
suggesting that “measured” DI gross flows may reflect flows through rather than to the country…” Blanchard and Acalin, 2016
• “…Better data on real size of international production and its geographic and sectoral distribution are needed to obtain an accurate picture of DI…” Sauvant 2017
• “Phantom investment calls for an exorcism….Statistics on foreign direct investment are no longer fit for purpose…More than third of foreign investment is multinationals dodging tax….” FT September 2019

INTERNATIONAL MONETARY FUND 6
IMF’s External Sector Policy Analysis
IMF’s mandate to promote the stability of the global international economy and monetary system►Central: monitoring and assessment of external imbalances►Not all external imbalances are risky, some even necessary►Challenge is to distinguish excessive from healthy imbalances
Focus beyond the current account balance: increasing role of the financial account and IIP

INTERNATIONAL MONETARY FUND 7
External sector surveillance has become central in the last decade, amid large current account and NIIP imbalances…
Source: IMF External Sector Report July 2019: The Dynamics of External Adjustment
Presenter
Presentation Notes
Current account balances Global current account surpluses and deficits narrowed in the aftermath of the global financial crisis and have become increasingly concentrated in advanced economies Net International Investment Position In sharp contrast, stock imbalances have continued to widen to reach record levels. At 40 percent of world GDP, the world’s net international investment position (NIIP)—defined as the sum of net creditor and net debtor positions—is now at a historical peak and four times larger than in the early 1990s Why the sharp contrast between CAB and NIIP? The IMF’s External Sector Report attributes the wider stock positions to the increased concentration of current account deficits (surpluses) in debtor (creditor) countries (with few exceptions, such as most euro area debtor countries). This has been partly mitigated by valuation effects in most cases, both in the form of exchange rate and asset price movements. This shows the importance of integrated international accounts and the need to understand stock and flow reconciliations.

INTERNATIONAL MONETARY FUND 8
What is needed?
Core elements and challenges of external imbalance assessments
Accurate measure of current account balance, especially income balance.
Real accumulation of external wealth by domestic residents
Treatment of retained earnings on portfolio equity not recorded as income.
Accurate measure of international investment position (IIP) and its composition.
Ultimate owner basis, consistent valuations, currency composition
Limited information on stock-flow reconciliation (i.e., statistics to reconcile flow information from BOP with stock information from IIP)
Banking statistics on a consolidated basis
FDI statistics: (i) Separate reporting of SPEs; (ii) Statistics by ultimate source/destination
BIS International Banking Statistics
Presenter
Presentation Notes
BIS has done leading work in the area of consolidated banking statistics. The next section discusses how the BPM can help address the measurement needs and what work has been done so far by BOPCOM in addressing these issues.

INTERNATIONAL MONETARY FUND 9
Statistical Challenges
• A decade since BPM6 was released.• Three broad major themes have emerged since BPM6:
• Globalization• Balance sheet analysis• Digitalization and financial innovation
• All three dimensions are strongly interlinked and overlap through..• MNEs, GVCs • Profit shifting, tax and regulatory drivers• Increasing role of intangible assets, intellectual property rights• Special purpose entities (SPEs)• Increasing financial integration• Balance sheet vulnerabilities• …..

INTERNATIONAL MONETARY FUND 10
…Advising enhancing the reliability of the Current and Financial Accounts related to….
• SPEs, profit shifting, transfer pricing
• Global value chains, and the role of foreign intermediate goods and services in exports/imports
• Foreign direct investment and portfolio investment
• Nationality-based presentation as complement to the standard residence-based international accounts
• Enhanced consistency between stocks and flows

INTERNATIONAL MONETARY FUND 11
Key role and challenges from SPEs
Originally, SPEs were mostly set-up by financial institutions
Now, include nonfinancial entities established to manage • Intellectual property rights, R&D• Trade and other activities • Part of group-wide profit maximization strategy
Dissemination of separately identified data on SPEs► IMF BOPCOM Task Force devised international definition and typology to support data
collection to begin by end of 2021
Beyond current standards (for consideration in BPM7):► Further disaggregation of institutional sectors into foreign controlled and non-foreign
controlled entities?► Should SPEs be considered separate institutional units from their parent?► How to determine the economic ownership of intellectual property (e.g. R&D)?
Presenter
Presentation Notes
Issues for further consideration in next BPM7 Further disaggregation of institutional sector accounts A further disaggregation of institutional sectors into foreign-controlled and non-foreign controlled entities (domestic MNEs and other domestic enterprises) would allow for certain financial flows within foreign controlled entities to be interpreted as pass-through activities. Consistent disaggregation of the domestic financial & nonfinancial accounts (e.g. G20 DGI recommendation 8) would allow for a link between domestic financial accounts & international accounts. Consolidate SPEs with the ultimate owner Should SPEs be considered as separate institutional units from their parents? Allocates activities of affiliates abroad to economies where decisions are made (similar to treatment of embassies and consulates) Conceptual and practical implications need to be considered

INTERNATIONAL MONETARY FUND 12
FDI and SPEs
Gross international financial flows and positions are central to assessing financial stability risks.
FDI positions have continued to expand since the global financial crisis. Increase primarily explained by FDI positions vis-à-vis financial centers. Prominent role of Special Purpose Entities.
Attributed to increased complexity in cross-border corporate structures of MNEs.
Choice of domiciliation for headquarters.
FDI may be distorted, making the assessment of external imbalances challenging

INTERNATIONAL MONETARY FUND 13
Direct Investment Positions: Top 10 Reporting Economies as at end-December 2017 (US$ million)Inward Direct Investment Position Outward Direct Investment Position
Presenter
Presentation Notes
Figure 1. The significant role of SPEs in DI positions is evident in the IMF’s Coordinated Direct Investment Survey (CDIS) data. The CDIS shows that both large and small economies in which SPEs have traditionally been located are among the main originators and recipients of DI investment.

INTERNATIONAL MONETARY FUND 14
Portfolio Investment Positions: Top 10 Economies as at end-June 2018 (US$ trillion)
Presenter
Presentation Notes
Figure 2. Furthermore, the importance of SPE-related portfolio investment positions is shown in the Coordinated Portfolio Investment Survey (CPIS) data. As of the end of June 2018, CPIS-derived liabilities* reveal that the top ten economies include major SPE-hosts, including Luxembourg, Cayman Islands, the Netherlands, and Ireland. *CPIS-derived liabilities show, from the perspective of the economy issuing the securities, the value of securities held by nonresidents as “derived” from information reported by the holders of the securities (creditor information)

INTERNATIONAL MONETARY FUND 15
The critical share of financial centers…
Source: Lane and Milesi-Ferretti (2017) International Financial Integration in the Aftermath of the Global Financial Crisis
0%
50%
100%
150%
200%
250%
1995 1997 1999 2001 2003 2005 2007 2009 2011 2013 2015
Global External Assets(ratio of world GDP)
Advanced (non FC)
Financial centers
Emerging and developing countries
Source: Lane and Milesi-Ferretti (2017) International Financial Integration in the Aftermath of the Global Financial Crisis

INTERNATIONAL MONETARY FUND 16
…in contrast to their share of GDP…
0%
10%
20%
30%
40%
50%
60%
70%
80%
90%
100%
1995 1997 1999 2001 2003 2005 2007 2009 2011 2013 2015
The Composition of World GDP(shares of world GDP)
Advanced (non FC) Financial centers Emerging and developing countries
16
Source: Lane and Milesi-Ferretti (2017) International Financial Integration in the Aftermath of the Global Financial Crisis

INTERNATIONAL MONETARY FUND 17
Treatment of retained earnings on portfolio equity
► Retained earnings rerouted to owner only in the case of foreign direct investment► Same treatment not applicable to portfolio equity (nor to domestic-to-domestic relations)► Many users consider that retained earnings on portfolio equity are perceived by investors as
income and thus impact their savings investment decisions (e.g. Adler et al 2019 “The Measurement of External Accounts”)
Should treatment be changed? Needs careful consideration (e.g. on conceptual grounds, but also in terms of data availability)
Should a similar treatment be considered in national accounts (as proposed by Reinsdorf et al 2017 “Improving the Treatment of Holding Gains and Default Losses in National Accounts”)?
Implication if all retained earnings of corporations are re-routed to shareholders, corporate saving ratios would become zero by definition
Presenter
Presentation Notes
The asymmetric treatment of retained earnings between direct and portfolio investment, and its implications for the income balance is a longstanding issue. While retained earnings are attributed to immediate owners in the case of direct investment and are reflected in the investment income on an accrual basis, retained earnings on portfolio investment are not attributed to immediate owners and are instead reflected in IIP valuation changes. Some users noted that from an economic perspective both should be income. The BPM6 update therefore provides an opportunity to review the treatment of retained income for different investment types (as well as the borderline between dividends and withdrawal of equity). Nonetheless, the impact on the saving ratio of companies with foreign shareholders as well as possible inconsistencies with the treatment of equity income in domestic to domestic relationships in national accounts should also be considered.

INTERNATIONAL MONETARY FUND 18
Multinational Enterprises & Global Value Chains
Fragmentation of production has created challenges in interpreting current trade related statistics. For example, gross exports often contain significant foreign intermediate goods and services.
► Potentially distorting who really trades with whom, current measures of bilateral trade balances may need supplemental measures for optimal policy analysis.
Made progress on certain issues that can be addressed within the current framework by providing more supplemental or granular statistics.
IMF BOPCOM Working Group on Balance of Payments Statistics on GVCs.► Identified components in the current balance of payments framework that are relevant for
developing GVC indicators: Developing a data collection template. ► Further breakdown of MNEs in current account transactions: BP/IIP7
Presenter
Presentation Notes
Indicators on GVCs are typically derived from Inter-Country Input-Output tables (ICIOs), which are created by combining national Supply-Use tables (SUT) or Input-Output (IO) tables with international bilateral merchandise and services trade statistics, to develop a complete global matrix of country-by-industry input-output tables. The key aspect of the compilation involves the breakdown of exports and imports (by product) as reported in national SUTs, by geographical partner, in order to link the SUT from one country to that of all others involved in the global chain of production. Example of more granular statistics needed are: In compiling the balance of payments items related to trade in goods and trade in services, several adjustments to international merchandise trade data are typically introduced to align these measures of physical flows with the balance of payments concept of change of economic ownership. A better understanding of which products and which partner countries are particularly affected by the transition from physical move to change of economic ownership would be highly beneficial. Geographical breakdowns for trade in services statistics, starting with the 12 main EBOPS categories (and total services trade) and prioritizing breakdowns for more detailed services category according to their relevance and importance in a country’s international trade.

INTERNATIONAL MONETARY FUND 19
Nationality versus residence based, ultimate source and host economy, stocks and flows,…
• More granularity, whenever possible (recommended by TFSPE): Nationality-based presentation of ESS as complement to the standard
residence-based ESS
Supplementary data on direct investment positions according to ultimate source and host economy
• More integrated international accounts by strengthening guidance on IIP valuation changes Nexus between returns on financial assets & liabilities and their corresponding
positions.• IIP currency breakdown (recommendation 10 of G-20 Data Gaps Initiative) Compilation remains challenging for many countries; as of Dec. 2019 only 13
countries reported data for re-dissemination to the IMF.
Presenter
Presentation Notes
Alternative frameworks The residency-based principle, corporations in an MNE setting are treated statistically as separate institutional units and as resident in their host economy. A nationality-based approach consolidates the positions of these corporations and attributes them to the nationality of the parent corporation. Further exploration on how to manage the duality of residence/nationality within the international accounts framework would be needed before such extensions could be produced. Could draw on the experiences of the BIS international banking statistics which produce both views,

INTERNATIONAL MONETARY FUND 20
Concluding comments (1)
Policy relevance should drive what issues should be given priority when updating the next generation of statistical standards: IMF developing a strategy of high priority issues for updating
BPM6.
Tension between user needs and the existing framework: What issues would change the fundamentals of the system? Do benefits
outweigh costs? What issues can be addressed through granular, supplementary, or extended
measures?
International standards and very diverse statistical capacity: Are priorities common/ relevant for most countries? Could the potential solutions
be implemented by national statistical compilers?

INTERNATIONAL MONETARY FUND 21
Concluding comments (2)
IMF provides guidance and TA to countries with very different economic structures and statistical systems, including resources, data sources and statistical capacity. The next ISS should as inclusive as possible.
A number of current statistical challenges may be met with more granular, supplementary, or extended measures => allows flexibility in implementation, without breaking the framework: too costly, unnecessary (?)...
Next revision of standards more driven by some critical restrictions: Statistical compilation feasibility Policy needs of both countries with high and low statistical capacity Data source availability and accessibility Flexibility to implement second-best solutions, due to differences across
countries related to economic structure and statistical capacity.

1/1
IFC Conference on external statistics "Bridging measurement challenges and analytical needs of external statistics: evolution or revolution?", co-organised with the Bank of Portugal (BoP) and the European Central Bank (ECB)
17-18 February 2020, Lisbon, Portugal
Globalisation and communication – addressing user needs and making our external economy data more comprehensible1
Caroline Bo and Casper Winther,
Statistics Denmark
1 This paper and presentation were prepared for the meeting. The views expressed are those of the authors and do not necessarily reflect the views of the BIS, IFC, BoP, ECB or
the central banks and other institutions represented at the meeting.

Globalisation and Communication 1
Globalisation and Communication
Addressing user needs and making our external economy
data more comprehensible
Caroline Bo and Casper Winther1
Abstract
The economic globalisation that has taken place the past decades has increased the
complexity of international trade for a small open economy like Denmark. New
questions and analytical needs have been put forward making it necessary to
rethink the way statistics are being produced and disseminated. In addition to an
increased complexity in conducting statistics within this field, it has become more
difficult for statistical users to understand what the statistics actually show.
Therefore, it is essential that producers of statistics also analyse and explain these
data instead of leaving it solely up to users to do this. The focus is changed from
providing data to providing knowledge.
Recently, we at External Economy, Statistics Denmark, have increased our
efforts to shed light on our statistics with regards to economic globalisation. It has
entailed new statistical products, and increased focus on analysing and explaining
our data to our users. Emphasis is on disseminating across domains, giving users a
more complete picture and thus making it easier to understand economic
globalisation. Also, some answers to emerging questions regarding globalisation
have been provided by linking existing information. By implementing these
measures, we are trying to make it easier for our users to understand what our
statistics show and which conclusions one may draw.
The efforts are ongoing, and changes to the regular dissemination of
International Trade in Goods statistics, International Trade in Services statistics, and
the Balance of payments are being considered. So far, users have reacted positively
to these efforts. However, we can still improve how we describe our statistics – the
effects of globalisation – in a way that is easy to understand.
Keywords: Dissemination, Analyses, Globalisation, Balance of payments, Trade
JEL classification: F10, F19, F60, F69
1 External Economy, Statistics Denmark. The views expressed are those of the authors and do not
necessarily reflect the views of Statistics Denmark.

2 Globalisation and Communication
Contents
1. Introduction .......................................................................................................................................... 3
2. Why is it necessary to make changes? ....................................................................................... 3
3. Responding to user needs .............................................................................................................. 6
3.1 Our users .................................................................................................................................... 6
3.2 Actions......................................................................................................................................... 7
3.2.1 Explanatory initiatives for the general public.................................................. 7
3.2.2 New insights for our expert users........................................................................ 9
4. Experiences so far ............................................................................................................................. 12
5. Concluding remarks and future work ....................................................................................... 14

Globalisation and Communication 3
1. Introduction
With the economic globalisation and technological development, that has taken
place the past decades, global trade has become more complex for a small open
economy like Denmark. Consequently, it has become more difficult to produce
statistics reflecting global trade, and complicated what to conclude from these
statistics. One of the key challenges is that an increasing part of Danish exports is
not crossing the border and is not included in the traditional cross-border statistics
on trade. Due to this, statistical users find it more challenging today to understand
what the statistics on global trade actually show. Therefore, informative descriptions
of statistics, such as international trade statistics and the balance of payments, is
necessary. Moreover, users also express interest in getting more detailed
information on economic globalisation. Thus, new statistical products on
globalisation are requested. Due to the complexity, it is essential that experts on
statistics also analyse these data instead of leaving it solely up to users to do this.
At External Economy at Statistics Denmark, we have increased our efforts on
analysing and explaining our data to our users. It entails different formats of
dissemination – descriptive papers and more analytical work. A key part is the
integration of the various statistical domains of international trade in the
dissemination. A traditional stovepipe approach to dissemination makes it difficult
to get a complete overview of economic globalisation. Also, additional information
on globalisation has been provided. By implementing these measures, we are trying
to make it easier for our users to understand what our statistics show and which
conclusions one may draw. Hopefully, this will provide a better understanding of the
Danish trade patterns in a globalised world, and the impact of globalisation on the
Danish economy.
2. Why is it necessary to make changes?
The pattern of international trade has changed dramatically the past twenty years, in
particular regarding the ways goods cross borders. Goods may no longer be
designed, manufactured nor assembled in a single country, but rather through
global value chains. Multinational enterprises organise themselves across several
countries. Because of the interconnectivity of the global production processes, the
traditional boundaries of countries are disappearing. Multinational enterprises may
let subsidiaries abroad manufacture and sell the company group’s goods. Perhaps
the goods never even reach the country where the company group is registered.
The headquarters may own the goods produced abroad but let their subsidiaries
take care of the processing activity. How multinationals choose fiscally to organise
their production (i.e. which enterprise legally owns the goods during the production
process and sale) can change overnight, and does not necessarily result in changes
in the actual flow of goods.
The traditional trade in goods statistics focus on flows, i.e. goods crossing
borders. Thus, it does not focus on change in ownership of the goods, i.e. changes
between Danish and foreign counterparts in who owns the goods. An increasing

4 Globalisation and Communication
part of Danish goods exports is not captured in the traditional measures of goods
trade, since more goods change ownership without having crossed Danish borders.
Danish businesses are increasingly selling goods abroad which are neither produced
in Denmark nor pass Danish borders. Figure 1 shows the development in sale of
Danish goods abroad that have not crossed Danish borders.
Goods exports outside Denmark by Danish manufacturing enterprises
amounted to more than DKK 140 bn in 2018. Sales outside Danish borders comprise
of merchanting goods and goods sold abroad after being processed abroad (see
more in box 1). Sales of merchanting goods made up more than one-half of total
sales in 2018. From 2005 to 2018 goods sold after being processed abroad grew
from about DKK 2 bn to more than DKK 60 bn, while sales of merchanting goods
grew from around DKK 7 bn to more than DKK 80 bn, see figure 1.
Goods sold abroad without crossing the border
by Danish manufacturing enterprises Figure 1
Source: Statistics Denmark, www.statistikbanken.dk/GLOB1
Along with the changes in trade patterns statistical guidelines on global
activities have been changed to better reflect this. Capturing the activities of global
production is a challenging aspect of macroeconomic statistics. It has complicated
the work for all parties involved – the companies reporting the activities, the
National Statistical Institutes (NSIs) producing the statistics, and the users who are
studying the statistics.
Box 1
How reported data on global activities is recorded in the statistics
Understanding how global production activities are reflected in the statistics is tricky. Most of
the largest Danish enterprises organise their activities globally and trade and production span
many countries. Usually the organisation also entails that some of these activities abroad are
managed from Denmark. When Danish trade and production activities take place outside
0
20
40
60
80
100
120
140
160
2005 2006 2007 2008 2009 2010 2011 2012 2013 2014 2015 2016 2017 2018
Sales of goods abroad after being processed abroad Sales of merchanting goodsDKK bn

Globalisation and Communication 5
Danish territory, but are operated from Denmark, things start to become complicated. This is
due to the fact that these activities are statistically regarded as Danish activities. Global
production patterns affect the statistics in a way that ‘old school economics’ did not teach us.
Instinctively, one thinks of a country’s international trade as being the goods (and services)
crossing the borders of the country. Most of our users think of Danish goods exports as being
the goods leaving Danish territory when sold to a customer abroad. However, global
production patterns muddle this understanding. Today, a large part of Danish goods exports is
taking place outside Danish borders, and the goods, which are sold, have never been in
Denmark. This kind of exports should by definition be included in the export figures in the
Danish balance of payments, and the activities also have an impact on the Danish national
accounts. It is, however, not part of the International Trade in Goods statistics, since the latter
statistics only includes goods crossing the Danish border.
Thus, Danish exports outside Denmark’s borders occur when Danish enterprises sell
products abroad, which they own, and which have not crossed Danish borders. Precisely how
these exports are recorded in Denmark’s balance of payments depends on whether the
products are sold abroad after processing, or if they are simply purchased as commodities and
subsequently sold without further processing. This latter process is known as merchanting.
Definition and recording of processing activities abroad
Processing activities abroad take place when a Danish enterprise (domestic resident)
buys production services from a foreign enterprise (non-resident) outside Denmark,
and the Danish enterprise owns the goods during the processing. The Danish
enterprise may buy raw materials both in Denmark and abroad for the processing
abroad. After the processing, the Danish company sells the finished goods to a
foreign enterprise abroad.
The payment for processing abroad is recorded in the International Trade in Services
statistics as an import of a processing service. It covers both payroll and any
supplementary purchasing of raw materials undertaken by the foreign enterprise in
relation to the further processing of the Danish goods. The goods purchased in
Denmark and sent abroad are recorded in the International Trade in Goods statistics
as exports. However, as Danish ownership of the goods sent abroad remains constant
and no change to a non-resident occurs, this movement of goods will not be
classified as an export in the balance of payments. On the contrary, raw materials
purchased abroad are not recorded in the International Trade in Goods statistics as
exports, but are included in the balance of payments as imported goods, due to the
change from foreign (non-resident) to Danish ownership (resident). After processing,
the products are sold to a foreign customer (non-resident), and have never crossed
Danish borders. The sale of goods abroad after being processed abroad is recorded
as an export in the balance of payments.
Definition and recording of merchanting activities abroad
Trade of merchanting goods takes place when a Danish enterprise (domestic
resident) buys goods from a foreign enterprise (non-resident), and resells them
directly to a foreign enterprise (non-resident) abroad. Thus, the goods are never
entering Denmark, and they are not altered between the purchase and the sale.
In the balance of payments, merchanting is treated as a net export (selling price
minus acquisition price)

6 Globalisation and Communication
Enterprises can easily shift between the two business models, and the physical trade patterns
will appear unaltered. However, how Danish enterprises choose fiscally to organise their
production and sales in the global economy are crucial for how the activities are recorded in
the statistics. When a company chooses to use one form of fiscal organisation instead of
another, it will have an effect on how the transactions are recorded in the balance of payments
and whether it is included in the calculation of Danish production (GDP) or only in Danish
income (GDI).
Thus, the change in trade patterns and global production arrangements has
increased the complexity in understanding statistics regarding international trade.
So due to the complexity of it all, we needed to enhance our efforts on making our
external economy data more comprehensible to our users.
3. Responding to user needs
In 2016 we started our work on making statistics on international trade more
comprehensible. We have had – and still have – ongoing discussions on what is
needed. In addition to new forms of dissemination, we have also concluded that we
need to provide more detailed information on global trade activities. This is to shed
light on our statistics; more importantly, it is an attempt to make a complex field
more comprehensible.
The International Trade in Goods statistics, the International Trade in Services
statistics, as well as the balance of payments are all produced at External Economy.
The fact that they are all produced in the same office makes it much easier when
developing new disseminating practices regarding the field of international trade
and economic globalisation, especially when explaining the interrelations between
the statistics.
3.1 Our users
When considering new initiatives on explaining our data we needed to keep in mind
that we have a mixed group of users. Overall, we can characterise our users as
belonging to one of two main groups – the general public and experts.
The first group includes, among others, journalists. Hence, people with limited
knowledge of our statistics. It is important to stress that journalists play an
important role since they are the ones who communicate our statistics to the
general public, and thus it is important that they understand the basics of our
statistics. We have come to realise that the public at large has difficulties in
understanding our statistics more generally. They are looking for a more overall
explanation of our statistics, including economic globalisation, in a not too
technical wording.
The latter group comprises experts who already have an in-depth knowledge of
our statistics and are completely familiar with the economic terms. It is
important that this group has a deep understanding of our statistics as they
play a key role in providing facts about society and thus affect the political

Globalisation and Communication 7
decision-making. We have come to realise that this group also has difficulties in
understanding our statistics, especially how global production setups are
included in the statistics. In addition to understanding how global activities are
reflected in Danish international trade figures, this group is asking for more
analytical work focused on economic globalisation and the trade patterns
linked to it. Thus, we need to provide new insights on economic globalisation
for our expert users.
Against this backdrop, when planning new initiatives, we have kept in mind that we
have users with different demands.
3.2 Actions
We have taken several steps to make the topics of international trade and economic
globalisation more comprehensible. It includes providing different formats of
dissemination – descriptive papers and more analytical work. Also, we have
provided more detailed data, i.e. new insights, on economic globalisation. We have
increased our collaboration with colleagues from the national accounts and the
central bank to add additional aspects to our numbers, and we plan to do this more
in the future.
Our analytical papers are typically written in a language that demands general
knowledge of economics. However, we try to incorporate graphics as much as
possible to ease the understanding. Our analyses are written in Danish. We have
chosen, however, also to translate them into English. In that way we are able to
reach a greater audience, and share them with colleagues internationally. Also, as a
bonus, they get more attention as they are published twice. The analyses are usually
aimed at our expert users.
The publication Behind the Numbers (Bag Tallene) is a series of articles written
in more simple terms and with a minimum of numbers in them. They are aimed at
the general public and are produced in collaboration with the communication team
at Statistics Denmark. These articles are produced on a regular basis and are only
published in Danish.
In addition, we have launched new data on globalisation for the manufacturing
industry, using existing sources. Along with the published data we publish
newsletters (only in Danish), which show data in tables, graphs and text.
Lastly, in 2017 a webpage on Statistics Denmark’s website was launched. It
focuses solely on economic globalisation. The webpage provides an overview of all
statistics, publications and newsletters that Statistics Denmark produces on
economic globalisation across statistical domains. The statistics are explained in an
easy-to-understand language. The webpage also links to international websites
related to the topic.
3.2.1 Explanatory initiatives for the general public
Several actions have been taken to meet the requests of the general public. It
entails providing an overall explanation of our statistics, including economic

8 Globalisation and Communication
globalisation, in a not too technical wording. Examples of some of our actions are
given below.
The newsletter Udenrigsøkonomi (External economy) was launched in 2014. It is
published yearly and combines International Trade in Goods statistics, International
Trade in Services statistics, and the balance of payments. Recently, we have
introduced a split of the goods account into goods, crossing the Danish border, and
goods that do not cross the Danish border. A graph from the newsletter is shown
below.
Current account balance, total net earnings and contribution to surplus
The analysis How big are Danish exports and who are our main trading partners?
was published in 2017 (Danish) and again in 2018 (English). It describes Danish
exports and Denmark’s trading partners, based on the different export statistics. The
analysis is aimed at the public at large who are interested in understanding the
different export figures that exist. Among other things, the analysis shows that
around a sixth of the total Danish export of goods takes place outside Danish
borders. It also looks at Danish trading partners based on the different trade
concepts including the concept of trade in value added. Two graphics from the
analysis are shown below.
Largest export markets for goods, 2016
15,0
11,2
6,2
6,0
5,34,93,5
47,9
Germany
Sweden
Norway
United Kingdom
Netherlands
US
China
Other
International trade in goods
Per cent
14,3
10,8
10,3
6,45,75,34,9
42,4
Balance of Payments - goods
Per cent

Globalisation and Communication 9
Example
Processing setup
In addition, a few more initiatives have been launched. It includes a “fact sheet”
comprising key facts about Danish external economic activities made to serve the
purpose of being a fact sheet to discussions on this topic during the Danish election
in 2019. The last initiative to be mentioned is the article ‘Danish exports with and
without Danish labour’ in the ‘Behind the Numbers’ publication. It was published in
2019. It is an article about how Danish manufacturing companies’ global production
setup affects Danish export numbers.
3.2.2 New insights for our expert users
Our expert users are asking for more detailed information on how global
production setups are included in the statistics. Moreover, they are requesting more
detailed data on global production activities. Several actions have already been
taken to meet these requests. Examples of some of our actions are given below.
The analysis Large increase in sales of goods abroad by Danish manufacturing
industries was published twice in 2016 (Danish and English). It describes how
manufacturing companies organise production internationally, and focuses
especially on production and sales abroad. One of the key findings is that Danish
manufacturers’ sale of goods abroad has increased dramatically – from about DKK 8
bn in 2005 to DKK 120 bn in 2015. This is illustrated in figure 1 in chapter 2.
New data on globalisation was launched in 2018. It entailed two tables
supplemented by an annual newsletter (Danish manufacturing companies'
international production) combining information from different sources on
manufacturing companies' international production. Some information is new, e.g.
goods flows related to processing activities. An extraction from one of the tables is
shown below.

10 Globalisation and Communication
Detailed data on Danish manufacturing companies' international production
2016 2017 2018
Exports
Trade with goods that crosses the border 352 372 373
Goods sold abroad without crossing the border 135 138 141
- Goods sold abroad in connection to processing abroad 62 63 60
- Goods sold under merchanting 74 75 81
Charges for the use of intellectual properties 5 6 6
Other trade, including maintenance and repair services, sale of
manufacturing services, construction and intracompany services 17 18 18
Goods sent abroad after processing abroad wihtout change of ownership 2 3 2
Goods acquired under merchanting (negative credit) -48 -51 -55
Imports
Trade with goods that crosses the border 150 160 165
- Goods procured abroad in connection to processing abroad 12 11 10
Charges for the use of intellectual properties 3 2 3
Purchase of manufacturing services abroad 7 7 7
Other trade, including maintenance and repair services, sale of
manufacturing services, construction and intracompany services 40 34 35
Goods returned after processing abroad without change of ownership 2 2 2
Units: DKK bn Source: Statistics Denmark, www.statistikbanken.dk/GLOB1, GLOB2
The analysis The global organisation of industrial groups has an impact on the
measurement of Danish production and income was published in 2018 (Danish) and
again in 2019 (English). It describes the global setup of Danish industrial groups and
their impact on the Danish economy. Focus is on the close correlation between
Danish exports and income from subsidiaries abroad. The analysis is a continuation
of the analysis from 2016. It shows, among other things, that income from
subsidiaries of DKK 42.1 billion accounts for approximately one third of total
earnings from Danish industrial groups’ manufacturing activities abroad. These
earnings could have been counted as exports had the group chosen a different role
for the production taking place in subsidiaries abroad. Two graphics from the
analysis are shown below.

Globalisation and Communication 11
Example
Global production setup
Danish industrial groups’ earnings from production abroad. 2016
The analysis A few industrial groups contribute massively to Denmark’s balance
of payments surplus was published in 2019 (Danish). An English version is planned
to be published in February 2020. The analysis is a continuation of the analyses from
2016 and 2018, and further elaborates on the global setup of Danish industrial
groups and their impact on the Danish economy. Focus is on how much the
industrial groups contribute to the balance of payments surplus, and the scale of
their outwards foreign direct investments. One of the key findings is that the direct
contributions by just five large industrial groups to the current account surplus
correspond almost to the entire Danish balance of payments surplus in 2018. This
finding is illustrated in the first of the two graphics from the analysis shown below.
26%
34%6%
34%
Merchanting sales Sales after processing Royalties Income from subsidiaries

12 Globalisation and Communication
Total balance of payments contribution
Broken down by the number of industrial groups. 2018
Investments abroad by industrial company groups
First vs. ultimate destination
4. Experiences so far
Users have reacted positively to our efforts. The response has been that our new
products are highly appreciated and much needed. Moreover, users have told us
that they hope we will continue our efforts in explaining our data, conduct analyses,
and provide more detailed data where possible. Furthermore, our measures have
made it easier for experts and to some extent journalists to pick up conclusions that
one can draw from our data that they most likely would not have otherwise
detected due to the complexity of the topic. Also, we have noticed that the English
versions do provide extra attention to our analyses.

Globalisation and Communication 13
Table 1 shows how much attention our initiatives have got. It should be noted
that a low number of views shall not be regarded as a failure. As mentioned, we
have different products aimed at different users. Some products are aimed at
experts and others are aimed at the general public. The latter group is of course
much bigger than the first one. The table stresses this. Three of our analyses (1, 3
and 4 in the table) and one of our newsletters (10 in the table) are aimed at experts
and have received less attention in number of views. However, these publications
have not gone unnoticed. Several experts have shown great interest in them. These
publications have led to people contacting us from ministries, trade unions,
industrial organisations, and universities with questions regarding the underlying
data and the topic in general.
It is thus most interesting to look at table 1 to see if our initiatives aimed at the
general public, get as much attention as we are hoping for. We have e.g. made a
paper with a general introduction to the exports definition (2 in the table). The table
shows that this analysis has indeed received a lot of attention. In fact, it is the most
read analysis of the ones published by Statistics Denmark in 2017. Some users have
contacted us due to this paper, mentioning that they appreciate our efforts in
explaining the exports definitions as they are far from clear cut to understand.
Another product aimed at the general public is our newsletter combining the
International Trade in Goods statistics, the International Trade in Services statistics,
and the balance of payments (11 in the table). As seen in the table the newsletter
has a large audience. It is also among the most read newsletters produced by
Statistics Denmark. Moreover, table 1 shows that the website on economic
globalisation has been viewed a lot since its launch in 2017. In the spring of 2019
the website had approximately a thousand views per month.
Number of views as of January 2020 for some of our new products Table 1
Product Published
Number of views by
external users since
launch
Target group
Analyses
1 Large increase in sales of
goods abroad by Danish
manufacturing industries
DK Oct 2016
(UK Nov 2016)
DK 772
(UK 545)
Experts
2 How big are Danish exports
and who are our main trading
partners?
DK Dec 2017
(UK Feb 2018)
DK 7,168
(UK 1,519)
General public
3 The global organisation of
industrial groups has an
impact on the measurement
of Danish production and
income
DK Oct 2018
(UK May 2019)
DK 666
(UK 97)
Experts
4 A few industrial groups
contribute massively to
Denmark’s balance of
payments surplus
DK Nov 2019
(UK Feb 2020)
DK 433
(UK – )
Experts

14 Globalisation and Communication
Behind the numbers (Bag Talllene)1
5 Facts about Denmark’s
economic activities with
foreign countries
Feb 2019 1,619 General public
6 Danish exports with and
without Danish labour
Jun 2019 437 General public
Webpage
7 Webpage on economic
globalisation
April 2017 21,080 General public /
experts
Tables
8 Glob1 Oct 2018 256 Experts
9 Glob2 Oct 2018 101 Experts
Newsletters (annual)
10 Danish manufacturing
companies' international
production
Oct 2018 999 Experts
11 External economy Feb 2019 4,556 General public
1 Since we produce Bag Tallene on a regular basis only two are included in the table.
5. Concluding remarks and future work
The past several years we at External Economy at Statistics Denmark have increased
our efforts to shed light on our statistics. This includes measures making the topics
of international trade and economic globalisation more comprehensible, and also
proving new insights on the topic. Our focus has changed – from providing data to
providing knowledge.
We have two main areas we will focus on regarding future measures. First, we
will continue our efforts on explaining our statistics, also to overcome the difficulty
of having two different concepts of trade. One of the things we are discussing is to
have a more integrated way to describe our statistics instead of disseminating them
separately. More specifically, we aim at disseminating the statistics on international
trade in goods and services as well as the balance of payments in one single
monthly press release.
Secondly, our expert users are asking for more analytical work and detailed
data to understand the impact of globalisation on the Danish economy. Our
collaboration with the central bank in our analytical work has allowed us to get the
full picture of the economic impact of industrial groups on the balance of payments.
And we have gained insights into the different channels of earnings used by
companies with an international organisation of production. We will continue to
add new dimensions to our analyses of the impact Danish industrial groups have on
the Danish economy. As a next step we plan to look into the job composition and
wages of those industrial firms that to a large extent have an international
production setup.

Globalisation and Communication-Addressing user needs and making our external economy data more comprehensible
Casper Winther and Caroline BoExternal economy, Statistics Denmark
Lisboa 17 February 2020

Major impact of globalisation on a small open economy as DK => Globalisation challenge the traditional use of statistics and raises new questions
Re-think dissemination - from providing data to providing knowledge Much can be done within existing frameworks Explain data and put statistics into perspective To fully understand the impact one must look across domains Explore and provide new knowledge – more details, new analytical
insights
Key takeaways
2

Statistics Denmark provides statistical knowledge to support decisions, debate, and research on Danish society.
To fulfill our role in society it is crucial that our users understand our statistics and can get the answers they are looking for – i.e. we must stay relevant
For statistics on international trade and economic globalisation this is a challenge!
Our mission is challenged by globalisation
3

International trade flows are complex/part of global value chains…
4

The impact of production abroad by manufacturing companies is significant
A significant part of Danish exports do not cross the DK border (not the way most people think!)
…it is also reflected in Danish trade
5
0
20
40
60
80
100
120
140
160
2005 2006 2007 2008 2009 2010 2011 2012 2013 2014 2015 2016 2017 2018
Sales of goods abroad after being processed abroad Sales of merchanting goodsDKK bn
0
20
40
60
80
100
2009 2010 2011 2012 2013 2014 2015 2016 2017 2018
Goods sold abroadafter being processedabroad
Merchanting
Goods crossing theDanish border
DKK bn
Exports to the US - both crossing and not crossing the Danish border

1. Explain: Statistics on international trade is difficult to understand- Border crossing vs. change of ownership, influenced by
different business models - explain data more thoroughly and put statistics into perspective
2. Explore: Economic globalisation is complex, additional information is needed to grasp its effects on the Danish economy- Provide new knowledge and more detailed data on global
trade activities to give deeper insights into the topic
Necessary to make changes - from providing data to providing knowledge
6

New forms of dissemination New statistical products - more detailed data on
global trade activities Increased collaboration with colleagues from the
national accounts and the central bank
Keep in mind that we have a mixed group of users -general public and experts
Some examples…
Actions
7

How big are Danish exports and who are our main trading partners?
Published in 2017
Explanatory initiatives (general public)
8
15,0
11,2
6,2
6,05,34,93,5
47,9
Germany
Sweden
Norway
United Kingdom
Netherlands
US
China
Other
International trade in goods
Per cent14,3
10,8
10,3
6,45,75,34,9
42,4
Balance of Payments - goods
Per cent

x
Explanatory initiatives - current account surplus driven by goods that do not cross the border
9

New insights (expert users)– close link between production and income
10
Danish industrial groups’ earnings from production abroad (2016)
26 pct.
34 pct.6 pct.
34 pct.
Merchanting sales Sales after processing Royalties Income from subsidiaries0
5
10
15
20
25
30
35
40
45
Merchanting sales Sales after processing Income from subsidiaries
DKK bn

Total balance of payments contribution Broken down by the number of industrial groups. 2018
New insights – impact on BoP
11

Outwards Foreign Direct Investments Broken down by the number of industrial groups. 2018
New insights – impact on iip
12
0
100
200
300
400
500
600
Top 5 company groups Top 10 company groups Top 50 company groups Top 100 company groups All company groups
DKK bn
46 %
62 %
91 %96 % 100 %

A stove pipe approach is of limited use when assessing the impact of globalisation – a broader view is needed, especially in trade statistics Positive reactions from
users so far saying newproducts are appreciated
Key message- do we get the full picture?
13

We plan to continue explaining our statistics and making it more accessible As a next step we plan to fully integrate the monthly dissemination
of balance of payments, international trade in goods and services statistics
And we continue exploring to meet expert users needs As a next step we plan to look into the job composition and wages
of those industrial firms that to a large extent have an international production setup.
Future work
14

Thank you!
15

1/1
IFC Conference on external statistics "Bridging measurement challenges and analytical needs of external statistics: evolution or revolution?", co-organised with the Bank of Portugal (BoP) and the European Central Bank (ECB)
17-18 February 2020, Lisbon, Portugal
Macroprudential liquidity stress tests using BIS locational banking statistics1
Nikolaos Georgiopoulos and Carnell Lambert,
Bermuda Monetary Authority
1 This paper and presentation were prepared for the meeting. The views expressed are those of the authors and do not necessarily reflect the views of the BIS, IFC, BoP, ECB or
the central banks and other institutions represented at the meeting.

1
Macroprudential Liquidity Stress Tests Using BIS Locational Banking Statistics
Nikolaos Georgiopoulos, Carnell Lambert1
Abstract
This study examines the use of both external and internal positions of Bermuda banks with relevance to the international non-resident sector, i.e. international insurance companies, from the BIS locational banking statistics for macroprudential liquidity stress testing of the Bermuda banking sector. The paper describes the reasons for using locational data in the context of a small open economy with liberalized capital flows. In addition, the paper will describe how locational data and external claims are compiled and validated for use in liquidity stress testing and also present how scenarios are built with this data. Finally, we describe how this data work using an artificial bank example and interactions of liquidity and solvency.
Keywords: stress testing, macroprudential surveillance, foreign assets, international financial data. JEL classification: C82, C800
Introduction The scope of this paper is to present to a wider audience the utilization of locational data collected by the Bank of International Settlements (BIS) for macroprudential liquidity stress testing in the context of a small open economy such as that of Bermuda. This paper will introduce the rationale behind the use of locational banking statistics for this purpose, the process of data collection and data quality control and then finally how the stress test is conducted using the data.
Macroprudential liquidity stress testing has been an active area of research although there are no fixed methodologies, rather a collection of methodologies tailored to individual country circumstances. Jobst et al. (2017) have a paper on principles of macroprudential liquidity stress tests as a rather long list of approaches from other countries. For the purposes of this paper we will not go through an exhaustive literature review, rather we will concentrate on methodological aspects relevant to Bermuda. In addition, the Bermuda example may serve as a guide for other small island jurisdictions due to comparable economic and financial systems.
To give some intuition behind our methodology, we will first describe in this section the economics of a small open economy, which is also an international financial center. Bermuda as an open economy trades with the outside world under a regime of largely liberalized financial account. Restrictions in Foreign Direct Investment (FDI) exist for real assets of the domestic economy such as real estate and businesses operating locally. Ownership restrictions restrict acquisition of low-end real estate from foreigners while acquisition of businesses has to follow a 60/40 sharing rule under which a foreign shareholder can hold at most 40% of a business’s share capital.
On the other hand, corporations with domicile in Bermuda but with services sold exclusively to overseas (non-Bermuda residents) customers are freely incorporated and capital flows with zero restrictions. Examples of such corporations are Bermuda (re)insurance companies, funds and trusts with clients 1 Senior Economist and Senior Analyst at the Bermuda Monetary Authority. The views of the paper represent the views of the authors and not of the Bermuda Monetary Authority. Corresponding author contact: [email protected], +1-441-2955278

2
residing and operating outside Bermuda. As these companies transact with the outside world and have a physical presence in Bermuda, they use local Bermuda banks to conduct transactions mostly of operational nature.
Thus, the structure of the balance sheet of Bermuda banks is bifurcated. On the one hand, there is a local economy largely insulated from capital flows and attempts of acquiring ownership from the outside world and an international economy fully liberalized in terms of ownership and capital flows. As a result, Bermuda banks are the de facto managers of capital flows in Bermuda. In addition, Bermuda’s currency board is fully operated by the banks without the monetary authority having control over interest rates, except the authority’s statutory responsibility to back with foreign reserves all notes and coins in local currency. This feature of the Bermuda economy renders banks operators of monetary policy as well with the goal to maintain the system of fixed exchange rates between the Bermuda dollar (BMD) and the US dollar (USD).
As part of the Bermuda Monetary Authority’s (BMA) strategy of enhancing its prudential framework, in 2019 a project was initiated to produce a tool for liquidity stress tests that takes into account the following characteristics of the Bermuda economy.
1. The bifurcated nature of Bermuda banks’ funding from the local protected sector and the international liberalized sector.
2. The absence of independent monetary policy.
The final project whose methodology we present in this paper, is the culmination of many years of work, which started from the BMA’s participation to the submission of locational bank data to the Bank of International Settlements (BIS) and culminated in an Excel model, which is currently used for stress testing. The importance of BIS locational data stems from the fact that supervisors, both micro and macroprudential, can identify exactly the liabilities of banks stemming from either the liberalized international economy or the local protected economy. Knowing bank exposures to the local and the international economy, allows supervisors to pinpoint vulnerabilities of banks to non-resident capital flows. Given potential vulnerabilities, scenarios can be developed that are tailored to the specific economic and regulatory circumstances of each country.
In the next sections we will describe the process of how the BIS locational data is compiled for usage for the liquidity stress test exercise, how the stress testing model is built according to the compiled BIS data and how the liquidity stress test transmits shocks to the bank balance sheet.
Bermuda Economy and Bermuda Banks Bermuda is a British Overseas Territory in the Atlantic Ocean. With no natural resources and with a small geographical size, Bermuda developed over the years a very large financial services economy alongside with tourism. Financial services are dominated by large international insurance and reinsurance companies which are domiciled in Bermuda but perform operations overseas. These large international companies are called exempted companies and they are not allowed to sell goods or services to Bermuda residents.
For national accounting purposes, these companies are not included in the GDP and the BoP (Balance of Payments) calculations as they would inflate the GDP numbers and show erroneously that Bermudians have abnormally high per capita incomes. In comparison to GDP, GNI would neither be a correct measure of income, since retained earnings of exempted companies would be included as well as income paid from overseas buyers of insurance. In addition, when insurance losses measured in the several billions increase from events outside Bermuda, the BoP would move in tandem as claims would be recorded in the BoP as income paid to policy holders. These movements would cause unnecessary

3
volatility in national accounting. For these reasons, the exempted sector is treated as non-resident in Bermuda.
This non-resident international business sector is also responsible as the largest perhaps employer in Bermuda with other sectors providing ancillary services to the exempted sector. Such services can include from legal and accounting to meals and stationery. This sector is responsible for huge imports of hard currency that is used to buy goods from abroad that Bermuda is unable to produce locally.
Banks act as a gateway of Bermuda to the world economy by providing a host of services including payments, accounts for savings and cheques, investments while they operate the fixed exchange rate system which pegs the BMD to the USD at an exchange rate of one to one. Bermuda banks, as gateways to the external world, also manage the capital flows of Bermuda vis-à-vis the rest of the world.
International insurance companies as well as funds and trusts use Bermuda banks to conduct transactions with the outside world. Most deposits of international insurance companies are operational since premium and claims settlements occur overseas. Other foreign financial institutions such as funds and trusts use Bermuda banks to process payments to local accounting, legal firms which provide services to these institutions. Combining all these activities together, we call this side of the economy which is dominated by insurance companies, funds and trusts as the international economy. Parallel to the international economy operates the local economy comprised of residents, Bermudians and foreigners, and local businesses who serve the needs of the local population.
The local economy operates both in USD and BMD. USD salaries are paid from international insurance companies to local residents, while local businesses conduct business with BMD. Local banks provide lending to the local economy in the form of loans, which are denominated both in USD and BMD. Due to ownership laws, Bermudians have priority of ownership of homes and stock of companies, while foreigners are usually barred from owning homes or acquiring more than 40% of stock of a locally incorporated firm with the exception of the international business sector including international insurance companies.
For these reasons, foreign residents’ deposits are usually USD deposits that are deemed to be less sticky and are usually moving overseas and vice-versa for operational reasons. In addition to that, the international insurance sector also has less sticky deposits since they are operational in nature and as a sum they comprise less than 1% of their total assets. At the same time, international companies are not invested in physical capital in Bermuda, rather they are invested in human and financial capital which by definition is mobile and not sticky. Overall, we see a structure of two parallel economic systems operating in tandem. An international economy with operational deposits in Bermuda and a local economy with operational and non-operational deposits in Bermuda.
Given this economic structure, the BMA undertook the goal of recognizing and embedding in its macroprudential surveillance function, data that show the extent to which local banks are exposed to these two parallel economic systems. Locational data allow the disaggregation of each sector and allow us to understand the relative sizes of each economic system and how banks are accommodating both from an asset-liability point of view.
In addition, the recognition of the two parallel economic systems allows us to identify potential vulnerabilities given that the international business sector is susceptible to forces and events outside the control of local authorities. In this way, the BIS locational data assist with policy formulation and policymaking.
BIS Locational Data Compilation The BMA participates in the locational data collection exercise of the BIS since 2002. In 2017, the BMA

4
made a strategic decision to operationalize this data for macroprudential surveillance and policy purposes. Operationalization of this data required two things. First, reconciliation with prudential fillings of banks since locational data submissions are unaudited and require some form of additional checks for accuracy. Second, compilation into a format that is usable for surveillance, identification of vulnerabilities and policy decisions. In this section, we will analyze both aspects.
Reconciliation The ability to identify and assess the resilience of the banking sector to liquidity shocks is crucial to the stability of Bermuda’s financial sector. Liquidity shocks can adversely affect banks causing the possible destabilization of the financial system. As discussed above, part of the work of the BMA involves analyzing BIS locational and prudential data for macroprudential purposes. The prudential data originates from the Prudential Information Returns (PIRs) which are statistical data reports submitted each quarter by Bermuda banks to the BMA. The reports provide information about the reporting bank’s balance sheet exposures on both a consolidated and unconsolidated basis, capturing on-and off-balance sheet assets and liabilities, profitability, capital adequacy, liquidity and other relevant data. Within the PIR there is the capital adequacy report which provides essential data about the bank’s capital solvency position in accordance with Basel III standards; incorporating the Risk Asset Ratio (RAR), Common Equity Tier 1 (CET1) capital ratio, Tier 1 ratio and Leverage ratio. The BMA also requires Bermuda banks to submit supplemental reports on both liquidity and funding risk, based on the liquidity coverage ratio (LCR) and net stable funding ratio (NSFR) standards.
In 2017, the BMA conducted a data reconciliation exercise with Bermuda banks, to verify that locational data was correctly populated, consistent with prudential and BIS reporting requirements and to understand any discrepancies between prudential and locational data that may exist. The exercise was done in a two-stage approach. The first stage focused on improving the reporting quality of the BIS template from Bermuda banks, while the second stage involved validating the BIS locational data for internal use including the liquidity stress testing model.
The BMA developed an Excel tool to validate the reliability of the reported values in the BIS template, by capturing the values from the BIS locational data and comparing them with audited unconsolidated prudential data in accordance with balance sheet classifications. In this exercise we used both prudential and BIS reporting guidelines as references to align the two data sets.
To properly match the data sets, only relevant data amounts were required to be included in the Excel template. For instance, BIS locational data only requires financial asset and liability positions to be reported for locational banking statistics. To accommodate this requirement, the prudential data side of the Excel template included financial and non-financial asset balances. Once the non-financial data was identified, it was removed from the prudential total asset balance sheet, so that the two data sets were similar in structure.
The corresponding BIS locational data side contains bank assets (claim) and bank liabilities based on instrument breakdown. The PIR side of the template also factors in the reporting of retained earnings, whereby banks are instructed to only include the retained earnings portion of the shareholders’ funds. Another component added to the Excel template was formatting the BIS locational amounts to match the prudential amounts. Amounts reported to BIS are required to be in millions of US dollars (up to three decimal places), to ensure that they are comparable to prudential data (reported in thousands), the BIS locational data was multiplied by a factor of thousand. For example, an amount of $3.435 (in millions) was converted to $3,435 (in thousands). To assist with populating the Excel template, each asset (claim) and liability balance has a direct reference link mapping the data fields to their respected reporting guidelines, thus ensuring that amounts are correctly populated. Thus, there is a fixed infrastructure of Excel spreadsheets that communicate to each other. Once a BIS submission is in place, the reconciliation is automatic without further manual work.

5
In a first attempt, the BMA populated the Excel template with local and foreign currency balance sheet data using PIR and BIS locational data from a designated quarter. The template was sent to each of the respective Bermuda banks to verify balance sheet amounts, correct any data discrepancies, and provide explanations for differences equal and above the materiality threshold (≥±5%).
The BMA performed an extensive review of the received responses from the banks to understand the explanations associated with the identified data gaps. In some cases, the BMA would discuss the data gaps with the bank representative to determine the extent and impact they may have on the overall balance sheet figures. For instance, if amounts included in a particular line item in the BIS locational side where not correctly reported in the corresponding line item in the PIR side of the template, the banks will be asked to resubmit a revised template reflecting the correct classification.
Figure 1 shows an example, based on artificial data, of the Excel template at a particular point in time (quarter-end). The yellow cells are populated with the BIS locational and unconsolidated prudential data, with each asset/liability breakdown separated between Bermuda dollar (BD$) and foreign currency (FX$) amounts. The protected grey cells use formulas to calculate totals for each balance sheet line item and convert the BIS locational data units to match the prudential data unit format. On the PIR side, the non-financial assets are listed to distinguish the non-essential assets not reported per the BIS requirements (financial assets only). In the example in figure 1, the PIR side of the template reflects a simple balance sheet format, while the BIS locational side is designed to mirror the outstanding positions of assets (claims) and liabilities in accordance with the locational banking statistics format.
Since BIS locational data reports financial assets, the PIR side of the template was adjusted to reflect only financial assets to be comparable. In the example, total assets on the PIR side equal $19,000 thousand as reported by the prudential figures submitted by the bank. However, since banks are instructed to report non-financial assets (e.g. “Other tangible assets” of $300 thousand) in the template this will reduce the total asset balance to $18,700 thousand thus closely mirroring the BIS locational side of the template.
On the liabilities side, the “Shareholders’ funds” balance equal $1,000 thousand as reported by the bank in the prudential submission. The prudential data includes all components of shareholders’ funds, whereas the BIS locational data reports the retained earnings2. Therefore, to be comparable to the BIS locational data side, the only component of “Shareholders’ funds” reported on the PIR side of the template is retained earnings (e.g. $500 thousand).
We observe in the example, the PIR asset position; cash, deposits, and loans, advances, bills and financial leases totaled $12,700 thousand. The corresponding “Loans and Deposits” amount on the BIS locational asset side totaled $12,000 thousand, resulting in a material difference of 5.83% (or $700 thousand). In general, most of the data captured in the balance sheet line items should match up to each of the respective datasets; however, banks may have reported a particular asset (e.g. intercompany asset) under “Loans, advances, bills and financial leases” for PIR reporting purposes but reported the same asset under “Other instruments” for BIS reporting purposes.
When observing the liability positions in figure 1, “Other liabilities” under the PIR side totaled $4,000 thousand, compared to the totaled of $4,500 thousand of “Debt securities” and “Other liabilities” under the BIS side, resulting in a material difference of 11.11% (or $500 thousand). In some instances, this could be a result of misclassification, while in other cases the discrepancy may be a result of a non-financial liability (i.e. defined benefit pension liability) recognized only in the PIR liability side in “Other liabilities”. To closely map the asset (claim) and liability categories between the prudential and locational data sets, each PIR balance sheet line item was paired against the BIS locational balance sheet line item, by aligning the outstanding positions into the following three categories:
2 Guidelines for reporting the BIS international banking statistics, pg. 11, “B.3.1.3 Other Instruments”

6
1. Loans and deposits; 2. Debt securities; and 3. Other instruments.
For instance, PIR balance sheet items like cash, deposit, and loan amounts should also be included in the “Loans and deposits” locational statistics category, since this category comprises of loans, working capital, interbank deposits, deposits with other banks, and other additional financial assets (i.e. repos, financial leases, holding of notes and coins in circulation) 3. In the investment category of the PIR side of the template, the aggregate is composed of sovereigns, public sector entities (PSEs), banks, securitisation exposures (non-equity tranches), securitisation (equity tranches), investments in subsidiaries and associated companies, investments in the capital of other banks and financial institutions and other investments. When compared to the BIS side of the template, the equivalent assets are “Debt securities” comprising of claims in all negotiable debt instruments and “Other assets (instruments)” comprising of residual claims such as; equity securities and derivative instruments. This same approach was applied to each balance sheet item, so that the prudential and locational amounts are closely matched and correctly categorized.
The BMA recognizes that certain assets/liabilities will either be categorized as “financial assets/liabilities” or “non-financial assets/liabilities”, resulting in some differences between the prudential and locational data sets. For example, a non-financial asset (i.e. equity holdings of subsidiaries) would be omitted from “Debt securities” and “Other instruments” for BIS reporting purposes, while on the PIR side the investment would be reported in “Investment in subsidiaries and associated companies”. As such, Bermuda banks are instructed to provide an explanation for material discrepancies, factoring in the non-financial asset/liabilities as reported in the template. In certain circumstances, individual balances from the prudential and locational data may not reconcile, yet the aggregate totals may agree. The BMA considers whether the discrepancy between the individual balances has an overall material impact on the aggregate totals. Banks may have reported an asset in one category for BIS reporting purposes with the corresponding asset reported in the PIR side in another asset category, thus creating a disparity between the two individual balances.
The reconciliation exercise continues to be a crucial part of the macroprudential work each quarter, as a tool to help validate and preserve the data integrity and improve data quality for the liquidity stress testing model and other future uses to support macroprudential surveillance and policy work.
3 Guidelines for reporting the BIS international banking statistics, pg. 8 & 9

7
Figure 1. Template for Reconciliation
LegendDatacells to be completed by bankFormula cell
Company NameMATERIALITY
<=5%=> BANK OF X
ASSETSReporting guidance BD$ FX$ Total (000's)
Reporting guidance Total (000's) Change % Change
Original (as reported in
BIS)
(x 1000s to match PIR reporting)
Original (as reported in
BIS)
(x 1000s to match PIR reporting)
Cash 1 1,000.00 500.00 1,500.00
Deposits 2 1,200.00 1,000.00 2,200.00 Loans, Advances, Bills and Finance Leases 3 4,000.00 5,000.00 9,000.00
Total 6,200.00 6,500.00 12,700.00 Loans and Deposits 5.00 5,000.00 7.00 7,000.00 12,000.00 (700.00) 5.83%Debt Securities 2 2.00 2,000.00 3.00 3,000.00 5,000.00 Other Assets (instruments) 3 - - 1.00 1,000.00 1,000.00
2,000.00 4,000.00 6,000.00 Total Investments (Debt + Other Assets) 2.00 2,000.00 4.00 4,000.00 6,000.00 - 0.00%
Goodwill 5a - Other intangible assets 5b 300.00 300.00
Premises owned and occupied by reporting bank 5c -
Other property /real estate owned by the reporting bank 5d -
Operating leases 5e -
Plant, equipment and other fixed assets 5f - Other 5g -
300.00 - 300.00
8,200.00 10,500.00 18,700.00 7.00 7,000.00 11.00 11,000.00 18,000.00 (700.00) 3.89%Total Financial Assets (BIS)Total Financial Assets
Exclude non-financial assets (per the BIS guidelines)
Total Non-financial assets
1
PIR
PIR /BIS Financial Analysis
Investments 4
Q2-20XX
COMMENTSBD$ FX$
BIS
ASSETS (CLAIMS)

8
LIABILITIESReporting guidance BD$ FX$ Total (000's) LIABILITIES
Reporting guidance Total (000's) Change % Change
Original (as reported in
BIS)
(x 1000s to match PIR reporting)
Original (as reported in
BIS)
(x 1000s to match PIR reporting)
Deposit liabilities 6 6,000.00 8,000.00 14,000.00 5.00 5,000.00 9.00 9,000.00 14,000.00 - 0.00%Savings deposits 6a 1,000.00 3,000.00 4,000.00 Demand deposits 6b 3,000.00 2,000.00 5,000.00
Time deposits 6c 2,000.00 3,000.00 5,000.00 Other Liabilities 5 2.00 2,000.00 2.50 2,500.00 4,500.00 Debt Securities 6 - - - -
3,000.00 1,000.00 4,000.00 Total (Debt Securities + Other Liabilities) 2.00 2,000.00 2.50 2,500.00 4,500.00 500.00 -11.11%
Shareholders' Funds 1,000.00 1,000.00
Shareholders' Funds (Total) 500.00 - 500.00
6,500.00 8,000.00 18,500.00 7.00 7,000.00 11.50 11,500.00 18,500.00 0.00%
Comments
Total Liabilities & Shareholders' Funds (excluding portion of shareholders' capital)
BD$ FX$
4
Other Liabilities 7
500.00 500.00
Total Loans and Deposits, Other Liabilities & Debt Securities
Loans and Deposits
Portion of shareholders' capital excluded from "Shareholders' Funds"
Shareholders' capital
Source: BMA

9
Compilation Compilation of locational data is performed in the so-called balance sheet approach of the International Monetary Fund’s (IMF) balance sheet approach to financial crises. For more information on this IMF tool, papers by Allen et al. (2002), Setser et al. (2005), Harutyunyan (2018), describe in detail the rationale behind the use of this model. According to Allen “unlike traditional analysis, which is based on the examination of flow variables (such as current account and fiscal balance), the balance sheet approach focuses on the examination of stock variables in a country’s sectoral balance sheets and its aggregate balance sheet (assets and liabilities). From this perspective, a financial crisis occurs when there is a plunge in demand for financial assets of one or more sectors”.
Under the IMF balance sheet approach, balance sheets of the government, banks, corporations and households are split in a cross-like schematic form for visual easiness for policy makers. In addition, the IMF balance sheet approach splits the exposures in assets and liabilities by residency (domestic and foreign), currency and duration. If the entire balance sheet table is filled, what is being reproduced is the International Investment Position (IIP) of a country and the domestic cross-sectorial exposures.
Table 1 shows with empty numbers how the BMA balance sheets are created. In the first column are the economic actors within and outside the local economy. We observe that these are the government, commercial banks, non-bank financial institutions, non-bank and non-financial institutions dubbed as corporates, households and the rest of the world. We are only interested in the assets and liabilities of banks while we currently do not have a comprehensive household wealth survey to see assets and liabilities of households outside those that are held in local Bermuda banks.
BIS Locational data are used to fill the bank exposures. We have automated the process by connecting the locational templates with table 1, after all the data validation and reconciliation have taken place. Table 1 is produced not only in the cross section but also in time series. Each quarter the entries of table 1 are recorded and we produce a time series of exposures in order to identify trends.
Table 1 rows denote liabilities, while columns denote assets. For example, under domestic issuer of security we have a set of institutions from General Government to Non-Bank households. These institutions are the issuers of liabilities. In our case where we are interested only in banks. Thus, we use only the rows for commercial banks for holders of bank liabilities. In the columns for holders of securities i.e. assets we are only interest in assets held by domestic commercial banks.
For interbank liabilities these are recorded in the rows shaded with light green on table 1. For interbank assets there would a supposition on liabilities and for that reason we record them in a separate table. For Bermuda, interbank assets are not significant in value and we nonetheless record them but they do not alter significantly the stress testing results. Moreover, for visual convenience for the scope of this paper we do not show the breakdown of foreign issuers of securities, even though we have a breakdown of the rest of the world issuers of securities in order to record column-wise the assets that Bermuda banks own vis-à-vis foreign issuers.

10
Table 1. Aggregate Balance Sheets(In US$ millions)
Holders of Securities Domestic Issuer of Security Domestic Domestic Domestic Domestic Domestic Foreign Foreign Foreign Foreign Foreign
General Government and Central Bank
General Government and
Central Bank Commercial
Banks Non-Bank
Financial
Non-Bank
Corporate
Non-Bank-Household
General Government and Central
Bank
Commercial Banks
Non-Bank Financial
Non-Bank Corporate
Non-Bank-Household
Total Domestic
Total Foreign Total
Short Term Liabilities (totals) in foreign currency in domestic currency 50 Medium and Long Term (totals) in foreign currency in domestic currency Commercial Banks Short Term Liabilities (totals) in foreign currency 100 100 in domestic currency Medium and Long Term (totals) in foreign currency in domestic currency Equity (Capital) Non-Bank Financial Short Term Liabilities (totals) in foreign currency in domestic currency Medium and Long Term (totals) in foreign currency in domestic currency Equity (Capital) Non-Bank-Corporate Short Term Liabilities (totals) in foreign currency in domestic currency Medium and Long Term (totals) in foreign currency in domestic currency Equity (Capital) Non-Bank-Household Short Term Liabilities (totals) in foreign currency in domestic currency Medium and Long Term (totals) in foreign currency in domestic currency Equity (Capital) Foreign Short Term Liabilities (totals) in foreign currency in domestic currency Medium and Long Term (totals) in foreign currency in domestic currency Equity (Capital)
Source: BMA

11
For expositional purposes we populated two fields in table 1. For example, the number 100 in red font color is 100 monetary units in foreign currency of a liability held by a domestic non-bank financial institution. In other words, the number 100 is a deposit of 100 monetary units of a domestic non-bank financial institution to a local bank. Another example is the number 50. It represents the holding of 50 monetary units by a local bank of assets, which represent a liability of the local government in domestic currency. In other words, the local bank holds a long term sovereign bond of the local government.
Up to now, the BIS template does not refer to liquidity and maturity profiles of assets and liabilities. We split locational data to maturity brackets by making common sense assumptions. For example, all deposit liabilities of banks to other institutions are short term. If we see a loan and deposit asset of a local bank as a liability of a non-bank financial institution, we will classify it as long term since most Bermuda non-bank financial institutions are insurance companies and most likely have issued some bond with maturity longer than one year. When in doubt about the liquidity classification of an asset or liability, we will prefer to classify an asset as a long term asset and a liability as a short term liability to err on the conservative side.
When this table is fully populated we have a complete picture of the internal and external assets and liabilities of the banking system in aggregate and in isolation. We compile table 1 for each individual bank and then for the aggregate banking system. With this information in table 1, we can build liquidity stress scenarios by assuming withdrawals from sectors which are either more volatile or whose size is large enough to cause disruptions. The stresses are designed under the assumption of being extreme but plausible. In the next section we will describe how the scenarios for liquidity stresses are determined.
What the locational data allows us to do is to pinpoint exactly the potential source of vulnerabilities and the size of vulnerable positions. This is the area where stress scenarios can be developed. In this paper we are focused on liquidity stresses but also credit stresses, FX stresses etc. which can also be developed with this information. As part of the exercise we also compile a set of vulnerability indicators for the banking system. These indicators can be found on table 2.
Table 2. Selected Vulnerability Indicators
FX Liabilities/Total Liabilities External Liabilities/Total Liabilities
Short Term Liabilities/Total Liabilities Short Term Assets/Short Term Liabilities
External Short Term Liabilities/Total Liabilities Source: BMA
These indicators show the reliance of the local banking system to foreign currency and non-resident deposits in particular with issues of how these liabilities are structured vis-à-vis currency and duration.
Scenario Design Scenario design in liquidity stress tests is a very subjective exercise since liquidity runs depend on a varied set of behavioral and economic variables. In the classic paper of Diamond and Dubvig (1983), financial intermediation in the form of banks exists only if there is the chance of a bank run which can occur as a sunspot equilibrium phenomenon without specific reason. There are no agreed methodologies on liquidity stress scenarios and individual authorities tailor their stress tests and stress scenarios according to country experience and supervisory necessity.
For Bermuda banks, scenarios are constructed in order to reflect risks specific to international financial centers with a large international economy sector, human and financial capital intensive. International financial centers are receivers of capital flows and direct investment. In Bermuda, capital flows are not

12
speculative and short term, which have the tendency to be unstable (hot money) but long term in nature. In addition, ownership restrictions and a shallow capital market for domestically-issued securities precludes speculative attacks.
As a place for international insurance and reinsurance, international insurers place significant operational deposits in the local banks. Funds and trusts are also active in Bermuda with capital flows and operational deposits for these entities also managed by Bermuda banks. These flows are denominated in USD and other foreign exchange. On the other hand, the local economy is characterized by residents and local businesses that transact mainly in Bermuda dollars.
Thus, we tend to believe that the international economy is far more mobile than the local economy and more prone to capital reversals than the local economy, which is also tied to Bermuda dollar. But the capital reversals are not from speculative hot money, rather from structural events that influence the conduct of business in an international financial center. Therefore, the scenarios are based on a set of circumstances that can influence the life of an international financial center and for the case of Bermuda, circumstances that affect the international insurance and reinsurance industry. Such circumstances can be:
Global economic and regulatory developments in insurance markets that increase the cost of doing business in Bermuda. Such developments can include protectionism, trade barriers, punitive treatment of provision of foreign-based insurance services etc.
A natural catastrophe that could decimate Bermuda’s infrastructure and render conduct of business in Bermuda impossible. Destruction of property and /or loss of life of key employees as well as destruction of physical premises of international insurance firms that would render their operations here, non-viable for an extended period of time.
A bank-specific idiosyncratic shock accompanied with loss of confidence in other banks that can trigger massive outflows from institutional investors.
An international shock that could create severe losses in banks’ asset portfolios and trigger runs from loss of confidence.
These economic circumstances are evaluated and scenarios are produced with a determined outcome of deposit outflows. The Financial Stability Department (FSD) at the BMA, monitors sectorial developments in international insurance and participates in relevant standard setting bodies such as the International Association of Insurance Supervisors (IAIS), thus the FSD has a good picture of scenarios or instances where international insurance on Bermuda can be threatened. Banking supervision have their own views about banking risk as microprudential supervisors.
Locational data are used to distinguish the type of deposits that are part of the international business economy. Given location, type of activity and duration we are to pinpoint exactly where we think that an extreme but plausible scenario could be realized based on economic circumstances such as the ones that we discussed above.
In the Bermuda case of particular importance are liabilities of banks from non-bank financial institutions, which are broadly international insurance companies, funds and trusts. For BIS locational purposes these deposits are reported as resident deposits since the place of domicile, Bermuda in this case, defines also the residence. However, from an economic point of view these companies are very internationalized and we treat their deposits as more volatile in the design of scenarios. In addition, we allow the deposit run to develop in up to five periods which could be either, weeks, months or even days depending on the scenario design in order to simulate the progression of outflows in a staged fashion and not abrupt and immediate situations.

13
Liquidation Waterfalls When deposits are withdrawn, assets need to be sold to cover for the withdrawals. However, according to accounting rules some assets are recorded as Available for Sale (AFS) and other assets as Held to Maturity (HTM). In addition, some assets are liquid, while others are not. Therefore, as HTM and non-liquid assets are liquidated they incur capital losses. Capital losses stem from bid-ask spreads in illiquid markets or from realizing revaluation profits or losses of an HTM asset sold and marked-to-market.
Thus, the assumption that we make in liquidity stress tests is that banks will tend to liquidate first their AFS liquid assets, then their HTM liquid assets and lastly a stock of illiquid assets. AFS assets will be sold immediately without capital losses, while HTM assets will suffer mark-to-market revaluation. Illiquid assets will suffer from bid-ask spread price differentials. In this way, liquidity stresses can become capital stresses through the comprehensive income statement.
Locational data provide us the types of assets that are most likely to be liquidated and they supplement prudential fillings which also have a breakdown of assets. In particular, locational data can help us in identifying potential assets that cannot be liquidated if they are in different countries and are encumbered.
Care has to be taken to do the proper accounting of capital losses and how much assets are available for liquidation if they have to be revalued during a sale. In this section we will provide the accounting formulas which calculate the available assets for sale given haircuts and revaluations and the cumulative losses suffered by the bank during the sale of these assets. Before we proceed we introduce the following notation table.
Table 3. Notation
𝐴 AFS assets at time t 𝐵 HTM assets at time t 𝛤 Illiquid assets at time t 𝐶 Outflow at time t
1 𝐻 Haircut for each asset (%) When an HTM or illiquid asset needs to be liquidated due to an outflow at a haircut loss, 1 𝐻 1, the accounting is identical to having the asset without a haircut but with an outflow raised by the amount of the haircut. There is a formal proof for this result according to the following lemma.
Lemma 1. Assume an asset with value 𝐵 which has to be liquidated up to an amount 𝐶 with 𝐶 𝐵 . The value of the remaining asset 𝐵 after the liquidation at a haircut 1 𝐻 1, is:
𝐵 𝐵𝐶𝐻
1
Proof
When confronted with liquidation to the amount of 𝐶 , the bank splits the available assets 𝐵 into 𝐶 and 𝐵 𝐶 . 𝐶 is the amount of assets that will be used for liquidation for the outflow 𝐶 and 𝐵 𝐶 the remainder. To cover outflow of 𝐶 , the available assets are 𝐻𝐶 because of mark to market losses. The bank now has to find an additional 𝐻𝐶 𝐶 𝐶 𝐻 1 0 from 𝐵 𝐶 since 𝐻 1. Thus there is going to be a further liquidation:
𝐶 𝐻 1 𝐻 𝐶 𝐻 1 𝐶 𝐻 1 0
Again a new liquidation is needed for the deficit 𝐶 𝐻 1 . This equals:

14
𝐶 𝐻 1 𝐻 𝐶 𝐻 1 𝐶 𝐻 1 0
Doing this calculation ad infinitum and taking care of the changing signs we have that the remainder is:
𝐵 𝐵 𝐶 𝐶 𝐻 1 𝐶 𝐻 1 𝐶 𝐻 1 ⋯ 𝐵 𝐶 1 𝐻 1
𝐵 𝐶 1 𝐻 𝐵𝐶
1 1 𝐻𝐵
𝐶𝐻
∎
One can see that 𝐵 can become negative. This means that all HTM assets 𝐵 have been depleted and the bank needs to liquidate other less liquid assets. For the waterfall of assets, we have the following formulas which describe the value of assets after liquidation:
𝐴 max 𝐴 𝐶 2
𝐵
max 𝐵 𝐻 𝐶 𝐴 , 0 , |𝐴 𝐶 | 𝐵
max 𝐵𝐴 𝐶
𝐻, 0 , otherwise
3
𝛤
min 𝛤 𝐻 𝐶 𝐴 𝐵 𝐻 , 𝛤 , |𝐴 𝐵 𝐶 | 𝛤
𝛤 min 𝐵𝐶 𝐴
𝐻, 0 , otherwise
4
These formulas are neither particularly appealing, nor do they have a formal proof. They are results from multiple trial and errors in order to replicate the correct amounts. Equation (2) describes the amount of AFS assets after a cash flow 𝐶 . If the outflow 𝐶 is larger than all AFS assets 𝐴 , then these are depleted and take value equal to zero and HTM assets have to liquidated.
Equation (3) describes the value of HTM assets once AFS assets have been depleted. The equation is split into two parts. The condition |𝐴 𝐶 | 𝐵 means that the outflow after the liquidation of AFS assets is large enough to deplete all HTM assets completely. In this case, the amount of available assets to liquidate are 𝐵 𝐻 𝐶 𝐴 which are negative and the max function caps them at zero. In the case where the outflow will not deplete all HTM assets we need to employ equation (1) which raises the value of the outflow by the haircut 𝐻 to account for the mark to market losses when HTM assets are liquidated. The same logic pertains to equation (4), therefore we will not repeat its logic in detail.
Note that if 𝐵 𝐶 one cannot retrieve formula (1). There is a discontinuity at that point. The reason is that for total liquidation the sharing mechanism between the assets that need to be liquidated and those assets that are not liquidated that produces formula (1) is not present any more. At the point at which 𝐶 𝐻𝐵 we will have 𝐵 0 and for every 𝐶 𝐻𝐵 we will have 𝐵 0. What it will change is the loss carried forward for 𝛤 since for 𝐶 𝐻𝐵 up to 𝐶 𝐵 𝜀, 𝜀 0 there is partial liquidation of 𝐵 ,while at 𝐶 𝐵 there is full liquidation and different formulas are used in equation (3).
Having established the values of assets post liquidation, we now calculate the loss from revaluation and haircuts of HTM and illiquid assets. The losses for each asset type, 𝐿 for HTM and 𝐿 for non-liquid assets are given by the following equations:
𝐿𝐵 𝐶 𝐴 𝐵 , 𝐵 0
𝐵 𝐻 1 , otherwise5

15
𝐿𝛤 𝐻 𝐶 𝐴 𝐵 𝛤 , 𝛤 0
𝛤 𝐻 1 , otherwise6
Equations (5) and (6) describe the losses from revaluation and are both split into two branches. In equation (5) if there is anything left after the liquidation i.e. 𝐵 0, then the loss is the haircut suffered in the entire value of HTM assets. The same logic applies for non-liquid assets in equation (6). Running the stress test forward for five periods, we calculate the losses from asset sales for each period. Then, the total losses for the all five periods of the test are:
𝐿 𝐿
Example of Waterfall In this example, we show how the calculations work using formulas (1)-(6) in an Excel spreadsheet. We assume that we have $100 of AFS, $100 of HTM and $100 of illiquid assets. The haircut is assumed to be 10% or 𝐻 90%. Moreover, we assumed that the outflow is $250. We will do the calculations on what assets are left and the losses incurred step-by-step.
1. AFS assets are first to be liquidated, thus $100 $250 $150 of deficit and there is zero left of AFS.
2. HTM are second to be liquidated but at a haircut. Since there is $100 of HTM and $150 to be liquidated, then the amount available for sale for HTM is: $100 0.9 $150 $60.
3. Now the $60 that needs to be liquidated has to be sold from the illiquid assets which themselves need to suffer a haircut. Therefore the amount left is: $100 $60/0.9 $33.333.
If there were no valuation haircuts for both HTM and illiquid assets, the HTM assets deficit would be $50 instead of $60 and the remaining illiquid would be $50 instead of $33.333. The losses that eat up capital are first from HTM revaluation and second from illiquid asset sales. These are calculated as follows:
1. If there were no haircut for HTM assets, the value of the deficit would have been $50 instead of $60, thus the loss equals $10.
2. If there were no haircut for illiquid assets, the value of the outflows would be $60, now instead is $60/0.9, thus the loss is $60 1 1/0.9 $6.667.
3. Cumulatively the losses are $10 $6.667 $16.667.
The losses affect the capital position of the bank by first eating out equity and then changing the definition of risk-weighted assets as sales of assets reduce the stock of high quality liquid assets with low risk weights and instead increase the share of assets with higher risk weights.
Numerical Example In this section we will provide a numerical example based on artificial numbers on how the liquidity stress test can be conducted. In table 4 we provide the numbers for assets and liabilities of a model bank for the purposes of this paper.

16
Table 4. Model Bank Balance Sheet (In US$)
Assets Liabilities Cash and T-bills (AFS) 1,000,000 Foreign corporate deposits 2,000,000Long-term corporate bonds (HTM) 2,000,000 Domestic corporate deposits 2,000,000 Real estate (Illiquid) 2,000,000 Foreign households 2,000,000 Loans (Unable to liquidate) 5,000,000 Domestic households 2,000,000 Other assets 0 Equity 2,000,000 Total 10,000,000 Total 10,000,000
Source: Artificial data
The liability structure is compiled by break-ups according to BIS locational data. Corporate deposits can be either the sum of bank and non-bank financial institutions including non-financial corporations. These are typical BIS categories and can be easily aggregated into broader categorizations such as foreign and domestic corporates. Likewise, households and NPISH are relevant BIS categories and can again be broadly aggregated into domestic and foreign sub-categories.
In this example, we will assume that 99% of foreign deposits will flee within five time periods. The total amount to flee is 99% of $4,000,000. At each period 100 1 0.01 / 60.2% of each deposit category flees the bank. A scenario could be that foreign depositors/investors lose trust in the local government due to concerns in sovereign rating or some other geopolitical factors. As foreign depositors tend to be yield-seeking they are assumed to be more sophisticated and react faster to bad news. Once foreign depositors start fleeing, the central bank imposes capital controls and forbids any withdrawals from domestic depositors.
A rationale for such differentiated treatment of foreign vs. domestic depositors is that the government may not want to get bogged down into international litigation with foreign investors who would see their money trapped in the domestic banking system. Or, by being more sophisticated, foreigners are faster to withdraw especially if they have demand deposits instead of term deposits. In any event the scenario can take into account various variations around the thematic of foreign capital fleeing a country.
We assume that HTM and illiquid assets suffer a 10% haircut if they are liquidated, or in our notation 𝐻 0.9. Table 5 shows the results of the stress test for the first and final time period of the stress test.
Table 5. Liquidity Flows and Results
Time Period 1 Flows of Assets/Liabilities Losses of Portfolio Revaluation
Deposit Outflow 2,407,571 HTM Asset Losses 46,603 Cash and T-bills (AFS) 0 Illiquid Asset Losses 0 Long-Term Corporate Bonds (HTM) 436,031 Real Estate (Illiquid) 2,000,000 Total Losses Period 1 46,603
Time Period 5 Flows of Assets/Liabilities Losses of Portfolio RevaluationDeposit Outflow 60,475 HTM Asset Losses 0 Cash and T-bills (AFS) 0 Illiquid Asset Losses 71,111 Long-Term Corporate Bonds (HTM) 0 Total Losses Period 5 71,111 Real Estate (Illiquid) 711,111 Total Period Losses 424,360
Source: Artificial data

17
We observe that at the end of the period AFS and HTM assets are completely depleted and there is only some real estate left that has been liquidated. From table 4 we assumed that 99% of international depositors will flee implying a departure of $3,960,000, thus we expect to have left from $5,000,000 of assets that can be sold, around $1,040,000. Yet we have $711,111 left. This is due to capital losses as more assets are required to be sold since HTM and illiquid assets are subject to haircuts.
The losses are calculated separately and in total they are of the amount of $424,360. Losses accumulate from sequential sales of assets which are recorded as HTM or are illiquid. HTM assets suffer losses since they are recorded at book value and at liquidation they are sold at market value, thus the capital loss will move through the comprehensive income statement to the capital and surplus. Illiquid assets are revaluated due to bid-ask spreads in illiquid markets, which may not have a readily quotable price. In any event, these revaluations translate liquidity runs into solvency deterioration if the bank matches most of its liquid liabilities with less liquid assets.
In this example, the BIS categorization of deposits is crucial for the design of the scenarios. An overarching scenario of 99% withdrawal of deposits is extreme and implausible if the drivers of the withdrawal are not sufficiently understood. However, knowing deposits by sector and location we can articulate plausible scenarios and tie them into a coherent macroeconomic scenario. The usefulness of BIS locational data is that they allow the stress test to have an internal consistency on the stresses and also stress the bank with relevant economic shocks.
References
Andreas A. Jobst & Li Lian Ong & Christian Schmieder, 2017. "Macroprudential Liquidity Stress Testing in FSAPs for Systemically Important Financial Systems," IMF Working Papers 17/102, International Monetary Fund.
Brad Setser & Ioannis Halikias & Alexander Pitt & Christoph B. Rosenberg & Brett E. House & Jens Nystedt & Christian Keller, 2005. "Debt-Related Vulnerabilities and Financial Crises," IMF Occasional Papers 240, International Monetary Fund.
Brad Setser & Nouriel Roubini & Christian Keller & Mark Allen & Christoph B. Rosenberg, 2002. "A Balance Sheet Approach to Financial Crisis," IMF Working Papers 02/210, International Monetary Fund.
Diamond, Douglas W & Dybvig, Philip H, 1983. "Bank Runs, Deposit Insurance, and Liquidity," Journal of Political Economy, University of Chicago Press, vol. 91(3), pages 401-419, June.
Harutyunyan, Artak & Muñoz, Carlos Sánchez, (2019), The IMF balance sheet approach: towards from-whom-to-whom information on cross-border portfolio securities in Settlements, Bank for International eds., Are post-crisis statistical initiatives completed?, vol. 49, Bank for International Settlements.

Macroprudential Liquidity Stress
Tests Using BIS Locational
Banking Statistics
Irving Fisher Committee on Central Bank Statistics, European Central Bank, Banco de Portugal, Lisbon, Portugal.
Nikolaos Georgiopoulos. Senior Economist.
Carnell Lambert. Senior Analyst.
Disclaimer: The views in this presentation are of the authors and they do not represent the views of
the Bermuda Monetary Authority (BMA)

Bermuda Economy and Bermuda Banks
• Bermuda is a British Overseas Territory located in the Atlantic Ocean.
Population: 60,000. Area: 53.2 km².
• No natural resources, inability to create local capital intensive industries.
• Instead Bermuda developed tourism and financial services (insurance and
reinsurance).
• (Re)Insurance and tourism account for the majority of FX receipts.
• Banks act as gateways between Bermuda legal entities and individuals and the
rest the world.
• Bermuda banks serve the local economy and the international business economy
under unified entities, but local economy and international business economy are
exposed to different shocks.

Bermuda Economy and Bermuda Banks
• International insurance companies are exposed to the international underwriting
cycle, tax and regulatory effects. These are largely overseas shocks with the
Bermuda Government unable to intervene.
• Local economy is driven by domestic supply and demand factors which are also
affected by employment and FX receipts from international insurance and tourism.
• Banks have a bifurcated balance sheet for the local economy and the international
economy.
• International sector has operational deposits, the domestic sector has deposits for
savings, lending and operational purposes.
• BMA wanted to understand the dynamics of this bifurcated nature for policy
purposes especially in banking supervision at a microprudential level, recovery &
resolution planning and macroprudential surveillance.

BIS Locational Statistics and Bermuda Banks
• Starting point: BIS locational statistics.
• Location, currency and duration are essential to understand the
bifurcated nature of Bermuda bank balance sheets.
• Project: A comprehensive liquidity stress test for Bermuda banks
to inform BMA about potential vulnerabilities from the bank
balance sheets.

BIS Locational Statistics and Liquidity Stress Tests - Milestones.
• BIS data is unaudited. There was a need for comprehensive validation of the data.
Achieved in 2017 after one year of back testing past submissions using a special
template BMA created for validation.
• There was a need to present the data in a convenient form. We used the IMF
Balance Sheet Approach (Allen et al. 2002) and we linked to the IMF-like balance
sheets the submissions. Achieved in 2018.
• Validation and data compilation are almost fully automated processes done
quarterly.
• Liquidity stress testing model uses the BIS submissions as inputs, together with
prudential data. Final operational model created in October 2019.

Holders of Securities
Domestic Issuer of Security Domestic Domestic Domestic Domestic Domestic Foreign Foreign Foreign Foreign Foreign
General Government and Central Bank
General Government and
Central Bank
Commercial Banks
Non-Bank
Financial
Non-Bank
Corporate
Non-Bank-Household
General Government and Central
Bank
Commercial Banks
Non-Bank Financial
Non-Bank Corporate
Non-Bank-Household
Total Domestic
Total Foreign
Total
Short Term Liabilities (totals)
in foreign currency
in domestic currency 50
Medium and Long Term (totals)
in foreign currency
in domestic currency Commercial Banks Short Term Liabilities (totals)
in foreign currency 100 100
in domestic currency Medium and Long Term (totals)
in foreign currency
in domestic currency Equity (Capital) Non-Bank Financial Short Term Liabilities (totals)
in foreign currency
in domestic currency
Medium and Long Term (totals)
in foreign currency
in domestic currency Equity (Capital) Non-Bank-Corporate Short Term Liabilities (totals)
in foreign currency
in domestic currency
Medium and Long Term (totals)
in foreign currency
in domestic currency Equity (Capital)
Non-Bank-Household
Short Term Liabilities (totals)
in foreign currency
in domestic currency
Medium and Long Term (totals)
in foreign currency
in domestic currency
Equity (Capital) Foreign Short Term Liabilities (totals)
in foreign currency
in domestic currency Medium and Long Term (totals)
in foreign currency
in domestic currency Equity (Capital)

Scenario Design of Liquidity Stress Test
• Once we have the BIS submissions we combine them with prudential submissions
in the stress testing model.
• Liquidity stress scenarios are not produced according to an econometric method,
but using a “story-telling” approach.
• Financial stability department devises scenarios in the form of “Bermuda banks
are hit by this shock emanating from this sectorial imbalance or macroeconomic
development”. Then we devise a space of possible withdrawals of deposits
according to the scenario for each BIS reported sector, currency and duration of
liabilities/assets.
• We assume a waterfall of asset liquidations. AFS assets are first to be sold, HTM
second and illiquid assets are the last resort. Based on the scenario outflow, we
know exactly which assets are going to be sold and we assume haircuts to the
valuation of HTM and illiquid assets.

Scenario Design of Liquidity Stress Test
• All these features are blended together to provide us with post-stress LCR, Tier
1/RWA and final amount of assets and liabilities.
• The stress test can be conducted in reverse, i.e. which outflow can generate a
specified LCR, Tier 1/RWA or other indicator.
• For LCR calculation purposes, assets and liabilities are matched between
prudential, BIS and LCR templates. This is a tedious process and we literally go
line by line per broad asset categories to match three separate
databases/calculation methods.
• There are some discrepancies when we try to match the data but we make sure
that the matching calibrates the current LCR within reasonable accuracy. We allow
around 5 percentage points difference between actual and calibrated LCR if the
actual LCR is way above 100%.

Sample of Liquidity Stress Test based on Artificial Data
Assets Liabilities
Cash and T-bills
(AFS)1,000,000
Foreign corporate
deposits2,000,000
Long-term corporate
bonds (HTM)2,000,000
Domestic corporate
deposits2,000,000
Real estate (Illiquid) 2,000,000 Foreign households 2,000,000
Loans
(Unable to liquidate)5,000,000
Domestic
households2,000,000
Other assets 0 Equity 2,000,000
Total 10,000,000 Total 10,000,000
BIS lo
cation
al taxon
om
y
Pru
de
ntial fillin
gs taxon
om
y

Sample of Liquidity Stress Test based on Artificial Data
Time Period 1
Flows of
Assets/LiabilitiesLosses of Portfolio Revaluation
Deposit Outflow 2,407,571 HTM Asset Losses 46,603
Cash and T-bills (AFS) 0 Illiquid Asset Losses 0
Long-Term Corporate
Bonds (HTM)436,031
Real Estate (Illiquid) 2,000,000 Total Losses Period 1 46,603
Time Period 5
Flows of
Assets/LiabilitiesLosses of Portfolio Revaluation
Deposit Outflow 60,475 HTM Asset Losses 0
Cash and T-bills (AFS) 0 Illiquid Asset Losses 71,111
Long-Term Corporate
Bonds (HTM)0 Total Losses Period 5 71,111
Real Estate (Illiquid) 711,111 Total Period Losses 424,360
Assumptions: 10% of value haircut due to sale of HTM, illiquid assets, five-period liquidity
stress test, 99% of international deposits flee.

Pre-Stress
Post-Stress
0.0
20.0
40.0
60.0
80.0
100.0
120.0
140.0
Pre and Post-Stress LCR(In percent)
Pre-Stress
Pre-Stress
Post-Stress
Post-Stress
0.0
2,000.0
4,000.0
6,000.0
8,000.0
10,000.0
12,000.0
Assets Liabilities
Assets and Liabilities Pre/Post Stress(In US$ millions)
Pre-Stress
Post-Stress
0.0
500.0
1,000.0
1,500.0
2,000.0
2,500.0
Pre and Post-Stress Capital and Surplus(In US$ millions)
-500,000.0
0.0
500,000.0
1,000,000.0
1,500,000.0
2,000,000.0
2,500,000.0
Today Day 1 Day 2 Day 3 Day 4 Day 5
Asset Run-Off from Liquidations(In US$ millions)
Liquid Assets (AFS) Liquid Assets (HTM)
Illiquid Assets
All numbers and figures are based on artificial data

Thank you for your attention
Any Questions

1/1
IFC Conference on external statistics "Bridging measurement challenges and analytical needs of external statistics: evolution or revolution?", co-organised with the Bank of Portugal (BoP) and the European Central Bank (ECB)
17-18 February 2020, Lisbon, Portugal
What value added in the trade balances of euro area financial centres?1
Virginia Di Nino and Anna Ekstam,
European Central Bank
1 This paper and presentation were prepared for the meeting. The views expressed are those of the authors and do not necessarily reflect the views of the BIS, IFC, BoP, ECB or
the central banks and other institutions represented at the meeting.

What value added in the trade balances of euroarea financial centres?∗
Virginia di Nino†
European Central BankAnna Ekstam
European Central Bank
August 12, 2020
Abstract
Beside large capital flows, euro area financial centres feature important and growingtrade surpluses. We investigate the composition of their gross trade flows and disen-tangle (i) domestic and foreign production content that is (ii) directly traded with finalabsorbing economies or embedded in intermediates that are carried to final destinationby partner countries. This accounting exercise uncovers that foreign production tran-siting through their borders account for most of the surpluses of financial centres butalso that the net surplus in domestic value added traded directly with final consumersis twice as large as in other euro area economies. MNEs allocate to financial centresthe value created globally, they do through transfer pricing practices which underminethe correct representation of the external position of these countries with a bearing alsoon the external position of the euro area; their participation in production chains alsoappears oddly large. When we replace the official trade statistics with predictions basedon the gravity law of trade, the surpluses of main euro area financial centres disappear.
Keywords: financial centres, profit shifting, trade balance, domestic and foreign,value addedJEL-Classification: F14, F23, F40
∗We would like to thank Ettore Dorrucci for guidance and support, participants at the ECB DG-Einternal seminar and at the IFC Conference on external statistics "Bridging measurement challenges andanalytical needs of external statistics: evolution or revolution?" for comments and suggestions. The viewsexpressed in the paper are those of the authors and do not necessarily reflect those of the ECB or of theESCB.†Correspondence address: European Central Bank, 60311 Frankfurt am Main, Germany; E-mail address:

Non-technical Summary
The role of financial centres as hub of global financing, financial risk sharing and inter-national capital movements makes the size of the financial flows transiting through theirbalance of payments magnitudes larger than their domestic economy. In the course of thepast decade their trade flows have also expanded enormously, in a few cases beyond anyeconomically reasonable number for the size of their economy. Furthermore since exportsgrew constantly more than imports, their trade surpluses rapidly piled up.
On paper, this condition may indicate the presence of macroeconomic imbalances whilein practice it also reflects MNEs’ global operations rather than domestic disequilibria. Fi-nancial holdings and specialised subsidiaries of multinationals (MNEs) are often locatedin financial centres that offer favourable treatment to profit taxation and the euro area ishome of several globally important ones. For these reasons the euro area statistics sufferpotentially more than other regions from distortions due to MNE operations, a side effectof globalisation.
Some recent works provide first measurements of the base erosion and profit shifting(BEPS) size globally (see Bolwijn, Casella and Rigo (2018) and Tørsløv, Wier and Zucman(2018)). This paper contributes to the literature on MNEs activity in financial centres witha novel view on their external imbalances from a value added perspective. Our analysissheds light on additional aspects of profit shifting practices.
The trade balance of euro area countries is broken down by its value added content. Inparticular, we separate the value contained in foreign trade transactions into the part that(i) the exporting country itself and (ii) its partner economies have produced and exported,either (iii) directly to final consumer or (iv) to intermediate importers that, after furtherprocessing, re-export elsewhere.
Our approach identifies what components of the trade balance are most contaminatedby MNEs operations and in which direction.
The bilateral break-down highlights that in order to book value in financial centres,MNEs inflate the value of domestic production exported by financial centres, possibly over-pricing tasks performed there. These transfer pricing practices underpin the contributionof domestic production for final absorption in net trade balance that in financial centres istwice as large as in other euro area economies.
Moreover, the convenience of such practices is maximised when operated on the ex-factory price. This explains why financial centres act as transit for final (or almost final)production of other economies, their net trade in foreign value added absorbed by directimporter is atypically large. Finally our decomposition highlights large deficits in domesticproduction that is subject to further processing elsewhere; imports from original producersfor further processing are way bigger than the value of the production they export forfurther processing.
1

All these operations which are likely to conceal transfer pricing practices, involve atleast the crossing of three countries and are therefore classified in the literature as globalvalue chain (GVC) trade. Their GVC participation index is the highest in the world andfinancial centres appear as the most downstream positioned group of countries.
We find that financial centres are conduits economies of other’s production as much asthey are of financial transactions.
We also suggest a correction methodology based on trade gravity estimations and en-compassing indirect exports and GVC trade, that allows to recompute trade balances infinancial centres as predicted by gravity. The largest correction is performed on the do-mestic production entering global value chains but directly traded with final consumers;this component especially affected profit shifting practices as it pertains the value bookedin financial centres. As a results of our corrections the aggregate trade balance of the euroarea financial centres shrinks very substantially and remain stable over time. Accordingto our methodology profit shifted to Luxembourg, Ireland, Belgium and the Netherlandswould amount to $170 billion in 2014, not far from the $220 billion found by Bolwijn et al.(2018) for the advanced economies.
2

1 Introduction
Financial centres foster international capital movements, enhance access to global financing,favour risk sharing across economic agents. This typically makes the size of the financialflows transiting in their balance of payments (BoP) magnitudes larger than their domesticeconomy. In the course of the past decade their trade flows have also expanded enormously,in a few cases beyond any economically reasonable number for the size of their economy.Furthermore since exports grew constantly more than imports, their trade surpluses rapidlypiled up.
On paper, this condition may indicate the presence of macroeconomic imbalances, inpractice it reflects MNEs’ global operations rather than domestic disequilibria. Activityof global companies reverberate across the external account of hosting countries and inparticular on their external balances, leaving footprints in several macro statistics. Financialholdings and specialised subsidiaries of multinationals (MNEs) are often located in financialcentres and the euro area is home of several globally important ones. For these reasons theeuro area statistics suffer potentially more than other regions from distortions due to MNEoperations, a side effect of globalisation.
Several works point out that MNEs pursue tax-optimisation on global scale by shift-ing value (profits) in financial centres where they receive favourable fiscal treatments andidentify transfer pricing and licensing as the dominant channels (see Dowd, Landefeld andMoore 2017; Flaaen et al. 2017; Dharmapala 2019).
Some studies investigate the effects of profit shifting on macro conditions in home coun-tries of headquarters. Overesch (2009) finds that the size of multinationals’ real investmentsin a high-tax country is positively affected by a lower taxation of shifted profits. Guvenenet al. (2017) show that, over the past 25 years, profit shifting has subtracted each yearbetween 0.1% and 0.25% growth to the US aggregate productivity, with strongest effectsin RD-intensive industries.
The debate about global firms tax strategies has received increasing space in the newsand captured policymakers attention as crawling capital taxation and rising labor tax-burden led to rising inequality in advanced economies. However authorities face severalchallenges in finding silver bullet evidence of MNEs misbehaviour due to the lack of microstatistics, difficulties in pricing ICT services and royalties and to the complex schemes,involving transactions going through several jurisdictions, engineered by MNEs to escapecorporate taxation.
Recent work provides first measurements of the base erosion and profit shifting (BEPS)size; globally, one estimation is obtained measuring yield differentials on foreign invest-ments across countries and considering evidence of it the premia obtained by companies oninvestments in financial centres. Alvaredo et al. 2018 link the large current account surplusin low-tax jurisdictions to the favourable corporate taxation and attempt a first correction
1

of official BoP statistics based on mirror statistics and micro information.
This paper contributes to the literature on MNEs activity in financial centres with anovel view on their external imbalances from a value added perspective and sheds light onadditional aspects of profit shifting practices. In particular it discusses how BEPS practiceslead to a misrepresentation of positioning and participation of financial centres in globalvalue chains (GVCs). As mentioned, moving profits implies an allocation of value producedglobally to specific countries. This has repercussions on the estimated productivity, onperceived comparative advantages and aggregate production structure of financial centres.Our approach identifies what components of the trade balance are most contaminated byMNEs operations and in which direction. We also suggest a correction methodology basedon the gravity law of trade that allows to recompute trade balances in financial centres aspredicted by gravity.
The trade balance of euro area countries is broken down by its value added content.In particular, we separate the value contained in foreign trade transactions into the partthat (i) the exporting country itself and (ii) its partner economies have produced andexported, either (iii) directly to final consumer or (iv) to intermediate importers that, afterfurther processing, re-export elsewhere. We then compare similar decomposition acrosscountries and unveil that main euro area financial centres (namely the Netherlands, Ireland,Luxembourg and Belgium) share a strikingly similar type of trade balance decomposition,which is not traceable elsewhere.
Some country pairs relationships are more concerned than others by MNEs activity,some components of the trade balance are more affected by global operations than others.
The bilateral break-down highlights that certain peculiarities are common exclusively inbilateral transactions concerning financial and non-financial centres; in other words low andhigh taxation jurisdictions. Bilateral flows are not all equally distressed by MNEs strategiesand we trace back differences across countries to the extent that external statistics areplagued with global operations of MNEs.
In order to book value in financial centres, MNEs inflate the value of domestic productionexported by financial centres, possibly overpricing tasks performed there. These transferpricing practices underpin the contribution of domestic production for final absorptionin net trade balance that in financial centres is the twice as large as in other euro areaeconomies; we refer to this component of the trade balance as DV A−DIR in the text.
Moreover the convenience of such practices is maximised when operated on the ex-factory price. This explains why financial centres act as transit for final (or almost final)production of other economies, their net trade in foreign value added absorbed by directimporter is atypically large (we refer to it in the text as FV A−DIR). Finally our decom-position highlights large deficits in domestic production that is subject to further processingelsewhere; import from original producers for further processing is way bigger than the valueof the production they export for further processing (the term is labelled as DV A−GV C
2

in the paper). Besides, all these operations which are likely to conceal transfer pricingpractices, involve at least the crossing of three countries and are therefore considered bypractitioners as supply chain trade. Their GVC participation index is the highest in theworld and financial centres appear as the most downstream positioned group of countries.
A large and positive trade balance held in foreign production and a negative tradebalance in domestic production traded abroad suggest a "in chain" positioning close tofinal consumers, relative to their trading partners.
In conclusion, financial centres are conduits economies for real transactions as much asthey are of financial transactions; just a very small amount of foreign trade booked in theirbalance of payments is for domestic absorption.
In this paper we take up the challenge to correct official trade flows statistics of finan-cial centres for the footprints left by MNEs. We do so by resorting to predictions of anaugmented gravity model of bilateral gross exports, domestic value added exported to finalconsumers, and domestic value added exported through intermediary countries indirectlyto final consumers. The foreign value added exported via financial centres is obtained as thedifference between predicted gross exports and predicted exported domestic value added.The magnitude of global value shifted to euro area financial centres is the difference betweenofficial and predicted trade balances. Similarly we correct GVC participation and locationmeasures.
The aggregate trade balance of financial centres in our predictions shrinks substan-tially and stabilise. In particular the estimation downsizes gross exports, domestic andforeign production content substantially; the largest correction is performed on the domes-tic production entering global value chains but directly traded with final consumers; thiscomponent is likely to be the most affected by profit shifting practices as it pertains thevalue booked in financial centres. Profit shifted to Luxembourg, Ireland, Belgium and theNetherlands is found to amount all together to $170 billion in 2014, which is comparablewith previous evaluations in the BEPS literature. Our strategy may not be sufficient to fullycorrect for BEPS practices as GVC participation of financial centres is still exceptionallyhigh, although the positioning is definitely less downstream.
The paper introduces our novel decomposition of trade balances by the type of valueadded in section 2 and compares them across types of countries (financial centres versusother euro area main economies, and other large economies like US, UK and China); itreviews GVC measures in section 3. Section 4 provides details on gravity specificationaugmented to control for the structure of foreign trade of the bilateral importers and section5 discusses estimates and compute new trade balances as well as GVC measures based onpredicted trade flows. We perform a series of checks on the validity of the methodologyand on our findings robustness in section 6. Section 7 concludes with a review of maintakeaways.
3

2 The Trade balance in value added
Financial centres feature very sizeable and rising trade surpluses. In countries where finan-cial holdings and special purpose subsidiaries are concentrated, exports and imports flowsare heavily influenced by systematical misreporting of intra-firm trade transactions. Trans-fer pricing practices result in exports overvaluation as the value added created globally byMNEs is allocated there, promoting the build up of trade surpluses in these countries. Thisoccurs despite financial centres differ in their production systems and each exhibits its owntraits in terms of activities that MNEs subsidiaries located there specialise in.
Subsidiaries and partners of global companies may be involved in merchanting, receiveroyalties payments on intangibles (e.g. patents, intellectual property rights and brands);in some cases insurance and leasing subsidiaries are also located in financial centres (e.g.Cyprus and Ireland). The implicit pricing of these services show up as a difference betweeninput purchases and ex-factory prices of the product. These activities are so pervasive thatthey affect aggregate headline statistics.1 Tørsløv et al. (2018) explain that transfer pricingpractices in financial centres account for almost three quarters of the the discrepancy intotal service balance existing within EU-trade.
Therefore, while the established literature maintain that domestic policies and monetaryconditions relative to main trading partners are main determinants of external imbalances,the organisation of production networks on international and global scale is also important.In Felbermayr and Yotov (2019) words: "We do not know enough about the determinantsof current account balances to set out precise numerical norms"."Policy-makers should paymore attention to establishing the conditions that make current account deficits and sur-pluses – and their mirror image, international capital flows – sustainable."
Resorting to a novel decomposition of trade flows by value added content, this sectionestablishes new stylised facts on composition and patterns of trade balances in financialcentres. We show that global companies contribute with their activity to determine the nettrade position of financial centres in a very specific way.
2.1 The decomposition criteria
The goods and services we purchase and sell are composed of inputs from various countriesaround the world, hence the need of disentangling the different contributions to trade flows.We follow the methodology proposed by Borin and Mancini (2015) to distinguish domesticand foreign contributions and decompose gross bilateral exports into five items according totwo main criteria (for further details on the underlying decomposition, see appendix A.1).2
1These operations often wash out in the current account (see Avdjiev et al., 2018) but are very relevantfor trade balances as they inflate export values of financial centres, hence, giving rise to very consistenttrade surpluses.
2The break down we apply to gross export flows by value added has two advantages over alternativemethodologies; first, it is fully additive, hence, it does not generate biases in decomposing bilateral exports
4

• The trade balance of each country is broken down in terms of the value added that(i) the exporting country itself and (ii) its partner economies have produced in everyrelevant transaction. The former component of value added is referred to as domesticvalue added (DV A), and the latter as foreign value added (FV A).
• An additional useful distinction of trade flows is in (i) transactions that involve fi-nal consumers (DIR) and (ii) transactions concerning intermediate stages of globalproduction chains and involving further re-export (GV C).
This taxonomy helps understanding the mechanism generating large surpluses in euroarea financial centres as well as their contribution to the creation of global value added.
In particular the external position of financial centres adds up to the total euro area sur-plus; differently from Germany, which is the largest contributor of all through its domesticproduced value added, their surplus is entirely determined by foreign production transitingfor further processing through their borders. (see chart 1).
in domestic production and other trading partners production (foreign value added). Second, it separatesexports along several dimensions into 21 finely defined categories that can be easily re-grouped depending onspecific focuses. In particular it distinguishes across intermediates and final goods and services and identifieswhen the bilateral importer directly absorb it (also after further transformations), and in which cases goodsand services are further exported by the bilateral importer to other destinations. For each of them it singlesout the share of domestic value added and trading partners value added. Double counted trade is separatelyidentified (see Borin and Mancini, 2015).
5

Figure 1: Net euro area trade positionas percentage of euro area GDP
Source: Eurostat.Notes: euro area financial centres encompasses Belgium, Cyprus, Ireland Luxembourg, Malta and theNetherlands. Last observation 2018.
2.2 The origin of value added contained in trade balances
Based on the break-down of trade balances just detailed, we find out that financial centresemerge from the rest of countries for some key features. Four new stylised facts are dis-covered about financial centres. First, the net trade balances in domestic and foreign valueadded regularly take on opposite sign. Since 2000 their growth has constantly outpacedthat of the overall net trade position. Second, the trade surpluses in value added stem-ming from other countries dominate the remaining net trade components (see green bars;FV A − DIR of figure 2). They are made of goods and services produced elsewhere butdelivered by financial centres to final consumers.
Hence, financial centres import very little foreign value added for domestic absorptionbut re-export large amounts of others value added to final consumers. This is not the casein other euro area countries where trade surpluses reflect primarily domestic value addedthat is directly traded with the final consumers (see blue bars; DV A−DIR of figure 2).
Third financial centres present large deficits in the balance of domestic value added toproduction that is further re-exported by the bilateral importer (see yellow bars; DV A −GV C of figure 2).
6

Financial centres thereby tend to perform the very last stage(s) in the production chainmaking them located very downstream – i.e. they are closest to final consumers – thanany other participant in the global production network. They receive production for fur-ther transformation but do not export their production to other countries for additionalprocessing; hence the large deficit.3
And fourth, financial centres exhibit surpluses in domestic value added exported todirectly absorbing countries twice as large as in other euro area economies (see blue bars 2,DV A−DIR).
This is all the more noteworthy as right DV A−DIR makes most of the trade balancein other euro area economies. However this is also the component most likely to be con-taminated with profits (value) shifting as it concerns the value that is booked in financialcentres.
The four findings do not reflect a single financial centre specificity but stems frompatterns common across them (see figure 3). Despite a considerable heterogeneity in theproduction structure, the value added composition of their trade balance is strikingly similarin this group of countries and yet very different from any other country (compare figure 3and 4).
Figure 2: Decomposition of trade balance by value added content
Source: authors’ computations based on WIOD and ADB MRIO tables.Note: vertical axes expressed in billions USD.
3For the Netherlands some of these patterns are softened by the presence of a large, active exportingmanufacturing sector.
7

Figure 3: Trade balance in value added, financial centres
Note: vertical axes expressed in billions USD.Source: OECD and authors’ computations based on WIOD and ADB MRIO tables.
8

Figure 4: The value added representation of the trade balance in global economies
Note: vertical axes expressed in billions USD.Source: authors’ computations based on WIOD and ADB MRIO tables.
Let’s repeat ourselves and recap: each main euro area financial centre (Luxembourg,Ireland, Belgium and the Netherlands) exhibit a constantly increasing trade surplus (seefigure 3) mostly due to foreign value added traded directly with final consumers (FV A −DIR). They all have a mirror trade deficit in domestic value added that further requiresintermediate production stages (DV A−GV C).
The abnormality of financial centres appears clear when compared to other countries.The trade balance components related to production chains (e.g. FV A−DIR, FV A−GV Cand DV A−GV C) are inflated (both deficits and surpluses) by pervasive integration of theirproduction system into global networks. However, GVC champions like China, Germanyand the US, do not exhibit such large imbalances owing to integration in production net-work; most of their net positions still depend on the contribution of domestic productionto foreign trade transactions (see blue bars of figure 4). Noteworthy, the US runs constantdeficits in the balance of domestic value added traded with final consumers but exhibit per-sistent surpluses in domestic value added to intermediate stages of production chains. Theeuro area financial centres are US counterpart in half of these foreign trade transactions.
9

2.3 Bilateral trade balance in value added
If goods in transit and intangibles services mask tax-avoidance strategies, then one shouldexpect net trade positions of financial centres to primarily reflect bilateral balances withhigh-tax jurisdictions, thus resulting in “selective trade surpluses”. In other words, transfer-pricing practices manipulate the allocation of values globally created by MNEs betweenhigh and low taxation countries, hence plaguing mainly the correct representation of thesebilateral flows.
The bilateral trade balances of financial centres support this assumption. Financial cen-tres indeed hold large surpluses only vis-à-vis high-taxation jurisdictions, especially euroarea economies, whereas their positions with other financial centres are definitely morenuanced. When trade balances are expressed in terms of value added content, trade sur-pluses pertaining to exchanged FV A−DIR pile up vis-à-vis main manufacturing countries;this is because imports of foreign production for direct absorption from these economiesis negligible but exports is very substantial. Conversely high taxation jurisdiction exportsto financial centres dominantly their domestic production of intermediates that are furtherprocessed (DV A−GV C).
Also deficits with the US consist of US domestic production, which crosses the bordersof financial centres but ends up elsewhere (trade balance in DV A − GV C). Financialcentres are integrated in value chains in a special way: they are two way transit for regionalpartners and one way linked to the US — they transform and re-export to the rest of theworld; as a result they exhibit deficits vis-a-vis the US, that is in deficits almost vis-à-visany other country (see figure 5, A.4.2 and A.4.3).
Differently, net trade positions vis-à-vis other low corporate-tax jurisdictions are volatilewith frequent changes from surpluses into deficits.
Finally the dynamics of the bilateral trade balance between two financial centres mirror,in some occasions, developments in net trade observed between financial centres and othereuro area economies. Precisely this is the case for Luxembourg where the sudden reversalfrom surplus to deficit in 2013 vis-à-vis Germany and France is counterbalanced by a largetrade surplus emerged over the same period vis-à-vis Ireland (see figure 5).
10

Figure 5: The value added representation of the bilateral trade balance for Luxembourg
Note: vertical axes expressed in billions USD.Source: authors’ computations based on WIOD and ADB MRIO tables.
What may be occurring with the trade balance of financial centres is better understoodthrough an example. Imagine that MNEs operate a strategic allocation of value createdglobally in order to optimise their fiscal burden. MNEs can export to a subsidiary oper-ating in financial centres intermediate production for low price, hence, compressing profitsearned in the exporting high tax jurisdictions. At the same time the subsidiary, located inthe low-tax jurisdictions, adds complementary services (merchanting, royalties from brandand patents) and then re-export (FV A − DIR) the same goods. This time the value ofcomplementary services is included, hence, the goods are re-exported at higher prices.
To book profits in financial centres, the complementary services are allocated large frac-tion of the globally created value. Intuitively the convenience of transfer pricing strategiesis maximised when the economy with favourable taxation regime receives the products justahead of final sales and supply directly final consumers abroad.
This is the price gap between production and consumer price that Timmer, Dietzen-bacher, Los, Stehrer and De Vries (2015) refers to and it can explain the large surplus
11

identified in foreign production traded through financial centres directly with final con-sumers (FV A−DIR).
We draw two conclusions from this exercise. First, the dissection of the trade balancein value added shows that financial centres are conduits also for real transactions. A tinyfraction of their total trade is for their own domestic consumption while a significant shareof their trade instead responds to different objectives, including that of escaping profittaxation. Second the reliability of official trade balance statistics in presence of integrationin production network is questionable and their determinants may not be macroeconomicimbalances but global companies strategies which fall outside the room for manoeuvre ofgovernments.
As a result of tax-optimisation strategies pursued by global firms, the measurement offinancial centres participation and location in GVC is heavily biased and fictitious macroimbalances emerge which are not real.
3 Measures of GVC integration of financial centres
Standard measures of GVC participation and positioning rank financial centres as the mostdownstream located countries in supply networks. Such a feature remained unnoticed inprevious works for a twofold reason: first, most papers focused on the fragmentation of,strictly speaking, manufacturing processes across several borders and not on the contribu-tion of complementary services to the process. Furthermore, even when the importanceof complementary services, in terms of value added to the chain, was correctly identified,financial centres did not enter the picture. We draw a parallel between this feature and therole of financial centres as transit of real transactions toward other economies.
Figure 6 plots on the horizontal axis the share of domestic value added which is onlyindirectly exported (e.g. the part of gross exports made of domestic production whichreaches final consumers after crossing at least other two borders; DV A − GV C). This iscommonly referred to as forward GVC participation. On the vertical axis are the figuresreporting backward GVC participation. This is given by the share of foreign productioncontained in gross export of each country and is the sum of foreign production that transitthrough a country’s border to reach directly the final consumer (FV A−DIR) and foreignproduction that crosses at least two more borders (FV A−GV C). Each point on the plotidentifies a pair of forward and backward links by origin-destination pair of countries.
Origins are divided into two groups: the first contains the main euro area manufacturers(Big 4) and the second contains the four main euro area financial centres plus Malta andHungary.4 These are colour coded as blue and orange, respectively. Moreover, we single outpairs of bilateral relations between financial centres by yellow dots and in a similar manner
4Hungary is not a tax-havens but has put in place tax policies favouring MNEs relocation there (seeBlanchard, Acalin et al., 2016).
12

pairs of bilateral relations between main EU countries (Big 4) and financial centres are ina lighter shade of blue. We find out that:
1. financial centres features the largest backward GVC participation of all;
2. the degree of backward participation of financial centres falls sensibly to more normallevels vis-à-vis other financial centres (e.g. less integrated with other financial centres,see yellow dots).
3. The four largest euro area economies maintain the strongest forward GVC participa-tion with financial centres (see light blue dots).
Figure 6: The participation and positioning of financial centres in GVCs
Note: Big 4 consists of Germany, Italy, France and Spain. Financial centres are Belgium, Ireland,Luxembourg and the Netherlands. Tax havens are referring to Hungary, and Malta. Total exportshave been netted out of double counting. Sources: WIOD, authors’ calculations
However this divide between financial centres and other countries in terms of GVCparticipation can be entirely traced back to finished goods produced in supply network.The GVC indices of participation and positioning converge when computed limitedly tointermediate stages of production (see figure 7). In this case, high taxation economiesgain in terms of backward GVC participation and financial centres in terms of forwardintegration (see right hand side panel of figure 7). The positioning of financial centresin GVCs remain atypically downstream in final goods and reflects their specialisation inservices which enter the chain at the end.
13

Figure 7: The participation and positioning in GVCs by product
Note: Big 4 consists of Germany, Italy, France and Spain. Financial centres are Belgium, Ireland,Luxembourg and the Netherlands. Tax havens are referring to Hungary, and Malta. Total exportshave been netted out of double counting. Sources: WIOD, authors’ calculations
These stylised facts raise more questions than they answer. Why should financial centresbe less integrated with other similar economies (other financial centres)? Why do mainmanufacturers appear forward integrated especially with financial centres rather than withother manufacturing economies? A potential explanation is that companies aiming atminimising tax burden from a global perspective will operate strategic allocation of profitsby rising the value of services supplied by financial centres at the very end of the chain.Thereby, a side effect of profit shifting is that countries, not expected to interact intensivelyaccording to the universal law governing foreign trade, appear instead fictitiously integrated.On these grounds, in order to correct BEPS distortions in GVC measures we resort to thepredictive power of the gravity law.
4 Trade surpluses in financial centres according to gravity law
The gravity equation has since its introduction in 1964 (see Tinbergen 1964) been widelyused to analyse determinants of bilateral trade flows, and its theoretical foundation has beenfurther developed and justified by Anderson (1979), Bergstrand (1985; 1989) and Andersonand van Winccop (2003) amongst others.
Despite its past proven stability and explanatory power, recent work has shown that themodel cannot provide a correct assessment of the determinants of bilateral trade balances
14

in the light of cross-border production fragmentation within GVCs (Noguera, 2012). In aclosely related paper Cuñat and Zymek (2019) apply a gravity framework to study bilateraltrade imbalances with a specific focus on the United States and conclude that factorsdetermining heterogeneity of bilateral trade balances are not yet fully understood. In thispaper we show that part of this heterogeneity can be accounted by transfer practices andcorrect for them.
The gravity specification builds on the seminal contribution in Anderson and van Winc-cop (2003) and includes inward and outward multilateral trade resistance terms among re-gressors. We control for the fact that bilateral exports from country i to country j depends,beside bilateral trade barriers, also on i’s global remoteness that affects its possibility tosupply other destinations (outward resistance) as well as j′s possibility to import fromalternative sources (inward resistance). However, we deviate from the common approachof employing exporter and importer or exporter-time and importer-time fixed effects tocontrol for resistances (see for instance Redding and Venables, 2004 and Feenstra, 2015).Instead, proxies for remoteness are constructed following a two-step procedure proposed byBaldwin, Taglioni et al. (2011), which in contrast to fixed effects does not absorb all time-varying country specific characteristics that are key to the why some countries function asfinancial centres.5
While applying gravity to gross exports is an established exercise in the literature,the application to value added trade is far less explored. We employ an augmented gravityequation to predict exports and imports of exported domestic production that enters globalvalue chains (e.g. exports which is further processed by the importer and then re-exported(EXP −DV A−GV C).
Our approach builds on earlier related works (Noguera, 2012; Baldwin et al., 2011) andmore recent analyses (Jang and Song, 2017; Lankhuizen and Thissen, 2019). In particular,as the primary goal of the paper is to provide a tool measuring to what extent reportedinternational trade figures are contaminated by MNEs strategies, we control for globalproduction network including a series of extra trade terms that describe the structure ofthe bilateral importer’s trade with the rest of the world.
In particular, Baldwin et al. (2011) points that the estimated coefficient on the GDPsshould be lower for nations where trade in parts and components (a very rough measurefor GVCs trade) is important and suggests to include, among determinants of a country’simports, either its exports or alternatively the trading partner demand shifters. Noguera(2012) shows that countries’ bilateral exports also depend on the bilateral importer aggre-gate imports (IMP −DV A−DIR and IMP −DV A−GV C) netted of the imports fromthe country under consideration.
We follow a similar reasoning and include, among determinants of country i’s EXP −5For details of the two-step procedure of constructing the multilateral resistance term, see chapter 3 of
International Monetary Fund, 2019).
15

DV A−GV C , the exports and the imports of the bilateral importer j from the rest of theworld. Precisely, the equation for bilateral exports of country i to j is augmented for thebilateral importer’s exports and imports in terms of production content,excluding exportsto the country under consideration (i).6
This strategy is also corroborated by the recent work on the effect of re-exports ingravity estimations, Lankhuizen and Thissen (2019) nets exports of the re-exported quota;in this work we follow the value added along the chain by including re-exports to the rest ofthe world through j as additional controls (EXP−FV A−GV C and EXP−FV A−DIR).7
The gravity equation takes on two specifications; a first one is applied to estimation ofgross exports and export of domestic production directly to final consumers, and a secondone that includes eight additional terms, representing exports and imports of the bilat-eral importer of domestic and foreign production. Moreover multilateral trade resistances(MRT ) replace the standard use of country dummies to control for origin and destinationunobservable factors (see equation 1).
Xijt =exp[α+
8∑tr=1
βtrln(γtrjt ) + β9ln(Yit) + β10ln(Yjt) + β11ln(Ywt)+
+ β12ln(Distanceij) + β13Languageij + β14Borderij +18∑
T A=15βrIijt+
+ β19lnMRT outit + β20lnMRT in
jt
]ηijt
(1)
where the dependent variable denotes, in turn, flows of gross exports from country i tocountry j at time t, flows of domestic produced exports from i to final importer countryj (EXP − DV A − DIR), flows of domestic produced exports from i to country j thatre-export them (EXP −DV A−GV C).
The first eight (γ’s) terms are the bilateral importer’s exports and imports in domesticand foreign value added, shipped directly to final consumer country or to other intermediarycountries; they are included only in the regression of EXP −DV A−GV C. 8
We maintain no a-priori on sign and magnitude of the elasticity of these eight terms.Exports of country j (the bilateral importer) enter its gross output and recent works showedit to be a better measure of aggregate demand in the presence of intermediates. The
6These consists of eight terms: EXP − DV A − DIR, EXP − DV A − GV C, EXP − F V A − DIR andEXP −F V A−GV C,IMP −DV A−DIR, IMP −DV A−GV C, IMP −F V A−DIR and IMP −F V A−GV C;for details about definitions of each component see appendix A.1).
7Another recent contribution by Jang and Song (2017) works out theoretical foundations of the gravityequation in the presence of trade in intermediates. It concludes that gravity remains a valid workhorse,provided gross output replaces gross value added as a proxy for aggregate demand.
8See the exact composition of EXP − DV A − DIR, EXP − DV A − GV C, EXP − F V A − DIR,EXP −F V A−GV C, IMP −DV A−DIR, IMP −DV A−GV C, IMP −F V A−DIR, IMP −F V A−GV Cin the appendix
16

elasticity aggregate exports of country j may hence be expected to be positive. Aggregateimports of country j represent a substitute to i’s exports to j therefore the elasticity maybe negative in this case.
Yit, Yjt, Ywt are standard gravity terms, respectively nominal GDP of the exporting,importing country and world GDP. The first two terms capture the economic mass ofthe two countries which determine their trade volumes; both are expected to have positiveelasticity (unitary elasticity according to gravity). World GDP is expected to have negativeelasticity; intuitively bilateral trade between country i and country j decreases relative totrade with the rest of the world as the economic size of the other countries’ grows.
Distance and border capture unobservable trade barriers and common language isexpected to promote bilateral trade. As for the observable factors (I) we single out thetrade enhancing effects of deeper economic integration by including a set of dummies whichtakes the value of one if the pair exporter-importer signed a free trade agreement (FTA) aremembers of a customs union (CU), common market (CM) and/or economic union (EU).
The final MRT variables are the inverse of outward and inward multilateral resistanceterms. MRTout increases when the weighted average of trade barriers faced by country i inthe global market lessens. MRTin captures the inverse of weighted-average trade barriersfaced by rest of the world when exporting to j.
Methodology
The process of adjustment of trade balances for the bias related to operations by MNEs infinancial centres, consists of three steps.
First we estimate via Pseudo Poisson Maximum Likelihood, a gravity equation of bilat-eral gross exports to obtain consistent, unbiased estimates even in presence of heteroscedas-ticity (see Silva and Tenreyro, 2006).
Second, we draw on the estimates of gross exports and re-scale accordingly the DVAand FVA content of reported gross exports. In particular, as shown in equation 2, re-scaled
EXP −DV A−DIR, EXP −DV A−GV C and EXP −DV A−REF are constructedby multiplying reported EXP−DV A−DIR, EXP−DV A−GV C and EXP−DV A−REFfor the share of predicted over actual gross exports.
V Aijt = V Aijt ∗(EXPijt
EXPijt
)(2)
The exports in value added, opportunely re-scaled to be consistent with first stageEXP , are then regressed on the same set of determinants as in equation (2). EXP − FV A
is obtained as difference between EXP , EXP −DV A−DIR and EXP −DV A−GV C).
Third, we replace reported with estimated export values when either the exporter orthe importer country is one of the six euro area financial centres.
17

We obtain imports as mirror statistics and compute accordingly the adjusted tradebalance (TB, TB −DV A−DIR, TB −DV A−GV C and TB − FV A−GV C).
Section 5 discusses main findings of gravity estimations and 6 comments over a seriesof robustness checks we performed on the validity of our methodology and stability of ourestimates. Linear projections of official trade balances on estimated trade balances arereported in the appendix A.
5 Empirical Results
The predicted elasticities of bilateral export flows to standard determinants are all wellbehaved; the augmented gravity regressions return highly significant coefficients of theexpected magnitude and sign, in line with the wide literature on gravity trade. This holdequally true for regressions of bilateral gross exports, bilateral exports of domestic valueadded to final bilateral importer (EXP −DV A−DIR) and bilateral exports of domesticvalue added further re-exported by the bilateral importer (EXP −DV A−GV C).
EXP−DV A−DIR turns out more sensitive to the size of the origin and the destinationcountry, e.g. to the bilateral economic mass (Yit, Yjt) than EXP−DV A−GV C, (estimatedcoefficients are 0.84, 0.89, 0.77 and 0.86 respectively, see Table 1) since the latter dependsalso on the macroeconomic conditions of destinations indirectly reached via intermediateimporters.
Free trade agreements raise bilateral exports by 22-26%; EXP − DV A − GV C areless responsive to bilateral liberalisations because trading conditions prevailing between thebilateral importer and other destinations are relevant too. Custom unions promote directexports to final consumers but it does not significantly improves exports in chain. Con-versely setting up a common market produces beneficial effects for the domestic productionexported in regional value chains (EXP−DV A−GV C) by about 15 and specifically joiningthe European Union grants an additional 8% of exports to EU members.
Bilateral distance reduces exports very substantially and almost equally across contenttypes; exports between trading partners that are 10% farer apart than the average is 6%below the average export value. Sharing the same language is confirmed an importantpromoting factor of bilateral exports, especially relevant for domestic production enteringsupply chains for further re-export (EXP-DVA-GVC) that is raised one third above theaverage by the common idiom. Sharing a common border instead boosts by about 50% ex-ports to direct consumer but matters definitely less for exports entering production network(see Table 2).
The multilateral trade resistance terms are both well behaved; trade barriers facedby country i when reaching out the global market depresses more exports of domesticproduction to direct final consumers whereas reducing barriers that every country face in
18

Table 1: Standard determinants of bilateral exports
(1) (2) (3)VARIABLES EXP EXP DVA DIR EXP DVA GVC
ln(Yit) 0.772*** 0.838*** 0.767***(0.00670) (0.00691) (0.00725)
ln(Yjt) 0.811*** 0.892*** 0.856***(0.00932) (0.0103) (0.0463)
ln(Ywt) -0.352*** -0.649*** -0.828***(0.0336) (0.0345) (0.0458)
FTAijt 0.220*** 0.260*** 0.0892**(0.0559) (0.0471) (0.0447)
CUijt 0.0480 0.155** -0.105(0.0721) (0.0738) (0.0728)
CMijt 0.0535 0.138*** 0.156***(0.0421) (0.0417) (0.0487)
EUijt 0.0624 0.108* 0.0809*(0.0564) (0.0625) (0.0472)
Observations 24,600 24,600 24,600R2 0.791 0.809 0.739
Robust standard errors in parentheses*** p<0.01, ** p<0.05, * p<0.1
Table 2: The gravity estimations on bilateral exports, trade barriers
(1) (2) (3)VARIABLES EXP EXP DVA DIR EXP DVA GVC
ln(Distanceij) -0.636*** -0.592*** -0.664***(0.0115) (0.0106) (0.0103)
Languageij 0.175*** 0.204*** 0.356***(0.0324) (0.0284) (0.0485)
Borderij 0.544*** 0.581*** 0.296***(0.0414) (0.0392) (0.0351)
ln(MRT outit ) 0.340*** 0.462*** 0.556***
(0.0369) (0.0374) (0.0384)ln(MRT in
jt ) 0.357*** 0.598*** 0.266***(0.0400) (0.0420) (0.0535)
Observations 24,600 24,600 24,600R2 0.791 0.809 0.739
Robust standard errors in parentheses*** p<0.01, ** p<0.05, * p<0.1
19

exporting to j positively affects primarily exports in chain (EXP −DV A−GV C) from i
to j.
Regarding the novelty of our approach, e.g. the introduction of the trade structure ofthe bilateral importer in the equation for (EXP−DV A−GV C), we find that imports fromother countries mostly tend to depress bilateral exports from i to j except when importsfrom i is of production from other sources and it is for final absorption in j (0.85, see Table3).Thereby other countries are to be considered alternative sources.
The four terms representing j’s exports to the rest of the world are not of immediateinterpretation. The more j exports to other countries its own production directly for finalabsorption, or other’ production (excluding i from the set of partners) for further re-export(EXP −DV A−DIR, EXP −FV A−GV C) the less it trades with i. However the exportsof i to J are strengthened by the exports of the latter which is integrated in supply network.The elasticity to EXP − DV A − GV C and EXP − FV A − DIR are positive and highlysignificant. The coefficient on EXP −FV A−DIR of i’s EXP −DV A−GV C is especiallylarge; this can be better understood considering that in this case the domestic production ofi passes through j for further processing but ends up lumped in the j’s EXP−FV A−DIR,hence the strong complementarity between the two terms.9
Our analysis confirm established results of the gravity literature but also establishessome novel ones, especially on determinants of the bilateral exports of production integratedin international value chains. In particular it shows how these transactions are also shapedby the importer integration in production chains. The empirical evidence tends to supportthe conclusion that the integration of j with the rest of the world negatively affects bilateralexports from i, unless they concern production of these two countries integrated in GVCs.
5.1 The correction of bilateral trade balances of euro area financial cen-tres
We rely on our estimates to obtain predicted values for bilateral trade relationship involvingfinancial centres either as exporter or as importer, which replace the official statistics.Imports are obtained through mirror statistics and revised trade balance are the differenceof estimated exports and imports.
In particular, once idiosyncrasies existing in trade flows of financial centres have beenidentified and eliminated by bringing their trade values in line with those predicted by tradegravity law, trade surpluses tend to disappear.
Figure 8 plots the revised trade balance for the four main euro area financial centres.Compared to the pre-treatment balances the Belgium’s surplus in 2014 shrinks from $30 tojust $7 billions, the correction for Ireland is even wider with a positive net position dropping
9Remember that the controls for the trade structure of the bilateral importer were constructed takingcare of netting the trade flows concerning the original i exporter.
20

Table 3: Regression results of gravity estimation on exports, determinants of value addedtrade in GVC
VARIABLES EXP DVA GVC
ln(IMP-DVA-DIRjt) -1.613***(0.145)
ln(IMP-DVA-GVCjt) -0.338***(0.0674)
ln(EXP-DVA-DIRjt) -1.114***(0.156)
ln(EXP-DVA-GVCjt) 0.867***(0.127)
ln(IMP-FVA-DIRjt) 0.846***(0.137)
ln(IMP-FVA-GVCjt) -0.570***(0.0949)
ln(EXP-FVA-DIRjt) 2.306***(0.153)
ln(EXP-FVA-GVCjt) -0.382***(0.106)
Observations 24,600R-squared 0.739
Robust standard errors in parentheses*** p<0.01, ** p<0.05, * p<0.1
21

from $50 to $10 billion, while the Netherlands undergoes the largest surplus reduction byabout 100 billion (from $120 to$20 billion). The correction for Luxembourg is not as largeand a gap between reported and estimated trade balance opens only starting around 2005,hinting to some change in their role of financial centre ahead of the great financial crisis;the surplus is however cut by a half by our correction in 2014. The revisions implementedon single components are important, they halve the partial trade balances (FV A − DIR
and in DV A−GV C).
These corrections are reflected in the trade balance of all other countries, the mostrelevant are reported in the appendix A.6. As a result of our exercise the deficit of theUS expands while the surplus of China shrinks substantially by almost $200 million. Thevery large correction may in this case also reflect the over-invoicing of Chinese export usedto bypass capital controls. Direct investments into China, which are restricted by law,are masked through international payments to Chinese companies for exports to MNEssubsidiaries located in euro area financial centres.
A downward revision relative to the official statistics is also operated on Germany nettrade surplus, on France and Portugal position and to a smaller degree on Spain net positionthat zeroes from positive in 2014. No correction is implemented on Italy’s net trade positionwhich appear in line with what predicted by the gravity law. Overall the correction dependson how off from projected trajectories are the reported bilateral exports between financialcentres and other countries.
The total correction for the four euro area financial centres sums up to about $170billion in 2014; such amount is comparable to the estimates on the amount of profit shiftedglobally obtained through different methodologies. For instance Bolwijn et al. (2018) usesFDI transactions of SPE located in financial centres and estimates pre-taxes profits to bebetween $330-450 billion, of which two thirds pertaining to advanced economies and onethird to emerging economies. Tørsløv et al. (2018) use differential in foreign investmentyields to correct the official income balance (which turns from a positive 0.3% to a −0.3%of euro area GDP). They also use mirror statistics to correct for under-reporting of importsfrom financial centres. Their revised figures for the euro area net trade surplus as a wholeare not major, summing to half a percentage point of euro are GDP (from almost 5 toabove 4%, see Figure A.5.1 in the appendix). Also in their case like in our exercise, thelargest correction are operated on the trade balance of the Netherlands and Ireland.
22

Figure 8: Revised trade balance of the four main euro area financial centres
Note: vertical axes expressed in billions USD.Source: OECD and authors’ computations based on WIOD tables
At last we also recompute the correct position and location of financial centres andcompare them with other main euro area economies. Their participation to GVC remainbackward oriented and downstream located but definitely to a lesser extent than before ourreassessment, and some heterogeneity across bilateral positions is restored (see figure 8 and2).
23

Figure 9: Corrected participation and positioning of financial centres in GVCs
Note: Big 4 consists of Germany, Italy, France and Spain. Financial centres are Belgium,Ireland, Luxembourg and the Netherlands. Tax havens are referring to Hungary, andMalta. Total exports have been netted out of double counting. Sources: WIOD, authors’calculations
6 Robustness
We carry out four different robustness checks on our gravity estimations. Each validationexercise has been performed on the three components of exports flows considered in thepaper.
Beside robustness validation, we have preliminarily linearly projected reported on pre-dicted trade balances (see results in A.3) and verified that gravity predictions prove stronglycorrelated with official figures (coefficient about unity for TB−DV A−DIR and TB − FV A;and 0.8 on TB −DV A−GV C). This is a rather good result compared to previous worksthat failed to explain empirically net trade external positions. Davis and Weinstein (2002)refer to the "Mystery of excess trade balances" and suggests it may arise due to highlyspecialised intermediates and macro policies. Felbermayr and Yotov (2019) claim to havesolved the puzzle of too large trade imbalances and obtained a good fit of net trade bal-ances by imposing in the equation specification an entire set of dummies that controls forcountry and country pair heterogeneity. Our results are as encouraging in this respect; westill obtain good predictions of the trade balance components and compared to theirs wedo not resort to dummies for country heterogeneity which would absorb a relevant fractionof variability, preventing us from identifying the full effects of a wide range of factors ontrade, including bilateral and multilateral trade resistances.
Gravity specification with origin destination fixed effects. The adjustments of
24

trade statistics we seek through gravity estimations require to exclude, from the equationspecification, fixed effects that normally control for unobservable heterogeneity across coun-tries. They are generally particularly useful to capture any form of remoteness and barrierto trade. However the "financial centres effects", that we try to identify and correct, wouldbe absorbed in the coefficient of country dummies, lumped together with several others.For this reason we have adopted Baldwin’s approach by including multilateral resistanceterms (MRT ) as additional controls in the equation. They also proxy remoteness and cap-ture unobservable barriers. We test the robustness of our estimates to the replacement ofMRT with exporter and importer fixed effects. As a result, the sign and the significanceof estimated elasticities are preserved; the coefficients tend to shrink in size because theirinterpretation is different. They are this time specifically identified based only on bilateralcountry-pair heterogeneity, whereas the country heterogeneity is subsumed in the fixed ef-fect. For instance, we cannot interpret a positive elasticity on the exporter Yit as evidencethat richer countries trade more among themselves but as the positive effects on exportsinduced by an increase in the economic mass of exporter i above its average value.
Gravity on predicted values of bilateral exports. As a second check we havereplaced official with predicted export flows in any bilateral relationship held by financialcentres with other countries and proceeded to re-estimate the gravity on the adjusted exportflows. The exercise is used to verify that misreporting by financial centres do not plague theelasticities estimated via gravity. We notice three differences compared to our benchmarkregression.
• The elasticity of MRT in increases, implying that bilateral exports are more sensitiveto changes in trade barriers faced by other countries when exporting to j ( e.g. newtrade barriers depress more exports of non financial centres). Intuitively the exportflows of financial centres respond to somewhat different incentives from those gov-erning trade flows elsewhere and this makes their exports resilient to common tradebarriers. An alternative and consistent explanation is that financial centres specialisein digital services that face lower obstacles to travel far.
• Exports from i to j is less sensitive to the trade structure of j.
• The significance of the EU membership is restored. The elasticities of the EU dummyare positive and significant on each export component. Therefore biases in officialtrade statistics of financial centres lead to perceive as less positive the effects of EUintegration on regional trade.
Linear gravity specification. It is widely accepted that PPML is to be preferredover linear gravity estimations of log-linearised equations because estimates are not biasedby the presence of heteroscedasticity, we however verify that our results are consistent withalternative estimation methodology, e.g. linear estimation.
25

PPML provides more precise and more significant estimates; in linear estimation somecoefficient are oddly low (Yjt) and others take on the wrong sign FTA. The only improve-ment is recorded in the estimation of the elasticity to distance that is equal to unity, aspredicted by the gravity low.
Gravity results when substitutability across varieties changes. As a fourth andlast robustness check we impose alternative values of the elasticity of substitution acrossvarieties (σ) in the computation of the MRT terms. A value of 3 is suggested by theempirical literature that estimated this parameter; we increase and reduce substitutabilityacross goods by raising σ to 4 and then lowering it to 2. Such changes produce the expectedresults: as heterogeneity across varieties falls (substitutability rises to 4), the elasticity toboth MRTin and MRTout rises. The opposite is true when σ takes on the value of 2;lower substitutability across varieties leads to trade flows reacting less to changes in tradebarriers. However the other elasticities are overall not significantly influenced, not eventhose on distance, confirming robustness of our estimates to the specification of technicalparameters.
Overall we conclude that our estimates are not driven by preferences for one methodol-ogy over the others.
7 Concluding Remarks
This paper contributes to the literature on global imbalances and profit shifting along twodimensions.
First it identifies unique features of trade balance common across financial centresthrough a novel decomposition of the value content of trade balances that opportunelydistinguishes domestic production from trading partners’ production; exports absorbed bythe bilateral importer and export further re-exported. The decomposition highlights, forthe first time the pervasiveness in the external statistics of financial centres of items tran-siting there but consumed elsewhere and create a parallel between their role of conduit ofcapitals and conduit of real products. We also make an attempt to connect regularitiesshowing up in headline external statistics to the MNEs tax-optimisation strategies. As thebusiness size of these companies is often bigger than the hosting economy, they shape macrostatistics returning a falsified picture of these countries macro conditions and imbalances.Therefore the external position from official statistics of financial centres are to be takenwith a grain of salt as well as their GVC positioning and participation computed from theinter countries input output tables.
The paper works through gravity estimations to clean reported figures for the effectof MNEs. The gravity equation is expanded to control for the effect on bilateral tradeof production chains encompassing several countries. We find broad evidence that tradewith other countries act as substitute of bilateral exports from i to j unless the trade flows
26

concern transactions of production integrated in the same value chains. In this case exportsand imports of the direct importer (j) turn out complements of i’s bilateral exports.
The revised trade balances suggest that profit shifting, involving main euro area financialcentres exhibit a positive trend and may amount to around $170 billion in 2014. Their largesurpluses disappear into more balanced position. The corrections reflect mostly importantreductions in exports of their domestic production that is directly absorbed by the bilateralimporter (EXP − DV A − DIR); this is noticeably the value booked in financial centres.Their participation in GVC is reduced but their positioning remain downstream, owing tothe specialisation of these countries in end of the chain intangible services.
Our approach is an alternative, not very different in nature, to those analyses that relyon investment yield differentials across countries, or on FDI of foreign owned companies togauge a measure of profit shifting. While our correction does not pretend to be exhaustivenor to nail down the exact amount of tax avoidance, it has the merit to look at misreportingof official statistics in financial centres from an alternative perspective and show a newdirection that can be pursued in other studies.
A way forward for researchers when assessing the global magnitude of profit shifting isto rely on multiple measurement instruments and source of information, including microdata sourced directly from global MNEs balance-sheets.
27

References
Alvaredo, F., Chancel, L., Piketty, T., Saez, E., Zucman, G., 2018. World inequality report2018. Belknap Press.
Anderson, J., 1979. A theoretical foundation for the gravity equation. The AmericanEconomic Review 69.
Anderson, J., van Winccop, E., 2003. Gravity with gravitas: a solution to the border puzzle.American Economic Review 93, 170–192.
Avdjiev, S., et al., 2018. Tracking the international footprints of global firms. BIS QuarterlyReview, March .
Baldwin, R., Taglioni, D., et al., 2011. Gravity chains: Estimating bilateral trade flowswhen parts and components trade is important. w16672, National Bureau of EconomicResearch.
Bergstrand, J., 1985. The gravity equation in international trade: some microeconomicfoundations and empirical evidenc. The Review of Economics and Statistics 67, 474–481.
Bergstrand, J., 1989. The generalized gravity equation, monopolistic competition and thefactor-proportions theory in international trade. The Review of Economics and Statistics71, 143–153.
Blanchard, O., Acalin, J., et al., 2016. What does measured FDI actually measure? Tech-nical Report.
Bolwijn, R., Casella, B., Rigo, D., 2018. An fdi-driven approach to measuring the scaleand economic impact of beps. Bolwijn, R., Casella, B., and Rigo, D.(2018). An FDI-driven approach to measuring the scale and economic impact of BEPS. TransnationalCorporations 25, 107–143.
Borin, A., Mancini, M., 2015. Follow the value added: bilateral gross export accounting.Bank of Italy Temi di Discussione (Working Paper) No 1026.
Cuñat, A., Zymek, R., 2019. Bilateral trade imbalances .
Davis, D.R., Weinstein, D.E., 2002. The mystery of the excess trade (balances). AmericanEconomic Review 92, 170–174.
Dharmapala, D., 2019. Profit shifting in a globalized world, in: AEA Papers and Proceed-ings, pp. 488–92.
Dowd, T., Landefeld, P., Moore, A., 2017. Profit shifting of us multinationals. Journal ofPublic Economics 148, 1–13.
28

Feenstra, R.C., 2015. Advanced international trade: theory and evidence. Princeton uni-versity press.
Felbermayr, G.J., Yotov, Y., 2019. From theory to policy with gravitas: A solution to themystery of the excess trade balances .
Flaaen, A., et al., 2017. The role of transfer prices in profit-shifting by us multinationalfirms: Evidence from the 2004 homeland investment act. Finance and Economics Dis-cussion Series 55.
Guvenen, F., Mataloni Jr, R.J., Rassier, D.G., Ruhl, K.J., 2017. Offshore profit shiftingand domestic productivity measurement. Technical Report. National Bureau of EconomicResearch.
International Monetary Fund, 2019. The Determinants of bilateral trade and spilloversfrom tariffs. Technical Report. International Monetary Fund.
Jang, S., Song, E.Y., 2017. Gravity with intermediate goods trade. East Asian EconomicReview 21, 295–315.
Lankhuizen, M., Thissen, M., 2019. The implications of re-exports for gravity equationestimation, nafta and brexit. Spatial Economic Analysis 14, 384–403.
Noguera, G., 2012. World economic outlook, april 2019 : Growth slowdown, precariousrecovery. Job Market Paper, Columbia University .
Overesch, M., 2009. The effects of multinationals’ profit shifting activities on real invest-ments. National Tax Journal , 5–23.
Redding, S., Venables, A.J., 2004. Economic geography and international inequality. Jour-nal of international Economics 62, 53–82.
Silva, J.S., Tenreyro, S., 2006. The log of gravity. The Review of Economics and statistics88, 641–658.
Timmer, M.P., Dietzenbacher, E., Los, B., Stehrer, R., De Vries, G.J., 2015. An illustrateduser guide to the world input–output database: the case of global automotive production.Review of International Economics 23, 575–605.
Tinbergen, J., 1964. Shaping the world economy: Suggestions for an international economicpolicy. American Journal of Agricultural Economics 46, 271.
Tørsløv, T.R., Wier, L.S., Zucman, G., 2018. The missing profits of nations. TechnicalReport. National Bureau of Economic Research.
29

A Appendix
A.1 The decomposition of gross exports in domestic and foreign valueadded
In this paper we follow the decomposition proposed by Borin and Mancini (see Borin andMancini, 2015) as it holds two advantages on others. First it does not generate downwardbiases of the foreign value added in export flows nor overestimate the domestic value addedin gross exports. Second it is fully additive, hence allows grouping countries at a later stage.
The 21 items were then bundled in 5 broader categories according to two broad crite-ria. First dividing domestic from foreign value added in exports (DV A versus FV A) andsecond breaking down what part of domestic and foreign is a final sale to the bilateralimporter (direct trade) and what is further re-exported by the bilateral importer (GVC).As mentioned in the main text the underlying main trade balance components.
DVA-DIR Domestic value added in bilateral exports absorbed by bilateral importer.
– 1a "domestic value added (VA) in final good to the final bilateral importers"
– 1b "domestic VA in intermediate exports absorbed by bilateral importers asdomestic final goods after additional processing stages"
– 2a "domestic VA in intermediate exports absorbed by direct importers as localfinal goods"
– 2b "domestic VA in intermediate exports absorbed by direct importers as localfinal goods only after further processing stages"
– EXP 3c "domestic VA in intermediate exports absorbed by direct importers asfinal goods from third countries"
DVA-GVC Domestic value added that is re-exported by the bilateral importer.
– 1c "domestic VA in intermediate exports absorbed by third countries as domesticfinal goods after additional processing stages"
– 2c "domestic VA in intermediate exports absorbed by third countries as localfinal goods"
– 3a "domestic VA in intermediate exports absorbed by third countries as finalgoods from direct bilateral importers"
– 3b "domestic VA in intermediate exports absorbed by third countries as finalgoods from direct bilateral importers only after further processing stages"
– EXP 3d "domestic VA in intermediate exports absorbed by third countries asfinal goods from other third countries
30

– EXP 4c "domestic VA in intermediate exports absorbed at home as final goodsof a third country"
DVA-REF exports of domestic value added that is absorbed at home.
– EXP 4a "domestic VA in intermediate exports absorbed at home as final goodsof the bilateral importers"
– EXP 4b "domestic VA in intermediate exports absorbed at home as final goodsof the bilateral importers after further processing stages"
– EXP 5 "domestic VA in intermediate exports absorbed at home as domestic finalgoods"
FVA-DIR foreign VA in exports that is absorbed by the bilateral importer.
– EXP 7 "foreign VA in exports of final goods"
– EXP 8 "foreign VA in exports of intermediate goods directly absorbed by theimporting country"
FVA-GVC foreign VA in exports that is further re-exported by the bilateral importer.
– EXP 9a "foreign VA in exports of intermediate goods re-exported by the bilateralimporter"
– EXP 9b "foreign VA in exports of intermediate goods re-exported by a thirdcountry"
DCO Double counted exports.
– EXP 9cd "double-counted intermediate exports originally produced abroad"
– EXP 6 "double-counted intermediate exports originally produced at home"
The export data we use in the empirical analysis and in charts have been cleaned fordouble counted exports. Reflected exports (DV A − REF ) is a negligible fraction of totalexports, we discard it in the empirical analysis.
31

A.2 Table Appendix
Table A.2.1: Regression results for gravity model on export flows corrected for financialcentres
(1) (2) (3)VARIABLES EXP EXPDV ADIR EXPDV AGV C
ln(Yit) 0.787*** 0.849*** 0.771***(0.00641) (0.00679) (0.00568)
ln(Yjt) 0.837*** 0.907*** 0.863***(0.00911) (0.0103) (0.0385)
ln(Ywt) -0.413*** -0.683*** -0.828***(0.0322) (0.0341) (0.0385)
ln(Distanceij) -0.661*** -0.611*** -0.701***(0.0111) (0.0104) (0.00925)
Languageij 0.109*** 0.158*** 0.265***(0.0286) (0.0270) (0.0248)
Borderij 0.626*** 0.634*** 0.416***(0.0386) (0.0374) (0.0300)
FTAijt 0.231*** 0.271*** 0.0850**(0.0498) (0.0428) (0.0388)
CUijt 0.0935 0.190** -0.0673(0.0737) (0.0742) (0.0746)
CMijt 0.0360 0.120*** 0.103**(0.0420) (0.0416) (0.0488)
EUijt 0.0934* 0.141** 0.117***(0.0536) (0.0609) (0.0424)
ln(MRT outit ) 0.456*** 0.546*** 0.696***
(0.0362) (0.0373) (0.0325)ln(MRT in
jt ) 0.490*** 0.670*** 0.428***(0.0394) (0.0428) (0.0361)
ln(IMP-DVA-DIRjt) -1.050***(0.0978)
ln(IMP-DVA-GVCjt) -0.552***(0.0456)
ln(EXP-DVA-DIRjt) -1.001***(0.123)
ln(EXP-DVA-GVCjt) 0.828***(0.0982)
ln(IMP-FVA-DIRjt) 0.289***(0.0857)
ln(IMP-FVA-GVCjt) -0.0738(0.0560)
ln(EXP-FVA-DIRjt) 1.967***(0.114)
ln(EXP-FVA-GVCjt) -0.397***(0.0839)
Observations 24,600 24,600 24,600R2 1.000 0.995 0.959
Robust standard errors in parentheses*** p<0.01, ** p<0.05, * p<0.1
32

Table A.2.2: Regression results of gravity model on reported export flows, OLS
VARIABLES ln(EXP) ln(EXP DVA DIR) ln(EXP DVA GVC)
ln(Yit) 0.869*** 0.926*** 0.947***(0.0188) (0.0184) (0.0197)
ln(Yjt) 0.849*** 0.902*** 0.258***(0.0173) (0.0168) (0.0649)
ln(Ywt) -0.306*** -0.694*** -0.799***(0.0383) (0.0358) (0.0634)
ln(Distanceij) -1.005*** -0.976*** -0.960***(0.0288) (0.0283) (0.0319)
Languageij 0.407*** 0.407*** 0.403***(0.121) (0.121) (0.132)
Borderij 0.416*** 0.430*** 0.560***(0.101) (0.104) (0.110)
FTAijt -0.204*** -0.181*** -0.147***(0.0336) (0.0320) (0.0356)
CUijt -0.0299 -0.0259 0.0113(0.0672) (0.0668) (0.0765)
CMijt 0.0410 0.0364 0.0324(0.0253) (0.0240) (0.0255)
EUijt 0.130*** 0.150*** 0.115***(0.0408) (0.0418) (0.0412)
ln(MRT outit ) -0.261*** -0.106 -0.149
(0.0893) (0.0861) (0.102)ln(MRT in
jt ) 0.0745 0.372*** 0.754***(0.116) (0.114) (0.148)
ln(IMP-DVA-DIRjt) -0.246(0.163)
ln(IMP-DVA-GVCjt) 0.338***(0.109)
ln(EXP-DVA-DIRPjt) 0.457***(0.143)
ln(EXP-DVA-GVCjt) -0.373***(0.120)
ln(IMP-FVA-DIRjt) 0.0271(0.158)
ln(IMP-FVA-GVCjt) 0.237*(0.131)
ln(EXP-FVA-DIRjt) 0.0127(0.127)
ln(EXP-FVA-GVCjt) 0.266**(0.114)
Observations 24,600 24,600 24,600R2 0.827 0.845 0.817
Robust standard errors in parentheses*** p<0.01, ** p<0.05, * p<0.1
33

Table A.2.3: Regression results for gravity model on reported export flows, fixed effects
(1) (2) (3)VARIABLES EXP EXP DVA DIR EXP DVA GVC
ln(Yit) 0.589*** 0.668*** 0.609***(0.0195) (0.0204) (0.0191)
ln(Yjt) 0.711*** 0.808*** 0.388***(0.0189) (0.0183) (0.0544)
ln(Ywt) -0.119*** -0.461*** -0.487***(0.0239) (0.0241) (0.0490)
ln(Distanceij) -0.977*** -1.025*** -0.874***(0.0154) (0.0205) (0.0192)
Languageij -0.311* -0.603*** -0.718***(0.173) (0.170) (0.220)
Borderij 2.496*** 2.690*** 2.303***(0.0646) (0.0736) (0.128)
FTAijt -0.00219 -0.0203 -0.0759***(0.0281) (0.0249) (0.0169)
CUijt -0.101*** -0.0364 -0.0480*(0.0289) (0.0277) (0.0285)
CMijt 0.0220* 0.0158 0.0445***(0.0132) (0.0142) (0.0161)
EUijt 0.0574*** 0.116*** 0.105***(0.0135) (0.0132) (0.0138)
ln(IMP-DVA-DIRjt) -0.724***(0.136)
ln(IMP-DVA-GVCjt) 0.0238(0.101)
ln(EXP-DVA-DIRPjt) -0.347***(0.111)
ln(EXP-DVA-GVCjt) 0.174*(0.0943)
ln(IMP-FVA-DIRjt) 0.429***(0.134)
ln(IMP-FVA-GVCjt) 0.149(0.110)
ln(EXP-FVA-DIRjt) 0.863***(0.0942)
ln(EXP-FVA-GVCjt) -0.196***(0.0654)
Observations 24,600 24,600 24,600R2 0.985 0.987 0.972
Note: Estimated with importer and exporter fixedRobust standard errors in parentheses
*** p<0.01, ** p<0.05, * p<0.1
34

Table A.2.4: Regression results of gravity model on reported export flows, sigma=2
(1) (2) (3)VARIABLES EXP DVA DIR DVA GVC
ln(Yit) 0.759*** 0.826*** 0.742***(0.00682) (0.00726) (0.00683)
ln(Yjt) 0.775*** 0.842*** 0.790***(0.00825) (0.00895) (0.0475)
ln(Ywt) -0.368*** -0.644*** -0.824***(0.0322) (0.0333) (0.0450)
ln(Distanceij) -0.652*** -0.596*** -0.675***(0.0107) (0.0102) (0.0102)
Languageij 0.179*** 0.171*** 0.340***(0.0306) (0.0266) (0.0471)
Borderij 0.534*** 0.568*** 0.290***(0.0404) (0.0385) (0.0350)
FTAijt 0.191*** 0.216*** 0.0818*(0.0549) (0.0479) (0.0445)
CUijt 0.0401 0.161** -0.104(0.0720) (0.0734) (0.0729)
CMijt 0.0845** 0.190*** 0.161***(0.0403) (0.0402) (0.0479)
EUijt 0.0629 0.0995 0.0565(0.0558) (0.0623) (0.0471)
ln(MRT outit ) 0.486*** 0.507*** 0.764***
(0.0487) (0.0472) (0.0593)ln(MRT in
jt ) 0.709*** 0.909*** 0.470***(0.0543) (0.0552) (0.0747)
ln(IMP-DVA-DIRjt) -1.507***(0.149)
ln(IMP-DVA-GVCjt) -0.352***(0.0682)
ln(EXP-DVA-DIRPjt) -1.076***(0.153)
ln(EXP-DVA-GVCjt) 0.858***(0.125)
ln(IMP-FVA-DIRjt) 0.793***(0.141)
ln(IMP-FVA-GVCjt) -0.561***(0.0968)
ln(EXP-FVA-DIRjt) 2.312***(0.151)
ln(EXP-FVA-GVCjt) -0.411***(0.104)
Observations 24,600 24,600 24,600R2 0.798 0.814 0.742
Note: Multilateral resistance terms when sigma is set to 2.Robust standard errors in parentheses
*** p<0.01, ** p<0.05, * p<0.1
35

Table A.2.5: Regression results of gravity model on reported export flows, sigma=4
(1) (2) (3)VARIABLES EXP DVA DIR DVA GVC
ln(Yit) 0.779*** 0.847*** 0.778***(0.00673) (0.00688) (0.00736)
ln(Yjt) 0.820*** 0.910*** 0.889***(0.00921) (0.0100) (0.0461)
ln(Ywt) -0.347*** -0.654*** -0.826***(0.0341) (0.0351) (0.0463)
ln(Distanceij) -0.629*** -0.589*** -0.660***(0.0119) (0.0108) (0.0105)
Languageij 0.140*** 0.172*** 0.326***(0.0325) (0.0285) (0.0471)
Borderij 0.548*** 0.584*** 0.303***(0.0418) (0.0395) (0.0353)
FTAijt 0.218*** 0.257*** 0.0895**(0.0562) (0.0474) (0.0439)
CUijt 0.0601 0.160** -0.101(0.0724) (0.0745) (0.0730)
CMijt 0.0514 0.122*** 0.165***(0.0433) (0.0432) (0.0493)
EUijt 0.0663 0.123** 0.0903*(0.0567) (0.0623) (0.0470)
ln(MRT outit ) 0.234*** 0.353*** 0.399***
(0.0308) (0.0320) (0.0282)ln(MRT in
jt ) 0.194*** 0.389*** 0.146***(0.0320) (0.0338) (0.0402)
ln(IMP-DVA-DIRjt) -1.672***(0.141)
ln(IMP-DVA-GVCjt) -0.338***(0.0669)
ln(EXP-DVA-DIRPjt) -1.121***(0.156)
ln(EXP-DVA-GVCjt) 0.875***(0.128)
ln(IMP-FVA-DIRjt) 0.865***(0.133)
ln(IMP-FVA-GVCjt) -0.571***(0.0928)
ln(EXP-FVA-DIRjt) 2.304***(0.154)
ln(EXP-FVA-GVCjt) -0.375***(0.107)
Observations 24,600 24,600 24,600R2 0.788 0.807 0.736
Note: Multilateral resistance terms when sigma is set to 4.Robust standard errors in parentheses
*** p<0.01, ** p<0.05, * p<0.1
36

A.3 Trade balance and export fit
Table A.3.1: Trade balance fit, reported trade balance on predicted trade balance
(1) (2) (3) (4)VARIABLES TB TB DVA DIR TB DVA GVC TB FVA
TB 0.310*(0.182)
TB DVA DIR 1.026***(0.158)
TB DVA GVC 0.873***(0.0669)
TB FVA 1.003***(0.0987)
Observations 24,600 24,600 24,600 24,600R2 0.155 0.303 0.496 0.620
Robust standard errors in parentheses*** p<0.01, ** p<0.05, * p<0.1
Table A.3.2: Trade balance fit, reported trade balance on predicted trade balance. Non-financial centres
(1) (2) (3) (4)VARIABLES TB TB DVA DIR TB DVA GVC TB FVA
TB 0.234(0.205)
TB DVA DIR 1.051***(0.172)
TB DVA GVC 0.779***(0.00624)
TB FVA 0.995***(0.147)
Observations 17,850 17,850 17,850 17,850R2 0.155 0.319 0.588 0.594
Robust standard errors in parentheses*** p<0.01, ** p<0.05, * p<0.1
37

Table A.3.3: Export fit, reported export flows on predicted export flows
(1) (2) (3) (4)VARIABLES EXP EXP DVA DIR EXP DVA GVC EXP FVA
EXP 0.913***(0.0765)
EXP DVA DIR 0.901***(0.1000)
EXP DVA GVC 0.939***(0.0508)
EXP FVA 0.971***(0.0721)
Observations 24,600 24,600 24,600 24,600R2 0.791 0.792 0.747 0.769
Robust standard errors in parentheses*** p<0.01, ** p<0.05, * p<0.1
38

A.4 Figures
Figure A.4.1: The value added representation of the bilateral trade balance for Ireland
Note: vertical axes expressed in billions USD.Source: authors’ computations based on WIOD and ADB MRIO tables.
39

Figure A.4.2: The value added representation of the bilateral trade balance for Belgium
Note: vertical axes expressed in billions USD.Source: authors’ computations based on WIOD and ADB MRIO tables.
40

Figure A.4.3: The value added representation of the bilateral trade balance for Netherlands
Note: vertical axes expressed in billions USD.Source: authors’ computations based on WIOD and ADB MRIO tables.
41

A.5 Figures
Figure A.5.1: Euro Area trade balance and profit shifting
percentage of GDP
Note: Cyprus, Malta and Lithuania are excluded. Source: "the Missing Profits of Nations". (Sep 2019).Authours: Torslov, T., Wier, L., Zucman, G. and the authors’ calculations
Figure A.5.2: Trade balances and profit shifting effects
percentage of GDP
Note: Cyprus, Malta and Lithuania are excluded. Source: "the Missing Profits of Nations". (Sep 2019).Authours: Torslov, T., Wier, L., Zucman, G. and the authors’ calculations
42

A.6 Figures
Figure A.6.1: reported and corrected trade balances
43

Note: vertical axes expressed in billions USD.Source: authors’ computations based on WIOD tables.
44

WHAT VALUE ADDED IN TRADE BALANCES?THE CASE OF EURO AREA FINANCIAL CENTRES
Virginia Di Nino Anna Ekstam
Virginia Di Nino
Euro Area External Sector and Euro Adoption DivisionDirectorate General Economics - ECB
BIS – ECB – BoP
Lisbon 17 – 02 – 2020Bridging measurement challenges and analytical needs of external statistics: evolution or revolution?
Disclaimer: the views expressed in this work are those of the authors and do not necessarily reflect those of the ECB.

Rubric
www.ecb.europa.eu
Project outline
2
MOTIVATION: Transfer Pricing and Profit Shifting practices plague BOP statistics and our understanding of key economic phenomena
Large Trade Surpluses maintained by tax havens Zucman et al. (2017, 2019), Dowd, Landefeld and Moore(2017), Flaaen et al. (2017), Dharmapala (2019).
WIOD use “cum grano salis” Timmer et al. (2015)
STYLIZED FACTS: TPPS revealed in Value Added trade
Trade Balance of euro area financial centres through value added lenses
Participation and positioning of euro area financial centres in GVC
HOW to IMPROVE?
Apply the gravity workhorse
Estimate adjusted Trade Balances for financial centres

Rubric
www.ecb.europa.eu3
Domestic value added absorbed by the direct importer (DVA direct)
Domestic value added exported abroad which is reflected and absorbed at home (DVA reflected)
Domestic value added exported and further re-exported (as foreign value added in the GVC chain; DVA GVC)
Foreign value added exported directly to the final consumer country (FVA direct)
Foreign value added that is further exported by third countries in the GVC chain (FVA GVC)
Measuring trade in value added
See Borin Mancini (2015)

Rubric
www.ecb.europa.eu4
Domestic value added absorbed by the direct importer (DVA direct)
Domestic value added exported abroad which is reflected and absorbed at home (DVA reflected)
Domestic value added exported and further re-exported (as foreign value added in the GVC chain; DVA GVC)
Foreign value added exported directly to the final consumer country (FVA direct)
Foreign value added that is further exported by third countries in the GVC chain (FVA GVC)
Measuring trade in value added
See Borin Mancini (2015)

Rubric
www.ecb.europa.eu5
Domestic value added absorbed by the direct importer (DVA direct)
Domestic value added exported abroad which is reflected and absorbed at home (DVA reflected)
Domestic value added exported and further re-exported (as foreign value added in the GVC chain; DVA GVC)
Foreign value added exported directly to the final consumer country (FVA direct)
Foreign value added that is further exported by third countries in the GVC chain (FVA GVC)
Measuring trade in value added
See Borin Mancini (2015)

Rubric
www.ecb.europa.eu6
Domestic value added absorbed by the direct importer (DVA direct)
Domestic value added exported abroad which is reflected and absorbed at home (DVA reflected)
Domestic value added exported and further re-exported (as foreign value added in the GVC chain; DVA GVC)
Foreign value added exported directly to the final consumer country (FVA direct)
Foreign value added that is further exported by third countries in the GVC chain (FVA GVC)
Measuring trade in value added
See Borin Mancini (2015)

Rubric
www.ecb.europa.eu7
Domestic value added absorbed by the direct importer (DVA direct)
Domestic value added exported abroad which is reflected and absorbed at home (DVA reflected)
Domestic value added exported and further re-exported (as foreign value added in the GVC chain; DVA GVC)
Foreign value added exported directly to the final consumer country (FVA direct)
Foreign value added that is further exported by third countries in the GVC chain (FVA GVC)
An illustration of trade in value added
See Borin Mancini (2015)

Rubric
www.ecb.europa.eu
The VA representation of the Trade Balance in the Big 4 EA countries
8Sources: WIOD, authors’ calculationsNote: vertical axes expressed in billions USD
DefinitionsSee other economies

Rubric
www.ecb.europa.eu
The VA representation of the Trade Balance in main EA Financial Centres
.
9See other economies
DefinitionsNote: vertical axes expressed in billions USD
Sources: WIOD, authors’ calculations

Rubric
www.ecb.europa.eu
Financial centres are the most downstream positioned in GVC
10
Note: Big 4 consists of Germany, Italy, France and Spain. Conduit refers to Belgium, Ireland, Luxembourg and the Netherlands. Tax havens are referring to Hungary, and Malta. Total exports have been netted out of double counting.
Sources: WIOD, authors’ calculations

Rubric
www.ecb.europa.eu
Improving current statistics of Trade in Value Added
11
Use an augmented gravity workhorse (Baldwin Taglioni(2011) Noguera (2012))
predict bilateral flows of gross and domestic valueadded exports
obtain FVA as a difference between the two predictions
re-compute mirror import statistics, TB & GVCmeasures.
In the vein of Zucman, impose the same structure ofexports and imports in VA across destination (TAX havens& non).

Rubric
www.ecb.europa.eu
Gravity specification
Controls for GVC structure: 𝛾𝛾𝑗𝑗𝑗𝑗𝑗𝑗𝑡𝑡
Controls for countries’ size: Yit, Yjt, Ywt,
Controls for bilateral trade barriers: Distanceij, Languageij, Borderij,
Controls for trade and economic integration:Iijt (CU, CM, EU ,FTA)
Controls for multilateral trade resistance: MRTitout, MRTjtin (two step procedure, see Anderson van Wincoop (2003) and IMF WEO (2019).
12

Rubric
www.ecb.europa.eu
Standard gravity controls
13

Rubric
www.ecb.europa.eu
New gravity controls
14
8 extra terms representing the aggregate trade structure in value added of the bilateral importer (j) with the rest of the world (excluding i)

Rubric
www.ecb.europa.eu
Robustness checks
Gravity estimation on the corrected dataset (predicted exports replace reported values for financial centres): smaller elasticity of exports to the importer GVC trade terms (FVA-DIR DVA-GVC)
Gravity OLS estimation: countries demand shifters less important, FTA insignificant, the negative effect of distance on trade is larger
Gravity including country fixed effects: as MRT terms drop out of the specification, the bilateral importer trade structure becomes more relevant in determining exports from i to j, Domestic demand less important, foreign demand more important, economic integration matters more (probably better identified DD effects when country’s fixed effects are included).
Gravity with lower and higher σ (elasticity of substitution across varieties): MRT terms gains relevance as σ increases.
15

Rubric
www.ecb.europa.eu
The adjusted trade balance of financial centres
16Sources: WIOD, authors’ calculations

Rubric
www.ecb.europa.eu
Revised positioning and participation
17
Note: Big 4 consists of Germany, Italy, France and Spain. Conduit refers to Belgium, Ireland, Luxembourg and the Netherlands. Tax havens are referring to Hungary, and Malta. Total exports have been netted out of double counting.
Sources: WIOD, authors’ calculations

Rubric
www.ecb.europa.eu
MAIN TAKEAWAYS
18
The trade balance decomposition by value added content reveals:1. for the main euro area financial centres
large deficits in domestic value added exported and further re-exported,
large surpluses in foreign value added exported directly to the finalconsumers,
2. for other main euro area economies
large surpluses in domestic value added absorbed by the directimporter.
3. Financial centres are the most downstream positioned in GVC owing toservices in intangibles only entering the very last stage of production.
4. Trade surpluses in main euro area financial centres disappears ingravity predictions.
5. Profits shifted to these economies are estimated to be around USD300 billion.

Rubric
www.ecb.europa.eu
THANKS FOR THE ATTENTION
19

Rubric
www.ecb.europa.eu
.
20
Reserve slides

Rubric
www.ecb.europa.eu
“Transfer pricing and relocation of IP washes out in the current account. Exports are under reported by the same amount as overseas investment income is over reported.”Avdjeiev, Everett, Lane & Shin, 2018, “Tracking the international footprints of global firms” BIS quarterly review
TP generates large discrepancies in mirror trade statistics. Within the EU the gap between service exports and imports is 11 p.p. of total service exports (8 p.paccounted by financial centres). Torlsov, Wier, Zucman (2019) “The missing profits of Nations”
The World Input Output Database (WIOD) is as afflicted by Profit shifting and thepractice of transfer pricing as BOP (primary data source) in two ways :1. Misreporting of intra-firm trade values;2. The implicit pricing of the use of intangibles (brand names, trademarks, software
and other knowledge systems). It shows up as a difference between the finalpurchasers’ and ex-factory prices of the product.
Timmer et al. (2015) “An illustrated user guide to WIOD”.
21
TP&PS on WIOD through BOP

Rubric
www.ecb.europa.eu22
Source: “Why High-Tax Countries Let Tax Havens Flourish”. (Nov 2017). Authors: Torslov, T., Wier, L., Zucman, G.
BOP items afflicted by TP&PS

Rubric
www.ecb.europa.eu
Trade balances corrected for profit shifting
23
Euro area trade balance & profit shifting
(% of GDP)
Trade balances & profit shifting effects(% of GDP)
Sources: “The Missing Profits of Nations”. (Sep 2019). Authors: Torslov, T., Wier, L., Zucman, G. and the authors’ calculations
0.00
0.01
0.02
0.03
0.04
0.05
0.06
Official trade balance Corrected trade balance
Note: Cyprus, Malta and Lithuania are excluded.Income balance

Rubric
www.ecb.europa.eu
Income balances corrected for profit shifting
24
Aggregated income balance corrected for profit shifting, Euro Area
(% of GDP)
Income balances corrected for profit shifting(% of GDP)
-0.40%
-0.30%
-0.20%
-0.10%
0.00%
0.10%
0.20%
0.30%
Official income balance Corrected income balance
-60%
-40%
-20%
0%
Fran
ceG
erm
any
Finl
and
Net
herla
nds
Gre
ece
Spai
nBe
lgiu
mLa
tvia
Italy
Aust
riaSl
ovak
iaEs
toni
aPo
rtuga
lSl
oven
iaIre
land
Luxe
mbo
urg
Official income balance Corrected income balance
Note: Cyprus, Malta and Lithuania are excluded.
Sources: “The Missing Profits of Nations”. (Sep 2019). Authors: Torslov, T., Wier, L., Zucman, G.and the authors’ calculations
back

Rubric
www.ecb.europa.eu
The current state of art: GVC position
25Sources: WIOD, authors’ calculations
GVC position=log(1+DVAinEXPij/TotEXPij) - log(1+FVAinEXPij/TotEXPij)

Rubric
www.ecb.europa.eu
• From aggregate to bilateral (and sectoral) decomposition of trade flows. Why a bilateral decomposition?
• country A decomposition, term 9, as VBBBAAAB(I − ABB)−1EB.
Follow the Value Added flows in GVCs: measurement issues and solutions
26

Rubric
www.ecb.europa.eu
Bilateral decomposition of Borin Mancini (2015)
27

Rubric
www.ecb.europa.eu
Trade Balance in Value added the case of Luxembourg
28
TB DVADIR = EXP of VA produced in LUX absorbed by the direct importer- IMP of VA produced by the direct exporter & absorbed by LUX
TB DVAGVC = EXP of VA produced in LUX & absorbed by a third country - IMP of VA produced by the direct exporter & not absorbed in LUX but elsewhere (not by the original exporter)
TB DVA reflected = EXP of VA produced in LUX & absorbed domestically - IMP of VA produced & absorbed by the direct exporter (via re-export of LUX) [negligible]
TB FVADIR = EXP by LUX of VA created by a third country & absorbed by the direct importer - IMP in LUX of VA not produced by the direct exporter & absorbed in LUX.
TB FVAGVC = EXP by LUX of VA created by a third country and not absorbed by the direct importer (but further re-exported) - IMP in LUX of VA not produced by the direct exporter but by a third country and not absorbed by LUX.

Rubric
www.ecb.europa.eu29
Luxembourg vis à vis the world
Sources: WIOD, authors’ calculations
The Trade Balance in Value Added of Luxembourg
Note: vertical axes expressed in billions USD
-80
-60
-40
-20
0
20
40
60
80
100
2000 2002 2004 2006 2008 2010 2012 2014
Domestic VA direct Domestic VA GVCDomestic VA reflected Foreign VA directDouble counting Foreign VA GVCtrade balance

Rubric
www.ecb.europa.eu
-25
-20
-15
-10
-5
0
5
2000 2002 2004 2006 2008 2010 2012 2014
-2
-1
0
1
2
3
4
5
2000 2002 2004 2006 2008 2010 2012 2014
-6
-5
-4
-3
-2
-1
0
1
2
3
4
5
2000 2002 2004 2006 2008 2010 2012 2014
-6
-4
-2
0
2
4
6
8
2000 2002 2004 2006 2008 2010 2012 2014
Bilateral TBVA of Luxembourg… where does FVA end-up?
30
Luxembourg vs. IrelandLuxembourg vs. Germany
Luxembourg vs. United States
See other economies
Luxembourg vs. France
Note: vertical axes expressed in billions USD
Sources: WIOD, authors’ calculations

Rubric
www.ecb.europa.eu
Exports and Imports in Value added
31
Luxemburg vis à vis the world
Sources: WIOD, authors’ calculations
Imports in VAExports in VA
Note: vertical axes expressed in billions USD
0
20
40
60
80
100
120
2000 2002 2004 2006 2008 2010 2012 2014
Domestic VA direct Domestic VA GVCDomestic VA reflected Foreign VA directDouble counting Foreign VA GVCtotal imports
0
20
40
60
80
100
120
140
2000 2002 2004 2006 2008 2010 2012 2014
Domestic VA direct Domestic VA GVCDomestic VA reflected Foreign VA directDouble counting Foreign VA GVCtotal exports

Rubric
www.ecb.europa.eu
-1000
-800
-600
-400
-200
0
200
400
2000 2002 2004 2006 2008 2010 2012 2014
-200
-100
0
100
200
300
400
500
600
700
800
2000 2002 2004 2006 2008 2010 2012 2014-150
-100
-50
0
50
100
150
200
2000 2002 2004 2006 2008 2010 2012 2014
-40
-20
0
20
40
60
80
100
120
2000 2002 2004 2006 2008 2010 2012 2014
Mill
ions
The VA representation of TB in global economies: large DVADIR
32
United States Switzerland
China Japan
Sources: WIOD, authors’ calculationsNote: vertical axes expressed in billions USD
DefinitionsSee other economies

Rubric
www.ecb.europa.eu
-1000
-800
-600
-400
-200
0
200
400
2000 2002 2004 2006 2008 2010 2012 2014
-200
-100
0
100
200
300
400
500
600
700
800
2000 2002 2004 2006 2008 2010 2012 2014-100
0
100
200
300
400
500
2000 2002 2004 2006 2008 2010 2012 2014
-8
-6
-4
-2
0
2
4
6
8
2000 2002 2004 2006 2008 2010 2012 2014
Decomposing the trade balance in value added
.
33
Malta
Germany
United States
China
Sources: WIOD, authors’ calculations

Rubric
www.ecb.europa.eu
-2
-1
0
1
2
3
4
5
6
2000 2002 2004 2006 2008 2010 2012 2014-3
-2
-1
0
1
2
3
4
5
6
7
2000 2002 2004 2006 2008 2010 2012 2014
-50
-40
-30
-20
-10
0
10
20
30
2000 2002 2004 2006 2008 2010 2012 2014
Bilateral Trade Balance in Value added, were FVA ends up
34
Ireland vs. Italy Ireland vs. Spain
Ireland vs. United States
Sources: WIOD, authors’ calculations
-4
-2
0
2
4
6
8
2000 2002 2004 2006 2008 2010 2012 2014
Ireland vs. France

Rubric
www.ecb.europa.eu
-10.0
-5.0
0.0
5.0
10.0
15.0
20.0
2000 2002 2004 2006 2008 2010 2012 2014
-2.0
-1.0
0.0
1.0
2.0
3.0
4.0
5.0
6.0
2000 2002 2004 2006 2008 2010 2012 2014
-20.0
-15.0
-10.0
-5.0
0.0
5.0
10.0
2000 2002 2004 2006 2008 2010 2012 2014
-10.0
-5.0
0.0
5.0
10.0
15.0
20.0
25.0
2000 2002 2004 2006 2008 2010 2012 2014
Bilateral Trade Balance in Value added, were FVA ends up
35
Belgium vs. Germany Belgium vs. Luxembourg
Belgium vs. United States
Sources: WIOD, authors’ calculations
Belgium vs. France

Rubric
www.ecb.europa.eu
Trade Balance in Value added
36
Germany vis à vis the world
Sources: WIOD, authors’ calculations
-100
0
100
200
300
400
500
2000 2002 2004 2006 2008 2010 2012 2014
TBDVAdir TBDVAGVC TBDVAREFTBFVAdir TBDCO TBFVAGVCtrb

Rubric
www.ecb.europa.eu
Exports and Imports in Value added
37
Germany vis à vis the world
Sources: WIOD, authors’ calculations
Imports in VAExports in VA
0
200
400
600
800
1000
1200
1400
1600
1800
2000 2002 2004 2006 2008 2010 2012 2014
DVAinBilEXP DVAinGVCEXP DVAinREFEXPFVAinBilEXP DCOinBilEXP FVAinGVCEXPtot exp
0
200
400
600
800
1000
1200
1400
2000 2002 2004 2006 2008 2010 2012 2014
DVAinBilIMP DVAinGVCIMP DVAinREFIMPFVAinBilIMP DCOinBilIMP FVAinGVCIMPtot imp

Rubric
www.ecb.europa.eu
-10
-5
0
5
10
15
20
25
30
2000 2002 2004 2006 2008 2010 2012 2014
-5
0
5
10
15
20
25
30
35
40
2000 2002 2004 2006 2008 2010 2012 2014-30
-20
-10
0
10
20
30
40
50
60
70
80
2000 2002 2004 2006 2008 2010 2012 2014
-10
-8
-6
-4
-2
0
2
4
2000 2002 2004 2006 2008 2010 2012 2014
Bilateral Trade Balance in Value added, were FVA ends up
38
Germany vs. Italy
Germany vs. France Germany vs. United States
See other economies
Germany vs. Ireland
Sources: WIOD, authors’ calculations

Rubric
www.ecb.europa.eu
Trade Balance in Value added
39
Belgium vis à vis the world
Sources: WIOD, authors’ calculations
-80
-60
-40
-20
0
20
40
60
80
100
120
2000 2002 2004 2006 2008 2010 2012 2014
TBDVAdir TBDVAGVC TBDVAREFTBFVAdir TBDCO TBFVAGVCtrb

Rubric
www.ecb.europa.eu
Exports and Imports in Value added
40
Belgium vis à vis the world
Sources: WIOD, authors’ calculations
Imports in VAExports in VA
0
50
100
150
200
250
300
350
400
450
2000 2002 2004 2006 2008 2010 2012 2014
DVAinBilEXP DVAinGVCEXP DVAinREFEXPFVAinBilEXP DCOinBilEXP FVAinGVCEXPtot exp
0
50
100
150
200
250
300
350
400
2000 2002 2004 2006 2008 2010 2012 2014
DVAinBilIMP DVAinGVCIMP DVAinREFIMPFVAinBilIMP DCOinBilIMP FVAinGVCIMPtot imp

Rubric
www.ecb.europa.eu
Trade Balance in Value added
41
Ireland vis à vis the world
Sources: WIOD, authors’ calculations
-100
-50
0
50
100
150
2000 2002 2004 2006 2008 2010 2012 2014
TBDVAdir TBDVAGVC TBDVAREFTBFVAdir TBDCO TBFVAGVCtrb

Rubric
www.ecb.europa.eu
Exports and Imports in Value added
42
Ireland vis à vis the world
Sources: WIOD, authors’ calculations
Imports in VAExports in VA
0
50
100
150
200
250
300
2000 2002 2004 2006 2008 2010 2012 2014
DVAinBilEXP DVAinGVCEXP DVAinREFEXPFVAinBilEXP DCOinBilEXP FVAinGVCEXPtot exp
0
50
100
150
200
250
2000 2002 2004 2006 2008 2010 2012 2014
DVAinBilIMP DVAinGVCIMP DVAinREFIMPFVAinBilIMP DCOinBilIMP FVAinGVCIMPtot imp

Rubric
www.ecb.europa.eu
Trade Balance in Value added
43
The Netherlands vis à vis the world
Sources: WIOD, authors’ calculations
-100
-50
0
50
100
150
200
2000 2002 2004 2006 2008 2010 2012 2014
TBDVAdir TBDVAGVC TBDVAREFTBFVAdir TBDCO TBFVAGVCtrb

Rubric
www.ecb.europa.eu
Exports and Imports in Value added
44
The Netherlands vis à vis the world
Sources: WIOD, authors’ calculations
Imports in VAExports in VA
0
100
200
300
400
500
600
700
2000 2002 2004 2006 2008 2010 2012 2014
DVAinBilEXP DVAinGVCEXP DVAinREFEXPFVAinBilEXP DCOinBilEXP FVAinGVCEXPtot exp
0
50
100
150
200
250
300
350
400
450
500
2000 2002 2004 2006 2008 2010 2012 2014
DVAinBilIMP DVAinGVCIMP DVAinREFIMPFVAinBilIMP DCOinBilIMP FVAinGVCIMPtot imp

Rubric
www.ecb.europa.eu
Share of exports and imports by VA content by destination in 2014
45
Note: 4B consists of Germany, Italy, France and Spain. 4C consists of Belgium, Ireland, Luxembourg and the Netherlands
Sources: WIOD, authors’ calculations
DVA in bilateral EXP
DVA in GVC EXP
DVA reflected
FVA in bilateral EXP
FVA in GVC EXP
total DVA total FVA Total
4BROW 30.3 5.3 0.2 10.5 2.2 36 13 49EA 17.2 7.8 0.8 6.4 3.8 26 10 36rest of EU 7.8 3.0 0.4 2.8 1.4 11 4 15
55 16 1 20 7 73 27 1004CROW 18.7 3.9 0.0 14.6 3.6 23 18 41EA 15.8 9.8 0.2 11.9 7.8 26 20 46rest of EU 5.7 1.8 0.0 4.6 1.5 7 6 14
40 16 0 31 13 56 44 100
DVA in bilateral IMP
DVA in GVC IMP
DVA reflected
FVA in bilateral IMP
FVA in GVC IMP
total DVA total FVA Total
4BROW 21.8 8.7 1.0 5.6 2.7 31 8 40EA 20.6 8.6 0.5 10.3 5.5 30 16 46rest of EU 6.9 3.0 0.1 3.1 1.7 10 5 15
49 20 2 19 10 71 29 1004CROW 17.1 19.4 2.4 4.0 4.2 39 8 47EA 13.0 11.7 0.9 6.0 6.4 26 12 38rest of EU 5.2 5.8 0.4 1.7 1.7 11 3 15
35 37 4 12 12 76 24 100
4C EXP4B EXP 4C IMP4B IMP

1/1
IFC Conference on external statistics "Bridging measurement challenges and analytical needs of external statistics: evolution or revolution?", co-organised with the Bank of Portugal (BoP) and the European Central Bank (ECB)
17-18 February 2020, Lisbon, Portugal
Developing an extended and more agile external accounts program1
Jennifer Withington,
Statistics Canada
1 This paper and presentation were prepared for the meeting. The views expressed are those of the author and do not necessarily reflect the views of the BIS, IFC, BoP, ECB or
the central banks and other institutions represented at the meeting.

Developing an extended and more agile external accounts program 1
Developing an extended and more agile external accounts program
Jennifer Withington, Statistics Canada
Traditionally, the conceptual framework of the external accounts has been focussed on better understanding the size and nature of products, services and investment exchanged between countries. While measuring economic activity between countries is and will remain crucial in the future, policy needs have evolved rapidly in recent years towards assessing the impact of global activity within domestic economies and better measuring the extent to which local economic agents benefit, or could benefit further, from this activity. Access to more sub-national level data is required to support this analysis.
In order to better address these evolving needs, a number of initiatives have been launched at the international level in the context of a broader external accounts framework. Several countries have started to develop new products that can be seen as extensions to their core external accounts program. Statistics Canada has put in significant effort in modernizing to better reflect the changing world and meet users’ needs.
Contents
A Changing World ................................................................................................................................... 2
Changing Users ........................................................................................................................................ 2
Changing Statistical Agency ................................................................................................................ 2
An Enhanced Balance of Payments .................................................................................................. 3
Trade by Enterprise Characteristics .................................................................................................. 4
Multinational Enterprises in Canada Program ............................................................................. 6
Granularity and Confidentiality .......................................................................................................... 8
Impacts on Core Estimates .................................................................................................................. 9

2 Developing an extended and more agile external accounts program
A Changing World
The world in which we live is rapidly changing. It’s becoming more complex and intertwined. With the globalization of our economy and changing views of societal issues – more than ever – objective quality data must drive evidence-based policy and decision making.
At the same time globalization has changed the way firms operate, with complex corporate structures and operational arrangements which allow funds to move through multiple jurisdictions before reaching their final destinations and maximizing operational profits.
Canada has a relatively small open economy, and over the last 90 years, Statistics Canada has developed and disseminated a rich set of data that measures Canada’s transactions with the rest of the world. While these data have served policy makers, academics and citizens well, the data are losing their relevance in the globally interconnected world in which firms and individuals find themselves. Until recently, our statistics did not tell the full story of Canada’s role in the global economy.
Changing Users
It is clear that as the world changes, users require stronger tools to enable them to understand these highly complex international transactions. At the same time big data is growing, data users are more literate and are looking to data to guide innovation and make business decisions. While globalization has made users focus on the international market, they also want to do so with increasing granularity.
It is no longer enough to simply report what we trade and where it goes or where it comes from. Policy makers want to know who is trading, what Canada’s value added is in the global value chain, how exposed we are to global financial markets and what the outcome of foreign direct investment isboth inside and outside of Canada. Simply, Canadians are no longer satisfied with the what and where, but are asking Statistics Canada about the who and the why.
This is an important story to tell since roughly a third of our GDP is related to international trade in goods and services. More than 12% of all Canadian jobs are linked to foreign direct investment in Canada. Non-residents hold more than $1 trillion in Canadian government and corporate bonds. If we do not have the proper tools to examine that changing role, we cannot develop appropriate policy that leads to a strong and stable Canadian economy.
Changing Statistical Agency
Over the last decade, Canadians and businesses increasingly want to be informed and expect to have high quality, real time data. There is a growing cadre of data savvy users while at the same time, the public is consuming information in an entirely different manner. There is also a proliferation of data providers who are ready to furnish data that have traditionally been the domain of Statistics Canada.

Developing an extended and more agile external accounts program 3
Statistics Canada is well aware of the rapidly changing world and evolving need of users. In response, Statistics Canada has recognized the importance of modernizing its operations and its approach as a statistical agency. Statistics Canada’s modernization initiative is centred of 4 basic pillars; User centric delivery service, leading-edge methods and data integration, statistical capacity building and leadership and sharing and collaboration.
User centric delivery means that users have the data they need when they need it with the tools and knowledge required to full leverage the information.
A focus on leading edge methods has brought about a shift from relying primarily on surveys as a collection vehicle to taking an “administrative data first” approach. This involves looking internally and externally to all possible administrative data sources.
Leading edge methods also implies a focus on new methods such as machine learning, data linking, modelling and “nowcasting” which increase the scope and quality of data that can be produced.
Statistical capacity building is more outward oriented and focuses on ensuring that users have the tools and knowledge to understand and use our statistics to their greatest advantage. Many government departments in Canada recognize the importance of data and are in the process of developing data strategies. Statistics Canada would like to play a leadership role in these data strategies and would like to help users have the tools and knowledge necessary to full leverage our data.
This is underpinned by the notion of a modern and flexible operation which will reduce costs, streamline processes to allow for a more agile corporation.
An Enhanced Balance of Payments
While the primary focus of the Balance of Payments remains rooted in the macroeconomic accounts, the need for change has become clear.
As mentioned, the International Accounts and Trade program was created at a time when simple two-way merchandise trade accounted for the vast majority of transactions and was the primary focus of policy makers’ interest. Now interest has evolved and users are increasingly interested in a variety of other elements, many of which are complex in nature. The International Accounts program must evolve to reflect this new world.
Statistics Canada has begun to pursue further initiatives that are extensions of the core international accounts, while remaining full grounded in their traditional concepts. The goal of these supplementary data is to better reflect the changing world, and to meet evolving user requirements.
The supplementary nature of these emerging products provides additional flexibility to compilers to construct experimental – but not less relevant – datasets as they are usually not bounded by more stringent statistical frameworks (i.e., the residency or economic territory definitions), as is the case for official external accounts. They also offer the potential to better respond to users’ needs for more sub-national data.

4 Developing an extended and more agile external accounts program
To enable the development of supplementary data sources, a project was initiated, enhancing the International Accounts. The importance of this exercise was fully recognized by our government partners and long term funding was secured.
All areas of the Balance of Payments have been enhanced and will continue to be expanded with an ambitious timeline that is in line with users’ priorities.
Given the backdrop of modernization, the emphasis was on the creation of an innovative statistical infrastructure maximizing the use of existing micro-data and record linkage techniques while being able to connect the details with established macro aggregates. This approach provides us with the agility required to better meet user needs. Client feedback and developments in international standards have also influenced the setting of priorities.
Over the last years, we have developed a number of innovative data products that help tell the story of Canada’s changing role in the global economy.
The outcome of this proposal includes addressing data gaps and enhancing statistics in the following areas:
• International trade in services including international trade in digital services and products – an area of growing importance.
• Properly measuring global production and addressing data gaps associated with global value chains and mismeasurements in Canada’s estimate of gross domestic product due to the growing amount of goods production abroad by Canadian producers.
• Providing more detail regarding Canada’s foreign direct investment flows including increased industrial, geographic and directional detail.
All of these products are considered extensions of Balance of Payments data and concepts and are based on the original Balance of Payments source data. Development of the extensions, in many cases was made possible by the availability and accessibility of a core Balance of Payments program.
While these data gaps are not specific to Statistics Canada, the centralized nature of the agency and its modern approach has provided some unique opportunities to address these gaps.
The end results are a new set of very granular statistics – including sub-national detail – with high data quality standards at relatively low costs, enhancing the ability of the organization to support evidence-based policy decision making.
While improvements have been made in all areas of the Balance of Payments, the focus for this paper will be put on two products that are more tangential, the programs on Activities of Multinationals Enterprises (AMNEs) and Trade by Enterprise Characteristics (TEC) will be described, focussing on the key enablers of their creation.
Trade by Enterprise Characteristics
Traditional statistics on international merchandise trade provide detailed information on products traded between Canada and the rest of the world and are very timely.

Developing an extended and more agile external accounts program 5
They are crucial for trade negotiations and provide users with an understanding of who our partners are and measure the intensity of trade with these partners.
They, however, do not provide insights such as who is engaged in such activity in the country, what are the characteristics of traders and how these characteristics differ from those who are non-traders could provide additional insights to policy-makers to develop more efficient policies in order to expand and diversify exporting markets for Canadian enterprises.
It is also when these data are combined with other data that they start to reveal a richer perspective and become more useful to understand the importance and the nature of trade in the economy. Once again we have extended our merchandise trade statistics, stayed true to current account concepts and simply expanded them.
Many countries have a trade by enterprise characteristics product. Canada, however, has a trade by importer and exporter characteristics program. This was done purposely to reflect the fact that information is linked at both the establishment and enterprise unit. Enterprise data supports analysis at the national level and allows for the linkage of consolidated financial data. It is at this level that we can link variables such as services, employment, R&D, imports and exports.
Statistics Canada is at an advantage in this regard. Having access to a business register and a number of other indicators allow us to link all the information together and gain a full portrait of our traders. Furthermore, when existing data sources are used, it minimizes the additional costs, both monetary and in terms of response burden.
The Canadian Business Register is a comprehensive, continuously maintained central repository of baseline information on businesses and institutions operating in Canada. As a statistical register, it provides listings of units and related attributes.
The primary point of linkage is the customs data (import and export declarations) which is a census of all merchandise that enters and exits the country. TIC and TEC data are also linked to the Survey of Employment, Payroll and Hours as well as our inward and outward affiliates programs.
Enterprise and establishment data are both included as the establishment level is more suitable for provincial analysis as it more closely reflects the local activity. This is particularly important for a vast and regionally diverse country such as Canada. Data for employment, manufacturing, imports and exports can be linked at this level.
Approximately 400 million transactions are processed per year.
The result is a rich data set that include 20 data tables including the following variables:
• Employment size
• Number of partner countries
• Concentration of exports
• Industry
• Export size
• Related party
• Country of destination
• Number of enterprises

6 Developing an extended and more agile external accounts program
• Firm size
With establishment data we can produce more accurate sub-national data. This subnational data allows users to better understand the regional variability in trade activities and pinpoint opportunities for development. There has been strong user demand for even more granular data, so that in September this year, Trade by importer and exporter data by Census Metropolitan Area (CMA) were produced for the first time for Canada’s 35 CMAs. These data provide users with a portrait of traders by major city that can be compared to other cities and even with non-census-metropolitan areas.
While the analytical potential is strong with all these data, having such granularity can be overwhelming. To that end, Statistics Canada developed an interactive tool, using Power BI to help facilitate analysis.1
All this work is in line with Statistics Canada’s modernization goals of using modern methods and being more clients centric.
At the requests of clients and in the interest of policy-makers, these extensions have been taken even further. For instance, special studies have been done on province to province trade for Canada and China. A study is also under way for sub-Saharan Africa.
Processes have also been modernized so that not only are we linking, but we are linking smarter. While originally much of the linkage was done manually, efforts have been made to automate the linkage process. A process that once required upwards of 10 staff can now be done with a couple of staff and automated linking. Having the information readily available and automated enables Statistics Canada to produce the data 5 months after the reference period, compared to an average of 18 months for other countries.
Multinational Enterprises in Canada Program
Statistics Canada has been publishing estimates of Canada’s foreign direct investment abroad and foreign direct investment in Canada since 1926. The traditional view of measuring foreign direct investment was to measure the origin and level of foreign investment. These measures remain important both within and outside the Balance of Payments framework and Statistics Canada continues to refine these estimates in order to produce a more robust capital account.
Today, however, more and more people want to better understand the outcomes associated with foreign investment with respect to jobs, trade and financial stability. This has given rise to a new and expanded set of foreign affiliate statistics which highlight the importance of foreign-owned firms in the Canadian economy. This program has been expanded to measure the economic and financial activity of both foreign and Canadian multinationals in Canada and helps measure the extent of globalization phenomenon within the Canadian economy.
1 https://www150.statcan.gc.ca/n1/pub/71-607-x/71-607-x2019009-eng.htm

Developing an extended and more agile external accounts program 7
While the multinational concept uses the majority owned concept, differing from the FDI threshold of 10% the difference is considered minor since the vast majority of FDI firms in Canada are in fact majority owned.
The multinational enterprise in Canada program is built upon a strong foundation of various data sources which allows for a rich analysis. It provides further insight on the impact of foreign MNEs in Canada and has recently been expanded to allow for the comparison with domestic enterprises both in terms of performance and contribution to the Canadian economy.
Once again, the ability to link together a number of data sources is one of the strengths of this program. In this case data linkages are primarily done at the enterprise level, given that the data are largely financial in nature. The primary data sources used to identify multinationals include the International Investment program, various tax schedules as well as the inter-corporate ownership program and labour statistics. Financial variables are linked to the Annual Financial and Taxation Statistics for Enterprises and are benchmarked to national accounts totals.
The extensive linking provides a comprehensive portrait of multinational enterprises both on an immediate and ultimate basis. Values include:
• Number of employees’ assets
• geographic location
• industry
• R&D expenditures
• exports and imports
• operating expenses
• value added.
All these variables allow policy maker’s insight into the contribution of multinationals and the outcomes of their presence.
Linking the data is an effective and cost-effective way to add dimensions to datasets. Once the initial work has been done to link at the enterprise level, there are economies of scale to adding extra variables. Quality control work is still done to ensure that any additional variables are well linked are of good quality and are coherent across the series of variables.
While the data series come from a number of different areas at Statistics Canada, the integrated nature of the agency allows for the easy sharing of data sources all on a common infrastructure. Furthermore, the centralized Business Register provides a common identifier for enterprises and clearly details which data sources can be leveraged. For example, the international accounts program has added flags for multinationals and for traders to help enrich the analysis of other survey programs by providing another variable for analysis. Generally program areas are willing to share their data through a common infrastructure and provide their subject matter expertise to the linking exercise.
Recently, Statistics Canada has gone further to complete the picture of multinationals in Canada by adding Canadian multinationals. This enriches the analysis by providing a point of comparison for the performance of foreign multinationals and the benefits that they bring to the Canadian economy. It answers the question of whether these multinationals are bringing jobs to the Canadian

8 Developing an extended and more agile external accounts program
economy along with many others. Who is boosting GDP? Are their profits being reinvested here or going back to their home country? Are they exporting more? Are they concentrated in specific industries, specific provinces? Are we better off supporting Canadian firms? Non-multinationals are also included in the analysis to see the full economic impact and as an extra point of comparison.
Taking the framework and foundation of the FDI program, and extending it by making micro-macro linkages can be beneficial to both the core program and help answer whether domestically engaged firms behave differently from those that are internationally engaged as well. This can be studied by a number of perspectives for instance is certain industries more likely to be internationally engaged and can help identify lost opportunities.
These extensions also help us to further refine our analysis in a way that would not be ideal with the traditional framework alone. For instance, the FDI program is sampled to be as efficient as possible, focusing on larger units. At the same time, policy experts are focused on SMEs and their promotion. Extended programs such as the multinationals can use the micro-macro framework to identify SMEs, thereby allowing breakouts of information by size of firm. Given their flexibility, these programs can be further extended to view the data through other lenses such as Gender-based analysis (GBA), a focus of the current government.
Granularity and Confidentiality
Statistics Canada has developed a number of new products recently to better illustrate Canada’s role in the global economy and the impact of trade and foreign investment in the Canadian economy, at the national and provincial level. While the world becomes more and more globally integrated, demand from users is to have access to more granular data, at the provincial, regional and even city level in order to properly assess the impact of globalization in their local economy and to take advantage of the structural and economic changes in their community.
In Canada, the development of these products coincided with the desire of the statistical agency to modernize its operations in order to become more user-centric and make better use of leading-edge methods and data integration. All these new products were developed against the backdrop of the modernization initiative undertaken by Statistics Canada. They involved the creation of an innovative statistical infrastructure maximizing the use of existing micro-data and record linkage techniques while being able to connect the details with established macro aggregates.
At the same time, Statistics Canada is fully committed to respecting the confidentiality of its respondents/administrative data sources. In fact, its reputation and ongoing success rely on how. How do we reconcile the two? How do we provide users with the increased granularity that they require while at the same time continue to respect confidentiality that is central to Statistics Canada’s values?
Our approach to confidentiality has also been modernized and the requirements have been looked at in a more nuanced manner. Traditionally, confidentiality has been introduced through a rigid set of rules that took the most conservative approach; the first instinct would be to make the data (and much of the grouping data) confidential. While this approach was safe, and the risk of identifying a firm’s

Developing an extended and more agile external accounts program 9
data was nil, this resulted in too much of our data being suppressed, thereby reducing the usability of our data. What is the point of producing all this data if much of it can’t be used?
We have tried to move the needle slightly and look at protecting confidentiality in more innovative ways. Random Tabular Adjustment (RTA) is being increasingly applied to our surveys in order to minimize suppression. RTA applies random adjustment to sensitive estimates by perturbing the data with random noise. A balance must be found so that confidential data cannot be identified yet without compromising the overall picture and quality of data. In certain areas such as the National Accounts, it was felt that the many adjustments already made to the data to align with SNA concepts were in fact acting as an RTA and the potential firms engaging in the activity was large.
As a result of these renewed methodologies, many data cells have been made available, greatly enhancing the usability of our data and meeting user requirements for greater granularity. Nonetheless, when linking data, the confidentiality rules of the supplying data program are always protected. We ensure that nothing that has been suppressed by the supplying data program will be revealed through our data linking. This is vital for the ongoing success of our program. Our confidentiality plan was vetted with the source programs and our approach is regularly reviewed to see if we can increase the number of cells released.
Impacts on Core Estimates
While some of the focus has shifted to expanded uses of the international accounts, our priority and primary mandate remain the Balance of Payments. How has this shift towards extensions impacted the core? In many ways the two products are complementary, leveraging data from the financial accounts and adding context. The additional details enable the data compilers to do more coherence analysis and further inspection of the granular data generally lead to better quality aggregates. Nonetheless there are risks associated that without sufficient resources and a proliferation of products, the core products could get less attention.
In creating the micro-macro frameworks discussed in the paper and extending our traditional external account frameworks, we are positioning ourselves to answer the policy questions of the day. In fact, we can look beyond this framework to get a better understanding of those outside the framework. This will help policymakers identify potential opportunities and understand the behaviour of those not engaging in the international sphere.
Statistics Canada will continue to balance various requirements in order to remain relevant in the future. By communicating regularly with users and striving to meet their needs, Statistics Canada will endeavour to continue to evolve while maintaining its reputation for quality information. This can largely be achieved by leveraging extending long-standing programs such as the external accounts. Statistics Canada will do so by continuing to build on the strong foundation of the external accounts and by doing so in an efficient manner leveraging existing resources.

Telling Canada’s story in numbers
Irving Fisher Committee on Central Bank Statistics
Jennifer Withington
Statistics Canada
Feb. 17, 2020
Developing an extended and more agile external accounts program
www.statcan.gc.ca

The World is changing and the statistical system must adapt to remain relevant
The ‘what’ we trade is important but ‘who’ is trading has become an important question.
Canadian firms are highly
involved in global value chains.
Focus of trade has shifted on Trade in value added.
Measuring the extent of direct
investment is crucial, but
assessing the impact of such investment
has taken greater importance.
Growing importance of services in the economy. Way of consuming services has changed.
Presenter
Presentation Notes
The world in which we live is rapidly changing. It’s becoming more complex and intertwined. With the globalization of our economy and changing views of societal issues – more than ever – objective quality data must drive evidence-based policy and decision making. International trade and Foreign Direct Investment (FDI) are main defining features and key drivers of Global Value Chains. Globalization has changed the way firms operate. They now operate at a global level. They have set up complex corporate structures, allowing funds to move through multiple jurisdictions before reaching their final destinations to optimize profits. Statistics Canada has developed a number of new products recently to better illustrate Canada’s role in the global economy and the impact of trade and foreign investment in the Canadian economy, at the national and provincial level. While the world becomes more and more globally integrated, demand from users is to have access to more granular data, at the provincial, regional and even city level in order to properly assess the impact of globalization in their local economy and to take advantage of the structural changes in the economy in their community.

Statistics Canada’s Modernization
2020-01-31Statistics Canada • Statistique Canada3

A culture shift in our thinking.
Collaborative Process Savvy User-Centric Modern Methods
Drop the mentality that we are the only ones
who can do what we do..
Be strategic in the evolution of our business
processes rather than letting processes develop
hap-hazardly and independently
Stop producing technical documents that are
verbose and inaccessible.
Accept that an Algorithm is better than a pencil.
.
Develop new skill sets that leverage the
increasing volume of data available to NSOs
Put as much effort into user access as we do in the development of the
product.
Workforce Market Oriented

Modernized Strategy for International Trade and Globalization Measures
Pillar 1 International
Trade in Services
Pillar 2 Firm
Characteristics
Pillar 3Foreign Direct
Investment
Pillar 4Economic
Globalization
Pillar 5 Survey on Innovation and Business Strategy
Presenter
Presentation Notes
The modernization of Statistics Canada, which aims to reinforce its continued independence, innovativeness and responsiveness, rests on five pillars developed by the DG WG on Modernization and Presented to EMB in June. These pillars are designed to ensure Statistics Canada will: -pursue a more user-centric service delivery, focusing resources on what clients want and need today; -work to build statistical capacity and foster data literacy among Canadians to effectively and critically use statistical data -collaborate and engage with partners, share expertise, processes, and increase access to data; -build and use leading edge methods to expand the use of administrative data; and -ensure staff are empowered in a modern and flexible workplace.

Trade in Services
TIC/TEC
Multinationals/FDI/Globalization
Access
Services TEC
Timely Monthly Trade in Services
Full MNE portrait Greenfield
Investment by Ultimate Parent
Power BI data visualization
Well-being accounts
Hubs accessible from external sites
Country Fact Sheets
Security by Security Hub
GDP
Services by Mode of Supply
Revision back to 2008Trade with
China by province
Trade by CMA
ICT sector
MerchantingFGPs,
VideosTrade Explorer
….
Digital Trade
….
Related party trade
2019 2024
Detailed Trade
SPEs
Link with Multinationals, other programs
Capital Investment
Increased use of tax data administrative data

777
Centralized Business Register (CBR)- Business number
- Legal entity - Enterprise
- Establishment- Number of employee
- Industry- Province
Inward Foreign Affiliates Statistics
Trade By Exporter Characteristics (TEC):
Goods
Trade by Importer Characteristics (TIC):
Goods
Introduction – TIC and TEC
- domestics vs. foreign- importer vs. exporter- trader vs. non-trader
The population of importers is almost 4 times larger than exporters

888
Sample findings…
Sources:1. Trade by exporter and importer characteristics: Goods, 2018 Daily release, May 14, 2019, Statistics Canada

999
Sample findings
Sources:1. Study: Trade in goods by exporter and importer characteristics, by census metropolitan area, Dec. 9, 2019, Statistics Canada

101010
Finding exporters and importers by clicking a map
Source: https://www150.statcan.gc.ca/n1/pub/71-607-x/71-607-x2019009-eng.htm

Delivering insight through data for a better Canada
- 5
10 15 20 25 30
2016 2017 2018
Billi
ons
Canadian goods exports to ChinaCustoms basis vs. Consignee basis (value in billions)
Customs based export value Linked value by consignee province

Delivering insight through data for a better Canada

Delivering insight through data for a better Canada
Scope of AMNEbusiness number, legal entity, enterprise, establishment, industry, province, sector, count
Foreign Multinationals
in Canada
Canadian Multinationals
in Canada
R&D expenditures and personnel
ISTD
Trade by Importer Characteristics (TIC):
Goods IATD
Trade by Exporter Characteristics (TEC):
GoodsIATD
Gross domestic product (value added)
NEAD
Imports and exports of commercial services
IATD
Financial indicators (assets, revenues)
IOFDInternational
technological receipts and payments
IATD
Number of Jobs
NEAD & SEPH
2020-01-31 1
3
1. Exporters who are importers2. Exporters and importers that are Canadian- (CMNEs) or foreign-controlled (FMNEs)
3. By sector or by industry4. SMEs or large enterprises
Non-multinationals
in CanadaNumber of enterprises
BR

Delivering insight through data for a better Canada
FMNEs continuously outnumbered CMNEs throughout the 8-year period
14
0
2’000
4’000
6’000
8’000
10’000
12’000
14’000
16’000
18’000
2010 2011 2012 2013 2014 2015 2016 2017
Number of multinationals in Canada, 2010 to 2017
Foreign multinational enterprises Canadian multinational enterprises

Delivering insight through data for a better Canada
FMNEs accounted for a larger share of most corporate activities compared to CMNEs except for assets and GDP
15
18%
18%
23%
29%
34%
40%
52%
65%
74%
50%
16%
27%
23%
28%
32%
21%
18%
17%
32%
65%
50%
48%
37%
28%
26%
16%
9%
0% 10% 20% 30% 40% 50% 60% 70% 80% 90% 100%
Total assets
Total number of jobs
Gross domestic product at basic prices (value added)
Operating revenues
R&D personnel
In-house R&D expenditures
Imports and exports of commercial services
Imports and exports of merchandise
Imports and exports of technological services
Activities of multinational enterprises in Canada, as a share of the corporate sector, 2017
Foreign multinational enterprisesCanadian multinational enterprises
Note: % of value for all variables except R&D personnel and number of jobs.

Delivering insight through data for a better Canada
MNEs employed one-third of corporate workers
• In 2017, 34.5% of Canada’s 12.6 million
corporate workers worked at MNEs
Canadian MNEs: 16.3% Foreign MNEs: 18.2%
―American MNEs: 11.6%―Non-American foreign MNEs: 6.6%
Source: Statistics Canada, 36-10-0356-01
18.2%
16.3%65.5%
Percent of corporate sector jobs by type of corporation, 2017
Foreign MNEs Canadian MNEs Non-MNEs

Delivering insight through data for a better Canada
FMNEs generated a larger amount of GDP compared to CMNEs in ON, whereas CMNEs contributed more to GDP in QC, AB and BC
17
$0 $50 $100 $150 $200 $250
Prince Edward Island
Territories
New Brunswick
Nova Scotia
Manitoba
Saskatchewan
Newfoundland and Labrador
British Columbia
Alberta
Quebec
Ontario
value in billions
Value of GDP by type of enterprise, by province, 2017
Non-multinational enterprises Foreign multinational enterprises
Canadian multinational enterprises

Delivering insight through data for a better Canada
AMNE Interactive Tool
Source: https://www150.statcan.gc.ca/n1/pub/71-607-x/71-607-x2019026-eng.htm

1/1
IFC Conference on external statistics "Bridging measurement challenges and analytical needs of external statistics: evolution or revolution?", co-organised with the Bank of Portugal (BoP) and the European Central Bank (ECB)
17-18 February 2020, Lisbon, Portugal
Empowering external statistics – how to deal with blurred data sources?1
Ana Mitreska, Sultanija Bojcheva-Terzijan, Dejan Stankov and Boban Neshkovikj,
National Bank of the Republic of North Macedonia
1 This presentation was prepared for the meeting. The views expressed are those of the authors and do not necessarily reflect the views of the BIS, IFC, BoP, ECB or the central banks and other institutions represented at the meeting.

8
Empowering External Statistic - How to deal with blurred data sources? 1
Empowering External Statistic - How to deal with blurred data sources?
Ana Mitreska∗ Sultanija Bojcheva-Terzijan±
Dejan Stankov Boban Neshkovikj
Work in progress
The paper sheds light on the challenges faced by statistical compilers in economies where cash cross-border flows are present. We tackle country specific experience – the Macedonian case, where significant amount of remittances enters the country in cash. Furthermore, given the existence of informal economy in the exchange of good and services, underlying cash inflows and outflows are also present. These specifics of cross –border flows affect the compilation of the balance of payments statistics. The bulk of the cash net-inflows is exchanged for domestic currency, recorded in the secondary income of the non – government sector which creates around 16% of GDP in the current account balance. Given that the sources of cross - border cash inflows and outflows are heterogeneous, statistics compilers are challenged – first, in identifying the causes of cash inflows and outflows and provide for proper statistical classification and second, in identifying and setting stable sources for collection of statistics. The paper will elaborate on the main steps undertaken in this respect and the implications they have for the external statistics. It will stress the importance of blending statistical sources – surveys, micro and macro data – for providing efficient estimates of the underlying transactions.
Key words: External statistics, Cross – border flows, Informal channels, Survey data.
JEL classification: C83, F24, F62, O17
∗ Email: [email protected], [email protected] and [email protected]. National Bank of Republic of North Macedonia.
± Email: [email protected], corresponding author. National Bank of Republic of North Macedonia.
The views expressed in this paper are those of the authors and do not necessarily represent the views of the National Bank of Republic of North Macedonia (NBRNM).

2 Empowering External Statistic - How to deal with blurred data sources?
Contents
Empowering External Statistic - How to deal with blurred data sources? .................... 1
1. Introduction ...................................................................................................................... 3
2. Review of literature .......................................................................................................... 4
3. Stylised facts ..................................................................................................................... 6
4. The Design and results for the remittances survey ...................................................... 9
5. Simulation ....................................................................................................................... 12
6. Conclusion ....................................................................................................................... 15
References ........................................................................................................................... 16
Annex tables ........................................................................................................................ 18

8
Empowering External Statistic - How to deal with blurred data sources? 3
1. Introduction
The globalization process has been intensive in the last three decades, implying rising and diverse cross – border flows. The challenges for national compilers of external statistics for proper capturing the occurrence and the nature of the rising flows have been mounting as well. In the recent years, a massive process of digitalization came on board, creating hybrid types of financial instruments, and allowing for new types of assets based on cryptography, which can be easily traded across borders. This opens an entirely new field, where statisticians have to understand the nature, the purpose and the functions of the innovative instruments and provide for a proper statistical coverage and classification.
Apart from the new challenges posed by the globalization and digitalization, some “traditional” challenges are lingering, as well. One of them are the informal cross – border flows, which are difficult to be properly measured and captured. They require an extra efforts in devising the most suitable and stable data source, which will allow for continuity, consistency and comparability. In this paper we will shed some light on this matter, on a country specific case – the Macedonian case. Macedonian economy is featured with relatively strong presence of informal economy in the overall economic activities. This holds for some of the cross border activities as well, and can be noted by the large amount of foreign currency cash exchanged.
As the source of the cash inflows is difficult to be pinpointed, very often prior assumptions are made. Given the profile of our economy, the assumption reveals possibility that the main source is related to cash remittances, informal trade, and money flowing in and out of the “mattresses”. These assumptions point to the necessity to devise alternative data sources that cannot be based on the conventional sources, such as the payment transactions platforms or direct reporting. They rather require alternatives such as survey data, cross checking with micro data, and thus provide for estimates, and no precise statistical measurement.
The importance of these estimates does not have statistical relevance, only. For a small economy, with tight trade and financial integration with the rest of a world, the external statistics is the main tool for scrutinizing the sources of strengths and potential vulnerabilities. Hence, it is one of the pivotal platforms for the policymakers in the decision-making process, thus requiring a well ordered external statistics as possible.
The paper is organised as follows. The first part discusses the literature through the lenses of the approaches used for statistical estimation. The second one provides stylised facts. The third one gives an overview of a survey, its design and results, envisaged to be used as a source for estimating part of the cross –border flows through informal channels. In the fourth section, we simulate alternative statistical data on remittances, after applying the new source and estimates. The last sections concludes.

4 Empowering External Statistic - How to deal with blurred data sources?
2. Review of literature
Globalisation and international migration in the last decades has been intensifying enlisting remittances as one of the main financial flows in developing countries. The latest WB estimates for 2019 indicate that they are likely to reach $550 billion, thus outperforming FDI inflows and official development assistance (WB, 2019). Having in mind their importance, in terms of volume and spill - overs to the economy, the issue of their measurement has been put to the fore on the international organizations and national statistical authorities’ agenda. Besides the constant increase of remittances over time, still the general perception of the economists is that they are underestimated (Centre for Latin American monetary statistics) and that there is space for further improvement in the methods of statistical compilation. The reasons behind this thinking is the heterogeneous nature of these flows, with many transactions that have small value, channelled through formal and informal channels.
The compilation practices evolved with time, as a result of international initiatives, improved legal and institutional arrangements and continuous work on financial literacy of the individuals. However, there are still challenges that compilers of external statistics face. Having in mind the transaction channels could be formal, but informal as well, the main difficulty is to obtain accurate source data for remittances. This hindrance poses a need for statisticians to review current data sources, to assess potential sources and alternative methods for estimation, as well as to construct data strategy for a combined approach in collection of data for remittances. So where do we stand now in terms of methodologies used? Is the use of combined methods a common tool and way forward?
The typical way of capturing remittances for the BOP collection purposes is the ITRS system, which represents a formal channel containing resident-nonresident transactions routed through the banking system. The biggest advantage of this system is its simplicity, low cost and timeliness, as well as accuracy (especially for the ITRS without a threshold). It should be noted, that in most cases this system was designed and kept in countries with some kind of foreign exchange controls. However, the liberalization and reporting thresholds led to abandoning or a need to complement this data source with other methods and data sources. This is the case for many EU countries. The decision of the EU of reporting exception of cross border settlements below 50.0001 euros directly influenced the quality of this data source, as most of these transactions are small and cannot be captured. This, together with the disadvantages of ITRS that is recording only the formal channel, and in some cases, net amounts instead of gross flows, misclassification, as well as lack of information for the time of economic ownership transfer led to finding alternative ways of data collection models, at least in the EU. However this system is still core data source in the Western Balkan countries (North Macedonia, Montenegro, Serbia) and in some
1 Regulation (EU) 2019/518 of the European Parliament and of the Council of 19 March 2019 amending Regulation (EC) No 924/2009 as regards certain charges on cross-border payments in the Union and currency conversion charges.

8
Empowering External Statistic - How to deal with blurred data sources? 5
forms in other EU countries (integrated or for cross checking in Greece, Portugal and Estonia, as a starting point and base for estimation of remittances in Belgium and Sweden etc.).
One of the alternative solutions is direct reporting, in which case the information is collected directly from the Money Transfer Operators (MTOs) and not through the banks. In practice, this means obtaining data from reports declared by numerous operators, of large or small scale, depending on the country. Italy, is one of the examples where the main source for remittances is the data from Money Transfer Operators, while information from MTOs, combined with other sources, are also used in the Czech Republic, Romania and France. However, this data collection channel has disadvantages also. Direct reporting requires a lot of resources and in many cases, data compilers are not interested in individual transactions, but only in total. Often, an obstacle for distinguishing remittance from non-remittance are the “poor financial records” of the MTOs and the “netting” principle applied in the MTOs internal records instead recording the transactions on a gross basis, which is required for appropriate compilation.
The ITRS and direct reporting are capturing transactions through formal channels. However, in economies suffering from domination of informal cross-border flow transactions these collection methods are not optimal and are not effective. Maybe to a lesser extent, but this also holds for the more developed economies. Household surveys are viewed as a potential and valuable data source that can alleviate some of the constraints in data gathering. In many economies, “household surveys are most commonly used to estimate personal transfers” (International Monetary Fund, 2009). In some cases, central banks conduct specialised remittances survey, while more often they use existing surveys conducted by statistical offices2, in which variables for remittances are incorporated. The main advantage of the specialised household survey conducted by the Central Bank is the focus on households that receive remittances, getting important granular information and insights in the nature of the flows, which cannot be extracted from the formal channel information’s. There are many countries that apply this method, such as the case of Albania (conducts specialized Remittance Survey), Philippines (Rider to a Labour force Survey), also Ireland and Poland that conduct specific households survey for remittances. However, it is important to stress that household surveys do not measure current transactions in the financial system, but instead they register stories about amounts, frequency and channels of transaction in a given reference period. Survey data indicate the remittance behaviour instead of actual cash flows as credits or debits through the financial system and provide auxiliary information for indirect estimation of the inflows. Thus, the results are prone to underreporting and misclassifications. These features are quite important in designing an integrated system based on combined data sources.
2 Labour Force Survey, Survey of Income and Living Conditions, Household Budget Survey, Demographic Surveys etc.

6 Empowering External Statistic - How to deal with blurred data sources?
In some countries where data collection systems are weak, with insufficient quality, or it is too expensive to set up a system or conduct a survey, an econometric models for estimation of remittances are applied. This is called use of “indirect data sources”, or use of “secondary data” (IMF, 2009). In these cases, data compilers make estimations based on demographic models, econometric models, or residual modelling. The demographic models could be quite straightforward, deriving personal transfers as a product of remittances senders by an average amount sent, even though different modalities can be applied. Setting a model in which remittances are an explanatory variable dependant on the behaviour of other variables, such as, income, migration, transaction costs and etc. is the essence of the econometric modelling approach. And finally, residual estimation – approach by which remittances are estimated as a residual of all recorded flows that generate inflows and outflows, indicating that the eventual discrepancies are unobservable remittances (IMF, 2009). Different countries are using specific indirect data methods. In most of the European countries, estimation models based on available data sources are used. This approach is followed in Austria, Bosnia and Hercegovina, Belgium, Switzerland, Denmark, Estonia, Finland, Hungary, Latvia, Netherland, Norway and Poland. However, this method also has drawbacks. The models heavily depend on the data used and the assumptions made, which are difficult to be verified in practice. The residual method may overestimate remittances as it can include other items etc.
Scrutinizing all methods one can conclude that remittances are heterogeneous and no single data source can ensure adequate reporting of all transactions. This is why blending statistical sources and setting up an integrated system that is based on deep understanding of the system, data collection practices, alternative sources and prioritization of data is essential. Or as Reinke states, for significant improvement of the quality of the remittances data, innovative combination of the data sources is crucial (Reinke, J. 2006).
3. Stylised facts
The balance of payments position of the Macedonian economy has a very specific feature, related to a sizeable amount of foreign currency cash net - inflows. Under a prior assumption that the bulk of them relate to current transactions, they are recorded as part of the current account balance. The main data source are the banks that record all the transactions routed through the banking system. Through the ITRS they provide data on personal transfers and embed the information from the MTOs. They also provide data on the amount of foreign currency cash bought and sold with households (banks foreign exchange transactions) and the net amount bought from the exchange offices on a standalone basis. Given the difficulties in identifying the exact sources of the foreign currency cash inflows, most of the net – inflows are recorded as “other current transfers - foreign currency cash flows”.

8
Empowering External Statistic - How to deal with blurred data sources? 7
Structure of private secondary income, net in Euro million Chart 1
Source: NBRNM, BOP statistics.
The size of the net–inflows for the cash component only in a longer time span (2013 -2018) averaged close to 12% of GDP. At the same time the deficit in the trade of good and services averaged close to 19% of GDP, indicating that above 60% of it was covered with unidentified inflows in foreign currency. The scrutiny of the overall structure of the secondary income reveals rising share of the cash component. The average share in 2003-2009 period equalled around 67%, while afterwards it averaged close to 74%, with no major deviations from the mean along the years. Hence, the importance of this component relative to the others in the secondary income gained significant weight.
Cash component, share in GDP and in the secondary income, in % Chart 2
Source: NBRNM, BOP statistics.
0 200 400 600 800 1000 1200 1400 1600 1800
2003
2005
2007
2009
2011
2013
2015
2017
Structure of the secondary income account
Personal transfers Foreign currency cash inflows Other

8 Empowering External Statistic - How to deal with blurred data sources?
Observing the dynamics of the foreign currency cash net – inflows, it is visible that in general it was rising until 2012, while its share to GDP started to decline afterwards and stabilized in the last three years to slightly below 12% of GDP. Despite the notable trend, there are few turning points in the path of the foreign currency cash net – inflows, which could indicate one of the potential causes and sources of the foreign cash component. The first one is the occurrence of the global crisis at end 2008 and 2009, when amidst the uncertainty economic agents started to convert domestic into foreign currency cash, which translated into lower net – inflows. The second one of a same nature, but smaller impact was the Greek crisis in 2015 and internal political crisis in 2016. An event with an opposite effect that yielded in significant inflow of foreign currency was the Euro Zone crisis at end 2011, when the future of the Euro currency was questioned.
These turning points in the dynamics of the foreign currency cash component reveal the impact of the confidence effect on the dynamics of this BOP component. Given the anecdotal and survey evidence for foreign currency in circulation being present in the economy, these flows indicate that foreign currency coming in and out of the mattresses is probably one of the sources which adds to the overall cash inflows. As the history of macroeconomic instability was replaced with a longstanding stability of the prices, currency and stability of the banking system, the strong confidence and interest rate differentials enabled foreign currency to come into the system. These flows cannot be measured statistically, and capturing them in the external statistics poses challenges.
The first potential source of the foreign currency cash net –inflows in the BOP sheds light on the extraordinary complexity of the component. The two other important potential sources increase it and pose significant challenges for compilers of statistics. Namely, the second source relates to possible cash flows underpinning informal trade of goods and services, which cannot be captured in the official statistics. The presence of the informal economy in general, has been specific for the Macedonian economy as well. Wide range of estimates exist, including an official estimates from the National Statistics Office, used as a correction factor in the compilation of the national accounts. They range from 16% to 40%, indicating large potential of informal economy to generate flows that are not statistically captured.
The third source, which we will put emphasis on in the paper, refers to net – inflows based on remittances. Formal remittances, personal transfers sent from migrants to their home country are relatively modest. They gravitate around 2% of GDP, with a declining trend. Yet, besides the formal channel, presumable large amount of remittances come in cash, through informal channels. This last component is in fact not pertinent to the Macedonian case only. It is widely – recognized matter in the external statistics, because “remittances are diverse (e.g. cash and non-cash; channelled through formal and informal routes)... there is no single data source that can guarantee accurate estimates. Countries use a variety of data sources based on the patterns and the channels employed in their countries” (World Bank, 2009).
Shedding light on the three possible source of the net –inflows of foreign currency cash in the external statistics reveals their different nature, as well as the need for different approaches for their statistical coverage. The difference in their

8
Empowering External Statistic - How to deal with blurred data sources? 9
essence also indicate that different factors can drive their dynamics, they may point to different sources of vulnerabilities and strengths, and may indicate susceptibility of the economy to different types of shocks. Given the size and the importance of the inflows, identifying and allocating these inflows in the appropriate BOP position is of a crucial statistical, but policy relevance, as well.
Given the focus of the paper, which is providing for alternative approach to the identification of the informal remittances, we will focus on this matter mostly. In the statistical perimeter, many countries use reporting from commercial banks, which may not include informal flows or flows through money transfer operators. The existence of an effective and appropriate international transactions reporting system (ITRS), in some countries is combined with household surveys in order to capture informal transfers (47 per cent of all countries use this method, according to the World Bank survey of Central Banks). Our approach is similar to this one, as it combines ITRS (assuming that this channel fully captures formal remittances) and Survey data to estimate the amount of informal remittances.
4. The Design and results for the remittances survey
Estimation of personal transfers in cash received through informal channels has been a significant challenge for the NBRNM. Recognizing the need for quality improvement several surveys were conducted (in 2007, 2011 and 20163). Besides the main aim, to obtain additional information for estimation the informal inflows that are part of private transfers, the Survey provided answers on the channels through which the inflows come to the country, the geographical distribution, seasonality, purpose of the funds sent, its sustainability etc.
In this section we will focus on the Survey from 2016 and will present some of the main results that can be used to estimate the value of personal transfers received through informal channels i.e. in cash. The 2016 survey was conducted by an outsourcing independent agency on a sample of 1,500 households that receive remittances from abroad. Snowball technique was used to select the sample. The sample of households receiving personal transfers from abroad was selected from each of the eight regions of North Macedonia, based on their population and additional information:
• on households that receive private transfers from abroad from the household consumption survey;
• the turnover of fast money transfers operators (FMO) by regions;
• the turnover of exchange bureaus offices (FXO) by regions; and
3 It should be noted that the Surveys are not fully consistent in terms of coverage, sample, response rates, etc. and for these reasons biases can occur.

10 Empowering External Statistic - How to deal with blurred data sources?
• Marriages of residents abroad and children born abroad from the State Statistical Office.
As noted before, one of the main aims of the 2016 survey was to estimate the share of the personal transfers received through informal channels, taking into account that remittances (personal transfers and compensation of employees) received through formal channels are already covered by the ITRS. In order to determine the share of formal and informal channels in the total personal transfers, we use the answer provided on the question “How do you receive the money?”. From total survey respondents, 61% answered that they receive funds through informal channels. More specifically, 43.3% from the respondents answered that relatives bring them cash when they come home, 10.8% answered that a friend or other family member who lives abroad is bringing the money on behalf of the sender, 3.5% of the respondents answered that the money has been sent by bus, 2.3 of the receivers went abroad to receive the money, and 1% of the respondents receive the money by mail. Concerning formal channels, 30.5% of the survey respondents receive the money by MTOs and only 8.5% by the bank. The reason for these results (high share of remittances send “on-hand”, or through informal channel) probably rest in costs for sending the money, demographic characteristics of the population receiving the money and employment status of the receivers and the senders.
The survey results for the share of formal and informal channels were compared with the data received from ITRS (ITRS cover the data from FMOs) and verified that the responses provided were generally consistent. Furthermore, results from the 2016 survey are also consistent with the results from 2011 survey.
Survey results from 2016 Chart 3

8
Empowering External Statistic - How to deal with blurred data sources? 11
Source: NBRNM’s Survey

12 Empowering External Statistic - How to deal with blurred data sources?
Most of the households reported that they receive remittances once (33.1%) or twice (25.9%) a year. These responses are logical given the previous question where in the most cases relatives brings the money when they come in North Macedonia, usually once or twice a year. With respect to seasonality, larger amounts of remittances are received in July, August, and December, during the holidays when most migrants visit the country.
Analyzed for which purposes the funds received from abroad were spent, the largest part of the received funds, around 60%, is used for current spending, while 10% is spent for a family celebration. Part of the received funds, 12% of the households spent the money for the renovation of the current home, while only around 5%, are invested in real estates. Around 11% of the personal transfers are kept for savings.
Having in mind that most of the inflows are used for current spending it is not surprising that half of the households spend the money relatively quickly, i.e. in the first month after receiving. Around 30% of the households spend money over a period of 6 months after receiving. About 90% of the funds, the households spend in Macedonian denars which previously exchanged on the exchange market. A certain amount, around 7%, are kept in the currency as they are received.
The survey embeds evidence on the geographical origin of the funds, and their currency structure as well. These are also important information, which can be further utilized in the statistics in defining the geographical and currency profile of remittances.
5. Simulation
In this section we provide for a simple simulation4, where the results of the survey are used to identify the amount of remittances which come through informal channels. The estimated informal remittances should be reallocated from the net cash inflows (other transfers) to “personal transfers”. The simulations include assessment only on the credit side. The method we use is carried out in two steps. The first one is improving the data on remittances received through formal channel by using alternative source. Namely, the ITRS data included in the BOP are on a net basis (foreign currency bought minus foreign currency sold). As we need data on gross amounts to estimate the value of unrecorded credit and debit transactions we include data that are collected from direct reporting of the MTOs (for regulatory purposes) collected on a gross basis. We should mention that the two sources provide net values that are quite similar, however we treat this as a direct and more comprehensive source and we believe that its use will provide slight improvement in the overall current account balance. In the second step we apply shares derived from the previous surveys on remittances i.e. the percentage of remittances that is received
4 Simulations presented in this paper are only illustrations on the impact of adding additional sources and do not represent definitive calculations that will be included in official statistics.

8
Empowering External Statistic - How to deal with blurred data sources? 13
through formal channel. The weights, combined with expert judgment are applied to the amount of remittances received through formal channel (ITRS) to obtain the total amount of remittances received. The remittances received in cash (informal channel) will be derived as a residual (the rest to 100 percent).
We conduct two approaches for setting the weights. In the first approach, for estimation of the formal channels, different coefficients for different years were applied. As previously stated, the available data for formal remittances and assumption for the share of official channels in the total amount of remittances are the starting point for the estimation and serve as a base for residual calculation of the informal remittances.
Coefficient applied for formal channels
In percent of total remittances Table 1
Survey (year)
Period for which the appropriate surveys coefficient is applied
Coefficient applied for formal channels
(Scenario 1)
Coefficient applied for formal channels
(Scenario 2)
2002 2003-2007 27% 27%
2007 2008-2011 32% 27%
2011 2012-2016 37% 27%
2016 2017-2019 40% 27%
Sources: Dzaferi Survey (2002), NBRNM Surveys and expert judgment (2007, 2011, 2016)
The results of the survey indicate that the weights increase over time, i.e. the share of the remittances sent through official channels increases over time from 27% in 2004 to 40% in 2018. Second, these estimations show significant undervaluation of the amounts recorded under personal transfers, or remittances that should be reported in BOP statistics including the inflows through the informal channel. The difference between published and estimated value of personal transfers is significant and in nominal terms is in an interval from Euro 383 million in 2004 to Euro 570 million in 2018. In relative terms (as percent of GDP) the personal transfers on average in the analysed period should be higher by 7 p.p..

14 Empowering External Statistic - How to deal with blurred data sources?
Personal transfers, credit estimates using varying coefficients Chart 4
Source: NBRNM, BOP statistics.
In the second approach, a coefficient of 27% for all of the years was applied. By using constant share we assume that the weight of the formal channel in the total amount of remittances has not changed through the years, which is probably less realistic scenario. By this approach we assume higher level of the cash remittances – in nominal terms they reach Euro 1,010 million in 2018. As percent of GDP, the estimated personal transfers are on average around 11% in the analysed period.
Personal transfers, credit estimates using constant coefficient Chart 5
Source: NBRNM, BOP statistics.
The simulation presented above, reveals quite different role and importance of the remittances in the economy, in comparison to what the official data suggest. It illustrates the importance of having an estimate of the origin of cross – border flows,

8
Empowering External Statistic - How to deal with blurred data sources? 15
for proper diagnostics and policy calibration. Yet, even after the estimates of the informal remittances, there is a necessity to address the rest of the cash net – inflows that could be attributed to capital account, the informal trade or the confidence effect. Hence, besides the estimation of personal transfers, other challenges arise in the period ahead. Capital transfers received in cash are still not estimated. The survey results showed that around 10% of the received remittances are invested in real estate. The appropriate amount should be deducted from other current transfers and reclassified to the capital account of the nongovernment sector. With respect to the current account, the survey results could be used for estimation of the unrecorded salaries received from non-residents thus improving the data on compensation of employees, even though this is not a significant component of the Balance of payments. Furthermore, part of the inflows and outflows arise from the tourism activities, which is in line with the tourism statistics. This flows will affect the credit and debit side of the travel services. The high turnover on the foreign exchange market could imply an underestimation of the export of goods and services. Some countries already make adjustments to include any goods where there is a change of ownership not recorded in customs data such as shuttle trade. Appropriate method to estimate the values of unrecorded goods and services based on the incorporation of additional data sources and assumptions is a challenge as well.
6. Conclusion
The aim of the paper was to illustrate the importance of the foreign currency cash flows underlying cross – border activities in the Macedonian economy and the need for proper identification of their origin. This implies a need for devising alternative data sources in the external statistics for proper capturing and allocation of these flows within the balance of payments statistics.
In the paper we have opted for depicting one of the steps, which is using survey data to estimate the amount of remittances coming into the economy through informal channels. The simulation, using combined survey and ITRS data, reveals much larger amount compared to the data in the official statistics. It demonstrates the need for combining different data sources and employing estimates, when the flows are connected with informal activities, or informal channels.
In the forthcoming period, efforts are needed to validate the results, and to proceed with estimates on the flows related to informal trade and the confidence effect in the economy. It will require cross – checking of different sources, and estimations methods as well. The whole process will allow for a more precise coverage in the statistics, but also a clearer picture on the sources of the flows in the balance of payments and their sustainability.

16 Empowering External Statistic - How to deal with blurred data sources?
References
Bank for International Settlements and The World Bank (2007):“General principles for international remittance services”, January. Bank of Albania (2006):“Remittances: Albanian experience”, Luxembourg, June. Bull-Berg, H and T Halvorsen (2006):“Compiling compensation of employees’ data in the Norwegian BOP – Use of administrative data”. Centre for Latin American Monetary Studies (2006):“Draft Manual on Best Practices for the Compilation of International Remittances”, Mexico City. Coates, K (2006):“Measurement problems in household international remittances”. Dzaferi, S (2004): “Финансискиот потенцијал на иселениците и неговото вклучување во економијата на Република Македонија”, Skopje, March. Eurostat, Balance of Payment Working Group (2010):“Compiling data on personal transfers: the new experimental method of the Netherlands”, Luxembourg, April. Eurostat, Balance of Payment Working Group (2010): “Data and metadata on remittances: progress report”, Luxembourg, April. Eurostat, Balance of Payment Working Group (2010):“Eurostat’s survey on the methods used for compiling remittances and compensation of employees: detailed results”, Luxembourg, April. International Fund for Agricultural Development (2015):“Sending money home: European flows and markets”, June. International Fund for Agricultural Development, The World Bank and European Commission (2016):“Official report, Global Forum on Remittances and Development 2015”, Milan, June. International Monetary Fund, Dissemination Standards Bulletin Board, Countries Metadata, www.dsbb.imf.org International Monetary Fund, Eurostat, Organisation for economic Co-operation and Development and World Bank (2009): “International transactions in remittances, guide for compilers and users”. International Monetary Fund, Statistics Department (2017):“Technical Assistance Report on External Sector Statistics Mission”-Internal Document, June. National bank of Poland (2008):“New estimation method of labour income from abroad in the balance of payment statistics”.

8
Empowering External Statistic - How to deal with blurred data sources? 17
Ortolani, G G, and U I dea Cambi (2007):”Measuring remittances: The experience of Italy”, Luxembourg, March. Reinke, J, and N Patterson (2006):“Remittances in the Balance of Payments Framework: Current Problems and Forthcoming Improvements”, Luxembourg, June. Rucaj, E, (2009):“Remittances data quality: A review of progress”, Washington DC, June. United Nations, Economic commission for Europe (2009): “Estimates of remittances in the Czech Republic”, Geneva, May. Walter, J (2006): “Workers’ remittances, current private transfers and compensation of employees in the German Balance of Payments Statistics”, Mainz, June. World Bank Group and The Global Knowledge Partnership on Migration and Development (2019): “Migration and remittances, Recent Developments and Outlook”, April.

18 Empowering External Statistic - How to deal with blurred data sources?
Annex tables
Secondary income - estimates using varying coefficients Table 2
as a % of GDP, estimated data
BPM6 Concept 2004 2005 2006 2007 2008 2009 2010 2011 2012 2013 2014 2015 2016 2017 2018
Secondary income 14.0 16.6 17.8 16.3 14.3 17.1 19.3 20.3 22.0 19.4 19.0 18.0 16.9 17.5 17.5 Credit 15.0 17.5 18.7 17.7 15.2 17.9 20.2 21.2 23.0 20.4 20.1 19.0 18.0 18.8 18.8 Debit 1.0 0.9 0.9 1.3 0.9 0.9 0.9 0.8 0.9 0.9 1.0 1.0 1.0 1.3 1.3 1. General government 1.2 1.1 1.1 0.4 0.7 0.5 0.4 1.0 0.8 0.9 1.3 0.6 0.9 1.1 1.0 Credit 1.3 1.2 1.2 1.0 0.9 0.6 0.5 1.1 0.9 1.0 1.4 0.8 1.1 1.4 1.3 Debit 0.1 0.2 0.1 0.6 0.2 0.1 0.1 0.1 0.1 0.1 0.1 0.2 0.2 0.3 0.2 2. Financial corporations, nonfinancial corporations, households, and NPISHs 12.8 15.6 16.7 15.9 13.6 16.5 18.9 19.3 21.2 18.5 17.8 17.4 16.0 16.4 16.5
Credit 13.7 16.3 17.5 16.7 14.3 17.3 19.7 20.1 22.1 19.3 18.6 18.2 16.9 17.4 17.5 Debit 0.9 0.7 0.7 0.7 0.7 0.8 0.8 0.8 0.8 0.8 0.9 0.8 0.9 1.0 1.0 2.1. Personal transfers 10.9 10.5 11.1 11.1 9.6 10.0 10.2 9.6 8.6 7.9 8.1 8.0 7.2 7.1 7.0 2.1. Personal transfers - published 2.6 2.5 2.6 2.6 2.4 2.5 2.6 2.4 2.4 2.2 2.2 2.1 1.8 1.7 1.7 Credit 11.2 10.7 11.3 11.3 9.9 10.3 10.4 9.8 8.8 8.1 8.3 8.2 7.3 7.3 7.2 Credit - published 2.8 2.7 2.9 2.9 2.7 2.8 2.8 2.6 2.6 2.3 2.4 2.3 2.0 1.9 1.9 Debit 0.3 0.2 0.2 0.3 0.3 0.2 0.2 0.2 0.2 0.2 0.2 0.2 0.2 0.2 0.1 Of which: Workers' remittances 10.9 10.5 11.1 11.1 9.6 10.0 10.2 9.6 8.6 7.9 8.1 8.0 7.2 7.1 7.0 Credit 11.2 10.7 11.3 11.3 9.9 10.3 10.4 9.8 8.8 8.1 8.3 8.2 7.3 7.3 7.2 Debit 0.3 0.2 0.2 0.3 0.3 0.2 0.2 0.2 0.2 0.2 0.2 0.2 0.2 0.2 0.1 2.2. Other current transfers 1.9 5.1 5.6 4.9 4.0 6.5 8.7 9.7 12.6 10.6 9.6 9.4 8.8 9.2 9.4 2.2. Other current transfers - published 9.8 13.3 14.1 13.5 11.3 13.6 16.1 16.3 18.2 15.9 15.1 14.7 13.6 14.1 14.2 Credit 2.5 5.6 6.1 5.3 4.4 7.1 9.3 10.2 13.3 11.3 10.4 10.0 9.6 10.1 10.3 Credit - published 10.4 13.8 14.6 13.9 11.7 14.2 16.7 16.9 18.8 16.5 15.8 15.4 14.3 14.9 15.1 Of which: Cash exchange, net -0.4 2.7 3.5 2.8 2.0 4.1 6.4 7.3 10.1 8.3 7.4 6.7 6.2 6.9 7.2 Of which: Cash exchange, net - published 7.6 10.9 11.9 11.4 9.3 11.2 13.8 14.0 15.7 13.6 12.8 12.1 11.0 11.8 11.9 Debit 0.6 0.5 0.5 0.5 0.4 0.6 0.6 0.6 0.6 0.6 0.7 0.7 0.7 0.8 0.9 Sources: NBRNM

8
Empowering External Statistic - How to deal with blurred data sources? 19
Secondary income - estimates using constant coefficient Table 3
as a % of GDP, estimated data
BPM6 Concept 2004 2005 2006 2007 2008 2009 2010 2011 2012 2013 2014 2015 2016 2017 2018
Secondary income 14.0 16.6 17.8 16.3 14.3 17.1 19.3 20.3 22.0 19.4 19.0 18.0 16.9 17.5 17.5 Credit 15.0 17.5 18.7 17.7 15.2 17.9 20.2 21.2 23.0 20.4 20.1 19.0 18.0 18.8 18.8 Debit 1.0 0.9 0.9 1.3 0.9 0.9 0.9 0.8 0.9 0.9 1.0 1.0 1.0 1.3 1.3 1. General government 1.2 1.1 1.1 0.4 0.7 0.5 0.4 1.0 0.8 0.9 1.3 0.6 0.9 1.1 1.0 Credit 1.3 1.2 1.2 1.0 0.9 0.6 0.5 1.1 0.9 1.0 1.4 0.8 1.1 1.4 1.3 Debit 0.1 0.2 0.1 0.6 0.2 0.1 0.1 0.1 0.1 0.1 0.1 0.2 0.2 0.3 0.2 2. Financial corporations, nonfinancial corporations, households, and NPISHs 12.8 15.6 16.7 15.9 13.6 16.5 18.9 19.3 21.2 18.5 17.8 17.4 16.0 16.4 16.5
Credit 13.7 16.3 17.5 16.7 14.3 17.3 19.7 20.1 22.1 19.3 18.6 18.2 16.9 17.4 17.5 Debit 0.9 0.7 0.7 0.7 0.7 0.8 0.8 0.8 0.8 0.8 0.9 0.8 0.9 1.0 1.0 2.1. Personal transfers 10.9 10.5 11.1 11.1 11.3 11.8 12.0 11.4 11.7 10.7 11.0 10.8 9.7 9.4 9.3 2.1. Personal transfers - published 2.6 2.5 2.6 2.6 2.4 2.5 2.6 2.4 2.4 2.2 2.2 2.1 1.8 1.7 1.7 Credit 11.2 10.7 11.3 11.3 11.6 12.1 12.2 11.6 11.9 10.9 11.1 11.0 9.9 9.6 9.4 Credit - published 2.8 2.7 2.9 2.9 2.7 2.8 2.8 2.6 2.6 2.3 2.4 2.3 2.0 1.9 1.9 Debit 0.3 0.2 0.2 0.3 0.3 0.2 0.2 0.2 0.2 0.2 0.2 0.2 0.2 0.2 0.1 Of which: Workers' remittances 10.9 10.5 11.1 11.1 11.3 11.8 12.0 11.4 11.7 10.7 11.0 10.8 9.7 9.4 9.3 Credit 11.2 10.7 11.3 11.3 11.6 12.1 12.2 11.6 11.9 10.9 11.1 11.0 9.9 9.6 9.4 Debit 0.3 0.2 0.2 0.3 0.3 0.2 0.2 0.2 0.2 0.2 0.2 0.2 0.2 0.2 0.1 2.2. Other current transfers 1.9 5.1 5.6 4.9 2.3 4.7 6.8 7.9 9.5 7.8 6.8 6.5 6.3 6.9 7.2 2.2. Other current transfers - published 9.8 13.3 14.1 13.5 11.3 13.6 16.1 16.3 18.2 15.9 15.1 14.7 13.6 14.1 14.2 Credit 2.5 5.6 6.1 5.3 2.7 5.3 7.5 8.5 10.2 8.4 7.5 7.2 7.0 7.8 8.1 Credit - published 10.4 13.8 14.6 13.9 11.7 14.2 16.7 16.9 18.8 16.5 15.8 15.4 14.3 14.9 15.1 Of which: Cash exchange, net -0.4 2.7 3.5 2.8 0.3 2.3 4.5 5.6 7.0 5.5 4.5 3.9 3.7 4.6 4.9 Of which: Cash exchange, net - published 7.6 10.9 11.9 11.4 9.3 11.2 13.8 14.0 15.7 13.6 12.8 12.1 11.0 11.8 11.9 Debit 0.6 0.5 0.5 0.5 0.4 0.6 0.6 0.6 0.6 0.6 0.7 0.7 0.7 0.8 0.9 Sources: NBRNM

Empowering External Statistic - How to deal with blurred data sources?
Ana Mitreska, Sultanija Bojcheva-Terzijan, Dejan Stankov, Boban Neshkovikj
Work in progress
National Bank of the Republic of North MacedoniaIFC Conference on external statistics
Lisbon, PortugalFebruary 2020

Outline
• Introduction• Stylized facts • Survey results• Simulations• Conclusion

Introduction
Aim: Dealing with “traditional challenges” posed by cross-border flows, aside the ones driven by globalization and digitalizationFocus: Country specific experience – the Macedonian case, an effort to capture the effect of informal remittances, using combined method of data compiling, survey results and expert judgment.Simulations: work in progress, illustrate the impact in the compilation of private transfers in the BOPPolicymaking: well ordered external statistics is pivotal for a small economy, with tight trade and financial integration with the rest of a world - crucial tool for scrutinizing the sources of strengths and vulnerabilities

Stylized facts (1)• Sizeable amount of foreign currency
cash net – inflows, as part of the current account balance
• Main data source are banks - all transactions routed through the banking system are recorded
• Through the ITRS banks provide data on personal transfers and embed information from the MTOs.
• Data on fx cash with the households and exchange offices net-inflows are to a large extent recorded as “other current transfers - foreign currency cash flows”
0 200 400 600 800 1000 1200 1400 1600 18002003
2005
2007
2009
2011
2013
2015
2017
Structure of the secondary income account
Personal transfers Foreign currency cash inflows Other
• FX cash flow data capture part of the informal remittances monetised in the economy, impact of confidence effect (fxcurrency “under the mattresses”) and presence of informal economy

Stylized facts (2)• FX cash flows predominant component of the secondary income, on average 12% of GDP
for the 2013-2018 period • Personal transfers on average 2% of GDP for the same period• Given the size and the importance of the inflows, the identification and allocation of
these inflows in the appropriate BOP position is of a crucial statistical, as well policy relevance
• Аlternative approach is used to identify the scope of informal remittances by combining ITRS compilation system with results from the household surveys

2016 Remittances Survey
The 2016 survey: conducted by an outsourcing independent agency on a sample of 1,500 households that receive remittances from abroad• The sample selected from eight regions of North Macedonia, based on their
population and cross data from the household consumption survey, turnover of money transfers operators (MTO) by regions, the turnover of exchange bureaus offices (FXO) by regions etc.
• Survey provides answers on the channels through which the inflows come to the country, the geographical distribution, seasonality, purpose of the funds sent, its sustainability etc.
• Main results used to estimate the value of personal transfers received through informal channels i.e. in cash

Survey Results• Main question “How do you receive the money?”• 61% of the respondents receive funds through informal channels, mainly relatives bring
cash when they come home• Concerning formal channels, 30.5% of the survey respondents receive the money by
MTOs and only 8.5% by the bank• Reasons for high share of remittances send “on-hand” rest in costs for sending the
money, demographic characteristics of the population receiving the money and employment status of the receivers and the senders

Survey Results• Most of the households reported that
they receive remittances once (33.1%) or twice (25.9%) a year
• Largest part of the received funds, around 60%, is used for current spending, while 10% is spent for a family celebration -much less for investment purposes
• Households spend the money relatively quickly, i.e. in the first month after receiving. Around 30% of the households spend money over a period of 6 months after receiving.
• About 90% of the funds, the households spend in Macedonian denars. A certain amount, around 7%, are kept in the currency as they are received.

Simulation
• Estimated informal remittances should be reallocated from the net cash inflows (other transfers) to “personal transfers”. The simulations include assessment only on the credit side.
• The method is carried out in two steps:• The first step: to improve data on remittances received through formal channel
by using alternative source - including data collected from direct reporting of the MTOs (for regulatory purposes) collected on a gross basis.
• Second step: weights derived from the surveys on remittances i.e. the percentage of remittances that is received through formal channel are used. They are applied to the amount of remittances received through formal channel (ITRS) to obtain the total amount of remittances received. The remittances received in cash (informal channel) are residual (the rest to 100 percent).
• Two alternatives: varying and constant weights over time

Simulation• Coefficients applied for formal channels• Weights increase over time, i.e. the share of the remittances sent
through official channels increases over time from 27% in 2004 to 40% in 2018
• Undervaluation of the amounts recorded under personal transfers that should be reported in BOP statistics including the inflows through the informal channel
Coefficient applied for formal channels In percent of total remittances Table 1
Survey (year)
Period for which the appropriate surveys coefficient is applied
Coefficient applied for formal channels
(Scenario 1)
Coefficient applied for formal channels
(Scenario 2)
2002 2003-2007 27% 27% 2007 2008-2011 32% 27% 2011 2012-2016 37% 27% 2016 2017-2019 40% 27%
Sources: Dzaferi Survey (2002), NBRNM Surveys and expert judgment (2007, 2011, 2016)

Simulation• Difference between published and estimated value of personal transfers - in
nominal terms in interval from Euro 383 million in 2004 to Euro 570 million in 2018, or by 7 p.p. higher as percent of GDP, in relative terms
• Scenario 1
• Scenario 2

Further steps• Work in progress• Necessity to address the rest of the cash net – inflows that could be attributed
to capital account, the informal trade or the confidence effect. • Capital transfers received in cash still not estimated. The survey results show
that around 10% of the received remittances are invested in real estate. • Survey results could be used for estimation of the unrecorded salaries received
from non-residents thus improving the data on compensation of employees (not a significant component of the BOP).
• Part of the inflows and outflows arise from tourism activities that affect the credit and debit side of the travel services.
• High turnover on the foreign exchange market could imply an underestimation of the export of goods and services. Appropriate method to estimate the values of unrecorded goods and services (grey economy effect) based on the incorporation of additional data sources and assumptions is challenge as well.

Conclusion
• Importance of the foreign currency cash flows underlying cross – border activities in the Macedonian economy and need for proper identification of their origin
• Best illustrated by using Survey data to estimate the amount of remittances coming into the economy through informal channels
• Clear need for combining different data sources and employing estimates in official statistics, especially when the flows are connected with informal activities, or informal channels.
• Further efforts needed to validate the results, and to proceed with estimates on the flows related to informal trade and the confidence effect in the economy.
• However, the whole process will allow for a more precise coverage in the statistics, as well as a clearer picture on the sources of the flows in the balance of payments and their sustainability.

Thank you for your attention

1/1
IFC Conference on external statistics "Bridging measurement challenges and analytical needs of external statistics: evolution or revolution?", co-organised with the Bank of Portugal (BoP) and the European Central Bank (ECB)
17-18 February 2020, Lisbon, Portugal
The advantages of data sharing: the use of mirror data and administrative data to improve the estimation of household assets/liabilities1
Daniel Sánchez,
Bank of Spain
1 This presentation was prepared for the meeting. The views expressed are those of the author and do not necessarily reflect the views of the BIS, IFC, BoP, ECB or the central
banks and other institutions represented at the meeting.

The advantages of data-sharing 1
The advantages of data-sharing: the use of mirror
data and administrative data to improve the
estimation of household assets/liabilities1
Sánchez, Daniel
Abstract
Compiling the financial assets/liabilities of households in the balance of payments
(b.o.p.) / international investment position (i.i.p.) is commonly considered as one of
the most challenging issues faced by statisticians. This is in light of the multiple
limitations of this institutional sector when a direct collection system is designed in
terms of complexity, coverage or accuracy. Therefore, it is necessary to find other
alternatives or complementary information to enhance the estimation of these data
with the aim of making them as real as possible. This is when data-sharing among
institutions and countries can play an important role.
This paper presents the Spanish experience working towards an improvement in
the regular production of official external statistics regarding transactions and
positions of households, not subject to the sources of information collected in first
instance by the compiler but using all available sources of information and taking
advantage of its complementarity. The paper will present the usefulness of mirror
data sources and administrative data going through different financial instruments
held/taken abroad by this sector: deposits, loans, life insurance technical reserves,
securities and real estate.
Keywords: mirror data, household assets/liabilities, data sources, international
banking, data-sharing, financial account, international investment position.
JEL classification: C820, C800, F42, F300, G500
1 The views expressed in this article are those of the author and not necessarily those of Banco de España.

2 The advantages of data-sharing
1. Introduction
One of the main data sources used by balance of payments (b.o.p.) and international
investment position (i.i.p.) compilers is the direct reporting system. This is
predominantly considered as a data source with a very high quality due to the report
being specifically designed for statistical purposes and to the fact that the reporting
is by the entity carrying out the transaction or holding the position, which means that
it should have full knowledge of all relevant details. This data-collecting system is
feasible, first, if the authority in charge of compiling external statistics is able to collect
the data needs through a specific legislative regulation which obliges reporters to
provide them; and further, if most of the entities involved in the cross-border
transaction are able to provide timely and reliable information on the required data.
Moreover, the balance of payments and international investment position
compilation guide also recommends replacing an international transactions reporting
system (ITRS) by a survey-based collection system since cross-border transactions
have become increasingly complex.
Concerning the Spanish direct reporting system for the compilation of non-bank
financial and non-financial sectors, the Banco de España, under a legislative
regulation2, issued in 2012 a Circular3 that establishes the requirements to report.
Under this Circular, any private individuals and legal entities resident in Spain who
have financial assets and liabilities held abroad must report the data to the national
bank. The threshold above which they are obliged to report is set in this way: if
transactions reach €1 million in the previous year or total assets and liabilities are
above this amount.
Nevertheless, the data coverage of financial balance sheets of the household
sector through this type of collecting system have shortcomings, as this sector is
logically more affected by a reporting threshold and missing responses.
Consequently, statisticians face the difficult challenge of compiling this sector
through other complementary data sources instead of the unique use of the direct
reporting method.
Various lines of work that can be found in the literature have been developed by
analysts, which try to estimate the importance of “missing wealth” in official statistics.
Taking into account the main characteristics of official statistics (high quality
assurance and high requirements on frequency and timeliness), these research-type
studies present the problems derived from, first, the heroic assumptions that
incorporate both in the estimation of the total “missing wealth” and in its allocation
by all countries in the world and, second, the insuperable difficulties to produce them
with the frequency and timeliness of official statistics.
The alternative is to work towards an improvement in the regular production of
official statistics not subject to the sources of information collected in first instance
by the compiler but using all available sources of information and taking advantage
of its complementarity. This paper presents the Spanish experience working in this
direction. It will highlight the usefulness of mirror data sources and administrative
2 Real Decreto 1816/1991, de 20 de diciembre. Transacciones Económicas con el Exterior (BOE de 27).
3 Circular 4/2012, de 25 de abril, del Banco de España, sobre normas para la comunicación por los
residentes en España de las transacciones económicas y los saldos de activos y pasivos financieros
con el exterior.

The advantages of data-sharing 3
data and the importance of data-sharing among institutions to make this alternative
possible. The final objective is to improve the estimation of external households’
assets and liabilities in the different financial instruments held abroad by this sector:
deposits, loans, securities, life insurance technical reserves and real estate.
The document is organised as follows. Section 2 describes data sources and
methods used for the compilation of the household sector in the Spanish external
statistics. This section is broken down by financial instrument focusing on loans and
deposits (2.1), insurance technical reserves (2.2), securities (2.3) and real estate (2.4).
And finally section 3 draws some conclusions.
2. Sources and methods used for the compilation of cross-
border assets and liabilities by Spanish households in
b.o.p./ i.i.p.
2.1 Loans and deposits
The direct reporting system to the Banco de España provides data on cross-border
flows and stocks for household sector, among others, and for all kinds of instruments,
including loans and deposits. Nonetheless, it is logically subject to a threshold (€1
million), and owing to the nature of this sector, the system does not cover all
operations. Therefore, it has been necessary to find other data sources which best
address these coverage limitations. As a result, the estimation of the cross-border
loans and deposits held by Spanish households is based on a combination of sources,
the most significant being the two provided by the European Central Bank (ECB) and
the Bank for International Settlements (BIS). Both sources are used as mirror data
deriving assets deposits of households from the liability side of banks abroad, and
liability loans of households from the asset side of banks abroad.
Balance Sheet Items Statistics (BSI)
Monetary Financial Institutions (MFIs) in the euro area are legally obliged to report
data from their business and accounting systems to the national central bank of the
Member State where they reside. These in turn report national aggregates to the ECB,
which is in charge of preparing BSI statistics of the MFI sector in the euro area.4
For this purpose, the ECB defines MFIs as central banks and other MFIs, which
comprise credit institutions, deposit-taking corporations other than credit
institutions, and money market funds (see Figure 1).
Information is based on a census rather than a sample, although National Central
Banks (NCBs) may grant derogations to small MFIs, provided that their combined
contribution to the national MFI balance sheet in terms of stocks does not exceed
5%.
4 The framework for the collection of BSI statistics is laid down in Regulation (EU) No 1071/2013 of the
European Central Bank concerning the balance sheet of the monetary financial institutions sector
(ECB/2013/33). Complemented by Guideline ECB/2014/15.

4 The advantages of data-sharing
BSI data are broken down by type of instruments, country and sector
counterparty, being in line with European System of Accounts (ESA) 2010 and the
sixth edition of the Balance of Payments and International Investment Position
Manual (BPM6). They are collected on a monthly and quarterly basis. Monthly data
are reported to the ECB by close of business on the 15th working day following the
end of the month to which the data relate, and quarterly data by close of business on
the 28th working day following the end of the quarter to which the data relate.
As a result, each Member State provides data to the ECB about deposits liabilities
and loans assets of deposit-taking corporations held by the Spanish household
sector.5
Hierarchy of classification of MFIs Figure 1
Source: Manual on MFI balance sheet statistics
The fact that the ECB provides NCBs with full access to BSI statistics, enables this
database to be treated as mirror data and deposits placed by the Spanish household
sector on the asset side to be derived using the deposits reported on the liability side
of banks in respective countries, and loans received by the Spanish household sector
on the liability side to be likewise derived using the loans reported on the asset side
of banks abroad.
Apart from euro area BSI data, a more limited dataset is available for non-euro
area EU Member States.6 This information only allows counterpart positions with
banks (or MFIs) and non-banks (or non-MFIs) to be distinguished. Hence, non-banks
positions vis-à-vis Spain can be also used as mirror data, although it is necessary to
estimate a subsector breakdown to allocate the amounts regarding the Spanish
household sector.
The valuation of loans and deposits in BSI statistics is slightly different to ESA
2010 and BPM6 requirements. While in ESA 2010 (5.242) and BPM6 (3.88) loans and
deposits refer to the nominal outstanding amount composed of the principal amount
including any accrued interest, in BSI data loans and deposits are reported at the
nominal outstanding amount, but the accrued interest has to be provided under a
5 For the purposes of reporting to the ECB, households are grouped together with non-profit institutions
serving households (NPISHs).
6 Non-euro area EU countries have the obligation to design and implement at national level all the
measures they consider appropriate to collect the statistical information needed to fulfil the ECB’s
statistical reporting requirements.

The advantages of data-sharing 5
different item, named “accrued interest on loans” (a sub-item of the category
“remaining assets”) in the case of loans, and “accrued interest on deposits” (a sub-
item of “remaining liabilities”) in the case of deposits.7 However, these last items are
specified at an aggregate level in terms of counterparty sector and total residency
area, so the Spanish share is not directly available.8
The BIS locational banking statistics (LBS)
The BIS compiles the locational banking statistics (LBS), which provide information
about the international business of banks broken down by instrument, sector and
currency by each individual counterpart country (whom-to-whom basis). Banks
submit data9 to an official authority in their country (usually the NCB), which is
responsible for aggregating and submitting the data to the BIS.
National reporting to BIS is voluntary and the number of LBS reporting countries
has been increasing over the years, reaching 47 reporters as from 2016 (16 EU
countries of which 13 are euro area members).10
LBS data refer to amounts outstanding on the last day of each quarter (giving
also transactions and reclassifications) and cover information on cross-border assets
and liabilities, categorised into four financial instruments: loans and deposits, debt
securities, derivatives and other instruments. In terms of timeliness, data are
published after 112 days.
Reporting authorities are required to allocate banks’ financial assets and
liabilities accounts by sector of their counterparty. The LBS definitions of counterparty
sectors are consistent with the institutional sectors defined in BPM6. Historically,
banks’ positions had to be split into banks and non-banks counterparties. Then, the
split of non-banks into non-bank financial and non-financials was required and first
published in 2015 (Figure 2, green boxes). Apart from that, a separate reporting of
positions with non-financial subsectors (government, non-financial corporations and
households11) is now encouraged but not required (Figure 2, orange boxes), and thus
not all reporting countries provide this complete subsector split. For each level of
detail, there is also an “unallocated” sector for those countries that do not provide
the disaggregated information.
The access to every detail provided by reporters is restricted for the internal use
of reporting authorities and eligible receivers.12 In the case of Spain, as one of the
countries whose authority (Banco de España) reports the international business of
national banks to the BIS, a fairly comprehensive dataset covering bilateral positions
between countries is available. Hence, the Spanish households’ cross-border bank
7 ECB/2013/33 (Annex I, Part 3, Table 2).
8 An estimation of the Spanish share is under way, although it is not a priority owing to the low impact on
the total amounts.
9 The LBS data are compiled according to the residence of banks on an unconsolidated, standalone basis.
This definition is aligned with b.o.p. and i.i.p. statistics.
10 The BIS, in consultation with the reporting countries, invites new authorities to participate in the LBS
when the international business of banks in their country becomes substantial.
11 The household sector includes non-profit institutions serving households (NPISHs).
12 Financial stability authorities from the same country as reporting authorities, and selected international
and regional financial organisations.

6 The advantages of data-sharing
loans and deposits can be derived through a mirror data approach. The accuracy of
the estimate will essentially rely on the availability of the subsector dataset provided
by the countries.
Sectoral breakdown in the locational banking statistics (LBS) Figure 2
Source: Author’s elaboration.
The valuation of loans and deposits in LBS statistics is in line with ESA 2010 and
BPM6 requirements, valued at nominal value including accrued but not yet paid
interest.
Regarding the Spanish counterparty sector coverage in the LBS statistics, Table
1 shows that 98% of total cross-border deposits liabilities and 99.7% of total cross-
border loans assets are allocated to either the non-bank financial or non-financial
sector. Furthermore, 90% (deposits) and 99% (loans) of the amounts allocated to the
non-financial sector provide the household subsector split. This data is
complemented by Table A and Table B (Annex), which provide deposits and loans
amounts outstanding, respectively, at end-December 2018 for all reporting foreign
banks with Spain as the counterpart country. These are all broken down, if available,
by either required or encouraged sector of counterparty. As can be observed in Table
A, the 90% of the deposits allocated to the non-financial sector are broken down by
subsector and are reported by 24 countries over 32. Of the remaining 8 countries,
which at end-December 2018 reported €2,652 million of unallocated amounts, the
United States (US) and China (CN) hold the most significant share (covering the 90%
of the total amount). Hence, a household subsector estimate for these two countries
could be applied in order to increase the data coverage from 90% to 99%, ensuring,
as loans (see Table B), the use of a complete and robust dataset for the compilation
of Spanish household cross-border deposits and loans in external statistics.

The advantages of data-sharing 7
Spanish counterparty sector coverage in the LBS statistics
Share allocated by subsector, in per cent, at end-December 2018 Table 1
Deposits Loans
Historical bank/non-bank sectors 100% 100%
Of which: required non-bank sectors 98% 99.7%
Of which: encouraged non-financial sectors 90% 99%
Sources: BIS locational banking statistics (LBS)
Graph 1 tracks the reporting countries providing a household sector split of
deposits (Graph 1a) and loans (Graph 1b) vis-à-vis Spain. The right-hand side (red
points) shows the number of countries providing these data over the years; and the
left hand side (coloured areas) shows the outstanding amount covered by the
countries that start to provide this split as from the same point in time. As both graphs
show, the number of countries providing the encouraged non-financial sector data
has varied over time. Data from 2013Q4 were first reported by 12 countries (in yellow),
in 2014Q1 the number of countries increased by one (in grey), and so on until their
number rose to 24 (deposits) and 23 (loans) countries, sending data from 2018Q2.
Despite the number of reporting countries having doubled in 2018, the last ones have
hardly impacted the level of deposits and loans and, thus, a time series could be
directly available from 2014Q4 (when 19 (deposits) and 18 (loans) countries, covered
an average of 98% of the 2018 total amount in both financial instruments).13
Reporting countries providing a household sector split
Cross-border assets (loans) and liabilities (deposits) to Spanish households, in €m Graph 1
Source: BIS locational banking statistics (LBS); author’s calculations
13 There is one country which is in the first group of reporting countries (Graph 1, in yellow) but it has only
sent LBS data until 2016Q2. Stocks from that date have been projected forward taking into account
changes in the exchange rate. Results are very close to BSI, in which the data of this country are
provided.
1b: Loans 1a: Deposits

8 The advantages of data-sharing
Other data sources to supplement the estimation of Spanish households’
deposits
Another complementary data source available for the compilation of Spanish
household deposits is the administrative data provided by the Spanish Tax Agency.
In 2012, the Spanish Government approved, following a special tax
regularisation, a law to combat tax evasion. They designed the 720 Form through
which individuals that are tax-resident in Spain must provide the Spanish Tax
Authority with: (i) their bank account balance in financial entities abroad; (ii) securities,
insurance and taxes deposited, managed or obtained abroad; and (iii) real estate and
any profit from real estate outside Spain.
This source of information provides stocks broken down by counterparty country
and it is reported on an annual basis within the five months following the end of the
year to which the data relate. The threshold value above which the declaration
becomes mandatory is €50,000 held in any of the three groups of instruments
mentioned in the previous paragraph.
Nonetheless, this available dataset14 presents some shortcomings that have had
to be addressed:
• Regarding bank accounts opened in foreign financial entities, the reporting
agent is required to file the 720 Form only when (a) they open a bank account above
€50,000; (b) the bank account increases by more than €20,000; or (c) the bank account
is closed. The dataset provides a split by these three types of declarations and by
counterparty country on an aggregate basis.15 As a result, it has been estimated the
2013-2018 annual stock by adding all the bank accounts reported the following years
that were opened to the first available dataset in 2012, and subtracting bank accounts
closed. It is, therefore, assumed that for those bank accounts opened in a specific
year, the movements occurring in the future (except the closing of the account) are
not included in the estimation.16 Consequently, the estimate by counterparty country
could be considered as a minimum amount.
• The 720 Form is, for the moment, designed for informative purposes and
not for tax purposes. As a result, it is known that there are Spanish households that
have not yet reported these data to the tax authority.
Once these administrative data were analysed from 2012 to 2018 on a
geographical basis, it was noted that Spanish individuals had reported a significant
amount of bank accounts in financial entities established in Andorra (€1.43 billion in
2018Q417) which had not been provided as a counterpart by any of the data sources
previously mentioned (BSI, LBS and direct reporting system). For this reason, and
despite the assumptions that are necessary to make, the data provided in the 720
14 Adapted to certain requirements requested by the Banco de España (disaggregation by instrument,
counterparty country, individual or legal entity, among others).
15 No individual data are provided owing to confidentiality issues.
16 The available dataset provided by the tax authority only contains, apart from opened and closed bank
accounts, the outstanding bank accounts for those which have increased by more than €20,000, so it
is not feasible to ascertain the total amount with the rest of the bank accounts (those that have not
exceeded the limit) included.
17 Figure based on the estimation method explained above.

The advantages of data-sharing 9
Form vis-à-vis this country have been included in the estimation of Spanish
household cross-border deposits.
A closely related piece of information to the Spanish 720 Form is the common
reporting standard (CRS) dataset. It was developed in response to the G20 request
and approved in 2014 by the Organisation for Economic Cooperation and
Development (OECD)18 owing to the fact that vast amounts of money are kept
offshore and go untaxed, with taxpayers failing to comply with tax obligations in their
home jurisdiction. Offshore tax evasion is a serious problem for jurisdictions all over
the world (OECD, 2017)19. Hence, the aim is to help fight tax evasion and to protect
the integrity of participating countries’ tax systems. This is a new information-
gathering and reporting requirement for financial institutions that relies on the
financial account-related information of individuals and legal entities tax-resident in
a country other than where the financial institution is established. The data are
automatically exchanged with other jurisdictions (tax authorities) on an annual basis.20
Currently, 97 countries have signed an agreement to implement it and the first
reporting exercises have been conducted in 2017.
Financial institutions must provide the data broken down by 5 account number
types:21 (i) IBAN (International Bank Account Number), (ii) OBAN (Other Bank Account
Number), (iii) ISIN (International Securities Information Number), (iv) OSIN (Other
Securities Information Number), and (v) Other (any other type of account number e.g.
insurance contract). However, analysing for the first time the 2017 dataset related to
Spanish households holding deposits abroad, some shortcomings have been
identified as 54% of the total outstanding amount (60% of number of declarations) is
not yet classified by any account/instrument type.
The Spanish Tax Authority is currently at a preliminary phase of data-checking
and it is expected that the quality of the data will improve in the coming years.
Nevertheless, they are performing a test exercise with the 720 Form, with the aim of
identifying coverage gaps by agent and requiring a 720 Form declaration to be filed
by them. As a result, thanks to this CRS dataset, the quality of the 720 data source will
be sounder in the coming years and it will enable compilers to keep using it as a
complementary data source in the compilation of Spanish households’ cross-border
deposits, improving the quality of b.o.p./i.i.p. statistics.
In the same context of CRS, there are FATCA (Foreign Account Tax Compliance Act)
data. This legislation has been designed and introduced by the US Department of
Treasury and the US Internal Revenue Service (IRS) to prevent tax evasion. Hence, the
purpose of FATCA is also to encourage better tax compliance by preventing US
persons from using foreign banks and other financial organisations in order to avoid
US taxation on their income and assets.22 The data are, like CRS, automatically
exchanged with tax authorities on an annual basis. However, so far these data cannot
18 Its legal basis is the Convention on Mutual Administrative Assistance in Tax Matters.
19 OECD (2017), Standard for Automatic Exchange of Financial Account Information in Tax Matters, Second
Edition, OECD Publishing, Paris.
20 The Spanish Tax Authority provides Banco de España with this dataset at the same time as the 720 Form,
but referring to a previous year.
21 See OECD (2017), Standard for Automatic Exchange of Financial Account Information in Tax Matters,
Second Edition, OECD Publishing, Paris. Annex 3. Common reporting standard user guide.
22 See the US treasury website (https://www.treasury.gov/resource-center/tax-
policy/treaties/pages/fatca.aspx)

10 The advantages of data-sharing
be used since the US financial institutions do not provide account balances.
Nonetheless, they provide dividends and interest received, so an analysis could be
done in the future comparing this data with the estimation included in the b.o.p.
Estimation method implemented in the Spanish b.o.p./i.i.p.
Spanish households’ cross-border loans and deposits are compiled through a
combination of BSI and LBS mirror data statistics and complemented by a direct
reporting system and administrative data sources for those countries not included in
the census of BSI or LBS. The compilation method is, thus, based on a defined priority
criterion depending on country coverage along with the availability of a household
subsector split, as follows:
Euro area countries
The data provided by euro area countries in BSI and LBS are compared. As graph 2
depicts, the household counterparty sector follows a very similar path in both datasets
from 2014Q4 for both deposits and loans, with the amounts of BSI slightly above LBS
figures.
BSI-BIS comparison of euro area reporting countries
Amounts outstanding to Spanish households, in €m Graph 2
2a: Deposits 2b: Loans
Sources: BIS locational banking statistics (LBS) and ECB balance sheet items statistics (BSI); author’s calculations
The main reasons for these discrepancies are:
a) Some countries do not provide the same amount in both datasets although
the difference is not significant (Graph 2, area in blue).
b) BSI census contains more countries than LBS from 2014Q4 (Graph 2, area in
brown). These are Estonia, Finland, Greece, Lithuania, Latvia, Malta, Slovenia and
Slovakia.
The fact that BSI data contain a complete coverage of euro area countries along
with a household subsector split, due to mandatory requirements, in addition to
being available earlier than BIS, determines the choice of using the BSI mirror data as
the main source in the estimation of Spanish households’ cross-border loans and
deposits vis-à-vis euro area countries.

The advantages of data-sharing 11
Non-euro area countries
A distinction is made between different scenarios, summarized in the graph shown in
Box 1.
The priority criterion is as follows:
1. A country provides LBS loans or deposits broken down by household
subsector for any quarter. In this case, this source is chosen to compile the
statistic. If this information is missing at some point in time (providing only
aggregate figures of non-banks or non-financial sectors), bilateral positions
can be estimated by applying to non-reported quarters the weighted average
of households in non-financial sectors or non-banks (as available). E.g.
Australia provides a household split from 2017Q4 and bilateral positions can
be estimated backwards applying the weighted average of households from
2017Q4 to 2019Q223 of non-bank sectors (as it provides only a bank/non-
bank sectors split in the missing periods). The weighted average remains
stable throughout all the available periods. Nevertheless, closer monitoring
is necessary so that if the weighted average proves volatile, the estimation
could be improved through a moving average.
2. A country has always provided LBS loans or deposits broken down by non-
bank financial and non-financial sectors as the most detailed breakdown. The
data are chosen and the estimation of the household subsector is based on
the weighted average of households of other reporting countries in each
quarter. E.g. the US solely provides a non-bank financial/non-financial sector
split, so bilateral household positions for the whole time series can be
estimated applying the weighted average of this sector in all available
countries.24
3. A country provides LBS loans or deposits broken down by bank and non-
bank sector as the most detailed breakdown:
a. If it is an EU (non-euro) area country, BSI data are prioritised as they
cover the same detailed level and they are available earlier. The household
subsector estimation method applied is the same as explained above in scenario
2. E.g. Bulgaria (only deposits), Czech Republic, Croatia, Hungary, Poland and
Romania.
b. If an extra EU area country is involved, the data are chosen and the
estimation method explained in scenario 2 is applied. E.g. Jersey, Panama,
Bahrain, Chile or Mexico, among others.
4. A country does not provide either BSI or LBS data. Data from the Spanish
direct reporting system are used as minimum amounts.
5. A country not covered by any of the three above-mentioned data sources.
The 720 Form, only for deposits, is used in significant cases. E.g. Andorra.
23 The latest LBS period available.
24 The US estimation based on all available countries could be refined and a possible enhancement is under
consideration (e.g. basing it on a close group of countries or the use of FATCA data if possible in the
future).

12 The advantages of data-sharing
Box 1
Summary of priority criterion for the compilation of Spanish households’ cross-border loans and deposits in the b.o.p./i.i.p. for each counterparty country
t=1,2,3,…,n stands for quarterly periods (1 is the first reporting quarter and n the last one); ES stands for Spain; k stands for countries
providing household sector vis-à-vis Spain; N stands for non-financial sectors; P stands for non-bank sector.
Only for deposits and significant countries.
Do BSI data provide
household sector split?
Do LBS data provide
household sector split?
Do LBS data provide non-
financial sectors split?
Yes
Yes
Yes
No
No
No
LBS
BSI
LBS
Yes BSI
Do BSI data provide non-
banks sector split?
No Direct reporting system
Tax authority (720 Form)
Do LBS data provide non-
banks sector split?
Yes
No
LBS
complemented by

The advantages of data-sharing 13
As the periodicity and availability of LBS data differs to that required for the
compilation of the b.o.p./ i.i.p., the way to address this limitation is as follows: for the
monthly b.o.p., the transactions provided by the direct reporting system are used; and
for the quarterly i.i.p., all the transactions and other flows reported by the direct
reporting system are accumulated to the last available quarter. Once the latest update
of LBS data is available, the data are replaced.
Results
Graph 3 shows how the unique use of the Spanish direct reporting system for the
compilation of households’ cross-border deposits and loans is not feasible since,
owing to the nature of this sector, many individuals do not reach the reporting
threshold and, thus, these operations are not covered.
Data coverage of Spanish households’ cross-border deposits and loans by data
source
Amounts outstanding, in €m, at end-December 2018 Graph 3
Sources: BIS, BSI and Spanish direct reporting system; author’s calculations.
Therefore, the use of complementary data sources through the mirror data
approach better reflects the financial situation of Spanish households holding
deposits or receiving loans abroad. Furthermore, administrative data, such as the 720
Form, help to complement and improve the estimation of deposits.
Graph 4 shows the final estimate of cross-border deposits and loans held by the
Spanish household sector and included in the i.i.p. from two perspectives: data source
composition (Graphs 4a and 4b) and geographical area composition (Graphs 4c and
4d).
Regarding deposits, Graph 4a shows that, in the last five years, the BSI mirror
data source covers an average of 36.5% relative to the average total amount.
Regarding the LBS mirror data source, it covers an average of 54.4%. From the 720
Form provided by the Spanish Tax Authority, the amount included in the estimation
covers an average share of 9%. And finally, the amounts included from the Spanish
direct reporting system are not significant and hardly impact the total figures,
accounting an average share of 0.1%.
In terms of geographical area composition, Graph 4c shows that, in the last five
years, Spanish households have held deposits in euro area countries totalling an
average of 36% relative to the average total amount. The most representative
countries are France, Germany and Luxembourg, covering the 75% of the average
3a: Deposits 3b: Loans

14 The advantages of data-sharing
euro area total amount. Regarding EU non-euro area countries, these account for an
average of 13%. And finally the average outstanding amount in non-EU countries
represents the 51% and the most representative countries are Switzerland, Andorra
and United States, covering an average of 88% in terms of the average non-EU area
total amount.
Regarding loans, Graph 4b shows that in the last five years, the BSI mirror data
source covers an average share of 46% and LBS mirror data source covers an average
share of 53%. Finally, from the Spanish direct reporting system, the amount included
in the estimation covers an average share of 1%.
In terms of geographical area composition, Graph 4d shows that, in the last five
years, Spanish households have received loans from euro area countries totalling an
average share of 46%. The most representative countries are, as well as deposits,
France, Germany and Luxembourg, covering an average of 69%. Regarding EU non-
euro area countries, these represent an average of 23%. And finally, the average
outstanding amount in non-EU countries represents the 31% with Switzerland the
most representative country.
Spanish households’ cross-border deposits and loans included in the international
investment position
Amounts outstanding, in €m Graph 4
Sources: BIS, BSI, 720 Form and Spanish direct reporting system; author’s calculations.
4c: Deposits, geographical area composition 4d: Loans, geographical area composition
4a: Deposits, data source composition 4b: Loans, data source composition

The advantages of data-sharing 15
2.2 Insurance technical reserves
In 2017 the Working Group in Financial Accounts (WG FA) and External Statistics (WG
ES), of the European System of Central Banks (ESCB),25 agreed to launch a stock-
taking exercise to have a better understanding of national practices regarding the
statistical recording of assets held abroad for the household sector.26 25 out of 28
countries participated in this exercise and they provided some details about data
sources and compilation methods involving households. The results showed that less
than half of the countries are still not compiling insurance, pension and standardised
guarantee schemes for household sector in b.o.p./i.i.p. and national accounts
statistics. This is because either the amounts are negligible or the data are not
available (this may be related to the high cost of obtaining this information in relation
to its relevance). In an attempt to resolve this data gap, the outcome of the exercise
highlighted the use of existing newer data sources (e.g. Solvency II data) to obtain a
better coverage of cross-border insurance schemes. Spain was one of the countries
that had not been able to estimate this instrument in the Spanish household sector
until the last benchmark revision27 carried out in 2019.
The international transactions reporting system (ITRS) - the main data source
used for the compilation of historical b.o.p./i.i.p. data until 2012 - and subsequently
the Spanish direct reporting system for the compilation of b.o.p./i.i.p. of non-bank
financial and non-financial sectors, did not provide any details about this financial
instrument. However, investigating the availability of new data sources, it was found
that cross-border insurance policies held by Spanish households were significant.
Since 2016, the ECB has provided to NCBs financial activity data from insurance
corporations placed in euro area countries under Regulation (EU) No 1374/2014 of
the European Central Bank of 28 November 2014 on statistical reporting
requirements for insurance corporations (ECB/2014/50).
The reporting population consist of insurance corporations resident in the
territory of the relevant euro area Member State (“host approach”), in accordance
with ESA 2010. Nevertheless, in order to limit the administrative burden and avoid the
duplication of tasks, NCBs may derive the data required under this Regulation from
data collected by national competent authorities (NCAs) for supervisory purposes
(Solvency II).28 This latter approach, while potentially not in line with ESA 2010 as the
data are compiled following the “home approach”, is acceptable as long as the
25 Committees and Working Groups of the Eurosystem/the ESCB are responsible for drafting documents
and conducting analysis on matters to be discussed by the decision-making bodies of the Eurosystem
and the ESCB, covering different areas such as monetary policy, banking supervision and statistics,
among others. The decisions taken at the Governing Council and the General Council meetings are
based on the work of the Committees of the Eurosystem/the ESCB.
26 The results were assessed in a dedicated workshop named “Estimating households’ foreign
assets/liabilities”, which resulted in a number of follow-up actions to enhance the regular production
of b.o.p./i.i.p. statistics for the household sector.
27 Benchmark revisions are a coordinated major European revision carried out at least once every five years
to incorporate new data sources and major changes in international statistical methodology. They
ensure a maximum degree of consistency within national accounts: the longest possible time series
as well as consistency across Member States and between domains.
28 See Directive 2009/138/EC of the European Parliament and of the Council of 25 November 2009 on the
taking-up and pursuit of the business of Insurance and Reinsurance (Solvency II).

16 The advantages of data-sharing
difference with the “host approach” data is not deemed significant (Guideline (EU)
ECB, 2016).29
Insurance corporations shall provide the relevant NCB, on a quarterly basis, with
end-of-quarter stock data on assets and liabilities.30 On the asset side, they provide
non-life insurance technical reserves (ITRs)31, and on the liabilities side they provide
ITRs broken down by life and non-life type. They provide the counterparty country of
all these data except by line of business, which is provided on an annual basis (see
Table 2).
29 NCBs that wish to adjust their data may, on a voluntary and best efforts basis, derive host approach data
from data collected in accordance with the home approach. For this purpose, bilateral contacts and
exchanges of data may take place between the NCBs concerned (Guideline, 2016).
30 Also quarterly revaluation adjustments or financial transactions, where applicable.
31 It relates to financial claims of ICs against reinsurance corporations based on life and non-life reinsurance
policies.
Statistical reporting ITRs requirements for insurance corporations
Insurance technical reserves Table 2
Total
Euro area Rest of the world
Domestic
Euro area Member
States other than
domestic (country-
by-country
information)
Non-participating
Member States
(country-by-country
information)
Main
counterparties
outside the EU1
Assets
Non-life insurance technical
reserves SUM Quarterly Quarterly Quarterly Quarterly
Liabilities
Insurance technical reserves SUM
Life ITRs SUM Quarterly Quarterly Quarterly Quarterly
Of which:
Unit-linked
Quarterly
Non unit-linked
Pension
entitlements
Defined
contribution
schemes
Defined benefit
schemes
Hybrid schemes
Non-life ITRs SUM Quarterly Quarterly Quarterly Quarterly
By line of business Quarterly Annual Annual Annual Annual
1 Country-by-country information for Brazil, Canada, China, Hong Kong, India, Japan, Russia, Switzerland, USA.
Source: Regulation (EU) No 1374/2014 of ECB (Part 3, Table 1a-1b); author’s elaboration.

The advantages of data-sharing 17
This dataset is based on a census rather than a sample. Entities are required to
report: (i) on a quarterly basis until at least 80% of the total market share of insurance
corporations is covered in each euro area Member State; (ii) on an annual basis until
reaching 95% share of the total market; and (iii) a reduced set of information to all
the rest, normally small entities.
Regarding timeliness, reporting agents shall transmit to the relevant NCB or NCA
the required quarterly data, at the latest, five weeks following the end of the quarter
to which the data relate; and the annual data, at the latest, 14 weeks following the
end of the year to which the data relate. This reporting arrangement has been in place
since 2016.
Therefore, the fact that the ECB provides NCBs with full access to data reported
by each Euro Area Member State enables compilers to derive Spanish policyholders’
ITRs assets vis-à-vis insurers in the Euro Area using the geographic counterpart
information of insurance corporations’ liabilities in ITRs. The Regulation does not
require insurance corporations to provide the counterparty sector, nevertheless only
light assumptions are needed to derive the data.
On the one hand, it is assumed that life ITRs should, by definition, be held by
households. Hence, these data have been included in the household sector of the
Spanish i.i.p./b.o.p, with Luxembourg32 the most significant country (more than 50%
of the total amount), followed by Ireland, France, Portugal and Belgium.
On the other hand, non-life ITRs could be held by any sector and not only by
households. However, analysing the figures by line of business33 vis-à-vis Spain (see
Graph 5), approximately 80% of the total amount comprises reinsurance34, this being
allocated on the basis of its nature (insurance for insurance companies) in the Spanish
insurance sector. Therefore, these data are also covered in the dataset provided by
the Spanish insurance corporations35 to the Banco de España and they are already
included in the b.o.p./i.i.p. The remaining non-life ITRs (Graph 5, in dark orange) have
still not been taken into account because it would be necessary to estimate a sector
breakdown in order to allocate a weight to the household sector. This is a possible
enhancement that it has still not considered owing to the low weight of these data in
relation to the total amount.
As the Regulation only covers euro area Member States, this data source has
been complemented, as well as deposits, by the 720 Form provided by the Spanish
Tax Authority. As explained in the deposits chapter, one of the three categories which
individuals that are tax-resident in Spain must provide comprises securities, insurance
and taxes deposited, managed or obtained abroad if, as a whole, they total more than
€50,000. In subsequent years, the form must be re-submitted if they increase by more
than €20,000.
32 Bilateral exchanges with Luxembourg confirmed the same figure.
33 Available on an annual basis (see Table 2).
34 An insurer may protect against an unexpectedly large number of claims, or exceptionally heavy claims,
by taking out a reinsurance policy with a reinsurer (16.16, ESA 2010).
35 A comparison exercise was performed to verify non-bilateral asymmetries.

18 The advantages of data-sharing
Non-life insurance technical reserves on the liabilities side of euro area insurance
corporations vis-à-vis Spain
Amounts outstanding, in €m Graph 5
Source: ECB; author´s calculations
Regarding insurance data, these contain life insurance policies as well as life or
temporary annuities held in insurance corporations abroad. Taking this information
on a geographical basis, the 2012-2018 annual stock is estimated by the same
method used in household cross-border deposits. As a result, it was noted that the
non-euro area countries where Spanish households hold significant amounts of
insurance policies are United Kingdom and Andorra. Consequently, the data referring
to these two countries have been included in the cross-border insurance assets of the
Spanish household sector.
Results
As data provided by the ECB Regulation are available from 2016 and data provided
by the 720 Form is available from 2012, it has been necessary to estimate a historical
series of household cross-border ITRs assets to be included in external statistics.
A relevant consideration when estimating the historical series was the
information confirmed on the bilateral exchange with Luxembourg, which provided
more details about the product composition of the life ITRs36, these mainly
comprising unit-linked products. This is a type of insurance product which, unlike a
pure insurance policy, enables the holder to combine an investment portfolio in a
range of qualified investments with the coverage of an insurance policy.
Hence, given the similar characteristics of unit-linked products and investment
funds, the estimation of the historical series37 is based on the evolution of Spanish
households’ shares in investment funds issued by the seven counterparty countries
(LU, IE, BE, PT, FR, AD and GB) and contrasted with the evolution of ITRs held by
36 NCBs are required to provide life insurance technical reserves by line of business on an aggregate basis,
as no counterparty country composition is required (See Table 2)
37 It was decided to estimate data backwards until 1999, the first year when stocks began to be significant.

The advantages of data-sharing 19
Spanish insurance corporations and issued by non-residents, and the life-insurance
premiums paid by Spanish households to these countries.
Graph 6 shows the final estimated series of the ITRs assets held by the Spanish
household sector in the i.i.p. The Regulation dataset used as mirror data covers an
average of 84% of the total amount, and it is complemented by the administrative
data source provided by the Spanish Tax Authority (720 Form).
Spanish households’ cross-border life insurance technical reserves included in the
international investment position (i.i.p.)
Amounts outstanding, in €m Graph 6
Source: ECB and 720 Form; author’s calculations
2.3 Securities
Another relevant instrument in the households’ balance sheet is the foreign securities
holdings. B.o.p. compilers often rely, for the compilation of securities, on information
provided by local custodians. However, they face difficulties in compiling securities
holdings held abroad via non-resident custodians. To address this challenge, the ESCB
provides a database that, used as mirror data, allows compilers to cover these missing
data for euro area custodians.
In the case of Spain, however, both securities deposited in Spain and securities
in custody abroad are covered by the direct reporting system. Nonetheless, the
availability of an alternative data source provided by the ESCB allows to cross-check
the data and find possible shortcomings that must be taken into account.
The Spanish compilation system
The securities compilation system for the compilation of Portfolio Investment,
Reserve assets and Direct Investment (for quoted securities) dates from 2001.38
38 Data collection is covered by Law 19/2003 on transactions with the foreign sector and by Royal Decree
1360/2011 on reporting obligations to the Banco de España under Banco de España's Circulars
1/2012, 4/2012, 3/2013 and 4/2017.

20 The advantages of data-sharing
The Spanish compilation system relies primarily on monthly direct reporting by
Spanish holders and custodians. The reporting systems are based in a security-by-
security and holder-by-holder declaration. This information is supplemented with the
Centralised Securities Database (CSDB).
Table 3 shows an approximation to the securities compilation system. For some
sectors (mainly the non-bank financial sectors under supervision with the exception
of the money market funds), securities deposited in Spain are declared directly by
both the holder and the custodian. Although the chosen data source in the
compilation of b.o.p./i.i.p. is that provided by the holder, the two datasets are cross-
checked to identify possible errors. For non-financial sectors, the securities held in
Spain are provided by custodians. Regarding securities deposited abroad, there is
direct reporting by the holder for all sectors.
Therefore, the compilation of households’ securities in custody abroad relies on
information provided by the holders to Banco de España through the direct reporting
system.
Spanish securities compilation system
Table 3
Non-resident Issuers Resident Issuers
In a resident
custodian Abroad
In a resident
custodian Abroad
Sector of the holder
S.1 Resident Sectors
S. 121 Banco de España Direct reporting Direct reporting
S. 122 Deposit-taking corporations, except the
Central Bank Direct reporting Direct reporting
S.123 Money market funds (MMFs) Direct/Custodian
reporting Direct reporting
Direct/Custodian
reporting Direct reporting
S.124 Non-MMF investment funds Custodian reporting Direct reporting
Direct/Custodian
reporting Direct reporting
S.128 Insurance corporations Direct/Custodian
reporting Direct reporting
Direct/Custodian
reporting Direct reporting
Other Financial corporations Custodian reporting Direct reporting
Custodian
reporting Direct reporting
S.13 General Government Custodian reporting Direct reporting
Custodian
reporting Direct reporting
S.11 Non-financial corporations Custodian reporting Direct reporting
Custodian
reporting Direct reporting
S.14/S.15 Households and Non-profit
institutions serving households Custodian reporting Direct reporting
Custodian
reporting Direct reporting
S.2 Non-resident holders - -
Custodian
reporting Mixed approach1
1 Portfolio investment liabilities are calculated as the net balance of all cross-border custody holdings between issuers, central
securities depository data (CSDs), custodians and resident end-investors.
Source: author’s elaboration

The advantages of data-sharing 21
From January 2013 onwards, Banco de España obliges all natural and legal
persons resident in Spain (other than payment service providers registered in the
official registers of the Banco de España) to report their transactions and positions
with non-residents, giving sufficient details about securities directly deposited in a
non-resident custodian. The exemption threshold is the same as for loans and
deposits of €1 million. Besides the threshold, which depends on the amount of the
transactions and/or balances of the year immediately before, there are two
declaration forms, one detailed and the other summary. Detailed declaration includes
the ISIN code (from January 2014) and the country of the custodian (from January
2018). The summary reporting form (which is annual and provides solely total assets
and liabilities) should be filed if the amount of neither the balances nor the
transactions exceeds €50 million. The summary reporting form is distributed taking
into account the detailed form. However, the distribution is made for instrument,
country, currency and NACE activity, but not for country of the custodian (until 2018)
and ISIN codes.
Figures under the simplification threshold are distributed by item using
estimates, and the portion assigned to portfolio assets is logically unallocated by ISIN.
The results obtained after the distribution of the summary reporting show that the
weight of the securities deposited abroad represent the 46% of the total amount
declared, followed by other equity, deposits and loans. And the weight of the
distributed amount in securities abroad (including the summary and the detailed
declaration) represents the 75%.
Graph 7 shows the current composition of Spanish households’ cross-border
securities broken down by issuer and custodian area. At end-December 2018, when
the country of custodian is provided in the direct reporting system and thus, a
distribution of the summary form is taken by this item, a further analysis can be made.
As can be seen in the graph, 87% (78% EA issuer and 9% non-EA issuer) of the total
amount is covered by the Spanish custodian reporting. The remaining amount (13%)
is covered by the direct reporting form provided by the Spanish holder.
Spanish households’ cross-border securities included in the international
investment position (i.i.p.)
Amounts outstanding, in per cent, at end-December 2018 Graph 7
Source: Spanish direct reporting system; author’s calculations.

22 The advantages of data-sharing
At the same time, since 2014 the ESCB has made available another data source
that could be useful for the compilation of households’ holdings of securities abroad.
This is the Eurosystem’s Securities Holdings DataBase (SHSDB). Therefore, this
complementary data source could be useful for checking the current direct reporting
used and, if applicable, it could be switched for the euro area countries.
The ESCB Securities Holdings Statistics
The SHSDB has been compiled by the ESCB since the beginning of 2014 and is based
on a security-by-security system broken down by instrument type, issuer/holder
country and further classifications.39
The Regulation and the Guideline set the requirements that holders and
custodians have to submit to the respective NCB: (i) holdings of securities by resident
investors; (ii) securities held in custody on behalf of investors resident in other euro
area Member States (the so-called third party holdings, TPH); and (iii) securities issued
by euro area entities held in custody with resident custodians on behalf of non-euro
area resident investors.
These data are consolidated by the ECB and disseminated to contributing NCBs
via the Securities Holdings DataBase (SHSDB), so that they may be integrated into
national statistics and compared, where appropriate, with a direct declaration.
Comparing TPH with the direct reporting system
Data on holdings by Spanish households deposited in custodians located in euro area
countries (regardless of the country the issuer of the securities is located in) or
deposited in non-EA custodians but issued by EA countries are provided by both the
holder in the Spanish direct reporting system (Graph 7, blue colours) and also by the
custodian in the TPH data of the SHSDB, e.g. Italian securities held by Spanish
households in the custody of German or Italian intermediaries. Hence, whenever
possible, both datasets could be compared at ISIN level and at the country of the
custodian basis to check the data and to help determine which best covers these
kinds of securities.
In the comparison exercise, TPH figures at end 2018 are around 20% higher than
direct reporting, which firstly suggests that direct reporting might be incomplete.
Nonetheless, analysing the data by country of the custodian (once the summary
reporting form is distributed), there are differences between some countries such as
Belgium, Luxembourg and Germany that they are currently being assessed.
There are some limitations that makes it difficult to conclude.
• Risk of wrong sectorization
As compilers of TPH, some cases have been identified in which the sector of the
non-resident holder is not properly declared by custodians, confusing financial and
non-financial sector. The main limitation is that a check is not possible.
39 The legal basis for collecting SHS data is laid down in Regulation ECB/2012/24 and subsequent
amendments. This Regulation is complemented by Guideline ECB/2013/7 and subsequent
amendments, which sets out the procedures to be followed by NCBs when reporting to the ECB.

The advantages of data-sharing 23
• Risk of duplication
Cases in which the data could be duplicated because they are reported by the
non-resident custodian data (TPH) and are also included by the Spanish security
compilation system. This is the case of resident investment fund distributors which
sell foreign investment funds in Spain.40 On the one hand, even though it was not
really a custodian, this entity must provide the Spanish investor shares in the
custodian dataset41 and, on the other hand, the foreign management entity or
custodian reports the data to the corresponding authority. Hence, if the TPH data are
intended to be directly used in the compilation of Households´ securities in
custodians abroad, it is necessary to take into account these cases in order to avoid
duplications.
Cases where the custodian country by ISIN is not the same in both datasets, e.g.
an ISIN issued in Japan whose custodian country is Japan in the direct reporting
system and yet the TPH reports Germany as the custodian country. This case could
generate duplicity if the TPH is used to cover the euro area and the direct reporting
system to cover the non-euro area.
• Lack of sufficient detail
As 75% of Spanish households’ holdings of securities abroad are unallocated by
ISIN and the custodian country is estimated, this hampers checking the data with TPH
at ISIN level.
In conclusion, it has been decided to use the direct reporting system for the
compilation of households’ securities abroad until the TPH figures are confirmed with
additional information, contacting the reporting countries bilaterally.
2.4 Real estate
Within the accounting framework of the national accounts and the b.o.p./i.i.p., real
estate assets are always considered to be the property of the economy in which they
are located. Accordingly, the ownership of a real estate asset cannot directly give rise
to an external asset or liability. If a resident household owns such an asset, it is
assumed that, instead of owning the asset itself, the household owns a notional
company, resident in the same country as the real estate asset, which in turn owns
the asset. Therefore, foreign investment in real estate abroad is reflected in the
b.o.p./i.i.p. as direct investment assets.
Until 2013, assets in real estate abroad included in direct investment figures were
estimated by the method of accumulation of flows, using data from the settlement
system (ITRS) and including an estimate of the distribution of the amounts under the
simplification threshold. From the stocks at December 2012, the direct reporting
system, described before in this paper, provides transactions and stocks abroad
covering, among others, this instrument. Nevertheless, for the periods for which there
40 Circular 3/2013 on the reporting of transaction and balances in securities establishes that these kinds of
entities, in addition to custodians, are also obliged to report these data.
41 In Spain, there should be an agreement between the Spanish entity distributor and the management
entity in order not to duplicate reporting (see Law 35/2003 on Collective Investment Institutions).
However, in this example each entity is located in a different country and this law does not apply.

24 The advantages of data-sharing
were figures available from the old (ITRS) and from the new (direct reporting) system,
figures from the new one were significantly lower than those from the former.
Again, in this case, taking into account the uncertainty derived from the threshold
and possible missing data, particularly applicable to this instrument/sector, it was not
considered convenient to revise the figures down to those of the new system and,
instead, stocks from the old system were projected forward. With the benchmark
revision that was implemented in 2019, the stock of real estate properties situated
abroad and owned by households resident in Spain has been revised upwards, taking
as reference the declaration of assets abroad data supplied by the Spanish Tax
Authority. The 720 Form, as introduced in page 8, is an administrative source of
information that provides data about household real estate investment outside Spain,
among others. This form gives information from 2012 about the acquisitions in real
estate as well as their revaluations, broken down by counterpart country.
Nevertheless, it is necessary to continue working in close coordination with this
authority in order to improve the usefulness of the data for statistical purposes.
Besides, there is another source of information, also resulting from the sharing
of data that has to be explored in the future: the exchange of bilateral real estate data
within compilers in the euro area. Cases of relevant asymmetries can be investigated
and sources and methods confronted looking for possible improvements.
3. Conclusions
The general need to enhance the current scope and quality of the data collected on
the household sector can be fulfilled through data-sharing among institutions and
countries. This also enables data asymmetries to be minimised and ensures
consistency within and across statistical domains.
The Spanish experience in the compilation of the household sector in the b.o.p./
i.i.p. shows how using a mirror approach, allows compilers to increase the quality of
selected instrument types such as loans, deposits and securities, and to collect
missing information on others such as life insurance technical reserves. Besides, the
experience also demonstrates how using the tax authorities´ information, such as the
720 Form in Spain, is also useful for supplementing the estimation of several financial
instruments.
So far, recent academic papers have proposed countries’ estimates for
households’ “hidden wealth”. The results clearly highlight the importance of “missing
wealth” in international statistics owing to the deposits in offshore financial centres
and securities held with custodians abroad. However, the uncertainties in the
estimation methods and the strong assumptions warrant some caution when
considering how this research can be integrated into a statistical production
framework of official statistics under macroeconomic imbalance procedure (MIP)42
and with the existing data requirements in terms of periodicity, time lags and
breakdowns. Hence, the search for new available data sources, as they are assessed
in the paper, allows working towards a more regular, realistic and assessed estimation
42 The Macroeconomic Imbalance Procedure aims to identify, prevent and address the emergence of
potentially harmful macroeconomic imbalances that could adversely affect economic stability in a
particular Member State, the euro area, or the EU as a whole.

The advantages of data-sharing 25
of the household sector in external statistics, which is one the issues addressed in the
ESCB medium-term strategy and the respective work programme for b.o.p./i.i.p.
statistics.
Naturally, the effectiveness of this methodological framework relies on the
availability of granular information. A growing number of countries are reporting
bilaterally using a further breakdown. But there are still countries, mainly non-EU
economies, which solely provide data on an aggregate basis. Nonetheless, the
estimation method applied appears to be consistent within a statistically reasonable
level of error with no major negative impact on total aggregates.
Going forward, it will be necessary to continue working on data-sharing
initiatives, exchanging bilateral data and seeking access to the data that national tax
authorities receive.

26 The advantages of data-sharing
References
Banco de España (2012): Circular 4/2012 de 25 de abril, del Banco de España, sobre
normas para la comunicación por los residentes en España de las transacciones
económicas y los saldos de activos y pasivos financieros con el exterior.
Banco de España (2013): Circular 3/2013, de 29 de julio, del Banco de España, sobre
declaración de operaciones y saldos en valores negociables.
Bank for International Settlements (2017): BIS locational banking statistics:
explanation of the data structure definitions.
Bank for International Settlements (2019): Reporting guidelines for the BIS
international banking statistics.
Boletín Oficial del Estado (2013): Orden HAP/72/2013, de 30 de enero, por la que se
aprueba el modelo 720, declaración informativa sobre bienes y derechos situados en
el extranjero, a que se refiere la disposición adicional decimoctava de la Ley 58/2003,
de 17 de diciembre, General Tributaria y se determinan el lugar, forma, plazo y el
procedimiento para su presentación. Boletín Oficial del Estado, 31 de enero de 2013,
núm. 27.
Council of the European Union (1998): Council Regulation (EC) NO 2533/98 of 23
November 1998 concerning the collection of statistical information by the European
Central Bank.
European Parliament and of the Council (2013): Regulation (EU) No 549/2013 of the
European Parliament and of the Council of 21 May 2013 on the European system of
national and regional accounts in the European Union (ESA 2010)
European Parliament and of the council (2009): Directive 2009/138/EC of the
European Parliament and of the council of 25 November 2009 on the taking-up and
pursuit of the business of Insurance and Reinsurance (Solvency II).
European Central Bank (2012): Regulation (EU) No 1011/2012 of the European Central
Bank of 17 October 2012 concerning statistics on holdings of securities.
European Central Bank (2013): Regulation (EU) No 1071/2013 of the European Central
Bank of 24 September 2013 concerning the balance sheet of the monetary financial
institutions sector.
European Central Bank (2014): Regulation (EU) No 1374/2014 of the European Central
Bank of 28 November 2014 on statistical reporting requirements for insurance
corporations.
European Central Bank (2016): Guideline (EU) 2016/450 of the European Central Bank
of 4 December 2015 on monetary financial statistics.
European System of Central Banks (2017): Data sources and methods of some
transactions/positions involving households: Stock taking exercise. WG ES Item 2.2.
WGES/2017/189.
European Central Bank (2019): Manual on MFI balance sheet statistics.

The advantages of data-sharing 27
International Monetary Fund (2009): Balance of Payments and International
Investment Position Manual (BPM 6).
International Monetary Fund (2014): Balance of payments and international
investment position compilation guide.
OECD (2017): Standard for Automatic Exchange of Financial Account Information in
Tax Matters, OECD Publishing, Paris.

28 The advantages of data-sharing
Annex
LBS statistics by Spanish sector of counterparty (deposits on the liability side)
Amounts outstanding at end-December 2018, in €m Table A
Deposits
All reporting
countries
Of which:
All encouraged non-
financial sectors
Required non-
bank sectors
Historical bank/non-
bank sectors
Non-banks, total 33,013 29,045 3,442 526
Non-banks financial institutions 7,111 6,322 789 -
Non-financial sectors 25,375 22,723 2,652 -
General Government 306 306 - -
Non-financial corporations 7,069 7,069 - -
General Government and Non-
financial corporations, unallocated1
4,726 4,726 - -
Households including NPISHs 10,622 10,622 - -
Non-financial sectors, unallocated 2,652 - 2,652 -
Non-banks, unallocated by sector 527 - - -
Number of reporting countries 38 24 8 6
1 There are two countries which report only the household subsector. This item refers to the other two not provided unallocated subsectors.
Source: BIS locational banking statistics (LBS); author’s calculations.
LBS statistics by Spanish sector of counterparty (loans on the asset side)
Amounts outstanding at end-December 2018, in €m Table B
Loans
All reporting
countries
Of which:
All encouraged non-
financial sectors
Required non-
bank sectors
Historical bank/non-
bank sectors
Non-banks, total 57,106 56,070 857 179
Non-bank financial institutions 10,362 9,985 376 -
Non-financial sectors 46,565 46,085 480 -
General Government 2,574 2,574 - -
Non-financial corporations 40,037 40,037 - -
Households including
NPISHs
3,474 3,474 - -
Non-financial sectors,
unallocated
480 - 480 -
Non-banks, unallocated by sector 179 - - -
Number of reporting countries 34 23 7 4
Sources: BIS locational banking statistics (LBS); author’s calculations.

THE ADVANTAGES OF DATA SHARING: THE USE OF MIRRORDATA AND ADMINISTRATIVE DATA TO IMPROVE THE ESTIMATION OF HOUSEHOLD ASSETS/LIABILITIESDaniel SánchezBalance of Payments Division, Banco de España
IFC, ECB, BDP EXTERNAL STATISTICS CONFERENCE
Lisbon, Portugal17 & 18 February 2020
STATISTICS DEPARTMENT

2STATISTICS DEPARTMENT
MOTIVATION
What?• Share the Spanish experience• Better way to estimate external
assets/liabilities of households
Why? • Under-coverage of the household sector
How? • Mirror data sources• Administrative data
(tax authority)
data-sharing among institutions and countries can play an important role!deposits - loans - securities – insurances – real estate

Locational banking statistics BIS
3
LOANS & DEPOSITS
STATISTICS DEPARTMENT
Cross-border deposits vis-à-vis Spanish households Cross-border loans vis-à-vis Spanish households
Spanish counterparty sector coverage in LBS statistics(Share allocated and nº countries at end-December 2018)
Deposits Loans
Share Nº countries Share Nº
countries
Required bank/non-banks sectors 100% 38 100% 34
Of which: required non-banks sectors 98% 32 99.7% 30
Of which: encouraged non-financial sectors
90% 24 99% 23
Sectoral breakdown in LBS statistics
€m €m

4
LOANS & DEPOSITS
STATISTICS DEPARTMENT
Coverage by data sourceAmounts outstanding, in € billion, at end-December 2018
Deposits Loans
Other data sources to supplement the estimation of Spanish household deposits
Common reporting standard (CRS)
• 54% not classified by account/instrument type
• Data-checking CRS vs 720 Form
Foreign Account Tax Compliance Act (FATCA)
• US does not provide account balances (only dividends and interest received)
Spanish tax authority (720 Form)• Bank account balances in financial entities
abroad ( > €50,000)• By counterparty country• Annual (t+5m) only stocks• Some shortcomings
E.g. Andorra

Priority criterion in the b.o.p./i.i.p. for each counterparty country
5
LOANS & DEPOSITS
STATISTICS DEPARTMENT
Do BSI data providehousehold sector split?
Do LBS data providehousehold sector split?
Do BSI data providenon-banks sector split?
Direct reportingsystem
Do LBS data providenon-banks sector split?
Do LBS data provide non-financial sectors split?
BSI
LBS
Tax authority(720 Form)
complemented by t=1,2,3,…,n stands for quarterly periods (1 is the first reporting quarterand n the last one); ES stands for Spain; k stands for countries providinghousehold sector vis-à-vis Spain; N stands for non-financial sectors; P standsfor non-bank sector.
Only for deposits and significant countries.

Available new data sources
6
INSURANCE TECHNICAL RESERVES (ITRS)
STATISTICS DEPARTMENT
Since 2016, ECB provides NCBs financial activity data from insurance corporationsplaced in EA countries under Regulation (EU) No 1374/2014
Based on a census, mainly quarterly data (t+5 weeks)
Complemented by administrative data (720 Form) Most significant: United Kingdom and Andorra
Liabilities Total Geographicalbreakdown
Sector breakdown
Life ITRs X X -
Of which: -
Unit-linked X - -
Non unit- linked X - -
Etc. X - -
Non-life ITRs X X -
By line ofbusiness X X
(annual) -
100% Households
≈ 80% reinsuranceinsurance sector≈ 20% unallocated(future improvement)
In many cases derived from
Solvency II data

The Spanish compilation system
7
SECURITIES
STATISTICS DEPARTMENT
thirdparty
holdings
Spanish households’ cross-border securities included in the i.i.p.Amounts outstanding, in per cent, at end-December 2018
undergoing revision

8
COMPARING TPH WITH DIRECT REPORTING SYSTEM
STATISTICS DEPARTMENT
Undergoing revision. Now country of custodian available in direct reporting
As compilers of TPH: sector of the non-resident holder sometimes wrong
Risk of wrongsectorisation
Different country of custodian (EA – Extra EA)
Spanish investment fund distributorsprovide same data as foreignmanagement entity or custodian
Risk of duplication (1) Risk of duplication (2)
Lack of detail
75% holdings of securitiesabroad (direct reporting) are unallocated by ISIN
TPHs
Directreporting
+20%
but… so…
Need for furtheranalysis and
bilateral contact

Work in progress
9
REAL ESTATE
STATISTICS DEPARTMENT
Beforebenchmark
revision 2019
Settlementsystem
1993-2012
Direct reporting(accumulation of
flows)2012-2018
Afterbenchmark
revision 2019
Settlementsystem
1993-2012
Spanish taxauthority (720
Form)Dec-2012
Direct reporting(accumulation of
flows)2013-2019
the exchange of bilateral data withincompilers in the EA
to continue the coordination with tax authority to improve the quality of 720 Form
Goingforward

10
CONCLUSIONS
STATISTICS DEPARTMENT
Using a MIRROR APPROACH allows compilers to increase the quality of selected instrument types and to collect missing data on others
Using the TAX AUTHORITIES´ INFORMATION (720 Form) is alsouseful for supplementing the estimation
Working towards a more REGULAR, REALISTIC and ASSESSEDestimation of official statistics rather than research-type studies
The effectiveness of this methodological framework relies on theavailability of GRANULAR INFORMATION. Significantly increased
Going forward, to continue working on DATA-SHARING initiatives, exchanging bilateral data

11
“YOU CAN DO WHAT I CANNOT DO, I CAN DO WHATYOU CANNOT DO.
TOGETHERWE CAN DO
GREAT THINGS”
STATISTICS DEPARTMENT
Teresa of Calcutta

1/1
IFC Conference on external statistics "Bridging measurement challenges and analytical needs of external statistics: evolution or revolution?", co-organised with the Bank of Portugal (BoP) and the European Central Bank (ECB)
17-18 February 2020, Lisbon, Portugal
Measuring digital trade in bop – a supplementary estimate of private households’ digital purchases using internet data1
Annette Meinusch and Benny Hessel,
Deutsche Bundesbank
1 This presentation was prepared for the meeting. The views expressed are those of the authors and do not necessarily reflect the views of the BIS, IFC, BoP, ECB or the central banks and other institutions represented at the meeting.

Measuring digital trade in bop 1
Measuring digital trade in bop - A supplementary estimate of private households' digital purchases using internet data
Annette Meinusch and Benny Hessel1
Abstract
As digitalisation progresses, a variety of digital goods and services such as app pur-chases, streaming subscriptions and online games have become more and more im-portant for international trade. These direct micro-transactions between businesses and consumers (B2C) have to date found little recognition in official statistics. As costs for them typically fall below national reporting thresholds, data gaps occur both in the national accounts and in the balance of payments statistics. To the best of our knowledge, this paper is the first to illustrate a step-by-step procedure to compile digital micro-transactions from a balance of payments point of view under the change of ownership principle using freely available internet data. Following the definitions of digital trade provided by the OECD, WTO and IMF handbook on ''Measuring Digital Trade'', we use freely available internet data to establish a bottom-up approach and break down the market of digitally traded services into five market segments in order to identify and quantify imports of German private households. The chosen approach turns out to be an appropriate and flexible procedure not only for closing the data gaps in external statistics, but also for taking into account novel market trends and changing user needs in a timely manner. The final results show that digital purchases certainly contribute € 7.4 billion to service imports in 2019 in the balance of payments in Germany.
Keywords: balance of payments, external trade, digital trade, international trade in services statistics, digitalisation
1 This paper is based on a common project by the National Statistical Office (Destatis) and the Deutsche
Bundesbank (bop section) which was launched in November 2018. The authors wish to thank Jens Walter for helpful comments.

2 Measuring digital trade in bop
Contents
Measuring digital trade in bop - A supplementary estimate of private households' digital purchases using internet data ...................................................................................... 1
1. Introduction ....................................................................................................................................... 3
2. Conceptual framework .................................................................................................................. 4
3. Estimation model ............................................................................................................................. 4
3.1 Video-on-demand ................................................................................................................ 5
3.2 Digital audio content ........................................................................................................... 6
3.3 Buying and using software ................................................................................................ 7
3.3.1 Mobile applications (incl. games) for smartphones and tablets .......... 8
3.3.2 Video games for PC/games consoles as well as online or browser games ........................................................................................................................ 11
4. Gambling .......................................................................................................................................... 13
5. Cloud services ................................................................................................................................. 14
6. Final results ...................................................................................................................................... 15
7. Conclusions ...................................................................................................................................... 16
References ................................................................................................................................................ 18

Measuring digital trade in bop 3
1. Introduction
Growing digitalisation is widely affecting international trade as it not only creates new opportunities for businesses to sell their products to broader markets, but also pro-vides customers around the world access to completely new services, such as stream-ing services, online games, apps for smartphones or cloud services.
These B2C transactions, i.e. direct transactions between businesses and consum-ers, have to date found little recognition in both the national accounts and the bal-ance of payments (bop) statistics, not least because such micro-transactions often fall below German reporting thresholds.2 On the business side, reporting thresholds might be of minor relevance as they are typically surpassed by business to business (B2B) transactions. However, in the case of services consumed by households, those transactions most probably lead to data gaps which have to be closed to follow in-ternational concepts such as the BPM6 (Balance of Payments and Investment Position Manual Sixth Edition) or the 2008 SNA (The System of National Accounts, 2008) to include all transactions made between resident entities and the rest of the world.
The work described in this paper aims to fill these data gaps. To the best of our knowledge, this paper is the first to illustrate a step-by-step procedure to compile digital micro-transactions from a balance of payments point of view under the change of ownership principle using freely available internet data.3
In an effort to develop a better understanding of which sales are generated through digital trade in Germany, a bottom-up approach was established to identify and quantify private households' international digital purchases. The approach is fo-cused on the debit side, i.e. on purchases by German private households' abroad. Although, to some extent, a potential under-reporting of micro-transactions on the credit side might be of relevance as well. However, this data gap is considered to be significantly lower than on the debit side, as the number of German providers of dig-ital services such as video-on-demand or online games is rather limited.
The remainder of this paper is organised into four sections. Section two gives a brief overview of the relevant definitions, the conceptual framework following the OECD, WTO and IMF handbook on ''Measuring Digital Trade'' as well as the working definition of digital trade used in this paper, while section three describes the estima-tion model on private households' digital purchases in detail and discusses the main data sources that were used. Section four summarises the results for Germany iden-tified in the relevant market segments, whereas section five holds the concluding re-marks and considers some future steps.
2 The legal basis is provided by Section 11(2) of the Foreign Trade and Payments Act (Außen-
wirtschaftsgesetz – AWG) and, building on this, Sections 67 et seq. of the Foreign Trade and Payments Regulation (Außenwirtschaftsverordnung – AWV).
3 In October 2017 Statistics Denmark presented a similar approach at the Expert Group Meeting on Measuring Digital Trade using NGO data and splitting the online market into five categories (Burman and Khalili (2018)).

4 Measuring digital trade in bop
2. Conceptual framework
The estimation model is based on the OECD, WTO and IMF handbook on ''Measuring Digital Trade''. The handbook aims to provide a conceptual framework to define dig-ital trade on the one hand, and a mechanism to bring together and share existing national and international efforts on measuring digital trade and/or dimensions of it that could be used to identify and develop best practices on the other hand. Although it has not yet been finalised, as it is considered to be a living document that will be continuously updated as measurement practices mature, a first version was published in December 2019 in which basic definitions have been already developed.
The handbook adopts a statistical definition of digital trade based on the nature of transaction, and not so much on the nature of the product traded. It defines digital trade as the share of current cross-border trade in goods and services that has been digitally ordered and/or digitally delivered.4 Equally, because of the considerable in-terest in understanding who is engaged in digital trade as well as of the relevance for the balance of payments, information on the actors is also needed.
That being said, it is crucial to mention that the estimation model described in the following is limited to a specific part of digital trade, as it is not able nor should it be able to estimate digital trade in its broad definition as outlined in the handbook. It focuses on services (product dimension) that were delivered via digital channels (digitally delivered or platform enabled) by foreign enterprises to resident private households (actors). In other words, it aims to estimate all digitally delivered con-sumption-related sales generated by households i.e. micro-transactions that fall be-low any national exemption threshold and are thus not subject to reporting require-ments for international trade (for instance, a subscription to a video-on-demand ser-vice). Therefore, goods or services that are purely digitally ordered (e-commerce transactions5) are not considered here, even though they might be under-reported in external statistics as well (de minimis trade).6
3. Estimation model
Following a bottom-up approach, the estimation model in this paper breaks down the market for digitally traded services into categories or so-called market segments. By the time the paper is published, five (major) categories will have been identified: video-on-demand, digital audio content, buying and using software, gambling, and cloud services.
4 It is shown in the handbook that all digitally intermediated transactions (by intermediation platforms)
are included in one or both of digitally ordered and digitally delivered, yet they are separately iden-tified in the framework.
5 According to the OECD definition, e-commerce is defined as follows: '’An e-commerce transaction is the sale or purchase of a good or service, conducted over computer networks by methods specif-ically designed for the purpose of receiving or placing orders.'’ OECD Guide to Measuring the Infor-mation Society, 2011
6 For further information on the conceptual framework of digital trade that goes beyond what is de-scribed in this paper, please see the handbook.

Measuring digital trade in bop 5
For two reasons, it was decided to concentrate on those above-mentioned mar-ket segments. First, they are expected to be the most significant segments when it comes to household demand in terms of digital services. Second, it seemed more promising and practicable to gather information for those segments than for others such as digital matching platform fees or e-learning services.
The chosen approach turns out to be an appropriate and flexible procedure for closing the data gaps in external statistics. It is considered to be flexible in the sense that, on the one hand, new categories such as e-learning etc. can be considered, re-searched and included anytime while, on the other hand, outdated categories can be excluded quickly and easily whenever necessary.
The estimation of digital trade is basically carried out as a two-step procedure: In a first step, sales are researched and assessed individually per category. This was done by the identification of gross consumer spending for each category and/or sub-category since 2013. In a second step, those sales of relevance to the balance of pay-ments and national accounts were determined by adjusting for resident service pro-viders. In some special cases a third step was necessary in which figures were further manually adjusted due to various reasons such as double-counting or stationary sales.
In the following, the main data sources for each segment as well as a step-by-step guide are presented in more detail.
3.1 Video-on-demand
Video-on-demand (VoD) is a system that allows viewers to request immediate access to video content of their choice and watch it at a convenient time on any device suit-able for playing videos such as PCs, TVs or smartphones and tablets etc. VoD provides a wide menu of available videos including feature films, sports, entertainment, and educational programmes from which to choose. Typically, user access is provided by a subscription to basic content as well as the ability to purchase additional premium viewing. VoD essentially encompasses three different business models:
• Subscription Video-on-Demand (SVoD) - access is granted through the pur-chase of a periodic subscription
• Transactional Video-on-Demand (transaction-based VoD or TVoD) - providers grant paid access to video content that is limited by time or number of views
• Electronic Sell-Through (EST) - users pay a one-time fee to download a video or for on-demand access with no limits on time or number of views, similar to the purchase of a DVD or blu-ray.
Estimates for this market segment are based on a study carried out by the market research institution Gesellschaft für Konsumforschung (GfK) on behalf of the German Federal Film Board (FFA) (Bundesverband Audiovisuelle Medien e. V. (2016)). The questionnaire was completed in writing (around 80 % online, around 20 % paper and pencil), in the form of a diary kept by panel participants. As the sample size was sur-prisingly high for digital formats (n=28,903), the results are considered to be reliable. Further, it is expected that a potential recall bias should be less pronounced as people are probably more likely to remember video-on-demand consumption than other

6 Measuring digital trade in bop
micro-transaction such as in-app purchases. The study puts total sales for video on demand services at around €0.77 billion in 2017.
As the video-on-demand segment is home to both resident and non-resident enterprises, an adjustment for transactions incurred in business with domestic enter-prises is necessary. In this context, a useful data source was a study conducted by Goldmedia, a German strategic consultancy firm in the field of media and telecom-munications. The survey has a sample size of n=2058 (Goldmedia, 2016) and provides information about the video portals used by German households where only paid film and series on demand providers were assessed (data as at April 2016). In Germany, the VoD market is (still) slightly dominated by resident VoD providers. The share of German paid VoD providers comes to roughly 62%. This considerably large propor-tion is due to the fact that in addition to ''traditional'' German providers well known foreign providers established German branches. In consequence, transactions with them have to be considered as resident-to-resident transactions and are thus not relevant for the balance of payments.
Due to the lack of detailed information, the share of resident paid VoD providers is assumed to remain steady over time. This is admittedly an ambitious assumption for what is still an emerging market - Netflix, for instance, has only existed since 2015, while other foreign providers have vanished from the market (e.g. Lovefilm and Watchever). Hence, the share of resident VoD providers should be observed contin-uously and should be adjusted as new information become available.
Given a market volume of €0.77 billion in 2017 and taking into account that 62% of sales within this segment are generated by resident VoD providers lead to sales of €0.29 billion that are relevant to the balance of payments. The calculated time series from 2013 to 2017 before and after the adjustment for resident service providers is shown in table 1.
Adjusted and non-adjusted sales in the VoD segment from 2013 to 2017. In € bn. Table 1
Sales, according to GfK study Sales, non-resident
2013 0.120 0.046
2014 0.150 0.057
2015 0.423 0.161
2016 0.545 0.207
2017 0.768 0.292
3.2 Digital audio content
The digital audio content segment is very heterogeneous in terms of both how prod-ucts are consumed (downloads of tracks, albums, music videos or audio streaming) and who provides them. Hence, it is worth basing the estimates on user behaviour. A paper prepared by the federal music industry association (Bundesverband der Mus-ikindustrie, 2017) shows in detail how music industry sales evolved from 1984 up to 2016. This paper is itself based on a study carried out by GfK Entertainment.

Measuring digital trade in bop 7
This survey puts digital music sales at €0.604 billion for 2016. Price Waterhouse Coopers (PwC) forecasts (on the basis of the above mentioned study) a figure of €0.741 billion for 2017 (Price Waterhouse Coopers, 2018). Alongside traditional music downloads, this number also includes audio streaming, real tones and digital audio books.
In terms of market structure, the digital audio content segment deviates signifi-cantly from the video-on-demand segment discussed in the previous section. In con-trast to the aforementioned segment, it is dominated by non-resident service provid-ers. Resident providers only play a minor role when it comes to services of digital audio content. Information on the share of resident providers for which the total sales need to be adjusted comes from a study carried out by Statista. Statista is a German online portal for statistics, that provides access to data collected by market and re-search institutes or derived from the economic sector and official statistics. Based on a 2017 survey, only around 10% of sales from digital audio content are generated by German providers (Statista, 2017). Though the sample size (respondents who have paid for digital audio content over the past 12 months) is relatively small at n=642, the results do indicate the dispersion across providers and countries. In Germany, there exist only two resident digital audio content service providers, the above esti-mate appears therefore to be dependable.7 In summary, around 90% of the sales calculated for 2017 are relevant for the balance of payments, equating to a figure of around €0.637 billion. Time series estimates are taken from the GfK survey mentioned above, from which information is available on how digital audio content purchases have evolved since 2008. The study results are adjusted for sales by domestic provid-ers. Again, it is assumed that the share of resident providers remains steady over time. Once better data become available, a time-variant share should be assumed as the assumption made here is quite restrictive.
In summary, 90% of the sales calculated for 2017 (€0.741 billion) are relevant to the balance of payments, equating to a figure of around €0.667 billion.
3.3 Buying and using software
Buying and using software is a market segment that involves a wide range of differ-ent services that need to be considered by balance of payments and national ac-counts compilers. Hence, from a practical point of view it is appropriate to separate it into two subcategories.8
1. Mobile applications (incl. games for smartphones and tablets);
2. Video games for PC / games consoles as well as online browser games
This differentiation constitutes a simplified way to deal with the variety of digital services included in this segment.
7 A list of digital audio content providers operating can be found here: http://www.musikstreaming-
dienste.net 8 It must be mentioned here that a third category, ''system and office software'' needs to be identified.
The model will be updated once data for this category become available.

8 Measuring digital trade in bop
3.3.1 Mobile applications (incl. games) for smartphones and tablets
Mobile applications, most commonly referred to as apps, are built to run on a mobile device such as a smartphone or tablet for a specific platform, e.g. iOS for Apple's iPhones or Android for various other smartphone providers. They serve to provide users with downloadable application software similar to services accessed on PCs. Purchases of mobile apps via smartphones or tablets by households are typically mi-cro-transactions that are neglected in external statistics due to high reporting thresh-olds. However, they can be estimated based on sales in the relevant app stores. Ac-cording to Gartner, Inc., which has established itself as a market leader in the field of research and advisory engagements (Gartner, Inc., 2018), the only operating systems of relevance to smartphones and tablets are iOS and Android.9
Data for the mobile applications segment come from App Annie, an app market data provider. Only freely available data published on their homepage were used. By knowing the 2017 global gross consumer spending in the Apple App Store, which was US $41 billion, in the Google Play Store as well as in third-party Android stores (e.g. Amazon App Store), which was US $40 billion, global market shares were calcu-lated for the Apple App Store on the one hand and all Android Stores in total on the other hand (App Annie, 2018a).10 Thus, Apple's App Store accounts for a global mar-ket share of 50.6%, whereas Android Stores make up for 49.4% of global app market sales.
Sales on the German app market were also taken from an App Annie market study. They are given as US$ 1.4 billion for 2017 or €1.17 billion (App Annie, 2018b). But as detailed information on German market shares of Apple and Android in Ger-many are not available, it is assumed that the global market shares of both app stores are equivalent to their market shares in Germany. The distinction between operating systems is crucial as both Android stores and the Apple App Store offer third-party apps. This refers to apps that are not developed and marketed directly by, e.g., Google or Apple, but are produced by publishers that merely offer their apps for sale in the respective stores.
Payments are generally made to the store operator regardless of whether the app being purchased is a third-party app or not. The store operator will then pay these revenues minus their commission (commonly known as the transaction fee) to the publisher.
In a first constellation (own store/own app), the contractual relationship is clear, as the contractual party is always the App store provider. But things are different for third-party apps (own store/third-party app), whose publishers use the app stores as a sales platform. Neither Google (Google, 2019) (as the biggest app store platform operator under Android) nor Apple (Apple, 2019) unambiguously clarify the contrac-tual relationship in their terms of use. However, the general consensus is that pur-chasing a third-party app gives rise to a contractual relationship between the end consumer and the third-party provider in the Google Play Store (by assumption, this
9 The Microsoft Store creates a degree of opacity. It can be accessed both via a desktop computer or
a notebook as well as via a Windows phone. However, the Windows operating system is of virtually no relevance to 2017.
10 These figures include the prices of the apps as well as subscriptions for media streaming, news and dating apps, which are routed through the app stores’ sales channel. They also include in-app pur-chases.

Measuring digital trade in bop 9
also applies to the other Android app stores such as Amazon). As such, app stores can therefore be regarded as sales platforms and third-party publishers could be res-ident publishers. When it comes to Apple, this general consensus in terms of third-party apps does not apply. This is because Apple, by checking and releasing any apps it offers, has material control over all content, advertising and technical content and thus becomes the contractual party regardless of which app was purchased by a res-ident household.11
That being said, it must be clarified what percentage of app revenues generated in the Android Stores is relevant to external statistics by establishing the share of resident app publishers. According to a list of the top 20 Android app publishers in Germany in 2015, some 7% of revenues are generated by German publishers.12 In contrast, statistics on the most successful publishers of games in the Google Play Store of September 2018, show that around 5% of revenues are generated by German providers (Statista, 2018a). It is assumed, that those shares most probably will under-estimate the true values as all studies focus on the most successful publishers. For lack of a better estimator, the percentage of German publishers in Android stores in Germany is initially estimated to be 10%.
Thus, the estimated €1.17 billion must consequently be corrected by €0.0578 bil-lion. For 2017, this sub-category shall be estimated to have generated sales of €1.11 billion.
To capture developments in sales over time, we use information on sales via app stores coming from a Bitkom study (Bitkom, 2018).13 As this data source includes in-formation on sales for advertisements, it diverges from data provided by App Annie. Thus, only the growth rates as per the Bitkom study are applied to the sales figure calculated above. This is possible as the assumption is made that the percentage of German publishers in the app market remains constant over time.
After the adjustment for resident services providers, a further adjustment in the mobile applications segment is needed. This next step is crucial in order to avoid double counting of services that were purchased on mobile devices and whose sales were routed and billed via Android Stores or the Apple App Store.
If, for example a video-on-demand subscription is concluded via an app store, revenues are booked via the store and are part of the revenue figures for mobile applications for smartphones and tablets calculated here in the mobile applications segment. However, they are also included in the video-on-demand segment data. Hence, a decision must be made as to where the corresponding sales should be in-cluded.
Within the balance of payments, spending on this subscription should, however, be exclusively booked under video-on-demand. This is because it seems more rea-sonable to remove the corresponding transactions in the mobile application segment where they are considered to be in-app purchases and to leave them in the video-on-demand segments where their true nature as a video-on-demand service is taken
11 https://rickert.net/blog/vertragliche-beziehungen-beim-kauf-von-apps 12 https://omr.com/de/app-publisher-umsatz-ranking 13 The market research company research2guidance was entrusted with this study on behalf of Bitkom.

10 Measuring digital trade in bop
into account. The adjustments made are specific to all three video-on-demand busi-ness models described in section 3.1.
In the case of TVoD or EST, then, these are films which can be hired or ordered directly in an app on a smartphone or tablet. As for SVoD, these are subscriptions which are taken out and paid for directly in an app (Netflix, for example, can be sub-scribed to via a number of channels.14) As these transactions can constitute both, video-on-demand services as well as digital audio content services, corrections in the mobile applications segment for both market segments are necessary.15
Since the information needed for a robust estimation is lacking, just a very rough estimate can be made using the only data that are available. Indications are provided by a number of monthly statements published on Statista, which have been calculated by Priori Data, a provider of app market data (Statista, 2008b-c). These monthly state-ments show the top 10 grossing apps in Germany in each app store. In the Google Play Store (which we consider representative for all Android stores) there were no video-on-demand providers in the top 10 list in October 2018, which implies that a video-on-demand provider must have grossed less than US $1.1 million monthly. This equates to roughly €0.92 million.16 In the Apple App Store, Netflix shows up in the top 10, once with a figure of €1.42 million for October 2018 and with €0.92 million for January 2018. From this information, average monthly sales are calculated that are grossed up to annual sales.
Netflix, as the only video streaming subscription service which could be bought and paid for directly in the smartphone app before January 2019, will probably have registered average monthly sales across both app stores in 2018 of €1.08 million, which equates to annual sales of €13 million. Measured in terms of total sales of video-on-demand services (i.e. EST + TVoD + SVoD) relevant to the balance of pay-ments, in the amount of €0.29 billion, this represents an adjustment of around 4.5% for the SVoD segment. The exact calculation is shown below in more detail for all three video-on-demand business models.
correction business model i = annual sales of business model i routed trough app stores (€ bn)
total annual sales in video-on-demand in (€ bn)
with i = SVoD, EST + TVoD.
The correction factors for EST and TVoD need to be determined as well. Sales relevant for the balance of payments for 2017 are made up of roughly 35% from individual sales (EST) and time-limited hires (TVoD), and 65% from streaming service subscriptions (SVoD). It is assumed that those shares are also equivalent to the video-on-demand sales that are paid for exclusively via the app stores. In this case, the cal-culated annual sales figure of €13 million for SVoD equates to 65%. This means that corrections still need to be made for 35% of sales (TVoD and EST), i.e. by an amount of €7 million, corresponding to roughly 2.4% of video-on-demand sales that are rel-evant to the balance of payments.
14 Since January 2019 the subscription to Netflix and Spotify (Music on demand) is no longer possible
via Apples App store. Thus, this adjustment will not be necessary in future data updates. 15 Corrections for the audio content services will be included in the next data update. 16 Exchange rate series from the Deutsche Bundesbank database: BBEX3.M.USD.EUR.BB.AC.A01

Measuring digital trade in bop 11
In total, then, the sales included in the ''mobile applications (including games) for smartphones and tablets'' segment that are relevant to the balance of payments are reduced by 4.5% for SVoD and 2.4% for EST and TVoD to avoid double counting due to sales already included in the video-on-demand segment.
A time series for the necessary corrections is estimated based on information from the GfK study cited in 3.1. This study publishes sales generated with digital for-mats since 2013. The results are adjusted for sales by resident providers (62%). Data on subscriptions to video streaming services have only been collected since 2015. Therefore, the corrections in the mobile applications segment up until 2015 comes to 2.4% (individual sales and hires of moving image content billed via one of the two app stores), whereas the addition corrections for SVoD of 4.5% are made as of 2015.
3.3.2 Video games for PC/games consoles as well as online or browser games
A suitable source for determining which sales of video games for PC and games con-soles as well as online and browser games are of relevance to the balance of payments is the association of the German games industry (game – Verband der deutschen Games-Branche)17. The figures it publishes are based on the GfK Consumer Panel, in which a sample of 25,000 persons are asked about their spending habits.
Overall, spending on video games amounted to around €2.4 billion in 2017. Purchases of games for mobile phones, smartphones and /or tablets are described as micro transactions in which the individual transactions generate only minimal revenues, but these add up to significant sales in aggregate. The same holds for in-app purchases. As sales for apps and in-app purchases (where relevant to the balance of payments) were calculated in section 3.3.1, in-app purchases must now be deducted from the sales figures for this category. It is assumed that the sales data on the purchase of apps and in-app purchases to the tune of some €14.1 million as published by game underestimate actual turnover. This is due, in particular, to the fact that those sales only represent one specific genre of apps, namely game apps, whereas data in the mobile applications apps encompass all genres in total. Further, it is expected that there might be a pronounced recall bias in this category of games. Eliminating in-app purchases is largely unproblematic for the years 2014 to 2017, as game publishes the relevant data in its annual reports.
Sales of video games for PC and games consoles as well as online and browser games excluding the purchase of apps or in-app purchases are listed in the following table. It shows that sales in the German games market rose from €1.6 billion in 2014 to around €1.9 billion in 2017.
17 www.game.de

12 Measuring digital trade in bop
Sales in the German games market In € bn Table 2
2014 2015 2016 2017
Sales 1.63 1.68 1.72 1.89
Sources: game – Verband der deutschen Games-Branche (2018)
Following the procedure in the other market segments, those sales need to be identified that represent a transaction between residents and non-residents and are therefore relevant to the balance of payments. As before, only games provided digi-tally will be considered, not those acquired on physical data carriers. The following table shows the percentage of downloads.
Share of downloads in German game sales In percent Table 3
2012 2013 2014 2015 2016 2017
Share of downloads 9% 11% 19% 21% 27% 29%
Sources: game – Verband der deutschen Games-Branche (2018)
According to the game association's annual report, German games develop-ments made up a share of sales of 𝜋𝜋=5.4% in 2017.
Share of sales from German games developments In percent Table 4
2014 2015 2016 2017
Share of sales π 6.9% 6.5% 6.4% 5.4%
Sources: game – Verband der deutschen Games-Branche (2018)
Sales of relevance to the balance of payments, i.e. sales of international games developments on the German games market and therefore spending by German con-sumers on international video games, can now be calculated using the following for-mula:
Sales of international games developments = Sales in the Germany games market × (1-π) on German games market This yields the following data in terms of games market sales of relevance to the balance of payments.

Measuring digital trade in bop 13
Sales in the games segment of relevance to the balance of payments In € m Table 5
2014 2015 2016 2017
Sales in BOP 589 690 812 995
Sources: game – Verband der deutschen Games-Branche (2018)
4. Gambling
Since 2014 the state governments’ gambling supervisory authorities publish annual reports that include benchmark figures for the German gambling market, private online sports and horse racing betting, online casino games, online poker and online secondary lotteries.
Gross gambling revenues of non-resident providers from German customers In € m Table 6
2012 2013 2014 2015 2016 2017
Sales 418 1,673 1,746 2,270 2,558 3,284
Sources: State governments’ gambling supervisory authorities annual reports
Data for 2013-2016 on gross gambling revenues with non-residents, calculated as gross stakes minus winnings paid out, which corresponds to German expenditure on gambling, was taken from the annual report (Glückspielaufsichtsbehörden der Länder (2018)). The figures for 2017 are calculated by projecting the 2016 figure at the rate of change in tax revenues from bettings and lotteries, as shown in the statis-tics on tax revenues provided by the Federal Statistical Office. The time series begins with the second half of 2012, thus the figure for 2012 is estimated to be 1/4 of the annual figure for 2013.This explains the significant rise in values from 2012 to 2013.
Since the gross gambling revenues already represent sales by non-resident pro-viders to German customers, they are generally relevant to the balance of payments. However, gross gambling revenues also include a portion of sales that is generated not online but at a gambling outlet (particularly in the case of sports and horse racing betting). As the annual reports indicate, this share was around 23% in 2014, around 19% in 2015, and around 20% in 2016. The annual share of sales generated in gam-bling outlets is assumed to remain relatively constant, including in the years in which it is not known. The mean of the 2014, 2015 and 2016 figures (21%) is therefore shown used. This results in the amounts shown in table 7.

14 Measuring digital trade in bop
Gross gambling revenues in the gambling segment relevant to the balance of payments
In € m Table 7
Gross gambling revenues gambling outlets and online
Share at gambling outlets in % Gross gambling revenues online only
2012 418 21% 330
2013 1,673 21% 1,322
2014 1,746 23% 1,344
2015 2,270 19% 1,839
2016 2,558 20% 2,046
2017 3,284 21% 2,594
Sources: State governments’ gambling supervisory authorities annual reports
5. Cloud services
Cloud services are typically offered globally by a service provider to multiple custom-ers through the internet. They include a wide range of IT services that traditionally are hosted in-house, e.g. storage space or accessing software and applications directly from the web without the need of a prior installation.
Not only enterprises but also households purchase IT storage space in clouds for hosting websites or for back-up data on a variety of devices. However, in most cases, households get a certain amount of free storage space free of charge from their in-ternet provider. Only those requiring more storage capacities usually have to pay.
To calculate household purchases of storage space, a model was developed based on quarterly data from the survey on the private use of information and com-munication technologies ICT survey carried out by the Federal Statistical Office (2018). This survey collects data on the private facilities and use of state-of-the-art infor-mation and communication technologies, in particular on computers and the internet and also on cloud users. From this data source the number of internet users and the share of German cloud users were used. As the ICT survey only provides information on the number of internet users for the first quarter of each year, figures were allo-cated to the other quarters by interpolation. In a next step, they were multiplied by the share of cloud users to calculate the number of German cloud users as shown in table 8 exemplarily for the years 2016-2017.
For the share of cloud users, only information between 2016 and 2017 was avail-able. Thus, it was assumed that the share was following a constant positive trend.

Measuring digital trade in bop 15
Number of internet and cloud users in Germany In thous. Table 8
Q1 2016 Q2 2016 Q3 2016 Q4 2016 Q1 2017 Q2 2017 Q3 2017 Q 2017
Number of internet users 61,970 62,311 62,140 62,651 62,651 63,094 63,538 63,981
Share of cloud users in % 23% 24% 26% 27% 28% 29% 30% 31%
Number of cloud users 14,253 15,069 15,889 16,714 17,542 18,297 19,061 19,834
Sources: Federal Statistical Office (2018)
Research has discovered two things: first, storage capacities of different sizes are free of charge, depending on the provider; and second, many internet providers are domiciled in Germany. This is why it is assumed that around 5% of cloud users do indeed purchase storage space from abroad. Prices for storage space as shown in table 9 were calculated by analysing cloud service providers’ websites .
Quarterly average prices for cloud services in Germany In € Table 9
Q1 2016 Q2 2016 Q3 2016 Q4 2016 Q1 2017 Q2 2017 Q3 2017 Q 2017
Price per quarter 61 61 61 61 60 60 60 59
Sources: Federal Statistical Office (2018) / own calculations
All in all, this volume/price model produces the following time series:
Results of volume/price model on purchases of cloud services by German customers In € m Table 10
Q1 2016 Q2 2016 Q3 2016 Q4 2016 Q1 2017 Q2 2017 Q3 2017 Q4 2017
Cloud purchases abroad 43 45 47 49 52 54 56 58
Sources: Federal Statistical Office (2018) / own calculations
6. Final results
All researched sales figures from the previous sections are summarised in table 11. For 2018 and 2019 the figures shown are calculated based on the year-on-year growth rate from 2016/2017. This is an appropriate way in light of the current spell

16 Measuring digital trade in bop
of growth in digital trade and the market segments under observation. However, if the market became saturated in the future, this straightforward approach would re-sult in the figures being overstated. This is why the sales figures should be revisited and adjusted as necessary in the future.
Sales in all market segments of relevance to the balance of payments In € bn
Table 11
2014 2015 2016 2017 2018 2019
Mobile Applications 0.674 0.946 1.070 1.104 1.139 1.174
Video-Games 0.589 0.690 0.812 0.995 1.219 1.443
Video-on-demand 0.057 0.161 0.207 0.295 0.412 0.532
Digital Audio Content 0.317 0.416 0.516 0.634 0.779 0.924
Gambling 1.344 1.839 2.016 2.594 2.824 3.055
Cloud Services 0.123 0.155 0.184 0.218 0.258 0.299
TOTAL 3.104 4.207 4.835 5.837 6.632 7.427
The 2018 and 2019 sales relevant to the balance of payments are calculated as in the following:
Sales2018/2019 = Sales2017 × Sales2017 - Sales2016
Sales2016 + Sales2017 .
This formula disregards very strong past growth rates. For the time being, only the growth from 2016 to 2017 is carried over to 2017 - 2018 and to 2018 - 2019. For the gambling segment, the 2017 figure is already an estimate by the Federal Statistical Office, which is why the growth from 2015 to 2016 is carried over to 2017 - 2018.
7. Conclusions
Increasing sales in international digital purchases have made it necessary to fill po-tential data gaps that occur in external statistics due to high national reporting thresholds. In this paper, it is shown how the digital market in Germany is classified into several market segments, which data sources are used to estimate yearly sales, and which adjustments were necessary to compile a supplementary estimate of pri-vate households' digital purchases for the balance of payments. The following con-clusions and recommendations are made as a result of the study:
First, a bottom-up approach delivers a proxy for service debits of households which are provided via the internet. The figures obtained using this method provide an initial indication of the scale and dynamics. As the market for digital services might be very heterogeneous across countries, this procedure seems to be sufficiently flex-ible to account for any country specifics.

Measuring digital trade in bop 17
Second, the estimation model is easily expandable, as the implementation of fur-ther categories or subcategories such as platform fees or e-learning services can be realised as soon as reliable information is available. Likewise, outdated categories can be excluded when appropriate.
Third, extensive research has identified the main data sources for the first five most relevant market segments in Germany, which very much simplifies data updates in the future.
A further way to proceed forward is to give up the assumptions of time invariance that were taken advantage of in many market segments. This step would increase considerably the quality of the estimates described.
The advantage of using freely available internet data is that data gaps in the official statistics can be closed quickly and cost-effectively. However, there are also a number of disadvantages. For instance, there is a risk that the data provider in ques-tion will stop producing the data or stop making them available to the public. In ad-dition, checking the quality of internet data is not necessarily a simple process, since most of the information is taken from the results of surveys that were not carried out by official bodies. Besides this, some of the information is only available with a time lag of several years, meaning that the data need to be extrapolated to the current end.
Added to this is the fact that the data that are freely available at present do not meet all the requirements of the balance of payments. They are not broken down by country, for example. Initial analyses show that a country structure of digital pur-chases cannot be identified on the basis of the current data sets. For this reason, the estimated sales are shown under the item “countries not identified”. Developing an appropriate method for breaking digital purchases down by country is a task that still needs to be tackled.
This project should be seen as a first step to better measure internet induced
micro-transactions in the balance of payments. It forms one piece of work to provide data on digital trade according to the definitions of the OECD, WTO and IMF hand-book. It should therefore be clear, if digital trade statistics encounter growing interest from users, a cooperation with the data providers will play a key role in overcoming these challenges.

18 Measuring digital trade in bop
References
App Annie (2018a). App Annie Market Forecast 2016-2021, retrieved, December 2018, from http://go.appannie.com/report-app-annie-market-forecast-2017.html —— (2018b). App Annie Market Forecast 2017-2022, retrieved, December 2018, from https://s3.amazonaws.com/files.appannie.com/reports/1805_Report_2022_Fore-cast_EN.pdf Apple (2019). Bedingungen der Apple Media Services, retrieved January, 2019, from https://www.apple.com Bitkom (2018). App Store feiert Geburtstag – App-Umsatz auf Rekordhoch, retrieved December, 2018, from https://www.bitkom.org Bundesverband Audiovisuelle Medien E.V. (2016). Der Home Video Markt im Jahr 2016, retrieved December, 2018, from https://www.bvv-medien.org/fileadmin/u-ser_upload/businessreports/JWB2016.pdf Bundesverband Musikindustrie (2017, November 11). Musikindustrie 2016 in Zahlen, retrieved December, 2018, from http://www.musikindustrie.de/fileadmin/bvmi/up-load/02_Markt-Bestseller/MiZ-Grafiken/2016/BVMI_ePaper_2016.pdf Burman, S. and Khalili, J.S. (2018). Measuring Import of Digitally Enabled Services to Private Consumers. Statistics Denmark. game – Verband der deutschen Games-Branche (2018). Database Gartner, Inc. (2018). Gartner says worldwide sales of smartphones recorded first ever decline during the fouth quarter of 2017, retrieved December, 2018, from https://www.gartner.com/en/newsroom/press-releases/2018-02-22-gartner-says-worldwide-sales-of-smartphones-recorded-first-ever-decline-during-the-fourth-quarter-of-2017 Glückspielaufsichtsbehörden der Länder (2018). Jahresreport 2016 der Glückspielauf-sichtsbehörden der Länder, retrieved December 2018 from https://innen.hes-sen.de/sites/default/files/media/hmdis/jahresreport_2016_0.pdf Goldmedia (2016). Amazon dominiert die Pay-VoD-Nutzung in Deutschland – Netflix etabliert sich als Nr. 2, retrieved February, 2018, from https://www.goldme-dia.com/fileadmin/goldmedia/2015/Studien/2016/VoD/160705-Gra-fik_Pay_VoD_Nutzung_2016_Angebote_Goldmedia_.jpg Google (2019). Google Play-Nutzungsbedingungen, retrieved February 2019, from https://play.google.com/intl/de_de/about/play-terms.html OECD / WTO (2020). Handbook on measuring digital trade. Version 1.
Online Marketing Rockstars (OMR), retrieved January, 2019, from https://omr.com/de/app-publisher-umsatz-ranking.

Measuring digital trade in bop 19
Rickert.net. retrieved January, 2019, from https://rickert.net/blog/vertragliche-bezi-ehungen-beim-kauf-von-apps. Price Waterhouse Coopers (2018). Nach dem Streaming kommt die Blockchain: Hype oder echte Chance für die Musikindustrie, retrieved January, 2019, from https://www.pwc.de/de/technologie-medien-und-telekommunikation/blockchain-in-der-musikindustrie.html Statista (2018a). Ranking der erfolgreichsten Publisher von Spiele-Apps im Google Play Store nach Umsatz in Deutschland, retrieved November, 2018, from https://de.statista.com/statistik/daten/studie/513226/umfrage/umsatz-der-publis-her-von-android-apps-in-deutschland/https://de.statista.com —— (2018b). Ranking der erfolgreichsten Apps im Google Play Store nach Umsatz in Deutschland, retrieved November 2018 and January 2019, from https://de.sta-tista.com/statistik/daten/studie/689054/umfrage/apps-im-google-play-store-nach-umsatz-in-deutschland/ —— (2018c). Erfolgreichste iPhone Apps nach Umsatz in Deutschland, retrieved Oc-tober, 2018 and January 2019, from https://de.statista.com/statistik/daten/stu-die/689054/umfrage/apps-im-google-play-store-nach-umsatz-in-deutschland/ —— (2018d). Umsatz der Publisher von IOS Apps in Deutschland, retrieved Novem-ber, 2018, from https://de.statista.com/statistik/daten/studie/513099/umfrage/um-satz-der-publisher-von-ios-apps-in-deutschland/ —— (2017). Umfrage in Deutschland zu beliebten kostenpflichtigen Anbietern digita-ler Musik, retrieved November, 2018, https://de.statista.com/progno-sen/810090/umfrage-in-deutschland-zu-beliebten-kostenpflichtigen-anbietern-di-gitaler-musik Statistisches Bundesamt (2018). Private Haushalte in der Informationsgesellschaft - Nutzung von Informations- und Kommunikationstechnologien, retrieved November, 2018, from https://www.destatis.de/GPStatistik/servlets/MCRFileNodeServlet/DE-Heft_derivate_00035249/2150400177004_Korr15062018.pdf

1/1
IFC Conference on external statistics "Bridging measurement challenges and analytical needs of external statistics: evolution or revolution?", co-organised with the Bank of Portugal (BoP) and the European Central Bank (ECB)
17-18 February 2020, Lisbon, Portugal
Changes in the structure of multinational groups – a challenge for external statistics compilers1
Nadia Accoto, Giuseppina Marocchi and Silvia Sabatini,
Bank of Italy
1 This presentation was prepared for the meeting. The views expressed are those of the authors and do not necessarily reflect the views of the BIS, IFC, BoP, ECB or the central
banks and other institutions represented at the meeting.

Changes in the structure of multinational groups – A challenge for external statistics compilers 1
Changes in the structure of multinational groups – A challenge for external statistics compilers
Nadia Accoto, Giuseppina Marocchi and Silvia Sabatini1
Abstract
In recent years, multinational enterprises adopted new internationalization strategies, pursuing pioneering forms of cross-border investments if compared to the traditional acquisition, total or partial, of an existing non-resident company.
One of the most interesting patterns of internationalization consists of the cross-border merger between two companies and the subsequent creation, in the merged company country, of a branch (a unit without legal personality and with limited accounting reports). This new entity inherits all assets and liabilities of the merged company. Another approach foresees the ad hoc creation of one or more subsidiaries, just to be reorganized in a short time, immediately after the provision of participations, brands or business units.
These new strategies imply relevant problems in compiling external statistics, particularly in the field of foreign direct investment. The main issues for compilers lie in the identification of the subjects involved in the transactions in order to obtain all necessary information. This is especially in the case of branches, due to the elusive and indefinite nature of these institutional units.
The purpose of the work is to highlight the challenges that these innovations pose to external statistics compilers, through the analysis of some real cases recently observed in Italy.
Keywords: multinational enterprises, external statistics, foreign direct investment
1 The authors wish to thank Stefano Federico for his useful comments. The views expressed in the
article are those of the authors and do not involve the responsibility of the Bank of Italy.

2 Changes in the structure of multinational groups – A challenge for external statistics compilers
Contents
Changes in the structure of multinational groups – A challenge for external statistics compilers .......................................................................................................................... 1
1. Introduction ....................................................................................................................................... 3
2. The Beni Stabili merger ................................................................................................................. 4
2.1 General description and impacts on external statistics ........................................... 4
2.2 Main challenges ....................................................................................................................... 6
3. The acquisition of Pirelli and the consequent restructuring of the group ............... 8
3.1 General description and impacts on external statistics ........................................... 8
3.2 Main challenges ..................................................................................................................... 13
4. Conclusions ......................................................................................................................................... 14
References ................................................................................................................................................ 16

Changes in the structure of multinational groups – A challenge for external statistics compilers 3
1. Introduction
In the context of the lively process known as globalisation, large multinational groups, whose relevance, dimension and complexity largely increased in the last few years, play a key role.
In this framework, companies gather into groups with different internationalization strategies and new forms of cross-border investments, better meeting the needs for rationality, efficiency and optimization.
As a side effect, external statistics compilers face several challenges, particularly, but not solely, in the field of foreign direct investment. These challenges mainly relate to the lack of exhaustive and timely information, the troubles in uniquely classifying events, the continuous and quick appearing-and-disappearing of institutional units, etc.
This paper tackles some relevant issues studying two real cases, occurred in the past few years, each with a significant impact on the Italian external statistics, merely in the field of compilation. The first refers to the merger of the Italian Beni Stabili Spa with a French company, occurred in early 2019 (Chapter 2); the second concerns the acquisition of Pirelli group by the Chinese National Chemical Corporation, occurred during the years 2015-2018 (Chapter 3).
The two examples have been selected among many others, as they represent quite well the complexity of such processes; furthermore, they offer a fairly wide range of occurrences worth of analysis.
For each case, the key events are described in chronological order, highlighting the impact on Balance of Payments and International Investment Positions (BoP/IIP) statistics and focusing on the issues raised for compilers.
The discussion concentrates only on the financial account of the balance of payments and on the international investment position. The events described in the paper also influence the current account of the BoP through the investment income item. Challenges for current account compilers are quite similar to those described here and are not examined in the paper.
The circumstances described in the examples are derived from public documents and correspond to known facts. On the opposite, reported amounts are fictitious and bear no relationships with actual figures. There is no possibility to infer, directly or indirectly, confidential information from tables in the paper.

4 Changes in the structure of multinational groups – A challenge for external statistics compilers
2. The Beni Stabili merger
2.1 General description and impacts on external statistics
At the beginning of 2019, a cross-border merger by incorporation took place between the Italian company Beni Stabili Spa (Beni Stabili) and its French controlling investor Foncière des Régions SA (FdR). Beni Stabili was a real estate company, listed in Milan stock exchange. FdR was a société anonyme incorporated under French law operating in the real estate sector, listed in compartment “A” of the Euronext Paris. The rationale of the merger was the simplification of the group structure and the improvement of the synergies between its various divisions and business areas.
The merger resulted in a new real estate joint-stock company, called Covivio SA, located in France and listed both on Italian and French stock exchanges.
According to the proposal2 approved during 2018 by the Boards of Directors of the two companies, the merger developed in three stages:
− a first phase in which the shareholders of Beni Stabili might accept to exchange Beni Stabili shares with shares of FdR or, alternatively, decide to exercise a withdrawal right. In this last case, FdR committed to repurchase Beni Stabili shares;
− a second phase, occurred in January 2019, in which the two companies merged in the new French company Covivio SA whereas the Italian company Beni Stabili ceased to exist; the new company undertook all the obligations in respect of the Beni Stabili’s bonds issued before the merger and not yet expired (or converted);
− a third phase, simultaneous but logically distinct from the second, in which a permanent establishment in Italy (a branch) was created and provided with all the Beni Stabili’s existing assets and liabilities, including its shareholdings in controlled companies (excluding the liabilities connected to the above mentioned Beni Stabili’s bonds).
After the merger, the permanent establishment has continued to carry out without interruption the same activities performed by Beni Stabili using the same resources and employees.
From an external statistics point of view, this process generated wide-ranging effects, both on the balance of payments and international investment position. In order to outline them, let us suppose (see Figure 1) that the value of the participation of FdR in Beni Stabili, before the phase 1 started, was equal to 200 Euros.
Let us also assume that, because of the adherence to the offers, FdR purchased all the additional shares3, for a total amount of 100 Euros: 25 Euros coming from exercise of the withdrawal right (15 by resident and 10 by non-resident shareholders) and 75 Euros coming from acceptance of the exchange offer (45 by resident, 30 by non-resident shareholders).
2 As stated in the “Explanatory report by Beni Stabili’s Board of Directors In accordance with article
2501-quinquies of the Italian civil code, article 8 of decree No.108/2008 and article 70, paragraph 2, of the Italian Issuers’ Regulation”.
3 We are supposing that all the diffuse shareholders adhere to the offers; it means that during phase 1 FdR increased the percentage of ownership of Beni Stabili up to 100%.

Changes in the structure of multinational groups – A challenge for external statistics compilers 5
Finally, let us suppose that the bonds issued by Beni Stabili before the merger amount to 60 Euros (35 held by resident investors and 25 held by non-residents).
Equity investment in Beni Stabili before the merger
Figure 1
From the Italian perspective, in the first phase, the adherence to the offers implies an increase in the foreign direct investment liabilities: FdR raises the value of the equity investment in Beni Stabili of 100 Euros (according to our assumptions).
Besides, the shareholders who exercise the withdrawal right sell Italian portfolio equity securities (25 Euros): if they are non-resident (10 Euros), it results in a decrease of portfolio investment liabilities too (if they are resident, they “only” receive 15 Euros from a non-resident purchaser (FdR), determining an increase in other investment, assets (deposits)).
As to the shareholders who accept to exchange Italian shares with French ones (for total 75 Euros), if they are non-resident (30 Euros), the result is a decrease in portfolio investment liabilities; if they are resident (45 Euros), the exchange produces an increase in portfolio investment assets.
The following figure summarizes the recording in the Italian external statistics before, during and after the first phase.
Impact of Phase 1 on BoP/IIP
Figure 2
During the second and the third phase, no transaction actually occurs: the events involving FdR, Beni Stabili and portfolio investors (both resident and non-resident)
Equity investment in Beni StabiliAmount (Euros)
Total 300FdR 200Resident f loating shareholders 60
excercising withdrawal right 15accepting exchange offer 45
Non resident f loating shareholders 40excercising withdrawal right 10accepting exchange offer 30
Assets Liabilities Assets Liabilities Assets LiabilitiesFinancial account 265 60 60 60 325
Direct investment - Equityin listed companies 200 100 300in unlisted companies
Portfolio investment - equity 40 45 -40 (=-10-30) 45 0 - debt securities 25 25Other investment 15 15
Net IIP/ Net e&o
Closing positionTransactions
-265 0 -265
Impact of the Merger - PHASE 1 on external statisticsOpening position

6 Changes in the structure of multinational groups – A challenge for external statistics compilers
do not give rise to balance of payments recordings; yet they lead to changes in the IIP.
In the second phase, the merging of Beni Stabili in Covivio produces, as an immediate effect, the elimination of the stock in the direct investment equity liabilities (300 Euros).
Furthermore, concerning the former Beni Stabili bonds, the change in residence of the issuer (from Italian to French) produces a double effect on the portfolio investment (debt securities) of the financial account: the elimination of the stock liability (25 Euros, connected to the holding by non-resident investors) on one hand; the arising of an asset (35 Euros, holdings by residents) on the other (see first and second part of Figure 3).
All these changes in the IIP (all in all +360 Euros on a net basis: from -265 to +95) are reconciled through an entry in the other changes in volume account.
Impact of Phases 2 and 3 on IIP
Figure 3
Similarly, in the third phase, a stock arises in the liability side of the direct investment (equity) item: it refers to the birth of the permanent establishment created by Covivio in place of (and in continuity with) Beni Stabili, as described before. Note that the amount recorded for the new liability is rather different from the previous one; this reflects the change in the nature of the direct investment enterprise: from a listed company, valuated at market price, to an unlisted one. As at the end of phase 2, all changes in the IIP (-200 Euros on a net basis: from +95 to -105) are explained by other changes in volume.
2.2 Main challenges
The Beni Stabili case represents quite well the complexity of such processes of mergers by incorporation. Indeed, however clear and well defined in theory, they pose a number of practical problems as the events have to be identified, understood and finally recorded in the external statistics.
A first type of issue refers to the availability of information on mergers. Frequently, news about such events are available on the media but are partial, approximate and often inaccurate. Rarely, the merger plan is published in advance by the companies involved (this is the case of Beni Stabili). Also in this circumstance,
Assets Liabilities Assets Liabilities Assets LiabilitiesFinancial account 60 325 95 0 95 200
Direct investment - Equityin listed companies 300 0in unlisted companies 200
Portfolio investment - equity 45 45 45 - debt securities 25 35 0 35Other investment 15 15 15
Net IIP
Impact of the Merger - PHASE 2 and PHASE 3 on external statisticsOpening position(end of Phase1)
Intermediate position (end of Phase2)
Closing position(end of Phase3)
-265 95 -105

Changes in the structure of multinational groups – A challenge for external statistics compilers 7
anyway, its materialisation has to be carefully verified (checking whether and when facts actually occurred); moreover figures have to be exactly quantified.
In cases in which minor entities are involved, the lack of information can be total.
Another relevant issue concerns the coherent interpretation of cases: do all the BoP compilers involved read the same events in the same way? In this case, for instance, do France and Italy agree that the events in phase 2 and 3 have to be recorded as other changes in volume? Within the EU, a dedicated network allows to exchange views on many questions related to the FDI, included classification of events. However, this question remains an open issue as a potential source of asymmetries and BoP errors and omissions, both at national and Euro area level.
A third issue refers to the possibility to identify the effects on BoP/IIP items other than FDI equity (as for portfolio investment in Beni Stabili case), recognizing them as an offspring of the merger itself and recording them consistently. This depends crucially on the system in place for the compilation of external statistics: as an example, a system based on direct reporting for FDI and on security-by-security data collection for portfolio investment allows deeper analysis and further cross-checking (through the identification of the securities issuers that have been involved in mergers and reorganizations). A brief overview of the Italian BoP/IIP direct reporting system is reported in Box 1.
Finally, a very peculiar issue regards the branches, units without legal personality whose status raises some additional points. Indeed, a branch is recognized as an institutional unit resident in the economy where it is located if it compiles or may compile (whether requested) a complete set of accounts, separated from those of the parent company4. If not, it is considered as an indistinct part of the foreign parent company. Thus, criteria for identification of branches are neither unique nor fully objective and are based on hard-to-find information (who can say if a set of accounts including a balance sheet could be possible and meaningful?).
This has two main consequences: first, the same unit might be classified as a resident branch or as a non-resident unit by different compilers, depending on their subjective interpretations.
Furthermore, the estimate of the figures relevant for the external statistics (value of the equity investment, income, dividends…) might be rather difficult in case of absence of an actual balance sheet.
In these respects, the case of Beni Stabili is unambiguous: the permanent establishment is clearly and doubtless a branch with a complete and definite system of accounts5. Nevertheless, cases are often much more borderline and pose relevant problems in many macro-economic aggregates measurement (not only BoP/IIP)6.
4 See IMF, Balance of Payments and International Investment Position Manual, Sixth Edition (par. 4.27) 5 The permanent establishment, as defined in the merger plan (see note 2), satisfies all the branches’
requirements listed in the international manuals (see par 18.12-18.14 ESA2010 for example). 6 The identification of branches has implications for the statistical reporting of both the parent and the
branch in different domains (BoP/IIP and national account at least). The operation of the branch should be excluded from the accounts of the economy of its head office and included in the statistics of the economy in which it is located. The delineation of parent and branch should be made consistently in both of the affected economies.

8 Changes in the structure of multinational groups – A challenge for external statistics compilers
3. The acquisition of Pirelli and the consequent restructuring of the group
3.1 General description and impacts on external statistics
During the period 2015-2018 a deep restructuring involved the Italian company Pirelli & C. Spa, one of the main tyre makers globally, founded in Milan in 1872. The process developed in several steps7 and ended up in the acquisition of the entire Pirelli group by National Chemical Corporation (ChemChina), a state-owned enterprise headed by the Chinese Central Government.
7 See “Explanatory report of the Board of Directors of Pirelli & C. S.p.A. on the merger by absorption
of Marco Polo Industrial Holding S.p.A. into Pirelli & C. S.p.A.”
Box 1
The Italian BoP/IIP Direct Reporting system
The Italian data collection system is mainly based on direct reporting by entities involved in cross-border transactions.
Direct reporting entities include all the resident banks, all the other financial intermediaries, and the central bank, for their own transactions and positions, and a sample of non-financial and insurance companies.
With reference to resident banks and other financial intermediaries, data are collected, on a census basis, within the framework of supervisory reporting, through specific statistical reports.
The non-financial and insurance company direct reporting system consists of a set of sample surveys covering specific non-financial and financial transactions and positions and varying in frequency from monthly to annual, depending on the investigated phenomena.
The total sample covers about 7,000 enterprises; the sample selection makes use of a BoP-specific business register (with a flag for the presence of FDI relationships) and is based on the size of enterprises and on their geographical location on the Italian territory. The most relevant enterprises in terms of dimension are included on a census basis.
This system offers different advantages; in particular a key factor is the direct contact with the reporting agents that allows the compilers to exchange different kind of information.
For instance, when a relevant event is reported by the media, the BoP/IIP compilers can:
- contact the units directly or indirectly involved for further explanations on the event, in order to: clearly outline the process, obtain the necessary details (including real amounts), correctly record in the external statistics all the relevant aspects (functional category and instruments such as equity, bonds and loans);
- evaluate the possibility to insert in the sample newly established companies.
The direct link with the reporting agent gives also the possibility to know about relevant operations in advance even when they do not jump to the press headlines or are not reported by commercial data providers.
In the two cases analysed in this paper, the frequent informal contacts with Beni Stabili and Pirelli gave a prompt and complete picture of all the most relevant aspects of the processes.
Remaining to our cases, Covivio and three of the new enterpises created within the Pirelli restructuring (see chapter 3) were included in the sample.

Changes in the structure of multinational groups – A challenge for external statistics compilers 9
Before the restructuring, Pirelli was a listed company, owned by Camfin Spa, an Italian enterprise, and some other minor or floating shareholders (Figure 4, here and after, when not explicitly reported, the percentage of ownership is 100%).
Pirelli group before the acquisition
Figure 4
In the framework of the acquisition, in spring 2015, ChemChina, through its Luxembourgish subsidiary Fourteen Sundew Sarl, created three new Italian companies: Marco Polo International Italy Spa (Newco), with a share capital af 5 Euros, Marco Polo International Holding Italy Spa (Holdco) and Marco Polo Industrial Holding Spa, both with a small share capital as well. The three new companies are linked each other by an FDI (100%) relationship.
In the same period, Camfin sold its 26% participation in Pirelli to Marco Polo Industrial Holding Spa, receiving in return a direct participation in Newco. Afterwards, Marco Polo Industrial Holding launched a tender offer on the ordinary and savings share capital of Pirelli, aimed to acquire the entire share capital to achieve the delisting of Pirelli from Electronic Stock Market.
For the completion of the transactions, two loan agreements were signed between Holdco and Marco Polo Industrial Holding Spa, on one side, and a pool of Italian and foreign banks on the other. The two loans provided the necessary resources to finance the acquisition of Pirelli by Marco Polo Industrial Holding Spa (directly and indirectly, via a capital increase subscribed by Holdco). Figure 5 summarizes the ownership chain after the aforementioned operations.

10 Changes in the structure of multinational groups – A challenge for external statistics compilers
Pirelli group at the end of 2015
Figure 5
From an external statistics point of view, this first step of the process produced effects both on the balance of payments and on the international investment position8. In order to outline them, let us suppose that the value of the Pirelli shares owned by non-resident floating shareholders at the end of 2014 was equal to 40 Euros, included in the Italian IIP as Portfolio investment, equity, liability.
During 2015, the following transactions occurred in the Italian BoP:
8 The participations abroad of Pirelli & C. Spa were not affected by the acquisition and they are not
considered in the analysis of the Bop/IIP effects.

Changes in the structure of multinational groups – A challenge for external statistics compilers 11
− an investment of 5 Euros in Direct investment, equity, liability, as a consequence of the creation of Newco;
− a divestment of 40 Euros in Portfolio investment, equity, liability which represented the adherence of non-residents to the tender offer launched by Marco Polo Industrial Holding SpA on the Pirelli share capital;
− an increase of 100 Euros in Other investment liability, due to the loans taken out by Marco Polo Industrial Holding SpA9 with non-resident banks.
At the end of 2015, the value of Newco increased (from 5 to 200 Euros) as a consequence of the indirect acquisition of Pirelli (through Holdco and Marco Polo Industrial Holding). The corresponding change in the IIP was reconciled through the revaluation - other price changes account10.
Impact of 2015 Pirelli acquisition on BoP/IIP
Figure 6
Settlements of the described financial account transactions have not been reported in the table.
During 2016, in order to streamline and simplify group structure and
indebtedness, the parent company Marco Polo Industrial Holding Spa and Pirelli & C. Spa merged by absorption into Pirelli & C. Spa. Consequently, the financial debt of Marco Polo Industrial Holding was transferred to Pirelli.
In the same year, Fourteen Sundew Sarl subscribed a capital increase of Newco increasing its percentage of ownership from 59% to 65%.
In 2017, Holdco merged into its shareholder Newco, while Pirelli started to repay the loan received and, on October 4 of the same year, returned to the stock market.
The ownership chain at the end of 2017 is described in Figure 7.
9 Holdco did not take out loans with non-resident banks. 10 The acquisition of Pirelli by Marco Polo Industrial Holding Spa did not affect the BoP as both the
investor and the investee were Italian.
Assets Liabilities Assets Liabilities Assets LiabilitiesFinancial account 0 40 0 65 0 300
Direct investment - Equityin listed companiesin unlisted companies 5 200
Portfolio investment - equity 40 -40Other investment 100 100
Net IIP/Net Financial Account (non-bank sector)
The acquisition of PirelliEnd of 2014 2015 Transactions End of 2015
-40 -65 -300

12 Changes in the structure of multinational groups – A challenge for external statistics compilers
Pirelli group at the end of 2017
Figure 7
This phase of the restructuring process implied several BoP registrations:
− in 2016, an investment of 50 Euros in Direct investment, equity, liability due to the subscription of the capital increase of Newco by Fourteen Sundew Sarl;
− in 2017, a divestment of 60 Euros in Other investment liability as a result of the repayment by Pirelli of part of the loan previously subscribed by Marco Polo Industrial holding SpA and an investment of 25 Euros in Portfolio Investment, equity, liability, representing the newly listed Pirelli shares purchased by non-resident investors.

Changes in the structure of multinational groups – A challenge for external statistics compilers 13
Impact of Pirelli group restructuring on 2016-2017 BoP/IIP
Figure 8
Settlements of the described financial account transactions have not been reported in the table.
In 2018, a non-proportional demerger of Marco Polo International Italy Spa occurred and Marco Polo’s stake in Pirelli was allocated to three Italian companies (Camfin Spa and the newly created Marco Polo International Italy Srl and LTI Italy). This last part of the process is not illustrated in this paper as it did not imply relevant BoP/IIP issues.
3.2 Main challenges
The acquisition of Pirelli and the consequent reorganization of the group structure put in evidence relevant challenges that an external statistics compiler face in this kind of situation.
Some of them had already emerged in the Beni Stabili case (described in Chapter 2) and refer to the availability of clear and comprehensive information, the coherent interpretation of cases and events, the identification of additional related effects, such as the resources granted by banks to finance the acquisition.
In addition, a new issue arises not encountered in Chapter 2. It concerns the creation of ad-hoc short-living companies, only functional for the acquisition and born to be absorbed at the end of the process (as for Newco, Holdco and Marco Polo Industrial Holding in the Pirelli case).
Such cases pose new problems for the compilers. First, a specific challenge regards the identification of the entities involved in the restructuring and of the subject(s) able to provide the necessary information. This aspect is particularly tricky as such companies often cease their business even before completing the financial year, without closing a balance sheet.
Furthermore, the creation of ad-hoc short-living companies is problematic for the correct interpretation of FDI flows: being them newly established companies, the foreign investment should be formally classified as “greenfield” even though, substantially, the unit is created for the mere acquisition of an already existing company, not for the establishment of a new production activity.
Assets Liabilities Assets Liabilities Assets Liabilities Assets Liabilities Assets LiabilitiesFinancial account 0 300 0 50 0 350 0 -35 0 315
Direct investment - Equityin listed companiesin unlisted companies 200 50 250 250
Portfolio investment - equity 25 25Other investment 100 100 -60 40
Net IIP/Net Financial Account (non-bank sector)
2017 Transactions End of 2017
35 -315
The restructuring of Pirelli groupEnd of 2015 2016 Transactions End of 2016
-300 -50 -350

14 Changes in the structure of multinational groups – A challenge for external statistics compilers
As an extra consideration, note that only the presentation of FDI by Ultimate Investing country reveals the presence of a Chinese investment in Italy, a relevant feature not visible in the standard presentation.
4. Conclusions
The paper focuses on the wide range of challenges that BoP compilers meet when dealing with new internationalization strategies adopted by multinational enterprises.
Some of them emerged in the two real-world cases analyzed in this paper. They can be summarized as follows.
− Availability and timeliness of information. The details provided by the media are often inaccurate, incomplete, approximate (for example with respect to the timing or the amounts). Thus they need to be verified and integrated via additional sources/information.
− Consistent interpretation of facts among all the external statistics compilers from countries involved in the cross border operations, in order to avoid potential asymmetries and reduce BoP errors and omissions.
− Correct identification and allocation of the effects on BoP/IIP items other than FDI equity. Operations of this type are often connected to portfolio investments and/or to other investment (e.g. takeover bid, financing from banking system). In this framework, the challenge is to identify all the details useful for a correct quantification and classification in the BoP/IIP schemes.
− Necessity to deal with peculiar cases, such as branches or temporary ad-hoc units that pose a specific category of problems. The relevance of these cases is general and goes beyond those that emerge during mergers, acquisition and corporate restructuring.
Some suggestions that may help external statistics compilers can be highlighted.
A pivotal starting point would be a widespread sharing of the main definitions, classifications and methodologies. In this respect, a clear and objective definition of “branches” could also help avoiding asymmetries. Furthermore, an international discussion on the treatment of the merger of a resident unit into a non-resident one (and vice versa) could be useful: is it correct that it should be treated as other adjustment in volume in the external statistics? Why some compilers classify it as a transaction? And how do they avoid consequent errors and omissions?
Another suggestion refers to the data collection systems: of course, the more flexible, granular and direct the system, the greater its potential. As mentioned, a system based on direct reporting allows a deeper understanding of the phenomena; moreover a security-by-security data collection for portfolio investment also allows deeper analyses and further cross-checking.
Finally, it is crucial to exchange views among compilers in order to share information on the event occurred and their recording in the BoP/IIP within the limit

Changes in the structure of multinational groups – A challenge for external statistics compilers 15
of confidentiality issues. In this regard, the FDI Network11 and the related initiatives and instruments (for example the methodological functional mailbox and the Asymmetries Resolution Meeting12) represent a very useful tool. A wider use of them could be a step forward in the solution of such issues.
11 A network set up on a European level (ECB and Eurostat) for secure exchange of information related
to FDI transactions or positions. 12 The ARM is a periodical virtual meeting organized by the ECB and Eurostat aimed at reducing the
biggest asymmetries.

16 Changes in the structure of multinational groups – A challenge for external statistics compilers
References
International Monetary Fund (2009): Balance of Payments and International Investment Position Manual, sixth edition.
OECD (2008): Benchmark Definition of Foreign Direct Investment, fourth edition.
Pirelli SpA (2015): Explanatory report of the Board of Directors of Pirelli & C. S.p.A. on the merger by absorption of Marco Polo Industrial Holding S.p.A. into Pirelli & C. S.p.A.
Beni Stabili SpA (2018): Explanatory report by Beni Stabili’s Board of Directors In accordance with article 2501-quinquies of the Italian civil code, article 8 of decree No.108/2008 and article 70, paragraph 2, of the Italian Issuers’ Regulation.

Nadia Accoto, Giuseppina Marocchi and Silvia SabatiniBank of Italy - Statistical Analysis Directorate
Bridging measurement challenges and analytical needs of external statistics: evolution or revolution? (Lisbon, 17-18 February 2020)
Changes in the structure of multinational groups A challenge for external statistics compilers

Introduction
2
In the context of globalisation, large multinational enterprises play a key role: companiesgather into groups with different internationalization strategies and new forms of cross-border investments.We will illustrate the challenges these processes pose• from the point of view of external statistics compilers (challenges for BoP current account not seen),• through the study of two real cases, occurred in the past few years in Italy;• reported amounts are fictitious and bear no relationships with actual figures.
The BeniStabili merger The Pirelli case Challenges… and hints Conclusions

The BeniStabili merger The Pirelli case Challenges… and hints Conclusions
3

At the beginning of 2019, a cross-border merger by incorporation took placebetween the Italian company Beni Stabili Spa (Beni Stabili) and its Frenchcontrolling investor Foncière des Régions SA (FdR).
Beni Stabili was a real estate company, listed in Milan stock exchange. FdR was asociété anonyme incorporated under French law operating in the real estate sector,listed in compartment “A” of the Euronext Paris.
The process developed in several steps…
The Beni Stabilimerger The Pirelli case Challenges… and hints Conclusions
4

Foncière desRégions SA
52 %
Floatingshareholders
48 %
Beni Stabili Spa
I. Shareholders of BS might exchange BS shares with FdR shares or money (withdrawal right) – PHASE 1
Foncière desRégions SA
52 %
Floatingshareholders
48 %
Beni Stabili Spa
FdR shares
BS shares
Foncière desRégions SA
Beni Stabili Spa
100 %
Before the merger During PHASE 1 At the end of PHASE 1
The Beni Stabilimerger The Pirelli case Challenges… and hints Conclusions
5

Effects on BoP and IIP
Impact of the Merger - PHASE 1 on external statisticsOpening position Transactions Closing position
Assets Liabilities Assets Liabilities Assets LiabilitiesFinancial account 265 60 60 60 325
Direct investment - Equityin listed companies 200 100 300in unlisted companies
Portfolio investment - equity 40 45 -40 45 0- debt securities 25 25
Other investment 15 15Net IIP/ Net e&o -265 0 -265
FdR shares
BS shares
The Beni Stabilimerger The Pirelli case Challenges… and hints Conclusions
6

II. The two companies merged in the new French company Covivio SA – PHASE 2III. In Italy a branch was created and provided with all the Beni Stabili’s existing assets and
liabilities – PHASE 3
Covivio SA
Covivio SA
Foncière desRégions SA
Beni Stabili Spa
100 %
At the end of PHASE 1 At the end of PHASE 3
Covivio SA
At the end of PHASE 2
The Beni Stabilimerger The Pirelli case Challenges… and hints Conclusions
7

Impact of the Merger - PHASE 2 and PHASE 3 on external statistics
Opening position(end of Phase1)
Intermediate position (end of Phase2)
Closing position(end of Phase3)
Assets Liabilities Assets Liabilities Assets LiabilitiesFinancial account 60 325 80 0 80 200
Direct investment - Equityin listed companies 300 0in unlisted companies 200
Portfolio investment - equity 45 45 45- debt securities 25 35 0 35
Other investment 15Net IIP -265 80 -120
IIP changes reconciled via
other changes in volume
The Beni Stabilimerger The Pirelli case Challenges… and hints Conclusions
Effects on BoP (none) and IIP
8

The BeniStabili merger The Pirelli case Challenges… and hints Conclusions
9

During the period 2015-2018 a deep restructuring involved the Italian companyPirelli & C. Spa, one of the main tyre makers globally, founded in Milan in 1872.
The process ended up in the acquisition of the entire Pirelli group by NationalChemical Corporation (ChemChina), a state-owned enterprise headed by theChinese Central Government.
The process developed in several steps…
The Beni Stabilimerger The Pirelli case Challenges… and hints Conclusions
10

11
Other Resident
Camfin Spa26 %
Harbor international fund
4 %16 %
Floatingshareholders
54 %
Pirelli & C. Spa
The Beni Stabilimerger The Pirelli case Challenges… and hints Conclusions
Before the acquisition

12
Camfin Spa
Pirelli & C. Spa
Marco Polo Industrial Holding Spa
Marco Polo International Holding
Italy Spa "Holdco"
Marco Polo International Italy Spa
"Newco"
Fourteen SundewSarl
National ChemicalCorporation(ChemChina)
100 %
Loans
Loans
During 2015:I. ChemChina creates three new Italian companiesII. Camfin sold its participationIII. Tender offer of Marco Polo Industrial Holding using loans
The Beni Stabilimerger The Pirelli case Challenges… and hints Conclusions

The acquisition of PirelliEnd of 2014 2015 Transactions End of 2015
Assets Liabilities Assets Liabilities Assets LiabilitiesFinancial account 0 40
Direct investment - Equityin listed companiesin unlisted companies
Portfolio investment - equity 40Other investment
Net IIP/ Net e&o -40
I. ChemChina creates three new Italian companiesII. Camfin sold its participationIII. Tender offer of Marco Polo Industrial Holding using two loan agreements signed with
a pool of Italian and foreign banks
The acquisition of PirelliEnd of 2014 2015 Transactions End of 2015
Assets Liabilities Assets Liabilities Assets LiabilitiesFinancial account 0 40
Direct investment - Equityin listed companiesin unlisted companies 5
Portfolio investment - equity 40Other investment
Net IIP/ Net e&o -40
The acquisition of PirelliEnd of 2014 2015 Transactions End of 2015
Assets Liabilities Assets Liabilities Assets LiabilitiesFinancial account 0 40 0 65
Direct investment - Equityin listed companiesin unlisted companies 5
Portfolio investment - equity 40 -40Other investment 100
Net IIP/ Net e&o -40
The acquisition of PirelliEnd of 2014 2015 Transactions End of 2015
Assets Liabilities Assets Liabilities Assets LiabilitiesFinancial account 0 40 0 65 0 300
Direct investment - Equityin listed companiesin unlisted companies 5 200
Portfolio investment - equity 40 -40Other investment 100 100
Net IIP/ Net e&o -40 -65 -300
Value increased due to the indirect acquisition
of Pirelli. IIP change reconciled via
other price changes
The Beni Stabilimerger The Pirelli case Challenges… and hints Conclusions
Effects on BoP and IIP
13

14
Camfin Spa
Floatingshareholders
Pirelli & C. Spa
Marco Polo International Italy Spa
"Newco"
Fourteen SundewSarl
National ChemicalCorporation(ChemChina)
IV. Marco Polo Industrial Holding and Pirelli merged by absorption into Pirelli (2016)
V. Holdco merged into Newco (2017)VI. Pirelli returned to the stock market (2017)
Loans
Loans 27 %
63 %
The Beni Stabilimerger The Pirelli case Challenges… and hints Conclusions
…the story goes on

The BeniStabili merger The Pirelli case Challenges… and hints Conclusions
15

Availability and timeliness of informationIn some cases (as in the two real cases seen), the merger plan is published in advance. Anyway all the events have to be carefully verifiedMore often, news on the events are available in the media, but they are often inaccurate, incomplete, approximate (timing, amounts, counterpart country…)In cases in which minor entities are involved, the lack of information can be total
Consistent interpretation of facts among compilers Do all the compilers involved read the same events in the same way? Does Luxemburg agree that the increase in the value of the Newco has to be treated as price changes? Does France agree that the events in phase 2 and 3 in the Beni Stabili merger have to be recorded as other changes in volume? Does France agree that the permanent establishment has to be considered as an institutional unit resident in Italy (and not an indistinct part of the French parent company)?
Identification and allocation of the effects on BoP/IIP items other than FDI equityOperations of this type are often connected to portfolio investments and/or to other investment (e.g. takeover bid, financing from banking system)
Peculiar cases, such as branches or temporary ad-hoc units and related problems Identification of the entities involved in the restructuring and of the subject(s) able to provide the necessary informationClassification of units (branches)Misinterpretation of events (greenfield)
The Beni Stabilimerger The Pirelli case Challenges… and hints Conclusions
16

Widespread sharing of the main definitions, classifications and methodologiesMerger of a resident unit into a non-resident one (and vice versa): when does it have to be treated as transactions and when other adjustment? A clear and objective definition of “branches” could also help avoiding asymmetries
Data collection systemsThe more flexible, granular and direct the system, the greater its potentialA system based on direct reporting allows a deeper understanding of the phenomena (see Box 1 in the paper)A security-by-security data collection for portfolio investment also allows deeper analyses and further cross-checking
Exchange views among compilers Share information on the event occurred and their recording in the BoP/IIP within the limit of confidentiality issues (FDI Network and related tools)
The Beni Stabilimerger The Pirelli case Challenges… and hints Conclusions
17

Extra considerations (some advise for users)
Data interpretation
02OPTIONSThis is dummy text it is not here to be read. The is just text to show where you could insert text. This is dummy text.
For a complete understanding of the phenomena, conventionsand metadata need to be well known (e.g. flows/adjustments)
GreenfieldCarefully use statistics on greenfield (new companies do notnecessarily mean new production activity)
Standard and “by UIC” presentations of FDI must be jointlyconsidered in order to have a complete picture (see China)UIC
The Beni Stabilimerger The Pirelli case Challenges… and hints Conclusions
18

The Beni Stabilimerger The Pirelli case Challenges… and hints Conclusions
LOREM IPSUM This is dummy text it is not here to be read. This is dummy text it is not here to be read. This is dummy text it is not here to be read. This is dummy text it is not here to be read. This is dummy text it is not here to be read.
19
CHANGES IN THE STRUCTURE OF MULTINATIONAL GROUPS
as a consequence of globalizing processes
CHALLENGES
Information
Interpretation
Other BoP/IIP impacts
Specific issues
HINTS
Shared methodologies
Data collection systems
Exchange views
NOTICE TO SKIPPERS
Data and metadata
Greenfield
UIC

1/1
IFC Conference on external statistics "Bridging measurement challenges and analytical needs of external statistics: evolution or revolution?", co-organised with the Bank of Portugal (BoP) and the European Central Bank (ECB)
17-18 February 2020, Lisbon, Portugal
Understanding the presence of MNEs in Ireland as an end user1
Jenny Osborne-Kinch, Caroline Mehigan and Maria Woods,
Central Bank of Ireland
1 This presentation was prepared for the meeting. The views expressed are those of the authors and do not necessarily reflect the views of the BIS, IFC, BoP, ECB or the central
banks and other institutions represented at the meeting.

Understanding the presence of MNEs in Ireland as an end user 1
Understanding the presence of MNEs in Ireland as an end user
Caroline Mehigan, Jenny Osborne-Kinch and Maria Woods1
Abstract
Ireland is a highly globalised economy, as evident across trade and finance channels and also Multinational Enterprise (MNE) interlinkages. The role of the MNE sector in Ireland is greater than that for many other EU countries; MNEs are significant employers, exporters of both goods and services and taxpayers. This has made it increasingly complex in interpreting macroeconomic statistics in Ireland and specifically, in understanding the real domestic links to the economy from this sector. Given the size, extensive role and concentrated nature played by foreign owned MNEs in Ireland, this paper provides a broad structure to assist policy makers and statistical users in understanding their presence, benefits and vulnerabilities.
This paper first examines the importance of MNEs to the Irish economy drawing on Irish macroeconomic data and highlights the measurement challenges that exist. It then identifies approaches to better understand the activities of foreign MNEs located in Ireland and their possible response to key external developments. These can be assessed using market intelligence, firm-level analysis and case studies. Finally, potential opportunities linking new granular datasets are presented, which will be the basis of further work. While the findings are based on an Irish case study, they are of general interest, given the increasingly globalised nature of the economic and financial system.
Keywords: E01, F23, F60.
JEL classification: Globalisation, Multinational firms, National Accounts.
1 The views expressed here are those of the authors and do not necessarily represent those of the
Central Bank of Ireland or the ESCB. Corresponding author is [email protected]. The authors wish to thank Mark Cassidy, Rory McElligott, Reamonn Lydon and Peter McQuade for helpful comments on earlier drafts. Also the authors gratefully acknowledge assistance with data from Enda Keenan, David Horan, Lorenz Emter, Rajat Parihar, Julie Maguire and Keelan Beirne.

2 Understanding the presence of MNEs in Ireland as an end user
Contents
Understanding the presence of MNEs in Ireland as an end user ......................................... 1
1. Introduction ....................................................................................................................................... 3
2. National Accounts: What do they tell us today? ................................................................. 5
Economic contribution of foreign owned MNEs ............................................................... 5
National Accounts, distortions and MNEs ........................................................................... 8
3. How can we enhance this information? ............................................................................... 10
Market Intelligence ...................................................................................................................... 11
Monitoring the MNEs ................................................................................................................. 12
Sectoral case studies ................................................................................................................... 13
4. New data sources and opportunities to explore further? ............................................. 13
Data Model Steps ......................................................................................................................... 14
5. Summary and Conclusions ........................................................................................................ 16
References ................................................................................................................................................ 17

Understanding the presence of MNEs in Ireland as an end user 3
1. Introduction
In recent decades, international trade has undergone significant change. Market liberalisation and improved technology have increased cross-border activity while the rise of Global Value Chains (GVCs) in production processes and Multinational Enterprises (MNEs) dominate certain industries and sectors. MNEs are large corporate structures that can easily leverage economies of scale and spread their operations across multiple countries. Further, the ability to restructure relatively quickly means that MNEs can minimise overall costs of production by locating in low- cost jurisdictions for profit maximisation purposes. Multiple factors determine their choice of corporate structure and in turn, the geographical location for each of the affiliated entities such as a stable business environment, access to an educated labour force, a competitive corporation tax regime and sustainable long-term macro-economic factors. While MNEs play an important role in the global economy (De Backer et al., 2019) and can provide positive national spill-over effects (See Javorcik, 2004, Keller and Yeaple, 2009), higher levels of cross-country interconnectedness combined with the concentrated presence of large, complex corporate structures present data challenges for policy makers, risk analysts and statisticians.
To implement effective policy decisions, national policy makers need to understand and measure domestic economic activity and welfare. In this context, it is necessary to understand the impact of foreign MNEs in their country and disentangle their economic role relative to the domestic real economy. Reliable data and analysis are key to this role. Controlling for the impact of globalisation in economic data is, therefore, an active area of work for national accountants and the statistical community. The reform to the System of National Accounts (SNA, 2008) and its European counterpart (ESA, 2010) provided guidelines on how to account for business activities that were global in nature in the national accounts. Some open issues remain such as accounting for digitalisation, recording of intellectual property and research and development (R&D) expenditure (De Haan and Hayes, 2018), the role of Special Purpose Entities (SPEs), transfer pricing and the allocation of Gross Value Added (GVA) across different jurisdictions (Bundesbank, 2018).
Even within the statistical framework, the complex and evolving nature of MNE activities can, however, present measurement issues especially when the scale of their activities are large relative to a national economy (Stapel-Weber and Verrinder, 2018). Changes in business model strategies can lead to discontinuities in economic aggregates or discrete statistical movements that are unrelated to underlying driving forces in the real economy (Bundesbank, 2018). Confidentiality issues can also arise if a limited number of firms cause large movements in the data. Dealing with these confidentiality issues correctly may, conversely, create opacity for end-users of the data if certain aggregates must be removed. Further, if these firms or their affiliated entities have limited links to the real economy where they are located, the national data must be adjusted for effective policy making (Fitzgerald, 2018 and ESRG, 2016).
From a risk perspective, it is important to understand MNE group structures, their connections to other firms, their role in the economy and any sensitivity to changing market conditions. This applies both to assessing risk at the national level and when looking at global macro-financial conditions. Again, data issues and gaps are to the fore. Understanding these issues are particularly important for those organisations with a financial stability mandate in addition to those with monetary policy or fiscal

4 Understanding the presence of MNEs in Ireland as an end user
remits. Since the Global Financial Crisis, there has been increased willingness to bridge these gaps through the use of enhanced data collections and information-sharing initiatives. Some examples are the G20 Data Gaps initiatives and Cadestin et al., (2018) on the OECD’s Activity of Multinational Enterprises (AMNE) database. On the data side, the use of consolidated figures, where available, both at national and at an international level to complement national, resident data is favoured in financial stability work (See Tissot, 2016).
This paper contributes to the literature and analytical work on MNEs by presenting a broad approach implemented on Irish data to bridge certain data gaps in risk and policy analysis. Ireland is a very useful case study given the role of multinationals in the country since the early-1970s. Ireland is a highly globalised economy, as evident across trade and finance channels and also MNE interlinkages. The role of the MNE sector in Ireland is greater than that for many other EU and OECD countries. This has made it increasingly complex in interpreting macroeconomic and financial statistics in Ireland and specifically, in understanding the real domestic links to the economy. Also their outsized contribution relative to the domestic real economy highlights data distortions that can occur in a small open economy setting. While there are domestic MNEs present in Ireland, those with a foreign parent are of interest to this paper given their relatively larger size and sectoral concentrations.2
From a central banking perspective, there may be solutions to remaining data limitations on MNEs. First, the aggregate data reveal that MNEs are concentrated by sector and by geography. Therefore a monitoring framework that takes these concentrations into account is necessary for a complete risk assessment. Second, as national statistics often come with a significant lag, market intelligence and monitoring firm’s financials can bridge the gap. Given the number of high profile MNEs are located in Ireland, anecdotal or local market intelligence can provide important insights and complement traditional research. Finally, the creation of granular statistical databases and registers (e.g., Anacredit, Centralised Securities Database (CSDB) and Register of Institutions and Assets Database (RIAD)) combined with the OECD’s Analytical Database on Individual Multinationals and Affiliates (ADIMA) offers opportunities for network analysis both within and across MNE corporate structures. Given the extensive role and concentrated nature played by MNEs in Ireland, any shock to this sector could, therefore, have significant real effects.3 It is therefore important, from a policy and risk perspective to understand both the potential origin of such shocks and the transmission channels through which such shocks could impact the Irish macro-financial environment.
The paper proceeds as follows; section 2 shows the economic contribution of foreign owned MNEs in Ireland using aggregate macroeconomic data with a brief discussion of the data distortions and gaps for analytical purposes. Section 3 aims to bridge some of these data issues from a risk perspective by discussing the importance of sectoral analysis in the Irish case. Using recent experience, the benefits of complementing data with soft information such as market intelligence are also discussed. Section 4 presents the architecture and a broad outline of the
2 Within the MNE category, there are both firms that are foreign-owned and firms that have an Irish
parent. According to a CSO definition, having more than half of their sales revenue abroad differentiates Irish MNEs from other Irish firms. In this paper we assume foreign owned MNEs are MNE whose ultimate controlling parent is abroad.
3 See Lane, Philip. R. “Tail risks and the Irish Economy”, speech delivered at UCD, 29 April 2019.

Understanding the presence of MNEs in Ireland as an end user 5
methodology underlying the design of a firm level data model; a summary and conclusion are contained in the final section.
2. National Accounts: What do they tell us today?
Economic contribution of foreign owned MNEs
Foreign direct investment and MNEs have been an important part of the Irish economic landscape since the 1970s. Some of the key factors that influence MNEs’ decisions to invest in a country include; demographics, education and skills, competitiveness on wages, infrastructure and taxation. In line with changing trends in international trade and technology, the profile of foreign owned MNEs has altered over time. More recently, the production of pharmaceutical products, medical devices along with technology are key sectors in terms of export share. According to IDA Ireland, all of the world’s top ten pharmaceutical companies, and nine of the top ten medical technologies firms are located in Ireland.4 Although much of their activities are focused on global markets, foreign owned MNEs make an important contribution to the Irish economy. Specifically they are significant employers, exporters of both goods and services and contribute to tax revenue. Other potential indirect benefits could include knowledge spill-overs to indigenous firms and potential multiplier effects in the form of job creation in associated firms.
Ireland is a highly globalised economy. In terms of trade, the Irish economy is one of the most open in the world. Total gross exports in 2017 amounted to 120 per cent of GDP. Furthermore, the amount of domestic value-added (output) that meets foreign final demand, an indicator of openness, is significant at 63 per cent using 2016 data from the OECD Trade in Value Added (TiVA) database. This is one of the highest in the OECD, second only to Luxembourg. Focusing in on the top 20 exporting MNEs, firms in the technology, medical technology and pharma sectors accounted for 83 per cent of the exports of this group in 2015. 5 At a national aggregate level, the export base is highly concentrated in a small number of sectors. Merchandise exports have long been dominated by chemical products (i.e., 61 per cent in 2018), while the contribution of computer services to services exports has increased substantially in recent years (i.e., 46 per cent in 2018) (Figures 1 and 2). Aggregate export levels increased by 10.4 per cent in 2018 but this was predominantly driven by a small number of products in the chemicals sector.
4 IDA Ireland is the Industrial Development Agency, a non-commercial, semi-state body promoting
Foreign Direct Investment into Ireland. 5 Using The Irish Exporters Association (2015) “Top 250 Exporters in Ireland and Northern Ireland 2015”,
The top foreign MNEs by exports in technology, medtech, and pharma are: Google, Apple, Microsoft and Facebook, Adobe, Dell, Intel, Oracle, VMware, and Western Digital, Abbott Lab, Alexion, Allergan, Baxter, Boston Scientific, Gilead, Johnson & Johnson, Mallinckrodt, Medtronic, McKesson, Merck, Perrigo, and Pfizer.

6 Understanding the presence of MNEs in Ireland as an end user
Figure 1: Merchandise Trade Exports Figure 2: Services Trade Exports
Source: CSO Source: CSO
The contribution of MNEs to domestic output as measured by Gross Value Added (GVA) is large compared to European peers (Figure 3). Within sectors, the value added of the pharma and computer and electronic sectors in manufacturing is almost entirely driven by MNEs.6 However, as much of the profit from these activities flows to foreign owners, the direct contribution to Net National Income (NNI) through wages and corporation tax paid – is estimated to be less (See Fitzgerald, 2018).
Figure 3: Sizeable MNE contribution to GVA (2015)
Source: Eurostat and Central Bank calculations
6 OECD Activity of Multinational Enterprises (AMNE) Data for 2012
0
25
50
75
100
125
150
2007 2008 2009 2010 2011 2012 2013 2014 2015 2016 2017 2018
€ B
illio
ns
Food (0) Beverages and tobacco (1)Crude materials (2) Mineral fuels (3)Animal and vegetable oils (4) Manufactured goods (6)Machinery and transport equipment (7) Miscellaneous m anufactured art icles (8)Commodities and transactions (9) Chemicals and related products (5)
0
20
40
60
80
100
120
140
160
2007 2008 2009 2010 2011 2012 2013 2014 2015 2016 2017
€ Bi
llion
s
Computer services Financial and insuranceBusiness services: R&D Business services: Operat ional leasingBusiness services: Other Royalties/l icencesTranport , tourism , and travel Other services
0
10
20
30
40
50
60
70
IE HU LU RO UK NL SE BE EE EU 28PT ES DK DE FR IT GR
per c
ent

Understanding the presence of MNEs in Ireland as an end user 7
Research has shown that taxation plays a key role in the location decisions of MNEs (Lawless, Morgenroth and O’Toole, 2014) in addition to the legal system, political stability, agile and educated labour force and English language. In Ireland, MNEs make a significant contribution to the exchequer. According to Revenue (2014), between 2008 and 2012, foreign owned MNEs accounted for three quarters of the corporation tax paid in the State with sectors such as Finance, Information and Communications Technology and Manufacture of Pharmaceuticals contributing the most over this period. 7 The latest figures for 2018, show that MNEs accounted for almost 80 per cent of corporation tax (CT) receipts in 2018 (Figure 4). 8,9 Further, MNEs account for 40 per cent of income and Universal Social Charge (USC) charges in 2018.
Figure 4: MNE tax contribution (2018)
Source: Revenue Commissioners.
Although much MNE activity is focused on global markets, these entities contribute substantially to employment in Ireland. Foreign owned MNEs account for one in seven jobs in Ireland. This number could be higher still if indirect employment through firms that have grown to service MNEs and their employees could be counted leading to positive multiplier effects. In terms of the controlling parent, US firms account for almost 40 percent of MNE employment which is not surprising given the established role of US foreign direct investment in Ireland.10 Of course, certain sectors (e.g., manufacturing and retail) are more labour intensive than others within the MNE category.
7 https://www.revenue.ie/en/corporate/documents/research/corporation-tax.pdf 8 https://www.revenue.ie/en/corporate/documents/research/ct-analysis-2019.pdf 9 Despite an increase in the number of contributors, CT receipts are currently quite concentrated in
Ireland with 100 largest companies paying the vast majority at 70 per cent (See Revenue, 2019 and Conefrey et al, 2019 for an analysis of the potential issues for public finances arising from reliance on higher, more volatile corporation tax receipts).
10 By ultimate investor, the US had a position of €519.5 billion of a total of €717 billion inward FDI in 2017.
0123456789
10
Total CT liable Income Tax USC
€ M
illion
s
Other Companies Foreign MNEs

8 Understanding the presence of MNEs in Ireland as an end user
National Accounts, distortions and MNEs
Due to the established and significant presence of foreign owned MNEs in a small economy such as Ireland, statisticians and economists have long considered their impact on both economic data and related analysis. More recently, there has been considerable volatility in the Irish data due to changes in business model operations by large foreign MNEs. Further, the implementation of ESA 2010 combined with certain activities by MNEs has also led to large movements in key economic aggregates which are unrelated to underlying domestic activity.
One notable recent example was the 2015 increase in real GDP by 25.2 per cent, which made international headlines and was significantly out-of-line with 2014 figures of 8.6 per cent per annum and underlying activity. Trade and investment figures for Ireland also experience considerable volatility as a result of MNEs (See Figure 5).
Figure 5: GDP, GFCF and Exports for Ireland (constant market prices)
Source: CSO and Central Bank calculations Note: GFCF is gross fixed capital formation
According to Fitzgerald (2018), recent volatility in national accounts relate to the growth of both the aircraft leasing sector and in activity by re-domiciled PLCs; patent changes for large pharmaceutical companies and the capital transfer of international assets such as intellectual property (IP) to affiliated entities located in Ireland.11,12
In terms of re-domiciled PLCs, while they have moved headquarters to Ireland, they contribute little to employment or enhance domestic factors of production (See Avdjiev et al., (2018)). Such entities can, however, create distortions to external accounts given that they generally retain a significant proportion of earnings so their market value is high. The current account balance can therefore be affected given
11 The growth in the aircraft leasing sector in Ireland and its impact on national investment and trade
figures is discussed further in Fitzgerald (2015) and is a further example of the effects of globalisation on the national accounts of a small open economy.
12 For further discussion on the patent cliff please see section 3. The distortions associated with aircraft leasing are not discussed in detail here. For further detail please see Fitzgerald (2015).
-30-20-10
0102030405060
1996 2000 2004 2008 2012 2016
Annu
al p
erce
ntag
e ch
ange
GDP GFCF Exports

Understanding the presence of MNEs in Ireland as an end user 9
the shortfall between outflows and inflows from this sector (Fitzgerald, 2018). In recognition of the fact that although these re-domiciled entities are Irish by definition, their activities have limited links to the domestic economy, their accounts are presented separately as sub sector S11.c. of the NFC category in the institutional sector accounts.
The transfer of intellectual property (IP) assets to affiliated entities in Ireland is considered to have contributed significantly to the 2015 increase in GDP. Such expenditure on R&D is now included in national investment in line with ESA, (2010) and following the principle of economic ownership (See De Haan and Hayes, 2018). Also according to Bundesbank (2018), the licencing income arising from the transfer of these IP products increased exports significantly. IP is important to both IT and Pharma companies which are dominant sectors in Ireland.
Such distortions complicate fiscal policy discussions and the assessment of domestic financial stability which in turn, supports macroprudential policy decisions. For example, many macro-financial risk indicators rely on economic activity as a benchmark for public and private indebtedness levels. The distortion of trade figures also makes the assessment of Ireland’s external position through the current account balance problematic. Productivity figures and institutional sector accounts are also affected by MNE activity requiring separate releases for foreign MNEs versus indigenous firms. Confidentiality issues also arise if activities of a small number of firms explain movements in one economic aggregate: dealing with such movements can complicate analysis at sector level.13
In Ireland, work is underway to understand the role of MNEs in national economic aggregates and aid interpretation by end-users by Irish statisticians. Some examples are the establishment of a large cases unit (LCU) by the national statistics office (The Central Statistics Office (CSO)) to understand large foreign-owned MNEs and the publication of separate statistics and methodological notes on this sector for end-users of national accounts.
As labour market developments and other measures of domestic demand such as consumption remain relatively unaffected, they provide an alternative measure of underlying national activity for economists. In response to the 2015 distortion and subsequent volatility in the national accounts, the Economic and Statistical Review group (ESRG) was established in Ireland to provide a useful guide for policymakers when analysing Irish macroeconomic data. The ESRG created a number of alternative metrics to aid policymakers and market analysts modified domestic demand and modified current account indicator (ESRG, 2016).
An example of one of these alternative measures introduced by ESRG is Gross National Income (GNI*) which is a measure of Irish economic output which excludes the depreciation on foreign-owned IP and leased aircraft, and also makes an adjustment for the profits of re-domiciled PLCs. This metric therefore may provide a more accurate picture of economic growth in Ireland (Figure 6).
The group also created a number of further recommendations to deal with these issues. To aid end-users when analysing MNEs and broader globalisation issues in
13 For example, in 2018, it was necessary for confidentiality reasons to merge together different sectors
(e.g. Nace Rev.2 divisions 18, 21, 26, 27 & 32.5 ).

10 Understanding the presence of MNEs in Ireland as an end user
Ireland, the CSO provides information releases on key sectors such as aircraft leasing and the link between re-domiciled plc and Balance of Payments. 14,15
Figure 6: GDP and GNI* (Current Market Prices)
Source: CSO and Central Bank calculations
Complementarily to national statistics (i.e. Sectoral, Financial Accounts, Balance of Payments), there is a need to move beyond the aggregates and the use of micro data is considered an important way forward. Such work is also reflected at a European level as detailed by Bundesbank (2018).
However, there are some remaining gaps in knowledge that can be filled by sectoral analysis and market intelligence as discussed in Section 3. Combining the information provided from market intelligence, case studies, monitoring firm financials and external developments can provide additional insights to understanding the presence of MNEs in Ireland and their responses to the evolving global landscape. Such information can facilitate scenario analysis, for example a shock to corporation tax receipts or employment in the MNE sector and investigating the corresponding real effects using structural macroeconomic models of the economy.
3. How can we enhance this information?
While national statistics are one way of understanding the economic landscape, they often come with a significant lag. Speaking with market participants can provide more timely information. Furthermore, in a country where the number of big firms is very concentrated, market intelligence, monitoring firm financial information or case studies can provide additional insights. In order to increase the understanding of the MNE sector, and the tail risks associated with such a dependence, as end users, staff
14 https://www.cso.ie/en/statistics/internationalaccounts/aircraftleasinginireland/ 15 https://www.cso.ie/en/releasesandpublications/in/rpibp/redomiciledplcsintheirishbalanceofpayments/
0
50,000
100,000
150,000
200,000
250,000
300,000
350,000
1995 1997 1999 2001 2003 2005 2007 2009 2011 2013 2015 2017
€ m
illion
s
Gross Domestic Product (GDP) Modified Gross National Income (GNI*)

Understanding the presence of MNEs in Ireland as an end user 11
in the Central Bank have started monitoring the sector beyond national statistics. This has been conducted in a three pronged approach i) market intelligence, ii) monitoring the larger firms and the sectors they operate in, and iii) MNE case studies.
Market Intelligence
Using market intelligence (MI) or qualitative information to enhance an understanding of a sector or industry is often used by and across institutions. For example, the approach of speaking to firms or market participants is conducted at the ECB via the non-financial business sector dialogue. The dialogue helps to inform the ECB about the business sector’s views on the economic situation and thereby deepen its understanding of economic developments and issues relevant to policymakers.16 In the context of MNEs, the Deutsche Bundesbank and Banque de France worked together to better understand and explain the contribution of MNEs in their Balance of Payments (BoP) (Mosquera Yon & Walter 2018). This involved the exchange of information between the central banks, and also collaboration with the multinational enterprises involved.
Staff in the Central Bank of Ireland started gathering market intelligence on the MNE sector in 2019. This approach was developed in order to better understand the possible responses of MNEs located in Ireland to the many external developments for example, to the global tax and trade landscape. The MI involves quarterly meetings with professional services firms, industry experts and at times, the MNEs themselves. Mainly, the meetings focus on the trends in the sector. The MNEs are not identified in line with the confidentiality conditions of the firms, unless speaking directly with the MNE. These meetings are conducted on the understanding that the material is confidential and the resulting analysis would be compiled along Chatham House rules, circulated to a limited group (as necessary) and not be published.
To illustrate, in 2019, the main external developments and the possible implications for the activities of MNEs discussed in the interviews were:
• Trade tensions affecting the investment decisions of MNEs
• US tax reform
• OECD BEPS 2.0 process
• Brexit
• Onshoring patterns of intellectual property
• Competitiveness of Ireland for FDI relative to other destinations
The information increases our understanding of international corporate taxation and trade developments and how firms are responding to changes. It has also provided information which has helped to clarify movements seen in the national accounts, and at times served as a signal of movements to come. This channel could serve as an early warning system for potential future shifts in behaviour.
16 For further details please see https://www.ecb.europa.eu/mopo/devel/html/nfbd.en.html.

12 Understanding the presence of MNEs in Ireland as an end user
Monitoring the MNEs
Firm level information provides insights into the opportunities and challenges firms face and a deeper understanding of the sectors in which they operate. The concentrated nature of the MNE sector in Ireland merits firm level analysis. A shock or organisational change to one firm or industry could have significant implications for statistics, trade or employment. Firm level analysis of these MNEs can help monitor areas of vulnerability and benefits for the Irish economy more broadly.
A closer look was provided in “MNEs in Ireland: A firm level analysis” (Emter et al 2019). Financial indicators of the top MNEs in Ireland (as defined by their exports) were examined. When thinking of the resilience of the economy, it is important to consider the prospects of these MNEs and the sectors in which they operate. In this way, the equity prices and profit performance of the firms are informative (See Figure 7). In addition, the growth in forecast earnings for these sectors can be helpful. How the firms operate, from operating expenses and revenue ratios, to capital expenditure, assets and the role of intangibles, all add to the understanding of the firms and the risks they face (see Figure 8). For example, Pharma exhibited a relatively low capital expenditure coupled with relatively high operating expenses to revenue compared to the technology focused MNEs.
Figure 7: Equity Performance vs S&P 500
Figure 8: Capital Expenditure to Assets Ratio
Note: Index: 2007=100, average within group. Based on 24 large MNEs operating in Ireland. GAMF refers to Google, Apple, Microsoft and Facebook. Tech consists of 6 companies: Adobe, Dell, Intel, Oracle, VMware, WesternDigital. Pharma includes 14 companies, namely: AbbottLab, Alexion, Allergan, Baxter, BostonScientific, Gilead, Johnson & Johnson, Mallinckrodt, Medtronic, McKesson, Merck, Perrigo, Pfizer, and Takeda.
Source: Emter et al (2019)
Note: Based on 24 large MNEs operating in Ireland. GAMF refers to Google, Apple, Microsoft and Facebook. Tech consists of 6 companies: Adobe, Dell, Intel, Oracle, VMware, Western Digital. Pharma includes 14 companies, namely: AbbottLab, Alexion, Allergan, Baxter, BostonScientific, Gilead, Johnson & Johnson, Mallinckrodt, Medtronic, McKesson, Merck, Perrido, Pfizer and Takeda.
Source: Emter et al (2019)
Beyond the financial indicators of the firms themselves, the importance of monitoring issues from global trade tensions and tax reform, to market power and anti-trust concerns is also recognised.
0
100
200
300
400
500
600
GAMFTech
PharmaS&P500
0
0.5
1
1.5
2
2.5
Pharma Tech GAMF SP500

Understanding the presence of MNEs in Ireland as an end user 13
Sectoral case studies
In addition to MI and firm financial indicators, case studies can add a further layer of detail to our understanding of these entities, especially how their activity is reflected in the national statistics and potential risks to particular products or services. Given the high concentration and size of activities of some of the MNEs, case studies can especially inform some of the statistical distortions we see in the data. For example, a closer look at one of the recent statistical distortions suggests that it may have been due to the global restructuring of an MNE. This case study also highlighted the role of the group when analysing these firms - different subsidiaries can be mainly used for sales, while others are used to hold intellectual property. Corporate inversions, on-shoring of IP and the patent cliff are other instances where case studies have informed the interpretation of statistics.
Irish merchandise exports are becoming increasingly concentrated in pharmaceuticals with remaining growth attributable to the computer hardware sector (Byrne et al., 2020). Using disaggregated trade data, a Herfindahl-Hirschman index illustrates that Ireland’s merchandise export basket is higher than most other EU countries, second only to Cyprus. Given the concentrated nature of Irish exports, for example the relatively high concentration of antisera and blood vaccine products in merchandise exports (Byrne, 2019), a clear understanding on the firms producing these products is beneficial. A shock to one or two firms or products could result in a significant downturn in Irish exports.
In terms of product risks, the so-called “patent cliff” is one such example of a risk to the economy. The role of patents is important for the pharmaceutical and medical technology sectors. Between 2011 and 2013 the patents for a number of “blockbuster” drugs produced in Ireland were due to expire. The “patent cliff” was a significant concern for the sector and Irish trade and growth statistics. Between the end of 2011 and the end of 2012, the patent on a number of drugs produced in Ireland expired. There was a significant fall in revenue for one company which led to a reduction in Irish exports and gross value added. Despite the large movements in the headline statistics, employment remained unchanged (Fitzgerald, 2013).
4. New data sources and opportunities to explore further?
Mapping MNE corporate structures is an important part of building up knowledge of the interlinkages across MNE firms, between MNEs and with systemically important firms such as domestic banks. This knowledge is key to understand the potential macro-financial channels through which shocks or structural changes could propagate in Ireland. There are already a number of ongoing initiatives led by international organisations such as the OECD and NCBs including Banco de Portugal (Pinto, Neves and Pereira, 2018) in this space. In this section we present a broad architecture being designed to help bridge data gaps from a Central Bank perspective and understand MNE interlinkages. The authors identify the potential opportunities surrounding a number of Eurosystem granular datasets, and look to link these datasets with internationally available databases such as the OECD’s ADIMA database, in order to understand MNEs and their complex ownership structures. This includes matching information from the OECD ADIMA database with reference data in the

14 Understanding the presence of MNEs in Ireland as an end user
Central Bank of Ireland (Central Bank) institution database in combination with micro level data on loans and securities. Its first objective is to map out the corporate structures and examine counterpart and credit data for foreign controlled corporations. Figure 9 presents the initial model in its infant stages. The building blocks of the data model are explained in more detail below.
Data Model Steps
1. As a first building block, the ADIMA database was used to develop the multinational financial interlinkages database, and more specifically, data on MNEs associated with Ireland - Irish affiliates. This database contains information on the affiliate name, parent name and legal entity identifier (LEI) code for Irish affiliated companies. An LEI is a unique global identifier of entities that participate in financial transactions. At the time of writing this paper, there were 593 Irish affiliates belonging to 67 MNE’s with a presence in Ireland from the OCED’s ADIMA dataset.17 Of this, 296 out of the 593 Irish affiliates found on ADIMA had an LEI recorded. Using name matching, one can retrieve affiliates LEIs and Irish Company Registration Office (CRO) numbers (Irish National Tax Identifier) from the LEI Register and Irish CRO Database respectively18.This enriches the data on Irish subsidiaries, enabling analysis where LEI or other indicators are unavailable in ADIMA.
2. Using a combination of Irish CRO Numbers and LEIs (attained from Step 1), along with name matching, it is possible to search affiliates against the Central Bank’s Institution Database (Master Central Bank Database). 19 This database provides counterparty reference data (using Anacredit20) for affiliates including details on address, number of employees, annual turnover, as well as credit data related to each affiliate including details on the bank/agent providing credit, the type, value and maturity of the credit instrument, as well as the interest rate. Identifying the relationship builders, one can begin the process of mapping out the corporate structures.
3. This can include connecting to the CSDB (Central Securities Database) on the basis of Irish CRO Numbers, LEIs and name matching, thereby obtaining data on securities issued by affiliates. 21 Additionally, ISIN (International Securities Identification Number) codes, a code that uniquely identifies specific securities issued, can be attained from the CSDB Database. The ISIN code provides a
17 ADIMA currently covers 100 of the largest global MNEs at end 2018. It is to be extended towards 500
by 2020. Five selection criteria were created for MNEs to be included in the ADIMA database. These included revenues, stock listing and whether a multinational has an online presence. The selection of MNEs covers enterprises with headquarters in 16 countries.
18 The LEI Register contains data on companies that possess a Legal Entity Identifier (LEI). The Irish CRO Database provides data on companies that bear an Irish CRO Number; an Irish CRO number is a Irish National Tax identifier, unique to Irish companies.
19 Central Bank of Ireland’s Institution Database is a Central Bank Master Database. 20 Anacredit is a dataset with detailed information on individual bank loans in the euro area. The name
stands for “analytical credit datasets”. https://www.ecb.europa.eu/explainers/tell-me-more/html/anacredit.en.html.
21 Central Securities Database (CSDB) contains data on securities and their issuers. https://www.ecb.europa.eu/pub/pdf/other/centralisedsecuritiesdatabase201002en.pdf.

Understanding the presence of MNEs in Ireland as an end user 15
valuable identifier to facilitate connection to additional databases, thus allowing further analysis on securities issued by the ADIMA affiliates.
4. Finally, using the ISIN code identified from the CSDB Database, the SHS (Securities Holding Statistics) Database can subsequently be examined. 22 The SHS, which is collected on a security-by-security basis, provides information on securities held by selected categories euro area investors. This exploration of the SHS Database provides, where possible, information on the country and sector of holders of the debt and equity issued by affiliates.
Enriching information from the ADIMA database with key identifiers such as the LEI and CRO number, one can connect to the Central Bank’s Institution database (which includes information from Anacredit and RIAD). It is possible then to map out the parent structure and also potentially understand the financial linkages. The next step of the project is to assess the quality of the data and explore further the uses of the SHS Database. The LEI identifier is an important part of the mapping process, and in these vain, initiatives to promote the use of LEIs should be pursued.
Figure 9: Overview of Data Model
22 Securities Holding Statistics (SHS) Database contains information on holders of debt and equity.
https://www.ecb.europa.eu/stats/financial_markets_and_interest_rates/securities_holdings/html/index.en.html.

16 Understanding the presence of MNEs in Ireland as an end user
5. Summary and Conclusions
While MNEs play an important role in the global economy and provide positive national spill-over effects; higher levels of cross-country interconnectedness combined with the concentrated presence of large, complex corporate structures present data challenges for policy makers, risk analysts and statisticians.
There has been significant progress both at national and at international level in enhancing the analysis of this sector through the collection and discussion of data on this sector. At a national level, the establishment of the ESRG and the publication of its 2016 Report provided guidance and recommendations to support economic analysis. At an international level, the G20 Data Gaps Project and the publication of the AMNE database by the OECD are just two examples of on-going work in this area.
From a central banking perspective, bridging data gaps to complete both risk assessments and econompic analysis is important. Therefore this paper introduces a broad structure applied to Irish data to bridge certain data gaps in these areas. Ireland is a very useful case study given that the role of the MNE sector in Ireland is greater than that for many other EU and OECD countries. Further, given the extensive role and concentrated nature played by MNEs in Ireland, any shock to this sector could, therefore, have significant real effects. It is therefore important, from a policy and risk perspective to understand both the potential origin of such shocks and the transmission channels through which, such shocks could impact the Irish macro-financial environment.
This paper presents, from an end user perspective how the aggregate national accounts data can be complemented by both quantitative and qualitative information to inform risk and policy assessment. The sectoral and firm level approach assists the analysis given the heterogeneity of firms within the MNE sample and the differing risk profiles across these sectors. The market intelligence network, drawing on key market analysts, MNE consultants and MNEs themselves provides a forum to gain early insights into the sector’s activities and any sensitivity to macro-financial developments. Further, initial work in the area of mapping the corporate structure of MNE entities using micro data will allow greater understanding of firm interlinkages. Such work is an important building block to assessing cross-sector interconnectedness.

Understanding the presence of MNEs in Ireland as an end user 17
References
Avdjiev, S., M. Everett, P. Lane and H. Song Shin, (2018), “Tracking the international footprints of global firms”, BIS Quarterly Review, March.
Bundesbank, (2018), “Activities of multinational enterprise groups and national economic statistics”, Deutsche Bundesbank Monthly Report, October 2018.
Byrne, S. (2019), “Strong pharmaceutical exports boost overall export growth”, Central Bank of Ireland, Quarterly Bulletin 2019, No 1. Box C.
Byrne, S., Doyle, L. and P. McQuade, (2020) “Sectoral Concentration in Irish Exports” Central Bank of Ireland, Quarterly Bulletin 2020, No 1. Box A.
Cadestin, C., De Backer, K., Desnoyers-James, I, Miroudot, S., Rigo, D. and M Ye (2018a), “Multinational Enterprises and Global Value Chains: The OECD Analytical AMNE Database”, OECD Trade Policy Papers No. 211, OECD publishing, Paris
De Backer, K., Miroudot, S. and D. Rigo, (2019), “Multinational enterprises in the global economy: heavily discussed, hardly measured”, VoxEu, CEPR,
De Haan, M. and J. Hayes,(2018), “R&D capitalisation: where did we go wrong? Eurostat Review on National Accounts and Macroeconomic Indicators, Euronia, Issue 1, Eurostat.
Emter, L. McQuade, P. and C. Mehigan (2019) “MNEs and Ireland: A Firm Level Analysis”, Central Bank of Ireland, Quarterly Bulletin 2019, No 3. Box E.
ESRG (2016), Report of the Economics Statistics Review Group (ESRG), December 2016
FitzGerald, J., (2013a). “The Effect on Major National Accounting Aggregates of the Ending of Pharmaceutical Patents”, ESRI, Quarterly Economic Commentary Research Note 2013/2/1.
FitzGerald, J., (2015), “Problems Interpreting National Accounts in a Globalised Economy – Ireland”, ESRI Quarterly Economic Commentary, Summer.
Fitzgerald, J., (2018), “National Accounts for a Global Economy: the Case of Ireland”, TCD Working Papers No. 0418, May, Trinity College Dublin.
Javorcik, B.S (2004), “Does Foreign Direct Investment Increase the Productivity of Domestic Firms? In Search of Spillovers through Backward Linkages”, American Economic Review, 94 (3): 605-627.
Keller, W and S. R. Yeaple (2009), “Multinational Enterprises, International Trade, and Productivity Growth: Firm-Level Evidence from the US”, Review of Economics and Statistics, 91 (4): 821–831
Lawless, M. , McCoy, D, Morgenroth,E. and C. O’Toole, (2014) “The Importance of Corporation Tax Policy in the Location Choices of Multinational Firms”Part of the Economic Impact Assessment of Ireland’s Corporation Tax Policy.
Mosquera Yon, T. & J, Walter (2018) “Sharing of data reported by complex multinational enterprises: a cooperative approach between Deutsche Bundesbank and Banque de France”, IFC Central Bank of Armenia Workshop on “External Sector Statistics”, Armenia 2018.

18 Understanding the presence of MNEs in Ireland as an end user
OECD (2018), Measuring MNEs using Big Data: The OECD Analytical Database on Individual Multinationals and their Affiliates (ADIMA), 2018.
Pinto A.B, Neves J.A and T.P. Pereira, (2018) “Keeping track of MNEs through business group databases: the experience of Bank of Portugal”. Ninth IFC Conference, Basel, 30-31 August 2018.
Tissot, B., (2016), “Globalisation and financial stability Risks: is the residency based approach of the national accounts old-fashioned?” BIS Working Papers No. 587, October.
Stapel-Weber, S. and J. Verrinder (2016), ”Globalisation at Work in Statistics- Questions Arising from the `Irish Case'," EURONA: Eurostat Review on National Accounts and Macroeconomic Indicators 2/2016, 45-72.

Understanding the presence of MNEs in Ireland as an end userExternal Statistics Conference 17/18 February 2020
Jenny Osborne-Kinch*, Caroline Mehigan and Maria Woods
The views expressed are not necessarily those of the Central Bank of Ireland
Central Bank of Ireland - RESTRICTED

2
Introduction/Motivation
Importance of MNEs for global trade ; provide positive national spill-overs but
corporate structure can be complex and span multiple jurisdictions
poses challenges for statisticians, analysts and policy makers
Statistical initiatives to bridge data gaps and enhance understanding
Issues remain as an end user and Central Bank
1. Aggregate data mask important sectoral/firm heterogeneity
2. Macroeconomic data released with a lag
3. To assess risk at national level need to know financial linkages within individual MNEs (entity
level), across the sector and with other systemically important firms
Present broad structure to bridge these data gaps in Ireland
Central Bank of Ireland - RESTRICTED

3
Current Statistical Framework
National statistics
Economic Contribution of Foreign Owned MNEs
How can we enhance this information?
Market intelligence
Monitoring of MNEs
Opportunities with new datasets…
ADIMA
RIAD/Anacredit/CSDB/
SHSDB
Central Bank of Ireland - RESTRICTED

4
Economic contribution of foreign owned MNEs significant
Economic Activity (GVA)
• 1 in 7 jobs
• Multiplier effects
• Manufacturing & Retail
Employment Tax
Central Bank of Ireland - RESTRICTED

Statistical Challenges
Volatility in trade and economic growth figures Alternative measures constructed
5
Central Bank of Ireland - RESTRICTED

6
How can we enhance understanding beyond national statistics?
Anecdotal or firm specific information can provide additional insights beyond national statistics -
number of large firms is very concentrated.
We use a three pronged approach
i) Market intelligence,
ii) Monitoring the larger firms and the sectors they operate in, and
iii) MNE case studies.
Can facilitate scenario analysis
Central Bank of Ireland - RESTRICTED

7
Market Intelligence MNE Monitoring Case studies
Quarterly meetings with network of contacts
Possible MNE responses to external developments 2019:- Trade tensions- US tax reform - OECD BEPS 2.0 process- Onshoring patterns of IP - Irl as an FDI destination
Clarify movements in NA
Semi annual firm & sectorlevel assessment
Firm: Stock prices, forecast earnings, CapEX operating expenses, revenue ratios and Intangible asset share
Sector risks: global trade tensions, global tax reform.
Given high concentration and size of some MNEs, case studies can at times help explain data distortions.
Corporate inversions IP onshoring Patent cliff
Product specialisation i.e. antisera and blood vaccine products in merchandise exports.
Central Bank of Ireland - RESTRICTED

8
New data sources and opportunities
Mapping MNE corporate structures is an important part of understanding macro-financial interlinkages
Ongoing initiatives internationally – OECD, Banco de Portugal
Seek to build a broad architecture and data model
-Utilise internationally available databases (ADIMA database)
-use of granular Eurosystem datasets
Initial step – seek to match ADIMA database with reference data and credit data - MNE group structure
Entity identifiers – LEI, tax ID (CRO), name, country
Central Bank of Ireland - RESTRICTED

9
Data model : MNFID – Multinational Financial Interlinkages Database
ADIMAADIMA
EnrichedConnect to CBI institution data
Reference data- name, address, no. employees,
BS size
Relationships
Credit data
Securities issued
Central Bank of Ireland - RESTRICTED
Enhance with key identifiers from
LEIs register and Irish CROs
RIAD/Anacredit
CSDB/SHSDB

Analyse Securities
Holding Statistics
(SHS) Database
1 2 43
Central Bank of Ireland - RESTRICTED
Data Model: Connecting ADIMA
Initial ADIMA Data

11
Summary and Conclusions
MNEs play an important economic role but present challenges for statisticians and policy
makers
National statistics can be distorted especially if MNE large relative to domestic economy
End users such as Central Bank face challenges
Timeliness, sectoral and firm level detail, financial interlinkages across firms
This presentation details the Irish case and presents a structure to address some of these issues
1. Market intelligence network,
2. Sectoral/firm case studies and
3. Data model as first step to understanding financial interlinkages within MNEs
Further work will enhance these structures
Central Bank of Ireland - RESTRICTED

12
Thank you…
Any Questions?
Central Bank of Ireland - RESTRICTED

1/1
IFC Conference on external statistics "Bridging measurement challenges and analytical needs of external statistics: evolution or revolution?", co-organised with the Bank of Portugal (BoP) and the European Central Bank (ECB)
17-18 February 2020, Lisbon, Portugal
Bilateral capital flows: gravity, push, and pull1
Rogelio Mercado Jr,
The South East Asian Central Banks SEACEN Research and Training Centre
1 This paper and presentation were prepared for the meeting. The views expressed are those of the author and do not necessarily reflect the views of the BIS, IFC, BoP, ECB or
the central banks and other institutions represented at the meeting.

Bilateral Capital Flows: Gravity, Push, and Pull 1
Bilateral Capital Flows: Gravity, Push, and Pull
Rogelio Mercado, Jr.1
Abstract
Using bilateral capital flows data from 10 advanced reporting economies — with over 186 bilateral country pairs — for 2000 to 2016, this paper provides evidence on the significance of gravity factors, including distance and bilateral trade ties, in explaining cross-border bilateral financial asset flows. This finding is new to the capital flows literature that mostly consider push and pull factors. In addition, this study offers new evidence of regional contagion as bilateral capital flows decrease more for country pairs with closer geographic proximity (or with less information frictions) than those that are farther apart when global risk aversion increases. These findings have policy implications on the importance of information frictions, bilateral trade ties, and regional cooperation on bilateral financial asset flows.
Keywords: bilateral capital flows, gravity factors, global and domestic factors
JEL classification: F21, F36, G10
1 Former Senior Economist at The South East Asian Central Banks Research and Training Centre (The
SEACEN Centre), currently Economist at the Asian Development Bank, Email: [email protected].
The author is highly indebted to Abdul Abiad, Stijn Claessens, Hans Genberg, Matteo Lanzafame, Shanty Noviantie, Victor Pontines, Arief Ramayandi, Ilhyock Shim, Anuj Singh, Philip Wooldridge, and James Yetman for their valuable comments, suggestions and insightful discussions. The author greatly acknowledges the assistance of Camille Deduque, Christopher Gohrband, Y. Laachir, and Robert Wederkinck in discussing their respective country’s bilateral Balance of Payments Statistics. Earlier versions of this paper were released as SEACEN Working Paper 06/2018 and Trinity Economics Paper 0818. This version of the paper was presented at the Irving Fisher Committee on Central Bank Statistics, European Central Bank, Banco de Portugal Conference on “Bridging measurement challenges and analytical needs of external statistics: evolution or revolution?”, held on 17-18 February 2020 in Lisbon, Portugal. The views expressed in this paper are those of the author and do not necessarily represent those of SEACEN or its member central banks/monetary authorities.

2 Bilateral Capital Flows: Gravity, Push, and Pull
Contents
Bilateral Capital Flows: Gravity, Push, and Pull ............................................................................ 1
1. Introduction ....................................................................................................................................... 3
2. Related Literature and Conceptual Framework ................................................................... 6
3. Data on Bilateral Capital Flows and Stylized Facts ........................................................... 10
4. Empirical Specifications and Data Sources.......................................................................... 14
5. Results and Analysis ..................................................................................................................... 18
5.1 Baseline Regressions: Determinants of Bilateral Capital Flows ......................... 18
5.2 Extension: Interaction Between Distance and VIX ................................................. 24
6. Concluding Remarks .................................................................................................................... 29
References ................................................................................................................................................ 30
Appendix ................................................................................................................................................... 33

Bilateral Capital Flows: Gravity, Push, and Pull 3
1. Introduction
The asset trade literature informs us that information frictions and economic ties are highly relevant in explaining cross-border capital flows and asset holdings. The seminal works of Portes, Rey and Oh (2001), and Portes and Rey (2005) on bilateral portfolio flows; and Aviat and Coeurdacier (2007), Buch (2005), and Lane and Milesi-Ferretti (2005a and 2005b) on bilateral portfolio and bank holdings provide both theoretical and empirical support on the significance of information frictions and economic ties on cross-border investments. Specifically, Portes, Rey and Oh (2001) and Portes and Rey (2005) suggested that distance is a proxy for information frictions or asymmetries. They argue that countries close to one another transact more through direct interaction such as business ties, frequent travels, media coverage, and language familiarity; than those farther apart. In addition, Coeurdacier (2009), Lane and Milesi-Ferretti (2005a), Rose and Spiegel (2002) and Rose (2005) provided theoretical justification on why economies with stronger economic ties, proxied by bilateral trade, have greater bilateral asset transactions and holdings. Consequently, voluminous papers show empirical support on the role of information frictions and trade ties on bilateral capital flows.2
Most empirical studies on asset trade literature focus on the role of information frictions on bilateral holdings in line with the role of information asymmetries on portfolio allocation. However, it is important to differentiate between holdings and flows in the context of information frictions and economic ties as holdings data include both changes in the flows as well as valuation effects. Consider the case when there is no change in bilateral asset purchases of Country A to Country B from time 1 to 2. Assume also that there is no change in exchange rate, if asset returns on existing holdings increase, the stock data will capture the increase in the value of existing stock; whereas transactions data will be zero. Hence, bilateral holdings data might capture the persistence of information frictions, while flows or transactions data reflect actual significance of information frictions at a given time.3 Assessing the relevance of information frictions on bilateral flows data is of interest to policy makers as varying global and domestic factors might exacerbate information frictions, which bilateral holdings data do not capture. In this regard, Mercado (2018a) provided empirical evidence on the role of information frictions and trade ties on bilateral capital flows using Balance of Payments Statistics data.
But standard capital flows literature points to the relevance of global (push) and domestic (pull) factors as the key determinants of capital flows size, volatilities, and occurrence of extreme episodes. To some extent, contagion factors are considered like geographic location, trade ties and financial openness (Forbes and Warnock, 2012; and Ghosh et al., 2014). Yet none of the empirical papers consider the role of information frictions and economic ties, alongside push and pull factors, due to lack of bilateral capital flows data that reflect aggregate bilateral flows as opposed to those which used specific types. This, then, raises the question: if the asset trade literature provides support on the importance of gravity factors on specific types of
2 Refer to Section 2 for detailed empirical literature review on the role of gravity factors on bilateral
capital flows. 3 This may explain the emergence of “distance puzzle” in asset trade literature, where the impact of
information frictions has grown over time (Brei and von Peter, 2018).

4 Bilateral Capital Flows: Gravity, Push, and Pull
bilateral flows, are capital flows also driven by gravity factors aside from push and pull factors?4 Providing robust evidence is the primary task of this paper.
But considering gravity factors, alongside push and pull factors, warrants justification. First, using bilateral capital flows data will extract partner domestic factors from global factors, more so if data is available for large advanced economies whose domestic policies affect global financial markets. This ensures that global factors are capturing true global factors and not domestic conditions of large partner economies. Second, more importantly, bilateral capital flows allow us to examine the importance of information frictions, financial centres, and economic ties which segments financial markets. This has profound policy implications as it adds another layer to the extent of domestic policy levers. Consider a case of an emerging economy pursuing a more open economic policy. Existing capital flows literature using the push and pull framework will point to the importance of economic fundamentals and structural reforms that will promote good governance, capital openness, and financial depth. But if information frictions segment international financial markets, policy design will leave out the importance of encouraging information flows which could counter information frictions. Moreover, if bilateral capital flows are responsive to bilateral economic ties, then stronger trade ties should be considered as another means of attracting larger bilateral capital flows. For these reasons, examining the importance of gravity factors with the usual push and pull factors is warranted.
By using bilateral capital flows data, this paper complements existing literature in several ways. First, it extends our understanding of the determinants of size or magnitude of capital flows by considering gravity factors; whereas previous papers consider only push and pull factors. Second, it also contributes to the asset trade literature by providing evidence of financial market segmentation at the aggregated bilateral level; in contrast to other papers which offer strong evidence using specific types of flows. Furthermore, although existing studies using one type of bilateral flows can offer granular analysis, they leave out investor portfolio reallocation across asset types and so we might miss the overall aggregate bilateral trends which are very important on economic outcomes such as exchange rate fluctuations.5 Third, it provides new insight on how capital flows behave when global uncertainty rises at given levels of distance (or information frictions). One would expect that as global uncertainty rises, the impact of information frictions increases; and financial transactions will decline more for country pairs that are farther apart. By interacting bilateral distance and a measure of global risk aversion, we can assess whether the decline in bilateral capital flows given an increase in global risk uncertainty, varies across distance. Do bilateral flows decrease more when global uncertainty rises the farther country pairs are? Put differently, do gravity factors, such as information frictions, exacerbate the negative impact of an increase in global risk on bilateral capital flows? This is the second question this paper asks.
4 In this paper, economic ties (proxied by bilateral imports) are considered as gravity factors as they
reflect weaker “multilateral resistance”, in line with Okawa and van Wincoop (2012). On the contrary, greater distance strengthens “multilateral resistance” due to stronger information frictions or asymmetries.
5 Consider a sudden move from bank borrowing to bond issuance (or vice versa), an increase in one and a decrease in the other are captured in bank and securities level data. But this scenario might cancel out in an aggregate bilateral level, and so a bilateral surge at a granular level does not inform us of the overall pattern in capital flows.

Bilateral Capital Flows: Gravity, Push, and Pull 5
To address these questions, we proceed as follows. We use bilateral capital flows data from Balance of Payments Statistics of 10 reporting advanced economies, including Austria, Canada, Denmark, Germany, Japan, Korea, Netherlands, New Zealand, Spain and United States. The data set covers the period 2000-2016 and includes 186 bilateral country pairs composing of advanced reporter and advanced partner; and advanced reporter and emerging partner economies.6 We exclude a large financial centre (United Kingdom) and offshore financial centres (Bermuda, British Virgin Islands, Cayman Islands, Channel Islands, Cook Islands, Cyprus, and Netherlands Antilles) as bilateral capital flows to these partner economies might be determined by other factors that have nothing to do with gravity, push or pull factors.7 We assemble data for bilateral financial asset flows along with its component flows including direct, portfolio, other assets, financial derivatives and reserve assets. Although we also compile data on bilateral financial liabilities, our focus is on bilateral financial asset flows to examine the bilateral asset flows of advanced economies. The bilateral capital flows data pertains to domestic resident financial asset flows with its partner economies, whose value can be positive or negative depending on whether domestic residents of reporting economy made net purchase or net sale of financial assets. We scale the bilateral flows data by the reporting economy’s nominal GDP to contextual flows in terms of size or magnitude.8
Next, we use the standard gravity equation in the asset trade literature to assess the importance of gravity factors. However, unlike Galstyan and Lane (2013), Galstyan, Lane, Mehigan, and Mercado (2016), Hellmanzik and Schmitz (2017), Lane and Milesi-Ferretti (2005a and 2005b), and Mercado (2018a), we exogenize push and pull factors by including global factors and domestic reporter and partner factors; and relying on time-invariant reporter and partner fixed effects to capture other unobserved heterogeneity.9 Moreover, we use lagged values for some domestic reporter and partner variables to address reverse causality, but we assume that global factors are exogenous, and hence included in the contemporaneous values in our regression specifications (Ghosh et al., 2014). We run a battery of sensitivity tests including sample and period splits; decomposing bilateral asset flows into direct, portfolio, and other asset flows; and using various specifications and global and domestic variables. Lastly, we interact distance with VIX to assess the marginal effects of an increase in global risk uncertainty on bilateral capital flows, at given levels of distance.
The results show that global factors such as global commodity price level and global risk aversion are consistently significant with expected signs. Moreover, reporter and partner domestic governance and reporter capital account openness are, likewise, significant. What is new is that gravity factors including distance and bilateral trade are statistically significant across various tests. However, the sensitivity tests involving period splits and annual regressions indicate that some of the gravity
6 Refer to Appendix Table A1 for the country classification of advanced and emerging partner
economies. 7 But we still conduct sensitivity test including a large financial centre (United Kingdom) and offshore
financial centres. The results hold and are discussed in Section 5. 8 Alternatively, we could have scaled the bilateral flows data with stock holdings of total foreign assets.
However, data for other investment assets would be restricted to banking sector asset holdings. Consequently, we opt to scale the bilateral flows data by reporter country nominal GDP.
9 In contrast, Galstyan, Lane, Mehigan, and Mercado (2016) and Mercado (2018a) used reporter plus year fixed effects and partner plus year fixed effects to capture time-varying reporter and partner effects.

6 Bilateral Capital Flows: Gravity, Push, and Pull
factors are relevant only in certain periods or years. In addition, by extending the analysis in the context of contagion, the findings offer evidence that an increase in global risk aversion has a uniform negative impact on bilateral capital flows, at different levels of distance. However, the negative impact of an increase in global risk aversion on bilateral capital flows decreases with distance. This means that bilateral capital flows decrease more between economies of closer geographic proximity and weaker information frictions, than those that are farther apart or with greater information asymmetries when global uncertainty rises. This new finding is highly intuitive as bilateral investments tend to be smaller for partner economies at a greater distance, and so the negative impact of an increase in global risk is less.
The contribution of this paper is thus threefold. First, this paper demonstrates an application of the importance of using bilateral capital flows data. Bilateral flows data can, likewise, be applied in the context of policy, risks, and crisis transmissions and spillovers. This will enrich our understanding of the patterns and risks associated with cross-border investments. Second, the results provide strong evidence on the importance of gravity factors in determining cross-border capital flows, which has not been considered in previous studies. The relevance of gravity factors calls for policy initiatives that can improve information flows and promote bilateral trade to attract more bilateral capital flows. These policy implications based on the empirical results of this paper have not been considered in the existing capital flows literature. Lastly, the findings provide new evidence showing that the negative impact of an increase in VIX on bilateral capital flows decreases with distance, offering new evidence of regional contagion, which could serve as a basis for greater regional cooperation at the policy level.
This paper proceeds as follows. Section 2 provides the literature review on the push and pull framework and gravity factors in the context of the determinants of the magnitude of capital flows. Section 3 discusses the bilateral capital flows and presents stylized facts; while Section 4 provides the empirical specifications and data sources. The baseline results and sensitivity tests are presented in Section 5, while the last section provides concluding remarks.
2. Related Literature and Conceptual Framework
Capital flows are driven by push and pull factors.10 Push factors are global factors which are beyond the control of domestic policy makers, while pull factors are domestic factors within the influence of policy makers. Push factors pertain to supply-side factors influencing cross-border financial transactions. In contrast, pull factors represent demand-side factors that attracts capital inflows. Existing studies on capital flows have tested the relevance of these two factors in determining the magnitude and volatilities of capital inflows and their component flows; occurrence of extreme episodes such as sudden stops and surges; size of capital flows during extreme episodes, and the proportion of variance attributed to each of these factors.11 The
10 See Koepke (2018) and Yeyati and Zuñiga (2015) on literature review on capital flows in the context
of push and pull factors. 11 Refer to Ahmed and Zlate (2014), Byrne and Fiess (2016), Fratzscher (2012), Giordani et al. (2017),
Mercado and Park (2011), Milesi-Ferretti and Tille (2011), Niel, Sedik, and Mondino (2014), and Wang (2018) on empirical tests of push and pull factors on the size or magnitude of capital flows; Broto et

Bilateral Capital Flows: Gravity, Push, and Pull 7
use of the push and pull framework as an analytical tool in understanding the covariates of capital flows hinges on the policy implications of their significance. If push factors are more relevant, policy makers have little control over capital flows and hence, they must rely on domestic financial resiliency to counter the adverse consequences of huge and volatile capital inflows. On the other hand, if pull factors are more relevant, policy makers have more levers to influence the size, composition, and volatility of cross-border financial inflows. Indeed, this simple framework brings about profound policy implications.
Empirical studies provide strong evidence for the relevance of push or global factors such as global or advanced economy output growth, global or U.S. interest rate, global commodity price levels, and more importantly, global investor risk aversion. Strong global growth improves investor optimism leading to higher cross-border investments, while lower growth in advanced economies increases capital inflows to emerging economies due to greater growth differentials between advanced and emerging economies, which signifies higher potential returns on the latter. Low global or U.S. interest rate initiates the search for higher yields and improves creditworthiness of emerging and developing economies, thereby raising cross-border flows (Fernandez-Arias, 1996; and Calvo et al., 1993). Global commodity price booms tend to channel capital flows to commodity exporting economies, more so in a low global interest rate environment (Reinhart and Reinhart, 2009). Moreover, the global financial crisis (GFC) of 2008-09 illustrates the importance of global investor risk aversion as the key determinant of retrenchment of capital flows back to advanced economies (Milesi-Ferretti and Tille, 2011). But the significance of these push factors varies with country income groups (either advanced or emerging economies or both), type of capital flows (direct investment, portfolio, and/or banking flows), period coverage (long sample versus specific periods such as pre-, crisis, and post-crisis periods), and types of capital flows considered (such as magnitude of gross or net inflows, volatilities of capital flows, and occurrence of extreme episodes).
More recent papers on the determinants of the size of capital inflows show that higher global growth is significantly correlated with higher inflows to emerging economies (Li et al., 2018), while higher global or U.S. interest rate is strongly associated with lower capital inflows to emerging economies (Byrne and Fiess, 2016; Giordani et al., 2017; Ghosh et al., 2014; Koepke, 2018; Li et al., 2018; and Mercado 2018b). Higher commodity prices tend to increase capital inflows to emerging and developing economies (Byrne and Fiess, 2016, Mercado 2018b, and Reinhart and Reinhart, 2009). In addition, greater global risk aversion leads to lower or reversals of cross-border inflows, more so during periods of financial stress (Ahmed and Zlate, 2014; Fratzscher, 2012; Ghosh et al., 2014; and Giordani et al., 2017).
Yet most studies also highlight the importance of pull or domestic factors. Strong output growth, lower macroeconomic risks (such as low domestic inflation), trade and financial openness, quality of governance, and financial depth of receiving economies are associated with larger capital inflows. Higher domestic growth signifies the attractiveness of an economy as an investment destination due to higher potential
al. (2011), Eichengreen et al. (2018), Mercado and Park (2011), and Neumann et al. (2009) on volatilities of capital flows; Calderon and Kubota (2013), Cavallo and Frankel (2008), Forbes and Warnock (2012), and Reinhart and Reinhart (2009) on the occurrence of sudden stops and/or surges; Ghosh et al. (2014), Li et al. (2018) and Mercado (2018a) on the occurrence of surges and associated magnitude of capital flows conditional on surges; Calvo et al. (1993) on global factor principal component analysis; and Cerutti et al. (2015), Chuhan et al. (1998), Puy (2016), Sarno et al. (2016), and Shirota (2015) on variance decompositions of global and domestic factors.

8 Bilateral Capital Flows: Gravity, Push, and Pull
profits (Giordani et al., 2017; and Mercado and Park, 2011). Lower or stable inflation signals macroeconomic policy stability and “discipline effect”, while higher domestic interest rate, relative to world or foreign interest rate, relates to higher expected returns (Li et al., 2018). Trade openness lowers the probability of debt default, while financial openness tends to attract more volatile capital inflows as foreign investors can easily repatriate their investments (Byrne and Fiess, 2016; Ghosh et al., 2014; Mercado and Park, 2011; and Mercado, 2018a). Better institutional quality or governance attracts more capital inflows as foreign investors have guarantee that contracts will be honoured, and they can safely repatriate their investments (Byrne and Fiess, 2016; and Mercado and Park, 2011). Financial depth in receiving economies attracts more capital inflows as it offers more opportunities for risk-sharing and consumption smoothing; and improves financial efficiency and resilience to financial shocks.
But empirical support on the relevance of pull factors, alongside push factors, tend to be weaker and more inconclusive as compared to push or global factors. The significance of domestic factors usually depends on specific periods, country coverage, and which factors are considered. For instance, Fratzscher (2012) established that common factors such as global liquidity and risk shocks were the key factors explaining the reduction in net portfolio inflows at the peak of the global financial crisis, although domestic factors like quality of institution, country risk, and strength of fundamentals were more dominant during the recovery period.12 This illustrates that the significance of domestic factors varies across time periods. Moreover, even studies using variance decompositions of global and domestic factors find that global factors explain the largest share of variation in capital inflows, while domestic factors explain less (Chuhan et al., 1998; Puy, 2016; and Sarno et al., 2016).
Aside from push and pull factors, several papers consider contagion as a relevant factor in determining the magnitude of capital inflows. The literature identifies three channels in which events affecting capital inflows in one country spillovers to another country. These include trade ties, financial linkages and country similarities (including geographic location). For example, Li et al. (2018) showed regional contagion to significantly increase portfolio inflows during surges, whereas Mercado (2018b) found that regional contagion, defined as half of economies in the region experiencing a surge episode, significantly reduces the size of gross capital inflows during surges as foreign investors might have allocated more capital flows to neighbouring economies which, likewise, are experiencing surges.
But contagion variables can be viewed as “gravity” factors because belonging to a geographic region entails shorter distance or closer proximity. In this context, capital inflows to economies that are closer to one another might be driven by similar push factors or might have similar pull factors which attract capital inflows at a given point in time. In the asset trade literature, Portes, Rey and Oh (2001) and Portes and Rey (2005) suggested that distance is a proxy for information frictions or asymmetries. They argue that countries close to one another transact more through direct interaction such as business ties, frequent travels, media coverage, and language familiarity. Several papers provide empirical evidence on the negative relation between distance and bilateral capital flows. Choi et al. (2014), Portes, Rey and Oh (2001); and Portes and Rey (2005) found negative covariation between bilateral portfolio equity flows and distance. Brei and von Peter (2018), Herrmann and Mihaljek
12 Ghosh et al. (2014) offered similar evidence on the occurrence of surges.

Bilateral Capital Flows: Gravity, Push, and Pull 9
(2013) and Papaioannou (2009) showed the inverse relation between bilateral bank flows using the Bank for International Settlements (BIS) Locational Banking Statistics and distance; while di Giovanni (2005) had similar results for foreign direct investment flows using Thomson Financial data on mergers and acquisitions (M&A) and distance. In contrast, Mercado (2018a) provided robust evidence on the negative covariation between distance and various types of bilateral capital inflows and outflows. His main finding offers new evidence on the importance of gravity factors and transaction costs at the aggregate level of bilateral capital flows, in contrast to other studies which used specific type of bilateral capital flows
Aside from distance, information frictions also include bilateral factors such as common language, common legal origins, and colonial ties. These time-invariant factors suggest the degree of similarity between countries. Common language and legal origins—which increase familiarity between country pairs—reduce information frictions, thereby increasing bilateral asset holdings and transactions. Specifically, common language fosters greater information flows as it reduces translation costs and increases access to available information. Common legal origins facilitate easier settlements and improves contract enforcement; while colonial ties increase similarities between two countries due to similar institutional set-up (Head and Ries, 2008).
Moreover, strong bilateral economic ties (such as bilateral trade) increase bilateral asset holdings. Several theories are proposed in the asset trade literature linking trade ties with asset holdings. Lane and Milesi-Ferretti (2005a) extended the Obstfeld and Rogoff (2000) model to N country case. The intuition is as follows. Country A does not trade with country B. But country A imports from country C. Suppose there is a productivity shock in country C which lower its prices, country A will suffer losses as it will import more from country C. To hedge against its losses, country A should hold portfolio assets of country C. Hence, higher trade leads to higher portfolio holdings. In contrast, Coeurdacier (2009) highlighted the role of lower trade cost, which increases bilateral trade. As trade intensifies, domestic firms face greater competition. To hedge against losses, a country must hold equity of foreign firms which directly compete with domestic firms. This explains the positive relation between trade and asset holdings. The second explanation is in line with Portes and Rey (2005). The intuition goes as follows: a shorter distance reduces information frictions and lowers transaction costs. These lead to higher bilateral trade. As information frictions decline, asset holdings also increase, more so when the equity market expands (Martin and Rey 2004). Third, Rose and Spiegel (2002) and Rose (2005) offered another theoretical framework in the context of debt default. The authors argue that countries fear debt default because it cuts them off from international capital markets and leads to trade reduction, hence output drop. Consequently, creditors favour debtor countries where they have greater trade ties. Several papers provide empirical support on the positive covariation between bilateral trade and bilateral capital flows, including di Giovanni (2005) for foreign direct investment flows; Portes and Rey (2005) on bilateral equity flows; Hermann and Mihaljek (2013) on bilateral bank flows, and Mercado (2018a) on various types of bilateral gross capital inflows and outflows.
However, there remains a gap in the literature. Although Mercado (2018a) offered empirical evidence on the relevance of gravity factors (including trade ties) on bilateral gross capital inflows and outflows (including their compositions), there is no existing study which combines it with push and pull factors. In other words, if capital flows are driven by global and domestic factors, and gravity factors are

10 Bilateral Capital Flows: Gravity, Push, and Pull
relevant in explaining bilateral capital flows, then bilateral capital flows must then be driven by gravity, push and pull factors. This is the main hypothesis in this paper. Combining these two strands of capital flows literature enriches our understanding of the drivers and patterns of capital flows in a bilateral context and provides policy implications as to what extent policy makers have control over capital inflows. Although policy makers do not have control over most gravity factors, they can certainly encourage information flows and economic ties with their partner economies.
3. Data on Bilateral Capital Flows and Stylized Facts
To examine the importance of gravity factors as one of the key determinants of cross-border financial flows, alongside global and domestic factors, this study utilizes bilateral Financial Account data from the Balance of Payments Statistics, following Mercado (2018a). Other studies on bilateral financial flows focus on one type of asset — mostly securities and bank flows — as there is a lack of comprehensive dataset covering all types of capital flows. For instance, Wang (2018) utilized BIS bilateral banking data flows to assess the role of gravity factors and domestic reporter and partner factors. Di Giovanni (2005) exploited Thomson Financials data on bilateral mergers and acquisitions to examine foreign direct investment flows. Choi et al. (2014) and Portes, Rey and Oh (2001) used U.S. Treasury International Capital data; while Portes and Rey (2005) used Cross Border Capital data to test the role of gravity factors on bilateral equity flows.
The main advantage of using bilateral capital flows data is that it provides aggregated total bilateral data comprising all kinds of bilateral investments such as direct, portfolio, and other investment assets. This offers greater understanding of bilateral cross-border investment patterns. For instance, di Giovanni (2005) did not consider bilateral asset transactions involving greenfield investments. Portes, Rey and Oh (2001) and Portes and Rey (2005) focused on bilateral equity flows which did not include bond flows. Wang (2018) excluded bilateral direct exposures of non-bank sectors in her analysis of bilateral banking flows, whereas all sectors are covered in other investment category of the bilateral Financial Account.13 More importantly, the data are mostly aligned with the Balance of Payments Manual 6 compiling standards, allowing standardised cross-country comparisons. However, there are disadvantages as well. First, there are very few countries which report bilateral Balance of Payments. For those that do, most partner economies are grouped or aggregated at the regional level due to confidentiality reasons. Second, bilateral capital flows mostly capture location of counterparties, which may or may not be the location of the ultimate owner, issuer, or beneficiary of financial transactions. This is particularly true for portfolio flows where cross-border transactions usually involve financial intermediaries and custodians located in financial centres such as London (Warnock and Cleaver, 2003). For this reason, bilateral capital flows data do not capture investor cross-border portfolio choice or allocation, although it informs us of cross-border financial transaction patterns.
13 Of interest, loans made by non-bank financial corporations to non-bank sector are not captured by
the BIS Banking Locational Statistics.

Bilateral Capital Flows: Gravity, Push, and Pull 11
Figure 1 illustrates a schematic diagram showing the complexities of using bilateral capital flows data. Figure 1 shows that some transactions are recorded based on the country of the ultimate issuer of a financial asset. But most bilateral transactions are reported based on the location of transacting counterparty such as those using financial intermediaries and/or custodians. In the latter case, the country location of the ultimate owner, issuer, or beneficiary may or may not be known. For example, if a company in the reporting country A acquires a company in country C through an intermediary in country B, bilateral transactions will be recorded between the reporting country A and country B, even if ownership is in country C. In practice, most countries report bilateral transactions based on the country location of the counterparty involved in that transaction. However, initiatives are made to report some categories of the bilateral Financial Account based on the location of the ultimate owner, issuer or beneficiary, such as the case of the Netherlands. Table 1 summarizes the bilateral capital flows data and indicates whether each functional category of the Financial Account refers to the country location of the transacting counterparty (TC) or the country location of the ultimate owner, issuer or beneficiary (UOIB). The table reveals that most values of the bilateral financial flows pertain to the country location of the transacting counterparty.
Figure 1: Schematic Diagram of Reporting - Bilateral Financial Assets Flows
The bilateral capital flows data are taken from Balance of Payments Statistics of 10 reporting central banks or statistics agencies, including Austria (Österreichische Nationalbank), Canada (Statistics Canada), Denmark (Danmarks Nationalbank), Germany (Deutsche Bundesbank), Japan (Bank of Japan), Korea (Bank of Korea), Netherlands (De Nederlandsche Bank), New Zealand (Stats NZ), Spain (Banco de España) and United States (Bureau of Economic Analysis).14 Values are mostly presented in local currency units. To standardize across countries, values are converted to US dollar using the average foreign exchange rate taken from the International Financial Statistics of the IMF.15 The data covers annual values from
14 There are other countries which could have been included in the data set. For instance, France reports
bilateral capital flows for direct and portfolio investments, but not for other investments which could have been supplemented by using bilateral bank flows from the BIS locational banking statistics. However, we opt to restrict our sample to those countries which report the complete functional categories of the Balance of Payments. Nonetheless, the sample size is representative of the global sample given the inclusion of the United States, Japan, and Germany. On the average, the sample accounts for around 25% of world total bilateral holdings of direct and portfolio investments and bank claims.
15 Given that we used nominal GDP of the reporting country in US dollars, we remove any exchange rate effects in our bilateral capital flows.
A
Reporter B
C
flow of BOP

12 Bilateral Capital Flows: Gravity, Push, and Pull
2000 to 2016. For some countries, quarterly or monthly data in USD millions are added annually. Confidential and unavailable data are treated as missing values; whereas zeros are included as they are. Reported values follow the Balance of Payments Manual 6 (BPM6), but in cases where values are based on Balance of Payments Manual 5, e.g. Japan for 2000-2013, bilateral assets flows are multiplied by -1 in lieu of BPM6 convention of having a positive sign to indicate an increase in assets. We exclude a large financial centre (United Kingdom) and offshore financial centres (Bermuda, British Virgin Islands, Cayman Islands, Channel Islands, Cook Islands, Cyprus, and Netherlands Antilles) from the dataset as bilateral capital flows to these partner economies might be determined by other factors. In total, our data set covers 186 bilateral pairs, as reported in Table 1.
Table 1: Summary of Bilateral Financial Flows
Notes: TC = country location of the transacting counterparty. UOIB = country location of ultimate owner, issuer, and beneficiary. Estimates (est) for Austria and the Netherlands are based on aggregate portfolio liabilities weighted using derived values from the IMF’s Coordinated Portfolio Investment Survey. Data classification for Korea is assumed to be based on the country location of the transacting counterparty as no confirmation was given. A = annual, Q = quarterly, and M = monthly. Bilateral financial account flows are sourced from reporting central banks or statistics agencies.
The various types of bilateral capital asset flows include foreign direct investment assets (FDIA), portfolio assets (PORTA), and other investment assets (OIA).16 If
16 Reporting economies also report the bilateral breakdown of their financial derivatives and reserve
assets and financial account liabilities across various functional categories where available. However, the focus of our analysis is more to the three main components of capital flows. For Austria, foreign
Uni
ted
Stat
es
Cana
da
Aust
ria
Den
mar
k
Ger
man
y
Net
herla
nds
Spai
n
Japa
n
Kore
a
New
Zea
land
Foreign Direct Investments Assets (FDIA) TC TC TC TC TC UOIB TC TC TC TC Liabilities (FDIL) TC TC TC TC TC TC TC TC TC TCPortfolio Investments Assets (PORTA) UOIB TC TC UOIB TC UOIB TC TC TC TC Liabilities (PORTL) TC TC (est) TC TC (est) TC TC TC TCFinancial Derivatives Assets (DERA) TC TC TC TC TC
Liabilities (DERL) TC TC TC TC
Other Investment Assets (OIA) TC TC TC TC TC UOIB TC TC TC TC Liabilities (OIL) TC TC TC TC TC TC TC TC TC TCReserve Assets (RESA) TC TC TC TC
Frequency Q Q Q M Q A A Q A AStart Year 2003 2000 2001 2005 2000 2004 2013 2000 2006 2000End Year 2016 2016 2016 2016 2016 2016 2016 2016 2016 2016No. of Counterparty 20 2 13 34 32 22 6 31 3 23

Bilateral Capital Flows: Gravity, Push, and Pull 13
bilateral total assets and liabilities are given, they are used in the data set. If not, total assets are computed as the sum of direct, portfolio, financial derivative, other investment and official reserve assets whenever data are available.17 Following the naming convention in the capital flows literature, bilateral asset transactions refer to gross capital outflows, which pertains to domestic resident’s net financial acquisitions of foreign assets. Bilateral financial account assets and liabilities data are not the mirror image of each other as resident financial transactions with non-resident counterparties are not equal to non-resident financial transactions with resident counterparties.
To preview the data set, Table 2 presents the values of bilateral financial asset flows of selected reporting to partner economies in 2016. The striking pattern we see is that there is huge variation of reporting country asset transactions with its partner economies. For instance, Japanese investors sell off assets in Germany but acquired more asset transactions with the United States in the same year. But Japan’s reversal of asset flows to Germany was primarily directed to portfolio and financial derivative assets. This illustrates that the bilateral capital flows capture actual financial transaction flows which informs us of resident investor portfolio rebalancing among different asset types across partner economies in each period.
Table 2: Bilateral Financial Asset Flows, 2016
(in USD billion)
Notes: … = data unavailable. Values were converted to USD using average foreign exchange rate from the International Financial Statistics of the IMF. Bilateral financial account flows data are sourced from reporting central banks or statistics agencies.
Table 3 provides descriptive statistics on bilateral capital flows in percent of the reporting economy’s nominal GDP. Several observations are noted. For the full sample period of 2000-16, the average bilateral total financial asset flows were about 0.3% of the reporting economy’s nominal GDP. Bilateral asset flows were mostly in the form of direct and portfolio assets. In contrast, the relative size of average bilateral asset flows was smallest for other investments at around 0.06%. Total bilateral asset flows to advanced economies were, on average, around 0.4% of reporting economy’s
direct investment data mostly include direct investments of Special Purpose Entities (SPEs) and the real estate sector. However, for some economies, reported foreign direct investment assets and liabilities exclude these items.
17 Data on financial derivative assets and liabilities and reserve assets are available for a limited number of countries. Moreover, financial derivative assets are reported mostly in net terms. For these reasons, analysis involving different types of capital flows are restricted to the main functional categories. Nonetheless, data on derivatives and reserves are included in computing total financial assets flows.
Reporter Partner FINA FDIA PORTA DERA OIA RESA
United States Germany -4.36 5.92 -16.56 … 6.28 …United States Japan 71.81 2.27 35.11 … 34.43 -0.01Germany United States 57.31 13.35 33.70 0.80 9.46 …Germany Japan 2.89 1.02 -3.92 -0.60 6.38 …Japan United States 176.41 52.21 163.70 -97.54 58.03 …Japan Germany -1.56 2.33 -5.68 -9.97 11.77 …

14 Bilateral Capital Flows: Gravity, Push, and Pull
nominal GDP, which was more than twice the total bilateral asset flows to emerging economies. This implies that bilateral financial transactions are larger for advanced partner economies than with emerging partner economies. Across sub-periods, the average bilateral asset flows were highest in the pre-global financial crisis period of 2000-07. In fact, the average bilateral direct and portfolio investment assets flows were around 0.2% of reporting economy’s nominal GDP. Compared to the pre-crisis period, both crisis and post-crisis years witnessed a significant decline in bilateral asset flows, particularly for both portfolio and other investment asset flows which include banking flows. However, the decline in bilateral asset transactions was greater for other investments, as compared to portfolio investments.
Table 3: Bilateral Financial Asset Flows - Descriptive Statistics (% of reporting economy nominal GDP)
Taken together, these stylized facts show bilateral financial asset flows of advanced reporting economies: 1) exhibit significant variation across partner economies; 2) mostly between reporter and partner advanced economies; 3) usually in the form of foreign direct investments; and 4) are very large in the pre-crisis period.
4. Empirical Specifications and Data Sources
To address the first question on the significance of gravity factors, alongside push (global) and pull (domestic) factors, we use the gravity equation from the asset trade literature, following Galstyan and Lane (2013), Galstyan, Lane, Mehigan, and Mercado (2016), Hellmanzik and Schmitz (2017), Lane and Milesi-Ferretti (2005a and 2005b), and Mercado (2018a). However, unlike these papers, we exogenize time-varying
Obs Mean Std. Dev. Min Max Obs Mean Std.
Dev. Min Max Obs Mean Std. Dev. Min Max
Total Financial Account Assets 2,713 0.31 1.36 -12.49 30.62 1,867 0.39 1.59 -12.49 30.62 846 0.13 0.51 -1.64 5.60Foreign Direct Investment Asse 2,566 0.16 1.06 -18.81 28.60 1,773 0.18 1.24 -18.81 28.60 793 0.10 0.44 -1.76 5.25Portfolio Investment Assets 2,660 0.12 0.51 -3.87 4.60 1,844 0.16 0.60 -3.87 4.60 816 0.02 0.09 -0.51 1.39Financial Derivative Assets 1,718 -0.03 0.32 -4.13 6.50 1,188 -0.04 0.39 -4.13 6.50 530 0.00 0.02 -0.14 0.18Other Investment Assets 2,647 0.06 0.50 -5.29 6.82 1,812 0.08 0.60 -5.29 6.82 835 0.01 0.17 -0.96 2.28Reserve Assets 716 0.01 0.25 -2.01 2.41 510 0.02 0.29 -2.01 2.41 206 0.00 0.00 0.00 0.02Total Financial Account Liabiliti 2,697 0.16 2.01 -18.03 44.47 1,853 0.22 2.41 -18.03 44.47 844 0.05 0.32 -2.43 2.88Net Financial Account Assets 2,730 0.15 1.84 -23.12 23.71 1,875 0.18 2.18 -23.12 23.71 855 0.08 0.55 -2.99 5.02
Full Sample Bilateral Pairs Advanced Partner Economies Emerging Partner EconomiesVariable
Obs Mean Std. Dev. Min Max Obs Mean Std.
Dev. Min Max Obs Mean Std. Dev. Min Max
Total Financial Account Assets 1,080 0.42 1.44 -4.81 30.62 358 0.21 1.36 -8.95 10.80 1275 0.25 1.28 -12.49 24.00Foreign Direct Investment Asse 1,012 0.17 1.06 -2.77 28.60 338 0.12 0.75 -7.14 5.53 1216 0.16 1.13 -18.81 24.57Portfolio Investment Assets 1,048 0.16 0.49 -3.70 3.83 353 0.08 0.50 -2.65 4.30 1259 0.09 0.52 -3.87 4.60Financial Derivative Assets 658 -0.02 0.20 -2.42 3.09 236 -0.05 0.32 -3.16 1.45 824 -0.03 0.39 -4.13 6.50Other Investment Assets 1,057 0.11 0.52 -5.29 6.82 347 0.02 0.61 -4.26 4.00 1243 0.03 0.45 -4.21 4.80Reserve Assets 215 -0.01 0.07 -0.38 0.41 112 0.10 0.36 -0.19 2.41 389 0.00 0.27 -2.01 1.63Total Financial Account Liabiliti 1,070 0.38 2.13 -10.02 44.47 359 0.08 1.72 -12.88 8.03 1268 0.00 1.96 -18.03 16.27Net Financial Account Assets 1,088 0.04 1.54 -23.12 10.17 360 0.13 1.89 -8.03 13.31 1282 0.24 2.04 -11.27 23.71
Variable2000-07 2008-09 2010-16

Bilateral Capital Flows: Gravity, Push, and Pull 15
common factors, which are global factors, as well as time-varying reporter and partner factors, which corresponds to domestic reporter and partner factors. Specifically, we estimate the following equation:
, , 1 , , ,ij t i j ij ij t t i t j t ij tCF d h g r pα α θ φ β δ γ ε−= + + + + + + + Equation (1)
where ,ij tCF refers to bilateral capital flows from reporter country i to partner
country j at year t. iα and jα are time-invariant reporter and partner dummy
variables, respectively. ijd θ is a row vector of bilateral time-invariant gravity
variables including distance, common legal origins, and common spoken language.
, 1ij th θ− captures the time-varying bilateral factor, specifically lagged bilateral trade
ties. tg β is a row vector of global factors which are common across bilateral pairs
but varies by year. ,i tr δ and ,j tp γ are row vectors of reporter and partner country
domestic factors, respectively. ,ij tε pertains to clustered standard errors at bilateral
pair.
The inclusion of time-invariant reporter and partner fixed effects reduces endogeneity by controlling for unobserved heterogeneity in the sample. Moreover, time-varying bilateral factor and reporter and partner domestic GDP growth and interest rate are replaced by their one-year lagged values to address reverse causality. Like Ghosh et al. (2014) and Li et al. (2018), we use contemporaneous values for global factors as these are exogeneous factors. However, unlike Ghosh et al. (2014), we do not use lagged values for some of the domestic reporter and partner factors such as quality of governance, capital account openness, and financial depth as these are slow moving factors in our data set which runs from 2000-16.18 Equation (1) is consistent with the theoretical model of Okawa and van Wincoop (2012) and the estimation approach suggested by Baldwin and Taglioni (2007). As discussed in the previous section, the time-varying bilateral factor, proxied by bilateral trade, is considered a gravity factor as stronger trade ties mean weaker multilateral resistance between bilateral pairs. We use ordinary least squares estimation with clustered standard errors at the bilateral level.
The bilateral capital flows data are expressed in percent of reporting country’s nominal GDP, following Aviat and Coeurdacier (2007) and Mercado (2018a). Scaling bilateral flows in terms of nominal GDP allows us to interpret the coefficients in terms of relative size instead of elasticities as widely used in the asset trade literature. An advantage of using relative magnitude is that it addresses the issue of having zeros and negative values in the data set due to capital flow reversals. The time-invariant gravity factors are measures of information frictions. We expect distance to reduce bilateral flows, while common spoken language and common legal origins to increase bilateral transactions as they proxy for familiarity or similarity between country pairs. The time-varying gravity factor captures trade ties between country pairs. We expect that as economic ties between two economies increase so will their financial
18 We conduct sensitivity test using lagged values of all the reporter and partner domestic factors. The
baseline results hold.

16 Bilateral Capital Flows: Gravity, Push, and Pull
transactions. For time-varying global factors, we consider global GDP growth, global interest rate, global commodity price level, and global risk aversion. We expect bilateral capital flows to increase when global growth is high; when global interest rate is high; when global commodity price levels drop; and when global investor risk aversion is low. For reporter and partner domestic factors, we consider GDP growth and interest rate to capture growth and interest rate differentials between reporter and partner economies as well as between reporter economies and global factors. In addition, we also consider governance, capital account openness, and financial depth. We expect bilateral capital flows to partner countries to increase on better governance, less capital account restrictions, and well-developed financial market.
Data on bilateral capital flows pertain to financial assets flows (FINA) sourced from central banks or statistics agencies of advanced reporting economies. This data captures the advanced economy domestic resident financial asset flows to the partner economy (not bilateral net financial asset flows).19 Values are scaled by the nominal GDP of the reporting country, taken from the World Economic Outlook Database. Distance (distance) is in log value of the population-weighted distance between country pairs. Common legal origins (legal_origin) is a dummy variable with a value of 1 if a country pair has a common legal origin; and 0 otherwise. Data are sourced from Head, Mayer, and Ries (2010). Common spoken language (common_language) is included as a variable ranging from 0 to 1 where a higher value indicates greater common spoken language between country pairs. The data are taken from Melitz and Toubal (2014). Data on bilateral trade (bilateral_trade) is the lagged values of bilateral imports between reporter and partner countries in percent of reporting country’s nominal GDP, sourced from IMF’s Direction of Trade Statistics and World Economic Outlook Database.
Global GDP growth (global_growth) is the year-on-year percent change of real global GDP, sourced from IMF’s World Economic Outlook Database. Global interest rate (global_interest_rate) refers to the weighted average of long-term interest rate across countries using GDP in constant prices as weights. Data is sourced from Oxford Economics. Global commodity price index (commodity_price) pertains to the All Commodity Price Index, which includes both fuel and non-fuel price indices, with base year set in 2005 (2005 = 100). The annual index is the average value of monthly price index, taken from IMF’s Commodity Price Database. Global risk aversion (VIX) is the annual average value of CBOE VIX accessed through Datastream. Domestic reporter and partner GDP growth rates (o_d_growth and p_d_growth) are year-on-year percent change of real GDP, sourced from IMF’s World Economic Outlook Database. Domestic reporter and partner interest rates (o_d_interest_rate and p_d_interest_rate) are mostly annual long-term government bond yields of reporter and partner economies sourced from the IMF’s International Financial Statistics. If data are unavailable, domestic interest rate refers to lending rate, also taken from the International Financial Statistics. Domestic reporter and partner governance indicators (o_d_governance and p_d_governance) are the unweighted average of percentile ranking of control of corruption, government effectiveness, political stability and absence of violence, regulatory quality, rule of law, and voice and accountability. Reporter and partner capital account openness indices (o_d_kaopen and p_d_kaopen) are the standardized Chinn-Ito Capital Account Index (Chinn and
19 We focus on bilateral asset flows and not bilateral net asset flows as the latter will account for bilateral
liabilities flows. The interest in this paper is primary on advanced reporting economy’s cross-border asset transactions, which is more informative in the perspective of partner economies.

Bilateral Capital Flows: Gravity, Push, and Pull 17
Ito, 2006) scaled to 100. Domestic reporter and partner financial depth indicators (o_d_financial_depth and p_d_financial_depth) refer to domestic credit provided by the financial sector in percent of nominal GDP. Data are taken from the World Bank’s World Development Indicators. Table 4 presents summary statistics of the gravity, push and pull factors.
Table 4: Regressors Descriptive Statistics
Notes: Distance is taken from CEPII Database. Bilateral trade, global growth, commodity price, domestic growth, and domestic interest rates are taken from various databases of the International Monetary Fund. VIX taken from CBOE. Global interest rate taken from Oxford Economics. Reporter and partner governance and financial depth indicators are sourced from various data sets of World Bank. Capital Openness Index taken from Chinn and Ito (2006).
To address the second question on whether the negative impact of global risk aversion on bilateral financial asset flows varies with distance, we re-estimate Equation (1) without pull factors which are now subsumed in the country fixed effects and add an interaction term for distance and VIX. Specifically, we estimate:
, , 1 ,ij t i j ij ij t t t ij ij tCF d h g VIX distα α θ φ β ϕ ε−= + + + + + × + Equation (2)
where t ijVIX dist× captures the interaction between global risk aversion and
distance. ijd θ and tg β still include both distance and global risk aversion,
respectively. However, unlike standard interaction terms involving continuous and dummy variables, both distance and VIX are continuous variables in Equation (2). This complicates the interpretation of the estimated coefficient of the interaction term ϕ
Variables Mean Std. Dev. Min Maxdistanceij 8.144 1.221 5.483 9.847common_legalij 0.231 0.422 0.000 1.000common_languageij 0.353 0.306 0.000 0.994bilateral_tradeij,t-1 1.012 2.072 0.001 22.123global_growtht 3.856 1.387 -0.150 5.558global_interest_ratet 4.381 0.875 2.675 5.994commodity_pricet 121.884 46.445 58.246 192.571VIXt 20.814 6.808 11.560 40.000o_d_growthi,t-1 1.643 2.094 -5.563 11.309o_d_interest_ratei,t-1 3.402 1.672 0.350 8.720o_d_governancei,t 91.024 5.892 70.757 98.792
o_d_kaopeni,t 99.256 6.052 41.451 100.000o_d_financial_depthi,t 194.397 65.323 70.940 345.722p_d_growthi,t-1 3.009 3.473 -14.814 25.486p_d_interest_ratei,t-1 6.308 9.147 -0.080 183.200p_d_governancei,t 74.679 20.819 8.225 99.756p_d_kaopeni,t 78.777 30.660 0.000 100.000p_d_financial_depthi,t 129.553 66.503 0.230 345.722

18 Bilateral Capital Flows: Gravity, Push, and Pull
. Consequently, we refer to the marginal effects of the estimated continuous interaction term to estimate the amount of change in bilateral financial asset flows with one-unit change in global risk aversion (VIX) while holding bilateral distance at different values. As in the previous specification, we estimate Equation (2) using ordinary least squares with clustered standard errors at the bilateral pair level.
5. Results and Analysis
5.1 Baseline Regressions: Determinants of Bilateral Capital Flows
Baseline Results. Table 5 presents the baseline regressions on the determinants of bilateral financial asset flows. Various specifications are presented, including gravity factors with reporter, partner, and year fixed effects (Column 1); gravity and global factors with reporter and partner fixed effects (Column 2); gravity and domestic reporter and partner factors with time, reporter, and partner fixed effects (Column 3); and gravity, global, and domestic factors of origin and partner economies with reporter and partner fixed effect (Column 4) For each specification, we report marginal R2 to assess the incremental improvement in the explanatory power of the regression model with the inclusion of gravity factors.20 The reported values for the marginal R2 indicate that gravity factors improved the model’s explanatory power by around 20%, suggesting the importance of including gravity factors in explaining total variation in bilateral capital flows.
The baseline results show that bilateral asset flows are highly responsive to information frictions, proxied by bilateral distance (Column 4). This is consistent with existing findings using bilateral transactions data from Brei and von Peter (2018), Choi, Rhee and Oh, 2014, di Giovanni (2005), Mercado (2018a), Portes and Rey (2005), and Portes, Rey and Oh (2001). Specifically, doubling the distance between two economies reduces financial asset flows, on the average, by about 0.03% of the reporting country’s GDP.21 For other familiarity variables, both common legal origins and common spoken language have the correct signs but are insignificant. Moreover, the results offer strong evidence on the significance of bilateral trade ties, such that a one unit increase in bilateral trade raises bilateral asset transactions by around 0.12% of reporting country’s nominal GDP.
In terms of global factors, the estimates show that higher global investor risk aversion significantly reduces bilateral financial asset transactions of advanced economies, which is consistent with results using aggregated capital flows data. For instance, a unit increase in VIX reduces bilateral transactions by around 0.01% of reporting economy’s nominal GDP. For global commodity price, the estimate is significant but with a negative sign. This implies that as global commodity price levels increase, bilateral capital flows decrease. For domestic factors, the results indicate that better governance in reporting and partner economies significantly covary with higher bilateral financial asset flows. Moreover, there is evidence that more financially open economies have significantly higher financial asset transactions. Although
20 Marginal R2 is computed as 1-(RSS/RSSc) where RSS is the residual sum of squares in a regression
specification with gravity factors, while RSSc is the residual sum of squares in a regression specification without gravity factors.
21 Calculated as log(2)*-0.107 = -0.03.

Bilateral Capital Flows: Gravity, Push, and Pull 19
insignificant, domestic reporter and partner GDP growth indicate opposing signs. When domestic growth in the reporting country increases, bilateral asset flows tend to be smaller. When domestic growth in partner country increases, bilateral asset flows tend to increase. Such asymmetries, albeit insignificant, are only observed using bilateral capital flows data.
Table 5: Baseline Determinants of Bilateral Financial Asset Flows
Notes: Dependent variables are total bilateral financial asset flows in % of reporting economy nominal GDP. Marginal R2 is computed as 1-(RSS/RSSc) where RSS is the residual sum of squares in a regression specification with gravity factors, while RSSc is the residual sum of squares in a regression specification without gravity factors. Clustered standard errors (bilateral pairs) are in parenthesis. *** p<0.01, ** p<0.05, * p<0.1.
(1) (2) (3) (4)
distanceij -0.107* -0.106* -0.108* -0.107*(0.058) (0.058) (0.058) (0.058)
legal_originij 0.033 0.032 0.033 0.033(0.080) (0.080) (0.080) (0.080)
common_languangeij 0.520 0.516 0.516 0.514(0.393) (0.390) (0.393) (0.390)
bilateral_tradeij,t-1 0.122** 0.123** 0.121** 0.122**(0.048) (0.048) (0.048) (0.048)
global_growtht 0.006 0.015(0.023) (0.031)
global_interest_ratet 0.083** 0.078(0.034) (0.064)
commodity_pricet -0.001** -0.001*(0.000) (0.001)
VIXt -0.015** -0.011**(0.006) (0.006)
reporter_growthi,t-1 -0.009 -0.006(0.014) (0.014)
reporter_interest_ratei,t-1 -0.066 -0.008(0.053) (0.038)
reporter_governancei,t 0.021 0.028*(0.019) (0.016)
reporter_kaopeni,t 0.020** 0.016*(0.010) (0.009)
reporter_financial_depthi,t 0.000 -0.002(0.003) (0.002)
partner_growthi,t-1 0.001 0.005(0.007) (0.005)
partner_interest_ratei,t-1 -0.005 -0.005(0.005) (0.005)
partner_governancei,t 0.016** 0.014*(0.008) (0.007)
partner_kaopeni,t -0.001 -0.000(0.002) (0.002)
partner_financial_depthi,t 0.000 0.000(0.001) (0.001)
Observations 2,713 2,713 2,713 2,713R-squared 0.208 0.205 0.210 0.207Marginal R-squared 0.045 0.045 0.045 0.045Country F.E. Yes Yes Yes YesPartner F.E. Yes Yes Yes YesYear F.E. Yes No Yes No

20 Bilateral Capital Flows: Gravity, Push, and Pull
Sensitivity Tests. The relevance of gravity factors, particularly distance and bilateral trade, holds across various specifications and sensitivity tests. First, we test whether the baseline results hold when we decompose bilateral financial account asset flows into its component flows. The standard capital flows literature highlights the importance of considering the composition of capital flows as they are driven by varying determinants. The findings, shown in Table 6, suggest that information frictions remain significant across different types of flows including direct, portfolio, and other asset flows. However, bilateral trade is insignificant for portfolio asset flows, although it is relevant for both direct and other asset flows. Importantly, foreign direct investment flows appear to be highly responsive mainly to gravity factors, whereas portfolio and other investment flows are responsive to both gravity and push factors. These results illustrate the varying sensitivities of various types of investments to gravity, push, and pull factors. Second, we also test whether gravity factors will remain significant when we split the partner economies into advanced and emerging economies. It is possible for information frictions, proxied by distance and other time-invariant bilateral factors, to be more relevant for emerging partner economies, possibly due to more informational flows between advanced reporting and partner economies. Table 7 confirms that information friction is significant between advanced and emerging country pairs, while bilateral trade is relevant for advance reporting and partner country pairs. However, we find that common legal origins between advanced and emerging country pairs to significantly increase bilateral asset transactions. We also run a test removing United States, Japan, and Germany which are the three largest advanced economies that are also financial centres in the sample. The results stay the same.
Next, we split the sample into pre-crisis (2000-07) and post-crisis (2010-16) periods to determine whether gravity factors hold across periods. Moreover, we run annual regressions validating the significance of bilateral distance and bilateral trade. Table 8 indicates that information frictions are more relevant during the pre-crisis; whereas trade ties remain significant across periods. To further validate the baseline results, we run annual regressions in a cross-sectional set-up from 2003 to 2016, where we abstract from global factors. The results indicate that gravity factors do not consistently explain bilateral asset flows. This suggests that information frictions and even bilateral trade ties might have time-varying significance on bilateral asset transactions (flows).
We run several more tests to validate the baseline results. First, instead of clustering standard errors at the bilateral country pair, we use robust standard errors. Second, to further reduce endogeneity due to reverse causality, we use lag values of all domestic regressors including reporter and partner governance, capital account openness, and financial depth. In both tests, the results are mostly the same. Third, when we lagged global factors, gravity factors stayed significant. Global factors also remained significant, although marginally. Fourth, we correct for sample outliers by winsorising bilateral financial asset flows at the bottom and top 10% of the bilateral country sample. In all these tests, both gravity factors, including distance and bilateral trade are significant with the same sign, alongside push and pull factors.
We also conducted sensitivity test by including bilateral pairs where the partner country is a global financial centre (e.g. United Kingdom) or an offshore financial centre (Bermuda, British Virgin Islands, Cayman Islands, Channel Islands, Cook Islands, Cyprus, and Netherlands Antilles). Bilateral capital flows might gravitate towards large

Bilateral Capital Flows: Gravity, Push, and Pull 21
financial markets which are centres of financial intermediation such as London; or tax-haven economies. The results concur with the baseline estimates. Gravity factors, including distance and bilateral trade; as well as global and domestic factors are significant.
Gravity factors remain significant, alongside global and domestic factors, under alternative measures on global, and domestic factors. Using advanced economy GDP growth taken from the IMF’s World Economic Outlook Database, instead of global GDP growth, produce similar findings. The same is true when we replace global interest rate with global liquidity measure from the Bank for International Settlements. Using global commodity price inflation, instead of price level, show the same results. However, global commodity inflation is insignificant, implying that bilateral flows are responsive to commodity price levels rather than price changes. The main results remain mostly the same when we change governance with political stability, taken from World Bank’s World Governance Indicators, although reporter and partner governance lose significance. Using stock market capitalization as a percent of nominal GDP, from World Bank’s World Development Indicators, as a measure of financial depth, likewise, yield consistent results. The same is true when we use domestic real interest rate, by taking the difference between nominal interest rate and domestic consumer price inflation sourced from the IMF’s World Economic Outlook Database.
In summary, the baseline results show that gravity factors, such as distance and trade ties, are significant determinants of bilateral financial asset flows, alongside push and pull factors like global risk aversion, reporter and partner governance and reporter capital account openness. These results hold across various specifications and sensitivity tests. However, we find evidence that information frictions and bilateral trade ties have time-varying significance.

22 Bilateral Capital Flows: Gravity, Push, and Pull
Table 6: Determinants of Different Composition of Bilateral Financial Asset Flows
Notes: Dependent variables are bilateral direct investment assets (FDIA), portfolio assets (PORTA) and other investment assets (OIA) flows in % of reporting economy nominal GDP. o_d_ refers to reporting country domestic factor. p_d_ pertains to partner country domestic factor. Clustered standard errors (bilateral pairs) are in parenthesis. *** p<0.01, ** p<0.05, * p<0.1.
(1) (2) (3) (4) (5) (6) (7) (8) (9)VARIABLES
distanceij -0.061** -0.060* -0.061** -0.079*** -0.080*** -0.080*** -0.019* -0.019* -0.020*(0.031) (0.031) (0.030) (0.024) (0.024) (0.024) (0.011) (0.011) (0.011)
legal_originij 0.038 0.039 0.037 0.012 0.012 0.014 0.011 0.011 0.012(0.073) (0.073) (0.073) (0.026) (0.026) (0.026) (0.023) (0.023) (0.023)
common_languangeij 0.112 0.109 0.109 -0.142 -0.144 -0.144 0.036 0.036 0.035(0.280) (0.276) (0.276) (0.107) (0.106) (0.106) (0.072) (0.072) (0.072)
bilateral_tradeij,t-1 0.049*** 0.050*** 0.050*** 0.028 0.028 0.028 0.040*** 0.040*** 0.040***(0.018) (0.018) (0.018) (0.024) (0.024) (0.023) (0.007) (0.007) (0.007)
global_growtht 0.012 0.030 -0.006 -0.020* 0.004 0.013(0.023) (0.035) (0.013) (0.012) (0.011) (0.012)
global_interest_ratet 0.006 -0.009 0.014 0.011 0.053*** 0.041(0.019) (0.042) (0.013) (0.028) (0.015) (0.028)
commodity_pricet -0.000 -0.000 -0.001*** -0.001*** -0.000 0.000(0.000) (0.000) (0.000) (0.000) (0.000) (0.000)
VIXt -0.005 -0.000 -0.003 -0.006** -0.008*** -0.005*(0.003) (0.004) (0.003) (0.003) (0.003) (0.003)
reporter_growthi,t-1 0.015 -0.018*** 0.001(0.015) (0.005) (0.007)
reporter_interest_ratei,t-1 0.003 0.007 -0.001(0.026) (0.016) (0.016)
reporter_governancei,t -0.005 0.020*** 0.010*(0.011) (0.006) (0.006)
reporter_kaopeni,t 0.003 0.005 0.010***(0.002) (0.009) (0.003)
reporter_financial_depthi,t -0.001 -0.000 -0.001(0.001) (0.001) (0.001)
partner_growthi,t-1 -0.002 0.002 0.003(0.003) (0.002) (0.003)
partner_interest_ratei,t-1 -0.004 -0.000 -0.001(0.005) (0.001) (0.001)
partner_governancei,t 0.002 0.007** 0.006*(0.003) (0.003) (0.004)
partner_kaopeni,t -0.001 0.001* -0.000(0.002) (0.000) (0.001)
partner_financial_depthi,t 0.001 -0.000 0.000(0.000) (0.001) (0.001)
Observations 2,566 2,566 2,566 2,660 2,660 2,660 2,647 2,647 2,647R-squared 0.107 0.101 0.102 0.234 0.225 0.232 0.089 0.081 0.084Country F.E. Yes Yes Yes Yes Yes Yes Yes Yes YesPartner F.E. Yes Yes Yes Yes Yes Yes Yes Yes YesYear F.E. Yes No No Yes No No Yes No No
FDIA PORTA OIA

Bilateral Capital Flows: Gravity, Push, and Pull 23
Table 7: Determinants of Bilateral Financial Asset Flows - Partner and Reporter Economy Splits
Notes: Dependent variables are total bilateral financial asset flows in % of reporting economy nominal GDP. o_d_ refers to reporting country domestic factor. p_d_ pertains to partner country domestic factor. See country classification list for advanced and emerging economy sample. Large advanced economies include Germany, Japan, and United States. Clustered standard errors (bilateral pairs) are in parenthesis. *** p<0.01, ** p<0.05, * p<0.1.
(1) (2) (3) (4) (5) (6) (7) (8) (9)VARIABLES
distanceij -0.079 -0.078 -0.081 -0.250* -0.250* -0.250* -0.264*** -0.263*** -0.264***(0.074) (0.074) (0.075) (0.129) (0.128) (0.127) (0.083) (0.083) (0.083)
legal_originij 0.039 0.039 0.041 0.465** 0.465** 0.463** -0.249 -0.250 -0.244(0.084) (0.084) (0.085) (0.227) (0.225) (0.225) (0.203) (0.204) (0.207)
common_languangeij 0.328 0.322 0.307 -0.712 -0.712 -0.718 0.549 0.539 0.556(0.501) (0.497) (0.499) (0.449) (0.447) (0.447) (1.017) (1.009) (1.014)
bilateral_tradeij,t-1 0.141*** 0.142*** 0.141*** 0.036 0.037 0.036 0.114** 0.115** 0.113**(0.051) (0.051) (0.051) (0.040) (0.040) (0.042) (0.044) (0.044) (0.044)
global_growtht 0.001 0.019 0.016 0.020 0.004 0.017(0.033) (0.045) (0.015) (0.021) (0.048) (0.063)
global_interest_ratet 0.113** 0.036 0.006 0.114 0.145** 0.299*(0.047) (0.098) (0.041) (0.080) (0.063) (0.158)
commodity_pricet -0.002** -0.002** 0.000 -0.000 -0.002** -0.002(0.001) (0.001) (0.000) (0.000) (0.001) (0.001)
VIXt -0.020** -0.016** -0.002 -0.000 -0.023** -0.014(0.008) (0.008) (0.003) (0.003) (0.011) (0.011)
reporter_growthi,t-1 -0.014 -0.002 -0.004(0.019) (0.009) (0.029)
reporter_interest_ratei,t-1 -0.002 -0.048 -0.101(0.049) (0.051) (0.079)
reporter_governancei,t 0.025 0.029* 0.021(0.022) (0.016) (0.042)
reporter_kaopeni,t 0.024* 0.002 0.019*(0.013) (0.003) (0.010)
reporter_financial_depthi,t -0.005 0.002 -0.001(0.003) (0.002) (0.005)
partner_growthi,t-1 0.014 0.004 0.003(0.009) (0.005) (0.014)
partner_interest_ratei,t-1 0.044 -0.005 -0.016(0.030) (0.005) (0.035)
partner_governancei,t 0.041** -0.002 0.033*(0.016) (0.007) (0.017)
partner_kaopeni,t 0.004 -0.001 -0.001(0.003) (0.002) (0.003)
partner_financial_depthi,t 0.002 0.002 0.001(0.001) (0.001) (0.002)
Observations 1,867 1,867 1,867 846 846 846 1,362 1,362 1,362R-squared 0.213 0.208 0.213 0.261 0.257 0.276 0.220 0.216 0.219Country F.E. Yes Yes Yes Yes Yes Yes Yes Yes YesPartner F.E. Yes Yes Yes Yes Yes Yes Yes Yes YesYear F.E. Yes No No Yes No No Yes No No
Excl Large Advanced EconomyEmerging Economy PartnerAdvanced Economy Partner

24 Bilateral Capital Flows: Gravity, Push, and Pull
Table 8: Determinants of Bilateral Financial Asset Flows - By Period
Notes: Dependent variables are total bilateral financial asset flows in % of reporting economy nominal GDP. Pre-crisis include 2000-07; and post-crisis refers to 2010-16. Clustered standard errors (bilateral pairs) are in parenthesis. *** p<0.01, ** p<0.05, * p<0.1.
5.2 Extension: Interaction Between Distance and VIX
Baseline Results. The results in the preceding section offer strong evidence that bilateral financial asset transactions of advanced economies are driven by gravity factors, alongside push and pull factors. Given that bilateral distance and global risk aversion are both significant in the baseline results and sensitivity tests, we extend the analysis by considering the interaction between these two factors as shown in Equation (2). This will allow us to test whether distance exacerbate the adverse impact of information frictions. As discussed in Section 4, both variables in the interaction term are continuous variables. In Table 9, the presence of the interaction term renders a different interpretation for the distance and VIX. The estimated parameters now act as intercepts when one of the continuous interacted variables takes a value of zero. For instance, the estimated coefficient for distance suggests how much bilateral capital flows will drop when VIX is zero. In contrast, the estimated coefficient for VIX now implies how much bilateral capital flows will fall when distance is zero.
The estimate coefficient of the interacted continuous variables in Column (1) suggest that the greater distance, the larger the impact of VIX on bilateral capital flows, albeit insignificant. But for bilateral other investment asset flows, the estimate is significant as shown in Column (4). Given the we interacted continuous variables, the interpretation of the results is unclear as we do not know the actual impact of higher global risk aversion on bilateral capital flows, given larger distance. Hence, we consider the marginal effects of the interaction term.
Tables 10a-10d present the marginal effects for total bilateral capital flows, bilateral FDI asset flows, bilateral portfolio asset flows, and bilateral other investment asset flows, respectively. For Table 10a, we find that at log distance 6, a unit increase in VIX decreases total bilateral capital flows by around 0.02% of reporting country’s nominal GDP, whereas at log distance 9, a unit increase in VIX decreases total bilateral capital flows by around 0.01% of reporting country’s nominal GDP. These results are largely in line with other investment asset flows. For instance, at log distance 6, a unit increase in VIX reduces other investment asset flows by around 0.02% of reporting country’s nominal GDP, but at log distance 8, a unit increase in VIX decreases other investment asset flows by around 0.01% of reporting country’s nominal GDP. The
(1) (2) (3) (4) (5) (6) (7)VARIABLES Pre-crisis Post-crisis Year=2006 Year=2008 Year=2010 Year=2011 Year=2016
distanceij -0.181*** -0.088 -0.303** -0.140 -0.363* -0.055 -0.136(0.065) (0.073) (0.124) (0.174) (0.200) (0.171) (0.128)
bilateral_tradeij,t-1 0.171*** 0.119* 0.388*** 0.134 0.116 0.217** 0.004(0.029) (0.068) (0.052) (0.095) (0.107) (0.097) (0.130)
Observations 1,080 1,275 179 179 178 178 185R-squared 0.324 0.183 0.681 0.352 0.380 0.388 0.385Country F.E. Yes Yes Yes Yes Yes Yes YesPartner F.E. Yes Yes Yes Yes Yes Yes Yes

Bilateral Capital Flows: Gravity, Push, and Pull 25
marginal effects for foreign direct and portfolio investments are mostly insignificant. Figures 2a to 2d show the predictive values of bilateral capital flows given an increase in VIX at varying levels of distance. The figures indicate a uniform negative impact of an increase in VIX on bilateral flows across varying levels of distance, particularly for total bilateral capital flows (Figure 2a) and bilateral other investment asset flows (Figure (2d).
Sensitivity Tests. We conduct some sensitivity tests to validate the results. First, we remove gravity and global factors that are insignificant. Specifically, we remove common legal origins, common spoken language, global growth, and global interest rate. Second, to check whether the results are sensitive to outliers in the data, we winsorise the bilateral capital flows at the bottom and top 10% of the bilateral country sample. In both cases, we confirm the uniform negative impact of VIX across varying levels of distance. Moreover, we validate that the negative impact of VIX on bilateral capital flows diminishes as distance increases. Third, removing crisis years of 2008-2009 yields similar results, i.e. the negative impact of VIX on bilateral capital flows decreases with distance. Lastly, when we hold VIX at given levels, we find uniform negative impact of an increase in distance on bilateral capital flows. Moreover, the negative impact of information frictions on bilateral capital flows decreases as global financial risk increases.
Taken together, the estimates show that although VIX has uniform negative effect on bilateral capital flows, its impact decreases with distance. This is in line with the fact that bilateral asset holdings and transactions decline at greater distance. This means that bilateral capital flows decrease more for economies that are of closer geographic proximity or with less information frictions than those that are farther apart or with more information frictions when global investor risk aversion rises. Hence, information frictions do not exacerbate the negative impact of an increase in VIX on bilateral capital flows. On the contrary, the results provide evidence of regional contagion using bilateral flows data.

26 Bilateral Capital Flows: Gravity, Push, and Pull
Table 9: Determinants of Bilateral Financial Asset Flows - Interaction Between Distance and VIX
Notes: Dependent variables are bilateral financial asset flows (FINA), foreign direct assets (FDIA), portfolio assets (PORTA) and other investment assets (OIA) in % of reporting economy nominal GDP, respectively. Clustered standard errors (bilateral pairs) are in parenthesis. *** p<0.01, ** p<0.05, * p<0.1.
Table 10: Marginal Effects of Distance and VIX Interaction
a) Total Bilateral Capital Flows
(1) (2) (3) (4)Total FDIA PORTA OIA
distanceij -0.151* -0.043 -0.059 -0.112***(0.085) (0.059) (0.044) (0.042)
legal_originij 0.032 0.039 0.012 0.010(0.093) (0.073) (0.026) (0.022)
common_languangeij 0.516 0.108 -0.145 0.039(0.324) (0.275) (0.106) (0.072)
bilateral_tradeij,t-1 0.123*** 0.050*** 0.028 0.040***(0.031) (0.018) (0.023) (0.007)
global_growtht 0.006 0.012 -0.006 0.003(0.025) (0.023) (0.013) (0.011)
global_interest_ratet 0.083** 0.006 0.014 0.053***(0.039) (0.019) (0.013) (0.015)
commodity_pricet -0.001* -0.000 -0.001*** -0.000(0.001) (0.000) (0.000) (0.000)
VIXt -0.033 0.002 0.006 -0.046***(0.031) (0.019) (0.016) (0.016)
distanceij*VIXt 0.002 -0.001 -0.001 0.005**(0.004) (0.002) (0.002) (0.002)
Observations 2,713 2,566 2,660 2,647R-squared 0.205 0.101 0.225 0.087Country F.E. Yes Yes Yes YesPartner F.E. Yes Yes Yes Yes
VARIABLES
Average Marginal Effects dy/dx std. err. t P>|t|dist = 5 -0.022 0.013 -1.650 0.099 -0.048 0.004dist = 6 -0.020 0.010 -1.950 0.051 -0.039 0.000dist = 7 -0.017 0.007 -2.390 0.017 -0.032 -0.003dist = 8 -0.015 0.006 -2.730 0.006 -0.026 -0.004dist = 9 -0.013 0.006 -2.200 0.028 -0.025 -0.001dist = 10 -0.011 0.008 -1.340 0.181 -0.026 0.005
95% Conf. Interval

Bilateral Capital Flows: Gravity, Push, and Pull 27
b) Foreign Direct Investment Assets
c) Portfolio Investment Assets
d) Other Investment Assets
Note: Average marginal effects are partial effects of bilateral financial asset flows with respect to changes in VIX at given levels of distance (dist).
Figure 2: Predictive Margins Plot of Bilateral Financial Asset Flows on Change in VIX at Given Levels of Distance
a) Total Bilateral Capital Flows
Average Marginal Effects dy/dx std. err. t P>|t|dist = 5 -0.002 0.008 -0.240 0.811 -0.019 0.015dist = 6 -0.003 0.006 -0.440 0.658 -0.016 0.010dist = 7 -0.004 0.005 -0.800 0.425 -0.013 0.005dist = 8 -0.005 0.003 -1.380 0.168 -0.011 0.002dist = 9 -0.005 0.003 -1.740 0.084 -0.011 0.001dist = 10 -0.006 0.004 -1.480 0.142 -0.015 0.002
95% Conf. Interval
Average Marginal Effects dy/dx std. err. t P>|t|dist = 5 0.001 0.008 0.080 0.939 -0.015 0.016dist = 6 0.000 0.006 -0.070 0.944 -0.013 0.012dist = 7 -0.001 0.005 -0.320 0.750 -0.010 0.008dist = 8 -0.002 0.003 -0.780 0.436 -0.009 0.004dist = 9 -0.004 0.002 -1.510 0.132 -0.008 0.001dist = 10 -0.005 0.003 -1.760 0.080 -0.010 0.001
95% Conf. Interval
Average Marginal Effects dy/dx std. err. t P>|t|dist = 5 -0.023 0.007 -3.130 0.002 -0.037 -0.008dist = 6 -0.018 0.006 -3.270 0.001 -0.029 -0.007dist = 7 -0.014 0.004 -3.390 0.001 -0.021 -0.006dist = 8 -0.009 0.003 -3.110 0.002 -0.015 -0.003dist = 9 -0.004 0.003 -1.560 0.120 -0.010 0.001dist = 10 0.000 0.004 0.070 0.942 -0.007 0.008
95% Conf. Interval

28 Bilateral Capital Flows: Gravity, Push, and Pull
b) Foreign Direct Investment Assets
c) Portfolio Investment Assets
d) Other Investment Assets
Notes: Distance (dist) expressed in log values. Linear predictions are predictive values of bilateral capital flows in % of reporting country nominal GDP.

Bilateral Capital Flows: Gravity, Push, and Pull 29
6. Concluding Remarks
This paper extends the capital flows literature by considering the importance of gravity factors, alongside the traditional push and pull factors, in determining the size of bilateral capital flows. The asset trade literature offers empirical and theoretical support on the importance of gravity forces, such as distance (which proxies for information frictions) as well as economic ties, on bilateral asset transactions and holdings. But since transactions or flows data are technically part of capital flows, it is natural to expect that bilateral capital flows are driven by gravity, push and pull factors. Unfortunately, evidence on this conjecture is constrained by the lack of bilateral capital flows data. This paper fills the gap in this literature by using bilateral Balance of Payments Statistics of 10 advanced reporting economies for the period of 2000 to 2016.
The results are as follows. Global factors such as global commodity price level and global risk aversion are consistently significant with expected signs. Moreover, reporter and partner domestic governance and capital account openness are, likewise, significant. What is new is that gravity factors such as distance and bilateral trade ties are statistically significant across a battery of sensitivity tests. Extending the analysis in the context of contagion, the results offer evidence that an increase in global risk aversion has a uniform negative impact on bilateral capital flows, at given levels of distance. But its negative impact on bilateral capital flows is greater between economies of closer geographic proximity or lesser information frictions, than those that are farther apart or with greater information asymmetries. These findings warrant considering the importance of information frictions and economic ties between economies in understanding the patterns and behaviour of capital flows at academic and policy circles.

30 Bilateral Capital Flows: Gravity, Push, and Pull
References
Ahmed, S. and A. Zlate. 2014. Capital Flows to Emerging Market Economies: A Brave New World? Journal of International Money and Finance, 48: 221-248.
Aviat, A. and N. Coeurdacier. 2007. The Geography of Trade in Goods and Asset Holdings. Journal of International Economics, 71: 22-51.
Baldwin, R. and D. Taglioni. 2007. Trade Effects of the Euro: A Comparison of Estimators. Journal of Economic Integration, 22(4): 780-818.
Brei, M. and G. von Peter. 2018. The Distance Effect in Banking and Trade. Journal of International Money and Finance, 81: 116-137.
Broto, C., J. Diaz-Cassou, and A. Erce. 2011. Measuring and Explaining the Volatility of Capital Flows to Emerging Countries. Journal of Banking and Finance, 35: 1941-1953.
Buch, C. 2005. Distance and International Banking. Review of International Economics, 13(4): 787-804.
Byrne, J. and N. Fiess. 2016. International Capital Flows to Emerging Markets: National and Global Determinants. Journal of International Money and Finance, 61: 82-100.
Calderon, C. and M. Kubota. (2013). Sudden Stops: Are Global and Local Investors Alike? Journal of International Economics, 89 (1): 122-142.
Calvo, G., L. Leiderman, and C. Reinhart. 1993. Capital Inflows and Real Exchange Rate Appreciation in Latin America: The Role of External Factors”, IMF Staff Papers, 40(1): 108-151.
Calvo, G., L. Leiderman, and C. Reinhart. 1996. Inflows of Capital to Developing Countries in 1990s. Journal of Economic Perspectives, 10(2): 123-139.
Cavallo, E. and J. Frankel. 2008. Does Openness to Trade Make Countries More Vulnerable to Sudden Stops, or Less? Using Gravity to Establish Causality. Journal of International Money and Finance, 27: 1430-1452.
Cerutti, E., S. Claessens, and D. Puy. 2015. Push Factors and Capital Flows to Emerging Markets: Why Knowing Your Lender Matters More Than Fundamentals. IMF Working Paper No. 15/17. International Monetary Fund.
Chinn, M. and H. Ito. 2006. What Matters for Financial Development? Capital Controls, Institutions, and Interactions. Journal of Development Economics, 81(1): 163-192.
Choi, C., D.-E. Rhee, and Y. Oh. 2014. Information and Capital Flows Revisited: The Internet as a Determinant of Transactions in Financial Assets. Economic Modelling, 40: 191-198.
Chuhan, P., S. Claessens, and N. Mamingi. 1998. Equity and Bond Flows to Latin America and Asia: The Role of Global and Country Factors. Journal of Development Economics, 55: 439-463.
Coeurdacier, N. 2009. Do Trade Cost in Goods Market Lead to Home Bias in Equities. Journal of International Economics, 77: 86-100.
di Giovanni, J. 2005. What Drives Capital Flows? The Case of Cross-Border M&A Activity and Financial Deepening. Journal of International Economics, 65: 127-149.
Eichengreen, B., P. Gupta, O. Masetti. 2018. Are Capital Flows Fickle? Increasingly? And Does the Answer Still Depend on Type? Asian Economic Papers, 17(1): 22-41.

Bilateral Capital Flows: Gravity, Push, and Pull 31
Fernandez-Arias, E. 1996. The New Wave of Private Capital Inflows: Push or Pull? Journal of Development Economics, 48: 389-418.
Forbes, K. and F. Warnock. 2012. Capital Flow Waves, Surges, Stops, Flights and Retrenchment. Journal of International Economics, 88 (2): 235-251.
Fratzscher, M. 2012. Capital Flows Push versus Pull Factors and the Global Financial Crisis. Journal of International Economics, 88(2): 341-365.
Galstyan, V., and P. Lane. 2013. Bilateral Portfolio Dynamics During the Global Financial Crisis. European Economic Review, 57: 63-74.
Galstyan, V., P. Lane, C. Mehigan, and R. Mercado. 2016. The Holders and Issuers of International Portfolio Securities. Journal of the Japanese and International Economics, 42: 100-108.
Ghosh, A., J. Kim, M. Qureshi, and J. Zalduendo. 2014. Surges. Journal of International Economics, 92(2): 266-285.
Giordani, P., M. Ruta, H. Weisfeld, and L. Zhu. 2017. Capital Flow Deflection. Journal of International Economics, 105: 102-118.
Head, K., Mayer, T. & Ries, J. (2010). The Erosion of Colonial Trade Linkages after Independence, Journal of International Economics, 81(1):1-14.
Head, K. and J. Ries. (2008). FDI as an Outcome of the Market for Corporate Control: Theory and Evidence. Journal of International Economics, 74: 2-20.
Hellmanzik, C. and M. Schmitz. 2017. Taking Gravity Online: The Role of Virtual Proximity in International Finance. Journal of International Money and Finance, 77: 164-179.
Herrmann, S. and D. Mihaljek. 2013. The Determinants of Cross-Border Bank Flows to Emerging Markets. Economics of Transition, 21(3): 479-508.
Koepke, R., (2018), “What Drives Capital Flows to Emerging Markets? A Survey of Empirical Literature”, Journal of Economic Surveys, 33(2): 516-540.
Lane, P. and G. M. Milesi-Ferretti. 2005a. International Investment Patterns. The Review of Economics and Statistics, 90(3): 538-549.
Lane, P. and G. M. Milesi-Ferretti. 2005b. The International Equity Holdings of Euro Area Investors. IIIS Discussion Paper No. 104.
Li, S., J. de Haan, B. Scholterns. 2018. Surges in International Fund Flows. Journal of International Money and Finance, 82: 97-119.
Martin, P. and H. Rey. 2004. Financial Super-Markets: Size Matters for Asset Trade. Journal of International Economics, 64: 335-361.
Melitz, J. and F. Toubal. (2014). Native Language, Spoken Language, Translation and Trade, Journal of International Economics, 92(2): 351-363.
Mercado, R. 2018a. Bilateral Capital Flows: Transaction Patterns and Gravity. Trinity Economics Papers No. 0218. Trinity College Dublin.
Mercado, R. 2018b. Not All Surges of Gross Capital Inflows Are Alike. Journal of Economic Studies, 45(2): 326-347.
Mercado, R. and C.Y. Park, (2011), “What Drives Different Types of Capital Flows and Their Volatilities in Developing Asia?” International Economic Journal, 27(4): 497-524.

32 Bilateral Capital Flows: Gravity, Push, and Pull
Milesi-Ferretti, G.M. and C. Tille. 2011. The Great Retrenchment: International Capital Flows During the Global Financial Crisis. Economic Policy, 26(66): 289-346.
Neumann, R., R. Penl, and A. Tanku. 2009. Volatility of Capital Flows and Financial Liberalization: Do Specific Flows Respond Differently? International Review of Economics and Finance, 18(3): 488-501.
Obstfeld, M. and K. Rogoff. 2000. The Six Major Puzzles in International Macroeconomics: Is there a Common Cause? NBER Macroeconomics Annual 2000, Vol. 15. NBER.
Okawa, Y. and E. van Wincoop. 2012. Gravity in International Finance. Journal of International Economics, 87: 205-2015.
Papaioannou, E. 2009. What Drives International Financial Flows? Politics, Institutions and Other Determinants. Journal of Development Economics, 88: 269-281.
Portes, R., H. Rey., and Y. Oh. 2001. Information and Capital Flows: The Determinants of Transactions in Financial Assets. Journal of International Economics, 45: 783-796.
Portes, R. and H. Rey. 2005. The Determinants of Cross-Border Equity Flows. Journal of International Economics, 65: 269-296.
Puy, D. 2016. Mutual Fund Flows and the Geography of Contagion. Journal of International Money and Finance, 60: 73-93.
Reinhart, C. and V. Reinhart. 2009. Capital Flow Bonanzas: An Encompassing View of the Past and Present. NBER International Seminar on Macroeconomics 2008.
Rose, A. 2005. One Reason Countries Pay Their Debts: Renegotiation and International Trade. Journal of Development Economics, 77: 189-206.
Rose, A. and M. Spiegel. 2002. A Gravity Model of Sovereign Lending: Trade, Default, and Credit. NBER Working Paper No. 9285. National Bureau of Economic Research.
Sarno, L., I. Tsiakas, and B. Ulloa. 2016. What Drives International Portfolio Flows? Journal of International Money and Finance, 60: 53-72.
Shirota, T. 2015. What is the Major Determinant of Cross-Border Banking Flows? Journal of International Money and Finance, 53: 137-147.
Wang, Y. 2018. Fickle Capital Flows and Retrenchment: Evidence from Bilateral Banking Data. Journal of International Money and Finance, 87: 1-21.
Warnock, F. and C. Cleaver. 2003. Financial Centres and the Geography of Capital Flows. International Finance, 61: 27-59.
Yeyati, E. and J. Zuñiga. 2015. Varieties of Capital Flows: What Do We Know. Harvard Kennedy School Faculty Research Working Paper Series 15-025. Harvard University.

Bilateral Capital Flows: Gravity, Push, and Pull 33
Appendix
Table A1: Bilateral Pairs and Partner Economy Classification
Notes: Economy classification based on WEO country classification. * denotes reporting economy.
Australia 5 Argentina 3Austria* 4 Brazil 5Belgium 6 Bulgaria 1Canada* 6 Chile 1Czech Republic 3 China 7Denmark* 1 Croatia 1Estonia 1 Hungary 3Finland 2 India 4France 8 Indonesia 2Germany* 7 Iran 1Greece 2 Malaysia 2Hong Kong, China 5 Mexico 4Ireland 3 Papua New Guinea 1Italy 7 Philippines 2Japan* 7 Poland 3Korea* 5 Romania 2Latvia 1 Russia 4Lithuania 1 Saudi Arabia 1Luxembourg 5 South Africa 3Malta 1 Thailand 2Netherlands* 7 Turkey 1New Zealand* 1 United Arab Emirates 2Norway 2 Venezuela 1Portugal 3 Vietnam 1Singapore 5 Bilateral Pairs 57Slovakia 2Slovenia 3Spain* 5Sweden 3Switzerland 6Taipei, China 4United States* 8Bilateral Pairs 129
Advanced Economy Partner Emerging Economy Partner

Bilateral Capital Flows: Gravity, Push, and Pull
Rogelio Mercado Jr.Senior Economist, The SEACEN Centre
Kuala Lumpur, [email protected]
Conference on External Statistics: “Bridging Measurement Challenges and
Analytical Needs of External Statistics: Evolution or Revolution?”
Lisbon, 17-18 February 2020

The SEACEN Centre 2
Outline
1) Bilateral capital flows dataset
2) Research applications
3) Bilateral capital flows in the context of capital flow covariates
4) Concluding remarks

The SEACEN Centre 3
Bilateral Capital Flows Dataset
❑ Few economies report the geographic
breakdown of their Balance of Payments
Statistics.
❑ Bilateral capital flows pertain to the
geographic breakdown of the Financial
Account Balance.
❑ Data are available for 10 reporting
central banks or statistics agencies,
including Österreichische Nationalbank,
Statistics Canada, Danmarks
Nationalbank, Deutsche Bundesbank,
Bank of Japan, Bank of Korea, De
Nederlandsche Bank, Stats NZ, Banco
de España, and Bureau of Economic
Analysis.
Un
ite
d
Sta
tes
Ca
na
da
Au
str
ia
De
nm
ark
Ge
rma
ny
Ne
the
rla
nd
s
Sp
ain
Jap
an
Ko
rea
Ne
w
Zea
lan
d
Foreign Direct Investments
Assets (FDIA) TC TC TC TC TC UI TC TC TC TC
Liabilities (FDIL) TC TC TC TC TC TC TC TC TC TC
Portfolio Investments
Assets (PORTA) UI TC TC UI TC UI TC TC TC TC
Liabilities (PORTL) TC TC (est) TC TC (est) TC TC TC TC
Financial Derivatives
Assets (DERA) TC TC TC TC TC
Liabilities (DERL) TC TC TC TC
Other Investment
Assets (OIA) TC TC TC TC TC UI TC TC TC TC
Liabilities (OIL) TC TC TC TC TC TC TC TC TC TC
Reserve Assets (RESA) TC TC TC TC
Frequency Q Q Q M Q A A Q A A
Start Year 2003 2000 2001 2005 2000 2004 2013 2000 2006 2000
End Year 2016 2016 2016 2016 2016 2016 2016 2016 2016 2016
No. of Counterparty 21 3 15 36 33 25 7 33 3 30
Table 1: Bilateral Capital Flows Data
Source: Mercado (2018).

The SEACEN Centre 4
Bilateral Capital Flows Dataset
❑ Bilateral capital flows data include direct
investment assets, portfolio assets,
financial derivative assets, other
investment assets and official reserve
assets (whenever data are available).
❑ Data captures bilateral financial
transactions i.e. location of counterparty.
❑ Data mostly consistent with Balance of
Payments Manual 6.
❑ Reported bilateral data between country
pairs do not match.
❑ The sample accounts for around 25% of
reported world bilateral holdings of direct
and portfolio investments; and banking
sector claims.
Un
ite
d
Sta
tes
Ca
na
da
Au
str
ia
De
nm
ark
Ge
rma
ny
Ne
the
rla
nd
s
Sp
ain
Jap
an
Ko
rea
Ne
w
Zea
lan
d
Foreign Direct Investments
Assets (FDIA) TC TC TC TC TC UI TC TC TC TC
Liabilities (FDIL) TC TC TC TC TC TC TC TC TC TC
Portfolio Investments
Assets (PORTA) UI TC TC UI TC UI TC TC TC TC
Liabilities (PORTL) TC TC (est) TC TC (est) TC TC TC TC
Financial Derivatives
Assets (DERA) TC TC TC TC TC
Liabilities (DERL) TC TC TC TC
Other Investment
Assets (OIA) TC TC TC TC TC UI TC TC TC TC
Liabilities (OIL) TC TC TC TC TC TC TC TC TC TC
Reserve Assets (RESA) TC TC TC TC
Frequency Q Q Q M Q A A Q A A
Start Year 2003 2000 2001 2005 2000 2004 2013 2000 2006 2000
End Year 2016 2016 2016 2016 2016 2016 2016 2016 2016 2016
No. of Counterparty 21 3 15 36 33 25 7 33 3 30
Table 1: Bilateral Capital Flows Data
Source: Mercado (2018).

The SEACEN Centre 5
Bilateral Capital Flows Dataset
Capital Flows Obs Mean Std. Dev. Min Max Obs Mean Std. Dev. Min Max
2000-2016 2000-2007
Total Financial Assets 2,972 0.343 1.757 -13.212 36.141 1,183 0.545 2.141 -4.806 36.141
Total Financial Liabilities 2,962 0.323 2.508 -18.030 44.473 1,178 0.562 2.601 -10.017 44.473
FDI Assets 2,825 0.190 1.240 -18.810 28.599 1,120 0.220 1.337 -2.765 28.599
FDI Liabilities 2,700 0.152 1.230 -9.321 41.127 1046 0.233 1.653 -3.908 41.127
Portfolio Assets 2,910 0.122 0.511 -3.868 4.601 1,153 0.180 0.516 -3.699 3.831
Portfolio Liabilities 2,803 0.160 1.991 -18.086 23.835 1,126 0.223 1.494 -9.857 15.820
Other Investment Assets 2,899 0.066 0.778 -13.176 16.365 1,165 0.176 0.878 -5.295 16.365
Other Investment Liabilities 2,873 0.063 0.807 -11.668 14.215 1,154 0.166 0.816 -2.667 14.215
Capital Flows Obs Mean Std. Dev. Min Max Obs Mean Std. Dev. Min Max
2008-2009 2010-2016
Total Financial Assets 391 0.098 1.506 -8.947 10.796 1,398 0.239 1.410 -13.212 24.000
Total Financial Liabilities 392 0.145 2.015 -12.881 16.446 1,392 0.170 2.538 -18.030 20.818
FDI Assets 370 0.128 0.775 -7.143 5.529 1,335 0.181 1.261 -18.810 24.569
FDI Liabilities 352 0.098 0.751 -8.599 5.855 1302 0.101 0.885 -9.321 15.937
Portfolio Assets 384 0.069 0.490 -2.651 4.295 1,373 0.088 0.508 -3.868 4.601
Portfolio Liabilities 371 0.136 1.823 -13.124 15.992 1,306 0.113 2.375 -18.086 23.835
Other Investment Assets 379 -0.090 1.046 -13.176 3.999 1,355 0.015 0.555 -5.673 4.800
Other Investment Liabilities 379 -0.038 0.782 -5.215 5.512 1,340 0.004 0.796 -11.668 6.737
Table 2: Descriptive Statistics, % of reporter nominal GDP
Source: Mercado (2018).

The SEACEN Centre 6
Research ApplicationsThe geographic breakdown of capital flows will
allow us to assess the significance of bilateral
factors on bilateral transactions.
➢ Bilateral factors include distance (information
frictions) and trade ties (economic ties).
➢ By using bilateral transactions data, we capture
actual bilateral flows instead of bilateral holdings
(stocks) which may exhibit persistent effects.
➢ Most studies on bilateral financial transactions
focus on specific type of investment flows
(Portes and Rey, 2005 on equity flows; Brei and
von Peter, 2018; Herrmann and Mihaljek, 2013;
on bank flows; and di Giovanni, 2005 on mergers
and acquisitions.
➢ Mercado (2018a) used total bilateral capital flows
across types of investments and found the
significance of gravity factors.
(1) (2) (3) (4)
FINA FDIA PORTA OIA
Distanceij -0.262*** -0.154** -0.064** -0.039
(0.078) (0.051) (0.019) (0.040)
Financial Centrej 3.408** 1.201** 1.492*** 1.047
(1.197) (0.394) (0.432) (0.685)
Tradeij,t-1 0.137*** 0.061** 0.026 0.044
(0.037) (0.019) (0.016) (0.024)
R2 0.375 0.284 0.458 0.364
Obs 2939 2788 2875 2867
Table 3: Bilateral Capital Flows and Gravity Factors
Note: Bilateral capital flows are in % of reporter GDP. Trade refers to bilateral imports in % of
GDP.
Source: Mercado (2018).

The SEACEN Centre 7
Research ApplicationsThe geographic breakdown of capital flows
will allow us to understand global financial
flows network.
➢ Mercado and Noviantie (2019) constructed
financial centrality measure and found
varying significance of network systemic
and idiosyncratic factors in explaining
financial centrality across different types of
investments and residency of investors.
Future research can consider policy and risk
spillovers.
Figure 1: Financial Asset Network Before Crisis
Source: Mercado and Noviantie (2019).

The SEACEN Centre 8
Bilateral Capital Flows: Gravity, Push and Pull
➢ Mercado (2018) found bilateral capital flows are responsive to gravity factors. But capital flows
literature point to the importance of global and domestic factors.
➢ This raises the question: are capital flows driven by gravity factors, alongside push and pull
factors? If so, policy makers must also consider the role of information frictions and economic
ties.
➢ This raises another question: if gravity factors are significant, do information frictions
exacerbate the adverse effects of global financial risks?
➢ We consider the following specifications:
, , 1 , , ,ij t i j ij ij t t i t j t ij tCF d h g r p −= + + + + + + +
, , 1 ,ij t i j ij ij t t t ij ij tCF d h g VIX dist −= + + + + + +

The SEACEN Centre 9
Bilateral Capital Flows: Gravity, Push and PullTable 4: Bilateral Pairs and Partner Economy Classification

(1) (2) (3) (4)
distanceij -0.107* -0.106* -0.108* -0.107*
(0.058) (0.058) (0.058) (0.058)
legal_originij 0.033 0.032 0.033 0.033
(0.080) (0.080) (0.080) (0.080)
common_languangeij 0.520 0.516 0.516 0.514
(0.393) (0.390) (0.393) (0.390)
bilateral_tradeij,t-1 0.122** 0.123** 0.121** 0.122**
(0.048) (0.048) (0.048) (0.048)
global_growtht 0.006 0.015
(0.023) (0.031)
global_interest_ratet 0.083** 0.078
(0.034) (0.064)
commodity_pricet -0.001** -0.001*
(0.000) (0.001)
VIXt -0.015** -0.011**
(0.006) (0.006)
reporter_growthi,t-1 -0.009 -0.006
(0.014) (0.014)
reporter_interest_ratei,t-1 -0.066 -0.008
(0.053) (0.038)
reporter_governancei,t 0.021 0.028*
(0.019) (0.016)
reporter_kaopeni,t 0.020** 0.016*
(0.010) (0.009)
reporter_financial_depthi,t 0.000 -0.002
(0.003) (0.002)
partner_growthj,t-1 0.001 0.005
(0.007) (0.005)
partner_interest_ratej,t-1 -0.005 -0.005
(0.005) (0.005)
partner_governancej,t 0.016** 0.014*
(0.008) (0.007)
partner_kaopenj,t -0.001 -0.000
(0.002) (0.002)
partner_financial_depthj,t 0.000 0.000
(0.001) (0.001)
Observations 2,713 2,713 2,713 2,713
R-squared 0.208 0.205 0.210 0.207
Marginal R-squared 0.045 0.045 0.045 0.045Notes: Dependent variables are total bilateral financial asset flows in % of reporting economy nominal GDP. Marginal R2 is computed as 1-(RSS/RSSc) where RSS is the residual sum ofsquares in a regression specification with gravity factors, while RSSc is the residual sum of squares in a regression specification without gravity factors. All specifications include reporter andpartner dummy variables. Specification (1) and (3) include year dummy variables. Clustered standard errors (bilateral pairs) are in parenthesis. *** p<0.01, ** p<0.05, * p<0.1.
Table 5: Determinants of Bilateral Financial Asset Flows
10
Doubling the distance between
two economies reduces
financial asset flows, on the
average, by about 0.03% of
reporting country’s GDP
(approximately US$5.6 billion
for the U.S.).

The SEACEN Centre 11
Bilateral Capital Flows: Gravity, Push and Pull
Gravity factors (distance and trade) are significant alongside global and domestic reporter
and partner factors (VIX, global prices, governance, capital account openness).
o This holds across different types of investments, though there are differences.
o For advanced economy partner, distance is insignificant while trade is significant. For emerging
economy partner, distance is negative and significant, but trade is insignificant. Common legal
origins is positive and significant.
o Period and annual regressions show either distance or bilateral trade is significant; or both or
neither are significant.
o Results hold when I changed the specification; winsorised the data; used different global and
domestic factors; and included financial centres in the sample.

The SEACEN Centre 12
Bilateral Capital Flows: Gravity, Push and Pull
Table 6: Interaction Between Distance and VIX
Marginal Effects dy/dx std. err. t P>|t|
[95% Conf.
Interval]
dist = 5 -0.022 0.013 -1.650 0.099 -0.048 0.004
dist = 6 -0.020 0.010 -1.950 0.051 -0.039 0.000
dist = 7 -0.017 0.007 -2.390 0.017 -0.032 -0.003
dist = 8 -0.015 0.006 -2.730 0.006 -0.026 -0.004
dist = 9 -0.013 0.006 -2.200 0.028 -0.025 -0.001
dist = 10 -0.011 0.008 -1.340 0.181 -0.026 0.005
Note: Marginal effects are partial effects of one unit increase in VIX on bilateral financial asset flows at
given levels of distance (dist). Distance are in log values.
At log distance 6 (e.g. between Germany and Belgium), a unit
increase in VIX decreases bilateral capital flows by around
0.02% of reporting country’s nominal GDP (around US$0.7
billion); but at log distance 9 (e.g. between Germany and
Korea), a unit increase in VIX decreases bilateral capital flows
by around 0.01% of GDP (around US$0.3 billion).

The SEACEN Centre 13
Bilateral Capital Flows: Gravity, Push and Pull
An increase in global risk aversion has a uniform
negative impact of bilateral capital flows across
different levels of distance.
However, the adverse impact of an increase in
global risk aversion is greater for country pairs
that are closer to each other (contagion).
The results hold when some gravity and global
factors were removed; when bilateral flows data were
winsorised; and when we removed crisis years of
2008-09.
Figure 2: Predicted Values of Bilateral Financial
Asset Flows on Change in VIX at Given Levels
of Distance

The SEACEN Centre 14
Concluding Remarks
Compiling the geographic breakdown of the Balance of Payments Statistics will provide new
insights to researchers and policymakers.
For instance, we have new evidence that bilateral capital flows are responsive to gravity factors
alongside push and pull factors. We also have evidence showing that although bilateral capital
flows decrease across different levels of distance when global risk aversion increases, the impact
is greater for economies closer to one another. This offers support for regional cooperation.

1/1
IFC Conference on external statistics "Bridging measurement challenges and analytical needs of external statistics: evolution or revolution?", co-organised with the Bank of Portugal (BoP) and the European Central Bank (ECB)
17-18 February 2020, Lisbon, Portugal
Special purpose entities: a visit outside of the common set of residency and economic ownership1
Péter Bánhegyi,
Magyar Nemzeti Bank
1 This paper and presentation were prepared for the meeting. The views expressed are those of the author and do not necessarily reflect the views of the BIS, IFC, BoP, ECB or
the central banks and other institutions represented at the meeting.

1
Special Purpose Entities: A Visit Outside of the Common Set of Residency and Economic Ownership
Péter Bánhegyi
Abstract
Recent international standards for macroeconomic statistics (BPM6, SNA 2008) are heavily based on both the concept of residency and the concept of economic ownership. The concept of residency requires that the focus of the economic interest of a given player should be the base of the recording of its transactions in macroeconomic statistics of a given country while the concept of economic ownership requires that the value added of an economic activity should be attributed to the economy where the economic owner of (non-financial) assets involved in this activity is resident. Usually an economic player lies in the common set of these concepts but there are some border cases. One of them is the set of foreign-owned special purpose entities (SPE) where these entities are involved in real economic activities. Foreign-owned SPEs operating in the compiling economy are resident there but are usually considered that they neither have direct relationship with the domestic economy nor have effect on domestic GDP. National concept of compiling macroeconomic statistics therefore suggests that, if necessary, their reported data should be reclassified by national compilers according to the definition of economic ownership. On the other hand, the international comparability requires that all transactions of resident players should be recorded in the same way (i.e. irrespective of their SPE status) to reduce bilateral asymmetries and reconcile national statistics for analytical purposes. This tension may lead to different concepts of compiling and releasing macroeconomic statistics regarding SPEs, similarly to national versus community concept of foreign trade statistics inside the European Union, even if there is a common definition of SPEs which can be found in the Final Report of the Task Force on Special Purpose Entities compiled in 2018 (this task force was led by the IMF). This report addressed this point, but it seems that concepts and guidelines should be more straightforward here by distinguishing the issue of data collection from the one of data compilation and release.
Keywords: macroeconomic statistics, value added, production, special purpose entities
Content
Introduction ............................................................................................................................................... 2
Concepts and definitions ...................................................................................................................... 2
Questions and datasets ......................................................................................................................... 5
Concluding remarks .............................................................................................................................. 9
References .................................................................................................................................................. 9

2
Introduction
The basic role of statistics is to provide an adequate picture of a phenomenon or a process in a specified field like economy, society or meteorology. This task requires both a comprehensive framework and relevant data of good quality. The former includes categories for which data should be released for users and definitions which serve as the base for these categories while the latter means data which should be available for compilers in order to produce good statistics. These requirements should, however, be fulfilled at different levels of aggregation since these phenomena and processes can be analysed at different levels of aggregation in a given economy or society. It is a possible issue that the required methodology and data at a given level of aggregation cannot be used automatically in the case of other levels. Therefore, it is an important goal to find the right connection between these different levels as regards methodology and data.
In macroeconomic statistics there are open methodological issues where the
choice between possible alternatives may have an effect on bilateral asymmetries between data released by different countries and, as a result, the aggregation of their data at upper level. Data needs for further analysis also should be taken in account. It is important to handle well this aggregation and analysis problem through well-designed data collection and exchange systems, but it would not happen at the expense of the methodology and economic interpretability. It should be clear which problems are what we want to solve.
In the following short paper, this point will be presented through a widely discussed issue of special purpose entities (SPEs) where usually there is a conflict between two key points of methodology, namely residency and economic ownership. The first section is about the methodology itself. Although there is a definition of residency and economic ownership in recent manuals (BPM6, SNA 2008. ESA 2010), the long discussion on SPEs in different guides and reports shows that the application of these manuals to this case is not obvious and the latest step (the newly proposed definition of SPEs) has not even made the picture clear. The second section will discuss that the difference should be made more straightforward between data released at a given aggregation level and data sent to an upper level for further aggregation and analysis. At the end there will be some concluding remarks.
Concepts and definitions
Globalisation processes make production and financing transactions more and more complex. This is reflected in the fact that many of international manuals and reports deal with the location (the host country) of (elements of) these transactions since in many cases it does not seem to be ambiguous. There are two important characteristics which are intended for the right recording of economic transactions: residence and economic ownership.

3
Upon international manuals, the “residence of each institutional unit is the
economic territory with which it has the strongest connection, in other words, its centre of predominant economic interest.” (SNA 2008 4.113, BPM6 4.10, cf. ESA 2010 2.04) As regards the other one, the “economic owner of entities such as goods and services, natural resources, financial assets and liabilities is the institutional unit entitled to claim the benefits associated with the use of the entity in question in the course of an economic activity by virtue of accepting the associated risks.” (SNA 2008 3.26, cf. BPM6 5.3 and ESA 2010 1.90)
In short, residency is rather related to economic players while economic ownership is rather related to economic assets. It would be a convenient state if all resident players owned those and only those assets which are at the same time legally owned by them. Notwithstanding in the case of financial assets, it is practically possible. As SNA 2008 3.29 states:
“The benefits inherent in financial assets and liabilities are seldom transferred from a legal owner to an economic owner in exactly the same state. They are usually transformed to new forms of financial assets and liabilities by the intermediation of a financial institution that assumes some of the risk and benefits while passing the balance on to other units.”
It means that the holding of financial assets and the activity of financial intermediary usually include characteristics of economic ownership. If the “real” economic owner of a financial asset passed this asset legally to another unit for holding it (and there is no sale or transfer) then the original owner would get in turn another financial asset since acquiring the original financial asset should be financed by a financial liability. As a result, some risks and benefits and so the economic ownership of this financial asset can be also attributable to the country of the residence of this another unit (which may be a financial intermediary).
The case of non-financial assets is, however, a bit different. A SNA 2008 3.39 states:
“The only non-financial assets included in the asset boundary of an economy are those whose economic owners are resident in the economy. However, in the case of most natural resources and immobile fixed capital, which physically cannot leave the economy, a notional resident unit is established if the economic owner is technically a non-resident unit. In this way the assets in question do become those with resident economic owners and so are included within the asset boundary and are included on the balance sheet.”
It means that the economic ownership of non-financial assets results in production in the resident economy since the “asset boundary for fixed assets consists of goods and services that are used in production for more than one year” (SNA 2008 10.33), where fixed assets may be both physical and non-physical assets

4
(see SNA 2008 Table 10.2). While in the case of financial assets economic ownership is not by all means accompanied by production in the resident economy, in the case of non-financial assets it should happen. In a simple wording:
“In other words, it is the economic owner that uses the asset in its production process.” (UNECE 2015 3.21)
Autonomy of the economic owner seems to be not a necessary criterion. Although autonomy is one of criteria for institutional units in recent manuals, exceptional cases are also discussed (see SNA 2008 4.42, cf. BPM6 4.15, ESA 2010 2.30). There are some examples where an institutional unit engaged in production in the resident economy and so the economic owner is practically not an independent unit, moreover not an existing unit at all. A good example is the branch:
“When a non-resident unit has substantial operations over a significant period in an economic territory, but no separate legal entity, a branch may be identified as an institutional unit. This unit is identified for statistical purposes because the operations have a strong connection to the location of operations in all ways other than incorporation. An unincorporated enterprise abroad should be treated as a quasi-corporation when indications of substantial operations can be identified separately from the rest of the entity.” (SNA 2008 4.47, cf. BPM6 4.27-4.28 and ESA 2010 18.12)
This example raises the question whether in practice the measured production or, in general, “substantial operation” may be considered as rather real or rather artificial. It will be also the key issue in the case of SPEs.
The recent definition of SPE was worked out by the IMF-led Task Force on Special Purpose Entities after long preliminaries. This task force has dealt with only SPEs owned and controlled ultimately by non-residents. Key elements of this definition are well-known for many years but as a formal definition this is the first one at international level:
“An SPE resident in an economy, is a formally registered and/or incorporated legal entity recognized as an institutional unit, with no or little employment up to maximum of five employees, no or little physical presence, and no or little physical production in the host economy.
SPEs are directly or indirectly controlled by nonresidents.
SPEs are established to obtain specific advantages provided by the host jurisdiction with an objective to (i) grant its owner(s) access to capital markets or sophisticated financial services; and/or (ii) isolate owner(s) from financial risks; and/or (iii) reduce regulatory and tax burden; and/or (iv) safeguard confidentiality of their transactions and owner(s).

5
SPEs transact almost entirely with nonresidents and a large part of their financial balance sheet typically consists of cross-border claims and liabilities.” (IMF 2018, 39.)
As it could be seen before, the economic ownership is not by all means related to the autonomy of the owner which at the first sight supports the above definition of SPE having “no or little physical production in the host economy” and, as a result, being economic owners of (both financial and non-financial) non-physical assets in their resident country.
This approach, however, also includes ambiguity. It is well-known for many years that SPEs may legally own non-financial assets in their resident economy while their economic ownership is at least questionable:
“The Task Force concluded that the SPEs generally acquire the legal ownership of the non-financial assets, but the foreign owner of the SPE should be considered as the economic owner when it is the sole client of the SPE, possibly together with other affiliates of the group.” (Eurostat 2009, p. 14)
Therefore, it is not clear whether this new definition (together with the proposed template) just reflects data needs upon legal status and book-keeping for further analysis or, at the same time, it is also the suggested application of methodology and release template for national compilers. The first case is rather related to data collection while the second one is also the issue of data release to the public. This point will be tackled in the next section.
Questions and datasets
The IMF-led Task Force Final Report proposed the template for national compilers in Annex VII to collect data on SPEs, at least for the selected BOP and IIP items. Upon the discussion and the definition of SPEs in this report, goods and some services category were also selected where formally SPEs may be concerned. It is well understandable and acceptable if the goal is to collect data on this phenomenon upon legal status for further analysis. In addition, SPEs may inflate transactions under various instruments and if their transactions and positions are well detected then they can be separated from standard BOP and IIP data at national level (see Montvai 2015). In principle this kind of process does not harm the requirements of bilateral symmetry. The question is whether this is all which should be served by this dataset.
It is well-known that there is here also a debate on methodology, namely which recording is required by the economically reasonable recording of SPEs in macroeconomic statistics. Differently from this definition, BD4 Box 6.2 stated that one characteristic of an SPE is that it “has no or few employees, little or no production in the host economy and little or no physical presence”. This wording would exclude SPEs from almost all production processes (and so from economic ownership of non-financial assets) in their resident economy (more exactly in this case their production

6
should be valued at costs) and it can be argued that this approach would be more in line with the experience that these units have relationships and transactions mainly with non-residents and have “little or no physical presence” in the resident economy.
This was also reflected in different papers in last years:
“Probably, it would be preferable though to limit the relevant criterion to ‘having no or few employees’, as the second part of the criterion ‘having little or no production’ is slightly ambiguous, when one interprets it as having little or no output and value added. In the case of some SPEs, e.g. royalty and licensing companies, output and value added can be quite substantial. … Although there seems to be an economic rationale for imputing transactions and positions to (better) reflect the economic ownership of the assets, it would without any doubt lead to a considerable number of imputations. The Task Force and the AEG suggest as a general rule not to reroute the ownership of assets of SPEs. … It should also be noted that the classification of these assets may have a direct impact on the recording of output and value added which is dealt with below.” (ECB-Eurostat-OECD 2013, p. 11-14)
“The income generated by an SPE is subject to the tax code of its country of residence and this fact cannot be ignored. If (economic) ownership of the IPP was not assigned to the SPE in question a considerable amount of rerouting of transactions and related financial flows would be necessary. In general, the 2008 SNA does not encourage such imputations, probably because of the risk of asymmetries, as approaches may diverge between countries.” (UNECE 2015 3.58)
After these preliminaries it seems as if points of views of aggregation, analysis and methodology would be confused or rather this latter would be thrown into the shade by this new proposed definition and template. These papers argue that compiling of economically more reasonable data on SPEs would be accompanied by number of imputations and so practically difficult and harmful for bilateral symmetries so data on SPEs should be compiled upon their legal status (more exactly similarly to data on non-SPEs).
This point will be tackled below but before this another issue should be discussed: these papers, as it seems, also accept that the handle of SPEs upon their legal status in national data may have an effect on resident GDP, but they find that it can also accepted methodologically:
“Concerning production by SPEs, the text of the SNA of 2008 4.57 quoted before is not particularly clear and it is not sufficient to describe all the cases of SPEs that can be found in the case studies produced by the Task Force. Indeed, the SNA of 2008 (4.47a and 26.30b) gives also a list of examples of production activities that do not involve physical presence and that therefore should be considered in connection with SPEs.” (Eurostat 2009, p. 10)

7
Under 4.47 and 26.30 SNA 2008 discusses the case of branches whose physical present in principle also may be low-level in the resident economy. SNA 2008 (and BPM6) does not make a difference as regards recording of production in the resident economy whether a branch has significant physical presence there or not. Since from the point of view of taxation setting up an SPE seems to be more advantageous than setting up a branch, it is not clear why a branch was set up for activities without significant physical presence (e.g. merchanting or collecting licence fees from customers and converting these receipts to incomes for their non-resident parents) instead of an SPE. If a branch is considered in every case to have production and economic ownership in the resident economy than it can be argued for the economic ownership of SPEs in the resident economy.
The relationship, however, may be also the reverse: since for SPEs the form of institutional unit is not defined, branches without (significant) physical presence and engaged in activities similar to invoicing companies also can be considered as SPEs (since probably they have also no significant connection with the resident economy). As a result, the issue of little or no physical presence of branches rather strengthens the approach of BD4 as regards the SPE with “little or no production in the host economy” which would result that an SPE may not be an economic owner of non-financial assets in the resident economy due to the lack of significant production. This point should be also cleared well in international manuals.
Returning to the question of how this template or, in general, the separated data on SPEs would be handled in national publications, one trivial goal is to prevent inflation of transactions and positions in FDI figures deducting data on SPEs from them. Transactions under goods and services data of resident SPEs, however, seem to be more complicated to explain. If they belong to resident production and GDP, then it is not necessary to separate them from standard BOP and SNA figures. If, however, there were an economic interpretation of their separation from standard figures at national level, then it should question whether these SPEs represent an integral part of resident production and GDP.
Traditional economic theory says that there is no production without production factors. Although in our digitalised world the location of these factors may become less obvious, the measured factor productivity figures can show if artificial production is present:
“A large part of service production, exports, and imports, and some part of goods production can begin to consist of phantom production and trade that makes no use of factors of production actually resident in the countries to which they are attributed. If that takes place to an important degree, the measures of the current balance and national output begin to lose their meaning.” (Lipsey 2009, p. 61)
These considerations also support the concept of SPEs not holding economical ownership of non-financial assets in the resident economy. If this concept were accepted, the newly proposed dataset on SPEs should serve other goals than the separation of data on SPEs from resident figures and analysis of them. In the first step,

8
however, the question of this separation (together with the issue of bilateral asymmetries) and the one of compilation of economically more interpretable data should be detached from each other. The former can be approached rather through templates like the one proposed by the IMF-led task force (with detailed country breakdown) while the latter rather by compilation of full set of BOP and IIP data for the resident economy without resident SPEs where these units cannot be economic owners of non-financial assets. These data should be not in contradiction with each other since they answer to different questions. Of course, at the same time these datasets should not also be independent from each other since both are resulted from the same national data collection and compilation system. In sum, the separation of datasets and questions cannot be confused with their independence.
At national level imputation and rerouting transactions of SPEs seem to be less problematic in the case of resident SPEs since the main task is to record their transactions under FDI income instead of goods and services if necessary. At the first sight it is not a question here whether to which country these latter should be attributed or how this rerouting affects bilateral asymmetries since theoretically it is not a primary goal of national publications (which cannot be again confused with national data collecting and compilating system which should face the issue of bilateral asymmetries). On the other side, however, under the concept of resident SPEs holding no non-financial asset in the resident economy the issue is not just adjusting for resident SPEs in resident statistics but also for non-resident SPEs where production and economic ownership should be attributed to resident players from non-resident SPEs and there is a need for data on them available somewhere in other countries. Maybe somewhere here is the point where the issue of rerouting is not supported by international manuals and reports, but it in itself cannot make national data economically more reliable. It is possible that, in the case of (supposed) significant turnovers, national compilers, together with tax authorities which may be also very interested in this topic, apply for other methods to make this attribution like formulary apportionment which in the case of “little chance for bilateral or multilateral agreements” regarding this regime, “likely would be the only practical approach” (Fleming-Peroni-Shay 2014, p. 9).
The other dataset including separated data on SPEs upon legal status would help this issue, too, if there were a will to address these user needs, e.g. with a well-defined concept of rerouting (i.e. who is the real economic owner), detailed country breakdown and data exchange system. If the concept of ultimate investor is important for FDI statistics, the concept of ultimate owner of non-financial assets also can be important for compiling resident GDP. This work should concern not only countries with hosting residents SPEs but also the ones owning them abroad – these two sets of countries are not necessarily reconciled with each other.
It means that in the second step both datasets can serve both the reconciliation of bilateral asymmetries and the issue of compilation of economically more interpretable data at both national and international level. The less is the ambition, the less will be the result.

9
Concluding remarks
The phenomenon of SPEs requires special attention. There are many questions to be answered which they raise, and these may require different data. At national level the main issue is the level of production or inward and outward FDI without capital in transit and asset-portfolio restructuring. At international level important question is the bilateral asymmetry or the distribution of production and wealth across countries. These can be answered by the help of different datasets which should be compiled. Possibly it requires more effort both by national compilers and users of their data including international organisations. There is, however, a precedence for these different datasets since this issue resembles national and community concept of international trade in the European Union.
At last but not at least it may be also raised that if we intend to compile economically more interpretable national statistics, then data should be adjusted not for data on SPEs since transfer pricing and capital is transit are present more generally in national data. It is well-known that there are resident players who can be considered as SPE-type or near SPE where some but not all of their transactions have similar characteristics to ones of SPEs. If they are engaged in production, i.e. they are economic owners in the resident economy, then their goods and services data cannot be separated from other transactions since they form a part of the resident GDP. The only possibility is to make other adjustments based on other available information (like in the case of VAT registrations) similarly to adjustment for capital in transit in the case of non-SPEs. These steps, however, are otherwise done regularly by national compilers affecting also bilateral asymmetries. From this point of view the importance of SPEs can be found in the fact that they can be a well-defined, compact subset of these adjustments.
References
ECB-Eurostat-OECD 2013 – Final Report by the Task Force on Head Offices, Holding Companies and Special Purpose Entities (SPEs). ECB-Eurostat-OECD, 2013
Eurostat 2009 – Task Force on the recording of certain activities of multinationals in national accounts, Final report. Eurostat, 2009
Fleming-Peroni-Shay 2014 - J. Clifton Fleming Jr., Robert J. Peroni, and Stephen E. Shay: Formulary Apportionment in the U.S. International Income Tax System: Putting Lipstick on a Pig? Michigan Journal of International Law, vol. 36, 2014, pp. 1-57.
IMF 2018 – Final Report of the Task Force on Special Purpose Entities. Prepared by the Statistics Department, International Monetary Fund, 2018
Lipsey 2009 - Robert E. Lipsey: Measuring International Trade in Services. In: Marshall Reinsdorf and Matthew J. Slaughter ed.: International Trade in Services and

10
Intangibles in the Era of Globalization. National Bureau of Economic Research, University of Chicago Press, 2009, pp. 27-70.
Montvai 2015 - Montvai, Beata: FDI statistics excluding special purpose entities, capital-in-transit and financial restructuring—Hungarian practice. ISI World Statistics Congress, IFC Satellite Meeting, Rio de Janeiro, 2015
UNECE 2015 – Guide to Measuring Global Production. United Nations, New York and Geneva, 2015

1 |
Conference Bridging measurement challenges and analytical needs of external statistics:
evolution or revolution?
17-18 February 2020, Lisbon
SPECIAL PURPOSE ENTITIES: A VISIT OUTSIDE THE COMMON SET
OF RESIDENCY AND ECONOMIC OWNERSHIP
Péter Bánhegyi
Magyar Nemzeti Bank

2 |
• Starting points
• Residency and economic ownership
• Approaches to SPEs
• Conclusions
OVERVIEW

3 |
• Economic growth and global production are current issues inrecent analyses both at national and international level.
• Data for global and regional analysis should fulfil the followingcriteria:
bilateral asymmetry; economically adequate distribution of production and trade
across countries.
• Production and trade are linked to non-financial assets.• Country data are compiled upon international methodological
standards including residency and economic ownership.
STARTING POINTS

4 |
• As regards residency: the “residence of each institutional unit isthe economic territory with which it has the strongest connection,in other words, its centre of predominant economic interest.” (SNA2008 4.113)
• Residency is related to legal ownership.• As regards economic ownership: the “economic owner of entities
such as goods and services, natural resources, financial assets andliabilities is the institutional unit entitled to claim the benefitsassociated with the use of the entity in question in the course of aneconomic activity by virtue of accepting the associated risks.” (SNA2008 3.26)
• It is a bit different issue in the cases of financial and non-financialassets.
RESIDENCY AND ECONOMIC OWNERSHIP 1.

5 |
• In the case of financial assets it is possible to transform an assetinto the other one (through intermediation) which includes someof risks and benefits – legal ownership can be considered aseconomic ownership here in statistics.
• In the case of non-financial assets this intermediation is notpossible – non-financial liabilities do not exist!
• As we can read: “The only non-financial assets included in theasset boundary of an economy are those whose economic ownersare resident in the economy.” (SNA 2008 3.39) “In other words, it isthe economic owner that uses the asset in its production process.”(UNECE 2015 3.21)
• As a result, economic ownership of non-financial assets is linkedto production.
• Autonomy is not a necessary criterion to be an economic owner!
RESIDENCY AND ECONOMIC OWNERSHIP 2.

6 |
It would be a wonderful world if residency and economic ownershipcoincided with each other…
…but the reality is a bit different.
One element of this difference is the presence of special purposeentities (SPEs).
RESIDENCY AND ECONOMIC OWNERSHIP 3.

7 |
There are two detailed description of SPEs in internationalmethodology: general criteria in OECD BD4 in 2008 and definition of the IMF-led Task Force on Special Purpose Entities
in 2018.
APPROACHES TO SPES 1.
Criterion IMF TF definition OECD BD4 general criteria
Legal and formally registered unit in the resident yes yeseconomyDirectly or indirectly controlled by non-resident yes yesparentTheir financial balance sheet typically consists of yes yescross-border claims and liabilitiesPhysical presence little or no little or no
Employment up to maximum five no or fewemployees employees
Production little ot no physical little or no production production

8 |
• If we take literally these approaches (and we would suppose thatevery word is in its place), there is an important differencebetween them since OECD BD4 general criteria practicallyexclude while IMF TF definition practically allows the economicownership of (basically intangible) non-financial assets for SPEsin the resident economy.
• This issue may be practical: „If (economic) ownership of the IPPwas not assigned to the SPE in question a considerable amount ofrerouting of transactions and related financial flows would benecessary. In general, the 2008 SNA does not encourage suchimputations, probably because of the risk of asymmetries, asapproaches may diverge between countries.” (UNECE 2015 3.58)
• From economic point of view, however, the attribution importantproduction to an economy upon legal base may be problematicand demands for other possibilities (e.g. formularyapportionment). OECD BD4 general criteria seem to be moreadequate here – unless we find that the set of SPEs under OECDBD4 criteria is just a subset of SPEs under the IMF TF definition (isthis what we wish?)
APPROACHES TO SPES 2.

9 |
APPROACHES TO SPES 3.
income production receipts
parent
income income production receipts
parent
production receipts
parent
Economy A Economy B Economy C
SPE
SPE affiliate (either real or notional)

10 |
• The first case is the application of IMF TF definition while thesecond and the third ones are possible reroutings of production toother countries upon economic ownership (issue of incomes maybe a heavy barrier to the application of the third case!).
• Important question arises here: what is the status of the IMF TFdefinition? First, it can fulfil IMF data needs for getting information on
SPEs from the concerned countries. Second, it may serve also as a methodological guideline for
national compilers for SPEs in their national statistics.• The first case (if every concerned country provides data upon this
definition on SPEs to the IMF) can assure the global measure theactivity of SPEs upon legal ownership.
• The second, in addition, may assure bilateral symmetries but maytake the autonomy of member states away as regards theapplication of the concept of economic ownership.
APPROACHES TO SPES 4.

11 |
These two approaches can be compared as regards statisticalconsequences (where the set of SPEs under these two approaches isconsidered as the same and these findings should be explained as if„every other issues were all right”!):
APPROACHES TO SPES 5.
IMF TF definition OECD BD4 criteria OECD BD4 criteriawithout cooperation with cooperation
Country GDP data aggregable at global level yes partly yes
Country GDP data aggregable at regional partly partly yeslevelBilateral asymmetry of trade no partly no
Adequate distribution of production across partly partly yescountriesPossibility of excluding economic ownership no yes yesof non-financial assetsPossibility of "missing" or "excess" GDP no yes noat global levelPossibility of "missing" or "excess" GDP yes yes noat regional level

12 |
• The optimal solution would be the application of BD4 general criteriatogether with the cooperation of concerned countries in order toachieve bilaterally asymmetric, aggregable country GDP and tradedata and economically adequate distribution of production and tradeacross countries.
• In the lack of this cooperation the definition and the data templatefor SPEs have their own legitimacy - which can be raised if these datawill be also sources for international cooperation.
• The application of the concept of economic ownership for SPEs, i.e.the rerouting production and trade to another countries mayrequire compilation of two datasets from national compilers forSPEs – it may be well-known from the difference between nationaland community concept of foreign trade inside the European Union.
• This concept of economic ownership theoretically also would requirethe rerouting the production of resident-owned non-resident SPEs tothe resident economy!
APPROACHES TO SPES 6.

13 |
• Different needs of compilation of national and internationalfigures may require different datasets for SPEs in the first step inthe lack of global or regional cooperation of countries.
• In the second step, however, data collected by the IMF throughthe proposed data template may be the source of internationalcooperation for data reconciliation of SPEs upon economicownership – towards the concept of ultimate producer and owner.
• This application of economic ownership can operate only in thecase of SPEs – near SPEs and similar enterprises have real residentproduction which should be recorded in resident statistics(adjustments for capital in transit should be made for them also!).
• Rerouting of production and trade affect FDI incomes also andthey cannot be negligible – this is why rerouting of production andbilateral symmetry of total balance of payments (or rest-of-the-world account) never can be achieved at the same time and dataexcluding SPEs (in general, capital in transit) should be analysed.
CONCLUSIONS

14 |
THANKS FOR YOUR ATTENTION!

1/1
IFC Conference on external statistics "Bridging measurement challenges and analytical needs of external statistics: evolution or revolution?", co-organised with the Bank of Portugal (BoP) and the European Central Bank (ECB)
17-18 February 2020, Lisbon, Portugal
On the re-evaluation of the air transport activity in a globalised environment1
Marios Papaspyrou,
Bank of Greece
1 This presentation was prepared for the meeting. The views expressed are those of the author and do not necessarily reflect the views of the BIS, IFC, BoP, ECB or the central
banks and other institutions represented at the meeting.

On the Re-evaluation of the Air Transport Activity in a Globalized Environment 1
On the Re-evaluation of the Air Transport Activity in a Globalized Environment
Marios Papaspyrou1
Abstract
Multi-territorial enterprises have always been one of the most challenging items in the Balance of Payments (BOP) statistics, both in terms of methodology and data collection. Aviation and shipping are the industries where the best proponents of these multi-territorial enterprises are fostering. Economic globalization makes identification of BOP transactions for these MNEs even harder. This paper attempts a deep dive into the air transport activity, with the scope to provide some insights to the current methodology and existing data collection methods and to provide, when possible, favorable alternatives. A centralized global model is proposed, based on an International Organization playing the role of data Guardian, collaborating with other international organizations and associations, such as IATA. Practical criteria for identifying the statistical residency are clearly stated, whereas the mechanics of the whole model is explained in detail. The use of big data techniques is suggested when there is lack of adequate data sources or when our model is far too optimistic to achieve the first best. The importance of cooperation and coordination among national authorities and international organizations is highlighted.
JEL Classification: C81, F60, R40.
Keywords: Airline Industry, Globalization, Balance of Payments methodology, Big Data
1 Bank of Greece, Department of Statistics, External Sector Data Collection Section, Tel: +30 210 320
3864, Email: [email protected].
The views and opinions expressed in this article are those of the author and do not necessarily reflect the official position of the Bank of Greece.

2 On the Re-evaluation of the Air Transport Activity in a Globalized Environment
Contents
On the Re-evaluation of the Air Transport Activity in a Globalized Environment ......... 1
Introduction ............................................................................................................................................... 3
The Model .................................................................................................................................................. 5
Defining the statistical unit and their residency ................................................................ 5
The major problem of OTAs in the current billing system ............................................ 8
The role of IATA in the data collection model .................................................................... 9
Implementing a full air transport services model in practice – the use of big data. .......................................................................................................................................... 10
Pros and Cons of the Guardian-based data collection model ................................... 13
Conclusion ................................................................................................................................................ 14
Acknowledgements .............................................................................................................................. 14
References ................................................................................................................................................ 15

On the Re-evaluation of the Air Transport Activity in a Globalized Environment 3
Introduction
Balance of payments (BOP) statistics are official statistics referring to external transactions between residents and non-residents from a statistical point of view. If there is physical movement involved in the transaction, as in the case of trade in goods, along with supervisory mechanisms from tax authorities, tracking consistently such cross-border transactions is rather straightforward. However, when we talk about non-tangible output, such as air transport services, and the interest is more statistical than for taxational2, capturing such BOP transactions can be a really difficult task.
In 2000, the IMF [1] identified four basic aspects of globalization: trade and transactions, capital and investment movements, migration and movement of people, and the dissemination of knowledge. A rough definition of economic globalization could be the increasing economic interdependence of national economies across the world through a rapid increase in cross-border movement of goods, services, technology, and capital.
Merely from their definitions, one realizes that the collection of BOP data and globalization are two competitive concepts. On the one hand, the collection of BOP data requires: a) clear definitions on the statistical residence of all trading partners, b) a clear view of the transaction and c) a measurable way to quantify it properly. In other words, you need to know exactly how and when the change of economic ownership occurs in every transaction. On the other hand, globalization promotes the removal of cross – border trade barriers, smoothing in a way economic environment, while making the daily job of official statisticians far more difficult and tempting at the same time. Hence, it is by no chance that the effect of globalization is more profound in Multinational/Multi-territorial Enterprises, the so called MNEs. MNEs have been of central interest lately in Task Forces and International Conferences [2] and the reason is that identifying “who does what” and “who owns what” can be a very difficult puzzle to solve in a globalized environment. An additional problem is that MNEs act under profit maximization on a worldwide level, whereas BOP statistics are on a national level; so in a sense, MNE’s managers do not speak the same language as the one implied in the BOP manuals. Discussions on MNEs mainly focus on issues concerning Foreign Direct Investment (FDI) (stock/flow) transactions and tax avoidance/antitrust policies [3]. However, looking at trade in services at a European level, see Table 1 [4], one can identify that transport services, mostly driven by sea and air transport, account for about 17% of total BOP revenues in services. Given that the shipping and airline companies are structured on a multinational setting, reviewing the trade in services for these multi-territorial enterprises is of great importance and interest on its own.
2 Main International Transport Services are excluded from the VIES tax declaration.

4 On the Re-evaluation of the Air Transport Activity in a Globalized Environment
Table 1.
Source of data: Eurostat. International trade in services (since 2010) (BPM6) [bop_its6_det]. Updated 20.01.20.
Investigating mirror data on the current account balance and quantifying current account bilateral asymmetries is a standard practice in the BOP quality assessment. Till now, the main reason for the presence of such bilateral asymmetries is attributed, as cited in EUROSTAT’s site on Economic Globalization and Data Asymmetries [5], mainly to different data sources used by Member States for collecting the data, whereas time of recording and different thresholds come as a secondary matter. Under globalization one could fairly add also the inherent difficulty of understanding MNEs transactions and their divergence from standard practice as described in existing manuals. Regarding BOP data collection the EU-official statistician stands on the most difficult point. On the one side, EU monetary and economic integration asks for the lift of all potential barriers to capital and physical mobility among Member States, while on the other side, the requirement to produce official statistics on a national level is retained. In Table 2 below, we can see that within EU-28 for air transport services the balance item (credit minus debit) which unveils data asymmetries, is growing significantly from 2013 and onwards.
Table 2.
Source of data: Eurostat. International trade in services (since 2010) (BPM6) [bop_its6_det]. Updated 20.01.20.

On the Re-evaluation of the Air Transport Activity in a Globalized Environment 5
Concerning official financial statistics, a lot of effort has been made by International Organizations to mitigate this globalization effect with the adoption, and even with the construction, of international databases. For example, the development of the Centralized Securities Database (CSDB) and the Register of Institutions and Affiliates (RIAD) was vital to the ECB for the production of EU-consistent Securities Holding Statistics (SHS) and Analytical Credit (AnaCredit) data respectively3. In CSDB each financial instrument is provided with a “country of the issuer”, where this field is firmed up after gathering information from various data providers and “voting” with non-equal weights. The same goes with RIAD where each entity is assigned a country of residence. What is important is that all Member States contribute to these databases, decide in common the statistical residency of the enterprise and, most important, use these databases for the production of their financial data. In this way, internal consistency is achieved and double-counting or under-reporting are minimized. This approach is the way to go when it comes to global consistency. Similar centralized data collection methods for the current account items have not yet come to surface. Lately, Eurostat is paving the way, via a Task Force on Shipping [6], in addressing the issue of globalization on the shipping cluster. A methodological handbook on sea transport is ongoing [7], where the use of international maritime databases is endorsed.
Before presenting our data collection method for the air transport activities, it would be wise to have in mind a reference data collection method under a globalized environment; find out why it works, analyze its strengths and try to see if it is possible to fit some of its principles to our model. Looking at official statistics the BIS report on deposits around the world really stands out. BIS gathers, on a quarterly basis, from the monetary authorities of each country, through Balance Sheet Items Statistics, the deposits resting in the commercial banks. In turn, by having high response is in the position to publish detailed data for deposits on a global level. The key ingredients for this successful collection method can be summarized to the following ones: first, BIS is practically the “Guardian” of the global banking system, and as such, almost all central banks report consistently to the BIS, second, definitions of residence are easy to be followed by all reporting banks worldwide and, third, deposits is a very clear item to measure and declare by the reporting banks. Although all these three characteristics are crucial for data completeness, the first one, that of being the Guardian of the system, appears to be of utmost importance.
The Model
Defining the statistical unit and their residency
The present methodological model has the ambition to set a data collection model for air transport services that will be the “equivalent” of BIS for the deposits. Although, in principle, it is a global model, its contribution appears to be greatest for the case of the European Union (EU). EU is facing an inherent difficulty in collecting BOP air transport statistics and the main reasons are that there is free movement of individuals across Member States, there are no formal check points (such as for
3 The introduction of the Legal Entity Identifier (LEI) for unique identification of the companies works
to the same direction.

6 On the Re-evaluation of the Air Transport Activity in a Globalized Environment
migration or customs), mobility of employees is high due to intensive intra-EU trade and there are a lot of MNEs with several affiliates operating within Europe, for which their employees are highly intragroup mobile.
Starting with the definitions, according to the BPM6 CG [8], for the resident economy BOP credits on air transport refer (mainly) to receipts earned from resident airline companies for providing cross-border air transport services, that is international carriage, to non-residents, whereas debits are (mainly) payments to non-residents airline companies for providing such international transport services to residents4. Here, although it is not crucial for our model, a clarification needs to be made. From our perspective, the parties involved in a BOP air passenger transaction are not always the airline carrier and the passenger. Of course, this holds for the case of travelling for personal vacations, which is, of course, is the main drive of airline revenues. When it comes to business travelling where, the ticket is paid, and most often booked, from the employee’s company or the travel agency contracted with the company, then the real BOP transaction is between the airline carrier and the employee’s company. To shed more light to this situation, we provide here an interesting example: a Greek travel agency books, on account of a Greek shipping company, an airline ticket for a seaman from Philippines to travel from Manilla (although it could be any place on Earth) to New York to onboard there, using as a carrier Deutsche Lufthansa, let’s say. The real transaction, in economic terms, is between the Greek shipping company and the German carrier, so for Greece it should be on the BOP debits. Following the money validates this view also in financial terms. End to end, the money goes from the shipping company to the airline carrier; all other parties are pass-through units. Observe here that, neither the nationality of the passenger nor the port of origin/port of destination plays any role for classifying the transaction5. In fact, the passenger is totally indifferent to the ticket’s arrangement or/and its cash settlement. And the same story goes practically for all tickets referring to business purposes. The significance of this key point here will be evident later on, when we will try to specify criteria for the residency of the “passenger” 6.
Now that we have identified the statistical units involved in the transactions, we can proceed by determining their residency. The concept of residence of the two trade parties is the most crucial one for compiling BOP statistics. Concerning the residence of the airline company, the answer is fairly clear: it should be the country as designated in the country/region field from the International Civil Aviation Association (ICAO) designators [9]. In addition, the International Air Transport Association (IATA) has an online airline search tool, where, for the IATA airline members, the country/territory of the airline company along with an IATA designator is explicitly provided [10]. Although identifying the residency of airline companies is relatively easy, the big problem arises to identify the residence of the counterpart. As mentioned above, the counterpart should be the individual if the ticket is paid by the
4 Domestic flights provided by resident carriers are included in the travel item, provided that
transportation is not compound to the international carriage. In the case of transit, this also goes to transport services.
5 The seaman could equally well travel to New York from Hamburg or any other place on Earth. 6 The travel agency is by definition an intermediator. According to MSITS 2010, “the travel component
of EBOPS 2010 differs from most internationally traded services in that it is transactor-based”. This means that one could suggest that the individual, not the company, should be the counter-party. However, international carriage is clearly excluded from travel, so this suggestion should not hold.

On the Re-evaluation of the Air Transport Activity in a Globalized Environment 7
passenger himself (and never reimbursed), in cases of personal vacation travel, or the company, that the passenger represents, in cases of business travel. Hence, the crucial point here is first, to identify if the counterpart is the individual or the company and, second, to determine the residency in each case.
Compilation manuals, such as MSITS 2010 [11], clearly define residence of individuals as the country where their principal dwelling is located. However, when it comes to explicitly specifying means for practical identification and collection of granular data on the residency of individuals (by simultaneously respecting the latest GDPR standards), manuals remain relatively silent. In the BOP CG the use of migration statistics is suggested for compiling air transport services. From the discussion above, it should be obvious that within EU, migration statistics are not relevant whereas, passport data for EU passengers, can, in fact, be misleading. Within Europe, there is freedom in getting a job in a foreign country and becoming economic resident of that country. However, earning nationality (i.e. passport) is much more difficult. To this end, some countries combine data from Civil Aviation Authorities on air traffic and from the travel survey, to obtain estimates on the residency of the travelers. However, these practices require computationally intensive and stratification methods, which may suffer from small sample biasness. Here instead we opt for a data collection procedure that is as granular and direct as possible.
To this end, we propose a practical criterion for identifying the statistical residency that solves simultaneously both problems mentioned above. We suggest that when the phone number of the ticket reservation is available, then the country code of this phone number (say +44 for GB) obtains the first best solution. When someone establishes himself to a foreign country to work for a long period of time, one of the first things he does is to obtain a phone number from a domestic telecommunications provider7. Hence, in our view, the statistical residency of an individual can be identified most accurately and timely by the country code of the phone number of the individual. Now, for the case of the business travel, an addition observation is very helpful: if the company is contracted with a travel agency for ticket booking, the travel agency would, most often, be a local agency, hence having the same residency as the company. Then, the phone number in the ticket reservation would be that of the travel agency, which captures the correct residency of the company8. Of course, when the company books the ticket herself, the phone number of the company would then be indicated, rendering our problem trivial. The issue of availability of such (non-confidential) phone data is discussed later on in the paper. Here it suffices to say that, in principle, phone data are visible to travel agents when the ticket is booked by an agency and to the airline companies when the ticket is booked through the airline’s website.
7 Roaming within EU is financially viable only for short term visits. In long term establishments, which
entail most of the times, change of residency, obtaining a local phone number is the standard case. 8 Although the phone number may not be the correct one, the country code of the phone number
signals the desired country.

8 On the Re-evaluation of the Air Transport Activity in a Globalized Environment
The major problem of OTAs in the current billing system
In principle, there are two ways to book an airline ticket. Either you visit directly the website of the airline company and book the ticket from there, and this is called direct sales, or you go to a travel agency, which is called most often billing. Direct sales are known only to the airline company, however it comprises only a minor component of the total sales9. The predominant turnover of the airline companies however, comes through tickets issued by travel agents. Especially, for the major airline companies, who are IATA members, their ticket settlement passes mainly through the IATA Currency Clearance Service (ICCS), comprising the IATA Billing and Settlement Plan (IATA BSP) and IATA Cargo Agents Settlement System (IATA CASS), along with the IATA Clearing House (ICH) for interline arrangements.
The IATA is a trade association of the world’s airlines. Consisting of 290 airlines, primarily major carriers, representing 117 countries, the IATA's member airlines account for carrying approximately 82% of total available seat miles air traffic. IATA has over 50 offices over the world, supporting members in 120 countries10. Observing the member list of IATA, we see that practically all major airline companies are members of IATA, whereas most airline companies outside IATA membership are low-cost carriers. In relative terms, one can say that IATA is the guarantor between accredited travel agents and the airline companies.
Travel agents can be either internet-based platforms searching for best prices across airline companies for a specific trip, often called Online Travel Agents (OTAs), or traditional offline travel agencies with physical presence. From 2013 and onwards OTAs have made a strong entrance to the billing system. The BPM6 CG [pg. 12.49] suggests that “the compiler must make a simple, but not altogether unreasonable, assumption that tickets sold in a particular economy are sold to residents of that economy and adjustments made to estimates as necessary, by using surveys of travelers”. Indeed, for the case of the offline travel agencies with physical presence, this suggestion is still valid. When a ticket is reserved with physical presence via a local travel agency, then all odds are in favor of assuming that the passenger is a resident. On the contrary, it was with the intrusion of OTAs in the billing system that made the above assumption rather outdated. Large scale resident OTAs tend to inflate a country’s billing system, in BOP terms, when they decide to clear tickets in the domestic economy. The reason is that, in such cases, one sees in a domestic economy a high level of IATA BSP for several foreign airline companies when, in fact, the biggest proportion of these sales refers to tickets between non-residents passengers and non-resident airline carriers. Additionally, because OTAs may have several IATA slots to clear their online ticket reservations. The above two observations pressure significantly the whole data collection system in BOP terms11.
9 Low-Cost Carriers try to push more their direct sales, but simultaneously have lower turnover. Given
that direct sales are known only to the airline company, one can obtain these data either directly from the airline company, credit cards data or by estimations methods. This issue will be discussed later on at the implementation phase of our model.
10 Source: IATA website https://www.iata.org/en/about/. 11 Port of origin of the ticket could be a potential solution, but does not reflect completely the concept
of residency. In our previous example with the Greek shipping company and the seaman from Philippines, port of origin is totally misleading, whereas our approach appears to be fully robust.

On the Re-evaluation of the Air Transport Activity in a Globalized Environment 9
The role of IATA in the data collection model
Regarding the IATA BSP, the system is on a ticket by ticket level. The airline companies (and the IATA) know from the billing report, per travel agent, the number of the ticket, the transaction value, gross sales, commissions, taxes and possible refunds. Although the name of passenger is known to the airline company12, it is the travel agency who has access to the crucial variable of the country code of the phone number of the ticket reservation13. The IATA collects billing statements worldwide from accredited travel agents on airline companies who are IATA members.
The missing link to our model is that travel agencies should submit to IATA the country code of the phone number appearing in the ticket reservation. In the event where such information is not available to the travel agent, as is in the case of group/bulk reservation in an offline setting, the country code of the travel agency itself (as it appears in the billing report) could be used, as suggested earlier in our methodological approach. Then IATA, having the billing reports from all travel agents around the world, could pivot and deliver BOP data per airline carrier and per country of residence. The advantage of this approach is that it mitigates the “noise in the data” produced by OTAs and achieves global consistency within the billing data.
Apart from the ΙΑΤΑ BSP, which is the major item for air transport activities, we also have the IATA CASS, which is for cargo transport. The standard practice for IATA CASS cleared in a domestic economy, is that the cargo is dispatched from that economy and most probably from residents, hence, it should be recorded as BOP transaction when the carrier is a foreign airline company.
In addition, an important issue is the “interline market”, between airline companies. Interline arrangements, as discussed also in the BPM6 CG, is the case where the actual operating carrier and the airline issuing the ticket differ. In financial terms, interline resembles the interbank market with central bank intermediation. IATA runs the IATA Clearing House, who plays the role of the central “institution” where each airline company uploads her assets/liabilities vis-à-vis all other airline companies and at the end the ICH transfers the net payable to the beneficiaries with positive balance, while requesting money from the those with negative balance. The ICH has a clear view of assets and liabilities on gross values, as suggested in the manuals, for each airline company contracted with ICH. Net payables of course may differ.
The IATA-based model presented above, provides a realistic solution to capture BOP transactions regarding ticket sales issued by travel agents within the IATA airline members, which is the big picture of the global airline industry in terms of air transport activity and revenues. However, in order to have the full picture, one needs to have, in addition, the direct sales of the airline companies14, taking place outside the IATA clearing system. Although for IATA airline members direct sales constitute
12 The name of passenger is not directly visible to the airline company from the billing report, but it can
be retrieved from additional reports. 13 To the majority of OTAs ticket reservation systems, the country code of the mobile phone number is
a mandatory field (with asterisk). The same holds on direct sales ticket reservation of airlines. 14 As mentioned earlier, direct sales occur when the ticket reservation takes place through the airline’s
own website/call center. For low-cost carriers direct sales form a significant portion of the total turnover, whereas for IATA airline members direct sales represent only a small extent of total sales.

10 On the Re-evaluation of the Air Transport Activity in a Globalized Environment
only a small fraction of the total turnover, for low-cost airlines direct sales play the biggest role15. From a statistical point of view, direct sales have the advantage that the airline company has “more direct” information on the customer. Most often, in direct sales the phone number is a mandatory field in the reservation process and hence it is available to the airline company. But again, low-cost carriers tend to have minimal physical presence throughout the world, with no branches whatsoever, so obtaining data from these non-resident companies by using standard survey methods can lead to a significant under-sampling. Only for the countries where these low-cost companies have legal registration and physical presence is direct reporting truly feasible. For these countries, BOP credits would be correctly reported, whereas for the counterpart countries it would, most probably, be a missing part from their debits. This is because if a resident physical person books a ticket online with a low-cost non-resident airline company with no established branch, this debit transaction will be very hard to capture, given the small transaction value and the fact that it refers to an individual. Hence, it appears rather inefficient to have all countries trying to collect/estimate such sparse data16. What seems to be really efficient, given the inherent deficiencies in collecting such air transport data, is that a centralized body is developed where countries can have access and exchange these data, maybe on a more aggregated basis. Here, the necessity for an International Organization to take the lead and play the role of the “Data Guardian” is more than obvious. Each country should submit to the Guardian data17 only non-IATA data (i.e. data not included in the IATA BSP, CASS, ICH) and only for the airline companies who have their Headquarters incorporated to their country. This, in fact, reduces significantly the burden and the number of the respondents.
In turn, the Guardian will be responsible for three main things: first, to gather the relevant BOP data from all countries regarding non-IATA data, second, to establish cooperation with IATA in order to get all data passing through IATA and, third, to arrange for timely and secure data sharing with NCBs and NSIs.
Implementing a full air transport services model in practice – the use of big data.
Establishing a data Guardian with the above responsibilities is, of course, the first best. However, in real life, we all know that implementing such a large-scale project can be time consuming and may fall into the caveats of bureaucracy. As a second best, the step of gathering non-IATA data could be overcome. Lately, with the advent of big data and computational algorithms, the hope has emerged to use this technology to produce official statistics of high quality while reducing the statistical burden. For the above cases, big data tools can prove to be beneficial in two ways: NCBs can employ
15 However, it deserves to be mentioned here that, even from their definition, low-cost airline
companies due to cheaper tickets, smaller distance travel destinations and total operational costs, contribute much less to the total turnover of the global air transport activity.
16 Of course having a two-sided reporting system is invaluable for data quality checks using mirror data. But this is efficient only when both countries have access to good quality data, such as imports and exports of goods.
17 These data should use again the country code of the phone number, in case it is available (as it is in direct sales), or the country of the travel agency otherwise.

On the Re-evaluation of the Air Transport Activity in a Globalized Environment 11
analytical credit cards data18 for airline companies outside IATA membership, where the residence of the passenger should now be aligned with the country of the credit institution having issued the credit card. The other, would be to use analytical daily data from Civil Aviation Authorities, proceed by online data extraction and other data mining techniques to find proxies on the daily prices on these low-cost carriers and then employ stratification/clustering methods to estimate the desired BOP values. Such big data applications have been suggested for estimating housing prices in the Real Estate market by Loberto, Luciani and Pangallo (2018) from Banca d’ Italia[12]19. Of course, for better fit, training of such machine learning algorithms can use information from observable databases. For example, there is no reason why the residency allocation within IATA airline companies should differ in the family of non-IATA airline companies.
Finally, to put together all the pieces of the puzzle, there are some additional, although less significant, components relevant to the air transport services, such as port expenses, handling services, catering, route overflown charges (such as Eurocontrol) and others20. Most of these expenses have to be reported either from the resident side, from the domestic enterprises offering these services within the standard direct reporting framework or from the branches of the non-residents airline companies operating in the resident economy. Concerning route charges, in the first-best edition of our centralized model, they could actually be collected centrally by our data Guardian within the scheme of bilateral collaboration between International Organizations (such as Eurocontrol for Europe). In the second-best scenario, extracting data from the tracking flights websites (or ICAO directly) could be employed to estimate route charges. Especially for Eurocontrol, a dynamic Route Per State overflown distance tool is available [13], for estimating the incurring route charges within the Eurocontrol charging area. Using the output of this tool as a training dataset, one could estimate the route charges for the non-EU area.
In order to have the whole picture of our centralized model, we present below in Figure 1 and Figure 2 the flow charts for the two scenarios.
18 For the EU, the ongoing ECB payment statistics regulation should facilitate towards this solution. 19 However, one should be aware that in our case, stratification can be very difficult. Ticket prices, even
for the same flight, tend to vary a lot throughout time, whereas pricing policy of low-cost carriers vs major airlines for the same destination can vary significantly.
20 The main expenses from the operation of the aircraft are the bunkers and the crew wages. These expenses are, almost always, paid directly from the headquarters.

12 On the Re-evaluation of the Air Transport Activity in a Globalized Environment
Figure 1.
Figure 2.

On the Re-evaluation of the Air Transport Activity in a Globalized Environment 13
From Figures 1 and 2 above, one can see that the IATA and the NCBs/NSIs play a key role as primary data source providers. The IATA captures the big bulk of the wholesales from travel agents, whereas national authorities are engaged with the collection of the sparsely distributed air transport data. It is evident that the introduction of novel big data techniques is beneficial to the statistical authorities and hence, it is to their best interest to develop relevant tailor made statistical methods.
Pros and Cons of the Guardian-based data collection model
Our proposed model on air transport activity combines three important merits. First, concerning the major part of the air transport services passing through IATA Clearing system, full consistency is achieved. Second, the definition on statistical residency is followed in the tightest possible manner. Third, amounts are exact, reflecting real cash transactions avoiding estimation techniques that may suffer from lack of robustness or misspecification. In order to make the whole project a reality, we allow deviation from the first-best solution and we seek for estimation/big data techniques only for the smaller part of the total turnover, that is outside the IATA billing, whereas the main bulk remains to be calculated accurately. One should not forget that following closely cash transactions minimizes the net errors and omissions item of the BOP. Finally, this centralized data collection, with the parallel use of big data from the NCBs will reduce significantly the burden to the respondents.
Although quite promising, the model comes with two relatively minor deficiencies. The first has to do with time availability of the data. Specifically, IATA clearing is materialized at T+30, meaning that for BOP compilation purposes all data dissemination and compilation from Member States regarding IATA data shall take place at the last available week before the BOP compilation deadlines. This narrow window for compilation can be stressful for official data compilers who compile monthly BOP seriers, but less stressful for those who compile quarterly or annually data, especially if such data have a provisional phase.
The second, and most important, is that in order for our model to work and be viable in long term, international coordination is explicitly required. The International Organization (data Guardian) will need to take the lead and establish bilateral agreements with IATA in order to guarantee timely transmission, solve confidentiality problems, data ownership and technical issues among others. These issues should not be undermined in any way, as experience has shown that these obstacles require coordinated global effort to be overcome. Observing existing frameworks, efficiency of International Organizations is high when these Organizations, apart from being data guardians, have a “constitutional” leverage on the declarants. For example BIS, IMF, ECB have such leverage in hand, making data collection on financial instruments much easier. On the contrary, most current account models dealing with the real economy and the non-financial sector lack of such leverage. Here, the necessity for global coordination has to be placed upon the importance of official statistics itself for the common good.

14 On the Re-evaluation of the Air Transport Activity in a Globalized Environment
Conclusion
The present methodological paper addresses the issue of how globalization complicates the collection and compilation of official statistics, taking the airline sector as a study case. We identify the standards that a generic model (irrespective of the industry involved) has to respect in order to bypass the effects of globalization; BIS deposits report is such a model. For the air transport services, concerning the statistical residency we propose the country code of the phone number as indicated in the ticket reservation to be the best proxy for residency, as passports can be highly misleading especially within EU. Our proposal is a centralized model, where an International Organization will be the data Guardian and collect data from IATA for all air transport services that are cleared through IATA, whereas for non-IATA data, only the countries where such airline companies have their Headquarters legally incorporated (hence resident) will report vis-à-vis rest of the world to the Guardian. The proposed model overcomes the imputed noise in geographical allocation from the presence of online travel agents in the billing system. In order to reduce even more the statistical burden, a second-best solution is proposed, where for the non-IATA data we rely on big data techniques. The importance to develop international cooperation for better official statistics in a globalized environment is strongly highlighted.
Acknowledgements
The author would like to thank all experts from the airline industry for the numerous discussions and for sharing their ideas and expertise. Also, he would like to thank the Bank of Greece for supporting the presentation of this paper.

On the Re-evaluation of the Air Transport Activity in a Globalized Environment 15
References
[1] “Globalization: Threat or Opportunity?”. IMF Issues, April 12, 2000 (Corrected January 2002).
[2] (a) Joint ESCB/ESS Task Force on Foreign Direct Investment.
(b) World Statistical Congress, 2019, International Statistical Institute. IPS-173: Consistent Measurement of Multinational Enterprise (MNE) Activities in Economic Statistics.
[3] Report from the Commission to the European Parliament, The Council, The European Economic and Social Committee and the Committee of the Regions, Report on Competition Policy 2018.
[4] EUROSTAT Database, International Trade in Services (since 2010) (BPM6), online data code: bop_its6_det. Last update: 20-01-2020.
[5] https://ec.europa.eu/eurostat/web/economic-globalisation/globalisation-macro economic-statistics/data-quality/data-asymmetries.
[6] Eurostat’s Task Force on the Recording and Compilation of Maritime Transports in the National Accounts and the Balance of Payments (2018-2019).
[7] Eurostat’s Methodological Handbook on the compilation of statistics on sea and air transport in national accounts and balance of payments — 2020 edition. https://ec.europa.eu/eurostat/web/products-manuals-and-guidelines/-/KS-GQ-20-007?inheritRedirect=true&redirect=%2Feurostat%2Fpublications%2Fmanuals-and-guidelines.
[8] IMF’s Balance of Payments and International Investment Position Compilation Guide, (BPM6 CG), Last updated: November 2017.
[9] https://en.wikipedia.org/wiki/List_of_airline_codes.
[10] IATA Members List. https://www.iata.org/en/about/members/airline-list.
[11] Manual on Statistics of International Trade in Services 2010.
[12] Banca d’ Italia, Working Papers, April 2018, No. 1171, Loberto, Luciani and Pangall. “The Potential of Big Housing Data: An Application to the Italian Real-Estate Market”.
[13] https://www.eurocontrol.int/online-tool/route-state-overflown-distance-tool.

On the Re-evaluation of the Air Transport Activity in a Globalized Environment
Marios PapaspyrouBank of Greece
1

IntroGlobalization and Official Balance of Payments (BOP) Statistics
Globalization promotes the removal of cross-border barriers to fostereconomic interdependence and increase cross-border movement of goods,services, individuals and capital.
BOP statistics refer to the transactions between residents and non-residentsbased on the sharp identification of the change of economic ownership.
By definition the two concepts are rivals !
Official Statisticians need to work more on globalization by providing:1) clearer definitions and practical guidelines for each industry.2) exploitation of new technologies. 2

Multi-National Enterprises (MNE) are the wranglers of globalization.
• Till now, focus on MNE has been given to: Foreign Direct Investment (FDI)and Tax Avoidance.
• Transport Services represent 17% of Total Services for the EU.
• In turn, Sea and Air Transport have the biggest share to TransportServices and the two industries are built up in a multinational setting.
• Main International Transport Services are excluded from the EU-VIES taxdeclaration, so data collection is harder.
3

Difficulties in the Air Transport Services Item
• Statistical residency can be difficult to capture in an analytical way.Globalization promotes the mobility across countries and with no-migration/residency barriers (such as EU), identification of residency isharder.
• Various data collection methods across countries (business surveys,estimation methods, cash transaction data, credit cards, use of travelsurvey data and others).
• Strong presence from 2013 and onwards of the Online Travel Agents(OTA) in the issuance of air tickets.
• Non-physical presence of branches of airline companies in the reportingcountry.
4

Difficulties in the Air Transport Services Item
Looking at EU data asymmetries for air transport services, we see anincrease from 2013 and onwards in the trade in services balance.
Credits increase faster than debits.
Source of data: Eurostat. International trade in services (since 2010) (BPM6) [bop_its6_det]. Updated 20.01.20.
5

Financial Statistics have moved forward to this end.
• ECB has developed for EU-consistency:
I. Centralized Securities Database (CSDB). Identification of debt securities.NCB, combine various data sources, along with information from commercial dataproviders, and decide the residency and other characteristics of each securities.Once decision is solid, every NCB uses the CSDB for producing the SecuritiesHolding Statistics (SHS).
II. Register of Foreign Affiliates (RIAD). Identification of companies.NCB feed the RIAD with companies along with various fields. Using primary keysfrom RIAD, AnaCredit loan data collected from the commercial banks can begrouped for each company.
• BIS report on deposits.Collection from monetary authorities of data on deposits hold in commercialbanks. A really global analytical report of granular financial data.
6

Globalization asks for a centralized airline data collection model.
Financial Account (FA) statistics fit more in a centralized data model. Financial markets are heavily regulated and information is more accessible to the public.
Current Account (CA) statistics, reflecting the real economy, especially in thecase of MNE, lack uniformity in the data collection methods and the bilateraluse of an international reference registry.
Latest efforts (within EU) towards this end have been:• The cross-country investigation of Large Case Units.• The development of shipping models using international databases.
7

Globalization asks for a centralized airline data collection model.
The key characteristics of a centralized data model are:
a) Presence of a data Guardian.
b) Uniform definitions and an ultimate step of finalizing the variables.
c) Cooperation between member states.
d) Access to these data by all compilers and compilation of statistics basedon these finalized data.
8

Defining the statistical unit and their residency• Concerning the airlines: Go to International Civil Aviation Organization (ICAO)
and get the country as designated in the ICAO (or IATA) airline designators.
9
The Model
• Concerning the BOP counterpart: For personal vacations the passenger isthe counterpart unit. For business travel the company, who eventuallypays the ticket, should be the counterpart unit.
• Criterion for counterpart residency: The country code of the phone numberof the ticket reservation is the first-best approach to residency. Peopletend to get a new phone number from local telecommunications provideras soon as they establish themselves. For the case of business travel, if atravel agency intermediates, we assume that companies generallycontracts with local travel agencies.

Example:A Greek shipping company, using a Greek travel agent, booksan flight ticket with the German carrier Lufthansa for aPhilippine seaman to fly from Manilla (or any other place onEarth) to New York to on board on a ship there.
Statistical units & Residency: The BOP parties are the Greekshipping company and German carrier Lufthansa. The phonenumber would be either that of the shipping company or ofthe local travel agent. In either case, the country code wouldbe correct as “GR”. Money leave the same trace.
The seaman is totally indifferent (even ignorant) of the ticketreservation, departure/arrival, cash settlement.
10

IATA and Online Travel Agents (OTA)
11
• Or, you go a travel agent. Travel agents can be either with physicalpresence (offline) or online, such as Kiwi, Ctrip, Lastminute, Etraveliand others.
• Since 2013 Online Travel Agents (OTA) have made a big entrance inthe flight reservations market. The reason is: they help potentialpassengers to view simultaneously the best ticket regarding priceand time schedule.
There are two ways to book a ticket:• Either you go to the airline’s website
and book the ticket directly. Theseare called the “Direct Sales” knownonly to the airline company. The fieldphone country code is mandatory toproceed for the reservation.

IATA and Online Travel Agents (OTA)
International Air Transport Association (IATA) is a trade associationof the world’s airlines. Consists of 290 airlines, primarily majorcarriers, representing 117 countries, and accounting 82% of thetotal seat miles air traffic. IATA has 50 offices around the worldsupporting members in 120 countries. IATA travel agents are about60,000 globally.
IATA has three major clearing services:I. IATA Billing and Settlement Plan (IATA BSP) for passengers.II. IATA Cargo Agents Settlement System (IATA CASS) for cargo.III. IATA Clearing House (ICH) for interline arrangements.
12

The “Noise” from Globalized Online Travel Agents (OTA)
• BPM6 CG [pg. 12.49] suggests “the compiler must make a simple, butnot altogether unreasonable assumption that tickets sold in aparticular economy are sold to residents of that economy andadjustments made to estimates as necessary, by using surveys oftravelers”.
• This was generally true till 2010 when BPM6 was written. Alsogenerally true for the offline flight reservation till now.
• Not valid for 2020, with the presence of the OTA. Large OTA tend toinflate the IATA BSP of the resident economy by clearing, in thedomestic economy, tickets of non-residents with foreign airlines.
• IATA BSP of one country contains information relevant for the BOP ofother countries.
13

The Role of IATA in the Data Collection
IATA billing report is on ticket-by-ticket level.
Airline company has the information on the reservation, grosssales, refund, commissions. From other reports, the name ofpassenger can be retrieved by the airline companies.
The travel agency has direct access to the crucial variable of thecountry code of the phone number of the reservation.
IATA BSP collects billing statements from all IATA travel agenciesand makes the clearing twice a month back to the IATA carriers.
14

The Role of IATA in the Data Collection
The missing link of our model from the current practice is that travelagencies need to feed this billing report to IATA with the variable of thecountry code of the ticket reservation.
For online reservation this field is mandatory. For offline reservation, thisfield could be missing (due to group reservations). The country code ofthe travel agency itself could be safely used instead.
Having gathered flight tickets reserved from travel agencies from allaround the Globe, with country code indication on a ticket level, we couldproduce consistent BOP data regarding the IATA BSP for every country.
IATA BSP is a major contributor to the total airline turnover.
15

The Role of IATA in the Data Collection
IATA CASS refers to cargo shipment. In general, IATA CASS has muchsmaller turnover than BSP. Refers mainly to transactions betweencompanies (local couriers and carriers), so countries of residence shouldbe easily identified.
ICH refers to interline agreements between IATA airlines. IATA plays therole of the clearing house. ICH has centralized data on assets andliabilities in gross terms from all IATA airlines vis-à-vis the rest airlines.
In all cases, IATA plays the role of the intermediate guardian like astandard financial clearing house.
16

Completing the Picture of the Whole Model
Suppose, for now, that we assign an International Organization as ourData Guardian, who will establish data sharing with IATA and will be thekeeper of all these monthly IATA datasets (BSP, CASS, ICH).
This is a big step: we have captured most of the total turnover!
We are now missing:I. Direct sales from IATA airline companies.II. Data from non IATA airline companies, mainly Low Cost Carriers (LCC).III. Other air transport related expenses, such as tolls, route overflowncharges (i.e. Eurocontrol), port expenses, handling, catering and others.
17

Completing the Picture of the Whole Model
• Low Cost Carriers have minimal presence in most countries, withvery few branches established. Survey sampling of these airlineswill be inefficient for all national authorities (except for thecountry of incorporation).
• This could be a reason why Credits >> Debits in the air transportservices balance.
• Direct Reporting can be truly feasible only for the countrieswhere the Headquarters are legally and physically incorporated.Data collected should refer to the activities of the airline allaround the world.
18

Completing the Picture of the Whole Model
This is the way to go for a complete centralized airline data model !
• The Guardian will collect all IATA data.
• Each country should submit to the Guardian analytical data onlyfor airlines legally incorporated in their domestic economy.
• Data collected from each country would be only for Direct Salesof IATA airlines and all data for non IATA airlines, along withrelevant expenses.
19

First – Best Approach.
20

Implementing the Model in Practice – the use of Big data.
Collecting smaller parts of the model can be time consuming and inefficient.Latent items can be estimated using Big data. Direct Sales, non IATA and otherexpenses could be replaced with:
• Analytical credit card data (for direct sales).
• Web scraping and clustering algorithms for finding daily prices perdestination. Banca d’Italia has an equivalent project for real estate prices.(non IATA sales)
• Tracking flights websites for estimation of route charges. Eurocontrol, has adynamic Route Per State overflown distance tool is available. Use this outputas a training dataset for the rest of world route charges. Similar methods forcatering, handling, port expenses.
• The IATA dataset could be used for training algorithms used for non IATAairline companies. No reason for different geographical allocation. Numerousclassification alternatives exist.
21

Second – Best Approach.
22

Pros and Cons of our Centralized Model for Air Transport Services
Pros• Achieves almost global consistency for the BOP data on air transport
services.• Statistical residency is followed as closely as possible, avoiding
globalization effects, such as expatriates.• Data are based on real cash, leaving estimation techniques only for the
residual parts of the model.• Efforts to reduce the reporting burden by centralized reporting.
Application of big data methods for latent or hard to collect data.
Cons• Establishment of a data Guardian and coordination between
International Organizations and Associations.• Data Timeliness. Date of IATA clearing is close to BOP reporting
deadlines.23

Any Questions ?
Thank you !!!
24

1/1
IFC Conference on external statistics "Bridging measurement challenges and analytical needs of external statistics: evolution or revolution?", co-organised with the Bank of Portugal (BoP) and the European Central Bank (ECB)
17-18 February 2020, Lisbon, Portugal
Globalisation and the reach of multinationals: implications for portfolio exposures, capital flows, and home bias1
Carol Bertaut, Beau Bressler and Stephanie Curcuru,
Board of Governors of the Federal Reserve System
1 This presentation was prepared for the meeting. The views expressed are those of the authors and do not necessarily reflect the views of the BIS, IFC, BoP, ECB or the central
banks and other institutions represented at the meeting.

Globalization and the Reach of Multinationals
Implications for Portfolio Exposures, Capital Flows, and Home Bias
Carol Bertaut, Beau Bressler, and Stephanie Curcuru1
This version: December 1, 2019
Abstract
The growing use of low-tax jurisdictions as locations for firm headquarters, proliferation of offshore financing vehicles, and growing size, number, and geographic diversity of multinational firms have clouded the view of capital flows and investor exposures from standard sources such as the IMF Balance of Payments and the Coordinated Portfolio Investment Survey. We use detailed, security-level information on U.S. cross-border portfolio investment to uncover the extent of distortions in the official U.S. statistics. We find that roughly $3 trillion – nearly a third of U.S. cross border portfolio investment – is allocated to a country different from its primary economic exposure by standard reporting conventions. Moreover, this distortion has grown significantly in a little over a decade. Expanding to consider global implications, we estimate that the geographic exposure of roughly $10 trillion – about one-fourth – of the stock of global cross-border portfolio investment is similarly distorted, and that exposures to emerging markets are likely understated by about a third. Estimates of the international exposures of U.S. investors are even larger when we distribute the exposure from holdings of domestic and foreign firms according to the geographic distributions of firm-level sales. Our results have implications for conclusions we draw about the factors influencing capital flows, in particular those to emerging markets.
Keywords: Balance of payments, capital flows, financial globalization, foreign assets, international financial data, home bias
JEL classification: F30, F32, G15
1The authors are in the Division of International Finance at the Board of Governors of the Federal Reserve System. We thank seminar participants at the International Monetary Fund, the Bank for International Settlements, the Federal Reserve Bank of San Francisco, and the Federal Reserve Board for helpful comments. The views expressed are solely the responsibility of the authors and should not be interpreted as reflecting the views of the Board of Governors of the Federal Reserve System or of any other person associated with the Federal Reserve System. A version of this paper including data files is available at https://www.federalreserve.gov/econres/notes/feds-notes/globalization-and-the-geography-of-capital-flows-20190906.htm

2
1. Introduction
After the global financial crisis, the G20 supported efforts to improve global capital flow and investment
statistics, with the goal of better understanding cross-border financial linkages and investor exposures.
These initiatives include increased participation in the International Monetary Fund’s Coordinated
Portfolio Investment Survey (CPIS) and efforts to increase both the frequency and granularity of the
CPIS, including detail on issuer and investor sectors. However, these efforts to improve our
understanding of global securities portfolios are subject to a fundamental limitation: They use the
official balance of payments (BoP) framework that collects cross-border flows and positions according
to legal residence. This concept was designed for tracking transactions between countries under the
assumption that firms record financial transactions in the same country where the economic activity
takes place. This framework is increasingly uninformative in a world where multinational firms structure
their financial operations using a complex web of subsidiaries chosen to maximize profits. For example,
firms issuing securities may not do any business at the legal residence of the subsidiary issuing the
securities, and thus ownership of such securities may say little about the actual economic exposures
investors face.
Three main factors lead to the distortions between country of residence and economic exposure. First,
multinational firms often incorporate in jurisdictions with low tax rates. This motivation is especially
relevant for firms with substantial intangible and other highly portable assets that are easy to shift
between subsidiaries.1 As a result, global cross-border statistics show elevated holdings of equity issued
by firms incorporated in the Cayman Islands, Ireland, and other low-tax jurisdictions, locations that
typically are associated with neither firm production nor expenses. Indeed, according to the CPIS, the
third largest destination for equity investment by foreign investors is the Cayman Islands, after the
United States and United Kingdom.2, 3 Such distortions have become more pronounced in U.S. statistics
over the past decade, in part because of a recent wave of cross-border mergers and corporate
“inversions”. 4 As a result, the equity of several major U.S. firms is now considered “Irish” equity
according to official statistics. Adding to these distortions is the increasing presence of emerging market
economy (EME) firms incorporated in the Caribbean, including the Chinese firms Alibaba, Baidu, and
Tencent.

3
A second driver of distortions is firms seeking to improve their access to capital markets and the pool of
global bond investors. Many firms, particularly those in EMEs, issue corporate bonds using a subsidiary
firm or financing arm located in a market outside their home country. Residence-based statistics will
attribute investment in such bonds to the location of the subsidiary rather than the location of the parent
company. Factors driving the use of offshore subsidiaries include improved pricing, access to foreign
investors, and the ability to issue larger, lower-rated, or longer-maturity bonds.5
A third source of distortions in official statistics comes from the growing importance of mutual funds
and other managed investment funds as vehicles for cross-border investment. International statistical
standards for the BoP classify holdings of investment fund shares as equity holdings, even if they consist
entirely of non-equity securities such as bonds. As with other investments, they are assigned to the
country of fund incorporation. These standards apply regardless of the types of assets held by the fund or
the geographic focus.6 In many cases, funds are located in offshore financial centers.
The disconnect between traditional residence-based statistics and investor exposures is gaining
increasing recognition. For example, the Bank for International Settlements (BIS) publishes its statistics
on international debt securities on both a legal residence basis (where the issuing subsidiary is
incorporated, or “resident”), and a nationality basis (reflecting the country of the parent firm). These
statistics highlight the rapid growth of bond issuance via offshore financial centers (see Gruic and
Wooldridge 2012). Similarly, the world’s largest sovereign wealth fund, the Norwegian Government
Pension Fund, lists its roughly $1 trillion portfolio holdings on both a country of residence basis and on
a country of exposure (nationality) basis.7 In the academic community, Lane and Milesi-Ferretti (2017)
provide an overview of the distortionary effects of increasing offshore issuance and financial center
intermediation on external exposures. Coppola et al. (2019) also discuss the distortions created by
residence-based statistics and provide a methodology and adjustment factors to restate cross-border
investment positions.
2. Distortions in the U.S. cross-border portfolio
We use the U.S. cross-border securities portfolio to document the extent of distortions in traditional
residence-based portfolio statistics. With cross-border holdings of $12 trillion in stocks and bonds as of

4
end-2017, the U.S. investors in aggregate have the largest amounts of cross-border holdings. We exploit
the underlying security-level data on U.S. cross-border portfolio holdings collected as part of the
Treasury International Capital (TIC) system. Data for the annual “U.S. Residents' Portfolio Holdings of
Foreign Securities” survey are collected on a legal residence basis for construction of the U.S. BoP
statistics.8 Using security-level identifiers as well as text matching techniques, we map these holdings,
security by security, to the country of exposure for each firm, thus converting these holdings to a
“nationality” basis.9 For common stock equity holdings, our mapping is based on the constituent
information for Morgan Stanley Capital International (MSCI) country-focused equity indexes. For firms
not included in the MSCI indexes we use information on the primary location of operations.10 For
bonds, we also rely on information about the ultimate parent company obtained from Moody’s Investors
Service, and, for asset-backed securities, about the underlying assets to map holdings of corporate bonds
to a nationality basis.11 Finally, we draw implications for distortions created by U.S. cross-border fund
shares and other equity holdings using “mirror data” on the portfolio assets of countries that account for
the majority of such U.S. cross-border holdings, most notably the Cayman Islands, Ireland, and
Luxembourg.12
Common Stock
Figure 1a shows the evolution of the U.S. cross-border portfolio of common stock on the BoP standard
residence (country of incorporation) basis. An increasing share of U.S. equity holdings are of firms
incorporated in offshore and low-tax financial centers;13 these holdings have increased from about $400
billion in 2003 to more than $2.2 trillion by 2017. Equity holdings restated to the country of economic
exposure, (nationality basis) are reported in figure 1b, and figure 1c shows the differences. As indicated
in figures 1b and 1c, a growing share of what is reported as cross-border equity holdings are firms that
primarily operate in the United States and that MSCI equity indexes classify as U.S. firms. Recent
increases in part reflect the corporate inversions into Ireland noted above. Figure 1c also highlights the
growing reallocation to EME stocks on a nationality basis. These reallocations largely reflect the recent
trend of the Caribbean as a hub for firms with Chinese and Hong Kong exposures. Including allocations
from other countries not included in our financial center definitions, we find that by 2017, roughly $1.8
trillion–nearly a fourth—of U.S. holdings of common stock in the official U.S. cross-border statistics is
attributed to a different country by standard investor benchmarks.

5
Corporate Bonds
U.S. investor holdings of corporate bonds issued through financial centers have also increased over the
past several years (figure 2a). By 2017, roughly 40 percent of U.S. foreign corporate bonds holdings
(nearly $820 billion) consisted of securities issued out of financial center countries. Figure 2b shows
holdings on a reallocated nationality basis, and figure 2c shows the distortions. As with common stock,
bonds of “U.S.” companies are a growing share of financial center bonds. In addition to bonds issued by
“U.S.” firms incorporated abroad, these holdings also include bonds issued by other U.S. firms via
offshore financing arms, notably in Europe. “U.S.” bond holdings also include substantial investments in
asset-backed securities issued by Cayman Islands financing vehicles of U.S. financial firms. These
include securities backed by U.S. mortgages in the run-up to the financial crisis and, more recently, of
collateralized loan obligations backed by U.S. syndicated loans.
Figure 2c also shows a fairly consistent reallocation of corporate bonds to other advanced economies,
primarily from European firms that issue bonds from financing subsidiaries in Luxembourg and the
Netherlands, and a growing allocation to EMEs. Overall, our nationality-based estimate of U.S.
investment in EME corporate debt securities is about $100 billion higher than under the residence-based
statistics in 2017. Differences in corporate debt holdings are especially pronounced for some countries
including Brazil, Russia, and China (figures 3a and 3b). In fact, once we take into account offshore
issues, U.S. holdings of Brazilian corporate debt are roughly comparable to holdings of Mexican
corporate debt – a fact that would be missed in the residence-based statistics.
Fund shares and other equity
U.S. investors also hold sizable cross-border investments in the form of shares in mutual funds and other
types of managed funds. We estimate that of the roughly $1.3 trillion in U.S. holdings of foreign equity
other than common stock, more than $1 trillion is not attributed to the country of primary economic
exposure in the residence statistics. Indeed, we estimate that by 2017, more than half of these holdings
actually reflect exposure to the United States; another roughly 10 percent reflect exposures to EMEs;
and nearly 30 percent reflect exposures to advanced foreign economies (AFEs) other than the financial

6
center where the funds are incorporated (figures 4a, 4b, and 4c).14 Moreover, these fund holdings are
also distorted by asset type; that is, the underlying securities are bonds, commodities, and other assets
besides equity.
Total portfolio distortions
Combining our findings for U.S. cross-border investment in bonds, common stock, and fund shares, we
estimate that $3.5 trillion – nearly 30 percent – of the total $12 trillion in long-term foreign portfolio
securities held by U.S. investors in 2017 reflects exposures to countries other than as reported in the
official U.S. statistics (table 1). In contrast, in 2003, less than 15 percent of the U.S. portfolio reflected
investment in a different country of exposure. We estimate that by 2017, more than $2 trillion is actually
exposure to the United States, while exposures to EMEs are about $650 billion, or 25 percent, larger
when recalculated on a nationality basis.
3. Implications for global distortions
Our results can be generalized to draw conclusions about the extent of global distortions. We assume
that U.S. investments in financial center securities are likely representative of global investments in such
locations. Using CPIS data on global investment in these financial centers, we assume that global
distortions are proportional to U.S. distortions. We estimate that at least $10 trillion – roughly 20
percent – of current global cross-border portfolio investment is similarly distorted in the current statistics
(table 2). In particular, we estimate that global exposures to EME bonds and equity in the CPIS are
likely understated by at least $2 trillion – by roughly a third – because of corporate bonds issued via
offshore financing arms, the growing market cap of emerging market firms incorporated in offshore
centers, and fund allocations to EMEs. Global holdings of U.S. securities are also likely understated,
owing to the incorporation of U.S.-based multinationals in low-tax jurisdictions as well as the
investments of funds located in offshore centers. Securities holdings of other advanced economies,
including Germany, Italy, and Spain, are likely understated too, because their firms often issue debt
securities via Luxembourg and Netherlands financing arms.

7
These findings have implications for understanding the factors influencing capital flows. For example,
there has been much focus on the global impact of the extraordinary policy actions undertaken by
advanced economy central banks in the wake of the global financial crisis. Of particular emphasis has
been how these monetary policies spill over into emerging markets and how EME asset prices would
react when these policies are reversed (Bowman et al 2015, Fratzscher et al 2018, Converse et al 2019).
Our results showing understated growth in holdings of EME assets also imply mismeasurement of
capital flows to EMEs. We find distortions of EME asset holdings – in particular those caused by
offshore bond issuance – were especially pronounced for the years 2010 through 2014, years when
advanced economy policy was especially accommodative. These higher holdings suggest that the
spillovers in terms of quantities may be understated.
Our results also weaken the argument that capital flows arising from foreign direct investment (FDI) are
generally preferable because they are less volatile than portfolio flows, in part because FDI is harder to
expropriate (Albuquerque 2003) and is driven by pull rather than push factors (Eichengreen et al 2018).
These arguments assume that portfolio flows in the BoP accounts fully capture investment in a country’s
securities. When corporations issue bonds via offshore affiliates, however, funds borrowed through the
offshore entities are funneled back to the parent firm in the form of lending or “reverse investment” in
the parent firm. These flows, which appear as FDI inflows, are effectively no different from typical
portfolio flows, and can be just as volatile. Growing reliance on offshore financing vehicles for debt
issuance can thus confound our understanding of the resilience of different types of cross-border
financial flows. Similarly, our results also raise some potential flags for interpreting conclusions on the
effectiveness of capital controls in preventing portfolio inflows to emerging markets (Forbes and
Warnock 2012, Ahmed and Zlate 2014, Forbes et al. 2014, Forbes et al 2015, Pasricha et al. 2015).
Foreign investors may still be able to gain exposures to countries via offshore-issued bonds, which
typically are unaffected by controls. But because such purchases are not classified as portfolio inflows to
these countries, the effectiveness of controls may be overstated.
Our results are also relevant to the long-standing Lucas (1990) paradox, which arises from differences
between the theoretical prediction of capital movements between developed and developing countries
and what is observed. Theory predicts that capital should move toward economies with lower levels of
capital per worker. Most studies, however, find that capital does not flow from more to less developed

8
economies; rather, it flows in the other direction (see Alfaro et al. 2008). Our results suggest that
advanced economy exposure to EMEs is larger than previously understood, which resolves some portion
of this puzzle. This larger exposure is likely to be still more evident if we consider the global reaches of
multinational firms and the full portfolios of domestic investors.
4. Firm-level foreign exposures
Thus far, we have focused on the extent of distortion caused by the residence basis for official statistics,
pointing out that a good portion of “foreign” equity held by U.S. investors is in fact equity of firms that
standard investor benchmarks consider to be U.S. firms. However, U.S. investors also have
considerable foreign exposure through their holdings of securities issued by U.S. multinational firms.
Indeed, stock prices of internationally-exposed U.S. firms certainly respond to foreign shocks and
developments such as dollar appreciation or announcements about potential changes to trade policy such
as tariff increases. To examine global exposures more broadly, we consider the full U.S. common stock
portfolio, including U.S. investor holdings of domestic as well as foreign stocks.
Our claims surveys only collect security-level information on U.S. holdings of securities issued by
foreign-resident firms. We calculate U.S. investor holdings of domestic firms by starting with the stated
market capitalization of each firm, and subtracting from that market cap those holdings that we can
attribute to foreign investors. Foreign investor holdings of U.S. securities are collected at the security
level from the complementary annual surveys of “Foreign Residents’ Portfolio Holdings of U.S.
Securities”. We then map our firm-level individual securities to firm-level information from Worldscope
on the major geographic regions of sales as reported in company annual report filings. We allocate both
firm market capitalization and our estimated U.S. investor equity holdings by three broad regions: the
United States, emerging markets, and other foreign countries.15 Figure 5 compares the market
capitalization of Worldscope firms used in our mapping with the market capitalization as reported by the
World Federation of Exchanges. Overall, Worldscope coverage is quite good and improves over time,
and is especially good for U.S.-listed firms. We are able to classify market capitalization and U.S.
portfolio holdings for December 2003 through 2017. By 2017, we have data on nearly 10,000 firms
with market capitalization at end-2017 of $76 trillion.

9
Figures 6a, 6b, and 6c compare total U.S. portfolio holdings on a residence, nationality, and full
exposure basis. Figure 6a illustrates the large portion of the U.S. portfolio on a residence basis that
consists of domestic equity, with the holdings of foreign stocks as reported on the same basis as figure
1a.16 Holdings of the equity of U.S. firms amounts to about $23.5 trillion by December 2017, roughly
80 percent of the total U.S. stock portfolio of slightly over $30 trillion. On a nationality basis, holdings
of U.S. equities increases to $24.3 trillion, reflecting our reclassification of nearly $1 trillion in holdings
of equity of U.S. multinationals incorporated in offshore centers, as discussed above and shown in figure
1b. Holdings of emerging market equity are also slightly larger, in large part reflecting the
reclassification of financial center equity to Chinese firms, also as discussed above.
In contrast, estimated U.S. portfolio exposures of U.S. firms to the United States when allocated by firm
sales shares (figure 6c) are considerably smaller at $17 trillion, though they remain the largest portion of
the total portfolio. This smaller U.S. share reflects the fact that large-cap U.S. firms are global in reach
and thus holding their shares provides U.S. investors with considerable exposure to both AFEs and
EMEs. Of note, we find that U.S. investors have more indirect exposure to both AFEs and EMEs from
their holdings of equity of U.S. multinationals than they do from equity of foreign firms. Of course, the
reduced exposure to the United States and increased exposure to the rest of the world from these
calculations is offset in part by a reallocation of some of the holdings of foreign equity: foreign
multinationals often have significant operations in the United States, and thus U.S. investors acquire
back some U.S. exposure through their holdings of foreign stocks.
Implications for home bias
The differences in measures of how much foreign exposure U.S. investors have will affect how we think
about evolving investor preferences, including how we measure (and interpret) “home bias” and the
drivers of portfolio allocations. “Home Bias” refers to the lack of diversification of international
investors relative to the optimal holdings implied by the International Capital Asset Pricing model
(ICAPM). The ICAPM predicts that in a world with frictionless markets the optimal asset allocation is
the world portfolio; in other words, investors should spread their wealth among global equities
according to each asset’s share of global market capitalization. For example, since U.S. equities

10
currently make up about 40 percent of global market capitalization, about 40 percent of U.S. investors’
equity holdings should be in U.S. stocks.
The basic calculation for home bias thus compares portfolio allocations in foreign (to the investor)
equity to shares in global market capitalization:
(ℎ𝑜𝑜𝑜𝑜𝑜𝑜𝑜𝑜𝑜𝑜𝑜𝑜𝑜𝑜 𝑜𝑜𝑜𝑜 𝑜𝑜𝑜𝑜𝑓𝑓𝑓𝑓𝑜𝑜𝑜𝑜𝑜𝑜 𝑓𝑓𝑒𝑒𝑒𝑒𝑜𝑜𝑒𝑒𝑒𝑒)
(𝑒𝑒𝑜𝑜𝑒𝑒𝑡𝑡𝑜𝑜 𝑓𝑓𝑒𝑒𝑒𝑒𝑜𝑜𝑒𝑒𝑒𝑒 𝑝𝑝𝑜𝑜𝑓𝑓𝑒𝑒𝑜𝑜𝑜𝑜𝑜𝑜𝑜𝑜𝑜𝑜)(𝑓𝑓𝑓𝑓𝑓𝑓𝑓𝑓𝑓𝑓𝑓𝑓𝑓𝑓 𝑓𝑓𝑒𝑒𝑒𝑒𝑓𝑓𝑒𝑒𝑒𝑒 𝑚𝑚𝑚𝑚𝑓𝑓𝑚𝑚𝑓𝑓𝑒𝑒 𝑐𝑐𝑚𝑚𝑐𝑐)
(𝑤𝑤𝑓𝑓𝑓𝑓𝑤𝑤𝑤𝑤 𝑓𝑓𝑒𝑒𝑒𝑒𝑓𝑓𝑒𝑒𝑒𝑒 𝑚𝑚𝑚𝑚𝑓𝑓𝑚𝑚𝑓𝑓𝑒𝑒 𝑐𝑐𝑚𝑚𝑐𝑐)
Note that if portfolio shares are close to or equal market capitalization shares, this ratio will be close to
one. This ratio is typically subtracted from 1 to measure “home bias”, so that the larger this resulting
calculation, the greater the extent of home bias:
1 − (ℎ𝑓𝑓𝑤𝑤𝑤𝑤𝑓𝑓𝑓𝑓𝑓𝑓𝑜𝑜 𝑓𝑓𝑓𝑓 𝑓𝑓𝑓𝑓𝑓𝑓𝑓𝑓𝑓𝑓𝑓𝑓𝑓𝑓 𝑓𝑓𝑒𝑒𝑒𝑒𝑓𝑓𝑒𝑒𝑒𝑒)
(𝑒𝑒𝑓𝑓𝑒𝑒𝑚𝑚𝑤𝑤 𝑓𝑓𝑒𝑒𝑒𝑒𝑓𝑓𝑒𝑒𝑒𝑒 𝑐𝑐𝑓𝑓𝑓𝑓𝑒𝑒𝑓𝑓𝑓𝑓𝑤𝑤𝑓𝑓𝑓𝑓)(𝑓𝑓𝑓𝑓𝑓𝑓𝑓𝑓𝑓𝑓𝑓𝑓𝑓𝑓 𝑓𝑓𝑒𝑒𝑒𝑒𝑓𝑓𝑒𝑒𝑒𝑒 𝑚𝑚𝑚𝑚𝑓𝑓𝑚𝑚𝑓𝑓𝑒𝑒 𝑐𝑐𝑚𝑚𝑐𝑐)
(𝑤𝑤𝑓𝑓𝑓𝑓𝑤𝑤𝑤𝑤 𝑓𝑓𝑒𝑒𝑒𝑒𝑓𝑓𝑒𝑒𝑒𝑒 𝑚𝑚𝑚𝑚𝑓𝑓𝑚𝑚𝑓𝑓𝑒𝑒 𝑐𝑐𝑚𝑚𝑐𝑐)
In practice, investors in the U.S. hold larger shares of their wealth in domestic securities than predicted
by the ICAPM, and this is true for investors around the globe. There is a large literature on the potential
causes of home bias, which include hedging motives arising from exchange rate and other risks, and
frictions such as transactions costs as well as easier access to and better information about domestic
markets. Coeurdacier and Rey (2013) provide a comprehensive survey of this literature. This literature
focuses on factors that affect investor demand for exposure, and the associated characteristics of
investment in different countries. But how these portfolio shares – and market capitalization shares – are
constructed can lead to markedly different measures of home bias, which in turn can confound our
interpretation of what drives portfolio preferences such as “home bias”.
To illustrate how much of a difference these shares can make, we also construct shares of global market
capitalization according to residence, nationality, and exposure. Figure 7 shows the evolution of market
capitalization allocated by sales shares. The blue segments illustrate the growing shares of EME
exposure in global market cap. The majority of this increase arises from foreign firms – largely EME-

11
nationality firms – that do business in EMEs, but there is also a noticeable increase in the share of
market cap that reflects activity of U.S. firms that do business in EMEs.
Figure 8 shows the resulting constructions of home bias for U.S. investors. As measured by residence
(the red line), U.S. home bias in common stock is quite high, but has trended down slightly from about
.75 in the early 2000s to about .65 after the global financial crisis, and it has remained around that level
for the past several years. When measured on a nationality basis (the blue line), home bias in the early
2000s starts at a similar level and also declines to about 2009, but in contrast to the residence basis, U.S.
home bias has actually increased slightly in recent years. This finding suggests that recent increases in
U.S. holdings of foreign stock as reported in official residence-based statistics have been
disproportionally of firms that on a nationality basis are considered “U.S.” The gray line shows the
home bias measure using our exposure based shares for both portfolio shares and market capitalization.
By this measure, U.S. home bias is noticably lower – averaging only about .4 – and has been fairly
stable. This lower level of home bias largely reflects the exposure to foreign countries U.S. investors
achieve through their holdings of equity of U.S. multinationals, as illustrated in Figure 6c, rather than
from equity of foreign-resident firms.
The marked differences in measures of home bias as well as their trends suggest caution in constructing
such estimates using aggregate data, such as from the CPIS, and in the interpretation of drivers of home
bias and portfolio allocations that arise from such estimates. Our investigation of the U.S. portfolio
indicates that some aspects of “home bias” clearly still exist even once we adjust for nationality versus
residence, and even when we consider the broader exposure definition. In particular, we find that U.S.
investors gain slightly more exposure to foreign countries through their holdings of stocks of
internationally-exposed U.S. firms than they do from holdings of stocks of foreign firms, which is in
contrast to shares in market capitalization. In further work, we plan to exploit the security level data to
look at firm-specific factors that likely play more important roles in determining portfolio allocations
than country of residence.
5. Summary

12
The disconnect between global official statistics on portfolio capital flows and positions and investor
exposures is sizable and growing. These distortions have implications for the conclusions we draw about
the factors influencing capital flows, in particular those to emerging markets, and global asset allocation
more broadly. Policy makers should consider alternative reporting frameworks that more accurately
capture global capital movements.
Notes: 1 See for example the survey on the tax competition literature in Keen and Konrad 2013, as well as Desai, Foley, and Hines 2006, Hebous and Johannesen 2016, Pomeroy 2016, Devereaux and Vella 2017. 2 See CPIS table 13: http://data.imf.org/regular.aspx?key=32986 3 Distortions from the location of incorporation are not new: Schlumberger, long one of the largest 100 global firms, has operated in the United States since the 1930s and is headquartered in Houston, Texas, but has been incorporated in Curaҫao since 1956 (http://www.fundinguniverse.com/company-histories/schlumberger-limited-history/). As a result, cross-border statistics have shown large holdings of Curaҫao equity for some time. 4 “Inversions” refer to merger and acquisition activity where the acquiring firm is typically larger than the target firm. After the merger, the combined firm “inverts” to establish its residence in the country of the target firm, which is typically a lower-tax jurisdiction. Recent high-profile U.S. inversions that resulted in U.S. firms becoming “Irish” firms include Actavis/Allergan and Medronic/Covidien, both in 2015. See https://www.allergan.com/news/news/thomson-reuters/actavis-completes-allergan-acquisition and http://newsroom.medtronic.com/phoenix.zhtml?c=251324&p=irol-newsArticle&ID=2004310. 5 See for example Black and Munro (2010). Serena and Moreno (2016) identify a pickup in offshore issuance by firms in EMEs following the global financial crisis, which they attribute to declining financing costs and the less developed state of EME financial markets more generally. However, since the Asian Financial Crisis in the late 1990s there has been a shift away from offshore issuance, which is generally denominated in hard currencies, toward local-currency issuance in the domestic bond market (Black and Munro 2010, Mizen et al 2012, Hale et al 2016). 6 While official statistics consider all fund shares to be “equity” regardless of the investment focus of the fund, other data sources such as EPFR provide breakdowns of investment by bonds and equity. 7 https://www.nbim.no/ 8 The U.S. cross-border data also include U.S. holdings of foreign short-term debt securities (i.e. those with an original maturity of less than one year). We focus on long-term securities in our analysis, because holdings of short-term securities are relatively small compared to equity and long-term securities holdings, and only a small share is issued via offshore financial centers. Annual reports by the U.S. Department of the Treasury provide descriptive statistics and analysis on the underlying data. 9 Because information on security identifiers is inconsistent in our data, especially in earlier years, we use text matching to assign nationality to securities for which we cannot match by security identifiers. We extensively clean security names and then use exact and fuzzy matching techniques. See Cohen et al. (2018). 10 For common stock, we assign the ultimate MSCI country designation for securities of companies that have not yet been included in an MSCI index. For example, we assign any U.S. holdings of Chinese firms such as Alibaba, Tencent, and Baidu (incorporated in the Cayman Islands) to China for years prior to 2015, although these firms were not included in the MSCI China/Emerging Markets indexes until 2015. See https://www.reuters.com/article/us-msci-china-index-alibaba/msci-adds-alibaba-other-u-s-listed-china-shares-to-indexes-idUSKCN0T12RF20151112 11 For bonds, our reassignment primarily affects corporate debt. Although sovereign bonds of many countries are issued as international debt securities, their country assignment typically will not be distorted in residence-based statistics in the same manner as corporate bonds, because they are not issued via subsidiaries that are legally incorporated in offshore financial centers. Our reassignment to “ultimate parent” nonetheless results in a few differences in country for government debt securities. Some of these differences arise from debt securities that are primarily repackaged sovereign debt exposures. Additionally, some bonds were misclassified by country in the underlying data. Because our underlying data are from the surveys of U.S. portfolio holdings of foreign securities collected on a residence basis, we are not able to include U.S. investor holdings of bonds issued by U.S. financing arms of foreign firms.

13
12 For fund share and other equity allocations, we rely primarily on country allocations of financial center reporting to the CPIS, as their outward CPIS statistics will largely reflect the underlying securities of investment funds incorporated in those locations. For example, beginning in December 2015, the Cayman Islands submission to the CPIS includes securities holdings of resident funds. Cross-border portfolio holdings of the Cayman Islands were roughly $1.9 trillion as of December 2017, with a little over $1 trillion in debt securities and the remainder in cross-border equity. About 70 percent of these holdings are of U.S. securities, 15 percent are securities issued by other advanced economies, and the residual 15 percent those of all other countries, including EMEs. We assume that cross-border holdings of Cayman Island funds are similarly distributed for years before 2015. For Ireland, International Investment Position data indicate that investment funds account for more than half of Ireland’s cross-border portfolio holdings, with about a third of the holdings of these funds invested in U.S. securities. Country allocations are quite similar to Ireland’s overall CPIS reporting, and thus we use the country allocations of Ireland’s outward CPIS holdings to distribute U.S. holdings of Irish fund shares. We similarly use CPIS reporting of Bermuda, Guernsey, Jersey, and Mauritius to distribute fund shares and other equity of those countries. The British Virgin Island does not participate in the CPIS. We assume that their fund holdings are distributed similarly to those in Bermuda and the Cayman Islands. Information on assets of non-monetary Luxembourg funds is available from the Central Bank of Luxembourg. Securities held by these funds were more than $4 trillion at end-2017, with nearly a quarter U.S. securities and another quarter are securities issued by non-euro area countries including EMEs. U.S. investors also hold sizable amounts of U.K. funds. For these holdings, we use country share allocations of securities held by funds registered in the United Kingdom from EPFR. 13 The “offshore and low-tax” financial center countries we identify in the TIC data include Bermuda, the British Virgin Islands, the Cayman Islands, Curaҫao (combined as Netherlands Antilles in the TIC data until 2013), Guernsey, Ireland, Isle of Man, Jersey, Liberia, Luxembourg, the Netherlands, Malta, the Marshall Islands, Mauritius, Panama, and Switzerland. 14 We include both holdings of registered investment funds as well as holdings of hedge fund shares and private equity. Coverage of such fund share holdings in the U.S. data (and the distortions they generate) increased notably in December 2011 after clarification of instructions on reporting responsibilities of managed investment funds. 15 For each geographic segment provided for location of sales revenue, we calculate the share of total sales revenue attributable to that segment, and then use each share to allocate market capitalization exposures and U.S. portfolio exposures. When geographic segments list individual countries, we assign sales shares to that particular country. When geographic segment data lists regions or combinations of countries, we allocate across countries by GDP shares. If no geographic segment data is listed, we assume all sales are domestic. When sales data is missing for key segments in particular years, we assign the prior year’s distribution. 16Foreign holdings are slightly smaller than in Figure 1a, because we only include foreign stocks that we can match to Worldscope.

14
References:
Ahmed, S. and A. Zlate (2014), “Capital flows to emerging market economies: A brave new world?”, Journal of
International Money and Finance, Vol. 48(PB), pp 221-248.
Albuquerque, R. (2003). “The composition of international capital flows: risk sharing through foreign direct
investment.” Journal of International Economics, 61(2), 353-383.
Alfaro, L., Kalemli-Ozcan, S., & Volosovych, V. (2008). “Why doesn't capital flow from rich to poor countries?
An empirical investigation.” The Review of Economics and Statistics, 90(2), 347-368.
Black, S., & Munro, A. (2010). Why issue bonds offshore? BIS Working Paper No. 334.
Bowman, D., Londono, J. M., & Sapriza, H. (2015). “U.S. unconventional monetary policy and transmission to
emerging market economies.” Journal of International Money and Finance, 55, 27-59.
Cohen, Gregory J., Melanie Friedrichs, Kamran Gupta, William Hayes, Seung Jung Lee, W. Blake Marsh, Nathan
Mislang, Maya Shaton, and Martin Sicilian (2018). “The U.S. Syndicated Loan Market: Matching Data,”
Finance and Economics Discussion Series 2018-085. Washington: Board of Governors of the Federal Reserve
System, https://doi.org/10.17016/FEDS.2018.085.
Coppola, A., M. Maggiori, B. Neiman, and J. Schreger (2019). “Redrawing the Map of Global Capital Flows: The
Role of Cross-Border Financing and Tax Havens.” Working Paper.
Converse, N., S. Curcuru, A. Rosenbaum and C. Scotti (2019). “Pushing or Pulling? Quantitative Easing,
Quantitative Tightening and International Capital Flows” Working paper.
Nicolas Coeurdacier & Hélène Rey (2013). "Home Bias in Open Economy Financial Macroeconomics," Journal
of Economic Literature, American Economic Association, vol. 51(1), pages 63-115, March.
Desai, M. A., Foley, C. F., & Hines Jr, J. R. (2006). The demand for tax haven operations. Journal of Public
economics, 90(3), 513-531.
Devereux, M. P., & Vella, J. (2017). Implications of Digitalization for International Corporate Tax Reform.
Eichengreen, B., Gupta, P., & Masetti, O. (2018). Are capital flows fickle? Increasingly? and does the answer still
depend on type?. Asian Economic Papers, 17(1), 22-41.
Forbes K., M. Fratzscher, T. Kostka and R. Straub (2016), “Bubble thy neighbour: Portfolio effects and
externalities from capital controls”, Journal of International Economics, Vol. 99, pp 85-104.
Forbes K., M. Fratzscher and R. Straub (2015), “Capital-flow management measures: What are they good for?”,
Journal of International Economics, Vol. 96, pp S76-S97.
Forbes K. and F. Warnock (2012), “Capital flow waves: Surges, stops, flight, and retrenchment”, Journal of
International Economics, Vol. 88, pp 235–251.
Fratzscher, M., Lo Duca, M., & Straub, R. (2018). On the international spillovers of US quantitative easing. The
Economic Journal, 128(608), 330-377.

15
Pasricha, G., Falagiarda, M., Bijsterbosch, M., & Aizenman, J. (2015). Domestic and multilateral effects of
capital controls in emerging markets (No. w20822). National Bureau of Economic Research.
Gruić, B., & Wooldridge, P. D. (2012), “Enhancements to the BIS debt securities statistics”, BIS Quarterly
Review (December).
Hale, G., P. Jones and M. M. Spiegel (2016). “The Rise in Home Currency Issuance”, Federal Reserve Bank of
San Francisco Working Paper 2014-19
Hebous, S., & Johannesen, N. (2015). At your service! The role of tax havens in international trade with services
Keen, M., & Konrad, K. A. (2013). The theory of international tax competition and coordination. In Handbook of
public economics (Vol. 5, pp. 257-328). Elsevier.
Lane, M. P. R., & Milesi-Ferretti, M. G. M. (2017). International financial integration in the aftermath of the
global financial crisis. International Monetary Fund Working Paper No. 17/115.
Lucas, R. E. (1990). Why doesn't capital flow from rich to poor countries?. The American Economic Review,
80(2), 92-96.
Mizen, P., Packer, F., Remolona, E. M., & Tsoukas, S. (2012). Why do firms issue abroad? Lessons from onshore
and offshore corporate bond finance in Asian emerging markets.
Pasricha, G., Falagiarda, M., Bijsterbosch, M., & Aizenman, J. (2015). Domestic and multilateral effects of
capital controls in emerging markets (No. w20822). National Bureau of Economic Research.
Pomeroy, James. 2016. “The Rise of the Digital Natives.” HSBC report, September.
Serena, J. M., & Moreno, R. (2016). Domestic financial markets and offshore bond financing.
U.S. Department of Treasury, annual reports on U.S. Portfolio Surveys of Foreign Securities, various years.
https://www.treasury.gov/resource-center/data-chart-center/tic/Pages/shcreports.aspx
U.S. Department of Treasury, annual reports on Foreign Residents’ Portfolio Holdings of U.S. Securities, various
years.
https://www.treasury.gov/resource-center/data-chart-center/tic/Pages/shlreports.aspx

Table 1. U.S. Portfolio Holdings of Long-term Foreign Securities Billions of Dollars
Long-term Foreign Securities Holdings Holdings with nationality country different from residence country
Total Common stock
Bonds of which: Corporate Bonds
Fund shares and other equity
Total Common stock
Corporate bonds
Fund shares and other equity
2003 2,953.8 2,006.3 874.4 559.5 73.2 393.7 220.6 149.6 23.4 2004 3,553.4 2,497.1 993.0 676.6 63.3 537.7 294.3 214.0 29.4 2005 4,345.9 3,223.7 1,028.2 735.8 94.0 614.8 358.5 222.0 34.4 2006 5,623.0 4,165.6 1,294.1 972.9 163.4 858.0 455.7 317.1 85.3 2007 6,862.7 4,956.1 1,609.8 1,217.0 296.8 1,236.7 657.6 431.4 147.8 2008 4,009.1 2,541.4 1,260.6 962.3 207.0 756.4 300.6 344.5 111.4 2009 5,589.5 3,704.8 1,594.2 1,214.1 290.5 1,055.5 504.0 415.1 136.4 2010 6,361.7 4,326.9 1,714.8 1,273.7 320.1 1,165.4 633.5 381.2 150.6 2011 6,480.5 3,786.4 1,979.0 1,442.7 715.0 1,518.6 558.3 444.4 515.8 2012 7,593.3 4,487.1 2,271.5 1,574.3 834.8 1,693.7 657.1 466.7 569.9 2013 8,777.5 5,715.5 2,304.6 1,664.4 757.4 2,004.4 1,008.3 480.6 515.4 2014 9,235.2 5,743.9 2,508.5 1,842.2 982.7 2,420.8 1,130.9 562.6 727.3 2015 9,103.3 5,758.7 2,347.2 1,739.4 997.5 2,634.0 1,267.9 576.5 789.6 2016 9,582.8 5,917.7 2,436.5 1,833.3 1,228.7 2,963.7 1,350.2 633.6 979.9 2017 11,953.3 7,851.5 2,835.2 2,098.0 1,266.7 3,505.3 1,771.8 718.4 1,015.1
Source: Treasury International Capital and authors' estimates
16

Table 2. Estimated distortions in global cross-border securities holdings, 2017 trillions of dollars (except as noted)
Total Long-term Debt Equity Total holdings of cross-border long-term securities* 53.4 22.1 31.3 Holdings in European financial centers: Ireland, Netherlands, Switzerland 5.1 1.8 3.3 Luxembourg 3.8 0.7 3.1
Holdings in Caribbean and other offshore centers 5.5 1.2 4.3
Share of holdings distorted in U.S. statistics Share in European financial centers: Ireland, Netherlands, Switzerland 0.42 0.36 0.44 Luxembourg 0.79 0.82 0.76 Share in Caribbean and other offshore centers 0.90 0.93 0.90
Global estimated holdings with nationality country other than as reported in CPIS 10.0 2.3 7.7 *Excluding securities held as reserve assets and by international organizations Source: IMF CPIS and authors' calculations
17

0
2,000
4,000
6,000
8,000
2003 2005 2007 2009 2011 2013 2015 2017
$ B
illio
ns
AFE EME Fin. centers
Figure 1a. Residence basis
0
2,000
4,000
6,000
8,000
2003 2005 2007 2009 2011 2013 2015 2017
$ B
illio
ns
U.S. AFE EME Fin. centers
Figure 1b. Nationality basis
−2,000
−1,000
0
1,000
2,000
2003 2005 2007 2009 2011 2013 2015 2017
$ B
illio
ns
U.S. AFE EME Fin. centers
Figure 1c. Difference between nationality and residencebasis holdings
Figure 1. U.S. holdings of common stock
Authors' estimates based on Treasury International Capital data.Data only include securities that were considered "foreign" on a residence basis.
18

0
500
1,000
1,500
2,000
2,500
2003 2005 2007 2009 2011 2013 2015 2017
$ B
illio
ns
AFE EME Fin. centers
Figure 2a. Residence basis
0
500
1,000
1,500
2,000
2,500
2003 2005 2007 2009 2011 2013 2015 2017
$ B
illio
ns
U.S. AFE EME Fin. centers
Figure 2b. Nationality basis
−1,000
−500
0
500
1,000
2003 2005 2007 2009 2011 2013 2015 2017
$ B
illio
ns
U.S. AFE EME Fin. centers
Figure 2c. Difference between nationality andresidence basis holdings
Figure 2. U.S. holdings of corporate bonds
Authors' estimates based on Treasury International Capital data.Data only include securities that were considered "foreign" on a residence basis.
19

Nationality
Residence
0
10
20
30
40
50
60
2003 2005 2007 2009 2011 2013 2015 2017
$ B
illio
ns
BRAZIL MEXICO
Figure 3a. Brazil and Mexico
Nationality
Residence
0
5
10
15
20
25
30
2003 2005 2007 2009 2011 2013 2015 2017
$ B
illio
ns
CHINA, MAINLAND RUSSIA
Figure 3b. China and Russia
Figure 3. U.S. holdings of foreign corporate bonds
Authors' estimates based on Treasury International Capital data.Data only include securities that were considered "foreign" on a residence basis.
20

0
250
500
750
1,000
1,250
1,500
2003 2005 2007 2009 2011 2013 2015 2017
$ B
illio
ns
AFE EME Fin. centers
Figure 4a. Residence basis
0
250
500
750
1,000
1,250
1,500
2003 2005 2007 2009 2011 2013 2015 2017
$ B
illio
ns
U.S. AFE EME Fin. centers
Figure 4b. Nationality basis
−1,500
−1,000
−500
0
500
1,000
1,500
2003 2005 2007 2009 2011 2013 2015 2017
$ B
illio
ns
U.S. AFE EME Fin. centers
Figure 4c. Difference between nationality and residencebasis holdings
Figure 4. U.S. holdings of fund shares and other equity
Authors' estimates based on Treasury International Capital data.Data only include securities that were considered "foreign" on a residence basis.
21

0
10
20
30
40
50
60
70
80
90
2003 2004 2005 2006 2007 2008 2009 2010 2011 2012 2013 2014 2015 2016 2017
Trillions $
Figure 5. Global Market Capitalization: Worldscope Firm Coverage
Global Market Cap World Federation of Exchanges Global Market Cap from Worldscope Firms
US Market Cap World Federation of Exchanges US Market Cap Worldscope firms
Source: World Federation of Exchanges and authors' calculations using Worldscope and TIC data.
22

0
5,000
10,000
15,000
20,000
25,000
30,000
35,000
2003 2004 2005 2006 2007 2008 2009 2010 2011 2012 2013 2014 2015 2016 2017
Billio
ns $
6a. Full US Common Stock Portfolio by Residence
Fin Centers
EME
AFE
US f irms
‐
5, 000
10,000
15,000
20,000
25,000
30,000
35,000
2003 2004 2005 2006 2007 2008 2009 2010 2011 2012 2013 2014 2015 2016 2017
Billio
ns $
6c. Full US Common Stock Portfolio by Exposure
Frgn f irm EME exp
US f irm EME exp
Frgn f irm AFE exp
US f irm AFE exp
Frgn f irm US exp
US f irm US exp
0
5,000
10,000
15,000
20,000
25,000
30,000
35,000
2003 2004 2005 2006 2007 2008 2009 2010 2011 2012 2013 2014 2015 2016 2017
Billio
ns $
6b. Full US Common Stock Portfolio by Nationality
Fin Centers
EME
AFE
US f irms
Source: Authors' calculations using TIC and Worldscope data. 23

0
10,000
20,000
30,000
40,000
50,000
60,000
70,000
80,000
2003 2004 2005 2006 2007 2008 2009 2010 2011 2012 2013 2014 2015 2016 2017
Billion
s $
Figure 7. Global Market Cap by Exposure
Frgn firm EME exp
US firm EME exp
Frgn firm AFE exp
US firm AFE exp
Frgn firm US exp
US firm US exp
Source: Authors' calculations from Worldscope data.
24

0.2
0.3
0.4
0.5
0.6
0.7
0.8
0.9
2003 2004 2005 2006 2007 2008 2009 2010 2011 2012 2013 2014 2015 2016 2017
Figure 8. U.S. Home Bias in Common Stock
Residence based foreign definition Nationality based foreign definition
Sales exposure based foreign definition
Source: Authors' calculations
25

Globalization and the Reach of Multinationals: Implications for Portfolio Exposures, Capital Flows, and Home Bias
Carol Bertaut, Beau Bressler, and Stephanie CurcuruFederal Reserve Board
CONFERENCE ON EXTERNAL STATISTICS BANCO DE PORTUGAL, IRVING FISHER COMMITTEE ON CENTRAL BANK STATISTICS, AND EUROPEAN CENTRAL BANKF E B R U A R Y 1 7 - 1 8 2 0 2 0

February 4, 2020 2
Disclaimer
“The views expressed here are solely our own and should not be interpreted as reflecting the views of the Board of Governors of the Federal Reserve System or of any other person associated with the Federal Reserve System.”

February 4, 2020 3
Policymakers, we have a problem
• Official statistics on cross-border capital flows and portfolios holdings do not accurately reflect investor exposures
• Post-crisis G20 Data Gaps initiatives◦ More information on portfolio exposures◦ IMF CPIS changes:◦ greater participation, more granularity (issuer/holder sectors), more
frequent (semi-annual)
• But biggest problem is country attribution◦ BOP framework uses legal residence (country where incorporated)

February 4, 2020 4
Blame globalization
Multinationals and globalization more generally are contributing to the problem in three ways:
1. Multinationals frequently incorporate in low-tax countries2. Emerging market firms issue debt out of financing arms in
offshore centers for improved market access
3. Fund shares are an increasing share of cross-border investment◦ Funds are established in offshore centers/low-tax jurisdictions◦ Funds are reported as equity regardless of the assets held

February 4, 2020 5
Awareness is growing
• Recent papers ◦ Lane & Milesi-Ferretti (2017): financial center intermediation◦ Avdjiev, Everett, Lane, Shin (2018): complexity of multinational firms and
effect on economic statistics◦ Coppola, Maggiori, Neiman & Schreger (2019): restate cross-border
investment positions based on global mutual fund allocations (about half of the U.S. foreign holdings portfolio)
• Existing initiatives◦ BIS banking and international debt securities statistics are published on
both a locational and nationality basis ◦ Norway pension fund lists constituent holdings on both legal residence
and exposure basis

February 4, 2020 6
Our project: Remap the U.S.
• Current work: Use the underlying security-level data on U.S. foreign portfolio claims to remap each security from country of legal residence to country of exposure
◦ Remap $3.5 trillion (30 percent) of U.S. cross-border portfolio in 2017◦ Up from ~$400 billion (14 percent) in 2003
• Ongoing work: Redistribute U.S. holdings of both domestic and foreign firms using location of sales
◦ Foreign exposure of domestic firms is considerable so the estimated foreign exposure of U.S. residents jumps dramatically
• Future work: Remap foreign debt issued in the U.S. to its country of origin
◦ Appears as domestic debt so not reported as U.S. foreign claim

February 4, 2020 7
Global portfolios are similarly distorted
• Portfolio distortion is a global phenomenon • Difficult to assess:◦ drivers of portfolio allocations and capital flows◦ resilience of different types of capital flows◦ effectiveness of capital controls ◦ spillovers of monetary policy ◦ components of and sustainability of current account ◦ many other issues

February 4, 2020 8
Residence to nationality remap: common stock
• test
• U.S. foreign common stock claims on residence basis totaled $8 trillion in 2017◦ $2 trillion in financial centers

February 4, 2020 9
Residence to nationality remap: common stock
• Remapped based on the exposure-based country assignment by MSCI for their equity fund portfolios
• Nearly $1 trillion in 2017 is considered U.S. by MSCI
• Larger EME holdings, Chinese firms incorporated in Cayman Islands

February 4, 2020 10
Residence to nationality remap: corp. bonds
• test
• U.S. foreign bond claims on residence basis: $2.1 trillion in 2017◦ $800 billion in low-tax jurisdictions

February 4, 2020 11
Residence to nationality remap: corp. bonds
• Nearly $400 billion in 2017 is considered U.S. exposure by MSCI
• Sizable amounts of MBS, CLOs
• EME holdings of China, Brazil, Russia firms

February 4, 2020 12
Residence to nationality remap: corp. bonds

February 4, 2020 13
Residence to nationality remap: fund shares
• Nearly 15% ($1.3 trillion) in 2017 of reported cross-border equity claims are in the form of fund shares and equity other than common stock
◦ Increased from about 3% (< $75 billion) in 2003
• Primarily firms residing in the Cayman Islands, British Virgin Islands, Luxembourg, Ireland
• Investments include:◦ ETFs that track the S&P 500◦ funds invested in U.S. Treasuries ◦ real estate funds◦ emerging market funds◦ commodities funds◦ private equity holdings

February 4, 2020 14
Residence to nationality remap: fund shares
• test
• More than half of reported fund exposure is U.S. exposure

February 4, 2020 15
Residence to nationality remap: fund shares
• Remapped using statistics reporting the types and origin of foreign assets held by investors
◦ CPIS, central bank data
• Additional geographic distortion of $1 trillion in 2017

February 4, 2020 16
Residence to nationality remap: total
• In 2017, about $3.5 of $12 trillion (30%) reflects exposure to country other than as reported in official U.S. statistics◦ Substantial increase from about $400 billion in 2003 ◦ EM exposure is 25 percent higher on a nationality basis
• Global portfolios likely similarly distorted◦ Estimate that $10 of $53.4 trillion in cross-border global holdings in
2017 CPIS are exposure of country other than as reported

February 4, 2020 17
Implications
• More capital flows from AEs to EMEs than previously thought
• Capital controls can be avoided◦ Purchases switch to bonds issued offshore
• Some FDI inflows are really portfolio◦ Purchases of EME corporate bonds issued via offshore centers will
result in FDI, not portfolio, inflows to EMEs◦ FDI flows often considered more stable than portfolio flows, but offshore
issuance means FDI could be increasingly “portfolio – like”

February 4, 2020 18
Nationality basis is an improvement…
• But does not fully capture extent of investor exposures to other countries
• Multinational firms have activities in many countries• Also need to consider investor holdings of domestic equity • For U.S. investors, largest part of total portfolio• Includes holdings of large U.S. multinationals
• Firm sales-based exposure estimates◦ Map the security-level U.S. foreign + domestic portfolio to Worldscope data on
firm sales to different locations to estimate total country exposures◦ Fairly complete data for firms listed on U.S. exchanges (required by SEC)

February 4, 2020 19
Residence to nationality remap: U.S. global stock portfolio
• Total U.S. common stock portfolio: ~$30 trillion in 2017◦ U.S. firms: $23.5 trillion (residence), $24.3 trillion (nationality)

February 4, 2020 20
Firm sales-based geographic exposure
• U.S. investor exposure to U.S.: falls to $17 trillion
• Exposure to EMEs: equal to AFE exposure at $7 trillion
• U.S. investors have greater indirect exposure to foreign countries from activities of U.S. multinationals than direct exposure from foreign equity

February 4, 2020 21
Implications for “Home Bias”
• ICAPM: in frictionless world, global investors should hold market cap in portfolio:
1 -ℎ𝑜𝑜𝑜𝑜𝑜𝑜𝑜𝑜𝑜𝑜𝑜𝑜𝑜𝑜 𝑜𝑜𝑜𝑜 𝑜𝑜𝑜𝑜𝑓𝑓𝑓𝑓𝑜𝑜𝑜𝑜𝑜𝑜 𝑓𝑓𝑒𝑒𝑒𝑒𝑜𝑜𝑒𝑒𝑒𝑒
𝑒𝑒𝑜𝑜𝑒𝑒𝑡𝑡𝑜𝑜 𝑓𝑓𝑒𝑒𝑒𝑒𝑜𝑜𝑒𝑒𝑒𝑒 𝑝𝑝𝑜𝑜𝑓𝑓𝑒𝑒𝑜𝑜𝑜𝑜𝑜𝑜𝑜𝑜𝑜𝑜𝑜𝑜𝑜𝑜𝑓𝑓𝑓𝑓𝑜𝑜𝑜𝑜𝑜𝑜 𝑓𝑓𝑒𝑒𝑒𝑒𝑜𝑜𝑒𝑒𝑒𝑒𝑚𝑚𝑡𝑡𝑓𝑓𝑚𝑚𝑓𝑓𝑒𝑒 𝑐𝑐𝑡𝑡𝑝𝑝𝑤𝑤𝑜𝑜𝑓𝑓𝑜𝑜𝑜𝑜 𝑓𝑓𝑒𝑒𝑒𝑒𝑜𝑜𝑒𝑒𝑒𝑒𝑚𝑚𝑡𝑡𝑓𝑓𝑚𝑚𝑓𝑓𝑒𝑒 𝑐𝑐𝑡𝑡𝑝𝑝
• But investors don’t: widespread “home bias”• Literature: frictions, hedging costs, market access, information
advantages of home country firms• How we define foreign equity holdings and market cap will affect these
calculations (and how we interpret what drives investor behavior)

February 4, 2020 22
U.S. “Home Bias” in common stock
• Residence basis:◦ high home bias, but
has trended down since 2003
• Nationality basis: ◦ high home bias,
trended down but has actually reversed in recent years
• Exposure basis: ◦ home bias is much
lower, and has been fairly stable

February 4, 2020 23
Concluding thoughts
• Post-crisis statistical initiatives are gathering more information on investor exposures, but the framework for these statistics is no longer well-suited to this task.
◦ Cross-border statistics are increasingly distorted
• One solution: Also publish cross-border statistics on a nationality basis• Estimates of U.S. nationality-based statistics available in our FEDs note◦ https://www.federalreserve.gov/econres/notes/feds-notes/globalization-and-the-
geography-of-capital-flows-20190906.htm
• But even this won’t fully capture global exposures, because of increasing global reach of multinational firms
• Geographic sales-based exposures are one way to more fully capture extent of global exposures
◦ Requires accurate, complete reporting on activities of multinationals

1/1
IFC Conference on external statistics "Bridging measurement challenges and analytical needs of external statistics: evolution or revolution?", co-organised with the Bank of Portugal (BoP) and the European Central Bank (ECB)
17-18 February 2020, Lisbon, Portugal
Luxembourg, the chain of direct investment ownership and the residence principle1
Paul Feuvrier,
Central Bank of Luxembourg
1 This presentation was prepared for the meeting. The views expressed are those of the author and do not necessarily reflect the views of the BIS, IFC, BoP, ECB or the central
banks and other institutions represented at the meeting.

Luxembourg, the chain of direct investment ownership and the residence principle 1
Luxembourg, the chain of direct investment ownership and the residence principle1
Paul Feuvrier, Banque centrale du Luxembourg
Foreign Direct Investments (FDI) positions and transactions in and out of Luxembourg are very high, largely because of activities linked to the Luxembourg’s role as a financial centre, executed through captive financial institutions. This is true even after switching from an asset/liability principle to the extended directional principle. On the one hand, the argument goes, this would somewhat highlight the limits or even the irrelevance of the residence principle applying to the FDI methodology. What matters would be the investor’s “lasting interest”, irrespective of the chain of direct investment ownership. On the other hand, in 2018 the IMF initiated an ambitious data collection framework for special purpose entities (report of the Task Force on SPEs) and confirmed that SPEs were residence-based institutional units. Reinforcing the link between micro and macro data would overcome this apparent paradox: “transparent” statistics with proper identification of each component of the chain would allow for a relevant information system, including on “ultimate investment”. In the medium term, interconnected registers may help national and European compilers to document these links between financial entities. In this regard, the Legal Entity Identifier (LEI) system is now covering the Luxembourg financial industry very well. Finally, the BcL has been sharing selected micro data with counterpart countries since 2009.
Keywords: SNA 2008, BPM6, Foreign Direct Investment, residence principle.
High FDI figures for Luxembourg
Foreign Direct Investment (FDI) positions and transactions in and out of Luxembourg are very high, largely because of resident captive financial institutions (CFIs).
The magnitude of these Luxembourg FDI figures is confirmed by partner
countries. Although the figures for Luxembourg are compiled in line with international standards (SNA 20082 and BPM63), it has increasingly been argued that
1 This presentation should not be reported as representing the views of the BCL or the Eurosystem. The
views expressed are those of the author and may not be shared with other research staff or policymakers in the BCL or the Eurosystem.
2 System of National Account 3 Balance of Payments Manual

2 Luxembourg, the chain of direct investment ownership and the residence principle
such high FDI figures in the non-banking sector would introduce opacity into global FDI figures and blur competitiveness analysis. An entity in the middle of the FDI chain does not really matter, it is argued, but only the investment’s initiator and its final target. In addition, a “true” FDI, so the argument goes, would typically be a “greenfield” investment generating tangible assets.
Extended Directional Principle
In the early 2000’s, this old question led to a second form of FDI presentation, namely the Extended Directional Principle (ExDP), complementing the Asset/Liability principle4. However, the ExDP approach only partially fixes the issue. Gross positions are reduced by 23% and 27% on the asset and liability side respectively, but they remain quite high.
Institutional unit test
A much more radical strategy sometimes advocated (again with a view to reducing some gross FDI positions in so-called “financial centres”) would be to “go through” the chain of direct investment, i.e. to make a change to the so-called “institutional unit test”. Indeed, a (currently) sufficient condition for an entity to constitute a resident institutional unit is to be controlled by a non-resident entity. In other words, one should not perform cross-border consolidation on External Sector Statistics, at least for their standard presentation.
SNA 2008 § 4.61
An entity of this type that cannot act independently of its parent and is simply a passive holder of assets and liabilities (sometimes described as being on auto-pilot) is not treated as a separate institutional unit unless it is resident in an economy different from that of its parent. If it is resident in the same economy as its parent, it is treated as an “artificial subsidiary.
4 BPM6 standard

Luxembourg, the chain of direct investment ownership and the residence principle 3
Should future SNA and BPM standards come back to this approach? From the perspective of Luxembourg, this “non-resident control makes institutional unit” principle remains valid, for various reasons.
First, taking into account the very complex chains of Direct Investment ownership on the one hand, and the significant current cross-country Direct Investment asymmetries on the other, one needs simple rules to derive cross-border financial assets and liabilities in a transparent and efficient way. The “immediate counterpart country” principle is one of those basic rules. In addition, computing regional aggregates (e.g. euro area totals) by “looking through” CFIs would probably be extremely challenging, at least as long as the regional compiler is working on national aggregates without underlying micro data.
Second, due to a new international environment5, Luxembourg Captive Financial Institutions are progressively gaining “substance” and therefore staff. Against this backdrop, an increasing proportion of Luxembourg CFIs is expected to no longer meet the IMF definition of SPEs in a near future. The following section presents a tentative implementation in Luxembourg of this definition of SPE’s.
Captive financial institutions (CFIs) and special purpose entities (SPEs)
Multinational Enterprises (MNEs) usually do not set up a single legal entity in Luxembourg, but rather a network of units. We distinguish between four patterns:
1 - Network of entities with total employment not exceeding 5 Full Time Equivalent (FTE) positions
Despite the fact that the pattern is usually trickier than the one shown in the example below (inward position in the first entity and outward position in the last), the consolidation or non-consolidation of these Luxembourg entities does not affect the network’s gross external assets and liabilities. In all cases, the Luxembourg entities are CFIs and SPEs.
5 The EU’s Anti-tax Avoidance Directive (ATAD) was transposed into national law in 2019, with an incentive
to reduce the use of some sophisticated instruments and enhance the “substance” of some institutions.

4 Luxembourg, the chain of direct investment ownership and the residence principle
2 - Network of entities with total employment exceeding 5 FTEs
In this second pattern, total employment in Luxembourg entities exceeds 5 FTEs. The entities remain institutional units, but turn into non-SPEs, in accordance with the IMF definition. As has been previously emphasized, CFIs in the new international environment will probably carry on gaining more “substance” and thus have more staff in the future.
3 - Network of entities including a non-financial corporation (NFC)
In this pattern, one of the entities set up by the MNE is a non-financial corporation (NFC), which is itself a non-SPE. Remaining units (theoretically consolidated in the NFC) are in this context non-SPEs.

Luxembourg, the chain of direct investment ownership and the residence principle 5
4 - CFI set up by an investment fund or securitization vehicle
Most Luxembourg real estate investment funds do not hold real estate directly, but do so through a resident structure. This structure does not meet the SPE definition either, because investment funds are usually held by minority investors and are therefore not “controlled” by non-residents. The same goes for securitization vehicles.
All in all, following these implementation rules, 21% of CFIs surveyed by the BCL and 35% of aggregate balance sheets (B/S) are non-SPEs, first and foremost because of the employment criterion.

6 Luxembourg, the chain of direct investment ownership and the residence principle
Data sharing on FDI and Legal Entity Identifier (LEI) level 2
In a nutshell, FDI is a combination of: - 1 cross-border financial links between companies; - 2 valuation (position, transaction, income) of cross border equity positions; - 3 position, transaction and income on cross-border debt between entities of
the chain of direct investment. The BCL collects monthly and quarterly reports on CFIs. Both the valuation and
the timing of equity transactions should be consistent with those of mirror countries. At the European level, this often requires bilateral discussions. International organizations have recently launched several such coordination initiatives, in which the BCL actively participates: the “FDI network” project and more recently the “Asymmetry Resolution Meetings”. Statistical confidentiality remains an obvious non-negotiable rule often preventing the exchange of detailed information with international organisations and partner countries. However, these coordination initiatives are starting to bring about some positive results and progress will be made step by step.
Against this backdrop and as far as the record of cross-border financial links between companies (the first of the three elements of FDI) is concerned, one should mention the LEI level 2 database. This database documents (to simplify) the chain of direct investment relationship and combines four strong points for an entity:
- It is identified by an internationally recognised identifier (reporter, national compiler, counterparty of the transaction and cross-border compiler).
- The database displays its immediate shareholder. - The database displays its ultimate shareholder as well. - This whole set of information is public.
For instance, Pfizer Holdings International (first row) is held by Pfizer inc (ultimate investor) and itself holds Pfizer Shareholdings Intermediate SARL and Phivco Luxembourg S.à r.l.
33% of Luxembourg CFIs surveyed by the BCL have an LEI code (LEI level 1) and 14% document Direct Control in LEI level 2. Even if the chain of direct investment relationship is only the starting point of direct investment statistics, these results are somewhat promising and may facilitate the exchange of micro data in the medium or

Luxembourg, the chain of direct investment ownership and the residence principle 7
long run. In accordance with a 2017 EU Regulation, CFIs issuing debt securities on open markets are now identified by a Legal Entity Identifier (LEI)6
Conclusion
The residence principle remains valid for FDI statistics, in particular with reference to CFIs, even if it can obviously be complemented by nationality-based statistics. CFIs meet various objectives and one has to distinguish in this population between SPEs and non-SPEs. Finally, the work on CFIs (valuation of unlisted equities, timing of transactions, etc.) often requires international data exchange, which may be facilitated, in the medium run, by a broader use of LEIs.
6 Regulation (EU) 2017/1129 of the European Parliament and of the Council of 14 June 2017 on the
prospectus to be published when securities are offered to the public or admitted to trading on a regulated market

1
Luxembourg, the chain of direct investment ownershipand the residence principle
Lisboa, 18 February 2020
Paul Feuvrier, Banque centrale du Luxembourg

22
Performannks : foreign / localLuxembourg, the chain of direct investment ownershipand the residence principle
Disclaimer
This presentation should not be reported as representingthe views of the BCL or the Eurosystem.
The views expressed are those of the author and may not beshared by other research staff or policy makers in the BCL orthe Eurosystem.

33
Performannks : foreign / local1 - High FDI figures in Luxembourg
1 - High FDI figures in Luxembourg
2 - Extended Directional Principle
3 - Institutional unit test
4 - Captive Financial Institutions (CFIs) and Special Purpose Entities (SPEs)
5 - Data sharing on FDI and possible future role of Legal Entity Identifier (LEI)
6 - Conclusion

44
Performannks : foreign / local1 - High FDI figures in Luxembourg
High FDI positions and transactions in Luxembourg Overall because of Captive Financial Institutions Difficult economic interpretation
Competitiveness analysis… What to do with entities in the middle of FDI chain?
Statistical standard Taking into account compilation constraints…

55
Performannks : foreign / local2 - Extended Directional Principle
Historical reply : Directional principle (BPM 5) Followed by Extended Directional Principle (BD 4)
From A / L to Extended Directional PrincipleAsset / Liability & Extended Directional PrincipleLuxembourg Direct Investment PositionDecember 2018 - EUR bn1 - Asset Liability principlebn euros conversion ExDPAsset Outwards AOF + D1 In direct investment enterprise 4 262Asset Inwards AIF - D2 In direct investor (reverse) 155Asset Outwards AOF+ U1 Between fellow UCP resident 31Asset Inwards AIF - U2 Between fellow UCP non resident 772Asset 5 221Liability Inwards LIF + D1 In direct investment enterprise 3 431Liability Outwards LOF - D2 In direct investor (reverse) 254Liability Outwards LOF - U1 Between fellow UCP resident 20Liability Inwards LIF + U2 Between fellow UCP non resident 779Liability 4 484Net 737
2 - Extended Directional PrincipleOutwards 4 020Reduction 23%Inwards 3 283Reduction 27%Net 737Source: BcL

66
Performannks : foreign / local3 - Institutional unit test
Key SNA item for high FDI Luxembourg figures
SNA 2008 § 4.61 An entity that cannot act independently of its parent and is simply a passive holder of
assets and liabilities is not treated as a separate institutional unit unless it is resident in an economy different from that of its parent.
If it is resident in the same economy as its parent, it is treated as an “artificial subsidiary
Future SNA: such Captive Financial Institutions to remain as Separate Institutional Units ? Or reclassified with their parents ?

77
Performannks : foreign / local3 - Institutional unit test
“Non-resident control makes institutional unit” principle
Still valid principle for four reasons:
1 Changing international environment (BEPS, ATAD in Europe) What does it bring about ?
2 Simple compilation rules to derive cross-border financial assets and liabilities If one “goes through” non resident SPEs, where to stop ?
Possible blurred lines between SPEs and operating entities Taking into account SPE IMF TF definition…

88
Performannks : foreign / local3 - Institutional unit test
“Non-resident control makes institutional unit” principle Still valid principle for four reasons:
3 Principle endorsed by SPE IMF TF Distinction between
FDI / captive Financial Institutions / SPEs FDI / captive Financial Institutions / non SPEs
4 Macro economic statistics increasingly linked to micro data Future role of LEI
Resident principle = single SNA & BPM standard complemented by “alternative” presentations
e.g. “consolidated” or “nationality based” aggregates

99
Performannks : foreign / local4 - Captive Financial Institutions (CFIs) and Special
Purpose Entities (SPEs)
4.1 - Network of entities with total employment not exceeding 5 Full Time Equivalent Luxembourg entities
= CFIs = SPEs.

1010
Performannks : foreign / local4 - Captive Financial Institutions (CFIs) and Special
Purpose Entities (SPEs)
4.2 - Network of entities with total employment exceeding 5 Full Time Equivalent Luxembourg entities
= CFIs = non SPEs

1111
Performannks : foreign / local4 - Captive Financial Institutions (CFIs) and Special
Purpose Entities (SPEs)
4.3 - Network of entities including a Non-Financial Company Luxembourg entities
= non SPEs

1212
Performannks : foreign / local4 - Captive Financial Institutions (CFIs) and Special
Purpose Entities (SPEs)
4.4 - CFIs set up by an investment fund or a securitization vehicle Luxembourg entities
= CFIs = non SPEs

1313
Performannks : foreign / local4 - Captive Financial Institutions (CFIs) and Special
Purpose Entities (SPEs)
35 % of CFIs B/S non SPEs Main factor Employment criterion
Employment up to maximum of 5 employees

1414
Performannks : foreign / local5 - Data sharing on Foreign Direct Investment
Foreign Direct Investment = combination of: Cross-border financial links between companies
infrastructure Position, transaction & income of cross border
equity positions debt between entities of the chain of direct investment
Valuation and timing of CFI equity transactions should be consistent with those of mirror countries requires bilateral/multilateral discussions
implemented at the European level FDI network, Asymmetry Resolution Mechanism…
restricted by statistical confidentiality European initiatives start to bring about some positive results…

1515
Performannks : foreign / local5 – Improved data sharing with legal Entity Identifier ?
LEI: Legal Unit identified by an internationally recognised identifier
reporter, national compiler, counterparty of the transaction and cross bordercompiler
Immediate and ultimate shareholder Whole set of information is public
Limitations Only touches upon “infrastructure” LEI does not immediately addresses pending issues
Valuation of unlisted equities Statistical confidentiality

1616
Performannks : foreign / local5 - Data sharing and LEI level 2

1717
Performannks : foreign / local5 - LEI level 2 in Luxembourg Captive Financial Institutions

1818
Performannks : foreign / local6 - Conclusion
TF on SNA Research Agenda Subgroup on Globalization
Ongoing consultation on MNEs and SPEs… Increasing role of micro data sharing in the medium run
Broader use of LEI Implementation of SPE IMF TF definition
Distinction between FDI / captive Financial Institutions / SPEs FDI / captive Financial Institutions / non SPEs
“substantial” institutions Residence principle remains valid for FDI statistics
In line with SPE IMF TF definition Also for compilation purposes Can obviously be completed by nationality-based statistics

1/1
IFC Conference on external statistics "Bridging measurement challenges and analytical needs of external statistics: evolution or revolution?", co-organised with the Bank of Portugal (BoP) and the European Central Bank (ECB)
17-18 February 2020, Lisbon, Portugal
Foreign direct investment – using network analysis to understand the position of Portugal in a global FDI network1
Filipa Lima, Flávio Pinheiro, João Falcão Silva and Pedro Matos,
Bank of Portugal
1 This presentation was prepared for the meeting. The views expressed are those of the authors and do not necessarily reflect the views of the BIS, IFC, BoP, ECB or the central
banks and other institutions represented at the meeting.

Foreign direct investment – using network analysis to understand the position of Portugal in a global FDI network 1
Foreign direct investment – using network analysis to understand the position of Portugal in a global FDI network
Filipa Lima, Flávio Pinheiro, João Falcão Silva and Pedro Matos1
Abstract
Understanding the role of foreign direct investment (FDI) is of utmost importance in a world economy of increasingly interdependent economies. However, the lack of an unified data source of FDI covering a long time frame has posed serious challenges to its analysis. In this article we apply methods of network analysis to build a representation of the global FDI relationships. We show how the network representation of the global FDI can be used to identify patterns, identify preferential paths for investment, establish trends and describe the relations between countries over time. We present the results by using specific visualisation tools that graphically illustrate the interlinkages between the economies, and that can be a valuable instrument for the design and deployment of regulating instruments.
Keywords: Foreign direct investment, Network analysis, Visualisation tools
JEL classification: C02, C63, F21
1. Introduction
“One picture is worth a thousand words”. For producers of official statistics this translates into “One picture is worth a thousand numbers”.
An increasingly globalized and interconnected world economy raises new challenges to the traditional macroeconomic statistics. To describe a globalized world, where national borders are less relevant, economic statistics also need to adapt and be supplemented with information on global interconnectedness. In this respect, external statistics play a crucial role in the comprehension of global phenomena.
One domain where we are likely to find ourselves immersed in a deluge of data concerns Foreign Direct Investment (FDI). FDI is a category of cross-border investment in which an investor resident in one economy establishes a lasting interest in and a significant degree of influence over an enterprise resident in another economy (immediate counterpart country). The dimensions of analysis covered in FDI include, among others, inward and outward values for stocks, flows and income, by partner country and by industry. In a world with 10 countries only, analysing the FDI links between countries based on the annual stocks would require a 100 cells matrix. Moreover, from the observation of this matrix one would not be able to say straightforward which countries are closer to which, which ones have stronger FDI links, etc.
1 Filipa Lima ([email protected]) and João Falcão Silva ([email protected]), Statistics Department, Banco de Portugal.
Flávio Pinheiro ([email protected]) and Pedro Matos ([email protected]), NOVA Information Management School. The views expressed are those of the authors and not those of the Banco de Portugal or NOVA Information Management School. We thank to Ana Margarida Soares, Vítor Silveira and Vítor Pereira (Banco de Portugal) for their valuable comments.

2 Foreign direct investment – using network analysis to understand the position of Portugal in a global FDI network
In order to capture the indirect foreign direct investment relationships and to have a comprehensive picture of ultimate cross-economy financial linkages and risks, FDI standard data needs to be complemented with information on ultimate counterpart economy.
This paper illustrates how the use of network analysis tools, to represent FDI country-to-country relationships, can help producers of these data to better understand and communicate them. In particular, we will illustrate how we can assess the position of a given country in a global FDI network and how it varies over time. Furthermore, a comparison between 2009 and 2018 network is addressed and the results show that the countries with more FDI interconnections usually correspond to advanced economies, financial centres, and tax benefit countries. To that end we will use data provided by the International Monetary Fund (IMF) - Coordinated Direct Investment Survey (CDIS), for all the available world countries, and focus our analysis in European economies and Portugal in particular.
The paper is organised as follows: after the introduction section, a literature review on the network analysis is presented. The methodological session describes the network approach and its fundamentals and in section 4 data variables and data sources are described. The global FDI network is represented in section 5 and section 6 concludes.
2. Network analysis and economic variables
Network analsysis has a long tradition in the study of socio-economic systems (Jackson (2010) and Schweitzer et al., 2009). Network science offers a set of tools to facilitate the inference of relationships between different elements (agents, actors, individuals, etc.) of a system (Marvasi et al., 2013, Giovannetti et al., 2015, Newman et al., 2006), while offering an opportunity to analyse the macroscopic properties that stem from the collection of relationships established between those elements. Network science constitutes a unique framework to study how information propagates through a system and failures cascade throughout its elements (Barabási et al., 2016).
Ribeiro et al. (2018) analyzed the historical activity archives of a XVI century merchant/banker from Spain, showing a global network that exhibit properties quite similar to those of modern day banking systems, arguably raising questions on the universality of the mechanisms underlying the emergence of such structures regardless of the society technology levels. Batiston et al. (2016) and D’Errico and Roukny (2017) used network analysis to study the redundant capital in over-the-counter (OTC) markets and the degree to which these can be compressed in order to ease the role of the regulator. In fact, in the follow up of the 2008 financial crisis many authors have resorted to network science methods in order to disentangle the complex cascade effects observed in the banking sector.
In the context of economic development, Hidalgo et al. (2007) introduced the Product Space, a network that measures the knowledge proximity between products that countries can export, helping to explain both the natural laws of development of countries but also their constrains. These methods have become widely popular in economic geography by capturing the building blocks of regional technological and industrial specialization dynamics (Alstott et al., 2017; Ter Wal and Boschma, 2009; and, Hidalgo et al. 2018). Focusing instead in the relationships between countries and not their products, the World Trade Web represents the bilateral relationships between countries obtained from the import and export flows. In the literature several works can be found that make a characterization of its complex nature (Serrano and Boguñá, 2003), but also how it has shown a rather non-intuitive stability over the years (Fagiolo et al. 2010).
Amighini and Gorgoni (2014) analysed the patterns of trade in auto parts and found that the rise of emerging economies as suppliers forced a change in the international market structure. On the other

Foreign direct investment – using network analysis to understand the position of Portugal in a global FDI network 3
hand, Akerman and Seim (2014) analysed the global arms trade network and the results showed that over the years the network became more clustered and decentralised.
More recently, Amador et al. (2018) analysed the global value added in the trade flows to understand the structure of global value chains, using a complex network analysis to represent the value that each country added to the global value chains. According to the authors, many articles use the complex network perspective to achieve an empirical analysis of international trade interactions. In this case each country is defined as a node and the bilateral interaction between them is defined as an edge. Many studies already focus on this interaction, either on an undirected way (when the interaction is from both countries) or directed way (just from one to the other), as Kali and Reyes (2007), Fagiolo et al. (2010), and, Garlaschelli and Loffredo (2005). The use of network analysis can also determine the existence of a high level of clustering between two or more countries (Amador and Cabral, 2016), which may indicate common characteristics between the different countries.
The set of tools allows the identification of the full structure of interactions between many countries without any limitation on using longer time frames. According to Newman (2010) there is a set of measures to examine analytically the large-scale properties that are subject to a complex network system. This means that we can integrate the data in one single structure and analyse it according to different measures which define the properties of this structure. In addition, the network tools provide a set of visual aid for the structure representation. It uses graphs with notes that contain nodes linked by edges to support a better understanding of the relationships between each country, represented by a node. This node indicates the closeness between each country in the same group. The use of the network analysis in economics can improve the understanding of economic systems, where firms or individuals interact between each other. It also explains stylized facts and complex relationships structures, with simple models (Marvasi et al., 2013).
Interestingly, there is a lack of studies exploring FDI data. Li et al. (2018), explores evolution on the global FDI network, from 2003-2012. The authors used network analysis tools to present and analyse the global FDI, using some metrics to define the global characteristics of the network. The authors recognized the value added from using the methodology. Furthermore, they used network analysis customization and presentation tools, such as changing the size or the colour of nodes in order to highlight the importance of each country in the network. And they also explored the potential use of two network metrics, the degree and the average path length, to better define the characteristics and the relations inside the network. Damgaard and Elkjaer (2017) focused on the role of special purpose entities (SPEs) and estimated a unique global FDI network where SPEs are removed and FDI positions are broken down by the ultimate investing economy. According to the authors total inward FDI in the new network is reduced by one-third, and financial centers are less dominant. More recently, Damgaard et al. (2019) estimated the global network of FDI positions while disentangling “real FDI” (the relation between an investor in one economy and an active and substantial business in another economy) and the “Phantom FDI” (investments into empty corporate shells with no link to the local real economy). Ignoring phantom investment and allocating real investment to ultimate investors increases the explanatory power of standard gravity variables by around 25 percent.
3. Methodology approach
In the following sections we will describe the key methodological aspects and main variables of interest in the context of network analysis.

4 Foreign direct investment – using network analysis to understand the position of Portugal in a global FDI network
Network Analysis
Network science provides a common framework and analytical tools to extract insights from many systems and problems. In particular, and stemming from its strong complex systems roots, it is often used to link how individual/microscopic interactions lead to emergent macroscopic structures that governs the behaviour of the entire system as a whole. In that sense, and besides the analytical tools, network science has also gained some relevance for the potential to provide rich visualizations of the complex organization of such systems, allowing to highlight structures and patterns of interest. In this section, we detail the fundamentals of what makes a network and some relevant network measures. In the following sections we will detail the network inference methodology used in this work.
A network, 𝒢𝒢, is a system composed by two sets of distinct but complementary elements: a set of 𝑁𝑁 vertices/nodes (𝒱𝒱: {𝑣𝑣0, … , 𝑣𝑣𝑁𝑁}) and a set of links/edges (ℒ: {𝑒𝑒𝑖𝑖𝑖𝑖 , … , 𝑒𝑒𝑘𝑘𝑘𝑘}). Edges connect pairs of nodes, such that edge 𝑒𝑒𝑖𝑖𝑖𝑖 identifies the existence of a link between vertices 𝑣𝑣𝑖𝑖 and 𝑣𝑣𝑖𝑖. Networks elements are commonly used as abstractions of entities (vertices) and existing relationships between them (edges). For instance, in a social system vertices could represent individuals with edges representing a social tie (i.e., friendship. co-work, family) between them.
Graphical representation of different types of networks (top), and the same representation in the adjacency matrix (bottom)
Figure 1
Top panel of Figure 1 shows a graphical representation of three types of networks: Undirected; Directed; and Weighted. Another common, and often algorithmic useful, representation of a network is through the adjacency matrix, see bottom panel of Figure 1 for the adjacency representation of the above networks. The adjacency matrix, 𝐴𝐴, of a network is a square matrix in which the entries 𝑎𝑎𝑖𝑖𝑖𝑖 are zero if there is no relationship between vertices 𝑣𝑣𝑖𝑖 and 𝑣𝑣𝑖𝑖, and non-zero if there is a relationship. In the case of a weighted network the value of 𝑎𝑎𝑖𝑖𝑖𝑖 corresponds to the weight of the relationship, while in the case of unweighted networks it is by definition one. Moreover, in the case of undirected networks 𝑎𝑎𝑖𝑖𝑖𝑖 = 𝑎𝑎𝑖𝑖𝑖𝑖. The diagonal entries of 𝐴𝐴 denote self-links, that is, edges that start and end in the same node. In practice

Foreign direct investment – using network analysis to understand the position of Portugal in a global FDI network 5
it is common to have the diagonal set to zero2. In the network representation each edge that connects two nodes, must have at least one arrow, indicating the direction of the investment, i.e., the investment that is made by one economy (the investor) in the other economy (the host). If an edge has two arrows, each pointing towards a different country, then both countries made an investment to each other.
It is often the case that additional information is available about the characteristics of the different elements of a network. For instance, if vertices represent individuals characteristics these may include their age, gender, or salary. Such information on vertices is typically ignored in the network construction and used only at a later stage to either validate the network, characterize its connectivity structure, or identify new relevant associations3. Hence, networks can be either undirected (when edges have no direction) or directed (when edges have a direction) and weighted (when edges have a magnitude or value) or unweighted (when edges weight are merely a binary value representing whether a particular relation exists or not). In general, weights can inform us on the similarity between pairs of nodes (i.e., heavier links mean two nodes are more similar), or their proximity/distance (i.e., how far away are two nodes, where heavier links mean two nodes are farther apart). In network analysis, It is important to clearly specify which measure is being attributed to links weight as it will impact the computation of different network metrics. The available list of characteristics and the ultimate goal of analysis will, in the end, dictate the type of networks to be generated.
Several measures can be made from networks, thus providing a characterization of its elements but also of its structure as a whole. For instance, the degree 𝑘𝑘𝑖𝑖 of a vertex 𝑣𝑣𝑖𝑖 represents the number of connections that vertex participates. In the case of directed networks the degree can be decomposed in two quantities: the in-degree (𝑘𝑘𝑖𝑖𝑖𝑖𝑖𝑖) and out-degree (𝑘𝑘𝑖𝑖𝑜𝑜𝑜𝑜𝑜𝑜). The first represents the number of links that point towards such vertex, while the second represents the number of links that point outwards of vertex 𝑣𝑣𝑖𝑖 . It is common to characterize networks by their degree distribution, 𝐷𝐷(𝑘𝑘), that represents the fraction of vertices with degree 𝑘𝑘. From the degree distribution we can estimate the average degree ⟨𝑘𝑘⟩ and degree variance 𝑣𝑣𝑎𝑎𝑣𝑣(𝑘𝑘), which is often taken as a measure of the level of the degree heterogeneity of a network. The shape of the degree distribution is one of the simplest forms to characterize the structure of a network. It can indicate the fundamental mechanics behind the process that gave origin to a network. For instance, random networks tend to have a Poisson degree distribution (𝐷𝐷(𝑘𝑘)~ ⟨𝑘𝑘⟩𝑒𝑒−⟨𝑘𝑘⟩ 𝑘𝑘!⁄ ), while networks stemming from preferential attachment have scale-free degree distributions (𝐷𝐷(𝑘𝑘)~𝑘𝑘𝛼𝛼).
Other measures try to quantify the organization of the network. For instance, in social sciences a commonly measure of interest is the Cluster Coefficient (Newman, 2003), which can be a local measure of the nodes or a global measure of the population. It measures the number of closed triangles that are formed in the network, given the number of open triangles that exist. For instance, in social sciences this could be represented by quantifying the number of friends that have a friend in common, and thus an indicator of social cohesion. Hence high clustering is associated with more clustered networks. Often confusing is the relationship between clusters and communities in networks. Communities represent a partition of a network (in different groups) that minimize the inter-links between groups and maximizes the intra-linkages. Finding the optimal partition of a network is an optimization problem that often uses modularity as an objective function (Newman, 2006). Hence although it is expected cluster coefficient to be high inside each community or group, clustering is, in network science jargon, associated with the density of triangular motifs in the network. Networks can be thought as providing a metric that allows
2 One example to illustrate an undirected network is by thinking on a subway system map. In a subway map two stations have
an undirected connection, which means that the subway can have each one either as a point of origin or as a destination. Conversely, if the subway system was directed the subway could only go from one station to the other, not doing the same way back.
3 Likewise, information about relationships can carry important information that indicate the direction of a relationship (e.g., different people might indicate different friends) or its weight/magnitude (e.g., friendships can have different degrees of importance depending on how old they are).

6 Foreign direct investment – using network analysis to understand the position of Portugal in a global FDI network
to estimate the distances between elements in a system. Indeed, one can measure distances between two vertices by identifying the shortest length of the chain - edges and vertices - that would be necessary to transverse in the network to reach one element when starting from another. Naturally, this mindset needs to take into account whether the networks are weighted (in which case the chains need to incorporate the weights) or directed (in which case there are certain nodes) but arguably allows to measure distances in systems and scenarios that otherwise would be very complicated (e.g., social distance between individuals is not something that is measurable by comparing the characteristics of two individuals). In that sense, one measure of interest is the distance between two nodes, which is simply the shortest path that connects two nodes in the network. The average path length measures the average length of the shortest paths in the network, measuring thus the expected distance between any pair of nodes. Finally, the diameter of a network corresponds to the largest shortest path in the network.
Figure 2 represents a simple network with the most central nodes estimated from different metrics highlighted. As it is clear to see, although in many circumstances the same node can be the most central according to different centrality measures, it is easy to show that that is not necessarily the case.
Simple network with the most central nodes estimated from different centrality metrics highlighted
Figure 2
A common problem in many fields is to identify the most important/central elements of a particular system. In network science this is done by analysing the relative position of each element in the overall network and, in some cases, their relative importance to the functioning of the network. One classical example of the importance of network centrality measures comes from Google, whose algorithm, Page Rank, used to rank the relevance of pages to queries of users, stems from a network centrality measure (Page et al., 1999)). In that sense, there are several measures of vertices centrality that are worth mentioning:
1. Degree Centrality – measures the importance of a node by their degree. Hence a node is more important the more relationships it holds;

Foreign direct investment – using network analysis to understand the position of Portugal in a global FDI network 7
2. Closeness Centrality – measures the importance of a node by how far away it is from the remaining nodes of the network. In that sense, the most important node is the one that stands closer to the othes;
3. Betweenness Centrality – measures importance of a node by how often it intermediates paths between other nodes. In that sense, a node is more important if it is more often the middle man in the information diffusion through the network;
4. Eigevenvector Centrality – measures the importance of a node by how likely would a random walker spend time in that specific node if the walker was left indefinetly visiting nodes of the network by transversing its edges. Pagerank is a variation of the Eigenvector.
4. Data description and sources
The direct investment comprises cross-border investment associated with a resident in one economy having control or a significant degree of influence on the management of an enterprise that is resident in another economy4. It captures the immediate direct investment relationships, i.e., when a direct investor directly owns equity that entitles it to 10 percent or more of the voting power in the direct investment enterprise.
The direct investment is usually presented in two different perspectives – following the asset/liability principle (as introduced in the 6th edition of the Balance of Payments Manual) or directional principle (requested in previous editions). In our paper, we consider the directional principle presentation to reflect the direction of the investment. Under the directional principle, direct investment is shown as either direct investment abroad (outward investment5) or direct investment in the reporting economy (inward investment6).
The implementation of the network estimation uses statistical information on the foreign direct investment directional principle. The information was obtained from the Coordinated Direct Investment Survey provided by the International Monetary Fund. The selected data contains annual information from 2009 until 2018 on the total inward direct investment (stocks) and also inward equity direct investment (stocks). In addition, it was considered information for all the available world countries (133) with all the available counterpart countries (259) in US dollars. It reflects all the immediate direct investment relationships between resident direct investment enterprises and their non-resident direct investors (those that own 10 percent or more of the voting power in the direct investment enterprise).
5. Building a FDI global network
Here, we will consider the case where each node represents a country, while edges highlight the strength of the direct investment between two countries proxied by the Foreign Direct Investment Stock.
4 The significant degree of influence is determined to exist if the direct investor owns from 10 to 50 percent of the voting
power in the direct investment enterprise. Control is determined to exist if the direct investor owns more than 50 percent of the voting power in the direct investment enterprise.
5 Investments by resident direct investors in their direct investment enterprises abroad deducted from the reverse investments by direct investment enterprises abroad in their resident direct investors.
6 Investments in resident direct investment enterprises by direct investors abroad minus Reverse investments by resident direct investment enterprises in their direct investors abroad.

8 Foreign direct investment – using network analysis to understand the position of Portugal in a global FDI network
Let us consider that 𝑓𝑓𝑖𝑖𝑖𝑖 represents the Inward Direct Investment Positions, US Dollars, between country 𝑖𝑖 and 𝑗𝑗. By definition the FDI stock can be a positive or negative number. A negative FDI position is most likely to occur when FDI statistics are presented by partner country (i.e., directional principle) and occurs when the funding from the affiliate to its parent exceeds the investment made by the parent in the affiliate, and it can be asymmetrical, in that 𝑓𝑓𝑖𝑖𝑖𝑖 ≠ 𝑓𝑓𝑖𝑖𝑖𝑖 . Our first step in network inference is to deal with the problem of negative 𝑓𝑓𝑖𝑖𝑖𝑖. To that end, we shall consider the absolute values, |𝑓𝑓𝑖𝑖𝑖𝑖|. Secondly we want to analyse the proximity between countries and we need to merge both asymmetric flows into a single quantity. To that end we measure the proximity between two countries as
𝜙𝜙𝑖𝑖𝑖𝑖 =1
�𝑓𝑓𝑖𝑖𝑖𝑖� + |𝑓𝑓𝑖𝑖𝑖𝑖|(1)
where by definition 𝜙𝜙𝑖𝑖𝑖𝑖 = 𝜙𝜙𝑖𝑖𝑖𝑖 . Under this assumption the larger the magnitude of the FDI stock between two countries the closer, or more related, they are. In the end we obtain a proximity square matrix, Φ, that allow us to build an undirected weighted graph.
Visualizing the network spanned by Φ leads to an utterly dense structure in which is difficult to visualize any important or relevant structural properties. Hence, to visualize the network we first identify the Minimum Spanning Tree, which is the network with the minimum number of edges (and in this case total weight sum) that creates a single connected network, that is, a network in which all nodes are connected to at least another node and in which is possible to draw a path between any pair of nodes. However, since the resulting structure is very sparse and lacks any sense of structure, we add the edges with the lowest weight, which identify the closest relationships, to the network. We define a threshold on a case by case. For layout we use the Gravity Embedding from Wolfram Mathematica 12.
Note that, besides the above steps for network visualization, all other computations are done on the network spanned by the full proximity matrix (Φ).
Figure 3 corresponds to the network representation of global FDI for 2018. Each node represents a country, and relationships identify the highest weight defined as above. Six geographic areas are identified by six different colours and the main players, together with Portugal, are also identified, both in terms of betweenness centrality and closeness centrality.
The most important (central) countries in terms of how often they intermediate paths (i.e., FDI relationships) between other countries (betweenness centrality) in 2018 are, by descending order: United States, Netherlands, United Kingdom, Luxembourg, China, Hong Kong, Germany, Italy, Mauritius, and France. These countries are more often the middle country in the FDI diffusion through the network. The presence in this TOP10 list is likely to be explained by the fact that the country acts as an important financial centre or as an off-shore.
The most important countries in terms of how close they are to the rest of the countries (closeness centrality) in 2018 are, by descending order: United States, Netherlands, Luxembourg, United Kingdom, Canada, Japan, Switzerland, Ireland, Germany and Bermuda. These results are consistent with the main “FDI” countries, as they usually correspond to to advanced economies, financial centres, and tax benefit countries among other country situations countries which are politically and economically stable. The results are also consistent with the World Investment Report 2019 (UNCTAD).

Foreign direct investment – using network analysis to understand the position of Portugal in a global FDI network 9
Network representation of global FDI (2018). In the right panel it is shown the TOP10 ranked countries by betweenness and closeness centrality.
Figure 3
Source: IMF CDIS data and authors’ calculations
Figure 4 corresponds to the network representation of global FDI for 2009. There are some differences between the 2009 and 2018 networks. One general difference relies on the closeness and centrality, which is higher in the 2009 network than in the 2018 network. Furthermore, it can be pointed that in 2009 South Africa occupied a central position in Africa, whereas in 2018 Mauritius became more important. In addition, in the 2009 network there are more European countries in the centre of the network than in 2018. Finally, it is also important to stress out that in both networks China and Russian Federation play a crucial role in Asia, while United States are crucial in North America.

10 Foreign direct investment – using network analysis to understand the position of Portugal in a global FDI network
Network representation of global FDI (2009). In the right panel it is shown the TOP10 ranked countries by betweenness and closeness centrality.
Figure 4
Source: IMF CDIS data and authors’ calculations
In Figure 5 we zoom in this global FDI network and highlight the European FDI sub-network, i.e., the European countries highlighted in blue in the global FDI network (left panel). In addition we selected one specific case to analyse the shortest path connecting FDI between China and Portugal in 2018, where there is evidence that China is an ultimate investor in many Portuguese inward foreign direct investments, but not the immediate counterpart country in the right panel of Figure 6. According to the results obtained, the shortest path between Portugal and China passes by Hong-Kong, United Kingdom and Netherlands (immediate counterpart country). Interestingly, this is precisely the information we expect to find when considering immediate counterparts vs. ultimate investors. From complementary data sources we find evidence that much FDI done in Portugal by Chinese investors (ultimate counterpart) is intermediated by Dutch companies (immediate counterpart). The fact that this intermediation is captured by network science techniques using as raw data only information on the immediate counterpart illustrates the enormous potential and analytical power of these tools both for researchers and statisticians.

Foreign direct investment – using network analysis to understand the position of Portugal in a global FDI network 11
Network Representation of European FDI and FDI shortest path between China and Portugal (2018)
Figure 5
Source: IMF CDIS data and authors’ calculations
The shortest path connecting FDI between China and Portugal evolved over time, as illustrated in
Figure 6, between 2009 and 2018. Figure 6 shows that between 2009/2013 there were three FDI intermediate countries between Portugal and China (Netherlands, United States and Japan) whereas in 2014 these three intermediate countries were Spain, Netherlands and Hong Kong. From 2015 until 2018 only two countries (Netherlands and Hong Kong) intermediate the FDI investment of China in Portugal. In 2018 United Kingdom appears in the network close to the Netherlands and Hong-Kong.
Evolution of FDI shortest path between China and Portugal (2009-2018) Figure 6
Source: IMF CDIS data and authors’ calculations

12 Foreign direct investment – using network analysis to understand the position of Portugal in a global FDI network
On average, the number of intermediaries in the shortest paths that connect every pair of world country is around 3 and has not varied significantly over time (Figure7). Nevertheless, the composition may be different.
Average number of intermediaries in the shortest paths that connect every pair of world country (2009-2018)
Figure 7
Source: IMF CDIS data and authors’ calculations
Turning now to the TOP10 intermediaries in 2018, we analysed how often they intermediate any FDI relationship between any pair of countries in the world. We exclude the cases where they are the origin or the destination of the FDI itself. As we can see in Figure 8, the list is led by the United States, intermediating over 50% of all FDI paths identified; moreover, in more than 1/10 of those paths, the United States operate as first intermediary in the path. The cases of the Netherlands and the United Kingdom are also worth mentioning. Although their share as intermediaries is smaller than that of the United States for 2018, they act as first intermediaries every other path.
Finally, in Table 1, we looked at some selected countries as originators of FDI and assessed which countries were chosen as first intermediaries. The United States again dominate the table, acting as first intermediary in the most of selected countries as Germany (35%), Japan (49%) and United Kingdom (29%). Moreover, Netherlands dominates in the case of Portugal (52%) and United States (14%). Finnally, Hong Kong plays an important role in China (43%) and Cyprus in the Russian Federation (49%). It is important to refer that the results differ when different years are considered.

Foreign direct investment – using network analysis to understand the position of Portugal in a global FDI network 13
TOP intermediaries in a global FDI network (2018) Figure 8
Source: IMF CDIS data and authors’ calculations
Selected investors and TOP intermediaries in a global FDI network (2018) Table 1
Investor (country)
1st intermediary (country)
1st intermediary
(share, %)
China Hong Kong 43%
Germany United States 35%
Japan United States 49%
Portugal Netherlands 52%
Russian Federation Cyprus 49%
United Kingdom United States 29%
United States Netherlands 14% Source: IMF CDIS data and authors’ calculations
6. Final remarks
According to the UNCTAD’s count, in 2018, 55 countries and economies introduced 112 policy measures affecting foreign investment – a decrease of more than 11 per cent over the previous year’s figure. Thirty-one of these measures related to new restrictions or regulations relevant to FDI, while 65 related to investment liberalization, promotion and facilitation. Accordingly, the proportion of more restrictive or
0% 20% 40% 60%
United States Netherlands
United Kingdom Luxembourg
China Hong Kong
Germany Italy
Mauritius France
Global 1st intermediary

14 Foreign direct investment – using network analysis to understand the position of Portugal in a global FDI network
more regulatory policy measures introduced soared from 21 per cent in 2017 to 34 per cent – an increase of more than 60 per cent. This ratio is the highest since 2003.
Our results are consistent with the Damgaard and Elkjaer (2017). According to these authors, The United States, Netherlands, and Luxembourg dominate the FDI network based on the CDIS. The network also reveals a very high degree of connectedness where most economies have FDI links vis-à-vis each other. Moreover, the authors conclude that some economies appear on the list of low-tax economies (Cyprus, Gibraltar, Jersey, and Mauritius) and Hungary similar to our results.
Despite the interesting results obtained so far we are aware of some limitations in this analysis and we have already identified avenues for future research and improvement. They include the following:
• Enlarging the time frame to better understand the behaviour of FDI and its main trends prior and after the global financial crisis. This will probably require combining multiple data sources.
• Creating a network analysis with only transactions data, instead of stocks.
• Conducting an in-depth analysis on the differences between direct and ultimate investors, comparing the results obtained until now with actual data on ultimate investors.
• Performing a cluster analysis for the global network of direct investment. Identifying groups of countries that have closer relations or common characteristics, will help to understand what motivates different countries to establish investment relations between them. Identifying main factors, such as proximity, language or culture.
• Analysing the impact that FDI has on the different economic sectors. Define what are the main targets of foreign investment, how have they changed over time and what is their impact for the economy.
From the above aspects, it is clear that a useful extension of this study can be conducted.
Nonetheless, from the results presented it is clear that network analysis tools present many advantages on the study of economic variables, especially when studying a large dataset with many agents. We have highlighted not only the visualisation capabilities of this methodology, but also its ability to apply metrics that provide useful information about economic relations. Therefore, in order to ensure the most efficient use of existing large data sets, without using other variables, network analysis presents itself as a tool to analyse, describe and present the results.
References
Akerman, A and A Seim (2014): “The Global Arms Trade Network 1950-2007”, Journal of Comparative Economics, volume 42, issue 3, 535 - 551.
Alstott, J, Triulzi, G and B Yan (2017). “Mapping technology space by normalizing patent networks”, Scientometrics 110, 443–479.
Amador, J and S Cabral (2016): “Networks of Value-Added Trade”, ECB Working Paper, number 1931. Retrieved from https://doi.org/10.1111/twec.12469.
Amador, J, Cabral, S, Mastrandrea, R and F Ruzzenenti (2018): "Who’s Who in Global Value Chains? A Weighted Network Approach". Open Economies Review, Springer, vol. 29(5), pages 1039-1059, November.
Amighini, A and S Gorgoni (2014): “The International Reorganisation of Auto Production”, The World Economy, volume 37, issue 7, 923 – 952.

Foreign direct investment – using network analysis to understand the position of Portugal in a global FDI network 15
Balance of Payments and International Investment Position Manual, 6th edition, International Monetary Fund.
Barabási, A (2016): “Network Science”, Cambridge University Press, 1st edition (August 5, 2016).
Battiston, S, Roukny, T, Stiglitz, J, Caldarelli, G and R May (2016): “The price of complexity”, Proceedings of the National Academy of Sciences USA 113, 10031–10036.
Damgaard, J and T Elkjaer (2017): “The Global FDI Network: Searching for Ultimate Investors”, IMF Working Paper, November 2017.
Damgaard, J, Elkjaer, T and N Johannesen (2019): “What Is Real and What Is Not in the Global FDI Network?”, IMF Working Paper, December 2019.
D’Errico, M and T Roukny (2017): “Compressing over-the-counter markets”, European Systemic Risk Board, Working Paper Series, No 44 / May 2017.
Fagiolo, G, Reyes, J and S Schiavo (2010): “The Evolution of the World Trade Web: A Weighted-network Analysis”, Journal of Evolutionary Economics, 20, 479-514.
Garlaschelli, D and M Loffredo (2005): “Structure and evolution of the world trade network”, Physica A: Statistical Mechanics and its Applications, volume 355, issue 1, 138 – 144.
Giovannetti, G, Marvasi, E and M Sanfilippo (2015): “Supply chains and the internationalization of small firms”, Small Business Economics 44 (4), 845–865.
Jackson, M (2010): “Social and Economic Networks”. Princeton: Princeton University Press.
Hidalgo, C, Klinger, B, Barabási, A-L and R Hausmann (2007): “The Product Space Conditions the Development of Nations”, Science 317(5837):482-7.
Hidalgo, C, Balland, P, Boschma, R, Delgado, M, Feldma, M, Frenken, K, Glaeser, E, He, C, Kogler, D, Morrison, A, Neffke, F, Rigby, D, Stern, S, Zheng, S and Z Shengjun (2018): “The Principle of Relatedness”, No 1830, Papers in Evolutionary Economic Geography (PEEG), Utrecht University, Department of Human Geography and Spatial Planning, Group Economic Geography.
Kali, R and J Reyes (2007): “The architecture of globalization: a network approach to international economic integration”, Journal of International Business Studies, volume 38, issue 4, 595 – 620.
Li, B, Liao, Z and L Sun (2018): “Evolution of FDI flows in the global network: 2003 – 2012”, Applied Economics Letters, volume 25, issue 20, 1440 – 1446.
Marvasi, E (2013): “The Sophistication of China’s Exports, Imports and Intermediate Products”, in Gomel, G, Marconi, D, Musu, I, and B Quintieri, editors, The Chinese Economy, pp. 181–209, Springer Berlin Heidelberg.
Marvasi, E, Giovannetti, G and G Ricchiuti (2015): “The Heterogeneity of Foreign Direct Investors: Linking Affiliates to Parent Productivity”, Working Papers – Economics, Universita degli Studi di Firenza.
Newman, M (2003): "Properties of highly clustered networks.", Physical Review E 68.2 (2003): 026121.
Newman, M (2006): "Modularity and community structure in networks.", Proceedings of the national academy of sciences103.23 (2006): 8577-8582.
Newman, M (2010): “Networks: An introduction”, Oxford: Oxford University Press.
OECD Benchmark Definition of Foreign Direct Investment - 4th Edition.
Page, L, Brin, S, Motwani, R and T Winograd (1999): “The PageRank Citation Ranking: Bringing Order to the Web”, Technical Report, Stanford InfoLab.

16 Foreign direct investment – using network analysis to understand the position of Portugal in a global FDI network
Ribeiro, A S, Pinheiro, F, Santos, F and A Polónia (2018): “Structural and temporal patterns of the first global trading market”, Royal Society Open Science 5(8):180577 · August 2018.
Rodrigues, E, Milic-Frayling, N, Smith, M and D Hanse (2011): “Group-in-a-box Layout for Multi-faceted Analysis of Communities”. Boston, MA, USA. IEEE Third International Conference on Privacy, Security, Risk and Trust.
Serrano, M and M Boguñá (2003): “Topology of the World Trade Web”, Physical review. E, Statistical, nonlinear, and soft matter physics. 68. 015101. 10.1103/PhysRevE.68.015101.
Schweitzer, F, Fagiolo, G, Sornette, D and F Vega-Redondo (2009): "Economic Networks: The New Challenges”. Science 325(5939):422-5.
Ter Wal, A L J and R A Boschma (2009): “Applying social network analysis in economic geography: framing some key analytic issues”, Annals of Regional Science, 43, 739–756.
World Investment Report) Special Economic Zones, UNCTAD, 2019.

Using network analysis to understand the position of Portugal in a global FDI network
Filipa Lima, Flávio Pinheiro, João Falcão Silva, Pedro Matos
Bridging measurement challenges and analytical needs of external statistics: evolution or revolution?
18 February 2020, Lisboa

How can the Foreign Direct Investment benefit from the network analysis?
2 18th February 2020

How can the Foreign Direct Investment benefit from the network analysis?
3 18th February 2020
0 10 000 20 000 30 000 40 000 50 000 60 000 70 000 80 000 90 000 100 000
China
Netherlands
Total
2011 2012
Inward Foreign direct investment – Portugal (M€)

How can the Foreign Direct Investment benefit from the network analysis?
’One picture is worth a thousand numbers’
4
PTCN NL
18th February 2020

How can the Foreign Direct Investment benefit from the network analysis?
’One picture is worth a thousand numbers’
5
PTCN NL??
FDI statistics
‘Immediate source of funding’
18th February 2020

How can the Foreign Direct Investment benefit from the network analysis?
’One picture is worth a thousand numbers’
6
PTCN NL??
FDI statistics
‘Immediate source of funding’
‘Controller’
18th February 2020

How can the Foreign Direct Investment benefit from the network analysis?
’One picture is worth a thousand numbers’
7
PTCN NL??
FDI statistics
‘Immediate source of funding’
‘Controller’
Network science offers a set of tools to facilitate the inference of relationships between different elements of a system
18th February 2020

Aim of the paper
• Illustrate how the use of network analysis tools can help to understand FDI country-country relationships:
• Inward stocks - 133 X 259 countries• Coordinated Direct Investment Survey
• Construct a global FDI network between 2009 and 2018
• Use the network analysis to predict theultimate direct investor and intermediaries
• Design the shortest paths between the immediate and ultimate direct investors
8 18th February 2020

Inward Direct Investment Positions (USD) [IIW_BP6_USD]
9 18th February 2020

Building the FDI global network
10
Negative-PositivePositive-Positive
Bilateral FDI Stocks
𝑓𝑓𝑖𝑖𝑖𝑖 𝑓𝑓𝑖𝑖𝑖𝑖 𝑓𝑓𝑖𝑖𝑖𝑖 𝑓𝑓𝑖𝑖𝑖𝑖
Problem: we have two directions and negative values. Can we simplify this data and still
retrieve useful insights on the FDI relationships between countries?
18th February 2020

Building the FDI global network
11
Negative-PositivePositive-Positive
Bilateral FDI Stocks
FDI Country Proximity
𝑓𝑓𝑖𝑖𝑖𝑖 + |𝑓𝑓𝑖𝑖𝑖𝑖|
𝑓𝑓𝑖𝑖𝑖𝑖 𝑓𝑓𝑖𝑖𝑖𝑖 𝑓𝑓𝑖𝑖𝑖𝑖 𝑓𝑓𝑖𝑖𝑖𝑖
18th February 2020

Building the FDI global network
12
FDI Country Proximity
𝑓𝑓𝑖𝑖𝑖𝑖 + |𝑓𝑓𝑖𝑖𝑖𝑖|𝑓𝑓𝑖𝑖𝑖𝑖 + |𝑓𝑓𝑖𝑖𝑖𝑖|
Countries with larger bilateral stock are closer, thus the weight of the link is heavier.
18th February 2020

Building the FDI global network
13
FDI Country Proximity
𝑓𝑓𝑖𝑖𝑖𝑖 + |𝑓𝑓𝑖𝑖𝑖𝑖|
FDI Country Distance
𝜙𝜙𝑖𝑖𝑖𝑖 =1
𝑓𝑓𝑖𝑖𝑖𝑖 + |𝑓𝑓𝑖𝑖𝑖𝑖|
𝑓𝑓𝑖𝑖𝑖𝑖 + |𝑓𝑓𝑖𝑖𝑖𝑖|
18th February 2020

Building the FDI global network
14
FDI Country Distance
𝜙𝜙𝑖𝑖𝑖𝑖 =1
𝑓𝑓𝑖𝑖𝑖𝑖 + |𝑓𝑓𝑖𝑖𝑖𝑖|
Countries with larger bilateral stock are closer, thus are at a shorter distance from each other.
Meaning, the weight of the link is lighter.
18th February 2020

Building the FDI global network
15
• The resulting network (G) is very dense
• For visualization we perform the following steps to generate a projection (Gp):
• Find the Minimum Spanning Tree, the set of edges with the minimum weight(sum of distances) that connect all nodes in the network;
• Afterwards add the edges with the lowest weights to reinforce visually which countries are closer and provide some structure to the network
• All network analysis are performed on G and visualized on Gp
18th February 2020

FDI Network, Graphical Representation
17
The Network provides a “proxy” metric between elements of a system, allowing to estimate paths and distances between its elements
A Node with highest betweenness centrality is one that participates as an “intermediary” in many paths.A Node with the highest closeness centrality is the one that is closer in average to all other nodes in the network
18th February 2020

Evolution of the Portuguese – China linkages
19
Shortest path between China and Portugal(2018)
Evolution of the shortest path between China and Portugal(2009-2018)
18th February 2020

How can the Foreign Direct Investment benefit from the network analysis?
18th February 202020
PT

How can the Foreign Direct Investment benefit from the network analysis?
21
PT
NL
18th February 2020

How can the Foreign Direct Investment benefit from the network analysis?
22
PTCN
NL
18th February 2020

How can the Foreign Direct Investment benefit from the network analysis?
23
PTCN
NL
UK
HK
18th February 2020

Network analysis to predict FDI linkages – TOP intermediaries in a global FDI network (2018)
24
0% 10% 20% 30% 40% 50% 60%
United States
Netherlands
United Kingdom
Luxembourg
China
Hong Kong
Germany
Italy
Mauritius
France Global 1st intermediary
18th February 2020

25 18th February 2020
Network analysis to predict FDI linkages – TOP intermediaries in a global FDI network (2018)
China Hong Kong
Germany United States
Japan United States
Portugal Netherlands
Russian Federation Cyprus
United Kingdom United States
United States Netherlands
85%
60%
85%
98%
96%
48%
24%
1st intermediary(share, %)
1st intermediaryInvestor

Conclusions and future work
• Network analysis present many advantages on the visualization capabilities and provide useful information about economic relations
• The 2009 and 2018 comparison shows that the countries with more FDI interconnections usually correspond to advanced economies, financial centres, and tax benefit countries
• Network science illustrates the enormous analytical power to predict the ultimate directinvestor and the path between the immediate/ultimate direct investor countries
• In the future … conduct an analysis on the differences between direct/ultimate investors, comparing the results (network analysis) with actual data on ultimate investors
26 18th February 2020

Foreign direct investment using network analysis to understand
the position of Portugal in a global FDI network
18 February 2020
Filipa Lima | Flávio Pinheiro | João Falcão Silva | Pedro [email protected] | [email protected] | [email protected] |

1/1
IFC Conference on external statistics "Bridging measurement challenges and analytical needs of external statistics: evolution or revolution?", co-organised with the Bank of Portugal (BoP) and the European Central Bank (ECB)
17-18 February 2020, Lisbon, Portugal
Differences in measuring FDI: do they matter for our economic conclusions?1
Konstantin M. Wacker,
University of Groningen
1 This presentation was prepared for the meeting. The views expressed are those of the author and do not necessarily reflect the views of the BIS, IFC, BoP, ECB or the central
banks and other institutions represented at the meeting.

Differences in measuring FDI: do they matter for our economic conclusions? 1
Differences in measuring FDI: do they matter for our economic conclusions?
Konstantin M. Wacker, University of Groningen, [email protected]
Abstract
In this paper, I use two FDI data sets on ultimate ownership and compare it to two traditional FDI data sets based on the direct/immediate ownership principle. I find those data sets to be highly correlated and leading to essentially identical economic conclusions when applied to a gravity model for FDI. While there are substantial country(-pair) peculiarities in certain cases, I argue that they have an economic interpretation and that future research should explore those differences across data sets rather than dismissing the quality of traditional FDI data.
Keywords: FDI, measurement, ownership data, gravity model
JEL classification: F2, E01
Contents
Differences in measuring FDI: do they matter for our economic conclusions? .............. 1
1. Introduction ....................................................................................................................................... 2
2. Data sources ...................................................................................................................................... 3
2.1 OECD data ................................................................................................................................ 3
2.2 IMF CDIS ................................................................................................................................... 3
2.3 Ultimate ownership estimates by Casella (2019) ...................................................... 3
2.4 Other data .................................................................................................................................. 4
2.5 Summary statistics and coverage ..................................................................................... 4
3. Descriptive relations between FDI data sets ......................................................................... 6
4. A gravity model for various FDI data sets .............................................................................. 8
4.1 Model setup ............................................................................................................................ 8
4.2 Estimation results .................................................................................................................. 8
4.3 Is there a pattern in the “outliers” and what can we learn from it? .................. 9
5. Conclusion ........................................................................................................................................ 12
References ................................................................................................................................................ 13

2 Differences in measuring FDI: do they matter for our economic conclusions?
1. Introduction
Foreign direct investment (FDI) accounts for about 29% of global cross-border liabilities and constitutes more than half of foreign financing in more than a third of the world’s countries. While FDI flows as a share of GDP more than quadrupled since the 1980s, the number of academic articles on the subject even increased at a faster pace, with a bulk of empirical studies examining determinants of FDI or its effects. 1
To what extent FDI data can be used as a proxy for multinational production has been heavily debated in the literature. Lipsey (2007, 2010) raises serious concerns about the use of FDI data because of the problem how to value assets of multinational firms, the intangible nature of most production generated by multinational corporations and the fact that even for the production of tangible products, important parts of the assets that enter production are intangible, especially financial assets. Technical measurement problems are also discussed, inter alia, in IMF (2004) and Linsi and Mügge (2019). Studies by Beugelsdijk et al. (2010) and Wacker (2016) corroborate those measurement problems but also stress that key data discrepancies are not due to ‘poor measurement’ but have an economically meaningful interpretation such as higher labor productivity or a capital-bias of multinational firms.
A number of recent contributions have furthered data concerns about FDI (e.g. Blanchard and Alcalin, 2016; Pastoris and Schmitz, 2019). Damgaard et al. (2019) claim that “phantom investment” with no substance and no real links to the local economy may account for almost 40 percent of global FDI. A common concern in these contributions is the round-tipping of FDI for pure tax evasion or financial reasons and the associated fact that a direct foreign owner needs not be identical to the ultimate owner.
Do we have to dismiss the bulk of empirical studies on FDI determinants and the associated economic insights because of those data problems? The increasing availability of bilateral direct and ultimate FDI data availability allows me to empirically address this question with the clear economic answer “No, but…”
In the following analysis, I use four bilateral FDI stock datasets for the year 2017 from OECD, the IMF CDIS, and UNCTAD (Casella, 2019), two of which record direct ownership relations while the other two record or estimate ultimate ownership status. I find that those datasets are highly correlated – with no correlation coefficient between all dataset pairs lower than 80%. I then apply a gravity model for FDI as motivated by Kleinert and Toubal (2010) and find that the estimated determinants of FDI are very similar across data sets – with no qualitative differences and only modest differences in magnitudes.
Because average statistical relationships can mask country(-pair) peculiarities, I then look at such idiosyncrasies and outliers and show them to be where one would expect. For example, Luxemburg and the Netherlands are much less important as an ultimate investor than the direct investor data suggest. This is consistent with the fact that a relevant part of FDI is channelled through these economies. Differences
1 Sources: Wacker (2013), Lane and Milesi-Ferretti (2017), Harms and Wacker (2019). Blonigen (2005)
provides an early survey on FDI determinants. For more recent studies, see the references in Schneider and Wacker (2020). Several influential studies on the determinants of multinational production have used affiliate sale data but often used FDI data at least in part of their analysis.

Differences in measuring FDI: do they matter for our economic conclusions? 3
between ultimate vs. direct investor relationships are thus not necessarily a sign of ‘poor data quality’. Rather, systematic analysis of such data discrepancies can potentially be helpful to understand firms’ financial and tax considerations in maximizing global corporate profits and to design according policies.
The remainder of this article is organized as follows: I first describe the data sources in section 2. Section 3 looks at descriptive correlation patterns across data sets. Section 4 applies the gravity estimation, compares results across data sets, and takes a closer look at residuals and outliers of those estimation. Section 5 concludes.
2. Data sources
This analysis compares four different data sets of bilateral FDI stocks: OECD data on direct/immediate and ultimate ownership, the ‘Coordinated Direct Investment Statistics’ (CDIS) on direct/immediate ownership prepared by the International Monetary Fund (IMF), and a novel UNCTAD data set on estimated ultimate FDI ownership prepared by Casella (2019). All data are for 2017 because this is the only year available from Casella (2019).
2.1 OECD data
The Organisation for Economic Co-operation and Development (OECD) provides inward FDI stocks by direct/immediate and ultimate investing country, based on statistics provided by 36 OECD member countries on the basis of the 4th edition of the ‘Benchmark definition of FDI’ (BMD4). An advantage of this data is the consistent data source for direct and ultimate FDI. Coverage of the data in terms of countries is limited, however.
2.2 IMF CDIS
The IMF’s Coordinated Direct Investment Statistics’ uses consistent definitions and best practices in collecting FDI stock data. CDIS data reporting templates have built-in validation tools for national compilers before they submit FDI data to the IMF. The IMF Statistics Department then uses ‘mirror data’ of reported FDI partners to check consistency of the bilateral data and reaches out to national compilers in case of large bilateral asymmetries in data reported by source and host country (see IMF, 2015, ch: 6, for details). The data are for direct/immediate bilateral ownership and thus do not trace back the ultimate investor.
Following standard convention, I focus on using the inward position of FDI, which is usually more reliable. After dropping all values that are marked as “confidential”, the CDIS allows to fill missing values with the ‘derived’ inward position from the ‘mirror data’.
2.3 Ultimate ownership estimates by Casella (2019)
To trace ultimate owners of bilateral FDI stocks, Casella (2019) has developed a probabilistic approach, based on absorbing Markov chains. This approach assigns a certain probability to each bilateral FDI stock either being ‘ultimate’ (i.e. no further

4 Differences in measuring FDI: do they matter for our economic conclusions?
direct investor than the one reported) or ‘transient’ (investing entity has a further direct investor). The underlying Markov chain converges to a final distribution of absorbing states, which serves as an estimate for ultimate ownership relations.
The data show the estimated percentage of FDI in a recipient country that is held by each ultimate investor. Those percentages are hence multiplied with the FDI inward stock of each country to obtain an estimate of the bilateral ultimate FDI positions.
2.4 Other data
For estimating the gravity model in section 4, I additionally use GDP data for investing and recipient economy, taken from United Nations (logarithm of current 2017 GDP in USD), the (logarithm of the population-weighted) distance between investing and recipient country, taken from the CEPII GeoDist database, relative skill endowments which are calculated as the logarithm of the ratio between the investor and recipient human capital index, taken from the Penn World Tables 9.1, and corporate tax rates, taken from KPMG. Further details are provided in Schneider and Wacker (2020).
2.5 Summary statistics and coverage
Table 1 presents summary statistics of the four FDI data sets, all of which are measured in current million US dollars. Given that the OECD data is limited on data received by their member countries, coverage in terms of observations is more limited. Since OECD members are usually high-income economies with respectable economic size, it is not surprising that the mean of FDI stocks in those countries is higher than for the IMF CDIS and UNCTAD samples, which include many developing and low-income economies. Because parent companies can have liabilities with their affiliates, it is possible and not uncommon to have negative stock observations, especially in bilateral data. This is not the case for the UNCTAD data because it applies the bilateral ultimate owner probabilities (which are bounded at 0) to overall inward stocks, which do not display any negative values.
I will focus on comparing the two OECD data sets on the one hand side and on comparing the CDIS to the UNCTAD data on the other hand. This is informative for two reasons. First, one would expect that comparing the OECD data ensures a minimum data standard and consistency across data sets. Differences between those data sets could thus be interpreted as mainly due to differences between direct and ultimate ownership. Second, the CDIS and UNCTAD data cover a much broader range of countries and are also based on very different data sets. While CDIS data are observed bilateral FDI stocks, the constructed UNCTAD data set is an estimate of bilateral ultimate ownership based on stochastic methods, multiplied with overall inward stock of FDI. Discrepancies between both data sets are hence expected to be much more driven by different accounting standards and potentially also measurement error, given that lower-income countries in those samples usually have lower statistical capacity.
To understand the joint coverage of those FDI data sets, Table 2 presents the number of overlapping observations. The OECD data sets offer 2,587 overlapping observations, while CDIS and UNCTAD contain 13,647 overlapping country pairs. This clearly emphasizes that sample coverage is very different.

Differences in measuring FDI: do they matter for our economic conclusions? 5
Summary statistics of FDI data sets (in mio. USD) Table 1
Data set Observations Mean Std.Deviation Min Max
OECD direct 6,207 4,152 35,462 -39,602 1,099,297
OECD ultimate 2,763 3,051 25,465 -1,580 614,865
IMF CDIS 25,417 1,556 20,051 -39,601 1,242,441
UNCTAD ultimate 23,544 1,316 17,952 0 985,444
Sources: own calculations based on data from OECD, IMF, and UNCTAD
Coverage of bilateral FDI data sets: number of observations Table 2
Data set OECD direct OECD ultimate IMF CDIS UNCTAD ultimate
OECD direct 6,207 2,587 4,997 4,833
OECD ultimate 2,763 2,294 2,146
IMF CDIS 25,417 13,647
UNCTAD ultimate 23,544
Sources: own calculations based on data from OECD, IMF, and UNCTAD

6 Differences in measuring FDI: do they matter for our economic conclusions?
3. Descriptive relations between FDI data sets
I start by looking at correlation coefficients across pairs of data sets, which are presented in Table 3. When looking at the OECD data sets of direct vs. ultimate ownership, the correlation coefficient equals 83%. I leave it to the reader to judge whether this is a high or low correlation, but it will be difficult to argue that both data sets measure completely different economic concepts. The correlation between the direct CDIS ownership data and the ultimate UNCTAD data is even higher, at 85%, even though both use different data and ownership concepts. The lowest pairwise correlation can be found between OECD’s ultimate investment data and the direct investment data of CDIS, but this correlation coefficient still equals 80%.
Correlation coefficients between bilateral FDI data sets Table 3
Data set OECD direct OECD ultimate IMF CDIS UNCTAD ultimate
OECD direct 1.00 0.83 0.99 0.87
OECD ultimate 1.00 0.80 0.93
IMF CDIS 1.00 0.85
UNCTAD ultimate 1.00
Sources: own calculations based on data from OECD, IMF, and UNCTAD
Such overall correlations can mask certain peculiarities. Figure 1 hence provides a scatter plot of the two OECD data sets. Observations on the upper left of the 45-degree line exhibit higher direct bilateral FDI stocks than their ultimate ownership relation would suggest. Not surprisingly, observations in this area where direct ownership deviates most from ultimate ownership include bilateral FDI positions that are booked as originating from tax-havens such as Luxemburg and the Netherlands in the direct FDI statistics but where the ultimate ownership of those countries is considerably smaller. In other words, this reflects that a considerable amount of FDI is channelled through those European tax havens. On the other end of the Figure 1 we see that the stock of FDI in Switzerland that is ultimately held by US investors is much larger than the bilateral direct FDI stock suggests. This suggests that a lot of US FDI in Switzerland is channelled via other countries and/or could also reflect that affiliates of US parent companies hold significant assets, probably of intangible nature, in Switzerland.

Differences in measuring FDI: do they matter for our economic conclusions? 7
Figure 1: direct vs. ultimate bilateral FDI stocks (OECD data)
Figure 2 repeats this exercise for the IMF CDIS stock of direct vs. the UNCTAD stock of ultimate ownership relationships. Among relationships where the direct CDIS data suggests much higher bilateral FDI positions than UNCTAD’s ultimate ownership data suggest, we find US FDI in Luxemburg and Netherlands and FDI from Luxemburg in the Netherlands. The latter is not too surprising as it possibly reflects multinationals’ channelling holding structures through various tax havens. Maybe more surprisingly, the discrepancy for US FDI suggests that a considerable part of FDI into the tax-havens Luxemburg and Netherlands gets channelled through the US. One reason to be explored in future research may be favourable financing conditions or accounting standards from multinationals’ corporate perspective in the US. On the other end of Figure 2 we observe that FDI from key US trading partners, UK, Japan, and Canada, into the US gets channelled via other countries.
Figure 2: direct CDIS vs. ultimate UNCTAD bilateral FDI stocks
Note: red dots indicate derived FDI positions from CDIS mirror data.

8 Differences in measuring FDI: do they matter for our economic conclusions?
4. A gravity model for various FDI data sets
Do the reported differences in bilateral FDI data sets lead to different conclusions about the key determinants of global FDI? In other words, how susceptible are econometric models of FDI determinants to different data sets? To explore this issue, I apply a standard gravity model for bilateral FDI positions on the four data sets. This model is motivated by ‘real’, as opposed to financial, motives of multinational firms. In other words, it captures the economic rationale of profit-maximizing firms to avoid the costs of exporting (horizontal, market-seeking motives) and explore factor price differences (vertical motives).
4.1 Model setup
Kleinert and Toubal (2010) have shown that horizontal and vertical motives in FDI lead to a standard gravity representation in the form:
𝐹𝐹𝐹𝐹𝐹𝐹 𝑠𝑠𝑠𝑠𝑠𝑠𝑠𝑠𝑠𝑠𝑠𝑠ℎ = 𝑏𝑏1𝑙𝑙𝑙𝑙𝑙𝑙𝐹𝐹𝑙𝑙𝑠𝑠 + 𝑏𝑏2𝑙𝑙𝑙𝑙 𝑙𝑙𝐹𝐹𝑙𝑙ℎ + 𝑏𝑏3ln (𝐹𝐹)𝑠𝑠ℎ + 𝑏𝑏4𝑅𝑅𝑅𝑅𝑠𝑠𝑅𝑅𝑠𝑠ℎ𝑡𝑡 + 𝑏𝑏5ln (𝑙𝑙𝐹𝐹𝑙𝑙𝑠𝑠 +𝑙𝑙𝐹𝐹𝑙𝑙ℎ) + 𝑢𝑢𝑠𝑠ℎ,
where subscripts s and h indicate source (investor) and host (recipient), respectively, D is distance and RSkE is a measure of relative skill endowment (as described in section 2.4). The derivation of Kleinert and Toubal (2010) is appealing because parameter hypotheses can be used to discriminate between vertical and horizontal FDI motives. For example, the vertical model suggests b4 > 0 and b5 > 0, whereas those parameters should be 0 in the horizontal model.2
Following the standard in the literature (Bénassay-Quéré et al., 2007; Kleinert and Toubal, 2010; Demi and Hu, 2016), this model is estimated using PPML.3 Accordingly, negative observations are dropped. The OECD data set is limited to bilateral observations where both, direct and ultimate FDI data exist, and similarly I restrict the CDIS and UNCTAD sample to observations where data from the respective other source is available. This ensures that differences in parameter estimates are not driven by sample composition effects.
4.2 Estimation results
Table 4 reports the results for the gravity estimation using the different FDI data sets. Qualitatively, estimates from all data sets are consistent with theory.4 The positive coefficients of recipient GDP and the negative coefficients for distance are
2 Strictly speaking, the model of Kleinert and Toubal (2010) is formulated for affiliate sales. The model and
hypotheses can be extended to FDI stocks, however, as long as affiliate sales are a sufficiently simple function of FDI stocks.
3 The inclusion of investor and recipient fixed effects was not possible because the maximum likelihood algorithm would not converge with those fixed effects. If anything, the omission of those fixed effects fosters the key message of this article because fixed effects would remove measurement issues particular to individual investing and recipient economies.
4 Remember that the goal of this exercise is not causal identification of structural gravity parameters but to demonstrate susceptibility of estimates with respect to different data sets.

Differences in measuring FDI: do they matter for our economic conclusions? 9
consistent with both, vertical and horizontal motives in FDI. The positive coefficient for investor GDP is consistent with a horizontal model of FDI, while the vertical model would suggest a unity (or positive) coefficient on relative skill endowment and a positive effect for the sum of GDPs, which can be found in all estimates (although the latter is not statistically different from 0 in all estimates).
With respect to quantitative magnitudes, there are some differences across data sets, e.g. the higher investor and recipient GDP elasticities for the ultimate ownership data of UNCTAD when compared to the IMF CDIS data or the elasticity for the sum of GDPs being double as large in the OECD’s ultimate ownership data when compared to the direct ownership data. One may disagree how relevant those differences are. But it is hard to argue that results from using ultimate investor statistics differ from traditional direct investor statistics to a degree that completely turns around our economic understanding of the key drivers for bilateral FDI positions. Finally, it is worth highlighting that the size of the estimated coefficient for recipient GDP shows no clear pattern when moving from direct to ultimate ownership data: it decreases for the OECD data but increases when moving from the CDIS to the UNCTAD data. This casts doubt on the finding of Damgaard et al. (2019) that this coefficient increases with ‘real’ (non-phantom) FDI data and their claim that standard FDI statistics systematically underestimate the real investment links between large economies because much of the investment being channeled through small offshore financial centers. However, a definite statement on this elasticity is difficult, as recipient GDP is also reflected in the sum of GDPs.
4.3 Is there a pattern in the “outliers” and what can we learn from it?
The econometric gravity model allows us to look at predicted FDI stocks and compare them to the actual data. Figure 3 thus plots this residual from the CDIS data set (column 3 in Table 4) against the FDI stock the model would predict. A handful of actual observations are much higher than the estimated gravity model would suggest. Again, they include investments into tax havens, such as Luxemburg and the Netherlands, often for FDI directly coming from the US. Anther outlier is FDI from Hong Kong, China into the Peoples’ Republic of China, a well-known case of FDI round-tipping.
Finally, we can also compare residuals from gravity models for direct ownership to those of ultimate ownership, which are depicted in Figures 4 (for OECD data) and 5 (for CDIS and UNCTAD data).5 The figures suggest that, for example, actual bilateral FDI stocks of Luxembourg in Switzerland and the US overshoot the model prediction much more for direct FDI data than for ultimate data. It is reassuring that this is consistent for the OECD data as well as when looking at the direct CDIS vs. the ultimate UNCTAD data (Figure 5). On the other hand, actual bilateral FDI stocks of Ireland in the US and of the US in Switzerland surpass model prediction much more for ultimate ownership than for direct ownership. The latter is consistent with the earlier descriptive evidence of US FDI in Switzerland potentially being channeled through various countries.
5 Note that the definition of residual is different to the definition in Figure 3: it is a deviance residual in
Figures 4 and 5 and the prefix is inverse.

10 Differences in measuring FDI: do they matter for our economic conclusions?
Gravity estimation results Table 4
VARIABLES OECD direct OECD ultimate IMF CDIS UNCTAD
ln(GDP investor) 0.307** 0.438*** 0.491*** 0.806***
(0.137) (0.0979) (0.0841) (0.0714)
ln(GDP recipient) 0.841*** 0.546*** 0.457*** 0.779***
(0.237) (0.211) (0.0858) (0.0805)
ln(distance) -0.668*** -0.478*** -1.049*** -0.716***
(0.140) (0.146) (0.0814) (0.0678)
Relative skill
endowment
2.804*** 2.677*** 0.684*** 0.482*
(0.634) (0.520) (0.206) (0.255)
ln(sum of GDPs) 0.322 0.717*** 0.390*** 0.217
(0.334) (0.266) (0.151) (0.132)
Constant -26.79*** -35.17*** -19.55*** -35.11***
(5.372) (5.354) (2.573) (2.521)
Observations 1,324 1,324 8,077 8,077
R-squared 0.158 0.180 0.168 0.288
Note: Robust standard errors in parentheses *** p<0.01, ** p<0.05, * p<0.1
Sources: estimation based on data from OECD, IMF, and UNCTAD

Differences in measuring FDI: do they matter for our economic conclusions? 11
Figure 3: Gravity residual vs. predicted value
Figure 4: Deviance residuals: direct vs. ultimate ownership (OECD)

12 Differences in measuring FDI: do they matter for our economic conclusions?
Figure 5: Deviance residuals: direct CDIS vs. ultimate UNCTAD ownership
Can we learn something from those residual patterns? On a global level, residual outliers from gravity models show FDI patterns that are difficult to justify with ‘purely real’ economic motives. Differences between direct and ultimate ownership in raw data and in model residuals provide some first evidence about global patterns of FDI round-tipping and multi-country investment chains. Future research could use those as a motivation to better understand the interaction of taxation, financing conditions, and accounting standards that lead to those global FDI networks beyond traditional motives for multinational production networks (e.g. ‘complex vertical FDI’ or ‘complex FDI complements’, see Antras and Yeaple, 2014).
Discrepancies are also important for individual country studies. For example, comparison of different FDI data sets suggest that about the 10-fold of ultimate Austrian FDI in Switzerland and Luxemburg is direct FDI from Austria in those countries with ultimate owners outside of Austria, while Austrian direct FDI in European tax havens like the Netherlands, Luxembourg, and Switzerland is about the threefold of what can be justified with real economic motives of a gravity model (see Wacker, 2020). Taken together, those numbers clearly suggest aggressive tax avoidance by multinationals originating from and/or being active in Austria.
5. Conclusion
Notwithstanding the skepticism about conventional direct-ownership data for foreign direct investment, this article documents that our picture of global bilateral FDI stocks and their key economic determinants does not substantially change if we use novel data on ultimate ownership. Researchers studying traditional FDI motives in bilateral data sets will usually do well when accounting for commonly known tax-haven and round-tipping patterns with bilateral fixed effects and/or excluding extremely small tax haven islands (see e.g. Schneider and Wacker, 2020).

Differences in measuring FDI: do they matter for our economic conclusions? 13
This is not to say that this new generation of FDI data and associated effort by data compilers will not be helpful. On the contrary, I argue that it is not the question which data is better but that a comparison of bilateral FDI positions across different ownership principles will give us additional insights about the spread of global FDI networks and the financing and tax-evasion strategies of multinational firms.
On a final note, my rather optimistic conclusion about the use of traditional direct FDI statistics refers to the study of ‘real’ FDI determinants that are motivated from trade theory (see e.g. Antràs and Yeaple, 2014) and mostly use variation across countries, in some form or another, to identify those determinants. Evidence by Blanchard and Acalin (2016) and Lane (2020) suggest that more care may be needed if one investigates FDI patterns over time, especially at higher frequency.
References
Antràs, Pol and Yeaple, Stephen (2014): “Multinational Firms and the Structure of International Trade.” In: Gopinath, Gita, Elhanan Helpman, and Kenneth Rogoff (eds.): Handbook of International Economics, Vol. 4, Amsterdam: North-Holland.
Bénassay-Quéré, Agnes, Maylis Coupet and Thierry Mayer (2007): “Institutional Determinants of Foreign Direct Investment.” World Economy 30(5): 764-782
Beugelsdijk, S., Hennart, J.-F., Slangen, A., and Smeets, R. (2010): “Why and how FDI stocks are a biased measure of MNE affiliate activity.” Journal of International Business Studies, 41(9):1444–1459.
Blanchard, Olivier and Julien Acalin (2016): What Does Measured FDI Actually Measure? PIIE Policy Brief 16-17, Peterson Institute for International Economics.
Blonigen, Bruce A. (2005): “A Review Of The Empirical Literature On FDI Determinants.” Atlantic Economic Journal, 33(4): 383-403.
Casella, Bruno (2019): “Looking through conduit FDI in search of ultimate investors – a probabilistic approach.” Transnational Corporations, 26(1): 109-146
Damgaard, Jannick, Thomas Elkjaer, and Niels Johannesen (2019): What Is Real and What Is Not in the Global FDI Network? IMF Working Paper 19/247, International Monetary Fund, Washington, DC.
Demir, Firat and Chenghao Hu (2016): “Institutional Differences and the Direction of Bilateral Foreign Direct Investment Flows: Are South–South Flows any Different than the Rest?” World Economy 39(2): 2000-2024.
Harms, Philipp and Konstantin M. Wacker (2019): “The special issue on FDI and multinational corporations: an introduction.” Economics: The Open-Access, Open-Assessment E-Journal, 13 (2019-24): 1–7.
IMF (2004): Foreign Direct Investment: Trends, Data Availability, Concepts, and Recording Practices. International Monetary Fund, Washington, DC. edited by Neil Patterson, Marie Montanjees, John Motala,and Colleen Cardillo.
IMF (2015), “Coordinated Direct Investment Survey Guide - 2015.” Technical report, International Monetary Fund.

14 Differences in measuring FDI: do they matter for our economic conclusions?
Lane, Philip R. (2020): The analytical contribution of external statistics: addressing the challenges. Keynote speech at the Joint European Central Bank, Irving Fisher Committee and Banco de Portugal conference on “Bridging measurement challenges and analytical needs of external statistics: evolution or revolution?” Lisbon, February 17, 2020.
Lane, Philip R. and Gian M. Milesi-Ferretti (2017): International financial integration in the aftermath of the global financial crisis. IMF Working Paper 17/115, International Monetary Fund, Washington, DC.
Linsi, Lukas and Daniel Mügge (2019): “Globalization and the growing defects of international economic statistics.” Review of International Political Economy. 26(3): 361-383.
Lipsey, Robert E. (2007): Defining and measuring the location of FDI output. NBER working paper 12996, National Bureau of Economic Research, Cambridge, MA.
Lipsey, Robert E. (2010): “Measuring the Location of Production in a World of Intangible Productive Assets, FDI, and Intrafirm Trade.” Review of Income and Wealth, 56(S1): 99-110
Pastoris, Fausto and Martin Schmitz (2019): Measuring and analysing direct investment in the presence of multinationals – insights from bilateral FDI between the US and the euro area. Paper presented at the 5th Mainz-Groningen Workshop on FDI and Multinational Corporations. Groningen, November 4, 2019.
Schneider, Sophie T. and Konstantin M. Wacker (2020): Explaining the global landscape of foreign direct investment: knowledge capital, gravity, and the role of culture and institutions. FIW Working Paper 194, Research Centre International Economics.
Wacker, Konstantin M. (2013): On the measurement of foreign direct investment and its relationship to activities of multinational corporations. ECB Working Paper 1614.
Wacker, K.M. (2016): “(When) Should We Use Foreign Direct Investment Data to Measure the Activities of Multinational Corporations? Theory and Evidence.” Review of International Economics, 24(5): 980-999.
Wacker, Konstantin (2020): Schein und Sein: Auslandsinvestitionen österreichischer Konzerne in Europas Steueroasen. A&W blog (accessed April 29, 2020): https://awblog.at/auslandsinvestitionen-oesterreichischer-konzerne/

Konstantin M. WackerUniversity of Groningen
@KM_Wacker
Differences in measuring FDI: do they matter for our economic conclusions?

| 2
Motivation
› Importance of FDI• 29% of global cross-border liabilities
• More than quadrupled as a share of GDP since 1980s
› Number of FDI-related articles grew even faster than actual FDI, with may empirical applications.
› Several studies critical on FDI as a measure for multinational production (Lipsey 2007, 2010; Beugelsdijk et al., 2010; Wacker, 2016).
› Most recent concern: round-tipping and actual ownership(Blanchard and Alcalin, 2016; Pastoris and Schmitz, 2019; Damgaard et al., 2019)

| 3
Research question and contribution
› Do we have to dismiss empirical evidence on FDI determinants once we use different data, accounting for ultimate instead of direct ownership?
› No!
• Very high correlation between data sets (>80%).
• No substantial differences in parameter estimates for gravity model.
› But…
• Average statistical relationships can mask country(-pair) peculiarities.
• Those peculiarities have an economic interpretation and are worth studying.

| 4
Data
› OECD inward FDI stocks (BDM4)
• direct/immediate investor
• ultimate investor
› IMF CDIS
• direct inward stock
• where confidential or missing, filled with derived stock
› UNCTAD ultimate investor estimate (Casella, 2019)
• based on absorbing Markov chain
• percentages multiplied with UNCTAD inward stocks
• limited to 2017

| 5
Data
› Gravity and control variables
• GDP (in USD, UN)
• distance (population-weighted, CEPII)
• relative skill endowment (PWT):
RSkE = ln(hcinvestor/hcrecipient)
• corporate tax rates (KPMG)

| 6
Coverage
Coverage of bilateral FDI data sets: number of observations
Data set OECD direct OECD ultimate IMF CDIS UNCTAD
ultimate
OECD direct 6,207 2,587 4,997 4,833
OECD ultimate 2,763 2,294 2,146
IMF CDIS 25,417 13,647
UNCTAD ultimate 23,544

| 7
Correlation between FDI data
Correlation coefficients between bilateral FDI data sets
Data set OECD direct OECD ultimate IMF CDIS UNCTAD
ultimate
OECD direct 1.00 0.83 0.99 0.87
OECD ultimate 1.00 0.80 0.93
IMF CDIS 1.00 0.85
UNCTAD ultimate 1.00

| 8
Correlation: OECD data

| 9
Correlation: CDIS vs. UNCTAD data

| 10
A gravity model of FDI
› Kleinert and Toubal (2010)
FDI stocksh = b1lnGDPs + b2ln GDPh + b3ln(D)sh + b4RSkEsht +b5ln(GDPs + GDPh) + ush
› Inference on parameters allows to distinguish between horizontal and vertical motives in FDI.
› Estimated using PPML.

| 11
FDI gravity model: resultsVARIABLES OECD direct OECD ultimate IMF CDIS UNCTAD
ln(GDP investor) 0.307** 0.438*** 0.491*** 0.806***
(0.137) (0.0979) (0.0841) (0.0714)
ln(GDP
recipient)
0.841*** 0.546*** 0.457*** 0.779***
(0.237) (0.211) (0.0858) (0.0805)
ln(distance) -0.668*** -0.478*** -1.049*** -0.716***
(0.140) (0.146) (0.0814) (0.0678)
Relative skill
endowment
2.804*** 2.677*** 0.684*** 0.482*
(0.634) (0.520) (0.206) (0.255)
ln(sum of GDPs) 0.322 0.717*** 0.390*** 0.217
(0.334) (0.266) (0.151) (0.132)
Constant -26.79*** -35.17*** -19.55*** -35.11***
(5.372) (5.354) (2.573) (2.521)
Observations 1,324 1,324 8,077 8,077
R-squared 0.158 0.180 0.168 0.288
Note: Robust standard errors in parentheses *** p<0.01, ** p<0.05, * p<0.1
Sources: estimation based on data from OECD, IMF, and UNCTAD

| 12
Outlier inspection (CDIS model)

| 13
Residuals: direct vs. ultimate investor model

| 14
Residuals: direct vs. ultimate investor model

| 15
Summary and conclusion
› On average, no key differences between FDI data sets that would change our picture of global FDI landscape.
› But substantial country(-pair) peculiarities.
› Those peculiarities have an economic interpretation.
• Better to put effort in understanding those peculiarities than principally dismissing aggregate FDI data.
• Difficult to ‘easily’ explain peculiarities with economic variables.
• Helpful to understand firms’ financial and tax considerations in profit maximization and to design according policies.

1/1
IFC Conference on external statistics "Bridging measurement challenges and analytical needs of external statistics: evolution or revolution?", co-organised with the Bank of Portugal (BoP) and the European Central Bank (ECB)
17-18 February 2020, Lisbon, Portugal
Asymmetries along the chain of round-tripping investment1
Krzysztof Makowski,
Narodowy Bank Polski
1 This presentation was prepared for the meeting. The views expressed are those of the author and do not necessarily reflect the views of the BIS, IFC, BoP, ECB or the central
banks and other institutions represented at the meeting.

Asymmetries along the chain of round-tripping investment 1
Asymmetries along the chain of round-tripping investment
Krzysztof Makowski, Department of Statistics, Narodowy Bank Polski
Abstract
Recent work on the ultimate investing country and ultimate host country presentation in the direct investment statistics, allowed to analyse the phenomenon of the round-tripping from the both perspectives of the investor and direct investment enterprise. By comparing data on round-tripping from those presentations some asymmetries were discovered which are a result of current recommendations laid down in the statistical manuals and the common practices stemming from local accounting practices and international financial reporting standards. The article presents the results of the analysis with most visible impact on the positions and potentially also on reinvested earnings. Statistical recommendations and the current compilation practice both in host/investor and intermediate countries are discussed. Finally, article proposes a way forward that would reduce round-tripping asymmetry and discusses implementation challenges.
Keywords: Asymmetries, Foreign Direct Investment, Round-tripping. Ultimate investing country
JEL classification: C82 (Methodology for Collecting, Estimating, and Organizing Macroeconomic Data; Data Access); F21 (International Investment; Long-Term Capital Movements)
Contents
Asymmetries along the chain of round-tripping investment ................................................ 1
1. Introduction ....................................................................................................................................... 2
2. International standards and the measurement of round-tripping ............................... 3
3. Round-tripping in Poland .............................................................................................................. 6
4. Way forward ........................................................................................................................................ 8
References .................................................................................................................................................. 8

2 Asymmetries along the chain of round-tripping investment
Working on asymmetries in the measurements allowed for the number of years to make statistics better. Up to now there where number of initiatives on comparison of mirror data on foreign direct investments like Angula and Hierro (2017) analysis based on Coordinated Direct Investment Survey (CDIS) or as a part of quality work in European communities (see e.g. Eurostat (2019)). The developments stemming from the fourth edition of OECD Benchmark Definition of FDI (BMD4) – the ultimate investing country presentation and ultimate host country presentation allowed to analyse different measures of the round-tripping. On the following pages author presents the theoretical foundations of the mismatch in the valuation of the round-tripping. It is then illustrated on the data for Poland. Finally, a way forward is proposed.
1. Introduction
Asymmetries in the data on portfolio and direct investment prompted recently research, like the one of Zucman (2013) analysing globally negative net investment position, that is situation where liabilities are greater than assets. One of the reasons for this negative net investment position was underreporting of the investment from wealthy countries into offshore financial centres. The other reasons cited also reporting errors. One top of that it should be also noted that international statistical manuals also allow for differences in measurement.
As regards the investment into offshore financial centres, as Daamgard et al. (2019) noted the value of investment going there is growing on higher pace than for the genuine investment or other types of investment as described by Lane and Millesi-Ferreti (2018). At the time when the use special purpose entities localised in certain countries is growing, the impact of the valuation and measurements is also expanding.
Generally, in the system of National Accounts the equity, the most relevant part of the direct investment, should be valued at the market prices. While many of the biggest companies are listed, still most direct investment entities have unlisted equity. Some guidance is provided for how to value equity, when the market value is not available but generally compilers have to rely on the accounting books of the companies.
It is usually an only option for valuation for countries hosting small companies established by direct investors for purposes of holding investment abroad, i.e. special purpose entities. First thing one should note, is the fact that still many of those countries does not compile data on direct investment. The Coordinated Direct Investment Survey (IMF, 2019) lists all their reporters and many countries hosting SPEs are not there. The others are challenged with the problem of showing their investment position as neutral from the point of view of those entities passing-through capital. If they have no real economic presence at the country, then their net investment position should be equal to zero. One of the solutions for Netherlands was described by Jellema (2019) where the assumptions on the e.g. zero net international investment position of those entities are taken a priori. This approach in a necessity for countries defined as conduits (channels) in the Garcia-Bernardo (2017) typography of countries used as offshore financial centres.

Asymmetries along the chain of round-tripping investment 3
Another issue to be considered for the countries hosting SPEs is their ability to track reinvested earnings along the chain of ownership. The international standards require to record in reinvested earnings undistributed profits from companies below in the chain of ownership, which might be difficult in the long chain of investments. Also, it would cause discrepancies if the value of equity remains at the book value.
On the following pages we will go into detail how those errors in measuring the round-tripping may arise.
2. International standards and the measurement of round-tripping
Both Balance of Payments and International Investment Position Manual – 6th edition (BPM6, IMF (2009), see par. 3.84 and 7.15 to 7.19) and OECD Benchmark Definition of Foreign Direct Investment – 4th edition (BMD4, OECD (2008), see: par. 298-303 and in more detail in annex 5, i.e. par. 516-535) are clear that the value of equity should be compiled at the market value. Due to fact that most of the equity is unlisted some guidance is provided on how to proxy for the market valuation. Among other methods the own funds at the book value (OFBV), i.e. the equity value from books of the direct investment entity is chosen as a reasonable approximation. This method is also put forward for unlisted equity in the CDIS compilation guide (IMF, 2015, see par. 3.12 and 3.13-3.16). Having the valuation at the OFBV is also good at reducing asymmetries due to fact that both counterparts are using in compilation the same books of the company and valuation. On the other hand, not all investment flows, especially not the reinvested earnings along the chain are reflected in the proper manner in the books of the investing company. This may lead to potential discrepancies.
The BMD4 introduced the ultimate investing country presentation as a supplemental data series to be provided by the compilers. This presentation shows the value of foreign direct investment, valued in the same way as in the traditional presentation, but attributed to the countries controlling the immediate direct investors. Also, in the BMD4 in the research agenda was laid down the discussion on the ultimate host country presentation, i.e. attribution of the investment abroad to the countries of ultimate host destinations. In the supplemental data series, the question of looking through SPEs abroad was discussed.
The ultimate investing country presentation gained some traction in the recent years with several countries presenting this data. Every one of them presented also the phenomenon of the round-tripping, i.e. investment originating from the same country that is reporting the figures. The value of round-tripping as a percentage of inward investment ranged from almost zero to fifteen, with the average of 5.6% for the 16 reporting countries, as presented in the OECD (2018).
For the ultimate host country presentation some problems were discovered, with collection of the necessary information from the companies abroad. Those difficulties were alleviated by concentrating on the investors controlled by the residents, which have decision centres locally. Therefore, one could also analyse the investment abroad by the resident-controlled companies according to ultimate host destinations. One could also observe that a part of investment goes to the same reporting country, that is that the round-tripping is also visible in those figures. Having those two

4 Asymmetries along the chain of round-tripping investment
measures of round-tripping from ultimate investing country and one from the ultimate host country one could make the comparison.
While the recent changes into international financing reporting standards (IFRS) introduced in IFRS 9 are encouraging users to have more valuations at the market values still for the most traditional form of equity investment the valuation in assets is according to the historical cost of acquisition. In case the equity investment is the only item on the asset side of the balance sheet the equity calculated as a residual value for investors is then tied to the valuation of the equity investment in assets. In this situation, even if historical acquisition cost is ruled out as a potential valuation (see par. 303 of the BMD4), due to fact that it is a proper valuation under IFRS and many of the local GAAPs, it also becomes the de facto valuation as it is reflected in the value of equity and then reported as OFBV.
Let us allow to analyse two base scenarios. In the first scenario after establishing an SPE, in the following period, there are only reinvested earnings in the production company. In the second scenario the sharing of profits via dividends is introduced. Author will show how the difference in value of round-tripping is introduced in each of those scenarios. There is an assumption that the reinvested earnings are perfectly recorded along the chain of investment, which is not necessarily true in practice. It makes the analysis more trackable. Absence of this assumption would introduce another discrepancy in the flows, while currently we would like to concentrate only on the positions.
In the first period the owner (resident) of the production facility valued at 100
establishes an SPE. At the end of the first period both the valuation of inward and outward investment is equal at 100. In the following period the production facility has earnings of 20 which are retained in the company. As the result for inward investment there are recorded reinvested earnings of 20 and stock at the end of 120. As for the SPE the value of their assets is unchanged (book value at historical acquisition cost) and as a result also the value of equity is unchanged at 100, which is also the value of investment abroad in the round-tripping.
Period I
Stock at the begining
Transactions (other than RE)
Reinvested earnings Other changes
Stock at the end
Outward 0 100 0 0 100SPE - inward 0 100 0 0 100SPE - outward 0 100 0 0 100Inward 0 100 0 0 100
Period II
Stock at the begining
Transactions (other than RE)
Reinvested earnings Other changes
Stock at the end
Outward 100 0 20 -20 100SPE - inward 100 0 20 -20 100SPE - outward 100 0 20 -20 100Inward 100 0 20 0 120

Asymmetries along the chain of round-tripping investment 5
As in the previous scenario, in the first period, the owner (resident) of the
production facility valued at 100 establishes an SPE. At the end of the first period both the valuation of inward and outward investment is equal at 100. In the following period, the production facility has earnings of 20, of which 15 is retained in the company, the remainder distributed as dividend. We assume that dividend is not distributed to the ultimate owner, which is usually the case, due to tax reasons. As the result for inward investment there are recorded reinvested earnings of 15, dividends of 5 and stock at the end of 115. As for the SPE the value of their equity investment in assets is unchanged (historical cost) but they also have the money from the dividend (5). The value of equity is equal to the sum of assets at 105, which is also the value of investment abroad. The net income of the SPE is equal to zero, as the credits are reinvested earnings of 15 and 5 in dividends, which due to retention are all reinvested earnings in the debits equal to 20.
In both scenarios the inward measure of round-tripping is bigger than the outward measure.
While the abovementioned scenarios are quite common across the round-tripping schemes, there are also some exceptions. First, losses if sustained by the operating company may drive the inward equity value lower than the historical value of acquisition by SPE. Second, the lower value of the outward investment might be a result of the external financing coming into the SPE. In this case inward investment is mirrored by both outward investment in round-tripping bur also external financing (often in the form of portfolio investment) of the SPE. Third, one must also remember that on the outward side the investors are often the natural persons which not always are fully covered in the compilation systems.
Above scenarios assumed that SPE countries are targeting the zero net international investment position of SPEs and the zero net income. In this case the foreign assets of SPEs are not recorded following the books of the direct investment entities as it would introduce the non-zero position and income, which would make macroeconomic figures for such a country rather difficult to interpret as those SPEs does not have (by definition) a significant economic presence in the country. Also, the high numbers of SPEs in some small countries, and their nature of being a “mail box” or a “brass plate” makes a collection of data from abroad on their direct investment entities and their income very burdensome.
Period I
Stock at the begining
Transactions (other than RE) RE Other changes
Stock at the end Dividends
Outward 0 100 0 0 100 0SPE - inward 0 100 0 0 100 0SPE - outward 0 100 0 0 100 0Inward 0 100 0 0 100 0
Period II
Stock at the begining
Transactions (other than RE) RE Other changes
Stock at the end Dividends
Outward 100 0 20 -15 105 0SPE - inward 100 0 20 -15 105 0SPE - outward 100 0 15 -15 100 5Inward 100 0 15 0 115 -5

6 Asymmetries along the chain of round-tripping investment
3. Round-tripping in Poland
Prior to the first publication of UIC data information on the round-tripping was only known from some case studies without knowledge of the scope of this investment form. From the first data (see NBP (2014)) on ultimate ownership a picture of relatively minor impact on inward investment with about 4-5% share in the stocks and from year to year in the neighbourhood of 6-8 position in the top investors. Applying the same value to the total outward position already signalled that Poland might be at the top of “outward” destinations. It was then confirmed with the first publication (see NBP (2019)) on UHC for the data at the end of 2017 for resident controlled entities investing abroad. Poland was indeed the number one destination for the investors in terms of value. Even when other resident companies would be included Poland as an ultimate destination would retain the top spot. One observation that was made is that the value of the outward round-tripping was smaller than for inward round-tripping. This observation was one of the motives for the current paper.
For the last few years the changes in the picture of round-tripping for Poland
involved only some changes in the residence of natural persons, which reduced slightly the number of companies that are ultimately controlled from Poland. The general picture is almost unchanged.
The major countries for round-tripping are Luxembourg, Cyprus and Netherlands. One should note already mentioned lower values on the outward side. The inward investment that is smaller than the inward for a certain country should be understood as a longer chain of SPEs which results in mismatch between inward and outward immediate counterpart.

Asymmetries along the chain of round-tripping investment 7
One could also analyse the round-tripping from the perspective of individual
investments. Each of the dots on the above graph represents single SPE chain used for round-tripping. On the vertical axis one finds the value of outward equity investment in SPE and on the horizontal value of the inward investment from the same SPE, both presented with logarithmic scales. Points that are below the 45-degree line are those for which inward valuation is higher than for outward. One should note the dots at the bottom of the graph which represent outward investments at the level of the minimum capital required the establish a SPE in some countries. Presented are both the cases of single SPEs structures and also chains involving multiple SPEs for largest companies. All the data are pooled from observations for years 2011-2018. At the end of 2018 there were 68 such cases with the value of investment measured at outward at 17,5 Bn, at inward at 31,1 Bn. For comparison in the outward round-tripping (i.e. ultimate host country presentation) 192 entities were involved with the investment of PLN 18,7 Bn and in inward round-tripping (i.e. ultimate investing country presentation) 680 SPEs investing and the valuation of PLN 38,5 Bn.
As a last remark this data comes from the data collected on the basis of regulations for balance of payments data collection. Data comes from the natural persons and residents whose foreign assets and liabilities are above the threshold of PLN 7 Mio for natural persons and PLN 10 Mio for companies. The companies (especially those involved internationally) are much more likely to be covered in the data collection. Also, a special purpose entity established a long time ago might not reflect the current valuation and be below the reporting threshold. As a result, we are aware that some of the reporters on the outward investment might be missing. On

8 Asymmetries along the chain of round-tripping investment
the other side the coverage of the wealthiest investors, which are the most significant in terms of value is relatively good.
From the data and studying in more detail most important cases there is a clear need to correct the value of the outward investment.
4. Way forward
One clearly sees that following the standards and common sense does not allow to have correct symmetrical measurement of the round-tripping from the perspective of the investor and host country.
The idea is to have a symmetrical measurement on both the outward and the inward side of the investment but also to maintain the current approach of some countries hosting SPEs that the SPE should have a zero net operational surplus and zero net investment position.
As a way forward we propose to adjust the outward investment to the values from the inward investment, which might not be a good idea when the SPE is both a holding company and the financial conduit for raising capital. Currently those roles are in different companies. The proposed approach would introduce deviation from the OFBV valuation from books of the direct investment enterprise of the immediate counterpart.
The other issue is regarding the bilateral asymmetry, while the current asymmetric treatment of round-tripping might not reflect bilateral asymmetries. First the exchange of data on round-tripping might be established so the countries hosting SPEs might adjust their data accordingly, even maintaining their zero net constraints.
On the other hand, ultimate investor and host presentation need not to be compared with the immediate counterparts but those ultimate investor and host countries. Therefore, comparing those presentations is a different exercise in bilateral asymmetries than one currently analysed for immediate counterparts. This approach also follows the recommendations from OECD Benchmark Definition to exclude resident SPEs from both the standard directional and ultimate presentations.
The data according to accounting standards are and will be in the future, the basis of data collection for external statistics. With some of the founding assumptions different in those systems there will be always a room for asymmetries unless those measures will start to converge.
References
• Angulo, E., Hierro, A. (2017), “Asymmetries in the Coordinated Direct Investment Survey: What Lies Behind?”, IMF Working Paper, WP/17/261
• Eurostat (2019), “Quality report on balance of payments (BOP), international trade in services (ITS) and foreign direct investment statistics (FDI) 2018 DATA”
• Damgaard, J., Elkjaer, T., Johannesen, N., (2019), “The Rise of Phantom Investments”, Finance & Development, 56 (3)

Asymmetries along the chain of round-tripping investment 9
• Garcia-Bernardo, J., Fichtner, J., Takes, F.W. et al. (2017), “Uncovering Offshore Financial Centers: Conduits and Sinks in the Global Corporate Ownership Network”. Sci Rep 7, 6246
• IMF (2009), “Balance of Payments and International Investment Position Manual – 6th edition”
• IMF (2019), “Coordinated Direct Investment Survey (CDIS)”, https://data.imf.org/CDIS
• IMF (2015), “Coordinated Direct Investment Survey Guide”
• Jellema, T., (2019), Preliminary Feedback on the IMF Task Force on Special Purpose Entities (TF-SPE) Definition, Discussion Paper, BOPCOM—19/21
• Lane, P. R., Milesi-Ferretti, G.M., (2018), “The External Wealth of Nations Revisited: International Financial Integration in the Aftermath of the Global Financial Crisis.” IMF Economic Review 66 (1), pp. 189–222
• NBP (2014), “Polskie i zagraniczne inwestycje bezpośrednie w 2012 r.”
• NBP (2019), „Zagraniczne inwestycje bezpośrednie w Polsce i polskie inwestycje bezpośrednie za granicą w 2017 roku”
• OECD (2008), “OECD Benchmark Definition of Foreign Direct Investment – 4th edition”
• OECD (2018), “FDI in Figures”, April 2018
• Zucman, G. (2013), “The Missing Wealth of Nations: Are Europe and the US net Debtors or net Creditors?", Quarterly Journal of Economics, 128(3), pp. 1321-1364

Krzysztof Makowski / Department of Statistics
Lisbon / February 18, 2020
Asymmetries along the chain of round-tripping
investment

■ Introduction
■ International standards and the measurement of round-tripping
■ Round-tripping in Poland
■ Way forward
Asymmetries along the chain of round-tripping investment 2
Contents

■ Asymmetries in data on portfolio and direct investment
■ Rising investment into offshore financial centres
■ Accounting guidelines for valuation of equity
■ International statistical standards
■ Net zero investment position and income in SPE countries?
Asymmetries along the chain of round-tripping investment 3
Introduction

■ Valuation of unlisted equity
■ BPM6 – par. 3.84, 7.15-7.19 – OFBV as proxy for market value
■ BMD4 – par. 298-303, 516-535 – OFBV as proxy for market value
■ CDIS compilation guide – par. 3.12-3.16 – OFBV to be used
■ OFBV good for analysis of asymmetries.
■ IFRS and local accounting practices on valuing equity participations
■ A fair value of investment is recommended
■ Usually original cost is used as there is no active markets
Asymmetries along the chain of round-tripping investment 4
International standards and the measurement of round-tripping (1)

■ Ultimate investing country and ultimate host country presentations may
have different valuations if accounting and statistical standards are followed
■ UIC – valuation at OFBV of the operating company
■ UHC – valuation at OFBV reflecting historical cost in assets of the holding
company
Asymmetries along the chain of round-tripping investment 5
International standards and the measurement of round-tripping (2)

Asymmetries along the chain of round-tripping investment 6
Example
Period I
Stock at the
begining
Transactions
(other than RE)RE Other changes
Stock at the
endDividends
Outward 0 100 0 0 100 0
SPE - inward 0 100 0 0 100 0
SPE - outward 0 100 0 0 100 0
Inward 0 100 0 0 100 0
Period II
Stock at the
begining
Transactions
(other than RE)RE Other changes
Stock at the
endDividends
Outward 100 0 20 -15 105 0
SPE - inward 100 0 20 -15 105 0
SPE - outward 100 0 15 -15 100 5
Inward 100 0 15 0 115 -5

Asymmetries along the chain of round-tripping investment 7
Example - illustration
Assets at
book
value(current
valuation)
Own
funds at
book
value(reflecting
current
valuation)
Assets at
book
value (historical
cost)
Own
funds at
book
value (reflecting
historical
cost)
Assets at
book
value
Own
funds at
book
value
PL SPE country PL
Round-tripping
in Inward FDI
Round-tripping
in Outward FDI
V
alu
e →

Asymmetries along the chain of round-tripping investment 8
Major routes for round-tripping in Polish FDI

Asymmetries along the chain of round-tripping investment 9
Inward and outward investment via SPEs abroad

Asymmetries along the chain of round-tripping investment 10
Way forward
■ Assumptions
■ a symmetrical measurement for both the outward and the inward side of the investment
■ SPEs should have a zero net operational surplus and zero net investment position
■ Adjust the outward investment via SPEs to the values from the inward investment
■ deviation from the OFBV valuation from books of the direct investment enterprise of the immediate counterpart.
■ Bilateral asymmetries
■ Exchange of data on round-tripping with pass-through countries
■ Ultimate investor and host presentations need not to be compared with the immediate counterparts
■ OECD Benchmark Definition recommendation to exclude resident SPEs from both the standard directional and ultimate presentations
■ Unless statistical standards and accounting standards start to converge there will be a room for asymmetries

www.nbp.pl
Narodowy Bank Polski
Krzysztof Makowski
Head of Division
Department of Statistics
phone: +48 22 185 13 30
mobile: +48 663 951 069
e-mail: [email protected]