IFC Volume 2 - International Finance Corporation
100
IFC’s COMMITMENT 2003 ANNUAL REPORT sustainability impact innovation INTERNATIONAL FINANCE CORPORATION WORLD BANK GROUP MANAGEMENT’S DISCUSSION AND ANALYSIS, FINANCIAL STATEMENTS, AND INVESTMENT PORTFOLIO VOLUME 2
-
Upload
khangminh22 -
Category
Documents
-
view
0 -
download
0
Transcript of IFC Volume 2 - International Finance Corporation

IFC’s COMMITMENT2003 ANNUAL REPORT
sustainabilityimpact
innovation
INTERNATIONAL FINANCE CORPORATIONWORLD BANK GROUP
MANAGEMENT’S DISCUSSION AND ANALYSIS, FINANCIAL STATEMENTS, AND INVESTMENT PORTFOLIO
VOLUME 2

INTERNATIONAL FINANCE CORPORATION
Since its founding in 1956, IFC has committed more than $37 billion of itsown funds and has arranged $22 billion in syndications for 2,990 compa-nies in 140 developing countries. IFC coordinates its activities with theother institutions in the World Bank Group—the International Bank forReconstruction and Development, the International DevelopmentAssociation, the Multilateral Investment Guarantee Agency, and theInternational Centre for Settlement of Investment Disputes—but is legallyand financially independent. Its 175 member countries provide its sharecapital and collectively determine its policies.
THE IFC ANNUAL REPORT ON THE WEB, www.ifc.org/ar2003,is a companion to this printed edition. It provides easy navigation anddownloading of data related to IFC investment projects.
IFC’S 2003 SUSTAINABILITY REVIEW is also available upon request.
CARLOS GOLDIN
Note: The regional reports, project listings, and other information on IFC operations during the 2003 fiscal yearappear in Volume 1 of the Annual Report.
The Corporation defines a commitment to include: (1) signed loan and equity (including quasi-equity) investmentagreements; (2) signed guarantee agreements; and (3) risk management facilities that are considered ready forexecution as evidenced by a signed ISDA agreement or a signed risk management facility agreement with a client.
Currency is given in U.S. dollars throughout unless otherwise specified.
COVER PHOTO: NIELS VESTERGAARD

1
INTERNATIONAL FINANCE CORPORATION World Bank Group
Innovation, Impact, SustainabilityIFC’S COMMITMENT
2 0 0 3 A N N U A L R E P O R T
V O L U M E 2
CONTENTS
MANAGEMENT’S DISCUSSION AND ANALYSIS 2
RESPONSIBILITY FOR EXTERNAL FINANCIAL REPORTING 23
FINANCIAL STATEMENTS 25
INVESTMENT PORTFOLIO 46

I. OVERVIEW International Finance Corporation (IFC or the Corporation) is an international organization, established in 1956, to further economic growth in its developing member countries by promoting private sector development. IFC is a member of the World Bank Group, which also includes the International Bank for Reconstruction and Development (IBRD or the World Bank), the International Development Association (IDA), and the Multilateral Investment Guarantee Agency (MIGA). It is a legal entity separate and distinct from the World Bank, IDA, and MIGA, with its own Articles of Agreement, share capital, financial structure, management, and staff. Membership in IFC is open only to member countries of the World Bank. As of June 30, 2003 IFC’s entire share capital was held by 175 member countries.
IFC’s principal products are loans and equity investments, with a small but growing guarantee portfolio. Unlike most multilateral development institutions, IFC does not accept host government guarantees. IFC raises virtually all of the funds for its lending activities through the issuance of debt obligations in the international capital markets, while maintaining a small borrowing window with the World Bank. Equity investments are funded from net worth. During the year ended June 30, 2003 (FY03), IFC had an authorized borrowing ceiling of $4.5 billion (including $1.0 billion to allow for possible prefunding of the funding program for the year to June 30, 2004 (FY04) during FY03).
IFC’s capital base and its assets and liabilities are primarily denominated in US dollars. The Corporation seeks to minimize market risk (foreign exchange and interest rate risks) by closely matching the currency, rate bases, and maturity of its liabilities in various currencies with assets with the same characteristics. The Corporation controls residual market risk by utilizing currency and interest rate swaps and other derivative instruments.
II. FINANCIAL SUMMARY
Basis of preparation of the Corporation’s financial statements The accounting and reporting policies of the Corporation conform to generally accepted accounting principles in the United States (US GAAP). The Corporation has traditionally prepared one set of financial statements and footnotes, complying with both US GAAP and International Financial Reporting Standards (IFRS). However, due to material differences between US Statement of Financial Accounting Standards (SFAS) No. 133, Accounting for Derivative Instruments and Hedging Activities, as amended by SFAS No. 138, Accounting for Certain Derivatives and Certain Hedging Relationships (collectively SFAS No. 133), which became effective for the Corporation on July 1, 2000, and its counterpart in IFRS, IAS No. 39, Financial Instruments Recognition and Measurement, which became effective for the Corporation on July 1, 2001, it is no longer possible for the Corporation to satisfy the requirements of both US GAAP and IFRS via one set of financial statements. IFC is actively monitoring developments related to accounting standards and the primary basis for preparation of its financial statements, all with a view to the necessary systems and controls to manage its various lines of business. IFC plans to resume presentation of its financial statements using IFRS by the year ending June 30, 2007. Unless stated otherwise, discussions of financial performance herein refer to operating income, which excludes the effects of adopting SFAS No. 133. The effects of SFAS No. 133 on net income are discussed in Section VII.
Financial performance summary
From year to year, IFC’s operating income is affected by a number of factors, principally the magnitude of provisions for losses against its loans, equity investments and guarantees; loans in nonaccrual status and recoveries of interest on loans formerly in nonaccrual status; and income (dividends and capital gains) generated from its equity portfolio. A significant part of IFC’s liquid assets portfolio is invested in fixed income securities, which are also subject to external market factors that affect the value of such securities, adding variability to operating income. Beginning in FY01, net income also includes unrealized gains and losses on financial instruments other than from trading activities, pursuant to the implementation of SFAS No. 133. IFC has been consistently profitable since its inception in 1956, and recorded operating income for FY03 of $528 million, as compared with $161 million for the year ended June 30, 2002 (FY02), and $241 million for the year ended June 30, 2001 (FY01). The $528 million of operating income in FY03 was a record high for the Corporation, reflecting contributions across each of IFC’s main business segments: loans, equities and treasury operations. The Corporation was able to record net income in FY03, including the effects of SFAS No. 133, of $487 million, as compared with $215 million for FY02 and $345 million for FY01.
2
Management’s Discussion & Analysis of Financial Condition and Results of Operations
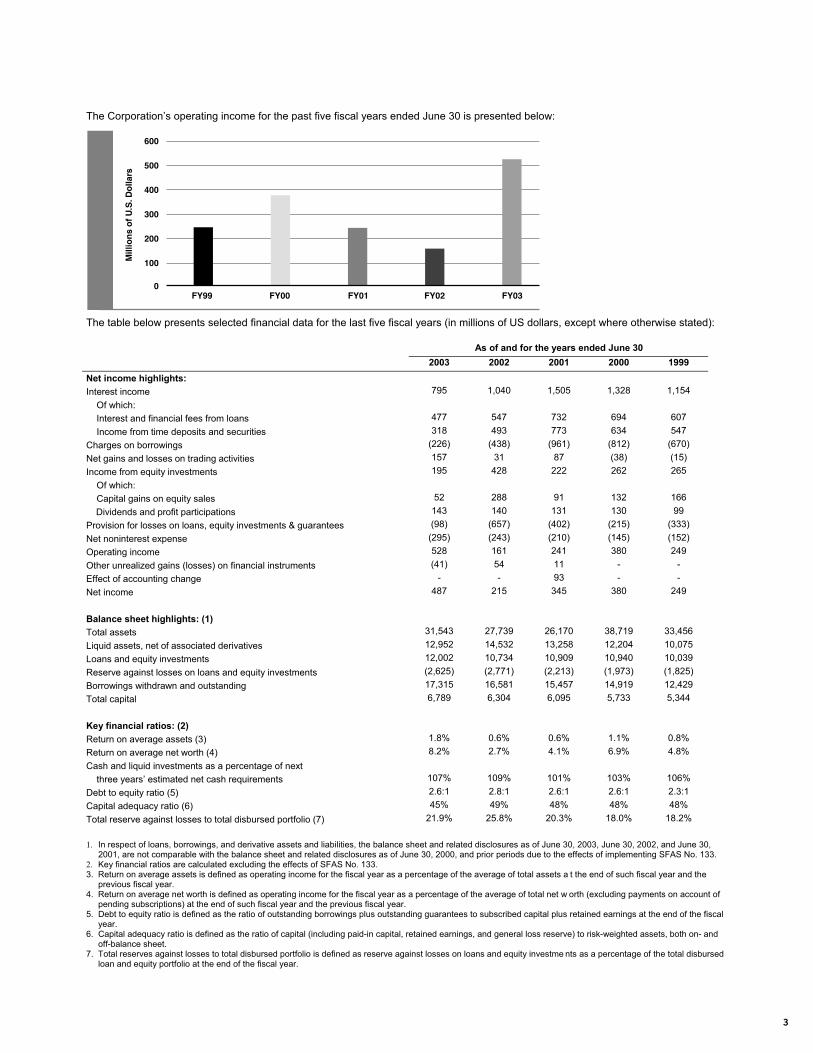
The Corporation’s operating income for the past five fiscal years ended June 30 is presented below:
The table below presents selected financial data for the last five fiscal years (in millions of US dollars, except where otherwise stated):
As of and for the years ended June 30
2003 2002 2001 2000 1999
Net income highlights:
Interest income 795 1,040 1,505 1,328 1,154
Of which:
Interest and financial fees from loans 477 547 732 694 607
Income from time deposits and securities 318 493 773 634 547
Charges on borrowings (226) (438) (961) (812) (670)
Net gains and losses on trading activities 157 31 87 (38) (15)
Income from equity investments 195 428 222 262 265
Of which:
Capital gains on equity sales 52 288 91 132 166
Dividends and profit participations 143 140 131 130 99
Provision for losses on loans, equity investments & guarantees (98) (657) (402) (215) (333)
Net noninterest expense (295) (243) (210) (145) (152)
Operating income 528 161 241 380 249
Other unrealized gains (losses) on financial instruments (41) 54 11 - -
Effect of accounting change - - 93 - -
Net income 487 215 345 380 249
Balance sheet highlights: (1)
Total assets 31,543 27,739 26,170 38,719 33,456
Liquid assets, net of associated derivatives 12,952 14,532 13,258 12,204 10,075
Loans and equity investments 12,002 10,734 10,909 10,940 10,039
Reserve against losses on loans and equity investments (2,625) (2,771) (2,213) (1,973) (1,825)
Borrowings withdrawn and outstanding 17,315 16,581 15,457 14,919 12,429
Total capital 6,789 6,304 6,095 5,733 5,344
Key financial ratios: (2)
Return on average assets (3) 1.8% 0.6% 0.6% 1.1% 0.8%
Return on average net worth (4) 8.2% 2.7% 4.1% 6.9% 4.8%
Cash and liquid investments as a percentage of next
three years’ estimated net cash requirements 107% 109% 101% 103% 106%
Debt to equity ratio (5) 2.6:1 2.8:1 2.6:1 2.6:1 2.3:1
Capital adequacy ratio (6) 45% 49% 48% 48% 48%
Total reserve against losses to total disbursed portfolio (7) 21.9% 25.8% 20.3% 18.0% 18.2%
1. In respect of loans, borrowings, and derivative assets and liabilities, the balance sheet and related disclosures as of June 30, 2003, June 30, 2002, and June 30, 2001, are not comparable with the balance sheet and related disclosures as of June 30, 2000, and prior periods due to the effects of implementing SFAS No. 133.
2. Key financial ratios are calculated excluding the effects of SFAS No. 133. 3. Return on average assets is defined as operating income for the fiscal year as a percentage of the average of total assets at the end of such fiscal year and the
previous fiscal year. 4. Return on average net worth is defined as operating income for the fiscal year as a percentage of the average of total net worth (excluding payments on account of
pending subscriptions) at the end of such fiscal year and the previous fiscal year. 5. Debt to equity ratio is defined as the ratio of outstanding borrowings plus outstanding guarantees to subscribed capital plus retained earnings at the end of the fiscal
year. 6. Capital adequacy ratio is defined as the ratio of capital (including paid-in capital, retained earnings, and general loss reserve) to risk-weighted assets, both on- and
off-balance sheet. 7. Total reserves against losses to total disbursed portfolio is defined as reserve against losses on loans and equity investments as a percentage of the total disbursed
loan and equity portfolio at the end of the fiscal year.
3
FY99 FY00 FY01 FY02 FY03
Mill
ion
s o
f U
.S. D
olla
rs
0
100
200
300
400
500
600

III. CLIENT SERVICES Business overview In partnership with private investors, IFC assists in financing the establishment, improvement, and expansion of private sector enterprises by making investments where sufficient private capital is not otherwise available on reasonable terms. IFC seeks to bring together domestic and foreign private capital and experienced management and thereby create conditions conducive to the flow of private capital, domestic and foreign, into productive investments in its developing member countries. In this way, IFC plays a catalytic role in mobilizing additional project funding from other investors and lenders, either through cofinancing or through loan syndications, underwritings, and guarantees. In addition to project finance (described below) and resource mobilization, IFC offers financial and technical advisory services to private businesses in developing member countries. It also advises member governments on private sector development matters.
IFC’s investments are normally made in its developing member countries. The Articles of Agreement mandate that IFC shall invest in productive private enterprise. The requirement for private ownership does not disqualify enterprises that are partly owned by the public sector if such enterprises are organized under local commercial and corporate law, operate free of host government control in a market context and according to profitability criteria, and/or are in the process of being totally or partially privatized.
The Corporation’s main investment activity is project financing. This encompasses “greenfield” projects, expansions, and modernizations. IFC also provides corporate credits to selected companies to finance ongoing programs of investment projects. In addition, the Corporation facilitates financing through financial intermediaries, covering project and general purpose lending and specialized lending products such as leasing, trade, and mortgage finance. These financial intermediaries function either as IFC’s borrower, on-lending to private sector companies at their own risk, or as IFC’s agent, identifying companies for direct loans from IFC. The Corporation applies stringent tests of enterprise soundness, project viability, and developmental impact in determining the eligibility of projects for its investments.
Investment process and portfolio supervision IFC’s investment process can be divided into six main stages:
The initial four stages are carried out under the responsibility of the Vice President, Investment Operations, while the fifth and sixth stages are overseen by the Vice President, Portfolio and Risk Management. The Corporation carefully supervises its projects to monitor project performance and compliance with contractual obligations and with IFC’s internal policies and procedures. IFC’s Board of Directors is informed of such matters and of recommended courses of action at regular intervals.
4
Identification & appraisal
Board approval
Document negotiation
Commitment Disbursement Supervision

5
Investment program summary Commitments In FY03, the Corporation entered into new commitments totaling $3.9 billion, including $0.4 billion of signed guarantees, compared with $3.1 billion (including $0.3 billion of signed guarantees) for FY02. Loan and equity investment commitments pending disbursement at June 30, 2003 were $3.5 billion ($3.4 billion at June 30, 2002). Guarantees and client risk management facilities committed but not utilized at June 30, 2003, were $0.9 billion ($0.7 billion at June 30, 2002). FY03 and FY02 commitments comprised the following:
Disbursements IFC disbursed $3.0 billion for its own account in FY03 ($1.5 billion in FY02). The strong level of disbursements in FY03, as compared to FY02 and FY01 ($1.5 billion), reflects the changed focus on the Corporation toward commitments as a measure of operational performance over the past two years, which has resulted in higher disbursement levels, particularly in FY03. In addition, in FY02 and FY01, the Corporation faced a difficult investment climate in the emerging markets in which it operates, together with a changing product mix from direct investment products such as loans and equity investments to off-balance sheet products such as guarantees. At June 30, 2003, IFC’s disbursed and outstanding loans and equity investments for its own account (disbursed investment portfolio) grew 12% to $12.0 billion ($10.7 billion at June 30, 2002).
Approvals In FY03 IFC approved new investments for its own account, including guarantees and client risk management facilities, totaling $4.0 billion, representing 186 projects, compared with $4.0 billion in FY02, representing 223 projects. In addition, IFC approved loan participations (B-loans) arranged to be placed with financial institutions (Participants) for loans approved by the Corporation’s Board of Directors totaling $1.5 billion in 27 projects in FY03 compared with $1.9 billion in 39 projects in FY02. FY03 and FY02 approvals comprised the following:
Approvals pending commitment for IFC’s own account at June 30, 2003, including guarantees and client risk management facilities, were $2.9 billion ($3.8 billion at June 30, 2002).
IFCFY03
ParticipantsFY03
IFCFY02
ParticipantsFY02
Mill
ion
s o
f U
.S. D
olla
rs
0
1,000
2,000
3,000
4,000 Guarantees & other
Quasi-equity
Equity
Loans
IFCFY03
ParticipantsFY03
IFCFY02
ParticipantsFY02
Mill
ion
s o
f U
.S. D
olla
rs
0
1,000
2,000
3,000
4,000 Guarantees & other
Quasi-equity
Equity
Loans

6
Disbursed investment portfolio The Corporation’s disbursed investment portfolio is widely diversified by sector and geographic region. The following charts show the distribution of the portfolio as of June 30, 2003 and June 30, 2002:
Distribution of disbursed portfolio by sector
Distribution of disbursed portfolio by geographic region
Disbursed B-loans The portfolio of disbursed and outstanding B-loans at June 30, 2003 totaled $6.1 billion in 224 transactions compared with $5.7 billion in 217 transactions at June 30, 2002. Additional information on IFC’s investment portfolio as of and for the years ended June 30, 2003 and 2002 can be found in Notes C, D and E to the Corporation’s FY03 financial statements.
Investment products
Loans Loans account for the major part of the financing provided by IFC, representing 77% of the Corporation’s disbursed investment portfolio as of June 30, 2003, as compared to 75% at June 30, 2002. Loans will generally have the following characteristics:
Term: typically amortizing with final maturities of up to 12 years Currency: primarily in major convertible currencies, principally US dollar, and to a lesser extent, Euro, Swiss franc and Japanese yen
Interest rate: fixed or variable
Pricing: reflects such factors as market conditions and country and project risks; variable rate loans are generally tied to the 6-
month LIBOR index in the relevant currency.
A B C D E F G H I J K L M N O
% o
f P
ort
folio
FY02
FY03
0
5
10
15
20
25
F–Nonmetallic mineral product manufacturing
G–Primary metals
H–Oil, gas, & mining
I–Information
J–Collective investment vehicles
A–Finance & insurance
B–Utilities
C–Transportation & warehousing
D–Food & beverages
E–Chemicals
K–Industrial & consumer products
L–Accommodation & tourism services
M–Textiles, apparel, & leather
N–Paper & pulp
O–Other
FY03 FY02
Latin American and Caribbean
Asia
Europe and Central Asia
Sub-Saharan Africa
Middle East and North Africa

7
Since the year ended June 30, 1999, IFC has offered local currency loan products to certain clients, provided the Corporation is able to hedge its local currency exposure through mechanisms such as cross-currency swaps or forward contracts. Fixed-rate loans and loans in currencies other than US dollars are normally transformed, using currency and/or interest rate swaps, into US dollar variable rate loans.
On June 30, 2003, total loans disbursed and outstanding were $9.2 billion ($8.0 billion at June 30, 2002). At June 30, 2003, 86% (89% at June 30, 2002) of the Corporation’s loans were US dollar-denominated. The currency composition of the loan portfolio at June 30, 2003 and 2002 is shown on the accompanying diagram:
Equity Equity investments accounted for 23% of the Corporation’s disbursed investment portfolio at June 30, 2003, as compared to 25% at June 30, 2002. IFC’s equity investments are typically in the form of common or preferred stock and are usually denominated in the currency of the country in which the investment is made.
Quasi-equity In addition to traditional equity investments, the Corporation provides financing through a variety of quasi-equity instruments, which constitute a growing portion of its investment portfolio. Quasi-equities include subordinated or convertible loans, asset-backed securities, mortgage-backed securities, and certain common or preferred shares with put and/or call features. Depending upon their characteristics, quasi-equities may be classified as either loans or equity investments in the Corporation’s balance sheet. At June 30, 2003, the Corporation’s disbursed and outstanding quasi-equity portfolio totaled $1,571 million ($1,342 million at June 30, 2002), of which $1,391 million was classified as loans ($1,157 million at June 30, 2002) and $180 million was classified as equity investments ($185 million at June 30, 2002) in the Corporation’s balance sheet.
Loan participations (B-loans) IFC finances only a portion, usually not more than 25%, of the cost of any project. All IFC-financed projects, therefore, require other financial partners. The principal direct means by which the Corporation mobilizes such private sector finance is through the sale of participations in its loans, known as the B-loan program. Through the B-loan program, IFC has worked primarily with commercial banks but also with non bank financial institutions in financing projects since the early 1960s. More than 194 commercial banks and institutional investors currently participate in IFC’s B-loan program. Whenever it syndicates a loan, IFC will always make a loan for its own account (an A-loan), thereby sharing the risk alongside its loan participants. IFC acts as the lender of record and is responsible for the administration of the entire loan, including the B-loan. IFC charges fees to the borrower at prevailing market rates to cover the cost of the syndication of the B-loan. Since it began its loan syndication program, IFC has placed participations totaling $21.5 billion.
Client risk management services IFC provides clients with access to asset and liability management tools such as currency swaps and interest rate swaps, caps and floors by acting as an intermediary between clients and market counterparties. IFC also provides risk-sharing structures and guarantees that allow its clients to transact directly with market counterparties.
Guarantees and partial credit guarantees Guarantees represent a growing product line for the Corporation. Beginning in FY01, the Corporation began offering partial credit guarantees to clients covering, on a risk-sharing basis, client obligations on bonds and/or loans. The Corporation’s guarantee is available for debt instruments and trade obligations of clients and covers commercial as well as noncommercial risks. IFC will provide local currency guarantees but generally only if the Corporation is able to fund its commitment in local currency terms, for example, by hedging its exposure in the swap market. Guarantee fees are consistent with IFC’s loan pricing policies. During FY03, the Corporation signed $0.4 billion of guarantees, as compared with $0.3 billion in FY02.
USdollars
Euro Othercurrencies
Total
Mill
ion
s o
f U
.S. D
olla
rs
FY03
FY02
0
2,000
4,000
6,000
8,000
10,000
8
Underwritings and investment banking services IFC provides underwriting and placement services for equity, quasi-equity, and/or debt securities issues of private sector companies in IFC’s developing member countries. It also structures and underwrites funds and pooled investment vehicles such as private equity investment funds. IFC is often a core investor in the enterprises it underwrites. Services are priced in conformity with market standards and practices, in consultation with international securities firms and financial intermediaries. Underwriting and other capital markets services requiring a financial commitment from IFC are subject to the same investment criteria and limits applicable to its loans and equity investments. The Corporation does not conduct any placement activities within the United States or directed at US investors in connection with securities offerings of private sector companies or pooled investment vehicles.
Advisory activities The Corporation, on its own or through a department jointly managed with the World Bank, provides three general types of advisory services to member countries as well as to individual enterprises:
Special advisory services on project structuring and financial packaging
Financial advisory services provided to member governments or to private sector clients
Policy advice to governments on capital markets development and private sector development, including privatization and foreign investment.
The Corporation also assists governments with developing the legal frameworks for privatizing their state-owned sectors, as well as with the sale of individual enterprises. Fees are charged for advisory services consistent with market rates charged for comparable services. IFC recorded such fees amounting to $51 million for FY03 ($40 million for FY02 and $41 million for FY01).
Specially targeted assistance IFC has established a number of vehicles through which it provides specially targeted assistance to areas highly in need of development. In FY03, the Corporation contributed $28 million to such vehicles, compared with $22 million in FY02 and $16 million in FY01. In FY03, such vehicles included:
The World Bank Group’s Global SME Capacity Building Facility, which funds partnerships and programs that support the core pillars of the World Bank Group’s Small and Medium-Sized Enterprise (SME) strategy.
The Private Enterprise Partnership, which provides focused technical assistance, with the goal of helping build successful private businesses in the former Soviet Union region.
The Corporation’s own Technical Assistance Trust Fund, which provides resources through which IFC can cofinance technical assistance being supported by donors.

9
IV. TREASURY SERVICES Liquid assets IFC invests its surplus liquidity in highly rated fixed and floating rate instruments issued by, or unconditionally guaranteed by, governments, government agencies and instrumentalities, multilateral organizations, and AAA-rated corporate issuers, including mortgage- and asset-backed securities, and in time deposits and other unconditional obligations of banks and financial institutions. The Corporation manages the market risk associated with these investments through a variety of hedging techniques including derivatives, principally currency and interest rate swaps and financial futures. IFC’s liquid assets are invested in four separate portfolios.
PORTFOLIO MARKET VALUE *
COMPRISING
MANAGED BY
INVESTED IN
BENCHMARK
P0 $0.4bn
($0.6bn)
Funds awaiting disbursement or reinvestment
IFC’s Treasury Department
Short-term deposits US overnight Fed funds
P1 $8.6bn
($10.0bn)
Proceeds from market borrowings
IFC’s Treasury Department
Principally global government bonds, asset-backed securities, and other AAA-rated corporate bonds generally swapped into 6-month US dollar LIBOR
Since January 2001, adjusted 3-month US dollar LIBID **. Prior to January 2001, 6-month US dollar LIBOR
P2 $3.0bn
($2.9bn)
Primarily the Corporation’s paid-in capital and accumulated earnings that have not been invested in equity and quasi-equity investments or fixed-rate loans
IFC’s Treasury Department
US Treasuries and other sovereign and agency issues
3-year duration US Treasuries***
P3 $1.0bn
($1.0bn)
Proceeds from market borrowings
External managers appointed by IFC
Global government bonds and mortgage-backed securities
Same as for P1
Total $13.0bn
($14.5bn) * at June 30, 2003 (June 30,2002)
** adjusted 3 month US dollar LIBID=US dollar LIBOR-12.5 basis points. The net duration of the P1 and P3 benchmarks is approximately 0.25 years.
*** duration of P2 portfolio plus fixed-rate loans
The P3 portfolio is not permitted to exceed 12% of the total value of liquid assets at any time.
All portfolios are accounted for as trading portfolios.
Beginning in FY01, the Corporation adopted a more flexible approach to managing the P1 portfolio by making investments on an aggregate portfolio basis against its benchmark within specified risk parameters. The P2 portfolio is also actively managed on an aggregate basis to its benchmark. In implementing these portfolio management strategies, the Corporation utilizes derivative instruments, futures, and options, and takes long or short positions in securities. All liquid assets are managed according to an investment authority approved by IFC’s Board of Directors and investment guidelines approved by IFC’s Finance and Risk Committee, a subcommittee of the Corporation’s Management Group.

10
Capitalization The Corporation’s capitalization as of June 30, 2003 and June 30, 2002 is as follows:
Borrowings The major source of IFC’s borrowings is the international capital markets. Under the Articles of Agreement, the Corporation may borrow in the public markets of a member country only with approvals from that member and also the member in whose currency the borrowing is denominated. The Corporation borrowed $3.5 billion during FY03 ($4.0 billion in FY02 and $3.6 billion in FY01). In addition, IFC’s Board of Directors has authorized the repurchase and redemption of and tender for debt obligations issued by the Corporation. During FY03, the Corporation repurchased and retired $116 million of outstanding debt ($186 million in FY02). IFC diversifies its borrowings by currency, country, source, and maturity to provide flexibility and cost-effectiveness. Outstanding market borrowings have remaining maturities ranging from less than one year to almost 30 years, with a weighted average remaining maturity of 10.5 years at June 30, 2003 (8.8 years at June 30, 2002).
Market borrowings are generally swapped into floating-rate obligations denominated in US dollars. As of June 30, 2003 the Corporation had gross payables from borrowing-related currency swaps of $9.3 billion ($10.2 billion at June 30, 2002) and from borrowing-related interest rate swaps in the notional principal amount of $7.3 billion ($7.1 billion at June 30, 2002). After the effect of these derivative instruments is taken into consideration, all of the Corporation’s market borrowings at June 30, 2003, and June 30, 2002, were US dollar-denominated.
The weighted average cost of market borrowings after currency and interest rate swap transactions was 0.9% at June 30, 2003 (1.8% at June 30, 2002).
Capital and retained earnings As of June 30, 2003 IFC’s net worth (presented as Total Capital in the Corporation’s balance sheet) amounted to $6.8 billion, up from the June 30, 2002 level of $6.3 billion.
As of June 30, 2003 and 2002, IFC’s authorized capital was $2.45 billion, of which $2.36 billion was subscribed at June 30, 2003, unchanged from June 30, 2002. Over 99% of this was paid in ($2.36 billion at June 30, 2002, and June 30, 2001). The Corporation has agreed to defer the payment dates for certain member countries. Pursuant to these arrangements, $2 million of subscribed shares remained unpaid at June 30, 2003, unchanged from June 30, 2002.
FY03 FY02
Borrowings from market sources
Borrowings from the World Bank
Paid-in capital
Retained earnings & other

11
V. ENTERPRISE RISK MANAGEMENT In executing its sustainable private sector development business, IFC assumes various kinds of risks. The Corporation’s management has defined a comprehensive enterprise risk management framework, within which it recognizes four main risk groupings: business risk, credit risk, financial risk, and operational risk. Active management of these risks is a key determinant of the Corporation’s success, its ability to maintain a stable capital and earnings base, and is an essential part of its operations. As part of its enterprise risk management framework, the Corporation has adopted several key financial and exposure policies and a number of prudential policies.
Business risk IFC defines business risk as the potential reputational, financial and other consequences of a failure to achieve its business mission and, in particular, its sustainable development mandate. The overall management of business risk is effected through the definition and implementation of an annual business strategy for meeting the Corporation’s mission and guidelines for its operations. The strategy is developed with Senior Management by the Operational Strategy Group, and is approved by the Board of Directors. The Operations Evaluation Group conducts ex post evaluation of the implementation of the Corporation’s strategy on an on-going basis. Business risk includes the risk incurred by IFC in exercising its environmental and social development framework in member countries. Responsibility for managing this part of business risk rests with the Environmental and Social Development Department. The key guiding principles and policies established as part of the framework for controlling business risk are as follows:
During FY03, IFC’s Environmental and Social Policies beca
Guiding principles for IFC’s operations Catalytic role: IFC will seek above all to be a catalyst in facilitating productive investments in the private sector of its developing member countries. It does so by mobilizing financing from both foreign and domestic investors from the private and public sectors. Business partnership: IFC functions like a business in partnership with the private sector. Thus, IFC takes the same commercial risks as do private institutions, investing its funds under the discipline of the marketplace. Additionality: IFC participates in an investment only when it can make a special contribution not offered or brought to the deal by other investors.
Environmental and social policies The Corporation has developed a comprehensive set of Guidelines and Safeguard Policies to promote environmentally and socially responsible private sector investments. Project sponsors are given the Safeguard Policies for environmental and social issues to review prior to conducting their assessments, as well as the environmental, health, and safety guidelines specific to the particular industry, sector, and type of project. When making investments, IFC applies its standards to the project and its performance is monitored against those standards. Projects are expected to comply with the applicable policies and guidelines, as well as applicable local, national, and international laws.
me widely recognized as best practice when twelve international commercial anks adopted them in the form of the Equator Principles.
redit risk
: g
nt, nment
uarantees of repayment on its investments and, therefore, incurs commercial and sovereign risk on its investments.
,
sts r assessments are subject to quarterly review, on a
mple basis, by the Portfolio Review Division of the Controller’s Department.
b
C IFC defines credit risk as the potential reduction in value of on- and off- balance sheet assets due to a deteriorating credit profile of its clients, the countries in which it invests, or a financial counterparty. Credit risk is incurred in two areas of the Corporation’s operations(i) in its investment operations, where IFC provides loans, equity investments, guarantees and derivatives for clients in its developinmember countries, and (ii) in its treasury operations, where credit risk is incurred with counterparties in its liquid asset investmeborrowing and asset-liability management activities. As part of its mandate, IFC is prohibited from accepting host goverg The Corporation’s Risk Management Group has oversight responsibility for overall credit risk management and, in addition, monitors and controls credit risk arising in IFC’s treasury activities. With respect to IFC’s credit risk exposures to clients in developing countriesthe Credit Review Department also plays a key role. At origination of new investments, the Credit Review Department analyzes information obtained from the investment departments and provides an independent review of the credit risk of the transaction. After commitment, the quality of IFC’s loan and equity investment portfolio is monitored according to supervision principles and procedures defined in the Operational Procedures. Responsibility for the day-to-day monitoring and management of credit risk in the portfolio re
ith the portfolio management units of individual investment departments. Theiwsa
Business RiskIFC Mission, Environment,
Social & Reputation
Operational RiskPeople, Systems
& Processes
EnterpriseRisk
Management
Financial RiskMarketing,Funding &Liquidity
Credit RiskClient,
Country &Counterparty

12
The Corporation’s investment portfolio is subject to a number of operational and prudential limits, including limitations on single project exposure, single country exposure, and segment concentration. Similarly, credit policies and guidelines have been formulated covering treasury operations; these are subject to annual revision by the Risk Management Group, and approval by the Finance and Risk Committee. Specifically, IFC has adopted the following key exposure policies:
FY03 credit risk highlights
Investment operations
1) IFC does not normally finance for its own account more than 25% of a project’s cost.
2) An equity investment in a company does not normally represent more than 35% of the company’s total share capital, provided further that IFC is not the single largest shareholder.
3) An investment in a single project or entity may not exceed 3% of IFC’s total investment portfolio.
4) Equity and quasi-equity investments in a single project or entity may not exceed 3% of the Corporation’s net worth plus general reserves.
5) Total investments in a single country will not normally represent more than 12% of IFC’s total investment portfolio or 25% of its net worth, whichever is lower.
6) The Corporation’s total exposure to a single risk sector may not exceed 8% of the total investment portfolio.
Treasury operations
1) Counterparties are subject to conservative eligibility criteria, currently restricted to banks and financial institutions with a minimum credit rating of A by leading international credit rating agencies.
2) Exposures to individual counterparties are subject to diversification caps. For derivatives, exposure is measured in terms of “worst case” potential exposure based on simulations of market variables. Institution-specific limits are updated monthly based on changes in counterparty size or credit status.
3) To limit exposure, IFC signs collateral agreements with counterparties that require the posting of collateral when net exposure exceeds certain predetermined thresholds, which decrease as a counterparty’s credit rating deteriorates.
4) Because counterparties can be downgraded during the life of a transaction, the agreements provide an option for IFC to terminate all swaps if the counterparty is downgraded below investment grade or if other early termination events occur that are standard in the market.
5) Limits are also imposed on the volume of over-the-counter derivative transactions with individual counterparties.
6) For exchange-traded instruments, IFC limits credit risk by restricting transactions to a list of authorized exchanges, contracts and dealers, and by placing limits on the Corporation’s open interest rate position in each contract.
IFC does not recognize income on loans where collectibility is in doubt or payments of interest or principal are past due more than 60 days unless management anticipates that collection of interest is expected in the near future.
The amount of nonaccruing loans as a percentage of the disbursed loan portfolio, a key indicator of portfolio performance, increased to 16.7% at June 30, 2003, compared with 15.2% at June 30, 2002. The principal amount outstanding on nonaccrual loans totaled $1,543 million at June 30, 2003, an increase of 27% from the June 30, 2002 level of $1,217 million. The quality of IFC’s investment portfolio stabilized during the first quarter of FY03 and the aggregate risk level improved slightly during the last nine months of the year. As a result, total reserves against losses on loans and equity investments at June 30, 2003, decreased to $2,625 million ($2,771 million at June 30, 2002). This is equivalent to 21.9% of the disbursed portfolio, below the historical high of 25.8% for the Corporation at June 30, 2002.
The five-year trend of loss reserves is presented below:
Given the Corporation’s limited history with financial guarantees, IFC is working under the assumption that the guarantee portfolio is exposed to the same idiosyncratic and systematic risks as IFC’s loan portfolio and the inherent, probable losses in the guarantee portfolio need to be covered by an allowance for loss. IFC also accrues anticipated losses associated with its guarantee portfolio. Beginning in FY01, the Corporation established such an allowance. The allowance at June 30, 2003, was $30 million ($29 million – June 30, 2002),
FY99 FY00 FY01 FY02 FY03
% o
f P
ort
folio
10
15
20
25
12.5
17.5
22.5
27.5

13
based on the year-end portfolio, and is included in payables and other liabilities on the balance sheet. The charge for the year, $1 million for FY03 ($16 million for FY02), is included in provisions for losses on loans, equity investments and guarantees in the income statement The Corporation has not suffered credit losses on its exposures to counterparties in its treasury operations.
Financial risk IFC defines financial risk in three components: (1) the potential inability to realize asset values in its portfolio sufficient to meet obligations to disburse funds as they arise (“liquidity risk”); (2) the potential inability to access funding at reasonable cost (“funding risk”); and (3) a deterioration in values of financial instruments or positions due to changes in market interest and exchange rates and the volatility thereof (“market risk”). Financial risk is managed by IFC’s Treasury Department, under oversight and monitoring by the Risk Management Group.
Key financial policies IFC currently operates under the following key financial policies, which have been approved by its Board of Directors:
1) Disbursed equity plus quasi-equity investments (net of loss reserves) may not exceed 100% of net worth. 2) Minimum liquidity (liquid assets plus undrawn borrowing commitments from the World Bank) must be sufficient at all times to
cover at least 65% of IFC’s estimated net cash requirements for the next three years.
3) The currency, rate basis, and maturity of loan assets must be closely matched to borrowings.
4) Capital (paid-in capital plus retained earnings plus general loss reserves) must equal at least 30% of risk-weighted assets.
In addition, under IFC’s Articles of Agreement, as long as IFC has outstanding borrowings from the World Bank, IFC’s leverage, as measured by the ratio of IFC’s debt (borrowings plus outstanding guarantees) to IFC’s equity (subscribed capital plus retained earnings), may not exceed 4.0 to 1.
Liquidity risk Within the key financial policies described above, in practice the Corporation maintains, as a prudential measure, an operating liquidity target of not less than 70% of three years’ net cash requirements, including projected disbursement and debt service requirements. The primary instruments for maintaining sufficient liquidity are the Corporation’s liquid asset portfolios. As already noted, IFC distinguishes four such portfolios: P0, which is generally invested in short-dated deposits reflecting its use for short-term funding requirements; P1 and P3, which are generally invested, directly or synthetically, in floating-rate US dollar instruments; and P2, which is generally invested in fixed-rate US dollar-denominated instruments.
FY03 liquidity risk highlights At June 30, 2003, the Corporation’s liquidity level stood at $13.0 billion, or 107% of its projected net cash requirements for three years ($14.5 billion, and 109% at June 30, 2002).
Funding risk
The Corporation’s primary objective with respect to managing funding risk is, through the adoption of, the key financial policies described above, to maintain its AAA credit rating and, thereby, access to funding, as required, at the lowest possible cost. Access to funding is maximized, and cost is minimized, by issuing debt securities in various capital markets in a variety of currencies, sometimes using complex structures. These structures include borrowings payable in multiple currencies, or borrowings with principal and/or interest determined by reference to a specified index such as a stock market index, a reference interest rate, a commodity index, or one or more foreign exchange rates.
FY03 funding risk highlights During FY03, the Corporation raised $3.5 billion of funding at sub-LIBOR rates, consistent with FY02.
Market risk The Corporation’s exposure to market risk is minimized by adopting the matched funding policy noted above and by using a variety of derivative instruments to convert assets and liabilities into 6-month floating rate US dollar assets and liabilities.
Investment operations Implementation of the matched funding policy is a two-step process: funds are earmarked at Board approval stage and matched, with respect to interest rate and currency, at disbursement. Interest rate and currency exchange risk associated with fixed rate and/or non-US dollar lending is hedged via currency and interest rate swaps that convert all cash flows into variable rate US dollar flows.

14
Exposures to market risk resulting from derivative transactions with clients, which are intended to facilitate clients’ risk management, are minimized by entering into offsetting positions with highly rated market counterparties.
Liquid asset portfolios Consistent with the matched funding policy, the P0, P1 and P3 portfolios are strictly managed to variable rate USD dollar benchmarks, on a portfolio basis. To this end, a variety of derivative instruments are used, including short-term, over-the-counter foreign exchange forwards (covered forwards), interest rate and currency swaps, and exchange-traded interest rate futures and options. The Corporation also takes both long and short positions in securities in the management of these portfolios to their respective benchmarks. The primary source of market risk in the liquid asset portfolios is the P2 portfolio, which, in contrast, is managed to a three-year duration US dollar benchmark, with additional flexibility to deviate from the benchmark. P2 represents the portion of IFC’s capital not disbursed as equity investments, and the benchmark reflects the chosen risk profile for this uninvested capital.
Borrowing activities Market risk associated with fixed rate obligations and structured instruments entered into as part of the Corporation’s funding program is mitigated by using derivative instruments to convert them into variable rate US dollar obligations, consistent with the matched funding policy.
Asset-liability management While IFC’s matched-funding policy provides a significant level of protection against currency and interest rate risk, the Corporation can be exposed to residual market risk in its overall asset and liability management. This residual market risk is monitored by the Asset-Liability Management group within the Treasury Department. Residual currency risk arises from events such as changes in the level of non-US dollar loan loss reserves. This risk is managed by monitoring the aggregate position in each lending currency and hedging the exposure when the net asset or liability position exceeds $5 million equivalent, through spot sales or purchases. Residual interest rate risk may arise from two sources:
Assets that are fully match-funded at inception, which can become mismatched over time due to write downs, prepayments, or rescheduling; and
Differing interest rate reset dates on assets and liabilities.
This residual risk is managed, first, by synchronizing interest rate reset dates on assets and liabilities at a portfolio level; and secondly by measuring the sensitivity of the present value of assets and liabilities in each currency to each basis point change in interest rates, with a review trigger of $50,000 on this measure.
FY03 market risk highlights Currency translation gains for FY03, were $8 million ($1 million loss in FY02 and $4 million loss in FY01). Net gains on liquid asset trading activities were $157 million ($31 million in FY02 and $87 million in FY01), of which $136 million was attributable to the P2 portfolio ($45 million in FY02 and $76 million in FY01).
Operational risk IFC defines operational risk as the potential for loss resulting from events involving people, systems and processes. These include both internal and external events, whether caused by a lack of controls, documentation, or contingency planning, or by breakdowns in information systems, communications, physical safeguards, business continuity, supervision, transaction processing, or in the execution of legal, fiduciary, and agency responsibilities. As such, operational risk covers the risks emanating from the manner in which an entity is operated as opposed to the way it is financed. Consistent with the Basel II Capital Adequacy guidelines, IFC is developing a matrix framework to analyze operational risk by identifying, for each area (people, systems and processes), which risks IFC will: (i) manage internally, as part of its ongoing business; (ii) alleviate through contingency planning; or (iii) insure externally, whether by sub-contracting, outsourcing or hedging, including insurance. Responsibility for the development of the framework for managing and monitoring operational risk, and for contingency planning for recovery from emergencies, rests with the Controller’s Department. In respect of insurable operational risk, IFC’s Insurance Services Group performs insurance reviews to identify the risks and assess the adequacy of existing insurance policies and limits.

15
IFC seeks to mitigate the risks it manages internally by maintaining a comprehensive system of internal controls that is designed not only to identify the parameters of various risks but also to monitor and control those areas of particular concern. Key components of this effort are:
Key components of operational risk management
The Corporation has adopted the COSO1 control framework and a control self-assessment methodology to evaluate the
effectiveness of its internal controls in people, systems and processes, and it has an ongoing program in place to cover all significant business operations. In addition, the COBIT
2 methodology is used to supplement the COSO review of the information
technology function.
The Internal Audit Department of the World Bank Group performs on-going independent review of the effectiveness of IFC’s internal controls in selected key areas and functions.
To promote data integrity, the Corporation has formulated a Data Management Policy. The policy is enforced through a network of Departmental Data Stewards. The Corporation has established a New Products/Initiatives Assessment Group, with representation from key business and support functions, to ensure that processes and controls are in place to manage the risks in new products and initiatives, before they are executed.
1 COSO refers to the Internal Control - Integrated Framework formulated by the Committee of Sponsoring Organizations of the Treadway Commission, which was convened by the US Congress in response to the well-publicized irregularities that occurred in the financial sector during the late 1980s.
2 COBIT refers to Control Objectives for Information and Related Technology, first released in 1996, updated to the 3rd edition released in July 2000, sponsored by the Information Systems Audit and Control Association (ISACA).
FY03 operational risk highlights IFC continues to focus on its preparedness to react to an emergency situation that disrupts its normal operations. During FY03, the
ing key business activities
simulation, to test the adequacy of its contingency planning and enhance the preparedness of its emergency management team.
p enhanced methodologies for measuring, monitoring and
rm an in-depth review of internal business processes and develop and
potential areas of exposure to operational risk in investment processes and
mmendations from this exercise in the area of portfolio supervision, on a selective “proof of concept” basis for evaluation.
Corporation has:
extended the scope of the back-up facilities available for its key systems;
commenced the deployment of computing facilities to the homes of staff considered essential to maintainin the event that the headquarters building becomes unavailable for use in an emergency situation; and
undertaken an emergency response
The Corporation is continuing a multi-year effort to analyze and develomanaging operational risk in its key activities. During FY03, IFC has:
Adopted a more formal and analytical approach for reviewing the potential for operational risk in business;
Formed a team to work with relevant departments to perfoimplement operational risk management methodologies;
Undertaken a process mapping exercise to identifyprovide a basis for quantifying potential risks; and
Following review by Senior Management, begun implementing reco

16
VI. CRITICAL ACCOUNTING POLICIES The Notes to the FY03 financial statements contain a summary of the Corporation’s significant accounting policies, including a discussion of recently issued accounting pronouncements. Certain of these policies are considered to be “critical” to the portrayal of the Corporation’s financial condition, since they require management to make difficult, complex or subjective judgments, some of which may relate to matters that are inherently uncertain. These policies include determining the level of the allowance for losses in the loan and equity investment portfolios, and valuation of certain financial instruments with no quoted market prices. Additional information about these policies can be found in Notes A, C and M to the FY03 financial statements.
Reserve against losses on loans and equity investments The Corporation considers a loan as impaired when, based on current information and events, it is probable that the Corporation will be unable to collect all amounts due according to the loan’s contractual terms. The reserve against losses for impaired loans reflects management’s judgment of the present value of expected future cash flows discounted at the loan’s effective interest rate. The Corporation establishes a reserve against losses for equity investments when a decrease in value of the investments has occurred which is considered other than temporary. The reserve against losses for loans and equity investments includes an estimate of probable losses on loans and equity investments inherent in the portfolio but not specifically identifiable. The reserve is established through periodic charges to income in the form of a provision for losses on loans and equity investments. Investments written off, as well as any subsequent recoveries, are recorded through the reserve. The assessment of the adequacy of total reserves against losses for loans and equity investments is highly dependent on management’s judgment about factors such as geographical concentration, industry, regional and macroeconomic conditions, and historical trends. The reserve against losses on equity investments also considers the management quality of the investee company and its financial condition. Due to the inherent limitation of any particular estimation technique, management utilizes three different and independent methods to provide estimates for the total loss reserve balance: (1) a simulation model, (2) country risk ratings and probability of crisis associated with those risks, and (3) a model of the Corporation’s long-term historical portfolio experience. Changes in these estimates could have a direct impact on the provision and could result in a change in the reserve balance. The reserve against losses on loans and equity investments is separately reported in the balance sheet as a deduction of the Corporation’s total loans and equity investments. Increases or decreases in the reserve level are reported in the income statement as provision for losses on loans, equity investments and guarantees. The reserve against losses on loans and equity investments relates only to the Client Services segment of the Corporation (see Note O to the FY03 financial statements for further discussion of the Corporation’s business segments).
Valuation of financial instruments with no quoted market prices As part of its compliance with SFAS No. 133, the Corporation reports at fair value all of its derivative instruments and certain borrowings that the Corporation has designated as components of fair value hedges. In addition, certain features in various loan agreements, equity investment agreements, and borrowing contracts contain embedded derivatives that, for accounting purposes, are separately accounted as either derivative assets or liabilities, including puts, caps, floors, and forwards. Few of these instruments have a ready market valuation. Therefore, the fair values of the financial instruments with no quoted market prices are estimated using sophisticated pricing models of the net present value of estimated future cash flows. Management makes numerous assumptions in developing the pricing models, including the appropriate discount rates, interest rates, and related volatility and expected movement in foreign currency exchange rates. Changes in assumptions could have a significant impact on the amounts reported as assets and liabilities and the related gains and losses reported in the income statement. The fair value computations affect both the Client Services and Treasury segments of the Corporation (see Note O to the FY03 financial statements for further discussion of the Corporation’s business segments). Additional information can be found in Notes A and M to the FY03 financial statements.
17
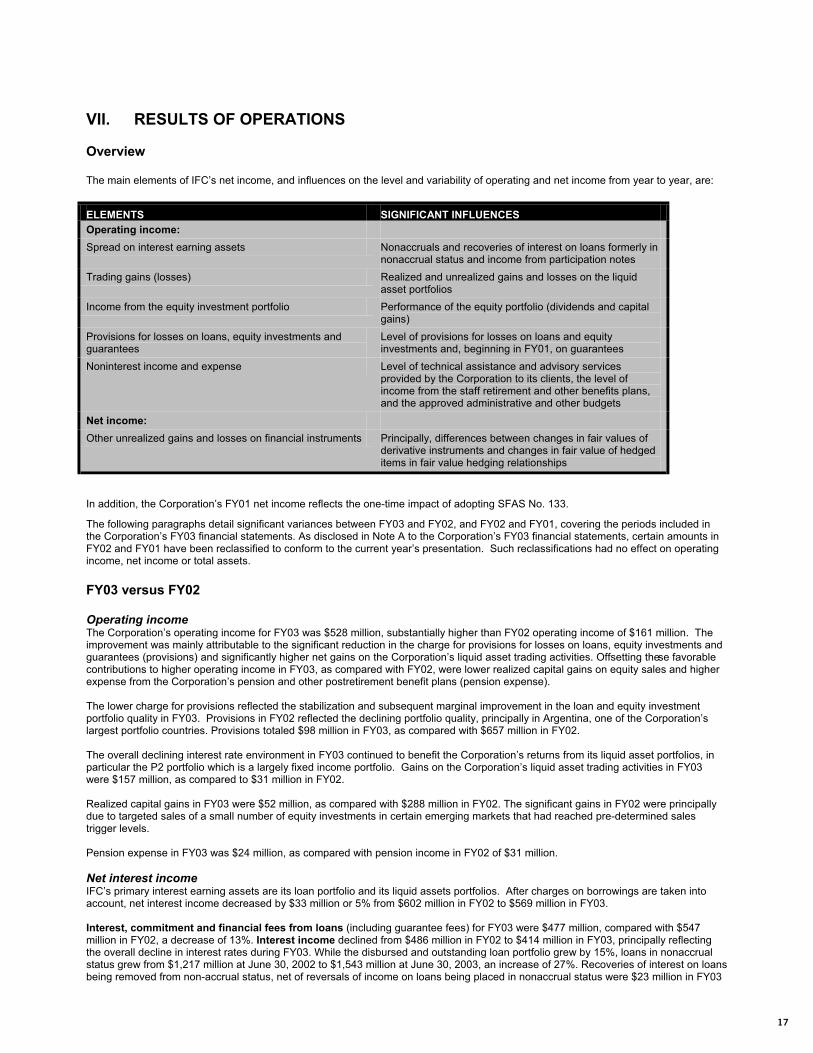
VII. RESULTS OF OPERATIONS Overview The main elements of IFC’s net income, and influences on the level and variability of operating and net income from year to year, are:
ELEMENTS SIGNIFICANT INFLUENCES
Operating income:
Spread on interest earning assets Nonaccruals and recoveries of interest on loans formerly in nonaccrual status and income from participation notes
Trading gains (losses) Realized and unrealized gains and losses on the liquid asset portfolios
Income from the equity investment portfolio Performance of the equity portfolio (dividends and capital gains)
Provisions for losses on loans, equity investments and guarantees
Level of provisions for losses on loans and equity investments and, beginning in FY01, on guarantees
Noninterest income and expense Level of technical assistance and advisory services provided by the Corporation to its clients, the level of income from the staff retirement and other benefits plans, and the approved administrative and other budgets
Net income:
Other unrealized gains and losses on financial instruments Principally, differences between changes in fair values of derivative instruments and changes in fair value of hedged items in fair value hedging relationships
In addition, the Corporation’s FY01 net income reflects the one-time impact of adopting SFAS No. 133.
The following paragraphs detail significant variances between FY03 and FY02, and FY02 and FY01, covering the periods included in the Corporation’s FY03 financial statements. As disclosed in Note A to the Corporation’s FY03 financial statements, certain amounts in FY02 and FY01 have been reclassified to conform to the current year’s presentation. Such reclassifications had no effect on operating income, net income or total assets.
FY03 versus FY02 Operating income The Corporation’s operating income for FY03 was $528 million, substantially higher than FY02 operating income of $161 million. The improvement was mainly attributable to the significant reduction in the charge for provisions for losses on loans, equity investments and guarantees (provisions) and significantly higher net gains on the Corporation’s liquid asset trading activities. Offsetting these favorable contributions to higher operating income in FY03, as compared with FY02, were lower realized capital gains on equity sales and higher expense from the Corporation’s pension and other postretirement benefit plans (pension expense). The lower charge for provisions reflected the stabilization and subsequent marginal improvement in the loan and equity investment portfolio quality in FY03. Provisions in FY02 reflected the declining portfolio quality, principally in Argentina, one of the Corporation’s largest portfolio countries. Provisions totaled $98 million in FY03, as compared with $657 million in FY02. The overall declining interest rate environment in FY03 continued to benefit the Corporation’s returns from its liquid asset portfolios, in particular the P2 portfolio which is a largely fixed income portfolio. Gains on the Corporation’s liquid asset trading activities in FY03 were $157 million, as compared to $31 million in FY02. Realized capital gains in FY03 were $52 million, as compared with $288 million in FY02. The significant gains in FY02 were principally due to targeted sales of a small number of equity investments in certain emerging markets that had reached pre-determined sales trigger levels. Pension expense in FY03 was $24 million, as compared with pension income in FY02 of $31 million.
Net interest income IFC’s primary interest earning assets are its loan portfolio and its liquid assets portfolios. After charges on borrowings are taken into account, net interest income decreased by $33 million or 5% from $602 million in FY02 to $569 million in FY03.
Interest, commitment and financial fees from loans (including guarantee fees) for FY03 were $477 million, compared with $547 million in FY02, a decrease of 13%. Interest income declined from $486 million in FY02 to $414 million in FY03, principally reflecting the overall decline in interest rates during FY03. While the disbursed and outstanding loan portfolio grew by 15%, loans in nonaccrual status grew from $1,217 million at June 30, 2002 to $1,543 million at June 30, 2003, an increase of 27%. Recoveries of interest on loans being removed from non-accrual status, net of reversals of income on loans being placed in nonaccrual status were $23 million in FY03
18
($27 million – FY02). Income from the Corporation’s participation notes, over and above minimum contractual interest, totaled $33 million in FY03 ($36 million – FY02). In addition, as discussed in Note E to the FY03 financial statements, the Corporation recorded nonrecurring income of $15 million in FY02, included in interest and financial fees from loans, as a result of exercising an option to reacquire the remaining outstanding loan participations owned by a trust, and the subsequent dissolution of the trust. Commitment and financial fees, however, grew from $61 million in FY02 to $63 million in FY03 reflecting the Corporation’s strong commitments and disbursements in the past year.
Interest income from time deposits and securities for FY03 was $318 million, $175 million lower than the $493 million recorded in FY02. The liquid assets portfolio, net of derivatives and securities lending activities, decreased from $14.5 billion at June 30, 2002, to $13.0 billion at June 30, 2003, largely due to loan and equity disbursements and sales of equity securities exceeding repayments and redemptions by $1.3 billion and repayments of the Corporation’s borrowings exceeding drawdowns by $0.3 billion. The $1.5 billion decline in the liquid assets portfolio combined with the reduced yields due to the overall declining interest rate environment contributed to the reduction in interest income from time deposits and securities from FY02 to FY03.
The Corporation’s charges on borrowings decreased by $212 million from $438 million in FY02 to $226 million in FY03, largely reflecting the declining US dollar interest rate environment, as the weighted average cost of the Corporation’s borrowings outstanding from market sources, after the effects of borrowing-related derivatives fell from 1.8% at June 30, 2002 to 0.9% at June 30, 2003. The borrowings portfolio, net of borrowing-related derivatives, decreased by $0.8 billion in FY03 from $16.7 billion at June 30, 2002, to $15.9 billion at June 30, 2003.
Net gains and losses on trading activities Due to the continuing overall decline in the US dollar interest rate environment throughout FY02, and the favorable impact of this decline on the carrying value of the Corporation’s fixed income liquid asset investments, the Corporation recorded net realized and unrealized gains on its liquid asset portfolios of $157 million, higher than the net realized and unrealized gains of $31 million recorded in FY02.
Income from equity investments Overall income from the equity investment portfolio declined by $233 million from $428 million in FY02 to $195 million in FY03. The Corporation generated capital gains for FY03 of $52 million as compared with $288 million for FY02, a decrease of $236 million or 82%. Capital gains in FY02 were highly concentrated with $227 million of the total capital gains of $288 million resulting from sales or partial sales of six equity investments in Korea, Mexico, Peru, and Latvia. Such opportunities for sales based on pre-determined trigger levels did not recur to a significant extent in FY03 with only one sale of an equity investment generating a capital gain in excess of $5 million. Dividend income was marginally higher in FY03 at $143 million, as compared with $140 million in FY02. Consistent with FY02, the stable performance in dividend income in FY03 was largely attributable to returns on the Corporation’s joint ventures in the oil, gas and mining sectors.
Provisions for losses on loans, equity investments and guarantees The income charge for provisions for losses of $98 million in FY03, including $1 million in respect of guarantees, was significantly lower than the charge in FY02 of $657 million (which included $16 million in respect of guarantees), a decline of $559 million. On June 30, 2003, the Corporation’s total reserves against losses on loans and equity investments were 21.9% of the disbursed and outstanding portfolio (25.8% at June 30, 2002). The significantly lower income charge in FY03 reflected the stabilization of the portfolio quality in the first quarter of FY03 and a marginal improvement in portfolio quality during the last nine months of the year.
Noninterest income Noninterest income of $93 million for FY03 was $11 million higher than in FY02 ($82 million), principally due to higher service fees - $51 million in FY03, as compared with $40 million in FY02. The increase was largely due to the recovery of $11 million of overdue interest and penalties received from one of the Corporation’s client risk management derivatives to a client in the power sector.
Noninterest expense Administrative expenses (the principal component of noninterest expense) marginally increased by 2% from $327 million in FY02 to $332 million in FY03. Administrative expenses include the grossing-up effect of certain revenues and expenses attributable to the Corporation’s reimbursable program ($30 million in FY03, as compared with $39 million in FY02), and the impact of a reorganization effected in FY02 ($nil million in FY03, as compared with $13 million in FY02). FY02 administrative expenses were impacted by a series of efficiency and effectiveness measures implemented in the second half of FY02. These measures were taken as part of IFC’s overall reorganization and also to address the impact on operating income of the emerging crisis in Argentina. Administrative expenses in FY02 included a charge of $13 million for the reorganization, which involved staff reductions, field office closings and reorganizations, and a headquarters reorganization. The reorganization was finalized and announced in the fourth quarter of FY02, and the implementation of the plan was substantially completed in FY03. The Corporation recorded expense from pension and other postretirement benefit plans in FY03 of $24 million, as compared with income of $31 million in FY02. The increase in expense was due to changes in the underlying actuarial assumptions related to the calculation of pension expense, and a decrease in the value of the pension assets during FY02.

19
Net income As more fully disclosed in Notes A, L and M to the Corporation’s FY03 financial statements, the Corporation changed its method of accounting for derivative instruments to conform with SFAS No. 133 beginning in FY01. Pursuant to SFAS No. 133, the Corporation has designated certain hedging relationships in its borrowing activities and its lending activities as fair value hedges. The Corporation generally matches the terms of its derivatives with the terms of the specific underlying financial instruments hedged, in terms of currencies, maturity dates, reset dates, interest rates, and other features. However, differing valuation methodologies are applied to the derivative and the hedged financial instrument, as prescribed by SFAS No. 133. The resulting ineffectiveness calculated for such relationships is recorded in other unrealized gains on financial instruments in net income.
The effects of SFAS No. 133 on net income FY03 and FY02 can be summarized as follows (US$ millions):
FY03 FY02
Operating income 528 161
SFAS No. 133 adjustments:
Other unrealized gains (losses) on financial instruments (41) 54
Net income 487 215
Other unrealized gains and losses on financial instruments largely comprises the difference between the change in fair value of derivative instruments and the change in fair value of the hedged item under designated hedging relationships.
FY02 versus FY01 Operating income The Corporation’s operating income for FY02 was $161 million, substantially lower than FY01’s operating income of $241 million. The decline was mainly attributable to the significant charge for provisions for losses on loans, equity investments and guarantees, which reflected the downturn in portfolio quality in FY02, principally in Argentina, one of the Corporation’s largest portfolio countries. Such provisions totaled $657 million in FY02 as compared with $402 million in FY01. Capital gains on equity sales partially offset the negative effect on operating income of such provisions. FY02 capital gains were $288 million as compared with $91 million in FY01 due to targeted sales of a small number of equity investments in certain markets that had reached pre-determined sales trigger levels.
Net interest income IFC’s primary interest earning assets are its loan portfolio and its liquid assets portfolios. After charges on borrowings are taken into account, net interest income improved by $58 million or 11% from $544 million in FY01 to $602 million in FY02.
Interest and financial fees (including guarantee fees) for FY02 were $547 million, compared with $732 million for FY01, a decrease of 25%. The disbursed and outstanding loan portfolio declined marginally by 2%, and the Corporation’s nonperforming loan rate was higher in FY02 than in FY01. Loans in nonaccrual status grew from $1,054 million at June 30, 2001 to $1,217 million at June 30, 2002, an increase of 15%. Interest and financial fees benefited in FY02 from net recoveries of interest on loans in nonaccrual status, related to current and prior years of $39 million ($27 million – FY01). In addition, as discussed in Note E to the FY03 financial statements, the Corporation recorded income of $15 million in FY02, included in interest and financial fees from loans, as a result of exercising an option to reacquire the remaining outstanding loan participations owned by a trust, and the subsequent dissolution of the trust.
Interest income from time deposits and securities for FY02 was $493 million, $280 million lower than the $773 million recorded in FY01. The liquid assets portfolio, net of derivatives and securities lending activities, grew from $13.3 billion at June 30, 2001, to $14.5 billion, largely funded by the growth in the Corporation’s borrowings program, proceeds from sales of equity securities and the slower pace of loan and equity disbursements experienced in FY02, continuing the trend experienced in FY01. The $1.2 billion growth in the liquid assets portfolio partially offset the negative effect of the overall declining interest rate environment experienced in FY02 on interest income from time deposits and securities.
The Corporation’s charges on borrowings fell by $523 million during FY02 from $961 million to $438 million, largely reflecting the declining US dollar interest rate environment, partially offset by the growth of the borrowings portfolio. After the effect of associated derivative financial instruments, the borrowings portfolio grew by $0.3 billion in FY02 from $16.6 billion at June 30, 2001, to $16.9 billion at June 30, 2002.
Net gains and losses on trading activities Due to the overall decline in the US dollar interest rate environment in FY02, and the favorable impact of this decline on the carrying value of the Corporation’s fixed income liquid asset investments, the Corporation recorded net realized and unrealized gains on its liquid asset portfolios of $31 million, lower than the net realized and unrealized gains of $87 million recorded in FY01 which was characterized by a steeper declining interest rate environment than experienced in FY02.

Income from equity investments Overall income from the equity investment portfolio was higher by $206 million, or 93%, from $222 million in FY01 to $428 million in FY02. The Corporation generated capital gains for FY02 of $288 million as compared with $91 million for FY01, an increase of 216%. Capital gains, while strong in FY02, were highly concentrated with $227 million of the total capital gains of $288 million resulting from sales or partial sales of six equity investments in Korea, Mexico, Peru, and Latvia. Dividend income was marginally higher in FY02 at $140 million, as compared with $131 million in FY01. Consistent with FY01, the stable performance in dividend income in FY02 was largely attributable to returns on the Corporation’s joint ventures in the oil, gas and mining sectors.
Provisions for losses on loans, equity investments and guarantees The income charge for provisions for losses of $657 million in FY02, including $16 million in respect of guarantees, was significantly higher than the charge in FY01 of $402 million (which included $13 million in respect of guarantees), a growth of $255 million or 63%. On June 30, 2002, the Corporation’s total reserves against losses on loans and equity investments were 25.8% of the disbursed and outstanding portfolio (20.3% at June 30, 2001).
Noninterest income Noninterest income of $82 million for FY02 was $17 million higher than in FY01 ($65 million), principally due to other income, principally fees collected from clients for reimbursement of expenses incurred by the Corporation, of $43 million in FY02 being $15 million higher than in FY01 ($28 million). Service fees in FY02 were substantially unchanged at $40 million, as compared with $41 million in FY01.
Noninterest expense Administrative expenses (the principal component of noninterest expense) rose 8% from $304 million in FY01 to $327 million in FY02. Excluding the grossing-up effect of certain revenues and expenses attributable to the Corporation’s reimbursable program ($39 million in FY02, as compared with $24 million in FY01) as noted above, and the impact of a reorganization effected in FY02 ($13 million in FY02, as compared with $nil in FY01), administrative expenses, the largest component of noninterest expense, fell by $5 million, from $280 million in FY01, to $275 million in FY02. This decrease was largely attributable to the effect of a series of efficiency and effectiveness measures implemented in the second half of FY02. Income from the Corporation’s pension and other postretirement benefit plans (recorded as a reduction in administrative expenses in FY02 and FY01 in the Corporation’s FY03 financial statements due to the FY03 presentation in noninterest expense) fell by $16 million from $47 million in FY01 to $31 million in FY02.
Net income The effects of SFAS No. 133 on net income FY02 and FY01 can be summarized as follows (US$ millions):
FY02 FY01
Operating income 161 241
SFAS No. 133 adjustments:
Other unrealized gains on financial instruments 54 11
Cumulative effect of change in accounting principle - 93
Net income 215 345
The cumulative effect of the change in accounting principle (the transition adjustment) comprises the difference between the previous balance sheet carrying value and the fair value of all freestanding derivatives together with the offsetting gains and losses on assets and liabilities held under hedging relationships in existence prior to the adoption of SFAS No. 133.
20

21
VIII. GOVERNANCE Board of Directors In accordance with its Articles of Agreement, members of IFC’s Board of Directors (the Board) are appointed or elected by their member governments. These Directors are neither officers nor staff of IFC. James D. Wolfensohn, President, is the only management member of the Board, serving as a non-voting member and as Chairman of the Board. The Board has established several Committees including:
Committee on Development Effectiveness Audit Committee Budget Committee Personnel Committee Committee on Governance and Administrative Matters
The Board and its Committees function in continuous session at the principal offices of the World Bank Group, as business requires. Each Committee’s terms of reference establish its respective roles and responsibilities. As Committees do not vote, their role is primarily to serve the full Board in discharging its responsibilities.
Audit Committee Membership The Audit Committee consists of eight members of the Board. Membership on the Committee is determined by the Board, based upon nominations by the Chairman of the Board, following informal consultation with the Directors. Membership of the Committee is expected to reflect the economic and geographic diversity of IFC’s member countries, as well as the seniority, and relevant experience of each member. Generally, Committee members are appointed for a two year term; reappointment to a second term, when possible, is desirable for continuity. Audit Committee meetings are generally open to any members of the Board who may wish to attend, and non-Committee members of the Board may participate in discussions. In addition, the Chairman of the Audit Committee may speak in that capacity at meetings of the Board with respect to discussions held in the Audit Committee.
Key responsibilities The Audit Committee is appointed by the Board to exercise, on its behalf, oversight and assessment of fiduciary controls, the effectiveness of financial reporting, various aspects of financial, business, operating, and reputational risk, quality of earnings, and internal controls. In the execution of this role, the Committee discusses with management and the external auditors financial issues and policies that have an important bearing on the Corporation’s financial position and risk-bearing capacity. It also reviews the internal audit work program with the Auditor General and Management of the Corporation.
Communications The Audit Committee communicates regularly with the Board through distribution of the following:
The minutes of its meetings Reports of the Audit Committee prepared by the Chairman, which document discussions held. These Reports are distributed to the Directors, Alternates, World Bank Group Senior Management and Vice Presidents of IFC. “Statement(s) of the Chairman” and statements issued by other members of the Committee. The Annual Report of the Board, which provides an overview of the main issues addressed by the Audit Committee over the year.
The Audit Committee’s communications with the external auditor are described in the Auditor Independence section, below.
Executive sessions Members of the Audit Committee may convene in executive session at any time, without management present. Under the Audit Committee’s terms of reference, it meets in executive session with the external auditors at least once a year.
Access to outside resources and to management Throughout the year, the Audit Committee receives a large volume of information, that supports the preparation of the financial statements. The Audit Committee meets both formally and informally throughout the year to discuss financial and accounting matters. Directors have complete access to management of the Corporation. The quarterly and annual financial statements are made available to the Audit Committee for discussion prior to issuance. The Audit Committee has the opportunity to meet with both management and the external auditors for bilateral discussions. The Audit Committee then meets to discuss the financial statements with management and the external auditors.
Code of Ethics The World Bank Group strives to foster and maintain a positive work environment that supports the ethical behavior of its staff. To facilitate this effort, the Bank Group has in place a Code of Professional Ethics – living our values. The Code applies to all staff (including managers, consultants, and temporary employees) worldwide. The Code is available on the Bank Group’s website, www.worldbank.org. Staff relations, conflicts of interest, and operational issues, including the accuracy of books and records, are key elements of the Code.

22
In addition to the Code, an essential element of appropriate conduct is compliance with the obligations embodied in the Principles of Staff Employment, Staff Rules, and Administrative Rules, the violation of which may result in disciplinary actions. In accordance with the Staff Rules, senior managers must complete a confidential financial disclosure instrument with the Office of Ethics and Business Conduct. Guidance for staff is also provided through programs, training materials, and other resources. Managers are responsible for ensuring that internal systems, policies, and procedures are consistently aligned with the World Bank Group’s ethical goals. In support of its efforts on ethics, the World Bank offers a variety of methods for informing staff of these resources. Many of these efforts are headed by the following groups:
The Office of Ethics and Business Conduct provides leadership, management and oversight for the Bank Group’s ethics infrastructure including the Ethics HelpLine, a consolidated conflicts of interest disclosure/resolution system, financial disclosure, ongoing training to both internal and external audiences, and communication resources. The Department of Institutional Integrity is charged with investigating allegations of fraud and corruption with the Bank Group. The Department also investigates allegations of misconduct by Bank Group staff, and trains and educates staff and clients in detecting and reporting fraud and corruption in Bank Group-funded projects. The Department reports directly to the President and is composed of professionals from a range of disciplines including financial analysts, researchers, investigators, lawyers, prosecutors, forensic accountants, and Bank Group staff with operational experience.
The Bank Group offers both an “Ethics HelpLine”, as well as a Fraud and Corruption hotline run by an outside firm staffed by trained specialists. The third party service offers numerous methods of communication in addition to a toll free hotline in countries where access to telecommunications may be limited. In addition there are other methods by which the Department of Institutional Integrity may receive allegations, including directly by email, anonymously, or through confidential submission through their website, as well as the postal service and telephone.
Auditor Independence In February 2003, the Board adopted a set of principles applicable to the appointment of the external auditor for IFC. Key features of those principles include:
An immediate prohibition of the external auditor from the provision of all non audit-related services. All audit-related services must be pre-approved on a case-by-case basis by the Board, upon recommendation of the Audit Committee. Mandatory rebidding of the external audit contract every five years. Prohibition of any firm serving as external auditor for more than two consecutive five-year terms. Mandatory rotation of the senior partner after five years. An evaluation of the performance of the external auditor at the mid-point of the five year term.
IFC’s external auditor is commencing a new term of up to five years as of the year ending June 30, 2004, and will have served eleven years as external auditor upon completion of that term, pursuant to a one-time grandfathered exemption from the above-referenced ten-year limit. The service of the external auditors is subject to recommendation by the Audit Committee for annual reappointment and approval of a resolution by the Board. As a standard practice, the external auditor is present as an observer at virtually all Audit Committee meetings and is frequently asked to present its perspective on issues. In addition, the Audit Committee meets periodically with the external auditor in private session without management present. Members of the Audit Committee have independent access to the external auditor. Communication between the external auditor and the Audit Committee is ongoing, as frequently as is deemed necessary by either party. IFC’s external auditors follow the communication requirements with audit committees set out under U.S. generally accepted auditing standards. In keeping with these standards, significant formal communications include:
quarterly and annual financial statement reporting, annual appointment of the external auditors, presentation of the external audit plan, presentation of control recommendations and discussion of the COSO attestation and report, and presentation of a statement regarding independence.
In addition, there is informal communication between the Chairman of the Audit Committee and the external auditor’s lead client service partner.

23
Responsibility for External Financial ReportingMANAGEMENT’S RESPONSIBILITY
INTERNATIONAL FINANCE CORPORATIONWashington, DC
July 31, 2003
RESPONSIBILITY FOR EXTERNAL FINANCIAL REPORTING
The external financial statements and related financial information in the IFC annual report, for the fiscal year ended June 30, 2003, were prepared by themanagement of IFC. In doing so, management applied generally accepted accounting principles in the United States, and also exercised its judgement andmade estimates in those instances where they were deemed appropriate.
In assuming its responsibility both for the integrity and fairness of financial information, management maintains a system of internal controls designed toprovide reasonable assurance to the Board of Executive Directors and member countries that assets are safeguarded, transactions are properly executed andrecorded in accordance with management’s authorizations, and accounting records are reliable for preparing accurate, published financial statements.Management uses its judgement balancing the costs of systems of internal accounting controls and the benefits to be derived from them.The systems ofinternal accounting controls are continually modified and improved in response to changes in business conditions and operations.
Key procedures that management has established and which are designed to provide effective internal financial control within the IFC include the prepa-ration, review and Board approval of annual financial plans that align with strategic plans prepared every year. Results are monitored regularly and reportson progress compared to the plan are prepared quarterly. Additionally, systems are in place to monitor financial risks such as changes in the market pricesof financial instruments, funding of assets, operational error and fraud. Exposure to these risks is monitored by the IFC Finance and Risk Committee.1
Further, the system of internal controls includes written policies and procedures,proper delegation of authority, accountability through establishing respon-sibility centers, and segregation of duties.
The effectiveness of IFC’s systems of internal accounting controls is monitored throughout the year by management in its ongoing oversight role, throughthe conduct of control risk self assessments, and by an established program of internal audit carried out by the World Bank Group Internal AuditingDepartment. Management believes that IFC’s internal controls for external financial reporting, which are subject to close scrutiny by management and byinternal auditors and are revised as considered necessary, support the integrity and reliability of the external financial statements.
Further, the external financial statements for the year ended June 30, 2003, were audited by external auditors who, in the course of their work, consid-ered the internal control structure to obtain an understanding of it sufficient to plan the audit and to determine the nature, timing, and extent of auditprocedures performed. However, an audit is not designed to provide assurance on the internal control system or to identify reportable conditions.
The Board of Directors of IFC has appointed an Audit Committee responsible for monitoring the accounting practices and internal controls of theCorporation.The Audit Committee meets periodically with management and our internal auditors to discuss the work of each. Both the internal audi-tors and the external auditors have direct access to the Audit Committee to discuss the audits and any accounting controls or financial accounting andreporting matters.
Even an effective internal control system, no matter how well designed, has inherent limitations – including the possibility of the circumvention or over-riding of controls – and therefore can provide only reasonable assurance with respect to external financial statement preparation. Further, because ofchanges in conditions, internal control system effectiveness may vary over time.
IFC assessed its internal control system as of June 30, 2003, in relation to criteria for effective internal control over external financial reporting describedin Internal Control – Integrated Framework issued by the Committee of Sponsoring Organizations (COSO) of the Treadway Commission. Based on thisassessment, IFC believes that, as of June 30, 2003, its system of internal control over external financial reporting met those criteria.
James D.Wolfensohn Peter WoickePresident Executive Vice President
Allen F. Shapiro Farida KhambataController Vice President, Portfolio and Risk Management
1 The Finance and Risk Committee is chaired by the VP, Portfolio and Risk Management. Its members include the EVP, the VP Operations, and the VP/General Counsel.

Responsibility for External Financial ReportingREPORT OF INDEPENDENT ACCOUNTANTS
24

Financial Statements
REPORT OF INDEPENDENT ACCOUNTANTS
FINANCIAL STATEMENTS INCLUDING NOTES
25

26
Page 1 INTERNATIONAL FINANCE CORPORATION
The notes to financial statements are an integral part of these statements.
BALANCE SHEET
as of June 30, 2003 and June 30, 2002
(US$ millions)
2003 2002 Assets Due from banks ......................................................................................................................... $ 93 $ 95 Time deposits ............................................................................................................................ 2,293 4,471 Trading securities – Note B ...................................................................................................... 10,572 11,795 Securities purchased under resale agreements ....................................................................... 4,046 563 Loans and equity investments disbursed and outstanding – Note C Loans .................................................................................................................................... 9,242 8,033 Equity investments ................................................................................................................ 2,760 2,701 Total loans and equity investments ...................................................................................... 12,002 10,734 Less: Reserve against losses on loans and equity investments ...................................... (2,625) (2,771) Net loans and equity investments ................................................................................ 9,377 7,963 Derivative assets ....................................................................................................................... 1,734 1,077 Receivables and other assets – Note F .................................................................................... 3,428 1,775 Total assets ..................................................................................................................... $ 31,543 $ 27,739
Liabilities and capital Liabilities Securities sold under repurchase agreements and payable for cash collateral received ............................................................................................... $ 3,053 $ 1,935 Borrowings withdrawn and outstanding – Note G From market sources ....................................................................................................... 17,181 16,412 From International Bank for Reconstruction and Development ........................................ 134 169 Total borrowings ........................................................................................................... 17,315 16,581 Derivative liabilities ............................................................................................................... 1,264 1,576 Payables and other liabilities – Note H ................................................................................. 3,122 1,343 Total liabilities ................................................................................................................... 24,754 21,435 Capital Capital stock, authorized 2,450,000 shares of $1,000 par value each – Note I Subscribed ........................................................................................................................ 2,362 2,362 Less: Portion not yet paid ................................................................................................ (2) (2) Total capital stock ........................................................................................................ 2,360 2,360 Accumulated other comprehensive income .......................................................................... 4 6 Retained earnings ................................................................................................................ 4,425 3,938 Total capital ...................................................................................................................... 6,789 6,304 Total liabilities and capital ............................................................................................. $ 31,543 $ 27,739

27
Page 2 INTERNATIONAL FINANCE CORPORATION
The notes to financial statements are an integral part of these statements.
INCOME STATEMENT
for the three years ended June 30, 2003
(US$ millions)
2003 2002 2001 Interest income Interest and financial fees from loans – Note C .......................................................$ 477 $ 547 $ 732 Interest from time deposits and securities – Note B ................................................ 318 493 773 Total interest income ......................................................................................... 795 1,040 1,505 Interest expense Charges on borrowings – Note G ............................................................................ 226 438 961 Total interest expense ....................................................................................... 226 438 961 Net interest income ................................................................................................ 569 602 544 Net gains on trading activities – Note B ....................................................................... 157 31 87 Income from equity investments Capital gains on equity sales ................................................................................... 52 288 91 Dividends and profit participations ........................................................................... 143 140 131 Total income from equity investments ............................................................ 195 428 222 Provision for losses on loans, equity investments and guarantees – Note C .............. 98 657 402 Net income from loans, equity investments and trading activities ....................... 823 404 451 Noninterest income Service fees ............................................................................................................. 51 40 41 Translation adjustments, net .................................................................................... 8 (1) (4) Other income – Note J ............................................................................................. 34 43 28 Total noninterest income .................................................................................. 93 82 65 Noninterest expense Administrative expenses – Notes Q and R .............................................................. 332 327 304 Expense (income) from pension and other postretirement benefit plans – Note P .. 24 (31) (47) Contributions to special programs – Note K ............................................................ 28 22 16 Other expenses ........................................................................................................ 4 7 2 Total noninterest expense ................................................................................ 388 325 275 Operating income ....................................................................................................... 528 161 241 Other unrealized (losses) gains on financial instruments – Note L ............................. (41) 54 11 Cumulative effect of change in accounting principle – Note L ..................................... - - 93 Net income...................................................................................................................$ 487 $ 215 $ 345

28
Page 3 INTERNATIONAL FINANCE CORPORATION
The notes to financial statements are an integral part of these statements.
STATEMENT OF COMPREHENSIVE INCOME
for the three years ended June 30, 2003
(US$ millions)
2003 2002 2001 Net income ..................................................................................................................$ 487 $ 215 $ 345 Other comprehensive income (loss) Cumulative effect of change in accounting principle – Note L ................................. - - 14 Reclassification to net income of net interest accruals on swaps in cash flow hedging relationships at June 30, 2000 ............................................... (2) (6) (2) Transfer to net income of accumulated unrealized holding gains and losses on available for sale securities reclassified as trading securities ............................. - - 5 Total comprehensive income ...........................................................................$ 485 $ 209 $ 362
STATEMENT OF CHANGES IN CAPITAL
for the three years ended June 30, 2003
(US$ millions)
Payments Accumulated received other on account Retained comprehensive of pending earnings income Capital stock subscriptions Total capital
At July 1, 2000 .........................................................................$ 3,378 $ (5) $ 2,358 $ 2 $ 5,733 Year ended June 30, 2001 Net income ............................................................................ 345 345 Other comprehensive income .............................................. 17 17 Payments received on account of pending subscriptions allocated to capital stock subscribed ................................ 2 (2) - At June 30, 2001 ......................................................................$ 3,723 $ 12 $ 2,360 $ - $ 6,095 Year ended June 30, 2002 Net income ............................................................................ 215 215 Other comprehensive income (loss) ..................................... (6) (6) At June 30, 2002 ......................................................................$ 3,938 $ 6 $ 2,360 $ - $ 6,304 Year ended June 30, 2003 Net income ............................................................................ 487 487 Other comprehensive income (loss) ..................................... (2) (2)
At June 30, 2003 ......................................................................$ 4,425 $ 4 $ 2,360 $ - $ 6,789
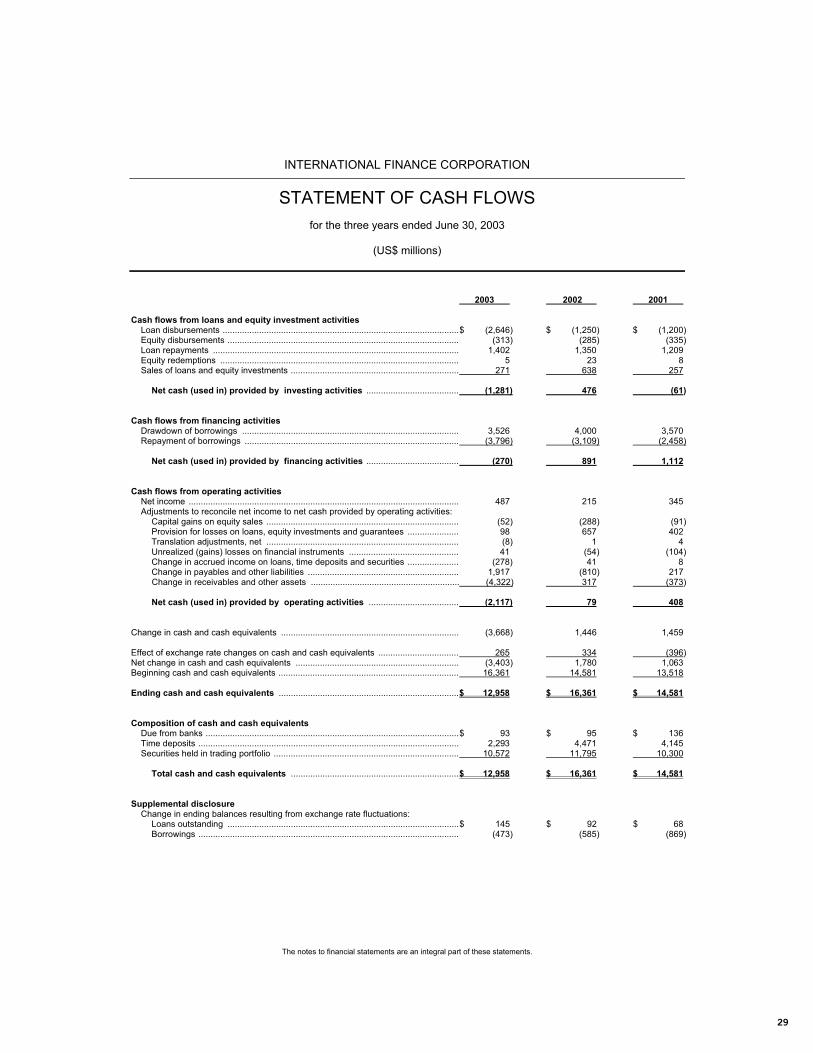
29
Page 4 INTERNATIONAL FINANCE CORPORATION
The notes to financial statements are an integral part of these statements.
STATEMENT OF CASH FLOWS
for the three years ended June 30, 2003
(US$ millions)
2003 2002 2001 Cash flows from loans and equity investment activities Loan disbursements .................................................................................................$ (2,646) $ (1,250) $ (1,200) Equity disbursements ............................................................................................... (313) (285) (335) Loan repayments ..................................................................................................... 1,402 1,350 1,209 Equity redemptions .................................................................................................. 5 23 8 Sales of loans and equity investments ..................................................................... 271 638 257 Net cash (used in) provided by investing activities ...................................... (1,281) 476 (61) Cash flows from financing activities Drawdown of borrowings ......................................................................................... 3,526 4,000 3,570 Repayment of borrowings ........................................................................................ (3,796) (3,109) (2,458) Net cash (used in) provided by financing activities ...................................... (270) 891 1,112 Cash flows from operating activities Net income ............................................................................................................... 487 215 345 Adjustments to reconcile net income to net cash provided by operating activities: Capital gains on equity sales ............................................................................... (52) (288) (91) Provision for losses on loans, equity investments and guarantees ..................... 98 657 402 Translation adjustments, net ............................................................................... (8) 1 4 Unrealized (gains) losses on financial instruments ............................................. 41 (54) (104) Change in accrued income on loans, time deposits and securities ..................... (278) 41 8 Change in payables and other liabilities .............................................................. 1,917 (810) 217 Change in receivables and other assets ............................................................. (4,322) 317 (373) Net cash (used in) provided by operating activities ..................................... (2,117) 79 408 Change in cash and cash equivalents ......................................................................... (3,668) 1,446 1,459 Effect of exchange rate changes on cash and cash equivalents ................................. 265 334 (396) Net change in cash and cash equivalents ................................................................... (3,403) 1,780 1,063 Beginning cash and cash equivalents .......................................................................... 16,361 14,581 13,518 Ending cash and cash equivalents ..........................................................................$ 12,958 $ 16,361 $ 14,581 Composition of cash and cash equivalents Due from banks ........................................................................................................$ 93 $ 95 $ 136 Time deposits ........................................................................................................... 2,293 4,471 4,145 Securities held in trading portfolio ............................................................................ 10,572 11,795 10,300 Total cash and cash equivalents .....................................................................$ 12,958 $ 16,361 $ 14,581 Supplemental disclosure Change in ending balances resulting from exchange rate fluctuations: Loans outstanding ...............................................................................................$ 145 $ 92 $ 68 Borrowings ........................................................................................................... (473) (585) (869)

30
Page 5 INTERNATIONAL FINANCE CORPORATION
The notes to financial statements are an integral part of these statements.
STATEMENT OF CAPITAL STOCK AND VOTING POWER
as of June 30, 2003
(US$ thousands) Capital stock Voting power Amount Percent Number Percent Members paid of total of votes of total
Afghanistan .......................$ 111 0.00 361 0.02 Albania .............................. 1,302 0.06 1,552 0.06 Algeria ............................... 5,621 0.24 5,871 0.24 Angola ............................... 1,481 0.06 1,731 0.07 Antigua and Barbuda ......... 13 0.00 263 0.01 Argentina ........................... 38,129 1.62 38,379 1.60 Armenia ............................. 992 0.04 1,242 0.05 Australia ............................ 47,329 2.01 47,579 1.98 Austria ............................... 19,741 0.84 19,991 0.83 Azerbaijan ......................... 2,367 0.10 2,617 0.11 Bahamas, The ................... 335 0.01 585 0.02 Bahrain .............................. 1,746 0.07 1,996 0.08 Bangladesh ....................... 9,037 0.38 9,287 0.39 Barbados ........................... 361 0.02 611 0.03 Belarus .............................. 5,162 0.22 5,412 0.23 Belgium ............................. 50,610 2.14 50,860 2.12 Belize ................................. 101 0.00 351 0.01 Benin ................................. 119 0.01 369 0.02 Bolivia ................................ 1,902 0.08 2,152 0.09 Bosnia and Herzegovina ... 620 0.03 870 0.04 Botswana ........................... 113 0.00 363 0.02 Brazil ................................. 39,479 1.67 39,729 1.65 Bulgaria ............................. 4,867 0.21 5,117 0.21 Burkina Faso ..................... 836 0.04 1,086 0.05 Burundi .............................. 100 0.00 350 0.01 Cambodia .......................... 339 0.01 589 0.02 Cameroon .......................... 885 0.04 1,135 0.05 Canada .............................. 81,342 3.45 81,592 3.39 Cape Verde ....................... 15 0.00 265 0.01 Central African Republic .... 119 0.01 369 0.02 Chad................................... 1,364 0.06 1,614 0.07 Chile .................................. 11,710 0.50 11,960 0.50 China ................................. 24,500 1.04 24,750 1.03 Colombia ........................... 12,606 0.53 12,856 0.53 Comoros ............................ 14 0.00 264 0.01 Congo, Dem. Rep. of ..... 2,159 0.09 2,409 0.10 Congo, Republic of ............ 131 0.01 381 0.02 Costa Rica ......................... 952 0.04 1,202 0.05 Côte d'Ivoire ...................... 3,544 0.15 3,794 0.16 Croatia ............................... 2,882 0.12 3,132 0.13 Cyprus ............................... 2,139 0.09 2,389 0.10 Czech Republic ................. 8,913 0.38 9,163 0.38 Denmark ............................ 18,554 0.79 18,804 0.78 Djibouti .............................. 21 0.00 271 0.01 Dominica ........................... 42 0.00 292 0.01 Dominican Republic .......... 1,187 0.05 1,437 0.06 Ecuador ............................. 2,161 0.09 2,411 0.10 Egypt, Arab Republic of ..... 12,360 0.52 12,610 0.52 El Salvador ........................ 29 0.00 279 0.01 Equatorial Guinea .............. 43 0.00 293 0.01 Eritrea ................................ 935 0.04 1,185 0.05 Estonia .............................. 1,434 0.06 1,684 0.07 Ethiopia ............................. 127 0.01 377 0.02 Fiji ...................................... 287 0.01 537 0.02 Finland ............................... 15,697 0.67 15,947 0.66 France ............................. 121,015 5.13 121,265 5.04 Gabon ................................ 1,268 0.05 1,518 0.06 Gambia, The ...................... 94 0.00 344 0.01 Georgia .............................. 861 0.04 1,111 0.05 Germany .......................... 128,908 5.46 129,158 5.37 Ghana ................................ 5,071 0.21 5,321 0.22 Greece ............................... 6,898 0.29 7,148 0.30 Grenada ............................ 74 0.00 324 0.01 Guatemala ......................... 1,084 0.05 1,334 0.06 Guinea ............................... 339 0.01 589 0.02 Guinea-Bissau ................... 18 0.00 268 0.01 Guyana .............................. 1,392 0.06 1,642 0.07 Haiti ................................... 822 0.03 1,072 0.04 Honduras ........................... 495 0.02 745 0.03 Hungary ............................. 10,932 0.46 11,182 0.47 Iceland ............................... 42 0.00 292 0.01 India ................................... 81,342 3.45 81,592 3.39 Indonesia ........................... 28,539 1.21 28,789 1.20 Iran, Islamic Republic of .... 1,444 0.06 1,694 0.07 Iraq .................................... 147 0.01 397 0.02 Ireland ............................... 1,290 0.05 1,540 0.06 Israel .................................. 2,135 0.09 2,385 0.10 Italy .................................... 81,342 3.45 81,592 3.39 Jamaica ............................. 4,282 0.18 4,532 0.19 Japan ............................... 141,174 5.98 141,424 5.88 Jordan ............................... 941 0.04 1,191 0.05 Kazakhstan ........................ 4,637 0.20 4,887 0.20 Kenya ................................ 4,041 0.17 4,291 0.18 Kiribati ............................... 12 0.00 262 0.01 Korea, Republic of ............. 15,946 0.68 16,196 0.67 Kuwait ................................ 9,947 0.42 10,197 0.42 Kyrgyz Republic ................ 1,720 0.07 1,970 0.08 Lao People's Dem. Rep. ... 278 0.01 528 0.02
Capital stock Voting power Amount Percent Number Percent Members paid of total of votes of total
Latvia ................................ $ 2,150 0.09 2,400 0.10 Lebanon ............................ 135 0.01 385 0.02 Lesotho ............................. 71 0.00 321 0.01 Liberia ............................... 83 0.00 333 0.01 Libya ................................. 55 0.00 305 0.01 Lithuania ........................... 2,341 0.10 2,591 0.11 Luxembourg ...................... 2,139 0.09 2,389 0.10 Macedonia, FYR of ........... 536 0.02 786 0.03 Madagascar ...................... 432 0.02 682 0.03 Malawi .............................. 1,822 0.08 2,072 0.09 Malaysia ........................... 15,222 0.65 15,472 0.64 Maldives ........................... 16 0.00 266 0.01 Mali ................................... 451 0.02 701 0.03 Marshall Islands ................ 663 0.03 913 0.04 Mauritania ......................... 214 0.01 464 0.02 Mauritius ........................... 1,665 0.07 1,915 0.08 Mexico .............................. 27,589 1.17 27,839 1.16 Micronesia, Fed. States of. 744 0.03 994 0.04 Moldova ............................ 784 0.03 1,034 0.04 Mongolia ........................... 144 0.01 394 0.02 Morocco ............................ 9,037 0.38 9,287 0.39 Mozambique ..................... 322 0.01 572 0.02 Myanmar ........................... 666 0.03 916 0.04 Namibia ............................ 404 0.02 654 0.03 Nepal ................................ 822 0.03 1,072 0.04 Netherlands ...................... 56,131 2.38 56,381 2.35 New Zealand .................... 3,583 0.15 3,833 0.16 Nicaragua ......................... 715 0.03 965 0.04 Niger ................................. 147 0.01 397 0.02 Nigeria .............................. 21,643 0.92 21,893 0.91 Norway ............................. 17,599 0.75 17,849 0.74 Oman ................................ 1,187 0.05 1,437 0.06 Pakistan ............................ 19,380 0.82 19,630 0.82 Palau ................................ 25 0.00 275 0.01 Panama ............................ 1,007 0.04 1,257 0.05 Papua New Guinea .......... 1,147 0.05 1,397 0.06 Paraguay .......................... 436 0.02 686 0.03 Peru .................................. 6,898 0.29 7,148 0.30 Philippines ........................ 12,606 0.53 12,856 0.53 Poland .............................. 7,236 0.31 7,486 0.31 Portugal ............................ 8,324 0.35 8,574 0.36 Romania ........................... 2,661 0.11 2,911 0.12 Russian Federation .......... 81,342 3.45 81,592 3.39 Rwanda ............................ 306 0.01 556 0.02 Saint Kitts and Nevis ........ 638 0.03 888 0.04 St. Lucia ............................ 74 0.00 324 0.01 Samoa .............................. 35 0.00 285 0.01 Saudi Arabia ..................... 30,062 1.27 30,312 1.26 Senegal ............................ 2,299 0.10 2,549 0.11 Serbia and Montenegro ..... 1,803 0.08 2,053 0.09 Seychelles ........................ 27 0.00 277 0.01 Sierra Leone ..................... 223 0.01 473 0.02 Singapore ......................... 177 0.01 427 0.02 Slovak Republic ................ 4,457 0.19 4,707 0.20 Slovenia ............................ 1,585 0.07 1,835 0.08 Solomon Islands ............... 37 0.00 287 0.01 Somalia ............................. 83 0.00 333 0.01 South Africa ...................... 15,948 0.68 16,198 0.67 Spain ................................ 37,026 1.57 37,276 1.55 Sri Lanka .......................... 7,135 0.30 7,385 0.31 Sudan ............................... 111 0.00 361 0.02 Swaziland ......................... 684 0.03 934 0.04 Sweden ............................. 26,876 1.14 27,126 1.13 Switzerland ....................... 41,580 1.76 41,830 1.74 Syrian Arab Republic ........ 194 0.01 444 0.02 Tajikistan .......................... 1,212 0.05 1,462 0.06 Tanzania ........................... 1,003 0.04 1,253 0.05 Thailand ............................ 10,941 0.46 11,191 0.47 Togo ................................. 808 0.03 1,058 0.04 Tonga ............................... 34 0.00 284 0.01 Trinidad and Tobago ........ 4,112 0.17 4,362 0.18 Tunisia .............................. 3,566 0.15 3,816 0.16 Turkey ............................... 14,545 0.62 14,795 0.62 Turkmenistan .................... 810 0.03 1,060 0.04 Uganda ............................. 735 0.03 985 0.04 Ukraine ............................. 8,907 0.38 9,157 0.38 United Arab Emirates ....... 4,033 0.17 4,283 0.18 United Kingdom ................ 121,015 5.13 121,265 5.04 United States .................... 569,379 24.12 569,629 23.70 Uruguay ............................ 3,569 0.15 3,819 0.16 Uzbekistan ........................ 3,873 0.16 4,123 0.17 Vanuatu ............................ 55 0.00 305 0.01 Venezuela, Rep. Boliv. de 27,588 1.17 27,838 1.16 Vietnam ............................ 446 0.02 696 0.03 Yemen, Republic of .......... 715 0.03 965 0.04 Zambia .............................. 1,286 0.05 1,536 0.06 Zimbabwe ......................... 2,120 0.09 2,370 0.10
Total June 30, 2003 $ 2,360,181 100.00+ 2,403,931 100.00+ Total June 30, 2002 $ 2,360,181 100.00+ 2,403,931 100.00+
* Less than .005 percent. + May differ from the sum of the individual percentages shown because of rounding.

31
Page 6 INTERNATIONAL FINANCE CORPORATION
NOTES TO FINANCIAL STATEMENTS
PURPOSE
The International Finance Corporation (the Corporation), an international organization, was established in 1956 to further economic development in its member countries by encouraging the growth of private enterprise. The Corporation is a member of the World Bank Group, which also includes the International Bank for Reconstruction and Development (IBRD), the International Development Association, and the Multilateral Investment Guarantee Agency (MIGA). The Corporation’s activities are closely coordinated with and complement the overall development objectives of the other World Bank Group institutions. The Corporation, together with private investors, assists in financing the establishment, improvement and expansion of private sector enterprises by making loans and equity investments where sufficient private capital is not otherwise available on reasonable terms. The Corporation’s share capital is provided by its member countries. It raises most of the funds for its investment activities through the issuance of notes, bonds and other debt securities in the international capital markets. The Corporation also plays a catalytic role in mobilizing additional project funding from other investors and lenders, either through cofinancing or through loan syndications, underwritings and guarantees. In addition to project finance and resource mobilization, the Corporation offers an array of financial and technical advisory services to private businesses in the developing world to increase their chances of success. It also advises governments on how to create an environment hospitable to the growth of private enterprise and foreign investment. NOTE A – SUMMARY OF SIGNIFICANT ACCOUNTING AND RELATED POLICIES
The accounting and reporting policies of the Corporation conform with accounting principles generally accepted in the United States of America (US GAAP). On July 31, 2003, the Board of Directors of the Corporation approved these financial statements for issue. Financial statements presentation - Certain amounts in the prior years have been reclassified to conform to the current year’s presentation. Use of estimates - The preparation of the financial statements requires management to make estimates and assumptions that affect the reported amounts of assets and liabilities and disclosure of contingent assets and liabilities at the date of the financial statements and the reported amounts of income and expense during the reporting periods. Actual results could differ from these estimates. A significant degree of judgment has been used in the determination of: the adequacy of the reserve against losses on loans and equity investments; estimated fair values of all derivative instruments and related financial instruments in qualifying hedging relationships; and net periodic pension income. There are inherent risks and uncertainties related to the Corporation’s operations. The possibility exists that changing economic conditions could have an adverse effect on the financial position of the Corporation. As part of the ongoing compliance with US Statement of Financial Accounting Standards (SFAS) No. 133, Accounting for Derivative Instruments and Hedging Activities, as amended by SFAS No. 138, Accounting for Certain Derivatives and Certain Hedging Relationships (collectively SFAS No. 133), the Corporation uses internal models to determine the fair values of derivative and other financial instruments and the aggregate level of the reserve against losses on loans and equity investments. The Corporation undertakes continuous review and respecification of these models with the objective of refining its estimates, consistent with evolving best market practices. Changes in estimates resulting from refinements in the assumptions and methodologies incorporated in the models are reflected in net income in the period in which the enhanced models are first applied. Translation of currencies - Assets and liabilities not denominated in United States dollars (US dollars or $), other than disbursed equity investments, are expressed in US dollars at the exchange rates prevailing at June 30, 2003 and June 30, 2002. Disbursed equity investments are expressed in US dollars at the prevailing exchange rates at the time of disbursement. Income and expenses are translated at the rates of exchange prevailing at the time of the transaction. Translation gains and losses are credited or charged to income. Loans and equity investments - Loans and equity investments are recorded as assets when disbursed. Loans are carried at the principal amounts outstanding. Where loans are part of a designated hedging relationship employing derivative instruments, the carrying value is adjusted for changes in fair value attributable to the risk being hedged. These adjustments are reported in other unrealized gains and losses on financial instruments in net income. It is the Corporation’s practice to obtain collateral security such as, but not limited to, mortgages and third-party guarantees. Equity investments are carried at cost. The Corporation enters into put and call option agreements in connection with equity investments; these are accounted for in accordance with SFAS No.133. Reserve against losses on loans and equity investments - The Corporation recognizes portfolio impairment in the balance sheet through the reserve against losses on loans and equity investments, recording a provision or release of provision for losses on loans and equity investments in net income on a quarterly basis, which increases or decreases the reserve against losses on loans and equity investments. Management determines the aggregate level of the reserve against losses on loans and equity investments, taking into account established guidelines and its assessment of recent portfolio quality trends. The guidelines comprise simulation techniques, internal country risk ratings and the impairment potential of the portfolio based on the Corporation’s historical portfolio write-off and loss reserve experience on mature investments. The reserve against losses on loans and equity investments reflects estimates of both probable losses already identified and probable losses inherent in the portfolio but not specifically identifiable. The determination of identified probable losses represents management’s judgment of the creditworthiness of the borrower or the value of the company invested in and is established through review of individual loans and equity investments undertaken on a quarterly basis. The Corporation considers a loan as impaired when, based on current information and events, it is probable that the Corporation will be unable to collect all amounts due according to the loan’s contractual terms. A reserve against losses for an equity investment is established when a decrease in value of the equity investment has occurred which is considered other than temporary. Unidentified probable losses are the aggregate probable losses over a one-year risk horizon, in excess of identified probable losses. The risks inherent in the portfolio that are considered in determining unidentified probable losses are those proven to exist by past experience and include:

32
Page 7 INTERNATIONAL FINANCE CORPORATION
NOTES TO FINANCIAL STATEMENTS
country systemic risk; the risk of correlation or contagion of losses between markets; uninsured and uninsurable risks; nonperformance under guarantees and support agreements; and opacity of, or misrepresentation in, financial statements. Loan and Equity investments are written-off when the Corporation has exhausted all possible means of recovery, by reducing the reserve against losses on loans and equity investments. Such reductions in the reserve are offset by recoveries associated with previously written-off loans and equity investments. Revenue recognition on loans and equity investments - Interest income and commitment fees on loans are recorded as income on an accrual basis. All other fees are recorded as income when received in freely convertible currencies. The Corporation does not recognize income on loans where collectibility is in doubt or payments of interest or principal are past due more than 60 days unless management anticipates that collection of interest will occur in the near future. Any interest accrued on a loan placed in nonaccrual status is reversed out of income and is thereafter recognized as income only when the actual payment is received. Interest not previously recognized but capitalized as part of a debt restructuring is recorded as deferred income, included in the balance sheet in payables and other liabilities, and credited to income only when the related principal is received. Such capitalized interest is considered in the computation of the reserve against losses on loans and equity investments in the balance sheet. Dividends and profit participations are recorded as income when received in freely convertible currencies. Capital gains on the sale or redemption of equity investments are measured against the average cost of the investments sold and are recorded as income when received in freely convertible currencies. Certain equity investments, for which recovery of invested capital is uncertain are accounted for under the cost recovery method, such that receipts of freely convertible currencies are first applied to recovery of invested capital and then to capital gains. Guarantees – The Corporation extends financial guarantee facilities to its clients to provide credit enhancement for their debt securities and trade obligations. Beginning in the year ended June 30, 2001, the Corporation began offering partial credit guarantees to clients covering, on a risk-sharing basis, client obligations on bonds and/or loans. Under the terms of the Corporation's guarantees, the Corporation agrees to assume responsibility for the client’s financial obligations in the event of default by the client (i.e., failure to pay when payment is due). Guarantees are regarded as issued when the Corporation commits to the guarantee. This date is also the “inception” of the guarantee contract. Guarantees are regarded as outstanding when the underlying financial obligation of the client is incurred, and called when the Corporation’s obligation under the guarantee has been invoked. There are two liabilities associated with the guarantees: (1) the stand-ready obligation to perform and (2) the contingent liability. The stand-ready obligation to perform is recognized at the commitment date unless a contingent liability exists at that time or is expected to exist in the near term. The contingent liability associated with the financial guarantees is recognized when it is probable the guarantee will be called and when the amount of guarantee called can be reasonably estimated. All liabilities associated with guarantees are included in payables and other liabilities, and the receivables are included in other assets on the balance sheet. When the guarantees are called, the amount disbursed is recorded as a new loan, and specific reserves are established, based on the estimated probable loss. These reserves are included in the reserve against losses on loans and equity investments on the balance sheet. Commitment fees on guarantees are recorded as income on an accrual basis. Liquid asset portfolio - The Corporation’s liquid funds are invested in government and agency obligations, time deposits and asset-backed securities. Government and agency obligations include long and short positions in highly rated fixed rate bonds, notes, bills and other obligations issued or unconditionally guaranteed by governments of countries or other official entities including government agencies and instrumentalities or by multilateral organizations. The liquid asset portfolio, as defined by the Corporation and as detailed in note B, comprises: these time deposits and securities; related derivative instruments; securities purchased under resale agreements, securities sold under repurchase agreements and payable for cash collateral received; receivables from sales of securities and payables for purchases of securities; and related accrued income and charges. On July 1, 2000, the Corporation reclassified all of its available for sale securities as trading securities. This resulted in a transfer of accumulated net unrealized holding losses on available for sale securities of $5 million from other comprehensive income to net income in the year ended June 30, 2001. Beginning with the year ended June 30, 2001, realized and unrealized gains and losses on trading securities are reported separately in the income statement. Trading securities are carried at fair value with any changes in fair value reported in net gains and losses on trading activities. Interest on securities and amortization of premiums and accretion of discounts are reported in interest from time deposits and securities. The Corporation classifies due from banks, time deposits and securities (collectively, cash and cash equivalents) as an element of liquidity in the statement of cash flows because they are readily convertible to known amounts of cash within 90 days. Repurchase and resale agreements - Repurchase agreements are contracts under which a party sells securities and simultaneously agrees to repurchase the same securities at a specified future date at a fixed price. Resale agreements are contracts under which a party purchases securities and simultaneously agrees to resell the same securities at a specified future date at a fixed price. It is the Corporation’s policy to take possession of securities purchased under resale agreements, which are primarily liquid government securities. The market value of these securities is monitored and, within parameters defined in the agreements, additional collateral is obtained when their value declines. The Corporation also monitors its exposure with respect to securities sold under repurchase agreements and, in accordance with the terms of the agreements, requests the return of excess securities held by the counterparty when their value increases. Repurchase and resale agreements are accounted for as collateralized financing transactions and recorded at the amount at which the securities were acquired or sold plus accrued interest. Securities purchased under resale agreements, securities sold under agreements to

33
Page 8 INTERNATIONAL FINANCE CORPORATION
NOTES TO FINANCIAL STATEMENTS
repurchase and securities payable for cash collateral received are recorded at fair value. Borrowings - To diversify its access to funding and reduce its borrowing costs, the Corporation borrows in a variety of currencies and uses a number of borrowing structures, including foreign exchange rate-linked, inverse floating rate and zero coupon notes. Generally, the Corporation simultaneously converts such borrowings into variable rate US dollar borrowings through the use of currency and interest rate swap transactions. Under certain outstanding borrowing agreements, the Corporation is not permitted to mortgage or allow a lien to be placed on its assets (other than purchase money security interests) without extending equivalent security to the holders of such borrowings. Borrowings are recorded at the amount repayable at maturity, adjusted for unamortized premium and unaccreted discount. Where borrowings are part of a designated hedging relationship employing derivative instruments, the carrying amount is adjusted for changes in fair value attributable to the risk being hedged. Adjustments for changes in fair value attributable to hedged risks are reported in other unrealized gains and losses on financial instruments in the income statement. Interest on borrowings and amortization of premiums and accretion of discounts are reported in charges on borrowings. Risk management, derivative instruments and hedge accounting - The Corporation enters into transactions in various derivative instruments for financial risk management purposes in connection with its principal business activities, including lending, client risk management, borrowing, liquid asset portfolio management and asset and liability management. The Corporation does not use derivatives for speculative, marketing or merchandising purposes. All derivative instruments are recorded on the balance sheet at fair value as derivative assets or derivative liabilities. Where they are not clearly and closely related to the host contract, certain derivative instruments embedded in loans, equity investments and market borrowing transactions entered into on or after January 1, 1999 are bifurcated from the host contract and recorded at fair value as derivative assets and liabilities. The value at inception of such embedded derivatives is excluded from the carrying value of the host contracts on the balance sheet. Changes in fair values of derivative instruments used in liquid asset portfolio management activities are recorded in net gains and losses on trading activities. Changes in fair values of derivative instruments other than those used in liquid asset portfolio management activities are recorded in other unrealized gains and losses on financial instruments. Subject to certain specific qualifying conditions in SFAS No. 133, a derivative instrument may be designated either as a hedge of the fair value of an asset or liability (fair value hedge), or as a hedge of the variability of cash flows of an asset or liability or forecasted transaction (cash flow hedge). For a derivative instrument qualifying as a fair value hedge, fair value gains or losses on the derivative instrument are reported in net income, together with offsetting fair value gains or losses on the hedged item that are attributable to the risk being hedged. For a derivative instrument qualifying as a cash flow hedge, fair value gains or losses associated with the risk being hedged are reported in other comprehensive income and released to net income in the period(s) in which the effect on net income of the hedged item is recorded. Fair value gains and losses on a derivative instrument not qualifying as a hedge are reported in net income. The Corporation has designated certain hedging relationships in its borrowing and lending activities as fair value hedges. The Corporation generally matches the terms of its derivatives with the terms of the specific underlying financial instruments hedged, in terms of currencies, maturity dates, reset dates, interest rates and other features. However, the valuation methodologies applied to the derivative and the hedged financial instrument, as prescribed by SFAS No. 133, may differ. The resulting ineffectiveness calculated for such relationships is recorded in other unrealized gains and losses on financial instruments in the income statement. The Corporation has not designated any hedging relationships as cash flow hedges. The risk management policy for each of the Corporation’s principal business activities and the accounting policies particular to them are described below. Lending activities The Corporation’s policy is to closely match the currency, rate basis and maturity of its loans and borrowings. Derivative instruments are used to convert the cash flows from fixed rate US dollar or non-US dollar loans into variable rate US dollars. The impact on net income of changes in fair value of interest rate swaps qualifying for the shortcut method under SFAS No. 133 is exactly offset by a corresponding adjustment to the fair value of the related loans. The Corporation has elected not to designate hedging relationships for all other lending-related derivatives that do not qualify for the shortcut method. Client risk management activities The Corporation enters into derivatives transactions with its clients to help them hedge their own currency, interest rate or commodity risk, which, in turn, improves the overall quality of the Corporation’s loan portfolio. To hedge the market risks that arise from these transactions with clients, the Corporation enters into offsetting derivative transactions with matching terms with authorized market counterparties. Changes in fair value of all derivatives associated with these activities are reflected currently in net income. Though hedge accounting is not applicable to these activities, the matching of terms between the offsetting transactions minimizes the impact on net income. Fees and spreads charged on these transactions are recorded as income on an accrual basis. Borrowing activities The Corporation issues debt securities in various capital markets with the objectives of minimizing its borrowing costs, diversifying funding sources, and developing member countries’ capital markets, sometimes using complex structures. These structures include borrowings payable in multiple currencies, or borrowings with principal and/or interest determined by reference to a specified index such as a stock market index, a reference interest rate, a commodity index, or one or more foreign exchange rates. The Corporation uses derivative instruments with matching terms, primarily currency and interest rate swaps, to convert such borrowings into variable rate US dollar obligations, consistent with the Corporation’s matched funding policy. The Corporation has designated the majority of derivatives associated with borrowing activities as fair value hedges of the underlying borrowings. There are a small number of cash flow-like hedging transactions for which no hedge relationship has been designated.

34
Page 9 INTERNATIONAL FINANCE CORPORATION
NOTES TO FINANCIAL STATEMENTS
Liquid asset portfolio management activities The Corporation manages the interest rate, currency and other market risks associated with certain of the time deposits and securities in its liquid asset portfolio by entering into derivative transactions to convert the cash flows from those instruments into variable rate US dollars, consistent with the Corporation’s matched funding policy. The derivative instruments used include short-term, over-the-counter foreign exchange forwards (covered forwards), interest rate and currency swaps, and exchange-traded interest rate futures and options. As the entire liquid asset portfolio is classified as a trading portfolio, all securities (including derivatives) are carried at fair value, and no hedging relationships have been designated. Asset and liability management In addition to the risk managed in the context of its business activities detailed above, the Corporation faces residual market risk in its overall asset and liability management. Residual currency risk is managed by monitoring the aggregate position in each lending currency and eliminating the net excess asset or liability position through spot sales or purchases. Interest rate risk due to reset date mismatches is reduced by synchronizing the reset dates on assets and liabilities and managing overall interest rate risk on an aggregate basis. Interest rate risk arising from mismatches due to writedowns, prepayments and reschedulings, and residual reset date mismatches, is monitored by measuring the sensitivity of the present value of assets and liabilities in each currency to each basis point change in interest rates. The Corporation monitors the credit risk associated with these activities by careful assessment and monitoring of prospective and actual clients and counterparties. In respect of liquid assets and derivatives transactions, credit risk is managed by establishing exposure limits based on the credit rating and size of the individual counterparty. In addition, the Corporation has entered into master agreements governing derivative transactions that contain close-out and netting provisions and collateral arrangements. Under these agreements, if the Corporation’s credit exposure to a counterparty, on a mark-to-market basis, exceeds a specified level, the counterparty must post collateral to cover the excess, generally in the form of liquid government securities. Resource mobilization - The Corporation mobilizes funds from commercial banks and other financial institutions (Participants) by facilitating loan participations, without recourse. These loan participations are administered and serviced by the Corporation on behalf of the Participants. The disbursed and outstanding balances of the loan participations are not included in the Corporation’s balance sheet. Pension and other postretirement benefits - IBRD has a defined benefit Staff Retirement Plan (SRP), a Retired Staff Benefits Plan (RSBP) and a Post-Employment Benefits Plan (PEBP) that cover substantially all of its staff members as well as the staff of the Corporation and of MIGA. The SRP provides regular pension benefits and includes a cash balance plan. The RSBP provides certain health and life insurance benefits to eligible retirees. The PEBP provides pension benefits administered outside the SRP. All costs associated with these plans are allocated between IBRD, the Corporation, and MIGA based upon their employees’ respective participation in the plans. In addition, the Corporation and MIGA reimburse IBRD for their share of any contributions made to these plans by IBRD. The net periodic pension and other postretirement benefit income or expense allocated to the Corporation is included in income from (contributions to) Staff Retirement Plan and cost of (income from) other postretirement benefits, respectively, in the income statement. The Corporation includes a receivable from IBRD in receivables and other assets, representing prepaid pension and other postretirement benefit costs. Accounting and financial reporting developments - During the year ended June 30, 2003, the Financial Accounting Standards Board (FASB) issued FASB Interpretation No. 45, Guarantor’s Accounting and Disclosure Requirements for Guarantees, Including Indirect Guarantees of Indebtedness of Others – an interpretation of FASB Statements No. 5, 57 and 107 and rescission of FASB Interpretation No. 34 (FIN45). The initial recognition and measurement provisions of FIN 45 were effective for guarantees issued or modified after December 31, 2002. Accounting for guarantees issued prior to this date is unaffected by FIN 45. The Corporation issued a small number of guarantees during the period January 1, 2003 through June 30, 2003, and the adoption of FIN 45 has had no material impact on the results of operations, statement of financial position or cash flows of the Corporation. Disclosures concerning guarantees, including those required by FIN 45 as of June 30, 2003, have been made in Note C. On January 17, 2003, FASB issued FASB Interpretation No.46 Consolidation of Variable Interest Entities – an interpretation of ARB No. 51 (FIN 46). FIN 46 is applicable to all entities with variable interests in variable interest entities created after January 31, 2003 immediately, and, for the Corporation, FIN 46 is applicable to any variable interests in a variable interest entity created before February 1, 2003, beginning July 1, 2003. The Corporation is currently in the process of evaluating the impact of FIN 46. During the year ended June 30, 2003, FASB issued Statement of Financial Accounting Standards No. 149, Amendment of Statement 133 on Derivative Instruments and Hedging Activities. SFAS No. 149 codifies certain implementation decisions previously issued by the Derivatives Implementation Group and addresses additional implementation issues relating to the definition of a derivative. The Standard also clarifies the definition of a financial guarantee to conform with FASB Interpretation No. 45, Guarantor's Accounting and Disclosure Requirements for Guarantees, Including Indirect Guarantees of Indebtedness of Others. SFAS No. 149 is effective for the Corporation on July 1, 2003 (FY04), and is not expected to have a material impact on the financial position or results of operations for the Corporation. During the year ended June 30, 2003, FASB issued Statement of Financial Accounting Standards No. 150, Accounting for Certain Financial Instruments with Characteristics of both Liabilities and Equity. SFAS No. 150 clarifies how the issuer classifies and measures certain financial instruments with characteristics of both liabilities and equities and is expected to lead to an increase in the number of quasi-debt/quasi-equity instruments issued being classified as liabilities on the issuer's balance sheet. SFAS No. 150 is effective for the Corporation on July 1, 2003 (FY04), and is not expected to have a material impact on either the financial position or the results of operations of the Corporation.

35
Page 10 INTERNATIONAL FINANCE CORPORATION
NOTES TO FINANCIAL STATEMENTS
NOTE B – LIQUID ASSET PORTFOLIO The composition of the Corporation’s liquid asset portfolio is as follows (US$ millions): June 30, 2003 June 30, 2002 Assets Due from banks $ 53 $ 48 Time deposits 2,293 4,471 Trading securities 10,572 11,795 Securities purchased under resale agreements 4,046 563 Receivables and other assets: Receivables from sales of securities 1,889 424 Accrued interest income on time deposits and securities 431 150 Accrued income on derivative instruments 15 26 Derivative assets 64 164 Total assets 19,363 17,641 Liabilities Payables and other liabilities: Payables for purchases of securities 2,388 598 Accrued charges on derivative instruments 96 79 Securities sold under repurchase agreements and payable for cash collateral received 3,053 1,935 Derivative liabilities 874 497 Total liabilities 6,411 3,109 Total net liquid asset portfolio $ 12,952 $ 14,532 The liquid asset portfolio is denominated primarily in US dollars; investments in other currencies, net of the effect of associated derivative instruments that convert non-US dollar securities into US dollar securities, represent less than 1% of the portfolio at June 30, 2003 (less than 1% - June 30, 2002). The annualized rate of return on the trading portfolio during the year ended June 30, 2003, was 3.7% (4.1% - year ended June 30, 2002; 7.1% - year ended June 30, 2001). After the effect of associated derivative instruments, the liquid asset portfolio generally reprices within one year. Trading securities The composition of trading securities is as follows: Year ended June 30, 2003 At June 30, 2003 Fair value average Average daily balance Fair value maturity Average (US$ millions) (US$ millions) (years) yield (%) Government and agency obligations $ 4,693 $ 4,296 5.4 4.2 Asset-backed securities 2,565 2,894 16.7 1.9 Corporate securities 3,010 3,242 3.4 4.7 Money market funds 140 140 - 1.2 Total trading securities $ 10,408 $ 10,572 Year ended June 30, 2002 At June 30, 2002 Fair value average Average daily balance Fair value maturity Average (US$ millions) (US$ millions) (years) yield (%) Government and agency obligations $ 5,426 $ 6,085 4.4 4.4 Asset-backed securities 2,474 2,473 11.1 2.3 Corporate securities 2,998 3,135 3.0 4.8 Money market funds 94 102 - 1.5 Total trading securities $ 10,992 $ 11,795 The expected maturity of the asset-backed securities will differ from the contractual maturity, as reported above, due to prepayment features.

36
Page 11 INTERNATIONAL FINANCE CORPORATION
NOTES TO FINANCIAL STATEMENTS
Liquid asset portfolio income Income from the liquid asset trading portfolio for the years ended June 30, 2003, 2002 and 2001 comprises (US$ millions): 2003 2002 2001 Interest Income $ 318 $ 493 $ 773 Net gains (losses): Realized 131 45 61 Unrealized 26 (14) 26 Total net gains (losses) on trading activities 157 31 87 Total income from liquid asset portfolio $ 475 $ 524 $ 860 Collateral The estimated fair value of securities held by the Corporation at June 30, 2003 as collateral, in connection with derivatives transactions and purchase and resale agreements, that may be sold or repledged was $4,500 million ($760 million - June 30, 2002). NOTE C – LOANS AND EQUITY INVESTMENTS AND RESERVE AGAINST LOSSES The distribution of the disbursed portfolio by sector is as follows (US$ millions): June 30, 2003 June 30, 2002 Equity Equity Loans investments Total Loans investments Total Finance and insurance $ 1,870 $ 794 $ 2,664 $ 1,361 $ 645 $ 2,006 Utilities 1,183 110 1,293 936 114 1,050 Food and beverages 731 115 846 602 129 731 Transportation and warehousing 636 170 806 560 174 734 Oil, gas and mining 549 150 699 453 165 618 Nonmetallic mineral product manufacturing 590 106 696 603 100 703 Information 483 181 664 422 183 605 Primary metals 566 97 663 529 93 622 Industrial and consumer products 537 90 627 457 90 547 Chemicals 536 85 621 626 86 712 Collective investment vehicles 13 550 563 7 567 574 Accommodation and tourism services 306 61 367 306 69 375 Textiles, apparel and leather 250 54 304 265 73 338 Wholesale and retail trade 259 26 285 224 27 251 Paper and pulp 215 66 281 225 91 316 Agriculture and forestry 163 19 182 168 26 194 Health care 99 20 119 111 21 132 Plastics and rubber 65 39 104 85 35 120 Other 178 27 205 78 14 92 Total disbursed portfolio 9,229 2,760 11,989 8,018 2,702 10,720 Fair value adjustments 13 - 13 15 (1) 14 Carrying value of loans and equity investments $ 9,242 $ 2,760 $ 12,002 $ 8,033 $ 2,701 $ 10,734 The distribution of the disbursed loan and equity investment portfolio by geographical region is as follows (US$ millions): June 30, 2003 June 30, 2002 Equity Equity Loans investments Total Loans investments Total Latin America and Caribbean $ 4,030 $ 907 $ 4,937 $ 3,393 $ 920 $ 4,313 Asia 1,730 948 2,678 1,919 919 2,838 Europe and Central Asia 2,089 429 2,518 1,635 423 2,058 Sub-Saharan Africa 697 256 953 646 274 920 Middle East and North Africa 683 194 877 424 132 556 Other - 26 26 1 34 35 Total disbursed portfolio 9,229 2,760 11,989 8,018 2,702 10,720 Fair value adjustments 13 - 13 15 (1) 14 Carrying value of loans and equity investments $ 9,242 $ 2,760 $ 12,002 $ 8,033 $ 2,701 $ 10,734 At June 30, 2003, 20% (23% - June 30, 2002) of the disbursed loan portfolio consisted of fixed rate loans, while the remainder was at variable rates.

37
Page 12 INTERNATIONAL FINANCE CORPORATION
NOTES TO FINANCIAL STATEMENTS
Loan portfolio The currency composition and average yield of the disbursed loan portfolio are summarized below: June 30, 2003 June 30, 2002 Amount Average Amount Average (US $ millions) yield (%) (US $ million) yield (%) US dollar $ 7,977 5.0 $ 7,155 5.7 Euro 907 5.9 654 6.8 Other currencies 345 8.5 209 8.0 Total disbursed loan portfolio 9,229 5.2 8,018 5.8 Fair value adjustments 13 15 Carrying value of loans $ 9,242 $ 8,033 After the effect of interest rate and currency swaps, the Corporation’s loans are principally denominated in US dollars. Disbursed loans in all currencies are repayable during the years ending June 30, 2004 through June 30, 2008, and thereafter, as follows (US$ millions): 2004 2005 2006 2007 2008 Thereafter Total Fixed rate loans $ 507 $ 289 $ 310 $ 209 $ 155 $ 411 $ 1,881 Variable rate loans 1,385 1,311 1,039 899 771 1,943 7,348 Total disbursed loan portfolio $ 1,892 $ 1,600 $ 1,349 $ 1,108 $ 926 $ 2,354 9,229 Fair value adjustments 13 Carrying value of loans $ 9,242 The Corporation’s disbursed variable rate loans generally reprice within one year. Loans on which the accrual of interest has been discontinued amounted to $1,543 million at June 30, 2003 ($1,217 million - June 30, 2002). Interest income not recognized on nonaccruing loans during the year ended June 30, 2003 totaled $82 million ($106 million - year ended June 30, 2002; $100 million - year ended June 30, 2001). Interest collected on loans in nonaccrual status, related to current and prior years, during the year ended June 30, 2003 was $40 million ($39 million - year ended June 30, 2002; $27 million - year ended June 30, 2001). The average recorded investment in impaired loans during the year ended June 30, 2003, was $2,543 million ($2,279 million - year ended June 30, 2002). The recorded investment in impaired loans at June 30, 2003 was $2,446 million ($2,640 million - June 30, 2002). Reserve against losses on loans and equity investments Changes in the reserve against losses on loans and equity investments for the years ended June 30, 2003, 2002 and 2001 are summarized below (US$ millions): 2003 2002 2001 Equity Equity Equity Loans investments Total Loans investments Total Loans investments Total Beginning balance $ 1,758 $ 1,013 $ 2,771 $ 1,363 $ 850 $ 2,213 $ 1,228 $ 745 $ 1,973 Provision for losses 47 50 97 373 268 641 193 196 389 Other adjustments (121) (122) (243) 22 (105) (83) (58) (91) (149) Ending balance $ 1,684 $ 941 $ 2,625 $ 1,758 $ 1,013 $ 2,771 $ 1,363 $ 850 $ 2,213 Provision for losses on loans, equity investments and guarantees in the income statement for the year ended June 30, 2003 includes $1 million in respect of guarantees ($16 million - year ended June 30, 2002; $13 million - year ended June 30, 2001). At June 30, 2003 the accumulated reserve for losses on guarantees, included in the balance sheet in payables and other liabilities, was $30 million ($29 million - June 30, 2002). Other adjustments comprise loan and equity investment write-offs and recoveries, reserves against interest capitalized as part of a debt restructuring, and translation adjustments. Interest and financial fees from loans Interest and financial fees from loans for the years ended June 30, 2003, 2002 and 2001 comprise the following (US$ millions): 2003 2002 2001 Interest income $ 414 $ 486 $ 704 Commitment fees 18 11 7 Other financial fees 45 50 21 Total interest and financial fees from loans $ 477 $ 547 $ 732

38
Page 13 INTERNATIONAL FINANCE CORPORATION
NOTES TO FINANCIAL STATEMENTS
NOTE D – PROJECTS APPROVED AND COMMITTED BUT NOT DISBURSED OR UTILIZED Projects approved by the Board of Directors not committed, loan and equity commitments signed but not yet disbursed, and guarantee and client risk management facilities signed but not yet utilized, are summarized below (US$ millions): June 30, 2003 June 30, 2002 Projects approved but not committed: Loans $ 1,961 $ 2,566 Equity investments 610 586 Guarantees 246 497 Client risk management facilities 54 115 Total projects approved but not committed 2,871 3,764 Projects committed but not disbursed: Loans 2,697 2,598 Equity investments 758 764 Projects committed but not utilized: Guarantees 765 571 Client risk management facilities 168 107 Total projects committed but not disbursed or utilized 4,388 4,040 Total projects approved but not disbursed or utilized $ 7,259 $ 7,804 NOTE E – RESOURCE MOBILIZATION Loan participations arranged to be placed with Participants in respect of loans approved by the Board of Directors, loan participations signed as commitments for which disbursement has not yet been made and loan participations disbursed and outstanding and serviced by the Corporation for the Participants are as follows (US$ millions): June 30, 2003 June 30, 2002 Loan participations arranged to be placed with Participants approved but not committed $ 2,517 $ 2,856 Loan participations signed as commitments but not disbursed 472 820 Loan participations arranged to be placed with Participants approved but not disbursed $ 2,989 $ 3,676 Loan participations disbursed and outstanding which are serviced by the Corporation $ 6,130 $ 5,700 During the year ended June 30, 2003 the Corporation called and disbursed $1,509 million ($574 million - year ended June 30, 2002) of Participants’ funds. In July 1995, the Corporation securitized and sold variable rate US dollar loan participations to a trust (the Trust). Concurrently, the Corporation provided a $20 million liquidity facility to the Trust and acquired $20 million of the Trust's Class C certificates. In January 2002, the Corporation exercised an option to reacquire the remaining outstanding loan participations owned by the Trust for $37 million, and the Trust was dissolved. As a result of the dissolution the Corporation recorded income of $15 million, included in interest and financial fees from loans in the income statement for the year ended June 30, 2002. Reserves against losses of $11 million were established on the reacquired loans, included in provision for losses on loans, equity investments and guarantees for the year ended June 30, 2002. NOTE F – RECEIVABLES AND OTHER ASSETS Receivables and other assets are summarized below (US$ millions): June 30, 2003 June 30, 2002 Receivables from sales of securities $ 1,889 $ 424 Accrued interest income on time deposits and securities 431 150 Accrued income on derivative instruments 325 396 Accrued interest income on loans 99 101 Receivable from IBRD representing prepaid pension and other postretirement benefit costs 277 286 Headquarters building: Land 89 89 Building 184 184 Less: Building depreciation (29) (24) Headquarters building, net 244 249 Deferred charges and other assets 163 169 Total receivables and other assets $ 3,428 $ 1,775
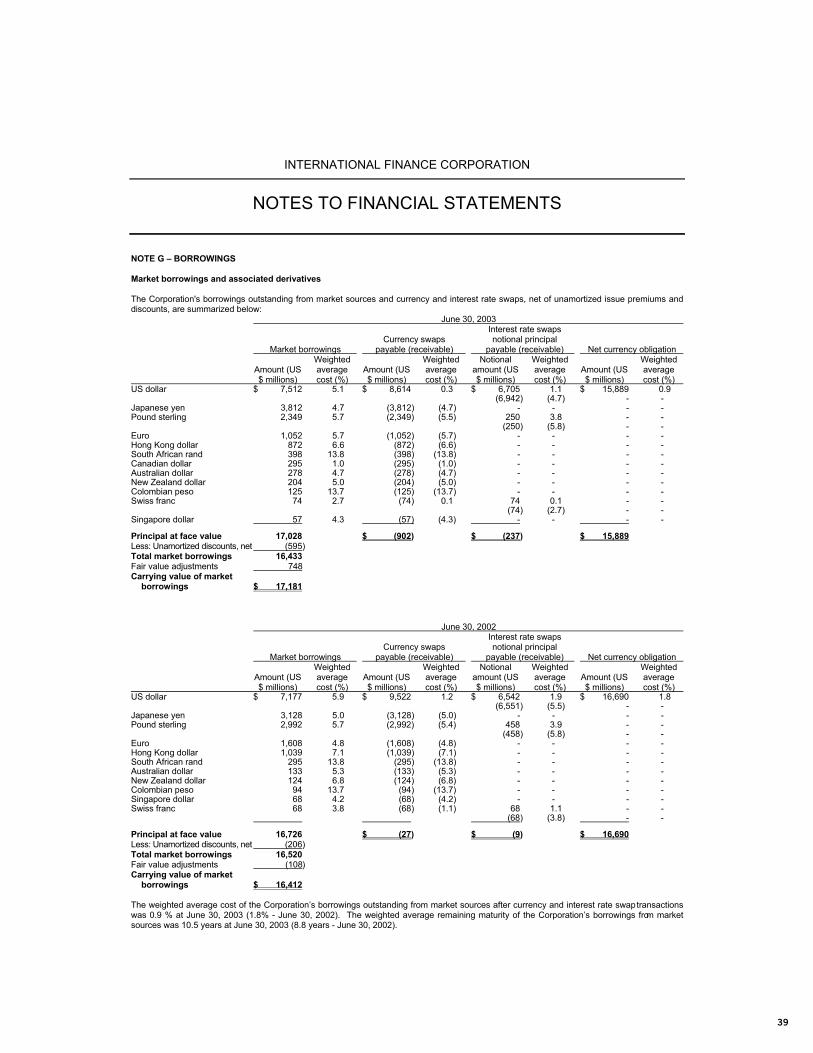
39
Page 14 INTERNATIONAL FINANCE CORPORATION
NOTES TO FINANCIAL STATEMENTS
NOTE G – BORROWINGS Market borrowings and associated derivatives The Corporation's borrowings outstanding from market sources and currency and interest rate swaps, net of unamortized issue premiums and discounts, are summarized below: June 30, 2003 Interest rate swaps Currency swaps notional principal Market borrowings payable (receivable) payable (receivable) Net currency obligation Weighted Weighted Notional Weighted Weighted Amount (US average Amount (US average amount (US average Amount (US average $ millions) cost (%) $ millions) cost (%) $ millions) cost (%) $ millions) cost (%) US dollar $ 7,512 5.1 $ 8,614 0.3 $ 6,705 1.1 $ 15,889 0.9 (6,942) (4.7) - - Japanese yen 3,812 4.7 (3,812) (4.7) - - - - Pound sterling 2,349 5.7 (2,349) (5.5) 250 3.8 - - (250) (5.8) - - Euro 1,052 5.7 (1,052) (5.7) - - - - Hong Kong dollar 872 6.6 (872) (6.6) - - - - South African rand 398 13.8 (398) (13.8) - - - - Canadian dollar 295 1.0 (295) (1.0) - - - - Australian dollar 278 4.7 (278) (4.7) - - - - New Zealand dollar 204 5.0 (204) (5.0) - - - - Colombian peso 125 13.7 (125) (13.7) - - - - Swiss franc 74 2.7 (74) 0.1 74 0.1 - - (74) (2.7) - - Singapore dollar 57 4.3 (57) (4.3) - - - -
Principal at face value 17,028 $ (902) $ (237) $ 15,889 Less: Unamortized discounts, net (595) Total market borrowings 16,433 Fair value adjustments 748 Carrying value of market borrowings $ 17,181 June 30, 2002 Interest rate swaps Currency swaps notional principal Market borrowings payable (receivable) payable (receivable) Net currency obligation Weighted Weighted Notional Weighted Weighted Amount (US average Amount (US average amount (US average Amount (US average $ millions) cost (%) $ millions) cost (%) $ millions) cost (%) $ millions) cost (%) US dollar $ 7,177 5.9 $ 9,522 1.2 $ 6,542 1.9 $ 16,690 1.8 (6,551) (5.5) - - Japanese yen 3,128 5.0 (3,128) (5.0) - - - - Pound sterling 2,992 5.7 (2,992) (5.4) 458 3.9 - - (458) (5.8) - - Euro 1,608 4.8 (1,608) (4.8) - - - - Hong Kong dollar 1,039 7.1 (1,039) (7.1) - - - - South African rand 295 13.8 (295) (13.8) - - - - Australian dollar 133 5.3 (133) (5.3) - - - - New Zealand dollar 124 6.8 (124) (6.8) - - - - Colombian peso 94 13.7 (94) (13.7) - - - - Singapore dollar 68 4.2 (68) (4.2) - - - - Swiss franc 68 3.8 (68) (1.1) 68 1.1 - - (68) (3.8) - -
Principal at face value 16,726 $ (27) $ (9) $ 16,690 Less: Unamortized discounts, net (206) Total market borrowings 16,520 Fair value adjustments (108) Carrying value of market borrowings $ 16,412 The weighted average cost of the Corporation’s borrowings outstanding from market sources after currency and interest rate swap transactions was 0.9 % at June 30, 2003 (1.8% - June 30, 2002). The weighted average remaining maturity of the Corporation’s borrowings from market sources was 10.5 years at June 30, 2003 (8.8 years - June 30, 2002).

40
Page 15 INTERNATIONAL FINANCE CORPORATION
NOTES TO FINANCIAL STATEMENTS
Net fair value adjustments to the carrying value of market borrowings comprises $748 million ($(108) million - June 30, 2002) representing adjustments to the carrying value of transactions in designated fair value hedging relationships. The net nominal amount receivable from currency swaps of $ 902 million and the net notional amount receivable from interest rate swaps of $237 million at June 30, 2003 ($27 million and $9 million - June 30, 2002), shown in the above table, are represented by currency and interest rate swap assets at fair value of $1,590 million and currency and interest rate swap liabilities at fair value of $166 million ($722 million and $605 million - June 30, 2002), included in derivative assets and derivative liabilities, respectively, on the balance sheet. Borrowings from IBRD Borrowings outstanding from IBRD are summarized below: June 30, 2003 June 30, 2002 Principal Weighted Principal Weighted amount average amount average (US$ millions) cost (%) (US$ millions) cost (%) US dollar $ 102 6.4 $ 124 6.5 Euro 15 8.0 22 7.7 Other currencies 17 6.1 23 6.0 Total borrowings outstanding from IBRD $ 134 $ 169 The weighted average remaining maturity of borrowings from IBRD was 3.7 years at June 30, 2003 (4.5 years - June 30, 2002). There were no undrawn balances on committed borrowings from IBRD at June 30, 2003 ($nil - June 30, 2002). Charges on borrowings for the year ended June 30, 2003 includes $10 million ($12 million - year ended June 30, 2002; $16 million - year ended June 30, 2001) in respect of IBRD borrowings. Maturity of borrowings The principal amounts repayable on borrowings outstanding in all currencies, gross of any premiums or discounts, during the years ending June 30, 2004 through June 30, 2008 and thereafter are summarized below (US$ millions): 2004 2005 2006 2007 2008 Thereafter Total Borrowings from market sources $ 2,381 $ 1,945 $ 1,423 $ 1,566 $ 1,590 $ 8,123 $ 17,028 Borrowings from IBRD 38 41 24 18 8 5 134 Total borrowings, gross $ 2,419 $ 1,986 $ 1,447 $ 1,584 $ 1,598 $ 8,128 17,162 Less: Unamortized discounts, net (595) Fair value adjustments 748 Carrying value of borrowings $ 17,315 After the effect of interest rate and currency swaps, the Corporation’s borrowings generally reprice within one year. NOTE H – PAYABLES AND OTHER LIABILITIES Payables and other liabilities are summarized below (US$ millions): June 30, 2003 June 30, 2002 Accrued charges on borrowings $ 285 $ 345 Accrued charges on derivative instruments 192 209 Payables for purchases of securities 2,388 598 Accounts payable, accrued expenses and other liabilities 212 143 Deferred income 45 48 Total payables and other liabilities $ 3,122 $ 1,343 NOTE I – CAPITAL STOCK The Corporation's authorized share capital was increased to $2,450 million through two capital increases in 1992. The subscription and payment period for shares then allocated ended on August 1, 1999, but the Corporation has agreed to defer the payment date for certain member countries beyond this date. Pursuant to these arrangements, $2 million of subscribed shares remained unpaid at June 30, 2003 ($2 million - June 30, 2002). During the year ended June 30, 2003, no shares were subscribed by member countries (92 shares at a par value of $1,000 each - year ended June 30, 2002). No monies were paid in on account of subscriptions in the year ended June 30, 2003 (less than $1 million - year ended June 30, 2002).
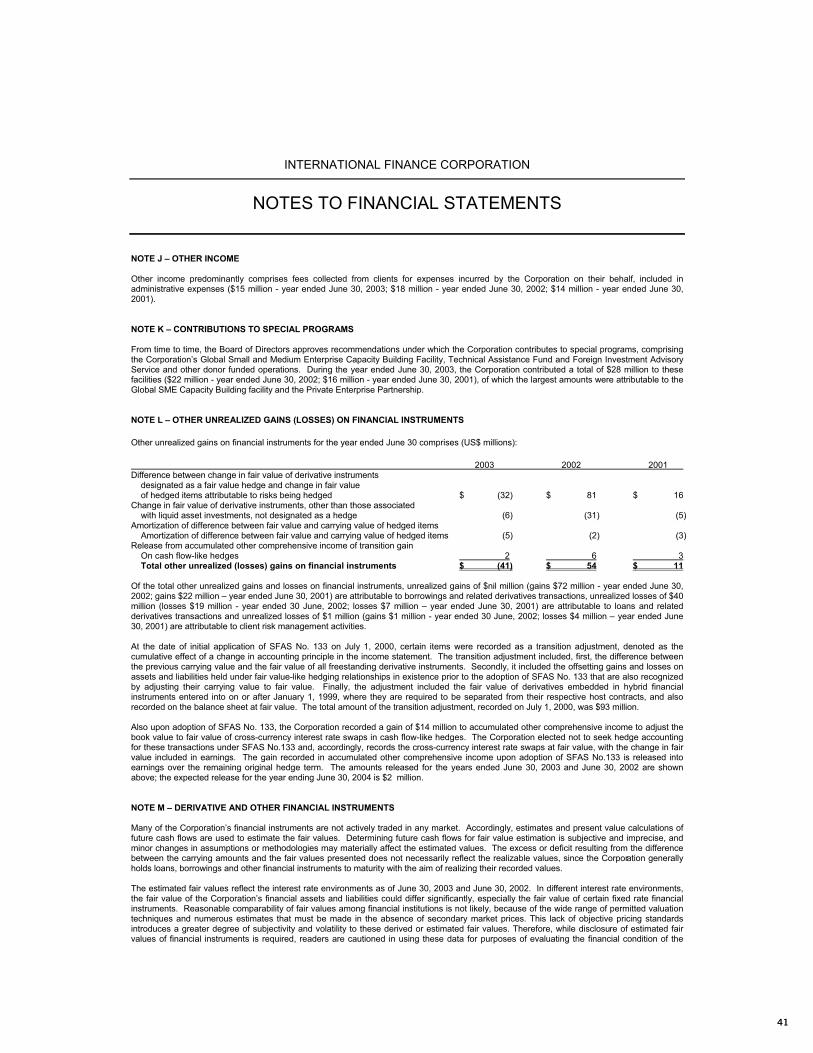
41
Page 16 INTERNATIONAL FINANCE CORPORATION
NOTES TO FINANCIAL STATEMENTS
NOTE J – OTHER INCOME Other income predominantly comprises fees collected from clients for expenses incurred by the Corporation on their behalf, included in administrative expenses ($15 million - year ended June 30, 2003; $18 million - year ended June 30, 2002; $14 million - year ended June 30, 2001). NOTE K – CONTRIBUTIONS TO SPECIAL PROGRAMS From time to time, the Board of Directors approves recommendations under which the Corporation contributes to special programs, comprising the Corporation’s Global Small and Medium Enterprise Capacity Building Facility, Technical Assistance Fund and Foreign Investment Advisory Service and other donor funded operations. During the year ended June 30, 2003, the Corporation contributed a total of $28 million to these facilities ($22 million - year ended June 30, 2002; $16 million - year ended June 30, 2001), of which the largest amounts were attributable to the Global SME Capacity Building facility and the Private Enterprise Partnership. NOTE L – OTHER UNREALIZED GAINS (LOSSES) ON FINANCIAL INSTRUMENTS
Other unrealized gains on financial instruments for the year ended June 30 comprises (US$ millions):
2003 2002 2001 Difference between change in fair value of derivative instruments designated as a fair value hedge and change in fair value of hedged items attributable to risks being hedged $ (32) $ 81 $ 16 Change in fair value of derivative instruments, other than those associated with liquid asset investments, not designated as a hedge (6) (31) (5) Amortization of difference between fair value and carrying value of hedged items Amortization of difference between fair value and carrying value of hedged items (5) (2) (3) Release from accumulated other comprehensive income of transition gain On cash flow-like hedges 2 6 3 Total other unrealized (losses) gains on financial instruments $ (41) $ 54 $ 11 Of the total other unrealized gains and losses on financial instruments, unrealized gains of $nil million (gains $72 million - year ended June 30, 2002; gains $22 million – year ended June 30, 2001) are attributable to borrowings and related derivatives transactions, unrealized losses of $40 million (losses $19 million - year ended 30 June, 2002; losses $7 million – year ended June 30, 2001) are attributable to loans and related derivatives transactions and unrealized losses of $1 million (gains $1 million - year ended 30 June, 2002; losses $4 million – year ended June 30, 2001) are attributable to client risk management activities. At the date of initial application of SFAS No. 133 on July 1, 2000, certain items were recorded as a transition adjustment, denoted as the cumulative effect of a change in accounting principle in the income statement. The transition adjustment included, first, the difference between the previous carrying value and the fair value of all freestanding derivative instruments. Secondly, it included the offsetting gains and losses on assets and liabilities held under fair value-like hedging relationships in existence prior to the adoption of SFAS No. 133 that are also recognized by adjusting their carrying value to fair value. Finally, the adjustment included the fair value of derivatives embedded in hybrid financial instruments entered into on or after January 1, 1999, where they are required to be separated from their respective host contracts, and also recorded on the balance sheet at fair value. The total amount of the transition adjustment, recorded on July 1, 2000, was $93 million. Also upon adoption of SFAS No. 133, the Corporation recorded a gain of $14 million to accumulated other comprehensive income to adjust the book value to fair value of cross-currency interest rate swaps in cash flow-like hedges. The Corporation elected not to seek hedge accounting for these transactions under SFAS No.133 and, accordingly, records the cross-currency interest rate swaps at fair value, with the change in fair value included in earnings. The gain recorded in accumulated other comprehensive income upon adoption of SFAS No.133 is released into earnings over the remaining original hedge term. The amounts released for the years ended June 30, 2003 and June 30, 2002 are shown above; the expected release for the year ending June 30, 2004 is $2 million. NOTE M – DERIVATIVE AND OTHER FINANCIAL INSTRUMENTS Many of the Corporation’s financial instruments are not actively traded in any market. Accordingly, estimates and present value calculations of future cash flows are used to estimate the fair values. Determining future cash flows for fair value estimation is subjective and imprecise, and minor changes in assumptions or methodologies may materially affect the estimated values. The excess or deficit resulting from the difference between the carrying amounts and the fair values presented does not necessarily reflect the realizable values, since the Corporation generally holds loans, borrowings and other financial instruments to maturity with the aim of realizing their recorded values. The estimated fair values reflect the interest rate environments as of June 30, 2003 and June 30, 2002. In different interest rate environments, the fair value of the Corporation’s financial assets and liabilities could differ significantly, especially the fair value of certain fixed rate financial instruments. Reasonable comparability of fair values among financial institutions is not likely, because of the wide range of permitted valuation techniques and numerous estimates that must be made in the absence of secondary market prices. This lack of objective pricing standards introduces a greater degree of subjectivity and volatility to these derived or estimated fair values. Therefore, while disclosure of estimated fair values of financial instruments is required, readers are cautioned in using these data for purposes of evaluating the financial condition of the

42
Page 17 INTERNATIONAL FINANCE CORPORATION
NOTES TO FINANCIAL STATEMENTS
Corporation. The fair values of the individual financial instruments do not represent the fair value of the Corporation taken as a whole. The methodologies used and key assumptions made to estimate fair values as of June 30, 2003 and June 30, 2002 are summarized below. Liquid assets - The estimated fair value of time deposits and the trading securities portfolio are based on quoted market prices and the present value of estimated future cash flows using appropriate discount rates. Derivative instruments - Fair values for covered forwards were derived by using quoted market forward exchange rates. Fair values for other derivative instruments were derived by determining the present value of estimated future cash flows using appropriate discount rates. Loans and loan commitments - The Corporation generally has not sold its loans from the portfolio, and there is no comparable secondary market. Fair values for fixed rate loans and loan commitments were determined using a discounted cash flow model based on a discount rate comprising the fixed rate loan spread plus the year-end estimated cost of funds. Since rates on variable rate loans and loan commitments are generally reset on a quarterly or semiannual basis, the carrying value adjusted for credit risk was determined to be the best estimate of fair value. The Corporation also holds options to convert loans into equity of certain of its investee companies. Fair values of these conversion options are based on quoted market prices or other calculated values of the underlying equity investment. Equity investments - Fair values were determined using market prices where available, put option prices, book values or cost, certain of which were discounted based upon management’s estimate of net realizable value. Where market prices were not available or alternate valuation techniques were not practical, cost was determined to be the best estimate of fair value. Prior to the year ended June 30, 2003, management’s estimate of fair value considered the relative illiquidity and volatility, as well as the overall business constraints, in the emerging markets in which the Corporation invests. Pursuant to a review of equity valuation methodologies undertaken in the year ended June 30, 2003, the Corporation no longer considers such factors in estimating the fair value of equity investments. Prior year numbers have been restated for comparability purposes. Borrowings - Fair values were derived by determining the present value of estimated future cash flows using appropriate discount rates. Estimated fair values of the Corporation’s financial assets and liabilities and off-balance sheet financial instruments are summarized below (US$ millions). The Corporation’s credit exposure is represented by the estimated fair values of its financial assets. June 30, 2003 June 30, 2002 Carrying Fair value amount adjustments Fair value Fair value Financial assets Due from banks, time deposits, securities and securities purchased under resale agreements $ 17,004 $ - $ 17,004 $ 16,924 Loans 9,242 414 9,656 8,296 Equity investments 2,760 1,801 4,561 4,246 Total loans and equity investments 12,002 2,215 14,217 12,542 Reserve against losses (2,625) - (2,625) (2,771) Net loans and equity investments 9,377 2,215 11,592 9,771 Derivative assets: Liquid asset portfolio-related 64 - 64 164 Loans-related 12 - 12 42 Borrowings-related 1,590 - 1,590 821 Client risk management-related 68 - 68 50 Total derivative assets 1,734 - 1,734 1,077 Nonfinancial assets 3,428 - 3,428 1,775 Total assets $ 31,543 $ 2,215 $ 33,758 $ 29,547 Financial liabilities Securities sold under repurchase agreements and payable for cash collateral received $ 3,053 $ - $ 3,053 $ 1,935 Market and IBRD borrowings outstanding 17,315 (8) 17,307 16,599 Derivative liabilities: Liquid asset portfolio-related 874 - 874 497 Loans-related 154 - 154 47 Borrowings-related 166 - 166 985 Client risk management-related 70 70 47 Total derivative liabilities 1,264 (8) 1,264 1,576 Nonfinancial liabilities 3,122 - 3,122 1,343 Total liabilities $ 24,754 $ (8) $ 24,746 $ 21,453

43
Page 18 INTERNATIONAL FINANCE CORPORATION
NOTES TO FINANCIAL STATEMENTS
June 30, 2003 June 30, 2002 Carrying Fair value amount adjustments Fair value Fair value Off-balance sheet financial instruments Loan commitments $ 2,697 $ 15 $ 2,712 $ 2,605 Guarantees Signed 1,080 - 1,080 794 Outstanding 314 - 314 223 NOTE N – CURRENCY POSITION The Corporation conducts its operations for its loans, time deposits and securities and borrowings in multiple currencies. The Corporation’s policy is to minimize the level of currency risk by closely matching the currency of its assets (other than equity investments and quasi-equity investments) and liabilities by using hedging instruments. The Corporation’s equity investments in enterprises located in its developing member countries are typically made in the local currency of the country. As a matter of policy, the Corporation carries the currency risk of equity investments and quasi-equity investments and funds these investments from its capital and retained earnings. The following table summarizes the Corporation’s exposure in major currencies at June 30, 2003 and June 30, 2002 (US$ millions): June 30, 2003 Japanese Other Fair value US dollar Euro yen currencies adjustments Total Assets Cash and cash equivalents $ 9,142 $ 2,695 $ 1,009 $ 112 $ - $ 12,958 Securities purchased under resale agreements 4,046 - - - - 4,046 Loans disbursed and outstanding 7,977 907 27 318 13 9,242 Equity investments disbursed and outstanding - - - 2,760 - 2,760 Total investments 7,977 907 27 3,078 13 12,002
Reserve against losses (2,398) (185) (4) (38) - (2,625) Net investments 5,579 722 23 3,040 13 9,377 Derivative assets 3,810 1,409 4,148 4,418 (12,051) 1,734 Receivables and other assets 3,082 198 87 61 - 3,428 Total assets $ 25,659 $ 5,024 $ 5,267 $ 7,631 $ (12,038) $ 31,543 Liabilities Securities sold under repurchase agreements and payable for cash collateral received $ 2,675 $ 378 $ - $ - $ - $ 3,053 Borrowings 7,369 1,048 3,821 4,329 748 17,315 Derivative liabilities 9,054 3,308 1,373 436 (12,907) 1,264 Payables and other liabilities 2,756 176 79 111 - 3,122 Total liabilities $ 21,854 $ 4,910 $ 5,273 $ 4,876 $ (12,159) $ 24,754

44
Page 19 INTERNATIONAL FINANCE CORPORATION
NOTES TO FINANCIAL STATEMENTS
June 30, 2002 Japanese Other Fair value US dollar Euro yen currencies adjustments Total Assets Cash and cash equivalents $ 12,988 $ 2,176 $ 1,074 $ 123 $ - $ 16,361 Securities purchased under resale agreements 563 - - - - 563 Loans disbursed and outstanding 7,155 654 35 174 15 8,033 Equity investments disbursed and outstanding - - - 2,702 (1) 2,701 Total investments 7,155 654 35 2,876 14 10,734
Reserve against losses (2,584) (157) (8) (22) - (2,771) Net investments 4,571 497 27 2,854 14 7,963 Derivative assets 3,980 1,743 3,472 4,720 (12,838) 1,077 Receivables and other assets 1,429 126 72 148 - 1,775 Total assets $ 23,531 $ 4,542 $ 4,645 $ 7,845 $ (12,824) $ 27,739 Liabilities Securities sold under repurchase agreements and payable for cash collateral received $ 1,826 $ 109 $ - $ - $ - $ 1,935 Borrowings 7,293 1,610 3,142 4,644 (108) 16,581 Derivative liabilities 10,076 2,623 1,441 317 (12,881) 1,576 Payables and other liabilities 1,028 108 64 143 - 1,343 Total liabilities $ 20,223 $ 4,450 $ 4,647 $ 5,104 $ (12,989) $ 21,435
NOTE O – SEGMENT REPORTING For management purposes, the Corporation’s business comprises two segments: client services and treasury services. The client services segment consists primarily of lending and equity investment activities. The treasury services segment consists of the borrowing, liquid asset management, asset and liability management and client risk management activities. The assessment of segment performance by senior management includes net income for each segment, return on assets, and return on capital employed. The Corporation’s management reporting system and policies are used to determine revenues and expenses attributable to each segment. Consistent with internal reporting, administrative expenses are allocated to each segment based largely upon personnel costs and segment head counts. Transactions between segments are immaterial and, thus, are not a factor in reconciling to the consolidated data. The accounting policies of the Corporation’s segments are, in all material respects, consistent with those described in note A, “Summary of Significant Accounting and Related Policies.” An analysis of the Corporation’s major components of income and expense by business segment for the years ended June 30, 2003, 2002 and 2001 is given below (US$ millions): 2003 2002 2001 Client Treasury Client Treasury Client Treasury services services Total services services Total services services Total Interest income $ 477 $ 318 $ 795 $ 547 $ 493 $ 1,040 $ 732 $ 773 $ 1,505 Charges on borrowings (79) (147) (226) (151) (287) (438) (403) (558) (961) Net gains and losses on trading activities - 157 157 - 31 31 - 87 87 Income from equity investments 195 - 195 428 - 428 222 - 222 Provision for losses (98) - (98) (657) - (657) (402) - (402) Service fees 51 - 51 40 - 40 41 - 41 Administrative expenses (326) (6) (332) (321) (6) (327) (299) (5) (304) Other noninterest income and expense (14) - (14) 44 - 44 53 - 53 Operating income (loss) 206 322 528 (70) 231 161 (56) 297 241 Unrealized gains and losses on financial instruments (2) (39) (41) (18) 72 54 12 92 104 Net income (loss) $ 204 $ 283 $ 487 $ (88) $ 303 $ 215 $ (44) $ 389 $ 345 During the year ended June 30, 2003, the Corporation changed its method of allocating certain costs among business units within the Corporation. Segment disclosures for the years ended June 30, 2002 and June 30, 2001 have been restated to be consistent with the new allocation method. Geographical segment data in respect of client services are disclosed in Note C, and are not relevant in respect of treasury services.

45
Page 20 INTERNATIONAL FINANCE CORPORATION
NOTES TO FINANCIAL STATEMENTS
NOTE P – PENSION AND OTHER POSTRETIREMENT BENEFITS IBRD has a defined benefit Staff Retirement Plan (SRP), a Retired Staff Benefits Plan (RSBP) and a Post-Employment Benefits Plan (PEBP) that cover substantially all of its staff members as well as the staff of the Corporation and of MIGA. The SRP provides regular pension benefits and includes a cash balance plan. The RSBP provides certain health and life insurance benefits to eligible retirees. The PEBP provides pension benefits administered outside the SRP. All costs associated with these plans are allocated between IBRD, the Corporation, and MIGA based upon their employees’ respective participation in the plans. In addition, the Corporation and MIGA reimburse IBRD for their share of any contributions made to these plans by IBRD. Net cost from the SRP allocated to the Corporation for the year ended June 30, 2003 was $15 million ($36 million - year ended June 30, 2002; $50 million - year ended June 30, 2001). The portion of the cost for the RSBP and the PEBP attributable to the Corporation for the fiscal year ended June 30, 2003 was $9 million ($5 million - year ended June 30, 2002; $3 million - year ended June 30, 2001). In addition, at June 30, 2003 $277 million was receivable by the Corporation from IBRD ($286 million - June 30, 2002), representing the accumulated excess of its contributions to pension and other postretirement benefit assets over its allocated net periodic pension and other postretirement benefit cost. NOTE Q – SERVICE AND SUPPORT PAYMENTS The Corporation obtains certain administrative and overhead services from IBRD in those areas where common services can be efficiently provided by IBRD. This includes shared costs of the Boards of Governors and Directors, and other services such as communications, internal auditing, administrative support, supplies and insurance. Payments for these services are made by the Corporation to IBRD based on negotiated fees, chargebacks and allocated charges, where chargeback is not feasible. Expenses allocated to the Corporation for the year ended June 30, 2003, were $19 million, unchanged from years ended June 30, 2002 and June 30, 2001. NOTE R – REORGANIZATION COSTS On March 8, 2002 the Corporation adopted a Strategic Directions Paper articulating its strategic priorities, being: frontier markets; high impact sectors; and support for small to medium sized enterprises. To achieve these strategic priorities, in late March, the Corporation began a major internal reorganization planning exercise designed to sharpen the focus on the needs of the Corporation’s clients, strengthen developmental impact, increase the volume of high quality assets, and provide counter-cyclical support in countries affected by volatility in capital flows. Details and particulars of the reorganization plan were finalized and announced during the quarter ended June 30, 2002. The plan involved staff reductions, field office closings and reorganizations, and a headquarters reorganization which was substantially concluded during the year ending June 30, 2003. The Corporation charged $13 million associated with the reorganization, included in administrative expenses in the income statement for the year ended June 30, 2002. The charge primarily represented costs associated with termination benefits (including outplacement consulting, job search assistance, training, medical insurance plan contributions, severance payments and related tax allowances) for 115 staff identified for separation as of June 30, 2002 and an additional amount, less than $1 million, associated with various field office closures and reorganizations. Actual expenses paid during the year ended June 30, 2003 and June 30, 2002 totaled $11 million. $1 million of the original accrual is expected to be paid in the year ending June 30, 2004. As a result, the original accrual has been revised downwards by $1 million. NOTE S – TRUST FUNDS The Corporation uses the services of IBRD to administer funds on behalf of donors which are restricted for specific uses, including technical assistance, feasibility studies and project preparation, global and regional programs and research and training programs. These funds are placed in trust and are not included in the Corporation’s assets. The responsibilities of the Corporation are to arrange for services generally not otherwise provided by it including full project implementation and procurement of goods and services. The distribution of Trust Fund assets by executing agent is as follows (US$ millions): June 30, 2003 June 30, 2002 Total fiduciary Number of Total fiduciary Number of assets active funds assets active funds Executed by the Corporation $ 167 592 $ 131 568 Executed by the recipient - 2 - 3 Total $ 167 594 $ 131 571 NOTE T – CONTINGENCIES In the normal course of its business, the Corporation is from time to time named as a defendant or co-defendant in various legal actions on different grounds in various jurisdictions. Although there can be no assurances, based on the information currently available, the Corporation’s Management does not believe the outcome of any of the various existing legal actions will have a material adverse effect on the Corporation’s financial condition or results of operations.

Investment Portfolio
2 0 0 3 A N N U A L R E P O R T
46
SUB-SAHARAN AFRICA 49
ASIA & THE PACIFIC 59
EUROPE & CENTRAL ASIA 69
LATIN AMERICA & THE CARIBBEAN 79
MIDDLE EAST & NORTH AFRICA 91
WORLDWIDE 96
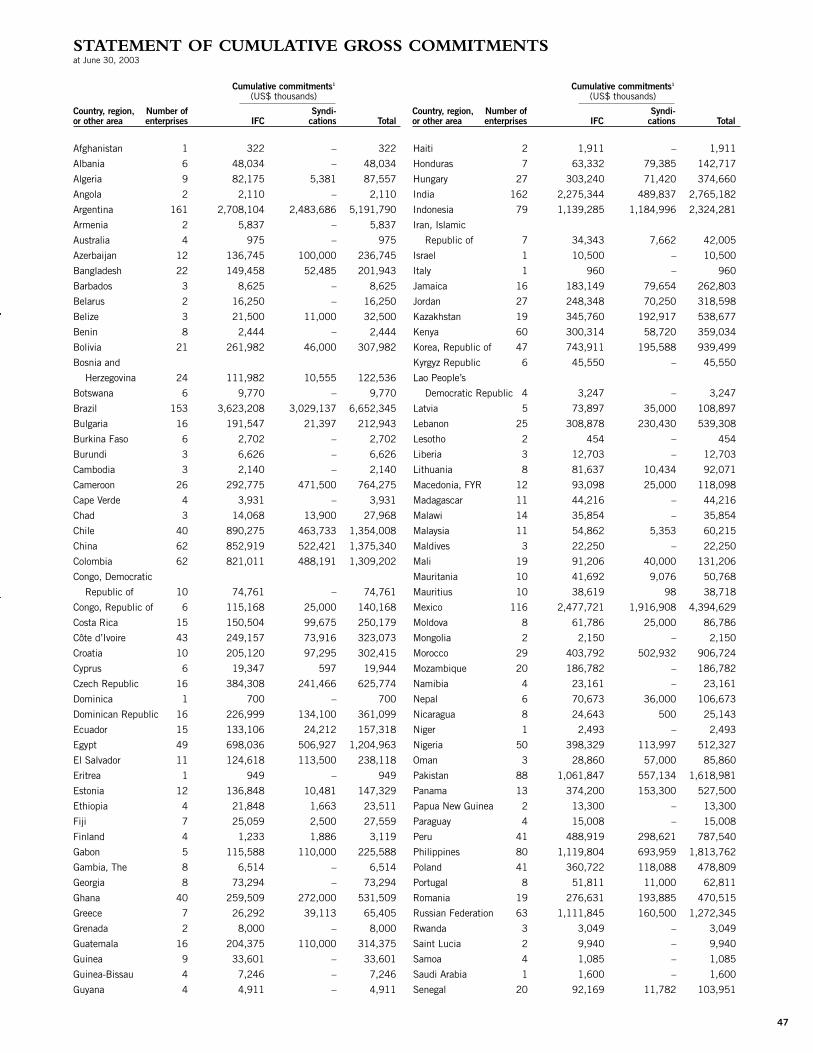
Afghanistan 1 322 – 322
Albania 6 48,034 – 48,034
Algeria 9 82,175 5,381 87,557
Angola 2 2,110 – 2,110
Argentina 161 2,708,104 2,483,686 5,191,790
Armenia 2 5,837 – 5,837
Australia 4 975 – 975
Azerbaijan 12 136,745 100,000 236,745
Bangladesh 22 149,458 52,485 201,943
Barbados 3 8,625 – 8,625
Belarus 2 16,250 – 16,250
Belize 3 21,500 11,000 32,500
Benin 8 2,444 – 2,444
Bolivia 21 261,982 46,000 307,982
Bosnia and
Herzegovina 24 111,982 10,555 122,536
Botswana 6 9,770 – 9,770
Brazil 153 3,623,208 3,029,137 6,652,345
Bulgaria 16 191,547 21,397 212,943
Burkina Faso 6 2,702 – 2,702
Burundi 3 6,626 – 6,626
Cambodia 3 2,140 – 2,140
Cameroon 26 292,775 471,500 764,275
Cape Verde 4 3,931 – 3,931
Chad 3 14,068 13,900 27,968
Chile 40 890,275 463,733 1,354,008
China 62 852,919 522,421 1,375,340
Colombia 62 821,011 488,191 1,309,202
Congo, Democratic
Republic of 10 74,761 – 74,761
Congo, Republic of 6 115,168 25,000 140,168
Costa Rica 15 150,504 99,675 250,179
Côte d’Ivoire 43 249,157 73,916 323,073
Croatia 10 205,120 97,295 302,415
Cyprus 6 19,347 597 19,944
Czech Republic 16 384,308 241,466 625,774
Dominica 1 700 – 700
Dominican Republic 16 226,999 134,100 361,099
Ecuador 15 133,106 24,212 157,318
Egypt 49 698,036 506,927 1,204,963
El Salvador 11 124,618 113,500 238,118
Eritrea 1 949 – 949
Estonia 12 136,848 10,481 147,329
Ethiopia 4 21,848 1,663 23,511
Fiji 7 25,059 2,500 27,559
Finland 4 1,233 1,886 3,119
Gabon 5 115,588 110,000 225,588
Gambia, The 8 6,514 – 6,514
Georgia 8 73,294 – 73,294
Ghana 40 259,509 272,000 531,509
Greece 7 26,292 39,113 65,405
Grenada 2 8,000 – 8,000
Guatemala 16 204,375 110,000 314,375
Guinea 9 33,601 – 33,601
Guinea-Bissau 4 7,246 – 7,246
Guyana 4 4,911 – 4,911
Haiti 2 1,911 – 1,911
Honduras 7 63,332 79,385 142,717
Hungary 27 303,240 71,420 374,660
India 162 2,275,344 489,837 2,765,182
Indonesia 79 1,139,285 1,184,996 2,324,281
Iran, Islamic
Republic of 7 34,343 7,662 42,005
Israel 1 10,500 – 10,500
Italy 1 960 – 960
Jamaica 16 183,149 79,654 262,803
Jordan 27 248,348 70,250 318,598
Kazakhstan 19 345,760 192,917 538,677
Kenya 60 300,314 58,720 359,034
Korea, Republic of 47 743,911 195,588 939,499
Kyrgyz Republic 6 45,550 – 45,550
Lao People’s
Democratic Republic 4 3,247 – 3,247
Latvia 5 73,897 35,000 108,897
Lebanon 25 308,878 230,430 539,308
Lesotho 2 454 – 454
Liberia 3 12,703 – 12,703
Lithuania 8 81,637 10,434 92,071
Macedonia, FYR 12 93,098 25,000 118,098
Madagascar 11 44,216 – 44,216
Malawi 14 35,854 – 35,854
Malaysia 11 54,862 5,353 60,215
Maldives 3 22,250 – 22,250
Mali 19 91,206 40,000 131,206
Mauritania 10 41,692 9,076 50,768
Mauritius 10 38,619 98 38,718
Mexico 116 2,477,721 1,916,908 4,394,629
Moldova 8 61,786 25,000 86,786
Mongolia 2 2,150 – 2,150
Morocco 29 403,792 502,932 906,724
Mozambique 20 186,782 – 186,782
Namibia 4 23,161 – 23,161
Nepal 6 70,673 36,000 106,673
Nicaragua 8 24,643 500 25,143
Niger 1 2,493 – 2,493
Nigeria 50 398,329 113,997 512,327
Oman 3 28,860 57,000 85,860
Pakistan 88 1,061,847 557,134 1,618,981
Panama 13 374,200 153,300 527,500
Papua New Guinea 2 13,300 – 13,300
Paraguay 4 15,008 – 15,008
Peru 41 488,919 298,621 787,540
Philippines 80 1,119,804 693,959 1,813,762
Poland 41 360,722 118,088 478,809
Portugal 8 51,811 11,000 62,811
Romania 19 276,631 193,885 470,515
Russian Federation 63 1,111,845 160,500 1,272,345
Rwanda 3 3,049 – 3,049
Saint Lucia 2 9,940 – 9,940
Samoa 4 1,085 – 1,085
Saudi Arabia 1 1,600 – 1,600
Senegal 20 92,169 11,782 103,951
Cumulative commitments1
(US$ thousands)
Country, region, Number of Syndi-or other area enterprises IFC cations Total
Cumulative commitments1
(US$ thousands)
Country, region, Number of Syndi-or other area enterprises IFC cations Total
STATEMENT OF CUMULATIVE GROSS COMMITMENTSat June 30, 2003
47

Serbia and Montenegro 15 231,824 92,610 324,434
Seychelles 6 29,359 2,500 31,859
Sierra Leone 4 29,186 – 29,186
Slovakia 5 115,544 – 115,544
Slovenia 11 211,484 52,816 264,300
Somalia 2 975 – 975
South Africa 37 257,097 15,000 272,097
Spain 5 19,043 1,635 20,678
Sri Lanka 24 121,532 23,372 144,903
Sudan 6 27,268 6,417 33,685
Swaziland 10 47,533 – 47,533
Syrian Arab Republic 3 17,200 – 17,200
Tajikistan 10 35,500 – 35,500
Tanzania 38 91,065 13,386 104,451
Thailand 56 1,021,895 1,699,670 2,721,565
Togo 7 18,255 – 18,255
Trinidad and Tobago 11 190,790 235,000 425,790
Tunisia 19 85,867 1,985 87,852
Turkey 115 2,109,402 1,352,676 3,462,078
Uganda 38 77,396 1,416 78,813
Ukraine 5 27,444 – 27,444
Uruguay 12 124,050 20,000 144,050
Uzbekistan 14 64,964 16,250 81,214
Vanuatu 1 5,398 – 5,398
Venezuela, República
Bolivariana de 35 695,870 703,791 1,399,662
Vietnam 24 229,805 203,375 433,180
Yemen, Republic of 8 39,517 750 40,267
Zambia 28 149,773 24,044 173,818
Zimbabwe 50 284,262 99,000 383,262
Regional Investments:
Sub-Saharan Africa 24 245,666 1,940 247,606
Asia & the Pacific 13 490,693 – 490,693
Europe & Central Asia 41 288,747 25,000 313,747
Latin America 41 469,394 50,000 519,394
& the Caribbean
Other2 17 59,814 8,200 68,014
Worldwide Investments 28 496,566 208,000 704,566
Total: 2990 37,245,664 22,078,977 59,324,641
1 Cumulative commitments are composed of disbursed and undisbursed balances. The undisbursedportion is revalued at current exchange rates, while the disbursed portion represents the cost ofcommitment at the time of disbursement. Excludes risk management and guarantee facilities.
2 Of this amount, $9.6 million represents investments made at a time when the authorities onTaiwan represented China in the International Finance Corporation. The balance represents invest-ments in West Bank and Gaza.
Cumulative commitments1
(US$ thousands)
Country, region, Number of Syndi-or other area enterprises IFC cations Total
Cumulative commitments1
(US$ thousands)
Country, region, Number of Syndi-or other area enterprises IFC cations Total
STATEMENT OF CUMULATIVE GROSS COMMITMENTSat June 30, 2003
48

AngolaFabrica de Bleach Corasol Limitada Chemicals FY99 0.6 – 0.6 – 0.6
0.6 0.6
BeninBank of Africa Benin (BOAB) Finance & Insurance FY93, 94, 95 0.3 – – 0.3 0.3
Finadev Microfinance Finance & Insurance FY01 0.3 – – 0.3 0.3
Vision+ Industrial & Consumer FY00 + – + – +
Products
0.7 0.7
BotswanaAbercrombie & Kent Botswana Accommodation & FY00, 01 2.8 – 2.6 – 2.6
(Proprietary) Limited Tourism Services
Africa Banking Corp Holdings Limited Finance & Insurance FY90, 02 3.0 – – 3.0 3.0
Kalahari Diamonds Limited Oil, Gas and Mining FY03 2.0 – – 2.0 2.0
2.6 5.0 7.6
BurundiFlorex Limited Agriculture & Forestry FY02 0.4 – 0.4 – 0.4
Vegetables and Flowers Exports S.A. Agriculture & Forestry FY01 0.5 – 0.6 – 0.6
0.9 0.9
CameroonBanque International du Cameroun Finance & Insurance FY01 0.9 – – 0.9 0.9
Pour L’Épargne et le Crédit
Cameroon Oil Transportation Company Oil, Gas and Mining FY01 86.1 86.1 86.1 – 86.1
Complexe Avicole de Mvog-Betsi Agriculture & Forestry FY96 0.3 – 0.3 – 0.3
Cotonnière Industrielle du Textiles, Apparel & FY86 6.5 – 2.2 – 2.2
Cameroun (CICAM) Leather
FME-GAZ Chemicals FY02 0.3 – 0.4 – 0.4
Horizon Bilingual Education Complex Education Services FY01 0.4 – 0.4 – 0.4
Notacam S.A. Textiles, Apparel & FY97 0.9 – 0.8 – 0.8
Leather
Pecten Cameroon Company Oil, Gas and Mining FY92, 96, 97, 98, 03 115.0 253.2 44.0 – 44.0
Société Agro-Industrielle et Agriculture & Forestry FY00 0.4 – 0.3 – 0.3
Commerciale du Cameroun (SAICAM)
Société Camerounaise de Mobiles Information FY02 4.3 – 5.0 – 5.0
Société de Transports et Transportation and FY03 0.8 – 0.8 – 0.8
Negoces du Cameroun SARL Warehousing
Société de Production, de Légumes S.A. Agriculture & Forestry FY94, 97 1.5 – – 0.4 0.4
140.3 1.2 141.5
Cape VerdeGrowela Cabo Verde, Limitada Textiles, Apparel & FY94 1.0 – 0.1 – 0.1
Leather
Moura Company Transportation and FY02 0.6 – 0.6 – 0.6
Warehousing
0.8 0.8
Original commitments1 Investments held for IFC(US$ millions) (US$ millions)
Fiscal Year in Totalwhich commitments syndi- Equity Total loans
Country, region or other area, and obligor Sector were made Total IFC cations Loans (at cost) and equity
SUB-SAHARAN AFRICAat June 30, 2003
49

ChadFinadev Tchad Finance & Insurance FY03 0.2 – – 0.2 0.2
Tchad Oil Transportation Oil, Gas and Mining FY01 13.9 13.9 13.9 – 13.9
Company S.A. (TOTCO)
13.9 0.2 14.1
Congo, Democratic Republic ofCeltel Congo (RDC), S.p.r.l. Information FY02 7.0 – 6.0 – 6.0
Celtel Democratic Republic of Congo Information FY03 20.0 – 20.0 – 20.0
26.0 26.0
Côte d’IvoireAfricaine De Bourse Finance & Insurance FY00 + – – + +
Bank of Africa (Cote d’Ivoire) Finance & Insurance FY99 0.2 – – 0.2 0.2
Cinergy, SA Utilities FY99 40.5 30.3 32.1 – 32.1
Compagnie Ivoirienne de Utilities FY95 19.1 – 4.0 – 4.0
Production d’Électricité S.A.
Drop Ivoire Food & Beverages FY99 1.2 – 1.3 – 1.3
FTG–Filature et Tissage Gonfreville Textiles, Apparel & FY96 – – 0.2 – 0.2
Leather
Industrial Promotion Services Collective FY88 0.8 – – 0.8 0.8
(Côte d’Ivoire) S.A. Investment Vehicles
Multi-Produits S.A. Wholesale and FY94, 97 0.8 – + + +
Retail Trade
Ocean Energy, Inc. Oil, Gas and Mining FY93, 95, 98 48.7 – – 48.7 48.7
Omnium Chimique et Cosmétique Food & Beverages FY87, 94, 97 9.2 – – 2.4 2.4
(COSMIVOIRE)
Pétro Ivoire S.A. Utilities FY96, 00 1.6 – 0.6 – 0.6
Société Hotelière de la Lagune Accommodation & FY00 2.0 – 1.8 0.4 2.2
Tourism Services
Société Medicale de Moyens et Health Care FY01 1.1 – 1.5 – 1.5
d’Equipements–SIMMEQ, S.A.
Société Pour le Développement Agriculture & Forestry FY97 2.8 – 3.5 – 3.5
Industriel de la Région d’Odienné
Texicodi S.A. Textiles, Apparel & FY96 – – 0.3 – 0.3
Leather
Tropical Rubber Agriculture & Forestry FY99 3.2 – 2.7 – 2.7
Établissements R. Gonfreville, S.A. Textiles, Apparel & FY77, 87 12.0 – – + +
Leather
48.0 52.6 100.6
GabonVaalco Energy, Inc. Oil, Gas and Mining FY02 10.0 – 9.0 – 9.0
9.0 9.0
Gambia, TheKerr Kande Farm Limited II Agriculture & Forestry FY98 0.2 – 0.2 – 0.2
Lyefish Company Limited Food & Beverages FY95 0.4 – 0.4 – 0.4
Ndebaan Medi–Services Company Health Care FY94 0.2 – 0.2 – 0.2
Limited
0.8 0.8
Original commitments1 Investments held for IFC(US$ millions) (US$ millions)
Fiscal Year in Totalwhich commitments syndi- Equity Total loans
Country, region or other area, and obligor Sector were made Total IFC cations Loans (at cost) and equity
SUB–SAHARAN AFRICAat June 30, 2003
50

GhanaAfariwaa Farms and Livestock Agriculture & Forestry FY94 0.4 – 0.2 – 0.2
Products Limited
Antelope Company Limited Chemicals FY97 0.3 – 0.3 – 0.3
CAL Merchant Bank Limited Finance & Insurance FY90, 91, 93 8.9 – – 0.9 0.9
Diamond Cement Ghana Limited Nonmetallic Mineral FY02 6.0 – 5.0 1.0 6.0
Product Manufacturing
Enterprise Life Assurance Finance & Insurance FY01 0.1 – – 0.1 0.1
Company Ltd. (ELAC)
Ghana Aluminium Products Primary Metals FY92 0.4 – – 0.4 0.4
Limited (Ghanal)
Ghana Leasing Company Limited Finance & Insurance FY93, 94 5.8 – – 1.5 1.5
Ghana Printing and Packaging Pulp & Paper FY02 1.7 – 1.7 – 1.7
Industries Limited
Ghanaian Australian Goldfields Limited Oil, Gas and Mining FY90, 92, 96, 97 27.2 18.5 9.9 2.5 12.4
Network Computer Systems (NCS) Information FY98 0.7 – 0.5 – 0.5
NIIT Computer Training School Education Services FY01 0.2 – 0.2 – 0.2
Pharmacare Industries Company Limited Chemicals FY00 0.4 – 0.2 – 0.2
Professional Technical Services Limited Industrial & FY98 0.3 – 0.3 – 0.3
Consumer Products
Shangri-la Hotel Accommodation & FY95 0.4 – 0.9 – 0.9
Tourism Services
Sikaman Savings and Loan Finance & Insurance FY01 0.5 – – 0.5 0.5
Company Limited
Tacks Farms Ghana Limited Agriculture & Forestry FY97 0.4 – 0.4 – 0.4
19.6 6.9 26.5
GuineaAgro Investment Company S.A. Agriculture & Forestry FY98 0.2 – 0.1 – 0.1
Société Aurifère de Guinée S.A. Oil, Gas and Mining FY92, 88 8.3 – + – +
Société Guinéenne d’Hôtellerie Accommodation & FY95, 99 4.5 – 3.3 0.6 3.8
et d’Investissements (SGHI) Tourism Services
3.4 0.6 4.0
Guinea-BissauAgribissau, S.A.R.L. Agriculture & Forestry FY95 0.8 – 0.1 – 0.1
Banco de Africa Occidental, S.A.R.L. Finance & Insurance FY00 0.3 – – 0.3 0.3
0.1 0.3 0.3
KenyaAAA Growers Limited Agriculture & Forestry FY00 0.5 – 0.6 – 0.6
AAR Health Services Limited Health Care FY98 0.5 – – 0.5 0.5
Allpack Industries Limited Pulp & Paper FY92 0.4 – – 0.4 0.4
Anspar Beverages Limited and Food & Beverages FY00 2.7 – 2.0 0.7 2.7
Anspar Distributors Limited
Ceres Estates Limited Food & Beverages FY97 0.9 – 0.9 – 0.9
Deras Limited Textiles, Apparel & FY99 1.0 – 1.0 – 1.0
Leather
Development Bank of Kenya Limited Finance & Insurance FY80, 84, 98 12.4 – 3.0 1.3 4.3
Diamond Trust of Kenya Limited Finance & Insurance FY82 0.8 – – 0.8 0.8
Equitea EPZ Company Ltd. Food & Beverages FY98 0.4 – 0.3 0.1 0.4
Future Hotels Limited Accommodation & FY93 0.5 – 0.1 – 0.1
Tourism Services
Gapco Kenya Wholesale and FY02 15.0 – 15.0 – 15.0
Retail Trade
Original commitments1 Investments held for IFC(US$ millions) (US$ millions)
Fiscal Year in Totalwhich commitments syndi- Equity Total loans
Country, region or other area, and obligor Sector were made Total IFC cations Loans (at cost) and equity
SUB–SAHARAN AFRICAat June 30, 2003
51
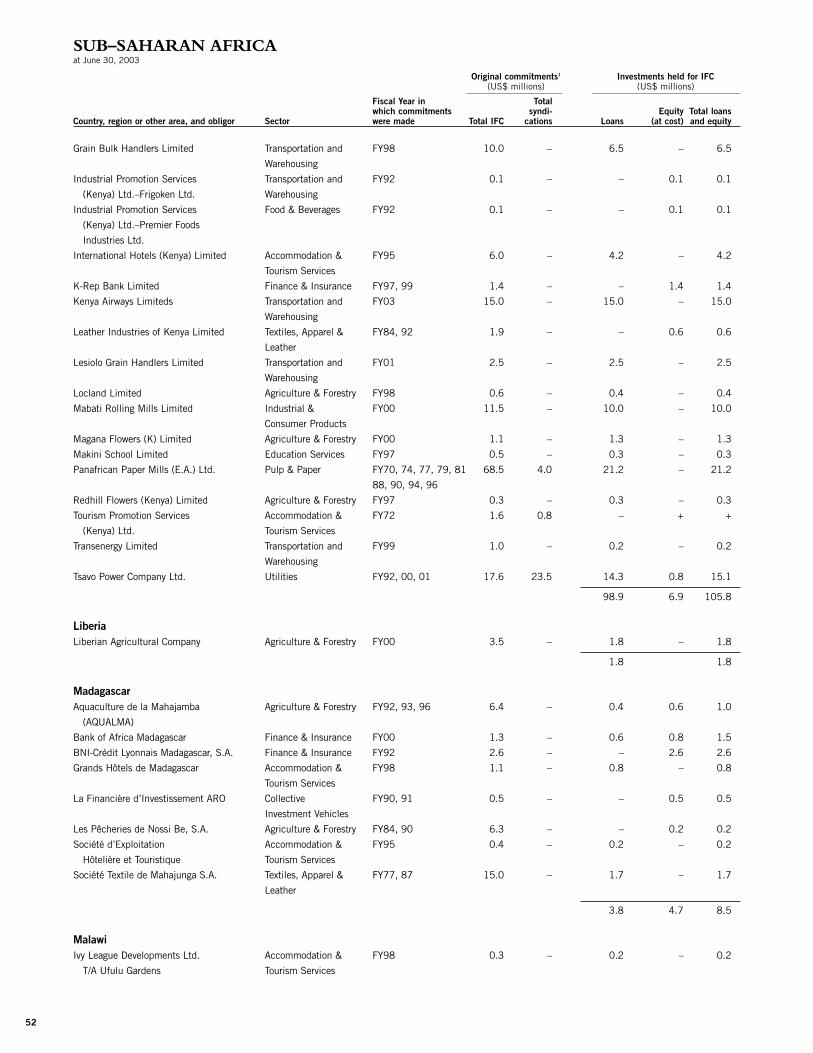
Grain Bulk Handlers Limited Transportation and FY98 10.0 – 6.5 – 6.5
Warehousing
Industrial Promotion Services Transportation and FY92 0.1 – – 0.1 0.1
(Kenya) Ltd.–Frigoken Ltd. Warehousing
Industrial Promotion Services Food & Beverages FY92 0.1 – – 0.1 0.1
(Kenya) Ltd.–Premier Foods
Industries Ltd.
International Hotels (Kenya) Limited Accommodation & FY95 6.0 – 4.2 – 4.2
Tourism Services
K-Rep Bank Limited Finance & Insurance FY97, 99 1.4 – – 1.4 1.4
Kenya Airways Limiteds Transportation and FY03 15.0 – 15.0 – 15.0
Warehousing
Leather Industries of Kenya Limited Textiles, Apparel & FY84, 92 1.9 – – 0.6 0.6
Leather
Lesiolo Grain Handlers Limited Transportation and FY01 2.5 – 2.5 – 2.5
Warehousing
Locland Limited Agriculture & Forestry FY98 0.6 – 0.4 – 0.4
Mabati Rolling Mills Limited Industrial & FY00 11.5 – 10.0 – 10.0
Consumer Products
Magana Flowers (K) Limited Agriculture & Forestry FY00 1.1 – 1.3 – 1.3
Makini School Limited Education Services FY97 0.5 – 0.3 – 0.3
Panafrican Paper Mills (E.A.) Ltd. Pulp & Paper FY70, 74, 77, 79, 81 68.5 4.0 21.2 – 21.2
88, 90, 94, 96
Redhill Flowers (Kenya) Limited Agriculture & Forestry FY97 0.3 – 0.3 – 0.3
Tourism Promotion Services Accommodation & FY72 1.6 0.8 – + +
(Kenya) Ltd. Tourism Services
Transenergy Limited Transportation and FY99 1.0 – 0.2 – 0.2
Warehousing
Tsavo Power Company Ltd. Utilities FY92, 00, 01 17.6 23.5 14.3 0.8 15.1
98.9 6.9 105.8
LiberiaLiberian Agricultural Company Agriculture & Forestry FY00 3.5 – 1.8 – 1.8
1.8 1.8
MadagascarAquaculture de la Mahajamba Agriculture & Forestry FY92, 93, 96 6.4 – 0.4 0.6 1.0
(AQUALMA)
Bank of Africa Madagascar Finance & Insurance FY00 1.3 – 0.6 0.8 1.5
BNI-Crédit Lyonnais Madagascar, S.A. Finance & Insurance FY92 2.6 – – 2.6 2.6
Grands Hôtels de Madagascar Accommodation & FY98 1.1 – 0.8 – 0.8
Tourism Services
La Financière d’Investissement ARO Collective FY90, 91 0.5 – – 0.5 0.5
Investment Vehicles
Les Pêcheries de Nossi Be, S.A. Agriculture & Forestry FY84, 90 6.3 – – 0.2 0.2
Société d’Exploitation Accommodation & FY95 0.4 – 0.2 – 0.2
Hôtelière et Touristique Tourism Services
Société Textile de Mahajunga S.A. Textiles, Apparel & FY77, 87 15.0 – 1.7 – 1.7
Leather
3.8 4.7 8.5
MalawiIvy League Developments Ltd. Accommodation & FY98 0.3 – 0.2 – 0.2
T/A Ufulu Gardens Tourism Services
Original commitments1 Investments held for IFC(US$ millions) (US$ millions)
Fiscal Year in Totalwhich commitments syndi- Equity Total loans
Country, region or other area, and obligor Sector were made Total IFC cations Loans (at cost) and equity
SUB–SAHARAN AFRICAat June 30, 2003
52

Kabula Hotel Limited Accommodation & FY00 0.6 – 0.6 – 0.6
Tourism Services
Maravi Flowers Ltd. Agriculture & Forestry FY97 0.6 – 0.2 – 0.2
Mwaiwathu Private Hospital Ltd. Health Care FY97 0.8 – – 0.8 0.8
National Insurance Company Limited Finance & Insurance FY00 1.0 – – 1.0 1.0
1.1 1.9 2.9
MaliEtablissement Zaumana Traore Suarl Transportation and FY92 0.1 – 0.5 – 0.5
Warehousing
Grand Hôtel de Bamako Accommodation & FY94, 98, 03 4.5 – 2.5 – 2.5
Tourism Services
Graphique Industrie S.A. Pulp & Paper FY92 – – 0.7 – 0.7
Groupement des Grands Garages Industrial & FY97 0.7 – 0.7 – 0.7
de Bamako Consumer Products
Hotel Le Rabelais Accommodation & FY92 – – 0.2 – 0.2
Tourism Services
Société d’Exploitation des Oil, Gas and Mining FY95 39.8 25.0 – 4.8 4.8
Mines d’Or de Sadiola S.A.
Timbuktu Trading and Transport Transportation and FY98 0.1 – 0.2 – 0.2
Warehousing
4.7 4.8 9.5
MauritaniaGénérale de Banque de Mauritanie Finance & Insurance FY98, 00 11.2 – 7.0 0.1 7.1
pour l’Investissement et le Commerce
TIVISKI S.A.R.L. Food & Beverages FY92 + – 0.6 – 0.6
7.6 0.1 7.6
MauritiusConsolidated Mills Limited Primary Metals FY92 0.7 – – 0.2 0.2
Mauritius Venture Capital Fund Limited Collective FY96 1.4 – – 0.9 0.9
Investment Vehicles
Socota Textile Mills Limited Textiles, Apparel & FY87 6.0 – – + +
Leather
1.1 1.1
MozambiqueAusmoz Farm Holdings, Lda. Agriculture & Forestry FY01 0.7 – 0.7 – 0.7
Auto Body Grand Prix Lda Industrial & FY03 0.4 – 0.5 – 0.5
Consumer Products
BIM - Investimento Finance & Insurance FY99 0.3 – – 0.3 0.3
Cabo Caju, LDA Food & Beverages FY00 0.6 – 0.6 – 0.6
Companhia De Pescas Da Zambezia Lda Food & Beverages FY98 1.0 – 1.0 – 1.0
Complexo Turistico Oasis de Accommodation & FY98 0.7 – 0.7 – 0.7
Xai-Xai Limitada Tourism Services
Hoteis Polana Limitada Accommodation & FY93 3.5 – 0.2 – 0.2
Tourism Services
Maragra Acucar SARL Food & Beverages FY00 10.3 – 10.3 – 10.3
Mozambique Aluminum S.A.R.L. Primary Metals FY98, 01 133.0 – 128.1 – 128.1
NovoBanco S.A.R.L. Finance & Insurance FY01 0.2 – – 0.2 0.2
Rodoviária da Beira Lda. Transportation and FY99 0.2 – 0.2 – 0.2
Warehousing
142.2 0.5 142.7
Original commitments1 Investments held for IFC(US$ millions) (US$ millions)
Fiscal Year in Totalwhich commitments syndi- Equity Total loans
Country, region or other area, and obligor Sector were made Total IFC cations Loans (at cost) and equity
SUB–SAHARAN AFRICAat June 30, 2003
53

NamibiaLife Office of Namibia Limited Finance & Insurance FY98, 01 1.6 – – 1.6 1.6
Nedcor Investment Bank Holding Finance & Insurance FY01 0.7 – 0.5 0.2 0.7
Pescanova Holdings of Namibia Limited Food & Beverages FY95, 97, 98, 03 20.2 – 12.4 – 12.4
12.9 1.8 14.7
NigeriaAbuja International Diagnostic Center Health Care FY97 2.5 – 1.8 0.7 2.5
Adamac Industries Limited Oil, Gas and Mining FY03 25.0 15.0 25.0 – 25.0
Andchristie Company Limited Information FY97 0.2 – 0.1 – 0.1
Ansbby Nigeria Limited Chemicals FY99 0.1 – 0.1 – 0.1
Arewa United Stores Limited Textiles, Apparel & FY64, 67, 70, 92 6.6 0.7 – + +
Leather
Capital Alliance Private Equity Fund Collective FY00 7.5 – – 7.5 7.5
Investment Vehicles
Citibank Nigeria Finance & Insurance FY01 20.0 – 18.3 – 18.3
Diamond Bank Nigeria Finance & Insurance FY01 20.0 – 14.0 – 14.0
E. Ekesons Brothers Nigeria Limited Transportation and FY97 0.4 – 0.1 – 0.1
Warehousing
First Securities Discount House Finance & Insurance FY93 0.9 – – 0.9 0.9
FSB International Bank Finance & Insurance FY01 22.5 – 22.5 – 22.5
Global Fabrics Manufacturers Limited Textiles, Apparel & FY00 0.3 – 0.3 – 0.3
Leather
Guaranty Trust Bank Plc. Finance & Insurance FY01 20.0 – 18.0 – 18.0
Hercules Tyres Manufacturing Plastics & Rubber FY00 1.3 – 1.3 – 1.3
Nigeria Ltd.
Hygeia Nigeria Limited Health Care FY00 0.6 – 0.2 0.2 0.4
Ikeja Hotel PLC Accommodation & FY81, 85, 88 12.3 – – 1.5 1.5
Tourism Services
Investment Banking and Trust Finance & Insurance FY01 20.0 – 20.0 – 20.0
Company Limited
Mid-East Nigeria Limited Nonmetallic Mineral FY96 0.1 – 0.1 – 0.1
Product Manufacturing
The Moorhouse Company Limited Accommodation & FY98 1.4 – 0.8 – 0.8
Tourism Services
Niger Delta Contractor Revolving Finance & Insurance FY02 15.0 – 15.0 – 15.0
Credit Facility
Oha Motors (Nigeria) Limited Transportation and FY01 0.9 – 0.8 – 0.8
Warehousing
Radmed Diagnostic Center Limited Health Care FY98 0.3 – 0.2 – 0.2
Safety Center International Limited Education Services FY01 0.6 – 0.5 0.1 0.6
Tourist Company of Nigeria Limited Accommodation & FY94 2.5 – – + +
Tourism Services
United Bank for Africa (plc) Finance & Insurance FY02 30.0 – 30.0 – 30.0
Vinfesen Industries Limited Plastics & Rubber FY96 1.0 – 1.0 – 1.0
170.1 10.8 180.9
SenegalBanque de l’Habitat du Sénégal, S.A. Finance & Insurance FY80 0.5 – – 0.5 0.5
Ciments du Sahel S.A. Nonmetallic Mineral FY00 18.1 – 18.8 2.3 21.1
Product Manufacturing
Groupe Scolaire Fanaicha Education Services FY99 0.3 – 0.3 – 0.3
GTi Dakar LLC Utilities FY98 10.8 11.0 8.8 1.7 10.4
Royal Saly S.A. Accommodation & FY02 1.2 – 1.3 – 1.3
Tourism Services
Original commitments1 Investments held for IFC(US$ millions) (US$ millions)
Fiscal Year in Totalwhich commitments syndi- Equity Total loans
Country, region or other area, and obligor Sector were made Total IFC cations Loans (at cost) and equity
SUB–SAHARAN AFRICAat June 30, 2003
54

Société d’Exploitation des Food & Beverages FY96, 97, 99 1.3 – – 0.4 0.4
Ressources Thonières
29.2 4.8 34.1
SeychellesAcajoux Hotel Limited Accommodation & FY95 1.0 – 0.2 – 0.2
Tourism Services
Coral Strand Hotel Accommodation & FY96 3.3 – 1.2 – 1.2
Tourism Services
Seychelles Internacional Mercantile Finance & Insurance FY99 10.0 – 3.0 – 3.0
Banking Corporation Limited
4.5 4.5
Sierra LeoneMSICIH II Celtel Sierra Leone Information FY02 4.0 – 3.4 – 3.4
3.4 3.4
South AfricaAfrican Bank Limited Finance & Insurance FY02 48.3 – 55.4 – 55.4
African Life Assurance Company Finance & Insurance FY95, 96, 99 20.7 – – 18.1 18.1
Limited
The Biotech Venture Partners Fund Collective FY02 2.4 – – 2.4 2.4
Investment Vehicles
Carosa Farm (Proprietary) Limited Agriculture & Forestry FY97 0.6 – 0.1 0.1 0.2
Cheiron Health Technologies (Pty) Ltd. Professional, Scientific FY00 1.3 – 0.2 0.6 0.9
and Technical Services
Dargle Timber (Pty) Ltd./ Industrial & FY99 0.6 – 0.3 0.2 0.5
Bulwer Timber (Pty) Limited Consumer Products
Decentralised Banking Solutions Information FY00 0.8 – – 0.8 0.8
Consult (Pty) Limited
Edu-Loan (Pty) Ltd. Finance & Insurance FY02 1.9 – 2.6 – 2.6
Eerste River Medical Center Health Care FY98 1.0 – – 1.0 1.0
First Rand Bank Limited Finance & Insurance FY00 30.0 – 21.0 – 21.0
Foxtrot Meat Processors CC Food & Beverages FY99 0.4 – 0.3 – 0.3
Freecom (Pty) Ltd. Industrial & FY02 0.3 – 0.3 0.1 0.4
Consumer Products
New Africa Mining Fund Collective FY03 5.0 – – 5.0 5.0
Investment Vehicles
New South Africa Pizza Accommodation & FY99 0.4 – + – +
Investment Company Ltd. Tourism Services
Printability Pulp & Paper FY01 6.0 – 5.1 3.9 8.9
Rubico Holding SA (Pty) Ltd. Information FY01, 02 6.3 – 1.3 5.0 6.3
South Africa Capital Growth Fund Collective FY96 20.0 – – 1.5 1.5
Investment Vehicles
South Africa Franchise Equity Collective FY95 2.1 – – 1.2 1.2
Fund Limited Investment Vehicles
South Africa Home Loans Finance & Insurance FY00, 02, 03 7.4 – 2.0 5.8 7.7
South African Private Equity Collective FY99 35.0 – – 27.9 27.9
Fund III, L.P. Investment Vehicles
Spier Estate Hotel Accommodation & FY02 11.9 – 14.0 1.9 15.9
Tourism Services
Tusk Project Management (Pty) Ltd. Professional, Scientific FY01 1.6 – 1.4 0.1 1.6
and Technical Services
104.0 75.5 179.5
Original commitments1 Investments held for IFC(US$ millions) (US$ millions)
Fiscal Year in Totalwhich commitments syndi- Equity Total loans
Country, region or other area, and obligor Sector were made Total IFC cations Loans (at cost) and equity
SUB–SAHARAN AFRICAat June 30, 2003
55

SwazilandNatex Swaziland Limited Textiles, Apparel & FY85, 88, 93 13.6 – 3.6 + 3.6
Leather
Swazi Paper Mills Ltd Pulp & Paper FY02 3.7 – 5.0 – 5.0
Swazi Wattle Industries (Pty) Ltd Chemicals FY01 0.9 – 0.7 0.2 1.0
Swaziland Industrial Development Finance & Insurance FY87, 93 3.3 – – 1.0 1.0
Company Limited
The Royal Swaziland Sugar Food & Beverages FY78, 86 10.0 – – 0.5 0.5
Corporation Limited
9.3 1.8 11.0
Tanzania
2000 Industries Limited Food & Beverages FY02 1.6 – 1.6 – 1.6
Abercrombie & Kent Tanzania Limited Accommodation & FY96, 00 0.8 – 0.1 – 0.1
Tourism Services
Aqva Ginners Tanzania Ltd. Agriculture & Forestry FY97 0.8 – 0.7 – 0.7
Blue Bay Company Limited Accommodation & FY99 1.5 – 1.3 – 1.3
Tourism Services
Boundary Hill Lodge Ltd. Accommodation & FY01 0.2 – 0.2 – 0.2
Tourism Services
Continental Flowers Limited Agriculture & Forestry FY97 0.4 – 0.3 – 0.3
Exim Bank of Tanzania Finance & Insurance FY02 3.5 – 3.5 – 3.5
Indian Ocean Hotel Limited Accommodation & FY00 2.5 – 2.5 – 2.5
Tourism Services
International House Property Limited Construction and FY97 2.3 – 0.6 0.6 1.2
Real Estate
Maji Masafi Limited Food & Beverages FY98 1.1 – 0.2 – 0.2
Milcafe Limited Agriculture & Forestry FY97 0.3 – 0.2 – 0.2
Moshi Leather Industries Textiles, Apparel & FY95 0.2 – – 0.2 0.2
Limited, Tanzania Leather
National Bank of Commerce Finance & Insurance FY01 10.0 – – 10.0 10.0
Tanzania Breweries Limited Food & Beverages FY95 6.0 – – 6.0 6.0
Tourism Promotion Services Accommodation & FY94 8.9 – 5.9 0.9 6.7
(Tanzania) Limited Tourism Services
Tourism Promotion Services Accommodation & FY95, 99 1.4 – 0.6 0.2 0.8
(Zanzibar) Limited Tourism Services
Zanzíbar Safari Club Limited Accommodation & FY00 0.7 – 0.7 – 0.7
Tourism Services
18.3 17.9 36.2
TogoWest African Cement S.A Nonmetallic Mineral FY00 5.7 – 2.9 1.2 4.2
Product Manufacturing
2.9 1.2 4.2
UgandaAgro Management Limited Chemicals FY96 1.0 – 0.6 0.4 1.0
CelTel Limited (Uganda) Information FY95, 01 10.3 – 1.5 – 1.5
Clovergem Fish and Foods Limited Food & Beverages FY93 1.0 – 0.8 – 0.8
Conrad Plaza Limited Construction and FY97 1.5 – 0.8 – 0.8
Real Estate
Development Finance Company of Finance & Insurance FY85, 92, 93 1.0 – – 1.3 1.3
Uganda Limited
Executive Investments Ltd. Construction and FY98 1.0 – 0.6 – 0.6
Real Estate
Original commitments1 Investments held for IFC(US$ millions) (US$ millions)
Fiscal Year in Totalwhich commitments syndi- Equity Total loans
Country, region or other area, and obligor Sector were made Total IFC cations Loans (at cost) and equity
SUB–SAHARAN AFRICAat June 30, 2003
56
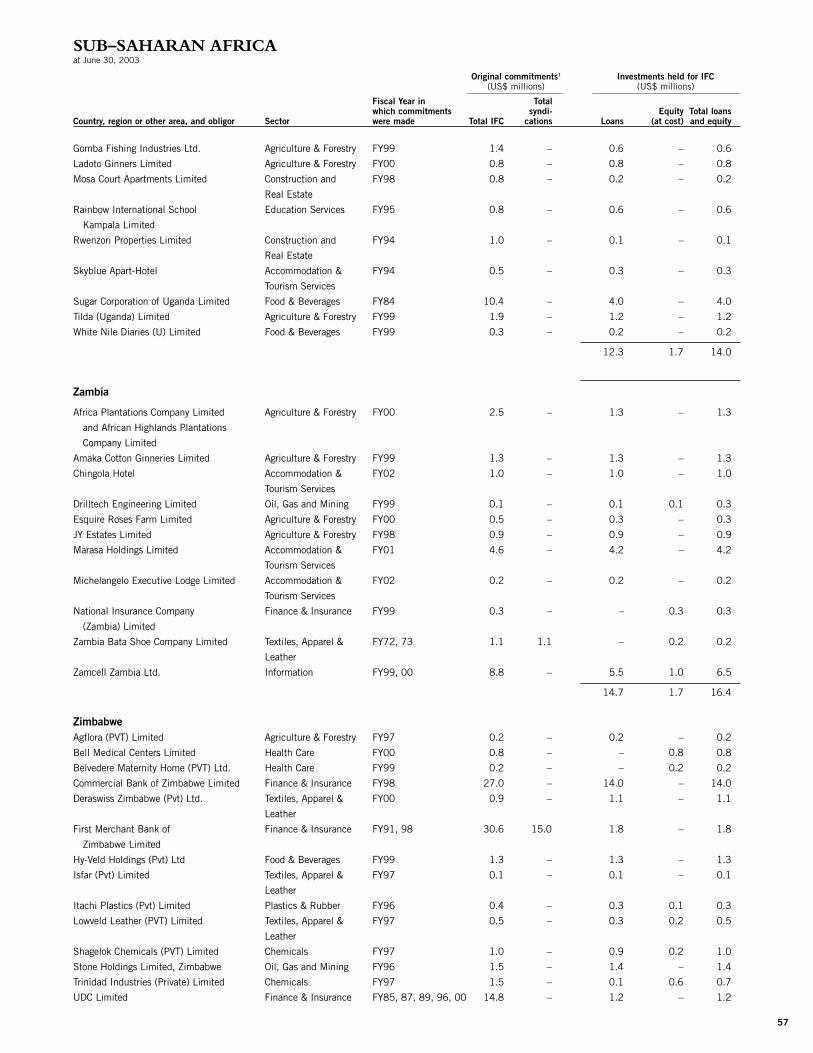
Gomba Fishing Industries Ltd. Agriculture & Forestry FY99 1.4 – 0.6 – 0.6
Ladoto Ginners Limited Agriculture & Forestry FY00 0.8 – 0.8 – 0.8
Mosa Court Apartments Limited Construction and FY98 0.8 – 0.2 – 0.2
Real Estate
Rainbow International School Education Services FY95 0.8 – 0.6 – 0.6
Kampala Limited
Rwenzori Properties Limited Construction and FY94 1.0 – 0.1 – 0.1
Real Estate
Skyblue Apart-Hotel Accommodation & FY94 0.5 – 0.3 – 0.3
Tourism Services
Sugar Corporation of Uganda Limited Food & Beverages FY84 10.4 – 4.0 – 4.0
Tilda (Uganda) Limited Agriculture & Forestry FY99 1.9 – 1.2 – 1.2
White Nile Diaries (U) Limited Food & Beverages FY99 0.3 – 0.2 – 0.2
12.3 1.7 14.0
Zambia
Africa Plantations Company Limited Agriculture & Forestry FY00 2.5 – 1.3 – 1.3
and African Highlands Plantations
Company Limited
Amaka Cotton Ginneries Limited Agriculture & Forestry FY99 1.3 – 1.3 – 1.3
Chingola Hotel Accommodation & FY02 1.0 – 1.0 – 1.0
Tourism Services
Drilltech Engineering Limited Oil, Gas and Mining FY99 0.1 – 0.1 0.1 0.3
Esquire Roses Farm Limited Agriculture & Forestry FY00 0.5 – 0.3 – 0.3
JY Estates Limited Agriculture & Forestry FY98 0.9 – 0.9 – 0.9
Marasa Holdings Limited Accommodation & FY01 4.6 – 4.2 – 4.2
Tourism Services
Michelangelo Executive Lodge Limited Accommodation & FY02 0.2 – 0.2 – 0.2
Tourism Services
National Insurance Company Finance & Insurance FY99 0.3 – – 0.3 0.3
(Zambia) Limited
Zambia Bata Shoe Company Limited Textiles, Apparel & FY72, 73 1.1 1.1 – 0.2 0.2
Leather
Zamcell Zambia Ltd. Information FY99, 00 8.8 – 5.5 1.0 6.5
14.7 1.7 16.4
ZimbabweAgflora (PVT) Limited Agriculture & Forestry FY97 0.2 – 0.2 – 0.2
Bell Medical Centers Limited Health Care FY00 0.8 – – 0.8 0.8
Belvedere Maternity Home (PVT) Ltd. Health Care FY99 0.2 – – 0.2 0.2
Commercial Bank of Zimbabwe Limited Finance & Insurance FY98 27.0 – 14.0 – 14.0
Deraswiss Zimbabwe (Pvt) Ltd. Textiles, Apparel & FY00 0.9 – 1.1 – 1.1
Leather
First Merchant Bank of Finance & Insurance FY91, 98 30.6 15.0 1.8 – 1.8
Zimbabwe Limited
Hy-Veld Holdings (Pvt) Ltd Food & Beverages FY99 1.3 – 1.3 – 1.3
Isfar (Pvt) Limited Textiles, Apparel & FY97 0.1 – 0.1 – 0.1
Leather
Itachi Plastics (Pvt) Limited Plastics & Rubber FY96 0.4 – 0.3 0.1 0.3
Lowveld Leather (PVT) Limited Textiles, Apparel & FY97 0.5 – 0.3 0.2 0.5
Leather
Shagelok Chemicals (PVT) Limited Chemicals FY97 1.0 – 0.9 0.2 1.0
Stone Holdings Limited, Zimbabwe Oil, Gas and Mining FY96 1.5 – 1.4 – 1.4
Trinidad Industries (Private) Limited Chemicals FY97 1.5 – 0.1 0.6 0.7
UDC Limited Finance & Insurance FY85, 87, 89, 96, 00 14.8 – 1.2 – 1.2
Original commitments1 Investments held for IFC(US$ millions) (US$ millions)
Fiscal Year in Totalwhich commitments syndi- Equity Total loans
Country, region or other area, and obligor Sector were made Total IFC cations Loans (at cost) and equity
SUB–SAHARAN AFRICAat June 30, 2003
57

Venture Capital Company of Zimbabwe, Ltd. Collective FY91 0.5 – – 0.5 0.5
Investment Vehicles
Victoria Falls Safari Lodge Hotel Accommodation & FY94 2.8 – – 0.2 0.2
(Private) Ltd. Tourism Services
The Zambezi Fund Mauritius Collective FY97 2.5 – – 0.5 0.5
(Private) Limited Investment Vehicles
Zambezi Safari Lodges Accommodation & FY96 1.3 – 1.0 – 1.0
Tourism Services
23.7 3.2 26.9
Regional InvestmentsThe Africa Emerging Markets Fund Collective FY94 7.5 – – 7.3 7.3
Investment Vehicles
Africa International Financial Collective FY03 6.6 – – 6.6 6.6
Holdings, LLC Investment Vehicles
Africa Media Group Limited Information FY02 5.0 – – 5.0 5.0
African Infrastructure Fund Collective FY00 74.8 – – 74.5 74.5
Investment Vehicles
Africap Microfinance Fund Ltd. Finance & Insurance FY02 2.0 – – 2.0 2.0
AIG African Infrastructure Management Collective FY00 0.2 – – 0.2 0.2
Investment Vehicles
Aureos East Africa Fund, LLC Collective FY03 4.0 – – 4.0 4.0
Investment Vehicles
Aureos Southern Africa Fund, LLC Collective FY03 6.0 – – 6.0 6.0
Investment Vehicles
Coca Cola SABCO (Pty) Ltd. Food & Beverages FY02 20.0 – 10.0 10.0 20.0
Ecobank Transnational Incorporated Finance & Insurance FY99 7.5 – 3.8 3.8 7.5
Energy Africa Limited Oil, Gas and Mining FY92 – – – 38.0 38.0
Framlington Asset Management Collective FY99 + – – + +
West Africa SA Investment Vehicles
Industrial Promotion Services Collective FY82 1.2 – – 1.2 1.2
(Kenya) Limited Investment Vehicles
Mining and Contracting Services Limited Oil, Gas and Mining FY01 34.0 40.0 30.0 4.0 34.0
Mobile Systems International Information FY00, 02 33.3 – – 33.3 33.3
Cellular Investments Holdings, B.V.
Osprey Oil and Gas Limited Oil, Gas and Mining FY03 0.3 – – 0.3 0.3
West Africa Growth Fund Collective FY97 6.3 – – 5.1 5.1
Investment Vehicles
43.8 201.3 245.0
Total equity and loans 975.2 408.8 1,384.0
Total guarantees and risk management products 60.0
Total IFC portfolio for Sub-Saharan Africa 1,444.0
Original commitments1 Investments held for IFC(US$ millions) (US$ millions)
Fiscal Year in Totalwhich commitments syndi- Equity Total loans
Country, region or other area, and obligor Sector were made Total IFC cations Loans (at cost) and equity
SUB–SAHARAN AFRICAat June 30, 2003
58

BangladeshDelta BRAC Housing Finance Finance & Insurance FY98 3.0 – 2.3 0.7 3.0
Corporation Ltd.
Dynamic Textile Industries Limited Textiles, Apparel & FY92 2.5 2.0 1.9 – 1.9
Leather
GrameenPhone Limited Information FY00 18.2 – 10.0 1.6 11.6
HeidelbergCement Bangladesh Nonmetallic Mineral FY01 10.0 – 10.0 – 10.0
Limited Product Manufacturing
Industrial Development Leasing Finance & Insurance FY85, 96 3.2 – – 0.1 0.1
Company of Bangladesh Limite
Industrial Promotion and Development Finance & Insurance FY80, 99 11.1 – 6.9 1.1 7.9
Company of Bangladesh Limited
Khulna Power Company Limited Utilities FY99 22.5 51.0 15.6 – 15.6
Lafarge Surma Cement Ltd. Nonmetallic Mineral FY02 45.0 – 35.0 10.0 45.0
Product Manufacturing
R.A.K. Ceramics (Bangladesh) Pvt. Ltd. Nonmetallic Mineral FY03 12.0 – 12.0 – 12.0
Product Manufacturing
93.7 13.4 107.1
CambodiaACLEDA Bank Finance & Insurance FY00 0.5 – – 0.5 0.5
Aman Siem Reap Accommodation & FY03 1.2 – 1.2 – 1.2
Tourism Services
SEF Hagar Soya Food & Beverages FY03 0.5 – – 0.5 0.5
1.2 0.9 2.1
ChinaAdvantage China Holdings Limited Finance & Insurance FY02, 03 0.7 – – 0.7 0.7
ASIMCO Interntional Casting Industrial & FY00 19.0 – 16.7 – 16.7
(Shanxi) Co., Ltd. Consumer Products
Bank of Shanghai Finance & Insurance FY00, 02 50.3 – – 50.3 50.3
Beijing Hormel Foods Company Limited Food & Beverages FY97 5.5 5.5 1.8 0.5 2.3
BNP Paribas Peregrine China Finance & Insurance FY03 11.6 – – 11.6 11.6
Investment Bank
CDH China Fund Collective FY02 20.0 – – 19.7 19.7
Investment Vehicles
Chengdu Chemical Company Ltd. Chemicals FY99 10.6 8.6 6.7 3.2 9.9
Chengxin International Credit Finance & Insurance FY99 0.4 – – 0.4 0.4
Ratings Limited
China Dynamic Growth Fund L.P. Collective FY94 12.4 – – 8.8 8.8
Investment Vehicles
China Huarong Asset Management Finance & Insurance FY02 34.5 – 31.5 3.0 34.5
Corporation
China Infrastructure Group Transportation and FY99, 00 4.5 – – 4.5 4.5
Holdings PLC. Warehousing
China Minsheng Banking Corp., Ltd. Finance & Insurance FY03 23.5 – – 23.5 23.5
China Walden Management Limited Collective FY94 + – – + +
Investment Vehicles
China Walden Venture Collective FY94 7.5 – – + +
Investments Limited Investment Vehicles
CSRC China Corporation Chemicals FY02 11.0 – 9.0 2.0 11.0
Dalian Float Glass Company Limited Nonmetallic Mineral FY95 32.9 30.5 – 2.4 2.4
Product Manufacturing
Dupont Suzhou Polyester Co. Ltd. Textiles, Apparel & FY96 29.1 52.0 9.3 4.1 13.5
Leather
Great Infotech Information FY03 3.5 – – 3.5 3.5
Original commitments1 Investments held for IFC(US$ millions) (US$ millions)
Fiscal Year in Totalwhich commitments syndi- Equity Total loans
Country, region or other area, and obligor Sector were made Total IFC cations Loans (at cost) and equity
ASIA & THE PACIFICat June 30, 2003
59

Hansom Investment Limited Transportation and FY99 16.1 – – 0.1 0.1
Warehousing
Interstate Energy Corporation Pte, Ltd. Utilities FY02 20.0 – 20.0 – 20.0
Jilin Zhengye Agriculture Food & Beverages FY03 15.0 – 15.0 – 15.0
Development Co.
Nanjing City Commercial Bank Finance & Insurance FY02 26.6 – – 26.6 26.6
Nanjing Kumho Tire Co. Ltd. Plastics & Rubber FY96 17.4 38.8 4.9 3.8 8.7
New China Life Insurance Co.,Ltd Finance & Insurance FY01 30.7 – – 30.7 30.7
Newbridge Investment Partners, L.P. Collective FY95 6.7 – – 2.0 2.0
Investment Vehicles
Orient Finance Company, Ltd. Finance & Insurance FY97 10.0 20.0 7.6 – 7.6
Pacific Ports Company Limited Transportation and FY97 – – – 2.5 2.5
Warehousing
Paris-Shanghai Asset Finance & Insurance FY03 1.9 – – 1.9 1.9
Management Co. Ltd.
Peak Pacific Investment Company Utilities FY02 25.0 – 25.0 – 25.0
Plantation Timber Products Industrial & FY00 1.5 – – 2.5 2.5
Holdings Limited Consumer Products
Scana Leshan Machinery Co., Ltd. Primary Metals FY99 7.4 – 5.4 1.4 6.7
Shanghai Hormel Foods Co. Ltd.* Food & Beverages FY92 (0.5) (0.5) 0.5 – 0.5
Shanghai Krupp Stainless Co., Ltd. Primary Metals FY00 30.0 68.8 28.9 – 28.9
Shanghai Midway Infrastructure Transportation and FY99 – – – 16.0 16.0
(Holdings), Ltd. Warehousing
Shenzhen China Bicycles Industrial & FY88, 92, 94 20.9 – 4.5 – 4.5
Company (Holdings) Limited Consumer Products
Shenzhen Tai-Yang PCCP Company Nonmetallic Mineral FY93 5.0 – 3.8 + 3.8
Limited Product Manufacturing
Sichuan SME Investment Fund Collective FY01 6.0 – – 6.0 6.0
Investment Vehicles
Sino Mining Limited Oil, Gas and Mining FY03 5.0 – – 5.0 5.0
Sino-Forest Plantation Agriculture & Forestry FY02 25.0 – 25.0 – 25.0
Suzhou Huasu Plastics Co., Ltd. Chemicals FY97 24.5 22.2 – 2.5 2.5
Weihai Weidongri Comprehensive Food & Beverages FY96 4.5 4.9 1.3 – 1.3
Foodstuff Co., Ltd.
Wuhan International Container Transportation and FY99 5.0 – 5.0 – 5.0
Transshipment Company Limited Warehousing
Xi’an City Commercial Bank Finance & Insurance FY03 19.9 – – 19.9 19.9
Yantai Mitsubishi Cement Nonmetallic Mineral FY93 30.7 – 7.9 2.0 9.9
Company Limited Product Manufacturing
Zibo Wan Jie Tumor Hospital Health Care FY02 15.0 – 15.0 – 15.0
244.8 261.1 505.9
FijiHillview Limited Accommodation & FY99 3.9 – 5.2 – 5.2
Tourism Services
5.2 5.2
Original commitments1 Investments held for IFC(US$ millions) (US$ millions)
Fiscal Year in Totalwhich commitments syndi- Equity Total loans
Country, region or other area, and obligor Sector were made Total IFC cations Loans (at cost) and equity
ASIA & THE PACIFICat June 30, 2003
60

IndiaThe Ahmedabad Electricity Utilities FY89 20.8 – 1.1 – 1.1
Company Limited
Alok Industries Limited Textiles, Apparel & FY03 17.5 – 17.5 – 17.5
Leather
Ambuja Cement Rajashtan Ltd. Nonmetallic Mineral FY94 19.4 17.0 – 4.9 4.9
Product Manufacturing
Apollo Tyres Limited Plastics & Rubber FY03 21.0 15.0 21.1 – 21.1
The Arvind Mills Limited Textiles, Apparel & FY92 20.9 – – 7.5 7.5
Leather
Asian Electronics Ltd. (AEL) Industrial & FY98 5.5 – – 5.5 5.5
Consumer Products
Balrampur Chini Mills Ltd. Food & Beverages FY03 14.9 – 15.0 – 15.0
Bharti Mobile Limited Information FY01 20.0 – – 20.0 20.0
Bhartiya Samruddhi Finance Limited Finance & Insurance FY01 1.0 – – 1.0 1.0
Bihar Sponge Iron Ltd. Primary Metals FY85, 91 15.9 – 13.2 0.7 13.9
Centurion Bank Limited Finance & Insurance FY95, 97 18.9 – 0.5 4.6 5.1
CESC Limited Utilities FY91, 93 54.7 67.0 30.1 – 30.1
CFL Capital Financial Services Limited Finance & Insurance FY97 20.0 – 19.6 – 19.6
Continentals Carbon India Limited Chemicals FY01 9.0 11.5 9.0 – 9.0
Cosmo Films Limited Plastics & Rubber FY03 10.0 – 10.0 – 10.0
Dataquest Management and Information FY03 2.0 – 0.5 1.5 2.0
Communications Ltd.
Dewan Housing Finance Finance & Insurance FY03 12.9 – 12.9 – 12.9
Corporation Ltd.
Eurolight Electricals Pvt., Ltd. Industrial & FY98 + – – + +
Consumer Products
GE Capital Transportation Finance & Insurance FY95 19.4 – – 4.4 4.4
Financial Services Ltd.
Global Trade Finance (Pvt.) Limited Finance & Insurance FY01 2.4 – – 2.4 2.4
Global Trust Bank Finance & Insurance FY94, 98, 00, 01 16.0 – 5.0 9.9 14.9
Gujarat Ambuja Cements Ltd. Nonmetallic Mineral FY94 25.8 – – 7.3 7.3
Product Manufacturing
GVK Industries Ltd. Utilities FY92, 96 37.5 38.8 – 7.5 7.5
Henkel SPIC India Ltd. Chemicals FY95, 00 4.7 – – 4.7 4.7
Housing Development Finance Finance & Insurance FY78, 87, 91, 92, 147.8 60.0 100.0 100.0
Corporation Limited 93, 03
IL&FS Venture Corporation Limited Collective FY93, 95 1.0 – – 1.0 1.0
Investment Vehicles
IndAsia Fund Advisors Pvt. Ltd. Collective FY01 15.0 – – 15.0 15.0
Investment Vehicles
India Auto Ancillary Fund Collective FY99 2.3 – – 2.3 2.3
Investment Vehicles
The India Direct Fund, L.P. Collective FY96 7.5 – – 7.2 7.2
Investment Vehicles
India Lease Development Limited Finance & Insurance FY85, 90, 95 4.6 – – 0.9 0.9
Indian Infrastructure Equipment Limited Finance & Insurance FY02 3.1 – – 3.1 3.1
The Indian Seamless Metal Primary Metals FY01 10.5 – 10.5 – 10.5
Tubes Limited
Indo Rama Synthetics Ltd. Textiles, Apparel & FY92, 94, 96 56.8 – 12.5 7.7 20.2
Leather
Indo Rama Textiles Ltd Textiles, Apparel & FY92 – – – 1.9 1.9
Leather
Indus Investments Mauritius Limited Collective FY96 + – – + +
Investment Vehicles
Original commitments1 Investments held for IFC(US$ millions) (US$ millions)
Fiscal Year in Totalwhich commitments syndi- Equity Total loans
Country, region or other area, and obligor Sector were made Total IFC cations Loans (at cost) and equity
ASIA & THE PACIFICat June 30, 2003
61

Indus Venture Capital Fund I Collective FY92 1.0 – – 0.6 0.6
Investment Vehicles
Indus Venture Investments Limited Collective FY96 5.0 – – 4.3 4.3
Investment Vehicles
Indus Venture Management Limited Collective FY92 + – – + +
Investment Vehicles
Information Technology Fund Collective FY94 0.6 – – 0.6 0.6
Investment Vehicles
Infrastructure and Development Finance & Insurance FY98 15.5 – – 15.5 15.5
Finance Company Limited
Infrastructure Leasing & Finance & Insurance FY91, 93, 95, 99 48.0 – – 8.0 8.0
Financial Services Limited
ING Vysya Bank Finance & Insurance FY01 7.3 – – 3.7 3.7
Ispat Industries Limited Primary Metals FY92, 95, 97 62.9 – 30.4 13.7 44.1
Jet Airways (P) Ltd. Transportation and FY01 15.0 – – 15.0 15.0
Warehousing
Larsen & Toubro Construction and FY03 50.0 – 50.0 – 50.0
Real Estate
Learning Universe Pvt. Limited Education Services FY01 0.3 – – 0.3 0.3
Mahindra & Mahindra Financial Finance & Insurance FY02 17.2 – 18.0 – 18.0
Services Limited
Mahindra & Mahindra Limited Industrial & FY81, 90, 93 28.8 – – 4.6 4.6
Consumer Products
Mahindra Infrastructure Utilities FY01 10.0 – – 10.0 10.0
Developers Limited
Mahindra Shubhlabh Services Limited Agriculture & Forestry FY03 2.3 – – 2.3 2.3
Minimally Invasive Education Education Services FY02 1.6 – – 1.6 1.6
Company Limited
Moser Baer India Limited Industrial & FY96, 99, 00 70.9 – 40.1 24.9 65.1
Consumer Products
NewPath Ventures LLC Information FY03 10.0 – – 10.0 10.0
Nicco Uco Alliance Credit Limited Finance & Insurance FY93, 96, 97, 98 6.5 5.0 2.1 0.5 2.5
Niko Resources Ltd. Oil, Gas and Mining FY03 30.0 – 30.0 – 30.0
Orchid Chemicals & Chemicals FY01 30.0 – 10.0 6.1 16.1
Pharmaceuticals Limited
Owens-Corning (India) Ltd. Nonmetallic Mineral FY97 25.0 – 17.3 – 17.3
Product Manufacturing
Oxides and Specialities Limited Chemicals FY91 0.3 – – + +
Prism Cement Limited Nonmetallic Mineral FY95 20.0 15.0 11.3 5.0 16.3
Product Manufacturing
Rain Calcining Limited Chemicals FY96 24.7 – 10.4 5.5 15.8
RPG Cellular Investments & Information FY01 2.0 – – 2.0 2.0
Holdings Private Limited
RPG Telephone Limited Information FY01 0.4 – – 0.4 0.4
South Asian Regional Apex Fund Collective FY96 5.9 – – 5.9 5.9
Investment Vehicles
Spryance.com, Inc. Information FY01, 03 3.0 – – 3.0 3.0
SREI International Finance Limited Finance & Insurance FY98, 00 33.0 – 24.1 3.0 27.1
Steuerung Anlage Pvt. Ltd. Industrial & FY98 0.1 – – 0.1 0.1
Consumer Products
Sundaram Home Ltd. Finance & Insurance FY00, 02 12.5 – 10.7 2.2 12.9
Switching Technologies Günther Ltd. Industrial & FY87 1.0 – 0.3 – 0.3
Consumer Products
Tanflora Infrastructure Park Limited Agriculture & Forestry FY00 0.5 – – 0.5 0.5
Tata Electric Companies Utilities FY90, 91, 94 130.6 – 16.7 – 16.7
Original commitmentsa Investments held for IFC(US$ millions) (US$ millions)
Fiscal Year in Totalwhich commitments syndi- Equity Total loans
Country, region or other area, and obligor Sector were made Total IFC cations Loans (at cost) and equity
62
Original commitments1 Investments held for IFC(US$ millions) (US$ millions)
Fiscal Year in Totalwhich commitments syndi- Equity Total loans
Country, region or other area, and obligor Sector were made Total IFC cations Loans (at cost) and equity
ASIA & THE PACIFICat June 30, 2003

Tata Engineering & Locomotive Industrial & FY03 50.0 – 50.0 – 50.0
Company Limited Consumer Products
The Tata Iron and Steel Primary Metals FY81, 86, 93, 94 98.4 16.7 – 7.7 7.7
Company Limited
TCFC Finance Limited Finance & Insurance FY94 – – – + +
TCW/ICICI India Private Equity Collective FY98 10.0 – – 5.6 5.6
Fund, L.L.C. Investment Vehicles
Technology Development and Collective FY91 2.1 – – 0.2 0.2
Information Company of India Limited Investment Vehicles
Titan Industries Limited Industrial & FY87, 89, 90, 93 20.9 – – 1.0 1.0
Consumer Products
UCAL Fuel Systems Limited Industrial & FY90 0.6 – – 0.4 0.4
Consumer Products
United Riceland Limited Food & Beverages FY96 10.0 – 9.4 – 9.4
Usha Martin Limited Primary Metals FY03 24.6 – 21.0 3.6 24.6
Varun Shipping Company Limited Transportation and FY91, 96, 01 22.8 6.0 – 1.7 1.7
Warehousing
Walden-Nikko India Management Co. Ltd. Collective FY98 + – – + +
Investment Vehicles
Walden-Nikko India Ventures Co. LDC Collective FY98 2.4 – – 2.0 2.0
Investment Vehicles
Webdunia.com (India) Private Limited Information FY02 2.0 – – 2.0 2.0
WTI Advanced Technology Professional, Scientific FY88 0.2 – – 0.2 0.2
and Technical Services
630.4 294.6 925.0
IndonesiaP.T. AdeS Alfindo Putrasetia Tbk. Food & Beverages FY98 13.8 19.7 – 7.0 7.0
P.T. Agro Muko Food & Beverages FY91 12.7 – – 2.2 2.2
P.T. Alumindo Light Metal Industry Primary Metals FY97 15.0 20.0 10.6 – 10.6
P.T. Asia Wisata Promosindo** Accommodation & FY94 – – 2.0 – 2.0
Tourism Services
P.T. Astra Graphia Professional, Scientific FY97 2.5 – – 2.0 2.0
and Technical Services
P.T. Astra International, Tbk. Industrial & FY90, 91, 94, 03 37.1 – – 12.7 12.7
Consumer Products
P.T. Astra Otoparts Tbk. Industrial & FY92 – – – 1.1 1.1
Consumer Products
P.T. Asuransi Jiwa Dharmala Manulife Finance & Insurance FY88 0.3 – – 0.3 0.3
P.T. Bakrie Pipe Industries Primary Metals FY95 37.3 – 33.2 – 33.2
P.T. Bank NISP Finance & Insurance FY98, 01, 02 18.6 – – 13.6 13.6
P.T. BBL Dharmala Finance Finance & Insurance FY93, 96 20.0 35.0 11.5 – 11.5
P.T. Berlian Laju Tanker tbk Transportation and FY98 28.2 25.2 6.8 20.0 26.8
Warehousing
P.T. Gawi Makmur Kalimantan Food & Beverages FY03 11.5 10.0 11.5 – 11.5
P.T. Grahawita Santika Accommodation & FY92, 96 11.8 – 5.0 – 5.0
Tourism Services
P.T. Indorama Synthetics Tbk. Textiles, Apparel & FY90, 91, 95, 99, 98.8 67.5 6.7 11.8 18.5
Leather 01, 03
P.T. Kalimantan Sanggar Pusaka Food & Beverages FY97 35.0 6.0 20.0 15.0 35.0
(KSP) and Subsidiaries
P.T. KDLC BancBali Finance Finance & Insurance FY94 16.1 – – + +
P.T. KIA Keramik Mas Nonmetallic Mineral FY92, 94, 96 30.9 63.5 18.8 – 18.8
Product Manufacturing
P.T. KIA Serpih Mas Nonmetallic Mineral FY95 21.2 55.0 15.0 – 15.0
Product Manufacturing
Original commitmentsa Investments held for IFC(US$ millions) (US$ millions)
Fiscal Year in Totalwhich commitments syndi- Equity Total loans
Country, region or other area, and obligor Sector were made Total IFC cations Loans (at cost) and equity
63
Original commitments1 Investments held for IFC(US$ millions) (US$ millions)
Fiscal Year in Totalwhich commitments syndi- Equity Total loans
Country, region or other area, and obligor Sector were made Total IFC cations Loans (at cost) and equity
ASIA & THE PACIFICat June 30, 2003

P.T. Makro Indonesia Wholesale and FY97, 00 1.3 – – 4.0 4.0
Retail Trade
P.T. Megaplast Jayacitra Industrial & FY99 11.3 – 5.3 2.5 7.8
Consumer Products
P.T. Nusantara Tropical Fruit Agriculture & Forestry FY93 8.6 6.7 7.6 – 7.6
P.T. Pramindo Ikat Nusantara Information FY97 53.9 70.0 – 2.5 2.5
P.T. Samudera Indonesia Transportation and FY93 17.0 3.0 – 5.0 5.0
Warehousing
P.T. Sayap Mas Utama Chemicals FY98 10.0 20.0 5.8 – 5.8
P.T. South Pacific Viscose Chemicals FY93, 96 45.0 60.0 21.1 – 21.1
P.T. Sunson Textile Manufacturer Tbk. Textiles, Apparel & FY02 12.4 8.2 12.4 – 12.4
Leather
P.T. Wings Surya Chemicals FY98 8.7 21.3 5.1 – 5.1
PT Bank Buana Indonesia Finance & Insurance FY03 15.0 – – 15.0 15.0
PT Sahabat Mewah Dan Makmur Agriculture & Forestry FY03 12.0 – 12.0 – 12.0
PT Sigma Cipta Caraka Professional, Scientific FY01 3.0 – – 3.0 3.0
and Technical Services
Verdaine Investment Limited Agriculture & Forestry FY03 14.0 – 14.0 – 14.0
224.4 117.7 342.1
Korea, Republic ofAsset Korea Capital Management Co., Ltd. Collective FY99, 02 0.9 – – 0.9 0.9
Investment Vehicles
Cheil Jedang Investment Trust Finance & Insurance FY01 45.8 – 16.9 29.8 46.6
& Securities
Dae Chang Industrial Co. Ltd. Primary Metals FY99 22.4 9.8 12.4 7.1 19.4
Halim & Co., Ltd. Food & Beverages FY99 20.0 – 14.0 5.1 19.1
Hana Bank Finance & Insurance FY71, 74, 76, 79, 143.5 65.0 – 73.2 73.2
80, 82, 89, 91, 94,
97, 98, 99, 03
Iljin Electric Co., Ltd. Industrial & FY99 15.0 – 9.0 0.2 9.2
Consumer Products
KOMOCO MBS 2001-1 Finance & Insurance FY92 – – 15.2 – 15.2
Korea Growth and Restructuring Collective FY00 35.0 – – 34.0 34.0
Fund, L.P. Investment Vehicles
Korea Mortgage Corporation Finance & Insurance FY01 96.8 – 43.8 8.8 52.6
Samgwang Gohachem Co., Ltd. Chemicals FY85 0.1 – – 0.1 0.1
Shinmoorim Paper Manufacturing Pulp & Paper FY99, 00 41.4 8.0 23.4 9.2 32.6
Co., Ltd.
134.6 168.4 303.0
Lao People’s Democratic RepublicBelmont Hotel Investments (Laos) Ltd Accommodation & FY98, 01 1.2 – 1.0 – 1.0
Tourism Services
Burapaha Agro-Forestry Co., Ltd. Industrial & FY99 0.8 – 0.8 – 0.8
Consumer Products
Endeavour Embroidery Co. Ltd. Textiles, Apparel & FY99 0.1 – 0.1 – 0.1
Leather
Villa Santi Accommodation & FY01 1.1 – 1.1 – 1.1
Tourism Services
3.1 3.1
Original commitments1 Investments held for IFC(US$ millions) (US$ millions)
Fiscal Year in Totalwhich commitments syndi- Equity Total loans
Country, region or other area, and obligor Sector were made Total IFC cations Loans (at cost) and equity
ASIA & THE PACIFICat June 30, 2003
64

MaldivesMaldives Leasing Company Finance & Insurance FY02 1.3 – – 1.3 1.3
Limited
Villa Shipping and Trading Accommodation & FY03 15.0 – 15.0 – 15.0
Company Private Ltd. Tourism Services
15.0 1.3 16.3
MongoliaG&M Industrial Ltd. Textiles, Apparel & FY97 1.3 – 0.3 – 0.3
Leather
XACBank Ltd. Finance & Insurance FY02 0.4 – 0.4 – 0.4
0.7 0.7
NepalBhote Koshi Power Company Utilities FY98 23.9 32.9 18.0 2.9 20.9
Private Limited
Himal Power Limited Utilities FY96 32.0 – 27.9 – 27.9
ILFC – Nepal Finance & Insurance FY01 0.3 – – 0.3 0.3
Jomsom Mountain Resort (P) Ltd. Accommodation & FY98 4.0 – 4.0 – 4.0
Tourism Services
49.8 3.2 53.1
PhilippinesAlaska Milk Corp. Food & Beverages FY80 – – – 0.6 0.6
All Asia Capital Growth Collective FY96 4.0 – – + +
Ventures BVI – I, Ltd. Investment Vehicles
All Asia Capital Managers, Inc. Collective FY96 + – – + +
Investment Vehicles
Asian Eye Institute Health Care FY03 1.0 – 1.0 – 1.0
Asian Hospital Inc. Health Care FY01 7.0 – 7.0 – 7.0
Asian Ventures Ltd. Collective FY96 + – – + +
Investment Vehicles
Avalon Professional Web Trade Pte. Ltd. Information FY01, 02 1.6 – 0.7 1.0 1.7
Banco de Oro Universal Bank Finance & Insurance FY02 20.0 – 20.0 – 20.0
Bataan Polyethylene Corporation Chemicals FY00 40.0 117.3 39.8 – 39.8
Eastwood Cyber One Corporation Professional, Scientific FY02 25.0 – 25.0 – 25.0
and Technical Services
ePlanters Information FY00 0.2 – – 0.2 0.2
Filinvest Alabang Inc. Construction and FY02 22.0 – 22.0 – 22.0
Real Estate
H&Q Philippine Holdings BVI, Inc. Collective FY99 5.8 – – 5.8 5.8
Investment Vehicles
H&Q Philippine Ventures II, Inc. Collective FY94 2.4 – – 1.2 1.2
Investment Vehicles
H&Q Philippine Ventures, Inc. Collective FY89 2.3 – – 0.6 0.6
Investment Vehicles
Manila North Tollways Corporation Transportation and FY02 46.0 – 46.0 – 46.0
Warehousing
Manila Water Company Utilities FY03 30.2 – 30.2 – 30.2
Mariwasa Manufacturing, Inc. Nonmetallic Mineral FY70, 72, 00 15.0 0.5 13.6 – 13.6
Product Manufacturing
Marsman-Drysdale Agribusiness Food & Beverages FY99 15.0 10.0 11.8 – 11.8
Holdings, Inc.
Micro Enterprise Bank of Phillipines Finance & Insurance FY01 0.1 – – 0.1 0.1
Mirant Pagbilao Corporation Utilities FY93 70.0 11.0 24.0 10.0 34.0
Original commitments1 Investments held for IFC(US$ millions) (US$ millions)
Fiscal Year in Totalwhich commitments syndi- Equity Total loans
Country, region or other area, and obligor Sector were made Total IFC cations Loans (at cost) and equity
ASIA & THE PACIFICat June 30, 2003
65

Mirant Sual Corporation Utilities FY96 47.5 196.0 25.5 17.5 43.0
Northern Mindanao Power Corporation Utilities FY92, 93 16.8 21.0 – 4.3 4.3
Pilipinas Shell Petroleum Corporation Chemicals FY93 40.3 65.9 – 1.6 1.6
PlantersBank Finance & Insurance FY01 23.7 – + 8.7 8.7
Pryce Gases Incorporated Professional, Scientific FY99 13.0 5.0 13.0 – 13.0
and Technical Services
S&R Price Wholesale and FY02 12.5 – 12.5 – 12.5
Retail Trade
Software Ventrues Int’l., Inc Professional, Scientific FY03 4.0 – – 4.0 4.0
and Technical Services
STRADCOM Corporation Transportation and FY01 20.0 – 12.0 8.0 20.0
Warehousing
Union Cement Corporation Nonmetallic Mineral FY93 23.6 – – 5.6 5.6
Product Manufacturing
United Pulp and Paper Company, Inc. Pulp & Paper FY99 30.0 – 28.5 – 28.5
Walden AB Ayala Management Co., Inc. Collective FY95 0.1 – – 0.1 0.1
Investment Vehicles
Walden AB Ayala Ventures Co., Inc. Collective FY95 3.8 – – 1.0 1.0
Investment Vehicles
332.6 70.5 403.1
SamoaMedCen Samoa Ltd. Health Care FY92 0.5 – 0.5 – 0.5
National Bank of Samoa Finance & Insurance FY00 0.1 – 0.1 – 0.1
Wilex Cocoa and Coconut Food & Beverages FY92 0.3 – 0.3 – 0.3
Products Limited
0.9 0.9
Sri LankaAsia Power (Private) Limited Utilities FY97 11.0 8.8 6.6 2.3 8.8
Commercial Bank of Ceylon Finance & Insurance FY03 10.0 – – 10.0 10.0
Fitch Ratings Lanka Limited Finance & Insurance FY00 0.1 – – 0.1 0.1
Lanka Orix Factors Ltd. Finance & Insurance FY99 1.7 – 0.4 – 0.4
National Development Bank Finance & Insurance FY00 1.1 – – 1.1 1.1
Housing Corp.
Nations Trust Bank Finance & Insurance FY99 1.1 – – 1.1 1.1
Packages Lanka (Private) Limited Pulp & Paper FY97 1.1 – – 1.1 1.1
South Asia Gateway Terminals Transportation and FY00 42.3 – 33.5 7.3 40.8
(Private Limited) Warehousing
Suntel Limited Information FY01 7.5 – – 7.5 7.5
Taj Lanka Hotels Limited Accommodation & FY81, 82 8.4 10.2 – 0.6 0.6
Tourism Services
Union Assurance Limited Finance & Insurance FY88, 95 1.0 – – 1.0 1.0
40.5 32.0 72.5
Original commitments1 Investments held for IFC(US$ millions) (US$ millions)
Fiscal Year in Totalwhich commitments syndi- Equity Total loans
Country, region or other area, and obligor Sector were made Total IFC cations Loans (at cost) and equity
ASIA & THE PACIFICat June 30, 2003
66

ThailandAyudhya Development Leasing Co. Ltd. Finance & Insurance FY92, 93, 96, 98 12.4 – 3.6 2.4 6.0
Bangkok Mass Transit System Transportation and FY97, 99 99.7 – 89.8 9.8 99.7
Public Company Limited Warehousing
Bumrungrad Medical Center Limited Health Care FY94, 00 27.2 35.0 – 1.1 1.1
Central Plaza Hotel Company Limited Accommodation & FY93 13.9 – – 13.9 13.9
Tourism Services
Dhana Siam Finance and Securities Finance & Insurance FY94 30.0 – 6.5 – 6.5
Public Company Limited
HMC Polymers Company Limited Chemicals FY88, 96 18.9 11.0 – 3.9 3.9
Krung Thai IBJ Leasing Company Limited Finance & Insurance FY92 0.4 – – 0.4 0.4
Ladprao General Hospital Company Ltd. Health Care FY92 0.3 – – 0.3 0.3
Siam Asahi Technoglass Co. Ltd. Industrial & FY90 6.4 – – 6.4 6.4
Consumer Products
Star Petroleum Refining Company Limited Chemicals FY94 100.0 350.0 63.3 – 63.3
TelecomAsia Corporation Plc Information FY02 25.8 – 27.0 – 27.0
Thai Equity Fund Collective FY02 37.5 – – 37.5 37.5
Investment Vehicles
Thai Petrochemical Industry Chemicals FY97 98.2 383.3 98.9 + 98.9
Public Company Limited
Thailand International Rating Agency Finance & Insurance FY01 0.1 – – 0.1 0.1
Tuntex Petrochemicals Chemicals FY94 24.9 137.5 – 4.9 4.9
(Thailand) Public Co. Ltd.
United Palm Oil Industry Food & Beverages FY92 – – – 1.1 1.1
Public Company Limited
289.2 81.9 371.1
VietnamAllianz/AGF Insurance (Vietnam) Co. Ltd. Finance & Insurance FY03 1.3 – – 1.3 1.3
Asia Commercial Bank Finance & Insurance FY03 5.0 – – 5.0 5.0
Dragon Capital Group Finance & Insurance FY03 2.0 – – 2.0 2.0
Franco–Vietnamese Hospital Health Care FY02 8.0 – 8.0 – 8.0
Glass Egg Digital Media Professional, Scientific FY03 1.8 – – 1.8 1.8
and Technical Services
Global CyberSoft, Inc. Information FY02 1.3 – – 1.3 1.3
Holcim (Vietnam) Ltd. Nonmetallic Mineral FY96 30.0 66.6 18.5 – 18.5
Product Manufacturing
Nghe An Tate & Lyle Ltd Food & Beverages FY00 20.0 20.0 16.8 – 16.8
Nghi Son Cement Corporation Nonmetallic Mineral FY99 21.2 18.8 17.0 – 17.0
Product Manufacturing
RMIT Vietnam International University Education Services FY02 7.3 – 7.3 – 7.3
Saigon Thuong Tin Commercial Finance & Insurance FY03 2.9 – – 2.9 2.9
Joint Stock Bank
San Miguel Haiphong Glass Company Nonmetallic Mineral FY97 10.0 4.5 6.1 – 6.1
Product Manufacturing
Vietnam Enterprise Investment Limited Collective FY02, 03 20.0 – 12.0 8.0 20.0
Investment Vehicles
Vietnam International Leasing Finance & Insurance FY97 0.8 – – 0.8 0.8
Company Limited
Vinh Phat Company Limited Textiles, Apparel & FY99 0.1 – 0.1 – 0.1
Leather
85.8 23.0 108.9
Original commitments1 Investments held for IFC(US$ millions) (US$ millions)
Fiscal Year in Totalwhich commitments syndi- Equity Total loans
Country, region or other area, and obligor Sector were made Total IFC cations Loans (at cost) and equity
ASIA & THE PACIFICat June 30, 2003
67

Regional InvestmentsAsia Opportunity Fund L.P. Collective FY99 84.9 – – 77.1 77.1
Investment Vehicles
Asian Debt Facility Collective FY99 100.0 – 100.0 – 100.0
Investment Vehicles
Asian Infrastructure Fund Collective FY95 50.0 – – 41.8 41.8
Investment Vehicles
Asian Infrastructure Fund Collective FY95, 98 0.1 – – 0.1 0.1
Management Company Ltd. Investment Vehicles
Asian Mezzanine Infrastructure Fund Collective FY97 2.3 – – 0.8 0.8
Investment Vehicles
Asian Mezzanine Infrastructure Collective FY97 0.1 – – 0.1 0.1
Fund Management Company Investment Vehicles
Chase Asia Equity Advisors, L. D.C. Collective FY99 + – – + +
Investment Vehicles
Emerging Asia CBO Limited Finance & Insurance FY02 17.5 – 16.7 – 16.7
Kula Fund Limited Collective FY98 3.0 – – 2.4 2.4
Investment Vehicles
SEAVI Participation Certificate Collective FY92 – – – + +
Investment Vehicles
SMELoan Finance & Insurance FY02 20.0 – 15.0 5.0 20.0
Vital Solutions Pte Ltd Information FY01 1.0 – – 1.0 1.0
131.7 128.3 260.0
Total equity and loans 2,283.7 1,196.3 3,480.0
Total guarantees and risk management products 758.8
Total IFC portfolio for Asia & the Pacific 4,238.8
Original commitments1 Investments held for IFC(US$ millions) (US$ millions)
Fiscal Year in Totalwhich commitments syndi- Equity Total loans
Country, region or other area, and obligor Sector were made Total IFC cations Loans (at cost) and equity
ASIA & THE PACIFICat June 30, 2003
68

AlbaniaAnglo Albania Petroleum Limited Oil, Gas and Mining FY98 28.5 – – 28.5 28.5
Eurotech Cement, Shpk. Nonmetallic Mineral FY99 1.2 – 0.6 – 0.6
Product Manufacturing
FEFAD Bank Finance & Insurance FY00 1.0 – – 1.0 1.0
National Commercial Bank Sh.A. Finance & Insurance FY00 2.0 – – 2.0 2.0
0.6 31.5 32.1
ArmeniaACBA Leasing Finance & Insurance FY03 2.3 – 2.0 0.3 2.3
Armenia Hotel Closed Joint Accommodation & FY01 3.6 – – 3.6 3.6
Stock Company Tourism Services
2.0 3.8 5.8
AzerbaijanAmoco Caspian Sea Finance Ltd Oil, Gas and Mining FY99 32.8 32.8 21.9 – 21.9
Azerigazbank Finance & Insurance FY98, 03 1.6 – 1.2 – 1.2
Baku Coca–Cola Bottlers Limited Food & Beverages FY98 12.8 – 2.3 – 2.3
Baku Hotel Company Accommodation & FY00 17.5 – 10.2 – 10.2
Tourism Services
Early Oil Finance Company Oil, Gas and Mining FY99 15.4 15.4 10.3 – 10.3
Kocbank Azerbaijan Limited Finance & Insurance FY99 1.0 – – 1.0 1.0
Microfinance Bank Azerbaijan Finance & Insurance FY02 1.8 – – 1.8 1.8
Rabitabank Finance & Insurance FY98, 03 1.6 – 1.2 – 1.2
Turkish Petroleum Early Oil Oil, Gas and Mining FY99 13.0 13.0 8.7 – 8.7
Finance Co. Ltd.
Unocal Chirag Finance Ltd. Oil, Gas and Mining FY99 19.4 19.4 12.9 – 12.9
68.7 2.8 71.5
BelarusPriorbank Joint Stock Company Finance & Insurance FY03 14.0 – 14.0 – 14.0
14.0 14.0
Bosnia and HerzegovinaAkova Impex, d.o.o. Food & Beverages FY99 2.1 – 1.3 – 1.3
Bosnalijek, d.d. Sarajevo Chemicals FY99, 01 4.6 – 1.9 1.8 3.8
Central Profit Banka Finance & Insurance FY02 3.0 – 3.6 – 3.6
Fabrika Cementa Lukavac Nonmetallic Mineral FY03 10.8 2.7 11.5 – 11.5
Product Manufacturing
Horizonte Bosnia–Herzegovina Collective FY98 1.9 – – 1.9 1.9
Enterprise Fund Investment Vehicles
INGA O.D.P. Industrial & FY98 0.1 – 1.8 – 1.8
Consumer Products
Konjuh Preduzece za Proizvodnju Industrial & FY98 (0.1) – 2.6 – 2.6
i Promet Namjestaja D.D. se P.A. Consumer Products
Lignosper ODP Industrial & FY98 2.4 – 2.4 – 2.4
Consumer Products
Lijanovici d.o.o. Food & Beverages FY99 2.5 – 1.6 – 1.6
Microenterprise Bank d.d. Sarajevo Finance & Insurance FY98, 99, 01, 03 4.5 – 3.4 1.2 4.7
O.D. Drvno Industrijsko Industrial & FY92 – – 1.8 – 1.8
Preduzece “KOZARA” Consumer Products
ODP Drvna Industrija Podgradci Industrial & FY92 – – 1.3 – 1.3
Consumer Products
Raiffeisen Bank Bosnia Finance & Insurance FY03 8.5 – 8.5 – 8.5
Sarajevo Privatization Venture Finance & Insurance FY02, 03 11.5 – 15.3 + 15.3
Original commitments1 Investments held for IFC(US$ millions) (US$ millions)
Fiscal Year in Totalwhich commitments syndi- Equity Total loans
Country, region or other area, and obligor Sector were made Total IFC cations Loans (at cost) and equity
EUROPE & CENTRAL ASIAat June 30, 2003
69

Sarajevska Pivara, D. D. Food & Beverages FY98 4.0 – 1.1 – 1.1
Sour Energoinvest Industrial & FY85 15.2 – 9.0 – 9.0
Consumer Products
Tvornica Kartona I Ambalaze Cazin Pulp & Paper FY77 10.8 7.4 3.9 – 3.9
Vrbas M.D.P. Industrial & FY98 0.1 – 1.8 – 1.8
Consumer Products
Wood Agency Credit Line* Industrial & FY98 14.0 – 5.2 – 5.2
Consumer Products
78.2 5.0 83.2
BulgariaBulbank AD Finance & Insurance FY01 17.5 – – 17.5 17.5
Bulgarian–American Credit Bank, AD Finance & Insurance FY99, 03 10.0 – 7.0 – 7.0
Compagnie des Hotels de Luxe S.A. Accommodation & FY98 13.0 9.5 12.9 – 12.9
Tourism Services
Devnya Cement A.D. Nonmetallic Mineral FY99 28.6 – 26.8 – 26.8
Product Manufacturing
Doverie Brico Agriculture & Forestry FY01 4.6 – 5.3 – 5.3
Elex N.V. Industrial & FY01 8.7 – 9.7 – 9.7
Consumer Products
EuroMerchant Balkan Fund SICAV Collective FY95 5.0 – – 4.9 4.9
Investment Vehicles
Florina Bulgaria S.A. Food & Beverages FY01 3.8 – 4.8 – 4.8
Kronospan Bulgaria EOOD Industrial & FY00, 01 19.1 11.9 19.2 – 19.2
Consumer Products
Paper Factory Stambolijski Pulp & Paper FY02 25.5 – 22.0 2.0 24.0
Petreco S.A.R.L. Oil, Gas and Mining FY03 17.0 – 17.0 – 17.0
ProCredit Bank AD Finance & Insurance FY01, 03 2.3 – – 2.3 2.3
Sofia Med Primary Metals FY01 14.1 – 15.5 – 15.5
Unionbank AD Finance & Insurance FY03 5.0 – 5.0 – 5.0
145.1 26.6 171.7
CroatiaBelisce D.D. Pulp & Paper FY73, 81, 98, 03 60.9 63.9 20.9 6.0 26.9
Brodogradiliste “Viktor Lenac” d.d. Industrial & FY00 12.1 9.0 6.0 6.1 12.1
Consumer Products
Croatia Banka d.d. Finance & Insurance FY02 9.8 – 10.3 – 10.3
Erste & Steiermarkische Bank D.D. Finance & Insurance FY00, 03 34.6 – 34.6 – 34.6
Pliva d.d. Chemicals FY01 35.0 12.5 10.0 – 10.0
The Croatia Capital Collective FY99 5.0 – – 5.0 5.0
Partnership L.P. Investment Vehicles
81.7 17.1 98.9
Czech RepublicCDV–1 Holding Company, L.P. Finance & Insurance FY01, 03 17.9 – – 2.9 2.9
Cekoslovenská Obchodní Banka a.s. Finance & Insurance FY99 77.7 – – 77.7 77.7
Cembrit CZ, a.s. Oil, Gas and Mining FY95 5.0 – 1.7 – 1.7
Cembrit Moravia, a.s. Oil, Gas and Mining FY95 5.6 – 1.5 – 1.5
Energy Center Kladno Utilities FY97 58.3 24.2 49.8 – 49.8
Generating, s.r.o. (ECKG)
Hayes Lemmerz Autokola, a.s. Industrial & FY94 16.4 22.1 3.7 – 3.7
Consumer Products
Nová Hut, a.s. Primary Metals FY97, 98 85.6 159.6 86.4 – 86.4
143.1 80.6 223.8
Original commitments1 Investments held for IFC(US$ millions) (US$ millions)
Fiscal Year in Totalwhich commitments syndi- Equity Total loans
Country, region or other area, and obligor Sector were made Total IFC cations Loans (at cost) and equity
EUROPE & CENTRAL ASIAat June 30, 2003
70
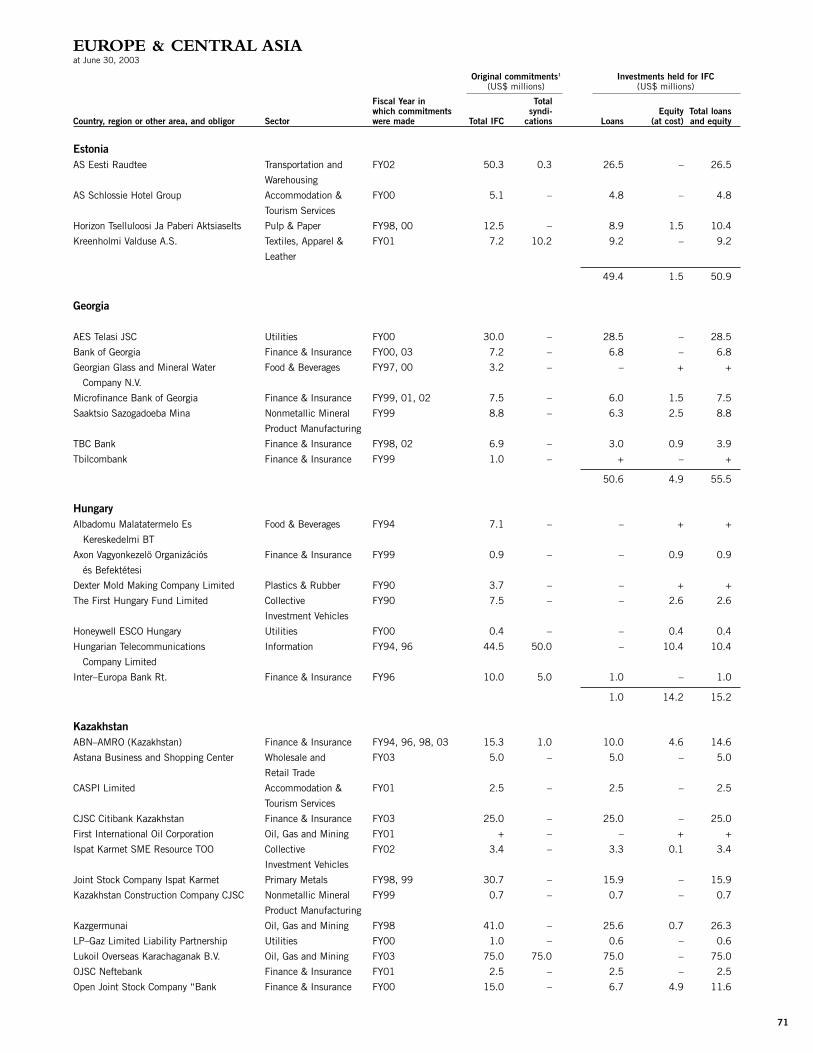
EstoniaAS Eesti Raudtee Transportation and FY02 50.3 0.3 26.5 – 26.5
Warehousing
AS Schlossie Hotel Group Accommodation & FY00 5.1 – 4.8 – 4.8
Tourism Services
Horizon Tselluloosi Ja Paberi Aktsiaselts Pulp & Paper FY98, 00 12.5 – 8.9 1.5 10.4
Kreenholmi Valduse A.S. Textiles, Apparel & FY01 7.2 10.2 9.2 – 9.2
Leather
49.4 1.5 50.9
Georgia
AES Telasi JSC Utilities FY00 30.0 – 28.5 – 28.5
Bank of Georgia Finance & Insurance FY00, 03 7.2 – 6.8 – 6.8
Georgian Glass and Mineral Water Food & Beverages FY97, 00 3.2 – – + +
Company N.V.
Microfinance Bank of Georgia Finance & Insurance FY99, 01, 02 7.5 – 6.0 1.5 7.5
Saaktsio Sazogadoeba Mina Nonmetallic Mineral FY99 8.8 – 6.3 2.5 8.8
Product Manufacturing
TBC Bank Finance & Insurance FY98, 02 6.9 – 3.0 0.9 3.9
Tbilcombank Finance & Insurance FY99 1.0 – + – +
50.6 4.9 55.5
HungaryAlbadomu Malatatermelo Es Food & Beverages FY94 7.1 – – + +
Kereskedelmi BT
Axon Vagyonkezelö Organizációs Finance & Insurance FY99 0.9 – – 0.9 0.9
és Befektétesi
Dexter Mold Making Company Limited Plastics & Rubber FY90 3.7 – – + +
The First Hungary Fund Limited Collective FY90 7.5 – – 2.6 2.6
Investment Vehicles
Honeywell ESCO Hungary Utilities FY00 0.4 – – 0.4 0.4
Hungarian Telecommunications Information FY94, 96 44.5 50.0 – 10.4 10.4
Company Limited
Inter–Europa Bank Rt. Finance & Insurance FY96 10.0 5.0 1.0 – 1.0
1.0 14.2 15.2
KazakhstanABN–AMRO (Kazakhstan) Finance & Insurance FY94, 96, 98, 03 15.3 1.0 10.0 4.6 14.6
Astana Business and Shopping Center Wholesale and FY03 5.0 – 5.0 – 5.0
Retail Trade
CASPI Limited Accommodation & FY01 2.5 – 2.5 – 2.5
Tourism Services
CJSC Citibank Kazakhstan Finance & Insurance FY03 25.0 – 25.0 – 25.0
First International Oil Corporation Oil, Gas and Mining FY01 + – – + +
Ispat Karmet SME Resource TOO Collective FY02 3.4 – 3.3 0.1 3.4
Investment Vehicles
Joint Stock Company Ispat Karmet Primary Metals FY98, 99 30.7 – 15.9 – 15.9
Kazakhstan Construction Company CJSC Nonmetallic Mineral FY99 0.7 – 0.7 – 0.7
Product Manufacturing
Kazgermunai Oil, Gas and Mining FY98 41.0 – 25.6 0.7 26.3
LP–Gaz Limited Liability Partnership Utilities FY00 1.0 – 0.6 – 0.6
Lukoil Overseas Karachaganak B.V. Oil, Gas and Mining FY03 75.0 75.0 75.0 – 75.0
OJSC Neftebank Finance & Insurance FY01 2.5 – 2.5 – 2.5
Open Joint Stock Company “Bank Finance & Insurance FY00 15.0 – 6.7 4.9 11.6
Original commitments1 Investments held for IFC(US$ millions) (US$ millions)
Fiscal Year in Totalwhich commitments syndi- Equity Total loans
Country, region or other area, and obligor Sector were made Total IFC cations Loans (at cost) and equity
EUROPE & CENTRAL ASIAat June 30, 2003
71

Turanalem”
Open Joint Stock Company Finance & Insurance FY97, 00 12.5 20.0 – 1.0 1.0
“Kazkommertsbank”
Rambutya Limited Liability Partnership Wholesale and FY00, 02 12.9 – 9.9 – 9.9
Retail Trade
Sazankurak Joint Stock Company Oil, Gas and Mining FY01 20.0 – 17.5 – 17.5
200.2 11.3 211.5
Kyrgyz RepublicAkun Ltd. Food & Beverages FY02 2.4 – 2.4 – 2.4
Demir Kyrgyz International Bank Finance & Insurance FY97 0.5 – – 0.5 0.5
FINCA Microfinance Resource Finance & Insurance FY02 1.0 – – 1.0 1.0
Kumtor Gold Company Oil, Gas and Mining FY95 40.0 – 10.0 – 10.0
Kyrgyz Investment & Commercial Bank Finance & Insurance FY01 1.4 – – 1.4 1.4
Kyrgyz–Chinese Joint Venture Altyn–Ajydar Pulp & Paper FY00 0.3 – 0.2 – 0.2
12.6 2.8 15.5
LatviaLinstow Varner SIA Wholesale and FY02 25.0 35.0 26.2 – 26.2
Retail Trade
26.2 26.2
LithuaniaAB Drobe Wool Textiles, Apparel & FY00 6.6 – 5.5 0.5 6.0
Leather
Viesbutis Lietuva Accommodation & FY02 10.4 10.4 11.5 – 11.5
Tourism Services
Vilniaus Bankas AB Finance & Insurance FY99, 01 18.3 – 25.2 – 25.2
42.1 0.5 42.6
Macedonia, Former Yugoslav RepublicAlkaloid AD Skopje Chemicals FY00 9.0 – 9.1 – 9.1
Enterprise for Production, Trade, and Primary Metals FY98 3.8 – 3.8 – 3.8
Services “Nikol–Fert” Export–Import,
D.O.O.
Komercijalna Banka A.D. Skopje Finance & Insurance FY01 3.3 – 4.3 – 4.3
Makedonijaturist A.D. Accommodation & FY99 4.0 – 1.8 – 1.8
Tourism Services
Makedonski Telekomunikacii Information FY98 25.0 25.0 – 11.3 11.3
Masinomont Industrial & FY98 0.8 – 0.8 – 0.8
Consumer Products
Microfinance Bank of Macedonia Finance & Insurance FY03 1.1 – – 1.1 1.1
SEAF–Macedonia LLC Collective FY00 2.5 – – 2.5 2.5
Investment Vehicles
Stopanska Banka a.d. Skopje Finance & Insurance FY98, 00, 01, 03 10.7 – – 10.5 10.5
Teteks A.D. Textiles, Apparel & FY98, 02 6.8 – 5.6 – 5.6
Leather
25.4 25.5 50.9
Original commitments1 Investments held for IFC(US$ millions) (US$ millions)
Fiscal Year in Totalwhich commitments syndi- Equity Total loans
Country, region or other area, and obligor Sector were made Total IFC cations Loans (at cost) and equity
EUROPE & CENTRAL ASIAat June 30, 2003
72

MoldovaBanca Comerciala Victoriabank SA Finance & Insurance FY02 4.0 – 4.0 – 4.0
FinComBank S.A. Finance & Insurance FY03 1.5 – 1.5 – 1.5
Incon JSC, Cupchin JSC, Food & Beverages FY97 6.9 – 4.9 2.0 6.9
Ungheni JSC, Floresti JSC
Micro Enterprise Credit Bank Moldova S.A. Finance & Insurance FY02 1.4 – – 1.4 1.4
Micro Enterprise Credit din Moldova S.A Finance & Insurance FY00 1.0 – 0.9 0.1 1.0
Moldinconbank S.A. Finance & Insurance FY01 3.0 – 2.8 – 2.8
RED Chisinau, RED Centru & RED Sud Utilities FY02 25.0 – 25.0 – 25.0
Voxtel S.A. Information FY99, 00, 01 16.6 25.0 13.5 1.6 15.1
52.7 5.1 57.7
PolandBaltic Malt Sp. zo.o Food & Beverages FY97 8.4 – 1.5 1.9 3.4
Central Poland Fund, L.L.C. Collective FY98 1.6 – – 1.6 1.6
Investment Vehicles
Gaspol S.A. Transportation and FY96, 97 6.0 – – 6.0 6.0
Warehousing
Global Hotels Development Accommodation & FY99 11.2 – 8.6 3.2 11.8
Group Poland S.A. Tourism Services
Honeywell ESCO Polska Utilities FY92 0.2 – – 0.2 0.2
Huta L.W. Sp. z o.o. Primary Metals FY93 22.8 – 2.6 – 2.6
Intercell S.A. Pulp & Paper FY95, 97, 98, 01 13.6 – – 13.6 13.6
Norgips Opole SP z o.o. Oil, Gas and Mining FY97 11.4 21.4 9.3 – 9.3
Peters A.G./GMT–Poland S.A. Food & Beverages FY94 6.6 – 0.6 0.1 0.7
Pilkington Polska SP. z o.o. Nonmetallic Mineral FY93 44.7 25.4 5.4 – 5.4
Product Manufacturing
The Poland Investment Fund L.P. Collective FY95 2.5 – – 1.5 1.5
Investment Vehicles
28.0 28.1 56.1
RomaniaAmbro S.A. Pulp & Paper FY00 5.9 – 4.1 – 4.1
Banc Post S.A. Finance & Insurance FY99, 02 20.0 – 10.0 – 10.0
Banca Comerciala Romana Finance & Insurance FY03 75.0 – 75.0 – 75.0
Banca Romaneasca S.A. Finance & Insurance FY01 5.9 – 5.3 – 5.3
The Danube Fund Collective FY97 2.0 – – 1.4 1.4
Investment Vehicles
Demir Romlease S.A. Finance & Insurance FY95, 98, 01 9.8 – 3.9 – 3.9
Dunapack Rambox Prodimpex S.R.L. Pulp & Paper FY99 4.1 – 0.8 2.0 2.8
ICME ECAB S.A. Primary Metals FY02 14.8 – 17.2 – 17.2
Krupp Bilstein Compa S.A. Industrial & FY98 2.8 2.8 0.9 – 0.9
Consumer Products
Krupp Compa Arcuri S.A. Industrial & FY99 6.2 2.7 3.4 – 3.4
Consumer Products
Microfinance Bank MIRO S.A. Finance & Insurance FY02, 03 2.6 – – 2.6 2.6
Mobil Rom S.A. Information FY92, 98, 01 52.1 162.9 30.2 – 30.2
S.C. Arctic S.A. Industrial & FY03 11.7 – 11.5 – 11.5
Consumer Products
162.2 6.0 168.2
Original commitments1 Investments held for IFC(US$ millions) (US$ millions)
Fiscal Year in Totalwhich commitments syndi- Equity Total loans
Country, region or other area, and obligor Sector were made Total IFC cations Loans (at cost) and equity
EUROPE & CENTRAL ASIAat June 30, 2003
73

Russian FederationAgro–Industrial Finance Company Finance & Insurance FY03 5.5 7.5 5.0 0.5 5.5
Alpha Cement Open Joint Stock Nonmetallic Mineral FY96, 98 15.6 – – 13.5 13.5
Company Product Manufacturing
Aminex Plc Oil, Gas and Mining FY97, 99 13.2 – – 5.5 5.5
AO Mosenergo Utilities FY98 20.0 – 14.6 – 14.6
Baltiskii Leasing ZAO Finance & Insurance FY02 2.0 – 1.8 – 1.8
The Baring Vostok Private Collective FY01 15.0 – – 14.9 14.9
Equity Fund, L.P 2 Investment Vehicles
BCEN Eurobank Finance & Insurance FY03 100.0 – 100.0 – 100.0
Campina 000 Food & Beverages FY00 8.8 – 3.6 – 3.6
Commercial Bank DeltaCredit Finance & Insurance FY02, 03 50.0 – 50.0 – 50.0
DeltaLeasing Finance & Insurance FY02 10.0 – 10.0 – 10.0
Egar Technology Information FY02 1.5 – – 1.5 1.5
First NIS Regional Fund Collective FY95 15.0 – – 0.2 0.2
Investment Vehicles
Framlington Russian Investment Fund Collective FY94 8.0 – – 4.0 4.0
Investment Vehicles
IBS Group Holdings Limited Information FY03 12.0 – 12.0 – 12.0
IKEA MOS (Retail and Property) OOO Wholesale and FY00 15.0 – 15.0 – 15.0
Retail Trade
Industry & Construction Bank Finance & Insurance FY02 10.0 – 10.0 – 10.0
Moscow Narodny Bank, Ltd. Finance & Insurance FY03 100.0 – 100.0 – 100.0
NBD Bank Finance & Insurance FY02, 03 7.5 – 7.5 – 7.5
New Medical Center Health Care FY01 2.1 – 2.2 – 2.2
OAO Borsky Stekolny Zavod Nonmetallic Mineral FY98, 03 42.2 – 28.6 15.0 43.6
Product Manufacturing
Omsukchansk Mining and Oil, Gas and Mining FY01 10.0 – 7.3 – 7.3
Geological Company
OOO Ruscam Nonmetallic Mineral FY02, 03 23.0 – 23.0 – 23.0
Product Manufacturing
Open Joint Stock Company Finance & Insurance FY02 2.0 – 1.6 – 1.6
Commercial Bank “Center–invest”
ProbusinessBank Finance & Insurance FY02 5.0 – 5.0 – 5.0
Ramenka 000 Wholesale and FY99, 01, 03 100.5 30.0 85.2 – 85.2
Retail Trade
Ru–Net Holdings Information FY03 6.0 – 3.0 3.0 6.0
Russian Standard Bank Finance & Insurance FY02 10.0 – – 10.0 10.0
The Russian Technology Fund L.P. Collective FY96 1.0 – – 1.0 1.0
Investment Vehicles
Sector Investment Holding Company Ltd. Collective FY92 – – – 1.1 1.1
Investment Vehicles
Small Business Credit Bank Finance & Insurance FY02 7.0 – 7.0 – 7.0
(KMB Bank)
Stavropolsky Broiler Agriculture & Forestry FY03 15.0 – 15.0 – 15.0
Swedwood Holding, BV Industrial & FY02 5.7 – 7.4 – 7.4
Consumer Products
UralTransBank Finance & Insurance FY03 10.0 – 10.0 – 10.0
Volga–Dnepr Airlines Transportation and FY02 16.9 13.0 16.9 – 16.9
Warehousing
ZAO Deutsche Leasing Vostok Finance & Insurance FY00 0.6 – – 0.6 0.6
ZAO The National Registry Company Finance & Insurance FY95 1.5 – – 1.5 1.5
ZAO Raiffeisenbank Austria Finance & Insurance FY03 80.0 – 80.0 – 80.0
ZAO Sonic Duo Information FY02 30.0 10.0 30.0 – 30.0
ZAO Stora Enso Packaging Pulp & Paper FY00, 02 14.5 – 10.6 – 10.6
662.3 72.2 734.5
Original commitments1 Investments held for IFC(US$ millions) (US$ millions)
Fiscal Year in Totalwhich commitments syndi- Equity Total loans
Country, region or other area, and obligor Sector were made Total IFC cations Loans (at cost) and equity
EUROPE & CENTRAL ASIAat June 30, 2003
74
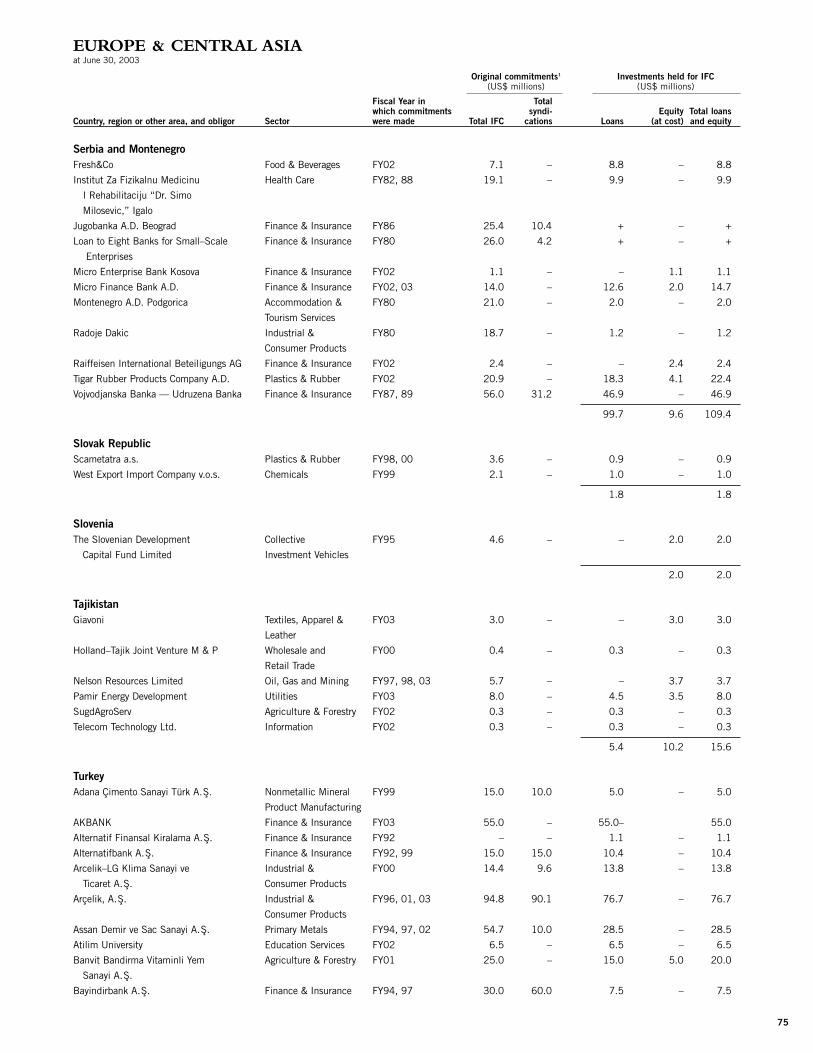
Serbia and MontenegroFresh&Co Food & Beverages FY02 7.1 – 8.8 – 8.8
Institut Za Fizikalnu Medicinu Health Care FY82, 88 19.1 – 9.9 – 9.9
I Rehabilitaciju “Dr. Simo
Milosevic,” Igalo
Jugobanka A.D. Beograd Finance & Insurance FY86 25.4 10.4 + – +
Loan to Eight Banks for Small–Scale Finance & Insurance FY80 26.0 4.2 + – +
Enterprises
Micro Enterprise Bank Kosova Finance & Insurance FY02 1.1 – – 1.1 1.1
Micro Finance Bank A.D. Finance & Insurance FY02, 03 14.0 – 12.6 2.0 14.7
Montenegro A.D. Podgorica Accommodation & FY80 21.0 – 2.0 – 2.0
Tourism Services
Radoje Dakic Industrial & FY80 18.7 – 1.2 – 1.2
Consumer Products
Raiffeisen International Beteiligungs AG Finance & Insurance FY02 2.4 – – 2.4 2.4
Tigar Rubber Products Company A.D. Plastics & Rubber FY02 20.9 – 18.3 4.1 22.4
Vojvodjanska Banka — Udruzena Banka Finance & Insurance FY87, 89 56.0 31.2 46.9 – 46.9
99.7 9.6 109.4
Slovak RepublicScametatra a.s. Plastics & Rubber FY98, 00 3.6 – 0.9 – 0.9
West Export Import Company v.o.s. Chemicals FY99 2.1 – 1.0 – 1.0
1.8 1.8
SloveniaThe Slovenian Development Collective FY95 4.6 – – 2.0 2.0
Capital Fund Limited Investment Vehicles
2.0 2.0
TajikistanGiavoni Textiles, Apparel & FY03 3.0 – – 3.0 3.0
Leather
Holland–Tajik Joint Venture M & P Wholesale and FY00 0.4 – 0.3 – 0.3
Retail Trade
Nelson Resources Limited Oil, Gas and Mining FY97, 98, 03 5.7 – – 3.7 3.7
Pamir Energy Development Utilities FY03 8.0 – 4.5 3.5 8.0
SugdAgroServ Agriculture & Forestry FY02 0.3 – 0.3 – 0.3
Telecom Technology Ltd. Information FY02 0.3 – 0.3 – 0.3
5.4 10.2 15.6
TurkeyAdana Çimento Sanayi Türk A.S. Nonmetallic Mineral FY99 15.0 10.0 5.0 – 5.0
Product Manufacturing
AKBANK Finance & Insurance FY03 55.0 – 55.0– 55.0
Alternatif Finansal Kiralama A.S. Finance & Insurance FY92 – – 1.1 – 1.1
Alternatifbank A.S. Finance & Insurance FY92, 99 15.0 15.0 10.4 – 10.4
Arcelik–LG Klima Sanayi ve Industrial & FY00 14.4 9.6 13.8 – 13.8
Ticaret A.S. Consumer Products
Arçelik, A.S. Industrial & FY96, 01, 03 94.8 90.1 76.7 – 76.7
Consumer Products
Assan Demir ve Sac Sanayi A.S. Primary Metals FY94, 97, 02 54.7 10.0 28.5 – 28.5
Atilim University Education Services FY02 6.5 – 6.5 – 6.5
Banvit Bandirma Vitaminli Yem Agriculture & Forestry FY01 25.0 – 15.0 5.0 20.0
Sanayi A.S.
Bayindirbank A.S. Finance & Insurance FY94, 97 30.0 60.0 7.5 – 7.5
Original commitments1 Investments held for IFC(US$ millions) (US$ millions)
Fiscal Year in Totalwhich commitments syndi- Equity Total loans
Country, region or other area, and obligor Sector were made Total IFC cations Loans (at cost) and equity
EUROPE & CENTRAL ASIAat June 30, 2003
75

Beko Elektronik A.S. Industrial & FY03 25.1 25.1 29.0 – 29.0
Consumer Products
Borçelik Çelik Sanayii Ticaret A.S. Primary Metals FY92, 95, 96, 97 47.1 – 10.0 9.7 19.7
Çayeli Bakir Isletmeleri A.S. Oil, Gas and Mining FY93 30.0 45.0 4.2 – 4.2
CBS Boya Kimya Sanayii ve Ticaret A.S. Chemicals FY95, 96 0.7 – – 3.7 3.7
CBS Holding A.S. Chemicals FY94 15.5 – 4.0 – 4.0
CBS Printas Baski Mürekkepleri Chemicals FY96, 01 + – – 0.6 0.6
ve Gerecleri A.S.
Demir Finansal Kiralama A.S. Finance & Insurance FY97, 98 15.0 – 1.1 – 1.1
Eczacibasi Karo Seramik Nonmetallic Mineral FY02 10.4 – 12.1 – 12.1
Product Manufacturing
Elginkan Holding A.S. Industrial & FY88, 93, 97 47.8 1.9 0.4 – 0.4
Consumer Products
Entek Elektrik Üretimi Utilities FY98 25.0 26.5 21.3 – 21.3
Otoprodüktor Grubu A.S.
Finans Finansal Kiralama A.S. Finance & Insurance FY97, 98 11.0 – 1.1 – 1.1
Finansbank, A.S. Finance & Insurance FY92, 00 20.0 55.6 6.7 – 6.7
Garanti Finansal Kiralama A.S. Finance & Insurance FY95, 98, 00 19.3 43.4 1.1 – 1.1
Gunkol Gunes Enerjisi ve Klima Industrial & FY02 10.8 – 13.4 – 13.4
Sanayi A.S. Consumer Products
Gümüssuyu Hali ve Yer Kaplamalari Textiles, Apparel & FY99 7.0 – 7.2 – 7.2
Sanayi ve Ticaret A.S. Leather
Indorama Iplik Sanayii ve Ticaret A.S. Textiles, Apparel & FY99 10.7 – 6.9 0.7 7.5
Leather
Ipek Kagit Sanayii ve Ticaret A.S. Pulp & Paper FY98, 00, 02 44.6 33.0 38.7 – 38.7
Istanbul Bilgi University Education Services FY01 12.0 – 12.0 – 12.0
Kepez Elektrik T.A.S. Utilities FY91 20.2 – 6.5 – 6.5
Kiris Otelcilik ve Turizm A.S. Accommodation & FY89, 90 23.4 – 25.0 – 25.0
Tourism Services
Koy–Tur Holding A.S. Food & Beverages FY90, 92 12.7 – – + +
Kula Mensucat Fabrikasi A.S. Textiles, Apparel & FY91 19.8 – 4.9 – 4.9
Leather
Medya Holding A.S. Information FY93, 96 28.6 – 7.5 – 7.5
Milli Reasurans T.A.S. Finance & Insurance FY02 50.0 – 50.0 – 50.0
Modern Karton Sanayii ve Ticaret A.S. Pulp & Paper FY98, 02 30.0 10.0 22.7 – 22.7
NASCO Nasreddin Holding A.S. Textiles, Apparel & FY92 17.5 5.0 10.2 – 10.2
Leather
Pasabahce Eskisehir Cam Sanayi Nonmetallic Mineral FY99, 02 24.2 16.7 9.9 – 9.9
ve Ticaret A.S. Product Manufacturing
Pinar Entegre Et Ve Yem Sanayi A.S. Food & Beverages FY84, 94, 98 21.9 – 6.3 – 6.3
Pinar Sut Mamulleri Sanayii A.S. Food & Beverages FY94, 00 23.2 – 16.1 – 16.1
Sakosa Sabanci–Kosa Endüstriyel Iplik Textiles, Apparel & FY99 24.3 23.8 21.7 – 21.7
ve Kord Bezi Sanayi ve Ticaret A.S. Leather
Silkar Turizm Yatirim ve Accommodation & FY86, 90 19.3 9.8 3.0 + 3.0
Isletmeleri A.S. Tourism Services
Söktas Pamuk ve Tarim Ürunlerini Textiles, Apparel & FY98, 02 17.0 – 11.8 – 11.8
Degerlendirme Ticaret ve Sanayi A.S. Leather
TEB Finansal Kiralama A.S. Finance & Insurance FY99 5.0 – 2.2 – 2.2
Trakya Cam Sanayii A.S. Nonmetallic Mineral FY79, 83, 84, 89, 66.7 31.4 – 3.4 3.4
Product Manufacturing 91, 96, 99
Turkish Private Equity Fund I L.P. Collective FY02 10.0 – – 10.0 10.0
Investment Vehicles
Türk Ekonomi Bankasi A.S. Finance & Insurance FY95, 99, 03 62.5 37.5 41.7 – 41.7
Türkiye Sise ve Cam Fabrikalari A.S. Nonmetallic Mineral FY93, 97, 02, 03 138.2 89.1 97.9 – 97.9
Product Manufacturing
Original commitments1 Investments held for IFC(US$ millions) (US$ millions)
Fiscal Year in Totalwhich commitments syndi- Equity Total loans
Country, region or other area, and obligor Sector were made Total IFC cations Loans (at cost) and equity
EUROPE & CENTRAL ASIAat June 30, 2003
76

Unye Cimento Sanayi ve Ticaret A.S. Nonmetallic Mineral FY00 21.4 – 14.6 – 14.6
Product Manufacturing
Uzel Makina Sanayii A.S. Industrial & FY99 11.4 8.5 9.5 – 9.5
Consumer Products
Viking Kagit ve Seluloz, A.S. Pulp & Paper FY70, 71, 82, 83, 98 15.2 – 8.2 – 8.2
Yalova Elyaf ve Iplik A.S. Textiles, Apparel & FY96 15.0 8.0 2.5 – 2.5
Leather
Yapi Kredi Finansal Kirkalama A.O. Finance & Insurance FY97, 98 12.9 – 1.0 – 1.0
Yeditepe Beynelmilel Otelcilik Accommodation & FY90, 94, 02 31.8 27.5 10.6 + 10.6
Turizm ve Ticaret A.S. Tourism Services
772.1 33.0 805.2
UkraineFirst Ukrainian International Bank Finance & Insurance FY98 5.0 – – 5.0 5.0
Joint Stock Commercial Bank Finance & Insurance FY98 2.3 – – 2.3 2.3
HVB Bank Ukraine
JSC Damen Shipyards Okean Industrial & FY02 10.0 – 10.0 – 10.0
Consumer Products
Microfinance Bank of Ukraine Finance & Insurance FY01 5.2 – 3.5 1.7 5.2
Ukraine Fund Collective FY94, 97 3.1 – – 2.9 2.9
Investment Vehicles
13.5 11.9 25.4
UzbekistanABN–AMRO Bank NB Uzbekistan A.O. Finance & Insurance FY96 1.0 – – 1.0 1.0
Fayz Holding Joint Stock Industrial & FY98 2.4 – 0.8 0.5 1.3
Company of the Open Type Consumer Products
National Bank for Foreign Economic Finance & Insurance FY00 15.0 – 14.5 – 14.5
Activity the Republic of Uzbekistan
Open Joint–Stock Commercial Finance & Insurance FY01 1.0 – 1.0 – 1.0
Bank “Hamkorbank”
Osiyo Granite Ltd. Nonmetallic Mineral FY01 1.6 – 1.6 – 1.6
Product Manufacturing
Private Closed JointStock Finance & Insurance FY01 1.0 – 1.0 – 1.0
Commercial Bank “Parvina Bank”
State Joint–Stock Commercial Finance & Insurance FY00, 03 15.0 – 13.0 – 13.0
Bank “Asaka”
The Uzbek–Dutch Joint Venture Uzdutch Food & Beverages FY00 0.6 – 0.5 – 0.5
Cheese Ltd. Limited Liability Company
Uzbek Leasing International A.O. Finance & Insurance FY96, 01, 03 3.4 – 2.5 0.9 3.4
35.0 2.4 37.4
Original commitments1 Investments held for IFC(US$ millions) (US$ millions)
Fiscal Year in Totalwhich commitments syndi- Equity Total loans
Country, region or other area, and obligor Sector were made Total IFC cations Loans (at cost) and equity
EUROPE & CENTRAL ASIAat June 30, 2003
77

Regional InvestmentsABC Medicover Holdings B.V. Health Care FY99 7.0 – 4.5 – 4.5
Advent Central and Eastern Europe II Collective FY98 15.0 – – 14.2 14.2
Investment Vehicles
Advent Central Europe Management L.P. Collective FY95 + – – + +
Investment Vehicles
Advent Private Equity Fund – Central Collective FY95 10.0 – – 4.8 4.8
Europe Limited Partnership Investment Vehicles
AIG Emerging Europe Collective FY00 30.0 – – 30.0 30.0
Infrastructure Fund Investment Vehicles
Alliance ScanEast Fund, L.P. Collective FY94 4.9 – – 3.8 3.8
Investment Vehicles
Baltic American Enterprise Fund Finance & Insurance FY03 50.0 – 50.0 – 50.0
Bancroft II L.P. Collective FY03 22.9 – – 22.9 22.9
Investment Vehicles
Black Sea Fund L.P. Collective FY99, 02 14.5 – – 14.4 14.4
Investment Vehicles
Central Europe Telecom Collective FY94 9.7 – – + +
Investments, L.P. Investment Vehicles
The Czech and Slovak Private Collective FY95 2.5 – – 2.5 2.5
Equity Fund L.P. Investment Vehicles
Euromedic International Health Care FY02 14.8 – 16.5 – 16.5
European Renaissance Capital, L.P. Collective FY94 5.0 – – 3.8 3.8
Investment Vehicles
Hanseatic Capital, LLC Finance & Insurance FY03 8.6 – 8.6 – 8.6
MFI Facility – Central Asia Finance & Insurance FY03 45.0 – 45.0 – 45.0
New Europe–East Investment Fund Collective FY93 10.0 – – + +
Investment Vehicles
NIS Restructuring Facility, L.P. Collective FY00 10.0 – – 9.0 9.0
Investment Vehicles
The Romania & Moldova Direct Collective FY99 4.0 – – 2.0 2.0
Fund, LP Investment Vehicles
SEAF Central and Eastern Collective FY01 3.3 – – 3.2 3.2
Europe Growth Fund LLC Investment Vehicles
SEAF Central Asia Small Enterprise Collective FY03 2.5 – – 2.5 2.5
Fund LLC Investment Vehicles
SEAF Trans–Balkan Fund LLC Collective FY01 4.8 – – 4.8 4.8
Investment Vehicles
124.6 117.9 242.5
Total equity and loans 2,898.5 526.6 3,425.1
Total guarantees and risk management products 155.6
Total IFC portfolio for Europe & Central Asia 3,580.7
Original commitments1 Investments held for IFC(US$ millions) (US$ millions)
Fiscal Year in Totalwhich commitments syndi- Equity Total loans
Country, region or other area, and obligor Sector were made Total IFC cations Loans (at cost) and equity
EUROPE & CENTRAL ASIAat June 30, 2003
78

ArgentinaAceitera General Deheza S.A. Food & Beverages FY95, 02 55.0 30.0 30.0 – 30.0
Acindar Industria Argentina de Primary Metals FY60, 95, 97, 99 119.4 90.7 81.9 16.4 98.4
Aceros, S.A.
Aguas Argentinas S.A. Utilities FY95, 96 85.0 307.5 46.6 7.0 53.6
Aguas Provinciales de Santa Fé Utilities FY01 20.0 30.0 20.0 – 20.0
Alpargatas S.A.I.C. Textiles, Apparel & FY77, 84, 86, 88, 76.3 117.0 – + +
Leather 94, 97
American Plast, S.A. Plastics & Rubber FY99 10.0 – 5.0 – 5.0
Argentina Equity Investments I Ltd Collective FY94 4.0 – – 2.8 2.8
Investment Vehicles
Asociación Civil Universidad del Salvador Education Services FY01 10.0 – 10.0 – 10.0
Asociación Unión Tamberos Food & Beverages FY99 6.0 – 5.2 – 5.2
Cooperativa Limitada (AUCTL)
BACS (Banco de Credito y Finance & Insurance FY00 59.1 – 19.1 12.5 31.6
Securitizacion S.A.)
Banco Bansud S.A. Finance & Insurance FY97 4.9 – 1.1 – 1.1
Banco de Galicia y Buenos Finance & Insurance FY97, 99, 00 80.0 245.0 65.0 – 65.0
Aires, S.A.
Banco del Suquia S.A. Finance & Insurance FY98, 99 45.0 30.0 46.0 – 46.0
Banco General de Negocios S.A. Finance & Insurance FY94, 99 48.0 – 33.0 – 33.0
Banco Hipotecario S.A. Finance & Insurance FY00 25.0 102.5 25.0 – 25.0
CCBA S.A. Food & Beverages FY96 18.5 33.0 10.6 – 10.6
Cefas S.A. Oil, Gas and Mining FY00 15.0 – 15.0 – 15.0
Cervecería y Maltería Quilmes Food & Beverages FY94 15.0 15.0 4.0 – 4.0
S.A. (Quilmes)
Cerámica Zanón S.A.C.I. y M. Nonmetallic Mineral FY96 20.0 – 17.7 – 17.7
Product Manufacturing
Compañía Elaboradora de Food & Beverages FY95 15.0 6.0 9.7 – 9.7
Productos Alimenticios S.A.
Compañías Asociadas Petroleras S.A. Oil, Gas and Mining FY97 17.0 33.0 10.5 – 10.5
Concesiones y Construcciones Transportation and FY00 26.0 – 6.0 20.0 26.0
de Infraestructura S.A. Warehousing
Correo Argentino S.A. Transportation and FY99 75.0 54.0 57.4 6.8 64.2
Warehousing
Empresa Distribuidora Norte Utilities FY94, 95 45.0 128.0 18.4 – 18.4
Sociedad Anónima S.A.
FAPLAC, S.A. Industrial & FY00 15.0 – 15.0 – 15.0
Consumer Products
Fondo Agricola de Inversión Collective FY98 2.8 – – 1.2 1.2
Directa 2003 y Unifund S.A. Investment Vehicles
Frigorifico Regional Industrias Food & Beverages FY98 12.5 7.0 12.5 – 12.5
Alimenticias Reconquista (Friar) (S.A.)
Frigorífico Rioplatense S.A.I.C.I.F. Food & Beverages FY92 13.0 4.0 5.3 1.0 6.3
FV S.A. Industrial & FY99 16.0 – 10.8 – 10.8
Consumer Products
Grunbaum, Rico y Daucourt Textiles, Apparel & FY96 10.0 5.0 8.0 – 8.0
S.A.I.C. y F. Leather
Guipeba–Ceval S.A. Food & Beverages FY97 20.0 20.0 12.5 – 12.5
Hospital Privado Centro Médico Health Care FY99 9.6 – 9.1 – 9.1
De Córdoba S.A.
HSBC Bank Argentina S.A. Finance & Insurance FY95, 98 50.0 – 36.0 – 36.0
Juan Minetti S.A. Nonmetallic Mineral FY 78, 81, 86, 87, 101.8 197.5 30.4 + 30.4
Product Manufacturing 93, 94, 96, 99
Kleppe S.A. y El Caldero S.A. Agriculture & Forestry FY95, 98 12.0 – 10.2 – 10.2
Maltería Pampa S.A. Food & Beverages FY93, 96 19.0 12.0 3.5 – 3.5
Original commitments1 Investments held for IFC(US$ millions) (US$ millions)
Fiscal Year in Totalwhich commitments syndi- Equity Total loans
Country, region or other area, and obligor Sector were made Total IFC cations Loans (at cost) and equity
LATIN AMERICA & THE CARIBBEANat June 30, 2003
79

Merchant Bankers Asociados S.A. Finance & Insurance FY96 0.2 – – 0.2 0.2
Milkaut S.A. Food & Beverages FY92, 97 20.0 5.0 15.6 5.0 20.7
Molinos Río de la Plata S.A. Food & Beverages FY93, 94, 03 32.3 30.0 30.0 5.5 35.5
Nahuelsat S.A. Information FY95 35.0 – 8.8 – 8.8
Nuevo Banco de Santa Fe S.A. Finance & Insurance FY01 5.8 – 4.1 – 4.1
Nuevo Central Argentino S.A. Transportation and FY93 13.0 15.0 – 3.0 3.0
Warehousing
Patagonia Fund, L.P. Collective FY98 25.0 – – 15.0 15.0
Investment Vehicles
Patagonia Mint S.A. Food & Beverages FY98 6.0 5.0 3.1 – 3.1
Pecom Energia S.A. Chemicals FY97 20.0 30.0 3.6 – 3.6
Petrolera Argentina San Jorge S.A. Oil, Gas and Mining FY97, 99 73.4 35.0 – 58.4 58.4
S.A. San Miguel A.G.I.C.I. y F. Agriculture & Forestry FY99 12.0 – 8.3 – 8.3
Sancor Cooperativas Unidas Limitada Food & Beverages FY95 40.0 30.0 28.8 – 28.8
Sideco Americana S.A. Transportation and FY95 – – – 15.0 15.0
Warehousing
Socma Americana S.A. Transportation and FY95 40.0 60.0 6.3 – 6.3
Warehousing
T6 Industrial S.A. Food & Beverages FY98 15.0 30.0 11.7 – 11.7
Terminal 6, S.A. Transportation and FY87, 90, 91, 96, 98 33.0 19.5 8.6 – 8.6
Warehousing
Terminales Portuarias Argentinas S.A. Transportation and FY96 12.0 – 3.5 – 3.5
Warehousing
The Tower Fund, L.P. Collective FY95 25.0 – – 19.8 19.8
Investment Vehicles
Tower Investment Management Collective FY95 0.1 – – + +
Company Investment Vehicles
Transportadora De Gas Del Norte S.A. Transportation and FY97 45.0 210.0 38.2 – 38.2
Warehousing
Vicentin S.A.I.C. Food & Beverages FY97, 03 55.0 40.0 45.6 – 45.6
Yacylec S.A. Utilities FY94 20.0 45.0 3.0 5.0 8.0
909.5 194.7 1,104.3
BarbadosAlmond Resorts, Inc. Accommodation & FY95 7.1 – – 1.1 1.1
Tourism Services
1.1 1.1
BelizeNova Companies (Belize) Ltd. Agriculture & FY98 5.5 – 4.8 – 4.8
and Ambergris Aquaculture Ltd. Forestry
4.8 4.8
BoliviaAguas del Illimani S.A. Utilities FY00 7.1 – 5.4 1.0 6.4
Banco Bisa, S.A. Finance & Insurance FY76, 88, 91, 92, 28.7 5.5 3.0 3.2 6.2
95, 98
Banco Mercantil S.A. Finance & Insurance FY96 10.0 – 4.3 – 4.3
Caja Los Andes S.A. Finance & Insurance FY99, 01, 03 10.0 – 8.6 – 8.6
Central Aguirre Portuaria S.A. Transportation and FY92, 02 4.7 – 2.2 0.3 2.5
Warehousing
Compañia Boliviana de Gas Chemicals FY93 2.3 – 0.4 – 0.4
Natural Comprimido Genex S.A.
Compañía Minera del Sur, S.A. Oil, Gas and Mining FY90, 94, 96, 00 40.6 5.0 6.3 – 6.3
Electropaz S.A. Utilities FY00 25.0 – 22.4 – 22.4
Original commitments1 Investments held for IFC(US$ millions) (US$ millions)
Fiscal Year in Totalwhich commitments syndi- Equity Total loans
Country, region or other area, and obligor Sector were made Total IFC cations Loans (at cost) and equity
LATIN AMERICA & THE CARIBBEANat June 30, 2003
80

F.I.E. Fondo Financiero Privado Finance & Insurance FY03 2.5 – 2.5 – 2.5
Minera S.A. Oil, Gas and Mining FY92 – – – 3.4 3.4
Telefonica Celular de Bolivia Information FY97, 01 26.7 23.3 12.8 – 12.8
S.A. (“Telecel S.A.”)
Transportadora de Electricidad S.A. Utilities FY03 30.0 – 30.0 – 30.0
Trenes Continentales S.A. Transportation and FY92 – – – 2.9 2.9
Warehousing
97.8 10.8 108.6
BrazilAG Concession Utilities FY02 30.0 – 15.0 15.0 30.0
Algar Telecom S.A. Information FY97 43.2 – 16.5 18.2 34.7
Amaggi Exportacao e Impotacao Food & Beverages FY03 30.0 – 30.0 – 30.0
Limitada
Andrade Gutierrez SA Collective FY03 40.0 20.0 40.0 – 40.0
Investment Vehicles
Apolo Produtos de Aco SA Industrial & FY02 8.0 – 8.0 – 8.0
Consumer Products
Bahia Sul Celulose S.A. Pulp & Paper FY90, 91, 93 61.0 60.0 – 19.7 19.7
Banco Bradesco, S.A. Finance & Insurance FY97, 03 26.8 85.2 12.7 – 12.7
Banco Itaú, S.A. Finance & Insurance FY02, 03 119.1 150.0 90.0 – 90.0
Banco Itaú–BBA S.A. Finance & Insurance FY01, 02 40.0 60.0 34.3 – 34.3
Bompreco S.A. Supermercados do Wholesale and FY98 30.0 – 15.4 – 15.4
Nordeste Retail Trade
Bulk Services Corporation Transportation and FY98 14.0 7.5 7.4 – 7.4
Warehousing
Cambuhy/MC Food & Beverages FY95 30.0 – 1.9 – 1.9
Ceval Alimentos S.A. Food & Beverages FY93, 96 90.0 130.0 – 16.1 16.1
Chapeco Companhia Industrial Food & Beverages FY94, 96 43.9 5.3 27.8 – 27.8
de Alimentos
CIA Tecinos Norte de Minas – Textiles, Apparel & FY97, 98, 00 25.5 20.0 8.4 8.1 16.5
Coteminas Leather
Companhia Petroquímica do Sul S.A. Chemicals FY98 40.0 180.0 17.5 – 17.5
Companhia Suzano Papel e Pulp & Paper FY90 – – – 1.3 1.3
Celulose S.A.
Concessionária Da Rodovia Transportation and FY98 35.0 79.5 21.4 – 21.4
Presidente Dutra S.A. Warehousing
Concessionária do Sistema Transportation and FY00 29.2 25.9 27.6 – 27.6
Anhanguera Bandeirantes S.A. Warehousing
Construtora Norberto Odebrecht Construction and FY02 80.0 165.0 71.8 – 71.8
Real Estate
CPFL Energia Utilities FY03 40.0 – 40.0 – 40.0
CRP Caderi Capital de Risco S.A. Collective FY95 0.8 – – 0.5 0.5
Investment Vehicles
Dende do Pará S/A — DENPASA — Food & Beverages FY80, 94 5.3 – – 1.1 1.1
Agricultura, Indústria e Comércio de Olea
Distel Holding S.A. Information FY95, 96, 98, 02 67.2 118.0 11.7 – 11.7
Dixie Toga S.A. Plastics & Rubber FY98 15.0 – – 15.0 15.0
Duratex S.A. Industrial & FY88, 97 29.4 78.0 8.3 – 8.3
Consumer Products
Empesca S.A. Construçôes Food & Beverages FY98 15.0 – 15.0 – 15.0
Navais, Pesca e Exportaçao
Empresa de Desenvolvimento de Oil, Gas and Mining FY73, 78 9.3 54.0 – 4.3 4.3
Recursos Minerais (CODEMIN) S.A.
Escol@24Horas Education Services FY01, 02 3.5 – – 3.5 3.5
Fertilizantes Fosfatado S.A. Chemicals FY99 20.0 45.0 7.6 – 7.6
Original commitments1 Investments held for IFC(US$ millions) (US$ millions)
Fiscal Year in Totalwhich commitments syndi- Equity Total loans
Country, region or other area, and obligor Sector were made Total IFC cations Loans (at cost) and equity
LATIN AMERICA & THE CARIBBEANat June 30, 2003
81

Fras–le, S.A. Industrial & FY99 20.0 – 8.0 10.0 18.0
Consumer Products
Gavea Hotelaria e Turismo S.A. Accommodation & FY94 16.8 7.5 9.3 – 9.3
Tourism Services
Grupo Peixoto de Castro Industrial & FY02 9.0 – 9.0 – 9.0
Participacoes S.A. Consumer Products
Hering Textile S.A.** Textiles, Apparel & FY95 – – 7.5 – 7.5
Leather
Icatu Equity Partners, L.P. Collective FY98 30.0 – – 19.6 19.6
Investment Vehicles
Indústrias Arteb S.A. Industrial & FY98 27.0 20.0 20.0 7.0 27.0
Consumer Products
Innova S.A. Chemicals FY00 25.0 60.0 16.3 5.0 21.3
Ipiranga Petroquímica S.A. Chemicals FY80, 87, 98 61.3 178.0 24.0 6.3 30.3
Itaberaba Participaçôes S.A. Health Care FY00 5.3 – – 5.3 5.3
Joaquim Oliveira S.A. Participaçôes Agriculture & Forestry FY01 15.0 – 14.6 – 14.6
Klabin Bacel S.A. Pulp & Paper FY94 24.7 36.0 3.8 15.7 19.5
Labratório de Análises e Pesquises Health Care FY00 15.0 – 14.4 – 14.4
Clínicas Gastao Fleury S/C Limitada
Lojas Americanas S.A. Wholesale and FY96 33.0 20.0 13.0 – 13.0
Retail Trade
Macae Utilities FY03 75.0 – 75.0 – 75.0
Macedo Alimentos Nordeste S.A. Food & Beverages FY92 – – 6.6 – 6.6
Maximilano Gaidzinski S.A.– Nonmetallic Mineral FY00 45.0 – 40.7 – 40.7
Industria de Azulejos Eliane Product Manufacturing
Microinvest S.A. Sociedade de Finance & Insurance FY03 1.3 – – 1.3 1.3
Credito Ao Microempreendedor
Mineraçôes Brasileiras Reunidas S.A. Oil, Gas and Mining FY88, 93, 01 75.0 27.0 30.0 – 30.0
Net Servicos de Comunicacao S.A Information FY02 5.0 – – 36.7 36.7
New GP Capital Partners B L.P. Collective FY92 – – – 9.7 9.7
Investment Vehicles
Oxiteno Nordeste S.A. Indústria Chemicals FY75, 96 44.6 – 2.5 5.0 7.5
e Comércio
Pará Pigmentos S.A. Oil, Gas and Mining FY95 39.0 33.5 15.1 9.0 24.1
Perdigâo S.A. and Perdigâo Food & Beverages FY88, 96 57.9 20.0 10.9 10.0 20.9
Agroindustrial S.A.
Petroflex Indústria e Comércio S.A.** Plastics & Rubber FY96 – – 7.5 – 7.5
Politeno Indústria é Comércio S.A. Chemicals FY89, 96 42.6 – 1.5 – 1.5
Portobello S.A. Nonmetallic Mineral FY95, 00, 02 39.1 – 18.5 6.1 24.6
Product Manufacturing
Puras do Brasil S.A. Accommodation & FY00 5.0 – 3.8 – 3.8
Tourism Services
Queiroz Galvao Perfuracoes S.A. Oil, Gas and Mining FY03 40.0 – 40.0 – 40.0
Randon S.A. Implementose e Industrial & FY99 10.0 – 8.1 – 8.1
Sistemas Automotivos Consumer Products
Ripasa S.A. Pulp & Paper FY91 25.0 – – 5.0 5.0
Sadia Concórdia S.A. Indústria Food & Beverages FY94, 95, 97 80.0 222.0 22.0 10.0 32.0
e Comércio
Samarco Mineraçâo S.A. Oil, Gas and Mining FY97 18.0 16.0 9.0 – 9.0
Saraiva S.A. Livreiros Editores Wholesale and FY98 18.0 – 6.9 3.0 9.9
Retail Trade
Satipel Industrial S.A. Industrial & FY03 25.0 – 25.0 – 25.0
Consumer Products
Seara Alimentos S.A. Agriculture & Forestry FY93 – – – 3.9 3.9
Sepetiba Terminal de Transportation and FY02 32.0 8.0 32.0 – 32.0
Containêres S.A. Warehousing
Original commitments1 Investments held for IFC(US$ millions) (US$ millions)
Fiscal Year in Totalwhich commitments syndi- Equity Total loans
Country, region or other area, and obligor Sector were made Total IFC cations Loans (at cost) and equity
LATIN AMERICA & THE CARIBBEANat June 30, 2003
82

Sucorrico S.A. Food & Beverages FY97 15.0 – 3.0 – 3.0
Sudamérica en Fiesta, S.A. Accommodation & FY00 15.0 – – 15.0 15.0
Tourism Services
Synteko Produtos Quimicos S.A. Industrial & FY02 18.0 – 18.0 – 18.0
Consumer Products
Sâo Paulo Alpargatas S.A. Textiles, Apparel & FY87, 97, 03 90.0 – 46.7 – 46.7
Leather
Tecon Rio Grande S.A. Transportation and FY99 12.1 16.0 11.3 – 11.3
Warehousing
Tecon Salvador S.A. Transportation and FY01, 03 5.1 5.0 3.5 1.6 5.1
Warehousing
Trikem S.A. Chemicals FY92, 93 12.9 – – + +
Tubos e Conexoes Tigre Ltda. Plastics & Rubber FY97 30.0 23.5 12.7 – 12.7
Unibanco — Uniao de Bancos Finance & Insurance FY88, 96, 02, 03 144.8 250.0 120.0 – 120.0
Brasileiros S.A.
UP Offshore (Bahamas) Limited Transportation and FY03 21.6 30.0 11.6 10.0 21.6
Warehousing
Usina Hidrelétrica Guilman– Amorim Utilities FY92, 98 30.0 91.0 24.3 – 24.3
Vulcabras do Nordeste S.A. Textiles, Apparel & FY99 20.0 – 11.7 – 11.7
Leather
Weist S.A. Industrial & FY99 8.0 – 8.0 – 8.0
Consumer Products
1,293.9 298.1 1,591.9
ChileCB Transporte e Infraestructura S.A. Transportation and FY99 2.0 – 0.8 – 0.8
Warehousing
Ferrocarril del Pacífico S.A. Transportation and FY97 20.5 6.0 12.3 5.6 17.9
Warehousing
Hidroeléctrica Aconcagua S.A. Utilities FY92, 93 14.4 6.0 – 6.5 6.5
HQI Transelec Chile S.A. Utilities FY03 60.0 – 60.0 – 60.0
Lan Chile Transportation and FY03 30.0 – 30.0 – 30.0
Warehousing
Minera Escondida Limitada Oil, Gas and Mining FY89, 93, 99 87.6 – 16.7 7.5 24.1
Moneda Asset Management S.A. Collective FY94, 96, 97 0.5 – – 0.5 0.5
Investment Vehicles
Pionero Fondo de Inversión Mobiliaria Collective FY94 10.0 – – 9.3 9.3
Investment Vehicles
Proa Fondo de Inversión de Collective FY96 8.3 – – 6.6 6.6
Desarrollo de Empresas Investment Vehicles
San Antonio Terminal Internacional S.A. Transportation and FY01 38.7 65.0 35.0 3.7 38.7
Warehousing
Transportes Ferroviarios S.A. Transportation and FY92 – – – 4.4 4.4
Warehousing
154.8 44.1 198.9
ColombiaBanco Caja Social Finance & Insurance FY02 7.0 – – 7.0 7.0
Bavaria Food & Beverages FY02 100.0 145.0 100.0 – 100.0
Cales y Cementos de Toluviejo, S.A. Nonmetallic Mineral FY01 3.3 7.1 3.3 – 3.3
Product Manufacturing
Cementos del Caribe, S.A. Nonmetallic Mineral FY75, 01 17.6 13.0 4.0 10.0 14.0
Product Manufacturing
Original commitments1 Investments held for IFC(US$ millions) (US$ millions)
Fiscal Year in Totalwhich commitments syndi- Equity Total loans
Country, region or other area, and obligor Sector were made Total IFC cations Loans (at cost) and equity
LATIN AMERICA & THE CARIBBEANat June 30, 2003
83

Colombian Home Mortgage Finance & Insurance FY02 13.0 – 2.3 10.6 13.0
Corp. (CHMC)
Compania Suramericana de Finance & Insurance FY99 5.1 – – 5.1 5.1
Arrendamiento Operativo S.A.
Compañía Colombiana de Tejidos Textiles, Apparel & FY63, 68, 69, 91 22.9 1.7 6.0 – 6.0
Leather
Corporación Financiera del Valle S.A. Finance & Insurance FY69, 85, 93, 95 51.1 60.0 – 7.4 7.4
Corporación Financiera Nacional y Finance & Insurance FY96, 00 88.8 – 38.1 25.0 63.1
Suramericana S.A.
Inversura S. A. Finance & Insurance FY02 15.0 – – 15.0 15.0
Omimex de Colombia, Ltd. Oil, Gas and Mining FY03 35.0 – 35.0 – 35.0
Productora de Derivados de la Sal, S.A. Chemicals FY87 7.2 – – 0.6 0.6
(PRODESAL)
Promigas S.A. E.S.P. Transportation and FY77, 89, 93, 94, 97 38.3 69.5 3.8 1.1 4.9
Warehousing
Promotora de Inversiones de Finance & Insurance FY92, 94, 95 6.4 – – 0.2 0.2
Santander, S.A.
Protección S. A. Finance & Insurance FY02 10.0 – – 10.0 10.0
Proyectos de Infraestructura S.A. Transportation and FY97 9.5 – – 5.0 5.0
Warehousing
Suramericana de Inversiones S.A. Finance & Insurance FY02 75.0 – 75.2 – 75.2
267.7 97.1 364.8
Costa RicaAlterra Partners Costa Rica S.A. Transportation and FY01 35.0 85.0 35.0 – 35.0
Warehousing
Banco Cuscatlan de Costa Rica Finance & Insurance FY03 5.0 – 5.0 – 5.0
Banco Interfin S.A. Finance & Insurance FY93, 01 20.0 – 13.8 – 13.8
Consorcio Hospitalario Internacional, S.A. Health Care FY99 1.2 – – 1.2 1.2
Corporación Supermercados Wholesale and FY99 40.0 – 24.7 10.0 34.7
Unidos S.A. Retail Trade
Hidroeléctrica Aguas Zarcas Utilities FY94 4.0 6.1 1.4 – 1.4
S.A. (Hidrozarcas)
Productos Gutis S.A. Health Care FY03 7.0 – 7.0 – 7.0
86.8 11.2 98.0
Dominican RepublicBanco BHD, S.A. Finance & Insurance FY03 20.0 – 20.0 – 20.0
Caucedo Investments Inc. Transportation and FY02 30.0 – 30.0 – 30.0
Warehousing
France Telecom Dominicana Information FY02 50.0 50.0 50.0 – 50.0
Inversora Internacional Accommodation & FY99 14.0 21.7 11.6 – 11.6
Hotelera, S.A. Tourism Services
Pasteurizadora Rica C. por A. Food & Beverages FY00 15.0 – 14.0 – 14.0
Red Sanitaria Hospiten Health Care FY00, 03 14.0 10.0 13.9 – 13.9
Smith/Enron Cogeneration Utilities FY95, 96 32.3 50.0 17.6 – 17.6
Limited Partnership
157.1 157.1
EcuadorAgrocapital, S.A. Agriculture & Forestry FY97 3.5 – 3.5 – 3.5
Compañia Financiera Ecuadoriana Finance & Insurance FY69, 73, 75, 77, 3.0 – – + +
de Desarollo, S.A. 81, 82, 88
Original commitments1 Investments held for IFC(US$ millions) (US$ millions)
Fiscal Year in Totalwhich commitments syndi- Equity Total loans
Country, region or other area, and obligor Sector were made Total IFC cations Loans (at cost) and equity
LATIN AMERICA & THE CARIBBEANat June 30, 2003
84

Concessionaria DHM, S.A. Transportation and FY99 12.8 15.0 11.5 1.0 12.5
Warehousing
Ecuacobre–FV S.A. Nonmetallic Mineral FY00 9.0 – 7.8 – 7.8
Product Manufacturing
Favorita Fruit Company, Ltd. Agriculture & Forestry FY99, 03 30.0 – 22.2 5.0 27.2
La Universal S.A. Agriculture & Forestry FY99 13.2 3.0 8.25.0 13.2
Rey Banano del Pacífico C.A. Agriculture & Forestry FY94 10.0 5.0 2.0 – 2.0
(Reybanpac)
55.2 11.0 66.1
El SalvadorAFP Crecer, S.A. Finance & Insurance FY99 – – – 1.2 1.2
Banco Cuscatlan, S.A. Finance & Insurance FY99, 03 40.0 – 31.4 – 31.4
Baterias de El Salvador, S.A. Industrial & FY99 2.0 – 1.4 – 1.4
Consumer Products
CAESS/EEO Distribution Companies Utilities FY02 45.0 75.0 44.2 – 44.2
Cemento de El Salvador, S.A. Nonmetallic Mineral FY97, 00 19.6 20.6 9.7 2.2 11.9
Product Manufacturing
Financiera Calpia S.A. Finance & Insurance FY03 2.0 – – 2.0 2.0
Implementos Agrícolas Industrial & FY98, 99 2.2 – – 0.2 0.2
Centroamericanos, S.A. Consumer Products
86.8 5.6 92.4
GrenadaBel Air Plantation Limited Accommodation & FY02 2.0 – 2.0 – 2.0
Tourism Services
2.0 2.0
GuatemalaBanco Cuscatlan de Guatemala Finance & Insurance FY03 10.0 – 10.0 – 10.0
Banco de Occidente. S.A. Finance & Insurance FY03 10.0 – 10.0 – 10.0
Fabrigas S.A. Utilities FY95 7.0 – 1.8 – 1.8
Frutera del Pacifico, S.A. Agriculture & Forestry FY00 7.0 – 5.6 – 5.6
Generadora de Occidente Ltda. Utilities FY03 15.0 12.0 15.0 – 15.0
Interforest S.A. Industrial & FY03 6.0 – 6.0 – 6.0
Consumer Products
La Fragua Wholesale and FY99 20.0 – 15.8 – 15.8
Retail Trade
Orzunil I de Electricada Limitada Utilities FY92, 98, 00 14.3 15.0 10.9 1.2 12.1
Pantaleón S.A. Food & Beverages FY97 20.0 – 6.3 – 6.3
Vidriera Guatemalteca, S.A. Nonmetallic Mineral FY93 11.0 – 0.7 – 0.7
Product Manufacturing
82.0 1.2 83.1
GuyanaGuyana Americas Merchant Bank Finance & Insurance FY00 1.0 – – 1.0 1.0
Heritage Limited (Cara Lodge) Accommodation & FY00 0.7 – 0.7 – 0.7
Tourism Services
IDS Holdings Limited Plastics & Rubber FY99 1.2 – 1.3 – 1.3
1.9 1.0 2.9
HaitiMicro Crédit National S.A. Finance & Insurance FY00 0.4 – – 0.4 0.4
0.4 0.4
Original commitments1 Investments held for IFC(US$ millions) (US$ millions)
Fiscal Year in Totalwhich commitments syndi- Equity Total loans
Country, region or other area, and obligor Sector were made Total IFC cations Loans (at cost) and equity
LATIN AMERICA & THE CARIBBEANat June 30, 2003
85
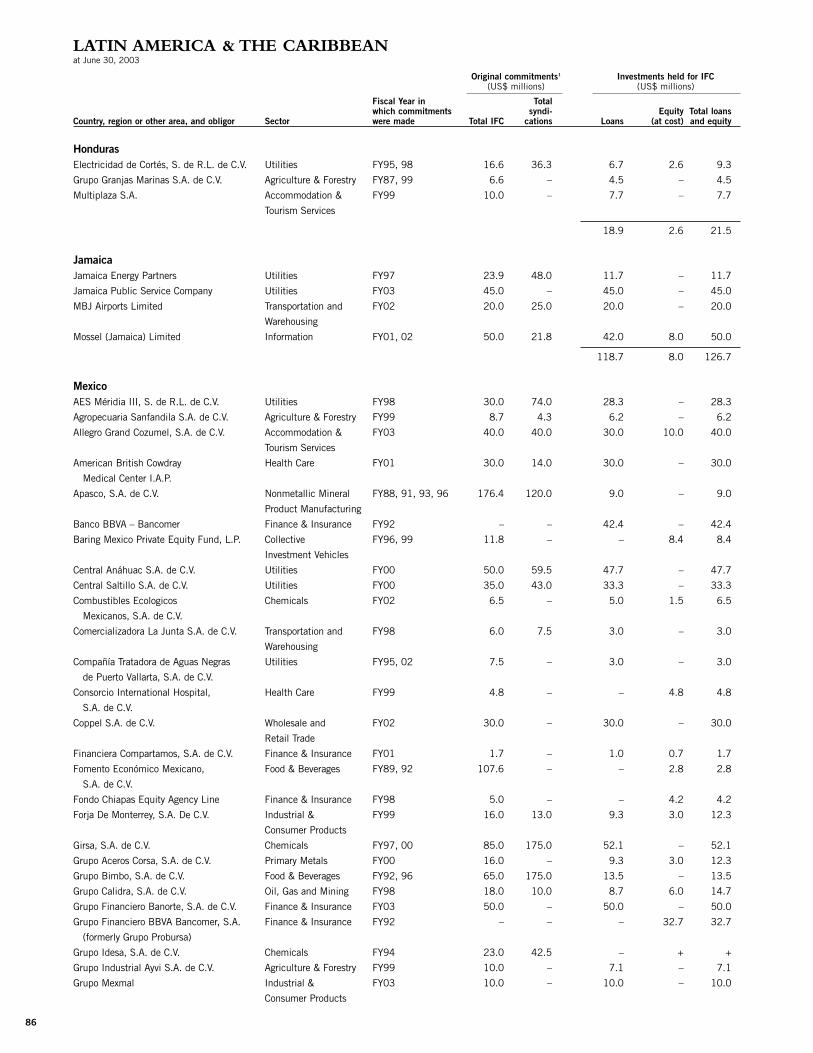
HondurasElectricidad de Cortés, S. de R.L. de C.V. Utilities FY95, 98 16.6 36.3 6.7 2.6 9.3
Grupo Granjas Marinas S.A. de C.V. Agriculture & Forestry FY87, 99 6.6 – 4.5 – 4.5
Multiplaza S.A. Accommodation & FY99 10.0 – 7.7 – 7.7
Tourism Services
18.9 2.6 21.5
JamaicaJamaica Energy Partners Utilities FY97 23.9 48.0 11.7 – 11.7
Jamaica Public Service Company Utilities FY03 45.0 – 45.0 – 45.0
MBJ Airports Limited Transportation and FY02 20.0 25.0 20.0 – 20.0
Warehousing
Mossel (Jamaica) Limited Information FY01, 02 50.0 21.8 42.0 8.0 50.0
118.7 8.0 126.7
MexicoAES Méridia III, S. de R.L. de C.V. Utilities FY98 30.0 74.0 28.3 – 28.3
Agropecuaria Sanfandila S.A. de C.V. Agriculture & Forestry FY99 8.7 4.3 6.2 – 6.2
Allegro Grand Cozumel, S.A. de C.V. Accommodation & FY03 40.0 40.0 30.0 10.0 40.0
Tourism Services
American British Cowdray Health Care FY01 30.0 14.0 30.0 – 30.0
Medical Center I.A.P.
Apasco, S.A. de C.V. Nonmetallic Mineral FY88, 91, 93, 96 176.4 120.0 9.0 – 9.0
Product Manufacturing
Banco BBVA – Bancomer Finance & Insurance FY92 – – 42.4 – 42.4
Baring Mexico Private Equity Fund, L.P. Collective FY96, 99 11.8 – – 8.4 8.4
Investment Vehicles
Central Anáhuac S.A. de C.V. Utilities FY00 50.0 59.5 47.7 – 47.7
Central Saltillo S.A. de C.V. Utilities FY00 35.0 43.0 33.3 – 33.3
Combustibles Ecologicos Chemicals FY02 6.5 – 5.0 1.5 6.5
Mexicanos, S.A. de C.V.
Comercializadora La Junta S.A. de C.V. Transportation and FY98 6.0 7.5 3.0 – 3.0
Warehousing
Compañía Tratadora de Aguas Negras Utilities FY95, 02 7.5 – 3.0 – 3.0
de Puerto Vallarta, S.A. de C.V.
Consorcio International Hospital, Health Care FY99 4.8 – – 4.8 4.8
S.A. de C.V.
Coppel S.A. de C.V. Wholesale and FY02 30.0 – 30.0 – 30.0
Retail Trade
Financiera Compartamos, S.A. de C.V. Finance & Insurance FY01 1.7 – 1.0 0.7 1.7
Fomento Económico Mexicano, Food & Beverages FY89, 92 107.6 – – 2.8 2.8
S.A. de C.V.
Fondo Chiapas Equity Agency Line Finance & Insurance FY98 5.0 – – 4.2 4.2
Forja De Monterrey, S.A. De C.V. Industrial & FY99 16.0 13.0 9.3 3.0 12.3
Consumer Products
Girsa, S.A. de C.V. Chemicals FY97, 00 85.0 175.0 52.1 – 52.1
Grupo Aceros Corsa, S.A. de C.V. Primary Metals FY00 16.0 – 9.3 3.0 12.3
Grupo Bimbo, S.A. de C.V. Food & Beverages FY92, 96 65.0 175.0 13.5 – 13.5
Grupo Calidra, S.A. de C.V. Oil, Gas and Mining FY98 18.0 10.0 8.7 6.0 14.7
Grupo Financiero Banorte, S.A. de C.V. Finance & Insurance FY03 50.0 – 50.0 – 50.0
Grupo Financiero BBVA Bancomer, S.A. Finance & Insurance FY92 – – – 32.7 32.7
(formerly Grupo Probursa)
Grupo Idesa, S.A. de C.V. Chemicals FY94 23.0 42.5 – + +
Grupo Industrial Ayvi S.A. de C.V. Agriculture & Forestry FY99 10.0 – 7.1 – 7.1
Grupo Mexmal Industrial & FY03 10.0 – 10.0 – 10.0
Consumer Products
Original commitments1 Investments held for IFC(US$ millions) (US$ millions)
Fiscal Year in Totalwhich commitments syndi- Equity Total loans
Country, region or other area, and obligor Sector were made Total IFC cations Loans (at cost) and equity
LATIN AMERICA & THE CARIBBEANat June 30, 2003
86

Grupo Minsa, S.A. de C.V. Food & Beverages FY97 30.0 30.0 12.5 – 12.5
Grupo Posadas, S.A. de C.V. Accommodation & FY92, 93, 95, 96, 00 83.7 68.5 46.2 5.0 51.2
Tourism Services
Hipotecaria Su Casita, S.A. de Finance & Insurance FY01 12.6 – 1.9 10.6 12.5
C.V. – SOFOL
Industrias Innopack S.A. de C.V. Plastics & Rubber FY01 15.0 – – 15.0 15.0
Invercap S.A. de C.V. Finance & Insurance FY00, 01 1.1 – – 1.1 1.1
Medicus, S.A. de C.V. Health Care FY99 7.0 – 6.8 – 6.8
Mexico City – Toluca Toll Road Transportation and FY92 13.8 – 1.8 – 1.8
Warehousing
Mexplus Puertos S.A. de C.V. Transportation and FY93, 95, 99 4.5 – – 4.5 4.5
Warehousing
Pan American Silver Oil, Gas and Mining FY00 9.0 – – 9.0 9.0
Corporation
Plata Panamericana, S.A. de C.V. Oil, Gas and Mining FY02 10.0 – 10.0 – 10.0
Polomex S.A. de C.V. Industrial & FY03 8.0 – 8.0 – 8.0
Consumer Products
Promotora de Centros Education Services FY01 6.5 – 6.5 – 6.5
Educativos S.A. de C.V.
Propalma Fondo Chiapas Equity Agency Food & Beverages FY98 0.2 – – 1.0 1.0
Puertas Finas de Madera Montealban, Industrial & FY02 13.0 – 13.0 – 13.0
S.A. de C.V. Consumer Products
Qualita Information FY02 6.0 – 3.5 2.5 6.0
Servicios S.A. de C.V. Transportation and FY01 12.4 10.0 9.8 1.9 11.7
Warehousing
Tenedora Nemak S.A. de C.V. Industrial & FY96, 99, 00, 01 33.0 35.0 9.0 – 9.0
Consumer Products
Terminal Maritima de Altamira Transportation and FY97 5.1 10.4 4.7 – 4.7
S.A. de C.V. Warehousing
Turborreactores S.A. de C.V. Industrial & FY00 14.0 4.0 12.0 – 12.0
Consumer Products
ZN Mexico Capital Growth Fund Ltd. Collective FY99 15.3 – – 15.3 15.3
Investment Vehicles
ZN Mexico Capital Management, LLC Collective FY92 10.0 – – 10.0 10.0
Investment Vehicles
574.4 152.9 727.3
NicaraguaCasa Mantica S.A. and Wholesale and FY99 4.5 – 3.9 – 3.9
Inmuebles Diano Marina, S.A. Retail Trade
Distribuidora Cesar Guerrero S.A. Wholesale and FY99 1.0 – 0.6 – 0.6
Retail Trade
Financiera Arrendadora Finance & Insurance FY00 2.0 – 1.0 – 1.0
Centroamericana, S.A.
Frutales del San Juan, S.A. Agriculture & Forestry FY99 2.0 – 0.4 0.4 0.8
5.9 0.4 6.3
PanamaAguas de Panama S.A. Utilities FY03 6.0 10.0 6.0 – 6.0
Banco Del Istmo, S.A. Finance & Insurance FY00 20.0 38.0 16.5 – 16.5
Banco General S.A. Finance & Insurance FY98, 00 40.0 – 37.3 – 37.3
Banco Latinoamericano de Finance & Insurance FY79, 85, 86, 88, 03 174.8 – 125.0 – 125.0
Exportaciones, S.A.
ICA Panama, S.A. Transportation and FY00 35.0 35.0 35.0 – 35.0
Warehousing
Original commitments1 Investments held for IFC(US$ millions) (US$ millions)
Fiscal Year in Totalwhich commitments syndi- Equity Total loans
Country, region or other area, and obligor Sector were made Total IFC cations Loans (at cost) and equity
LATIN AMERICA & THE CARIBBEANat June 30, 2003
87
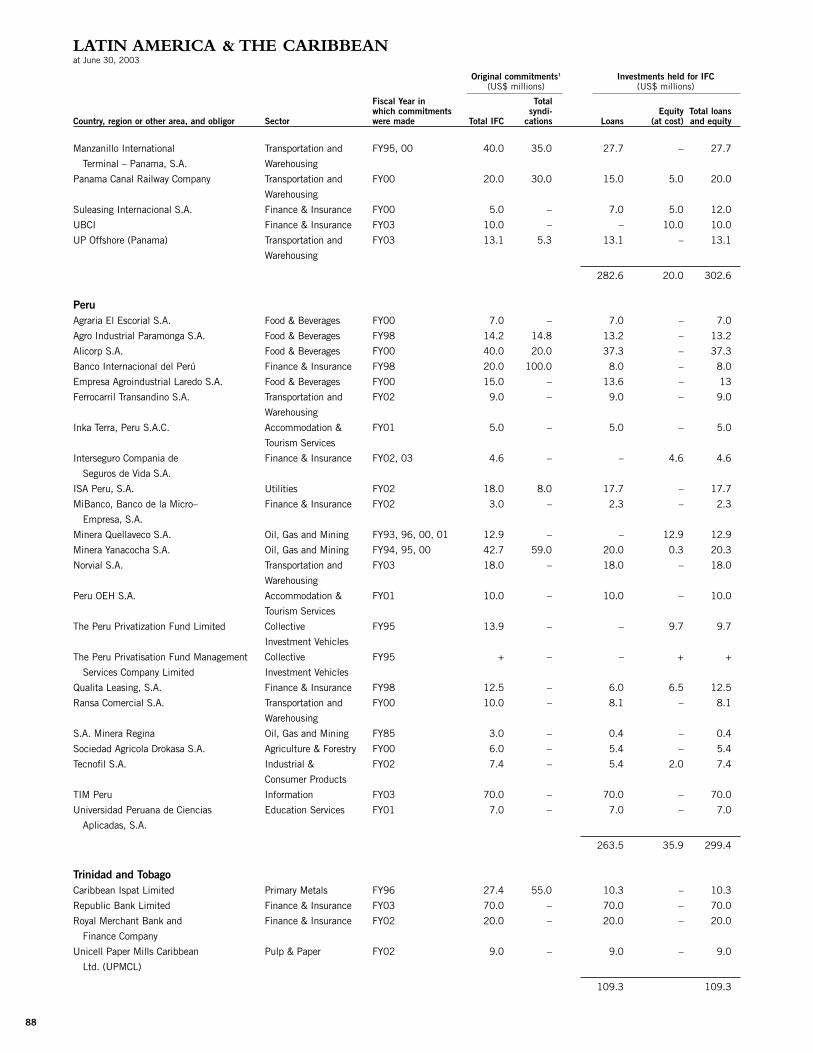
Manzanillo International Transportation and FY95, 00 40.0 35.0 27.7 – 27.7
Terminal – Panama, S.A. Warehousing
Panama Canal Railway Company Transportation and FY00 20.0 30.0 15.0 5.0 20.0
Warehousing
Suleasing Internacional S.A. Finance & Insurance FY00 5.0 – 7.0 5.0 12.0
UBCI Finance & Insurance FY03 10.0 – – 10.0 10.0
UP Offshore (Panama) Transportation and FY03 13.1 5.3 13.1 – 13.1
Warehousing
282.6 20.0 302.6
PeruAgraria El Escorial S.A. Food & Beverages FY00 7.0 – 7.0 – 7.0
Agro Industrial Paramonga S.A. Food & Beverages FY98 14.2 14.8 13.2 – 13.2
Alicorp S.A. Food & Beverages FY00 40.0 20.0 37.3 – 37.3
Banco Internacional del Perú Finance & Insurance FY98 20.0 100.0 8.0 – 8.0
Empresa Agroindustrial Laredo S.A. Food & Beverages FY00 15.0 – 13.6 – 13
Ferrocarril Transandino S.A. Transportation and FY02 9.0 – 9.0 – 9.0
Warehousing
Inka Terra, Peru S.A.C. Accommodation & FY01 5.0 – 5.0 – 5.0
Tourism Services
Interseguro Compania de Finance & Insurance FY02, 03 4.6 – – 4.6 4.6
Seguros de Vida S.A.
ISA Peru, S.A. Utilities FY02 18.0 8.0 17.7 – 17.7
MiBanco, Banco de la Micro– Finance & Insurance FY02 3.0 – 2.3 – 2.3
Empresa, S.A.
Minera Quellaveco S.A. Oil, Gas and Mining FY93, 96, 00, 01 12.9 – – 12.9 12.9
Minera Yanacocha S.A. Oil, Gas and Mining FY94, 95, 00 42.7 59.0 20.0 0.3 20.3
Norvial S.A. Transportation and FY03 18.0 – 18.0 – 18.0
Warehousing
Peru OEH S.A. Accommodation & FY01 10.0 – 10.0 – 10.0
Tourism Services
The Peru Privatization Fund Limited Collective FY95 13.9 – – 9.7 9.7
Investment Vehicles
The Peru Privatisation Fund Management Collective FY95 + – – + +
Services Company Limited Investment Vehicles
Qualita Leasing, S.A. Finance & Insurance FY98 12.5 – 6.0 6.5 12.5
Ransa Comercial S.A. Transportation and FY00 10.0 – 8.1 – 8.1
Warehousing
S.A. Minera Regina Oil, Gas and Mining FY85 3.0 – 0.4 – 0.4
Sociedad Agricola Drokasa S.A. Agriculture & Forestry FY00 6.0 – 5.4 – 5.4
Tecnofil S.A. Industrial & FY02 7.4 – 5.4 2.0 7.4
Consumer Products
TIM Peru Information FY03 70.0 – 70.0 – 70.0
Universidad Peruana de Ciencias Education Services FY01 7.0 – 7.0 – 7.0
Aplicadas, S.A.
263.5 35.9 299.4
Trinidad and TobagoCaribbean Ispat Limited Primary Metals FY96 27.4 55.0 10.3 – 10.3
Republic Bank Limited Finance & Insurance FY03 70.0 – 70.0 – 70.0
Royal Merchant Bank and Finance & Insurance FY02 20.0 – 20.0 – 20.0
Finance Company
Unicell Paper Mills Caribbean Pulp & Paper FY02 9.0 – 9.0 – 9.0
Ltd. (UPMCL)
109.3 109.3
Original commitments1 Investments held for IFC(US$ millions) (US$ millions)
Fiscal Year in Totalwhich commitments syndi- Equity Total loans
Country, region or other area, and obligor Sector were made Total IFC cations Loans (at cost) and equity
LATIN AMERICA & THE CARIBBEANat June 30, 2003
88

UruguayAzucitrus S.A. Food & Beverages FY85, 93 13.9 – 0.5 3.4 3.9
Banco Montevideo S.A. Finance & Insurance FY02 18.0 – 9.0 9.0 18.0
Consorcio Aeropuertos Transportation and FY96 8.0 10.0 5.6 – 5.6
Internacionales S.A. Warehousing
Cooperativa Nacional de Food & Beverages FY03 30.0 – 30.0 – 30.0
Productores de Leche
Granja Avicola Moro Food & Beverages FY92 3.8 – 1.8 0.8 2.5
Surinvest International Limited Finance & Insurance FY80, 87, 89, 97, 02 18.9 10.0 4.9 1.8 6.7
Universidad de Montevideo Education Services FY01 5.0 – 5.0 – 5.0
56.8 15.0 71.8
Venezuela, República Bolivariana deCompañia Anónima Nacional Information FY96 43.4 131.6 25.0 – 25.0
Teléfonos de Venezuela
Complejo Siderúrgico de Primary Metals FY97, 98 45.0 121.0 21.0 10.0 31.0
Guayana, C.A.
Corporacion de Cemento Andino, C.A. Nonmetallic Mineral FY01 7.6 21.3 7.6 – 7.6
Product Manufacturing
Corporación Industrial Chemicals FY91, 92 21.1 – – + +
Montana, C.A., S.A.
Electricidad de Caracas S.A.C.A. Utilities FY00, 01 70.0 35.0 53.5 – 53.5
Forestal Trillium de Industrial & FY00 22.8 10.0 16.8 6.0 22.8
Venezuela, C.A. Consumer Products
Global Material Services Venezuela C.A./ Transportation and FY02 3.2 – 2.5 – 2.5
ACBL Riverside Terminals C.A. Warehousing
Grupo Zuliano, S.A. C.A. Chemicals FY94 14.1 – – 14.1 14.1
Intersea Farms de Venezuela, C.A. Agriculture & Forestry FY02 8.0 – 5.0 3.0 8.0
Metanol de Oriente, Metor, S.A. Chemicals FY93 37.9 93.3 6.6 6.8 13.4
Minera Loma de Niquel, C.A. Oil, Gas and Mining FY98, 00 75.2 50.0 56.3 4.4 60.8
Productora de Alcoholes Chemicals FY91 39.4 2.0 7.5 – 7.5
Hidratados, C.A.
Propileno De Falcon Profalca, C.A. Chemicals FY00 24.0 23.0 20.3 – 20.3
Telecomunicaciones Movilnet, C.A. Information FY98 35.0 60.0 19.7 – 19.7
241.7 44.3 286.0
Regional InvestmentsAdvent Latin American Private Collective FY02 15.0 – – 15.0 15.0
Equity Fund II, L.P. Investment Vehicles
Bank of Nova Scotia Finance & Insurance FY01 25.0 25.0 25.0 – 25.0
Central America Growth Fund Collective FY03 8.3 – – 8.3 8.3
Investment Vehicles
Certifica.com Information FY01 1.5 – – 1.5 1.5
Convergence Communications, Inc. Information FY00, 01, 02 7.9 – – 7.9 7.9
Darby–BBVA Latin America Collective FY03 10.0 – – 10.0 10.0
Pivate Equity Fund Investment Vehicles
Eastern Caribbean Home Finance & Insurance FY97 0.4 – – 0.4 0.4
Mortgage Bank
HSBC Private Equity (South Collective FY01 – – – 0.3 0.3
America) Ltd. Investment Vehicles
HSBC Tower Equity Partners, L.P. Collective FY01 20.0 – – 19.7 19.7
Investment Vehicles
LAAD Finance & Insurance FY02 20.0 – 20.0 – 20.0
The Latin America Enterprise Fund, L.P. Collective FY95 20.0 – – 17.7 17.7
Investment Vehicles
Original commitments1 Investments held for IFC(US$ millions) (US$ millions)
Fiscal Year in Totalwhich commitments syndi- Equity Total loans
Country, region or other area, and obligor Sector were made Total IFC cations Loans (at cost) and equity
LATIN AMERICA & THE CARIBBEANat June 30, 2003
89

The Latin America Enterprise Collective FY98 23.1 – – 13.1 13.1
Fund II, L.P. Investment Vehicles
Marcopolo S.A. Industrial & FY03 30.0 – 30.0 – 30.0
Consumer Products
Medical Systems Finance Finance & Insurance FY98, 01 17.0 39.6 15.0 – 15.0
Holding Limited
PriceSmart, Inc. Wholesale and FY01, 02 42.0 – 30.6 10.0 40.6
Retail Trade
Profund Internacional, S.A. Collective FY96 3.0 – – 2.6 2.6
Investment Vehicles
Salutia Health Care FY02 2.7 – – 2.7 2.7
Scudder Latin American Power Collective FY92, 93 25.0 – – 21.0 21.0
Fund I Investment Vehicles
Scudder Latin American Power Collective FY92, 98 7.0 – – 4.9 4.9
Fund II Investment Vehicles
TCW/Latin America Partners LLC Collective FY00 70.0 – – 20.0 20.0
Investment Vehicles
Terra Capital Investors Limited Collective FY99 5.0 – – 5.0 5.0
Investment Vehicles
Trans Union Central America Finance & Insurance FY03 0.4 – – 0.4 0.4
UABL Bahamas Ltd. Transportation and FY03 25.0 10.0 20.0 5.0 25.0
Warehousing
140.6 165.5 306.1
Total equity and loans 5,012.6 1,120.9 6,133.4
Total guarantees and risk management products 79.5
Total IFC portfolio for Latin America & the Caribbean 6,212.9
Original commitments1 Investments held for IFC(US$ millions) (US$ millions)
Fiscal Year in Totalwhich commitments syndi- Equity Total loans
Country, region or other area, and obligor Sector were made Total IFC cations Loans (at cost) and equity
LATIN AMERICA & THE CARIBBEANat June 30, 2003
90

AlgeriaAlgerian Cement Company Nonmetallic Mineral FY03 35.0 – 35.0 – 35.0
Product Manufacturing
Algiers Investment Partnership Finance & Insurance FY00 0.3 – – 0.3 0.3
Arab Banking Corporation Algeria Finance & Insurance FY98 1.9 – – 1.9 1.9
Arab Leasing Corporation Finance & Insurance FY02 0.7 – – 0.7 0.7
Sider–Alfasid Primary Metals FY03 25.0 – 25.0 – 25.0
Société Générale d’Algérie Finance & Insurance FY99 0.7 – – 0.7 0.7
60.0 3.6 63.6
EgyptAbu Soma Development Company Accommodation & FY94, 97, 99 1.1 – – 1.1 1.1
Tourism Services
Al–Amir for Sanitary Ware Nonmetallic Mineral FY02 6.0 – 6.0 – 6.0
Production, S.A.E. Product Manufacturing
Alexandria Carbon Black Chemicals FY93, 97, 99, 03 27.5 – 13.6 3.0 16.5
Company, S.A.E.
Alexandria National Iron & Primary Metals FY84, 91, 93, 94, 42.6 – 5.7 22.6 28.3
Steel Company S.A.E. 96, 99
Amreya Casting Company Industrial & FY02 4.9 – 6.1 – 6.1
Consumer Products
Club Ras Soma Hotel Company Accommodation & FY94 7.4 2.9 2.8 2.4 5.2
Tourism Services
Commercial International Bank Finance & Insurance FY94 15.6 – – 15.6 15.6
(Egypt) S.A.E.
Commercial International Bank Legal & Finance & Insurance FY00 1.7 – – 1.7 1.7
General Life Insurance Company
E.D.F. Port Said East Power S.A.E. Utilities FY01 45.0 152.5 45.0 – 45.0
E.D.F. Suez Gulf Power S.A.E. Utilities FY01 45.0 152.5 45.0 – 45.0
EFG – Hermes Holding SAE Finance & Insurance FY01 15.0 – 9.3 – 9.3
HC Securities & Investment S.A.E. Finance & Insurance FY00 1.4 – – 1.4 1.4
IT Worx Ltd Professional, Scientific FY01 2.5 – – 2.5 2.5
and Technical Services
Meleiha Oil Development and Oil, Gas and Mining FY87, 88, 93 41.7 – – 30.8 30.8
Exploration Project
Metro Markets Wholesale and FY03 15.0 – 15.0 – 15.0
Retail Trade
Misr Compressor Manufacturing Industrial & FY92 13.5 – 9.7 – 9.7
Company, S.A.E. Consumer Products
Orascom Construction Nonmetallic Mineral FY02 25.0 30.5 25.0 – 25.0
Industries S.A.E. Product Manufacturing
Orascom Projects and Touristic Accommodation & FY97, 99 21.8 – 3.5 – 3.5
Development S.A.E. Tourism Services
Orix Leasing Egypt Finance & Insurance FY97, 02 6.9 – 5.7 0.9 6.6
Sekem Holdings Chemicals FY03 5.0 – 5.0 – 5.0
Unipak Nile Limited Pulp & Paper FY98, 01 8.0 – 7.1 – 7.1
204.6 81.9 286.4
Original commitments1 Investments held for IFC(US$ millions) (US$ millions)
Fiscal Year in Totalwhich commitments syndi- Equity Total loans
Country, region or other area, and obligor Sector were made Total IFC cations Loans (at cost) and equity
MIDDLE EAST & NORTH AFRICAat June 30, 2003
91
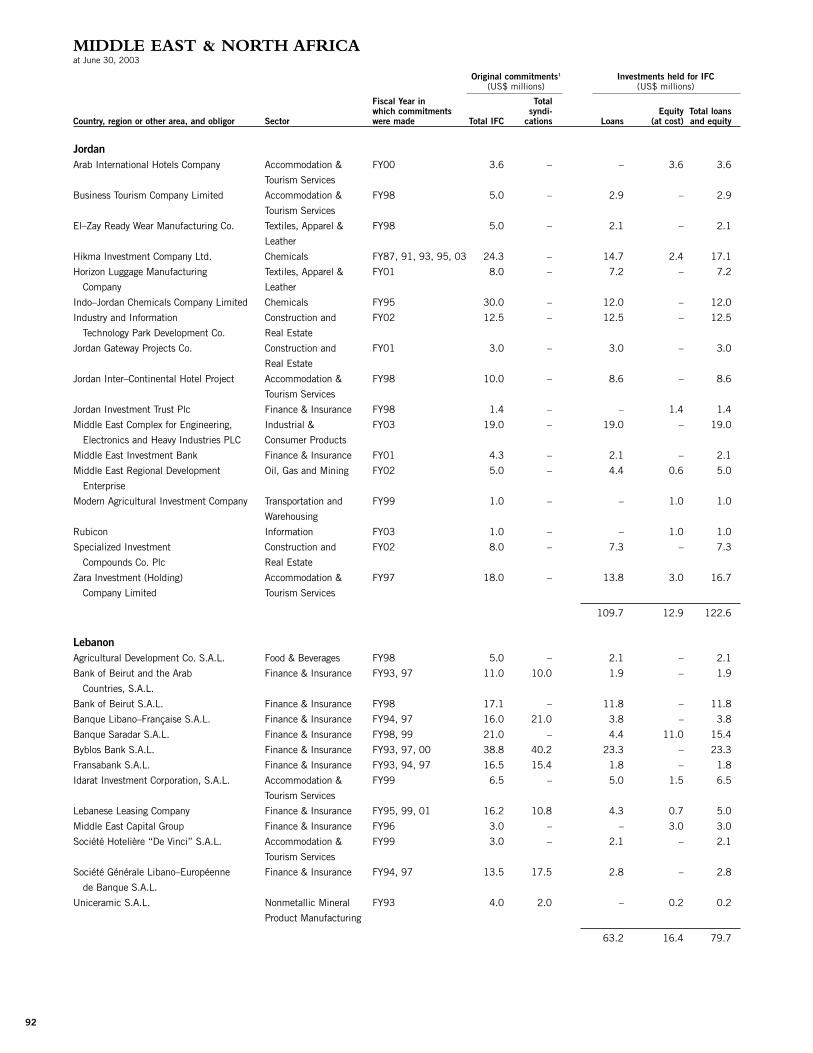
JordanArab International Hotels Company Accommodation & FY00 3.6 – – 3.6 3.6
Tourism Services
Business Tourism Company Limited Accommodation & FY98 5.0 – 2.9 – 2.9
Tourism Services
El–Zay Ready Wear Manufacturing Co. Textiles, Apparel & FY98 5.0 – 2.1 – 2.1
Leather
Hikma Investment Company Ltd. Chemicals FY87, 91, 93, 95, 03 24.3 – 14.7 2.4 17.1
Horizon Luggage Manufacturing Textiles, Apparel & FY01 8.0 – 7.2 – 7.2
Company Leather
Indo–Jordan Chemicals Company Limited Chemicals FY95 30.0 – 12.0 – 12.0
Industry and Information Construction and FY02 12.5 – 12.5 – 12.5
Technology Park Development Co. Real Estate
Jordan Gateway Projects Co. Construction and FY01 3.0 – 3.0 – 3.0
Real Estate
Jordan Inter–Continental Hotel Project Accommodation & FY98 10.0 – 8.6 – 8.6
Tourism Services
Jordan Investment Trust Plc Finance & Insurance FY98 1.4 – – 1.4 1.4
Middle East Complex for Engineering, Industrial & FY03 19.0 – 19.0 – 19.0
Electronics and Heavy Industries PLC Consumer Products
Middle East Investment Bank Finance & Insurance FY01 4.3 – 2.1 – 2.1
Middle East Regional Development Oil, Gas and Mining FY02 5.0 – 4.4 0.6 5.0
Enterprise
Modern Agricultural Investment Company Transportation and FY99 1.0 – – 1.0 1.0
Warehousing
Rubicon Information FY03 1.0 – – 1.0 1.0
Specialized Investment Construction and FY02 8.0 – 7.3 – 7.3
Compounds Co. Plc Real Estate
Zara Investment (Holding) Accommodation & FY97 18.0 – 13.8 3.0 16.7
Company Limited Tourism Services
109.7 12.9 122.6
LebanonAgricultural Development Co. S.A.L. Food & Beverages FY98 5.0 – 2.1 – 2.1
Bank of Beirut and the Arab Finance & Insurance FY93, 97 11.0 10.0 1.9 – 1.9
Countries, S.A.L.
Bank of Beirut S.A.L. Finance & Insurance FY98 17.1 – 11.8 – 11.8
Banque Libano–Française S.A.L. Finance & Insurance FY94, 97 16.0 21.0 3.8 – 3.8
Banque Saradar S.A.L. Finance & Insurance FY98, 99 21.0 – 4.4 11.0 15.4
Byblos Bank S.A.L. Finance & Insurance FY93, 97, 00 38.8 40.2 23.3 – 23.3
Fransabank S.A.L. Finance & Insurance FY93, 94, 97 16.5 15.4 1.8 – 1.8
Idarat Investment Corporation, S.A.L. Accommodation & FY99 6.5 – 5.0 1.5 6.5
Tourism Services
Lebanese Leasing Company Finance & Insurance FY95, 99, 01 16.2 10.8 4.3 0.7 5.0
Middle East Capital Group Finance & Insurance FY96 3.0 – – 3.0 3.0
Société Hotelière “De Vinci” S.A.L. Accommodation & FY99 3.0 – 2.1 – 2.1
Tourism Services
Société Générale Libano–Européenne Finance & Insurance FY94, 97 13.5 17.5 2.8 – 2.8
de Banque S.A.L.
Uniceramic S.A.L. Nonmetallic Mineral FY93 4.0 2.0 – 0.2 0.2
Product Manufacturing
63.2 16.4 79.7
Original commitments1 Investments held for IFC(US$ millions) (US$ millions)
Fiscal Year in Totalwhich commitments syndi- Equity Total loans
Country, region or other area, and obligor Sector were made Total IFC cations Loans (at cost) and equity
MIDDLE EAST & NORTH AFRICAat June 30, 2003
92
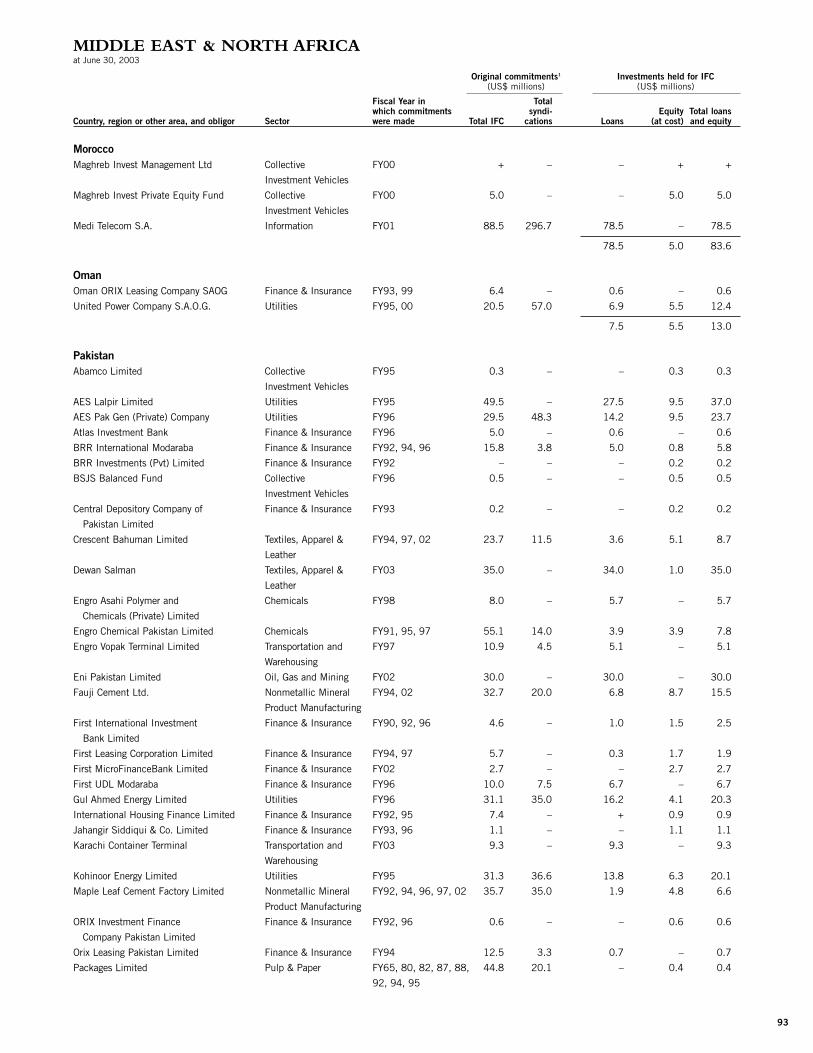
MoroccoMaghreb Invest Management Ltd Collective FY00 + – – + +
Investment Vehicles
Maghreb Invest Private Equity Fund Collective FY00 5.0 – – 5.0 5.0
Investment Vehicles
Medi Telecom S.A. Information FY01 88.5 296.7 78.5 – 78.5
78.5 5.0 83.6
OmanOman ORIX Leasing Company SAOG Finance & Insurance FY93, 99 6.4 – 0.6 – 0.6
United Power Company S.A.O.G. Utilities FY95, 00 20.5 57.0 6.9 5.5 12.4
7.5 5.5 13.0
PakistanAbamco Limited Collective FY95 0.3 – – 0.3 0.3
Investment Vehicles
AES Lalpir Limited Utilities FY95 49.5 – 27.5 9.5 37.0
AES Pak Gen (Private) Company Utilities FY96 29.5 48.3 14.2 9.5 23.7
Atlas Investment Bank Finance & Insurance FY96 5.0 – 0.6 – 0.6
BRR International Modaraba Finance & Insurance FY92, 94, 96 15.8 3.8 5.0 0.8 5.8
BRR Investments (Pvt) Limited Finance & Insurance FY92 – – – 0.2 0.2
BSJS Balanced Fund Collective FY96 0.5 – – 0.5 0.5
Investment Vehicles
Central Depository Company of Finance & Insurance FY93 0.2 – – 0.2 0.2
Pakistan Limited
Crescent Bahuman Limited Textiles, Apparel & FY94, 97, 02 23.7 11.5 3.6 5.1 8.7
Leather
Dewan Salman Textiles, Apparel & FY03 35.0 – 34.0 1.0 35.0
Leather
Engro Asahi Polymer and Chemicals FY98 8.0 – 5.7 – 5.7
Chemicals (Private) Limited
Engro Chemical Pakistan Limited Chemicals FY91, 95, 97 55.1 14.0 3.9 3.9 7.8
Engro Vopak Terminal Limited Transportation and FY97 10.9 4.5 5.1 – 5.1
Warehousing
Eni Pakistan Limited Oil, Gas and Mining FY02 30.0 – 30.0 – 30.0
Fauji Cement Ltd. Nonmetallic Mineral FY94, 02 32.7 20.0 6.8 8.7 15.5
Product Manufacturing
First International Investment Finance & Insurance FY90, 92, 96 4.6 – 1.0 1.5 2.5
Bank Limited
First Leasing Corporation Limited Finance & Insurance FY94, 97 5.7 – 0.3 1.7 1.9
First MicroFinanceBank Limited Finance & Insurance FY02 2.7 – – 2.7 2.7
First UDL Modaraba Finance & Insurance FY96 10.0 7.5 6.7 – 6.7
Gul Ahmed Energy Limited Utilities FY96 31.1 35.0 16.2 4.1 20.3
International Housing Finance Limited Finance & Insurance FY92, 95 7.4 – + 0.9 0.9
Jahangir Siddiqui & Co. Limited Finance & Insurance FY93, 96 1.1 – – 1.1 1.1
Karachi Container Terminal Transportation and FY03 9.3 – 9.3 – 9.3
Warehousing
Kohinoor Energy Limited Utilities FY95 31.3 36.6 13.8 6.3 20.1
Maple Leaf Cement Factory Limited Nonmetallic Mineral FY92, 94, 96, 97, 02 35.7 35.0 1.9 4.8 6.6
Product Manufacturing
ORIX Investment Finance Finance & Insurance FY92, 96 0.6 – – 0.6 0.6
Company Pakistan Limited
Orix Leasing Pakistan Limited Finance & Insurance FY94 12.5 3.3 0.7 – 0.7
Packages Limited Pulp & Paper FY65, 80, 82, 87, 88, 44.8 20.1 – 0.4 0.4
92, 94, 95
Original commitments1 Investments held for IFC(US$ millions) (US$ millions)
Fiscal Year in Totalwhich commitments syndi- Equity Total loans
Country, region or other area, and obligor Sector were made Total IFC cations Loans (at cost) and equity
MIDDLE EAST & NORTH AFRICAat June 30, 2003
93

Pakistan Industrial & Finance & Insurance FY94 5.0 – 0.6 – 0.6
Commercial Leasing Limited
Pakistan Industrial Leasing Finance & Insurance FY91, 94, 95 15.5 2.2 0.6 – 0.6
Corporation Limited
Pakistan Petroleum Limited Oil, Gas and Mining FY83, 85, 95, 02 49.5 85.4 – 8.2 8.2
Regent Knitwear Limited Textiles, Apparel & FY94 9.2 2.8 7.8 – 7.8
Leather
Rupafab Limited Textiles, Apparel & FY96 11.0 – 0.9 – 0.9
Leather
Sarah Textiles Limited Textiles, Apparel & FY93, 96, 02 7.7 – – + +
Leather
Uch Power Limited Utilities FY96 40.0 75.0 38.1 – 38.1
234.0 71.8 305.8
Saudi ArabiaSaudi Orix Leasing Company (SOLC) Finance & Insurance FY00 1.6 – – 1.6 1.6
1.6 1.6
Syrian Arab RepublicArab Drip Irrigation Technology Plastics & Rubber FY01 1.0 – – 1.0 1.0
Company Limited (Adritec)
Daaboul Company for Chemicals FY02 13.2 – 13.2 – 13.2
Petrochemicals Industries
Syrian Commercial Bank Finance & Insurance FY02 3.3 – – 3.3 3.3
13.2 4.3 17.5
TunisiaBanque Internationale Arabe de Tunisie Finance & Insurance FY98, 00 8.3 – – 2.5 2.5
International Maghreb Merchant Finance & Insurance FY95 0.3 – – 0.3 0.3
Bank S.A.
Société Industrielle des Textiles Textiles, Apparel & FY86, 92, 98 14.0 – – 2.9 2.9
(SITEX) Leather
Tuninvest Private Equity Fund Collective FY98 4.6 – – 4.3 4.3
Investment Vehicles
10.1 10.1
West Bank and GazaArab Bank PLC. Finance & Insurance FY97 – – 0.1 – 0.1
Arab Concrete Products Company Nonmetallic Mineral FY98 0.8 – 0.8 – 0.8
Product Manufacturing
Arab Palestine Investment Bank Finance & Insurance FY96 3.7 – – 3.7 3.7
Arab Palestinian Storage and Transportation and FY99 0.2 – 0.1 – 0.1
Cooling Co. Ltd Warehousing
Commercial Bank of Palestine Finance & Insurance FY97 6.6 – 0.1 – 0.1
Jericho Motels Company Ltd. Accommodation & FY99 1.2 – 1.1 – 1.1
Tourism Services
Jordan National Bank Finance & Insurance FY97 – – 0.9 – 0.9
Palestine Industrial Estates Development Construction and FY98 9.0 7.0 8.0 1.0 9.0
and Management Company Real Estate
Palestine Mortgage Housing Corporation Finance & Insurance FY99 3.0 – – 3.0 3.0
Palestine Tourism Investment Accommodation & FY99 9.3 – 5.8 1.4 7.2
Company Limited Tourism Services
Peace Technology Fund Collective FY99 12.6 – – 12.6 12.6
Investment Vehicles
Original commitments1 Investments held for IFC(US$ millions) (US$ millions)
Fiscal Year in Totalwhich commitments syndi- Equity Total loans
Country, region or other area, and obligor Sector were made Total IFC cations Loans (at cost) and equity
MIDDLE EAST & NORTH AFRICAat June 30, 2003
94

Peace Technology Management Ltd. Collective FY98 0.2 – – 0.2 0.2
Investment Vehicles
17.0 21.9 38.9
Yemen, Republic ofAden Company for Silos and Mills Food & Beverages FY99 12.0 – 12.0 – 12.0
Al–Ahila Mineral Water Company Food & Beverages FY03 1.5 – 1.5 – 1.5
Radfan Ceramics and Porcelain Nonmetallic Mineral FY98 3.8 – 2.2 – 2.2
Manufacturing Company Limited Product Manufacturing
15.7 15.7
Regional InvestmentsArab Insurance Group Finance & Insurance FY98 6.2 – – 6.0 6.0
First ANZ International Collective FY97 5.0 – – 0.6 0.6
Modaraba Limited Investment Vehicles
Inter Arab Rating Company Finance & Insurance FY96 0.3 – – 0.3 0.3
6.9 6.9
Total equity and loans 803.4 241.9 1,045.3
Total guarantees and risk management products 281.0
Total IFC portfolio for Middle East & North Africa 1,326.3
Original commitments1 Investments held for IFC(US$ millions) (US$ millions)
Fiscal Year in Totalwhich commitments syndi- Equity Total loans
Country, region or other area, and obligor Sector were made Total IFC cations Loans (at cost) and equity
MIDDLE EAST & NORTH AFRICAat June 30, 2003
95

ACCION Investments in Microfinance Finance & Insurance FY03 3.0 – – 3.0 3.0
Emerging Markets Fixed Income Fund Collective FY98 10.0 – – 7.7 7.7
Investment Vehicles
Gerling Credit Insurance Group Finance & Insurance FY01 11.1 – – 11.1 11.1
InfrastructureWorld.com Information FY01 5.0 – – + +
Internationale Micro Investitionen Finance & Insurance FY01, 02, 03 6.7 – – 6.7 6.7
Aktiengesellschaft
Novica United, Inc. Information FY03 1.5 – – 1.5 1.5
Round 1 Collective FY01 3.0 – 0.5 + 0.5
Investment Vehicles
Solar Development Capital Limited Collective FY01 5.5 – – 5.5 5.5
Investment Vehicles
State Street Bank and Trust Company Collective FY94 10.0 – – 9.0 9.0
IFC Emerging Markets Common Investment Vehicles
Trust Fund
0.5 44.5 45.0
Total for Worldwide 0.5 44.5 45.0
Total loans and equity for IFC 11,973.9 3,539.0 15,512.9
Total loans and equity for IFC (net of write–off adjustments)2 11,925.3 3,517.2 15,442.5
Total guarantees and risk management products 1,334.9
Total IFC portfolio for its own account 16,777.4
* Financial intermediary through which IFC makes loans to, and equity investments in, various small–scale companies.
** Subproject under an agency line or a multicountry loan facility. The corresponding commitment is shown for the agent.
+ Less than $ 50,000.
1. Commitments include funds to be provided by IFC for its own account, funds to be provided by participants through the purchase of an interest in IFC’s investment, and
funds to be provided by other financial institutions in association with IFC, where IFC has rendered material assistance in mobilizing those funds. Original commitments
are composed of disbursed and undisbursed balances. The undisbursed portion is revalued at current exchange rate, while the disbursed portion represents the cost of the
commitment at the time of disbursement. Loans held for the Corporation are revalued at the current exchange rates. Amounts shown are for commitments outstanding at
June 30, 2003, net of cancellations.
2. Of the total $290,414,425 in write–offs for FY03, write–off adjustments are $48,617,160 in loans and $21,835,727 in equity (at cost) for a total of $70,452,887.
Note: The operational investments are represented by loans and equity, as stated. In addition, in certain investments, the Corporation has the right to acquire shares and/or
participate in the profits of the enterprise.
Original commitments1 Investments held for IFC(US$ millions) (US$ millions)
Fiscal Year in Totalwhich commitments syndi- Equity Total loans
Country, region or other area, and obligor Sector were made Total IFC cations Loans (at cost) and equity
WORLDWIDEat June 30, 2003
96

PRIMARY IFC STAFF CONTRIBUTORS:Rosemarie AbadPhilippe AhouaTeresa AndayaAnthony AylwardDeborah BarryLouis BoorstinJohn BorthwickPaul BraveryNicholas BurkeOmar ChaudryJulia ChiperfieldMichael DompasDavid DonaldsonKutlay EbiriJames EmeryNeil GregoryAlison HarwoodKerry HemondPeggy HendersonBrigid HolleranGenoveva Izurieta
Lisa KaestnerJung Lim KimGjergj KondaRachel KyteIrina LikhachevaToshiya MasuokaJunko OikawaKaikham OnedamdyLory Camba OpemHarry PastuszekSérgio PimentaFereshteh RaissianRandall RiopelleBrian SamuelEllen SchwabStoyan TenevWilliam V. ToddWai-Keen WongRob WrightLinda YoungDamla Zeybel
DESIGN:Supon Design Group/MHI Communications, Washington, DC
PRINTING:Schmitz Press, Sparks, MD
PROJECT MANAGER & EDITOR:Paul McClure
CORPORATE RELATIONS CONTRIBUTORS:Joseph O’Keefe, ManagerDana Lane, Chief of PublicationsAriadne Garscadden, Information AssistantStephan Beauchesne, Information Officer (Web)Anna Bottiglieri, Editor (Web)Declan Heery, ConsultantShona Hurpaul, InternLore Lawrence, Information Analyst

INTERNATIONAL FINANCE CORPORATION 2121 Pennsylvania Avenue, NWWashington, DC 20433 USA
TELEPHONE 202-473-3800
FACSIMILE 202-974-4384
www.ifc.org www.ifc.org/ar2003
ISBN 0-8213-5652-6
2003 ANNUAL REPORTVOLUME 2
innovationimpact
sustainabilityIFC’s COMMITMENT
At IFC our mandate is to further sustainable economic developmentthrough the private sector.We pursue this goal through innovative solu-tions to the challenges of development, as we invest in companies andfinancial institutions in emerging markets and as we help build businessskills.We consider positive development impact an integral part of goodbusiness, and we focus much of our effort on the countries with thegreatest need for investment. We recognize that economic growth issustainable only if it is environmentally and socially sound and helpsimprove the quality of life for those living in developing countries.
THE IFC ANNUAL REPORT ON THE WEB, www.ifc.org/ar2003,is a companion to this printed edition. It provides easy navigation anddownloading of data related to IFC investment projects.
PRINTED WITH SOY-BASED INKS