Principles, problems and a paradox with the measurement of energy-expenditure of free-living...
16
STATISTICS IN MEDICINE, VOL. 9, 1365-1380 (1990) PRINCIPLES, PROBLEMS AND A PARADOX WITH THE MEASUREMENT OF ENERGY EXPENDITURE OF FREE- LIVING SUBJECTS USING DOUBLY-LABELLED WATER J. R. SPEAKMAN Department of Zoology, University of Aberdeen, Aberdeen. AB92TN, Scotland, U.K. SUMMARY Many aspects of the study of human nutrition would benefit from the ability to measure the energy which is expended by subjects as they go about their normal activities. The doubly-labelled water technique is a method which allows such measures to be made. The technique depends on the principle that a measure of carbon dioxide production is possible from the difference in the rates at which isotopic labels of hydrogen and oxygen are eliminated from the body. This simple explanation however conceals a host of assumptions. Several issues have emerged as important in the application of the technique to humans. These issues include first, the use of two samples (an initial and final sample) or multiple samples to estimate the rates of isotope elimination, and secondly the appropriate use of dilution spaces. This paper reviews the current status of the debates concerning these two issues. Paradoxically, improvements in our understanding of the technique, in the methods for calculating carbon dioxide production and in the accuracy of mass spectrometry, have not led to improvements in the accuracy of the technique. The mean deviation of estimates of carbon dioxide production using the technique from estimates made by conventional methods averages 7 per cent. INTRODUCTION Many outstanding problems in the study of human nutrition revolve around the difficulties of obtaining accurate measurements of the energy which is expended by subjects as they go about their normal behaviour. For example, obesity is a topical nutritional problem which has wide ranging consequences for health. It is obvious that obesity is a problem of energy balance, subjects are either eating too much or expending too little (or both). Debate has raged however as to the relative contribution that each of these causes makes to the development of obesity. The basic problem is that until recently we have not been in a position to test which of the potential causes is of most importance. This is because we did not have a technique which was capable of measuring the energy which is expended by obese people, as they go about their daily lives, compared to the energy expended by lean people. The traditional methods which have been used to measure energy expenditure are direct calorimetry, and the inference of heat production from oxygen consumption or carbon dioxide production (indirect calorimetry). Both these approaches require confinement of the subject in a relatively small chamber, in order to collect the respiratory gases or to trap the evolved heat. Although these chambers provide useful information on the basal levels of energy requirement, by their very nature they can never fully reproduce the multiplicity of factors which influence daily energy demands. An alternative to the calorimetry approach is to infer respiratory energy expenditure from the energy which is consumed as food minus any losses as faeces, urea and growth or fat deposition. 0277-6715/90/111365-16$08.00 © 1990 by John Wiley & Sons, Ltd.
Transcript of Principles, problems and a paradox with the measurement of energy-expenditure of free-living...

STATISTICS IN MEDICINE, VOL. 9, 1365-1380 (1990)
PRINCIPLES, PROBLEMS AND A PARADOX WITH THE MEASUREMENT OF ENERGY EXPENDITURE OF FREELIVING SUBJECTS USING DOUBLY-LABELLED WATER
J. R. SPEAKMAN Department of Zoology, University of Aberdeen, Aberdeen. AB92TN, Scotland, U.K.
SUMMARY
Many aspects of the study of human nutrition would benefitfrom the ability to measure the energy which is expended by subjects as they go about their normal activities. The doubly-labelled water technique is a method which allows such measures to be made. The technique depends on the principle that a measure of carbon dioxide production is possible from the difference in the rates at which isotopic labels of hydrogen and oxygen are eliminated from the body. This simple explanation however conceals a host of assumptions. Several issueshave emerged as important in the application of the technique to humans. These issues include first, the use of two samples (an initial and final sample) or multiple samples to estimate the rates of isotope elimination, and secondly the appropriate use of dilution spaces.This paper reviewsthe current status of the debates concerning these two issues.Paradoxically, improvements in our understanding of the technique, in the methods for calculating carbon dioxide production and in the accuracy of mass spectrometry, have not led to improvements in the accuracy of the technique. The mean deviation of estimates of carbon dioxide production using the technique from estimates made by conventional methods averages 7 per cent.
INTRODUCTION
Many outstanding problems in the study of human nutrition revolve around the difficulties of obtaining accurate measurements of the energy which is expended by subjects as they go about their normal behaviour. For example, obesity is a topical nutritional problem which has wide ranging consequences for health. It is obvious that obesity is a problem of energy balance, subjects are either eating too much or expending too little (or both). Debate has raged however as to the relative contribution that each of these causes makes to the development of obesity. The basic problem is that until recently we have not been in a position to test which of the potential causes is of most importance. This is because we did not have a technique which was capable of measuring the energy which is expended by obese people, as they go about their daily lives, compared to the energy expended by lean people.
The traditional methods which have been used to measure energy expenditure are direct calorimetry, and the inference of heat production from oxygen consumption or carbon dioxide production (indirect calorimetry). Both these approaches require confinement of the subject in a relatively small chamber, in order to collect the respiratory gases or to trap the evolved heat. Although these chambers provide useful information on the basal levels of energy requirement, by their very nature they can never fully reproduce the multiplicity of factors which influence daily energy demands.
An alternative to the calorimetry approach is to infer respiratory energy expenditure from the energy which is consumed as food minus any losses as faeces, urea and growth or fat deposition.
0277-6715/90/111365-16$08.00 © 1990 by John Wiley & Sons, Ltd.
1366 1. R. SPEAKMAN
This latter method, however, is critically dependent on the ability to accurately weigh, and assess the composition of all the ingested food. When this is left to the subjects themselves they frequently under-record their intakes. More importantly such under-declaring, leading to low inferred energy expenditure, may vary in relation to the critical variable under examination, for example obesity. This may lead to spurious inferences concerning the cause of the problem under study.
The doubly-labelled water (DLW) technique is a non-invasive method which allows an estimate of the energy expended by subjects as they go about their normal activities. In humans the technique provides an estimate of energy expenditure averaged over a period of a few days to a month. In small animals the period is one to two days. The technique has several advantages over the traditional methods of direct and indirect calorimetry. A most important advantage is the ease with which it is performed. It involves only the provision of a daily urine sample, hence subjects can engage in a completely natural daily routine. As such the technique has an enormous potential and is already providing insights into problems of energy balance in the study of human nutrition.
This review is in three parts. In the first part I will review the basic principles and assumptions which underly the technique as it was originally developed for the study of small animals. The application of the technique to humans has stimulated an exponential growth in investigations into the technique. It has also revealed several new problems. In the second part of this paper I will discuss two of these problems. This is not an exhaustive treatment since several other problems exist, however these two problems have had a major role in recent debates about the technique. Finally, I will introduce a paradox which is evident in validations of the technique.
PRINCIPLES
Although the DLW technique is often described by human nutritionists as a new technique, the original work which led to its development was done half a century ago. 1 The technique is only new therefore to the extent that it is only within the last few years that it has been applied to the study of human nutrition.
The experiments which led to development of the technique were performed to establish the fate of inspired oxygen, and the source of oxygen in expired CO2 , It had been suggested that inspired oxygen combined with tissue hydrogen to form water, while the oxygen in carbon dioxide was derived half from the substrate which was being oxidized (fat, protein or carbohydrate) and half from the body water. Lifson et al,' recognized that if an animal was forced to breathe oxygen which had been enriched with a heavy isotope of oxygen e80), then the isotopic label would enter the body water, and, because the oxygen in expired CO 2 is derived half from the body water, would also appear in the expired CO2 , If the other half of the oxygen in expired CO 2
was derived from the metabolic substrate they suggested that isotopic exchange between oxygen in the substrates of the body and oxygen in body water would bring the enrichment of 180 in CO 2
close to that in the body water. Furthermore, exchange of oxygen isotopes between CP2 and water during transport of the gases in the blood would enhance this parity. In an earlier experiment the appearance of inspired oxygen in CO 2 had been inferred to suggest that oxygen is directly involved in substrate oxidation.'
Lifson et al,' confirmed that when an animal (mouse) is forced to breathe heavy oxygen the 180 does appear in the expired CO 2 , but as they predicted it also appears in the body water' at the same enrichment. Moreover, if an animal is injected with water enriched in 18 0 , the label also appears in the expired CO2 , meaning the appearance of 180 derived from inspired air in expired CO 2 could be completely accounted for by equilibration of the 180 in water.
1367 ENERGY EXPENDITURE OF FREE-LIVING SUBJECTS
Lifson's great insight was that the equilibration of respiratory carbon dioxide with body water, that is the fact that respiratory CO 2 has the same isotopic enrichment of 180 as body water, held the potential to measure CO 2 production and hence energy expenditure. Lifson saw that the turnover of oxygen isotope in the body would depend predominantly on the fluxes of both water and CO 2 , However, a label of hydrogen would tum over mainly as a function only of the water flux. The difference in the turnover of the two isotopes multiplied by the size of the body compartment in which the isotopes turned over, would then be a measure of CO 2 flux. Generally
(1)
where k; and kd are the fractional turnover rates of the oxygen and hydrogen (termed kd to indicate that label is deuterium and not tritium) per unit time, N is the body compartment size, which was equated with the body water pool, 1/2 is a constant which accounts for the fact that the turnover ofa water molecule reflects the loss of only half a molecule of CO 2 since there is only one atom of oxygen in each water molecule, compared with two atoms in each CO 2 molecule, and rC0 2 equals the production of CO 2 per unit time. Because the decline in the abundance of the isotopic labels in the body is exponential, approaching ever nearer to the natural abundance as time goes on, the fractional turnover rates, k; and kd , are calculated from the gradient of the decline in the log converted enrichments of the isotopes above the background natural abundance. An estimate of the size of the pool, N, in which the isotopes turn over can also be made from measurements of isotopic enrichment in the body. If the amount of isotope used in the dose is known then the extent to which it is diluted by the body is a measure of how much dilutant is present in the body. There are two alternative ways in which this calculation can be performed - using either the initial measured isotopic abundances after a period of equilibration, called the plateau method, or by back extrapolation of the turnover line to the intercept at the initial time when the isotopic dose was administered, called the zero-time intercept technique.
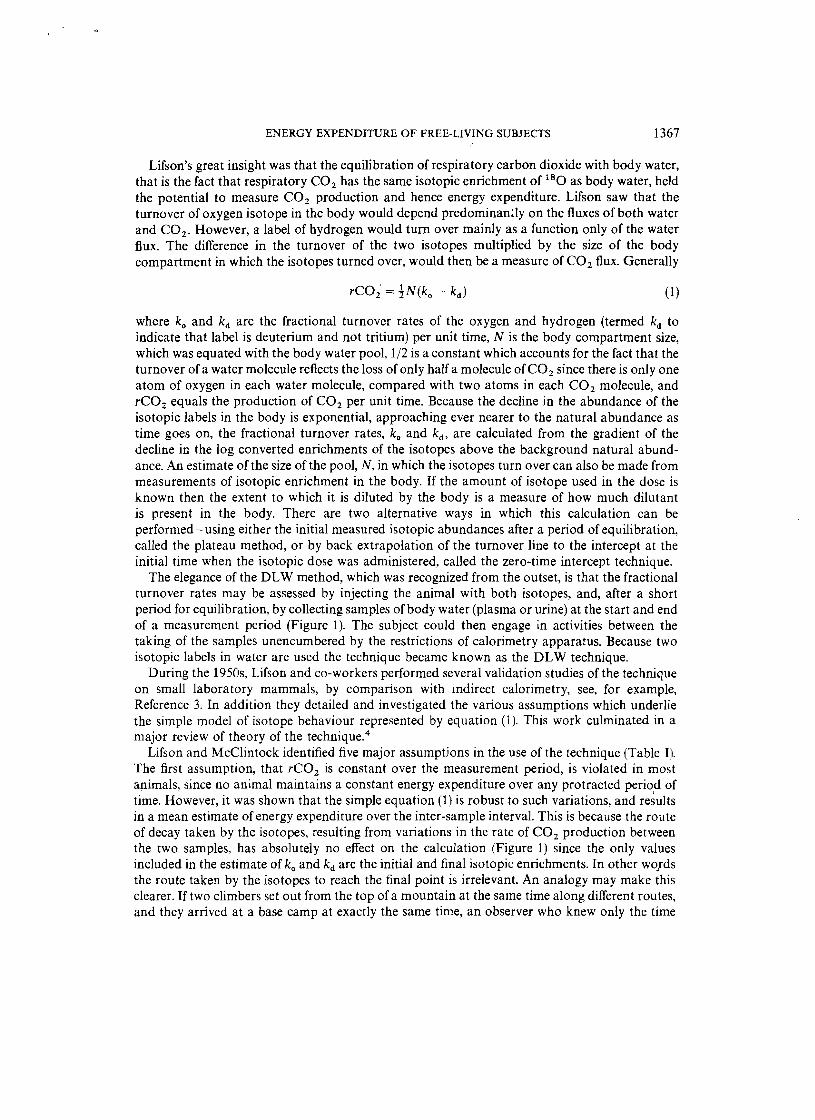
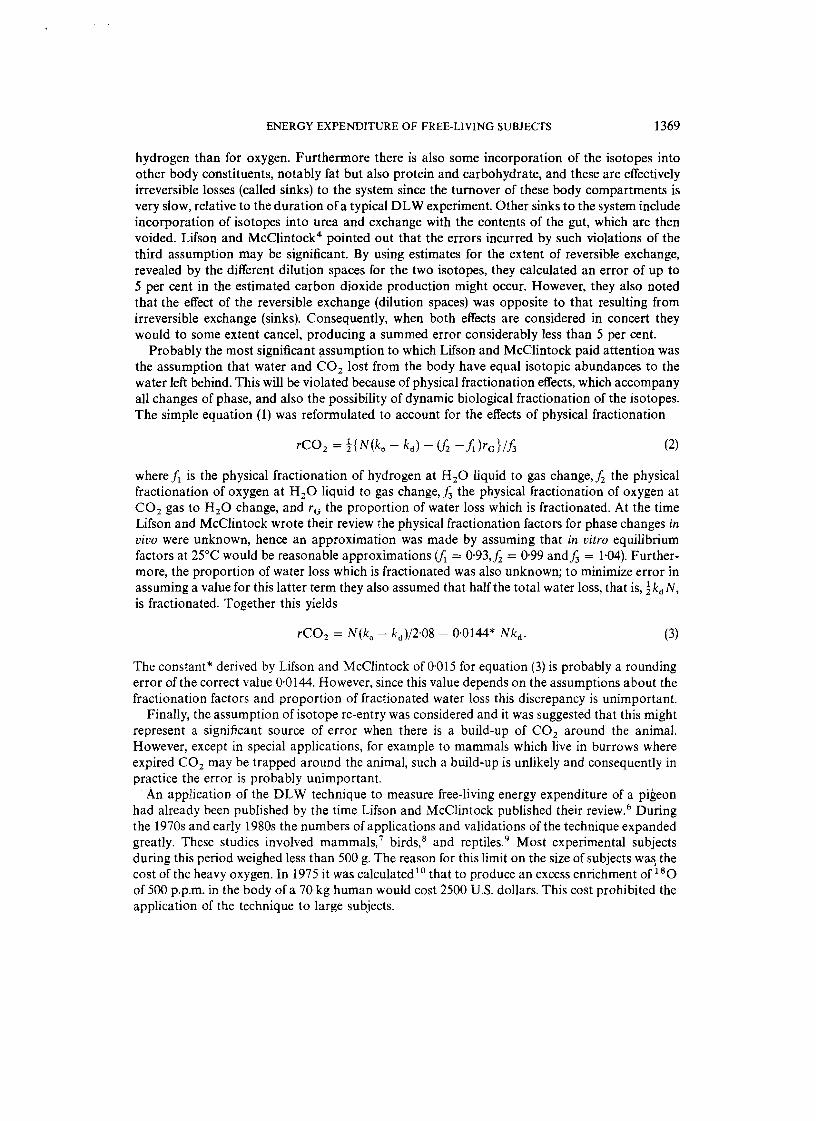
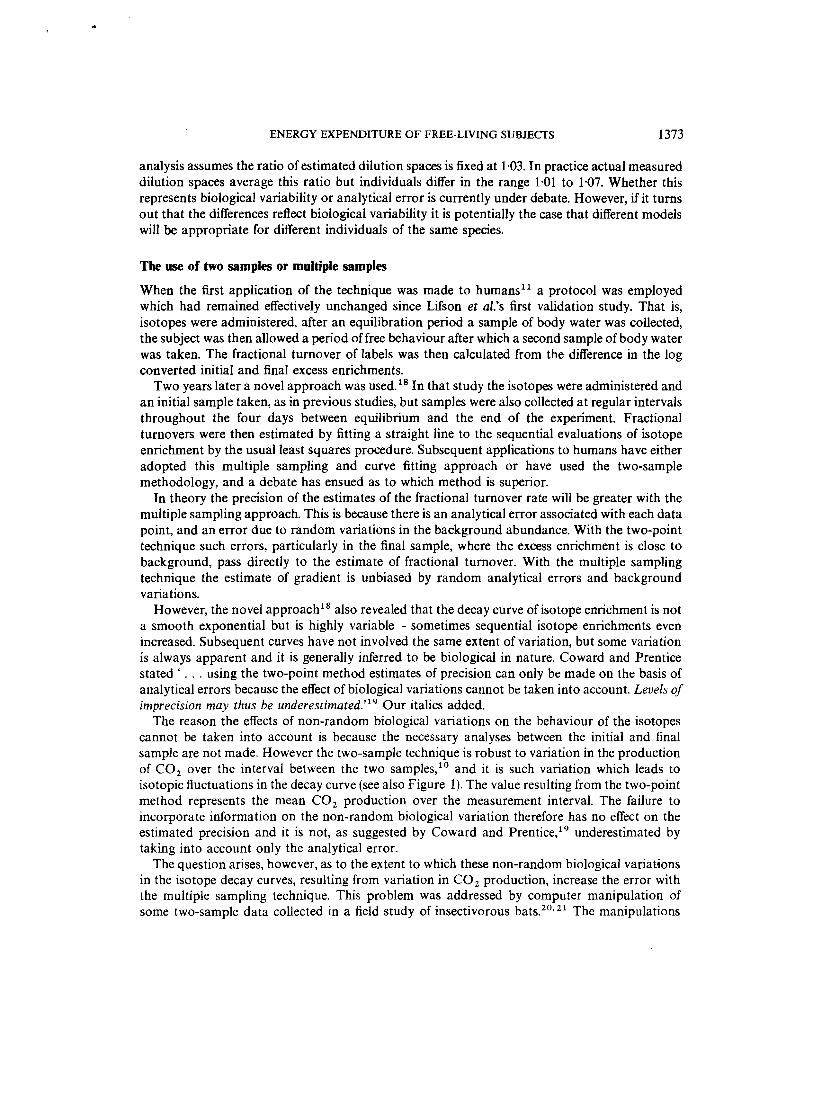
The elegance of the DLW method, which was recognized from the outset, is that the fractional turnover rates may be assessed by injecting the animal with both isotopes, and, after a short period for equilibration, by collecting samples of body water (plasma or urine) at the start and end of a measurement period (Figure 1). The subject could then engage in activities between the taking of the samples unencumbered by the restrictions of calorimetry apparatus. Because two isotopic labels in water are used the technique became known as the DLW technique.
During the 1950s, Lifson and co-workers performed several validation studies of the technique on small laboratory mammals, by comparison with indirect calorimetry, see, for example, Reference 3. In addition they detailed and investigated the various assumptions which underlie the simple model of isotope behaviour represented by equation (1). This work culminated in a major review of theory of the technique."
Lifson and McClintock identified five major assumptions in the use of the technique (Table I). The first assumption, that rC02 is constant over the measurement period, is violated in most animals, since no animal maintains a constant energy expenditure over any protracted period of time. However, it was shown that the simple equation (1) is robust to such variations, and results in a mean estimate of energy expenditure over the inter-sample interval. This is because the route of decay taken by the isotopes, resulting from variations in the rate of CO 2 production between the two samples, has absolutely no effect on the calculation (Figure 1) since the only values included in the estimate of k; and kd are the initial and final isotopic enrichments. In other WOlds the route taken by the isotopes to reach the final point is irrelevant. An analogy may make this clearer. If two climbers set out from the top of a mountain at the same time along different routes, and they arrived at a base camp at exactly the same time, an observer who knew only the time
1368 J. R. SPEAKMAN
EQUILIBRATION +-T1ME---+
>C o lD
2:: ~ w ~ :I: o ii: z w w Cl. o b ~ Cl o ....I
t TIM EDOSE ADMINISTERED
Figure 1. Schematic of the changes in isotopic enrichment within a body following introduction of labels of both hydrogen and oxygen. Hypothetical tracks taken by the isotopes during different decay scenarios are shown as dashed
lines
Table I. Assumptions in the Lifson and McClintock 1966 model"
1. The rate of production of carbon dioxide during the measurement period, rC0 2 , is constant 2. The body water pool size, N, is constant during the measurement period 3. The isotopes in the body are lost from the body only in the form ofwater and respiratory carbon dioxide 4. The isotopes which leave the body in water and carbon dioxide do so at the same enrichment as the
isotopes left behind 5. During the experimental period none of the isotopes which leaves the body re-enters it
they had set out and the time they had arrived would calculate an exactly equal average rate of descent for the two climbers. The intricacies of the two different routes the climbers took would be irrelevant to the calculation.
The assumption of constant body water pool size, N is also unrealistic. However, it was shown" that if the initial and final body masses are used to estimate an average pool size over the course of the measurement, effectively assuming that the change in mass throughout the measurement period is linear, then the resultant estimate also represents the mean energy expenditure over the measurement period. Deviations from linear changes in the pool size introduce negligible errors.
The third assumption that the isotopes only pervade the water pool and are only incorporated into water and CO 2 , is also violated in most animals. This is shown by the fact that the body pool size estimated from the dilution space of the isotopes exceeds the size of the body water pool established from desiccation." This means that when the isotopes pervade the body water pool they also exchange reversibly, but to a relatively small extent, with other compounds in the body. It has been established empirically that this small amount of reversible exchange is greater for
1369 ENERGY EXPENDITURE OF FREE-LIVING SUBJECTS
hydrogen than for oxygen. Furthermore there is also some incorporation of the isotopes into other body constituents, notably fat but also protein and carbohydrate, and these are effectively irreversible losses (called sinks) to the system since the turnover of these body compartments is very slow, relative to the duration of a typical DLW experiment. Other sinks to the system include incorporation of isotopes into urea and exchange with the contents of the gut, which are then voided. Lifson and McClintock4 pointed out that the errors incurred by such violations of the third assumption may be significant. By using estimates for the extent of reversible exchange, revealed by the different dilution spaces for the two isotopes, they calculated an error of up to 5 per cent in the estimated carbon dioxide production might occur. However, they also noted that the effect of the reversible exchange (dilution spaces) was opposite to that resulting from irreversible exchange (sinks). Consequently, when both effects are considered in concert they would to some extent cancel, producing a summed error considerably less than 5 per cent.
Probably the most significant assumption to which Lifson and McClintock paid attention was the assumption that water and CO 2 lost from the body have equal isotopic abundances to the water left behind. This will be violated because of physical fractionation effects, which accompany all changes of phase, and also the possibility of dynamic biological fractionation of the isotopes. The simple equation (1) was reformulated to account for the effects of physical fractionation
(2)
where h is the physical fractionation of hydrogen at H 2 0 liquid to gas change,/z the physical fractionation of oxygen at H 2 0 liquid to gas change,J; the physical fractionation of oxygen at CO2 gas to H2 0 change, and "o the proportion of water loss which is fractionated. At the time Lifson and McClintock wrote their review the physical fractionation factors for phase changes in vivo were unknown, hence an approximation was made by assuming that in vitro equilibrium factors at 25°C would be reasonable approximations u;. = 0'93,/z = 0·99 andj, = 1'04).Furthermore, the proportion of water loss which is fractionated was also unknown; to minimize error in assuming a value for this latter term they also assumed that half the total water loss, that is, -tkd N, is fractionated. Together this yields
(3)
The constant* derived by Lifson and McClintock of 0·015 for equation (3)is probably a rounding error ofthe correct value 0·0144. However, since this value depends on the assumptions about the fractionation factors and proportion of fractionated water loss this discrepancy is unimportant.
Finally, the assumption of isotope re-entry was considered and it was suggested that this might represent a significant source of error when there is a build-up of CO 2 around the animal. However, except in special applications, for example to mammals which live in burrows where expired CO 2 may be trapped around the animal, such a build-up is unlikely and consequently in practice the error is probably unimportant.
An application of the DLW technique to measure free-living energy expenditure of a pigeon had already been published by the time Lifson and McClintock published their review." During the 1970s and early 1980s the numbers of applica tions and validations of the technique expanded greatly. These studies involved mammals," birds," and reptiles." Most experimental subjects during this period weighed less than 500 g. The reason for this limit on the size of subjects wa~ the cost of the heavy oxygen. In 1975 it was calculated 10 that to produce an excess enrichment of 180
of 500 p.p.m. in the body of a 70 kg human would cost 2500 U.S. dollars. This cost prohibited the application of the technique to large subjects.
1370 J. R. SPEAKMAN
Two factors changed this situation. First, the cost of isotopes declined. The current cost (1989) to produce an excess enrichment of 500 p.p.m. in a 70 kg human is approximately 2000 U.S. dollars, about a third the cost it was in 1975 in real terms. Secondly, mass spectrometry instrumentation advances meant that it was no longer necessary to enrich to 500 p.p.m. to obtain a reliable estimate, and studies could be made at initial enrichments of 250 and even 100 p.p.m. excess at half and one-fifth the cost, respectively. In real terms, therefore, it is now possible to use the technique for one-fifth to one-fifteenth the cost that it was in the mid-1970s. The first study on humans was published in 1982.11 This was followed by an exponential expansion in applications and validations of the technique, not only to humans but to a wide range of animals (see the reviews of non-human applications.P and all validations up to 198813
) . In addition, further attention was focused on the assumptions underlying the technique, particularly in the human context.
The renewed interest in the theory and assumptions underlying the technique has involved developments in all the areas which were initially recognized as of importance (Table I). Moreover several practical problems peculiar to the application of the technique to humans have emerged as significant. In the second part of this paper I will outline two problems, one concerned with pool sizes, which has wider implications than the applications to humans and the second, the choice of multiple sampling or collection of only two samples, which is probably peculiar to humans and domestic animals.
PROBLEMS
The use of two pools or a single pool
In the Lifson and McClintock equation (3) the isotopic turnover of each label is referred to the volume of body water. This is because the model assumes that the labels pervade only the body water pool. This assumption is approximately correct, and the volume of distribution of the isotopes closely approximates that of the body water pool. However there is a significant discrepancy for both isotopes.
Coward et al.14 pointed out that to be mathematically correct the total outflow of products containing any label can only be calculated by multiplying the measured isotopic turnover (kd and ko) by its own dilution space (Nd and No). They therefore suggested that
(4)
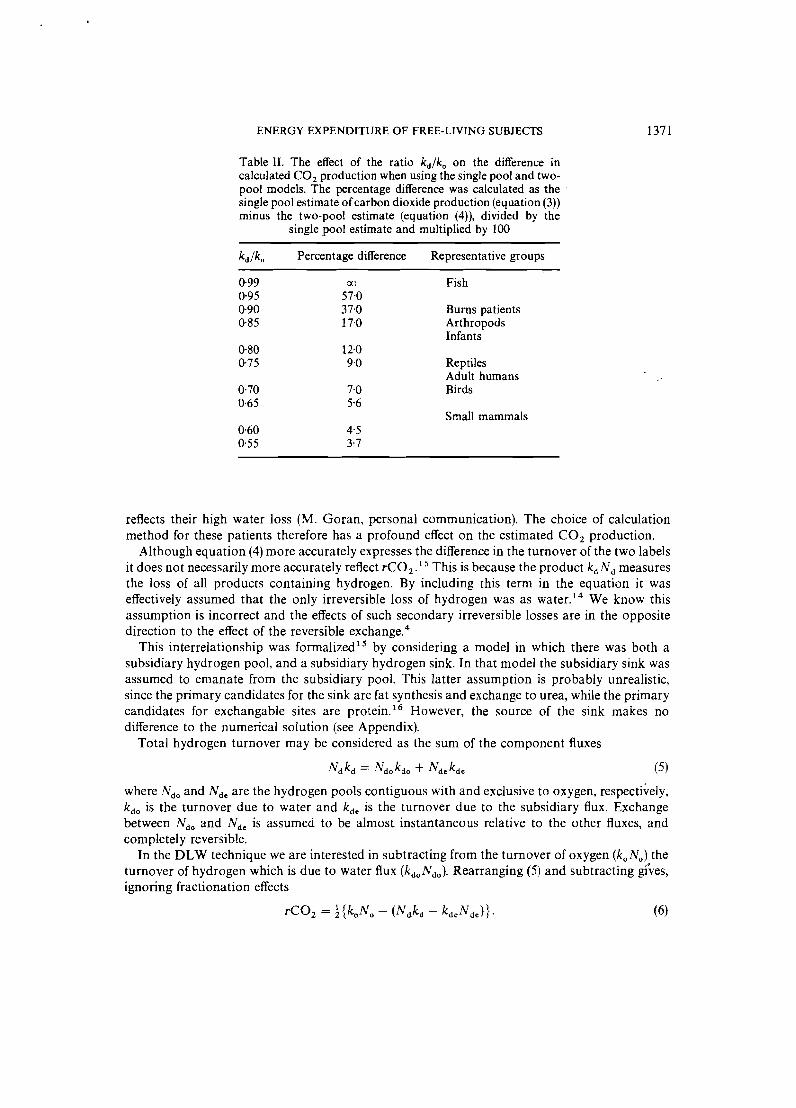
should be adopted to calculate CO 2 production. This differs from (3) principally in the fact that the turnovers are each related to their own dilution spaces. Since N d exceeds No by about 3 per cent this results in a lower estimate of rC0 2 than the original Lifson and McClintock equation." In their paper (Reference 4, Appendix 2) Lifson and McClintock also considered this model but indicated that the difference between the two calculations was only small (5 per cent). The
.renewed interest in the alternative model occurred because the actual difference between the two equations is a function of the size of kd in relation to ko (Table 11). As kd approaches ko the difference between the two models becomes very large. Indeed at values of kdlk o in excess of 0·971 (1/1'03) the difference results in a positive value for CO 2 production when using equation (3)but a negative value when using equation (4). Humans have generally higher ratios of kdlk o (Table II) and hence the significance of the alternative models for calculating reo 2 increased as the technique became applied to humans. It is also apparent that the significance of this problem also depends on the field of study. Burns patients for example have very high ratios of kdlko which
1371 ENERGY EXPENDITURE OF FREE-LIVING SUBJECTS
Table II. The effect of the ratio kd/ko on the difference in calculated CO2 production when using the singlepool and twopool models. The percentage difference was calculated as the singlepool estimateof carbon dioxide production (equation(3)) minus the two-pool estimate (equation (4)), divided by the
single pool estimate and multiplied by 100
kd/k o Percentage difference Representative groups
0·99 00 Fish 0·95 57·0 0·90 37·0 Burns patients 0·85 17·0 Arthropods
Infants 0·80 12·0 0·75 9'0 Reptiles
Adult humans 0·70 7·0 Birds 0·65 5·6
Small mammals 0·60 4·5 0·55 3·7
reflects their high water loss (M. Goran, personal communication). The choice of calculation method for these patients therefore has a profound effect on the estimated CO 2 production.
Although equation (4) more accurately expresses the difference in the turnover of the two labels it does not necessarily more accurately reflect rC0 2 .15 This is because the product kd N d measures the loss of all products containing hydrogen. By including this term in the equation it was effectively assumed that the only irreversible loss of hydrogen was as water.l" We know this assumption is incorrect and the effects of such secondary irreversible losses are in the opposite direction to the effect of the reversible exchange."
This interrelationship was formalized F by considering a model in which there was both a subsidiary hydrogen pool, and a subsidiary hydrogen sink. In that model the subsidiary sink was assumed to emanate from the subsidiary pool. This latter assumption is probably unrealistic, since the primary candidates for the sink are fat synthesis and exchange to urea, while the primary candidates for exchangable sites are protein.!" However, the source of the sink makes no difference to the numerical solution (see Appendix).
Total hydrogen turnover may be considered as the sum of the component fluxes
(5)
where Ndo and Nd e are the hydrogen pools contiguous with and exclusive to oxygen, respectively, is the turnover due to water and kd e is the turnover due to the subsidiary flux. Exchange kd o
between N do and Nd e is assumed to be almost instantaneous relative to the other fluxes, and completely reversible.
In the DLW technique we are interested in subtracting from the turnover of oxygen (koNo) the turnover of hydrogen which is due to water flux (kdoNdo)' Rearranging (5) and subtracting gives, ignoring fractionation effects
(6)
1372 J. R. SPEAKMAN
Table III. Irreversible losses of hydrogen (rnols/day) from the bodies of four species
Species
Bat Mouse Fat rat Human
Water 0·480 0·800 3-812 365·5
Irreversible exchange to urea Urea 0,0212* 0·020 ? Exchangeable Ht 0·0023 0·0025 ? 1·71
Loss of H in urea as percentage of water H (%) 0-48 0·312 ? 0·47
Incorporation into fat during fat synthesis
Fat ? 0·01 0·0458 osu Loss of H in fat as percentage of water H (%) ? 1'25 1·20 0'14
Total losses of non-aqueous hydrogen as percentage of aqueous loss of hydrogen
(%) > 0·48 1·562 > 1'20 0·61
* Calculated from urea concentration t Assuming only 11 per cent of urea H exchangeable.'? :j: Estimated from Reference 17, assuming turnover during typical 10 day DLW study is 10 per cent of the fat tissue
Since by definition No = Ndo, and empirically Nde = 0'03No
rC0 2 = 1{koNo - (Ndkd - 0·03kdeNde)}· (7)
Equation (7) more correctly expresses the turnover of oxygen minus the contribution to that turnover which is due to water than either of the equations (3) or (4), which represent the single pool and two-pool models, respectively. However, it contains an unmeasurable term (kdeNde). We may therefore ask under what conditions the two equations approximate equation (7) by substituting each of them into that equation. This yields the solution that the single pool model measures the true CO 2 production when kd = kde, and the two-pool model does so when kde = O. This latter result is consistent with formulation of the two-pool model which assumes all irreversible losses of hydrogen are as water.
These conditions may be redefined in terms of the total hydrogen flux, rH 2, the water hydrogen flux, rH 20, and the subsidiary hydrogen flux, rH 2x. This redefinition suggests the two-pool model will be accurate when rH 2x = 0 and the single pool model when rH 2x = 0·03 rH~O. The balance of superiority between these two approaches therefore lies at a point when the subsidiary losses of hydrogen are 1·5 per cent of the loss as water, if 2H overestimates body water, as estimated by 180, by 3 per cent.
There are relatively few measures of the magnitude of the subsidiary losses of hydrogen although Table III summarizes some of the available data. For a much fuller discussion see Reference 17. For humans it would appear subsidiary losses are well below 1·5 per cent of the water loss and hence the two-pool model is indicated. For small mammals, however, the problem remains unresolved and clearly further quantification of such losses is needed. Moreover this
1373 ENERGY EXPENDITURE OF FREE-LIVING SUBJECTS
analysis assumes the ratio of estimated dilution spaces is fixed at 1·03.In practice actual measured dilution spaces average this ratio but individuals differ in the range 1·01 to 1'07. Whether this represents biological variability or analytical error is currently under debate. However, if it turns out that the differences reflect biological variability it is potentially the case that different models will be appropriate for different individuals of the same species.
The use of two samples or multiple samples
When the first application of the technique was made to humansll a protocol was employed which had remained effectively unchanged since Lifson et al.'s first validation study. That is, isotopes were administered, after an equilibration period a sample of body water was collected, the subject was then allowed a period offree behaviour after which a second sample of body water was taken. The fractional turnover of labels was then calculated from the difference in the log converted initial and final excess enrichments.
Two years later a novel approach was used.?" In that study the isotopes were administered and an initial sample taken, as in previous studies, but samples were also collected at regular intervals throughout the four days between equilibrium and the end of the experiment. Fractional turnovers were then estimated by fitting a straight line to the sequential evaluations of isotope enrichment by the usual least squares procedure. Subsequent applications to humans have either adopted this multiple sampling and curve fitting approach or have used the two-sample methodology, and a debate has ensued as to which method is superior.
In theory the precision of the estimates of the fractional turnover rate will be greater with the multiple sampling approach. This is because there is an analytical error associated with each data point, and an error due to random variations in the background abundance. With the two-point technique such errors, particularly in the final sample, where the excess enrichment is close to background, pass directly to the estimate of fractional turnover. With the multiple sampling technique the estimate of gradient is unbiased by random analytical errors and background variations.
However, the novel approacb '" also revealed that the decay curve of isotope enrichment is not a smooth exponential but is highly variable - sometimes sequential isotope enrichments even increased. Subsequent curves have not involved the same extent of variation, but some variation is always apparent and it is generally inferred to be biological in nature. Coward and Prentice stated' ... using the two-point method estimates of precision can only be made on the basis of analytical errors because the effect of biological variations cannot be taken into account. Levels of imprecision may thus be underestimatedi'" Our italics added.
The reason the effects of non-random biological variations on the behaviour of the isotopes cannot be taken into account is because the necessary analyses between the initial and final sample are not made. However the two-sample technique is robust to variation in the production of CO 2 over the interval between the two samples.l? and it is such variation which leads to isotopic fluctuations in the decay curve (see also Figure 1).The value resulting from the two-point method represents the mean CO 2 production over the measurement interval. The failure to incorporate information on the non-random biological variation therefore has no effect on the estimated precision and it is not, as suggested by Coward and Prentice,"? underestimated by taking into account only the analytical error.
The question arises, however, as to the extent to which these non-random biological variations in the isotope decay curves, resulting from variation in CO 2 production, increase the error with the multiple sampling technique. This problem was addressed by computer manipulation of some two-sample data collected in a field study of insectivorous bats. 2 0
, 2 1 The manipulations
1374 J. R. SPEAKMAN
involved producing hypothetical isotope decay curves based upon realistic scenarios for variation in CO 2 production over 24 hours in small mammals. Straight lines were then fitted to these data and the gradients compared to the unbiased two-sample estimate. These data indicated that diurnal variation in CO 2 production might result in errors of up to 30 per cent in the estimates of total CO 2 production when using multiple sampling. This analysis demonstrated that when nonrandom variation in CO 2 production is large the two-sample technique is superior.
This is a remarkable result because it suggests that by doing less work one actually arrives at a better answer. To clarify why this might be the case let us return to the analogy of two climbers decending a mountain to a base camp. In the first case an observer knows only the heights of the mountain top and the camp, and the times of departure from the summit and arrival at the camp. The observer can calculate the mean rate of decline from these data, and as detailed previously this estimate is not influenced by the intricacies of the different routes taken by the two climbers if they depart and arrive at the same time. The error in the estimate depends only on the random analytical error in the estimated heights of the summit and camp, we shall assume error in the timing is negligible.
Consider now a second observer who plots the routes taken by the two climbers by taking their heights on the mountain at a series of preset intervals. The route taken by climber one is a direct linear path between the summit and the base camp, which is descended at a constant rate. Climber two, however, rapidly comes down a sheer face and then slowly walks back to the camp along a flat path. The observer plots out the graphs of elevation against time for the two climbers and fits straight lines to them using the standard least-squares procedure. The rates of descent are then estimated from the fitted gradients. For the first climber, who took the direct route at a constant rate, this approach works well and the estimated rate of descent is superior to that made by the first observer who only took two measures. This is because any random errors which occur in the estimation of height cancel out in the estimated gradient along the straight line path. However, for the second climber the estimate from the fitted curve is biased, because the route taken is not linear. That is an a priori assumption of the line fitting approach, that the variables were linearly associated results in an error in the estimate of the gradient of descent when the actual path deviates in a non-random fashion from linearity. In this instance the gradient would be overestimated. Where the error from this source exceeds the analytical error in the estimation of heights, which was the only source of error in the two-point estimate, the first observer, who has done less work, will indeed get a better answer for the rate of descent.
Two criticisms may be levelled at these results. First, over the time course of a typical experiment involving humans, variations in CO 2 production are much less than over the diurnal cycle of a small mammal. Secondly, only the error which occurs in the gradient of the fitted line was taken into account. It is well established that random measurement errors lead to covariation between the gradient and intercept of fitted regressions - larger gradients being associated with larger intercepts. This effect occurs because there is a pivot at the locus (x, y) through which a fitted line must pass. If the estimated gradient increases because of random measurement errors then the intercept will also increase, and vice versa. The intercept is often used to estimate the dilution space of the isotopes (No and Nd ) using the zero-time intercept method. Larger intercepts lead to smaller dilution spaces. In equation (4)the turnovers (ko and kd ) , which are estimated from the gradients, are multiplied by the dilution spaces, which are estimated from the intercepts. Covariance between the gradient and intercept might then be expected to lead to cancelling errors in the estimated products. By considering only error in the gradient, the error in final CO 2
production may have been overestimated by Speakman and Racey." In a recent paper the consequences of non-random biological variation in the decay curve were
further investigated using the computer modelling approach.22.23 In this paper much lower levels
1375 ENERGY EXPENDITURE OF FREE-LIVING SUBJECTS
of variation in CO 2 production were considered - at 1·1 times the average for one-third of the period and 0·95 times average for the remainder. This is the sort of variation which might result from a subject in a sedentary job who is periodically active, for example, at weekends. These variations in CO 2 production were so small that the resultant logarithmic-transformed isotope decay curves were almost indistinguishable from linear, which is straighter than any empirical curve yet published. Moreover, in the recent paper-? the effects of the different approaches on both the gradient and intercept were considered (see also Reference 23).
These simulations produced two results. First, covariance of the gradient and intercept is dependent on the measurement errors occurring at random, because it is only in this condition that the locus (.x,.9) around which the gradient pivots is stable. With non-random biological variation this locus is not always stable and therefore the errors in gradient and intercept do not always cancel, and indeed sometimes they are additive. Secondly, simply because a line appears straight we should not discount the possibility of errors. Decay gradients with r2 values greater than 0·999 still produced errors in the final CO 2 production estimate of up to 2 per cent.
The conclusion of these analyses is that the two-sample technique is robust to temporal variation in isotope abundance due to non-random biological variation in CO 2 production, but it is prone to analytical errors and random background variation in the final sample. The effects of such errors in the initial sample are relatively unimportant since it is very highly enriched above background. For multiple sampling the converse is true; random analytical errors and background variation are unimportant, but non-random biological variation may result in errors. Since the importance of analytical error and background variation in the two-sample technique depends on the final excess enrichment, the errors in the two-sample technique can be reduced by increasing the dose of label.
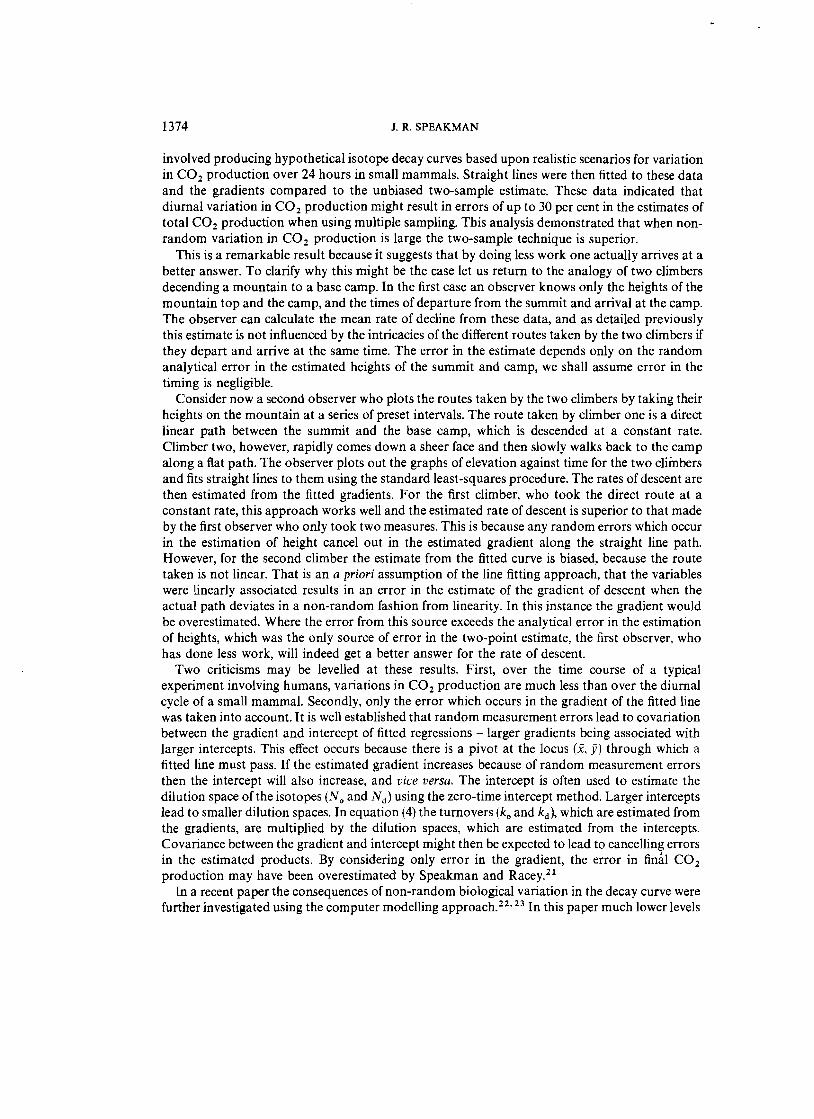
I have modelled this tradeoff in errors by considering the error in rC0 2 for both techniques as changes occur in the non-random biological variability and the initial isotope dosage. Nonrandom biological variability was modelled by introducing a kink into the theoretical linear decay curve, reflecting an initial period of low energy expenditure followed by a shorter period of high energy expenditure, and was expressed by the linearity of the decay curve: r = 1'000, no variability, r = 0·96 extreme variability. As the curve becomes progressively kinked, the correlation coefficient which expresses only the strength of linear association declines; 0·96 is the correlation coefficient equivalent to a kink reflecting the typical diurnal variation in CO 2
production of a small mammal. For two-sampling, random background variation over a typical 10-14 day experiment was assumed to be 3 p.p.m.F" and the analytical accuracy of the final sample was assumed to be 2 per cent of the excess enrichment.P The initial enrichment was varied between 100 and 2000 p.p.m. excess and the fractional turnovers were assumed to be k; = 0·13 and kd = 0·09 per day.
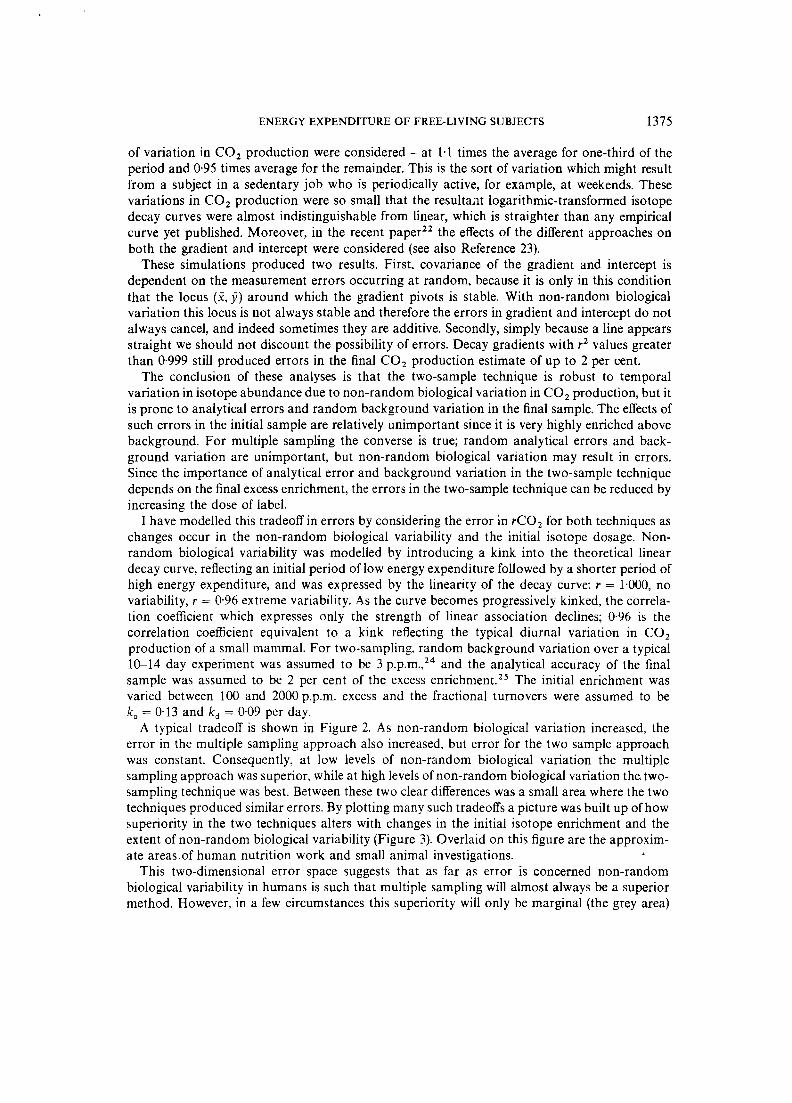
A typical tradeoff is shown in Figure 2. As non-random biological variation increased, the error in the multiple sampling approach also increased, but error for the two sample approach was constant. Consequently, at low levels of non-random biological variation the multiple sampling approach was superior, while at high levels of non-random biological variation the,twosampling technique was best. Between these two clear differences was a small area where the two techniques produced similar errors. By plotting many such tradeoffs a picture was built up of how superiority in the two techniques alters with changes in the initial isotope enrichment and the extent of non-random biological variability (Figure 3). Overlaid on this figure are the approximate areas.of human nutrition work and small animal investigations.
This two-dimensional error space suggests that as far as error is concerned non-random biological variability in humans is such that multiple sampling will almost always be a superior method. However, in a few circumstances this superiority will only be marginal (the grey area)
--1376 J. R. SPEAKMAN
--0- Multiple sampling30 Two-samples (200 ppm) -
... E Iii 10
Two-samples (1500 ppm)
o+-~-.-~,.....~---,-~-.-~----,.---~...,
0.94 0.95 0.96 0.97 0.98 0.99 1.00 -- Biological variation
Figure 2. The effects of non-random biological variability in CO 2 production on errors of the multiple sampling approach and the two-sampling approach, with initial enrichments of 200 and 1500 p.p.m.
2000 eo.
Small animal 0....... studies
C III E 1000 1: (J
i: C III
i E o+---;:==~~~~::, e
0.94 0.95 0.96 0.97 0.98 0.99 1.00
.. biological variability
Figure 3. Two-dimensional error space showing the superiority of the two techniques with changes in the non-random biological variability in CO 2 production and the initial isotopic enrichment. In the space above the curve the twosampling technique is superior, while in the area below the curve the multiple sampling and curve-fitting approach is
better. The grey area represented by the curve indicates no clear superiority
and in yet others the two-sample approach may be better. The choice of technique, especially in the grey area, will almost certainly depend on factors other than error. In laboratories which are set up for automated isotopic analyses each analysis is relatively cheap and the overall costs will be minimized by reducing the dose and using the multiple sampling approach. In contrast, where analyses must be done manually, or for one-off applications, where isotope analyses must be done commercially, the major cost is in the isotopic analysis. It may be cheaper, in these circumstances, to increase the dose and use the two-sample approach. In other words the practical decisions concerning which technique should be used will frequently depend on more than the theoretical arguments concerning errors. In particular cost may be an important consideration. In some situations the lower error with multiple sampling may not be required and in these circumstances the two-sample approach provides a cheaper and more easily performed alternative.

• • • •
• • • • ••
• • • •
1377 ENERGY EXPENDITURE OF FREE-LIVING SUBJECTS
15
10
5
0
•
• •
•
• :. •• •• .. .., .• .. I.
• 1950 1960 1970 1980 1990
Year
Figure 4. Algebraic error (made positive) for all validations of the technique by comparison to indirect calorimetry over the period 1955 to 1988
PARADOX
Over the history of the development of the DLW technique there have been a number of significant advances. Improvements have occurred along the technical front, in terms of the precision and accuracy which we can now expect in gas isotope ratio mass spectrometry. Furthermore we have advanced in terms of our understanding of the behaviour of isotopes within the body and at the interface of the body and environment.
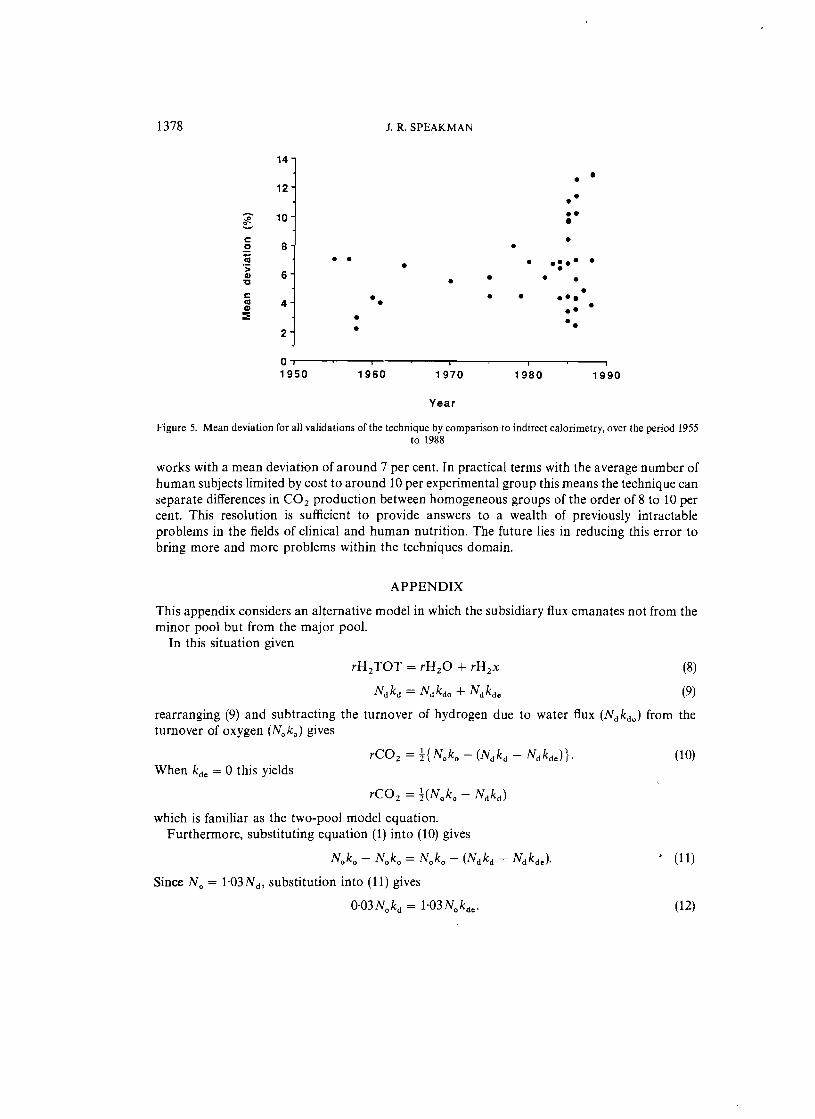
Although the five major assumptions (Table I) identified by Lifson and McCIintock4 were also basically the same assumptions considered in the reviews by Mullen/" and Nagy,"? and indeed in more contemporary reviews,23.28.29 our knowledge about the effects of violating these assumptions are now much clearer, and we have more information available, for example in vivo fractionation factors, on which to base our conclusions and treatment of experimental data. Recently proposed equations for calculating rC0214.19 yield significantly different values l" to the original equation of Lifson and McClintock. 4 The paradox is that despite these technical, empirical and theoretical advances, the mean algebraic error obtained in all the validation studies to date shows no evidence of any decline with time (Figure 4). This could be an artefact of using the algebraic error P which assesses only accuracy. A better measure which involves both accuracy and precision is the mean deviation, yet this too shows no evidence of decline over the past forty years (Figure 5). Mean deviation averages about 7 per cent.
The causes of this lack of improvement are unclear. Roberts'" has indicated the greater ratio of kd/k o in humans and its consequences for error (see also Table II). Human validations comprise a major portion of validations since 1982. However, if small animal studies are considered alone there is also no apparent improvement. The implication is that despite all the recent advances we are still missing something. Since improvements have occurred in the technical arena as well as in the constraints of the framework constructed by Lifson and McCIintock4 the most significant future advances may lie outside this theoretical framework which has dominated our thinking about errors in the technique for almost quarter of a century.
Nevertheless we should look on the positive side. A total of more than 30 validation studies have now been performed in a diverse range of subjects and all have indicated that the technique
• • • •
• • • •
• •
1378 J. R. SPEAKMAN
14
12
;e 10 ••~ • c: •.2 8 • .1;; • • • • ••• •• G) 6 • 'C
•c: •<a 4 • • • • •• •G) ••::E •
2 •
0 1950 1960 1970 1980 1990
Year
Figure 5. Mean deviation for all validations of the technique by comparison to indirect calorimetry, over the period 1955 to 1988
works with a mean deviation of around 7 per cent. In practical terms with the average number of human subjects limited by cost to around 10 per experimental group this means the technique can separate differences in CO 2 production between homogeneous groups of the order of 8 to 10 per cent. This resolution is sufficient to provide answers to a wealth of previously intractable problems in the fields of clinical and human nutrition. The future lies in reducing this error to bring more and more problems within the techniques domain.
APPENDIX
This appendix considers an alternative model in which the subsidiary flux emanates not from the minor pool but from the major pool.
In this situation given
rH 2 TOT = rH20 + rH 2x (8)
Ndkd = Ndk do + Ndk de (9)
rearranging (9) and subtracting the turnover of hydrogen due to water flux (Ndk do) from the turnover of oxygen (Noko) gives
(10) When kd e = 0 this yields
rC0 2 = t(Noko - Ndkd)
which is familiar as the two-pool model equation. Furthermore, substituting equation (1) into (10) gives
Noko - Noko = Noko - (Ndkd - Ndk de)· • (11)
Since No = 1'03Nd, substitution into (11) gives
0·03Nokd = 1·03Nokd•· (12)
1379 ENERGY EXPENDITURE OF FREE-LIVING SUBJECTS
Because
and
equation (12) is satisfied if and only if
rH2x = O·03rH20.
Consequently the conditions in which the one- and two-pool models are satisfied are independent of the source of the subsidiary hydrogen flux.
ACKNOWLEDGEMENTS
I am grateful to the ISCB-10 organizers for their invitation to participate in the mini-symposium on human nutrition. I am also thankful to Sue Roberts and Michael Goran for interesting discussions about the technique, particularly the significance of the kd/ko ratio, and finally to two anonymous referees for their painstaking improvement of the original manuscript.
REFERENCES
1. Lifson, N., Gordon, G. B., Visscher, M. B. and Nier, A. O. 'The fate of utilised molecular oxygen and the source of oxygen of respiratory carbon dioxide: studied with the aid of heavy oxygen', Journal of Biological Chemistry, 180, 803-811 (1949).
2. Day, J. N. E. and Sheel, J. P. 'Oxygen isotopic exchange in animal respiration', Nature, 142,917 (1938). 3. Lifson, N., Gordon, G. B. and McClintock, R. M. 'Measurement of total carbon dioxide production by
means of D 20 IS', Journal of Applied Physiology, 7, 704-710 (1955). 4. Lifson, N. and McClintock, R. M. 'Theory of use of the turnover rates of body water for measuring
energy and material balance', Journal of Theoretical Biology, 12, 46--74 (1966). 5. Nagy, K. A. and Costa, D. P. 'Water flux in animals: analysis of potential errors in the tritiated water
method', American Journal of Physiology, 238, R454-465 (1980). 6. Lefebvre, E. A. 'The use ofD20 lSfor measuring energy metabolism in Columba livia at rest and in flight',
Auk, 81, 403-416 (1964). 7. Mullen, R. K. 'Respiratory metabolism and body water turnover rates of Perognathus formosus in its
natural environment', Comparative Biochemistry and Physiology, 32, 259-265 (1970). 8. Hails, C. J. and Bryant, D. M. 'Reproductive energetics of a free-living bird', Journal of Animal Ecology,
48,471-482 (1979). 9. Nagy, K. A. 'Water and energy budgets of free-living animals: measurement using isotopically labelled
water', in Hadley, N. F. (ed.), Environmental Physiology of Desert Organisms, Dowden, Hutchinson and Ross, Pennsylvania, 1975.
10. Lifson, N., Little, W. S., Levitt, D. G. and Henderson, R. M. 'D 20 lS method for CO 2 output in small mammals and economic feasability in man', Journal of Applied Physiology, 39, 657-664 (1975).
11. Schoeller, D. A. and van Santen, E. 'Measurement of energy expenditure in humans by doubly-labelled water method', Journal of Applied Physiology, 53, 955-959 (1982).
12. Nagy, K. A. 'Field metabolic rate and food requirement scaling in mammals and birds', Ecological monographs, 57, 111-128 (1987).
13. Speakman, J. R. and Racey, P. A. 'Validation of doubly-labelled water technique in insectivorous bats by comparison with indirect calorimetry', Physiological Zoology, 61, 514-526 (1988).
14. Coward, W. A., Prentice, A. M., Murgatroyd, P. R., Davies, H. L., Cole, T. J., Sawyer, M., Goldberg, G. R., Halliday, D. and Macnamara, 1. P. 'Measurement of CO 2 and water production rates in man using 2H, ISO labelled H 20 : comparisons between calorimeter and isotope values', in Van Es (ed.), European Nutrition Report 5, Human Metabolism: physical activity and energy expenditure, measurements in epidemiological research based upon direct and indirect calorimetry, CIP-gegevens Koninklijke Bibliotheek, den Haag, 1985, pp. 126--128.
15. Speakman, J. R. 'Calculation of CO 2production in doubly-labelled water studies', Journal of Theoretical Biology, 126,101-104 (1987).
1380 1. R. SPEAKMAN
16. Cuelbras, J. M. and Moore, F. D. 'Total body water and the exchangable hydrogen in man', American Journal of Physiology, 232, R54-59 (1977).
17. Haggerty, P. 'The effect of isotope sequestration on the performance of the doubly-label1ed water technique for measuring energy expenditure', in Prentice, A. M. (ed.), 'The doubly-label1ed water method: technical recommendations for use in humans', Proceedings of the International dietary energy consultancy group meeting at Cambridge 1988, International Atomic Energy Agency, Vienna, 1990.
18. Klein, P. D., James, W. P. T., Wong, W. W., Irving, C. S., Murgatroyd, P. R., Cabrera, M., Dal1osso, H. M., Klein, E. R. and Nichols, B. L. 'Calorimetric validation of the doubly-label1ed water method for determination of energy expenditure in man', Human Nutrition Clinical Nutrition, 38, 95-106 (1984).
19. Coward, W. A. and Prentice, A. M. 'Isotope method for measurement of carbon dioxide production rate in man', American Journal of Clinical Nutrition, 41, 659-661 (1985).
20. Speakman, J. R. and Racey, P. A. 'The energetics of pregnancy and lactation in brown long-eared bats (Plecotus auritus)', in Fenton, M. 8., Racey, P. A. and Rayner, J. M. V. (eds),Recent Advances in the Study of Bats, Cambridge University Press, Cambridge, 1987.
21. Speakman, J. R. and Racey, P. A. 'Measurement of CO 2production by doubly label1edwater technique', Journal of Applied Physiology, 61(3), 120(H202 (1986).
22. Speakman, J. R. and Racey, P. A. 'Doubly-label1ed water: errors in the evaluation of oxygen isotope turnover due to temporal variation in CO 2 production do not always co-vary with dilution space estimate', Journal of Theoretical Biology, 141, 547-556 (1989).
23. Prentice, A. M. (ed.) 'The doubly-label1ed water method: technical recommendations for use in humans', Proceedings of the International dietary energy consultancy group workshop, Cambridge, September 1988, International Atomic Energy Agency, Vienna, 1990. .
24. Delany, J. P., Schoel1er, D. A., Hoyt, R. W., Askew, E. W. and Sharp, M. A. 'Field use of D2180 to
measure energy expenditure of soldiers at different energy intake', Journal of Applied Physiology, 67, 1922-1929 (1989).
25. Wong, W. W., Lee, L. S. and Klein, P. D. 'Oxygen isotope ratio measurements on carbon dioxide generated by reaction of microliter quantities of biological fluids with guanidine hydrochloride', Analytical Chemistry, 59, 690-693 (1987).
26. Mul1en, R. K. 'The D 2180 method of measuring the energy metabolism of free-living animals', in Gessernan, J. R. (ed.), Ecological Energetics of Homeotherms, Utah University Press, Utah, 1973.
27. Nagy, K. A. 'C02 production in animals: analysis of potential errors in the doubly-label1ed water method', American Journal of Physiology, 238, R466-R473 (1980).
28. Roberts, S. B. 'Use of doubly-label1ed water method for measurement of energy expenditure, total body water, water intake and metabolizable energy intake in humans and smal1animals', Canadian Journal of Physiology and Pharmacology, 67,1190--1198 (1989).
29. Speakman, J. R. and Racey, P. A. 'The doubly-labelled water technique for measurement of energy expenditure in free-living animals', Science Progress (Oxford), 72, 227-237 (1988).
30. Schoeller, D. A., Ravussin, E., Schutz, Y., Acheson, K. 1., Baertschi, P. and Jequier, E. 'Energy expenditure by doubly labelled water: validation and proposed calculation', American Journal of Physiology, 250, R823-R830 (1986).