Preparation of nanostructured ultrathin silver layer
7
Proc. of SPIE Vol. 7766 77660Q- 1 Downloaded from SPIE Digital Library on 04 Oct 2010. Terms of Use: http://spiedl.org/terms Preparation of nanostructured ultrathin silver layer Jiří Bulíř 1 , Michal Novotný 1 , Anna Lynnykova 1 , Ján Lančok 1 , Michal Bodnár 1 , Marek Škereň 2 1 Institute of Physics, Academy of Sciences of the Czech Republic 2 Faculty of Nuclear Sciences and Physical Engineering, Czech Technical University in Prague Abstract Silver is widely used for a fabrication of plasmonic devices due to its unique optical constants. Nanostructured Ag layer can exhibit strong localized surface plasmon resonance, which mainly affects its optical behavior in visible and near infrared spectra. The nanostructure of the Ag layer is mainly influenced during the initial stage of the silver nucleation. Therefore we focused our attention on the study of this stage of the silver growth. The nanostructured ultra-thin silver layers were prepared by means of the magnetron sputtering. The nucleation mode and the resulting nanostructure was controlled by the deposition conditions. The initial stage of the nucleation and the layer growth was studied by means of an optical monitoring, which is based on a principle of spectrophotometric measurement of sample reflectivity. The measured data were fitted to a model of layered structure. The non-continual (Volmer-Weber) mode of the layer nucleation was clearly distinguished in the monitored data. Thus we were able to estimate the point of the non-continual layer coalescence as well as the subsequent evolution of the surface roughness. The prepared nanostructured Ag layers were analyzed by Atomic Force Microscopy (AFM) and Scanning Electron Microscopy (SEM). Optical properties were studied by spectroscopic ellipsometry and spectrophotometry. The aim of this work was to study the formation of nanostructured Ag layer and its correlation to the optical behavior. Keywords: ultra-thin silver layer, growth monitoring, optical properties 1. Introduction A considerable number of metal-dielectric devices uses an ultra-thin silver layers. For instance, the typical optical metal- dielectric devices are transmission induced filters [1],[2] or conductive transparent multilayer structures known as “a transparent metal”, which consists of a multilayer stack of multiple resonators. Due to their mutual coupling resulting in “resonant tunneling”, the light propagates through the structure [3]. The performance of those metal- dielectric optical devices is influenced by a quality of the metal layer and especially, the metal-dielectric interface. A complex research has been carried out in order to understand of metal thin film growth [4], [5]. The growth mode depends mainly on a wetting relation between the deposited material and the substrate. The wetting is determined by relation of the adhesion energy and the free energy of metal in a vacuum. Nobel metals exhibit generally low adhesion energy to most oxides, which is caused by weak chemical bonding. These facts are precondition for Volmer-Weber growth mode, where isolated islands are formed at first. It is rather complicated to reach Stranski-Krastanov growth mode, which is important for obtaining smooth solid thin film. Silver is known to have tendency to non-continuous nucleation characterized by Volmer-Weber growth mode. Nano-structured materials in form of nano-composite, where the metallic nano-particles are uniformly distributed in a dielectric matrix, represents new type of material with unique optical properties, which are quite different from those of the particular components. Metallic nano-clusters show strong absorption bands, which are induced by excitation of the local resonance. Resonant frequency of the local plasmon is usually complex function of the geometry, size, dielectric function of the metallic cluster material and the dielectric function of the surrounding matrix. Granular metallic layers can generate resonance of surface plasmon-polariton. The optical extinction spectra of metallic nano-particles can be well described by theory of Gustav Mie [6]. However, this theory is rather limited to spherical shape of the particles. For qualitative description, it is possible to use a theory of effective media using Maxwell-Garnett theory (MGT) or effective media approximation (EMA). The former treats the composites with asymmetrical structure, where the inclusions of particles are embedded in a host material. This theory is strictly limited to particle size smaller Nanostructured Thin Films III, edited by Raúl J. Martin-Palma, Yi-Jun Jen, Akhlesh Lakhtakia, Proc. of SPIE Vol. 7766, 77660Q · © 2010 SPIE · CCC code: 0277-786X/10/$18 · doi: 10.1117/12.860634
-
Upload
independent -
Category
Documents
-
view
0 -
download
0
Transcript of Preparation of nanostructured ultrathin silver layer

Proc. of SPIE Vol. 7766 77660Q- 1
Downloaded from SPIE Digital Library on 04 Oct 2010. Terms of Use: http://spiedl.org/terms
Preparation of nanostructured ultrathin silver layer
Jiří Bulíř 1, Michal Novotný1, Anna Lynnykova1, Ján Lančok1, Michal Bodnár1, Marek Škereň2
1 Institute of Physics, Academy of Sciences of the Czech Republic
2 Faculty of Nuclear Sciences and Physical Engineering, Czech Technical University in Prague
Abstract Silver is widely used for a fabrication of plasmonic devices due to its unique optical constants. Nanostructured Ag layer can exhibit strong localized surface plasmon resonance, which mainly affects its optical behavior in visible and near infrared spectra. The nanostructure of the Ag layer is mainly influenced during the initial stage of the silver nucleation. Therefore we focused our attention on the study of this stage of the silver growth. The nanostructured ultra-thin silver layers were prepared by means of the magnetron sputtering. The nucleation mode and the resulting nanostructure was controlled by the deposition conditions. The initial stage of the nucleation and the layer growth was studied by means of an optical monitoring, which is based on a principle of spectrophotometric measurement of sample reflectivity. The measured data were fitted to a model of layered structure. The non-continual (Volmer-Weber) mode of the layer nucleation was clearly distinguished in the monitored data. Thus we were able to estimate the point of the non-continual layer coalescence as well as the subsequent evolution of the surface roughness. The prepared nanostructured Ag layers were analyzed by Atomic Force Microscopy (AFM) and Scanning Electron Microscopy (SEM). Optical properties were studied by spectroscopic ellipsometry and spectrophotometry.
The aim of this work was to study the formation of nanostructured Ag layer and its correlation to the optical behavior.
Keywords: ultra-thin silver layer, growth monitoring, optical properties
1. Introduction A considerable number of metal-dielectric devices uses an ultra-thin silver layers. For instance, the typical optical metal-dielectric devices are transmission induced filters [1],[2] or conductive transparent multilayer structures known as “a transparent metal”, which consists of a multilayer stack of multiple resonators. Due to their mutual coupling resulting in “resonant tunneling”, the light propagates through the structure [3]. The performance of those metal-dielectric optical devices is influenced by a quality of the metal layer and especially, the metal-dielectric interface.
A complex research has been carried out in order to understand of metal thin film growth [4], [5]. The growth mode depends mainly on a wetting relation between the deposited material and the substrate. The wetting is determined by relation of the adhesion energy and the free energy of metal in a vacuum. Nobel metals exhibit generally low adhesion energy to most oxides, which is caused by weak chemical bonding. These facts are precondition for Volmer-Weber growth mode, where isolated islands are formed at first. It is rather complicated to reach Stranski-Krastanov growth mode, which is important for obtaining smooth solid thin film. Silver is known to have tendency to non-continuous nucleation characterized by Volmer-Weber growth mode.
Nano-structured materials in form of nano-composite, where the metallic nano-particles are uniformly distributed in a dielectric matrix, represents new type of material with unique optical properties, which are quite different from those of the particular components. Metallic nano-clusters show strong absorption bands, which are induced by excitation of the local resonance. Resonant frequency of the local plasmon is usually complex function of the geometry, size, dielectric function of the metallic cluster material and the dielectric function of the surrounding matrix.
Granular metallic layers can generate resonance of surface plasmon-polariton. The optical extinction spectra of metallic nano-particles can be well described by theory of Gustav Mie [6]. However, this theory is rather limited to spherical shape of the particles. For qualitative description, it is possible to use a theory of effective media using Maxwell-Garnett theory (MGT) or effective media approximation (EMA). The former treats the composites with asymmetrical structure, where the inclusions of particles are embedded in a host material. This theory is strictly limited to particle size smaller
Nanostructured Thin Films III, edited by Raúl J. Martin-Palma, Yi-Jun Jen, Akhlesh Lakhtakia, Proc. of SPIE Vol. 7766, 77660Q · © 2010 SPIE · CCC code: 0277-786X/10/$18 · doi: 10.1117/12.860634
Proc. of SPIE Vol. 7766 77660Q- 2
Downloaded from SPIE Digital Library on 04 Oct 2010. Terms of Use: http://spiedl.org/terms
than 0.1 of wavelength, but, it can be generalized for arbitrary (non-spherical) shape using dynamical MGT [7, 8]. The latter treats the symmetrical microstructures, where the two components are randomly distributed in the structure.
2. Experimental details The silver ultra-thin layers were deposited in vacuum chamber by means of magnetron sputtering of silver target. The magnetron target was connected to radiofrequency (13.56 MHz) generator. The RF. power was set to 50 W. The distance from target to substrate was 100 mm. The vacuum chamber was evacuated to a ultimate pressure of 2·10-6 Pa before each experiment. The working pressure was set to 3 Pa by adjusting the Ar gas flow. The silver target surface was cleaned by a presputtering process for 60 seconds. The silver layers were grown on two types of fused silica substrates with dimensions of 14x14 mm2. For optical transmission measurement we used a substrate polished on both sides. The optical reflectivity measurement was performed on a substrate, which has the second side tarnished in order to avoid the unwanted reflection from the back-side of the substrate. Target to substrate distance was 90 mm.
The vacuum chamber is equipped with two oblique flanges with two fused silica windows. This arrangement allows in-situ measurement of reflectivity of the substrate surface. Thus the growth of the ultra-thin layer can be real-time monitored. The optical reflectivity spectra were collected during the deposition process with the sampling rate of 10 Hz. The optical spectra were measured by a spectrometer USB4000, Ocean Optics in the range from 200 to 890 nm. The incident angle of the light beam was 76.5 deg.
The electrical resistance of the layer was measured during the deposition process by means of a specialized apparatus. Two parallel silver electrodes were predeposited on fused silica substrate. The width of the uncoated space between electrodes was 10 mm. The electrodes were contacted to fast precision multimeter Agilent 34410A by 4-wires-method in order to minimize the influence of contacts to the measurement precision.
The ellipsometric measurements were performed by means of a J. A. Woollam spectroscopic ellipsometer operating in rotating analyzer mode. The main ellipsometric angles ψ and Δ were measured in a spectral range from 250 to 800 nm at incidence angles of 60 and 70 degrees. The samples were analyzed by fitting the measured data to a parameterized model consisting of parallel layers on a semi-infinite substrate. We assumed smooth interfaces and homogeneous optical constants in our model in order to simplify the model and minimize number of fitted parameters. The superficial roughness was considered as a top layer with optical constants determined by effective media approximation theory (a mixture of voids and an underlying material).
3. Results and Discussion We prepared a series samples differentiating each to other by the layer thickness, which was given by different deposition time. The deposition rate of the silver growth was estimated from thickness of Ag layer deposited 84 seconds. The thickness was estimated by simulation of transmission spectra of the Ag layer possessing the expected thickness around 50 nm. At such a thickness the silver layer is still transparent, nevertheless, the thickness is high enough to minimize the fitting error due to surface roughness. The Ag layer thickness of this sample was estimated 54 nm giving a deposition rate 0.64 nm·s-1.
The silver possess typically low wetting to oxides substrates. Therefore it has a tendency to Volmer – Weber growth mode which is characterized by a non-continual layer growth and islands formation. Main stages of the silver layer growth are shown at Scanning Electron Microscopy photographs on Figure 2. The shown layers #5, #6 and #7 were prepared with deposition time of a) 11.2 s, b) 12.8 s and c) 16.8 s, respectively. Assuming a constant deposition rate, we estimated mass thickness of those samples #5, #6 and #7 being 7.2, 8.3 and 10.8 nm, respectively. The Figure2.a) demonstrates a growth stage, which is characterized by non-continuous islands formation and coalescence phenomena of the neighbor particles.

Proc. of SPIE Vol. 7766 77660Q- 3
Downloaded from SPIE Digital Library on 04 Oct 2010. Terms of Use: http://spiedl.org/terms
Figure 1. Transmission spectrum of the Ag layer on glass substrate. The dashed curve shows a simulated transmission spectra for ideal silver layer with thickness of 54 nm.
The electrical resistance is beyond the measurable limit of the instrument (>1G). The reflectivity spectrum of this sample is shown on a Figure 3a). Reflectivity curve of the ideal continuous silver layer with the corresponding mass thickness is shown in the same graph for the comparison. The optical constants of Ag from literature [9] were used for this simulation. There is an obvious discrepancy between those two curves in the graph that is most pronounced in a visible and a near infrared region. This optical behavior is caused by the localized plasmon resonance in the silver nano-particles. The growth stage beyond the percolation threshold is represented by a sample #6, which is shown on a Figure 2b). The morphology of this layer is still highly disordered, but the electrical resistance decreased with respect to previous sample by several orders of magnitude reaching 142 . The reflectivity spectrum of this sample shows significant localized plasmon resonance effect (see Figure 3b). The SEM image at Figure2.c) show a nearly continuous layer with holes remaining in the layer. The electrical resistance of this sample is 35 . The reflectivity spectrum of this sample shows nearly similar behavior with the simulation as it is shown in the Figure3c. As a result of this experiment we can conclude that comparative analysis of the sample reflectivity can indicate the morphology of the silver layer. Thus we can indicate the growth mode of the deposition process. Therefore it would be useful to use a real-time monitoring of the reflectivity during the deposition process for an indication of the growth mode. The SEM photographs demonstrate that the morphology of the Ag ultra-thin layers significantly changes during a few seconds of the deposition process. The precise control of the growth would be difficult without an appropriate monitoring.
Figure 2. SEM photograph of three different ultrathin silver layer grown on fused silica substrate. The micrographs represent different stages of the growth: a) 11.2 s, b) 12.8 s, c) 16.8 s.
200 400 600 800 1000 1200
0
10
20
30
40
50
Tran
smis
sion
(%)
Wavelength (nm)
experimental data simulation
a) b) c)

Proc. of SPIE Vol. 7766 77660Q- 4
Downloaded from SPIE Digital Library on 04 Oct 2010. Terms of Use: http://spiedl.org/terms
Figure 3. Reflectivity spectra of three different ultrathin silver layer grown on fused silica substrate. The reflectivity was measured at near-to-normal angle of incidence. The samples were prepared at different stages of the growth: a) 11.2 s, b) 12.8 s, c) 16.8 s. The red curve shows a simulation of ideal continuous silver layer with the thickness corresponding to mass thickness of the experimentally prepared layer.
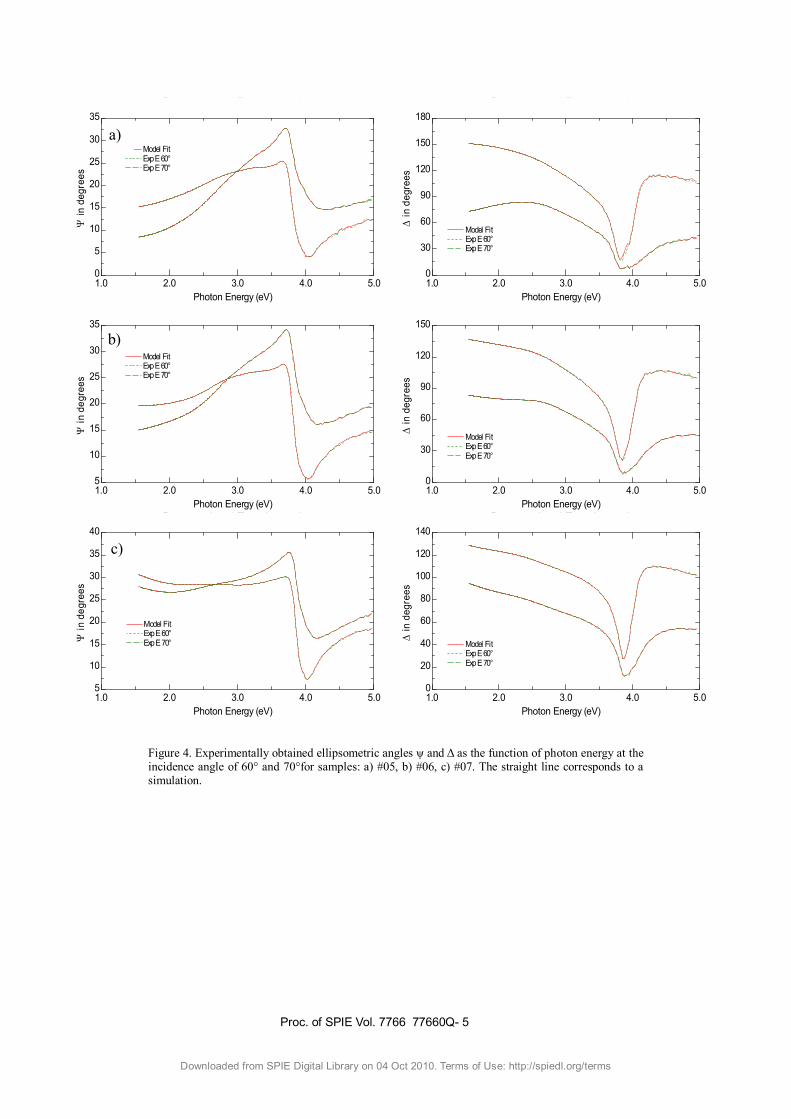
The optical properties of prepared samples were analyzed by spectral ellipsometry measurement in the spectral range from 250 to 800 nm, at two incidence angles of 60° and 70°. The graph of ellipsometric angles ψ and Δ as function of photon energy is shown on Figure 4. These data were fitted using a model of layered structure fused silica/silver layer/air ambient, where the dispersion of the silver layer was parametrized using a model of several Cody-Lorenz oscillators. The roughness of the sample #7 was included in the model as a top layer with optical constants determined by effective media approximation theory. Simulation curve fits well the measured data of ψ and Δ of all the samples as shown on Figure 4. The fitting procedure gave thickness values of 9.2 nm for the #5 sample, 11.6nm for the #6 and 10.6 nm plus 3.6 nm of roughness for the sample #7. These thickness values are higher than those of estimated effective mass thickness; however, this result is consistent with fact that mass thickness describes a solid silver layer with high packing density, whereas the studied ultra-thin silver films exhibit certain porosity.
The resulting index of refraction and extinction coefficient of the ultra-thin silver films is shown in the Figure 5. The optical constants of the bulk silver (obtained from literature [9]) are plotted in the same graph for the comparison. It can be seen, that the sample #07 exhibits the optical constants, which are nearest to those of the bulk silver. The non-continuous silver layers (samples #5 and #6) exhibit a gradual increase of the refractive index for electron energy below 3 eV. In the same spectral range, the extinction coefficient decrease with respect to bulk silver data.
In the discussion above, we have shown that the optical monitoring can be used for indication of the growth mode. The growth mode can be influenced by wetting properties of silver to substrate. This behavior is dependent on material of the substrate. In the following experiment, we assume that the silver possess good wetting properties to its own oxides. The silver oxides are typically unstable and they easily decompose at elevated temperature.
In the comparative experiment, we deposited two ultra-thin silver layers on fused silica substrate. The growth was monitored by real-time measurement of the coating's reflectivity during the deposition process. The deposition time was 14.6 s. The Figure 6a shows an evolution of the measured reflectivity spectra during the deposition process. The dotted curves exhibit a simulation of the reflectivity of ideal continuous silver layer. It is obvious that the discrepancy between the measured and the simulated curves indicates non-continuous silver layer growth typical for Volmer-Weber growth mode. This observation is confirmed by the SEM image of the completed silver layer that is shown on a Figure 6b.
The second experiment was accomplished on a fused silica substrate. An ultra-thin silver oxide layer (about 2 nm) was pre-deposited on the substrate before the silver deposition experiment. The silver layer was deposited over the AgOx interlayer. The monitored reflectivity spectra are shown on a Figure 7a. The simulation of the continuous Ag layer fits well the measured spectra indicating the continuous silver layer growth. The SEM image on the Fig. 7b confirms this observation showing a continual silver layer. The roughness of this layer was estimated by Atomic Force Microscopy being 1.8 nm (RMS).
200 300 400 500 600 700 800 9000
10
20
30
40
50
60 Measurement Simulation (cont. layer)
Ref
lect
ivity
(%)
Wavelength (nm)200 300 400 500 600 700 800 9000
10
20
30
40
50
60 Measurement Simulation (cont. layer)
Ref
lect
ivity
(%
)
Wavelength (nm)200 300 400 500 600 700 800 9000
10
20
30
40
50
60
Ref
lect
ivity
(%)
Wavelength (nm)
Measurement Simulation (cont. layer)
Proc. of SPIE Vol. 7766 77660Q- 5
Downloaded from SPIE Digital Library on 04 Oct 2010. Terms of Use: http://spiedl.org/terms
Figure 4. Experimentally obtained ellipsometric angles ψ and Δ as the function of photon energy at the incidence angle of 60° and 70°for samples: a) #05, b) #06, c) #07. The straight line corresponds to a simulation.
Generated and Experimental
Photon Energy (eV)1.0 2.0 3.0 4.0 5.0
in
deg
rees
0
5
10
15
20
25
30
35
Model Fit Exp E 60°Exp E 70°
a)
Generated and Experimental
Photon Energy (eV)1.0 2.0 3.0 4.0 5.0
in
deg
rees
0
30
60
90
120
150
180
Model Fit Exp E 60°Exp E 70°
Generated and Experimental
Photon Energy (eV)1.0 2.0 3.0 4.0 5.0
in
deg
rees
5
10
15
20
25
30
35
Model Fit Exp E 60°Exp E 70°
b)
Generated and Experimental
Photon Energy (eV)1.0 2.0 3.0 4.0 5.0
in
deg
rees
0
30
60
90
120
150
Model Fit Exp E 60°Exp E 70°
Generated and Experimental
Photon Energy (eV)1.0 2.0 3.0 4.0 5.0
in
deg
rees
5
10
15
20
25
30
35
40
Model Fit Exp E 60°Exp E 70°
Generated and Experimental
Photon Energy (eV)1.0 2.0 3.0 4.0 5.0
in
deg
rees
0
20
40
60
80
100
120
140
Model Fit Exp E 60°Exp E 70°
c)

Proc. of SPIE Vol. 7766 77660Q- 6
Downloaded from SPIE Digital Library on 04 Oct 2010. Terms of Use: http://spiedl.org/terms
Figure 5. Optical constants of ultra-thin Ag layers prepared with deposition time of 11.2, 12.8, and 16.8 seconds, respectively.
Figure 6. a) Real-time monitoring of reflectivity spectra during deposition process of the ultra-thin silver layer. b) The SEM image of the completed Ag layer.
Figure 7. a) Real-time monitoring of reflectivity spectra during deposition process of the ultra-thin silver layer. b) The SEM image of the completed Ag layer. The growth mode was influenced by AgOx coating prepared on the substrate before the deposition.
1.5 2.0 2.5 3.0 3.5 4.0 4.5 5.00.0
0.5
1.0
1.5
2.0
2.5
3.0
inde
x of
ref
ract
ion,
n
Photon energy (eV)
n #05 n #06 n #07 n Ag database
n
0
1
2
3
4
Ext
inct
ion
coef
ficie
nt, k
k #05 k #06 k #07 k Ag database
k
400 500 600 700 80025
30
35
40
45
50
55
60
65 Experimental data Simulation
Ref
lect
ivity
(%
)
Wavelength (nm)
Dep
ositi
on ti
me
400 500 600 700 80025
30
35
40
45
50
55
60
Ref
lect
ivity
(%
)
Wavelength (nm)
experimental data simulation (continuous layer)
Dep
ositi
on ti
me
(s)

Proc. of SPIE Vol. 7766 77660Q- 7
Downloaded from SPIE Digital Library on 04 Oct 2010. Terms of Use: http://spiedl.org/terms
4. Conclusion In this work we approved that the optical monitoring is a valuable tool to distinguish the growth mode in the real-time during the deposition process. The percolation threshold can be determined by electrical resistance monitoring. The continuous silver layer growth can be indicated by monitoring of the reflectivity spectra during the deposition. The growth mode of the silver can be influenced by pre-deposited AgOx inter-layer. Thus we can prepare a continuous ultra-thin silver layer as thin as about 10 nm.
5. Acknowledgment This research was supported by Grant Agency of Czech Academy of Sciences, projects: IAA100100718, AVOZ 10100522 and KAN 400100653, and Grant Agency of the Czech Republic, project: GACR 202/09/P324.
6. References [1] Piegari, A., Bulíř, J., "Variable narrow-band transmission filters with wide rejection band for spektrometry," Applied Optics 45, 16 (2006)
[2] Piegari, A., Bulíř, J., Krasilnikova Sytchkova, A., “Variable narrow-band transmission filters for spectrometry from space. 2. Fabrication process,” Applied Optics 47, C151 (2008)
[3] Sarto, F., Sarto, M.S., Larciprete, M.C., Sibilia, C., “Transparent films for electromagnetic shielding of plastics,“ Rev.Adv.Mater.Sci. 5, 329-336 (2003)
[4] Campbell, C.T., “Ultrathin metal films and particles on oxide surfaces: structural, electronic and chemisorptive properties,“ Surface Science Reports 27, 1 (1997)
[5] Doraiswamy, N., Jayaram, G., Marks, L.D., “Unusual island structures in Ag growth on Si(100)-(2x1),“ Phys. Rev. B 51, 10167 (1995)
[6] Kreibich, U., Vollmer, M., “Optical properties of metal clusters,“ Springer-Verlag Berlin Heidelberg, 1995
[7] Mandal, S.K., Roy, R.K., Pal, A.K., “Effect of particle shape distribution on the surface plasmon resonance of Ag-SiO2 nanocomposite thin films,” J.Phys.D: Appl. Phys. 36, 261-265 (2003)
[8] Wu,Y.M., Gao,L., Li, Z.Y., “The influence of particle shape on nonlinear optical properties of metal-dielectric composites,” Phys. Stat. Sol. B 220, 997 (2000)
[9] Palik, E.D., Handbook of Optical Constants of Solids I, Academic press, New York, 1985.