Preparation and In Vivo Evaluation of a Lidocaine Self ... - MDPI
18
pharmaceutics Article Preparation and In Vivo Evaluation of a Lidocaine Self-Nanoemulsifying Ointment with Glycerol Monostearate for Local Delivery Ji-Hyun Kang 1 , Kwang-Hwi Yoo 1 , Hyo-Young Park 2 , Seung-Min Hyun 2 , Sang-Duk Han 2 , Dong-Wook Kim 3, * and Chun-Woong Park 1, * Citation: Kang, J.-H.; Yoo, K.-H.; Park, H.-Y.; Hyun, S.-M.; Han, S.-D.; Kim, D.-W.; Park, C.-W. Preparation and In Vivo Evaluation of a Lidocaine Self-Nanoemulsifying Ointment with Glycerol Monostearate for Local Delivery. Pharmaceutics 2021, 13, 1468. https://doi.org/10.3390/ pharmaceutics13091468 Academic Editors: Eneida de Paula and Lígia N. M. Ribeiro Received: 14 August 2021 Accepted: 10 September 2021 Published: 14 September 2021 Corrected: 10 January 2022 Publisher’s Note: MDPI stays neutral with regard to jurisdictional claims in published maps and institutional affil- iations. Copyright: © 2021 by the authors. Licensee MDPI, Basel, Switzerland. This article is an open access article distributed under the terms and conditions of the Creative Commons Attribution (CC BY) license (https:// creativecommons.org/licenses/by/ 4.0/). 1 College of Pharmacy, Chungbuk National University, Cheongju 28160, Korea; [email protected] (J.-H.K.); [email protected] (K.-H.Y.) 2 DONG-A Pharm. Co., Ltd., Yongin 17073, Korea; [email protected] (H.-Y.P.); [email protected] (S.-M.H.); [email protected] (S.-D.H.) 3 Department of Pharmaceutical Engineering, Cheongju University, Cheongju 28503, Korea * Correspondence: [email protected] (D.-W.K.);[email protected] (C.-W.P.); Tel.: +82-43-229-7984 (D.-W.K.); +82-43-261-3330 (C.-W.P.); Fax: +82-43-229-8577 (D.-W.K.); +82-43-268-2732 (C.-W.P.) Abstract: Lidocaine, a commonly used local anesthetic, has recently been developed into a number of ointment products to treat hemorrhoids. This study examined its efficient delivery to the dermis through the pharmaceutical improvement of hemorrhoid treatment ointments. We attempted to increase the amount of skin deposition of lidocaine by forming a nanoemulsion through the self- nanoemulsifying effect that occurs when glycerol monostearate (GMS) is saturated with water. Using Raman mapping, the depth of penetration of lidocaine was visualized and confirmed, and the local anesthetic effect was evaluated via an in vivo tail-flick test. Evaluation of the physicochemical properties confirmed that lidocaine was amorphous and evenly dispersed in the ointment. The in vitro dissolution test confirmed that the nanoemulsifying effect of GMS accelerated the release of the drug from the ointment. At a specific concentration of GMS, lidocaine penetrated deeper into the dermis; the in vitro permeation test showed similar results. When compared with reference product A in the tail-flick test, the L5 and L6 compounds containing GMS had a significantly higher anesthetic effect. Altogether, the self-nanoemulsifying effect of GMS accelerated the release of lidocaine from the ointment. The compound with 5% GMS, the lowest concentration that saturated the dermis, was deemed most appropriate. Keywords: hemorrhoids; local anesthetic ointment; lidocaine; glycerol monostearate; self-nanoemulsification 1. Introduction Hemorrhoid disease is the third leading outpatient gastrointestinal diagnosis, ac- counting for 3.3 million office and emergency department visits in the United States [1]. The self-reported incidence of hemorrhoids in the United States is 10 million per year, corresponding to 4.4% of the population [2–4]. In addition, although rarely serious, hemor- rhoids often have a significantly negative impact on the quality of life [5]. Optimal pain control is required, particularly when patients are treated in an outpatient surgery setting. One important facet of the management of post-hemorrhoidectomy pain is the application of a multimodal pain control strategy [6–8]. The procedure-specific post-operative pain management (PROSPECT) working group has released Grade A recommendations for pain management after hemorrhoid surgery, including beyond-conventional oral analgesics, oral diosmin, metronidazole, laxatives, local application of lidocaine, glyceryl trinitrate, cholestyramine ointments, and infiltration with long-acting local anesthetics [9,10]. Lidocaine is a widely used local anesthetic that relieves pain, burning, and itching caused by hemorrhoids [11,12]. Specifically, lidocaine produces analgesia by blocking Pharmaceutics 2021, 13, 1468. https://doi.org/10.3390/pharmaceutics13091468 https://www.mdpi.com/journal/pharmaceutics
-
Upload
khangminh22 -
Category
Documents
-
view
3 -
download
0
Transcript of Preparation and In Vivo Evaluation of a Lidocaine Self ... - MDPI
pharmaceutics
Article
Preparation and In Vivo Evaluation of a LidocaineSelf-Nanoemulsifying Ointment with Glycerol Monostearatefor Local Delivery
Ji-Hyun Kang 1 , Kwang-Hwi Yoo 1, Hyo-Young Park 2, Seung-Min Hyun 2, Sang-Duk Han 2, Dong-Wook Kim 3,*and Chun-Woong Park 1,*
�����������������
Citation: Kang, J.-H.; Yoo, K.-H.;
Park, H.-Y.; Hyun, S.-M.; Han, S.-D.;
Kim, D.-W.; Park, C.-W. Preparation
and In Vivo Evaluation of a Lidocaine
Self-Nanoemulsifying Ointment with
Glycerol Monostearate for Local
Delivery. Pharmaceutics 2021, 13, 1468.
https://doi.org/10.3390/
pharmaceutics13091468
Academic Editors: Eneida de Paula
and Lígia N. M. Ribeiro
Received: 14 August 2021
Accepted: 10 September 2021
Published: 14 September 2021
Corrected: 10 January 2022
Publisher’s Note: MDPI stays neutral
with regard to jurisdictional claims in
published maps and institutional affil-
iations.
Copyright: © 2021 by the authors.
Licensee MDPI, Basel, Switzerland.
This article is an open access article
distributed under the terms and
conditions of the Creative Commons
Attribution (CC BY) license (https://
creativecommons.org/licenses/by/
4.0/).
1 College of Pharmacy, Chungbuk National University, Cheongju 28160, Korea; [email protected] (J.-H.K.);[email protected] (K.-H.Y.)
2 DONG-A Pharm. Co., Ltd., Yongin 17073, Korea; [email protected] (H.-Y.P.);[email protected] (S.-M.H.); [email protected] (S.-D.H.)
3 Department of Pharmaceutical Engineering, Cheongju University, Cheongju 28503, Korea* Correspondence: [email protected] (D.-W.K.); [email protected] (C.-W.P.);
Tel.: +82-43-229-7984 (D.-W.K.); +82-43-261-3330 (C.-W.P.); Fax: +82-43-229-8577 (D.-W.K.);+82-43-268-2732 (C.-W.P.)
Abstract: Lidocaine, a commonly used local anesthetic, has recently been developed into a numberof ointment products to treat hemorrhoids. This study examined its efficient delivery to the dermisthrough the pharmaceutical improvement of hemorrhoid treatment ointments. We attempted toincrease the amount of skin deposition of lidocaine by forming a nanoemulsion through the self-nanoemulsifying effect that occurs when glycerol monostearate (GMS) is saturated with water. UsingRaman mapping, the depth of penetration of lidocaine was visualized and confirmed, and thelocal anesthetic effect was evaluated via an in vivo tail-flick test. Evaluation of the physicochemicalproperties confirmed that lidocaine was amorphous and evenly dispersed in the ointment. Thein vitro dissolution test confirmed that the nanoemulsifying effect of GMS accelerated the release ofthe drug from the ointment. At a specific concentration of GMS, lidocaine penetrated deeper into thedermis; the in vitro permeation test showed similar results. When compared with reference productA in the tail-flick test, the L5 and L6 compounds containing GMS had a significantly higher anestheticeffect. Altogether, the self-nanoemulsifying effect of GMS accelerated the release of lidocaine fromthe ointment. The compound with 5% GMS, the lowest concentration that saturated the dermis, wasdeemed most appropriate.
Keywords: hemorrhoids; local anesthetic ointment; lidocaine; glycerol monostearate; self-nanoemulsification
1. Introduction
Hemorrhoid disease is the third leading outpatient gastrointestinal diagnosis, ac-counting for 3.3 million office and emergency department visits in the United States [1].The self-reported incidence of hemorrhoids in the United States is 10 million per year,corresponding to 4.4% of the population [2–4]. In addition, although rarely serious, hemor-rhoids often have a significantly negative impact on the quality of life [5]. Optimal paincontrol is required, particularly when patients are treated in an outpatient surgery setting.One important facet of the management of post-hemorrhoidectomy pain is the applicationof a multimodal pain control strategy [6–8]. The procedure-specific post-operative painmanagement (PROSPECT) working group has released Grade A recommendations for painmanagement after hemorrhoid surgery, including beyond-conventional oral analgesics,oral diosmin, metronidazole, laxatives, local application of lidocaine, glyceryl trinitrate,cholestyramine ointments, and infiltration with long-acting local anesthetics [9,10].
Lidocaine is a widely used local anesthetic that relieves pain, burning, and itchingcaused by hemorrhoids [11,12]. Specifically, lidocaine produces analgesia by blocking
Pharmaceutics 2021, 13, 1468. https://doi.org/10.3390/pharmaceutics13091468 https://www.mdpi.com/journal/pharmaceutics
Pharmaceutics 2021, 13, 1468 2 of 18
voltage-gated sodium channels, which are responsible for the propagation of action po-tentials [7,13]. This molecule is characterized by the onset of its surface anesthetic actionwithin a few minutes, providing rapid relief from pain and itching [13]. When appliedlocally, lidocaine needs to permeate through the skin to act as an anesthetic or analgesic.This outer layer of skin is made up of keratinized, stratified squamous epithelial cells thatform a permeability barrier that prevents the movement of water [14]. Recently, lidocainehas been applied to various topical delivery dosage forms, such as microneedles anddepots [15,16]. However, these dosage forms are difficult to use for hemorrhoids. It hasbeen proposed that local dosage compounds take up water from sweat or trans-epidermalwater loss, then form a self-emulsion.
Local delivery can be defined as the application of a drug-containing formulationto the skin in order to directly treat cutaneous disorders, such as acne, or the cutaneousmanifestations of a general disease, such as hemorrhoids [17]. Local drug delivery offersadvantages such as ease of delivery, a cooperative patient, increased compliance, and avoid-ance of first-pass metabolism [15,18]. Local anesthetics have always been of considerableclinical benefit in reducing cutaneous pain associated with various medical procedures.The stratum corneum layer of the epidermis is the main hurdle, and penetration through itis the rate-limiting step in the percutaneous absorption of local anesthetic drugs. As thesensory nerve endings responsible for pain sensation are mainly present in the dermis, localanesthetics should aim to penetrate this layer during local administration [19]. New drugdelivery technologies and penetration enhancers may help avoid some of these issues [20].An alternative delivery strategy used to increase the penetration of local anesthetics isthe incorporation of the drug into innovative colloidal carrier delivery systems, such asmicroemulsions [21]. An emulsion is a system that contains water and/or oil nanodomainscoexisting in thermodynamic equilibrium, owing to the presence of a surfactant film at theoil/water interface [22].
The use of fatty acids in local treatments enhances skin permeability, mainly due todisturbance of the stratum corneum [23–25]. More specifically, fatty acids have been foundto increase the fluidic movement of surface lipid structures, thereby decreasing the phasetransition temperatures of lipid structure [26,27]. Fatty acids are also used as emulsifiersin pharmaceutical and cosmetic products [28]. Lipid glycerol monostearate (GMS) iscomposed of a single fatty acid chain attached to a glycerol backbone [29]. GMS moleculesself-assemble in water and oil into several types of mesophases, and the polymorphicand mesomorphic properties of GMS can affect the behavior of emulsion systems [30,31].The lamellar structure of GMS is similar to the structure of the human stratum corneum;therefore, the hydrated lamellar phase could significantly increase the water content ofthe stratum corneum [32,33]. There is much evidence that hydration induces a significantincrease in drug permeability [34–36]. The concept of self-emulsifying drug deliverysystems (SEDDSs) was pioneered in the 1960s, when components of poor aqueous solubilitywere incorporated into mixtures of lipophilic and hydrophilic excipients to enhance thesolubility of lipophilic substances [37]. Recently, research has been conducted on applyingSEDDS to the skin [38–40]. It has been proposed that local dosage compounds take upwater from sweat or trans-epidermal water loss, then form a self-emulsion [41].
This study aimed to improve lidocaine ointments to relieve hemorrhoid pain usinga petrolatum base [42,43]. Although the petrolatum is effective in relieving itching fromhemorrhoids, it may not be ideal as a carrier, due to slow drug release [44]. To overcomethe disadvantages of petrolatum base ointment, we prepared the ointment through self-nanoemulsion with GMS, in order to improve its efficacy. After producing ointments withdifferent proportions of GMS, the physicochemical properties were evaluated, and the effectof GMS on permeability was studied through ex vivo permeability tests. In addition, wevisualized the improved penetration through ex vivo experiments using Raman mapping.Finally, we performed an in vivo tail-flick test to confirm the local anesthetic effect oflidocaine ointments.
Pharmaceutics 2021, 13, 1468 3 of 18
2. Materials and Methods2.1. Materials
The lidocaine base was a gift from DONG-A Pharm Co., Ltd. (Seoul, Korea). GMSwas obtained from Gattefosse Corporation (Lyon, France). Petrolatum was purchased fromWonpoong Pharm Co., Ltd. (Seoul, Korea). Medium-chain triglyceride oil (MCT oil) wasobtained from KLK OLEO (Klang, Selangor, Malaysia). Other excipients were suppliedby DONG-A Pharm Co., Ltd. (Seoul, Korea). Reference Product A (Ref. A), Prepain®
ointment, was obtained from Ildong Pharm. Co., Ltd. (Seoul, Korea). Water was purifiedby filtration in the laboratory. High-performance liquid chromatography (HPLC)-gradesolvents were used for analysis. HPLC-grade ethanol and acetonitrile were purchased fromHoneywell Burdick & Jackson (Muskegon, MI, USA). Sprague Dawley® rats (SD rats) andInstitute of Cancer Research mice (ICR mice) were purchased from Samtako Corporation(Osan, Korea).
2.2. Methods2.2.1. Preparation and Rheological Characterization of Lidocaine Ointment
The ointments containing lidocaine were prepared using a fusion method [45,46]. Eachoil excipient, including petrolatum, MCT oil, GMS, and vitamin E-acetate, was first meltedin a water bath at 70 ◦C. Active pharmaceutical ingredients such as lidocaine, allantoin,prednisolone acetate, and dl-methylephedrine hydrochloride were then gradually added tothe molten material and then mixed at 6000 rpm and 70 ◦C for 5 min using a homogenizer(Homogenizing mixer Mark II model 2.5, Primix Corp., Tokyo, Japan). The mixture wascooled to 20 ◦C under constant stirring.
The composition of each ointment is listed in Table 1. L1, L2, and L3 are petrolatum-based ointments containing 0%, 5%, and 10% of GMS, respectively. The mixtures werein vitro research formulations containing lidocaine alone as an active pharmaceuticalingredient. Formulations L4 (Hemo ointment, Dong-A Pharm., Co., Ltd., Seoul, Korea), L5(ChioMAX ointment, Dong-A Pharm., Co., Ltd., Seoul, Korea), and L6 were prepared forin vivo testing.
Table 1. Formulation and rheological characterization of lidocaine ointments.
Excipient L1 L2 L3 L4 L5 L6
Petrolatum 95.00 91.00 86.00 91.95 86.45 81.45MCT oil 1.00 1.00 1.00 1.00 1.00 1.00
Glycerol monostearate - 5.00 10.00 - 5.00 10.00Vitamin E-acetate - - - 3.00 3.00 3.00
Lidocaine base 3.00 3.00 3.00 3.00 3.00 3.00Allantoin - - - 1.00 1.00 1.00
Prednisolone acetate - - - 0.05 0.05 0.05dl-Methylephedrine HCl - - - - 0.5 0.5
pH 8.4 8.4 8.5 8.5 8.5 8.5Viscosity (×103 cP) - - - 23.5 ± 0.5 41.9 ± 0.8 95.2 ± 0.9
Minimum extrusion force (N) - - - 19.5 ± 0.2 25.2 ± 0.8 54.9 ± 0.9
Abbreviations: MCT, Medium-chain triglyceride, HCl, hydrochloride.
The viscosity test was performed in an RV-7 viscometer (DV-III Ultra RV, AMETEKBrookfield Inc., Middleboro, MA, USA) at 25 ◦C and 50 rpm for 3 min. The minimumextrusion force was determined with a TA-XTplusC texture analyzer (Stable Micro SystemsLtd., Surrey, Godalming, UK). After the tube was completely filled with the ointment, theminimum force at which the ointment started to flow when compressed was measured.Each experiment was conducted in triplicate.
The pH measurement was conducted by pH meter (Sevencompact, Mettler ToledoInc., Greifensee, Switzerland) with a 10-fold diluted ointment using distilled water.

Pharmaceutics 2021, 13, 1468 4 of 18
2.2.2. Physicochemical Characterization of Lidocaine Ointment
To determine the droplet size and polydispersity index the Portal ELSZ Zeta-sizeanalyzer (Otsuka Electronics, Osaka, Japan) was employed. The measurements were madeat 90◦ at room temperature (25 ◦C). One milliliter of the sample was placed in the cuvettesand the lidocaine ointments were diluted (2-fold in phosphate buffer solution (PBS, pH7.4). Each experiment was conducted in triplicate [18].
The thermal properties of the lidocaine, other excipients, and prepared lidocaine oint-ments were analyzed using a DSC Q2000 (TA Instruments, New Castle, DE, USA) thermalanalyzer system. The samples were weighed, loaded into an aluminum pan, and analyzedat a heating rate of 10 ◦C/min over a temperature range of 40 ◦C to 120 ◦C. The thermalresponses of the prepared samples were calculated using the TA Advantage/UniversalAnalysis software (v5.2.6, TA Instruments, New Castle, DE, USA).
X-ray diffraction (XRD) patterns of lidocaine, other excipients, and lidocaine ointmentswere analyzed using a D8 Discover with GADDS (Bruker AXS, Karlsruhe, Germany) at awavelength of 1.54 Å. The 2θ scans were conducted between 5◦ and 60◦.
Raman spectroscopic measurements were performed using a RAMANtouch device(Nanophoton Corp., Osaka, Japan) equipped with a CCD camera and a diode laser. Thespectra of the individual components and formulations were acquired by 10 scans for a 10 sexposure time. Measurements were carried out with a 532 nm laser with a power level ofapproximately 1 mW at a slit width of 50 µm in the point measurement mode. Lidocaine,petrolatum, MCT oil, GMS, and prepared ointments were analyzed. In addition, raw SDrat skin and ointment-treated SD rat skin were analyzed. Ointment-treated SD rat skin wastreated with ointment for 6 h, and the remaining ointment was removed using an alcoholswab, then analysis was performed.
The morphology and structure of the diluted ointment were characterized usingtransmission electron microscopy (TEM). First, the diluted ointment was loaded onto acopper grid coating (TED PELLA Corporation, Redding, CA, USA) by soaking for 1 min.Next, the samples were dyed using 1% (w/v) phosphotungstic acid solution for 10 s. Thesample was dried for approximately 3 h at 25 ◦C. Images were obtained with an acceleratingvoltage of 200 kV using a LIBRA 120 instrument (Carl Zeiss, Oberkochen, Germany) [18].
2.2.3. In Vitro Dissolution Test of Lidocaine Ointment
The in vitro dissolution behavior of the lidocaine ointments was evaluated using adialysis membrane (Slide-A-Lyzer® mini dialysis devices 10 K MWCO, ThermoFisherScientific Inc., Waltham, MA, USA). Precisely, 1 g of ointment was added to the device, andthe device was placed into a 50 mL conical tube containing the dissolution medium, 45 mLof PBS. The conical tube was gently shaken at 100 rpm and maintained at 37 ± 1 ◦C in awater bath (BS-06, Jeiotech®, Daejeon, Korea). At a defined time, 200 µL of the medium wasadded, and the same volume of fresh PBS was added. Drug content was quantified usingHPLC. The HPLC system (Ultimate 3000 series HPLC system, Thermo Scientific, Waltham,MA, USA) was operated at 265 nm with an L1 packing 250 mm × 4.60 mm, 4 µm column(Phenomenex, Torrance, CA, USA). The mobile phase, consisting of acetonitrile and buffer(5% glacial acetic acid in distilled water, adjusted to pH 3.4 NaOH) at a 20:80 (v/v) ratio,was eluted at a flow rate of 1.0 mL/min. The column temperature was maintained at 30 ◦C,and the volume of each injected sample was 20 µL.
2.2.4. Ex Vivo Skin Permeation and Raman Mapping of Lidocaine Ointment
The ex vivo skin deposition test and Raman mapping of lidocaine ointment (L1, L2,and L3) were conducted using SD rat skin. Tests of L4, L5, L6, and Ref. A was performedusing the human cadaver skin. The skin was hydrated with PBS and mounted in a Franzdiffusion cell. PBS (pH 7.4) containing ethanol (50% v/v) was used as the receptor phase.The prepared lidocaine ointments and the Ref. A (3% w/w lidocaine) was applied to thedonor compartment (approximately 2.0 cm2). An ex vivo skin test (n = 4) was performedover a 6 h period, after which the excess ointment was removed with an alcohol swab.
Pharmaceutics 2021, 13, 1468 5 of 18
Adhesive tape (3M Scotch®, Paul, MN, USA) was used to separate the stratum corneum.The epidermis and dermis were cut into six pieces [18]. The pieces were then soaked in5 mL of the mobile phase by sonication. The extracted sample was filtered using a 0.45 µmpore 25 mm GD/X syringe filter (Whatman, Maidstone, UK). The filtered sample wasdiluted 2-fold with the mobile phase. The lidocaine concentration in each sample wasquantified using HPLC.
Raman mapping was performed to determine the distribution of lidocaine throughoutthe skin depth. After the ex vivo skin permeation test for 6 h (n = 3), the skin was cutinto 50 µm slices from top to bottom using a cryomicrotome (Microm HM450, ThermoScientific, Waltham, MA, USA). Up to approximately 300 µm of the skin was obtained andcut vertically to determine the difference in lidocaine by depth. The skin slice was placedon a glass slide (Marinefield Superior, Lauda-Königshofen, Germany) and examined byRaman mapping (RAMANtouch, Nanophoton Corp., Osaka, Japan). In each experiment,the laser light (532 nm, 50 mW) was focused on the sample. The magnification of the samplewas 20. The acquisition time was 0.1 sec and the slit size was 50 µm. The point-by-pointmode was used for mapping. The analysis was performed at 1670 cm−1. The view sizewas a square with 100 µm × 100 µm. The pixel size was 1.0 µm × 1.0 µm. In the Ramanmapping, a high concentration of lidocaine is presented as red color, whereas a relativelylow concentration of lidocaine was displayed as blue color.
2.2.5. In Vivo Tail-Flick Test of Lidocaine Ointment
The Chungbuk National University Institutional Animal Care and Use Committeeapproved the experimental protocols and animal care methods used in this study. In thepresent study, 20 male ICR mice were divided into five groups (n = 4). The mice werehoused at a temperature of 20 ◦C and relative humidity of 40% during the experiment. Themice were acclimatized for 7 days before the tail-flick test. To perform the test, a 1.5 cmportion of the tail was heated by a radiant heat source. Tail flick latency (TFL) time wasmeasured by turning on the heat source to the flicking of the tail. The mean time of fourmeasurements before the administration of ointment was performed as the baseline latency.Mice were selected for testing with a mean baseline latency time of 2–4 s. A 10 s cutoff timewas applied to avoid thermal damage to the tail at all points in the experiment [47].
The five groups of mice were treated with either 50 mg of L4 ointment (L4 group),50 mg of L5 ointment (L5 group), 50 mg of L6 ointment (L6 group), 50 mg of Ref. A (Ref. Agroup), or normal saline (normal saline group). The time points of the tail-flick test were0, 30, 50, 60, 75, 90, and 105 min after drug administration. The area under the receiveroperating characteristic curve (AUC) was calculated from the TFL-time profile of eachformulation using the linear trapezoidal rule.
2.2.6. Statistical Analysis
Statistically significant differences were evaluated using one-way analysis of variance(ANOVA) with the Least Significant Difference (LSD) post hoc test using SPSS version 23(SPSS Inc., Chicago, IL, USA). Statistical significance was set at p < 0.05.
3. Results3.1. Physicochemical Characterization of Lidocaine Ointment
Physicochemical characterization of lidocaine ointment was performed. The dropletsize and polydispersity index (PDI) of the diluted lidocaine ointment were determined(Table 2). The examination of L1 did not form a homogeneous emulsion. When L2 wasdiluted to 1:2, the droplet size was 117 nm, and the PDI was 0.28, indicating the formationof droplets of uniform size. L3 also had a droplet size at a 1:2 dilution of 108 nm and a PDIof 0.30, indicating a uniform droplet.
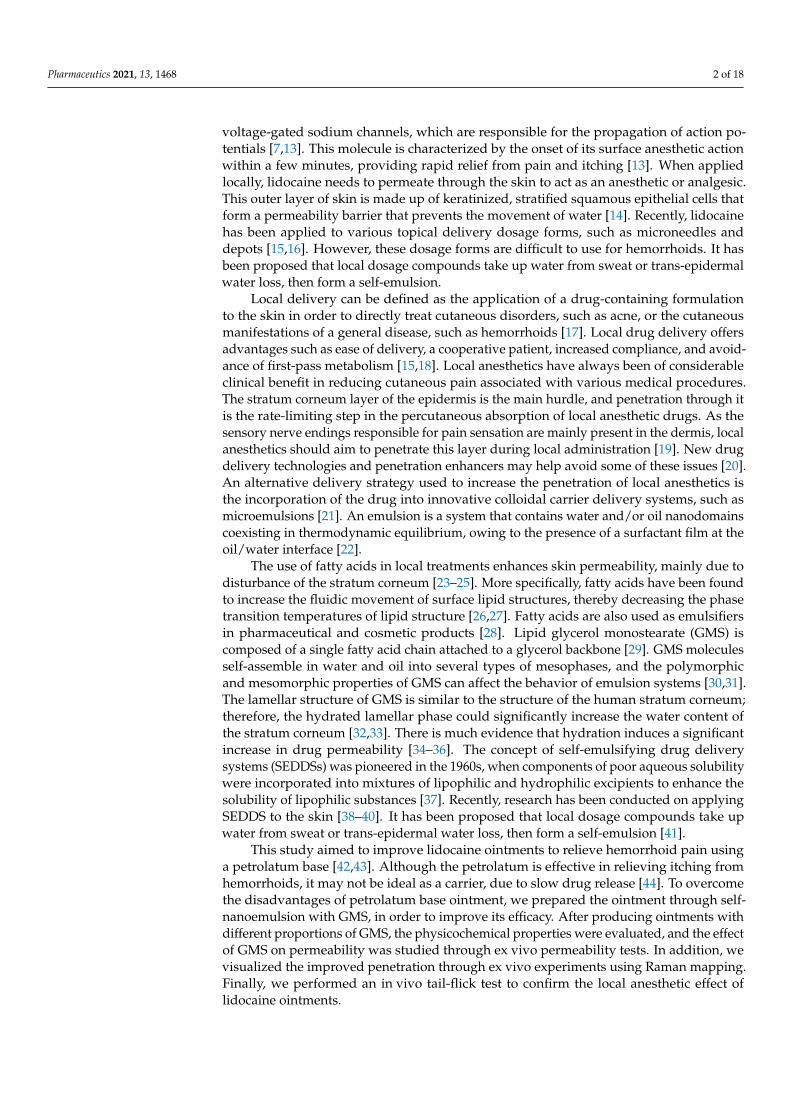
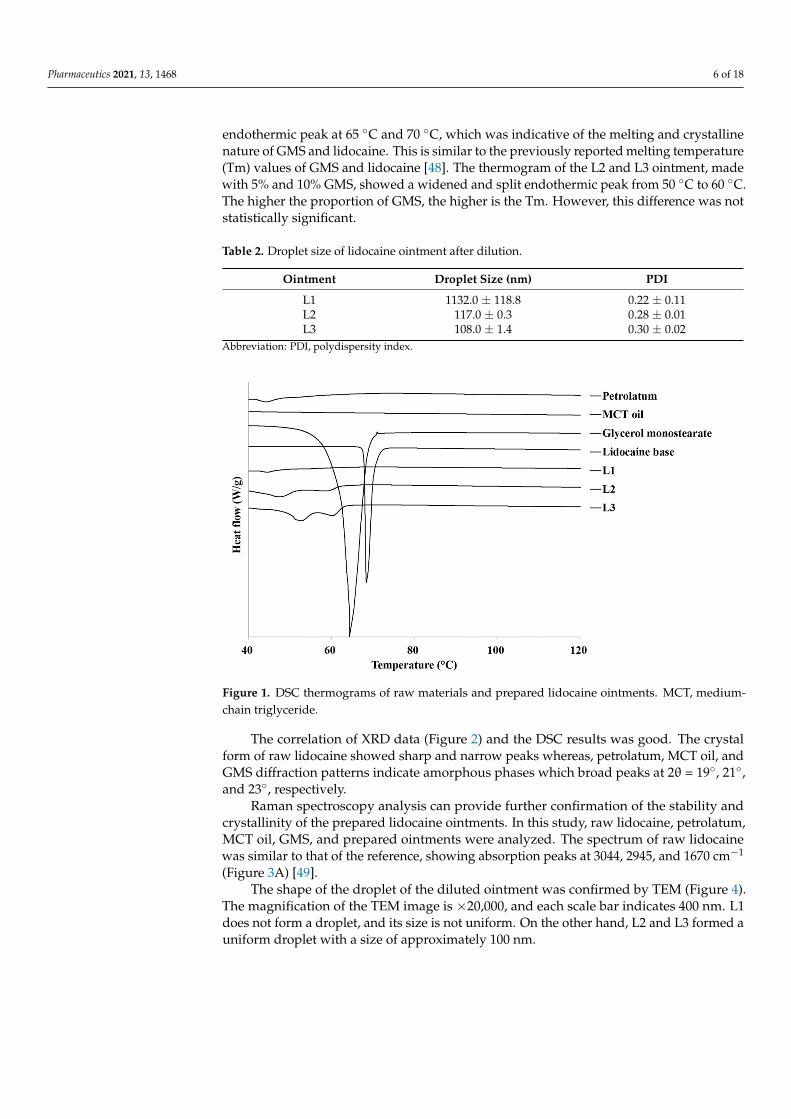
DSC thermograms of the raw materials and lidocaine ointment are shown in Figure 1.When petrolatum was examined with DSC analysis up to 120 ◦C, melting occurred with asmall and broad peak at 45 ◦C. The thermogram of GMS and lidocaine showed a sharp
Pharmaceutics 2021, 13, 1468 6 of 18
endothermic peak at 65 ◦C and 70 ◦C, which was indicative of the melting and crystallinenature of GMS and lidocaine. This is similar to the previously reported melting temperature(Tm) values of GMS and lidocaine [48]. The thermogram of the L2 and L3 ointment, madewith 5% and 10% GMS, showed a widened and split endothermic peak from 50 ◦C to 60 ◦C.The higher the proportion of GMS, the higher is the Tm. However, this difference was notstatistically significant.
Table 2. Droplet size of lidocaine ointment after dilution.
Ointment Droplet Size (nm) PDI
L1 1132.0 ± 118.8 0.22 ± 0.11L2 117.0 ± 0.3 0.28 ± 0.01L3 108.0 ± 1.4 0.30 ± 0.02
Abbreviation: PDI, polydispersity index.Pharmaceutics 2022, 14, 0 2 of 2
Pharmaceuticals 2022, 15, x FOR PEER REVIEW 2 of 3
Table 1. Formulation and rheological characterization of lidocaine ointments.
Excipient. L1 L2 L3 L4 L5 L6
Petrolatum 95.00 91.00 86.00 91.95 86.45 81.45
MCT oil 1.00 1.00 1.00 1.00 1.00 1.00
Glycerol monostearate ‐ 5.00 10.00 ‐ 5.00 10.00
Vitamin E‐acetate ‐ ‐ ‐ 3.00 3.00 3.00
Lidocaine base 3.00 3.00 3.00 3.00 3.00 3.00
Allantoin ‐ ‐ ‐ 1.00 1.00 1.00
Prednisolone acetate ‐ ‐ ‐ 0.05 0.05 0.05
dl‐Methylephedrine HCl ‐ ‐ ‐ ‐ 0.5 0.5
pH 8.4 8.4 8.5 8.5 8.5 8.5
Viscosity (×103 cP) ‐ ‐ ‐ 23.5 ± 0.5 41.9 ± 0.8 95.2 ± 0.9
Minimum extrusion force
(N) ‐ ‐ ‐ 19.5 ± 0.2 25.2 ± 0.8 54.9 ± 0.9
Abbreviations: MCT, medium‐chain triglyceride, HCl, hydrochloride.
There was an error in the original article in Figure 1, “Lidcocaine” is misspelled as a
legend. The correct Figure 1 appears below.
Figure 1. DSC thermograms of raw materials and prepared lidocaine ointments. MCT, medium‐
chain triglyceride.
There was an error in the original article in Figure 2, “Lidcocaine” is misspelled as a
legend. The correct Figure 2 appears below.
Figure 1. DSC thermograms of raw materials and prepared lidocaine ointments. MCT, medium-chain triglyceride.
There was an error in the original article in Figure 2, “Lidcocaine” is misspelled as alegend. The correct Figure 2 appears below.
Pharmaceuticals 2022, 15, x FOR PEER REVIEW 3 of 3
Figure 2. X‐ray diffraction patterns of raw materials and prepared lidocaine ointments. MCT, me‐
dium‐chain triglyceride.
The authors apologize for any inconvenience caused and state that the scientific con‐
clusions are unaffected. The original publication has also been updated.
Reference
1. Kang, J.H.; Yoo, K.H.; Park, H.Y.; Hyun, S.M.; Han, S.D.; Kim, D.W.; Park, C.W. Preparation and in vivo evaluation of a lidocaine
self‐nanoemulsifying ointment with glycerol monostearate for local delivery. Pharmaceutics 2021, 13, 1468.
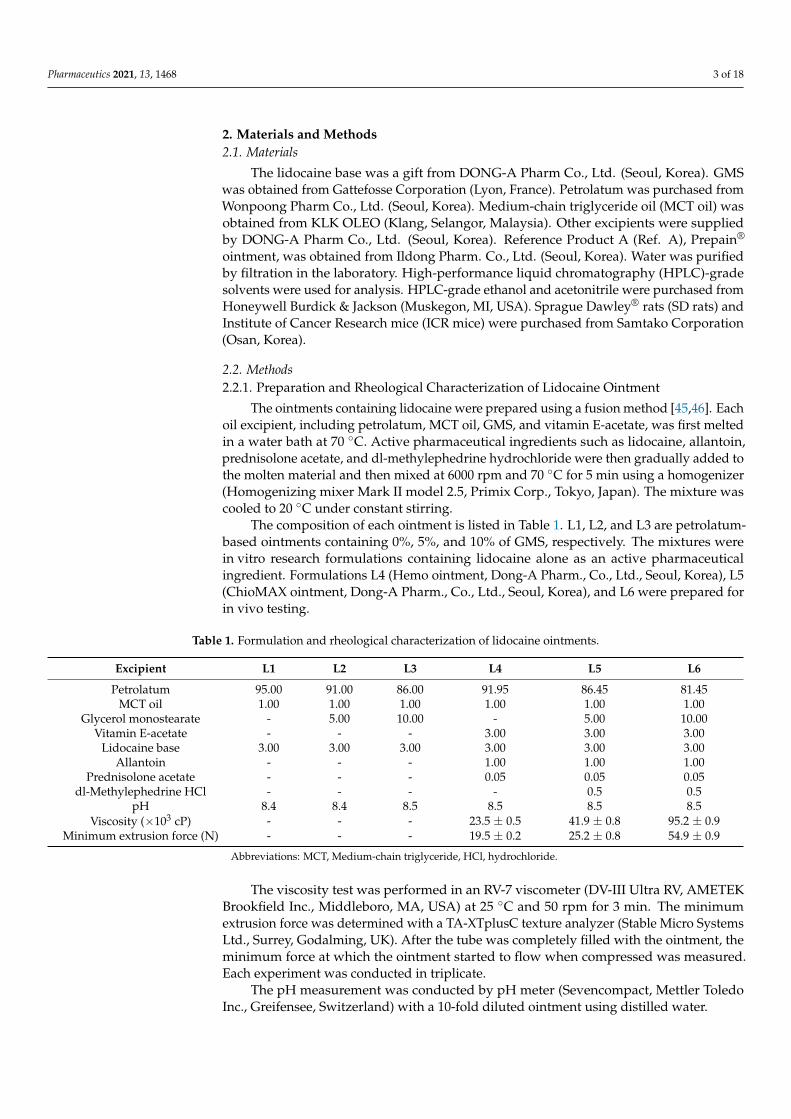
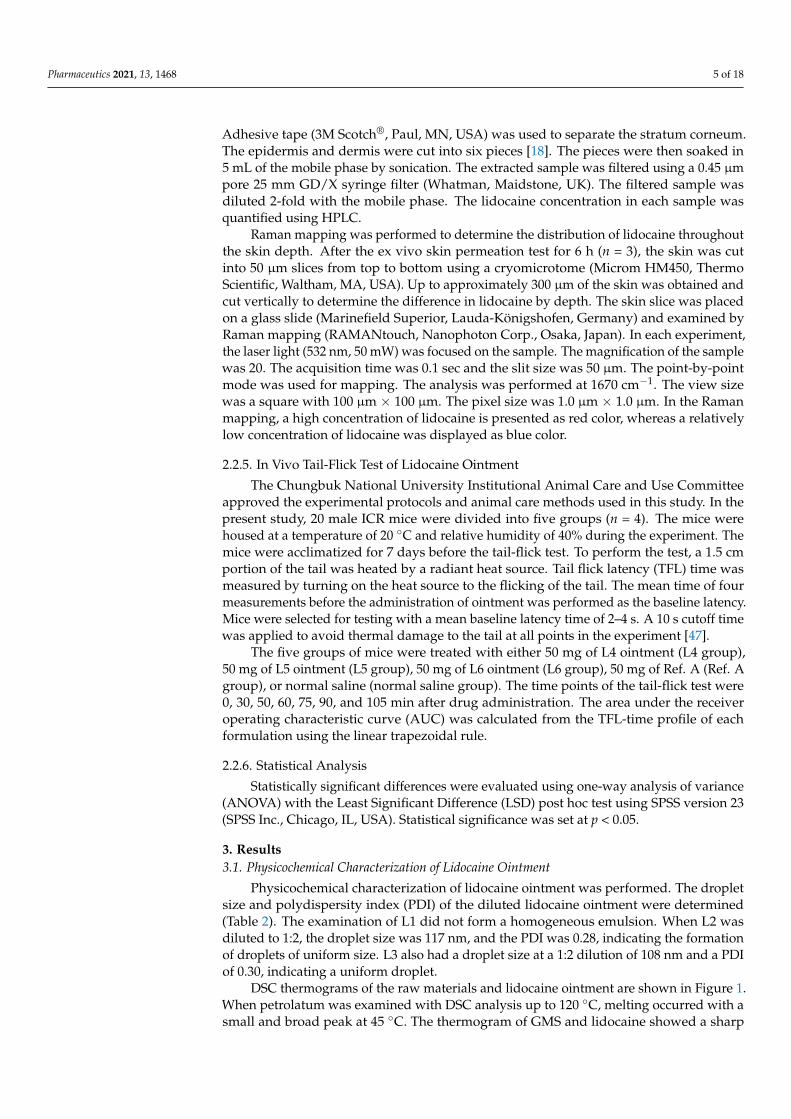
Figure 2. X-ray diffraction patterns of raw materials and prepared lidocaine ointments. MCT,medium-chain triglyceride.
The authors apologize for any inconvenience caused and state that the scientificconclusions are unaffected. The original publication has also been updated.
Reference1. Kang, J.-H.; Yoo, K.-H.; Park, H.-Y.; Hyun, S.-M.; Han, S.-D.; Kim, D.-W.; Park, C.-W. Preparation and in vivo evaluation of a
lidocaine self-nanoemulsifying ointment with glycerol monostearate for local delivery. Pharmaceutics 2021, 13, 1468. [CrossRef][PubMed]
Figure 1. DSC thermograms of raw materials and prepared lidocaine ointments. MCT, medium-chain triglyceride.
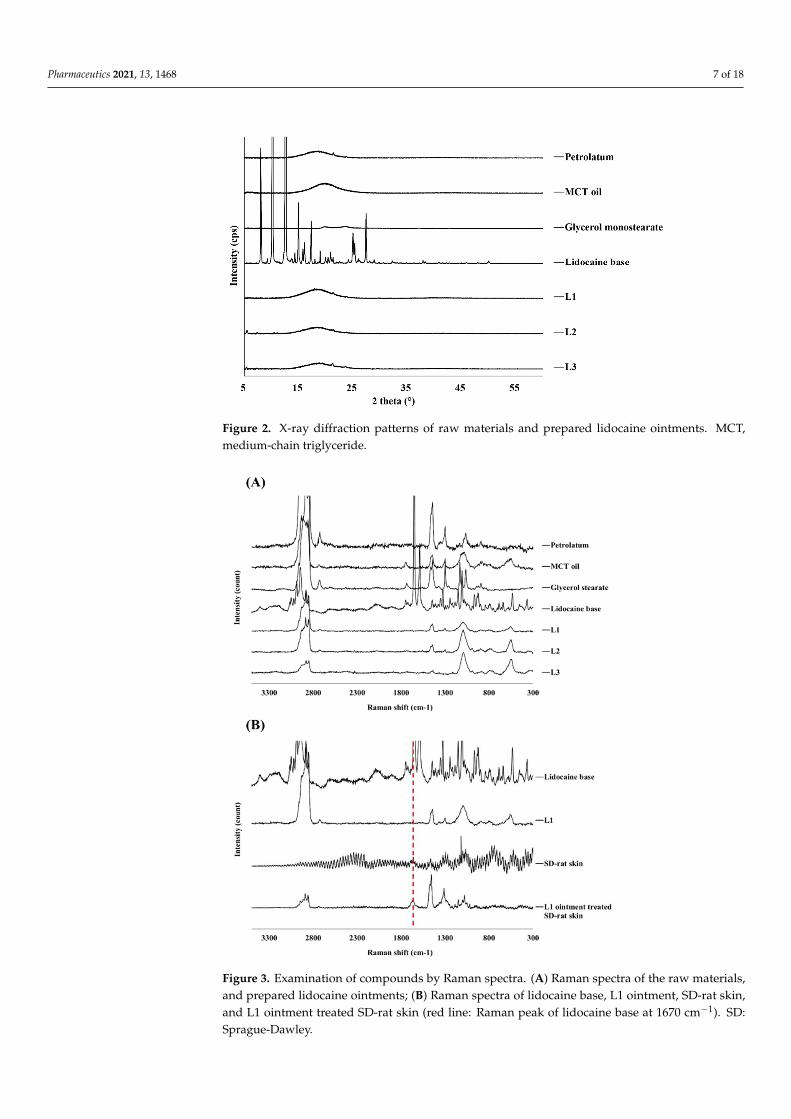
The correlation of XRD data (Figure 2) and the DSC results was good. The crystalform of raw lidocaine showed sharp and narrow peaks whereas, petrolatum, MCT oil, andGMS diffraction patterns indicate amorphous phases which broad peaks at 2θ = 19◦, 21◦,and 23◦, respectively.
Raman spectroscopy analysis can provide further confirmation of the stability andcrystallinity of the prepared lidocaine ointments. In this study, raw lidocaine, petrolatum,MCT oil, GMS, and prepared ointments were analyzed. The spectrum of raw lidocainewas similar to that of the reference, showing absorption peaks at 3044, 2945, and 1670 cm−1
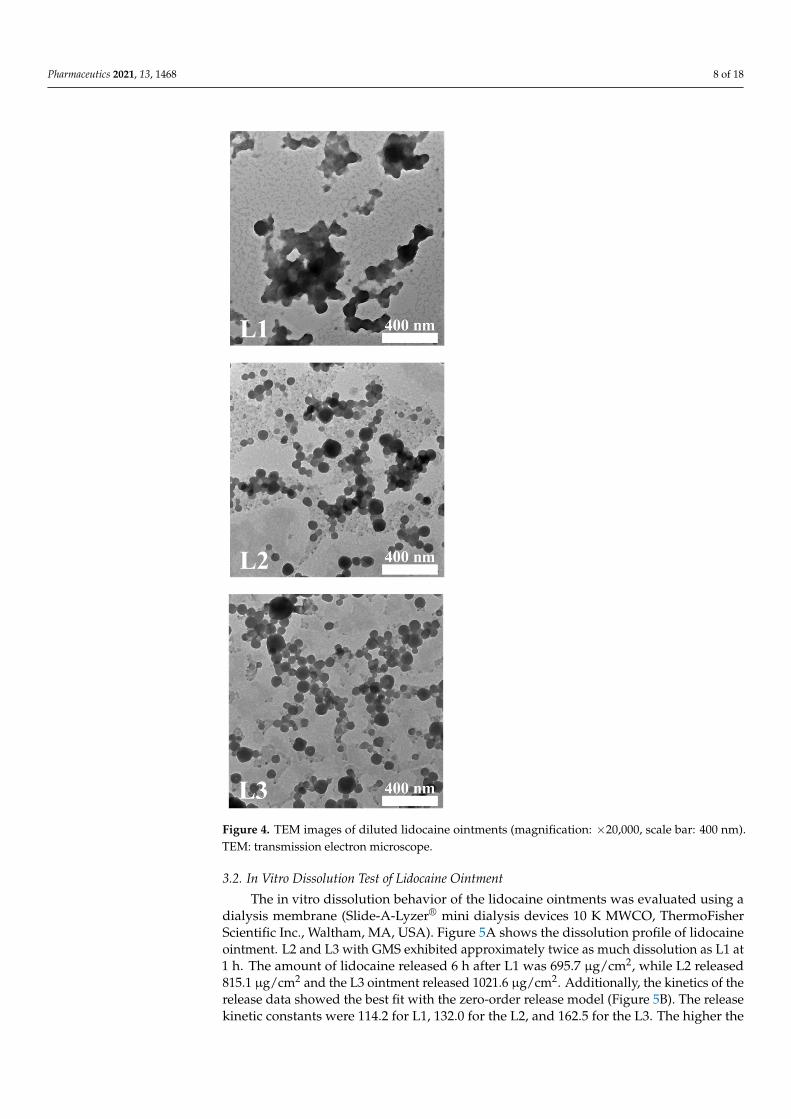
(Figure 3A) [49].The shape of the droplet of the diluted ointment was confirmed by TEM (Figure 4).
The magnification of the TEM image is ×20,000, and each scale bar indicates 400 nm. L1does not form a droplet, and its size is not uniform. On the other hand, L2 and L3 formed auniform droplet with a size of approximately 100 nm.
Pharmaceutics 2021, 13, 1468 7 of 18
Pharmaceutics 2022, 14, 0 2 of 2
Pharmaceuticals 2022, 15, x FOR PEER REVIEW 2 of 3
Table 1. Formulation and rheological characterization of lidocaine ointments.
Excipient. L1 L2 L3 L4 L5 L6
Petrolatum 95.00 91.00 86.00 91.95 86.45 81.45
MCT oil 1.00 1.00 1.00 1.00 1.00 1.00
Glycerol monostearate ‐ 5.00 10.00 ‐ 5.00 10.00
Vitamin E‐acetate ‐ ‐ ‐ 3.00 3.00 3.00
Lidocaine base 3.00 3.00 3.00 3.00 3.00 3.00
Allantoin ‐ ‐ ‐ 1.00 1.00 1.00
Prednisolone acetate ‐ ‐ ‐ 0.05 0.05 0.05
dl‐Methylephedrine HCl ‐ ‐ ‐ ‐ 0.5 0.5
pH 8.4 8.4 8.5 8.5 8.5 8.5
Viscosity (×103 cP) ‐ ‐ ‐ 23.5 ± 0.5 41.9 ± 0.8 95.2 ± 0.9
Minimum extrusion force
(N) ‐ ‐ ‐ 19.5 ± 0.2 25.2 ± 0.8 54.9 ± 0.9
Abbreviations: MCT, medium‐chain triglyceride, HCl, hydrochloride.
There was an error in the original article in Figure 1, “Lidcocaine” is misspelled as a
legend. The correct Figure 1 appears below.
Figure 1. DSC thermograms of raw materials and prepared lidocaine ointments. MCT, medium‐
chain triglyceride.
There was an error in the original article in Figure 2, “Lidcocaine” is misspelled as a
legend. The correct Figure 2 appears below.
Figure 1. DSC thermograms of raw materials and prepared lidocaine ointments. MCT, medium-chain triglyceride.
There was an error in the original article in Figure 2, “Lidcocaine” is misspelled as alegend. The correct Figure 2 appears below.
Pharmaceuticals 2022, 15, x FOR PEER REVIEW 3 of 3
Figure 2. X‐ray diffraction patterns of raw materials and prepared lidocaine ointments. MCT, me‐
dium‐chain triglyceride.
The authors apologize for any inconvenience caused and state that the scientific con‐
clusions are unaffected. The original publication has also been updated.
Reference
1. Kang, J.H.; Yoo, K.H.; Park, H.Y.; Hyun, S.M.; Han, S.D.; Kim, D.W.; Park, C.W. Preparation and in vivo evaluation of a lidocaine
self‐nanoemulsifying ointment with glycerol monostearate for local delivery. Pharmaceutics 2021, 13, 1468.
Figure 2. X-ray diffraction patterns of raw materials and prepared lidocaine ointments. MCT,medium-chain triglyceride.
The authors apologize for any inconvenience caused and state that the scientificconclusions are unaffected. The original publication has also been updated.
Reference1. Kang, J.-H.; Yoo, K.-H.; Park, H.-Y.; Hyun, S.-M.; Han, S.-D.; Kim, D.-W.; Park, C.-W. Preparation and in vivo evaluation of a
lidocaine self-nanoemulsifying ointment with glycerol monostearate for local delivery. Pharmaceutics 2021, 13, 1468. [CrossRef][PubMed]
Figure 2. X-ray diffraction patterns of raw materials and prepared lidocaine ointments. MCT,medium-chain triglyceride.
Pharmaceutics 2021, 13, x FOR PEER REVIEW 7 of 18
Figure 2. X-ray diffraction patterns of the raw materials and prepared lidocaine ointments. MCT, medium-chain triglyceride.
Raman spectroscopy analysis can provide further confirmation of the stability and crystallinity of the prepared lidocaine ointments. In this study, raw lidocaine, petrolatum, MCT oil, GMS, and prepared ointments were analyzed. The spectrum of raw lidocaine was similar to that of the reference, showing absorption peaks at 3044, 2945, and 1670 cm−1 (Figure 3A) [49].
Figure 3. Examination of compounds by Raman spectra. (A) Raman spectra of the raw materials, and prepared lidocaine ointments; (B) Raman spectra of lidocaine base, L1 ointment, SD-rat skin, and L1 ointment treated SD-rat skin (red line: Raman peak of lidocaine base at 1670 cm−1). SD: Spra-gue-Dawley.
Figure 3. Examination of compounds by Raman spectra. (A) Raman spectra of the raw materials,and prepared lidocaine ointments; (B) Raman spectra of lidocaine base, L1 ointment, SD-rat skin,and L1 ointment treated SD-rat skin (red line: Raman peak of lidocaine base at 1670 cm−1). SD:Sprague-Dawley.
Pharmaceutics 2021, 13, 1468 8 of 18
Pharmaceutics 2021, 13, x FOR PEER REVIEW 8 of 18
The shape of the droplet of the diluted ointment was confirmed by TEM (Figure 4). The magnification of the TEM image is ×20,000, and each scale bar indicates 400 nm. L1 does not form a droplet, and its size is not uniform. On the other hand, L2 and L3 formed a uniform droplet with a size of approximately 100 nm.
Figure 4. TEM images of diluted lidocaine ointments (magnification: ×20,000, scale bar: 400 nm). TEM: transmission electron microscope.
3.2. In Vitro Dissolution Test of Lidocaine Ointment The in vitro dissolution behavior of the lidocaine ointments was evaluated using a
dialysis membrane (Slide-A-Lyzer® mini dialysis devices 10 K MWCO, ThermoFisher Sci-entific Inc., Waltham, MA, USA). Figure 5A shows the dissolution profile of lidocaine ointment. L2 and L3 with GMS exhibited approximately twice as much dissolution as L1
Figure 4. TEM images of diluted lidocaine ointments (magnification: ×20,000, scale bar: 400 nm).TEM: transmission electron microscope.
3.2. In Vitro Dissolution Test of Lidocaine Ointment
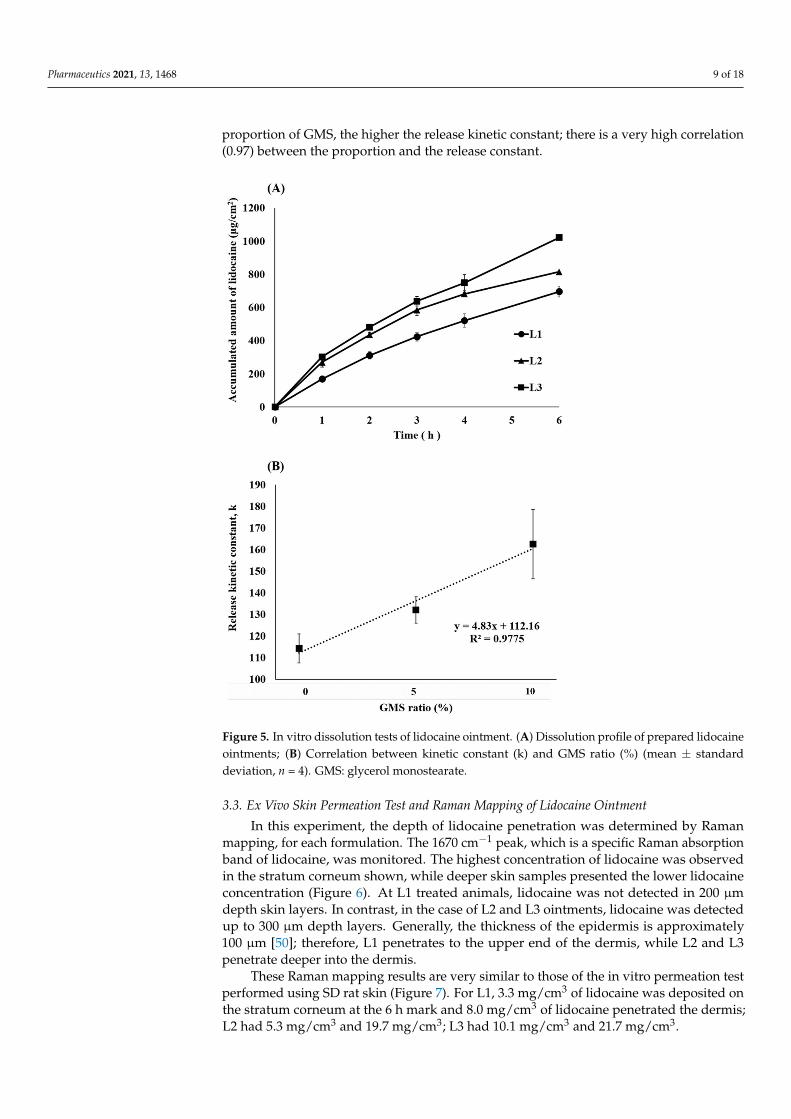
The in vitro dissolution behavior of the lidocaine ointments was evaluated using adialysis membrane (Slide-A-Lyzer® mini dialysis devices 10 K MWCO, ThermoFisherScientific Inc., Waltham, MA, USA). Figure 5A shows the dissolution profile of lidocaineointment. L2 and L3 with GMS exhibited approximately twice as much dissolution as L1 at1 h. The amount of lidocaine released 6 h after L1 was 695.7 µg/cm2, while L2 released815.1 µg/cm2 and the L3 ointment released 1021.6 µg/cm2. Additionally, the kinetics of therelease data showed the best fit with the zero-order release model (Figure 5B). The releasekinetic constants were 114.2 for L1, 132.0 for the L2, and 162.5 for the L3. The higher the
Pharmaceutics 2021, 13, 1468 9 of 18
proportion of GMS, the higher the release kinetic constant; there is a very high correlation(0.97) between the proportion and the release constant.
Pharmaceutics 2021, 13, x FOR PEER REVIEW 9 of 18
at 1 h. The amount of lidocaine released 6 h after L1 was 695.7 μg/cm2, while L2 released 815.1 μg/cm2 and the L3 ointment released 1021.6 μg/cm2. Additionally, the kinetics of the release data showed the best fit with the zero-order release model (Figure 5B). The release kinetic constants were 114.2 for L1, 132.0 for the L2, and 162.5 for the L3. The higher the proportion of GMS, the higher the release kinetic constant; there is a very high correlation (0.97) between the proportion and the release constant.
Figure 5. In vitro dissolution tests of lidocaine ointment. (A) Dissolution profile of prepared lido-caine ointments; (B) Correlation between kinetic constant (k) and GMS ratio (%) (mean ± standard deviation, n = 4). GMS: glycerol monostearate.
3.3. Ex Vivo Skin Permeation Test and Raman Mapping of Lidocaine Ointment In this experiment, the depth of lidocaine penetration was determined by Raman
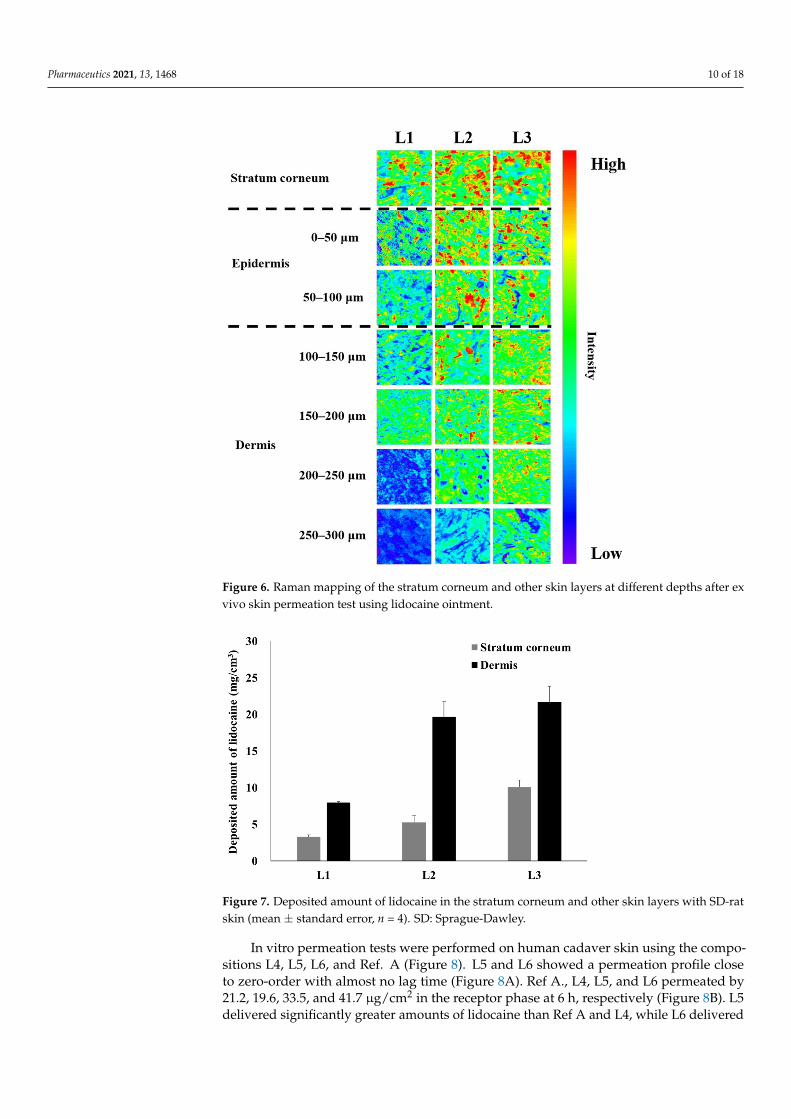
mapping, for each formulation. The 1670 cm−1 peak, which is a specific Raman absorption band of lidocaine, was monitored. The highest concentration of lidocaine was observed in the stratum corneum shown, while deeper skin samples presented the lower lidocaine concentration (Figure 6). At L1 treated animals, lidocaine was not detected in 200 μm depth skin layers. In contrast, in the case of L2 and L3 ointments, lidocaine was detected up to 300 μm depth layers. Generally, the thickness of the epidermis is approximately 100 μm [50]; therefore, L1 penetrates to the upper end of the dermis, while L2 and L3 penetrate deeper into the dermis.
Figure 5. In vitro dissolution tests of lidocaine ointment. (A) Dissolution profile of prepared lidocaineointments; (B) Correlation between kinetic constant (k) and GMS ratio (%) (mean ± standarddeviation, n = 4). GMS: glycerol monostearate.
3.3. Ex Vivo Skin Permeation Test and Raman Mapping of Lidocaine Ointment
In this experiment, the depth of lidocaine penetration was determined by Ramanmapping, for each formulation. The 1670 cm−1 peak, which is a specific Raman absorptionband of lidocaine, was monitored. The highest concentration of lidocaine was observedin the stratum corneum shown, while deeper skin samples presented the lower lidocaineconcentration (Figure 6). At L1 treated animals, lidocaine was not detected in 200 µmdepth skin layers. In contrast, in the case of L2 and L3 ointments, lidocaine was detectedup to 300 µm depth layers. Generally, the thickness of the epidermis is approximately100 µm [50]; therefore, L1 penetrates to the upper end of the dermis, while L2 and L3penetrate deeper into the dermis.
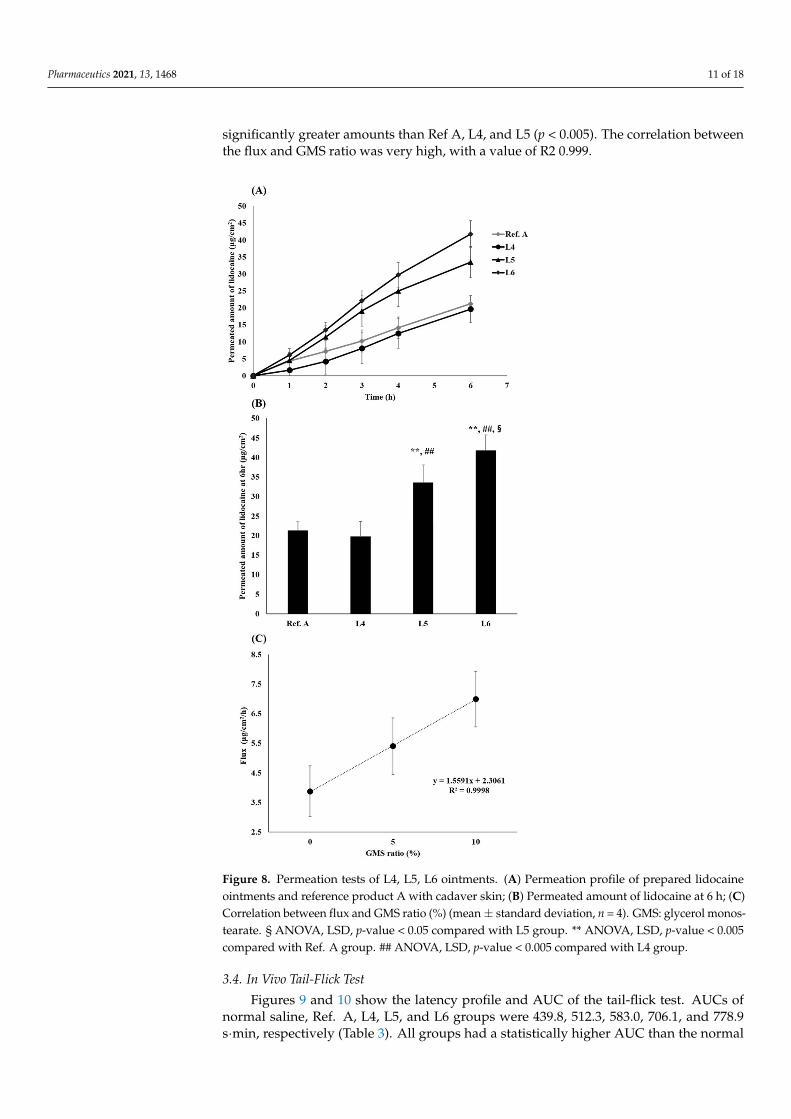
These Raman mapping results are very similar to those of the in vitro permeation testperformed using SD rat skin (Figure 7). For L1, 3.3 mg/cm3 of lidocaine was deposited onthe stratum corneum at the 6 h mark and 8.0 mg/cm3 of lidocaine penetrated the dermis;L2 had 5.3 mg/cm3 and 19.7 mg/cm3; L3 had 10.1 mg/cm3 and 21.7 mg/cm3.
Pharmaceutics 2021, 13, 1468 10 of 18Pharmaceutics 2021, 13, x FOR PEER REVIEW 10 of 18
Figure 6. Raman mapping of the stratum corneum and other skin layers at different depths after ex vivo skin permeation test using lidocaine ointment.
These Raman mapping results are very similar to those of the in vitro permeation test performed using SD rat skin (Figure 7). For L1, 3.3 mg/cm3 of lidocaine was deposited on the stratum corneum at the 6 h mark and 8.0 mg/cm3 of lidocaine penetrated the dermis; L2 had 5.3 mg/cm3 and 19.7 mg/cm3; L3 had 10.1 mg/cm3 and 21.7 mg/cm3.
Figure 7. Deposited amount of lidocaine in the stratum corneum and other skin layers with SD-rat skin (mean ± standard error, n = 4). SD: Sprague-Dawley.
Figure 6. Raman mapping of the stratum corneum and other skin layers at different depths after exvivo skin permeation test using lidocaine ointment.
Pharmaceutics 2021, 13, x FOR PEER REVIEW 10 of 18
Figure 6. Raman mapping of the stratum corneum and other skin layers at different depths after ex vivo skin permeation test using lidocaine ointment.
These Raman mapping results are very similar to those of the in vitro permeation test performed using SD rat skin (Figure 7). For L1, 3.3 mg/cm3 of lidocaine was deposited on the stratum corneum at the 6 h mark and 8.0 mg/cm3 of lidocaine penetrated the dermis; L2 had 5.3 mg/cm3 and 19.7 mg/cm3; L3 had 10.1 mg/cm3 and 21.7 mg/cm3.
Figure 7. Deposited amount of lidocaine in the stratum corneum and other skin layers with SD-rat skin (mean ± standard error, n = 4). SD: Sprague-Dawley.
Figure 7. Deposited amount of lidocaine in the stratum corneum and other skin layers with SD-ratskin (mean ± standard error, n = 4). SD: Sprague-Dawley.
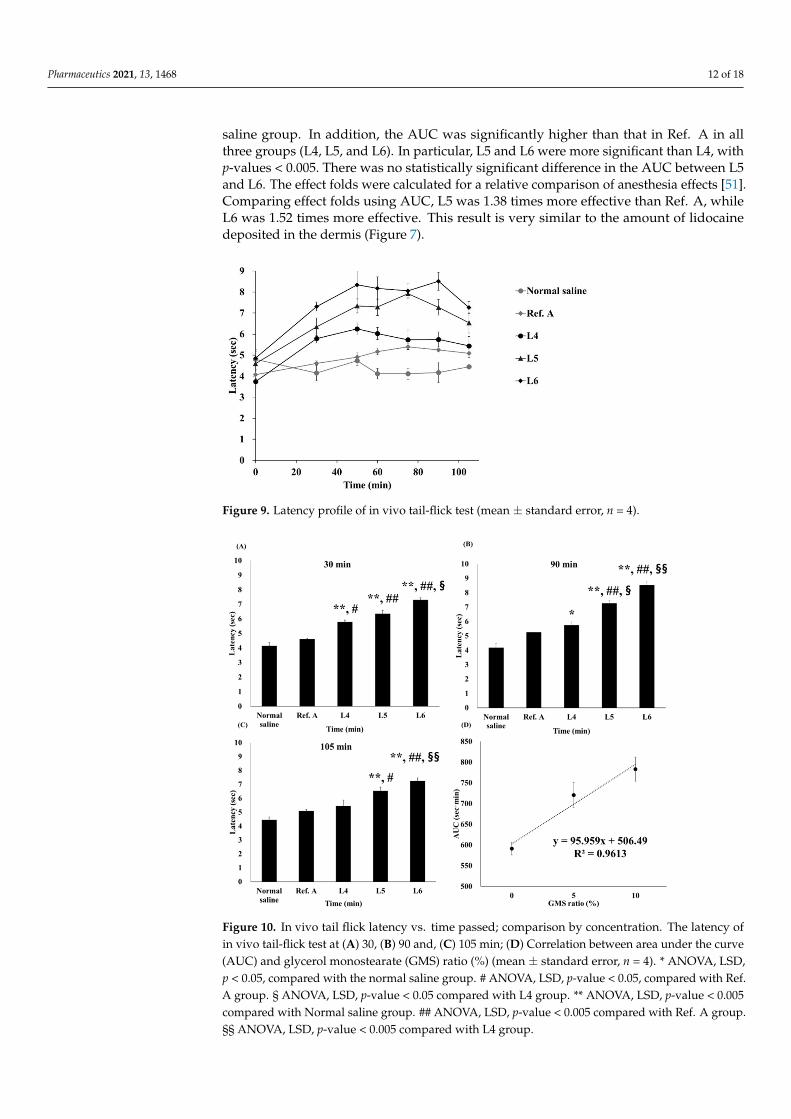
In vitro permeation tests were performed on human cadaver skin using the compo-sitions L4, L5, L6, and Ref. A (Figure 8). L5 and L6 showed a permeation profile closeto zero-order with almost no lag time (Figure 8A). Ref A., L4, L5, and L6 permeated by21.2, 19.6, 33.5, and 41.7 µg/cm2 in the receptor phase at 6 h, respectively (Figure 8B). L5delivered significantly greater amounts of lidocaine than Ref A and L4, while L6 delivered
Pharmaceutics 2021, 13, 1468 11 of 18
significantly greater amounts than Ref A, L4, and L5 (p < 0.005). The correlation betweenthe flux and GMS ratio was very high, with a value of R2 0.999.
Pharmaceutics 2021, 13, x FOR PEER REVIEW 11 of 18
In vitro permeation tests were performed on human cadaver skin using the compo-sitions L4, L5, L6, and Ref. A (Figure 8). L5 and L6 showed a permeation profile close to zero-order with almost no lag time (Figure 8A). Ref A., L4, L5, and L6 permeated by 21.2, 19.6, 33.5, and 41.7 μg/cm2 in the receptor phase at 6 h, respectively (Figure 8B). L5 deliv-ered significantly greater amounts of lidocaine than Ref A and L4, while L6 delivered sig-nificantly greater amounts than Ref A, L4, and L5 (p < 0.005). The correlation between the flux and GMS ratio was very high, with a value of R2 0.999.
Figure 8. Permeation tests of L4, L5, L6 ointments. (A) Permeation profile of prepared lidocaine ointments and reference product A with cadaver skin; (B) Permeated amount of lidocaine at 6 h; (C) Correlation between flux and GMS ratio (%) (mean ± standard deviation, n = 4). GMS: glycerol monostearate. § ANOVA, LSD, p-value < 0.05 compared with L5 group. ** ANOVA, LSD, p-value < 0.005 compared with Ref. A group. ## ANOVA, LSD, p-value < 0.005 compared with L4 group.
Figure 8. Permeation tests of L4, L5, L6 ointments. (A) Permeation profile of prepared lidocaineointments and reference product A with cadaver skin; (B) Permeated amount of lidocaine at 6 h; (C)Correlation between flux and GMS ratio (%) (mean ± standard deviation, n = 4). GMS: glycerol monos-tearate. § ANOVA, LSD, p-value < 0.05 compared with L5 group. ** ANOVA, LSD, p-value < 0.005compared with Ref. A group. ## ANOVA, LSD, p-value < 0.005 compared with L4 group.
3.4. In Vivo Tail-Flick Test
Figures 9 and 10 show the latency profile and AUC of the tail-flick test. AUCs ofnormal saline, Ref. A, L4, L5, and L6 groups were 439.8, 512.3, 583.0, 706.1, and 778.9s·min, respectively (Table 3). All groups had a statistically higher AUC than the normal
Pharmaceutics 2021, 13, 1468 12 of 18
saline group. In addition, the AUC was significantly higher than that in Ref. A in allthree groups (L4, L5, and L6). In particular, L5 and L6 were more significant than L4, withp-values < 0.005. There was no statistically significant difference in the AUC between L5and L6. The effect folds were calculated for a relative comparison of anesthesia effects [51].Comparing effect folds using AUC, L5 was 1.38 times more effective than Ref. A, whileL6 was 1.52 times more effective. This result is very similar to the amount of lidocainedeposited in the dermis (Figure 7).
Pharmaceutics 2021, 13, x FOR PEER REVIEW 12 of 18
3.4. In Vivo Tail-Flick Test Figures 9 and 10 show the latency profile and AUC of the tail-flick test. AUCs of
normal saline, Ref. A, L4, L5, and L6 groups were 439.8, 512.3, 583.0, 706.1, and 778.9 s·min, respectively (Table 3). All groups had a statistically higher AUC than the normal saline group. In addition, the AUC was significantly higher than that in Ref. A in all three groups (L4, L5, and L6). In particular, L5 and L6 were more significant than L4, with p-values < 0.005. There was no statistically significant difference in the AUC between L5 and L6. The effect folds were calculated for a relative comparison of anesthesia effects [51]. Comparing effect folds using AUC, L5 was 1.38 times more effective than Ref. A, while L6 was 1.52 times more effective. This result is very similar to the amount of lidocaine deposited in the dermis (Figure 7).
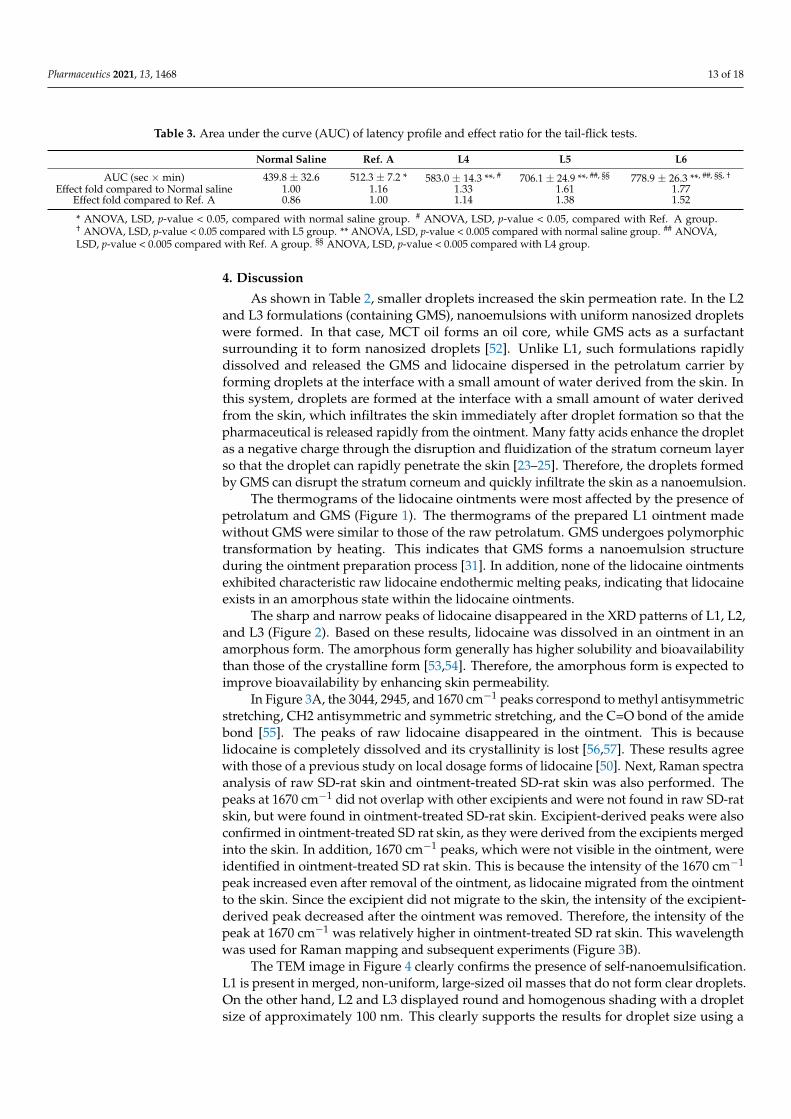
Figure 9. Latency profile of in vivo tail-flick test (mean ± standard error, n = 4).
Figure 10. In vivo tail flick latency vs. time passed; comparison by concentration. The latency of in vivo tail-flick test at (A) 30, (B) 90 and, (C) 105 min; (D) Correlation between area under the curve (AUC) and glycerol monostearate (GMS) ratio (%) (mean ± standard error, n = 4). * ANOVA, LSD, p < 0.05, compared with the normal saline group. # ANOVA, LSD, p-value < 0.05, compared with Ref. A group. § ANOVA, LSD, p-value < 0.05 compared with L4 group. ** ANOVA, LSD, p-value < 0.005 compared with Normal saline group. ## ANOVA, LSD, p-value < 0.005 compared with Ref. A group. §§ ANOVA, LSD, p-value < 0.005 compared with L4 group.
Figure 9. Latency profile of in vivo tail-flick test (mean ± standard error, n = 4).
Pharmaceutics 2021, 13, x FOR PEER REVIEW 12 of 18
3.4. In Vivo Tail-Flick Test Figures 9 and 10 show the latency profile and AUC of the tail-flick test. AUCs of
normal saline, Ref. A, L4, L5, and L6 groups were 439.8, 512.3, 583.0, 706.1, and 778.9 s·min, respectively (Table 3). All groups had a statistically higher AUC than the normal saline group. In addition, the AUC was significantly higher than that in Ref. A in all three groups (L4, L5, and L6). In particular, L5 and L6 were more significant than L4, with p-values < 0.005. There was no statistically significant difference in the AUC between L5 and L6. The effect folds were calculated for a relative comparison of anesthesia effects [51]. Comparing effect folds using AUC, L5 was 1.38 times more effective than Ref. A, while L6 was 1.52 times more effective. This result is very similar to the amount of lidocaine deposited in the dermis (Figure 7).
Figure 9. Latency profile of in vivo tail-flick test (mean ± standard error, n = 4).
Figure 10. In vivo tail flick latency vs. time passed; comparison by concentration. The latency of in vivo tail-flick test at (A) 30, (B) 90 and, (C) 105 min; (D) Correlation between area under the curve (AUC) and glycerol monostearate (GMS) ratio (%) (mean ± standard error, n = 4). * ANOVA, LSD, p < 0.05, compared with the normal saline group. # ANOVA, LSD, p-value < 0.05, compared with Ref. A group. § ANOVA, LSD, p-value < 0.05 compared with L4 group. ** ANOVA, LSD, p-value < 0.005 compared with Normal saline group. ## ANOVA, LSD, p-value < 0.005 compared with Ref. A group. §§ ANOVA, LSD, p-value < 0.005 compared with L4 group.
Figure 10. In vivo tail flick latency vs. time passed; comparison by concentration. The latency ofin vivo tail-flick test at (A) 30, (B) 90 and, (C) 105 min; (D) Correlation between area under the curve(AUC) and glycerol monostearate (GMS) ratio (%) (mean ± standard error, n = 4). * ANOVA, LSD,p < 0.05, compared with the normal saline group. # ANOVA, LSD, p-value < 0.05, compared with Ref.A group. § ANOVA, LSD, p-value < 0.05 compared with L4 group. ** ANOVA, LSD, p-value < 0.005compared with Normal saline group. ## ANOVA, LSD, p-value < 0.005 compared with Ref. A group.§§ ANOVA, LSD, p-value < 0.005 compared with L4 group.
Pharmaceutics 2021, 13, 1468 13 of 18
Table 3. Area under the curve (AUC) of latency profile and effect ratio for the tail-flick tests.
Normal Saline Ref. A L4 L5 L6
AUC (sec × min) 439.8 ± 32.6 512.3 ± 7.2 * 583.0 ± 14.3 **, # 706.1 ± 24.9 **, ##, §§ 778.9 ± 26.3 **, ##, §§, †
Effect fold compared to Normal saline 1.00 1.16 1.33 1.61 1.77Effect fold compared to Ref. A 0.86 1.00 1.14 1.38 1.52
* ANOVA, LSD, p-value < 0.05, compared with normal saline group. # ANOVA, LSD, p-value < 0.05, compared with Ref. A group.† ANOVA, LSD, p-value < 0.05 compared with L5 group. ** ANOVA, LSD, p-value < 0.005 compared with normal saline group. ## ANOVA,LSD, p-value < 0.005 compared with Ref. A group. §§ ANOVA, LSD, p-value < 0.005 compared with L4 group.
4. Discussion
As shown in Table 2, smaller droplets increased the skin permeation rate. In the L2and L3 formulations (containing GMS), nanoemulsions with uniform nanosized dropletswere formed. In that case, MCT oil forms an oil core, while GMS acts as a surfactantsurrounding it to form nanosized droplets [52]. Unlike L1, such formulations rapidlydissolved and released the GMS and lidocaine dispersed in the petrolatum carrier byforming droplets at the interface with a small amount of water derived from the skin. Inthis system, droplets are formed at the interface with a small amount of water derivedfrom the skin, which infiltrates the skin immediately after droplet formation so that thepharmaceutical is released rapidly from the ointment. Many fatty acids enhance the dropletas a negative charge through the disruption and fluidization of the stratum corneum layerso that the droplet can rapidly penetrate the skin [23–25]. Therefore, the droplets formedby GMS can disrupt the stratum corneum and quickly infiltrate the skin as a nanoemulsion.
The thermograms of the lidocaine ointments were most affected by the presence ofpetrolatum and GMS (Figure 1). The thermograms of the prepared L1 ointment madewithout GMS were similar to those of the raw petrolatum. GMS undergoes polymorphictransformation by heating. This indicates that GMS forms a nanoemulsion structureduring the ointment preparation process [31]. In addition, none of the lidocaine ointmentsexhibited characteristic raw lidocaine endothermic melting peaks, indicating that lidocaineexists in an amorphous state within the lidocaine ointments.
The sharp and narrow peaks of lidocaine disappeared in the XRD patterns of L1, L2,and L3 (Figure 2). Based on these results, lidocaine was dissolved in an ointment in anamorphous form. The amorphous form generally has higher solubility and bioavailabilitythan those of the crystalline form [53,54]. Therefore, the amorphous form is expected toimprove bioavailability by enhancing skin permeability.
In Figure 3A, the 3044, 2945, and 1670 cm−1 peaks correspond to methyl antisymmetricstretching, CH2 antisymmetric and symmetric stretching, and the C=O bond of the amidebond [55]. The peaks of raw lidocaine disappeared in the ointment. This is becauselidocaine is completely dissolved and its crystallinity is lost [56,57]. These results agreewith those of a previous study on local dosage forms of lidocaine [50]. Next, Raman spectraanalysis of raw SD-rat skin and ointment-treated SD-rat skin was also performed. Thepeaks at 1670 cm−1 did not overlap with other excipients and were not found in raw SD-ratskin, but were found in ointment-treated SD-rat skin. Excipient-derived peaks were alsoconfirmed in ointment-treated SD rat skin, as they were derived from the excipients mergedinto the skin. In addition, 1670 cm−1 peaks, which were not visible in the ointment, wereidentified in ointment-treated SD rat skin. This is because the intensity of the 1670 cm−1
peak increased even after removal of the ointment, as lidocaine migrated from the ointmentto the skin. Since the excipient did not migrate to the skin, the intensity of the excipient-derived peak decreased after the ointment was removed. Therefore, the intensity of thepeak at 1670 cm−1 was relatively higher in ointment-treated SD rat skin. This wavelengthwas used for Raman mapping and subsequent experiments (Figure 3B).
The TEM image in Figure 4 clearly confirms the presence of self-nanoemulsification.L1 is present in merged, non-uniform, large-sized oil masses that do not form clear droplets.On the other hand, L2 and L3 displayed round and homogenous shading with a dropletsize of approximately 100 nm. This clearly supports the results for droplet size using a
Pharmaceutics 2021, 13, 1468 14 of 18
zeta-size analyzer. Owing to the presence of GMS, the oil phases of the L2 and L3 ointmentswere able to achieve a self-nanoemulsion.
As the dissolution progressed, L2 slowed down, while L1 and L3 maintained theirdissolution rates (Figure 5A). This is because the GMS contacted the water of the hydratedmembrane to form a self-nanoemulsion and penetrate the membrane. By forming ananoemulsion at the interface between the hydrated membrane and the ointment, thedroplet rapidly permeated and then dissolved, in order to maintain the sink state, therebyallowing the rapid dissolution of lidocaine and GMS from the ointment to the interface. L1is released according to zero-order because it does not have GMS and is released by simplediffusion along the concentration gradient of lidocaine. In addition, L3 is comparativelyrich in GMS, so droplets are steadily formed and released at zero-order faster than L1. Onthe other hand, it is possible that L2 does not have sufficient GMS, and the dissolutionrate decreases in the latter half. However, when actually applied to the skin, unlike thedissolution environment, only a very small amount of water is present; therefore, GMSdeficiency does not occur. In Figure 5B, high release kinetic constants indicate that thesystem by which GMS forms droplets allows the drug to be released rapidly from thepetrolatum, which is a highly lipophilic ointment agent, and allows the drug to penetratethe skin. This means that it is faster and has a higher residual amount in the skin and caneffectively deliver the drug to the dermis.
As shown in the Raman mapping results (Figure 6), L1 was relatively less permeatedthan L2 and L3. Since it does not penetrate deep into the dermis, it is likely that a sig-nificantly lower amount was delivered. In addition, L3 had a larger amount of depositin the stratum corneum than L2 because the self-nanoemulsion progressed more rapidlydue to the large amount of GMS, and lidocaine was dissolved from the ointment faster.L2 and L3, with GMS, show not only a larger amount of lidocaine penetration, but alsoa deeper deposition than L1 without GMS, so it is expected that the onset to reach theanesthetic effect is fast and the anesthetic effect is higher. The presence or absence ofself-nanoemulsifying changes depends on the presence or absence of GMS. Therefore, L1was unable to self-nanoemulsify, so the rate of dissolution from the ointment to the skinwas slow and the rate of penetration into the deep skin was slow (Figure 7). On the otherhand, the GMS present in L2 and L3 ensured a high driving force and high penetrationowing to the high dissolution rate and self-nanoemulsifying effect. Raman mapping byskin depth and the permeation test with SD rats did not show a significant differencedepending on the amount of GMS, only its presence.
The permeation tests using human cadaver skin also showed that the influence ofthe GMS ratio was the largest (Figure 8A). Similar to the previous results, the presenceor absence of GMS had a great influence on how quickly the drug was released fromthe petrolatum base ointment. Since the dissolution of lidocaine from the ointment wasaccelerated by the self-nanoemulsifying effect of GMS, there was no lag time for both L5and L6, showing a permeation profile close to zero order. As a result, as the ratio of GMSincreased, the flux also increased, and linearity was possible (Figure 8B). In conclusion,through the self-nanoemulsifying effect of GMS, L5 and L6 showed higher permeabilitythan Ref. A and L4.
In all formulations, latency tended to increase up to approximately 60 min overall andthen decreased. However, L5 and L6 maintained a high latency of up to 105 min, with arelatively small decrease (Figure 9). As shown in Figure 10, the latency was significantlyhigher in L4, L5, and L6 than in the normal saline group at 30 min (Figure 10A).
However, there was no difference between L4 and Ref. A at 90 min. L5 and L6showed higher latencies than those in Ref. A at all-time points (Figure 10B,C). The self-nanoemulsifying effect of GMS allowed lidocaine to penetrate the skin from the ointmentand rapidly reach the intradermal concentration, showing an anesthetic effect; as GMSexists at a higher concentration, the latency of the L5 and L6 groups is higher in the tail-flicktest. Finally, the correlation between the AUC and GMS ratios was also high (R2 = 0.96), butwas relatively low compared to the other parameters (Figure 10D). This is because the AUC
Pharmaceutics 2021, 13, 1468 15 of 18
tended to deviate slightly from the linearity at L5. These results suggest that the differencebetween GMS 5% and GMS 10% had no significant effect in vivo. This result is similar tothe fact that the amount deposited in Raman mapping (Figure 6) and dermis (Figure 7) didnot differ significantly between the two formulations. After being rapidly released from theointment by the GMS, lidocaine is transferred to the dermis. It is possible that the amountdeposited in the dermis and transferred to the receptor phase was not significantly differentfrom the amount originally deposited in the dermis. Lidocaine was rapidly released fromthe ointment base by GMS in vivo. It is expected that it was transferred to the dermisover time, and when the amount exceeded a certain level, it was transferred to the blood.Therefore, there would have been no difference between L5 and L6 in the skin, similar tothe deposited amount and Raman mapping results for the dermis evaluated in vitro.
5. Conclusions
We conducted a pharmaceutical study to take advantage of the self-nanoemulsifyingeffect of GMS, allowing lidocaine to be released rapidly from the petrolatum ointmentand rapidly penetrate the dermis. The self-nanoemulsifying effect of GMS was confirmedthrough an in vitro dissolution test, which resulted in rapid release from the ointment. Dueto these properties, in vitro skin permeation also shows a rapid transition to the receptorphase with GMS, while a larger amount of lidocaine was deposited in the dermis. In thein vitro permeation test, the penetrated amount in the receptor phase and flux increased asthe amount of GMS increased, and the profile showed a zero-order form with no lag time,which had a linear correlation with the ratio of GMS. However, there was no differencein the amount deposited in the dermis, as confirmed by Raman mapping. In the case ofL1 without GMS, the drug permeated to a depth of 200 µm, which is the position thatseems to be the top of the dermis, while in L2 and L3, which contained GMS, the drug wasdistributed to a deeper layer of the dermis. After saturation of the dermis above a certainamount, the drug shifts to the receptor phase, so it is considered that there is no significantdifference in the amount deposited in the dermis between L2 and L3, beyond that whichwas necessary for saturation. Furthermore, similar results were obtained from the in vivotail-flick test. In the case of the Ref. A and L4 ointment without GMS, the latency betweenstimulus and tail-flick was higher than that in the normal saline group, but there wasno significant difference between Ref. A and L4. However, L5 and L6 had significantlyhigher latency and AUC, and were more effective than Ref. A, L5 at 1.38 times, and L6 at1.52 times. Additionally, improvement of skin deposition was confirmed through in vitroRaman mapping, and the superiority of local anesthetic effect was confirmed through anin vivo tail-flick study. In conclusion, the self-nanoemulsifying effect of GMS was appliedto improve local anesthetic ointment, primarily for the treatment of hemorrhoids.
Author Contributions: Conceptualization, H.-Y.P., S.-M.H. and S.-D.H.; Validation, K.-H.Y.; writing,J.-H.K.; visualization, D.-W.K.; project administration, C.-W.P. All authors have read and agreed tothe published version of the manuscript.
Funding: This study was supported by the National Research Foundation of Korea Grant funded bythe Korean government (NRF-2021R1A2C4002746 and 2017R1A5A2015541) and DONG-A Pharm.Co., Ltd. (Yongin, Korea).
Institutional Review Board Statement: The Chungbuk National University Institutional AnimalCare and Use Committee approved the experimental protocols and animal care methods used in thisstudy (CBNUA-1409-20-01).
Informed Consent Statement: Informed consent was obtained from all subjects involved in the study.
Conflicts of Interest: The authors declare no conflict of interest. H.-Y.P., S.-M.H. and S.-D.H. arefull-time employees of Dong-A Pharm. Co. Ltd. The funders had no role in the design of the study;in the collection, analyses, or interpretation of data; in the writing of the manuscript, and in thedecision to publish the results.
Pharmaceutics 2021, 13, 1468 16 of 18
References1. Sun, Z.; Sun, M.J. Review of hemorrhoid disease: Presentation and management. Clin. Colon Rectal Surg. 2016, 29, 22–29.2. Johanson, J.F.; Sonnenberg, A.J.G. The prevalence of hemorrhoids and chronic constipation: An epidemiologic study.
Gastroenterology 1990, 98, 380–386. [PubMed]3. Mongelli, F.; Treglia, G.; La Regina, D.; Di Giuseppe, M.; Galafassi, J.; Majno-Hurst, P.E.; Christoforidis, D. Pudendal nerve block
in hemorrhoid surgery: A systematic review and meta-analysis. Dis. Colon Rectum 2021, 64, 617–631. [CrossRef] [PubMed]4. Van Tol, R.R.; Kleijnen, J.; Watson, A.J.M.; Jongen, J.; Altomare, D.F.; Qvist, N.; Higuero, T.; Muris, J.W.M.; Breukink, S.O. European
society of coloproctology: Guideline for haemorrhoidal disease. Colorectal Dis. 2020, 22, 650–662. [PubMed]5. Lorenc, Z.; Gökçe, Ö. Tribenoside and lidocaine in the local treatment of hemorrhoids: An overview of clinical evidence. Eur. Rev.
Med. Pharm. Sci. 2016, 20, 2742–2751.6. Davis, B.R.; Lee-Kong, S.A.; Migaly, J.; Feingold, D.L.; Steele, S.R. The American society of colon and rectal surgeons clinical
practice guidelines for the management of hemorrhoids. Dis. Colon Rectum 2018, 61, 284–292. [CrossRef] [PubMed]7. Muldoon, R. Review of American society of colon and rectal surgeons clinical practice guidelines for the management of
hemorrhoids. JAMA Surg. 2020, 155, 773–774. [CrossRef]8. Asteria, C.R.; Lauretta, A.; Martellucci, J.; Lucchini, G.; Chiodaroli, R.; Todaro, A.; Infantino, A. Does anaesthesia change severity
of haemorrhoidal disease? A prospective and multicentre case-control study on haemorrhoidal disease assessment in twodifferent settings: Outpatient and operating theatre. Int. J. Colorectal Dis. 2016, 31, 1529–1531. [CrossRef]
9. Tarik, S.; Barazanchi, A.W.H.; Hill, A.G. Evidence-based management of pain after excisional haemorrhoidectomy surgery:A PROSPECT review update. World J. Surg. 2017, 41, 603–614.
10. Barazanchi, A.W.H.; MacFater, W.S.; Rahiri, J.L.; Tutone, S.; Hill, A.G.; Joshi, G.P. Evidence-based management of pain afterlaparoscopic cholecystectomy: A PROSPECT review update. Br. J. Anaesth. 2018, 121, 787–803. [CrossRef]
11. Altomare, D.F.; Giannini, I. Pharmacological treatment of hemorrhoids: A narrative review. Expert Opin. Pharm. 2013, 14,2343–2349. [CrossRef] [PubMed]
12. Zagriadskiı, E.A.; Bogomazov, A.M.; Golovko, E.B. Conservative treatment of hemorrhoids: Results of an observational multicen-ter study. Adv. Ther. 2018, 35, 1979–1992. [CrossRef] [PubMed]
13. Weinberg, L.; Peake, B.; Tan, C.; Nikfarjam, M. Pharmacokinetics and pharmacodynamics of lignocaine: A review. World J. Anesth.2015, 4, 17–29. [CrossRef]
14. Gudin, J.; Nalamachu, S. Utility of lidocaine as a topical analgesic and improvements in patch delivery systems. Postgrad. Med.2020, 132, 28–36. [CrossRef]
15. Kim, S.; Dangol, M.; Kang, G.; Lahiji, S.F.; Yang, H.; Jang, M.; Ma, Y.; Li, C.; Lee, S.; Kim, C.; et al. Enhanced transdermal deliveryby combined application of dissolving microneedle patch on serum-treated skin. Mol. Pharm. 2017, 14, 2024–2031. [CrossRef]
16. Zhao, Z.; Lian, Y.; Zhu, Y.; Ye, H.; Liu, M.; Li, J. Depot lidocaine-loaded microemulsion for prolonged local anesthesia: Differentefficacy model studies. J. Drug Deliv. Sci. Technol. 2020, 55, 101404. [CrossRef]
17. Tadwee, I.K.; Gore, S.; Giradkar, P. Advances in topical drug delivery system: A review. Int. J. Pharm. Res. Sci. 2012, 1, 14–23.18. Kang, J.H.; Chon, J.; Kim, Y.I.; Lee, H.J.; Oh, D.W.; Lee, H.G.; Han, C.S.; Kim, D.W.; Park, C.W. Preparation and evaluation
of tacrolimus-loaded thermosensitive solid lipid nanoparticles for improved dermal distribution. Int. J. Nanomed. 2019, 14,5381–5396. [CrossRef] [PubMed]
19. Sobanko, J.F.; Miller, C.J.; Alster, T.S. Topical anesthetics for dermatologic procedures: A review. Derm. Surg. 2012, 38, 709–721.[CrossRef] [PubMed]
20. Oskuie, A.B.; Nasrollahi, S.A.; Nafisi, S. Design, synthesis of novel vesicular systems using turpentine as a skin permeationenhancer. J. Drug Deliv. Sci. Technol. 2018, 43, 327–332. [CrossRef]
21. Lee, H.J.; Oh, D.W.; Na, M.J.; Kim, D.W.; Yuk, D.Y.; Choi, H.C.; Lee, Y.B.; Han, G.; Park, C.W. Preparation and in vivo evaluationof lecithin-based microparticles for topical delivery of minoxidil. Arch. Pharm. Res. 2017, 40, 943–951. [CrossRef]
22. Mehta, D.P.; Rathod, H.J.; Shah, D.P.; Shah, C.N. A review on microemulsion based gel: A recent approach for topical drugdelivery system. Res. J. Pharm. Technol. 2015, 8, 118–126. [CrossRef]
23. Kim, C.K..; Kim, J.; Chi, S.; Shim, C. Effect of fatty acids and urea on the penetration of ketoprofen through rat skin. Int. J. Pharm.1993, 99, 109–118. [CrossRef]
24. Dhal, S.; Pal, K.; Giri, S. Transdermal delivery of gold nanoparticles by a soybean oil-based oleogel under iontophoresis. ACS Appl.Bio Mater. 2020, 3, 7029–7039. [CrossRef]
25. Oh, D.W.; Kang, J.H.; Lee, H.J.; Han, S.D.; Kang, M.H.; Kwon, Y.H.; Jun, J.H.; Kim, D.W.; Rhee, Y.S.; Kim, J.Y.; et al. Formulationand in vitro/in vivo evaluation of chitosan-based film forming gel containing ketoprofen. Drug Deliv. 2017, 24, 1056–1066.[CrossRef] [PubMed]
26. Walker, R.B.; Smith, E.R. The role percutan penetration enhancers. Adv. Drug Deliv. Rev. 1996, 18, 295–301. [CrossRef]27. Mosallam, S.; Ragaie, M.H.; Moftah, N.H.; Elshafeey, A.H.; Abdelbary, A.A. Use of novasomes as a vesicular carrier for improving
the topical delivery of terconazole: In vitro characterization, in vivo assessment and exploratory clinical experimentation.Int. J. Nanomed. 2021, 16, 119–132. [CrossRef] [PubMed]
28. Vucinic-Milankovic, N.; Savic, S.; Vuleta, G.; Vucinic, S. Natural surfactant-based emulsion vehicles: A correlation betweencolloidal structure and in vitro release of diclofenac diethylamine. J. Disp. Sci. Technol. 2010, 31, 1077–1084. [CrossRef]
Pharmaceutics 2021, 13, 1468 17 of 18
29. Talele, P.; Sahu, S.; Mishra, A.K. Physicochemical characterization of solid lipid nanoparticles comprised of glycerol monostearateand bile salts. Colloids Surf. B Biointerfaces 2018, 172, 517–525. [CrossRef] [PubMed]
30. Wang, F.C.; Marangoni, A.G. Internal and external factors affecting the stability of glycerol monostearate structured emulsions.RSC Adv. 2015, 5, 93108–93116. [CrossRef]
31. Wang, F.C.; Peyronel, F.; Marangoni, A.G. Phase diagram of glycerol monostearate and sodium stearoyl lactylate.Cryst. Growth Des. 2016, 16, 297–306. [CrossRef]
32. Sone, T.; Hanamizu, T.; Ichioka, M.; Yokokura, T.; Yoshikawa, S.; Kondo-Yanai, N.; Hiraki, Y.; Esumi, K. Moisturizing effect ofvesicles formed from monoglycerides on human skin. Int. J. Cosmet. Sci. 1999, 21, 23–31. [CrossRef]
33. Wang, F.C.; Marangoni, A.G. Advances in the application of food emulsifier α-gel phases: Saturated monoglycerides, polyglycerolfatty acid esters, and their derivatives. J. Colloid Interface Sci. 2016, 483, 394–403. [CrossRef] [PubMed]
34. Hadgraft, J. Modulation of the barrier function of the skin. Ski. Pharmacol. Physiol. 2001, 14, 72–81. [CrossRef] [PubMed]35. Dabrowska, A.K.; Spano, F.; Derler, S.; Adlhart, C.; Spencer, N.D.; Rossi, R.M. The relationship between skin function, barrier
properties, and body-dependent factors. Ski. Res. Technol. 2018, 24, 165–174. [CrossRef] [PubMed]36. Zhou, Z.; Liu, C.; Wan, X.; Fang, L. Development of aw/o emulsion using ionic liquid strategy for transdermal delivery of
anti-aging component α–lipoic acid: Mechanism of different ionic liquids on skin retention and efficacy evaluation. Eur. J.Pharm. Sci. 2020, 141, 105042. [CrossRef]
37. Singh, B.; Beg, S.; Khurana, R.K.; Sandhu, P.S.; Kaur, R.; Katare, O.P. Recent advances in self-emulsifying drug delivery systems(SEDDS). Crit. Rev. Ther. Drug Carrier Syst. 2014, 31, 121–185. [CrossRef] [PubMed]
38. Ponto, T.; Latter, G.; Luna, G.; Leite-Silva, V.R.; Wright, A.; Benson, H.A.E. Novel self-nano-emulsifying drug delivery systemscontaining astaxanthin for topical skin delivery. Pharmaceutics 2021, 13, 649. [CrossRef]
39. Van Staden, D.; Du Plessis, J.; Viljoen, J.J.P. Development of a self-emulsifying drug delivery system for optimized topical deliveryof clofazimine. Pharmaceutics 2020, 12, 523. [CrossRef]
40. Badran, M.M.; Taha, E.I.; Tayel, M.M.; Al-Suwayeh, S.A. Ultra-fine self nanoemulsifying drug delivery system for transdermaldelivery of meloxicam: Dependency on the type of surfactants. J. Mol. Liq. 2014, 190, 16–22. [CrossRef]
41. El Maghraby, G.M. Self-microemulsifying and microemulsion systems for transdermal delivery of indomethacin: Effect of phasetransition. Colloids Surf. B Biointerfaces 2010, 75, 595–600. [CrossRef] [PubMed]
42. Alonso, C.; Larburu, I.; Bon, E.; González, M.M.; Iglesias, M.T.; Urreta, I.; Emparanza, J.I. Efficacy of petrolatum jelly for theprevention of diaper rash: A randomized clinical trial. J. Spec. Pediatr. Nurs. 2013, 18, 123–132. [CrossRef] [PubMed]
43. Fujii, M.; Nakamura, T.; Fukuno, S.; Mizutani, N.; Nabe, T.; Kohno, S. Ethanol aggravates itch-related scratching in hairless micedeveloping atopic dermatitis. Eur. J. Pharmacol. 2009, 611, 92–99. [CrossRef] [PubMed]
44. Xu, X.; Al-Ghabeish, M.; Krishnaiah, Y.S.; Rahman, Z.; Khan, M.A. Kinetics of drug release from ointments: Role of transient-boundary layer. Int. J. Pharm. 2015, 494, 31–39. [CrossRef]
45. Whitworth, C.W.; Asker, A.F. Effect of small-scale preparation techniques on diffusion of salicylic acid from various ointmentbases. J. Pharm. Sci. 1974, 63, 1618–1620. [CrossRef]
46. Bhagurkar, A.M.; Angamuthu, M.; Patil, H.; Tiwari, R.V.; Maurya, A.; Hashemnejad, S.M.; Kundu, S.; Murthy, S.N.; Repka, M.A.Development of an ointment formulation using hot-melt extrusion technology. AAPS Pharm. Sci. Tech. 2016, 17, 158–166.[CrossRef]
47. Omar, M.M.; Hasan, O.A.; El Sisi, A.M. Preparation and optimization of lidocaine transferosomal gel containing permeationenhancers: A promising approach for enhancement of skin permeation. Int. J. Nanomed. 2019, 14, 1551. [CrossRef]
48. López-Iglesias, C.; Quílez, C.; Barros, J.; Velasco, D.; Alvarez-Lorenzo, C.; Jorcano, J.L.; Moteiro, F.; Garcia-González, C. Lidocaine-loaded solid lipid microparticles (slmps) produced from gas-saturated solutions for wound applications. Pharmaceutics 2020,12, 870. [CrossRef]
49. Lee, H.J.; Kwon, Y.B.; Kang, J.H.; Oh, D.W.; Park, E.S.; Rhee, Y.S.; Kim, J.Y.; Shin, D.H.; Kim, D.W.; Park, C.W. Inhaled bosentanmicroparticles for the treatment of monocrotaline-induced pulmonary arterial hypertension in rats. J. Control Release 2021, 329,468–481. [CrossRef] [PubMed]
50. Bakonyi, M.; Gácsi, A.; Kovács, A.; Szucs, M.B.; Berkó, S.; Csányi, E. Following-up skin penetration of lidocaine from differentvehicles by Raman spectroscopic mapping. J. Pharm. Biomed. 2018, 154, 1–6. [CrossRef] [PubMed]
51. Muniz, B.V.; Baratelli, D.; Di Carla, S.; Serpe, L.; da Silva, C.B.; Guilherme, V.A.; Ribeiro, L.N.M.; Cereda, C.M.S.; Paula, E.;Volpato, M.C.; et al. Hybrid hydrogel composed of polymeric nanocapsules co-loading lidocaine and prilocaine for topicalintraoral anesthesia. Sci. Rep. 2018, 8, 17972. [CrossRef] [PubMed]
52. Wijaya, W.; Zheng, H.; Zheng, T.; Su, S.; Patel, A.R.; Van der Meeren, P.; Huang, Q. Improved bioaccessibility of poly-methoxyflavones loaded into high internal phase emulsions stabilized by biopolymeric complexes: A dynamic digestionstudy via TNO’s gastrointestinal model. Curr. Res. Nutr. Food Sci. 2020, 2, 11–19. [CrossRef] [PubMed]
53. Sweed, N.M.; Fayez, A.M.; El-Emam, S.Z.; Dawoud, M.H. Response surface optimization of self nano-emulsifying drug deliverysystem of rosuvastatin calcium for hepatocellular carcinoma. Int. J. Pharm. Investig. 2021, 51, 85–101. [CrossRef]
54. Tran, P.; Park, J.S. Recent trends of self-emulsifying drug delivery system for enhancing the oral bioavailability of poorlywater-soluble drugs. Int. J. Pharm. Investig. 2021, 1–25.

Pharmaceutics 2021, 13, 1468 18 of 18
55. Lee, H.J.; Kang, J.H.; Lee, H.G.; Kim, D.W.; Rhee, Y.S.; Kim, J.Y.; Park, E.S.; Park, C.W. Preparation and physicochemicalcharacterization of spray-dried and jet-milled microparticles containing bosentan hydrate for dry powder inhalation aerosols.Drug Des. Dev. Ther. 2016, 10, 4017–4030. [CrossRef] [PubMed]
56. Park, C.W.; Lee, H.J.; Oh, D.W.; Kang, J.H.; Han, C.S.; Kim, D.W. Preparation and in vitro/in vivo evaluation of PLGA micro-spheres containing norquetiapine for long-acting injection. Drug Des. Dev. Ther. 2018, 12, 711–719. [CrossRef] [PubMed]
57. Kim, N.A.; Oh, H.K.; Lee, J.C.; Choi, Y.H.; Jeong, S.H. Comparison of solubility enhancement by solid dispersion and micronizedbutein and its correlation with in vivo study. Int. J. Pharm. Investig. 2021, 51, 53–60. [CrossRef]