PREPARATION AND CHARACTERIZATION OF NAPROXEN LOADED MICROEMULSION FORMULATIONS FOR DERMAL...
10
Neslihan Üstündağ Okur, et al. Int J Pharm 2014; 4(4):33-42 ISSN 2249-1848 www.pharmascholars.com 33 Research article CODEN: IJPNL6 PREPARATION AND CHARACTERIZATION OF NAPROXEN LOADED MICROEMULSION FORMULATIONS FOR DERMAL APPLICATION Neslihan Üstündağ-Okur * , Mehmet Ali Ege, H. Yeşim Karasulu Department of Pharmaceutical Technology, Faculty of Pharmacy, University of Ege, 35100 Bornova, Izmir, Turkey *Corresponding author e-mail: [email protected] ABSTRACT The aim of this study was to prepare new w/o microemulsions of naproxen (Np) for topical application and evaluate in vitro permeation of Np. The Pseudo-ternary phase diagrams were constructed for various microemulsions composed of isopropyl myristate (IPM) as oil phase, Span 80, Labrafil M, Labrasol, Cremophor EL as surfactants, ethanol as co-surfactant and water as aqueous phase. Finally, concentration of Np in all microemulsions was 10% (w/w). The physicochemical properties of microemulsions such as conductivity, droplet size, viscosity and pH were measured. The in vitro permeability of Np compared with commercial (C) and microemulsions. The permeation rates of Np from microemulsions were higher (1.2 times) than C gel formulation. Finally, according the histological examination of microemulsions did not show irritant effect on treated skin. In conclusion, the results of this study indicated that the microemulsions especially M2 Np can be considered as potentially useful vehicles for topical application of Np. KEYWORDS: histological evaluation, in vitro permeation, microemulsion, naproxen, topical application INTRODUCTION Microemulsions are homogeneous, transparent; thermodynamically stable dispersions optically isotropic liquid system of oil and water, stabilized by a suitable surfactant and cosurfactant [1-5] . Compared to conventional formulations microemulsions have some advantages such as improved drug solubility, simplicity of preparation, good thermodynamic stability and low viscosity, high drug loading ability, small droplet size and enhancing effect on transdermal capacity. There are numerous permeation enhancement mechanisms of microemulsions such as an increased concentration gradient and thermodynamic activity toward skin and permeation enhancement activity of the components of microemulsions [1,4,6-11] . Microemulsions provide another promising alternative for transdermal delivery of both hydrophilic and lipophilic drugs [5,11] . Naproxen (Np), (s)-6-methoxy-α-methyl-2- naphthalenenacetic acid (Figure 1), is a non-steroidal anti-inflammatory drug (NSAID) compound with analgesic and antipyretic effects, used for treatment of rheumatoid arthritis, osteoarthritis and traumatic conductions [12] . NSAIDs are most commonly used drugs to reduce inflammation and pain. Oral therapy of NSAIDs is very effective, but the clinical use is often inadequate because of their adverse effects such as irritation and ulceration of the gastro-intestinal mucosa. The eradication of these difficulties is possible by developing drug carriers so as to allow the dermal application of the drug [12-14] . The popularity of topical drug delivery systems is increasing, because of their advantages compared to more conventional treatments [15] . Topical drug delivery has many advantages over the oral route of administration: it avoids hepatic metabolism, the administration is easier and more convenient for the patient, and there is the possibility of immediate withdrawal of the treatment if necessary [16,17] . Compared to oral route, the dermal route of drug administration has the advantages of decreasing gastrointestinal side effects and drug degradation [18] . International Journal of Pharmacy Journal Homepage: http://www.pharmascholars.com
Transcript of PREPARATION AND CHARACTERIZATION OF NAPROXEN LOADED MICROEMULSION FORMULATIONS FOR DERMAL...
Neslihan Üstündağ Okur, et al. Int J Pharm 2014; 4(4):33-42 ISSN 2249-1848
www.pharmascholars.com 33
Research article CODEN: IJPNL6
PREPARATION AND CHARACTERIZATION OF NAPROXEN LOADED
MICROEMULSION FORMULATIONS FOR DERMAL APPLICATION
Neslihan Üstündağ-Okur
*, Mehmet Ali Ege, H. Yeşim Karasulu
Department of Pharmaceutical Technology, Faculty of Pharmacy, University of Ege, 35100
Bornova, Izmir, Turkey
*Corresponding author e-mail: [email protected]
ABSTRACT
The aim of this study was to prepare new w/o microemulsions of naproxen (Np) for topical application and evaluate
in vitro permeation of Np. The Pseudo-ternary phase diagrams were constructed for various microemulsions
composed of isopropyl myristate (IPM) as oil phase, Span 80, Labrafil M, Labrasol, Cremophor EL as surfactants,
ethanol as co-surfactant and water as aqueous phase. Finally, concentration of Np in all microemulsions was 10%
(w/w). The physicochemical properties of microemulsions such as conductivity, droplet size, viscosity and pH were
measured. The in vitro permeability of Np compared with commercial (C) and microemulsions. The permeation
rates of Np from microemulsions were higher (1.2 times) than C gel formulation. Finally, according the histological
examination of microemulsions did not show irritant effect on treated skin. In conclusion, the results of this study
indicated that the microemulsions especially M2Np can be considered as potentially useful vehicles for topical
application of Np.
KEYWORDS: histological evaluation, in vitro permeation, microemulsion, naproxen, topical application
INTRODUCTION
Microemulsions are homogeneous, transparent;
thermodynamically stable dispersions optically
isotropic liquid system of oil and water, stabilized by
a suitable surfactant and cosurfactant [1-5]
. Compared
to conventional formulations microemulsions have
some advantages such as improved drug solubility,
simplicity of preparation, good thermodynamic
stability and low viscosity, high drug loading ability,
small droplet size and enhancing effect on
transdermal capacity. There are numerous permeation
enhancement mechanisms of microemulsions such as
an increased concentration gradient and
thermodynamic activity toward skin and permeation
enhancement activity of the components of
microemulsions [1,4,6-11]
. Microemulsions provide
another promising alternative for transdermal
delivery of both hydrophilic and lipophilic drugs [5,11]
.
Naproxen (Np), (s)-6-methoxy-α-methyl-2-
naphthalenenacetic acid (Figure 1), is a non-steroidal
anti-inflammatory drug (NSAID) compound with
analgesic and antipyretic effects, used for treatment
of rheumatoid arthritis, osteoarthritis and traumatic
conductions [12]
.
NSAIDs are most commonly used drugs to reduce
inflammation and pain. Oral therapy of NSAIDs is
very effective, but the clinical use is often inadequate
because of their adverse effects such as irritation and
ulceration of the gastro-intestinal mucosa. The
eradication of these difficulties is possible by
developing drug carriers so as to allow the dermal
application of the drug [12-14]
.
The popularity of topical drug delivery systems is
increasing, because of their advantages compared to
more conventional treatments [15]
. Topical drug
delivery has many advantages over the oral route of
administration: it avoids hepatic metabolism, the
administration is easier and more convenient for the
patient, and there is the possibility of immediate
withdrawal of the treatment if necessary [16,17]
.
Compared to oral route, the dermal route of drug
administration has the advantages of decreasing
gastrointestinal side effects and drug degradation [18]
.
International Journal of Pharmacy Journal Homepage: http://www.pharmascholars.com

Neslihan Üstündağ Okur, et al. Int J Pharm 2014; 4(4):33-42 ISSN 2249-1848
www.pharmascholars.com 34
The goal of this study is to develop new Np loaded
water in oil microemulsion formulations for dermal
application and to evaluate physiologic
characterization of microemulsions and in vitro
permeation of Np. To confirm the dermal use of
microemulsion formulations, the dorsal skins of rats
treated with microemulsion were histologically
examined and the findings compared to that of
control rats treated with either the C gel formulation
or serum physiologic (SP).
MATERIALS AND METHODS
Materials: Isopropyl myristate (IPM) and
Cremophor-EL ((Polyoxyethylenglyceroltriricinoleat
35) were purchased from Sigma, Germany. Span 80
(Sorbitan monooleate) and ethanol were obtained
from Merck, Germany. Labrafil-M and Labrasol
(Glyceryl caprylate/caprateand PEG-8
caprylate/caprate) were gift from Gattefosse, France.
Np was a gift from Deva Holding, Turkey. The
cellulose membrane (molecular weight cut-
off=12,000–14,000) was provided by Sartorius,
Germany. All chemicals were used as analytical
grade.
Microemulsion preparation: Pseudo-ternary phase
diagrams were constructed to find out the existence
range of microemulsions, by titration of a series of oil
and surfactant/co-surfactant (S/Cos) mixtures with
bidistilled water at 25 ± 2 oC. The boundaries of the
microemulsion domains were determined for
different values of the S/Cos (w/w) ratios. S/Cos
weight ratios were varied as 1:1, 1:2, 1:3, 1:4, 1:5,
1:6, 1:7, 1:8, 1:9, 2:1, 3:1, 4:1, 5:1, 6:1, 7:1, 8:1 and
9:1. The oily mixtures were visually assessed and
determined as microemulsions. Based on these
pseudo-ternary phase diagrams, appropriate
concentrations of oil, surfactants and cosurfactant
were selected. All experiments replicated at least
three times.
Microemulsions were prepared using IPM as oil
phase, Span 80, Labrafil-M, Labrasol and Cremophor
EL as surfactants, ethanol as co-surfactant and
bidistilled water as aqueous phase. All
microemulsion formulations were prepared in the
same way.
After the microemulsion regions in the phase diagram
were selected, two typical microemulsion vehicles
(M1 and M2) were selected and prepared at different
component ratios. Np was slowly incorporated into
the microemulsion after microemulsion was
prepared. After Np was entirely dissolved in the
miroemulsion, the clear microemulsion-based
formulation was obtained. The final concentration of
Np in microemulsion systems (M1Np and M2Np) was
10% (w/w) (100 mg/g) (Table 1). No phase change
was noted after addition of Np.
Characterization of the microemulsion
formulations: The microemulsions in the presence
or absence of Np were analyzed for various
physicochemical attributes. The viscosities of
microemulsion formulations in the presence or
absence of Np were measured at 25±2 oC using a
viscosimeter (ULA spindle, Brookfield, USA). The
pH of the microemulsion formulations in the
presence or absence of Np were detected at 25±2 oC
using a digital pH-meter (HI 221 – Mauritius). The
refractive indexes of microemulsions in the presence
or absence of Np were evaluated at 25±2 oC using a
refractometer (Atago RX-7000 CX- Japan). The
average droplet size and polydispersity index (PDI)
of microemulsion formulations in the presence or
absence of Np were studied by photon correlation
spectroscopy (Nano ZS, Malvern Instruments, U.K.).
The dynamic light scattering (DLS) experiments
were performed on a Zetasizer Nano ZS (Malvern
Instrument Laboratory, Malvern, U.K.) instrument
employing a He–Ne laser operated at 4mW (λo = 633
nm), and a digital correlator.
Electrical conductivity of the microemulsions in the
presence or absences of Np were studied at 25 ± 2 oC
using a conductometer (Jenway 4071 – U.K.). Based
on electrical conductivity, the phase systems of the
microemulsions in the presence or absence of Np
were determined. The experiments were carried out
five times for each sample, and the results are
presented as an average ± SD.
Transmission electron microscopy (TEM): The
shape and surface morphology of microemulsion
were examined by the transmission electron
microscopy (TEM, FEI Tecnai G2 120kV,
Netherlands). For observation by TEM, a drop of
microemulsion formulation in the presence or
absence of Np (M1Np, M2Np) (1 mL) was placed on
300 mesh copper electron microscopy grids and
allowed to stand for 10 min after which any excess
fluid was absorbed in a filter paper. Then the sample
was quickly frozen at liquid nitrogen, followed by
freeze-dried at - 55 °C. Before examination, one drop
of 1% osmium tetrachloride was applied for fixation
and allowed to dry for 5 min. Then the sample was
quickly frozen at liquid nitrogen, followed by freeze-
dried at - 55 °C again [19]
.
Stability of the microemulsion formulations: In the
stability studies, the microemulsions in the presence
or absence of Np were stored at 5±2, 25±2 and 40±2
°C for 12 months. After storage for 12 months the
clarity, phase separation, concentration of Np were

Neslihan Üstündağ Okur, et al. Int J Pharm 2014; 4(4):33-42 ISSN 2249-1848
www.pharmascholars.com 35
investigated and the microemulsion formulations
were also evaluated for changes in particle size,
electrical conductivity, viscosity, pH and refractive
index. The centrifuge tests were carried out at 12000
rpm at 25±2oC for 30 min to assess the physical
stability of microemulsions [20]
. In order to evaluate
the stability during the temperature changes,
formulations were frozen at −20±2°C for 30 min and
thawed at 40±2°C for 15 min. after repeating this
cycle for 4 times; the appearance of the formulations
was examined. In the chemical stability tests,
concentration of Np in the formulations was analyzed
as spectrophotometrically at 5±1oC, 25±2
oC and
40±2oC for up to 12 months.
In vitro permeation studies: Diffusion cell was used
to study the permeability of Np. The apparatus
consisted of clamped preconditioned cellulose
membrane (Sarttorius, Germany) onto glass diffusion
cell between donor and receptor compartments. The
cellulose membrane was first hydrated in a buffer
solution at 20±1oC for 12h. Phosphate buffer pH 7.4
(10 mL, 600 rpm) was used in the receptor
compartment. Temperature was maintained at 37±1 oC with the help of a circulating water bath. The
donor compartment contained 500 mg microemulsion
formulations (containing 50 mg Np) or C gel
formulation (one gram gel contained 100 mg Np).
Samples were filtered through a membrane filter (0.2
µm Nylon, Milipore Millex-GN) and the aliquots (1
mL) withdrawn at various intervals were immediately
analyzed for drug concentration as
spectrophotometrically (263 nm). Calibration and
assay of Np was carried out using UV
spectrophotometer at 263 nm. Each experiment
replicated independently 5 times. Sink conditions
were maintained in the receptor compartment during
in vitro permeation studies.
Permeation data analysis: Average values of in
vitro permeation data were calculated and cumulative
amount of drug (mg cm−2
) permeated per unit surface
area of the membrane was plotted versus time. The
slope of the linear portion of the plot was calculated
as flux (Jss) [21,22]
and the permeability coefficient
was calculated using Equation 1:
Where Kp is permeability coefficient and Cv is total
amount of the drug.
Kinetic evaluation and determination of release
mechanism: Kinetic evaluation of Np release from
microemulsions and C gel formulation were
estimated using a computer based kinetic program [23]
. Zero-order, First-order and Higuchi kinetic
models were used for evaluation and determination of
the release mechanism [24,25]
.
Determination of Np release from microemulsions
and C gel formulation were estimated [26]
Equation 2:
Mt / M∞ = Ktn
Mt/M∞; the fraction of drug released, t; released time,
k; release rate constant and n is the release exponent.
The n value is used to characterize different release
mechanisms as given in Table 1 [27]
.
Histological studies of microemulsions: The
experimental protocol was approved by the Local
Animal Ethical Committee of Ege University,
Faculty of Pharmacy (Approval No. 2008/3-1). Male
wistar albino rats weighting 250±10 g were
purchased from Experimental Animal Center of Ege
University (Izmir, Turkey) for the histology studies.
The dorsal part of the rat skin was carefully shaved.
Rats were housed in a room maintained at 22 ± 1°C
with an alternating 12 hour light-dark cycle. Animals
had free access to pellet diet and water ad libitum.
Microemulsion formulations, serum physiologic (SP)
(Negative control) and C gel formulation (Positive
control) were dermally applied on the dorsal skin of
male wistar albino rat for 24 hours. 500 mg
microemulsions, SP or C gel were applied for 24
hours on the excised skin. Rats were sacrificed by
carbon dioxide gas 1 day later. The formulations
were removed; dorsal side of rat skin were dissected
and further processed for light microscopy. Each
specimen was fixed in a 10 % formaline solution for
approximately 24 h; then washed with tap water,
dehydrated through an increasing ethanol series,
immersed in xylene and were finally embedded in
paraffine wax at 56oC. Paraffine blocks were cut
serially 5µm using a rotary microtome (RM 2145,
Leica Co., Nussloch Germany). Sections were stained
with Hematoxylene & Eosine and examined by light
microscope (Olympus BX-51, Japan).
Statistical data analysis: All permeation values
were calculated for three independent experiments,
and data are expressed as the mean value ± S.D
(Standard Deviation). The statistical analysis were
performed on the collected data , One way analysis of
variance (ANOVA) was used to test the difference
between the means of microemulsion formulations
and C gel formulation permeation experiments. The
results with P < 0.05 are considered statistically
significant.
RESULTS AND DISCUSSION
Microemulsion preparation: The production of
pseudo-ternary phase diagrams was used to
determine the concentration range of components in
Neslihan Üstündağ Okur, et al. Int J Pharm 2014; 4(4):33-42 ISSN 2249-1848
www.pharmascholars.com 36
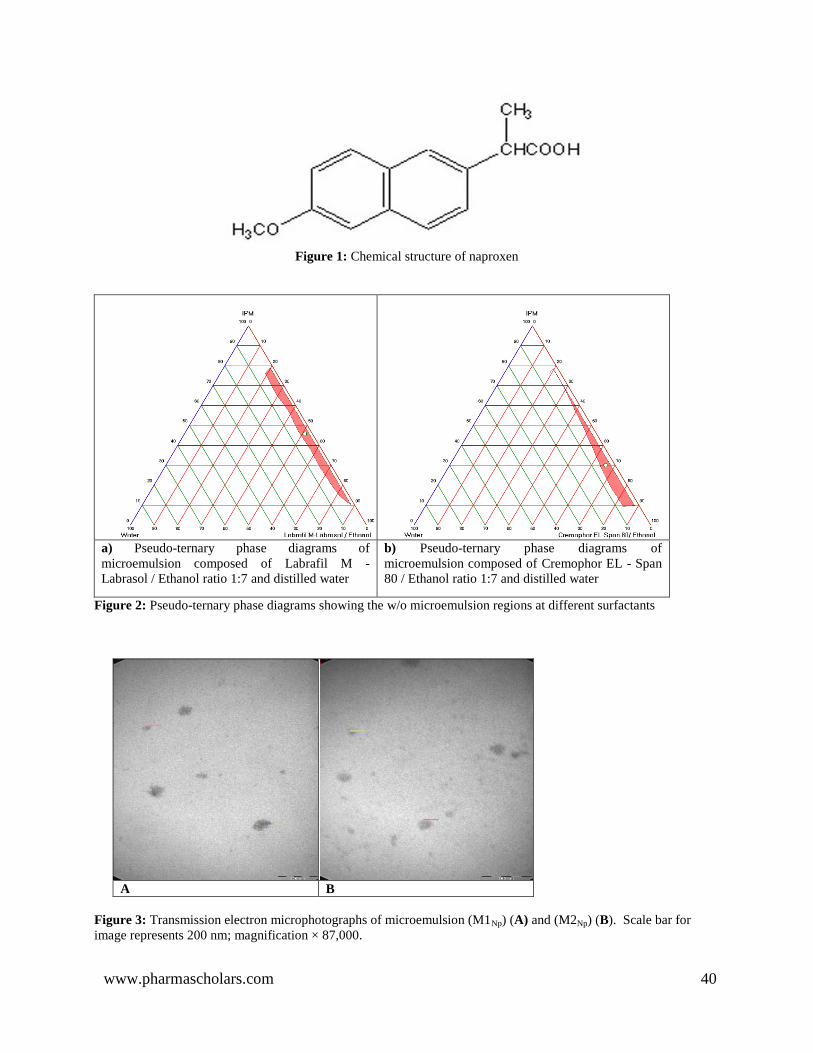
the presence range of microemulsion. The pseudo-
ternary phase diagrams with various weight ratios of
IPM, Labrafil M, Labrasol, Span 80, Cremophor EL,
ethanol and distilled water were described in Figure
2. Microemulsions areas obtained using various
S/Cos ratios.
Various microemulsion formulations (M1 and M2)
were selected from gravity midpoint of the phase
diagrams. Based on these diagrams, different
microemulsions within the center of gravity region
were prepared to evaluate the effects of
microemulsion structure with various surfactants on
the permeation skill. Compositions of the
microemulsion formulations (M1Np and M2Np) were
given at Table 2.
Characterization of the microemulsion
formulations: The physicochemical
characterizations of microemulsions in the presence
or absence of Np were measured and reported in
Table 3. Incorporating the co-surfactant into the
microemulsion resulted in a significant reduction in
the viscosity of the formulations, with the flow
changing to a simple Newtonian flow. Therefore, the
viscosities of M1NP and M2NP were found to be
14.2±0.05 cP and 15.1±0.02 cP, respectively. The
results indicated that the dynamic viscosity of the
formulations has very low range. The average pH
value of microemulsions ranged from 4.83±0.01 to
5.92±0.01. The incorporation of Np into M1 and M2
increased the pH values (Table 3). The pH of the
microemulsion formulations was appropriate for
topical delivery of Np. The average refractive index
of microemulsions ranged from 1.409±0.001 to
1.415±0.001 (Table 3).
There was a robust relationship between the specific
structure of the microemulsion systems and their
electrical conductive behaviour 9. The phase systems
(o/w or w/o) of the microemulsions were determined
by measuring the conductivity (Jenway 4071 – U.K.)
of the microemulsions [6]
. The results of electrical
conductivimetry analysis showed that microemulsion
was in the form of water-in-oil phase system, which
could be regarded as appropriate for topical
applications.
The droplet sizes of the microemulsion formulations
were examined by photon correlation spectroscopy.
In the absence of Np, the average droplet size of M1
and M2 was 1.813±0.050 nm and 1.809±0.030 nm,
respectively. However, in the presence of Np, the
average droplet sizes of M1Np and M2Np were
1.590±0.114 nm and 1.701±0.060 nm, respectively.
In addition, the incorporation of Np into M1 and M2
resulted in a 0.3 to 0.1 nm decrease in the average
droplet size (Table 3). These findings support a
recent study that found the mean droplet size was
decreased after loading the drug [28,29]
. The
polydispersity values demonstrated the homogeneity
in the droplet size. All polydispersity values were
smaller than 0.5. Therefore, these results indicate that
the droplet size had high homogeneity.
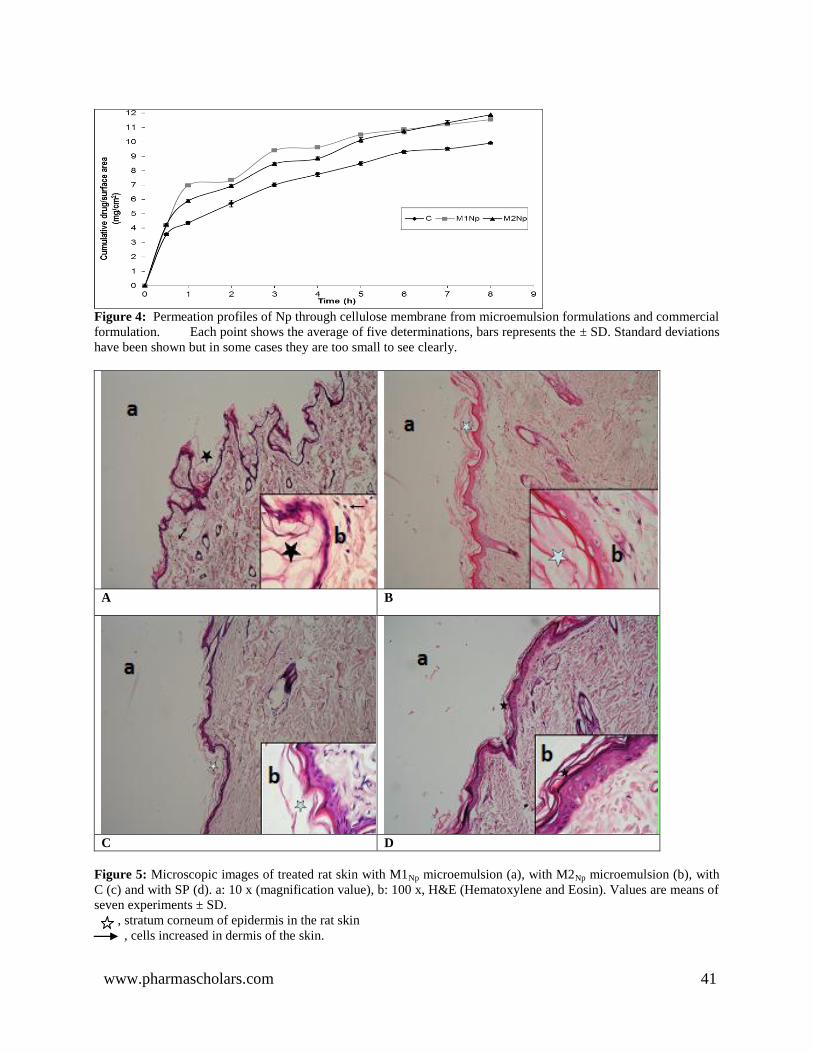
Transmission electron microscopy (TEM): The
shape and morphology of microemulsions by TEM
analysis was shown in Figure 3. It showed the
spherical shape and uniform droplet size of
microemulsion. TEM image of M1Np and M2Np
(Figure 3A and 3B) showed that the diameters of
most particles were below 10 nm with narrow
distribution.
Stability of the microemulsion formulations: The
stability tests of all microemulsion formulations were
completed at 5±1oC, 25±2
oC and 40±2
oC for 12
months. The changes were not observed during 12
months in particle size, electrical conductivity,
viscosity, pH, refractive index, phase separation and
degradation of Np loaded microemulsions. The
microemulsion vehicles were isotropic, transparent
dispersions, and after centrifugation, no phase
separation was observed. The centrifuge tests
showed that all microemulsions had good physical
stability. The formulations also remained stable after
the temperature test, which indicated that their
stability under different temperature conditions.
Microemulsions which were kept at 5±1oC, 25±2
oC
and 40±2oC showed no change in clarity and phase
behaviour. The concentrations of Np in
microemulsions were almost constant and no
degradation was detected. The hydrolysis of Np in
microemulsions was not determined during 12
months. The results showed that microemulsion
formulations had good shelf stability and so
microemulsions should be kept at 5±1 o
C, 25±2 o
C
and 40±2 oC for 12 months.
In vitro permeation studies: The cumulative
amounts of Np through cellulose membrane from the
microemulsions were evaluated and it was also found
that the Np permeation rate values from the
microemulsion formulations significantly higher than
C formulation from cellulose membrane (P<0.05).
The permeation parameters of microemulsions (M1Np
and M2Np) and C formulation were presented in
Table 4. No significant difference was found between
the releases rates of NP of microemulsion
formulation that of C formulation
(P˃0.05). Statistical comparison of the flux
throughout cellulose membrane for 8 hour showed
that the microemulsions provided fluxes higher than
the commercial formulation. In Figure 4, the rank
order for in vitro release of Np from the three
Neslihan Üstündağ Okur, et al. Int J Pharm 2014; 4(4):33-42 ISSN 2249-1848
www.pharmascholars.com 37
formulations was found to be: M2Np > M1Np > C.
M2Np microemulsion formulation with the highest
permeation rate (1.207±0.022g/cm2/h) involved of
IPM (2.135 g), Span 80 (0.570 g), Cremophor EL
(0.228 g), Ethanol (5.586 g), bidistilled water (0.481
g) and Np (1 g). In a similar our previous study, when
the microemulsion formulation contains Span 80 as a
surfactant, the in vitro release of Np was determined
highest permeation rate [30]
. The microemulsions
were able to reduce the interface tension between
vehicle and skin because of their contact to the skin
lipids, which resulted in faster permeation [31]
.
Moreover, the surfactant and cosurfactant in the
microemulsions may reduce the diffusional barrier of
the stratum corneum by acting as permeation
enhancers [6]
. In the present study, microemulsion
formulations consisted of IPM as oil phase. IPM is an
effective penetration enhancer that enables an
extensive permeation [31-33]
. Ethanol was shown to
extract stratum corneum lipids and to disrupt barrier
purpose, which improved the permeation of more
hydrophilic drugs through the skin [6]
.
Kinetic evaluation: The mathematical parameters of
microemulsion formulations and commercial
formulation were presented in Table 5 and Table 6.
The diffusional exponents (n) of Peppas equation are
very low indicating that the drug release mechanism
is non-Fickian diffusion (Table 6). This result is very
normal for dissolutions of gels (C) and emulsions
(M1Np – M2Np) type dosage forms. In addition, first
order kinetic is dominant for hydrophilic gels (C) and
Higuchi for microemulsions. These kinetic results fit
the results of Peppas analyses. Because above
mentioned kinetic models related non-Fickian
diffusion.
The model that gave higher ‘r’ value was considered
as best fit model. The release of Np (in the M1Np
formulation) across cellulose membrane followed
Higuchi kinetics as its correlation coefficient
(r=0.951) predominated over zero-order kinetics
(r=0.923). This may indicate that the diffusion of Np
in microemulsion matrix retards in the late stage of
its dermatopharmacokinetics. This is consistent with
Wang et al., who have suggested that the topical
formulations could be followed Higuchi kinetics [34]
.
The release of Np (in the M2Np formulation) across
cellulose membrane followed Zero Order kinetics as
its correlation coefficient (r=0.981) predominated
over Higuchi kinetics (r=0.979). This finding was in
accordance with other reported works [33,35]
.
The diffusion mechanism of drug release was further
confirmed by Peppas plots that showed fair linearity
(r2 values between 0.898 and 0.997), with slope
values (n) less than 0.5, indicating that drug release
mechanism of the formulations was diffusion
controlled (Table 6).
Microemulsion histological evaluation: To
understand the effect of microemulsion formulations
on the skin irritation, the skin was pathologically
investigated after use of formulations. The histology
of excised dorsal rat skin in control and treated with
microemulsions and C formulation after 24 hours is
shown in Figure 5. In histological evaluation,
epidermal liquefaction, dermal oedema was
considered as the key criteria to distinguish the effect
of Np. The microscopic observations indicate that the
microemulsions have no severe effect on the
microscopic structure of the skin. The surface
epithelium lining and the granular cellular structure
of the skin were totally intact. No main changes in
the ultra-structure of skin morphology could be seen
and the epithelial cells appeared mostly unchanged.
Visible irritation was not observed after the
application of SP (Group 3) (Figure 5D). No damage
in the epidermal layers and no inflammation in the
dermal layers were found in the skins applied with SP
(negative control).
It was observed that there was no apparent change in
skin morphology after the application of SF and
M2Np (Figure 5D and 5B). In terms of epidermal
disruption, when compared to the control (SF), C and
M1NP formulations displayed low levels of disruption
on the stratum corneum. Stratum corneum of the
treated skin remained intact when applied M2Np. In
Group 2; the stratum corneum layer became thinner
and subjacent layers remained after the application of
the C formulation (Figure 5C). Regarding of dermal
inflammation and oedema, compared to the SF group,
the group treated with C displayed low grade of
inflammation and oedema, at the same time moderate
grade of inflammation and oedema obtained with
M1NP. No inflammation and oedema were observed
in the group treated with M2NP (Table7).
IPM is widely used in cosmetics and topical
formulations and is generally regarded as nontoxic.
The irritation studies did not show visible irritation
after application of M1Np - M2Np. Thus the developed
microemulsions were considered to be safe for the
use of dermal drug delivery. Hence this
microemulsion system for the transdermal delivery of
Np is viable. These histological findings were
consistent with previous reports that compared to the
control, stratum corneum of the treated skin remained
intact [22,36]
.
CONCLUSIONS
Novel microemulsions containing Np were prepared
with the aim of achieving maximum release through

Neslihan Üstündağ Okur, et al. Int J Pharm 2014; 4(4):33-42 ISSN 2249-1848
www.pharmascholars.com 38
the skin thus eliminating its gastrointestinal adverse
effects. For the formulation of microemulsions
containing Np, the proper components and their
optimum concentration ranges were obtained by
using pseudo-ternary phase diagrams. Thus a
microemulsion was successfully prepared using IPM
oil phase, Span 80, Labrafil-M, Labrasol and
Cremophor EL as surfactants, ethanol as cosurfactant
and water. The fluxes of microemulsions were better
than C gel formulation in the in vitro release studies.
In this study the findings revealed that microemulsion
formulations which have been used as dermal
delivery carriers for anti-inflammatory drugs among
which M2NP is more suitable microemulsion
formulation which has better permeation effect than
C formulation. The release of NP fits well to the zero
order and Higuchi model. Furthermore, irritation and
histological studies clearly illustrated that the
microemulsion formulations are safe for the skin.
Therefore the microemulsion of NP was prepared to
obtain improved patient compliance. The developed
system displayed greater penetration, also enables the
decrease in the number of applications of gels per
day. The Np loaded microemulsion is advantageous
for dermal use because it is well-tolerated in the skin
and seemed to provide a higher degree of
bioavailability. Finally, according to these results of
the characterization, in vitro permeation and
histology studies, microemulsion formulations were
found to be appropriate vehicle for the dermal
application of Np.
ACKNOWLEDMENT
The authors would like to thank Assoc. Professor Dr
Altuğ Yavaşoğlu for professional assistance in the
histological studies. This study was supported by
University of Ege, Faculty of Pharmacy and
Department of Pharmaceutical Technology
(08/ECZ/006).
AUTHOR DISCLOSURE STATEMENT
The authors reveal there is no conflict of interest
regarding this manuscript.
Table 1: Diffusion exponent and solute release mechanism for cylindrical shape
Diffusion exponent (n) Diffusion mechanism
0.45 Fickian diffusion
0.45 < n < 0.89 Anomalous (non-Fickian) diffusion
0.89 Case-II transport
n > 0.89 Super case-II transport
Table 2: Compositions and HLB values of the microemulsion formulations
Formulations M1 (w/o) M2 (w/o)
Formulation Components Formulation Components
HLB value 5.66 6.64
M1(% )(w/w) M1Np (g) M2(%) (w/w) M2Np (g)
IPM 26.02 2.342 23.72 2.135
Labrafil-M 7.39 0.665 - -
Labrasol 1.47 0.132 - -
Span 80 - - 6.33 0.570
Cremophor EL - - 2.53 0.228
Ethanol 62.09 5.588 62.07 5.586
Distilled water 3.03 0.273 5.34 0.481
Naproxen - 1 - 1
Final concentration of Np in all microemulsion is 10 % (w/w).

www.pharmascholars.com 39
Table 3: Pysicochemical characterizations of microemulsion formulations in the presence or absence of Np at 25 oC.
Values are means of five determinations ± SD.
Codes
pH Conductivity
(µs/cm)
Viscosity
(cP)
Droplet Size
(nm)
Polydispersity
index
Refractive
index
M1 5.12 ± 0.02 21.1 ± 0.02 14.2 ± 0.05 1.813 ± 0.050 0275 ± 0.030 1.410 ± 0.001
M2 4.83 ± 0.01 24.8 ± 0.03 15.1 ± 0.02 1.809 ± 0.030 0.360 ± 0.030 1.409 ± 0.001
M1Np 5.92 ± 0.01 21.6 ± 0.03 14.2 ± 0.05 1.590 ± 0.114 0.396 ± 0.040 1.415 ± 0.001
M2Np 5.33 ± 0.02 25.9 ± 0.04 15.1 ± 0.02 1.701 ± 0.060 0.369 ± 0.029 1.411 ± 0.002
Table 4: The permeation parameters of the Np loaded microemulsions and commercial formulation. Values are
means of five determinations ± SD.
Formulations (mg/cm2) Jss (mg/cm
2/h) D*10
-7 (cm
2/h)
M1Np 11.560±0.031 1.140±0.003 1.66±0.020
M2Np 11.894±0.141 1.207±0.022 1.94±0.035
C 9.920±0.165 0.992±0.016 2.47±0.353
Table 5: The mathematical parameters of the Np loaded microemulsions and C formulation with in vitro permeation
study
Kinetic Model C M1Np M2Np
r2 K r2 K r2 K
First Order 0.9951 4.9256 0.9151 405.140 0.9330 161.4023
Higuchi 0.9894 22.271 0.9514 63.826 0.9790 25.9421
Zero Order 0.9483 11,395.94 0.9237 22,796.10 0.9819 12, 916.75
Table 6: Peppas values (n) of the Np loaded microemulsions and C formulation with in vitro permeation study
C M1Np M2Np
r2 0.9979 0.8987 0.9734
n 0.4181 0.4067 0.3305
Log k 1.5848 1.7245 1.7076
Table 7: Epidermal disruption and Dermal inflammation and oedema degrees layers of the skin (-----: no effect; +:
Weak; ++: Moderate; +++: Severe).
GROUPS
Disruption Degrees of Epidermal Layers Inflammation and Oedema
Degrees of Dermal Layers
Stratum
corneum
Stratum
lucidum
Stratum
granulosum
Stratum
spinosum
Stratum
basale
Stratum
papillare
Stratum
reticulare
Group I
M1Np + ----- ----- ----- ----- ++ ++
M2Np ----- ----- ----- ----- ----- ----- -----
Group II C + ----- ----- ----- ----- + +
Group III SP ----- ----- ----- ----- ----- ----- -----
www.pharmascholars.com 40
Figure 1: Chemical structure of naproxen
a) Pseudo-ternary phase diagrams of
microemulsion composed of Labrafil M -
Labrasol / Ethanol ratio 1:7 and distilled water
b) Pseudo-ternary phase diagrams of
microemulsion composed of Cremophor EL - Span
80 / Ethanol ratio 1:7 and distilled water
Figure 2: Pseudo-ternary phase diagrams showing the w/o microemulsion regions at different surfactants
A B
Figure 3: Transmission electron microphotographs of microemulsion (M1Np) (A) and (M2Np) (B). Scale bar for
image represents 200 nm; magnification × 87,000.
www.pharmascholars.com 41
Figure 4: Permeation profiles of Np through cellulose membrane from microemulsion formulations and commercial
formulation. Each point shows the average of five determinations, bars represents the ± SD. Standard deviations
have been shown but in some cases they are too small to see clearly.
A B
C D
Figure 5: Microscopic images of treated rat skin with M1Np microemulsion (a), with M2Np microemulsion (b), with
C (c) and with SP (d). a: 10 x (magnification value), b: 100 x, H&E (Hematoxylene and Eosin). Values are means of
seven experiments ± SD.
, stratum corneum of epidermis in the rat skin
, cells increased in dermis of the skin.

www.pharmascholars.com 42
REFERENCES
1. Karasulu HY. Expet Opin Drug Deliv, 2008; 5: 119-35.
2. Binks BP, Espert A, Fletcher PDI, Soubiran L. Colloid Surface A, 2003; 212: 135-45.
3. Huang YJ, Yates MZ. Colloid Surface A, 2006; 281: 215-20.
4. Jadhav KR, Shaikh IM, Ambade KW, Kadam VJ. Curr Drug Deliv, 2006; 3: 267-73.
5. Lawrence MJ, Rees GD. Adv Drug Deliv Rev, 2000; 45: 89-121.
6. Peltola S, Saarinen-Savolainen P, Kiesvaara J, Suhonen TM, Urtti A. Int J Pharm, 2003; 254: 99-107.
7. Chen H, Chang X, Du D, Li J, Xu H, Yang X. Int J Pharm, 2006; 315: 52-8.
8. Heuschkel S, Shukla A, Neubert RHH. Use of microemulsions for topical drug delivery. In: Bronaugh RL and Maibach
HI (eds.). Percutaneous Absorption Drug-Cosmetics-Mechanisms-Methodology; Martin-Luther-University Halle-
Wittenberg; 2005, pp. 701-18.
9. Yue Y, San-ming L, Pan D, Da-fang Z. Chem Res Chinese U, 2007; 23: 81-6.
10. Özgüney (Sarıgüllü) I, Karasulu HY, Kantarcı G, Sözer S, Güneri T, Ertan G. AAPS Pharm Sci Tech, 2006; 88: 1-7.
11. Maghraby GM. Colloid Surface B, 2010; 75: 595-600.
12. Correa MA, Scarpa MV, Franzini MC, Oliveira AG. Colloid Surface B, 2005; 43: 108-14.
13. Shakeel F, Baboota S, Ahuja A, Ali J, Aqil M, Shafiq S. AAPS Pharm Sci Tech, 2007; 104: 1-9.
14. Baboota S, Shakeel F, Ahuja A, Alı J, Shaafiq S. Acta Pharm, 2007; 57: 315-32.
15. Rautio J, Nevalainen T, Taipale H, Vepsalainen J, Gynther J, Laine K, Jarvinen T. Eur J Pharm Sci, 2000; 11: 157-63.
16. Swart H, Breytenbach JC, Hadgraft J, Plessis J. Int J Pharm, 2005; 301: 71-9.
17. Kogan A, Garti N. Adv Colloid Interface Sci, 2006; 123-126: 369-85,
18. Yuan JS, Ansari M, Saman M, Acosta EJ. Int J Pharm, 2008; 349: 130-43.
19. Üstündağ-Okur N, Gökçe EH, Eğrilmez S, Özer Ö, Ertan G. J Ocul Pharmacol Th, 2013; 30: 319-32.
20. Chen H, Chang X, Weng T, Zhao X, Gao Z, Yang Y, Xu H, Yang X. J Control Release, 2004; 98: 427-36.
21. Escribano E, Calpena AC, Queralt J, Obach R, Domenech J. Eur J Pharm Sci, 2003; 19: 203-10.
22. Panchagnula R, Bokalial R, Sharma P, Khandavilli S. Int J Pharm, 2005; 293: 213-23.
23. Ege MA, Karasulu HY, Karasulu E, Ertan G. A computer program designed for in vitro dissolution kinetics, in vitro-in
vivo kinetic correlations and routine application, In 4th Central European Symposium on Pharmaceutical Technology,
Vienna; Scientia Pharmaceutica 69: 2001; pp. 127-8.
24. Koester LS, Ortega GG, Mayorga P, Bassani VL. Eur J Pharm Bio, 2004; 58: 177-9.
25. Ertan G, Karasulu HY, Karasulu E, Ege MA, Köse T, Güneri T. Drug Dev Industrial Pharm, 2000; 26: 737-43.
26. Ritger PL, Peppas NA. J Control Release, 1987; 5: 37-42.
27. Basak SC, Kumar KS, Ramalingam M. Braz. J Pharm Sci, 2008; 44: 477-83.
28. Cui J, Yu B, Zhao Y, Zhu W, Li H, Lou H, Zhai G. Int J Pharm, 2009; 371: 148–55.
29. Üstündağ-Okur N, Apaydın Ş, Karabay Yavaşoğlu EÜ, Yavaşoğlu A, Karasulu HY. Int J Pharm, 2011; 416: 136-44.
30. Üstündağ-Okur N, Yavaşoğlu A, Karasulu HY. Chem Pharm Bull, 2014; 62(2): 135–43.
31. Teichmann A, Heuschkel S, Jacobi U, Presse G, Neubert RH, Sterry W, Lademann J. Eur J Pharm Biopharm, 2007; 67:
699-706.
32. Huang YB, Lin YH, Lu TM, Wang RJ, Tsai YH, Wu PC. Int J Pharm, 2008; 349: 206-11.
33. Tsai YH, Lee KF, Huang YB, Huang CT, Wu PC. Int J Pharm, 2010; 388: 257-62.
34. Wang YY, Hong CT, Chiu WT, Fang JY. Int J Pharm, 2001; 224: 89-104.
35. Prajapati ST, Patel CG, Patel CN. ISRN Pharmaceutics, 2011; 1: 1-9.
36. Changez M, Chander J, Dinda AK. Colloid Surface B, 2006; 48: 58-66.