Structural analysis of naproxen-intercalated bentonite (Unye
8
Chemical Engineering Journal 174 (2011) 281–288 Contents lists available at SciVerse ScienceDirect Chemical Engineering Journal j ourna l ho mepage: www.elsevier.com/locate/cej Structural analysis of naproxen-intercalated bentonite (Unye) A. Tabak a,∗ , N. Yilmaz a , E. Eren b , B. Caglar c , B. Afsin d , A. Sarihan b a Department of Chemistry, Faculty of Arts and Sciences, Rize University, 53100 Rize, Turkey b Department of Chemistry, Faculty of Arts and Sciences, Bilecik University, 11210 Bilecik, Turkey c Department of Chemistry, Faculty of Arts and Sciences, Erzincan University, 24030 Erzincan, Turkey d Department of Chemistry, Faculty of Arts and Sciences, Ondokuz Mayis University, 55139 Samsun, Turkey a r t i c l e i n f o Article history: Received 6 May 2011 Received in revised form 3 September 2011 Accepted 7 September 2011 Keywords: Naproxen Unye-bentonite XRD FTIR TG/DTA/DSC Surface area a b s t r a c t The difference in the basal spacing (8.79 ˚ A) and a higher mass loss (6.2%) in the temperature range of 200–750 ◦ C of naproxen-bentonite (N-bentonite) comparing to that of Unye bentonite (UB) signified the existence of thermally stable organic species in the interlamellar space of the bentonite clay. The asym- metric OCO − stretching band (1607 cm −1 ) of N-bentonite became stronger in the temperature interval of 100–400 ◦ C as a result of binding via the C O group of the ligand to exchangeable cation and/or water molecule whereas the OH bending peak of water (1633 cm −1 ) and the C C stretching vibration of aromatic ring (1531 cm −1 ) became weaker on thermal treatment. The effect of ionic strength on the des- orption of naproxen species and the related kinetic data revealed that the release mechanism at pH = 7.4 is unrestricted diffusion controlled and governed by the repulsive interactions between the bentonite surface and the negatively charged species. The pore structure characteristics of the bentonite samples corresponding to the surface area, pore volume and pore size were determined by using the conventional analysis of the nitrogen adsorption–desorption isotherms. © 2011 Elsevier B.V. All rights reserved. 1. Introduction Natural clay minerals and modified clays such as organo-clays prepared by acid activation, ion-exchange, and pillaring are widely used as excipients and active agents in drugs [1,2]. Therefore, the surface properties of these materials referring to their roles in adsorption (desiccation or removal of water from the gas phase), purification of gas or liquid streams and bulk separation of a wide range of organic chemicals and catalytic processes (as catalysts of alkylation, dimerisation and cracking reactions for hydrocarbons) has been of interest [3,4]. The elucidation of the structural (spe- cific surface area, sorption capacity, rheological properties) and compositional (chemical inertness and low or null toxicity for the patient) features of clays and clay minerals for medicinal purposes provided significant advantages in practical applications [5–7]. A comprehensive review of the utility of these materials in phar- maceutical formulations (gastrointestinal protectors, osmotic oral laxatives, antidiarrhoeaics, dermatological protectors and cosmet- ics), spas (geotherapy, pelotherapy and paramuds) and aesthetic medicine (to clean and moisturise the skin and to combat compact lipodystrophies, acne and cellulite) has been given by Carretero [8]. ∗ Corresponding author. Tel.: +90 4642236126; fax: +90 4642235376. E-mail address: [email protected] (A. Tabak). The beneficial effects of a drug for human health are closely related to targeting selected body parts at a desired concentration level of drug for prolonged period of time. This concentration level for therapeutic applications can be achieved without reaching a higher toxic level or dropping below the minimum effective level [9]. Natural clays and clay minerals may play a crucial role in mod- ulating controlled delivery systems and, they can release the active substance at the desired biological site of the body in controlled manners [10,11]. This mechanism covers the penetration of drug into the interlayer space of the lamellar host and the release of it via diffusion and de-intercalation process [12]. Clay–drug interactions include the binding mechanisms of ionic, ion–dipole, hydrogen bonding, and van der Waals and, in some cases, covalent bond- ing is encountered depending on the molecular size, the type of the functional groups and physical–chemical properties of organic compounds inserted into the interlayer space of the clay as cationic or neutral species as well as the clay type [10,13]. The drug–clay complexes can be examined based upon the changes in the basal spacing, thermal stability, specific surface area and the pore size distribution [14,15]. Therefore, X-ray diffraction, thermal, Fourier Transform Infrared, and surface area analysis techniques which give invaluable information about the type of clay–organic inter- actions are of prime importance in characterizing the structures of these materials. Bentonite clay, mainly composed of montmorillonite, consists of sheets of alumina octahedra and silica tetrahedra shared in a 1385-8947/$ – see front matter © 2011 Elsevier B.V. All rights reserved. doi:10.1016/j.cej.2011.09.027
Transcript of Structural analysis of naproxen-intercalated bentonite (Unye
S
Aa
b
c
d
a
ARRA
KNUXFTS
1
pusaprahccppcmliml
1d
Chemical Engineering Journal 174 (2011) 281– 288
Contents lists available at SciVerse ScienceDirect
Chemical Engineering Journal
j ourna l ho mepage: www.elsev ier .com/ locate /ce j
tructural analysis of naproxen-intercalated bentonite (Unye)
. Tabaka,∗, N. Yilmaza, E. Erenb, B. Caglarc, B. Afsind, A. Sarihanb
Department of Chemistry, Faculty of Arts and Sciences, Rize University, 53100 Rize, TurkeyDepartment of Chemistry, Faculty of Arts and Sciences, Bilecik University, 11210 Bilecik, TurkeyDepartment of Chemistry, Faculty of Arts and Sciences, Erzincan University, 24030 Erzincan, TurkeyDepartment of Chemistry, Faculty of Arts and Sciences, Ondokuz Mayis University, 55139 Samsun, Turkey
r t i c l e i n f o
rticle history:eceived 6 May 2011eceived in revised form 3 September 2011ccepted 7 September 2011
eywords:aproxen
a b s t r a c t
The difference in the basal spacing (8.79 A) and a higher mass loss (6.2%) in the temperature range of200–750 ◦C of naproxen-bentonite (N-bentonite) comparing to that of Unye bentonite (UB) signified theexistence of thermally stable organic species in the interlamellar space of the bentonite clay. The asym-metric OCO− stretching band (1607 cm−1) of N-bentonite became stronger in the temperature intervalof 100–400 ◦C as a result of binding via the C O group of the ligand to exchangeable cation and/orwater molecule whereas the OH bending peak of water (1633 cm−1) and the C C stretching vibration of
−1
nye-bentoniteRDTIRG/DTA/DSCurface areaaromatic ring (1531 cm ) became weaker on thermal treatment. The effect of ionic strength on the des-orption of naproxen species and the related kinetic data revealed that the release mechanism at pH = 7.4is unrestricted diffusion controlled and governed by the repulsive interactions between the bentonitesurface and the negatively charged species. The pore structure characteristics of the bentonite samplescorresponding to the surface area, pore volume and pore size were determined by using the conventionalanalysis of the nitrogen adsorption–desorption isotherms.
© 2011 Elsevier B.V. All rights reserved.
. Introduction
Natural clay minerals and modified clays such as organo-claysrepared by acid activation, ion-exchange, and pillaring are widelysed as excipients and active agents in drugs [1,2]. Therefore, theurface properties of these materials referring to their roles indsorption (desiccation or removal of water from the gas phase),urification of gas or liquid streams and bulk separation of a wideange of organic chemicals and catalytic processes (as catalysts oflkylation, dimerisation and cracking reactions for hydrocarbons)as been of interest [3,4]. The elucidation of the structural (spe-ific surface area, sorption capacity, rheological properties) andompositional (chemical inertness and low or null toxicity for theatient) features of clays and clay minerals for medicinal purposesrovided significant advantages in practical applications [5–7]. Aomprehensive review of the utility of these materials in phar-aceutical formulations (gastrointestinal protectors, osmotic oral
axatives, antidiarrhoeaics, dermatological protectors and cosmet-cs), spas (geotherapy, pelotherapy and paramuds) and aesthetic
edicine (to clean and moisturise the skin and to combat compactipodystrophies, acne and cellulite) has been given by Carretero [8].
∗ Corresponding author. Tel.: +90 4642236126; fax: +90 4642235376.E-mail address: [email protected] (A. Tabak).
385-8947/$ – see front matter © 2011 Elsevier B.V. All rights reserved.oi:10.1016/j.cej.2011.09.027
The beneficial effects of a drug for human health are closelyrelated to targeting selected body parts at a desired concentrationlevel of drug for prolonged period of time. This concentration levelfor therapeutic applications can be achieved without reaching ahigher toxic level or dropping below the minimum effective level[9]. Natural clays and clay minerals may play a crucial role in mod-ulating controlled delivery systems and, they can release the activesubstance at the desired biological site of the body in controlledmanners [10,11]. This mechanism covers the penetration of druginto the interlayer space of the lamellar host and the release of it viadiffusion and de-intercalation process [12]. Clay–drug interactionsinclude the binding mechanisms of ionic, ion–dipole, hydrogenbonding, and van der Waals and, in some cases, covalent bond-ing is encountered depending on the molecular size, the type ofthe functional groups and physical–chemical properties of organiccompounds inserted into the interlayer space of the clay as cationicor neutral species as well as the clay type [10,13]. The drug–claycomplexes can be examined based upon the changes in the basalspacing, thermal stability, specific surface area and the pore sizedistribution [14,15]. Therefore, X-ray diffraction, thermal, FourierTransform Infrared, and surface area analysis techniques whichgive invaluable information about the type of clay–organic inter-
actions are of prime importance in characterizing the structures ofthese materials.Bentonite clay, mainly composed of montmorillonite, consistsof sheets of alumina octahedra and silica tetrahedra shared in a
2 eering Journal 174 (2011) 281– 288
2ilotltimhstpipan
ndpaatpia
ebiXT(i
2
2
(pr
2
w1wTsomc
sTtwaksp
Table 1Chemical composition of the Unye bentonite.
Constituents Weight (%)
SiO2 62.70Al2O3 20.10Fe2O3 2.16Na2O 0.27K O 2.53
82 A. Tabak et al. / Chemical Engin
:1 ratio. The isomorphous replacement of a trivalent aluminiumon for a tetravalent silicon ion in the tetrahedral layer and a diva-ent magnesium or iron ion for a trivalent aluminium ion in thectahedral layer results in an excess charge which is balanced byhe exchangeable cations such as Na+, K+, H+, Ca2+, etc., on theayer surfaces. The parallel layers in these structures which are heldogether by rather weak forces of van der Waals and electrostaticnteractions are expandable by anchoring organic species and water
olecules into the gallery spacing of clay [16,17]. Bentonite clay,aving the releasing ability of these species in controlled sense, isuggested to be a good delivery carrier of various drugs because ashe excipient, it plays an important role in dispersing active princi-les due to its ability to increase in volume in the presence of water,
n buffering abrupt change of acidity, and in stabilizing emulsion,olar gel and suspension because of its colloidal characteristic tovoid the segregation of the pharmaceutical formulation’s compo-ents [18–20].
Naproxen, systematic (IUPAC) name (+)-(S)-2-(6-methoxy-aphthalene-2-yl) propanoic, is a non-steroidal anti-inflammatoryrug commonly used for the reduction of moderate to severeain, fever, inflammation and stiffness caused by conditions suchs osteoarthritis, rheumatoid arthritis, psoriatic arthritis, gout,nkylosing spondylitis, menstrual cramps, tendonitis, bursitis, andhe treatment of primary dysmenorrhea [21]. However, naproxenreparations containing sodium are not recommended for use
n patients with sodium-sensitive hypertension, due to potentialdverse effects on blood pressure.
In the present work, the thermal stability and structural prop-rties of naproxen-bentonite (N-bentonite) composite preparedy treatment of naproxen with Unye bentonite (UB), which is an
mportant clay mineral resource in Turkey, were investigated using-ray diffraction (XRD), thermal analysis (TG/DTA/DSC), Fourierransform Infrared (FTIR), and specific surface area measurementBET) techniques by giving special emphasis to the nature of thenteraction between naproxen and the clay.
. Materials and methods
.1. Materials
CaCl2·6H2O (Merck, 99.0%), ZnCl2 (Merck, 99.0%), and (+)-(S)-2-6-methoxynaphthalene-2-yl) propanoic (naproxen) were used forreparing the cation-exchanged- and naproxen-bentonite samples,espectively.
.2. Preparation of Ca- and Zn-bentonite samples
5 g of raw-bentonite sample from Ordu/Unye region of Turkeyas washed with deionized water several times and dried at
05 ◦C and then centrifuged at 6000 rpm. The bentonite sampleas homoionized by treating with 100 ml of 0.1 M CaCl2 solution.
he Ca-bentonite product thus obtained was dried at 105 ◦C andieved to 38–108 �m. The cation exchange capacity (CEC) valuef UB, which is mainly Ca-montmorillonite, was determined as 74equiv/100 g clay by methylene blue adsorption technique and the
hemical composition of the clay sample is given in Table 1 [22,23].The Ca-bentonite sample was treated with 100 ml of 0.1 M ZnCl2
olution at room temperature for 24 h under vigorous stirring.he product was washed with deionized water thoroughly andhe supernatant was filtered off and the solid part was washedith deionized water repeatedly until a negative chloride test was
ttained. The solid precipitate was ground to the initial size andept for spectroscopic measurements. In this study, the Zn cationelected for the cation exchange compared to the other cations waserfectly interacted to form the complex compound with naproxen
2
CaO 2.29MgO 3.64
molecule. This result may be explained in terms of the effect of ionsize and charge of exchangeable cation.
2.3. Synthesis of naproxen-bentonite (N-bentonite)
The suspension of 3.0% (by mass) of Zn-bentonite in deion-ized water (400 ml) was treated with naproxen sodium solutionin an ethyl alcohol/water (1:5) mixture (10 g/100 ml) at pH = 6 and60 ◦C for 24 h under a nitrogen atmosphere. The N-bentonite wasseparated from ethyl alcohol/water mixture by centrifugation andwashed with deionized water thoroughly which is followed byfreeze-drying and grinding to 38–108 �m.
2.4. Desorption procedure
The naproxen-loaded bentonite samples were immersed in150 ml aliquots of 0.1 M sodium phosphate buffer containing dif-ferent amounts of sodium chloride, pH = 7.4 (PBS), and incubatedon a constant temperature shaking bed at 37 ◦C and 130 rpm. Afterspecific intervals, 1 ml aliquot of samples were withdrawn andimmediately replaced with the same amount of fresh medium.5 ml of solution were withdrawn at fixed intervals, filtered withMillex HV Millipore (� = 45 �m) filters and immediately replacedwith an equal volume of the buffer solution, in order to keep a con-stant volume. The amount of naproxen delivered from the sampleswas monitored by the Unicam UV2 UV-VIS spectrophotometer at� = 332 nm. The kinetic analysis of the release process was carriedout by fitting the data to the Korsmeyer–Peppas model [24–26]. Theadsorption kinetics experiments were repeated in triplicate and theaverage values were reported.
2.5. Characterization of the bentonite samples
EDXRF spectrometer (Epsilon5, PANalytical) was used for chem-ical analysis of UB (Table 1). FTIR spectra of the raw and N-bentonitesamples were recorded in the region of 4000–450 cm−1 on aSpectrum-100 FTIR spectrometer at a resolution of 4 cm−1. XRDpatterns were taken on a Rigaku 2000 automated diffractometerusing Ni filtered CuK� radiation (� = 1.54050 A; 40 kV and 40 mA).Bragg’s law, defined as n� = 2d sin �, was used to compute thecrystallographic spacing (d) for the examined bentonite samples.The TG and DTA curves were scanned using a PYRIS DiamondTG/DTG apparatus in a dynamic nitrogen atmosphere (heatingrate: 10 ◦C/min, platinum crucibles, mass ∼10 mg and temper-ature range: 30–1000 ◦C). The DSC curves were collected on aPYRIS Diamond DSC apparatus in a static air atmosphere (heatingrate: 10 ◦C/min, platinum crucibles, mass ∼10 mg and temperaturerange: 30–750 ◦C).
Nitrogen adsorption/desorption isotherms were obtained in therelative pressure range of 0.05 < P/P0 < 1.00 using 0.2–0.5 g of sam-ple with a Micromeritics ASAP 2020 V3.04 H analyzer. The samples
were degassed at 150 ◦C for 6 h prior to the textural measurementsat 77 K (−196 ◦C). Specific surface areas were determined fromadsorption isotherms by applying the BET and Langmuir equations(SBET and SL, respectively). Mesoporous surface areas (BJHSmp) and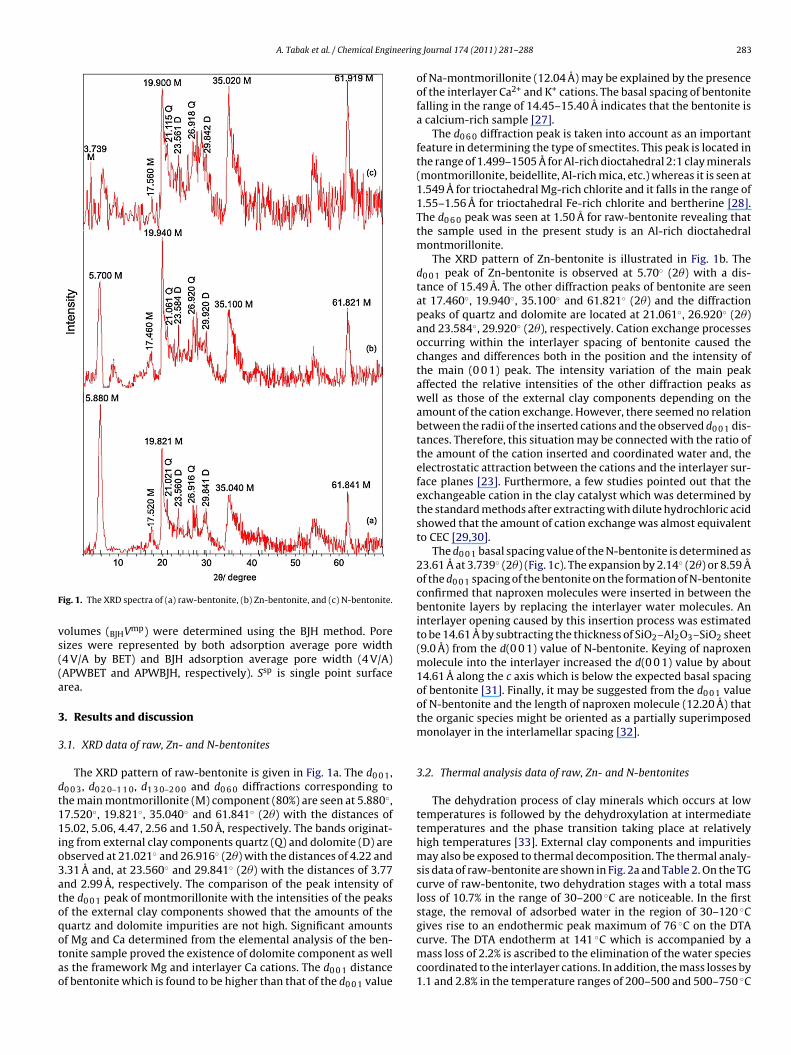
A. Tabak et al. / Chemical Engineerin
F
vs((a
3
3
dt11io3atoqotao
ig. 1. The XRD spectra of (a) raw-bentonite, (b) Zn-bentonite, and (c) N-bentonite.
olumes (BJHVmp) were determined using the BJH method. Poreizes were represented by both adsorption average pore width4 V/A by BET) and BJH adsorption average pore width (4 V/A)APWBET and APWBJH, respectively). Ssp is single point surfacerea.
. Results and discussion
.1. XRD data of raw, Zn- and N-bentonites
The XRD pattern of raw-bentonite is given in Fig. 1a. The d0 0 1,0 0 3, d0 2 0–1 1 0, d1 3 0–2 0 0 and d0 6 0 diffractions corresponding tohe main montmorillonite (M) component (80%) are seen at 5.880◦,7.520◦, 19.821◦, 35.040◦ and 61.841◦ (2�) with the distances of5.02, 5.06, 4.47, 2.56 and 1.50 A, respectively. The bands originat-
ng from external clay components quartz (Q) and dolomite (D) arebserved at 21.021◦ and 26.916◦ (2�) with the distances of 4.22 and.31 A and, at 23.560◦ and 29.841◦ (2�) with the distances of 3.77nd 2.99 A, respectively. The comparison of the peak intensity ofhe d0 0 1 peak of montmorillonite with the intensities of the peaksf the external clay components showed that the amounts of theuartz and dolomite impurities are not high. Significant amounts
f Mg and Ca determined from the elemental analysis of the ben-onite sample proved the existence of dolomite component as wells the framework Mg and interlayer Ca cations. The d0 0 1 distancef bentonite which is found to be higher than that of the d0 0 1 valueg Journal 174 (2011) 281– 288 283
of Na-montmorillonite (12.04 A) may be explained by the presenceof the interlayer Ca2+ and K+ cations. The basal spacing of bentonitefalling in the range of 14.45–15.40 A indicates that the bentonite isa calcium-rich sample [27].
The d0 6 0 diffraction peak is taken into account as an importantfeature in determining the type of smectites. This peak is located inthe range of 1.499–1505 A for Al-rich dioctahedral 2:1 clay minerals(montmorillonite, beidellite, Al-rich mica, etc.) whereas it is seen at1.549 A for trioctahedral Mg-rich chlorite and it falls in the range of1.55–1.56 A for trioctahedral Fe-rich chlorite and bertherine [28].The d0 6 0 peak was seen at 1.50 A for raw-bentonite revealing thatthe sample used in the present study is an Al-rich dioctahedralmontmorillonite.
The XRD pattern of Zn-bentonite is illustrated in Fig. 1b. Thed0 0 1 peak of Zn-bentonite is observed at 5.70◦ (2�) with a dis-tance of 15.49 A. The other diffraction peaks of bentonite are seenat 17.460◦, 19.940◦, 35.100◦ and 61.821◦ (2�) and the diffractionpeaks of quartz and dolomite are located at 21.061◦, 26.920◦ (2�)and 23.584◦, 29.920◦ (2�), respectively. Cation exchange processesoccurring within the interlayer spacing of bentonite caused thechanges and differences both in the position and the intensity ofthe main (0 0 1) peak. The intensity variation of the main peakaffected the relative intensities of the other diffraction peaks aswell as those of the external clay components depending on theamount of the cation exchange. However, there seemed no relationbetween the radii of the inserted cations and the observed d0 0 1 dis-tances. Therefore, this situation may be connected with the ratio ofthe amount of the cation inserted and coordinated water and, theelectrostatic attraction between the cations and the interlayer sur-face planes [23]. Furthermore, a few studies pointed out that theexchangeable cation in the clay catalyst which was determined bythe standard methods after extracting with dilute hydrochloric acidshowed that the amount of cation exchange was almost equivalentto CEC [29,30].
The d0 0 1 basal spacing value of the N-bentonite is determined as23.61 A at 3.739◦ (2�) (Fig. 1c). The expansion by 2.14◦ (2�) or 8.59 Aof the d0 0 1 spacing of the bentonite on the formation of N-bentoniteconfirmed that naproxen molecules were inserted in between thebentonite layers by replacing the interlayer water molecules. Aninterlayer opening caused by this insertion process was estimatedto be 14.61 A by subtracting the thickness of SiO2–Al2O3–SiO2 sheet(9.0 A) from the d(0 0 1) value of N-bentonite. Keying of naproxenmolecule into the interlayer increased the d(0 0 1) value by about14.61 A along the c axis which is below the expected basal spacingof bentonite [31]. Finally, it may be suggested from the d0 0 1 valueof N-bentonite and the length of naproxen molecule (12.20 A) thatthe organic species might be oriented as a partially superimposedmonolayer in the interlamellar spacing [32].
3.2. Thermal analysis data of raw, Zn- and N-bentonites
The dehydration process of clay minerals which occurs at lowtemperatures is followed by the dehydroxylation at intermediatetemperatures and the phase transition taking place at relativelyhigh temperatures [33]. External clay components and impuritiesmay also be exposed to thermal decomposition. The thermal analy-sis data of raw-bentonite are shown in Fig. 2a and Table 2. On the TGcurve of raw-bentonite, two dehydration stages with a total massloss of 10.7% in the range of 30–200 ◦C are noticeable. In the firststage, the removal of adsorbed water in the region of 30–120 ◦Cgives rise to an endothermic peak maximum of 76 ◦C on the DTA
curve. The DTA endotherm at 141 ◦C which is accompanied by amass loss of 2.2% is ascribed to the elimination of the water speciescoordinated to the interlayer cations. In addition, the mass losses by1.1 and 2.8% in the temperature ranges of 200–500 and 500–750 ◦C
284 A. Tabak et al. / Chemical Engineering Journal 174 (2011) 281– 288
DTA
/µV
En
do
D
TA/µ
V
Endo
Mas
s (%
)
100 90 80
100 200 300 400 500 600 700 900 800 1000 30
618
DTA
80 90
100
80 90
100
DTA
TG
62
76
141
TG
69
357 619
636
(a)
(b)
(c)
DTA
TG
Temperature/(ºC)
Fb
oc
sipoe
at(eairbsoc
200 100 400 300 600 500
DSC
DDSC
DSC
DDSC
102
171
72 107
356
DD
SC/ m
W/ m
in
Exo
DSC
/ mW
(b)
(a)
TT
ig. 2. Thermal analysis curves of (a) raw-bentonite, (b) Zn-bentonite, and (c) N-entonite.
n the TG curve, respectively, represent the removal of externallay components and structural OH groups, respectively.
Thermal analysis results of Zn-bentonite (Fig. 2b and Table 2) areimilar to those of raw-bentonite. The mass losses by 11.4 and 4.2%n the temperature ranges of 30–200 and 200–750 ◦C, respectively,oint out the evolution of interlayer water and dehydroxylationf lattice water which is accompanied by the decomposition ofxternal clay components, respectively.
In the case of N-bentonite, the endothermic DTA peaks arettributed to the removal of interlayer organic species with a con-inuous mass loss of 10.2% in the temperature range of 200–750 ◦CFig. 2c). The exothermic peak at 356 ◦C with a decompositionnthalpy of −0.54 mJ mg−1 on the DSC curve of N-bentonite (Fig. 3bnd Table 2) corroborates this result. In addition, the decreasen total water amount (7.1%) removed from N-bentonite in theange of 30–200 ◦C in comparison with the raw-bentonite and Zn-
entonite samples may be explained by the replacement of outerphere water entities by naproxen species [34,35]. The water typesf lower decomposition energy on the DSC curve of N-bentoniteomparing to that of raw-bentonite in the same temperature rangeable 2hermal analysis data of raw-bentonite, Zn-bentonite and N-bentonite.
Sample DSCmax (◦C) �H (mJ mg−1) DTAmax (◦C)
Raw-bentonite
102 47.7 76
171 7.05 141
– – –
– – 636
Zn-bentonite
– – 62
– – –
– – –
– – 618
N-bentonite
72 3.96 69
107 8.34 –
356 −0.54 357
– – 619
Temperature/ ºC
Fig. 3. DSC–DDSC curves of (a) raw-bentonite and (b) N-bentonite.
may be taken as another evidence confirming this result (Fig. 3aand b and Table 2). Furthermore, the higher total mass loss of N-bentonite than the raw and Zn-bentonites in the temperature rangeof 200–750 ◦C illustrates the gradual decomposition of the organicmolecule and the release of high amounts of organic H2O and CO2species are released (Table 2) as a result of high-temperature oxida-tion of black residue [36]. The thermal stability of the interlamellarorganic species up to 750 ◦C also signifies the presence of � inter-actions between the oxygen planes of the clay sheet and aromaticring of the molecule, and the shielding effect of alumino-silicatelayers [16,37,38].
3.3. IR spectral data of raw, Zn- and N-bentonites
The IR spectrum of the raw-bentonite is given in Fig. 4a.The structural OH stretching vibrations appear in the range of3700–3200 cm−1, the Si–O stretching vibration and the OH bendingmodes are seen in the range of 1300–440 cm−1 [39,40]. The peak at3620 cm−1 originates from the Al2OH stretching. The broad peak at3434 cm−1 which belongs to the OH stretching of H-bonded waterof raw-bentonite is intensified because of the higher amount of
octahedral replacement of Mg atoms than that of Fe atoms [40–43].The peaks originating from the external clay components suchas quartz and dolomite are located at 790 and 698 cm−1, respec-tively. The peak at 1638 cm−1 belongs to the OH deformationalTemperature range (◦C) Mass loss (%) Total mass loss (%)
30–120 8.54120–200 2.18200–500 1.14500–750 2.85 14.71
30–120 10.00120–200 1.40200–500 1.57500–750 2.60 15.57
30–120 7.50120–200 0.45200–500 5.69500–750 4.55 18.19

A. Tabak et al. / Chemical Engineering Journal 174 (2011) 281– 288 285
4000 3000 2000 150 0 1000 450
%T 3629
3478
913
3247
1034
1631 839
522
467
3630 3446
1633 1531
1031
522
468
(a)
(b)
(c)
792
622
3620
3434
1638
1111
1031
910
834790
698
622 573 520
466
1607
1506 1484 1462
14231369
1259 1212
814
1390 1229
Wavenumbers/ cm-1
F
mshTatbcntm
ectdtwticarttbtstv
gtFa
3000 4000 1000 1500 2000
3630 3446 1633
1531
450
1607
(a)
(b)
(c)
(d)
(e)
(f)
(g)
(h)
100 °C
25 °C
150 °C
200 °C
250 °C
300 °C
350 °C
400 °C
% T
Wavenumbers/ cm-1
ig. 4. The FTIR spectra of (a) raw-bentonite, (b) Zn-bentonite, and (c) N-bentonite.
ode of water and the peak at 1111 cm−1 is the longitudinal Si–Otretching mode. The Si–O–Si and Al–O–Si stretching peaks of tetra-edral layer was clearly seen at 1031 and 520 cm−1, respectively.he OH bending peaks of octahedral layer was observed at 910nd 834 cm−1. The Al2OH and AlMgOH bending peaks point outhe octahedral substitution process. Based on the peaks of raw-entonite, it may be concluded that the Al atoms predominate theenters of octahedral layer and the amount of Mg atoms is sig-ificant. Both the XRD patterns and the vibrational features provehat the raw-bentonite sample consists of an Al-rich dioctahedral
ontmorillonite component.The IR spectrum of Zn-bentonite is shown in Fig. 4b. In gen-
ral, the exchange process between the new and exchangeableations did not exhibit significant differences in the IR spectrum ofhe raw-bentonite. However, it is possible to come across to someistinctions in the OH vibrational peaks due to the differences ofhe binding abilities of the metal cations towards the interlayerater species since the water molecule is preferably coordinated
o the interlayer cations and the residual water is retained by thenterlayer holes. The water molecules coordinating to the cationsan emigrate to the bi-trigonal cornered holes on siloxane surfaceffecting the OH groups and thus, change the intensities of the cor-esponding peaks [23,42,44]. In the IR spectrum of Zn-bentonite,he OH-groups involved in H2O–H2O H-bonds give rise to the vibra-ions around 3478 cm−1, and the small shoulder at 3247 cm−1 maye ascribed to an overtone of the H2O bending vibration. Because ofhe polarizing power of the Zn2+ cations, stronger H-bonds to waterpecies are expected to form in outer coordination spheres, andhus, the band at 3247 cm−1 which is probably due to the M2+–OHibration is intensified [42,45].
The (C C) aromatic ring and the deformation vibrations of alkylroups in the ranges of 1600–1430 and 1480–1360 cm−1, respec-
ively, are clearly seen in the IR spectrum of N-bentonite shown inig. 4c. The C–H in plane bending peaks of alkyl groups are locatedt 1484, 1462, 1451, 1369 and 1363 cm−1, the C–O stretching ofFig. 5. FTIR spectra of N-bentonites (a–h) heated in the interval temperature of25–400 ◦C, respectively.
carboxyl at 1212 and 1229 cm−1, the O–H in plane bending at1412 and 1423 cm−1, the C–O stretching of aromatic ring’s etherat 1259 cm−1 and, the vibrations of aromatic ring (C C) at 1531and 1506 cm−1 all demonstrate that the naproxen entities arepenetrated into the interlamellar space of bentonite. The asymmet-ric and symmetric OCO− stretching peaks of carboxylate speciesemerging at 1607 and 1390 cm−1, respectively, may be taken asanother evidence to the penetration process. It may be concludedfrom the positional difference by �� = 217 cm−1 between the asym-metric and symmetric OCO− stretching bands that the naproxenmolecule is most likely bound to the interlayer metallic cation ofbentonite through bidentate or bridging form [46–56].
The thermo-IR-spectra were recorded in the range from roomtemperature to 400 ◦C to follow the decomposition process of theN-bentonite complex (Fig. 5a–h). The dehydration and decomposi-tion of N-bentonite at 200 ◦C resulted in the weakening of the OHbending mode of water (1633 cm−1) and the C C stretching vibra-tion of aromatic ring (1531 cm−1) in addition to the intensificationof the asymmetric OCO− stretching peak at 1607 cm−1 (Fig. 5d).These intensity changes became more significant as the decompo-sition of N-bentonite progressed at higher temperatures, with the
substantial mass loss happening over 350 ◦C. The strengthening ofthe asymmetric OCO− stretching band in parallel with the tem-perature increase may be related to the binding of the molecule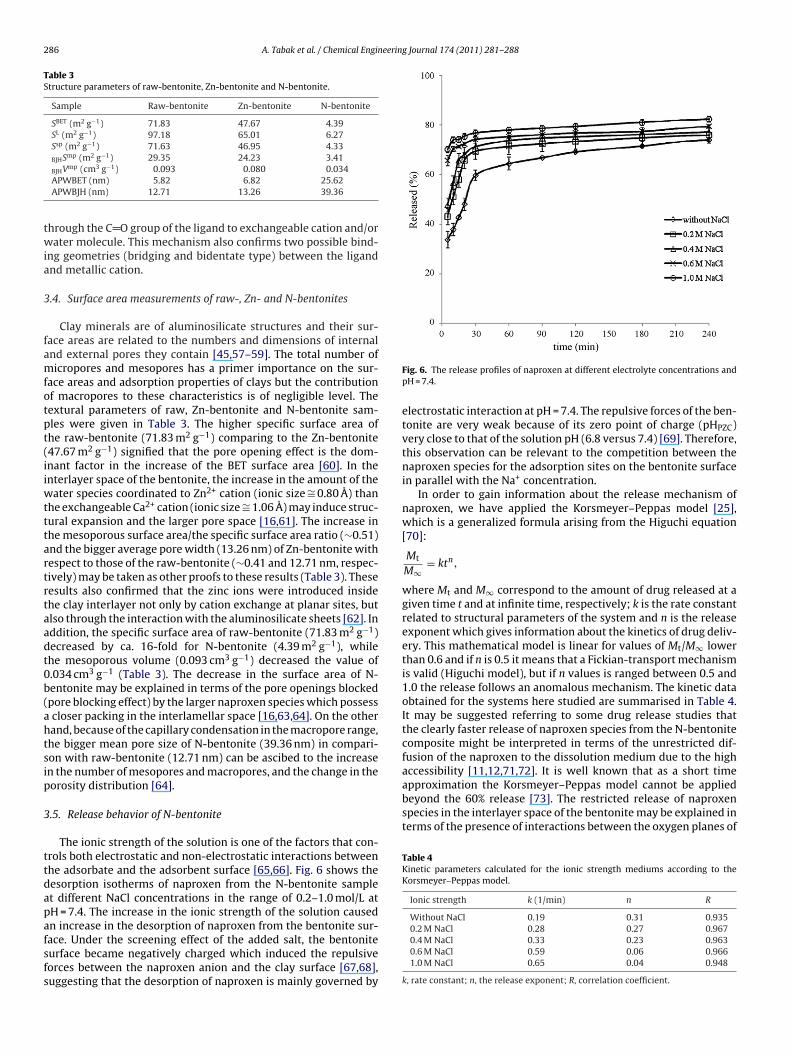
286 A. Tabak et al. / Chemical Engineering Journal 174 (2011) 281– 288
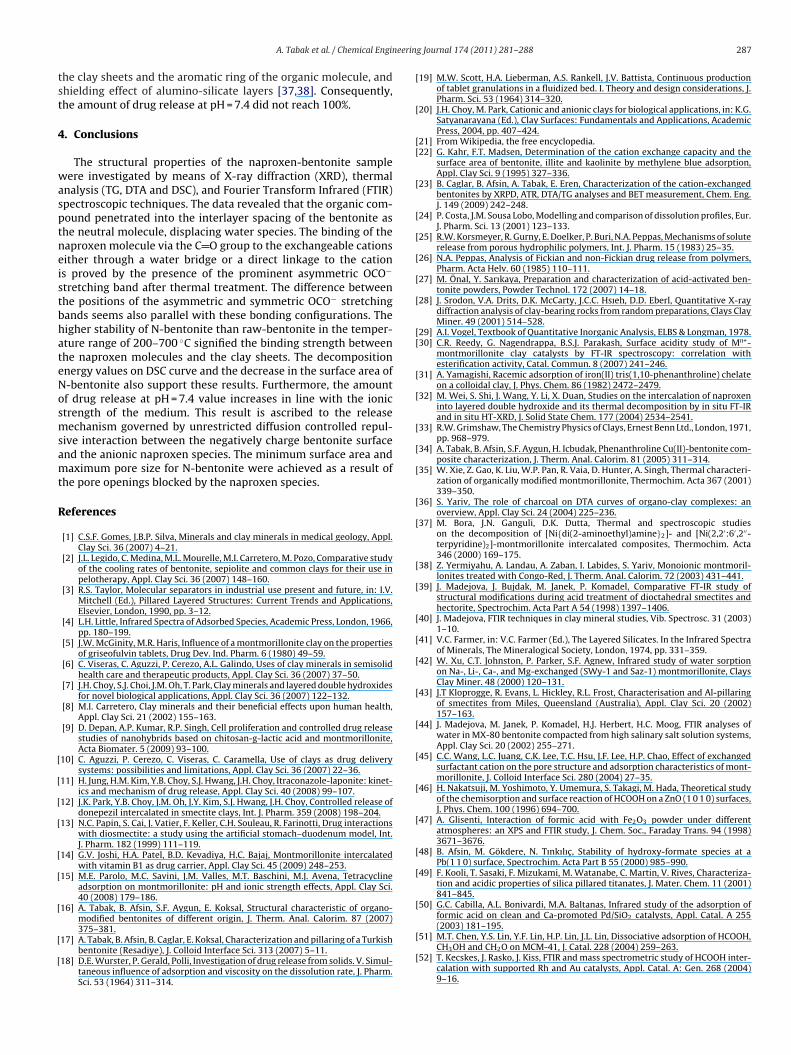
Table 3Structure parameters of raw-bentonite, Zn-bentonite and N-bentonite.
Sample Raw-bentonite Zn-bentonite N-bentonite
SBET (m2 g−1) 71.83 47.67 4.39SL (m2 g−1) 97.18 65.01 6.27Ssp (m2 g−1) 71.63 46.95 4.33BJHSmp (m2 g−1) 29.35 24.23 3.41
Vmp (cm3 g−1) 0.093 0.080 0.034
twia
3
famfotpt(iiwtttartrtaadt0b(ahtsip
3
ttdapafsfs
approximation the Korsmeyer–Peppas model cannot be appliedbeyond the 60% release [73]. The restricted release of naproxenspecies in the interlayer space of the bentonite may be explained interms of the presence of interactions between the oxygen planes of
Table 4Kinetic parameters calculated for the ionic strength mediums according to theKorsmeyer–Peppas model.
Ionic strength k (1/min) n R
Without NaCl 0.19 0.31 0.9350.2 M NaCl 0.28 0.27 0.967
BJH
APWBET (nm) 5.82 6.82 25.62APWBJH (nm) 12.71 13.26 39.36
hrough the C O group of the ligand to exchangeable cation and/orater molecule. This mechanism also confirms two possible bind-
ng geometries (bridging and bidentate type) between the ligandnd metallic cation.
.4. Surface area measurements of raw-, Zn- and N-bentonites
Clay minerals are of aluminosilicate structures and their sur-ace areas are related to the numbers and dimensions of internalnd external pores they contain [45,57–59]. The total number oficropores and mesopores has a primer importance on the sur-
ace areas and adsorption properties of clays but the contributionf macropores to these characteristics is of negligible level. Theextural parameters of raw, Zn-bentonite and N-bentonite sam-les were given in Table 3. The higher specific surface area ofhe raw-bentonite (71.83 m2 g−1) comparing to the Zn-bentonite47.67 m2 g−1) signified that the pore opening effect is the dom-nant factor in the increase of the BET surface area [60]. In thenterlayer space of the bentonite, the increase in the amount of the
ater species coordinated to Zn2+ cation (ionic size ∼= 0.80 A) thanhe exchangeable Ca2+ cation (ionic size ∼= 1.06 A) may induce struc-ural expansion and the larger pore space [16,61]. The increase inhe mesoporous surface area/the specific surface area ratio (∼0.51)nd the bigger average pore width (13.26 nm) of Zn-bentonite withespect to those of the raw-bentonite (∼0.41 and 12.71 nm, respec-ively) may be taken as other proofs to these results (Table 3). Theseesults also confirmed that the zinc ions were introduced insidehe clay interlayer not only by cation exchange at planar sites, butlso through the interaction with the aluminosilicate sheets [62]. Inddition, the specific surface area of raw-bentonite (71.83 m2 g−1)ecreased by ca. 16-fold for N-bentonite (4.39 m2 g−1), whilehe mesoporous volume (0.093 cm3 g−1) decreased the value of.034 cm3 g−1 (Table 3). The decrease in the surface area of N-entonite may be explained in terms of the pore openings blockedpore blocking effect) by the larger naproxen species which possess
closer packing in the interlamellar space [16,63,64]. On the otherand, because of the capillary condensation in the macropore range,he bigger mean pore size of N-bentonite (39.36 nm) in compari-on with raw-bentonite (12.71 nm) can be ascibed to the increasen the number of mesopores and macropores, and the change in theorosity distribution [64].
.5. Release behavior of N-bentonite
The ionic strength of the solution is one of the factors that con-rols both electrostatic and non-electrostatic interactions betweenhe adsorbate and the adsorbent surface [65,66]. Fig. 6 shows theesorption isotherms of naproxen from the N-bentonite samplet different NaCl concentrations in the range of 0.2–1.0 mol/L atH = 7.4. The increase in the ionic strength of the solution causedn increase in the desorption of naproxen from the bentonite sur-
ace. Under the screening effect of the added salt, the bentoniteurface became negatively charged which induced the repulsiveorces between the naproxen anion and the clay surface [67,68],uggesting that the desorption of naproxen is mainly governed byFig. 6. The release profiles of naproxen at different electrolyte concentrations andpH = 7.4.
electrostatic interaction at pH = 7.4. The repulsive forces of the ben-tonite are very weak because of its zero point of charge (pHPZC)very close to that of the solution pH (6.8 versus 7.4) [69]. Therefore,this observation can be relevant to the competition between thenaproxen species for the adsorption sites on the bentonite surfacein parallel with the Na+ concentration.
In order to gain information about the release mechanism ofnaproxen, we have applied the Korsmeyer–Peppas model [25],which is a generalized formula arising from the Higuchi equation[70]:
Mt
M∞= ktn,
where Mt and M∞ correspond to the amount of drug released at agiven time t and at infinite time, respectively; k is the rate constantrelated to structural parameters of the system and n is the releaseexponent which gives information about the kinetics of drug deliv-ery. This mathematical model is linear for values of Mt/M∞ lowerthan 0.6 and if n is 0.5 it means that a Fickian-transport mechanismis valid (Higuchi model), but if n values is ranged between 0.5 and1.0 the release follows an anomalous mechanism. The kinetic dataobtained for the systems here studied are summarised in Table 4.It may be suggested referring to some drug release studies thatthe clearly faster release of naproxen species from the N-bentonitecomposite might be interpreted in terms of the unrestricted dif-fusion of the naproxen to the dissolution medium due to the highaccessibility [11,12,71,72]. It is well known that as a short time
0.4 M NaCl 0.33 0.23 0.9630.6 M NaCl 0.59 0.06 0.9661.0 M NaCl 0.65 0.04 0.948
k, rate constant; n, the release exponent; R, correlation coefficient.
eerin
tst
4
wasptneistbhateNosmsamt
R
[
[
[
[
[
[
[
[
[
[
[
[[
[
[
[
[
[
[
[[
[
[
[
[
[
[
[
[
[
[
[
[
[
[
[
[
[
[
[
[
A. Tabak et al. / Chemical Engin
he clay sheets and the aromatic ring of the organic molecule, andhielding effect of alumino-silicate layers [37,38]. Consequently,he amount of drug release at pH = 7.4 did not reach 100%.
. Conclusions
The structural properties of the naproxen-bentonite sampleere investigated by means of X-ray diffraction (XRD), thermal
nalysis (TG, DTA and DSC), and Fourier Transform Infrared (FTIR)pectroscopic techniques. The data revealed that the organic com-ound penetrated into the interlayer spacing of the bentonite ashe neutral molecule, displacing water species. The binding of theaproxen molecule via the C O group to the exchangeable cationsither through a water bridge or a direct linkage to the cations proved by the presence of the prominent asymmetric OCO−
tretching band after thermal treatment. The difference betweenhe positions of the asymmetric and symmetric OCO− stretchingands seems also parallel with these bonding configurations. Theigher stability of N-bentonite than raw-bentonite in the temper-ture range of 200–700 ◦C signified the binding strength betweenhe naproxen molecules and the clay sheets. The decompositionnergy values on DSC curve and the decrease in the surface area of-bentonite also support these results. Furthermore, the amountf drug release at pH = 7.4 value increases in line with the ionictrength of the medium. This result is ascribed to the releaseechanism governed by unrestricted diffusion controlled repul-
ive interaction between the negatively charge bentonite surfacend the anionic naproxen species. The minimum surface area andaximum pore size for N-bentonite were achieved as a result of
he pore openings blocked by the naproxen species.
eferences
[1] C.S.F. Gomes, J.B.P. Silva, Minerals and clay minerals in medical geology, Appl.Clay Sci. 36 (2007) 4–21.
[2] J.L. Legido, C. Medina, M.L. Mourelle, M.I. Carretero, M. Pozo, Comparative studyof the cooling rates of bentonite, sepiolite and common clays for their use inpelotherapy, Appl. Clay Sci. 36 (2007) 148–160.
[3] R.S. Taylor, Molecular separators in industrial use present and future, in: I.V.Mitchell (Ed.), Pillared Layered Structures: Current Trends and Applications,Elsevier, London, 1990, pp. 3–12.
[4] L.H. Little, Infrared Spectra of Adsorbed Species, Academic Press, London, 1966,pp. 180–199.
[5] J.W. McGinity, M.R. Haris, Influence of a montmorillonite clay on the propertiesof griseofulvin tablets, Drug Dev. Ind. Pharm. 6 (1980) 49–59.
[6] C. Viseras, C. Aguzzi, P. Cerezo, A.L. Galindo, Uses of clay minerals in semisolidhealth care and therapeutic products, Appl. Clay Sci. 36 (2007) 37–50.
[7] J.H. Choy, S.J. Choi, J.M. Oh, T. Park, Clay minerals and layered double hydroxidesfor novel biological applications, Appl. Clay Sci. 36 (2007) 122–132.
[8] M.I. Carretero, Clay minerals and their beneficial effects upon human health,Appl. Clay Sci. 21 (2002) 155–163.
[9] D. Depan, A.P. Kumar, R.P. Singh, Cell proliferation and controlled drug releasestudies of nanohybrids based on chitosan-g-lactic acid and montmorillonite,Acta Biomater. 5 (2009) 93–100.
10] C. Aguzzi, P. Cerezo, C. Viseras, C. Caramella, Use of clays as drug deliverysystems: possibilities and limitations, Appl. Clay Sci. 36 (2007) 22–36.
11] H. Jung, H.M. Kim, Y.B. Choy, S.J. Hwang, J.H. Choy, Itraconazole-laponite: kinet-ics and mechanism of drug release, Appl. Clay Sci. 40 (2008) 99–107.
12] J.K. Park, Y.B. Choy, J.M. Oh, J.Y. Kim, S.J. Hwang, J.H. Choy, Controlled release ofdonepezil intercalated in smectite clays, Int. J. Pharm. 359 (2008) 198–204.
13] N.C. Papin, S. Cai, J. Vatier, F. Keller, C.H. Souleau, R. Farinotti, Drug interactionswith diosmectite: a study using the artificial stomach–duodenum model, Int.J. Pharm. 182 (1999) 111–119.
14] G.V. Joshi, H.A. Patel, B.D. Kevadiya, H.C. Bajaj, Montmorillonite intercalatedwith vitamin B1 as drug carrier, Appl. Clay Sci. 45 (2009) 248–253.
15] M.E. Parolo, M.C. Savini, J.M. Valles, M.T. Baschini, M.J. Avena, Tetracyclineadsorption on montmorillonite: pH and ionic strength effects, Appl. Clay Sci.40 (2008) 179–186.
16] A. Tabak, B. Afsin, S.F. Aygun, E. Koksal, Structural characteristic of organo-modified bentonites of different origin, J. Therm. Anal. Calorim. 87 (2007)375–381.
17] A. Tabak, B. Afsin, B. Caglar, E. Koksal, Characterization and pillaring of a Turkishbentonite (Resadiye), J. Colloid Interface Sci. 313 (2007) 5–11.
18] D.E. Wurster, P. Gerald, Polli, Investigation of drug release from solids. V. Simul-taneous influence of adsorption and viscosity on the dissolution rate, J. Pharm.Sci. 53 (1964) 311–314.
[
[
g Journal 174 (2011) 281– 288 287
19] M.W. Scott, H.A. Lieberman, A.S. Rankell, J.V. Battista, Continuous productionof tablet granulations in a fluidized bed. I. Theory and design considerations, J.Pharm. Sci. 53 (1964) 314–320.
20] J.H. Choy, M. Park, Cationic and anionic clays for biological applications, in: K.G.Satyanarayana (Ed.), Clay Surfaces: Fundamentals and Applications, AcademicPress, 2004, pp. 407–424.
21] From Wikipedia, the free encyclopedia.22] G. Kahr, F.T. Madsen, Determination of the cation exchange capacity and the
surface area of bentonite, illite and kaolinite by methylene blue adsorption,Appl. Clay Sci. 9 (1995) 327–336.
23] B. Caglar, B. Afsin, A. Tabak, E. Eren, Characterization of the cation-exchangedbentonites by XRPD, ATR, DTA/TG analyses and BET measurement, Chem. Eng.J. 149 (2009) 242–248.
24] P. Costa, J.M. Sousa Lobo, Modelling and comparison of dissolution profiles, Eur.J. Pharm. Sci. 13 (2001) 123–133.
25] R.W. Korsmeyer, R. Gurny, E. Doelker, P. Buri, N.A. Peppas, Mechanisms of soluterelease from porous hydrophilic polymers, Int. J. Pharm. 15 (1983) 25–35.
26] N.A. Peppas, Analysis of Fickian and non-Fickian drug release from polymers,Pharm. Acta Helv. 60 (1985) 110–111.
27] M. Önal, Y. Sarıkaya, Preparation and characterization of acid-activated ben-tonite powders, Powder Technol. 172 (2007) 14–18.
28] J. Srodon, V.A. Drits, D.K. McCarty, J.C.C. Hsıeh, D.D. Eberl, Quantitative X-raydiffraction analysis of clay-bearing rocks from random preparations, Clays ClayMiner. 49 (2001) 514–528.
29] A.I. Vogel, Textbook of Quantitative Inorganic Analysis, ELBS & Longman, 1978.30] C.R. Reedy, G. Nagendrappa, B.S.J. Parakash, Surface acidity study of Mn+-
montmorillonite clay catalysts by FT-IR spectroscopy: correlation withesterification activity, Catal. Commun. 8 (2007) 241–246.
31] A. Yamagishi, Racemic adsorption of iron(II) tris(1,10-phenanthroline) chelateon a colloidal clay, J. Phys. Chem. 86 (1982) 2472–2479.
32] M. Wei, S. Shi, J. Wang, Y. Li, X. Duan, Studies on the intercalation of naproxeninto layered double hydroxide and its thermal decomposition by in situ FT-IRand in situ HT-XRD, J. Solid State Chem. 177 (2004) 2534–2541.
33] R.W. Grimshaw, The Chemistry Physics of Clays, Ernest Benn Ltd., London, 1971,pp. 968–979.
34] A. Tabak, B. Afsin, S.F. Aygun, H. Icbudak, Phenanthroline Cu(II)-bentonite com-posite characterization, J. Therm. Anal. Calorim. 81 (2005) 311–314.
35] W. Xie, Z. Gao, K. Liu, W.P. Pan, R. Vaia, D. Hunter, A. Singh, Thermal characteri-zation of organically modified montmorillonite, Thermochim. Acta 367 (2001)339–350.
36] S. Yariv, The role of charcoal on DTA curves of organo-clay complexes: anoverview, Appl. Clay Sci. 24 (2004) 225–236.
37] M. Bora, J.N. Ganguli, D.K. Dutta, Thermal and spectroscopic studieson the decomposition of [Ni{di(2-aminoethyl)amine}2]- and [Ni(2,2′:6′ ,2′′-terpyridine)2]-montmorillonite intercalated composites, Thermochim. Acta346 (2000) 169–175.
38] Z. Yermiyahu, A. Landau, A. Zaban, I. Labides, S. Yariv, Monoionic montmoril-lonites treated with Congo-Red, J. Therm. Anal. Calorim. 72 (2003) 431–441.
39] J. Madejova, J. Bujdak, M. Janek, P. Komadel, Comparative FT-IR study ofstructural modifications during acid treatment of dioctahedral smectites andhectorite, Spectrochim. Acta Part A 54 (1998) 1397–1406.
40] J. Madejova, FTIR techniques in clay mineral studies, Vib. Spectrosc. 31 (2003)1–10.
41] V.C. Farmer, in: V.C. Farmer (Ed.), The Layered Silicates. In the Infrared Spectraof Minerals, The Mineralogical Society, London, 1974, pp. 331–359.
42] W. Xu, C.T. Johnston, P. Parker, S.F. Agnew, Infrared study of water sorptionon Na-, Li-, Ca-, and Mg-exchanged (SWy-1 and Saz-1) montmorillonite, ClaysClay Miner. 48 (2000) 120–131.
43] J.T Kloprogge, R. Evans, L. Hickley, R.L. Frost, Characterisation and Al-pillaringof smectites from Miles, Queensland (Australia), Appl. Clay Sci. 20 (2002)157–163.
44] J. Madejova, M. Janek, P. Komadel, H.J. Herbert, H.C. Moog, FTIR analyses ofwater in MX-80 bentonite compacted from high salinary salt solution systems,Appl. Clay Sci. 20 (2002) 255–271.
45] C.C. Wang, L.C. Juang, C.K. Lee, T.C. Hsu, J.F. Lee, H.P. Chao, Effect of exchangedsurfactant cation on the pore structure and adsorption characteristics of mont-morillonite, J. Colloid Interface Sci. 280 (2004) 27–35.
46] H. Nakatsuji, M. Yoshimoto, Y. Umemura, S. Takagi, M. Hada, Theoretical studyof the chemisorption and surface reaction of HCOOH on a ZnO (1 0 1 0) surfaces,J. Phys. Chem. 100 (1996) 694–700.
47] A. Glisenti, Interaction of formic acid with Fe2O3 powder under differentatmospheres: an XPS and FTIR study, J. Chem. Soc., Faraday Trans. 94 (1998)3671–3676.
48] B. Afsin, M. Gökdere, N. Tınkılıc , Stability of hydroxy-formate species at aPb(1 1 0) surface, Spectrochim. Acta Part B 55 (2000) 985–990.
49] F. Kooli, T. Sasaki, F. Mizukami, M. Watanabe, C. Martin, V. Rives, Characteriza-tion and acidic properties of silica pillared titanates, J. Mater. Chem. 11 (2001)841–845.
50] G.C. Cabilla, A.L. Bonivardi, M.A. Baltanas, Infrared study of the adsorption offormic acid on clean and Ca-promoted Pd/SiO2 catalysts, Appl. Catal. A 255(2003) 181–195.
51] M.T. Chen, Y.S. Lin, Y.F. Lin, H.P. Lin, J.L. Lin, Dissociative adsorption of HCOOH,CH3OH and CH2O on MCM-41, J. Catal. 228 (2004) 259–263.
52] T. Kecskes, J. Rasko, J. Kiss, FTIR and mass spectrometric study of HCOOH inter-calation with supported Rh and Au catalysts, Appl. Catal. A: Gen. 268 (2004)9–16.
2 eerin
[
[
[
[
[
[
[
[
[
[
[
[
[
[
[
[
[
[
[
[
88 A. Tabak et al. / Chemical Engin
53] T. Kecskes, R. Nemeth, J. Rasko, J. Kiss, New reaction route of HCOOH catalyticdecomposition, Vacuum 80 (2005) 64–68.
54] R.B. Barros, A.R. Garcia, L.M. Ilharco, The chemistry of formic acid on oxygenmodified Ru(0 0 1) surfaces, Surf. Sci. 591 (2005) 142–152.
55] G. Jacobs, M. Patterson, U.M. Graham, A.C. Crawford, B.H. Davis, Lowtemperature water gas shift: the link between the catalysis of WGSand formic acid decomposition over Pt/Ceria, Int. J. Energy 30 (2005)1265–1276.
56] G. Jacobs, M. Patterson, U.M. Graham, A.C. Crawford, A. Dozier, B.H. Davis,Catalytic links among the water–gas shift, water-assisted formic acid decom-position, and methanol steam reforming reactions over Pt-promoted thoria, J.Catal. 235 (2005) 79–91.
57] J.F. Lee, C.K. Lee, L.C. Juang, Size effects of exchange cation on the pote structureand surface fractality of montmorillonite, J. Colloid Interface Sci. 217 (1999)172–176.
58] M. Önal, Y. Sarıkaya, T. Alemdaroglu, I. Bozdogan, The effect of acid activationon some physicochemical properties of a bentonite, Turk. J. Chem. 26 (2002)409–416.
59] T. Alemdaroglu, G. Akkus , M. Önal, Y. Sarıkaya, Investigation of the surface acid-ity of a bentonite modified by acid activation and thermal treatment, Turk. J.Chem. 27 (2003) 675–681.
60] R.S. Juang, S.H. Lin, F.C. Huang, C.H. Cheng, Structural studies of Na-montmorillonite exchanged with Fe2+, Cr3+, and Ti4+ by N2 adsorption andEXAFS, J. Colloid Interface Sci. 274 (2004) 337–340.
61] F.C. Huang, J.F. Lee, C.K. Lee, H.P. Chao, Effects of cation exchange onthe pore and surface structure and adsorption characteristics of mont-
morillonite, Colloids Surf. A: Physicochem. Eng. Aspects 239 (2004)41–47.62] C. Mosser, L.J. Michot, F. Villieras, M. Romeo, Migration of cations in copper(II);exchanged montmorillonite and laponite upon heating, Clays Clay Miner. 45(1997) 789–802.
[
g Journal 174 (2011) 281– 288
63] N. Ozturk, A. Tabak, S. Akgol, A. Denizli, Reversible immobilization of catalaseby using a novel bentonite–cysteine microcomposite affinity sorbents, ColloidsSurf. A: Physicochem. Eng. Aspects 322 (2008) 148–154.
64] J.F. Lee, C.K. Lee, L.C. Juang, Size effects of exchange cation on the pore structureand surface fractality of montmorillonite, J. Colloid Interface Sci. 217 (1999)172–176.
65] S. Netpradit, P. Thiravetyan, S. Towprayoon, Adsorption of three azo reactivedyes by metal hydroxide sludge: effect of temperature, pH, and electrolytes, J.Colloid Interface Sci. 270 (2004) 255–261.
66] A. Tabak, E. Eren, B. Afsin, B. Caglar, Determination of adsorptive properties of aTurkish Sepiolite for removal of reactive 15 anionic dye from aqueous solutions,J. Hazard. Mater. 161 (2009) 1087–1094.
67] E. Tombacz, M. Szekeres, Colloidal behaviour of aqueous montmorillonite sus-pensions: the specific role of pH in the presence of indifferent electrolytes, Appl.Clay Sci. 27 (2004) 75–94.
68] A. Tabak, N. Baltas, B. Afsin, M. Emirik, B. Caglar, E. Eren, Adsorption of reac-tive red 120 from aqueous solutions by cetylpyridinium-bentonite, J. Chem.Technol. Biotechnol. 85 (2010) 1199–1207.
69] E. Eren, Removal of basic dye by modified Unye bentonite, Turkey, J. Hazard.Mater. 162 (2009) 1355–1363.
70] T. Higuchi, Mechanism of sustained-action medication, J. Pharm. Sci. 52 (1963)1145–1149.
71] J.P. Zheng, L. Luan, H.Y. Wang, L.F. Xi, K.D. Yao, Study on ibupro-fen/montmorillonite intercalation composites as drug release system, Appl.Clay Sci. 36 (2007) 297–301.
72] Z.L. Wang, E.B. Wang, L. Gao, L. Xu, Synthesis and properties of Mg2Al layered
double hydroxides containing 5-fluorouracil, J. Solid State Chem. 178 (2005)736–741.73] T. Heikkila, J. Salonen, J. Tuura, M.S. Hamdy, G. Mul, N. Kumar, T. Salmi, D.Y.Murzin, L. Latinen, A.M. Kaukonen, J. Hirvonen, V.P. Lehto, Mesoporous silicamaterial TUD-1 as a drug delivery system, Int. J. Pharm. 331 (2007) 133–138.