Chloride ion transport and mass balance in a metropolitan area using road salt

Applied Clay Science, 6 (1992) 265-276Elsevier Science Publishers B.V., Amsterdam
265
The formation of bentonite: mass balance effects
E. Caballero, E. Reyes, A. Delgado, F. Huertas and J. LinaresEstacion Experimental de Zaidln (e.S. I.C), Profesor Albareda 1. 18008-Granada. Spain
(Received April 23, 1991; accepted after revision August 30, 1991)
ABSTRACT
Caballero, E., Reyes, E., Delgado, A., Huertas, F. and Linares, J., 1992. The formation of bentonite:mass balance effects. Appl. Clay ScL, 6: 265-276.
The alteration ofvolcanic material into bentonite produces an important loss ofmass originated bythe hydrolytic action of a large amount of hydrothermal solutions. The latter solutions also provideessential elements for the formation of these materials. Mass balance gains and losses in 52 samplesfrom several bentonite deposits show that the greatest element losses correspond to Si, and to a lesserextent to Na and K. There are some gains in Fe, Ca, Mg and H20. On the other hand, there is a goodcorrelation (1'=0.87) between the amount of matter lost and the amount ofsmectite formed. In addition, the relationship between matter loss and the chemical composition ofthe neoformed smectitehas been studied, and it has been observed that the chemical composition of smectite varies withincreasing matter loss. The initial smectite contains less A I, and more Fe and Mg in comparison tothe final smectite.
INTRODUCTION
The fundamental process that takes place during the formation of hydrothermal bentonites is the hydrolysis of volcanic materials. This process requires the existence of important accumulations of porous and vitreous rocksand large quantities of aqueous solutions above room temperature (Caballeroet al., 1985; Linares, 1985).
Leone et al. (1983) determined the formation temperatures for bentonitessamples taken from the Cabo de Gata region (southeastern Spain); they average between 40 and 70°C.
From the relationship between the chemical composition and density ofrock and bentonite, it can be inferred that large losses of matter take placeduring the alteration process. There is some natural evidence that supportsthis conclusion. Thus, at some points in the volcanic region of Cabo de Gata(Almeria, Spain) there are bentonite dikes, extruded through fractures, whichmay derive from the collapse of the deposit overburden caused by matter lossduring bentonite formation. In other cases, small geomorphological read-
0169-1317/92/$05.00 © 1992 Elsevier Science Publishers B.V. All rights reserved.

266 E. CABALLERO ET AL.
justements, also due to reductions in volume, can be observed in some bentonite deposits (Reyes et al., 1979a, b; Caballero et al., 1985).
The purpose of this work was to calculate the loss of matter in a series ofbentonite deposits in the Cabo de Gata region, starting from the chemicalcomposition of the parent rock, which was deduced theoretically. In addition,we have tried to analyze the variations in the chemical composition of thesmectites, depending on the different amounts of material lost.
MATERIAL AND EXPERIMENTAL METHODS
Fifty-two bentonite samples, displaying different degrees of alteration andbelonging to bentonite deposits of small outcrops in Cabo de Gata were selected (Fig. 1). The transformation is total and, therefore, no parent rocksare present. The selection of these samples was made strictly on the basis ofgeological criteria, the sample being taken from those points where the parentrock was probably a rhyolite.
Mineralogical analysis (Table I) was carried out by XRD, following amethodologysimilar to that of Tatlock (1966). The chemical composition ofbentonites (bulk sample) and smectites ( < 2 ,um fraction) was determinedby the wet method (Table II) (Huertas and Linares, 1974).
RESULTS AND DISCUSSION
Inferring the theoretical parent rock
As already mentioned, the transformation into bentonite was so complete,that no parent rock remained. In order to determine the composition of theparent rock, a series of calculations were made starting from the chemicalanalysis of bentonites and based on Barth's geologicalbalance (1948), so asto normalize all the data. Because all the bentonites showed different degreesof alteration (different smectite percentages), Barth's parameter was regressed against the smectite content. In this way, by extrapolation to a zerosmectite content, the composition of the parent rock or a rock very similar toit, is derived. The regression equations obtained are given in Table III. Fromextrapolation to zero smectite, the following parent rock composition is obtained: Si02=78.95 %, A1203=8.18 %, Fe203=5.81 %; Ti02=0.44 %,Na20=2.51 %and K20=3.92 %.
The values for MgO, CaO and H20+, which are negative in this extrapolation, are considered to be zero. When comparing these data with values available for rocks in the region (L6pez and Rodriguez .Badiola, 1980), a greatsimilarity to rhyolites was found, although there are some significantdifferences.
For this reason, the values previously given have been slightly corrected,

THE FORMATION OF BENTONIT E: MASS BALANCE EFFECTS 267
F':1~
~
o•
SPAIN
QUATERNARY
MIOCENE LIMESTONE
VOLCANIC ROCK
J UR ASSICLIMESTONE
0 123045
~---
Fig. 1.Geographical and geological locations of the samples .
268 E. CABALLERO ET AL.
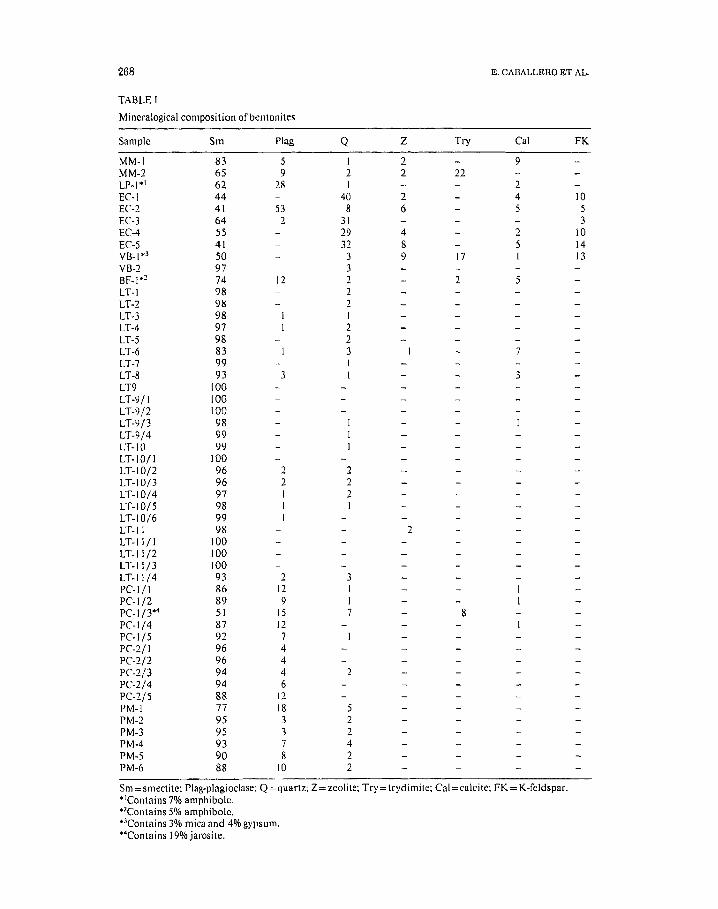
TABLE!
Mineralogical composition of bentonites
Sample Sm Plag Q Z Try Cal FK
MM·I 83 5 [ 2 9MM·2 65 9 2 2 22LP·I"' 62 28 I 2EC·! 44 40 2 4 10EC·2 41 53 8 6 5 5EC·3 64 2 3[ 3ECA 55 29 4 2 10EC-5 41 32 8 14VB.["3 50 3 9 17 [3VB·2 97 3SF· I"' 74 12 2 2 5LT· I 98 2LT-2 98 2LT-3 98 [
LT·4 97 2LT·5 98 2LT·6 83 3 7LT-7 99 [
LT·8 93 3 [ 3LT9 [00LT·9/l [00LT·9/2 100LT·9/3 98LT-9/4 99LT·IO 99LT·IO/I 100LT·IO/2 96 2 2LT· I0/3 96 2 2LT·10/4 97 I 2LT·10/5 98 I ILT·10/6 99 ILT· 1I 98 2LT·II/I 100LT· I 1/2 100LT-ll/3 100LT-II/4 93 2 3PC·I/l 86 12 1PC·I/2 89 9 [
PC·I/3"' 51 15 7 8PC·I/4 87 12PC-I/5 92 7PC·2/1 96 4PC·2/2 96 4PC·2/3 94 4 2PC-2/4 94 6PC·2/5 88 12PM-! 77 18 5PM-2 95 3 2PM-3 95 3 2PM-4 93 7 4PM-5 90 8 2PM·6 88 10 2
Srn e smectite; Plag-plagioclasc; Qs-quartz: Z=zcolite; Try e trydimite; Cal e calcite: FK= K-feldspar."IContains 7% amphibole.•2Contains 5% amphibole.•3Contains 3% mica and 4% gypsum."Contains 19%jarosite.

THE FORMATION OF BENTONITE: MASS BALANCE EFFECTS 269
TABLE II
Chemical composition of bentonites
Sample Si02 AI203 Fe20, Ti02 CaO MgO Na20 K20 CO2 H2O+
MM-I 59.88 17.74 4.91 0.42 5.47 2.34 1.11 0.33 2.13 6.39MM-2 69.29 15.84 4.27 0.54 1.05 1.56 2.20 0.50 0.15 4.65LP-I 61.54 17.86 7.21 0.57 2.77 2.24 2.22 0.38 1.35 4.34EC-I no 14.32 1.07 0.11 1.04 0.64 0.64 3.03 0.60 2.56EC-2 76.77 13.67 0.84 0.10 1.22 0.66 0.31 2.78 0.73 2.61EC-3 72.72 15.60 2.08 0.09 0.38 1.61 0.55 1.98 0.07 4.24EC-4 69.77 17.94 1.45 0.10 0.75 0.58 1.40 4.04 0.38 3.07EC-5 71.65 16.37 2.00 0.10 0.88 0.84 1.33 3.93 0.45 2.14YB-l 69.31 13.32 2.01 0.12 4.52 0.69 2.58 1.32 3.49 2.32YB-2 64.61 2l.47 2.77 0.12 0.28 2.29 1.0 I 1.57 0.05 6.06BF-I 62.79 18.46 5.58 0.53 3.07 1.73 1.34 0.60 1.61 5.19LT-I 54.81 26.15 2.37 0.00 1.19 4.56 0.94 0.42 0.00 9.11LT-2 56.02 26.38 1.52 0.00 1.19 4.43 0.75 0.50 0.00 9.96LT-3 59.24 24.11 0.06 0.00 1.18 5.08 0.93 0.33 0.04 9.62LT-4 57.95 23.51 1.67 0.00 1.76 4.35 0.74 0.33 0.09 9.75LT-5 59.18 22.71 1.17 0.00 1.75 4.90 0.83 0.25 0.00 9.96LT-6 53.91 21.66 1.69 0.00 8.83 3.86 1.00 0.40 5.37 3.98LT-7 60.l7 22.08 0.90 0.00 3.55 3.26 0.66 0.33 0.44 9.53LT-8 57.53 23.34 1.39 0.00 3.12 4.48 0.92 0.33 0.00 9.61LT-9 59.65 23.42 1.11 0.00 0.78 4.92 0.66 0.25 0.00 9.72LT-9/1 60.04 22.27 0.86 0.00 1.41 5.05 0.58 0.34 0.00 9.63LT-9/2 58.19 23.66 1.41 0.00 1.38 4.96 0.61 0.25 0.00 9.44LT-9/3 58.60 23.40 2.24 0.00 1.15 5.25 0.63 0.24 0.66 8.72LT-9/4 58.87 23.31 1.41 0.00 1.39 5.58 0.62 0.17 0.04 8.81LT-IO 57.86 23.35 3.11 0.00 1.95 4.49 0.65 0.33 0.00 9.39LT-IO/l 54.80 26.10 2.60 0.00 1.56 5.18 0.74 0.33 0.00 9.47LT-IO/2 58.64 23.67 0.00 0.00 2.02 4.63 0.66 0.25 0.00 9.31LT-IO/3 57.98 22.94 1.96 0.00 1.58 5.67 0.70 0.33 0.09 9.57LT-IO/4 59.62 22.64 0.33 0.00 1.44 6.43 0.69 0.25 0.09 9.51LT-IO/5 58.41 23.92 1.09 0.00 1.94 4.87 0.69 0.25 0.00 9.27LT-IO/6 58.99 24.47 0.63 0.00 1.40 4.04 0.76 0.34 0.00 9.77LT-II 57.00 25.03 1.22 0.00 1.98 4.78 0.66 0.33 0.00 9.64LT-ll/l 55.13 25.93 2.96 0.00 1.19 4.84 0.38 0.25 0.00 9.25LT-ll/2 56.41 25.38 2.81 0.00 1.14 4.64 0.49 0.30 0.00 9047LT-II/3 61.79 21.17 0.00 0.00 0.80 6.14 0.38 0.25 0.00 9.44LT-ll/4 58.59 21.46 1.92 0.00 1.94 5.15 1.29 0.54 0.13 8.97PC-I/l 61.47 22.53 3.35 0.51 2.60 2.05 2.45 0.61 0.07 6.23PC-Ij2 61.93 20.04 3.59 0.52 1.94 3.00 2.74 0.67 0.18 6.94PC-I/3 52.63 15.94 13.79 0.39 1.23 1.24 3.64 0,81 0.04 8.49PC-I/4 59,83 22.42 4.15 0.46 2,85 1.58 2,88 0.81 0.00 5,04PC-lj5 60,78 20.59 4.88 0,29 1.11 3.79 1.95 0.58 0.00 6.09PC-2/ I 62.03 20.67 3,01 0,22 1.05 5.28 2,51 0.50 0.42 6.57PC-2/2 63.92 20,62 2,74 0.25 0.72 5,21 2,14 0.47 0.05 5.81PC-2/3 60.11 19,10 3.41 0.30 1.28 5.11 2,16 0,80 0,08 5,92PC-2/4 61.22 20041 3.96 0.26 1.05 5,36 1.85 0,53 0.00 6,39PC-2/5 61.31 20,06 3.78 0.38 1.00 5.31 1.89 0.57 0.00 6,25PM-I 65.98 16.47 1.92 0,24 2,06 1.34 3.12 1.80 0,00 6,68PM-2 67.07 17.26 2.21 0,22 0,39 5.02 1.94 0.41 0.10 6.22PM-3 63.56 20.11 2.98 0.45 0,85 5.13 2.42 0.87 0.60 6.08PM-4 61.18 20.08 3.64 0,24 1.37 5.12 2.40 0,67 0.00 6.08PM-5 62.36 20.04 4.42 0.39 1.62 4.76 2.54 0.78 0.00 6.93PM-6 61.96 20.30 3.01 0.25 0,58 3.60 3.33 1.25 0.00 6.23

270
TABLE III
E. CABALLEROET AL.
Regression equations [Barth's ( 1948) cations versus smectite content %I
y X ao b r n Sign.
Si %Sm 72.08 -0.25 0.835 52 1 %0Al %Sm 8.79 0.13 0798 52 1 %0Fe %Sm 3.97 - 0.03 0.333 52 5%Ti %Sm 0.30 0.002 0.339 52 5%Ca %Sm - 0.05 0.0 1 0.352 52 5 %Mg %Sm - 3.85 0. 10 0.848 52 1%0Na %Sm 4.44 - 0.02 0.299 52 5 %K %Sm 4.57 - 0.04 0.782 52 1 %0H %Sm -9.06 0.55 0.791 52 1 %0
ao= Y axis intercept; b=slope; r= correlation coefficient; n::::number of data; Sign.=st atisticsignificance.
taking into account the relation between the oxides of calc-alkaline rocks andthe Si02 content in the rocks from this region (Lopez and Rodriguez Badiola,1980). The final result for parent rock composition is as follows:Si02=79.01 %; A1203= 10.80 %; Fe203=OAO %; Ti02=O.36 %;CaO=O.60 %; Na20=2.37 %; K20=3.95 %; and H 20+=2.51 %.
The MgO value is still zero. This rock is a rh yolite, according to the classification of Lopez and Rodriguez Badiola (1980) which in its form is a modification of that of Pecerillo and Taylor (1976).
Mass balance
Once the parent rock composition is known, losses and gains of matter canbe established . For th is purpose, Barth's values are recalculated so that allsamples contain as much aluminium as the original rock. This assumption isbased on the absence of proper physicochemical conditions for the solutionof aluminium, as evidenced by the study of the composition of hydrothermalsolutions in the region carried out by Caballero et al. (1985). It is assumed,therefore, that all the Al in the rock passed over to smectite. Afterward, thesevalues for cations are recalculated to the weight of the corresponding oxides,and finally, the oxide contents of the inferred parent rock are subtracted fromthe composition of each bentonite. These values are shown in Table IV, expressed as percentages of loss or gain in relation to the parent rock.
From the data obtained, Si exhibited the most important losses, whereas ,considering average values for depos its, there were minor losses for K andNa, and gains in Mg, Fe, Ca and H20.
The silica loss, with a mean value of close to 50 % (weight basis) , is anevidence that the process must be considered highly destructive, since one tonof parent rock only yields half a ton of bentonite, on the average. Now, in

THE FORMATION OF BENTONITE: MASS BALANCE EFFECTS 271
TABLEIV
Barth's ( 1948) balance. Percentageoflosses ( - ) and gains (+ ) at constant Al
Sample Si Fe Ti Ca Mg Na K H Totalloss
MM-I -42.56 2.59 -0,10 2,73 1.42 1.69 -3.75 1.38 -39.98MM-2 - 31.77 2.51 0.01 0.12 1.06 -0.87 -3.61 0.66 -31.89LP-I -41.80 3,96 -0.02 1.08 1.35 -1.03 -3.72 0.11 -40.06EC-I -20.94 0.41 -0.28 0.18 0.48 -1.89 -1.66 -0.58 -24,27EC-2 -19.23 0.25 -0.28 0.35 0,51 -2.13 -1.79 -0.48 -22.79EC-3 -28.62 1.04 -0.30 -0.34 1.11 -1.99 -2.58 0.43 -31.24EC-4 -37.01 0.47 -0.30 -0.15 0,35 -1.53 -1.52 -0.66 -40.34EC-5 -31.74 0,92 -0.29 -0,02 0,55 -1.49 -1,36 -1.10 -34.53VB-I -22.81 1.23 -0.26 3.06 0.56 -0.28 -2.88 -0.63 -22.01VB-2 -46.51 0.99 -0.30 -0.46 1.15 -1.86 -3.16 0.54 -49.61BF-I -41.27 2.86 -0.05 1.20 1.01 -1.59 -3.60 0.53 -41.91LT-I -56.37 0.58 -0.36 -0.11 1.88 -1.98 -3.78 1.25 -58.89LT-2 -56.08 0,22 -0.36 -0.11 1.81 -2.06 -3.75 1.57 -58.75LT-3 -52.47 0.37 -0,36 0.07 2.28 -1.95 -3.80 1.80 -54.96LT-4 -52.39 0.37 -0,36 0,21 2,00 -2.03 -3.80 1.97 -54.03LT-5 -50.87 0.16 -0.36 0.23 2.33 -1.98 -3.83 2.23 -52,09LT-6 -52.13 0.44 -0.36 3.80 1.92 -1.87 -3.75 -0.53 -52.47LT-7 -49.58 0,04 -0.36 1.14 1.59 -2.05 -3.79 2.15 -50.85LT-8 -52.39 0,24 -0.36 0,84 2,07 -1.94 -3.80 1.94 -53.39LT-9 -51.50 0,11 -0.36 -0.24 2.27 -2.07 -3.83 1.97 -53.65LT-9/1 -49,89 0.02 -0.36 0.08 2.45 -2.09 -3.79 2.16 - 51.42LT-9/2 -52.45 0.24 -0.36 0,03 2.26 -2.09 -3.84 1.80 -54.40LT-9/3 - 51.96 0.63 -0,36 -0,07 2.42 -2,08 -3,84 1.51 -53.74LT-9/4 - 51.73 0.25 -0.36 0,04 2,59 -2.08 -3.87 1.57 -53.59LT-IO -52.25 1.04 -0.36 0,30 2.08 -2.07 -3.80 1.83 -53.22LT-I0/l -56.33 0.68 -0.36 0.05 2,14 -2.06 -3.81 1.41 -58.30LT-I0/2 -52.25 -0.40 -0.36 0.32 2.11 -2,07 -3.84 1.74 -54.75LT-1O/3 -51.7! 0.52 -0,36 0,14 2.67 -2.04 -3.79 2.00 -52,58LT-1O/4 -50.57 -0.24 -0.36 0,09 3.07 -2.04 -3.83 2,03 -51.86LT-I0/5 -52.64 0,09 -0.36 0,28 2,20 -2.06 -3.84 1.68 -54,65LT-1O/6 -52.97 -0.12 -0.36 0.02 1.78 -2,03 -3,80 1.80 -55,69LT-II -54.42 0,13 -0.36 0,25 2.06 -2.09 -3,81 1.65 -56.58LT-!!/! -56.05 0.83 -0.36 -0.10 2.02 -2.21 -3,85 1.34 -58.38LT-II/2 - 55.Ql 0,80 -0.36 -0,11 1.97 -2.16 -3,82 1.52 -57.17LT-ll/3 -47.49 -0.40 -0,36 -0.19 3.13 -2.18 -3,82 2.31 -49.00LT-ll/4 -49.52 0,57 -0,36 0.38 2,59 -1.72 -3.68 2,00 -49,74PC-I/! -49.54 1.21 -0,12 0.65 0.98 -1.20 -3.66 0.48 -51.20PC-I/2 -45.63 1.53 0.08 0.45 1.62 -0,89 -3.59 1.23 -45.37PC-1/3 -43,35 8,94 -0.10 0,23 0,84 0,10 -3.40 3,24 -33.49PC-1/4 -50.19 1.60 -0.14 0,77 0,76 -0.98 -3.56 -0.08 -51.82PC-l/5 -47.13 2,16 -0,21 -0.02 1.99 -1.35 -3.65 0.68 -47.52PC-2/1 -46.60 1.17 -0.25 -0.05 2.76 -1.06 -3.69 0.92 -46.79PC-2/2 -45,53 1.04 -0.23 -0,22 2.73 -1.25 -3.70 0.53 -46.64PC-2/3 -45.02 1.53 -0.19 0,12 2.89 -1.15 -3,50 0.84 -44.48PC-2/4 -46.62 1.70 -0,22 -0.04 2,84 -1.39 -3,67 0.87 -46,54PC-2/5 -46.00 1.64 -0,16 -0.06 2,86 -1.35 -3,64 0,85 -45.87PM-l -35.74 0.86 -0.20 0.75 0.88 -0.32 -2.77 1,87 -34,68MP-2 -37,04 0,98 -0.22 -0.36 3.14 -1.16 -3.69 1.38 -36.96PM-3 -44,88 1.20 -0.12 -0,14 2,76 -1.07 3.48 -0.76 -44.98PM-4 -46.10 1.56 -0.23 0,14 2,75 -1.08 -3,59 1.20 -45.36PM-5 -45.40 1.98 -0.15 0,27 2,57 -1.00 -3.53 1.22 -44.04PM-6 -46.05 1.20 -0,23 -0.29 1.92 -0,60 -3.28 0.80 -46.53

272 E. CABALLERO ET AL.
order to remove all this SiO2 in solution, large amounts of water are needed.Actually, taking into account the solubility of Si02 at 60°C - which is themean temperature of bentonite formation in this region (Leone et al., 1983)- it ispossibleto calculate, usingdata reported by Fournier and Rowe ( 1977),that more than 2300 m' water is necessary to leach 0.5 ton of Si02• That is tosay, for each ton of unaltered pyroclastic material more than 2300 m' wateris necessary to form 0.5 ton of bentonite. This is the minimum amount ofwater needed to maintain the silica in solution .
These high amounts of water can contribute small quantities of elementswhich can enter into the smectite network. For instance, for the estimatedwater/rock ratio (2300/1) all the MgO (2.33 %as mean value) contained inthe Trancos Deposit could be contributed by a solution containing 28 ppmMgO (about 1 meqjl). This is a common value for aquifers which have percolated through metamorphic and sedimentary formations (Hem, 1970). Itcan also be deduced that Fe gains (PC/l deposit) could be obtained from asolution with more than 6 ppm of Fe content; this value corresponds to solutions of meteoric origin (Hem, 1970). Similar calculations can be made forthe rest of the elements.
Taking into account the geographic location of the samples (Fig. 1) it canbe observed that total Si02 losses are more important in the northern zone.The same is valid for the gains in Mg2+ (Table V) and H20+. This fact mustbe related, on the one hand, to the hydrodynamic history of these solutions.Caballero et al. (1985) conclude that the hydrothermal solutions acting inthe region came from the northern ranges (Sierra Alhamilla and Cabrera)and that, while travelling southward through deep fractures, they were heated,and in this way the percolated materials were altered. These authors also suggested that the chemical composition of solutions should have changed during their migration. Thus, exchangeable Mg in smectites decreases toward thesouth, which is in accordance with the greater Mg contribution in the north.
The variations in matter loss encountered in the N-S direction must berelated also to the reactivity of solutions. The solutions probably lost part oftheir altering capacity as they travelled southward due to a gradual transfer ofions between the solutions and the pyroclastic materials. Thus, the solution
TABLE V
Geographic variation of MgO% and MgV'
MgO MgV'(% )
Los Trancos (LT) 4.86 0.760Serrata de Nijar (PC, PM) 3.93 1.032Zona Centro (BF,MM, LP) 1.97 1.178Zona Sur (VB, EC) 1.04 0.904

THE FORMATION OF BENTONITE: MASS BALANCE EFFECTS 273
should undergo essentially a proton loss (hydrogen metasomatism afterRemley and Jones, 1964) and a gain in solutes, derived from the hydrolysisof volcanic materials, until reaching total inactivity when a compositionalequilibrium with the volcanic rocks is attained (Helgeson et al., 1969).
Mass balance and smectitecharacteristics
From the data obtained it is apparent that there is a relation between theloss of matter and the smectite content in bentonites. Both variables are related through the regression equation:
% totalloss=6.1763+0.4695 %smectite, (r=0.866, n=52)
Some interesting conclusions can be drawn from this equation: (1) The Yaxis intercept indicates that there was some loss of matter prior to smectiteformation. The volcanic materials must have been hydrolyzed before smectite formed from the hydrolysis products. (2) The material lossesceased whenthe entire original material has been transformed into smectite. Nevertheless,this is not necessarily always the case, since in other deposits of this region(data not published) there are bentonites which have suffered variable lossesin matter, although their composition is always 100 %smectite. In such casesit is necessary to assume that the smectite itself is hydrolyzed and partiallydestroyed.
With the purpose of exploring the relation existing between the chemicalcomposition of smectite and the percentage of matter loss, a series of linearregressions were calculated (Table VII) using the calculated structural formulae. These crystallochemical formulae have been obtained usingthe methodof Marshall (1949). Samples containing small mineral impurities were discarded. For this reason, we calculated 39 formulae (Table VI).
A new regression between the total matter loss and the percentage of smectite has been done for these data:
% total loss= 14.396+0.388 % smectite (r=0.525, n= 39)
the correlation level is again higher than 1%0.The most important fact observed in Table VII is that smectite suffered a
change in composition as the material loss increases. Smectite compositionseems to depend on the degree of alteration of volcanic rocks. Thus, the composition of an initial smectite (from 14.40 %total loss and a smectite contentclose to zero) and a final one (53.20 % total loss and 100%smectite), can beinferred.
The compositions calculated on the basis of the regression equations in Table VII are as follows: initial smectite, (Sis) (Al1.84Feo.n M g 2.09 ) X6.26 0 20
(OH)4; and final smectite, (Sh55Alo.45) (A13.39 FeO.33 Mgo.92 ) Xt03 0 20
(OH)4'

274 E. CABALLERO ET AL.
TABLE VI
Structural formulae of smectites
Sample Si1v Apv AIYI Fev l MgY1 X+
LP-I 7.672 0.328 2.452 0.668 1.178 0.614VB-2 7.672 0.313 2.955 0.270 0.904 0.832LT-l 7.209 0.791 3.348 0.312 0.479 0.852LT-2 7.296 0.704 3.328 0.237 0.591 0.830LT-3 7.553 0.447 3.199 0.146 0.758 0.900LT-4 7.576 0.424 3.241 0.144 0.763 0.796LT-5 7.537 0.463 3.224 0.100 0.811 0.867LT-6 7.388 0.612 3.214 0.234 0.763 0.744LT-7 7.633 0.367 3.213 0.000 0.918 0.892LT-8 7.645 0.355 3.231 0.155 0.610 0.975LT-9 7.599 0.401 3.186 0.178 0.693 0.925LT-9/1 7.596 0.440 3.027 0.120 0.968 1.071LT-9/2 7.607 0.393 3.095 0.225 0.738 0.954LT-9/3 7.614 0.386 3.047 0.135 0.909 1.091LT-9/4 7.958 0.042 3.154 0.077 0.707 0.931LT-IO 7.382 0.618 3.105 0.253 0.740 1.064LT-IO/1 7.331 0.669 3.320 0.192 0.679 0.775LT-IO/2 7.418 0.582 3.236 0.236 0.589 0.988LT-1O/3 7.631 0.369 3.016 0.240 0.861 0.879LT-1O/4 7.761 0.239 3.148 0.133 0.842 0.713LT-IO/5 7.549 0.451 3.078 0.232 0.793 0.935LT-IO/6 7.653 0.347 3.197 0.073 0.838 0.860LT-l [ 7.371 0.629 3.215 0.219 0.720 0.885LT-l1/1 7.174 0.826 3.204 0.239 0.703 1.092LT-ll/2 7.349 0.651 3.303 0.231 0.650 0.747LT-ll/3 7.698 0.302 3.186 0,096 0.869 0.718LT-ll/4 7,775 0.225 3.038 0.055 1.0[5 0.918PC-Ill 7.590 0.410 2.997 0.439 0.809 0.483PC-1/2 7.560 0.440 3.054 0.460 0.716 0.466PC-1/4 7.708 0.292 2.652 0.658 0.925 0.511PC-liS 7.623 0.377 2.79[ 0.533 0.898 0.609PC-2/1 7.559 0.441 2.868 0.310 1.062 0.781PC-2/2 7.638 0.362 2.751 0.293 1.217 0.793PC-2/3 7.758 0.242 2.730 0.340 1.172 0.687PC-2/4 7.700 0.300 2.689 0.381 1.182 0.725PC-2/5 7.789 0.211 2.815 0.307 1.044 0.755PM-2 7.831 0.169 2.756 0.193 1.323 0.675PM-3 7.405 0.595 2.984 0.336 0.969 0.698PM-4 7.710 0.290 2.792 0.357 1.067 0.709
Si1v =tetrahedral silicon; Al'"=tetrahedral aluminium; AIYI, MgV1 and FeVI= octahedral cations;X+ =layer charge.
The initial smectite has less tetrahedral substitution, (AIlV) and layer charge,
and more (Fe Yl) and (Mg'") than the final smectite. The composition of the
final bentonite appears to be more correct because the initial one would have
THE FORMATION OF BENTONITE: MASS BALANCE EFFECTS
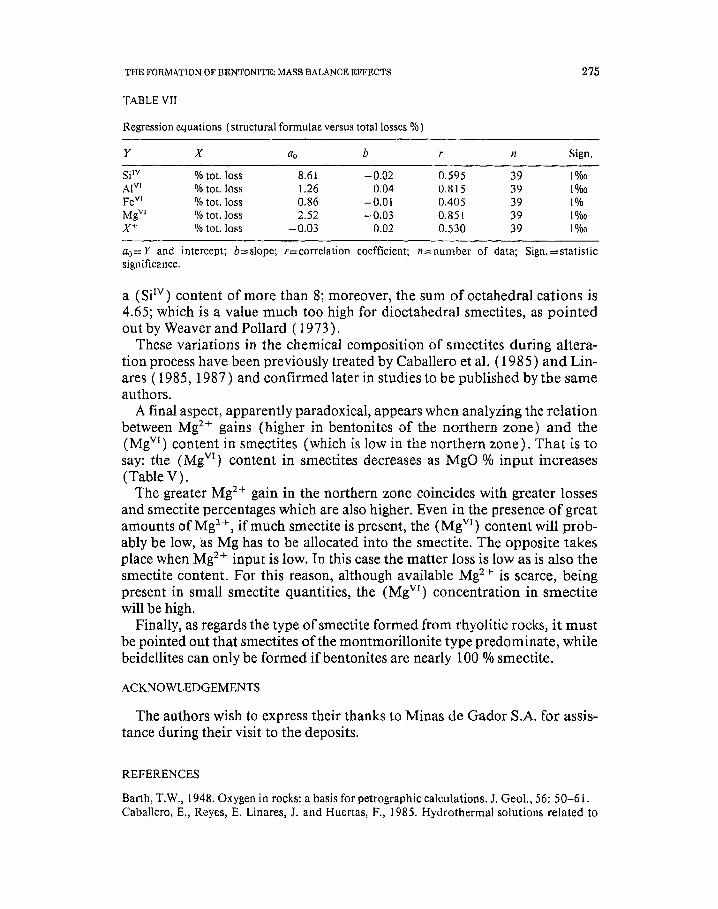
TABLEVII
Regression equations (structural formulae versus total losses %)
275
y X Qo b r n Sign.
Spv % tot. loss 8.61 -0.02 0.595 39 10/00AIYI % tot. loss 1.26 0.04 0.815 39 1%0FeY I % tot. loss 0.86 -0.01 00405 39 1%MgY I % tot. loss 2.52 -0.03 0.851 39 1%0X+ % tot. loss -0.03 0.02 0.530 39 1%0
Qo= Y and intercept; b=slope; r=correlation coefficient; n=number of data; Sign.=statisticsignificance.
a (SiIV) content of more than 8; moreover, the sum of octahedral cations is
4.65; which is a value much too high for dioctahedral smectites, as pointedout by Weaver and Pollard (1973).
These variations in the chemical composition of smectites during alteration process have been previously treated by Caballero et aI. (1985) and Linares ( 1985, 1987) and confirmed later in studies to be published by the sameauthors.
A final aspect, apparently paradoxical, appears when analyzing the relationbetween Mg2 + gains (higher in bentonites of the northern zone) and the(MgVI) content in smectites (which is low in the northern zone). That is tosay: the (MgV1
) content in smectites decreases as MgO % input increases(Table V).
The greater Mg2+ gain in the northern zone coincides with greater lossesand smectite percentages which are also higher. Even in the presence of greatamounts of Mg2+, if much smectite is present, the (Mg VI
) content will probably be low, 'as Mg has to be allocated into the smectite. The opposite takesplace when Mg2+ input is low. In this case the matter loss is low as is also thesmectite content. For this reason, although available Mg2+ is scarce, beingpresent in small smectite quantities, the (MgV I
) concentration in smectitewill be high.
Finally, as regards the type of smectite formed from rhyolitic rocks, it mustbe pointed out that smectites ofthe montmorillonite type predominate, whilebeidellites can only be formed if bentonites are nearly 100 % smectite.
ACKNOWLEDGEMENTS
The authors wish to express their thanks to Minas de Gador S.A. for assistance during their visit to the deposits.
REFERENCES
Barth, T.W., 1948. Oxygen in rocks: a basis for petrographic calculations. J. Geo!., 56: 50-61.Caballero, E., Reyes, E. Linares, J. and Huertas, F., 1985. Hydrothermal solutions related to
276 E. CABALLERO ET AL.
bentonite genesis, Cabo de Gata region, Almeria. SE Spain. Mineral. Petrogr. Acta., 29-A;187-196.
Caballero, E., Reyes, E., Huertas, F. and Linares, J., 1991. Factores que afectan a la cornposicion de las esmectitas. (to be published).
Fournier, R.O. and Rowe, 1.J., 1977. The solubility of amorphous silica in water at high temperatures and high pressures. Amer. Mineral., 62: 1052-1056.
Helgeson, Re., Garrels, R.M. and Mackenzie, F.J., 1969. Evaluation of irreversible reaction ingeochemical processes involving minerals and aqueous solutions - 1I. Applications. Geochirn, Cosmochim. Acta., 33: 455-481.
Hem, J.D., 1970. Study and interpretation of the chemical characteristics of natural water. Geol.Surv. Water-supply Pap., 1473,363 pp.
Hernley, .J.J. and Jones, W.R., 1964. Chemical aspects of hydrothermal alteration with emphasis on hydrogen metasomatism. Econ. Geol., 59: 538-569.
Huertas, F. and Linares, J., 1974. Metcdos de analisis de rocas y rninerales. Report interno.E.E.z. Granada.
Leone. G., Reyes, E. Cortecci, G., Pochini, A. and Linares, J., 1983. Genesis of bentonite fromCabo de Gata, Almeria, Spain: a stable isotope study. Clay Miner., 18: 227-238.
Linares, 1., 1985. The process ofbentonite formation in Cabo de Gata, Almeria, Spain. Mineral.Petrogr. Acta., 29-A: 17-33.
Linares, J., 1987. Chemical evolutions related to the genesis of hydrothermal smectites (Almeria, SE Spain), In: Geochemistry and Mineral formation in the earth surface e.S.I.e.C.N.R.S., Madrid, pp. 567-584.
Lopez Ruiz, J. and Rodriguez Badiola, E., 1980. La region volcanica neogena del sureste deEspana. Estud. Geol., 36: 5-63.
Marshall, c.E., 1949. The colloid chemistry of the silicate minerals. Academic Press, New York.,N.Y.,195pp.
Pecerillo, A. and Taylor, S.R., 1976. Geochemistry of Eocene cal-alkaline volcanic rocks fromthe Kastamonu area, Northern Turkey. Contrib. Mineral. Petrol., 58: 63-81.
Reyes, E., Huertas, F. and lineal'S, J. (1979a). Mineralogia y Geoquimica de las bentonitas dela zona norte de Cabo de Gata (Almeria). V. Area de Los Trancos. Estud. Geol., 35: 363370.
Reyes, E., Huertas, F. and Linares, J., 1979b. Mineralogia y Geoqulmica de las bentonitas de lazona norte de Cabo de Gata (Almeria). VI. Area de Pozo Usero. Estud. Geol., 35: 355-362.
Tatlock, D.B., 1966. Rapid modal analysis of some felsic rocks from calibrated X-Ray diffraction patterns. U.S. Geo!. Surv, Bull., 1209,41 pp,
Weaver, C. and Pollard, L.D., 1973. The Chemistry of Clay Minerals. Elsevier, Amsterdam, 213pp.
Copyright © 2022 FDOKUMEN