Trophic analysis of Lake Awassa (Ethiopia) using mass-balance Ecopath model
11
ecological modelling 201 ( 2 0 0 7 ) 398–408 available at www.sciencedirect.com journal homepage: www.elsevier.com/locate/ecolmodel Trophic analysis of Lake Awassa (Ethiopia) using mass-balance Ecopath model Tadesse Fetahi, Seyoum Mengistou ∗ Department of Biology, Addis Ababa University, P.O. Box 1176, Addis Ababa, Ethiopia article info Article history: Received 5 April 2006 Received in revised form 12 September 2006 Accepted 2 October 2006 Published on line 30 November 2006 Keywords: Lake Awassa Ecopath with Ecosim Trophic relationship Ecosystems abstract A user-friendly software model, Ecopath with Ecosim, version 5.0 Beta, was used to construct energy flow and mixed trophic impact (MTI) for the Lake Awassa ecosystem (Ethiopia). We used data from the literature and also several parameters were estimated from the present study done from November 2003–August 2004. Thirteen functional groups including two ontogeny ones were used in the present analysis, which assessed the trophic relationship, energy flow and interactions between them. The producers particularly phytoplankton and detritus are under exploited; hence energy transfer from lower trophic levels is low. On the contrary, all consumers have ecotrophic efficiency (EE) close to 1 indicating that consumers are heavily exploited in the system. Flow from detritus was as important as flow from phy- toplankton. Flow from both herbivorous and carnivorous zooplankton to consumers was high. MTI analyses indicate that phytoplankton and detritus have positive impact on most other groups while zoobenthos has negative impact on some groups. Lake Awassa has low ecological efficiency with a value of 0.00144 for the gross efficiency of the fisheries. The system primary production/respiration (P/R) ratio of Lake Awassa is 5.834 showing that the lake is at developmental stage, with high autotrophy, and some attention should be given to human impacts. This trophic model analysis also enabled us to confirm/refute previous studies and pinpoint critical gaps in the present knowledge about Lake Awassa. © 2006 Published by Elsevier B.V. 1. Introduction Lake Awassa is comparatively one of the most-thoroughly studied lakes in Ethiopia and many investigators have studied different aspects of the lake (Tudorancea et al., 1988; Kibret and Harrison, 1989; Taylor and Gebre-Mariam, 1989; Teferra and Fernando, 1989; Kifle and Belay, 1990; Mengistou and Fernando, 1991; Kebede and Belay, 1994; Tekle-Giorgis and Casselman, 1995; Admassu, 1996; Admassu and Dadebo, 1997; Dadebo, 2000). But even though relatively large literature data are available on various elements of the lake separately, no attempt has been made to bring the information together in order to see the foodweb relationship in the system. For ∗ Corresponding author. Tel.: +251 11 239 471; fax: +251 1 239471. E-mail address: [email protected] (S. Mengistou). Lake Awassa, earlier, Mengistou (1989) recommended a switch from descriptive to trophic analysis and synthesis in order to understand the lake as an ecosystem. Further, whole-lake ecosystem study in Ethiopia in indispensable as the diver- sity of the freshwater biota is poorly known and the rate of degradation of the environment is very high (Getahun and Stiassny, 1998). Perhaps one of the plausible reasons for not pursuing such studies so far in Ethiopia was the lack of comprehensive and easy-to-use models. This also requires estimates of several functional groups of the ecosystem, which in turn requires either working with different specialists or reviewing the literature they documented (Christensen et al., 2000). 0304-3800/$ – see front matter © 2006 Published by Elsevier B.V. doi:10.1016/j.ecolmodel.2006.10.010
-
Upload
independent -
Category
Documents
-
view
1 -
download
0
Transcript of Trophic analysis of Lake Awassa (Ethiopia) using mass-balance Ecopath model
e c o l o g i c a l m o d e l l i n g 2 0 1 ( 2 0 0 7 ) 398–408
avai lab le at www.sc iencedi rec t .com
journa l homepage: www.e lsev ier .com/ locate /eco lmodel
Trophic analysis of Lake Awassa (Ethiopia) usingmass-balance Ecopath model
Tadesse Fetahi, Seyoum Mengistou ∗
Department of Biology, Addis Ababa University, P.O. Box 1176, Addis Ababa, Ethiopia
a r t i c l e i n f o
Article history:
Received 5 April 2006
Received in revised form
12 September 2006
Accepted 2 October 2006
Published on line 30 November 2006
Keywords:
Lake Awassa
Ecopath with Ecosim
Trophic relationship
Ecosystems
a b s t r a c t
A user-friendly software model, Ecopath with Ecosim, version 5.0 Beta, was used to construct
energy flow and mixed trophic impact (MTI) for the Lake Awassa ecosystem (Ethiopia). We
used data from the literature and also several parameters were estimated from the present
study done from November 2003–August 2004. Thirteen functional groups including two
ontogeny ones were used in the present analysis, which assessed the trophic relationship,
energy flow and interactions between them. The producers particularly phytoplankton and
detritus are under exploited; hence energy transfer from lower trophic levels is low. On the
contrary, all consumers have ecotrophic efficiency (EE) close to 1 indicating that consumers
are heavily exploited in the system. Flow from detritus was as important as flow from phy-
toplankton. Flow from both herbivorous and carnivorous zooplankton to consumers was
high. MTI analyses indicate that phytoplankton and detritus have positive impact on most
other groups while zoobenthos has negative impact on some groups. Lake Awassa has low
ecological efficiency with a value of 0.00144 for the gross efficiency of the fisheries. The
system primary production/respiration (P/R) ratio of Lake Awassa is 5.834 showing that the
lake is at developmental stage, with high autotrophy, and some attention should be given
to human impacts. This trophic model analysis also enabled us to confirm/refute previous
studies and pinpoint critical gaps in the present knowledge about Lake Awassa.
estimates of several functional groups of the ecosystem, which
1. Introduction
Lake Awassa is comparatively one of the most-thoroughlystudied lakes in Ethiopia and many investigators have studieddifferent aspects of the lake (Tudorancea et al., 1988; Kibretand Harrison, 1989; Taylor and Gebre-Mariam, 1989; Teferraand Fernando, 1989; Kifle and Belay, 1990; Mengistou andFernando, 1991; Kebede and Belay, 1994; Tekle-Giorgis andCasselman, 1995; Admassu, 1996; Admassu and Dadebo, 1997;Dadebo, 2000). But even though relatively large literature data
are available on various elements of the lake separately, noattempt has been made to bring the information togetherin order to see the foodweb relationship in the system. For∗ Corresponding author. Tel.: +251 11 239 471; fax: +251 1 239471.E-mail address: [email protected] (S. Mengistou).
0304-3800/$ – see front matter © 2006 Published by Elsevier B.V.doi:10.1016/j.ecolmodel.2006.10.010
© 2006 Published by Elsevier B.V.
Lake Awassa, earlier, Mengistou (1989) recommended a switchfrom descriptive to trophic analysis and synthesis in orderto understand the lake as an ecosystem. Further, whole-lakeecosystem study in Ethiopia in indispensable as the diver-sity of the freshwater biota is poorly known and the rate ofdegradation of the environment is very high (Getahun andStiassny, 1998). Perhaps one of the plausible reasons for notpursuing such studies so far in Ethiopia was the lack ofcomprehensive and easy-to-use models. This also requires
in turn requires either working with different specialists orreviewing the literature they documented (Christensen et al.,2000).
g 2 0
wtbtfcs2ouEaitotob
1
Lc3Aa
F(
e c o l o g i c a l m o d e l l i n
In recent years a user-friendly software model, Ecopathith Ecosim (EwE), has been widely used to describe the
rophic relationships in aquatic ecosystems on quantitativeases. Once an Ecopath model is constructed for an ecosys-em, it is possible to have an overview of the resources and theeeding interactions in the ecosystem. Ecopath, for example,an quickly identify an extinction prey group due to heavy con-umption by a large number of predator groups (Pauly et al.,000). Moreau et al. (1993a) have confirmed both the accuracyf previous works (biomass and production estimates) and thenderutilization of phytoplankton by fishes with the help ofcopath model in Lake George, Uganda. Mavuti et al. (1996)lso noted that by identifying mis-utilizations of food sourcesn the ecosystem (species groups), Ecopath can contribute tohe development of fisheries in African inland waters. Thebjective of this paper is to characterize the food web interac-ion of the different functional groups and to analyze the flowf energy in Lake Awassa (Ethiopia, East Africa) using massalance EwE version 5 model.
.1. The study site: Lake Awassa
ake Awasa is located at an altitude of 1680 m in the
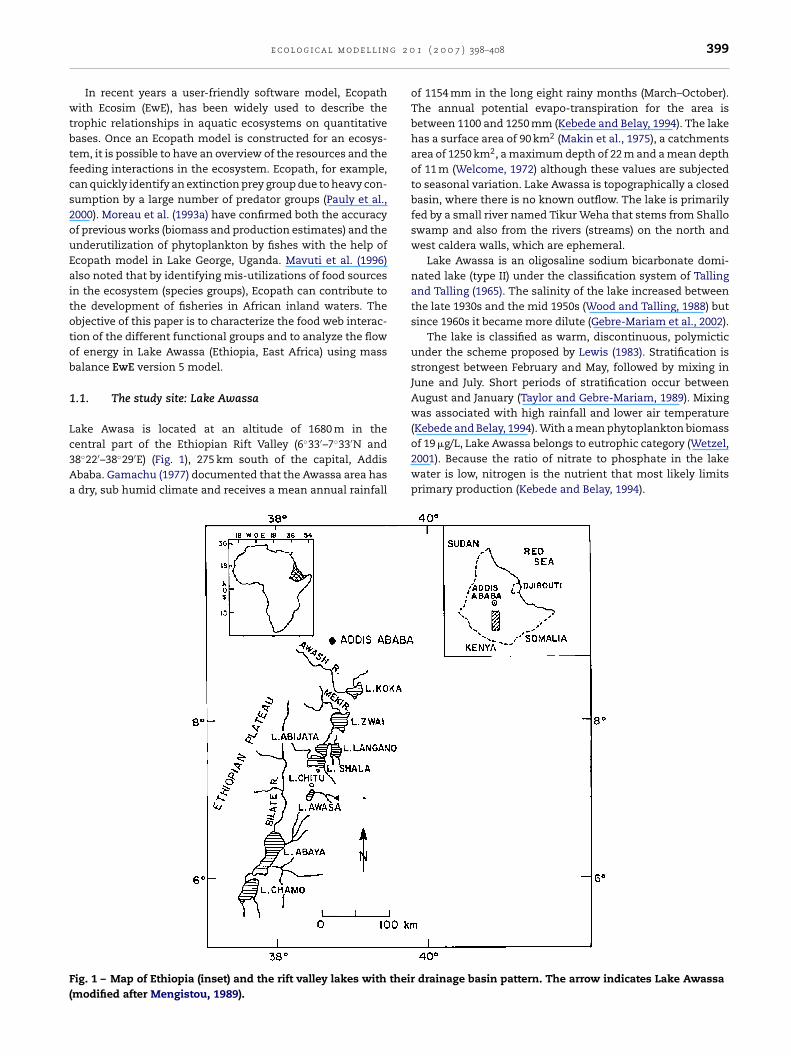
entral part of the Ethiopian Rift Valley (6◦33′–7◦33′N and8◦22′–38◦29′E) (Fig. 1), 275 km south of the capital, Addisbaba. Gamachu (1977) documented that the Awassa area hasdry, sub humid climate and receives a mean annual rainfallig. 1 – Map of Ethiopia (inset) and the rift valley lakes with theirmodified after Mengistou, 1989).
1 ( 2 0 0 7 ) 398–408 399
of 1154 mm in the long eight rainy months (March–October).The annual potential evapo-transpiration for the area isbetween 1100 and 1250 mm (Kebede and Belay, 1994). The lakehas a surface area of 90 km2 (Makin et al., 1975), a catchmentsarea of 1250 km2, a maximum depth of 22 m and a mean depthof 11 m (Welcome, 1972) although these values are subjectedto seasonal variation. Lake Awassa is topographically a closedbasin, where there is no known outflow. The lake is primarilyfed by a small river named Tikur Weha that stems from Shalloswamp and also from the rivers (streams) on the north andwest caldera walls, which are ephemeral.
Lake Awassa is an oligosaline sodium bicarbonate domi-nated lake (type II) under the classification system of Tallingand Talling (1965). The salinity of the lake increased betweenthe late 1930s and the mid 1950s (Wood and Talling, 1988) butsince 1960s it became more dilute (Gebre-Mariam et al., 2002).
The lake is classified as warm, discontinuous, polymicticunder the scheme proposed by Lewis (1983). Stratification isstrongest between February and May, followed by mixing inJune and July. Short periods of stratification occur betweenAugust and January (Taylor and Gebre-Mariam, 1989). Mixingwas associated with high rainfall and lower air temperature(Kebede and Belay, 1994). With a mean phytoplankton biomass
of 19 �g/L, Lake Awassa belongs to eutrophic category (Wetzel,2001). Because the ratio of nitrate to phosphate in the lakewater is low, nitrogen is the nutrient that most likely limitsprimary production (Kebede and Belay, 1994).drainage basin pattern. The arrow indicates Lake Awassa
i n g 2 0 1 ( 2 0 0 7 ) 398–408
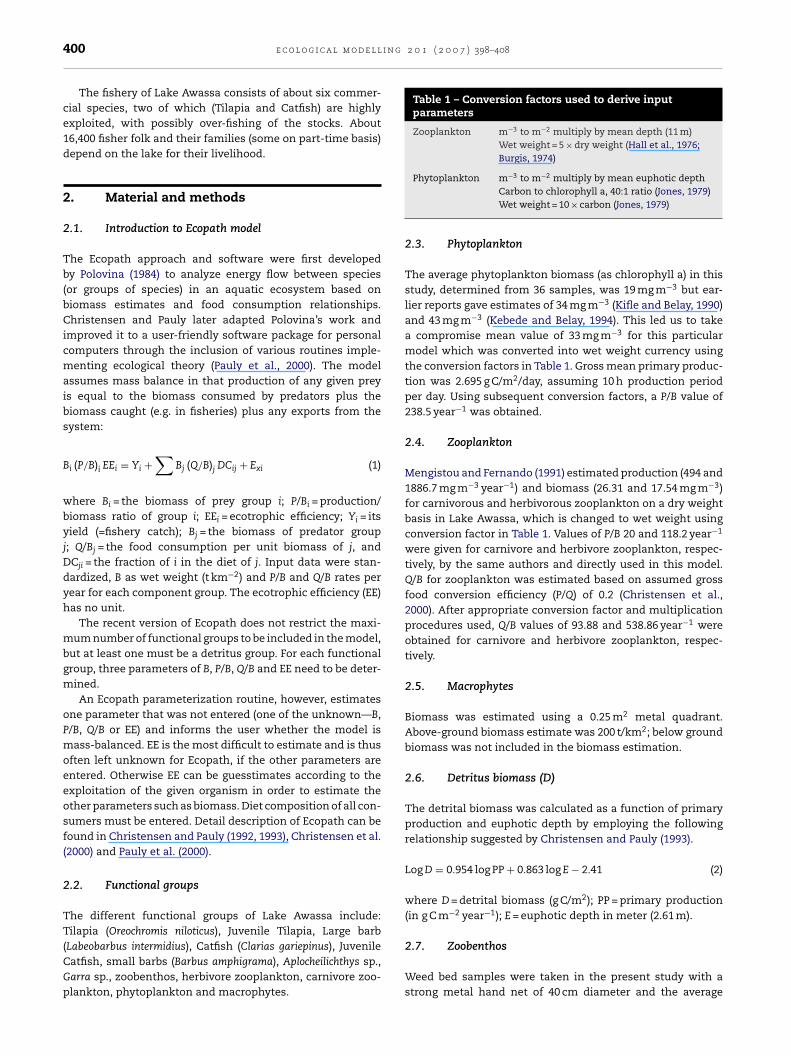
Table 1 – Conversion factors used to derive inputparameters
Zooplankton m−3 to m−2 multiply by mean depth (11 m)Wet weight = 5 × dry weight (Hall et al., 1976;Burgis, 1974)
−3 −2
400 e c o l o g i c a l m o d e l l
The fishery of Lake Awassa consists of about six commer-cial species, two of which (Tilapia and Catfish) are highlyexploited, with possibly over-fishing of the stocks. About16,400 fisher folk and their families (some on part-time basis)depend on the lake for their livelihood.
2. Material and methods
2.1. Introduction to Ecopath model
The Ecopath approach and software were first developedby Polovina (1984) to analyze energy flow between species(or groups of species) in an aquatic ecosystem based onbiomass estimates and food consumption relationships.Christensen and Pauly later adapted Polovina’s work andimproved it to a user-friendly software package for personalcomputers through the inclusion of various routines imple-menting ecological theory (Pauly et al., 2000). The modelassumes mass balance in that production of any given preyis equal to the biomass consumed by predators plus thebiomass caught (e.g. in fisheries) plus any exports from thesystem:
Bi (P/B)i EEi = Yi +∑
Bj (Q/B)j DCij + Exi (1)
where Bi = the biomass of prey group i; P/Bi = production/biomass ratio of group i; EEi = ecotrophic efficiency; Yi = itsyield (=fishery catch); Bj = the biomass of predator groupj; Q/Bj = the food consumption per unit biomass of j, andDCji = the fraction of i in the diet of j. Input data were stan-dardized, B as wet weight (t km−2) and P/B and Q/B rates peryear for each component group. The ecotrophic efficiency (EE)has no unit.
The recent version of Ecopath does not restrict the maxi-mum number of functional groups to be included in the model,but at least one must be a detritus group. For each functionalgroup, three parameters of B, P/B, Q/B and EE need to be deter-mined.
An Ecopath parameterization routine, however, estimatesone parameter that was not entered (one of the unknown—B,P/B, Q/B or EE) and informs the user whether the model ismass-balanced. EE is the most difficult to estimate and is thusoften left unknown for Ecopath, if the other parameters areentered. Otherwise EE can be guesstimates according to theexploitation of the given organism in order to estimate theother parameters such as biomass. Diet composition of all con-sumers must be entered. Detail description of Ecopath can befound in Christensen and Pauly (1992, 1993), Christensen et al.(2000) and Pauly et al. (2000).
2.2. Functional groups
The different functional groups of Lake Awassa include:
Tilapia (Oreochromis niloticus), Juvenile Tilapia, Large barb(Labeobarbus intermidius), Catfish (Clarias gariepinus), JuvenileCatfish, small barbs (Barbus amphigrama), Aplocheilichthys sp.,Garra sp., zoobenthos, herbivore zooplankton, carnivore zoo-plankton, phytoplankton and macrophytes.Phytoplankton m to m multiply by mean euphotic depthCarbon to chlorophyll a, 40:1 ratio (Jones, 1979)Wet weight = 10 × carbon (Jones, 1979)
2.3. Phytoplankton
The average phytoplankton biomass (as chlorophyll a) in thisstudy, determined from 36 samples, was 19 mg m−3 but ear-lier reports gave estimates of 34 mg m−3 (Kifle and Belay, 1990)and 43 mg m−3 (Kebede and Belay, 1994). This led us to takea compromise mean value of 33 mg m−3 for this particularmodel which was converted into wet weight currency usingthe conversion factors in Table 1. Gross mean primary produc-tion was 2.695 g C/m2/day, assuming 10 h production periodper day. Using subsequent conversion factors, a P/B value of238.5 year−1 was obtained.
2.4. Zooplankton
Mengistou and Fernando (1991) estimated production (494 and1886.7 mg m−3 year−1) and biomass (26.31 and 17.54 mg m−3)for carnivorous and herbivorous zooplankton on a dry weightbasis in Lake Awassa, which is changed to wet weight usingconversion factor in Table 1. Values of P/B 20 and 118.2 year−1
were given for carnivore and herbivore zooplankton, respec-tively, by the same authors and directly used in this model.Q/B for zooplankton was estimated based on assumed grossfood conversion efficiency (P/Q) of 0.2 (Christensen et al.,2000). After appropriate conversion factor and multiplicationprocedures used, Q/B values of 93.88 and 538.86 year−1 wereobtained for carnivore and herbivore zooplankton, respec-tively.
2.5. Macrophytes
Biomass was estimated using a 0.25 m2 metal quadrant.Above-ground biomass estimate was 200 t/km2; below groundbiomass was not included in the biomass estimation.
2.6. Detritus biomass (D)
The detrital biomass was calculated as a function of primaryproduction and euphotic depth by employing the followingrelationship suggested by Christensen and Pauly (1993).
Log D = 0.954 log PP + 0.863 log E − 2.41 (2)
where D = detrital biomass (g C/m2); PP = primary production(in g C m−2 year−1); E = euphotic depth in meter (2.61 m).
2.7. Zoobenthos
Weed bed samples were taken in the present study with astrong metal hand net of 40 cm diameter and the average
g 2 0
zfm
L
wmw
m(w
2
CbBmtm
2Pw2Tammle
L
ws
iwefP
2TbnpeP
L
e c o l o g i c a l m o d e l l i n
oobenthos biomass was calculated. Production/biomass ratioor benthic organisms was estimated using the empirical for-
ula of Brey (1999, as cited in Christensen et al., 2000).
og P/B = 1.672 + 0.993 log (1/Amax) − 0.035 log (Mmax)
− 300.447 1/(T + 273) (3)
here Amax—maximum age (per year) (1.5 year); Mmax—aximum individual body mass (g DM) (0.2 g); T—bottomater temperature (◦C).
Consumption/biomass ratio (Q/B) for zoobenthos was esti-ated based on assumed gross food conversion efficiency
P/Q) of 0.2 (Christensen et al., 2000). Hence, Q/B of 21.05 year−1
as calculated for zoobenthos.
.8. Fisheries
ommercially exploitable (Tilapia, Catfish and large Labeobar-us) and un-exploited fish species (Aplocheilichthys sp., smallarbus and Garra sp.) of Lake Awassa were considered in thisodeling analysis. All of the fish species share the following
wo (1 & 2) empirical relationships and their estimations wereade separately.
.8.1. Production/biomass ratio (P/B)roduction/biomass ratios are difficult to estimate directly andere taken as equivalent to total mortality (Z) (Pauly et al.,
000) assuming steady-state of the ecosystem (Allen, 1971).otal mortality (Z) of the two exploited fish species (Tilapiand Catfish) was determined by summing the value of fishingortality (F) and natural mortality (M) as Z = F + M. F was deter-ined using cohort analysis and yield models, as explained
ater. However, M was estimated using the Pauly’s empiricalquation (Pauly, 1984):
n (M) = −0.0152 − 0.279 ln (Linf) + 0.6543 ln (K) + 0.463 ln (T)
(4)
here Linf and K are parameters of VBGF; and T = annual meanurface water temperature of the lake.
Natural mortality (M) for unexploited fish species includ-ng juveniles’ of exploited fish species and large Labeobarbusere estimated using Pauly’s empirical formula and consid-
red as equivalent to total mortality (Z) as they do not sufferrom fishing mortality (F). This M value was directly taken as/B.
.8.2. Consumption/biomass ratio (Q/B)his parameter expresses food consumption (Q) per unitiomass for a conventional period of 1 year, which meansumber of times a given population consumes its own weighter year. This quantity was estimated for each consumerco-group using the relationship suggested by Palomares and
auly (1998):og (Q/B) = 7.964 − 0.204 log Winf − 1.965T + 0.083A
+ 0.532h + 0.398d (5)
1 ( 2 0 0 7 ) 398–408 401
where Winf is the asymptotic weight (g); T an expression forthe mean annual temperature of the water body, expressedusing T = 1000/K (K = ◦C + 273.15); A aspect ratio (Ar = h2/s—ofthe caudal fin of fish, given height (h) and surface area (s); h adummy variable expressing food type (1 for herbivores, and 0for detritivores and carnivores) and; d a dummy variable alsoexpressing food type (1 for detritivores and 0 for herbivoresand carnivores)
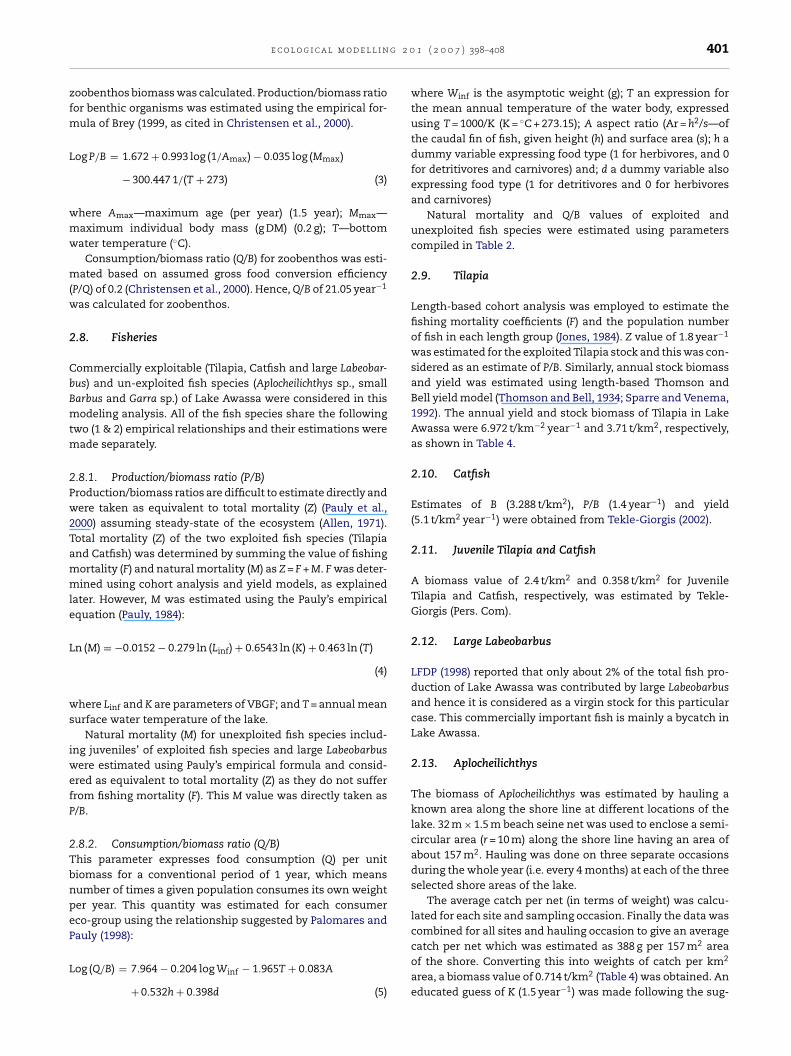
Natural mortality and Q/B values of exploited andunexploited fish species were estimated using parameterscompiled in Table 2.
2.9. Tilapia
Length-based cohort analysis was employed to estimate thefishing mortality coefficients (F) and the population numberof fish in each length group (Jones, 1984). Z value of 1.8 year−1
was estimated for the exploited Tilapia stock and this was con-sidered as an estimate of P/B. Similarly, annual stock biomassand yield was estimated using length-based Thomson andBell yield model (Thomson and Bell, 1934; Sparre and Venema,1992). The annual yield and stock biomass of Tilapia in LakeAwassa were 6.972 t/km−2 year−1 and 3.71 t/km2, respectively,as shown in Table 4.
2.10. Catfish
Estimates of B (3.288 t/km2), P/B (1.4 year−1) and yield(5.1 t/km2 year−1) were obtained from Tekle-Giorgis (2002).
2.11. Juvenile Tilapia and Catfish
A biomass value of 2.4 t/km2 and 0.358 t/km2 for JuvenileTilapia and Catfish, respectively, was estimated by Tekle-Giorgis (Pers. Com).
2.12. Large Labeobarbus
LFDP (1998) reported that only about 2% of the total fish pro-duction of Lake Awassa was contributed by large Labeobarbusand hence it is considered as a virgin stock for this particularcase. This commercially important fish is mainly a bycatch inLake Awassa.
2.13. Aplocheilichthys
The biomass of Aplocheilichthys was estimated by hauling aknown area along the shore line at different locations of thelake. 32 m × 1.5 m beach seine net was used to enclose a semi-circular area (r = 10 m) along the shore line having an area ofabout 157 m2. Hauling was done on three separate occasionsduring the whole year (i.e. every 4 months) at each of the threeselected shore areas of the lake.
The average catch per net (in terms of weight) was calcu-lated for each site and sampling occasion. Finally the data wascombined for all sites and hauling occasion to give an average
catch per net which was estimated as 388 g per 157 m2 areaof the shore. Converting this into weights of catch per km2area, a biomass value of 0.714 t/km2 (Table 4) was obtained. Aneducated guess of K (1.5 year−1) was made following the sug-
402 e c o l o g i c a l m o d e l l i n g 2 0 1 ( 2 0 0 7 ) 398–408
Table 2 – Growth and other parameters compiled for Q/B and M estimation
Tilapia Juvenile Tilapia Catfish Juvenile Catfish Large Labeobarbus Aplocheilichthys Small Barbus Garra sp.
Linf (cm)40a 20.9b 121c 42.7c 75d 4.5e 17e 15e
Winf (g)1000a 185.59b 14475c 566.63c 5536d 0.6e 46.91e 24.85e
T (◦C)e
Surface25 25 25 25 25 25 25 25
Mean waterbody26 26 26 26 26 26 26 26K (year−1)
0.3a 0.5b 0.16c 0.18h 0.12d 1.5f 1.5f 1.5f
Ae
1.8 1.8 1.5 1.5 3 1.4 2.5 1.4Hg
1 1 0 0 0 0 0 0dg
0 0 0 0 1 0 0 0
a Parameters estimated using VBG equation fitted to length at age data of Admassu (1989).b Parameters estimated using VBG equation fitted to length at age data of Tekle-Giorgis (1990).c Parameters estimate taken from age and growth work of Tekle-Giorgis (2002).d Linf (cm), Winf (g) and K were taken from Senior Students’ Project of Debub University.e Values estimated based on data collected during the present study.f An educated guess of K for Aplocheilichthys, Small Barbus and Garra sp. were made following the suggestion of Pauly (1984).
cea e
g Estimated based on information on feeding habit studies of TudoranDadebo (2000); Desta (pers. comm.); and Dadebo (pers. comm.).h Froese and Pauly (2006).
gestion of Pauly (1984). Estimation of small Barbus and Garrasp. were made using the same procedure as Aplocheilichthys sp.
2.14. Diet composition (DC)
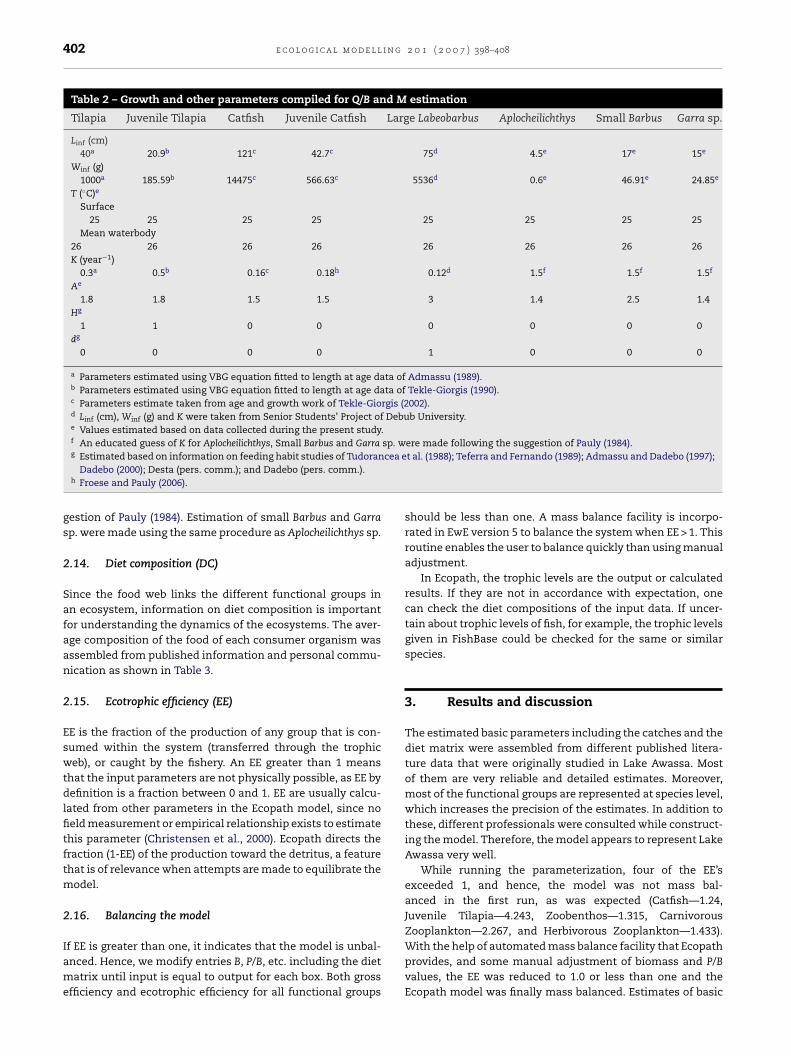
Since the food web links the different functional groups inan ecosystem, information on diet composition is importantfor understanding the dynamics of the ecosystems. The aver-age composition of the food of each consumer organism wasassembled from published information and personal commu-nication as shown in Table 3.
2.15. Ecotrophic efficiency (EE)
EE is the fraction of the production of any group that is con-sumed within the system (transferred through the trophicweb), or caught by the fishery. An EE greater than 1 meansthat the input parameters are not physically possible, as EE bydefinition is a fraction between 0 and 1. EE are usually calcu-lated from other parameters in the Ecopath model, since nofield measurement or empirical relationship exists to estimatethis parameter (Christensen et al., 2000). Ecopath directs thefraction (1-EE) of the production toward the detritus, a featurethat is of relevance when attempts are made to equilibrate themodel.
2.16. Balancing the model
If EE is greater than one, it indicates that the model is unbal-anced. Hence, we modify entries B, P/B, etc. including the dietmatrix until input is equal to output for each box. Both grossefficiency and ecotrophic efficiency for all functional groups
t al. (1988); Teferra and Fernando (1989); Admassu and Dadebo (1997);
should be less than one. A mass balance facility is incorpo-rated in EwE version 5 to balance the system when EE > 1. Thisroutine enables the user to balance quickly than using manualadjustment.
In Ecopath, the trophic levels are the output or calculatedresults. If they are not in accordance with expectation, onecan check the diet compositions of the input data. If uncer-tain about trophic levels of fish, for example, the trophic levelsgiven in FishBase could be checked for the same or similarspecies.
3. Results and discussion
The estimated basic parameters including the catches and thediet matrix were assembled from different published litera-ture data that were originally studied in Lake Awassa. Mostof them are very reliable and detailed estimates. Moreover,most of the functional groups are represented at species level,which increases the precision of the estimates. In addition tothese, different professionals were consulted while construct-ing the model. Therefore, the model appears to represent LakeAwassa very well.
While running the parameterization, four of the EE’sexceeded 1, and hence, the model was not mass bal-anced in the first run, as was expected (Catfish—1.24,Juvenile Tilapia—4.243, Zoobenthos—1.315, CarnivorousZooplankton—2.267, and Herbivorous Zooplankton—1.433).
With the help of automated mass balance facility that Ecopathprovides, and some manual adjustment of biomass and P/Bvalues, the EE was reduced to 1.0 or less than one and theEcopath model was finally mass balanced. Estimates of basic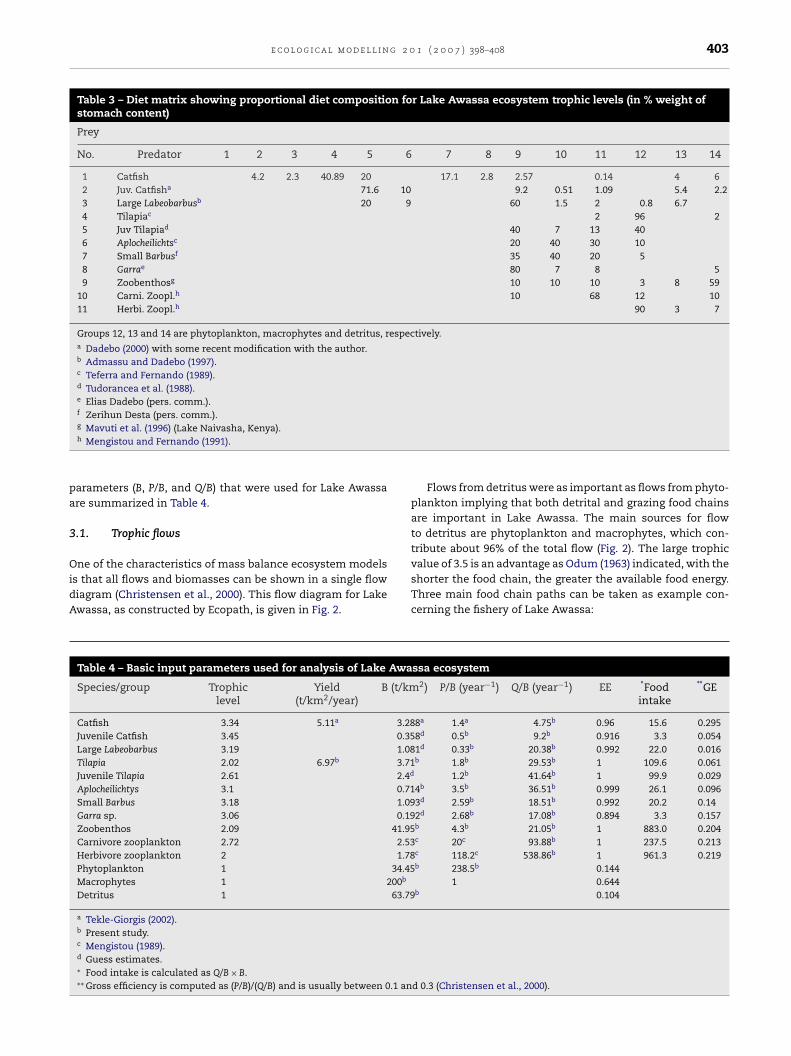
e c o l o g i c a l m o d e l l i n g 2 0 1 ( 2 0 0 7 ) 398–408 403
Table 3 – Diet matrix showing proportional diet composition for Lake Awassa ecosystem trophic levels (in % weight ofstomach content)
Prey
No. Predator 1 2 3 4 5 6 7 8 9 10 11 12 13 14
1 Catfish 4.2 2.3 40.89 20 17.1 2.8 2.57 0.14 4 62 Juv. Catfisha 71.6 10 9.2 0.51 1.09 5.4 2.23 Large Labeobarbusb 20 9 60 1.5 2 0.8 6.74 Tilapiac 2 96 25 Juv Tilapiad 40 7 13 406 Aplocheilichtsc 20 40 30 107 Small Barbusf 35 40 20 58 Garrae 80 7 8 59 Zoobenthosg 10 10 10 3 8 59
10 Carni. Zoopl.h 10 68 12 1011 Herbi. Zoopl.h 90 3 7
Groups 12, 13 and 14 are phytoplankton, macrophytes and detritus, respectively.a Dadebo (2000) with some recent modification with the author.b Admassu and Dadebo (1997).c Teferra and Fernando (1989).d Tudorancea et al. (1988).e Elias Dadebo (pers. comm.).f Zerihun Desta (pers. comm.).
pa
3
OidA
g Mavuti et al. (1996) (Lake Naivasha, Kenya).h Mengistou and Fernando (1991).
arameters (B, P/B, and Q/B) that were used for Lake Awassare summarized in Table 4.
.1. Trophic flows
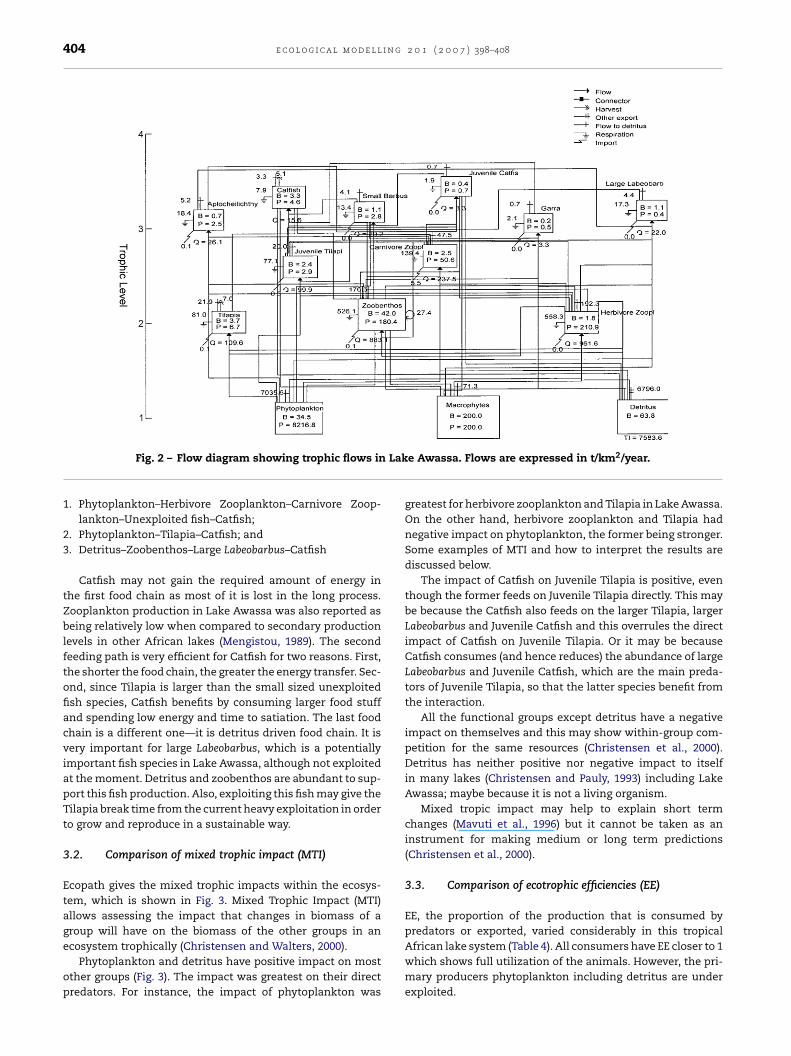
ne of the characteristics of mass balance ecosystem modelss that all flows and biomasses can be shown in a single flowiagram (Christensen et al., 2000). This flow diagram for Lakewassa, as constructed by Ecopath, is given in Fig. 2.
Table 4 – Basic input parameters used for analysis of Lake Awa
Species/group Trophiclevel
Yield(t/km2/year)
B (t/km
Catfish 3.34 5.11a 3.28Juvenile Catfish 3.45 0.35Large Labeobarbus 3.19 1.08Tilapia 2.02 6.97b 3.71Juvenile Tilapia 2.61 2.4d
Aplocheilichtys 3.1 0.71Small Barbus 3.18 1.09Garra sp. 3.06 0.19Zoobenthos 2.09 41.95Carnivore zooplankton 2.72 2.53Herbivore zooplankton 2 1.78Phytoplankton 1 34.45Macrophytes 1 200b
Detritus 1 63.79
a Tekle-Giorgis (2002).b Present study.c Mengistou (1989).d Guess estimates.∗ Food intake is calculated as Q/B × B.∗∗ Gross efficiency is computed as (P/B)/(Q/B) and is usually between 0.1 an
Flows from detritus were as important as flows from phyto-plankton implying that both detrital and grazing food chainsare important in Lake Awassa. The main sources for flowto detritus are phytoplankton and macrophytes, which con-tribute about 96% of the total flow (Fig. 2). The large trophic
value of 3.5 is an advantage as Odum (1963) indicated, with theshorter the food chain, the greater the available food energy.Three main food chain paths can be taken as example con-cerning the fishery of Lake Awassa:ssa ecosystem2) P/B (year−1) Q/B (year−1) EE *Food
intake
**GE
8a 1.4a 4.75b 0.96 15.6 0.2958d 0.5b 9.2b 0.916 3.3 0.0541d 0.33b 20.38b 0.992 22.0 0.016b 1.8b 29.53b 1 109.6 0.061
1.2b 41.64b 1 99.9 0.0294b 3.5b 36.51b 0.999 26.1 0.0963d 2.59b 18.51b 0.992 20.2 0.142d 2.68b 17.08b 0.894 3.3 0.157b 4.3b 21.05b 1 883.0 0.204c 20c 93.88b 1 237.5 0.213c 118.2c 538.86b 1 961.3 0.219b 238.5b 0.144
1 0.644b 0.104
d 0.3 (Christensen et al., 2000).
404 e c o l o g i c a l m o d e l l i n g 2 0 1 ( 2 0 0 7 ) 398–408
Lak
Fig. 2 – Flow diagram showing trophic flows in1. Phytoplankton–Herbivore Zooplankton–Carnivore Zoop-lankton–Unexploited fish–Catfish;
2. Phytoplankton–Tilapia–Catfish; and3. Detritus–Zoobenthos–Large Labeobarbus–Catfish
Catfish may not gain the required amount of energy inthe first food chain as most of it is lost in the long process.Zooplankton production in Lake Awassa was also reported asbeing relatively low when compared to secondary productionlevels in other African lakes (Mengistou, 1989). The secondfeeding path is very efficient for Catfish for two reasons. First,the shorter the food chain, the greater the energy transfer. Sec-ond, since Tilapia is larger than the small sized unexploitedfish species, Catfish benefits by consuming larger food stuffand spending low energy and time to satiation. The last foodchain is a different one—it is detritus driven food chain. It isvery important for large Labeobarbus, which is a potentiallyimportant fish species in Lake Awassa, although not exploitedat the moment. Detritus and zoobenthos are abundant to sup-port this fish production. Also, exploiting this fish may give theTilapia break time from the current heavy exploitation in orderto grow and reproduce in a sustainable way.
3.2. Comparison of mixed trophic impact (MTI)
Ecopath gives the mixed trophic impacts within the ecosys-tem, which is shown in Fig. 3. Mixed Trophic Impact (MTI)allows assessing the impact that changes in biomass of agroup will have on the biomass of the other groups in an
ecosystem trophically (Christensen and Walters, 2000).Phytoplankton and detritus have positive impact on mostother groups (Fig. 3). The impact was greatest on their directpredators. For instance, the impact of phytoplankton was
e Awassa. Flows are expressed in t/km2/year.
greatest for herbivore zooplankton and Tilapia in Lake Awassa.On the other hand, herbivore zooplankton and Tilapia hadnegative impact on phytoplankton, the former being stronger.Some examples of MTI and how to interpret the results arediscussed below.
The impact of Catfish on Juvenile Tilapia is positive, eventhough the former feeds on Juvenile Tilapia directly. This maybe because the Catfish also feeds on the larger Tilapia, largerLabeobarbus and Juvenile Catfish and this overrules the directimpact of Catfish on Juvenile Tilapia. Or it may be becauseCatfish consumes (and hence reduces) the abundance of largeLabeobarbus and Juvenile Catfish, which are the main preda-tors of Juvenile Tilapia, so that the latter species benefit fromthe interaction.
All the functional groups except detritus have a negativeimpact on themselves and this may show within-group com-petition for the same resources (Christensen et al., 2000).Detritus has neither positive nor negative impact to itselfin many lakes (Christensen and Pauly, 1993) including LakeAwassa; maybe because it is not a living organism.
Mixed tropic impact may help to explain short termchanges (Mavuti et al., 1996) but it cannot be taken as aninstrument for making medium or long term predictions(Christensen et al., 2000).
3.3. Comparison of ecotrophic efficiencies (EE)
EE, the proportion of the production that is consumed bypredators or exported, varied considerably in this tropical
African lake system (Table 4). All consumers have EE closer to 1which shows full utilization of the animals. However, the pri-mary producers phytoplankton including detritus are underexploited.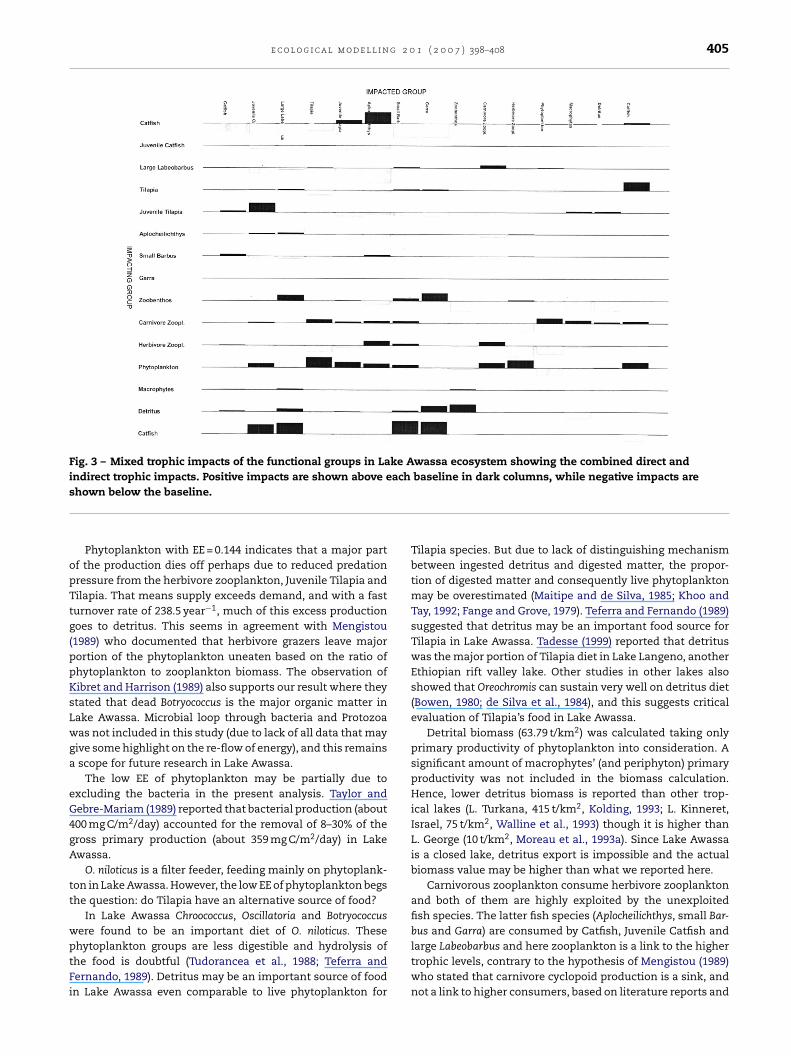
e c o l o g i c a l m o d e l l i n g 2 0 1 ( 2 0 0 7 ) 398–408 405
Fig. 3 – Mixed trophic impacts of the functional groups in Lake Awassa ecosystem showing the combined direct andindirect trophic impacts. Positive impacts are shown above each baseline in dark columns, while negative impacts ares
opTtg(ppKsLwga
eG4gA
tt
wptFi
hown below the baseline.
Phytoplankton with EE = 0.144 indicates that a major partf the production dies off perhaps due to reduced predationressure from the herbivore zooplankton, Juvenile Tilapia andilapia. That means supply exceeds demand, and with a fasturnover rate of 238.5 year−1, much of this excess productionoes to detritus. This seems in agreement with Mengistou1989) who documented that herbivore grazers leave majorortion of the phytoplankton uneaten based on the ratio ofhytoplankton to zooplankton biomass. The observation ofibret and Harrison (1989) also supports our result where theytated that dead Botryococcus is the major organic matter inake Awassa. Microbial loop through bacteria and Protozoaas not included in this study (due to lack of all data that may
ive some highlight on the re-flow of energy), and this remainsscope for future research in Lake Awassa.
The low EE of phytoplankton may be partially due toxcluding the bacteria in the present analysis. Taylor andebre-Mariam (1989) reported that bacterial production (about00 mg C/m2/day) accounted for the removal of 8–30% of theross primary production (about 359 mg C/m2/day) in Lakewassa.
O. niloticus is a filter feeder, feeding mainly on phytoplank-on in Lake Awassa. However, the low EE of phytoplankton begshe question: do Tilapia have an alternative source of food?
In Lake Awassa Chroococcus, Oscillatoria and Botryococcusere found to be an important diet of O. niloticus. These
hytoplankton groups are less digestible and hydrolysis ofhe food is doubtful (Tudorancea et al., 1988; Teferra andernando, 1989). Detritus may be an important source of foodn Lake Awassa even comparable to live phytoplankton forTilapia species. But due to lack of distinguishing mechanismbetween ingested detritus and digested matter, the propor-tion of digested matter and consequently live phytoplanktonmay be overestimated (Maitipe and de Silva, 1985; Khoo andTay, 1992; Fange and Grove, 1979). Teferra and Fernando (1989)suggested that detritus may be an important food source forTilapia in Lake Awassa. Tadesse (1999) reported that detrituswas the major portion of Tilapia diet in Lake Langeno, anotherEthiopian rift valley lake. Other studies in other lakes alsoshowed that Oreochromis can sustain very well on detritus diet(Bowen, 1980; de Silva et al., 1984), and this suggests criticalevaluation of Tilapia’s food in Lake Awassa.
Detrital biomass (63.79 t/km2) was calculated taking onlyprimary productivity of phytoplankton into consideration. Asignificant amount of macrophytes’ (and periphyton) primaryproductivity was not included in the biomass calculation.Hence, lower detritus biomass is reported than other trop-ical lakes (L. Turkana, 415 t/km2, Kolding, 1993; L. Kinneret,Israel, 75 t/km2, Walline et al., 1993) though it is higher thanL. George (10 t/km2, Moreau et al., 1993a). Since Lake Awassais a closed lake, detritus export is impossible and the actualbiomass value may be higher than what we reported here.
Carnivorous zooplankton consume herbivore zooplanktonand both of them are highly exploited by the unexploitedfish species. The latter fish species (Aplocheilichthys, small Bar-bus and Garra) are consumed by Catfish, Juvenile Catfish and
large Labeobarbus and here zooplankton is a link to the highertrophic levels, contrary to the hypothesis of Mengistou (1989)who stated that carnivore cyclopoid production is a sink, andnot a link to higher consumers, based on literature reports and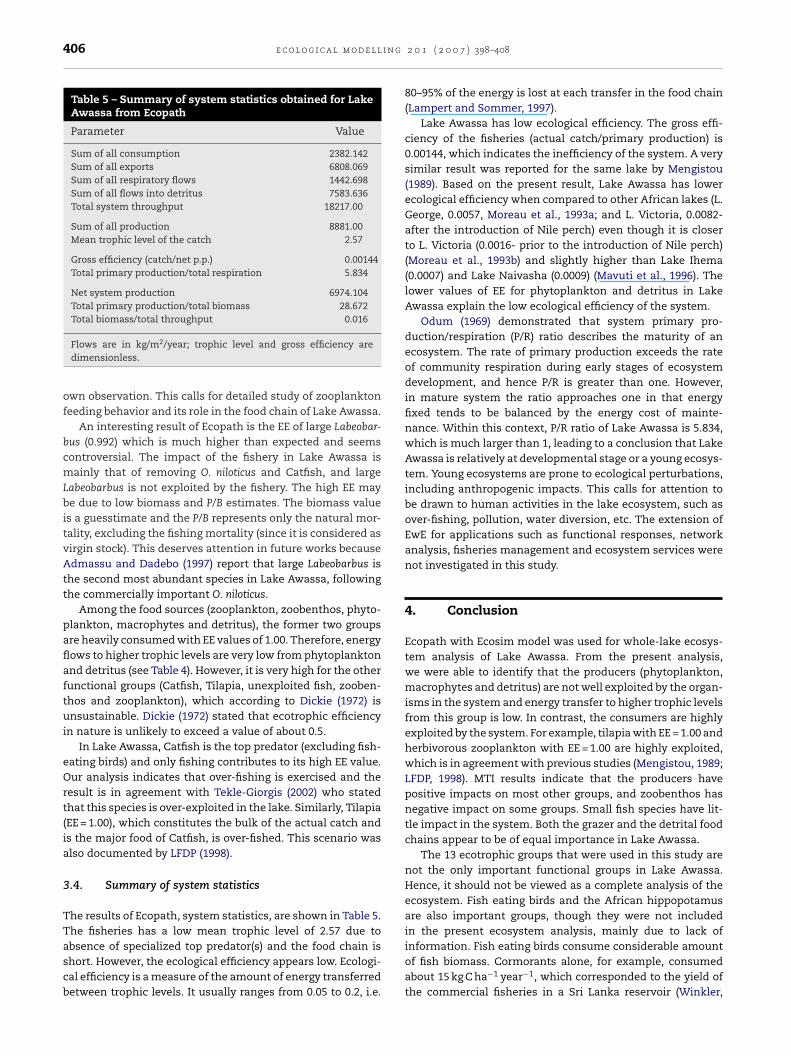
406 e c o l o g i c a l m o d e l l i n g
Table 5 – Summary of system statistics obtained for LakeAwassa from Ecopath
Parameter Value
Sum of all consumption 2382.142Sum of all exports 6808.069Sum of all respiratory flows 1442.698Sum of all flows into detritus 7583.636Total system throughput 18217.00
Sum of all production 8881.00Mean trophic level of the catch 2.57
Gross efficiency (catch/net p.p.) 0.00144Total primary production/total respiration 5.834
Net system production 6974.104Total primary production/total biomass 28.672Total biomass/total throughput 0.016
Flows are in kg/m2/year; trophic level and gross efficiency aredimensionless.
own observation. This calls for detailed study of zooplanktonfeeding behavior and its role in the food chain of Lake Awassa.
An interesting result of Ecopath is the EE of large Labeobar-bus (0.992) which is much higher than expected and seemscontroversial. The impact of the fishery in Lake Awassa ismainly that of removing O. niloticus and Catfish, and largeLabeobarbus is not exploited by the fishery. The high EE maybe due to low biomass and P/B estimates. The biomass valueis a guesstimate and the P/B represents only the natural mor-tality, excluding the fishing mortality (since it is considered asvirgin stock). This deserves attention in future works becauseAdmassu and Dadebo (1997) report that large Labeobarbus isthe second most abundant species in Lake Awassa, followingthe commercially important O. niloticus.
Among the food sources (zooplankton, zoobenthos, phyto-plankton, macrophytes and detritus), the former two groupsare heavily consumed with EE values of 1.00. Therefore, energyflows to higher trophic levels are very low from phytoplanktonand detritus (see Table 4). However, it is very high for the otherfunctional groups (Catfish, Tilapia, unexploited fish, zooben-thos and zooplankton), which according to Dickie (1972) isunsustainable. Dickie (1972) stated that ecotrophic efficiencyin nature is unlikely to exceed a value of about 0.5.
In Lake Awassa, Catfish is the top predator (excluding fish-eating birds) and only fishing contributes to its high EE value.Our analysis indicates that over-fishing is exercised and theresult is in agreement with Tekle-Giorgis (2002) who statedthat this species is over-exploited in the lake. Similarly, Tilapia(EE = 1.00), which constitutes the bulk of the actual catch andis the major food of Catfish, is over-fished. This scenario wasalso documented by LFDP (1998).
3.4. Summary of system statistics
The results of Ecopath, system statistics, are shown in Table 5.The fisheries has a low mean trophic level of 2.57 due to
absence of specialized top predator(s) and the food chain isshort. However, the ecological efficiency appears low. Ecologi-cal efficiency is a measure of the amount of energy transferredbetween trophic levels. It usually ranges from 0.05 to 0.2, i.e.2 0 1 ( 2 0 0 7 ) 398–408
80–95% of the energy is lost at each transfer in the food chain(Lampert and Sommer, 1997).
Lake Awassa has low ecological efficiency. The gross effi-ciency of the fisheries (actual catch/primary production) is0.00144, which indicates the inefficiency of the system. A verysimilar result was reported for the same lake by Mengistou(1989). Based on the present result, Lake Awassa has lowerecological efficiency when compared to other African lakes (L.George, 0.0057, Moreau et al., 1993a; and L. Victoria, 0.0082-after the introduction of Nile perch) even though it is closerto L. Victoria (0.0016- prior to the introduction of Nile perch)(Moreau et al., 1993b) and slightly higher than Lake Ihema(0.0007) and Lake Naivasha (0.0009) (Mavuti et al., 1996). Thelower values of EE for phytoplankton and detritus in LakeAwassa explain the low ecological efficiency of the system.
Odum (1969) demonstrated that system primary pro-duction/respiration (P/R) ratio describes the maturity of anecosystem. The rate of primary production exceeds the rateof community respiration during early stages of ecosystemdevelopment, and hence P/R is greater than one. However,in mature system the ratio approaches one in that energyfixed tends to be balanced by the energy cost of mainte-nance. Within this context, P/R ratio of Lake Awassa is 5.834,which is much larger than 1, leading to a conclusion that LakeAwassa is relatively at developmental stage or a young ecosys-tem. Young ecosystems are prone to ecological perturbations,including anthropogenic impacts. This calls for attention tobe drawn to human activities in the lake ecosystem, such asover-fishing, pollution, water diversion, etc. The extension ofEwE for applications such as functional responses, networkanalysis, fisheries management and ecosystem services werenot investigated in this study.
4. Conclusion
Ecopath with Ecosim model was used for whole-lake ecosys-tem analysis of Lake Awassa. From the present analysis,we were able to identify that the producers (phytoplankton,macrophytes and detritus) are not well exploited by the organ-isms in the system and energy transfer to higher trophic levelsfrom this group is low. In contrast, the consumers are highlyexploited by the system. For example, tilapia with EE = 1.00 andherbivorous zooplankton with EE = 1.00 are highly exploited,which is in agreement with previous studies (Mengistou, 1989;LFDP, 1998). MTI results indicate that the producers havepositive impacts on most other groups, and zoobenthos hasnegative impact on some groups. Small fish species have lit-tle impact in the system. Both the grazer and the detrital foodchains appear to be of equal importance in Lake Awassa.
The 13 ecotrophic groups that were used in this study arenot the only important functional groups in Lake Awassa.Hence, it should not be viewed as a complete analysis of theecosystem. Fish eating birds and the African hippopotamusare also important groups, though they were not includedin the present ecosystem analysis, mainly due to lack of
information. Fish eating birds consume considerable amountof fish biomass. Cormorants alone, for example, consumedabout 15 kg C ha−1 year−1, which corresponded to the yield ofthe commercial fisheries in a Sri Lanka reservoir (Winkler,
g 2 0
1bifibfitmi
tccbptiev
A
WbcWaTcTg
r
A
A
A
A
B
B
C
C
C
e c o l o g i c a l m o d e l l i n
983; Schiemer and Duncan, 1988). These cormorants, white-reasted and long tailed cormorants, are found in Lake Awassa
n significant numbers. Mavuti et al. (1996) also reported thatsh eating birds consumed 3.77 t/km2, almost twice the catchy fishermen in Lake Naivasha; indicating that exclusion ofsh-eating birds in Lake Awassa leaves a large gap in therophic analysis. Their feeding habit, abundance, biomass,
ortality etc should be studied in the future in order to bencluded in such type of analysis.
The un-exploited fish species, large Labeobarbus, zooben-hos and macrophytes should be studied in more detail. Dueonsideration should also be given to detritus, rotifers andiliates in order to understand the contribution of the micro-ial loop in the food chain of the lake. Hence, tuning-up allarameters, including accurate diet matrix is very importanto conclusively explain energy flow and trophic interactionsn Lake Awassa. This is a modest contribution that deliversssential baseline information from such a holistic point ofiew.
cknowledgments
e thank Dr. Elias Dadebo for zoobenthos taxonomy andiomass measurements. We are indebted to Dr. Demeke Kifleoncerning phytoplankton and for providing reading material.e owe our gratitude to Dr. Villy Christensen for sending ussoftware CD of Ecopath and his comments on some topics.his work was supported financially by the Ethiopian Agri-ultural Research Organization—Agriculture Research andraining Project and Addis Ababa University, for which we arerateful.
e f e r e n c e s
llen, K.F., 1971. Relation between production and biomass. J.Fish. Res. Bd. Can. 20, 1573–1581.
dmassu, D., 1989. A Study on the Age and Growth of AdultOreochromis niloticus Linn. (Pisces: Cichlidae) in Lake Awassa,Ethiopia. MSc thesis. Addis Ababa University, Addis Ababa,Ethiopia. 90 pp.
dmassu, D., 1996. The breeding season of Tilapia, Oreochromisniloticus L. in Lake Awassa (Ethiopian rift valley).Hydrobiologia 337, 77–83.
dmassu, D., Dadebo, E., 1997. Diet composition, length-weightrelationship and condition factor of Labeobarbus speciesRuppell, 1836 (Pisces: Cyprinidae) in Lake Awassa, Ethiopia.SINET: Ethiop. J. Sci. 20, 83–96.
owen, S.H., 1980. Detrital non-protein amino acids are the key torapid growth of Tilapia in Lake Valencia. Venez. Sci. 207,1216–1218.
urgis, M.J., 1974. Revised estimates for the biomass andproduction of zooplankton in Lake George, Uganda. FreswaterBiol. 4, 535–541.
hristensen, V., Pauly, D., 1992. Ecopath II a software forbalancing steady state ecosystems models and calculatingnetwork characteristics. Ecol. Model 61, 169–185.
hristensen, V., Pauly, D. (Eds.), 1993. In: Trophic models ofaquatic ecosystems. ICLARM Conference Proceedings No. 26,390 pp.
hristensen, V., Walters, C., 2000. Ecopath with Ecosim: methods,capabilities and limitations. Ecol. Model. 172, 109–139.
1 ( 2 0 0 7 ) 398–408 407
Christensen, V., Walters, C.J., Pauly, D., 2000. Ecopath withEcosim: A User’s Guide. Fisheries Center. Univeristy of BritishColumbia, Vancouver and ICLARM, Malaysia.
Dadebo, E., 2000. Reproductive biology and feeding habits of thecatfish Clarias gariepinus (Burchell) (Pisces: Clariidae) in LakeAwassa. SINET: Ethiop. J. Sci. 23 (2), 231–246.
de Silva, S.S., Perera, M.K., Maitipe, P., 1984. The composition,nutritional status and digestibility of the diets of Saratherodonmossambicus from nine manmade lakes in Sri Lanka. Environ.Biol. Fish. 2, 205–219.
Dickie, L.M., 1972. Food Chains and Fish Production, 8. ICNAFSpec. Publ, pp. 201–219.
Fange, R., Grove, D., 1979. Digestion. In: Hoar, Randall, Brett (Eds.),Fish Physiology, VIII. Academic Press, New York, pp. 161–260.
Froese, R., Pauly, D. (Eds.), 2006. Fish Base. World Wide Webelectronic publication. www.fishbase.org, version (06/2006).
Gamachu, D., 1977. Aspects of Climate and Water Budget inEthiopia. Addis Ababa University Press, Addis Ababa, Ethiopia.
Gebre-Mariam, Z., Kebede, E., Desta, Z., 2002. Long-term changesin chemical features of waters of seven Ethiopian rift-valleylakes. Hydrobiologia 477, 81–91.
Getahun, A., Stiassny, M.L.J., 1998. The freshwater biodiversitycrisis: the case of the Ethiopian fish fauna. SINET: Ethiop. J.Sci. 21 (2), 207–230.
Hall, D.J., Threlkeld, S.T., Burns, C.W., Crowley, P.H., 1976. The sizeefficiency hypothesis and the size structure of zooplanktoncommunities. Ann. Rev. Ecol. Sys. 7, 177–208.
Jones, J.G., 1979. A Guide to Methods for Estimating MicrobialNumbers and Biomass in Fresh Water. Freshwater BiologicalAssociation, Scientific Publication No. 39.
Jones, R. 1984. Assessing the effects of changes in exploitationpatterns using length composition data (with notes on VPAand cohort analysis). FAO Fisheries Technical Paper 256: 118 p.
Kebede, E., Belay, A., 1994. Species composition andphytoplankton biomass in a tropical frican lake (Lake Awassa,Ethiopia). Hydrobiologia 288, 13–32.
Khoo, H.W., Tay, S., 1992. Detritus production and its utilization byOreochromis mossambicus in Selatar Reservoir. In: De Silva (Ed.),Reservoir Fishery of Asia. IDRC, Ottawa, Canada, pp. 62–72.
Kibret, T., Harrison, A.D., 1989. The benthic and weed bed faunasof Lake Awassa (Rift Valley, Ethiopia). Hydrobiologia 174,1–15.
Kifle, D., Belay, A., 1990. Seasonal variation in phytoplanktonprimary production in relation to light and nutrients in LakeAwassa. Ethiop. Hydrobiologia 196, 217–227.
Kolding, J., 1993. Trophic interrelationships and communitystructure at two different periods of Lake Turkana, Kenya: acomparison using the Ecopath II box model. In: Christensen,Pauly (Eds.), Trophic models of aquatic ecosystems. ICLARMConference Proceedings No. 26, pp. 116–123, 390 p.
Lampert, W., Sommer, U., 1997. Limnocology: The Ecology ofLakes and Streams. Translated by Haney, J.F. Oxford UniversityPress, New York.
Lewis Jr., W.M., 1983. A revised classification of lakes based onmixing. Can. J. Fish. Aquat. Sci. 40, 1779–1787.
LFDP, 1998. Final report. Lake Fisheries Development projectworking paper.
Maitipe, P., de Silva, S.S., 1985. Switches between zoophagy,phytophagy and detritivory of Sarotherodon mossambicus(Peters) populations in twelve man-made Sri Lankan lakes. J.Fish Biol. 26, 49–61.
Makin, M.J., Kingham, T.J., Waddam, A.E., Birchall, C.J., Teffera, T.,1975. Development Projects in the Southern Rift Valley ofEthiopia. Land Resource Study No. 21. Land Resource Division.Ministry of Overseas Development, England.
Mavuti, K., Moreau, J., Munyadrorero, J., Plisnier, P.D., 1996.Analysis of trophic relationships in two shallow equatoriallakes Lake Naivasha (Kenya) and Lake Ihema (Rwanda) usinga multispecifies trophic model. Hydrobiologia 321, 89–100.
i n g
408 e c o l o g i c a l m o d e l lMengistou, S., 1989. Species Composition, Dynamics andProduction of the Dominant crustacean Zooplankton in LakeAwassa, Ethiopia. PhD Thesis. University of Waterloo, Ontario,Canada. 228 p.
Mengistou, S., Fernando, C.H., 1991. Seasonality and abundanceof some dominant crustacean zooplankton in Lake Awassa, atropical rift valley lake in Ethiopia. Hydrobiologia 226, 137–152.
Moreau, J.V., Christensen, V., Pauly, D., 1993a. A trophicecosystem model of Lake George, Uganda. In: Christensen,Pauly (Eds.), Trophic models of aquatic ecosystems. ICLARMConference Proceedings No. 26, pp. 124–129, 390 p.
Moreau, J.V., Ligtvoet, W., Palomares, M.L.D., 1993b. Trophicrelationship in the fish community of Lake Victoria, Kenya,with emphasis on the impact of Nile perch (Lates niloticus). In:Christensen, Pauly (Eds.), Trophic models of aquaticecosystems. ICLARM Conference Proceedings No. 26, pp.114–152, 390 p.
Odum, E.P., 1963. Ecology. Holt, Rinehart and Winston, New York.Odum, E.P., 1969. The strategy of ecosystem development.
Science 164, 262–270.Palomares, M.L.D., Pauly, D., 1998. Predicting food consumption of
fish populations as functions of mortality, food type,morphometrics, temperature and salinity. Marine FreshwaterRes. 49, 447–453.
Pauly, D., 1984. Fish population dynamics in tropical waters:manual for use with programmable calculators. ICLARMStudies Rev. 8, 325.
Pauly, D., Christensen, V., Walters, C., 2000. Ecopath, Ecosim, andEcospace as tools for evaluating ecosystem impact offisheries. ICES J. Marine Sci. 57, 697–706.
Polovina, J.J., 1984. Model of a coral reef ecosystem. Part I. Ecopathand its application to French Frigate Shoals. Coral Reefs 3,1–11.
Schiemer, F., Duncan, A., 1988. The significance of the ecosystemapproach for reservoir management. In: De Silva (Ed.),Reservoir Fishery Management and Development in Asia.IDRC, Ottawa, Canada, pp. 183–194.
Sparre, P., Venema, S.C., 1992. Introduction to tropical fish stockassessment. Part I. Manual. FAO Fisheries Technical Paper No.306.1, 376 pp.
Tadesse, Z., 1999. The nutritional status and digestibility of O.niloticus L. diet in Lake Langeno, Ethiopia. Hydrobiologia 416,97–106.
Talling, J.F., Talling, I.B., 1965. The chemical composition ofAfrican lake waters. Int. Revue ges. Hydrobiol. 50 (3), 421–463.
2 0 1 ( 2 0 0 7 ) 398–408
Taylor, W.D., Gebre-Mariam, Z., 1989. Size-structure andproductivity of the plankton community of an Ethiopian RiftValley lake. Freshwater Biol. 21, 353–363.
Teferra, T., Fernando, C.H., 1989. The food habits of anherbivorous fish (Oreochromis niloticus Linn.) in Lake Awassa,Ethiopia. Hydrobiologia 174, 195–200.
Tekle-Giorgis, Y., 1990. Age Determination and GrowthEstimation of Immature Oreochromis niloticus Linn. (Pisces:Cichlidae) in Lake Awassa, Ethiopia. MSc Thesis. Univeristy ofWaterloo, Canada. 137 p.
Tekle-Giorgis, Y., 2002. Comparative Age and Growth Assessmentof the African catfish, Clarias gariepinus Burchell (Clariidae) andNile perch, Lates niloticus Linn. (Centropomidae) in the threeSouthern Rift Valley Lakes of Ethiopia, Lakes Awassa, Abayaand Chamo. PhD Thesis. Addis Ababa University, AddisAbaba, Ethiopia, 160 p.
Tekle-Giorgis, Y., Casselman, J.M., 1995. A procedure forincreasing the precision of otolith age determination oftropical fish by differentiating biannual recruitment. In: Secor,Dean, Campana (Eds.), Recent Developments in Fish OtolithResearch. University of South Corolina Press Columbia, pp.247–269.
Thomson, W.F., Bell, F.H., 1934. Biological statistics of the Pacifichalibut fishery. Effects of changes in intensity upon total yieldand yield per unit of gear. Report of the InternationalFisheries (Pacific halibut) Commission (8): 49 p.
Tudorancea, C., Fernando, C.H., Paggi, J.C., 1988. Food and feedingecology of Oreochromis niloticus (Linnaeus, 1758) juveniles inLake Awassa (Ethiopia). Arch. Hydrobiol. 79,267–289.
Walline, P.D., Pisanty, S., Gophen, M., Berman, T., 1993. Theecosystem of Lake Kinneret, Israel. In: Christensen, Pauly(Eds.), Trophic models of aquatic ecosystems. ICLARMConference Proceedings No. 26, p. 390.
Welcome, P.L. 1972. The Inland Waters of Tropical Africa. CIFATechnical Papers. No. 1 FAO, Rome, 117 pp.
Wetzel, R.G., 2001. Limnology: Lake and River Ecosystems, thirded. Academic Press, San Diego, p. 1006.
Winkler, H., 1983. The ecology of cormorants (genusPhalocrocorax). In: Limnology of Parakrama Samudra—Sri
Lanka (Schiermer, ed.). Dr. W. Junk Publishers, The Hague. pp193–199.Wood, R.B., Talling, J.F., 1988. Chemical and algal relationships ina salinity series of Ethiopian inland waters. Hydrobiologia 158,29–67.