Reflections on Development in Ethiopia
307
-
Upload
khangminh22 -
Category
Documents
-
view
1 -
download
0
Transcript of Reflections on Development in Ethiopia
Edited by
Dessalegn RahmatoMeheret Ayenew Asnake Kefale and Birgit Habermann
Re ections on Developmentin Ethiopia
New Trends, Sustainability and Challenges

Reflections on Development
in Ethiopia New Trends, Sustainability and Challenges
Edited by Dessalegn Rahmato, Meheret Ayenew Asnake Kefale and Birgit Habermann
ፎረም ፎር ሶሻል ስተዲስ Forum for Social Studies

ii
Copyright: Forum for Social Studies, Friedrich Ebert Stiftung and authors, 2014 All Rights Reserved Text layout: Konjit Belete ISBN : 978-99944-50-52-7 Forum for Social Studies (FSS) P.O. Box 25864 code 1000 Addis Ababa, Ethiopia Email: [email protected] Web: www.fssethiopia.org.et Disclaimer: The opinions expressed in this book are those of the authors and do not necessarily reflect the views FSS or its Board of Advisors. Acknowledgements: The publication of this book was made possible by financial support from the Friedrich Ebert Stiftung as well as the Commission for Development Studies (KEF) at OeAD GmbH in Austria. The Austrian partner organization facilitating this support was the Centre for Development Research (CDR) at BOKU, the University of Natural Resources and Life Sciences in Vienna. Both FES and KEF provided funds and other assistance which enabled FSS to hold a conference in September 2013 where the authors of the contributions to this book first presented their work, and helped to cover the cost preparation, editing, and printing of the book. FSS is grateful to both organizations for their assistance and collaboration.

iii
CONTENTS List of Contributors
Forum for Social Studies: A Brief Institutional Profile
v
ix
Introduction Reflections on Development in Ethiopia: New Trends, Sustainability and Challenges
Dessalegn Rahmato
xi
PART I ECONOMIC DEVELOPMENT: TRENDS AND CHALLENGES
1. The Growth and Transformation Plan: Opportunities, Challenges
and Lessons Meheret Ayenew
3
2. Growth, Poverty and Inequality, 2000-2013: A Macroeconomic Appraisal Alemayehu Geda and Addis Yimer
31
3. Development with or without Freedom? Assefa Fiseha
67
4. Development Programs and the Post-MDG Agenda Amdissa Teshome
97
PART II DECENTRALIZATION AND REVENUE SHARING
5. Decentralization and Regional and Local Development: Trends and Policy Implications
Tegegne Gebre-Egziabher
133
6. Inter-governmental Transfers and the Problem of Imbalances in Regional Development: The Need for a Human Rights Approach Solomon Negussie
169

iv
PART III THE RURAL SECTOR
7. Post-dependent Rural Development: Engaging and Assessing
Subjective Well-being Jeffrey Bookwalter and Peter H. Koehn
199
8. Large-Scale Land Investments Revisited Dessalegn Rahmato
219
9. The Expansion of the Sugar Industry in the Southern Pastoral Lowlands
Asnake Kefale and Fana Gebresenbet
247
10. Governance Challenges of Dry Woodlands Melaku Bekele and Habtemariam Kassa
269

v
vii
Contributors
Addis Yimer is currently a PhD Candidate at the Department of Economics, Addis Ababa University. He is also a lecturer at Dire Dawa University. He has published on African and Ethiopian Economy. Alemayehu Geda is Professor of Economics at the Department of Economics, Addis Ababa University. He is also a research associate of the Center for Development Research, SOAS, University of London; Central Bank of Kenya (Nairobi) & the Kenyan National Treasury (Nairobi), Economic Policy Research Center, (Makarare University, Kampala) and the African Economic Research Consortium (Nairobi, Kenya). He has widely published on African and Ethiopian economy in reputable scientific journals including four books published by Palgrave-Macmillan; Nairobi University Press, Addis Ababa University Press and African Economic Research Consortium. Amdissa Teshome is an independent consultant. He holds BA degree in Economics from Addis Ababa University; MSc and PhD from University of London. Over the last 15 years, he has consulted on disaster risk management, food security and safety nets. His research interests include social protection, inclusive growth and MDGs. He is currently working with Tufts University in Addis Ababa as agriculture, food security and gender advisor. Asnake Kefale has a long teaching experience at Addis Ababa University. His teaching and research interests include: governance, conflict studies, development policies and foreign relations in Ethiopia and the Horn of Africa sub-region region. Assefa Fiseha is currently Associate Professor in the College of Law and Governance of Addis Ababa University. He has published a book entitled ‘Federalism and the Accommodation of Diversity in Ethiopia: A Comparative Study (2006)’and several articles in reputable journals. His latest publication include ‘Ethiopia’s Experiment in Accommodating Diversity: 20 Years Balance Sheet’ Regional and Federal Studies 22:4 (2012); Customary Dispute Resolution Mechanisms in Ethiopia co-edited with Gebre Yentiso and Fekade Azeze
vi
viii
Jeffrey Bookwalter is Associate Professor of Economics at the University of Montana. He is an applied microeconomist with interests in economic development, the economics of the household, and the determinants of happiness. Professor Bookwalter has lived in, worked with, and written about the economies of South Africa, Zimbabwe, Ethiopia, Mozambique, and the Republic of Georgia. Some of his recent work has focused on fiscal decentralization and development outcomes in Ethiopia. Dessalegn Rahmato was the Executive Director of FSS from 1998 to 2005 and is now a freelance consultant. His research interests include agrarian change and food security. Fana Gebresenbet is a Lecturer at Addis Ababa University’s Institute for Peace and Security Studies. He is currently a PhD candidate in the joint PhD program the Institute offers with Leipzig University, in Global and Area Studies. His research area primarily focuses on environmental/climate security, pastoralism and pastoral conflicts and developmentalism Habtemariam Kassa completed his PhD in Rural Development Studies in 2003 from the Swedish University of Agricultural Sciences (SLU). Currently he is a Senior Scientist in the Forests and Livelihoods Research Portfolio of the Center for International Forestry Research (CIFOR), and leads all research activities of CIFOR in Ethiopia. His current activities include research on the human-natural resources (forest) interface, on management of forests for multiple objectives at landscape level to better achieve development and conservation/ecological objectives through systemic and interdisciplinary researches. Between 1985 and 1998 he worked for the then Alemaya University, and between 2003 and 2005, he was employed by Virginia Tech University as an Agricultural Research and Extension Advisor for its project in the Amhara National Regional State of Ethiopia. He has published extensively in the areas of agricultural and rural development and over the last couple of years on forests and livelihoods. Peter H. Koehn is Professor of Political Science and Director of the Global Public Health program at The University of Montana. He is a Fulbright New Century Scholar and recipient of the 2011 Michael P. Malone International Leadership Award (2011) from the Association of Public and Land-Grant Universities (APLU). Professor Koehn taught university courses in public administration in Ethiopia from 1970 through 1972. His Ph.D. dissertation and several subsequent peer-reviewed journal articles (e.g., Koehn 1979; Cohen and

vii
ix
Koehn, 1977) and monographs (Cohen and Koehn 1980; Koehn and Waldron 1978) treat development in Ethiopia. His recent work focuses on transnational-competence building and on transnational higher-education partnerships. Meheret Ayenew holds a Ph.D from the State University of New York at Albany (SUNY-Albany) in Public Administration and Policy. He has many years of teaching and research experience at Addis Ababa University both at graduate and undergraduate levels, and has also served in a wide range of administrative and academic capacities. He has done extensive research and contributed numerous works in the areas of governance, decentralization, development management and policy. Currently, Meheret is the Executive Director of the Forum for Social Studies (FSS), which is a non-government and independent think tank based in Addis Ababa. Melaku Bekele completed his PhD in Rural Development in 2003 from Swedish University of Agricultural Sciences (SLU), Uppsala, Sweden. He is currently affiliated to Wondo Genet College of Forestry and Natural resources. He has been engaged in teaching and research for the last twelve years at the College. He has also served as Vice Dean and Dean of the College for over eight years. He has produced journal articles, and writings that appeared in proceedings and book chapters on forest related matters. He is actively engaged in consultancy services in partnership with international consultancy firms like UNIQUE, Climate Focus, and Factor CO2, etc, working on forest governance and climate policy issues of Ethiopia. Tegegne Gebre-Egziabher is an urban and regional planner by profession. He has a PhD from the Ohio State University. He has long years of teaching and research experience and has published many research results in the areas of urban development, rural-urban linkages, decentralization and regional and local development. Currently, he is the director of the Institute of Development and Policy research and also has served as the director of the Institute of Development Research between the years 1997-2000. Solomon Negussie is associate professor at the Institute of Federalism and Legal Studies, Ethiopian Civil Service University. He received his PhD from Utrecht University, and LLM from Amsterdam University and LLB from Addis Ababa University. His area of interest broadly includes federalism and public law, taxation and development, and governance.


xi
Forum for Social Studies
A Brief Institutional Profile
The Forum for Social Studies (FSS) is a non-government, non-profit institutionengaged in conducting and sponsoring policy-oriented research and promotinginformed public debate on a wide range of development issues. It wasestablished in 1998 by a group of academics and CSO activists whose aim wasto help deepen and broaden a democratic tradition of public debates. Its work isguided by the conviction that enhancing the public-government decision-makersinterface on key social and economic issues can promote a transparent,participatory and all-inclusive policy-making and implementation process.
Since its establishment, FSS has been engaged in policy research on awide array of development issues, and has disseminated its findings togovernment decision makers, legislators and the wider public. It has organized aseries of policy dialogues (workshops, seminars, panel discussions, etc.) aroundthe themes of poverty; gender; higher education; inter-generational transfer ofknowledge; good governance and democracy in Africa; culture anddevelopment; and climate change, environmental management and sustainabledevelopment in Ethiopia.
As part of its research activity, FSS has in the past successfully launchedtwo major book projects, viz. Ethiopia: The Challenge of Democracy fromBelow, and Democratic Assistance to Post-Conflict Ethiopia: Impact andLimitations. Since then it has published books and monographs on a wide rangeof development and policy issues, including, poverty and poverty reduction,natural resource management, decentralization, the quality of higher education,culture and development, and environment and climate change. Its publicationshave been disseminated to decision makers, institutions of higher education,academics and researchers as well as non-government and international donororganisations to stimulate further discourse and reflection. This book Reflections onDevelopment in Ethiopia: New Trends, Sustainability and Challenges is acontinuation of that tradition, and is intended to examine current development issuesin Ethiopia from different perspectives to promote dialogue and constructive debate.


Dessalegn Rahmato ___________________________________________________
INTRODUCTION
Reflections on Development in Ethiopia: New Trends, Sustainability and Challenges The need for a more nuanced and more transparent assessment of development in Ethiopia has been obvious for some time now, and the absence of such assessment, especially by independent voices, has hampered, to a good extent, serious public debate on the subject. The dominant narrative at the moment has come from two main sources: from the government, which is both the initiator and executer of the development program in place as well the sole source of information on it, on the one hand, and the international donor agencies, in particular the IMF and the World Bank, which have provided substantial financial and other support to the country, on the other. Government reports and forecasts on the economy present a highly positive picture, showing double digit growth in GDP over a period of some ten years, accompanied by a substantial reduction in poverty levels, high rates of employment and increased foreign exchange earnings. Senior public officials often echo the claims made by some international media sources that Ethiopia’s economy has become one of the fastest growing in the world. The achievements gained are attributed to the soundness of the development strategy charted by the leadership of the ruling party, a strategy that is said to be notable for its rejection of the standard “medicine” for growth prescribed by mainstream or neo-liberal development discourse. This “triumphalist” viewpoint ignores the numerous challenges impacting on society, natural resources and the political process that are becoming visible at the moment. Some of these challenges are due to unbalanced growth in some sectors of the economy, increased competition for scarce resources, policy and institutional failures, and inefficiencies and corruption, while others have a more complex provenance. All governments the world over almost always attempt to put a positive spin on their performance, and Ethiopia’s government is no exception to this. On the other hand, the assessment of the economy issued periodically by the IMF and the World Bank, while different in many ways from those of the government, is, nevertheless, narrowly focused, giving concern primarily to GDP growth, changes in the flow of foreign investment, and monetary and fiscal issues. They leave out a wide range of

xii
Reflections on Development in Ethiopia: New Trends, Sustainability and Challenges
x
problems and concerns that are central to people’s livelihoods and economic well-being. One could of course argue that the term economic growth has a narrower meaning than economic development and that what the two organizations have mainly focused on is the former rather than the latter.
This volume attempts to provide a broader picture of the country’s development program, examining not just the progress that has been made so far but also the challenges and pitfalls that are evident. This, we believe, makes the volume all the more topical and hence of interest to many readers. While each chapter covers a different subject and uses different analytical tools, with little or no relation to the chapter before or after it, and while, at first glance, the book appears to lack a unifying thread, there are a number of common concerns running through many of the contributions revolving around the issues of efficiency and equity, democracy and decentralization, and respect for regional identities and natural resource protection. Moreover, there are significant questions that are taken up in several of the contributions from a diversity of viewpoints of which the following are worth mentioning: does the development pathway chosen by decision-makers - one that has been adopted, it should be said, without sufficient public consultation and deliberation- ensure sustainability and social inclusion? What exactly does the concept of the “developmental state”, a concept that is said to inform the development strategy of the country, entail specifically in the Ethiopian context and how relevant is it? Are the benefits of growth shared by a broad segment of society or have they gone mainly to the few at the top of the social and economic pyramid? A recent report on Africa’s economic growth, produced by the African Progress Panel (chaired by the former UN Secretary-General, Kofi Annan) warns that the fruits of economic progress in the continent have not really “trickled down” to the broad masses of the people but concentrated in the hands of the business and technocratic elite, and the gap between the rich and the poor is widening considerably1. While the report does not specifically identify individual countries where the problem is in evidence, the warning is nevertheless relevant to Ethiopia as the country’s economy continues to expand. Lastly, should there be a separation between economic development, on the one hand, and democracy and human rights on the other as the country’s development model seems to suggest? In brief, the book examines a broad set of issues that should have been (but are not) in the forefront of the debate on the Ethiopian economy and on what the real objectives of the development process should be.
A sound program of development should not only mean growth in material assets (for example, growth in GDP, in the rate of investment and of savings, export performance) but must, in equal measure, bring about real 1 Africa Progress Report 2014. Africa Progress Panel, Geneva

xiii
INTRODUCTION
xi
improvements in peoples’ livelihoods, promote social equity, and enable the sustainability of the natural resource base. Many of the contributions in this collection suggest that viewed from this perspective the direction of the country’s development endeavor is cause for serious concern. The volume opens with a broad review of Ethiopia’s recent experience in development planning with a special focus on the Growth and Transformation Plan (GTP) which was launched in 2011 and is expected to run through 2015. The author, Meheret Ayenew, examines the ambitious objectives and targets of the Plan, and assesses what has been achieved in the three years since its implementation and what remains to be done. Meheret argues that at the end of three years of Plan implementation the results as reported by government sources can only be described as mixed, with some sectors showing considerable progress while in others the outcome has been patchy or altogether disappointing. He notes that among the economic problems causing particular concern are macro-economic imbalances caused by heavy state spending, runaway inflation, which has impacted on people’s livelihoods for over a decade now, and the unfavorable policy environment facing the private sector due in part to state control and management of many key productive and financial enterprises. He identifies and discusses at length a number of significant challenges that need to be addressed if the Plan is to succeed in its ambitious objectives.
In the second chapter of the book, Alemayehu and Addis examine closely and methodically the main economic data sets which have been the basis for all economic analysis and reports in this country, of which the government is the sole source and provider. There have been questions raised by independent researchers as well as by some international organizations such as the IMF and World Bank regarding the accuracy and reliability of the data generated by the Central Statistical Agency and other government bodies but few have been the works which have made a rigorous examination of the data as Alemayehu and Addis have attempted in this chapter. Employing a number of statistical tools and their own alternative measures, the authors have made a careful scrutiny of the evidence, checking for consistency and accuracy of the data over the ten years up to 2012, concluding that the figures provided in government reports regarding the rate of economic growth and poverty reduction are much higher than is warranted by the true picture and that the real rate of change is much more modest than those given in these reports. They recommend that public institutions responsible for data generation should be independent and committed to high professional standards and that the information they generate should be subject to scrutiny by an independent peer-review process. In the second part of the chapter the authors present an extend discussion of poverty and inequality backed by a wealth of data and documentary evidence. Their assessment is that there is strong evidence of pervasive poverty and inequality, and that the poor
xiv
Reflections on Development in Ethiopia: New Trends, Sustainability and Challenges
xii
are often vulnerable to external shocks such as conflict, climate change and aid and remittances. The problem is made all the more serious, they argue, because of a marked absence of structural transformation of the economy in the period in question.
The third chapter, a contribution by Assefa Fiseha, explores the contentious issue, often closely associated with the “ideology” of the developmental state, namely, should economic and political development go hand in hand or should the former precede the latter? In other words, should respect for and enforcement of democracy and human rights be postponed until the country’s economic development has reached a high level or are the two really different sides of the same coin? This notion of economic development “first” and democracy “later” was at one time a subject of debate in some of the countries in east Asia, but lately, while not articulated clearly, it has come to influence state policies and programs in some of the countries in sub-Sahara, not least those where rapid economic progress is taking place. The author argues that in Ethiopia, the ideological shift towards the developmental state gave priority to the economic sector over civil rights and democratic freedoms, while the country’s constitution places equal weight on both. The dilemma, the author notes, is that the public institutions responsible for enforcing human and democratic rights are unable to perform their duties because of a “lack of clarity in their respective roles”.
In the fourth chapter Amdissa Teshome reviews the origins as well as strengths and limitations of the Millennium Development Goals (MDGs), assesses what has and has not been achieved by the countries concerned in meeting the targets set, and reflects on what the post-MDG agenda should be after 2015 when the current MDGs program comes to an end. The author believes that the MDGs have played a significant role in galvanizing the global community to place particular emphasis on the need to reduce poverty and extreme hunger, improve gender equality and provide basic services in the areas of primary education and health, and access to clean water. Without the MDGs, the author notes, the considerable gains made in these areas benefitting tens of millions of people around the world would not have been possible. Amdissa shows that Ethiopia’s achievement in meeting the targets set by the MDGs is quite considerable and compares favorably with many African countries, nevertheless, he is aware that the country faces many challenges and limitations despite the economic growth registered in the last ten years or more. As far as the post-MDGs agenda is concerned, while there is consensus on a follow up initiative, there is no agreement as to what it should be, the main options still under discussion being: continuing with the existing program, reforming it in the light of the experiences gained, or developing an alternative framework.
xv
INTRODUCTION
xiii
Part II (chapters 5 and 6) contains two contributions dealing with the subject of decentralization and inter-governmental resource transfers, albeit from rather different angles. In Chapter 5, Tegegne Gebre-Egziabher approaches the subject from the standpoint of regional and local development, with particular focus on resource availability at regional and woreda levels and human resource capacity and local planning. Based on a wealth of secondary sources and official government documentation he argues that regions are benefitting from fiscal decentralization, gains have been made in resource mobilization in both cases, and some improvements in local capacity are in evidence. The woredas are now becoming important players and local level multi-year planning is now common though the planning exercise is much less participatory. The author cautions that while considerable progress has been made, a lot still remains to be done which will require reforms and follow-ups to enable regions and woredas to benefit fully from the decentralized fiscal arrangements. Solomom Negussie’s particular concern in Chapter 6 is to show why it is important to employ a human rights perspective in examining inter-governmental fiscal transfers. The standard approach to the study of federal –regional resource transfers and fiscal relations, the author states, concentrates mainly on the economic, administrative and politico-legal aspects, and ignores human rights considerations. The aim here is to determine whether meaningful fiscal and political powers have been devolved to sub-national levels within the federal arrangement. In contrast, he argues that the human rights approach is a valuable tool to ascertain to what extent government at regions and units below them are accountable to the people, ensure public participation in governance, and determine the proper utilization of fiscal transfers. Using the human rights framework to examine government institutions, he states, can improve the performance of governance in general and the delivery of services in particular.
Bookwalter and Koehn provide in Chapter 7 what they believe is an innovative framework for designing an inclusive post-dependent assessment of rural well-being. They argue that the data from the 2009 Ethiopian Rural Household Survey and in particular the responses to questions about happiness, life satisfaction and other subjective well-being indicators, allow decision-makers to gain insight into the types of goods, services, infrastructure, education, social networks, and other things that make rural people better off. This they stress is an important step forward in a post-dependent understanding of rural development. In the next chapter, Dessalegn takes a careful look at the state of the country’s large-scale land investment program in the context of the government’s grand strategy of state-led development and reviews what has or has not been achieved half a decade after it was launched with great fanfare. The program, he argues, is now facing serious difficulties and, in some respects, has become a costly failure. State-led development is characterized by emphasis on

xvi
Reflections on Development in Ethiopia: New Trends, Sustainability and Challenges
xiv
large-scale public investment and huge public debt which has damaging implications for people’s livelihoods and has led to a non-inclusive and skewed growth. Land investment, it is argued, is one among a number of public sector initiatives meant to enhance the country’s export market and contribute to the growing demand for state accumulation. It is further argued that the problems faced by the program are not caused solely by poor governance and lack of capacity but raise questions of policy choice and democratic decision-making. Asnake and Fana examine the construction of a large-scale sugar manufacturing enterprise in the lowlands of the Omo valley in the Southern Region in the context of what they call the politics of development governance. They trace the shifting paradigms of development ideology and economic policy both in the African continent and Ethiopia over a period of several decades and explore the specificities of the current ideology, namely the developmental state which has been adopted by Ethiopia and several other African countries. This has provided the Ethiopian government with a convenient justification to embark on massive state investment in many sectors of the economy, including the sugar industry, primarily aimed at the export market. The chapter investigates the political and economic impact of the construction of the sugar manufacturing and plantation enterprise both at national and local levels, but more importantly on the pastoral communities of the South Omo valley whose livelihoods are seriously affected. They argue that while the pastoral population in the valley may stand to gain from the sugar project, most of the benefits will be reaped by the highland populations in the form of jobs, increased investment in industrial and other enterprises and infrastructure and services. Melaku and Habtemariam’s interest in the last chapter is on the country’s dry forests and woodlands which, they argue, are in a perilous state due to unregulated and unsustainable exploitation as a result of the expansion of commercial agriculture, state-sponsored settlement schemes and excessive charcoal production and firewood collection. These forests are located in fragile ecosystems but have been important to the livelihoods of the people here who have customarily depended on them. At present the country’s dry lands are coveted by international and domestic investors, parastatals, and well-to do local farmers, but neither these actors nor the government have put in place a sustainable system of management for the resources in them.
The contributions to the book are revised and edited versions of papers originally presented at a conference jointly hosted by FSS and FES and held in Addis Ababa on 19 – 20 September 2013. The editors acknowledge that there are a number of issues that have not been fully explored and several important subjects that have not been covered. A major economic sector that is missing is agriculture and the rural economy. The rural sector is a major player in the country’s economy for the reasons discussed in a number of the contributions in

xvii
INTRODUCTION
xv
the book as well as for the resources available in it and eagerly sought by numerous economic actors, both domestic and international. The vulnerability of the rural areas has at present been aggravated by climate change, the country’s growing engagement with the global commercial and financial system, and increasing competition for limited natural resources such as land, water, pasture and forest products. Another important area not given attention is the industrial sector which has gone through significant expansion due to the increased inflow of foreign investment in the last decade and the establishment of a growing number of manufacturing enterprises mainly but not exclusively by Asian and Middle Eastern capital. Lastly, a close look at the impact of commercial, industrial and mining investments on the environment and natural resources, and the consequences on the livelihoods of population groups, not least the poor and marginalized, would have been valuable in itself and as an indicator social well-being.
Despite these limitations, however, the book provides a good starting point for a balanced assessment of economic development in the last two decades. The primary purpose of the book is to stimulate debate on the Ethiopia’s economy and development endeavor in this period, and the challenges the country is facing due to the rapid changes that are taking place. The authors of the collection are based in academia, civil society organizations, and independent research institutions, and the contributions have come from economists as well as researchers in several other disciplines. As the diversity of the subject matter in the collection indicates, the work is not meant to be for economists only but is intended to attract a wider readership. We believe the book will be of interest to experts in government departments, development practitioners in civil society, academics, independent researchers, and people who have a special interest on Ethiopia and its future.


PART I
ECONOMIC DEVELOPMENT: TRENDS AND CHALLENGES


1
1 Meheret Ayenew
The Growth and Transformation Plan: Opportunities, Challenges and Lessons
Introduction Ethiopia’s Growth and Transformation Plan (GTP) covering the period 2010/11-2014/15 is the blueprint for transforming the economy and bringing about structural change. Its general tenet is that the government must play an active and leading role by undertaking massive investments in infrastructure (i.e. roads, hydropower projects, railways, etc.) as well as in education and health to spur growth and reduce poverty. Simply put, the plan places the state at the forefront of economic development. This chapter reviews some of the achievements of the GTP, and identifies some challenges that need to be addressed to successfully implement the plan.
The Government claims that the GTP has registered impressive results since its launch in 2010/2011. According to official data, the economy has been steadily growing at an annual average of more than 10 per cent and major infrastructural projects, such as the Grand Ethiopian Renaissance Dam (GERD), have been initiated and are progressing well. In addition, significant gains have also been scored in other important development schemes in the road, health and education sectors. The country has also made important advances in poverty reduction and job creation in rural and urban areas as a result of the Plan (MoFED 2013).
However, nearly three years into its implementation, the achievements and challenges of the GTP have come under close scrutiny and raised concerns. These concerns have both a political and economic dimension. On the economic front, issues causing particular concern have been the macro-economic imbalances of heavy state spending; runaway inflation that the country has been experiencing in the recent past; and the possible squeezing of the private sector against a backdrop of state-dominated management of the economy in key areas, such as big construction and metal/engineering works as well as other major projects, including the many large-scale sugar industries currently being set up by the government. In other words, expanded state monopoly and increasing

4
Meheret Ayenew
2
centralization of economic activity have affected the potential role that the private sector can play in economic development.
On the political side, the launching of the GTP has paved the way for the central government to emerge as the dominant actor in economic policy planning and implementation. As noted earlier, the GTP envisages centralized management of the economy and a strong interventionist state to implement many mega projects. The Government justifies this on the grounds that there is a need for a developing country such as Ethiopia for the state to assume a strong posture to accelerate economic growth and eradicate poverty. The main argument is that the Government must make strategic interventions in key sectors of the economy as these are essential to create conducive conditions for the private sector and foreign investment to flourish.
The opposing view also brings out the political ramifications of an increasingly centralized state on central-regional relations. Simply put, in a federal state such as Ethiopia, centralized and top-down decision making can erode the autonomy of regional states, which at present enjoy considerable self-rule, and increasingly pass on more authority to the central government at the expense of the Regions. While it may be argued that such a power shift is inevitable because it is the central government that has the resources and the capacity to spur economic growth, the political ramifications that can be produced on the federal arrangement must be appreciated (Aalen and Asnake 2012; Asnake 2011).
Equally important, the launching of the GTP has rekindled the debate on state-led development in Ethiopia in particular and in the African context in general. Among other things, this has meant the question of the potentials and limitations of the state to deliver sustainable growth have become important academic and policy issues. A relatively recent dimension to this debate has also been the notion of what is commonly referred to as the ‘developmental state’, viz. a state with a singular focus on economic growth but one that will have to delay the process of political democratization in the interests of fast-track economic transformation (Asnake 2011; Meles n.d.). This state paradigm is presented as the anti-thesis to the Western neo-liberal state model, which advocates a limited government role in the economy, and thus not relevant for a country such as Ethiopia.
In recent years, the developmental state model has also been gaining in popularity among some African countries, including Ethiopia. Since Ethiopia’s GTP assigns considerable role for this kind of state, it is this paradigm that will be used as a point of departure for discussing the Plan. As a prelude, however, a brief historical review of the role of the African state in the economy is in order

5
The Growth and Transformation Plan: Opportunities, Challenges and Lessons
3
to provide a proper context for the subsequent discussion on the current Ethiopian experience.
The African state and development: brief historical review Africa’s mode of development vis-à-vis the role of the state has traversed through many winding roads. Starting in the 1960s, which saw a wave of decolonization, there was a rising expectation in the ability of African governments to build strong economies. The direct result was an expanded role for the African state in economic activity in addition to its traditional responsibility as a provider of public goods and services. This trend continued well into the late 1970s until it became gradually clear that the African state had failed to deliver economic growth and proved incapable of providing public services efficiently and equitably. The multi-faceted crisis governments faced, including economic stagnation, political instability, widespread poverty and malfunctioning public sector institutions, strengthened the call for change to reduce the size and scope of the state.
The early 1980s saw increasing disillusionment with the poor track record of the African state in economic growth and its inability to address the intractable problems of poverty and underdevelopment. As a result, calls for the shrinking of the state and its total withdrawal from economic management were advocated vocally, particularly by multi-lateral aid institutions like the World Bank and the IMF (World Bank, 1981). The recommendations came in the form of structural adjustment programs (SAPs), which consisted of a package of prescriptions aimed at curtailing the role of the state, and included: (i) reduction of public expenditure;(ii) increase in domestic savings; (iii) reduced role of the state in economic planning and management; (iv) rationalization of the public services; (v) liberalization of the economy; (vi) promotion of exports; and (vii) promotion of foreign direct investment through extensive concessions to foreign investors (Chary 1989; Rose 1985). It was assumed that these steps would give more space and initiative to the private sector to play a more active role in manageing the economy. However, judging from the majority of the countries that adopted the program, the private sector did not assume the leadership role of the economy.
Structural adjustment programs (SAPs) of the 1980s had a devastating impact on African economies and societies. To downsize the state, massive layoffs of public servants were undertaken and this caused a great deal of social pain. Governments were compelled to cut subsidies and reduce budgets for critical public services, which aggrvated the poverty situation in urban and rural areas. Loss-making or inefficient public enterprises were either sold off or closed down altogether thus causing not only decreased economic activity but also

6
Meheret Ayenew
4
exacerbating joblessness. Because of the reduction in public expenditure as stipulated by the programs, poorly paid and demoralized civil services became the order of the day; schools were left without textbooks; hospitals and other health facilities lacked supplies to treat patients. Physical infrastructure, including roads, bridges, ports and other communication facilities were in disrepair because governments did not have the money to keep them running (Ihonvere 1991).
As the 1990s unfolded, all the ills and manifestations of the ‘broken state’ were attributed to the African state because of its inability to deliver development, and this precipitated calls for the ‘rolling back of the African state’ (Chary 1989; Laird 2007). Apart from the economic crisis that followed, much of the anti-state backlash was triggered by the resurgence of neo-liberal development thinking sweeping the West following the Reagan-Thatcher era of the early 1980s and the collapse of the Soviet Union. Many of the multi-lateral aid institutions like the World Bank, which are highly influenced by the ideological hegemony of the major western powers, jumped on the bandwagon and denounced the African state as ineffective (World Bank 1981; Rose 1985). Since then, the politics and practice of development vis-à-vis the state has taken several twists and turns, vacsilitating between a reduced role vs an enhanced role for government in the economy (Evans, et.al. 1985).
Revived thinking around the developmental state Development thinking about the size and role of the state in economic management began to change towards the end of the 1990s. This came in the form of the so called ‘developmental state’. This marked an important paradigm shift in development management, and ushered in a renewed notion about the need for proactive state intervention in economic development and transformation. In a way, it represented a rejection of the neo-liberal approach to development, which views the state as a referee to facilitate and create a conducive environment for the non-government sector to act as an engine of growth.
The inspiration for the paradigm shift that accentuates the role of an activist state in economic transformation came from the experiences of the Asian nations, such as Japan, South Korea, Thailand, and Malaysia. The theoretical and academic underpinnings of this turnaround originated from the pioneering work by Chalmers Johnson, who was probably the first to initiate an academic debate on the developmental state (Johnson 1982; Chang 1999). His conception of this kind of state was one which vigorously promotes economic growth, and takes appropriate policy measures to spur the process. Subsequent works pushed the discourse further by underscoring the fact that a developmental state, as was
7
The Growth and Transformation Plan: Opportunities, Challenges and Lessons
5
witnessed in Asia, was the only feasible approach to bring about economic transformation and defeat poverty in much of the developing world (Vu 2007; Meyns & Musamba 2010).
It must be underscored, however, that the Asian mode of the developmental state encouraged the active involvement and growth of the private sector in the economy by putting in place supportive policies and providing incentives. The experiences of some countries, such as South Korea and Taiwan suggest that apart from creating suitable conditions for the private sector, direct state management and ownership of the economy was somewhat limited. In other words, in all these countries, the state never worked to replace the sector but worked side by side to support its growth. It can also be argued that given the experiences of these countries, government or state involvement in the economy and private sector participation are not mutually exclusive (Song 2003; Kohli 2004; Noland 2005).
The developmental state approach has strong adherents as well as critics. As indicated elsewhere in this paper, proponents argue that the developmental state is the perfect alternative to its neo-liberal counterpart because the former addresses the agenda of the developing world for rapid economic growth. They admonish the classical neo-liberal state as a purely Western notion that is out of place in addressing the needs for accelerated economic growth in the emerging world. This kind of state might have worked in the past but under a different set of circumstances and in a different historical context. Hence, many question the efficacy of the neo-liberal state in transforming developing economies, and insist that there is sufficient justification and historical experience for the developmental state model to be relevant in transforming the structure of developing economies struggling to grow and improve living standards for their peoples (Meles n.d., Mkandawire 2010; Meyns & Musamba (eds) 2010).
Politically, the Asian nations that followed the developmental state paradigm, except Japan, were not said to be democratic as such, at least in the initial stages of economic takeoff. But, most of them gradually conceded to multi-party politics and became progressively democratic as the economies progressed (Slater & Wong 2012).
In the Ethiopian case, the official line is that the country pursues a democratic developmental state model. Whether this state will be able to follow a democratic path and attain development akin to the experiences of Japan and South Korea is open to debate. Simply put, in the Ethiopian case, there has been little prospect so far of marrying the two---development and democracy at the same time. Many signs so far indicate that the space for participatory and inclusive governance by non-state actors, such as civil society organizations (CSOs) and other socio-economic groups, has been gradually narrowing as the

8
Meheret Ayenew
6
economy continues to show signs of improvement. The recent CSO and press laws, which came out in the guise of regulating these non-state actors, as well as other controversial legislations that the Government introduced since the controversial 2005 elections can be cited as cases in point.
The developmental state model particularly in the African context has drawn criticisms. Skeptics contend that the African model of the developmental state lacks certain requisite elements to be effective. First, the state is perceived as weak in its organization and lacks the political power to preserve its autonomy from powerful vested interests, which may try to subvert its ability to exercise independent decision making. This argument goes in line with the thinking that the developmental state model can be pursued in an authoritarian political order.
In addition, the absence of adequate institutional resources, such as an efficient, competent and professional public bureaucracy to carry out a program of accelerated economic transformation is said to be another weakness of the African developmental state. This is sordidly lacking particularly in Africa, where civil services are highly politicized and riddled with corruption and incompetence. In the absence of this critical factor, the notion of a developmental state becoming a reality is a remote possibility. The current political praxis of the Ethiopia state suggests that the system cannot be immune from this observation (Ghelawdewos 2013). In other words, in the Ethiopian case, the state has narrowed the space for the engagement of civil society, opposition parties and, to some extent, the private sector, and hence one may say the autonomy of the state is preserved—albeit under an authoritarian political order.
A more stringent criticism of the developmental state is its poor track record in political democracy and its entrenched authoritarian character. When confronted with this contention, proponents of this state model provide a justification by arguing that opening the democratic space can delay the process of rapid economic transformation because the state will be compelled to share its power of decision making with different forces vying for control of the policy space. Simply put, economic determinism is the driving force behind the developmental state with political democracy relegated to a second degree or even postponed indefinitely until economic progress is achieved. This has also been partially the case in the historical experience of north-east and south-east Asian nations, for example South Korea in the 1980s, although it has recently been revealed that these countries gradually opened up avenues for democratic governance as economic growth gained momentum (Slater &Wong 2012; Slater 2012).
Another criticism leveled at the notion of the developmental state and one which is an offshoot of its authoritarian character is its antipathy towards civil

9
The Growth and Transformation Plan: Opportunities, Challenges and Lessons
7
society and other independent societal actors. It is in the nature of this kind of state to reject effective partnership among the state, the private sector and civil society or other independent organizations unless such a relationship guarantees the dominance of the former over all other democratic forces. The extreme view is that this predisposition of the developmental state can pose the danger of becoming a ‘Trojan horse’ for authoritarian rule and delaying democratic governance.
As earlier noted, safeguarding the autonomy of the state and its unfettered decision making and implementation process in order to speed up economic growth are presented as justification for a strong non-democratic ‘developmental state’. Nevertheless, this kind of argument for a monolithic, strong authoritarian state does not hold water because for economic growth to be sustainable and equitable, there is no alternative to a democratic, participatory and all-inclusuve governance apparatus. Equally important, in diverse and heterogeneous states such as Ethiopia, what is needed is a decentralized and accommodative policy space that allows for maximum participation by all significant societal forces, including political or ethnic-based organizations and non-state actors.
In addition, the argument that the development state must be an interventionist and domineering institution over all societal actors runs contrary to the principles and practices of participatory governance. From the perspective of democratic governance, it is strongly argued that the modern state must provide a platform for the active involvement of non-state actors in the process of policy making and implementation as well as nation building. This practice will enhance the people’s trust in government and also make public institutions accountable and responsive to the needs and interests of citizens. In other words, the state should be open to feedback, and encourage tolerance and diversity of views in politics and economics as a litmus test of its legitimacy and acceptance by its own citizens (Gelawdios 2013; UNDP1999).
The preceding discussion on the developmental state is intended to serve as a framework for assessing the performance of the GTP so far and its future prospects. As hinted earlier, this is necessary because the plan envisages a predominant role for the state to transform the Ethiopian economy. As such, this developmental state paradigm is the proper context for discourse on the growth strategy the country has adopted, and the opportunities and trends that arise from it.
Ethiopia’s GTP: main contents and salient features As a formal development plan, the GTP is comprehensive and the planning is made for both the federal government and the regions (MoFED 2010). It is an extremely important document that contains considerable data and reasonably

10
Meheret Ayenew
8
good analysis on the current state of the Ethiopian economy and its future prospects.
While no attempt will be made to cover the full range of the contents of this document, selected indicators and factual data will be employed to assess the current economic performance against the targets set to be attained during the Plan’s 5-year period. Equally important, this kind of approach can help in raising policy issues that can stimulate further debate on short-and long-term development opportunities and challenges. In addition, given the significance of the GTP, this kind of debate can generate practical policy ideas that can assist its effective implementation.
++++From an institutional perspective, the Ministry of Finance and Economic Development (MoFED) is the main executive body that is in charge of the GTP. It has been assigned the task of spearheading the preparation and implementation of the plan, while other sectoral ministries and agencies are at the same time made responsible for executing specific programs and functions relating to their mandate both at federal and regional levels. In addition, some regional governments have also recently started to prepare and implement their own development plans within the framework of the federal GTP (ANRS, 2003-2007 Eth. Calendar; TNRS, 2003 Eth. Calendar).
In addition to providing socio-economic targets to guide action, the GTP also lays out overarching multi-sectoral goals that are envisaged to be achieved during the Plan period. When effectively implemented, these will enable the country to build organizational and human resource capacity for long term growth as well as address cross-cutting concerns deemed necessary for inclusive and participatory development. The main ones listed as pillars of the strategy are the following (MoFED 2010, p.6):
Building all-inclusive implementation capacity; A massive push to accelerate growth; Creating the balance between economic development and population
growth; Unleashing the potentials of Ethiopia's women; Strengthening the infrastructure backbone of the country; Strengthening human resource development; Managing risk and volatility; and, Creating employment opportunities.

11
The Growth and Transformation Plan: Opportunities, Challenges and Lessons
9
As a substantive economic policy paper, the GTP is a litmus test of the determination of the Government to change the structure of the economy by putting the country on a fast tracked development trajectory. As indicated earlier, it covers the period 2010/11-2014/15, and comes on the heels of two preceding development plans aimed at poverty reduction and revitalizing the economy for further growth. These were the Sustainable Development and Poverty Reduction Program (SDPRP), which was finalized in 2002, and the Plan for Accelerated and Sustainable Development to End Poverty (PASDEP), which was implemented from 2005/06-2009/10. The SDPRP primarily focused on poverty reduction as a priority national agenda while the PASDEP was mainly intended to lay the ground work for the attainment of the Millennium Development Goals (MDGs) by 2015 (MoFED 2010). Important economic gains have been registered following the implementation of the two previous plans, and this has no doubt emboldened the Government to come up with high targets under the GTP.
The SDPRP was initiated at the behest of the major aid providers, viz. the World Bank and IMF, which encouraged governments in poor nations to produce poverty reduction programs. These were at the time popularly known as poverty reduction strategy programs (PRSPs). As with many other developing nations, these two organizations required that the Government of Ethiopia prepare a strategy committing itself to poverty reduction in exchange for debt relief and concessionary lending under the Highly Indebted Poor Countries (HIPC) scheme (Bijlmakers 2003). Accordingly, the Government produced the SDPRP as a sign of its commitment to reduce poverty. Apart from its poverty reduction goal, the SDPRP also had included programs in key areas, such as the Agricultural-Development Led industrialization (ADLI) program; civil service and justice system reform; capacity building at federal and regional levels; and governance, decentralization and empowerment (Amdissa 2006). Most of these program components were supported by the country’s bi-lateral and multi-lateral development partners because these measures will help to build institutional and governance capacity for sustainable economic growth.
One of the positive lessons from the preparation of the SDPRP was that it involved extensive consultations by citizens, civil society organizations, the private sector, professional associations and the wider public. This helped to enhance public participation and a sense of ownership of the program. Government support for public involvement also facilitated wide consultations at regional, woreda and community levels This kind of public engagement had the effect of widening the policy space and helped government to be responsive to the needs of its citizens. It also provided an opportunity for non–state actors to

12
Meheret Ayenew
10
provide inputs to the program1. Unfortunately, this tradition did not continue with the same vigor in the preparation of subsequent development plans, including PASDEP and the GTP.
The PASDEP, which run from 2005/06-2009/10, capitalized on the lessons drawn from the achievements and experiences of the SDPRP. Its main focus was on laying the foundation for accelerated economic growth and consolidating the gains under the previous plan. Although the main focus was economic growth, the plan has also identified hitherto unaddressed but critical areas of development that needed to be given particular attention, including creating the balance between economic development and population growth; managing risk and volatility; creating employment opportunities; and unleashing the potentials of Ethiopia’s women (MoFED, 2010).
The successes attained during the SDPRP provided a springboard for setting ambitious targets under PASDEP. This was done under what the Government termed ‘two alternative case scenarios’: base-case scenario and high-case scenario. According to the Government, PASDEP had been highly successful in both assumptions, and the progress gained steered the economy on a path towards a high growth course. According to Government data, real GDP grew at an average of 11 per cent per annum between 2005/06—2009/10. During the same period, agriculture grew by an average of 8 per cent, industry by 10 per cent, and services by 14.6 percent per year (MoFED 2010). If these high growth rates are maintained in the long run, the Ethiopian economy will certainly see a period of strong growth and significant structural change.
Despite PASDEP being hailed as a success, the Government has experienced serious constraints in implementing the plan. Two of these critical problems were said to be the high inflationary pressure that affected macro-economic stability and the low level of domestic savings that was unable to support the huge demand for investment in infrastructure and key growth sectors ( MoFED 2013). As will be explained later, these two development problems were not fully addressed during the GTP, and are bound to affect prospects for the country’s overall economic growth and poverty reduction in the years ahead. Lately, the Government has been taking a series of measures to deal with these problems but so far the attempts have been only partially successful.
From a policy making perspective, what is significant about PASDEP is that like its predecessor the SDPRP, it was largely government-led and followed a top-down approach to development planning. In other words, in comparison with the SDPRP process, there was limited public consultation in the planning process and the contribution from important non-state actors, including
1 The author was a participant in some of these public consultations.

13
The Growth and Transformation Plan: Opportunities, Challenges and Lessons
11
representatives from civil society and the private sector, was far less than expected. As reiterated elsewhere in this chapter, genuine public participation in the policy process promotes trust and legitimacy in governance and also provides for inclusive, broad-based development. In addition, it will assist the government to consider different alternatives in attaining policy goals while earning public support for its programs. As such, it is absolutely necessary to institutionalize a political culture of participatory development and governance to ensure successful outcomes, and enhance the impact of development plans and government programs.
In this connection, it must also be noted that carrying out genuine participation is problematic. Normally, democratic and competitive elections and non-state actors ensure genuine participation. In the absence of a democratic culture, public participation may be carried out for formal and populist reasons without substance. Simply argued, the political landscape must nurture a culture where there are competitive elections and non-state actors’ views are expressed freely and a culture of public participation is embedded in the policy process. This consideration will be taken up in assessing the strengths, opportunities and trends observed in the GTP.
The GTP: overview of targets, achievements and trends As was indicated elsewhere in this chapter, the GTP is Ethiopia’s ambitious plan aimed at putting the national economy on a fast-track growth trajectory. This plan is inspired by the significant growth attained in the economy under the two previous plans, i.e. the SDPRP and PASDEP. GTP is planned to be implemented over a 5-year period between 2010/11-2014/15 and is now in its third year. Several issues are being raised about the outcomes attained so far and the prospects that lie ahead, which I will attempt to address.
Contrary to government claims, unlike the SDPRP, there was not much public participation in the process of preparing the GTP (MoFED 2010). As a result, the plan was largely government dominated and followed a typical top-down approach. There was some public consultation with the country’s major aid providers as represented by the Development Assistance Group (DAG) (Geul 2013). In addition, there were also some limited public participation at the regional and Woreda levels, but these were largely formal and did not have any substantial impact because Government views invariably prevailed (Amdissa, 2006).
The GTP has two broad objectives. First, it aims to bring about sustained and broad-based economic growth that will result in making Ethiopia a middle-income country by 2025. According to the World Bank, a middle-income country is defined as one with a gross national income (GNI) per capita of

14
Meheret Ayenew
12
around USD 1,430 (World Bank 2013). In 2011, Ethiopia’s gross national income was estimated at USD 93.75 billion PPP, which would mean a GNI per capita of USD 1105 for a population of about 85 million. This figure points to the possibility of Ethiopia attaining the middle-income status within the medium-to-long-term time frame if current growth rates are maintained. In contrast, the comparative figure for Kenya with about half Ethiopia’s population stood at about USD 71 billion PPP or GNI per capita of USD 1775 in 2011. This is significantly higher than the Ethiopian GNI per capita, which means that the country still needs to do more to match the successes of its next door neighbor.
Furthermore, if Ethiopia’s record is compared with other big African countries, significant gaps can be observed. For example, Nigeria with a much bigger population had a gross domestic product (purchasing power parity) estimated at USD 448 billion in 2011, which is nearly five times that of Ethiopia. Egypt with a somewhat similar population size had a gross domestic product of USD 537 billion (purchasing power parity) during the same period. This is nearly six times that of Ethiopia (Global Finance, 2011 a &b). These comparative figures underscore the need for more concerted action to accelerate growth; they also serve as another sober reminder that there is no better alternative to effectively implementing bold and grand economic designs, such as the GTP.
The second goal of the GTP is to change the structure of the national economy from one of predominantly agriculture-based to industrial and services led. An important requirement in this transition is the modernization of the agricultural sector through the use of large-scale commercialization and modern technology and inputs to increase farm output. Related to this is the imperative for fast-track development of the industrial and service sectors of the economy by encouraging private domestic and foreign investment by offering incentives. This measure will certainly help to develop the productive sector and place the economy on a strong footing for long-term, accelerated growth. In the final analysis, the attainment of middle-income country status and structural transformation of the economy will significantly reduce poverty and raise living standards for the vast majority of Ethiopians.
Taking 2009/10 as the base year, the GTP sets targets under a base-case and high-case scenarios. Under a high-case scenario, total real GDP is projected to grow at an annual average of 14.9 percent per year over the Plan period. As can be observed in Table 1 below, the growth rate for a base-case assumption is set at a yearly average of 11.2 percent for the economy as a whole. Achieving these high targets will certainly alter the economic landscape of the country and make it the economic powerhouse of eastern and central Africa. The annual

15
The Growth and Transformation Plan: Opportunities, Challenges and Lessons
13
average growth rates of the major sectors of the economy under two alternative scenarios is provided in Table 1 below.
Table 1. Real GDP projection under base-case and high-case scenarios
Sector Base Year (2009/10)
Five Year Average (2010/11-2014/15)
Base Case High Case
Agriculture and allied activities 6.0 8.1 14.9
Industry 10.2 20.0 21.4
Services 14.5 11.0 12.8
Real GDP 10.1 11.2 14.9
SOURCE: MoFED 2010
As can be observed from the Table, the growth rates for agriculture and industry will more than double during the Plan period. Growth in agriculture is projected to rise from 6.0 percent per annum during the base year to 14.9 per cent per annum under the high-case scenario. Industry is set to grow from 10.2 percent achieved during the base year to a high of 21.4 percent under the GTP’s high-case scenario. The services sector is also projected to grow at a high rate, although slightly smaller than the base year. As will be explained later, it is these yardsticks that will be used as benchmarks to assess the progress made in achieving the GTP targets.
The GTP has a major strength: it is multi-sectoral and broad-based. In other words, it identifies key macro-economic and strategic sectors as principal areas of focus during the Plan period. This range of development priorities includes a long list of macro-economic indicators and strategic sectors, including agriculture, industry, infrastructure development, urban development and housing, and education and health. Targets to be attained during the Plan period have been set for all these sectors. These will be used for benchmarking progress in implementation and review. Target data for some selected indicators are provided in Table 2.

16
Meheret Ayenew
14
Table 2. Selected socio-economic and infrastructure targets to be attained under the GTP
Indicator 2009/10 2014/15
Per capita GDP at current market prices (USD) 401 698
Total poverty Head Count (percent) 29.2 22.2
Coffee exports (tons) 319,647 600,970
Sugar production (000 ton) 17,712 42,516
Electricity coverage (percent) 41 75
Road network (kms) 49,000 136,000
Number of housing units 213,000 700,000
Government higher institutions intake 185,788 467,000
Under-5 mortality rate (per 1000) 101 67
SOURCE: MoFED, 2010.
The above data represent high profile growth targets, but their attainment
begs several questions. Are these targets realistic and achievable during the plan period or are they intended to garner public support for government and mobilize the people? Or, alternatively, has the government deliberately set the plan targets so high to elicit commitment and participation by relevant stakeholders, including Ethiopia’s development partners? Does the country have the necessary institutional capacity and financial resources to implement this grand plan? What is the government counting on to get the massive finance required to attain these big targets, particularly for implementing the huge investment plans for some big industries, for example in the sugar sector, and the ambitious infrastructure projects in roads and railways? Have any specific measures or strategies been spelt out with regard to financing in the Plan?
To answer these and other related questions, it is necessary to assess the progress made so far under the GTP during the past three years. This will be done by comparing actual achievements with Plan targets for different economic and social sectors. This assessment will provide an indication of the prospects of fully attaining the plan targets during the specified period. Equally important, it will also help to identify major challenges that might have slowed progress so far and the corrective measures that need to be taken to ensure the successful implementation of the Plan.

17
The Growth and Transformation Plan: Opportunities, Challenges and Lessons
15
Achievements It has now been three years since the Government launched the GTP. Within this period, many assessment reports on the successes gained have been prepared by it and its development partners, such as the World Bank. Often, reports published by the Government and bi-lateral and multi-lateral organizations, which support the country’s development endeavors, vary, sometimes significantly (IMF 2006; IMF 2011). It is important to note here that the differences are more pronounced on substantive policies or further corrective measures that need to be taken than on actual indicators of performance. For example, while the World Bank argues that the GTP has the effect of crowding out the private sector and the tendening towards state monopoly of economic activity, the Government disputes this and asserts otherwise insisting that the Plan has actually helped to expand the scope and role of the sector as an active partner in development (World Bank 2013)2. The Bank’s position is partially supported by the Ethiopian private business community who often complain about the privileges and preferential treatment given to state monopolies and party-owned companies, and, to some extent, foreign investors. The bias is most often observed in important decisions in awarding government contracts, bank loan concessions (which favor foreign-owned businesses) and foreign exchange allocations (Reporter, Hamle 10, 2005 Eth.Calendar.)
On the whole, the government seems to be pursuing a somewhat inconsistent policy towards the private sector. On the government side, the criticism directed at the sector is that it is obsessed with a ‘quick rich’ mentality mainly operating in the import and export trade and services. Industrial development from which benefits are reaped in the long-term are deliberately avoided. For its part, the private sector accuses the government of being biased towards state owned businesses and public enterprises with many of the privileges, such as foreign exchange allocations and public contracts, going to the later. In addition, while the private sector is encouraged to engage mainly in the textile and leather manufacturing sector, the Government retains monopoly over mechanical and engineering fields--a fact cited as an example of discriminatory practice by the public sector (IMF 2010).
Varying accounts about the successes attained under the GTP have been provided by different sources. On the whole, however, there are areas in which significant progress has been made in terms of meeting targets while there are also concerns about the attainability of certain goals. Generally, the Government is fairly optimistic about the overall direction of the GTP in transforming the
2 Recently, Prime Minister Haile Mariam Dessalegn asserted this at a consultative meeting with private businessmen in Addis Ababa.

18
Meheret Ayenew
16
Ethiopian economy and bringing about sustainable and broad-based growth. The successful implementation of the Plan will, it is argued, bring down poverty levels, improve living standards for a substantial segment of the population, and help the country achieve the MDG targets (MoFED 2013).
On the other hand, skeptics contend that the plan is too big to be attained in so short a period of time, and is broad and lacks specifics, particularly on financing and investment required for big schemes, such as the planned mega sugar industries or the Grand Renaissance Dam. Hence, they argue that some of its important targets may not be realizable during the Plan period. They cite low-level savings, the diminished role of the private sector, less than projected growth in agriculture, and shortage of investment finance as major constraints that can militate against the full realization of the GTP (World Bank 2013; MoFED 2013).
Based on analysis of the performance of the GTP over the past three years, there have been marked improvements in the overall economy. This can be largely attributed to the success of the GTP registered so far. At the same time, there are also shortcomings that the Government has to address to ensure the successful implementation of the Plan within the remaining period. Selected macro-economic indicators will be used to lend credence to this argument.
According to the Government, for example, in the first two years of the GTP, the national economy grew by an average of 10 percent. This is said to be slightly lower than the projected growth of 11.1 percent for the first two years of the GTP and 11.2 percent annual growth rate projected for the entire 5-year GTP period. According to Government projections, the growth is expected to slip down to 8.5 percent per year in 2012. This is said to be by far better than the 5.3 per cent growth rate achieved in Sub-Saharan Africa during the same period . Figure 1 provides a summary of the growth projections forecast by the IMF and the Ethiopian Government.
The Government asserts that the country has been able to maintain an average annual economic growth rate of 11 percent over the last nine consecutive years between 2004 and 2012. While one can agree with this claim, it can, however, be observed, as shown by Figure 1 above, that the rate of growth is showing a declining trend between 2004-2012. There can be two possible implications for this phenomenon. Firstly, one can say that the growth rate reached its peak in 2004 and gradually declined. Secondly, a related and perhaps more important observation may be that the slowing trend over the years may give rise to concerns that the high growth rate may not be sustained in the long run. This is perhaps a more important concern because it will impel the Government to take new and proactive measures to maintain the momentum

19
The Growth and Transformation Plan: Opportunities, Challenges and Lessons
17
By many standards, Ethiopia is a very poor country and one of the most
aid-dependent in the world. According to UNDP, it stood at 173 out of 187 countries in terms of its Human Development Index (HDI) in 2010/11 (UNDP 2011). Hence, an important variable to assess the success of the GTP is its impact on poverty reduction. According to Government data, the percentage of people living below the poverty level has declined from 38.7 per cent in 2003/04 to 29.6 per cent in 2010/2011, and is expected to go down further to 27.6 per cent in 2011/2012. Urban unemployment has declined from 18.9 percent in 2009/10 to 18 per cent in 2010/11, and is expected to decline further to 17.5 per cent in 2011/12. The percentage of the urban poor is said to have declined from 35.1 percent in 2004/2005 to 25.7 percent in 2010/2011, and that of the rural poor from 39.3 percent to 30.4 percent during the same period (MoFED 2013). This success is attributed to massive expenditures in pro-growth and pro-poor economic sectors and investments in social services, particularly in education and health. To back up the claim, the Government has reported that of the total spending in 2011/12, about 70.4 percent went to growth-oriented pro-poor sectors (MoFED 2013).
The Government also points to improvements in domestic savings as a sign of progress derived from the GTP, although this is again disputed by the World Bank. In this regard, the target was to raise the savings rate to 15 per cent of GDP during the Plan period. In actuality, domestic savings has gone up from 5.2 per cent in 2009/2010 to 12.8 per cent in 2010/2011, and is projected to increase to 16.5 per cent in 2011/2012 (MoFED 2013; Sufian Ahmed 2013). As hinted earlier, this is is questioned by the World Bank. According to a recent
20
Meheret Ayenew
18
World Bank report, Ethiopia’s savings rate is at its lowest in 30 years declining from 10 per cent of GDP in the 1980s to 6 per cent of GDP in 2000s (World Bank 2013).
Comparison of plan targets vs performance In conventional planning, trend analysis in the interim is often used as a tool to provide some indication as to the prospects of achieving the full targets at the end of the plan period. By the same token, to better assess the progress achieved so far and predict the likelihood of fulfilling all GTP goals in the remaining plan period, data for selected economic indicators comparing actual performance during the initial two years with targets for the plan period taken from the Plan and the annual progress report have been analyzed (MoFED 2010; MoFED 2013. The details are presented as follows:
Tax to GDP ratio has been planned to be 15 percent during the GTP; actual performance has been 11.6 percent and 11.7 percent in 2010/11 and 2011/12 respectively. This suggests that actual achievement has been falling, slightly, below the target.
In fiscal year 2011/12, GDP at current market prices grew by 45.6 percent. This is said to be higher than the growth rate of GDP at current market prices registered a year earlier, which was 33.5 percent. It needs to be pointed out, however, that much of this high level of growth was induced by the inflationary pressure the country has been experiencing in recent years.
Despite a significant rise in total exports, the deficit in merchandise trade widened by 43.6 percent to USD 7.9 billion in 2011/12 from USD 5.5 billion in 2010/11. This will call for robust measures to encourage exports.
It was projected that the country would gain USD 644.2 million in revenues from industrial sector exports in 2011/12, but the actual was USD 255.4 million or about 40 percent of the target during the fiscal year, which suggests a review of the country’s industrial policies.
47 per cent of the total target for federal and regional roads have been constructed in the first two years of the GTP period, i.e. 2010/11 and 2011/12. This provides some optimism that the target can be met within the remaining three years if the momentum is maintained.
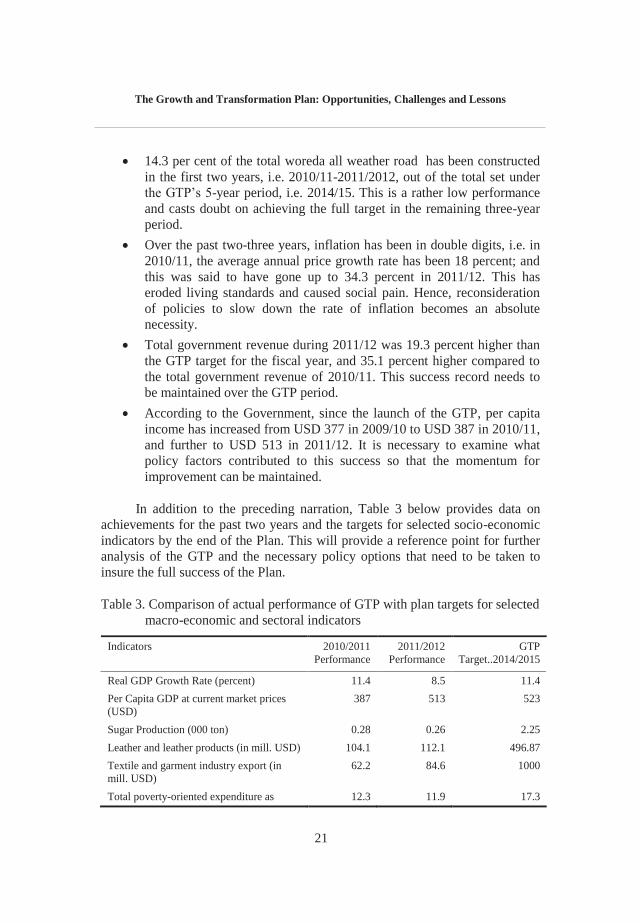
21
The Growth and Transformation Plan: Opportunities, Challenges and Lessons
19
14.3 per cent of the total woreda all weather road has been constructed in the first two years, i.e. 2010/11-2011/2012, out of the total set under the GTP’s 5-year period, i.e. 2014/15. This is a rather low performance and casts doubt on achieving the full target in the remaining three-year period.
Over the past two-three years, inflation has been in double digits, i.e. in 2010/11, the average annual price growth rate has been 18 percent; and this was said to have gone up to 34.3 percent in 2011/12. This has eroded living standards and caused social pain. Hence, reconsideration of policies to slow down the rate of inflation becomes an absolute necessity.
Total government revenue during 2011/12 was 19.3 percent higher than the GTP target for the fiscal year, and 35.1 percent higher compared to the total government revenue of 2010/11. This success record needs to be maintained over the GTP period.
According to the Government, since the launch of the GTP, per capita income has increased from USD 377 in 2009/10 to USD 387 in 2010/11, and further to USD 513 in 2011/12. It is necessary to examine what policy factors contributed to this success so that the momentum for improvement can be maintained.
In addition to the preceding narration, Table 3 below provides data on achievements for the past two years and the targets for selected socio-economic indicators by the end of the Plan. This will provide a reference point for further analysis of the GTP and the necessary policy options that need to be taken to insure the full success of the Plan.
Table 3. Comparison of actual performance of GTP with plan targets for selected macro-economic and sectoral indicators
Indicators 2010/2011 Performance
2011/2012 Performance
GTP Target..2014/2015
Real GDP Growth Rate (percent) 11.4 8.5 11.4 Per Capita GDP at current market prices (USD)
387 513 523
Sugar Production (000 ton) 0.28 0.26 2.25 Leather and leather products (in mill. USD) 104.1 112.1 496.87 Textile and garment industry export (in mill. USD)
62.2 84.6 1000
Total poverty-oriented expenditure as 12.3 11.9 17.3

22
Meheret Ayenew
20
percentage of GDP
Export of goods and non-factor services as percentage of GDP
17.0 14.0 22.5
Total poverty head count (percent) 29.6 27.6 22.2 Food poverty head count (percent) 33.5 32.7 21.2 Growth of agriculture value added (percent)
9.0 4.9 8.7
Number of PSNP beneficiaries (mills.) 7.7 7.6 1.3 Growth rate of industrial value added (percent)
15.0 13.6 23.7
Total road network (000 kms) 63.1 56.2 64.5 Potable water coverage (percent) 52.12 58.25 98.5 Primary school net enrollment ratio 85.3 85.4 100 Higher institutions intake capacity 444,553 491,181 467,444 Primary health services coverage (percent)
96 93 100
Infant mortality rate (per 1000) 59 -- 31
SOURCE: MoFED 2010
From Table 3, the following important observations can be drawn: As indicated in the report annual progress report (MoFED 2013), real
GDP growth rate has slowed down from 11.4 percent in 2010/11 to 8.5 percent in 2011/12. Since this is an important macro-economic indicator, changes observed in this respect point to growth prospects of the economy, and, equally important, the possibility of achieving the GTP targets.
A particular area of concern in the GTP’s performance is the noticeable decline in the growth of agriculture. Between 2010/2011-2011/2012, the annual average growth of the sector declined by a significant margin, i.e. from 9.0 percent to 4.9 percent. Given the reality that agriculture is a key sector of the economy contributing significantly to GDP and employment, this is a worrying sign about the possibility of achieving the growth target by the end of the Plan period.
In certain industry sectors, such as sugar production, exports of textile, garment and leather products, the rate of progress achieved over the past 3 years compared to the Plan is relatively small. Hence, this may be one area which needs corrective action by policy makers in order to ensure the successful implementation of the GTP.

23
The Growth and Transformation Plan: Opportunities, Challenges and Lessons
21
A less-than-expected performance is also observed in the export trade sector. Between 2010/11 and 2011/12, the growth of this sector declined from 17.0 percent to 14.0 percent. Given this, the projected target of 22.5 percent by the end of the GTP period looks like an unlikely possibility---a situation that calls for policy action.
A decline in the number of Productive Safety Net Program (PSNP) beneficiaries, which is one indicator of improved livelihood security, does not show much improvement by the end of 2011/2012, i.e. a decline of 100,000 over a two year period –from 7.7 million to 7.6 million. From this assessment, it is difficult to extrapolate that the number will go down to 1.3 million beneficiaries in 2014/15.
Given the rate of progress so far, some GTP targets may not be achievable at the end of the Plan period. A case in point is potable water coverage whereby it is expected to nearly double by the end of the GTP from its base year achievement of 58.25 percent in 2011/12. This seems highly unlikely given the rate of progress over the past 3 years.
Higher institutions’ student intake is an area in which there is a noticeable success in achieving GTP targets. Indeed, according to the data, this improve improvement suggests that gains scored so far will surpass projected expectations by the end of the plan period. Despite the achievements in numbers, however, the question of quality of education at the tertiary level continues to be a matter of serious policy concern.
In the education and health sectors, there has been significant progress. In particular, primary school net enrollment and reductions in infant mortality rate show notable successes. Gains in these sectors are important to the extent that they can predict the country’s ability to achieve the Millennium Development Goals (MDGs).
To sum up, the record of achievement of the GTP during the first 2-3 years is generally mixed, and in some instances exaggerated. This calls for a serious discourse on what policy options are available to guarantee the full success of the GTP in the remaining Plan period. In addition, it is also necessary to identify possible factors, both internal and external, that might have contributed to the less-than expected performance. The main intent of such an exercise is to provide inputs either for reshaping some policies or revising selected targets for the purpose of guaranteeing successful outcomes at the end. It will also help to draw lessons that can be put to good use in future national planning.

24
Meheret Ayenew
22
Challenges Slowing down of agricultural growth Agriculture is a key sector of the Ethiopian economy. It makes significant contribution to GDP, employment and is the source of livelihood for a large segment of the Ethiopian population. Over the past few years, its growth has been sluggish, and this can affect the overall national economy, including the implementation of the GTP. The slowdown may have been caused by several factors, ranging from natural factors, such as rainfall and erratic weather patterns, to government policies, such as accessibility and ownership rights related to land, supply and affordability of fertilizer inputs, etc. It is necessary to conduct a careful diagnosis of these and other policy elements for the purpose of identifying measures to increase agricultural production.
The inflation challenge Over the past two years or so, a high inflation rate has been a persistent challenge for the Ethiopian Government. Sometimes, the problem has hit double-digit levels sending shockwaves throughout the economy and causing steep price increases. It has produced severe impacts on living standards and people’s incomes. Some argue that this is primarily caused by high inflationary pressure that resulted from heavy expenditure and rising demand.
The Government has taken some measures to bring prices down, and intervened in the market by supplying essential commodities at reduced and subsidized prices. This might have eased the situation somewhat, but, the impact has been temporary as inflation is again observed to be creeping upwards. This suggests that further work is needed to bring down the price inflation and mitigate its adverse impacts on people’s living standards.
The lag in industrial development and exports According to Government data, the export and industrial sectors have not performed as planned. This should be a matter of serious policy concern because it can affect Government plans to change the structure of the economy from agriculture- and rural-based to industry and services-based. This situation calls for proactive measures to help the sectors grow through various measures, including encouraging more investment by domestic and foreign businesses, providing additional incentives, easing regulatory requirements and making the bureaucracy less burdensome to new business start ups.
The need to support the domestic private sector The GTP has enabled the state to emerge as a major player in economic growth. While this may not be an undesirable development on its own, its unintended

25
The Growth and Transformation Plan: Opportunities, Challenges and Lessons
23
consequence has been the dwarfing of the domestic private sector. There is the urgent need to reverse this situation by reviewing the current overarching policy of state monopoly and helping the private sector, which should be driven by competitive market forces, to become a more effective partner in economic growth. This can lay a strong foundation for an effective public-private partnership in economic growth.
In this connection, an important consideration is the fact that the Government must not work to replace the domestic private sector but rather focus on creating an enabling environment for the partnership, for example through supportive policies that can stimulate efficiency and competition. This will help the sector to become an engine of growth in the country. An examination of the experiences of the South-East Asian nations in building private sector-government partnerships in economic development, and the kind of policies used to enhance the contribution of the sector can help in designing approaches that fit the Ethiopian context.
Investment finance as a major hurdle in GTP implementation The GTP has set high goals but falls short on identifying sources or means of financing the many mega schemes, such as the multi-million hydroelectric dams and sugar industries as well as the many infrastructural projects that are to be attained during the Plan period. The implementation of these plans is crucial for accelerated economic growth and bringing about balanced regional development in the country. These projects are of strategic value to the national economy, and also have tremendous economic benefits, including providing employment opportunities for millions of people. Hence, their financing is of crucial importance, which the GTP has not adequately addressed.
Conclusion The GTP has placed the Ethiopian state at the forefront of economic growth. The Governemnt has made massive investments in infrastructure development, and pro-poor growth sectors, such as education and health. This has resulted in significant reductions in poverty levels and has given a sense of optimism to the promise of making Ethiopia a ‘middle-income country’ within two decades or less. Nevertheless, the achievement so far scored by the GTP should not be a reason for complacency as the country is still one of the poorest and most aid-dependent nations in the world. Despite this grim reality, however, how such an economic growth trajectory can be sustained and expedited should remain an extremely important issue for policy discourse.
A major goal of the GTP is changing the structure of the Ethiopian economy from one of agriculrure-dominated to service and industry-based

26
Meheret Ayenew
24
within the Plan period. This will certainly alter the economic landscape of the country and enable it to emerge as a major economic power in Africa. However, the constraints observed with regard to the growth of key sectors calls for caution, and, more importantly, makes it imperative to consider mid-course policy reviews in order to expedite the transformation of the national economy.
The GTP is Ethiopia’s foremost economic policy document with far-reaching implications on the economic future of the country. The Plan has been implemented within the framework of the ‘Developmental State’ model. The hallmarks of such a state is economic determinism and political authoritarianism. In other words, it gives priority to economic growth while political democracy is relegated to a secondary level. Because of this, the ‘developmental state’ is labeled as the ‘Trojan Horse’ for delaying democratic rule and participatory governance. Further, skeptics of this developmental paradigm question whether sustainable and equitable economic growth can be attained within an authoritarian political system (Sindzingre 2004).
As indicated in the tables above, while performance in terms of infrastructure, for example, federal roads, education, and health, are good, the performance of industry, which is expected to generate much needed foreign exchange, is way below expectation. This raises important questions. First, it can be observed that the GTP was an ambitious project and some of the targets set were not realistically achievable. It could be important to highlight that development planning needs to be grounded on existing reality so as not to create unattainable expectations. Second, industrial development, with the exception of the sugar and engineering sectors, is left to the private sector. In particular, leather and textiles, which are supposed to bring much of the expected foreign earnings, are left to the private sector. But at the same time the private sector is also being reduced or discriminated against by the government. This policy inconsistency is undesirable for the country’s economic transformation, and must be addressed by the government.
The private sector is under excessive pressure to tow the government policy line. For example, there are many reports that indicate that the proportion of loans given to the private sector is declining with preference given to the public sector (IMF 2006; IMF 2010). Private banks are forced to buy government bonds. At the same time, government banks give loans to government mega projects like housing without making a cost/benefit analysis. All this points to the need by the government to accept the role of different sectors ---private, civil society and others in the transformation of the economy.
The other major point that came out of this study is the need to marry democratic governance and economic development within the Ethiopian context. It is all the more important that Ethiopia, as a very diverse nation, should

27
The Growth and Transformation Plan: Opportunities, Challenges and Lessons
25
promote participatory and all-inclusive governance for economic development to be sustainable and broad-based. An authoritarian political culture may pay dividends in the short-term, but its long-term consequences, including the risks of instability and a volatile political culture, may be more costly.
Skeptics argue that the GTP is too big to be attained; it is broad and lacks specifics, particularly on financing and investment needed for big schemes that require heavy resource and technological inputs (IMF 2006). What is missing is a careful assessment of potential funding and investment sources for the purpose of generating enough capital and finance for the fulfillment of the Plan. Other policy gaps are also cited. For example, it is argued that although the Plan gives tacit recognition to the potential contribution of the private sector in national economic development, it does not provide specific policy directions or strong incentives to facilitate its involvement. The constant complaint by the sector that the Government extends special privileges to state monopolies and party owned companies at the cost of privately-owned businesses lends credence to this observation.
With regard to the achievements of the GTP, it can be concluded that the result has been mixed, and the veracity of some government statistics indicating achievement is questioned. In addition, given the short life span that the Plan has passed through, it is difficult to predict whether the present growth rate can be sustained over a long period of time. Hence, it is difficult to generalize or draw any specific conclusions. On the whole, there are areas in which significant progress has been made (e.g. poverty reduction, education, health, etc.) in terms of meeting targets while there are aso concerns in certain key sectors, such as agricultural growth and industrial development, as these may require more time and resources.
28
Meheret Ayenew
26
References Aalen, Lovise and Asnake Kefale 2012. The developmental state in federal
Ethiopia: Undermining regional autonomy and feeding conflict? Paper prepared for presentation at the 18th International Conference of Ethiopian Studies, Dire Dawa, Ethiopia. .
Amhara National Regional State (ANRS) 2003-2007 Eth. Calendar. Growth and Transformation Plan (GTP) of the Amhara regional state, Bureau of Finance and Economic Development(BoFED). Bahir Dar
Amdissa Teshome 2006. Agriculture, Growth and Poverty Reduction in Ethiopia: Policy Processes Around the New PRSP (PASDEP). Future Agricultures, University of Sussex. Brigton BNI 9RE England
Asnake Kefale 2011. Narratives of Developmentalism and Development in Ethiopia: Some Preliminary Explorations, Narratives of Development And Developmentalism in Ethiopia: Some Observations,” Paper presented at the Fourth European Conference on African Studies, Uppsala, Sweden.
Bijlmakers, L. 2003. Process and Impact of the PRSP in Ethiopia: A case study. Commissioned by Wemos Foundation. Amsterdam. Netherlands.
Chang, ha-Joon 1999. The Economic Theory of the Developmental State. In Meredith Woo-Cummings (ed), The Developmental State. Ithaca: NY: Cornell University Press.
Chary, Seatnus 1989. Structural Adjustment in Africa, Development Review, 1989.
Evans, Peter B. Rueschemeyer, D.; Skocpol, Theda, eds. 1985. Bringing the State Back. Cambridge University Press.
Geul, Geert 2013. Statement Delivered on Consultation of the Annual Progress Report of the GTP. Addis Ababa
Ghelawdewos Araia 2013. Reflections on ‘African Development: Dead Ends and New Beginnings. Institute of Development and Eduction for Africa, Inc.
Global Finance. 2011a. Egypt , GDP Data & Country Report. ______2011b. Nigeria, GDP Data & Country Report. Ihonvere, Julius O. 1991.
Economic Crisis in Sub-Saharan Africa: Issues, Responses and Prospects for Recovery, Pakistan Horizon, vol. 44, no. 4 Pakistan Institute of International Affairs.
IMF 2006. Joint Staff Advisory Note (JSAN). Country Report No. 06/28 ____ 2010. Ethiopia – Joint staff advisory note on Growth and Transformation
Plan (GTP), 2010/11-2014/15.

The Growth and Transformation Plan: Opportunities, Challenges and Lessons
27
Johnson, Chalmers 1982. MITI and the Japanese Miracle, Stanford, CA: Stanford Univeristy Press
Kohli, Atul 2004. State-Directed Development. Cambridge University Press. ird, Siobhan E 1997. ., Rolling Back the African State: Implications for Social Development in Ghana, Social Policy and Administration, Vol. 41, Issue 5.
Meles Zenawi n.d. African Development: Dead Ends and New Beginnings. Unpublished Masters Dissertation, n.d. Erasmus University. Rotterdam, the Netherlands.
Mkandawire, Thandika 2001. Thinking about Developmental States in Africa. Cambridge Journal of Economics, 25(3).
Meyns, Peter and Musamba, Charity, eds. 2010. The Developmental State in Africa: Problems and Prospects. Institute for Development and Peace, Duisburg Essen University. INEF Report 101.
Ministry of Finance and Economic Development (MoFED) 2002. Ethiopia: Sustainable Development and Poverty Reduction Program (SDPRP), Addis ababa.
_____2005/06. Plan for Accelerated and Sustained Development to End Poverty (PASDEP). Addis Ababa. _____2010. Growth and Transformation Plan (GTP) 2010/11-2014/15 (Draft). Addis Ababa. _____2013. Annual Progress Report (APR) for F.Y. 2011/12 Growth and
Transformation Plan, Addis Ababa. Noland, Marcus 2005. From Player to Referee? The State and the South
Korean Economy. Institute for International Economics, Massachusetts Avenue, Washington, DC. .
Rose, Tony, ed. 1985. Crisis and Recovery in Sub-Saharan Africa, Paris, OECD. Sindzingre, Alice N. 2004. Bringing the Developmental State back in: ontrasting
Development Trajectories in sub-Saharan Africa and East Asia. George Washington University, Washington, D.C.
Slater, Dan and Wong, Joseph 2012. Conceding and Thriving: Strong-State Democratization in Asia, Comparative Democratization (American Political Science Association), Vol. 10, No. 2:3
Slater, Dan 2012. Strong-State Democratization in Malaysia and Singapore. Journal of Democracy 23:2.
Song, Byung-Nak 2003. The Rise of the Korean Economy (3rd ed.). New York: Oxford University Press.
Sufian Ahmed Guenbot 2013. Budget Speech to the House of Representatives.
29

30
Meheret Ayenew
28
Reporter, Hamle 10, 2005 E.C. Interview with Ato Mohammed Nursanin, Board Chairman of the National Association of Ethiopian Industries, Addis Ababa.
Tigray Regional National State (TRNS) 2003 Eth.calendar. Five Years (2010/11-2014/15) Growth and Transformation Plan. Bureau of Plan and Finance. Makalle
UNDP 1999. Definitions and Elements of Good Governance. UNDP 2011. Human Development Report 2011/12. Vu, Tuong 2007. State Formation and the Origins of Developmental states in
South Korea and Indonesia, Studies in Comparative International Development, 2007, Vol. 41.
World Bank 1981. Accelerated Development in Sub-Saharan Africa: An Agenda for Action, Washington, D.C.
World Bank 2013. Ethiopia Economic Update. Washington D.C., June 18
31
2 Alemayehu Geda and Addis Yimer
Growth, Poverty and Inequality, 2000-2013A Macroeconomic Appraisal
Introduction
Official government reports on growth, poverty and inequality show thatEthiopia has registered a two-digit rate of growth in the last decade and hasmade immense progress in poverty reduction. In terms of poverty, the officialreports indicate that the head count ratio of poverty (the percent of populationbelow the poverty line) has declined from 45 percent in 1994/95 to 30 percent in2010/11. If we base our analysis on this data, this is an impressive record.However, a cursory look at people’s livelihoods across the country (includingAddis Ababa) reveals that things are not as rosy as it is made out in the officialreports and that many are unable to sustain themselves, especially following therampant inflation that began in2005. This observation is in line with the findingsof the multidimensional poverty measure discussed later in this chapter.Notwithstanding this, however, there is no scientific or independent basis tosubstantiate or challenge the official claim. Thus, the task of an independentobserver is daunting. The best he/she can do is to critically examine the evidencein the light of empirical observations and alternative measures of poverty, andcome up with the most likely state of growth, poverty and inequality in thecountry. In this chapter we will attempt to do that.
The political economy of growth, poverty and inequality is a sensitive anddifficult subject in today’s Ethiopia, partly because of the lack of accurateinformation and the uncertainty surrounding initiating dialogue on the subject.Notwithstanding this, in this work, we will attempt to do the following. First, inthe face of conflicting information and data unreliability regarding the country’sgrowth and development, it is imperative to make an educated guess of what isthe most likely state of growth in the last decade. This is done in the nextsection. In the remaining sections we shall examine the nature of poverty, theimplications of the reported growth on poverty and inequality, and finally, byway of conclusion, how growth, poverty and inequality are generally evolvingand are related to the politics of the country.

Alemayehu Geda and Addis Yimer
32
The nature of rapid economic growth in the last decade and halfWe begin the appraisal by briefly highlighting positive developments that thegovernment has brought about in the last decade and half (see Alemayehu 2013for details). In this period, using the official data, Ethiopia saw one of the besteconomic performances since the early 1990s (see Table 1). The growth of theeconomy was quite impressive with an average growth rate of about 9 percentper annum since 2000. If the abnormal first three years are left out and thegrowth rate is computed from the year 2003, the average annual growth rate willbe about 11 percent for consecutive 9 years. Except for the last five years whereinflation, owing to lack of prudent monetary and fiscal policy, was a majorproblem (see Alemayehu and Kibrom 2008), the macroeconomic performancewas very good too (Table 1). Given the dependence of growth on rain-fedagriculture as well as low level of domestic resource mobilization (includingshortage of foreign exchange), the sustainability of this growth is questionable,however.In general, grow this central for poverty reduction, and macroeconomicstability is a necessary condition for growth. Since 2005, however, althoughgrowth remained strong, macroeconomic management had its fair share ofproblems resulting in higher inflation, and problems with the balance ofpayments.

Growth, Poverty and Inequality, 2000-2013 A Macroeconomic Appraisal
33
Table 1. Some indicators of the macroeconomic environment
Sector/Indicator 2000/01
2001/02
2002/03
2003/04
2004/05
2005/06
2006/07
2007/08
2008/09
2009/10
2010/
11
Real GDPGrowth Rate(%)*
7.4 1.6 -2.1 11.7 12.6 11.5 11.8 11.2 9.9 10.4 11.5
Inflation (CPI,% Change)**
(0.3) (10.6) 10.9 7.3 6.1 10.6 15.8 25.3 36.4 2.8 18.1
Resere (Monthof Imports)
2.5 2.0 2.2 1.1 2.4 2.5 2.4 2.8
Gross DomesticSaving (%GDP)
10.0 6.0 4.0 11.9 5.9 4.6 8.7 5.2 6.4 5.2 8.8
Gross DomesticInvestment ( %of GDP)
21.5 24.1 22.2 26.5 23.8 25.2 22.1 22.4 22.7 24.7 25.5
Overall BudgetDeficitexcludinggrants (%GDP)
(8.2) (10.9) (12.8) (7.6) (8.7) (7.5) (8) (6.9) (3.6) (4.6) (4.8)
Overall BudgetDeficitincluding grants( % GDP)
(4.4) (7.2) 6.6 (3) (4.4) (4.6) (3.6) (2.9) (2.3) (1.3) (1.6)
Balance ofPaymts(%GDP)
0.4 3.6 3.5 1.4 -0.8 -1.1 0.6 -1.0 1.7 0.9 4.5
SOURCE: MOFED (2012) and NBE (2012).*See Table 2 for a more accurate picture
.** For the years 2007/08 and 2008/09 CSA data for inflation is 18.4 and 40.6 %respectively.
On the positive side and on the social front, there is an encouraging sign ofdeclining absolute poverty as well as impressive record on education, healthprovision (notwithstanding the quality), power development as well as roadconstruction. Generally, infrastructure development in the last decade has beenquite encouraging. The government has invested both in physical and human(albeit of low quality) capital formation. The share of total spending on poverty-targeted sectors (both recurrent and capital) increased from about 42 percent oftotal expenditure in 2002/03 to over 66 percent in 2009/10. This steady increasein spending on poverty-oriented sectors as well as the on-going Federal foodsecurity program was also important in ensuring food security for an extremelyvulnerable section of the society (see Alemayehu 2013 for details on thesepositive developments).In sum, there are a number of positive developments thatwill help the current growth to persist well into the future. Notwithstanding these

Alemayehu Geda and Addis Yimer
34
developments, the change in overall welfare or growth so far has not beensufficient enough to lead to a significant decline in poverty. This is partly relatedto a rise in income inequality during this period. It is also related to lack ofstructural transformation in the economy. Moreover, the growth figures may notbe as high as officially reported. This underscores the need to look at the linkbetween economic growth, inequality, and poverty reduction in the country.
The growth record given above is the highest not only in the long history ofEthiopia but also is the highest even by world standards. In contrast to thisdouble digit growth for nearly a decade, the country is still one of the poorest inthe world. Apart from casual observation of the pervasive poverty in the country,international data sources such as the recent(2013) human development index ofthe UNDP and the multidimensional measures of poverty noted belowcorroborate this observation (see below). In addition, International FinancialInstitutions (IFIs), such as the World Bank and IMF have reported a significantdiscrepancy with the growth figures of the government (Tables 1and 2). Thisobviously leads to doubts regarding both the official growth figures as well asthe related official measure of income poverty.
Checking the consistency and scientific accuracy of the National Accounts (NA)of a country is quite demanding. In addition, access to detailed data and how it isgenerated is usually difficult for an independent researcher. The lesson fromprevious studies about Ethiopian data (see Alemayehu 1996, 1998) is to beextremely cautious about growth figures since the estimates are made on oldbenchmark surveys and do not obey the national accounting consistency rule.The recent IMF report (2012), we believe, corroborates this observation. In theface of such problems, we can resort to a simple test to gauge the accuracy of thereported figures of the last decade. If the NA is consistent then one would expectdata from different institutions (such as NBE and MOFED) to be consistent andadd-up. For instance, one can check whether the “net factor payment and currenttransfer”, as computed by the National Bank of Ethiopia (NBE) in its balance ofpayments report, is equal to the same figure that is obtained as the differencebetween national and domestic savings from the national accounts of theMinistry of Finance and Economic Development (MOFED). This figure, aspercentage of GDP for the last decade is given in Table 2. As can be seen fromthe Table, there is a significant difference between the two, except for 2005/06 to2007/08. This shows the existence of a consistency problem, even withoutinvestigating in detail the accuracy and hence the politics of the actualgeneration of the figures.
Moreover, Table 2 also shows a big gap between the IMF growth forecast andthe official government growth figures. Although the IFIs, such as the IMF,
Growth, Poverty and Inequality, 2000-2013 A Macroeconomic Appraisal
35
base their growth figures on data provided by the government, one observes asignificant discrepancy between the two regarding growth forecasts. This mightbe related to the fact that the IMF forecast is most likely prepared by its ownexperts using models such as MULTI MoD1 while it is formally expected to usethe actual figures offered by the government. The politics of growth and relatedstatistics in Africa should not be a surprise. Jerven, in his recent book on thesubject (2013), for instance, notes that this game of numbers is becomingdangerously misleading and critical decisions are made on them. He states thatany ranking of African countries using GDP figures is misleading. He maintainsthat such GDP/national income data is the result of pragmatic decision statisticaloffices that are subject to paucity of data, shortage of financial resources and topolitical pressure. Ethiopia is no different in this respect.
Another angle to examine the accuracy of the growth data is to make aneducated guess of what the potential growth rate of the country is. This can bedone either using growth accounting, as has been done in Alemayehu (2008) andIMF (2012), discussed below, or by estimating the potential using the experienceof fast-growing countries both in Africa and East Asia. After an exhaustiveexamination of the economic history and experience of these countries,Alemayehu et al (2004) have estimated that the potential maximum growth ratein Ethiopia is between 5 to 8 percent per annum – Ethiopia’s official figure isabout 50 percent higher.
We can also further check the arithmetic consistency of the growth figures usingwhat is called the “doubling rule” or the “rule of 72/70”. In finance, the rule of72 is a method for estimating an investment’s doubling time. The number (e.g.72) is divided by the interest rate per period to obtain the approximate number ofperiods (usually years) required for doubling. There are a number of variations tothe rules that improve accuracy2.To apply this simple method, we took thegovernment’s GDP growth figure of11 percent per annum for the years 2002/03-
1 My effort to find how the IMF does these forecasts was a failure. What I have noted here is myeducated guess based on my earlier work on such global macro econometric models. IMFgenerally use an array of country, regional as well as international experts as well as global macroeconometric models such its own Multicounty Econometric Model called MULTIMOD2 . For periodic compounding, the exact doubling time for an interest rate of r per period is
,Where Tis the number of periods/years required. The formula above can be used for calculatingthe doubling time. If we want to know the tripling time, for example, we need to replace theconstant 2 in the numerator with 3. As another example, if you want to know the number ofperiods it takes for the initial value to rise by 50%, replace the constant 2 with 1.5 etc

Alemayehu Geda and Addis Yimer
36
2010/11. In the same period, agriculture, industry and the service sectors alsogrew by 10.2, 10.8 and 12.9 percent, respectively. This implies that it takes only6.3 years for the doubling of the GDP. The doubling of agricultural outputshould take about 7.2 years, while the industrial and service sectors shoulddouble in 6.6 and 5.6 years, respectively. An examination of the data after theseyears however shows that the GDP figure is less than double, and, on average, is80 percent of the estimated amount using the formula. This exercise shows that,first there is some kind of inconsistency in the data, and second that the actualgrowth rate must be lower than the reported one. With this in mind, we cancompute the growth rate backward to arrive at the rate consistent with thedoubling rule. This gives a growth rate of about 8.8 percent as the maximum.
Table 2. Which one is the right growth rate of Ethiopia?
Year Gov’tGrowth Rate
IMFGrowth
[Forecast]
IMFGrowth
[Actual]
WorldBank
Growth
Actual
NFPCT, BOPbased % GDP
[NAcctbased%GDP] *
What is the MostLikely Growth
Rate
2000/01 7.4 7.4 7.4 ~ 8.8% per annumusing the doubling
rule2001/02 1.6 1.6 1.6
2002/03 -2.1 -3.5 -2.1
2003/04 11.7 11.9 11.7 12.8 [4.1]
2004/05 12.6 7.3 10.5 12.6 14.1 [11.1] About 5 to 6% perannum in the lastdecade using thesource of growth
Analysis.
About 7 to 8%using the IMF
forecast
2005/06 11.5 5.3 9.65 11.5 13.1 [13.4]
2006/07 11.8 5.7 11.5 11.8 15.1 [15.3]
2007/08 11.2 8.4 11.2 11.2 13.9 [13.8]
2008/09 9.9 6.5 9.9 10.0 08.8 [13.2]
2009/10 10.4 6.5 8.0 8.0 06.9 [15.7]
2010/11 11.5 7.5 7.5 7.5 12.6 [15.8]
Average 11.3 6.7 7.8 10.5 Between 5 & 8.8%
2012 Forecast
5.0 7.0
2013 Forecast
6.5 ----
SOURCE: IMF, World Economic Outlook, various year; & Ethiopia Country Report; MOFED(2012); NBE (2012); WB (2012)
NOTE. *NFPCT: Net Factor Payment and Current transfer (NFPCT) according to the Balance ofPayment of the NBE and values in the square bracket [ ] are from the National Accountsof the MOFED.

Growth, Poverty and Inequality, 2000-2013 A Macroeconomic Appraisal
37
A final method for questioning the official growth figure is to examine thesource of this growth and compare that with the stylized facts in the country.This could be complemented by an examination of the status of structural changein this growth process. Table 3 contains such information. A source of growthanalysis can be done by fitting a growth model to the time series data of thecountry, and this has been done in Alemayehu and Befekadu (2005), Alemayehu(2008) and IMF(2012). Table 3 shows the growth accounting exercise forEthiopia in the last decade. A surprising finding of recent similar growthaccounting study by IMF (2012)as well as our analysis shown in Table 3 belowis that the main source of growth in Ethiopia in the last decade is factorproductivity (which is about 5 to 7 percent and hence contributed more than 50percent to the average official growth of 11percent). This is followed by thecontribution of capital (about 30 percent) and labour (about 23 percent). Thesignificance of total factor productivity (TFP) as a major source of growth in thelast decade compared to its negligible and at times negative contribution adecade before that (see Alemayehu 2008 and Table 3 below) shows that theofficial GDP growth figure has a problem. This is because the country has notmade any meaningful technological and structural transformation in its methodsof production, especially in the agricultural sector, in the last decade to bringabout such unprecedented growth in factor productivity. We have also to notethat TFP is computed as a residual. In fact the jump in TFP from negativerecorded in 2002/03 to significant positive in 2003/04 (an unprecedented jump of14 percentage points) shows the unrealistic nature of the growth figure officiallyreported. In addition, the fact that TFP world-wide has not grown more than 1.6percent in OECD countries (0.5–1.6 percent in East Asia and 1.4–4.6 percent inChina in 1984–94 when it was growing very fast, as reported in IMF, 2012)shows the unreliability of the Ethiopian TFP growth rate. Alemayehu (2008) hasargued that TFP in Ethiopia’s conditions is dependent more on the vagaries ofnature than technology and has been swinging between negative and positivevalues. It has, historically, also remained below 1.5 percent in the best of thecircumstances.

Alemayehu Geda and Addis Yimer
38
Table3. A growth accounting exercise for Ethiopia (2000-2010)
Year GDPGrowth
TheContribution
of Capital
The Contributionof Labour
The Contribution ofTotal Factor Productivity
(TFP)
2000/2001 7.4 0.6 2.6 4.2
2001/2002 1.6 0.8 2.7 -1.9
2002/2003 -2.1 1.0 2.6 -5.7
2003/2004 11.7 0.7 2.7 8.3
2004/2005 12.6 1.2 2.6 8.8
2005/2006 11.5 1.1 2.7 7.7
2006/2007 11.8 1.5 2.2 8.1
2007/2008 11.2 2.1 2.2 6.9
2008/2009 9.9 1.8 2.3 5.9
2009/2010 10.4 2.7 2.2 5.5
Average(2003/04-2009/10)
11.3 1.6 2.4 7.3
NOTE: The growth accounting is based on the result of econometric estimation reported inAlemayehu and Befekadu (2005) and Alemayehu et al (2008). Using various models(both macro and micro) these studies have come up with the capital share coefficient (β)that ranges from0.28 to 0.36. We have used 0.30. The capital stock is generated using theperpetual method.
A supporting evidence for doubting the official figure can also be gathered fromthe marked absence of structural transformation in the economy whereagriculture still contributes nearly 50 percent of the GDP and the share of theindustrial sector is hardly changed in the last three decade – being about 10% ofGDP. One should not expect a significant growth in TFP when the industrialsector is stagnant. A detail national accounts data (see Alemayehu 2013 fordetail) further shows that the service sector, followed by the agricultural sector,are the main drivers of growth in the last decade.
In sum, the source of growth analysis suggests that the GDP growth figure islikely to be exaggerated as it can only be realized through technological/efficiency improvements and not in the context of stagnant industry and thestylized fact of Ethiopia’s dependence on rain-feed agriculture and backward ox-plough cultivation. If the contribution of the total factor productivity is limited toits historic value of about 1 to 1.5 percent, or less as argued in Alemayehu(2008), the actual GDP growth will be about 5 to 6 percent per annum. In fact,Derconet al (2009) have documented, focusing on agriculture, the lack of arobust source of growth in Ethiopia and hence the possibility that theexaggerated growth figure might be a statistical artifact. In their excellent study,they note that according to government data, cereal output has doubled in the last

Growth, Poverty and Inequality, 2000-2013 A Macroeconomic Appraisal
39
ten years (writing in 2009), land cultivated with cereals has increased by 44percent and yield by 40 percent. They further note that in the year 2004 to 2009,government data show 12 percent increase in cereal production per year, yieldgrowth of 6 percent per year and area growth of 55 percent per year. However,the authors’ point out, the same data source shows no evidence of intensificationof agriculture such as increase in fertilizer use, irrigation or significant extensionprogram expansion. From this they sarcastically conclude, “Ethiopian yieldshave grown faster than recorded elsewhere, even compared to the greenrevolution in India, China or Vietnam. If the data are correct, this is the fastestgreen revolution in history, and its mechanism should be analyzed…lessonslearned, as they would be immensely important for other part of the country andbeyond”. They also caution that if the data are not correct it would suggest thatfood production is considerably lower than reported which has significantimplications for policy, specially about the poor (Dercon et al, 2009).
In sum, in view of the critical analysis presented above regarding theinconsistency of the national account data and the big gap between officialgrowth forecasts and those by IMF and others, we argue that the likely growthrate may range between 5 to 8 percent. It has to be noted, however, that even agrowth rate of about 5 percent is one of the best in the continent and there is noneed to resort to an exaggerated growth performance. Be that as it may, in future,we believe there is a need for data generating institutions such as the CentralStatistical Agency (CSA), MOFED and NBE to be independent and transparent.There is also a need for a proper peer review process of research methods andoutcomes from these institutions. In addition, the depoliticization of statistics, aswell as the development of detailed macro models of forecasting by differentresearch and academic institutions is necessary. Finally, whatever the level,growth has been accompanied by rising inequality, especially in urban areas withdetrimental impact on poverty reduction. These issues are discussed in the rest ofthe chapter.
The nature of poverty in the period 1995-2013The nature and extent of (income) povertyTable 4 shows the trend in poverty in Ethiopia in the last decade. It is based ondetailed household level data collected both by the government and theDepartment of Economics of Addis Ababa University in collaboration withvarious partners (University of Oxford, Gothenburg University andIFPRI).Thegovernment’s official income poverty level in 2010/11 is computedbased on a poverty line of Birr 3,781 per year per adult equivalent. This is adaily equivalent of Birr 10.50 per adult equivalent (about 0.50 United States

Alemayehu Geda and Addis Yimer
40
dollar, USD) (The food poverty line is Birr 5.4 (0.27 USD)). Given the gallopinginflation in the country since 2005, this is an extremely small amount of moneyto live on, even by Ethiopian standards.Notwithstanding this, using the officialincome based measure (head count ratio, called P0 index), the latest informationshows that in 2010/11, 30 percent of Ethiopians (about 27 million people) werepoor -a significant fall from 2004/5 when the figure was 38.7 percent. Poverty isslightly higher in rural (30 percent) than urban areas (26.1 percent). Over thesame period, the poverty gap index (called P1
3 index) fell from 8.3 percent in2004/5 to 7.8 percent in 2010/11, indicating a reduction in the intensity ofpoverty. The poverty gap index may be interpreted as the average cost per capitaof eradicating poverty as a percentage of the poverty line. The poverty indextherefore implies that, to eliminate poverty, the government of Ethiopia wouldneed to invest 7.8 percent of the poverty line per capita. Despite the reduction inheadcount poverty and the poverty gap, there has been an increase in the severityof poverty, as measured by the increase in the poverty gap squared (called P2
index)4 from 2.7 percent in 2004/5 to 3.1 percent in 2010/11. This means thatthe poorest people were worse off in 2010/11 than they were in 2004/5. Thisalso implies that the poorest are vulnerable to further poverty if povertyeradication resources and programmes do not specifically target and reach them.
Table 4.Indicators of poverty (1995-2010/11). National and Dept. Economics ofAAU data
Year CSA, Nationally RepresentativeData
Dept. of Economics (AAU) PanelBased Data
National Urban Rural AddisAbaba
National Urban Rural
1994 46 33 48
1995 39 32 40
1995/96 (Headcount)
Poverty gapindex
Poverty severityindex
0.45
0.120
0.051
0.33
0.099
0.041
0.47
0.134
0.053
0.30
3 The ‘poverty gap’ refers to how far, on the average, households are from the poverty line.4 The ‘poverty gap squared’, a measure of the severity of poverty, takes into account, in additionto the poverty gap, inequality among poor people by implicitly giving more weight for bigger thansmaller gaps in the process of squaring the gap index.

Growth, Poverty and Inequality, 2000-2013 A Macroeconomic Appraisal
41
1997 29 27 27
1999/00 (Headcount ratio)
Poverty gapindex
Poverty severityindex
0.44
0.119
0.045
0.37
0.101
0.039
0.45
0.122
0.046
0.36
2000 41 39 41
2004/05 (Headcount ratio)
Poverty gapindex
Poverty severityindex
0.39
0.083
0.027
0.35
0.077
0.026
0.39
0.085
0.027
0.33 33 37 32
2010/11 (Headcount ratio)
Poverty gapindex
Poverty severityindex
0.296
0.078
0.0310
0.26
0.069
0.027
0.30
0.08
0.032
0.28 NA NA NA
SOURCE: MOFED, 2012
Notwithstanding the official rosy picture about poverty reduction noted thus far,the pervasiveness and enormity of the poverty level in the country is obvious.The calculations of the national poverty line are based, as has been noted above,on Birr 10.75 per adult per day which is half the commonly used rate of one USdollar (USD) a day.Thus, assuming, optimistically, that the registered incomegrowth is fairly equally distributed (see below, however), and that a rate of oneUSD (or 20 Birr) a day is used instead, those below the poverty line will beabout 60 percent of the population5. Doubling the government’s nominal povertyline of USD 0.50 (or Birr 10.75) shows that it is equivalent to about 2.50 USD atpurchasing power parity (PPP). Using this rate, the World Bank has computedthe level of poverty to be 71.4 percent (see Figure 1 below).This simple exercisesuggests the need to question the official poverty (and inequality) indicators aswe have done of the growth figures of the last decade in the section above, with
5 This seems to contradict the World Bank’s (2012) similar computation. However, the WorldBank computation is based on PPP. With that it found the headcount poverty to be the same30% at PPP US$1.25. This apparently conflicting indicators emerged because the government’spoverty line of US$0.50 is equal to the World Bank’s level of PPP $1.25 which is computed atPPP price (See Figure 1 and Table 5 )

Alemayehu Geda and Addis Yimer
42
the aim of coming up with the most probable state of poverty in the country.Table 5 shows the result of such an attempt. The Table basically compares theofficial (income) poverty figures with that of the international poverty line. Italso shows the likely level of (income) poverty in the country which takes onboard the most probable growth rate of the country as discussed above as well asthe effect of inequality on poverty reduction. This is given in column 5 of theTable (explained in detail below). Note in passing that this figure would havebeen much higher if it were not based on the official level of the poverty line atthe initial years of the projection.
Table 5. What are the actual and most probable levels of poverty and inequality?
Year Gov’t Figures
(Nominal
$0.50/day)
Using Nominal$1.25/day
(Comparable to the
Gov’t Figure givento the left/column 2)
Using USD 1.25 aday
(In PPP terms)
**Using The LikelyGrowth Rate Figure
(Base on OfficialPoverty data but scaled
down GDP growth &rising inequality)
1995/96 45.5 60.52 [1995]
1999/00 44.2 55.58 [2000]
2004/05 38.7 >77.4 [2004/05]* 38.96 [2005] 39.1 [47]
2010/11 29.6 71.4 [2011] 30.65 [2011] 34.5 [42]
*NOTE: the poverty line had been Birr 1075 per adult per annum (& Exchange rate of $1=9). Weassumed it is at best half a dollar per day.** Is based on projection (see Figure 3) and thevalue in bracket [ ] is if the average gap b/n the panel and official data is taken on board.
SOURCE: MOFED, 2012 and World Bank 2012 and Authors’ estimation
Following the availability of the household and panel data since 1995, a numberof analytical poverty studies have been conducted in the country. These werepreceded by the pioneer quantitative study of the late Mekonnen Tadesse, whowas instrumental in producing systemic poverty data at the Department ofEconomics of Addis Ababa University (AAU data henceforth)6. Mekonnen(1996) examined urban poverty in Ethiopia using the 1994 AAU UrbanHouseholds Survey (AAU-EUHS). His analysis focused on food poverty,recognizing that in Ethiopia, access to basic food is a major factor of householdwelfare. The study confirmed that Ethiopia indeed suffers from extreme food
6 To my knowledge the only exception as the first quantitative, household based, poverty analysisin Ethiopia is that of Alemayehu (1993).

Growth, Poverty and Inequality, 2000-2013 A Macroeconomic Appraisal
43
poverty. In addition, using the 1994, 1995 and 1997 rounds of AAU data,Mekonnen (1999) analyzed the dynamics and determinants of urban poverty inthe country. Using poverty lines estimated by the Cost of Basics Needs (CBN)approach and consumption per adult equivalent7 as a measure of welfare, heindicated an increase in poverty between 1994 and 1995 and then a decline from1995 to 1997.Following this, Bevan and Joireman (1997) adopted a sociologicalapproach to the measurement of poverty, focusing on the meaning and use ofdifferent measurements. They argued that in rural Ethiopia non-economic formsof capital, such as social and human capital, are very important in determininglife chances. They further argued that entitlement norms which include suchthings as right of access to productive resources, political voice, right to leisure,inheritance rules and access to community support are crucial in determininghousehold poverty (Bevan and Joireman1997). Such an approach to povertyanalysis has been employed earlier by Dessalegn (1992) and Solomon (1995).
Dercon and Krishnan (1998) assessed changes in poverty between 1989 and1995 and tested the robustness of measured changes to the problems of choice ofpoverty lines and the impact of uncertainty in measured inflation rates. Theyfound that, poverty declined between 1989 and 1994 but remained virtuallyunchanged between 1994 and 1995.Moreover,households with substantialhuman and physical capital and better access to roads and towns have both lowerpoverty levels and are more likely to get better off over time. In addition, theyalso observed that human capital building and access to roads and towns reducethe fluctuations in poverty across seasons. The next study that sought to examinewhat happened to poverty was that of Dercon and Mekonnen (1999) whichmade a comparison between rural and urban poverty using the 1994 rounds ofthe AAU Rural and Urban Households Survey (AAU-ERHS) and AAU-EUHSdata.
Dercon and Mekonnen derived different poverty lines to overcome potentialproblems that could arise due to differences in household needs, prices and tastesacross rural and urban areas. Thus, poverty lines were defined using fourdifferent food baskets; one national, one each for cereal and enset growingregions, and one for urban areas. The authors’ findings show that urban povertyis much higher than rural poverty when region-specific food baskets, as opposedto a single national basket, are used. This finding is consistent with thehypothesis that expensive sources of calories are consumed in urban areas. Enset
7 A consumption basket that would meet a minimum energy requirement of 2200kcal of energyper adult per day was constructed and its cost calculated at region specific prices to obtain thefood poverty line.

Alemayehu Geda and Addis Yimer
44
growing rural regions were found to be much poorer when a single basket wasused, confirming the role of enset as a low-cost calorie source. Nevertheless, thedifference in poverty between urban and rural areas was found to be small onaverage (Dercon and Mekonnen1999).
Abbi (2000) focused on 900 households in Addis-Ababa, using the 1994 AAU-EUHS, and adopted the poverty lines developed by Mekonnen (1997) to analyzethe determinants of poverty in Addis-Ababa. He found that labour marketparticipation and education were the most significant determinants of poverty inthe capital city. Similar findings about the role of the labour market andeducation are also reported in Alemayehu and Alem (2006) that used the sameAAU urban data and a micro simulation approach.
The study of poverty in Ethiopia in the 1990s has continued into the turn of thecentury virtually with similar findings. This time, however, the focus of thestudies was to link poverty with growth and inequality. The studies also began tosearch for determinants of poverty. Dercon (2001 & 2006), using the thenemerging AAU micro level panel data from villages in rural Ethiopia, analysedthe determinants of growth and changes in poverty during the initial phase of theEPRDF economic reform (1989-1995) using a standard decomposition ofincome and poverty changes. He found that, overall, consumption grew andpoverty fell substantially during the period considered and that on average poorhouseholds benefited more from the reforms than non-poor households, thoughthe reforms did not benefit similarly all the poor. In addition, heidentifiedrelative price changes affecting returns on labour, land, human capital andlocation, as the main driving factors in income levels (Dercon, 2001 and2006).Alemayehu and Alem (2006) did a similar study by examining the impactof the 1992 reform on poverty and inequality in urban Ethiopia. They, however,used a data-exploration and micro-simulation approach. Their finding contradictsthe findings of Dercon (2001; 2006) in rural areas, however. Alemayehu andAlem found that following the 1992 reform aggregate indicators of poverty andinequality remained unchanged. This unchanged state, despite fundamentalchanges in macroeconomic policy, is because aggregate changes hide enormouschanges across income categories which in turn are dependent on structure ofreturns to labour, distribution of income and occupational choices thathouseholds make.
A report on the state of poverty at the beginning of the 21st century was preparedby the government on the basis of the 1999/2000 Household Income andConsumption Expenditure (HICE) and Welfare Monitoring Surveys (WMS).The conclusion reached is that the incidence of poverty is higher in rural than in

Growth, Poverty and Inequality, 2000-2013 A Macroeconomic Appraisal
45
urban areas with a poverty head count ratio of 45.4 and 36.9percent, respectively(MOFED, 2002). The same report also noted that compared to the 1995/96 level,poverty incidence increased by 11.4 percent in urban areas and declined by 4.42percent in rural areas, with the overall poverty incidence decreasing by 2.86percent. In the same period, Abbi and McKay (2003) analysed the dynamicsofchronic poverty in Ethiopia using the panel data of AAU for 1994-1997. Theydefined the chronically poor as households with real total expenditure per adultper month below the poverty line in all three years and the transient poor asthose with real total expenditure per adult per month below the poverty line inone or two of the years. They found that the proportion of the transient poor washigher than the chronically poor. Using multinomial logit regression, Abbi andMcKay (2003) argued that chronic poverty is associated with householdcomposition, unemployment, lack of asset ownership, casual employment, lackof education, ethnicity, the age of the household-head, and households headed byfemales. Focusing on the same subject and using the same AAU data, Bigstenand Abebe (2005), analysed the state of poverty in urban and rural Ethiopiabetween 1994 and 2004. They also studied the persistence of poverty during thisperiod. Their result showed that poverty in its absolute sense had declinedbetween 1994 and 1997, increased significantly until 2000 and declined in 2004.They also found that rural households had made more rapid progress than urbanones in getting out of poverty between1994 and 2004, with poverty havingdeclined by more than 10 percentage points. Their study further showed thatonly a relatively small number in both the rural and urban areas managed to exitpoverty completely during the decade under study, suggesting that aconsiderable number of the population had been in poverty at least once duringthe same decade-72 per cent in rural and 60 per cent in urban areas (Bigsten andAbebe (2005).
In another study, Bigsten and Abebe (2008)analyzed poverty transition andpersistence in Ethiopia, using a panel data of ten years (1994-2004). Theyemployed consumption expenditure to measure poverty and the spells approachto analyze poverty dynamics. They found that there is a higher probability (61percent) of poverty transition, of both movements into and out of poverty, inrural areas. They also found substantial persistence of poverty: it is harder to getout of poverty once in it, and it is less probable to re-enter poverty once one hasescaped from it too.In addition,the same study shows that household size,primary education of the household head and spouse, access to markets, as wellas changes in rainfall levels and variability are prominent factors in bothfacilitating the exit out of poverty and preventing re-entry into poverty acrossrural areas. Another study about poverty dynamics is that of Swanepoel (2005)who used the same AAU panel rural data from 1994-1997.Swanepoelfound that

Alemayehu Geda and Addis Yimer
46
movements of households into poverty are associated with life cycle effects andincidence of crop failures, while movements out of poverty are related tohousehold size. The study shows that transiently poor households have a higherdependency ratio, face more frequent crop failures, and have smaller areas ofland available for cultivation. The chronically poor households also own fewerassets and earn less from the sale of livestock. A study by Bigsten et al (2003),also using the same panel data found that cultivation of khat, an export cashcrop, decreases the probability of households falling into poverty whileincreasing the chances of escaping poverty in rural areas. What one can learnfrom these studies is that fighting poverty in Ethiopia is still contingent not onlyon the development of the agricultural sector but more importantly in transitingout of rain-fed agriculture, with an educated peasant that has an optimalhousehold size.
Using a different set of panel data from that of the AAU, Ayalneh et al(2005)attempted to investigate the determinants of rural poverty in Ethiopia, basedon information gathered from a three-round survey of 149 rural households inthree districts of Ethiopia during the 1999/2000 cropping season. They foundthat nearly 40 per cent of the sample households live below the poverty line withan average poverty gap of 0.047. In addition, using a binary logit model, theauthors found that rural poverty is strongly associated with entitlement failures,which are defined as lack of household resource endowments -crucial assetssuch as land, human capital and oxen.
Finally, the latest study using the AAU panel data is that of Derconet al (2007)which examines the process of growth, poverty and poverty persistence in apanel data set covering 15 communities across rural Ethiopia from 1994 to 2004.The authors indicate the existence of both considerable growth and povertyreduction for the period in question. In addition, they highlight the presence andpersistence of ‘chronic’ poverty. Using a statistical dynamic fixed effect growthmodel, they found that road infrastructure and the (slow) spread of extensionservices has contributed to this growth, even though a high sensitivity ofconsumption to rainfall shocks is noted as well. They also show that changes inpoverty are affected by the same factors. There is no clear evidence that thechronically poor are differently affected by these factors in the sample. However,they show that there is a ‘fixed’ latent growth effect that is highly correlated withchronic poverty, which suggests a serious growth handicap for the chronicallypoor. Dercon et al further found that chronic poverty and this latent growtheffect correlates highly with initial physical assets (such as land or livestock),education and remoteness. Ayaleneh (2011) also analysed the extent anddeterminants of rural household poverty in the eastern highlands of Ethiopia,
Growth, Poverty and Inequality, 2000-2013 A Macroeconomic Appraisal
47
using other micro data. The study examines 216 households using a householdconsumption expenditure survey data. The findings suggest that poverty islocation specific, depends on access to irrigated land (not land per se) and accessto non-farm income. The result also shows that household wellbeing isnegatively affected by household size, and positively affected by age ofhousehold head. Involvement in governance, social and production relatednetworks are also found to be strongly associated with the probability of ahousehold being out of poverty.
In contrast to the picture that may be drawn from the official sources, notedabove, the poverty studies reviewed briefly here suggest the pervasive andchronic nature of poverty in the country although it is generally declining overtime. The literature also shows significant differences regarding the level ofpoverty between the official and independent data sources. This suggests theneed to examine other approaches to measuring poverty.
Multidimensional poverty in Ethiopia
Although the probable level of (income) poverty offered in Table 5 is what onecould come up with by examining the existing official information, it is not thebest indicator of the state of poverty in the country. A more comprehensiveindicator is what is referred to as the “Multidimensional Poverty Index” (MPI).Alkire and Foster (2007) proposed this index which they argue reflects betterhuman deprivations. The basic idea behind the MPI is that the well-being of ahousehold or an individual depends not just on income or consumption, but alsoon several other dimensions or capabilities such as health, education, andstandard of living. Alkire and Foster (2009; 2010), and Alkire and Santos(2010), then, developed a strategy to identify the multidimensional poor. Theyintroduced an intuitive approach to identifying the poor that uses two forms ofcutoffs. The first is the traditional dimension-specific line or cutoff, whichidentifies whether a person is deprived with respect to that dimension. Thesecond delineates how widely deprived a person must be in order to beconsidered poor. Their benchmark procedure uses a counting methodology inwhich the second cutoff is a minimum number of dimensions of deprivation.This procedure readily generalizes to situations in which dimensions havedifferential weights. This ‘dual cutoff’ identification system gives clear priorityto those suffering multiple deprivations and works well in situations with manydimensions.
Such multi-dimensional poverty measure is more likely to underpin long-termpoverty (Hulme and Shepherd, 2003). In the use of MPI, consumption

Alemayehu Geda and Addis Yimer
48
expenditure, as a flow variable, is more likely to capture mobility of householdsinto and out of poverty while the general MPI poverty indices capture long-termwell-being (Hulme and Shepherd, 2003).
In concrete terms, the MPI reflects both the incidence or headcount ratio (H) ofpoverty – the proportion of the population that is multi dimensionally poor – andthe average intensity (A) of their poverty – the average proportion of indicatorsin which poor people are deprived. The MPI is then computed by multiplying theincidence of poverty by the average intensity across the poor (H×A). A person isidentified as poor if he or she is deprived in at least one third of the weightedindicators (see OPHI 2013).The MPI also identifies multiple deprivations in thesame household in education, health and living standards (Ethiopia Demographicand Health Survey, EDHS2011).\
Table 6 shows the multidimensional poverty index rate (MPI) and its twocomponents: incidence of poverty (H) and average intensity of deprivation facedby the poor (A) for Ethiopia and selected African countries for comparison. Thesecond column of the Table shows the survey year used to generate the MPIresults. Those identified as "Vulnerable to Poverty" are said to be deprived in 20to33 percent of the weighted indicators; and those identified as being in "SeverePoverty" are deprived in 50 percent or more (OPHI 2013).Ethiopia’s MPIhasimproved from0.677 (68 percent)in 2000 to 0.605 (60 percent)and 0.523 (52percent)in 2005 and 2011,respectively (EDHS2005 and 2011). Although thedecline in poverty in Ethiopia based on the MPI index is commendable, theannual percentage change in almost all components of the MPI index is lowercompared to its neighbors. Ethiopia’s level of MPI shows an extremely highlevel of deprivation, nearly double the average level, compared to neighboringAfrican countries. This suggests not only that poor people in Ethiopia sufferfrom a larger number of depravations compared to poor people in Eastern Africabut also social services that improve living standards are more available to thepoor in the other countries of Eastern Africa compared to Ethiopia. In particular,it is striking from Table 6 (especially column 6/7) that over 90 percent ofEthiopians are poor using this index. Further, according to EDHS (2011), as of2011, 84.1 percent of the population in Ethiopia suffers from multipledeprivations, while 6.8 percent are vulnerable to multiple deprivations8.Inaddition, 71.7 percent of the population is in severe poverty9.These indicatorsgenerally show that Ethiopia is the most deprived country in the world wherenearly all the population – above 90 percent - is poor and/or vulnerable to
8 who experience 20-33.32% intensity of deprivations9 with intensity higher than 50%

Growth, Poverty and Inequality, 2000-2013 A Macroeconomic Appraisal
49
poverty. This strengthens our critical examination of the official data presentedin Table 5.
Table 6.Changes in MPI, H and A at national level
Changes in MPI, H and A at National LevelMultidimensional Poverty Index
(MPI)
Annualized
change
MultidimensionalHeadcount ratio
(H), %
Annualized
change
Intensity ofPoverty (A),
%
Annualized
change
Period Year1
Year 2 %Relativ
e
Year 1 Year2
%Relativ
e
Year1
Year2
%Relativ
e
Ethiopia 2000-2005
0.677
0.605 -2.1% 93.58 89.73 -0.8% 72.35
67.40
-1.4%
2005-2011
0.605
0.523 -2.2% 89.73 84.07 -1.1% 67.40
62.26
-1.3%
Rwanda 2005-2010
0.460
0.330 -5.6% 82.9 66.1 -4.0% 55.5 49.9 -2.0%
Tanzania
2008-2010
0.367
0.326 -5.7% 65.2 59.9 -4.1% 56.3 54.4 -1.7%
Kenya 2003-2008/9
0.296
0.244 -3.2% 60.1 51.2 -2.7% 49.3 47.7 -0.6%
Uganda 2006-2011
0.417
0.343 -3.5% 77.7 66.8 -2.8% 53.7 51.4 -0.9%
SOURCE: OPHI, 2013
NOTE: MPI– A number between 0 and 1 that reflects the level of acute poverty.
A high number shows higher poverty. The MPI is the product ofH x A.H– theHeadcount Ratio or percentage of people who are identified asmulti dimensionalpoor; sometimes referred to as the ‘rate’ of poverty. It ranges from 0 to 100 percentand a higher figure shows worsening poverty. A– The intensity or averagepercentage of deprivations is what poor people experience together, measured from33 to 100 percent in the case of MPI. A higher figure shows worsening of poverty.Absolute: The reduction is calculated by subtracting one measure from another.Forexample, a 5 percentage point reduction of H could mean that H decreased from 75to 70 percent or from 10 to 5 percent. Relative: This is the absolute reductiondivided by the original poverty level, thus showing the percentage change.Annualized: show the changes per year, the total change is divided by then umberof years between the surveys.
This extremely high level of the MPI measure of poverty in Ethiopia may be putin perspective using a summary of other measures of poverty as shown in Figure1 below. Figure 1 compares the poverty rate, using the MPI, with three othercommonly used poverty measures. As can be seen from the figure, theproportion of people who are MPI poor in Ethiopia in the year 2011 is about85percent, while the percentage of people below the national (income) povertyline, according to the government, is about 30 percent. On the other hand, thepercentages of people who are poor according to USD 1.25 and 2.00 PPP a day

Alemayehu Geda and Addis Yimer
50
income-poverty line are 30.65 percent and 66 percent of the population,respectively, in the same year. As we have noted earlier, the World Bank’sincome poverty line of 30.65 percent, using USD 1.25 per day offers the samefigure to that of the official government figure of 29.6 percent although thisofficial figure is based on a poverty line of USD 0.50.
Figure 1. Comparison of poverty in Ethiopia using different measures
SOURCE: Author’s computation using OPHI, 2013: MOFED, 2012; PovCalNet (World Bank)2013
Table 7 and Figure 2 show the variation in poverty across Ethiopianadministrative regions using the MPI index. The Table shows that, excluding thecity states of Addis Ababa, Harari and Dire Dawa, where 20 to 58 percent of thepopulation is poor, the number of the population below the MPI poverty line inall the other regions is about 90percent. The worst figure is recorded for Somaliregion (93 percent), Oromia and Afar (91 percent) and Amhara, SNNP &Benishangul-Gumuz (90 percent). The best regions in terms of relatively lowerlevels of poverty are Gambela (81 percent) and Tigray (85 percent). Therelatively lower figure for Tigray is striking. This is because Tigray had thehighest (income) incidence of poverty in the country in 1995 and in 1999/2000with a head count ratio of 0.56 and 0.61, respectively. The Behangul-Gumuzresult is not that surprising as the head count ratio of this region was already lowbeing 0.34 and 0.50 during the two periods(see Alemayehu 2005; Alemayehuand Befekadu, 2005 and Figure 2 below). We should note, however, that thenumber of the poor in Tigray, 85 percent is still very high in absolute terms.
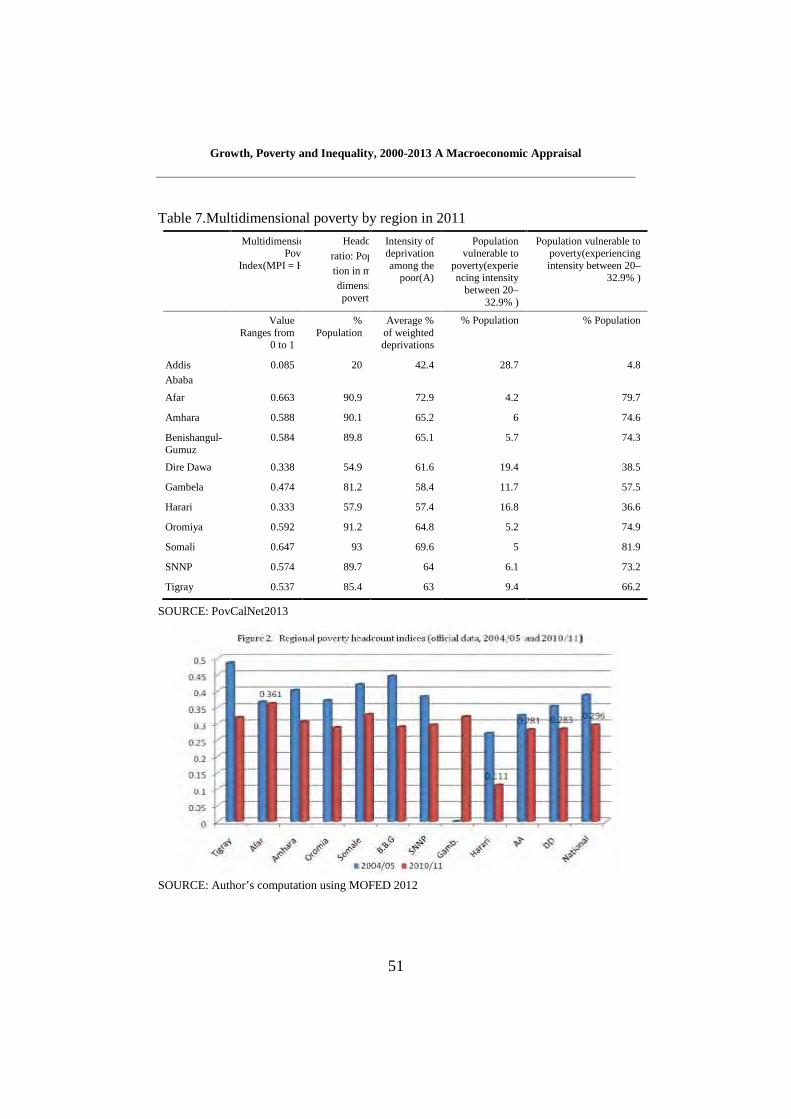
Growth, Poverty and Inequality, 2000-2013 A Macroeconomic Appraisal
51
Table 7.Multidimensional poverty by region in 2011
MultidimensionalPoverty
Index(MPI = H*A
Headcount
ratio: Popula-tion in multi-dimensionalpoverty(H)
Intensity ofdeprivationamong the
poor(A)
Populationvulnerable to
poverty(experiencing intensity
between 20–32.9% )
Population vulnerable topoverty(experiencingintensity between 20–
32.9% )
ValueRanges from
0 to 1
%Population
Average %of weighteddeprivations
% Population % Population
Addis
Ababa
0.085 20 42.4 28.7 4.8
Afar 0.663 90.9 72.9 4.2 79.7
Amhara 0.588 90.1 65.2 6 74.6
Benishangul-Gumuz
0.584 89.8 65.1 5.7 74.3
Dire Dawa 0.338 54.9 61.6 19.4 38.5
Gambela 0.474 81.2 58.4 11.7 57.5
Harari 0.333 57.9 57.4 16.8 36.6
Oromiya 0.592 91.2 64.8 5.2 74.9
Somali 0.647 93 69.6 5 81.9
SNNP 0.574 89.7 64 6.1 73.2
Tigray 0.537 85.4 63 9.4 66.2
SOURCE: PovCalNet2013
SOURCE: Author’s computation using MOFED 2012

Alemayehu Geda and Addis Yimer
52
How does the reported growth relate to poverty and inequality?Growth, inequality and poverty reduction
Growth is a necessary but not sufficient condition for poverty reduction. This ischiefly because the distribution of income associated with growth may have anegative bearing on poverty reduction. This effect is not small either. As Whiteand Anderson (2001) (cited in Naschold 2002)demonstrate, a small change inincome distribution can have a large effect on poverty reduction: a redistributionof one quarter of one per cent that goes to the poorest 20 percent of thepopulation would have the same effect as doubling of the growth rate10. Thus,we need to look not only at growth but also to the nature of that growth. As hasbeen demonstrated in Alemayehu et al (2008) for Ethiopia, assuming the incomedistribution to be relatively continuous,11 any distribution-neutral growth in percapita income, no matter how low, will reduce the intensity of poverty.However, redistribution reduces poverty only to the extent that it moves a personabove a defined poverty line.12 Even confronted with the condition of low percapita income, which Ethiopia finds itself in, Alemayehu et al. (2008) haveshown that simple redistribution rules – such as equal absolute increments acrossall percentiles, top to bottom, –that follow the Cheneryet. al. (1974) approach -could reduce poverty significantly. These rules could be viewed as relativelyminimalist, with alternative redistribution rules considerably more progressive,resulting in powerful outcomes for poverty reduction.
Despite earlier empirical evidence (e.g. Anand and Kanbur 1993, Bruno,Ravallion and Squire 1998, Fields 1998, Dollar 2001, and Dollar and Kraay(200013) on the absence of any systematic relationship between incomeinequality and economic growth, interest on this inter-linkage has resurfaced, as
10 A simple arithmetical example of White and Anderson (2001), as quoted in Naschold (2002),can help visualise this “… Imagine a country where the share of national income that goes tothe poorest 20% of the population increases from 6% to 6.25%. A change in incomedistribution of one quarter of one per cent would barely affect the Gini coefficient, but for thepoor this represents a 4% increase in their total income. Such a small redistribution wouldhave the same effect on poverty as doubling the annual growth of national income from 4%,which is the projected growth rate of many African countries, to 8%, which is necessary toachieve the income poverty Millennium Development Goal (MDG)”
11 That is, we assume there are no ‘gaps’ in the distribution below and near the poverty line.12 A redistribution of one percentage point of GDP from the richest ten per cent of the
population to the poorest ten per cent, equally distributed among the latter, would improve theincomes of all those in the lowest decile, but might shift none of them above the poverty line.
13 See Dagdeviren et al (2000) for analytical critics of the Dollar-Kay approach and thepossibility of getting the opposite result, however.
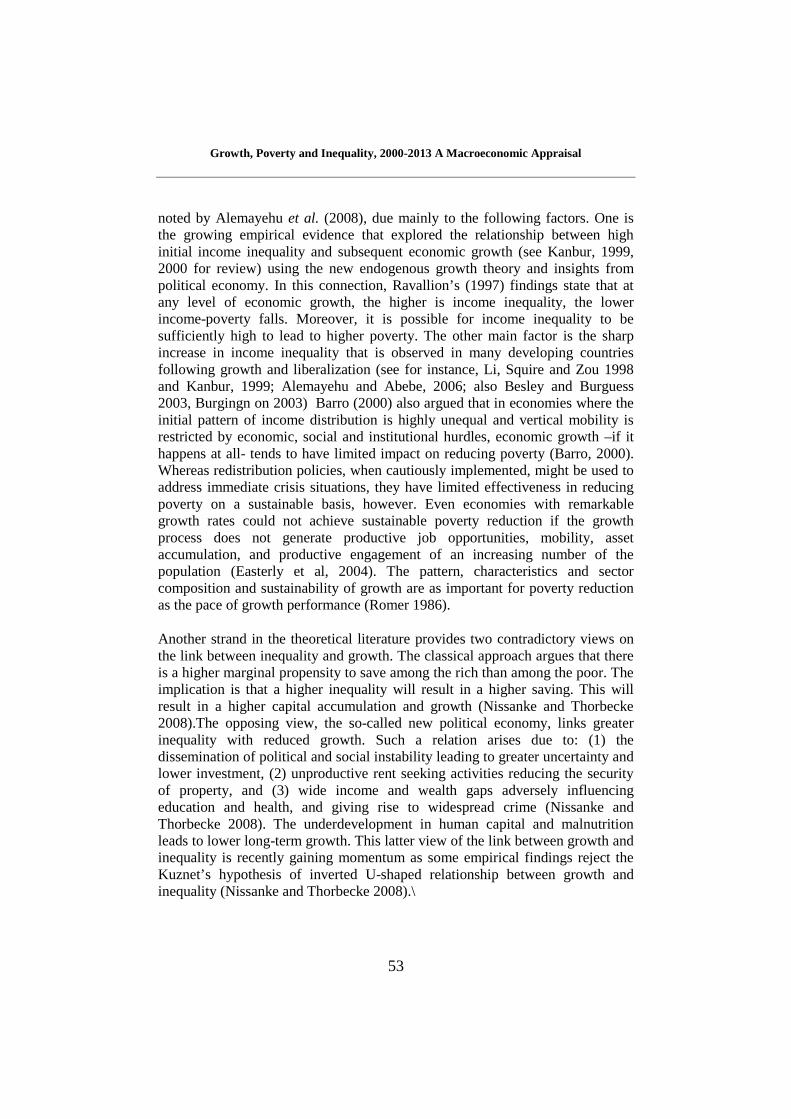
Growth, Poverty and Inequality, 2000-2013 A Macroeconomic Appraisal
53
noted by Alemayehu et al. (2008), due mainly to the following factors. One isthe growing empirical evidence that explored the relationship between highinitial income inequality and subsequent economic growth (see Kanbur, 1999,2000 for review) using the new endogenous growth theory and insights frompolitical economy. In this connection, Ravallion’s (1997) findings state that atany level of economic growth, the higher is income inequality, the lowerincome-poverty falls. Moreover, it is possible for income inequality to besufficiently high to lead to higher poverty. The other main factor is the sharpincrease in income inequality that is observed in many developing countriesfollowing growth and liberalization (see for instance, Li, Squire and Zou 1998and Kanbur, 1999; Alemayehu and Abebe, 2006; also Besley and Burguess2003, Burgingn on 2003) Barro (2000) also argued that in economies where theinitial pattern of income distribution is highly unequal and vertical mobility isrestricted by economic, social and institutional hurdles, economic growth –if ithappens at all- tends to have limited impact on reducing poverty (Barro, 2000).Whereas redistribution policies, when cautiously implemented, might be used toaddress immediate crisis situations, they have limited effectiveness in reducingpoverty on a sustainable basis, however. Even economies with remarkablegrowth rates could not achieve sustainable poverty reduction if the growthprocess does not generate productive job opportunities, mobility, assetaccumulation, and productive engagement of an increasing number of thepopulation (Easterly et al, 2004). The pattern, characteristics and sectorcomposition and sustainability of growth are as important for poverty reductionas the pace of growth performance (Romer 1986).
Another strand in the theoretical literature provides two contradictory views onthe link between inequality and growth. The classical approach argues that thereis a higher marginal propensity to save among the rich than among the poor. Theimplication is that a higher inequality will result in a higher saving. This willresult in a higher capital accumulation and growth (Nissanke and Thorbecke2008).The opposing view, the so-called new political economy, links greaterinequality with reduced growth. Such a relation arises due to: (1) thedissemination of political and social instability leading to greater uncertainty andlower investment, (2) unproductive rent seeking activities reducing the securityof property, and (3) wide income and wealth gaps adversely influencingeducation and health, and giving rise to widespread crime (Nissanke andThorbecke 2008). The underdevelopment in human capital and malnutritionleads to lower long-term growth. This latter view of the link between growth andinequality is recently gaining momentum as some empirical findings reject theKuznet’s hypothesis of inverted U-shaped relationship between growth andinequality (Nissanke and Thorbecke 2008).\

Alemayehu Geda and Addis Yimer
54
The empirical literature on Africa shows the negative impact of inequality on thepoverty reduction effect of growth (see Alemayehu and Abebe 2006; Alemayehuet al 2008; Fosu 2009, for instance). Fosu (2009) found that in sub-SaharanAfrica, the impact of GDP growth on poverty reduction is a decreasing functionof initial inequality. Ravallion (2001) and Bigsten and Abebe (2007) argued thatinitial inequalities determine how much the poor share in aggregate growth orcontraction. Ravallion(2005) found poverty to be inversely correlated withrelative inequality, but that the relationship depends on how inequality ismeasured. Ferreira et al. (2008) repoorted negative correlations between bothpoverty and inequality indices, on the one hand, and mean income per capita onthe other and noted that inequality tends to reduce the growth elasticity ofpoverty reduction. Adams (2004) argued that though economic growth reducespoverty, the actual extent of poverty reduction depends on how economic growthis measured. Baye (2006) found that growth components dominated theredistribution components in explaining poverty at the national and regionallevels. This finding is consistent with earlier findings by Datt and Ravallion(1992). Odedokun and Round (2004) also found that high inequality reducesgrowth and that the channels through which inequality affect growth includedreduction in secondary and tertiary education investments, reduced politicalstability, and increased fertility rate.This doesn’t mean, however, that there areno studies that do not contradict such findings, though they seem to be rare inAfrica. For instance, Arndt et al. (2006) used generalized entropy class ofinequality decomposition in Mozambique and showed that inequality betweenprovinces and regions diminished over time as income grew. However, suchfindings are not many.
In an earlier study on Ethiopia, Bigsten et al. (2003) found that potentialpoverty-reduction due to the increase in real per capita income was to someextent counteracted by worsening income distribution. Alemayehu et al. (2008)and Tassew et al (2008) have confirmed the significance of distribution ofincome in alleviating poverty, particularly for poor countries like Ethiopia.Tassew et al. (2008) reported that the prevalence of higher inequality in urbanareas increases the incidence of poverty. Using a household panel data,Alemayehu et al. (2008) showed the existence of a strong positive correlationbetween growth and inequality. On the basis of realistic assumptions, the studyfurther showed that from a baseline in 2000 of a 44percent poverty level, overten years at growth of 4percent per capita, poverty would decline from 44 to26percent for distribution-neutral growth (i.e., no change in the aggregateincome distribution). In contrast, were the growth increment distributed equallyacross percentiles (equally distributed gains of growth, EDG) poverty would

Growth, Poverty and Inequality, 2000-2013 A Macroeconomic Appraisal
55
decline by over half, to 15percent, a difference of almost eleven percentagepoints. Thus, ‘distribution matters’, even, or especially in a poor country likeEthiopia. Finally, with regard to the source of such inequality, Bigsten andAbebe(2006) attempted to decompose the determinants of income inequality inEthiopia using a regression model of consumption expenditure at the householdlevel. The result indicated that in rural areas a large part of the variation inincome inequality could be explained by differences in village levelcharacteristics and other unobserved factors. For urban areas, significant factorsthat played a role in determining inequality were household characteristics suchas occupation of the head of the household, educational level of the head of thehousehold and other unobserved characteristics. For rural areas during the period1994-2004, after controlling for village level differences (through villagedummies), average land holding size and its variance, and education of the keymembers of the household (the head and the wife) seem to be a very importantfactor driving inequality (see Bigsten and Abebe, 2006; and also Alemayehu etal. 2008).
Given such analytical link between growth, poverty and inequality, it isimperative to see the recent record on inequality and its effect on povertyreduction in Ethiopia. In the context of Ethiopia, the evidence on inequality overthe decade, obtained from the national household income and consumptionsurveys, as well as the panel data of the AAU, indicates that it has been clearlyrising in urban areas, and remained more or less at its initial level in rural areasthough it exhibited considerable variations across time according to the paneldata (Table 4.1 [8]) (see Alemayehu et al. 2008). Urban inequality, apart from itspolitical imperative (discussed at length in Alemayehu 2013), has a detrimentaleffect on poverty reduction. That is, the rise in inequality in urban Ethiopia inparticular, has wiped out the poverty-reducing effect of growth.
The nature and extent of inequality in EthiopiaCompared to 1995/96 inequality has increased in 2004/05 across all regions inEthiopia although its magnitude is not that significant. In 2004/05 inequality,measured by Gini, is the highest for Addis Ababa (0.46) followed by Dire Dawa(0.39) and Tigray (0.37). It was the least for Amhara (0.27). If urban inequalityis taken, however, Tigray ranks first (0.49) followed by Addis Ababa (0.46) andDire Dawa (0.43). In SNNP and Amhara, significant growth in consumptionoccurred with relatively little change in the distribution of consumption with theresult that poverty fell considerably in both places. Poverty also fell in Tigrayand in Benishangul-Gumuz, but in these regions the poverty reducing impact ofconsumption growth is offset by increased inequality. According tothe latestinformation available, HICE (2010/11), regionally, poverty is highest in Afar
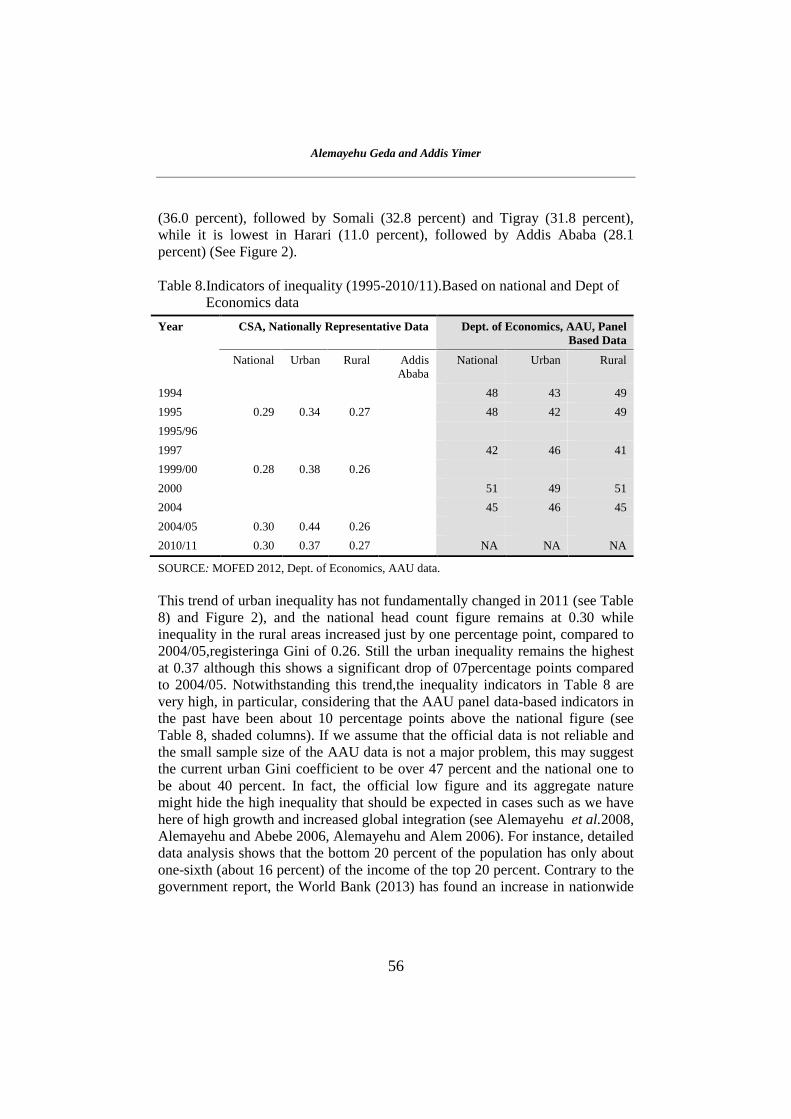
Alemayehu Geda and Addis Yimer
56
(36.0 percent), followed by Somali (32.8 percent) and Tigray (31.8 percent),while it is lowest in Harari (11.0 percent), followed by Addis Ababa (28.1percent) (See Figure 2).
Table 8.Indicators of inequality (1995-2010/11).Based on national and Dept ofEconomics data
Year CSA, Nationally Representative Data Dept. of Economics, AAU, PanelBased Data
National Urban Rural AddisAbaba
National Urban Rural
1994 48 43 49
1995 0.29 0.34 0.27 48 42 49
1995/96
1997 42 46 41
1999/00 0.28 0.38 0.26
2000 51 49 51
2004 45 46 45
2004/05 0.30 0.44 0.26
2010/11 0.30 0.37 0.27 NA NA NA
SOURCE: MOFED 2012, Dept. of Economics, AAU data.
This trend of urban inequality has not fundamentally changed in 2011 (see Table8) and Figure 2), and the national head count figure remains at 0.30 whileinequality in the rural areas increased just by one percentage point, compared to2004/05,registeringa Gini of 0.26. Still the urban inequality remains the highestat 0.37 although this shows a significant drop of 07percentage points comparedto 2004/05. Notwithstanding this trend,the inequality indicators in Table 8 arevery high, in particular, considering that the AAU panel data-based indicators inthe past have been about 10 percentage points above the national figure (seeTable 8, shaded columns). If we assume that the official data is not reliable andthe small sample size of the AAU data is not a major problem, this may suggestthe current urban Gini coefficient to be over 47 percent and the national one tobe about 40 percent. In fact, the official low figure and its aggregate naturemight hide the high inequality that should be expected in cases such as we havehere of high growth and increased global integration (see Alemayehu et al.2008,Alemayehu and Abebe 2006, Alemayehu and Alem 2006). For instance, detaileddata analysis shows that the bottom 20 percent of the population has only aboutone-sixth (about 16 percent) of the income of the top 20 percent. Contrary to thegovernment report, the World Bank (2013) has found an increase in nationwide

Growth, Poverty and Inequality, 2000-2013 A Macroeconomic Appraisal
57
inequality levels, as measured by the Gini coefficient, of 0.298 in 2005 to 0.336in 2011. In addition, we also observe that inequality among community groups(and across ethno-linguistic lines) is also growing significantly, threatening thesocial fabric of the country (discussed in detail in Alemayehu 2013). Asupporting evidence for our doubt of the official data may be inferred from Table9 below.
The wealth index used in Table 9 is a measure that has been used in manydemographic and health surveys (DHS) and other country-level surveys toindicate inequalities, including in the use of health and other services (Rutsteinet al. 2000). It serves as an indicator of the level of wealth that is consistent withexpenditure and income measures (Rutstein 1999). The index is constructedfrom household asset data using a principal component analysis. Table 9presents the wealth quintiles by residence and administrative regions of thecountry. In urban areas 88 percent of the population is in the highest wealthquintile by this measure. This is in sharp contrast to the rural areas, where only 5percent of the population is in the highest wealth quintile. Among regions, thewealth quintile distribution varies greatly. A relatively high percentage of thepopulation in the most urbanized regions is in the highest wealth quintile—Addis Ababa (99 percent), Dire Dawa (66 percent), and Harari (60 percent). Incontrast, a significant proportion of the population in the less urbanized regionsis in the lowest wealth quintile, as in Afar (57 percent), Somali (44 percent), andGambela (35 percent)
Table 9.Percentage distribution of the population by wealth quintiles and Ginicoefficient by residence and region in Ethiopia in 2011
Residence/Region
Wealth Quintiles Total
Weighted
Number
Unweighted
Number
GiniCoeffici
entLowest
Second
Middle
Fourth
Highest
Urban 2.3 1.0 1.1 8.0 87.6 100 13,939 18,917 0.14
Rural 23.9 24.2 24.1 22.6 5.1 100 63,438 56,738 0.07
Total/National
20.0 20.0 20.0 20.0 20.0 100 77,377 75,655 0.23
Region
Tigray 25.8 22.3 16.1 13.1 22.7 100 5,035 7,794 0.26
Afar 57.0 9.5 4.9 6.9 21.7 100 667 6,048 0.29
Amhara 22.4 22.7 21.8 17.1 16.0 100 19,478 9,264 0.20
Oromiya 16.0 20.9 22.4 25.3 15.4 100 29,800 10,325 0.19
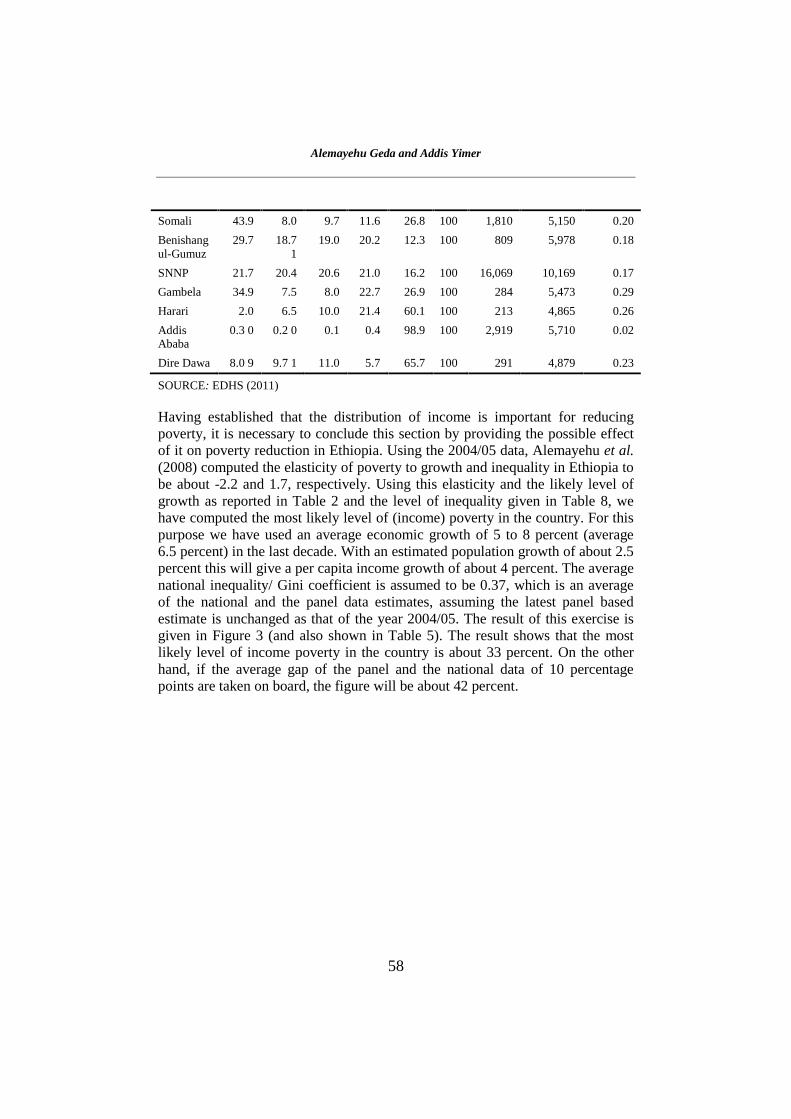
Alemayehu Geda and Addis Yimer
58
Somali 43.9 8.0 9.7 11.6 26.8 100 1,810 5,150 0.20
Benishangul-Gumuz
29.7 18.71
19.0 20.2 12.3 100 809 5,978 0.18
SNNP 21.7 20.4 20.6 21.0 16.2 100 16,069 10,169 0.17
Gambela 34.9 7.5 8.0 22.7 26.9 100 284 5,473 0.29
Harari 2.0 6.5 10.0 21.4 60.1 100 213 4,865 0.26
AddisAbaba
0.3 0 0.2 0 0.1 0.4 98.9 100 2,919 5,710 0.02
Dire Dawa 8.0 9 9.7 1 11.0 5.7 65.7 100 291 4,879 0.23
SOURCE: EDHS (2011)
Having established that the distribution of income is important for reducingpoverty, it is necessary to conclude this section by providing the possible effectof it on poverty reduction in Ethiopia. Using the 2004/05 data, Alemayehu et al.(2008) computed the elasticity of poverty to growth and inequality in Ethiopia tobe about -2.2 and 1.7, respectively. Using this elasticity and the likely level ofgrowth as reported in Table 2 and the level of inequality given in Table 8, wehave computed the most likely level of (income) poverty in the country. For thispurpose we have used an average economic growth of 5 to 8 percent (average6.5 percent) in the last decade. With an estimated population growth of about 2.5percent this will give a per capita income growth of about 4 percent. The averagenational inequality/ Gini coefficient is assumed to be 0.37, which is an averageof the national and the panel data estimates, assuming the latest panel basedestimate is unchanged as that of the year 2004/05. The result of this exercise isgiven in Figure 3 (and also shown in Table 5). The result shows that the mostlikely level of income poverty in the country is about 33 percent. On the otherhand, if the average gap of the panel and the national data of 10 percentagepoints are taken on board, the figure will be about 42 percent.
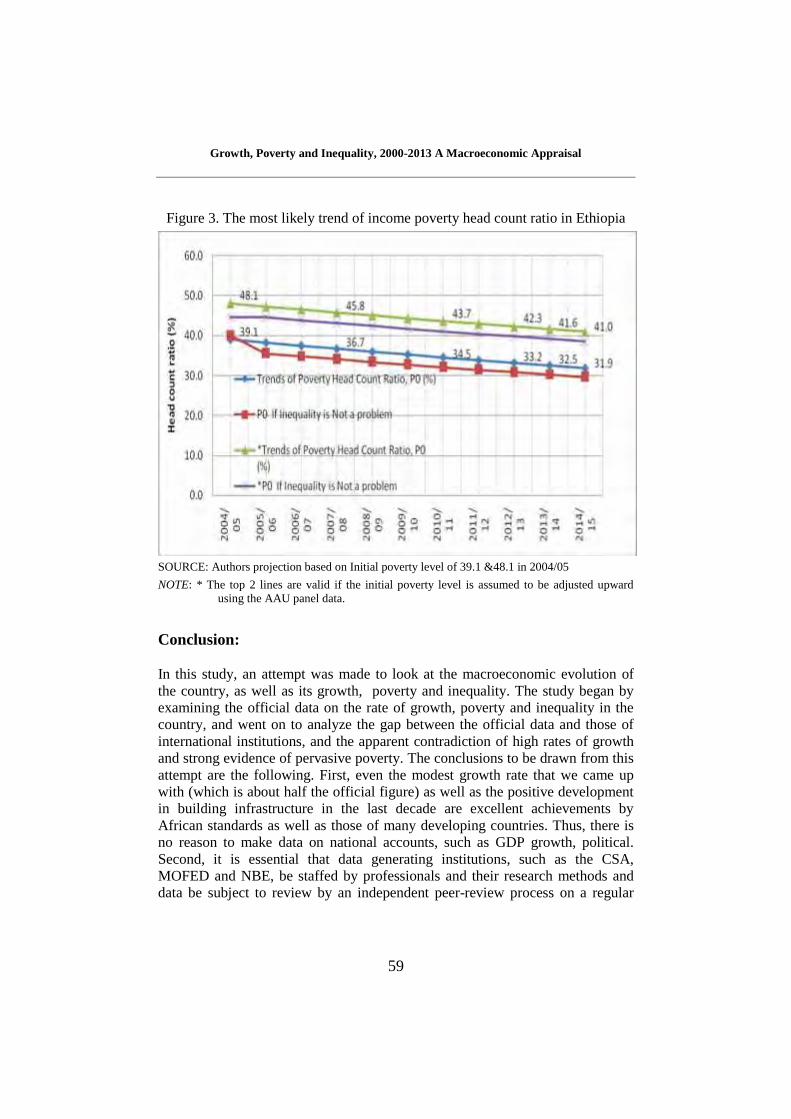
Growth, Poverty and Inequality, 2000-2013 A Macroeconomic Appraisal
59
Figure 3. The most likely trend of income poverty head count ratio in Ethiopia
SOURCE: Authors projection based on Initial poverty level of 39.1 &48.1 in 2004/05
NOTE: * The top 2 lines are valid if the initial poverty level is assumed to be adjusted upwardusing the AAU panel data.
Conclusion:
In this study, an attempt was made to look at the macroeconomic evolution ofthe country, as well as its growth, poverty and inequality. The study began byexamining the official data on the rate of growth, poverty and inequality in thecountry, and went on to analyze the gap between the official data and those ofinternational institutions, and the apparent contradiction of high rates of growthand strong evidence of pervasive poverty. The conclusions to be drawn from thisattempt are the following. First, even the modest growth rate that we came upwith (which is about half the official figure) as well as the positive developmentin building infrastructure in the last decade are excellent achievements byAfrican standards as well as those of many developing countries. Thus, there isno reason to make data on national accounts, such as GDP growth, political.Second, it is essential that data generating institutions, such as the CSA,MOFED and NBE, be staffed by professionals and their research methods anddata be subject to review by an independent peer-review process on a regular

Alemayehu Geda and Addis Yimer
60
basis. They need also to be autonomous and transparent, and, to the extentpossible, insulated from politics and pressure from the government.
After questioning the official data and its likely implications, the study attemptedto offer what is the most likely picture of growth, poverty and inequality in thecountry. In this regard the conclusion is that there is agood deal of growth butthe growth rate is modest. There is also a marked absence of structuraltransformation in the country in the last four decades. We also noted that growthand distribution are found to be important determinants of the change in poverty.In rural areas poverty reduction is fully accounted by growth (inequality was notsignificant). While in urban areas the poverty reduction effect of growth is morethan wiped out by the inequality that has accompanied it, and this underscoresthe need to address the challenges of inequality. Thus, achieving povertyreduction entails meeting, in addition to growth, the challenges of: (i) growthand vulnerability both at household and country level and (ii) addressing bothvertical and horizontal inequality. In particular, addressing the issue of emerginghorizontal inequality is central not only for poverty reduction but also forensuring a politically stable country, free from recurrent conflicts.
Finally, the study has shown that theEthiopian economy and the country’s poorare extremely vulnerable to external shocks, which may include conflict, climatechange (rainfall variability or drought), world price of exports and imports (suchas coffee, and fuel) as well as aid and remittances. The challenge of vulnerabilityhas also a micro dimension. Poverty studies in the country show that the poor areextremely vulnerable, and the chances of slipping back into poverty both in ruraland urban areas following shocks such as drought or the death of the head of thehousehold are very high. The level of poverty would have dropped nearly by halfhad it not been for risks associated with vulnerability of households. Thisvulnerability and the associated persistence of poverty is often related to thelack of structural transformation that is in turn related to lack of technicalprogress in agriculture, lack of strong institutions, access to markets, as well aslow asset accumulation in the country. Addressing these structural issues isimportant to achieve a sustainable reduction in poverty. This could be done inthe medium term by tackling the dependence on rain-feed agriculture throughexpansion of small and large-scale irrigation. Structural transformation alsorequires raising the competitiveness of the industrial and export sectors throughthe provision of increased physical infrastructure, human capital formation, anenabling macroeconomic environment and developing a cadre of managementprofessionals with a sensible incentive structure. The government is doing muchin the area of infrastructure, however inefficient it might be, but seems to fail inthe other areas and in particular in the professionalization of the work force and
Growth, Poverty and Inequality, 2000-2013 A Macroeconomic Appraisal
61
institutions. Thus, capacity building and decoupling politics and professionalismis important.
ReferencesAbbiMamoKedir and Mckay, A.2003.Chronic Poverty in Urban Ethiopia: Panel
Data Evidence. Paper Prepared for International Conference on StayingPoor: Chronic Poverty and Development. UK: Institute forDevelopment Policy and Management
AbbiMamoKedir and McKay, A. 2004.Chronic poverty in Ethiopia: Panel DataEvidence. Paper prepared for the Workshop on Chronic Urban Povertyin Ethiopia, 16-18 August, 2004, Addis Ababa, Ethiopia.
AbbiMamoKedir 2000. “Modelling Poverty and Its Determinants for UrbanEthiopia: The Multinomial Logit Selection Model”, Ethiopian Journal ofEconomics, Vol. 6(2): 1-36.
Adams, Richard Jr. 2004. "Economic Growth, Inequality and Poverty:Estimating the Growth Elasticity of Poverty," World Development, Vol.32(12), pages 1989-2014, December
Alemayehu Geda 1993. ‘Quantitative Measurement of Poverty in Ethiopia’,Ethiopian Journal of Development Research, 15(2):17-53.)
Alemayehu Geda 1996. ‘Macro Data and Macroeconomic Analysis: TheRelevance of A Consistent Macroeconomic Database in Ethiopia’(Ethiopian Journal of Economics)
Alemayehu Geda 1998. ‘A Consistent Macro Database for Ethiopia (1970-1999)’, Ethiopian Economic Association, A Research Report.
Alemayehu Geda, John Weeks, Daniel Zerfu and JonseDegefa 2004.‘Source ofGrowth in Ethiopia: A Background Paper for Government of Ethiopia,MOFED, Addis Ababa.
Alemayehu Geda 2005. Does Conflict Explain Ethiopian Backwardness? Yesand Significantly. In Alemayehu Geda (2001).Readings on EthiopianEconomy. Addis Ababa: Addis Ababa University Press.
Alemayehu Geda 2008. ‘The Political Economy of Growth in Ethiopia’ inBennoNdulu, Stephen A.O’connell, Jean_PaulAzam, RoberH.Bates,Augustin K. Fosu, Jan Willem Gunning and Dominique Njinkeu (eds).The Political Economy of Growth in Africa: 1960-2000. Cambridge:Cambridge University Press).
Alemayehu Geda 2013. ‘The Political Economy of Growth, Poverty andInequality in Ethiopian in the last Decade: 2000-2013’. (Unprocessed,

Alemayehu Geda and Addis Yimer
62
Department of Economics, AAU/IAES Working Paper, available atwww.Alemayehu.com
Alemayehu Geda and AlemAbereha 2006. ‘Macro Policy Reform, LabourMarket, Poverty and Inequlaity in Urban Ethiopia: A Micro-SimulationApproach’, Ethiopian Journal of Economics, 13(2): 1-35.
Alemayehu Geda and BefekaduDegefe 2005.Conflict and EconomicPerformance in Ethiopia. In A.Fosu and P. Collier (eds). Conflict andPost Conflict Economies in Africa. Basingstoke: Palgrave-Macmillan.
Alemayehu Geda,AbebeShimeles and John Weeks 2008. Growth, Poverty andInequality in Ethiopia: Which way for Pro Poor Growth.Journal ofInternational Development, 2008
Alemayehu Geda and Kibrom Tafere 2008.The Galloping Inflation in Ethiopia,Department of Economics, Mimeo/IEAS WP, available atwww.Alemayehu.com
Alkire, S. and Foster, J. 2007.Counting and multidimensional povertymeasurement. OPHI working paper series No. 07, Oxford Poverty andHuman Development Initiative (OPHI), University of Oxford.
Alkire, S. and Foster, J. 2009.Counting and multidimensional povertymeasurement. OPHI working paper series No. 32, Oxford Poverty andHuman Development Initiative (OPHI), University of Oxford.
Alkire, S. and J. Foster 2011.Counting and multidimensional povertymeasurement.Journal of public economics, 95(7-8):476-487.
Alkire, S. and J.M. Roche. 2013. How MPI Went Down: Dynamics andComparisons.Oxford Poverty & Human Development Initiative,University of Oxford.
Alkire, S. and M. E. Santos 2010. Acute multidimensional poverty: A new indexfor developing countries. Human development research paper,2010/2011.UNDP.
Anandt, S., and R. Kanbur. 1993. The Kuznets Process and the Inequality-Development Relationship. Journal of Development Economics 40:25–52.
Arndt, Channing, Robert C. James and Kenneth R. Simler 2006.Has EconomicGrowth in Mozambique been Pro-Poor?,Journal of African Economies,15(4), 571-602, December
AyalnehBogale 2011. Analysis of poverty and its covariates among smallholderfarmers in the EasternHararghe highlands of Ethiopia. Journal ofDevelopment and Agricultural Economics Vol. 3(4), pp. 157-164, April2011

Growth, Poverty and Inequality, 2000-2013 A Macroeconomic Appraisal
63
AyalnehBogale, KonradHagedorn,andBenediktKorf 2005. Determinants ofpoverty in rural Ethiopia, Quarterly Journal of International Agriculture44, 2: 101 120.
Barro, R. 1999. Inequality, Growth, and Investment.NBER Working Paper No.7038.National Bureau of Economic Research, Cambridge, MA, 1999.
Barro, R. J. 2000. Inequality and Growth in a Panel of Countries.Journal ofEconomic Growth vol. 5, no 1: 5-32.
Baye, F.M. 2006. Growth, Redistribution and Poverty Changes in Cameroon: AShapley Decomposition Analysis, Journal of African Economies, 15(4),543-570.
Bevan, P. and S.F. Joirmann 1997. The Perils of Measuring Poverty: Identifyingthe Poor in Rural Ethiopia, Oxford Development Studies 25 (3): 315-337.
Besley, Timothy and Robin Burgess 2003. Halving Global Poverty, The Journalof Economic Perspective, 17(3):3-22.
Bigsten, A., BereketKebede, AbebeShimelis and MekonnenTaddesse 2003.Growth and poverty reduction in Ethiopia: Evidence from householdspanel surveys. World Development, 31 (1): 87-106.
Bigsten, Arne and AbebeShimeles 2005. Poverty and Income Distribution inEthiopia: 1994-2000.Department of Economics, Gothenburg University,Gothenburg, Sweden.
Bigsten, A. and AbebeShimeles 2006.Poverty and income distribution inEthiopia: 1994-2000, in AbebeShimelesEssays on poverty, risk andconsumption dynamics in Ethiopia”,Economic Studies, no 155,Department of Economics, University of Göteborg.
Bigsten, Arne and Abebe, Shimeles 2007. Poverty transition and persistence inEthiopia: 1994-2004. Goteborg University, School of Business,Economics and Law.
Bigsten, A. and AbebeShimeles 2008. Poverty transition and persistence inEthiopia: 1994- 2004. World Development, 36(9), 1559-1584.
Bruno, M., M. Ravallion and L. Squire, 1996.Equity and Growth in DevelopingCountries: Old and New Perspectives on the Policy Issues, PolicyResearch Working Paper, No. 1563, The World Bank, WashingtonD.C.
Burgingnon, Francois 2003. The Growth Elasticity of Poverty ReductionExplaining Heterogeneity among Countries and Time Period’ WorldBank Research Group (Mimeo)
Chenery, H, M. S. Ahluwalia, C. L. G. Bell, J. H. Duloy and R.Jolly1974.Redistribution with Growth: Policies to Improve Income

Alemayehu Geda and Addis Yimer
64
Distribution in Developing Countries in the Context of EconomicGrowth. Oxford: Oxford University Press
Datt,G. and Ravallion ,M1992. Growth and Redistribution Components ofChanges in Poverty Measures : A Decomposition with Applications toBrazil and India in the 1980s,Journal of DevelopmentEconomics,38:275-295
Dercon, S. 2001. Economic reform, growth and the poor: Evidence from ruralEthiopia. Working Paper Series 2001: 8, Centre for the Study of AfricanEconomies, Oxford, Oxford University.
Dercon, S. 2006. Economic reform, Growth and the Poor: Evidence from RuralEthiopia. Journal of Development Economics, vol. 81, issue 1, pp.1-24
Dercon, S. and Krishnan, P. 1998. Changes in poverty in rural Ethiopia 1989-1995: Measurement, robustness tests and decomposition. Working PaperSeries, 98:7, Centre for the Study of African Economies, Oxford, OxfordUniversity.
Dercon, Stefan, Ruth V. Hill and Andrew Zeitin 2009.Rethinking Agricultural-led Growth in Ethiopia.Synthesis Paper Prepared as Part of a Study onAgriculture and Growth in Ethiopia Conducted for DFID, University ofOxford, Unprocessed.
Dercon , S., Hoddinott ,J. ,and TassewWoldehanna 2007.Growth and Poverty inRural Ethiopia: Evidence from 15 Communities 1994-2004. BackgroundPaper for the Chronic Poverty Report 2008-09.Chronic PovertyResearch Centre
Dercon, S., and MekonnenTadesse 1999.A Comparison of Poverty in Rural andUrban Ethiopia.Ethiopian Journal of Economics 8, no. 1: 83-98.
DesalegneRahmato 1992. The Dynamics of Rural Poverty: Case Studies from aDistrict in Southern Ethiopia’ CODESRIA Monograph Series, 2/92,Dakar, Senegal.
Dagdeviren, H., John Weeks and Rolph van der Hoeven 2000.RedistributionMatters: Growth for Poverty Reduction, SOAS Department ofEconomics Working Papers, No. 99, (London: School of Oriental andAfrican Studies)
Dollar, David 2001.Globalization, Inequality, and Poverty since 1980.Background Paper, Development Research Group,World Bank,November
Dollar, D and A. Kraay, 2000. Growth is Good for the Poor. World Bank PolicyResearch Working Paper No. 2587

Growth, Poverty and Inequality, 2000-2013 A Macroeconomic Appraisal
65
Easterly, William, Ross Levine, and David Roodman 2004.New Data, NewDoubts: A Comment on Burnside and Dollar’s “Aid, Policies, andGrowth’, American Economic Review, 94, no. 3, June.
EDHS (Ethiopian Demographic and Health Survey) 2011. Addis Ababa: CentralStatistics Agency
Fields, Gary 1980.Poverty, Inequality and Development.Cambridge:CambridgeUniversity Press
Fields, G. S. 1998. Do inequality measures measure inequality? [Electronicversion]. In S. P. Jenkins, A. Kapteyn, & B. M. S. Van Praag (Eds.) Thedistribution of welfare and household production. Cambridge:Cambridge University Press, pp. 233-249
Foster, J., Greer, J., and Thorbecke, E. (1984). Notes and comments: a class ofdecomposable poverty measures. Econometrica, 52(3), 761-766.
Fosu,AugustinKwasi 2009. Inequality and the Impact of Growth on Poverty:Comparative Evidence for Sub-Saharan Africa,Journal of DevelopmentStudies, 45(5), pp 726-745
Hulme, D.; Shepherd, A 2003. Conceptualizing Chronic Poverty, WorldDevelopment, Volume 31, Number 3, March 2003 , pp.403-423.
IMF (International Monetary Fund) 2012. IMF Country Report on Ethiopian,No. 12/287. Washington, D.C., October
Jerven, Morten (2013). Poor Numbers: How We are Misled by AfricanDevelopment Statistics and What to Do About IT. Ithaca: CornelUniversity Press.
Kanbur, R. (1999). Income Distribution and Growth, World Bank WorkingPapers: 98-13, Washington: The World Bank)
Kuznets, Simon 1953.Shares of upper-income groups in income and savings,National Bureau of Economic Research, New York.
Li, H., L.Squire and H.F. Zou1998. Explaining International Inequality andIntertemporal Variations in Income Inequality, Economic Journal,108:26-43.
MekonnenTadesse 1996. Food Consumption and Poverty in Urban Ethiopia: APreliminary Assessment. In Proceedings of the Fifth Annual Conferenceon the Ethiopian Economy, Kebede, B., and M. Tadesse (eds), AddisAbaba.
MekonnenTadesse 1999. Determinants and Dynamics of Urban Poverty inEthiopia.Ethiopian Journal of Economics8, 1: 61-82.
MOFED (Ministry of Finance and Economic Development) 2006.Ethiopia:Building on Progress - A Plan for Accelerated and Sustained

Alemayehu Geda and Addis Yimer
66
Development to End Poverty (PASDEP) (2005/06- 2009/10) Volume I:Main Text, Addis Ababa.
______ 2002.Poverty Profile of Ethiopia: Analysis based on the 1999/00 HICE& WM Survey Results. Welfare Monitoring Unit (WMU), Ministry ofFinance and Economic Development (MOFED), Federal DemocraticRepublic of Ethiopia.
_______ 2003. Ethiopia: Sustainable Development and Poverty ReductionProgram-Annual Progress Report (2002/2003), December, AddisAbaba.
______ 2008. Dynamics of growth and poverty in Ethiopia (1995/96-2004/05).Development Planning and Research Department, Ministry of Financeand Economic Development. April, Addis Ababa
______2012. Ethiopia`s Progress Towards Eradicating Poverty: An InterimReport on Poverty Analysis Study (2010/11), May, Addis Ababa.
_______ 2013. National Economic Accounts Statistics of Ethiopia, Estimates ofthe 2010/11 Base Year Series, April, Addis Ababa
Naschold, Felix 2002. Why Inequality Matters for Poverty. Department forInternational Development (DFID) Inequality Briefing, London
Nissanke, Machiko and Thorbecke, Eric 2008. Globalization and Poverty inAsia: Can Shared Growth be Sustained? In: Nissanke, Machiko and andErik Thorbecke, eds. (2010) The Poor under Globalization in Asia, LatinAmerica and Africa. Oxford: Oxford University Press.
Odedokun ,M.O. and Jeffery I. Round 2004. Determinants of Income Inequalityand its Effects on Economic Growth: Evidence from AfricanCountries,African Development Review, 16(2), pp 287-327.
OPHI(Oxford Povertyand Human Development Iinitiative) 2013. HowMultidimensional Poverty Went Down: Dynamics and Comparisons.University of Oxford.
PovcalNet2013.World Bankdata,http://povertydata.worldbank.organdhttp://iresearch.worldbank.org/PovcalNet/index
Ravallion, Martin, 1997. Can high-inequality developing countries escapeabsolute poverty?,Economics Letters, 56 (1), pp 51-57, September
Ravallion, M. 2001. Growth, Inequality and Poverty: Looking BeyondAverages,World Development 29, 1803-1815.
Ravallion, Martin, 2005. A poverty-inequality trade-off?, Policy ResearchWorking Paper Series 3579, The World Bank

Growth, Poverty and Inequality, 2000-2013 A Macroeconomic Appraisal
67
Ravallion, M., and B. Bidani 1994.How Robust is a Poverty Profile?The WorldBank Economic Review 8, 1:75-102
Romer, P. 1986. Increasing Returns and Long-Run Growth, Journal of PoliticalEconomy,94:5, 1002-37
Rutstein, S. Gwatkin, D.R,K. Johnson, R.P. Pande, and A. Wagstaff (2000).Socio-economic Differences in Health, Nutrition and Population, HNPPoverty Thematic Group of the World Bank.
SolomonGebre1995.The Condition of the Poor in Addis Ababa: A SocialProblem Not Yet Addressed in AsfawDesta and DesalegnRahamato(eds.), Dialogue, Journal of Addis Ababa University TeachersAssociaiton, Vol 2, No 1.
Stewart, F. 2002. Horizontal Inequalities: A neglected dimension ofdevelopment. QEH Working Paper Series, Centre for Research onInequality, Human Security and Ethnicity (CRISE) Oxford: CRISE.
Swanepoel, C. 2005. Poverty and Poverty Dynamics in Rural Ethiopia,Stellenbosch Economic Working Papers, 3 / 2005, University ofStellenbosch
TassewWoldehanna and TekieAlemu 2000. Poverty Profile of Ethiopia. AReport for Welfare Monitoring Unit (WMU), Ministry of Finance andEconomic Development (MOFED), Federal Democratic Republic ofEthiopia (FDRE), Addis Ababa
TassewWoldehanna, John Hoddinott and Stefan Dercon 2008. Poverty andInequality in Ethiopia: 1995/96 – 2004/05.
UNDP 2013. The Rise of the South: Human Progress in a Diverse World.Explanatory note on 2013 HDR composite indices.Violence inMultiethnic Societies. Frances Stewart (ed.) New York: PalgraveMacMillan.
White, H. and Anderson, E. 2001. Growth versus Distribution: Does the Patternof Growth Matter?Development Policy Review, 19: 267–289.
World Bank 2012. World Development Indicators.Washington,DC: World Bank.
World Bank 2013. World Development Report. Washington,DC: World Bank

69
3 Assefa Fiseha
Development with or without Freedom?
Introduction
The 1995 Ethiopian constitution provides for all three generation of rights.1 This very constitution is declared to be the supreme law of the land (Article 9). Ethiopia has also adopted major international treaties on human rights such as the International Covenant on Civil and Political Rights (ICCPR) and the International Covenant on Social, Economic and Cultural rights (ICSECR).2 By virtue of Article 9 of the constitution such treaties are considered as ‘an integral part of the law of the land.’3 Furthermore Article 13(2) stipulates that the fundamental rights and freedoms specified in chapter three of the constitution shall be interpreted in a manner conforming to the principles of the Universal Declaration of Human Rights (UDHR), international human rights covenants and instruments adopted by Ethiopia. Chapter three of the constitution guarantees a host of individual and group rights and constitutes one-third of the constitution. Further along this line, human rights in the Ethiopian constitution are also entrenched and given constitutional protection through a rigid amendment procedure. Thus the constitution and international treaties provide the institutional recognition of human rights. Nevertheless, as this paper illustrates, there appears to be a differing commitment on the part of the government in its promises to deliver development in the socio economic and cultural sectors on the one hand, and civil rights and political freedoms on the other. What explains this differing commitment and what implications does it bring to civil and political freedoms particularly when they are constitutionally entrenched?
1 Of course, it is possible to find out some hierarchies within the constitution, for example, between those rights that focus on nations, nationalities and peoples on one hand and individual rights on the other. Balancing these competing rights is a difficult exercise as it needs interpretation and while interpreting constitutional clauses, hierarchy of values gives some clue to the interpreter. The amendment and emergency clauses also corroborate the same point. 2 See Art 9(4) and the core international instruments signed by Ethiopia. 3 What this means is far from clear. Does it mean that such treaties have equal status with the constitution or only with proclamations? See for details Sisay 2008
68
Assefa Fiseha
70
Based on the East Asian experience with developmental state and the way it is emulated by the ruling party, the Ethiopian Peoples’ Revolutionary Democratic Front (EPRDF), the key argument that is made in this chapter is that the ideological shift towards the developmental state gives priority to the socio-economic sector than civil rights and political freedoms. This is in spite of the fact that the constitution places equal weight on all generations of rights. There is certainly an evolving tendency that focuses more on economic growth at the expense of civil rights and political freedoms. The weakness of the institutions that enforce human rights further aggravates this state of affairs. As indicated in the last section, the House of Federation (HoF) and the Courts that are the primary institutions for enforcing human rights, continue to suffer from lack of clarity in their respective roles.
As Japan and of late South Korea’s experience demonstrate economic growth and respect for human rights can be achieved simultaneously without prioritizing one over the other and indeed that is what the Ethiopian constitution stipulates. ‘Development as Freedom’ as articulated by Amartya Sen (1999) also indicates that development is not merely about improvements in the socio economic sector, crucial in itself, but also includes the enjoyment of freedoms. In Ethiopia, the government’s determination of putting economic growth first and rights/democracy next is not only problematic but also contradicts with the spirit of the constitution. Civil and political freedoms seem to be sacrificed in favour of a better performance in the socio economic and cultural sectors at least in the short run.4 The long term effect is far less predictable but it is not difficult to state that whatever gains made in the socio-economic sector could risk political instability unless the government demonstrates equal commitment to civil rights and political freedoms. Improvement in the socio-economic sector has the potential to create a middle class that will show less tolerance towards the authoritarian state in the long run. Whether the new generation of leaders of EPRDF will continue adhering to the ‘democratic developmental state’ as articulated by the late Prime Minister Meles Zenawi resulting in development and less freedom or will introduce political reform to make it genuinely democratic and developmental is something that is too early to tell.
The chapter has six sections. The different sections analyze the institutional foundations of the developmental state, namely, its institutional architecture, the role, alignment and capacity of the state in industrialization, the nature and function of the civil service and lastly the contentious issue of whether the developmental state could at the same time ensure democracy and respect for human rights. The study uses the experience of some East
4 See the last two sections of this paper that demonstrate this point further.

69
Development with or without Freedom?
71
Asian countries on developmental state as a framework for analyzing the nature and challenges of the evolving developmental state in Ethiopia. Institutional architectures of the developmental state and its role in socio-economic development Ethiopia is a country that has suffered for long because of food insecurity. The current government has made it clear in its Growth and Transformation Plan (GTP), a core document that defines the government’s developmental goals as: the eradication of poverty, achieving the Millennium Development Goals by 2015 and transforming Ethiopia into a middle income country by 2020-2023.5 Accordingly, it has designed relevant policies and targets a minimum of 11 percent6 economic growth that should be equitably shared across regions and across society to achieve the stated objectives. EPRDF since it took power in 1991 after overthrowing the military junta has committed itself to a more ‘activist state’ as opposed to the liberal state. Based on the experience of some South and East Asian states such as South Korea, Singapore, Japan and currently China, the late PM Meles Zenawi, who was also the chief ideologue articulated ‘democratic developmental state’7 as its party policy to take centre stage in Ethiopia.
EPRDF’s ideological roots ‘Revolutionary Democracy’ have largely been leftist. It has never been clearly set out in a manner where the rank and file cadres would understand and be able to explain it. Particularly since 1995 with more liberal elements included in the federal constitution,8 its own high ranking officials have been in the dark as to whether the EPRDF has abandoned its ideology and moved more to the right.9 The only leftists elements included in 5 See the Growth and Transformation plan (GTP) 2010/11-2014/15 v.1 Main Text, Ministry of Finance and Economic Development November 2010, Addis Ababa. 6 Figures are often contested. For example, the Ethiopian government estimate for the 2012 fiscal year was close to 10 percent growth, while the IMF claims only 7 percent. The World Bank’s estimate is however in line with Government’s estimate. See Aaron 2013; World Bank 2012. 7 The exact dates of when the ‘developmental state’ as an alternative system of governance for ensuring rapid economic growth with the state, not market as chief architect of development emerged is far from clear. Yet there are some indicators that EPRDF started to articulate this concept towards the early 2000’s. See Speech by the late Prime Minister Meles Zenawi 2006 and Reporter 201. 8 As argued in this paper constitutional entrenchment of human rights implies a limited government more than anything else. 9 The ambiguity among high ranking EPRDF leaders was at the center of the debate between former Prime Minister Meles Zenawi and former President Dr. Negaso Gidada during the party crisis in 2001. The PM then insisted publicly that EPRDF’s agenda as reflected in the constitution

70
Assefa Fiseha
72
the constitution and other policies are the land policy, the state monopoly over telecommunications and energy, opening up the financial sector only for Ethiopian private sector and the right to self-determination and the collective rights of ‘nations, nationalities and peoples.’ However, of late EPRDF seems to have shifted from the more ambiguous ideology of Revolutionary Democracy to that of developmental state. Understanding some of the key features of the developmental state is vital in order to grasp and explain the context in which it is currently applied in Ethiopia.
State-led development Developmental state is an institutional, political cum ideological arrangement that evolved from Japan’s post war economic recovery and that was later adopted by some East Asian countries (Johnson, 1982). Even if the concept initially evolved from Japan’s post war experience, it adapts or even transforms itself in reaction to new developments (Beeson, 2009). One may say, the developmental state is not at all a theoretical construct but rather a ‘catch up’ mechanism for late industrialized states and based on particular contexts (see Johnson, 1982:275; Mkandawire, 2010:59-61). Given the global economic crisis in 2008/2009, there seems to be a growing interest in the developmental state particularly in the developing world. The current dictum as Peter Evans alludes, ‘no developmental state, no development’ (World Bank, 1997: ii). Thus despite variations across states and time, it is crucial to identify some of its key institutional foundations.
Many seem to agree that the developmental state delivers results when it manifests four vital features. One is the role of the political leader’s ideological/political orientation and capability to design the development agenda of the country. In sharp contrast to the nature and role of the state advocated by the Bretton Woods Institutions in the early 1990s, the developmental state assumes a transformative role (Edgheji 2010). The developmental objective is more of a political decision backed by the ideological rationale of nationalism and the urgency to ‘catch up’ than a mere economic policy. Developmentally oriented political elite is in the driver’s seat of the economy that also has the mission of creating development oriented ideological hegemony. The legitimacy of the party and political institutions as such is not based on periodic and regular elections (though that is crucially relevant, if the state claims to be democratic) but on continuous delivery of rapid economic growth and improved living is ‘Nech (white) Capitalism.’ Apparently H.E Ato Bereket Simon’s book entitled ‘A Tale of Two Elections (of 2005 and 2010) in Amharic published in 2003 E. C. provides useful details on the same point and hence the question is when and how the ‘developmental state’ will phase out, if it ever will?

71
Development with or without Freedom?
73
standard of the population. It is not merely about state’s intervention in the economy for nearly all states intervene in the market for one reason or another.10 It is about how the government intervenes and the purpose it claims to serve that distinguishes it.11 In short it is a state led economic development. The state selects strategic sectors, and gives priority to achieve its developmental objectives. In other words, the state took developmental function (Johnson, 1982: 271) by giving precedence to industrial policy. Given that the private sector’s capacity is limited or is merely profit driven, the argument goes; it is incumbent upon the state to serve as engine of development (Hundt, 2009).
If one looks at the GTP, how the Ethiopian government articulated its development agenda will be clear. Certainly the issue of who is responsible for the design of the development agenda in Ethiopia is far from settled. To start with, EPRDF’s experience with policy design in general and developmental state in particular has been the task of the political leadership at the highest level and not of the elite bureaucracy (if there was one). The establishment of the Planning Commission in June 2013 and the appointment of the only non EPRDF figure, H. E Mekonnen Manyazewal to head it seem to set a new trend. As was the case in some East Asian states, this new development is probably about to herald the shift in the designing and and planning of transformational development goals from the highest political leadership and line Ministry (such as the Ministry of Finance and Economic Cooperation) to a technocratic group within the planning commission.12 Such institutions were the nerve centres of development plans and policies in East Asia. They were the ones who designed the selective industrial policy and played a key role in the allocation of scarce resources such as hard currency for preferred sectors. It is too early to tell but the tendency in Ethiopia seems to assign this key responsibility to the new institution perhaps with the condition that the political leadership makes the final decision on draft plans and policies. Sorting out clearly the role of this new institution vis-à-vis- the Ministry of Finance and Economic Development and the National Bank is not going to be an easy task. There is certainly an overlap in their functions.
Very much related is the question whether the National Planning Commission will leave room for innovative policy making at the regional level which is very central to the federal constitution. Since 1995, Ethiopia adopted a federal system to accommodate diversity, ensure equitable development and to end over concentration of power at the centre. The key feature in a federal system is the constitutionally based division of power that allows regional states 10 For strategic reasons such as security, to ensure industrial safety, to protect consumers, to prevent monopoly etc. See (Johnson 1982:270). 11 There is no guarantee that it will achieve its developmental goal as intended. 12 For comparative insights see (Chang, 2010:82-94).

72
Assefa Fiseha
74
to design their own policy. Federal systems allow various policies to be experimented at regional state level in order to address local context subject to a general framework policy set by the federal government. The question is, therefore, will regional states be represented in the National Planning Commission? These are worthy questions where it is hardly possible to provide a sound answer at this stage.
Capacity of the state Strongly related to the idea of state led development is the importance of capacity and commitment of the state to design, implement, penetrate and mobilize power and resources to attain its objective (see Doner et al, 2005:327-361). What the developmental state demands is a strong, stable and centralized state with a cohesive bureaucracy (Evans, 2010). This is a key condition that gives it a huge potential for action in achieving its developmental goals. No surprise that the EPRDF has more than any government in Ethiopian history penetrated deep into society. Kebeles were the lowest level state agents that the Derg (military junta 1974-1991) established when it was in power. EPRDF has set ‘a one to five’ structure at the lowest level going down even to the family level. The average family size in Ethiopia right now is not more than six. EPRDF, one could state, is now able to reach every family in the country. This provides the ruling party a huge potential for mobilizing resources and the people for its developmental objectives. For example, the success stories in relation to reduction of child mortality and improved maternal health is partly because of this structure but as indicated later, this is not without drawbacks to the democratization process. As illustrated later, the state is not only capable and coherent but also sufficiently close to (embedded) society. This also poses threats related to corruption and being exposed to business influence (Evans 1995).
Strong and merit-based bureaucracy A key institutional feature that comes with the state led development is the importance of strong bureaucracy. As the capacity of the state and its commitment to the developmental objective is crucial, the bureaucracy is not only recruited and promoted on impersonal, competitive and meritocratic basis (Evans, 2010: 45; Mkandawire, 2010: 63) but also has the additional responsibility of implementing the developmental goal. As such those who design, implement and monitor the development of the economy are supposed to be the creams of the nation; the best trained and highly paid technocrats.
Furthermore the civil service in many developed countries is not only recruited and promoted based on merit but also continues to provide its services

73
Development with or without Freedom?
75
despite changes in political parties following election. Only the political leadership is changed while retaining the civil service. Even in China and some East Asian countries, the system is competitive and able to attract capable civil servants by offering better services and opportunities than the market (Fukuma, 2012). In China, in particular, to join higher ranks within the Communist party, delivery of better economic growth at the provincial level remains a critical variable apart from party loyalty. It is thus possible to be competitive even under one party state (Beeson, 2009).
The civil service13 in Ethiopia is not immune from politics and the public sector has not been able either to retain or attract capable people.14 Several studies conducted about this sector indicate that the civil service in Ethiopia has suffered from political clientelism where informal/personal links, for example – belonging to the nobility either directly or through marriage and family and remaining loyal to the political executive such as the Monarch, or the Derg mattered more than technical competence (Haile Kiros, 1978). Indeed for the most part of Ethiopia’s long history, there was little demarcation between political leadership and the administration. Up until the early 1960s provincial governors and the emperor in particular retained all three functions – legislative, executive and judicial powers. Even after the 1960s and the establishment of the Central Personnel Agency (CPA) that was tasked with the idea of formulating merit based standard rules for recruitment, training, promotion, transfer and retirement, political loyalty to the regime overshadowed impersonal recruitment hence the proverbial saying of ‘shum shir’ ‘dej tinat’ and ‘sishom yalbela sishar yikochewal.’15 Politicization of the civil service and the overall subjugation of this sector to party and political control continued during the Derg (see Meheret 1997).
13 It refers to experts that implement policies and whose tenure is not dependent on elections but on merit and efficient delivery of services. Ministers, members of parliament, the armed forces, the police and judges do not constitute the civil service. African civil service in general and that of Ethiopia in particular suffers from politicization of the sector. See for details (Olowu, 1995:104, 109). 14 Even after EPRDF assumed power and commenced the civil service reform program, the sector lacked stable leadership. Initially, it started on a project basis and in a fragmented manner where various sectors were engaged in the reform, no one centre coordinating it. It later (in 2002) received central leadership from the Ministry of Capacity Building and was then again taken over by the Ministry of Civil Service when the former was liquidated in 2010. 15 These are well known proverbs on the Ethiopian public sector meant to indicate that civil servants are at the mercy of the political leader and these uncertainties pave the way for corrupt practices. Knowing that the civil servant will be fired soon, he/she is expected to ‘snatch as much as he/she can’ else the civil servant will regret it for the rest of the time. For details see (Haile Kiros, 1978)

74
Assefa Fiseha
76
Since it took power in 1991, EPRDF has tried to introduce reforms to the civil service sector through the stipulations and the public display of ethical principles; introducing customer oriented and decentralized service,16 improvements in designing strategic plans to enable the civil service deliver much desired services. But the reforms do not seem to have brought the desired outcomes. On the positive note, one of the new developments in post Meles EPRDF leadership is the emergence of a new position with the title of Deputy Prime Minister for the good governance cluster.17 This institution seems to be the driving force for all reform efforts currently going on in the country. et as recently November 7, 2013, Prime Minister Haile Mariam Desalegn in a televised speech expressed his anger over the ‘unnecessary delay’ in making decisions in many government institutions. A recently issued government document hints that the reform process among others lacked a committed political leadership at the middle and higher level. Sample studies from some federal line ministries show that line ministries have shown improvement in the delivery of services (Sirgut, 2006)18 but a lot remains in terms of enhancing the participation of employees in the sector, engagement of stake holders, improving transparency in the decision making process, respecting the right of employees, improving the overall working environment, clarifying the ambiguous variables used for the selection/appointment of the sira hidet balebet (process owner as they are often called) and the leader in the ‘1 to 5’19 task force at the grass root level (See Sirgut, 2006). Besides as discussions with senior experts of the
16 Key development in this respect is the creation of ten sub cities in Addis Ababa and subsequently in nearly all bigger cities of Ethiopia that brought significant improvement compared to the previous era of services from one centre. 17 This office was headed by H.E Muktar Kedir who was also the deputy chairman of the Oromo Peoples Democratic Organization, one of the four coalition partners of EPRDF and Minister for Civil Service. The civil service reform that is being conducted throughout the country is now accountable to this office. 18 Even in these sample institutions of late there is unfortunately some regression. The provision of electricity, water and telecommunication services particularly in terms of quality and efficiency seem to be getting worse, not better. See (The Reporter 2013) editorial calling an explanation and apology from the government for the frequent failure to deliver these crucial services. 19 In one regional state, the regional state Council indeed issued a law proclaiming expressly that ye sira hidet balbet is a political appointment but later retracted it, indicating the confusion even at the highest level. The ‘1 to 5’ task force organized in all sectors at federal and state level is meant to be led by one person selected by his/her best performance in the sector like the role model. He/she then leads the group in discharging whatever is to be done. Yet in practice the process of selection and the criteria for selecting the team leader are far from clear. In some regional states after a brief confusion they seem to have got to the point. In other regional states there is a tendency to pick the leader on arbitrary or political loyalty basis. A few other states have not even started it. Interview held with two regional state bureau heads in August and September 2013. On the origins and rationale for the ‘1 to 5’ structure. See (Bereket, 2011:205-207)

75
Development with or without Freedom?
77
civil service bureau in three regional states demonstrate, it is not clear how the heads of the sira hidet balebet and ‘1 to 5’ limatawi serawit (developmental army) structure fit into the existing structure.20 There is a tendency of setting up a parallel structure: the old and the new ‘1 to 5’ and it is not clear whether the new structure is to be subjected to, replace or supersede the existing civil service structure.21 More controversial however is whether the sira hidet balebet and team leader are political positions in which political loyalty plays a big role or whether the two positions are open for competition and hence the heads are selected because of merit and efficient performance. Right now the situation is far from clear and varies from one regional state to another. In some regional states the two positions are considered as political appointments while in others as civil service positions. In other regional states, the two positions combine both political and merit considerations in which the heads are subject to two accountability instruments both political and merit based.22
Table 1. Total number of civil servants in Ethiopia (Federal and Regional) as of June 2011
Region Region Total Tigray 63,736 Afar 18,197 Amhara 170,951 Oromia 298,035 Somali 36,732 Benishangul Gumuz 16,742 SNNPRS 187,251 Gambella 10,614 Harari 4,869 Addis Ababa 40,690 Dire Dawa 6,384 Federal government 72,515
Grand Total 926,716
SOURCE: Federal Ministry of Civil Service Human Resource Statistics 2011.
20 Interview with three senior regional state experts held in August 2013. 21 The Minister of Justice did in his speech aired on ETV on November 7, 2013 (on good governance) indicate that there is lack of clarity between the old and the new structure and as a result there is the risk of returning back to the old system. 22 Interview with three experts of regional state civil servants held in August 2013.

76
Assefa Fiseha
78
Thus the biggest challenge is that the civil service in Africa in general and in Ethiopia in particular suffers from extreme politicization. As such there is no clear distinction between the civil service and the political leadership or at least the boundary is fluid. The assumption is that political parties and governments come and go but the civil service remains to serve governments as an institution. Nevertheless, the policy of the Derg regime that politicized the civil service and the limited success of the reform process under the EPRDF have not improved the independence and neutrality of the civil service.
In some institutions, EPRDF’s reform agenda has been used as a means to avoid ‘unwanted technocrats’ and replace them by political loyalists. Instead of insulating this sector from politics, EPRDF indeed attempts to swell its size by increasing its members in the civil service.23 It is widely believed that recruitment, retention and promotion to higher positions within the civil service are very much influenced by membership in the ruling political party and political affiliation.24 If merit is relegated then how is the civil service going to deliver the minimum services, let alone of accomplishing the mission of the developmental state?
Building the capacity of the civil service and injecting merit to it will surely have a significant effect in improving the capacity of the state; otherwise the mission of the developmental state will be at risk.
The ideal civil service brings technical expertise to the government owing to education, training and neutrality it enjoys. Some of the challenges thus still haunt the sector to date (Federal Civil Service Ministry, 2013)25 According to the Federal Civil Service Ministry, of the total regional state civil servants (854,201) only 28 percent have first degree and above qualification. Of the total federal government’s civil servants (72,515) only 13 percent have first degree and above qualifications. Indeed, it is the least paid section in the public sector that continues to suffer from loss of its senior experts to the private sector. The dilemma of whether the civil service and the technocrats should be mere agents of developmental state limatawi serawit (development army) as the Ethiopian government currently claims or should enjoy some level of autonomy as technocrats remains an unresolved issue even today. Injecting merit,
23 See for details (Girmay, 2012: 100ff) where he states more than 95% of the civil servants in four sample weredas are members of the TPLF.p.103; another source on the civil service in the SNNPRS puts the figure even higher. Interview held in Hawassa August 22, 2013. 24 Even higher institutions that are supposed to have modest autonomy to pursue academic debates freely are not immune from this trend. 25 It is interesting to note though that the very same document dictates that only merit and no other criteria should be the basis for assessing the performance of civil servants. It as well emphasizes that this is basis for institution building in the sector. See (Federal Civil Service Ministry, 2013)
77
Development with or without Freedom?
79
depoliticizing the sector and designing mechanisms to retain senior experts in the civil service are probably going to be the Achilles heel of the Ethiopian government. The above evidences show that this sector is affected by neo-patrimonial and informal political variables than through formal laws that govern the civil service. Given this reality, it is to be naive to expect the civil service to effectively implement the development policies set by the government.
Federalism also brings its new set of challenges. True that Ethiopia is a federation that opens up to accommodate its diversity and that demands a fair representation of its different nationalities in the civil service.26 The problem is, however, the way representation is secured. On the one hand, representation can be made on the basis of merit and individuals from the different nationalities with the required skill and experience could be recruited. On the other hand, it can be done by undermining meritocracy and merely focusing on political loyalty (Peters and Pierre, 2005). Inefficient bureaucracy recruited principally on the basis of political loyalty is sooner or later going to be an obstacle to the mission of the developmental state.
State society coalition – embedded but autonomous state Another feature of the developmental state is what Peter Evans calls the ‘state-society relations’ (Evans 1995).27 In other words the developmental state should remain autonomous but strongly embedded into society. Unlike orthodox socialism or communism, that insists on state monopoly, developmental state accepts partnership with business elites (domestic or foreign) and other sectors of society. The ultimate goal of the state – development - is not the exclusive domain of the political elite or the bureaucracy – but should be a shared agenda that is based on a broad based social and political coalition (Evans, 2010: 45). The state maintains its internal organization but must be strongly tied to (embedded in) the society, the business community, the youth, women, farmers, trade unions and the civil society in order to enhance their role in development. It is difficult to meet the developmental goal, if there are factions and disagreements within the political elite and the bureaucracy. In a way the fact 26 This is a goal that is not yet fully achieved. A recent statistics indicates that of the total 65, 238 civil servants at federal level, there are only 65 Somali’s (0.1 %); 83 Afar’s (0.13%); 15 Gumuz (0.02%); 42 Nuer (0.06%); Anywa 42 (0.06%). Human Resources Statistics 2010 issued by the Ministry of Civil Service. 27 Peter Evans (1995): titled his book embedded autonomy which in a way is a paradox, if the state is close to or embedded in the society how can it remain autonomous? The literature is far from clear on this point. In fact the issue of ‘crony capitalism’ or corruption, the major challenges to the developmental state model seems a problem because of its exposure to business influence. Despite developmental state’s zero tolerance to corruption, it remains exposed to it. See ( Beeson, 2009:10; Johnson, 1982:.273-274).

78
Assefa Fiseha
80
that EPRDF is a strong (centralized) rural and mass based party28 gives it a leverage to steer the development agenda. But the same structure could also be a threat to the emergence of an autonomous and less politically affiliated civil society in Ethiopia. The implication of this feature for the developmental state of the twenty first century is massive. This institutional feature implies that the process of designing the development agenda and its overall implementation requires not only a democratic decision making process but also a deliberative one.29 Yet as illustrated later, the democratic credentials of the developmental state in the last century were suspect as it has been associated with authoritarian developmental states.
The state while embedded in society must maintain its policy making autonomy from domestic and foreign pressures (partisan, economic/business, class, global forces) to enable it design the developmental goal free from pressures. Two crucial challenges emerge in this regard. One is the issue of balancing technocratic autonomy versus the ideal of broad based societal coalition that may need more deliberative procedures and mass based decision making. The second is the possibility that when the state creates strong ties with the different sections of society, the political elite and the bureaucracy may fall trap into rent seeking behaviors and misuse of power and engage in corrupt practices (Evans, 2010: 52).
The fact that there are a few economically powerful groups in the Ethiopian economy was until recently considered as a favorable condition to the ruling party’s hegemony in the designing of development plans. Yet the corruption charges against some government officials and high profile members of the business community in 2013 indicate that unless supported by a strong institutional check and balance, the system is vulnerable to corruption and the state’s autonomy can easily be hijacked.30 Donor pressure is also a source of tension. EPRDF has not been that easy to deal with when it comes to donor
28 Although EPRDF has shown some flexibility in the last ten years by enlisting new members from urban youth and women, it is widely known that it represented the lower class mainly the rural farmers which constitutes 85 percent of the Ethiopian population. 29 Democracy is often understood as mere conducting of regular free and fair elections in which competitive parties campaign often during elections but deliberative democracy assumes continuous engagement of the public in public affairs without limiting its participation to the time of elections. 30 The Director of the Revenue and Customs Authority, his deputy and high profile business men were accused of corruption and brought before court in 2013. What is interesting about this development is that some of the business men were close to the government so much so that they even created a group called ‘limatawi balehabtoch’ (developmental investors) as opposed to ‘rent seeker’ investors and may have had a big share in financing the 2010 federal and regional state elections.

79
Development with or without Freedom?
81
agencies. As some studies hint, it strives hard to maintain its policy making autonomy, despite pressures coming from donors (Dereje, 2011).
Despite all the daunting challenges related to institutionalizing the developmental state, the Ethiopian state seems to have delivered fairly well in the socio economic sector. Until 2002 the total revenue collected both by federal and state governments did not exceed 7.8 billion birr annually. By 2012 the figure has reached 86 billion birr annually and the plan is to finance government’s entire plan from domestic revenue sources.31 Ethiopia has used its own budget and donor aid effectively in securing a consecutive economic growth of 10 percent or more32 and for the expansion of infrastructure. Although it is overshadowed by high rate of inflation33 and corruption, the 10 percent economic growth that has been registered for r a number of years made the country the fastest non-oil growing economy in Africa. In order to create jobs, the government actively uses Micro and Small Enterprises (MSE). It provides credit, training and land for those who participate in this scheme. The number of SMEs was no more than 22,000 in 2006. The number is now approaching 136,000 and nearly 600,000 jobs have been created through this scheme. As part of the effort to solve the critical problem of residential houses in cities, the government has built between 2006 and 2012 some 200,000 houses in the form of condominiums (low cost apartments), nearly half of it in the federal capital Addis Ababa (EPRDF Report 2013). Currently this project has been expanded with various options being provided to citizens and it is hoped that the housing problem in the major cities will be ameliorated significantly.
The share of Ethiopia’s living under poverty (less than a dollar a day) has fallen from 45 % in 1991 to 29 % in 2011. Export has risen sharply and series of hydroelectric dams34 have boosted the economy so much so that the country plans to be the energy giant of the Horn region exporting electricity to some
31 Ethiopia’s annual budget in 2012 was 130 Billion Birr; the difference is currently covered from donor agencies and loans. The plan is to finance all government activities from collected revenue which is considered key condition for ensuring the autonomy of the ‘developmental state.’ Ethiopia uses 60% of its budget for capital projets (EPRDF Report 2013). 32 The average economic growth between 1974 -1991 was 1.7 %. The Governments plan for the next three years based on the GTP is a minimum of 11% every year. The IMF however stated the 2013 economic growth much lower (7 percent) than what is stated by the government (EPRDF Report 2013). 33 In 2011, the rate of inflation reached 45% and is currently estimated to be 12% (EPRDF Report 2013). 34 In 1991, Ethiopia produced 300 Mega Watt only. It is now approaching 8000 Mega Watt. The biggest investment in this respect is the Grand Ethiopian Renaissance Dam (GERD 6000 MW) which has the potential to transform Ethiopia from mere consumer to exporter of electricity to its neighbors and earn much needed hard currency.

80
Assefa Fiseha
82
neighbouring countries like Djibouti, Kenya and the Sudan (Aaron, 2011). Nearly every child in Ethiopia can now attend primary education for free. The change in this respect is remarkable from 19 % in 1991 to 96 % in 2011.35 During the last decade, some thirty one new universities have been built, that has significantly increased their enrolment from a few thousand to more than 110,000 every year and the plan is to increase enrolment of 467,000 by 2007. The new universities are fairly well distributed throughout the regional states (Year Book 2001 E,C).36 Access to health centers also improved reducing child mortality significantly. There has also been significant improvement in infrastructure such as roads (only 18,560 km. in 1991 and now more than 80, 000 km still small but expanding fast) and telephone services.37 These developments are important preconditions to building one economic community. Indeed Ethiopia’s investment in infrastructure is the highest in the African continent. Taking note of these encouraging developments, an observer noted Ethiopia in 2011 is richer, more accommodative to cultural and linguistic diversity, relatively more stable and peaceful but far from democratic as indicated later (see Economist, 2012; Africa Confidential, 2012). To be sure, delivery in the socio economic sector does not necessarily translate into a guarantee of socio economic rights but it certainly is an important step forward towards realizing them. In the first place, the realization of socio economic rights is based on the government’s active engagement such as the design of pro poor policies and massive investment of resources. The massive expansion in infrastructure such as roads, construction of health centers and schools provided opportunity for the people to enrol in schools and for the fulfilment of their basic needs. The construction of the low cost residential condominiums responds to fundamental needs.
Overall, government’s commitment and the allocation of huge resources for the sector respond to the age old demand for adequate standard of living. Surely there is a lot more demand but if the government continues with its current commitment and addresses issues related to quality, it will certainly lay the foundation for better life. After all the protection and enforcement of socio economic rights is very much related to resources and committed political 35 Major dividing issue in this respect is that the massification of education at all levels without necessary preparation in terms of qualified personnel, library and other necessary inputs has compromised quality significantly. 36 See for details Ethiopia ye 2001 Ametawi Metshaf (in Amharic) Ethiopia 2001 E.C. Annual Book (Addis Ababa: Master Printing House). 37 By 2001, there were some 27,000 mobile telephone users. There are now more than 22 million users. In 1991 there were only 175,653 direct telephone lines, 70% of which was located in Addis Ababa. There are now 910,353 customers. This sector still suffers from lack of efficiency. Customers continue to complain about the slow speed of the internet (EPRDF Report 2013).

81
Development with or without Freedom?
83
leadership and budgetary allocation can do a much better job than the courts. Enforcement of socio economic rights has strong budgetary and policy implications and requires the state to use resources in addressing basic needs and improve the standard of living such as access to housing, education and employment opportunities. By doing so, the government enforces this category of rights through political institutions though they may not be justiciable in the short run before courts of law.
Economic growth first, democracy next? The last and more important point to our understanding of the institutional behavior of the developmental state is the fact that the developmental state in the last century operated under either a dominant, hegemonic or one party system (Thornton and Thornton, 2008) and there is growing concern as to whether it can be a democratic and developmental one at the same time. This is an area that is not well articulated in the literature on the nature of developmental state but remains crucial for those of us interested on the issue of whether developmental state can be democratic or at least can be transformed at some stage. We have noted already that in order to achieve its developmental objectives, the developmental state needs strong center capable of mobilizing the people, resources and various actors towards one goal and that can exist only if there is a strong, cohesive and centralized party system.38 A close observation of the East and South East Asian developmental states indicate that it is based on either of three possibilities. In China, Singapore (Ortmann 2011) and South Korea the ‘developmental state’ operated under one party state and had strongly authoritarian tendencies. That was the case in Singapore under Lee Kuan Yew and South Korea under General Park Chung Hee (1961-1979) and Chun Doo-hwan (1980-1987) (Ortmann, 2011: 41, 43). The situation in Singapore was such that one version of economic growth was coined after the former Prime Minister of Singapore as the Lee thesis (see next section). None other than former Malaysia's Prime Minister Mahathir captured the dilemma that gave birth to whether development should be conceived narrowly focusing on mere economic growth or whether it should be understood broadly as articulated by Sen’s ‘development as freedom’ and beyond to include democracy. He said (cited in Davis 1998:309): 38 Atul Kohli (2004:382, 384, 386) states that except India many of the East Asian countries followed what he calls ‘cohesive capitalist route’ whose main target is rapid industrialization. With respect to India, he states it is ‘fragmented multi-class’ type where the developmental goal is broad based with multiple centres of power that also combines goals of redistribution and achieving development alongside democratization.

82
Assefa Fiseha
84
In the former Soviet Union and the East European countries, democracy was introduced along with the free market. The result is chaos and increased misery. Not only have the countries broken up, mainly through bloody civil wars, but there is actual recession and more hardship for the people than when the Communists ruled. One may ask whether democracy is the means or the end. Democracy at all costs is not much different from Communist authoritarianism from the barrel of a gun. . . . In a number of East Asian countries, while democracy is still eschewed, the free market has been accepted and has brought prosperity. Perhaps it is the authoritarian stability which enabled this to happen. Should we enforce democracy on people who may not be able to handle it and destroy stability?39
This developmental path denies civil rights and political freedoms and indeed postpones democratization as the condition for effective and rapid economic development.40 Currently China seems to be going through similar circumstances under a single communist party system (officially a one party state) where multiparty elections and human rights issues seem to be neglected in favour of rapid economic growth (Thornton and Thornton, 2008: 145).
Japan demonstrates an interesting case to the experience in the region for it is the pioneering state and because it managed to secure consecutive economic growth under a genuinely dominant party system (Thornton and Thornton, 2008: 170) that was democratic under the Liberal Democratic Party (1954-1993 under LDP) for the most part of the 20th century. The LDP in Japan neither engaged in election rigging nor intended to stay in power by force of arms. When the relevance of the developmental state dwindled by the 1990s, the voters were able to bring another party to power and the LDP did not stifle the process. Indeed, credit goes to Japan’s post war economic reconstruction from the process of which evolved the ‘Japan’s miracle’ later to be coined as developmental state (McNeil, 1994).
India is another relevant case where democracy and development reinforce each other and where a dominant party system under Congress Party later gave birth to multiparty democracy. Given that India is also a multiethnic and multi-religious with a working federal system, it could offer a more relevant experience to Ethiopia than China. In the latter, economic development has not led to democratic reforms and respect for human rights so far. The East Asian experience thus is with mixed records: there are two camps ‘camps of development with and without freedom (Johnson, 1982: 178), that is, consecutive economic growth under authoritarian developmental state as in 39 As illustrated earlier, this is the core argument of those who insist on preconditions for democratization. See (Lipset, 1959:69-105). 40 See Amartya Sen’s summary of the Lee thesis (1999:15)

83
Development with or without Freedom?
85
South Korea, Singapore and China on one hand, and economic growth in democratic developmental state with a dominant party as in India, Japan and of late South Korea on the other.
Given that there are two camps of developmental state, one democratic and another authoritarian the question is which way for Ethiopia? A one party state is certainly a paradox with democracy. It undermines regular, free and fair elections among competing parties. But it ensures policy consistency which an important requisite for the developmental state. The experience indicates that the developmental state tries to minimize policy fluctuation (Hundt, 2009). On the other hand, regular, free and fair elections assume competitive political parties and alternative policy options. In other words, realization of the goals of the developmental state depends on the ability of the party that devises development policies to maintain power for an extended period. In sum, a developmental state requires either a hegemonic or a one party system where the opposition has a fair chance of competition but is less likely to pose a threat to the dominant party (Sartori 1976: 109).
The ruling party EPRDF claims, particularly following the 2010 national and regional state elections that Ethiopia needs an Awra/vanguard/dominant party (See Addis Raey, 2011: 30-38; Teshaye, 2010).41 This claim is illustrated in various documents of the ruling party citing examples from other countries such as Japan (from 1954 to 1993).42 Yet the analogy is problematic because there seems a thin line that differentiates between hegemonic and dominant party systems. Giovanni Sartori (1976) makes a useful classification between the two. As the case of Japan’s post WWII development hints at a dominant party system, the political system is not against a multi-party system as such but it happens that the voter satisfied with the performance of the LDP continued to elect the same party in consecutive elections. In this system, there is a regular and free election and opposition parties take part in the competitive election. There is little or no complaint about the electoral process on the basis of vote irregularity or fraud. The outcome of the election is also respected by both the winners and the losers. There was no fear that if the LDP loses election it will engage in ‘extra-legal measures’ to stay in power and when it lost the elections in 1993, it did hand over power peacefully.
41 Addis Raey 2011: 30-38; Tsehaye 2010. Tsehaye Debalkew (2010) 42 See (Sartori, 1976:.109) it is good to note that Japan’s politics is very different from Ethiopia. The challenges that are related to managing ethno nationalist groups makes Ethiopian politics distinct in many respects.

84
Assefa Fiseha
86
The hegemonic party system is a bit different. To a large extent, it is not competitive and yet it is not the same as a one party state.43 There are various restrictions made on political parties that want to engage in election. Complaints on the electoral process are very common as either of the parties might engage in various kinds of election rigging. Political pluralism is far from ascertained as well. As is well known competition and uncertainty of outcomes are vital elements of a democratic electoral process (see Cheibub, 2007). In a hegemonic party type, there are indicators that hint at the certainty of the outcome: the hegemonic party will retain power. More importantly there is no guarantee that if the hegemonic party loses the election, it will transfer power peacefully. It is uncertain at least.
As indicated above, EPRDF following the 2010 election declared itself as a dominant party. Yet it is difficult to ignore the various election irregularities mentioned by several international observers and critics (Tronvoll, 2010). More importantly there are no guarantees that the designation of EPRDF as a dominant party will address the problems associated with that of hegemonic parties that stand somewhere between dominant party system and one party system as stated above. Even if the constitution and the electoral laws by and large ensure a multi-party system, the reality in Ethiopia is more problematic. True or not, in nearly all four elections held between 1995 and 2010, various kinds of electoral irregularities were reported.44 Certainly there are now growing concerns on whether Ethiopia is a multiparty or hegemonic one which to some extent affects the nature of the developmental state (Tronvoll, 2010). If we look at the 2010 national and regional elections, Ethiopia’s transition to genuine multiparty democracy is far from achieved. There are some factors that contributed to state of hegemonic party system. The first is the ruling party’s aggressive campaigns emanating from fear are related to the 2005 election crisis. Second is the advantage of incumbency (use of government institutions and resources such as the media to its advantage). Third is the better organizational structure down to grass root level (party structure, mobilized mass and ruling party affiliated organizations such as women, youth, and farmers). Fourth is the relatively improved service delivery at grass roots level coupled with controlled freedom to
43 In this regime incumbents hold elections because they know they will not lose them. Yet in a democracy, uncertainty of electoral outcomes is considered as an important indicator of democracy, that is, the outcome of the elections remains unknown before it takes place providing hint that there is level playing field and every competitive party has a chance of winning the election. Another indicator is the requirement of alternation in power, regular and fair and competitive elections see ( Cheibub, 2007:29-30). 44 See European Union report on the 4th national and regional state council elections that concluded that seen from two angles: lack of level playing field for all contesting parties and the narrowing of political space, it failed to meet international standards (see EU, 2010).
85
Development with or without Freedom?
87
the fragmented opposition (due to lack of clear and coherent alternative policy, owing to pressure from outside, lack of internal democratic practice and power rivalry within itself) yielded in one party dominated electoral outcome –only one seat went to the opposition and another one for an independent candidate. As a result, some have gone to the extent of concluding that the era of multi party system in Ethiopia is gone giving way to one party state (Tronvoll, 2010). This conclusion is perhaps harsh and too early to take but it does certainly hint where Ethiopia’s democratization process is heading.
Following the death of former Prime Minister Meles Zenawi in the summer of 2012, the parliament did show its potential in checking the executive and administrative mal practices. But it is too early to tell if this is a result of genuine institutional reform that focuses on the centrality of parliament as representative and democratic institution indicating the emergence of multiple centers of power or the result of a temporary political shift of gravity created after the death of Meles Zenawi.
A final remark is that it is also far from clear as to whether the authoritarian developmental state is an interim possibility that later evolves into a democratic state (as in Japan and South Korea after 1990s) (see Kim 2003; List-Jensen 2008) or remains an alternative governance system which seems to be the case currently in China.45 As Susan Shirk alleges, China is a fragile superpower with the world’s fastest growing economy but with an ‘authoritarian regime that fears its own citizens’ (Shirk, 2007:5-6). This issue remains crucial because there is this allegation that developmental state is sooner or later ‘its own grave digger.’46
The legitimacy of the party and political institutions as such is not based on periodic and regular elections but on continuous delivery of rapid economic growth and improved living standard of the population (capability expanding services). Consecutive economic growth, expansion of infrastructure, improved access to education and health and pro poor policies are given the highest national priority. If it succeeds in achieving this, it produces an educated, informed and demanding middle class, the very forces that put pressure for change and political liberalization. Demand for political reform becomes acute. The developmental state must then be reformed to evolve as either liberal or social democratic state as in the Scandinavian countries. If it fails to deliver
45 See (Natahn, 2013; Reilly 203). There are those who think that development without freedom will eventually give way to democratic reforms. They argue that ‘authoritarian developmental state is its own grave digger.’ Increases in economic wealth sooner or later demand political reform and hence the state has to either liberalize itself politically or will face crisis. See (Davis, 1998). 46 Evans (1995:229) argues that developmental state does not last forever as it is less attractive to advanced economies.

86
Assefa Fiseha
88
consecutive economic growth, it will invite a sudden and probably lethal political crisis (Diamond, 2012: 12). If this assertion is true then developmental state appears to be an interim period of preparation that lays the foundation for either liberal or social democratic state.47 Yet the fact that China and Singapore (one of the most advanced economies) remain authoritarian but developed economies seem to challenge the above scenario and it is too early to state that the Chinese model of developmental state under one party rule is on the wane. Indeed Singapore and China are anomalies to the thesis articulated by Lipset that argues for a long period of economic
development as a social condition for democracy.48 So it seems, there are some preconditions for democracy and the argument is ‘the more well-to-do a nation, the greater the chance that it will sustain democracy’ (Lipset, 1959:75) because it transforms the middle class and the working class, the coalition of which serves as driving force for political reform. Yet China and Singapore possibly disprove such scenario or at least are major deviations.
At this stage, it is difficult to pass on a conclusive statement as to whether Ethiopia’s developmental path is an interim and transitory economic/political regime or is an alternative political economy. Sibhat Nega, a senior but retired political figure of the ruling party is quoted to have said, EPRDF’s role is to serve as a midwife to capitalism. The state playing as an engine of development, the system will give birth to the emergence of capitalism and once a middle class emerges, the ruling party will either wither away49 or evolve to either social democracy or liberal state.
Economic growth first, rights next? The key point developed in this section albeit briefly builds on the point that there is lack of political will to protect civil and political rights compared with the strong commitment on the part of the Ethiopian government in the socio economic sector. Added to this is the weak nature of the institutions that are 47 Parts of Western Europe and largely the Scandinavian countries practiced for long the social democratic state run by left oriented political elite that focused more on welfare state and full employment than rapid economic growth in the 1950s (Evans 2010). 48 India indeed poses a major anomaly to this perspective, democratization and economic development are evolving hand in hand. This is what is often referred by Thomas Carothers (2007) as the ‘sequencing fallacy.’ Some still argue that democratization can only succeed if preceded by the rule of law, economic growth, the existence of the middle class and a well-functioning state. They contend that unless these preconditions exist illiberal and extremist ones will prevail and these very forces derail, not facilitate democratization. For an effective defeat of the sequentialist argument see (Carothers, 2007:12-27) 49 The Amharic term he used in an interview with the VOA Amharic program in 2011 is Meksem (wither away by outliving its usefulness)
87
Development with or without Freedom?
89
responsible for enforcing civil rights and political freedoms. This trend does hint at an important dilemma. An active and strong developmentally oriented executive faces little or no restriction on its way. Given that the Ethiopian government is doing well in the socio economic sector and less on civil rights and freedoms, is the government prioritizing one category of rights over others? Is this scenario an endorsement of the practice in some East Asian countries of economic growth first and rights next? In order to appreciate the nature and content of the debate that is emerging in Ethiopia, it may be useful to refer to the issue as articulated by some authorities in the context of some Asian countries. There is this contentious argument often associated with former Singapore’s long serving Prime Minister Lee Kuan Yew50 (hence Lee’s thesis) that advocated for restrictions on civil and political freedoms as a condition for rapid economic growth. Lee thesis stresses the priority of economic goals, ‘economic growth first.’ (Thornton and Thornton, 2008: 46).
The essence of the argument is that civil rights and political freedoms make little sense in societies hit by poverty. Where there is widespread poverty, priority should be given to addressing economic needs, even if that may necessitate restriction of freedoms. Freedom from hunger is what people will opt for if they were to be given a choice between economic needs and political freedoms. Yet these arguments have their own problems. In the first place, there is no guarantee that the authoritarian state will deliver the economic needs. There cannot be any better evidence than Ethiopia’s own history for this. It has gone through two long serving authoritarian regimes for much of the 20th century but its economy went from bad to worst. Equally relevant is even if economic growth is to be made; it is difficult to sustain it unless civil rights and political freedoms are guaranteed (Sen, 1999: 150).
More importantly, as Amartya Sen argued, an adequate conception of development must go beyond improving the socio economic conditions of the citizen, for development is concerned with the enjoyment of socio economic and political freedoms. Growth of GDP per Capita is not an end in itself but a proxy for improvement in human wellbeing. Respect for human rights and democracy are not necessarily incompatible with development. Indeed respect for human rights and democracy are integral parts of development. Participatory and representative political institutions are crucial in the design of the developmental agenda and in its implementation. Both processes are not merely products of technocratic work but the product of a broad based societal
50 Lee Kuan Yew who was the Prime Minister of Singapore from 1959-1990 was successful in transforming Singapore’s economy while maintaining tight political control. He argued strongly that civil and political freedoms are Western values unsuited to Asia and emphasized on ‘Asian Values.’ See (Zakaria, 1994: 109).

88
Assefa Fiseha
90
coalition with the state that need democratic deliberation (Sen, 1999: 3, 77; Evans, 2010: 43) hence the argument ‘development as freedom.’ The citizen must be engaged in the public decision making process and that can only be meaningful if designed as per the citizen’s wishes and aspirations and that can only be effective when the citizen enjoys civil and political freedoms. Improvement in the socio economic conditions and public facilities is important in itself in eradicating many obstacles of freedom but it is not enough. As the ‘occupy Wall Street’ and many other protest movements in Western capitals demonstrated, economic inequality may occur despite economic growth. Economic inequality combined with fault lines related to language and religion could lead to a political storm in developing countries. So wealth needs to be fairly shared across sections of society and across geographic zones. The determination of the content and direction of development itself is based on the enjoyment of civil rights and political freedoms. It indeed constitutes the core of development. Achieving development, Sen argues, ‘requires the removal of poverty, tyranny, lack of economic opportunities, social deprivation, neglect of public services, and the machinery of repression’ (Sen, 1999:6-7). In other words, ‘just and sustainable development is best achieved where economic and political priorities are balanced.’51 As such there is no need to sacrifice one to the other. Economic needs and political freedoms can be achieved concurrently without the need for prioritizing of one over the other.
Given the fact that Ethiopia has suffered a lot owing to poverty and nearly 29% of its people are still under poverty, it goes without saying that focusing on equitable socio economic development is a step in the right direction. What is worrisome is the tendency to undermine or focus less on civil and political freedoms. The Ethiopian constitution chapter two (Articles 8-12) provides for fundamental principles of the constitution. Article 10 in particular states, ‘Human rights and freedoms, emanating from the nature of mankind, are inviolable and inalienable,’ incorporating the natural law conception of rights (Beitz, 2009: 68). That is human rights are ‘parents, not children of the law’ (Sen, 2006:4). Chapter three of the constitution guarantees a host of individual and group rights and constitutes one third of the Constitution. Reinforcing the fundamental nature of human rights as one of the principles of the constitution, Article 104 stipulates that amendment to chapter three of the constitution can only be made if all regional state councils approve by majority vote and if the two federal houses endorse it by a two-third
51 This is articulated as the ‘concurrent model of development’ by (Thornton and Thornton 2008:7).

89
Development with or without Freedom?
91
majority vote. Human rights therefore are strongly entrenched implying that the powers of political institutions are limited.
What does constitutional entrenchment imply apart from the fact that power of the majority in parliament and the executive is limited? Another important implication is the fact that if constitutionally entrenched rights and freedoms are to remain as limitations on power, a certain institution must be established and empowered to check whether the acts and decisions of the political institutions comply with (either before they are enacted or after the fact) the constitutional norms.52 Recognition of human rights in the constitution is an important step forward but is not enough. Strong institutional protection and enforcement is a crucial requirement in giving life to constitutionally entrenched human rights. In Ethiopia, the dominant thinking is that this mandate is exclusively given to the House of Federation (HoF) as assisted by the Council of Constitutional Inquiry (CCI).53 Yet one could also strongly argue that, constitutional interpretation is also the proper mandate of the federal and state level courts at least as far as chapter three is concerned.
The corner stone provision in this regard is Article 13 of the constitution which has so far attracted little attention both from practitioners and the academia. Sub article one stipulates ‘All Federal and State legislative, executive and judicial organs at all levels shall have the responsibility and duty to respect and enforce the provisions of this chapter.’ To be sure the provision imposes obligations on all public institutions but owing to the nature of the judicial function, the Article provides what one may call the implicit mandate of the courts at federal and state level to enforce and hence interpret chapter
52 Constitutional practice shows many variations in this regard. In the US the concept of judicial review evolved due to judicial practice since 1803 in Marbury vs Madison and as articulated by its Chief Justice John Marshall as the mandate of the regular courts and in particular that of the federal Supreme Court. In Germany and South Africa the Constitutional Court, not the Supreme Court plays the same role. In some parliamentary systems such as Australia and Canada the political institutions determine the scope and limit of rights and retain the last word in relation to resolution of constitutional disputes, though the Supreme Court participates particularly through common law protection of rights. The latter is also called judicial deference. That is leave those issues to be settled by political institutions or through the democratic process. The central issue in all is who determines the scope and limits of such rights? Should it be the courts or the political institutions? Activism claims judges apply those norms to specific cases. Political sceptics argue citizens have no moral rights. The point is that judges should apply the law that other institutions have made. They should not make law (Strauss, 2010). 53 See Arts 61, 62, cum 83 and 84. The CCI is composed of six legal experts appointed by the President of the Republic, three members of the HoF designated for this purpose and the Chief Justice of the Federal Supreme Court and his Deputy that serve as chair and vice chair of the CCI ex officio. The CCI has an advisory role only and the HoF is at liberty to endorse, modify or reject the opinion of the CCI.

90
Assefa Fiseha
92
three of the constitution. One cannot argue the same with respect to the mandate of the judiciary in relation to other chapters54 other than chapter three. The argument is limited to the chapter on fundamental rights and freedoms. This approach does not necessarily contradict with the mandate of the HoF/CCI. The argument is that final and authoritative interpretation of the constitution (including chapter three) is the mandate of the HoF/CCI. Yet as the weak form of review as evolved by the Supreme Court of Canada in its relations with the legislature illustrates well, courts can also interpret the chapter on fundamental rights and freedoms in the process of enforcing it, short of rendering a final verdict. Whatever interpretations the courts adopt is not necessarily final one. Whoever is not happy with the position of the court while interpreting chapter three can appeal to the HoF/CCI for final resolution. However, the role of courts in the enforcement of human rights enshrined in the constitution is one of the contested issues in Ethiopia. It is encouraging to see that the federal Supreme Court Cassation Division has in the case of Tsedale Demise vs. Kifle Demise55 courageously interpreted expansively the concept of ‘best interests’ of the child clause of the constitution. But when it comes to the enforcement of rights by limiting the powers of government agencies and public institutions, there appears to be a widespread confusion among judges at all levels. Judges at federal and regional state level think that they have little or no role in interpreting the provisions of human rights enshrined in the constitution.56 Apart from the empirical evidence regarding the opinion of judges, there are several cases decided both by the Cassation bench of the Supreme Court and the CCI/HoF that illustrate this assertion. One category of cases decided by the Cassation bench of Supreme Court relate to property rights, judicial review of administrative action, access to justice and due process rights. While lower courts attempted to limit abuse of power, this
54 There are 11 chapters in the constitution. Chapter one is on general provisions, chapter two is on fundamental principles, chapter three provides for fundamental rights and freedoms, chapter four is on the structure of government, chapter five provides on division of powers, chapter six is about federal legislative bodies, chapter seven provides about the President, chapter eight about the executive, chapter nine on the judiciary, chapter ten is on national policy principles and the last one miscellaneous provisions. 55 Tsedale Demise vs. Kifle Demise, Federal Supreme Court Cassation Division File No. 23632 (2006) v. 5 (Decisions of the Federal Supreme Court Cassation Division) v. 5 p. 188; see also (Getachew, 2009). 56 See Report on the needs assessment for in service training of judges and prosecutors (in Amharic) June 30 2009 by Assefa Fiseha and Solomon Niguse submitted to the Federal Training Institute for Judges and Prosecutors available with the author (unpublished). The study covered four regions namely, Oromia, the South, Somali, Benishangul Gumuz and Addis Ababa and 341 judges participated in the survey.

91
Development with or without Freedom?
93
is not the case with the Federal Supreme Court that consistently declined to enforce such rights.57
References Aaron, Maasho 2011. Ethiopia plans to sell power to Sudan, Yemen, Kenya
and even Egypt Addis Ababa, Reuters www.theglobeandmail.com Accessed, June 30, 2011.
______2013. IMF raises Ethiopia 2012/2013 growth forecast, www.reuters.com/ Accessed, November 13, 2013
Abbink, Jon 2006. ‘Discomfiture of Democracy? The 2005 Election Crisis in Ethiopia and is Aftermath’ African Affairs. 105/419
Abbink, Jon 2009. “The Ethiopian Second Republic and the Fragile “Social Contract” Africa Spectrum. 44/2. pp. 2: 3-28.
Addis Raey 2011. Ideological Bulletin of EPRDF, 3/3 (Hamle-Nehase 2003 EC). [In Amharic].
Africa Confidential 2005. “Ethiopia After Meles”, 53/17, August 24, 2012. Assefa Fiseha and Solomon Niguse 2009. Report on the Needs Assessment for
in Service Training of Judges and Prosecutors (in Amharic). Beeson, Mark 2009. “Developmental States in East Asia: A Comparative Study
of the Japanese and Chinese Experience,” Asian Perspective. 33/2, pp.5-39.
Bereket Simon, 2003 E.C. A Tale of Two Elections (2005 and 2010) in Amharic
57 See for example Yeka Land Development and Administration Office v. Asmelash Tafese and others Federal Supreme Court Civil Cassation File No. 27604 (March 2007); also the Heirs of Wasihun vs Agency for Government Houses where the Cassation Court decided on Miazia 21/2001 E.C (April 2009) that the Board is an administrative body and hence the Court has no mandate to review as to whether its decision contains fundamental error of law or not (unpublished available with the author). There are many cases that illustrate this but the most outrageous decision is the Mahberawi Watsina Belesiltan vs Ato Birhanu Hiry and Ato Kebede G. Mariam Federal Supreme Court Cassation Division File No 18342 Tahsas 17, 1998 in which the Court stated that the tribunal’s decision within the federal agency by virtue of Proclamation No. 38/88 is final and the Court has no mandate to review it. See V. 3 104 ff; Asehanfi Amare and et al vs. Ethiopian Revenue and Customs Authority in which the Authority was empowered by virtue of a secondary legislation (Regulation No 155/2008, Art 37) to dismiss employees suspected of corruption without following due process of law. The regulation as well stated that the decisions of the Authority are not subject to review by regular courts; the Cassation bench of the Supreme Court declined to review the Board’s decision and CCI in its opinions written on Yekatit 1, 2002 E.C. (January 20102) hinted, that the executive may in a parliamentary system declare some matters as non justiciable and prevent such cases from being brought before a court. See the opinion of the CCI on Asehanfi Amare and et al.

92
Assefa Fiseha
94
Carothers, Thomas 2007. “How Democracies Emerge, The ‘Sequencing’ Fallacy,” Journal of Democracy v.18 No. 1, pp. 12-27.
Chang, Ha-Joon 2010. “How to Do a Developmental State: Political Organizational and Human Resource Requirements for the Developmental State,” in Omano Edgheji ed. Constructing a Democratic Developmental State in South Africa, Cape town: HSRC Press.
Cheibub, Jose Antonio 2007. Presidentialism, Parliamentarism and Democracy, Cambridge: Cambridge University Press.
Davis, Michael 1998. “The Price of Rights: Constitutionalism and East Asian Economic Development,” Human Rights Quarterly. 20.
Dereje Feyissa 2011. “Aid Negotiation: The Un Easy ‘Partnership’ Between EPRDF and the Donors,” Journal of Eastern African Studies. 5/4. pp.788-811.
Diamond, Larry (2012) “China and East Asian Democracy,” Journal of Democracy v.23:1
Doner, Richard, Bryan Ritche and Dan Slater 2005. “Systemic Vulnerability and Origins of Developmental States: Northeast Asia and Southeast Asia in Comparative Perspective” International Organizations. 59/2. pp.327-361.
Economist 2012. “Ethiopia’s Prime Minister: The man who tried to make dictatorship acceptable”, August 24, 2012 [http://www.economist. com/node/21560904]. Accessed on August 25/2012.
Edgheji, Omano 2010. “Constructing a Democratic Developmental State in South Africa” in Omano Edgheji ed. Constructing a Democratic Developmental State in South Africa, Cape town: HSRC Press.
EPRDF Report 2013. submitted to its members in the 9th Congress of the party held in Bahir Dar.
Ethiopia ye 2001(E.C.) Ametawi Metshaf (in Amharic) Annual Book, Addis Ababa: Master Printing House)
European Union Election Observation Mission 2010. “Ethiopia Final Report on the House of Peoples Representatives and State Council Elections May 2010”. www.eueom.eu/ethiopia2010 Accessed on August 22, 2011.
Evans, Peter 1995. Embedded Autonomy: States and Industrial Transformation, Princeton: Princeton University Press
Evans, Peter 2010. “Constructing the Twenty First Century Developmental State: Potentials and Pitfalls,” in Omano Edgheji ed. Constructing a Democratic Developmental State in South Africa, Cape Town: HSRC Press.

93
Development with or without Freedom?
95
Federal Civil Service Ministry 2013. Building Federal Civil Service Development Army (Manual in Amharic). Addis Ababa: Federal Civil Service Ministry, January 2013.
______2011. Human Resource Statistics. Addis Ababa: Federal Civil Service Ministry
______2010. Human Resource Statistics. Addis Ababa: Federal Civil Service Ministry
Fukuyama, Francis 2012. “The Patterns of History.” Journal of Democracy. 23/1 Getachew Assefa 2009. “Is Publication of a Ratified Treaty a Requirement for its
Enforcement in Ethiopia? A Comment Based on Federal Cassation File No. 23632,” Journal of Ethiopian Law. 23/2
Girmay Zeru, 2012. The Civil Service Reform Program and Democracy in Tigray, unpublished MA Thesis, Addis Ababa: ECSU.
Haile Kiros Asmerom 1978. Emergence, Expansion and Decline of Patrimonial Bureaucracy in Ethiopia 1907 – 1974, Ph.D thesis, Amsterdam: Free University of Amsterdam.
Hundt, David 2009. Korea’s Developmental Alliance: State, Capital and the Politics of Rapid Development. London: Routledge
Johnson, Chalmers 1982. MITI and the Japanese Miracle: The Growth of Industrial Policy, 1925-1975. Stanford, California: Stanford University Press
Kim, Samuel 2003. Korea’s Democratization. Cambridge: Cambridge University Press,
Kohli, Atul 2004. State Directed Development: Political Power and Industrialization, Cambridge: Cambridge University Press, 2004.
Lipset, Seymour 1959. “Some Social Requirements of Democracy,” American Political Science Review. 53. pp 69-105.
List-Jensen, Ann Sasa 2013. “Economic Development and Authoritarianism: A Case Study on the Korean Developmental State” 2008, [http://www.diiper.ihis.dk] Accessed April 18, 2013.
Markakis, John 2006. Ethiopia: Anatomy of a Traditional Polity. Addis Ababa: Shama Books.
McNeil, Frank 1994. Japan’s New Politics. Journal of Democracy.5/4 Mehret Ayenew 1997. Public Administration in Ethiopia 1974-1992:
Administrative and Policy Response to Turbulence, PhD Thesis, New York: State University of New York.
Meles Zenawi 2006 Speech by H E Meles Zenawi Prime Minister of the Federal Democratic Republic of Ethiopia for the Africa Task Force, Brooks

94
Assefa Fiseha
96
World Poverty Institute, Manchester University, UK www.ethioembassy.org.uk Accessed April 10, 2013
Mkandawire, Thandika 2010. “From Maladjusted States to Democratic Developmental States in Africa” in Omano Edgheji ed. Constructing a Democratic Developmental State in South Africa. Cape town: HSRC Press
Natahn, Andrew 2013. “China at the Tipping Point? Foreseeing the Unforeseeable.” Journal of Democracy. 24/1.
Olowu, Dele 1996. “African Governance and Civil Service Reform” in Donald F Kettl et al, eds. Civil service reform: building a government that works. Washington, D.C.: Brookings Institution Press.
Ortmann, Stephan 2011. “Singapore: Authoritarian but Newly Competitive.” Journal of Democracy. 22/4. pp. 153-164.
Ottaway, Marina 1995. “The Ethiopian Transition: Democratization or New Authoritarianism?” Northeast African Studies 2/3. pp. 67-84.
Pei, Minxin 2012. Is CCP Rule Fragile or Resilient? Journal of Democracy.23/1, 27-41.
Peters, Guy and Jon Pierre 2004. Politicization of the Civil Service in Comparative Perspective: The Quest for Control, London: Routledge
Reilly, Benjamin 2013. “South East Asia: In the Shadow of China,” Journal of Democracy. 24:1.
Sartori, Giovanni 1976. Party and Party Systems: A Framework for Analysis v.1 Cambridge: Cambridge University Press.
Sen, Amartya 1999. Development As Freedom. Oxford: Oxford University Press.
Shirk, Suzan 2007. China: Fragile Super Power. Oxford: Oxford University Press.
Sirgut Mitchel 2006. Achievements and Challenges in the Implementation of Result Oriented Performance System in the Ethiopian Federal Civil Service: Case Study of Three Selected Ministries. Addis Ababa: AAU, MA Unpublished Thesis, 2006.
Sisay Alemahu 2008. “The Justiciablity of Human Rights in FDRE Ethiopia.” African Human Rights Law Journal. 8/2.
Strauss, David 2010. The Living Constitution, Oxford: Oxford University Press. The Reporter 2013. Editorial, September 13, 2013 www.ethiopianreporter.com
Accessed on September 13, 2013 The Reporter 2013. “The dominant party in East Asia and Ethiopia different?”
www.ethiopianreporter.com Accessed, April 10, 2013.

95
Development with or without Freedom?
97
Thornton, Songok Han, and William Thornton 2008. Development without Freedom: The Politics of Asian Globalization, Aldershot: Ashgate.
Tronvoll, Kjetil 2010. “Briefing: The Ethiopian 2010 Federal and Regional Elections: Re-establishing One Party State.” African Affairs. 110/438. pp. 121-136
Tsehaye Debalkew 2010. Whither Ethiopia; Towards a Dominant Party System or a Single Party State? August 10, 2010 www.aigaforum.com Accessed August 18, 2012
World Bank (1997). World Development Report: The State in the Changing World, New York: Oxford University Press.
World Bank 2012. “Ethiopia Economic Update – Overcoming Inflation, Raising Competitiveness”, December 13, 2012 [http://www.worldbank.org/ en/news/press-release/2012/12/13/ethiopia-economic-update-overcoming-inflation-raising-competitiveness] Accessed, November 13, 2013.
Zakaria, Fareed 1994. Culture is Destiny: A Conversation with Lee Kuan Yew. Foreign Affairs. 37/2.


99
4 Amdissa Teshome
Development Programs and the Post-MDG Agenda
Introduction1 Since 1991, the Ethiopian Government has been implementing various economic and social development policies, strategies and programmes which have been reviewed on numerous occasions (e.g. Aklilu Amsalu 2012; Taye 2008; Brown and Amdissa 2005; Amdissa 2003, 2006, 2008, 2010). Some of these works have focused on the extent to which the Ethiopian poverty reduction strategy programmes (PRSPs) are aligned with the Millennium Development Goals (MDGs) and served as building blocks of transformation. The present work extends the analysis to the post-MDG agenda.
The chapter reviews sectoral policies in four broad categories: agricultural and rural development, transitory and chronic food insecurity, climate change, and social and regional inequalities. These programmes are by and large aligned with the MDGs. As a result, Ethiopia is among countries making progress in areas such as reducing extreme hunger, ensuring gender equality, and ensuring environmental sustainability. Egypt and Rwanda are among African countries progressing much better than Ethiopia. However, when achievement is further disaggregated into “absolute progress” and progress “relative to MDGs”, Ethiopia appears in the top 20 countries making absolute progress but not in the top 20 countries making progress in relation to MDGs.
Looking forward to the post-MDG agenda, three alternative paths are explored – retaining the MDGs, reformulating the MDGs or designing new alternative development framework. Based on the global and national momentum, the chapter recommends the MDG+ approach where the ideals of the MDGs are retained but new goals are set for quality and inclusive education, quality of health services, balanced regional development, and genuine political participation.
1 Acronyms are given at the end of the chapter

98
Amdissa Teshome
100
Objective of the study The debate on the post-MDGs agenda indicates that MDGs are here to stay but the question is what should be the content. The objective of here is therefore to systematically review Ethiopia’s development programmes and examine its achievements and challenges in relation to the MDGs. Systematic review is defined as ‘rigorous method to map the evidence base in [as] unbiased way as possible, and to assess the quality of the evidence and synthesise it’(Hagen-Zanker and Mallett2013).This process is believed to offer the most reliable and comprehensive statement about what worksor does not work.It has come to be seen as a key tool for evidence-informed policymaking.
In view of this, in addition to the systematic (unbiased) review, opinions were sought electronically from purposively selected policy and programme experts in Ethiopia.A short questionnaire was designed and distributed by email to about 50 such experts and 25 provided insight on strength, limitations and challenges of achieving MDGs.These informants are from academic institutions, government, non-government and professional associations.
The discussion on progress towards the MDGs in general and Ethiopia’s progress in particular is informed by regional/global surveys that are comparable across countries. These data sources are summarised in Table 1.
Table 1. Sources of data
Survey/report name Description Economic Commission for Africa (ECA) electronic survey
112 stakeholders from 32 African countries. Respondents included representatives from government, civil society organisations, research institutions and academia.
Assessing Progress in Africa towards the MDGs (UNDP).
The survey used data from various sources including the UN Statistics Division, the World Bank and statistical databases of the Organisation for Economic Co-operation and Development (OECD).
Overseas Development Institute (ODI) MDG report card
The report card used data from global as well as national sources.
My World Survey launched by the UN Task Team (see http://www.myworld2015.org/).
This is the largest survey that gave citizens of the world to have a say on the Post-MDG. At the time of writing, over 1.2 million people from 194 countries have responded and over 12,000 of them are from Ethiopia.

99
Development Programs and the Post-MDG Agenda
101
Limited local survey A short questionnaire was developed and distributed by email to about 50 policy actors from government, non-government, academic and professional associations. Twenty-five (50%) provided insight on the strength, limitations and challenges of achieving the MDGs in the context of Ethiopia.
Structure of the chapter Following this introduction, Section 2 provides a synthesis of development programmes2that have been implemented since the 1990s. The discussion is framed around five themes. The first highlights the constitutional base for economic and social development. The subsequent sections discuss programmes that promote agriculture and rural development;address transitory and chronic food insecurity; respond to climate change and address social and regional inequalities.
Section 3 examines the strength and limitations of MDGs from the global as well as local perspectives. Section 4presents evidence from a wide range of sources on achievements and challenges of MDGs in Ethiopia. Finally, recommendations are put forward to enhance Ethiopia’s contribution to the post-MDG debate.
The evolution of Ethiopia’s development programs Over the last 20 years, various policies and strategies on agriculture, social services and other sectors have been implemented. For the purpose of this work, an inventory was carried out in five broad categories3, namely, (i) constitutional base for economic and social development; (ii) agricultural and rural development; (iii) climate change and environmental threats; (iv) transitory and chronic food insecurity/poverty; and (v) social and regional inequalities (See Annex 1 for a complete list).
Constitutional base for economic, social and regional development The Peaceful and Democratic Transitional Conference of Ethiopia held in July 1991 promulgated a Transitional Period Charter and established the Transitional 2Here, programs are used in the broadest sense to accommodate the constitutional provisions from the early days of taking power. 3This is by no means the only way to group policies and strategies. For example one may put the overall development plans like the PRSPs and the GTP in one category and sector specific strategies and programs such as agriculture, education, health and transport in another category.

100
Amdissa Teshome
102
Government of Ethiopia (TGE) that was in power from 1991-1993 (TGE, 1991:2).The Charter had a strong focus on relief and rehabilitation. For example, Article 5 gave autonomy to selected local government bodies to negotiate with relief organisations directly. Articles 14 -16 committed the Government to re-build war torn areas and gavespecial consideration to hitherto neglected and forgotten areas.
The Charter paved the way for the development of a fully-fledged Constitution in 1995 which contained several articles on the human, economic, and social development of citizens (FDRE Constitution, 1995). Article 41 sub articles 1-9 state thatevery Ethiopian has the right to engage freely in economic activity and pursue a livelihood of his or her choice anywhere within the national territory. The State shall undertake all measures necessary to increase opportunities for citizens to find gainful employment. The right to land for all citizens wishing to pursue livelihood in agriculture is also enshrined in the Constitution. These provisions are useful to hold the government accountable on its promises.
The Constitution also makes specific provisions for the protection of the environment. Article 92 states that the Government shall endeavour to ensure that (i) all Ethiopians live in a clean and healthy environment; (ii) the implementation of development projects shall not damage or destroy the environment; and (iii) people are consulted on environmental policies and projects that affect them directly. Addressing regional development is another area where the Constitution provides guidance. Therefore, the Transitional Charter and the Constitution have indeed formed the basis for the policies, strategies and programmes that ensued.
Agriculture and rural development The Ethiopian People’s Revolutionary Democratic Front (EPRDF) established strong rural roots during the armed struggle. As a result, its policies and strategies are rural-focused (e.g. Economic Development Strategy for Ethiopia 1994), Rural Development Policies, Strategies and Instruments 2001), and the poverty reduction papers such as SDPRP 2001-2004) and PASDEP2005/06-2009/10). The focus on agriculture and rural development is also an inherent belief that an agricultural development-led strategy is the path to industrialisation. ADLI, as it is commonly known, defines the policy orientation which was formulated in the early 1990s and subsequently put into practice from the early 2000s (GDF 2009).4
4It is worth noting that ADLI did not have a single reference. Instead, it was explained through various policy and strategy documents which are the basis for this paper. It has also been referred

101
Development Programs and the Post-MDG Agenda
103
The smallholder is the anchor of rural development in Ethiopia. However, the capacity of subsistence smallholders to realise the vision of ADLI has always been questioned. For example, Dessalegn (2008) calls the rural development policy as “betting on the smallholder” that does not have enough land to produce adequate food for itself.5Although access to land is enshrined in the Constitution, Ethiopia does not have a comprehensive land policy that addresses among other things (i) tenure security; (ii) farm size and fragmentation;and (iii) the issue of land markets (Samuel, 2006).
The Government has been responding to some of these issues. For example, it has issued land certification to both rural men and women with a view to promote gender equality and encourage investment in land improvement.6There are also a series of piecemeal proclamations that govern land issues.7Experience from countries such as China suggests that land reform is not an end product but a component of agrarian reformaccompanied by irrigation systems, introduction of high-yielding varieties, abundant chemical fertiliser, and investment in agricultural research (Samuel, 2006).
With respect to farm size, the policy direction stretches from smallholders to large scale farming (from one extreme to the other) without due consideration for medium scale farming which invariably involves land consolidation. Although there are informal land markets that are contributing to consolidation (Samuel 2006), there are also various restrictions on land transfer (Chamberlin and Schmidt, 2012; Dessalegn 2008) and the policy generally favours transfers to large investors rather than smallholders next door. Regional land laws impose restrictions on the size of land per household (e.g. Tigray sets a maximum of 2 ha.) which is meant to promote equitable land distribution but is clearly a barrier
to in various statements on Ethiopia’s Democratic Developmentalism and the Developmental State (GDF2009). 5 According to Desalegn (2008), 37% of which cultivates less than or equal to 0.5 ha; nearly two-thirds less than or equal to 1.0 ha and 87% less than 2.0 ha. The author calls this plots as “starvation plots” and estimates that under rain fed condition the smallholder needs at least 2.5 ha and pair of oxen to produce enough for his/her family. 6There are evidences that show mixed achievement. The World Bank (2007) declared the certification process as successful and cost-effective which can be of valuable lesson for other African countries. But smallholders’ confidence is still low fearing that some form of re-distribution may still happen (it is the case of it has happened before; it can happen again!) and more importantly, certification has not increased opportunities for access to credit and incentives for investment. 7USAID (2004) compiled 13 federal and regional proclamations governing land. Accordingly, the Federal Government has three proclamations including the provisions in the Constitution; Amhara (4); Oromiya (1), SNNPR (2), and Tigray (4).

102
Amdissa Teshome
104
to land consolidation. This limit is substantially lower than the 10 hectares per farm limit proposed by the Derg when it nationalized rural lands in 1975.8
The Government has pursued the expansion of large-scale commercial farming in areas perceived to be vacant, unutilised and undeveloped. The Agricultural Land Investment Agency is established within the Ministry of Agriculture to facilitate investment involving 5000 ha or more as and when it is delegated by the respective regional states (FDRE, 2013). The Agency has five directorates, namely land administration, economic zones, investors support, legal,social and environmentaldirectorates. It is also mandated to implement the investment Code of Practice (MoA, 2011) produced by its predecessor – the Agricultural Investment Directorate. The structure as well as the Code of Practiceis designed to respond to legal, social and environmental concerns arising from large scale investments.
Labour is the second most important resource for rural development in Ethiopia. However, the notion that Ethiopia has abundant agricultural labour is becoming a myth. Field and community conversations indicate that agriculture labour is under considerable pressure from internal as well as external factors (see Figure 1).9Internally, the farming population is aging, uneducated and suffers from various chronic and acute illnesses. Externally, rural communities welcome the expansion of education but it is siphoning labour out of agriculture without sufficient mechanisation. There is also growing evidence that the educated youth do notaspire to return to agriculture and work alongside their parents.This pre-mature exodus from agriculture coupled with numerous internal and external factors put considerable pressure on agriculture labour at a time when Ethiopia (and Africa in general) needs “more farmers to ensure food security for its growing population” Yisak and Tassew (2012:12).
8For a review of the history of land reform and its impact on growth and investment see Chamberlin and Schmidt (2012: 42-47). 9In 2006/07, the author facilitated a total of 67 focus group discussions involving over 700 participants in selected woreda(districts) and kebele in six regions of Ethiopia namely, Afar, Amhara, Benishangul, Oromiya, SNNPR, and Tigray. These discussions generated local knowledge on key constraints facing Ethiopian agriculture from a wide range of community members. The findings were reported in Amdissa and Devereux (2007).

103
Development Programs and the Post-MDG Agenda
105
Figure 1. External and internal pressure on agriculturallabour
SOURCE.: Based on a series of regional consultations conducted in 2006/07 for the Future Agricultures Consortium (www.futureagricultures.org).
More recently, the introduction of basic technologies such as row planting and transplanting of teff has exposed the underlying assumption of abundant labour. It is estimated that a farmer had to cover 50km (back and forth) to row plant a hectare of land.10 Transplanting of teff is almost considered a crazy idea 10Although most Ethiopian small farmers are aware of the benefits of row planting in crops such as maize and wheat, when it comes to teff, farmers continue to use the traditional broadcasting techniques which requires 30-50 kg/ha of seed. ATA demonstrated that with row planting there is significant gains from (i) reduction in seed requirement which can be as low as 3-5 kg/ha; and (ii) potential doubling of yields (ATA, 2012:14). These gains have been contested by some researchers (e.g. Vandercasteelen, et.al. 2011) but beyond the scope of this paper to discuss.
AGRICULTURE LABOR UNDER
PRESSURE
Population structure (high
dependency ratio)
Eating habits/low nutrition
awareness
Acute and chronic illnesses
(HIV/AIDS, malaria, TB) Eating habits/low nutrition
awareness
Low aspiration from educated youth to
remain in agriculture
Aging, illiterate and
unskilled farmers
Cultural/religious believes

104
Amdissa Teshome
106
by farmers and extension agents given the labour constraints. In order to address this constraint, the Agricultural Transformation Agency (ATA) has introduced various small to intermediate technologies and some farmers have also begun innovating on tools that minimise the labour requirements. Although these are encouraging developments, there is no doubt that labour abundance is proving to be a myth and cannot continue to be the basis for rural development strategy.
Addressing transitory and chronic food insecurity Ethiopia is a country where drought and famine have occurred frequently taking lives and eroding livelihoods. The 2002/03 drought affected over 12 million people and expanded its geographic coverage (Graham, et.al, 2012). Relief assistance which has been the most common form of response saved lives but failed to save livelihoods. It increasingly became clear that millions of households were not able to meet their food needs from own production even in good rains. This prompted the Government to make a distinction between transitory and chronic food insecurity. It also marked the launch of the New Coalition for Food Security (PANE, 2006) which the government used to rally donors behind its food security agenda.
The Productive Safety Net Programme (PSNP)11 is one of the four food security programmes launched in 2005 to address the needs of the chronically food insecure.12 Over 8 million people benefit from the PSNP making it the largest safety net programme in sub-Saharan Africa. About 7 million of these are able-bodied rural people contributing to public works whereas about 1 million labour poor people get unconditional transfers. The programme has proven to be successful in targeting the poorest of the poor with little or no elite capture (Coll-Black et.al 2012); flexible enough to shift from food to cash and vice versa as the situation demands; and make transfers as predictable and timely as possible compared to the emergency response. A complementary Household Asset Building (HABP) programme is available to offer PSNP beneficiaries a chance to re-build their assets and eventually graduate from the programme(MoARD, 2009a, 2009b). However, assessments done for the new generation of PSNP reported that progress towards graduation has been slow.13
11 At the time of writing this paper, the design of the next generation of PSNP is underway. There are indications that it will be re-named Rural Productive Safety Nets implying the possible emergence of urban safety nets. 12The other components are the Household Asset Building Program, Complementary Community Infrastructure and the Resettlement Program 13 The assessment reported that PSNP began with 4.83 million beneficiaries in 2005. In 2012, the figure rose to 7.54 and by 2012/13, as a result of graduation, it had declined to 6.88 million which brings the number of graduates to 660,000.
105
Development Programs and the Post-MDG Agenda
107
In spite of this, there is a strong belief that agriculture and rural development programmes including the food security programmes have contributed to reducing extreme hunger and poverty (MDG 1). The national poverty headcount declined from 44 percent in 2000 to 38.7, 29.6 and 26.3 percent in 2005, 2011 and 2012, respectively. In rural areas, the headcount poverty rate was 39.3 percent in 2004/05 and was reduced to 30.4 percent in 2010/11. Over the same period, the urban poverty headcount declined substantially, from 35.1 percent in 2004/05 to 25.7 percent in 2010/11. In urban areas, inequality increased until 2004/05 but there was a substantial decline from 44% in 2004/05 to 37.8 percent in 2010/11 (MoFED, 2012).However, there is considerable reservation on national statistics for measuring progress towards MDGs. As a result, late in this chaptervarious global sources are used for cross-country comparisons.
Climate change and environmental threats The Government of Ethiopia has demonstrated its commitment to addressing climate change and environmental threats since the Rio global conference on the environment.The inventory in Annex 1 shows that more than 40 percent (21 out of the 49)of policies, strategies, directives and programmes compiled have to do with environment and climate change which formed the basis for the Climate Resilient Green Economy (CRGE) launched in 2011.
For a country that has made very little contribution to climate change in terms of carbon emissions,14 why the obsession with climate related issues? First, it is evident that land degradation and deforestation are serious environmental problems that contribute to food insecurity in Ethiopia. Second, the Carbon Development Mechanism (CDM) promises to compensate developing countries for adopting a green economy strategy one of which is planting trees for carbon sequestration. The Bale Mountain Eco-region Emission Reduction and the Humbo Natural Regeneration Project (Afforestation and Reforestation) are examples of community based projects designed to sequester carbon and generate income from carbon finance for the community (EPA, 2012).Ethiopia has also made significant progress through mass mobilisation and PSNP public works for planting trees and carrying out conservation works. In
14Ethiopia’s contribution to the global increase in greenhouse gas emissions since theindustrial revolution has been practically negligible. Even after years of rapid economicexpansion, today’s per capita emissions of less than 2 t CO2e are modest compared with the more than 10 t per capita on average in the European Union and more than 20 t per capita in the United States and Australia. Overall, Ethiopia’s total emissions ofaround 150 Mt CO2e represent less than 0.3% of global emissions (EPA, 2012).

106
Amdissa Teshome
108
2007, the Independent Newspaper15 reported that Ethiopia planted over 700 million trees ranking it first among countries with the similar efforts.
The contribution of the PSNP to natural resource development is also worth noting. PSNP public works participants have constructed 600,000 km of soil and stone bunds, which enhance water retention and reducing soil and water run-off; and protected 644,000 ha of land in area enclosures, which increases soil fertility and carbon sequestration (MoA, 2014).Although there has not been an official census of the forest cove, external sources such as those cited above indicated that the forest coverage of the country has increased from 3 percent twenty years ago to 12.3 percent in 2011.16 This is an indication that the country is on its way to reversing land degradation thereby contributing to MDG 7 on environment.
Social and regional inequalities When it took power, EPRDF was mindful of the social and regional inequalities that plagued the country – limited access to education, health, and other social services and also remoteness. Ethiopia has progressed well in increasing access to basic education and health services. In 2011/12, 16.7 million children were attending primary school (Grade 1-8) which is 95.4% of children of that school age (7-14) (MoE, 2012). However, past reviews have shown that the focus on increasing access to education has compromised quality with high rates of attrition and dropouts.Furthermore, millions of children with various disabilities remain out of school because of low community awareness, and schools and teachers not equipped to teach such children (Amdissa 2008).
With regard to health, the number of health extension workers has reached 34,382 and 3,916 for rural and urban kebeles17respectively. As a result, the national health extension service coverage has reached 75.2 percent. Infant and under five mortality rates stand at 59/1000 and 88/1000, respectively(MoFED 2012). The Government believes that these results signify a promising prospect in achieving the health MDGs by 2014/15. However, the maternal mortality (MDG 5)remains high at 673 per 100,000. Achieving MDG 5 will therefore be a serious challenge and needs a serious attention (MoFED 2012).
MoFED (2010) identified regional disparities in MDG achievements as one of the challenges, referring particularly to Afar, Somali, Gambella and Benishangul.The Government’s approach to developing these peripheral and pastoral regions in particularhas always been contentious. The first criticismis that highland policies and strategies are implemented in pastoral areas with little 15http://www.independent.co.uk/environment/ethiopias-forest-cover-triples-ministry-2029508.html 16http://www.tradingeconomics.com/ethiopia/forest-area-percent-of-land-area-wb-data.html 17 The lowest administrative tier, below the woreda (district) in the country

107
Development Programs and the Post-MDG Agenda
109
or no adaptation to local context.18However, in its pastoral policy statement, MoFA (2008) argues that development policy for the pastoral and agro-pastoral areas have short and long term perspectives. In the short term, all sectors will mainstream pastoralist and agro-pastoralist issues into their policy and planning frameworks. In the long-term, the government envisions a stable pastoral and agro-pastoral community through the facilitation of gradual and voluntary transition towards permanent settlement especially along the perennial river banks.
Moreover, the Government is implementing large scale irrigation projects which it believes will ultimately enable pastoral and agro-pastoral people to pursue sedentary life with diversified and sustainable income. The government and the Sugar Corporation pledge that they will not repeat development-induced impoverishment of pastoral communities, as was the case for the Karrayu in the Awash Valley. When sugar plantations (WonjiShoa and Metehara) were established during the 1960s in the Awash valley, pastoralists were simply evicted and their land was enclosed (Bahru 1984; Buli 2006 cited in Asnake and Fana (this volume)).
Non-state actors’ engagement in the policy process The policy/programmeinventory given in Annex 1 shows thatnearly 50 percent of the policies and programmes currently in place were designed during the 1990s at a time when non-state actors (NSAs) were just evolving. In more recent times, when consultative forums were organized (e.g. the PRSP) they are more about providing information to the public about the policy than allowing them to make any significant contribution to the policy making process.19 Therefore, Governmentsin general and the Ethiopian Government in particular should ensure that citizens’ priorities are taken into account when shaping the post-MDG agenda.
In sum, policiesand programmes relating to rural development,chronic and transitory food insecurity address Goal 1 (eradicate extreme hunger); social sector policies respond to Goals 2, 4, 5 and 6, and environmental policies and
18Little, et. al. (2010a and 2010b)argue that policy makers’ thinking about pastoral development is still rooted in the scientific knowledge that is almost outdated. However, over the past 10 years, pastoral knowledge base in Ethiopia has developed due to increased research interest and increased government interventions in these areas. 19 The World Bank (2013), for example, classifies its engagement with NSAs into five categories: (i) information access and dissemination; (ii) policy dialogue; (iii) policy and programmatic consultation; (iv) collaboration and partnership; and (v) program implementation, monitoring and evaluation.

108
Amdissa Teshome
110
strategies fit into Goal 7. Ethiopia’s progress in these areas discussed in what follows is largely based on global data that is comparable across countries.
The MDGs: global perspective Background In the Year 2000, 189 membercountries of the UN signed the Millennium Declaration to reduce extreme poverty by 2015. The developing countries promised to manage their economies better and the developed countries promised to increase financial resources at least to 0.7 percent of their GDP – target set more than 30 years ago. From these commitments emerged the eight MDGs with 21 specific targets and 60 indicators and became the cornerstone of the Millennium Declaration and Universally Accepted Development Benchmarks for developing countries (Mailu,N.d).
A critical look at MDG strengths and limitations Strengths Firs, the MDGs are appealing because they have been successful in galvanising international support not only from government and inter-governmental bodies but also from civil society, the private sector, charities, foundations, the media and academia (UNECA/AUC 2012). The MDGs have also been an impetus for the Africa Union Commission (AUC) to launch the Comprehensive African Agriculture Development Programme (CAADP).
Second, the MDGs focused attention on the poor. According to UNDP (2003) cited in UNECA/AUC (2012), the MDGs are the first global development vision that combinedtechnical and political consensus on how to reduce poverty and hunger.
Third, MDGs have resulted in increased funding. Degol and Tsukada (2012) applied MDG-sensitivity criteria to Official Development Assistance (ODA) and found that its allocation has become MDG-sensitive since its declaration. UNECA/AUC (2012) also indicated that before the MDGs, ODA was at 0.22 percent of gross national income. By 2006, this has increased to 0.31 percent which is still far short of the 0.7 percent agreed over 30 years ago but is a progress not to be undermined.
Fourth, the MDGs have enabled developing countries and development partners to focus on results and outcomes rather than calculating inputs. As noted later, this is far short of a common monitoring framework but still has enabled countries to track progress in their own way.
Finally,the author’s observation is that information and knowledge sharing on development issues has been unprecedented since the launch of

109
Development Programs and the Post-MDG Agenda
111
MDGs. Electronic media has played a significant role in popularising the MDGs and contributed to shaping the post-MDG agenda. Development issues which traditionally were limited to academic journals are debated in simple languages so as to involve citizens.
Limitations There are equally persuasive limitations of the MDGs. First, MDGs are top down. The goals were set at the highest level with little or no consideration for local capacities to achieve them. The Government of Ethiopia in collaboration with development partners conducted MDGs needs assessment in order to ensure the integration of the MDGs into the national development programme (MoFED 2010).Second, MDGs lacked clarity.MDGs are essentially an extrapolation of global trends of the 1970s and 1980s and projected forward to 2015. Thus, assessing whether countries are ‘on track’ or ‘off-track’ can only be done at global level. It iserroneous, for instance, to lament that sub-Saharan Africa has failed to meet the MDGs because these targets were not set specifically for that region (Vandemoortele2007cited in Tabatabai 2007).
Third, MDGs are limited in scope.MDGs omit several important issues deemed indispensable for the enhancement of human development including but not limited to human rights, peace and security. MDGs are also criticised,perhaps unfairly, for putting a disproportionate emphasis on the social sector(e.g. education, health) and little emphasison the ‘productive’ sector (e.g. agriculture, industry). Fourth, lack of flexibility and dynamism – MDGs were never updated or refined over the last 15 years. For example, having made progress towards Universal Primary Education,there were opportunities to review and set quality indicators. MDGs were also best placed to alert countries on equity considerations (e.g. urban/rural/ remoteness) and inclusiveness (e.g. disability and old age). Failure to incorporate the impact of global financial crisis particularly for the least developed countries was a missed opportunity.
Fifth,MDGs lacked a common monitoring and reporting framework which resulted in not knowing exactly who has achieved what. Later in this chapter it becomes clear that some agencies (including UN agencies) declare Ethiopia as a country most likely to achieve most, if not all of the MDGs. Others (e.g. ODI) do not even put Ethiopia in the top 20 countries most likely to meet the MDGs. Reliability of national statistics is also a contentious area and most agencies reporting on MDG achievements do not trust local data. For example, both the UNDP 2012 and 2013 reports on MDG assessment used international sources because national data was not reliable.
110
Amdissa Teshome
112
The MDGs: Ethiopian perspective This section presents the Ethiopian perspective on the MDGs based on a review of relevant literature and consultation with purposely targeted policy actors familiar with the MDGs. A short questionnaire was developed and distributed by email to about 50 policy actors from government, non-government, academic and professional associations. Twenty-five of them provided insight on the strength,limitations and challenges of achieving the MDGs.
MDG strength and limitations in the context of Ethiopia The global strengths and limitations of MDGs reviewed above are by and large relevant to Ethiopia. However, there are some issues worth further discussion (see Table 2). First, some of the limitations from the global perspective are actually considered strength from a national context. For example, the focus on social sector is seen as a positive step because Ethiopians have been denied these services for generations. As discussed below, increased external funding is seen as strength from the global perspective whereas it is considered unsustainable from local perspectives. Second, MDGs have been instrumental in enhancing political will and commitment. The Ethiopian Government allocates up to 67 percent of its budget on what it calls pro-poor sectors such as agriculture, education, health and rural roads with a view to achieving the MDGs.20
On the limitations side, the heavy emphasis on monitoring quantitative targets is a major concern. A key informant shared her observation as follows:
…. I have seen pictures of a school in a place outside of Bahir Dar [Amara Regional State capital]. There were a few students (10 to 15) seating under the shade of a big tree, with a black board hanged on the tree. This was considered as a school and was counted towards achieving the millennium development goal. I think it is the monitoring mechanism of focusing on quantity that led to this kind of a school and other similar things(female respondent).
MDGs gave no consideration to quality of education partly because it is difficult to measure and partly because countries were so far behind in access that it was unreasonable to push for quality. Accordingly, Ethiopia has done well for expanding primary education but until very recently paid little attention to quality issues. Presently, the Ministry of Education has launched the General Education Quality Improvement Programme and established an agency to implement it (Fuad, 2011). Moreover, the almost exclusive dependence on external finance has raisedserious concerns over sustainability. An analysis of MDG-sensitivity of ODA (Degol and Tsukada 2012) indicates that its allocation 20As a matter of fact, Ethiopia is often cited as a county that surpassed CAADP 10% target for budget allocation to agriculture (Yihenew, et.al. 2013).

111
Development Programs and the Post-MDG Agenda
113
since the Millennium Declaration has become more MDG-sensitive. While such trends in aid disbursements are commendable, it does not conceal the fact that MDGs are highly dependent on external finance and the trend seems to continue for the post-MDGs. Table 2. Strength and limitations of MDGs in the Ethiopian context
SOURCE.Summary of key informant responses
Strength Limitations
The MDGs are in line with the broad objectives of the country’s development strategies. They put the country in competition with other countries that are in similar condition. Focus on social sector particularly health and education where the country has been lagging behind.Efforts made to promote gender equality and empower women, reduce child mortality, improve maternal health and combat HIV/AIDS. MDGs served as stepping stone to plan for the development and transformation the country. Helped to increase political will and commitment at national, regional, and local level, Investment in pro-poor sectors increased Served as a framework for global coalition and partnership for development on unprecedented scale MDGs have influenced national planning processes. Due to MDGs Ethiopia had its debts cancelled.
Not inclusive of several sectors that are equally important such the protection of human rights and good governance, employment and access to decent work, reproductive health/demographic problems, agriculture, manufacturing, industry, power and communication and tourism. Reducing poverty by half should not be an end. It till leaves a very large number of people living in absolute poverty. Lack of quality dialogue with NSAs, the private sector and most importantly the communities. No grassroots level awareness on MDGs. Almost exclusive dependence on external finance raising serious concerns over sustainability. Failure to protect land grabbing and systematic corruption Progress in universal primary education at the expense of quality. No targets for secondary, tertiary and adult education. Shortage of resources, capacity problem at different levels to achieve the plan. Weak follow up and monitoring system. Heavy focus on quantity as a monitoring indicator instead of quality. Lack of baseline on local capacity, human & financial resources, and institutional set-up. Lack of detailed action plan at country level. Lack of incentive systems to better performing countries (except CDM which emerged through a separate process) Some of the goals, targets and indicators are redundant. For example ensuring Target 4 (attaining gender equality in education) is possible by accomplishing Target 3 (achieving universal education for both boys and girls).

112
Amdissa Teshome
114
National program alignment with the MDGs An alignment is a process of making sure development programmes are systematically linked to a given benchmark such as MDGs. Alignment should be by design not by chance. In order to guide this process, the UN Millennium Project (2005) provided five alignment criteria against which Ethiopia’s development programmes were evaluated. As can be seen from Table 3, to a large extent, the government has been successful in aligning its national programmes with MDGs thanks to the MDG needs assessment.
Table 3. MDG alignment with national programs MDG Parameters
Definition of parameters PASDEP/GTP response to MDGs (extracts from the respective documents)
Ambition Country development programmes (e.g. PRSP) should be more ambitious than MDGs
PASDEP aimed at ending poverty (by implication during the plan period) which was unrealistic but at least in principle, it was more ambitious than the MDG that aimed to halve poverty incidence by 2015. The GTP is also as ambitious as PASDEP if not more. It aims to double GDP by 2015.
Scope The policies and strategies should set MDG consistent targets across the sectors not just the broader goals
A review of PASDEP showed that it has set MDG consistent targets for most of the sectors. GTP’s targets are greater than MDG targets.
Rigor The targets should be based on rigorous analysis of local capacity and constraints. They should not be designed just to satisfy the MDG alignment criteria
MDG Needs Assessment carried out and formed the basis for costing PASDEP.
Timeframe The timeframe for national policies and strategies should be aligned with the MDGs;
The first PRSP was a three year programme but PASDEP was changed to five year programme so as to ensure consistency with MDG timeframe. By coincidence or design, this also corresponds to the five year terms of EPRDF – the ruling party. Most programmes are more or less aligned with the MDG date of 2015. For example, the Food Security Programme (2010-2014); Health and Education Sectors Development Programme (2010-2014); Water Sector Development Programme (2002-2016) and the Growth and Transformation Plan (2011-2015)
Financing There should be clear Much of the expenditure on telecommunications

113
Development Programs and the Post-MDG Agenda
115
indication of gradual reduction in external financing and increase in domestic financing of national policies and strategies.
and power system expansion are funded by the respective public corporations using their own funds, supplier credits, and on-lending facilities financing; The GTP put considerable emphasis on domestic resource mobilisation to finance the plan. To this end, government tax collection capacity has been slowly increasing over the past years. The share of external finance in the annual budget has also been declining.
SOURCE.Updated version of earlier work by the author (2008b)
Achievements and challenges Achievements The Government’s commitment to the MDGs has enabled it to make progress in the provision of social services such as education, health and infrastructure by spending, as stated earlier, up to 67 percent of its budget in these “pro-poor sectors” (MoFED, 2012). Based on this and other evidence, the UNCT (2011) came to the conclusion that the country is on a positive and promising track to meeting the key MDGs wholly or partially - provided support from the international community continues.
As shown in Table 4, Ethiopia is among the best performing countries with respect to Target 1B, Target 7C and Indicator 3.2.21Rwandais the second most successful country next to Egypt.
Table 4.Africa’s MDG performance at a glance22
Goal Global Status
Target/indicator Best performing countries
Goal 1: Eradicate extreme poverty and Hunger
Off-track Target 1A: Egypt, Gabon, Guinea, Morocco, Tunisia
Target 1B: Burkina Faso, Ethiopia, Togo, Zimbabwe
Target 1C: Algeria, Benin, Egypt, Ghana, Guinea Bissau, Mali, South Africa, Tunisia
Goal 2: Achieve On-track Indicator 2.1: Algeria, Egypt, Rwanda, São
21 For a complete description of the key MDG targets and indicators see MDG Africa Report 2013 and Special issue of Adult Education for Development No. 80, 2013. 22Countries in italics are also countries that are tracked in forthcoming county comparisons (Tables 5 and 7).

114
Amdissa Teshome
116
universal primary education
Tomé and Príncipe
Indicator 2.2: Ghana, Morocco, Tanzania, Zambia
Goal 3: Promote gender equality and empower women
On-track Indicator 3.1: The Gambia, Ghana, Mauritius, Rwanda, São Tomé and Príncipe
Indicator 3.2: Botswana, Ethiopia, South Africa
Indicator 3.3: Angola, Mozambique, Rwanda, Seychelles, South Africa
Goal 4: Reduce child mortality
Off-track Indicators 4.1 and 4.2:
Egypt, Liberia, Libya, Malawi, Rwanda, Seychelles, Tunisia
Goal 5: Improve maternal health
Off-track Target 5A: Equatorial Guinea, Egypt, Eritrea, Libya, Mauritius, Rwanda, São Tomé and Príncipe, Tunisia
Target 5B: Egypt, Ghana, Guinea Bissau, Rwanda, South Africa, Swaziland
Goal 6: Combat HIV/AIDS, TB, malaria and other diseases
On-track Target 6A: Côte d’Ivoire, Namibia, South Africa, Zimbabwe
Target 6B: Botswana, Comoros, Namibia, Rwanda
Target 6C: Algeria, Cape Verde, Egypt, Libya Mauritius, São Tomé and Príncipe, Sudan, Tunisia
Goal 7: Ensure environmental sustainability
Off-track Target 7A: Egypt, Gabon, Morocco, Nigeria
Target 7C: Algeria, Botswana, Burkina Faso, Comoros, Egypt, Ethiopia, Libya, Mali, Mauritius, Namibia, Swaziland
Goal 8: Global partnership for development
Off-track Target 8F Kenya, Libya, Rwanda, Seychelles, Sudan, Uganda, Zambia
SOURCE. Based on UNDP 2013.Note:italics added
The Overseas Development Institute (ODI 2013) disaggregates a country’s progress into “absolute progress” and “progress relative to MDGs”. Absolute progress measures reduction in the largest share of the population living in extreme poverty or increased primary school enrolment rates by the largest number of percentage points. Relative progress measures progress against the

115
Development Programs and the Post-MDG Agenda
117
MDG target – for example, which countries have come closest to halving child mortality, or to closing the gap in achieving universal primary education. Low-income countries, like Ethiopia, tend to rank top in absolute progress, while middle-income countries tend to do better in closing the gap.
According to this classification, Ethiopia is in the top 20 countries making absolute progress but not in the top 20 countries making progress in relation to MDGs. This is also consistent with UNDP (2013: xv) ranking in which Ethiopia is not among the top 20 countries.Furthermore, Ethiopia does not feature in either absolute or relative progress with respect to improving maternal health which the Government recognised as a major challenge.
Table 5. Absolute and relative overall progress on the MDGs: Top 20 achievers23
Top 20 Absolute Progress Top 20Progress Relative to MDG Targets
Benin Mali Ethiopia Gambia Malawi Viet Nam Uganda Nepal India Cambodia
Bangladesh Honduras Mauritania Ghana China Burkina Faso Rwanda Nicaragua Guatemala Togo
Ecuador China Thailand Brazil Egypt Viet Nam Honduras Belize Nicaragua
Armenia Kazakhstan Sri Lanka Cuba Mexico El Salvador Benin Chile Malawi Gambia Guatemala
SOURCE.ODI MDG Report Card (N.d.) www.odi.org.uk/
Challenges
In its MDG Report the Government of Ethiopia identified several challenges that could at best slow down achievements and at worst reverse some of the gains (MoFED, 2010),. The key informants consulted for this paper also identified challenges some of which are consistent with MoFED. The major challenges are (i) human and institutional capacity (ii) lack of good governance; (iii) poor coordination, linkage and lack of trust between state and non-state actors (iv) macroeconomic challenges (e.g. inflation, unemployment) (v) vulnerability to external shocks (vi) high population growth and deep rooted
23The ODI ranking is based on a simple aggregation of rankings across the first seven MDGs (using one indicator per goal and an additional indicator on hunger for Goal 1): 1.1 (poverty), 1.8 (hunger); 2.1 (education); 3.1 (gender disparity); 4.1 (child mortality); 5.2 (maternal mortality); 6.1 (HIV AIDS) and 7.8 (water).

116
Amdissa Teshome
118
customs (vii) entrenched poverty (viii) ambitious planning and (ix) low quality of higher education (see Table 6 for details).
Table 6: MDG challenges Challenges MoFED
(2010) Key informants for this paper
(2013) Regional disparity in MDG achievements, pastoral and other emerging regions in particular
Low levels of income, savings and productivity in the agricultural sector
Limited implementation capacity Lack of strong institutional coordination mechanism and ownership of MDGs; constant restructuring, dissolving and creation of institutions affecting the quality, experience and commitment of civil servants
Macro challenges (Inflation, negative balance of payments and unemployment in general and youth unemployment in particular)
Limited or reduced development finance Vulnerability to internal and external shocks – drought, climate change, world economic and geopolitical conditions, and the rising costs of essential inputs such as fuel, fertilizer and imported grains
Increasing trends in inequality.24 The deep rooted cultures hampering progress towards gender empowerment and reduction of maternal mortality.
Limited availability of basic infrastructures such as water, electricity, road connections, laboratories, blood banks, communication, and referral systems - crucial for improving maternal health.
Limited HIV/AIDS mainstreaming in non-public sectors Systematic corruption Lack of good governance; inability to build a governance system that is inclusive of all political parties; weak integration, trust and partnership with none-state actors (Civil society, private sector, communities)
Ambitious planning Entrenchment of poverty despite considerable efforts to reduce it
24For urban areas the gain in poverty reduction obtained due to growth (about a 12 percentage point reduction) was accompanied by inequality (which raised it by about 14 percentage points), leading to a rise in poverty
117
Development Programs and the Post-MDG Agenda
119
Limited accountability on the part of non-state actors on resources allocated through them.
High population growth Low education quality at higher education level and lack of coherence with the demand of the economy especially from long-term perspectives.
Different baselines (starting points) for targets affecting achievements. For example, the baseline poverty level is high while the baseline level of health coverage is very low
SOURCE: Summarised from MoFED 2010 and key informant responses
The Post-MDG agenda The options Whatever the critics say about the MDGs, they have served a purpose. The discourse has now shifted from achievement to defining elements of the successor.Three scenarios have emerged from work done by UNECA/AUC (2012). These are explained below: (i) Retaining MDGs are they are: The case for retaining the MDGs comes out of the feeling that the timeframe for implementation of the entire programme was too short. Although it is 15 years since the MDGs were launched, it took eight years to design, fine-tune and sensitise the MDGs across countries. It is only 10 years since actual implementation began (including alignment with national poverty reduction strategies). Therefore, to try to halve extreme hunger in 10 years is not only ambitious but also unrealistic.Furthermore, the international community and the countries concerned cannot afford to go through another round of designing a new or modified framework. Therefore, MDGs deserve an extended period. (ii) Reforming the MDGs: There are also equally persuasive arguments for reformulating MDGs instead of maintain them as they are. Those who advocate reformulations contend that negotiations for the current MDGs started in the 90s so the MDG thinking is almost 25 years old. The situation then is markedly different from the situation now and would be more different from the post-MDG period. MDGs have already been criticised for not being flexible and dynamic to capture changing circumstances. Therefore, there is very little point in continuing the present MDGs as they are. They need to be re-designed taking stoke of the strength, limitations and the challenges presented in this paper. (ii) Developing an alternative framework: The third option on the table is to abandon MDGs altogether and design an alternative framework. Those advocating this option argue that the present MDGs are focused too much on outcomes and this is misplaced particularly for developing countries. What is

118
Amdissa Teshome
120
needed is a process-oriented approach facilitated by a developmental state. For example, the undue emphasis on primary education has contributed to weak human capital development at higher education levels thereby hindering economic transformation in Africa. Other process-oriented areas are the transformative role of infrastructure, agricultural markets, energy, financial markets and appropriate land policies (UNECA/AU, 2012). However, this option is loaded with too many ideas, and lacks focus which makes it difficult to monitor progress.
Which option for the post-MDG period? Despite considerable debates, a clear cut choice is not forthcoming. However, the idea of MDG+ (combination of option 1 and 2) has been floated.In this scenario, the current MDGsare retained but refined to address new priorities identified by citizens across the world, including Ethiopians. For example, quality of education should be the top priority since Ethiopia has done reasonably well in increasing access. Adult educationis one of the areas neglected in the previous MDGs.There is a strong case to includeit in the next phase because even if people are liberated from extreme hunger and poverty they still remain without education.25Figure 2 is a simplified illustration of the MDG Plus option. Figure 2. A simplified illustration of MDG +26
SOURCE. Based on discussion in this paper
25Adult Education for Development: Post 2015 (DVV International, 2013) presents strong case for including adult and life-long education as part of the MDGs. It argues that there are numerous global agreements on education in general and adult education in particular that can be reinvigorated and mainstreamed into MDGs. Examples include education for all (Dakar 2000); Belem Framework for Action (Brazil 2009) and the Agenda for the Future (1997). 26The United Nations High Level Panel (United Nations, 2013) has developed 12 illustrative goals for Post 2015 which take into account strength and limitations discussed in this paper. These are (1) End Poverty (2) Empower Girls and Women and Achieve Gender Equality (3) Provide Quality Education and Lifelong Learning (4) Ensure Healthy Lives (5) Ensure Food Security and Good Nutrition (6) Achieve Universal Access to Water and Sanitation (7) Secure Sustainable Energy (8) Create Jobs, Sustainable Livelihoods, and Equitable Growth (9) Manage Natural Resource Assets Sustainably (10) Ensure Good Governance and Effective Institutions (11) Ensure Stable and Peaceful Societies and (12) Create a Global Enabling Environment and Catalyse Long Term Finance.
New priorities: Better/quality education (including adult education ) Better job opportunities Better/quality health care And others
+ MDGs

119
Development Programs and the Post-MDG Agenda
121
The priorities
As the 2015 deadline for the MDGs approaches, there is a frantic effort to identify priorities. The most comprehensive effort is the global surveylaunched by the UN Special Task Team.Citizens of the world are required to vote for their six top priorities among the 16 identified by the Taskforce. The survey is completed online as well as by post. At the time of writing, 1,225,176 people (of which 12,092 are Ethiopians) from 194 countries have voted for their most pressing development issues that should be the focus of national and global efforts.
Table 7is an extract of results for six African countries. It compares their priorities with world priorities. Accordingly, (i) good education, (ii) better job opportunities, (iii) better health care, (iv) an honest and responsive government, v) access to clean water and sanitation and (vi) affordable and nutritious food are the top six most pressing development priorities for citizens of the world in the Post 2015 period. For Ethiopia, the top four are consistent with world priorities and the top three priorities for five African countries arealso consistent with world rankings.

120 12
2 Ta
ble
7. C
ompa
rison
of d
evel
opm
ent p
riorit
ies o
f sel
ecte
d A
fric
an c
ount
ries
with
wor
ld p
riorit
ies f
or th
e Po
st-M
DG
age
nda
SOU
RC
E. E
xtra
ct fr
om U
N T
ask
Team
(N.d
) My
Wor
ld S
urve
y (w
ww
.myw
orld
.org
) acc
esse
d N
ov. 1
0, 2
013
Dev
elop
men
t prio
ritie
s Et
hiop
ian
(n=1
2092
) K
enya
(n
=543
2)
Rw
anda
(n
=370
21)
Suda
n (n
=258
0)
Tanz
ania
n (n
=374
70)
Uga
nda
(n=1
583)
W
orld
(n
=1.2
m)
A g
ood
educ
atio
n
1 1
1 1
1 2
1 B
ette
r job
opp
ortu
nitie
s 2
3 3
3 2
4 3
Bet
ter h
ealth
car
e
3 2
2 2
3 1
2 A
n ho
nest
and
resp
onsib
le g
over
nmen
t 4
5 11
4
7 5
4 Po
litic
al fr
eedo
m
5 16
13
11
13
14
13
A
cces
s to
clea
n w
ater
and
sani
tatio
n
6 4
8 5
6 3
5
Free
dom
from
dis
crim
inat
ion
and
pers
ecut
ion
7
9 5
10
10
10
10
Phon
e an
d in
tern
et a
cces
s 8
12
7 16
8
11
14
Prot
ectio
n ag
ains
t crim
e an
d vi
olen
ce
9 6
6 6
4 6
7 Eq
ualit
y be
twee
n m
en a
nd w
omen
10
10
10
12
9
12
9 A
ctio
n ta
ken
on c
limat
e ch
ange
11
14
16
15
16
13
16
Pr
otec
ting
fore
sts,
river
s and
oce
ans
12
8 14
13
11
9
8 A
ffor
dabl
e an
d nu
tritio
us fo
od
13
7 4
7 5
8 6
Supp
ort f
or p
eopl
e w
ho c
anno
t w
ork
14
13
12
8 12
15
11
Bet
ter t
rans
port
and
road
s 15
11
15
9
14
7 12
Rel
iabl
e en
ergy
at h
ome
16
15
9 14
15
16
15
Amdi
ssa
Tesh
ome
120
need
ed is
a p
roce
ss-o
rient
ed a
ppro
ach
faci
litat
ed b
y a
deve
lopm
enta
l sta
te. F
or
exam
ple,
the
und
ue e
mph
asis
on p
rimar
y ed
ucat
ion
has
cont
ribut
ed t
o w
eak
hum
an
capi
tal
deve
lopm
ent
at
high
er
educ
atio
n le
vels
ther
eby
hind
erin
g ec
onom
ic
trans
form
atio
n in
A
fric
a.
Oth
er
proc
ess-
orie
nted
ar
eas
are
the
trans
form
ativ
e ro
le o
f in
frastr
uctu
re,
agric
ultu
ral
mar
kets
, en
ergy
, fin
anci
al
mar
kets
and
app
ropr
iate
land
pol
icie
s (U
NEC
A/A
U, 2
012)
. How
ever
, thi
s opt
ion
is l
oade
d w
ith t
oo m
any
idea
s, an
d la
cks
focu
s w
hich
mak
es i
t di
fficu
lt to
m
onito
r pro
gres
s. W
hich
opt
ion
for
the
post
-MD
G p
erio
d? D
espi
te c
onsi
dera
ble
deba
tes,
a cl
ear
cut c
hoic
e is
not
for
thco
min
g. H
owev
er, t
he id
ea o
f M
DG
+ (c
ombi
natio
n of
opt
ion
1 an
d 2)
has
bee
n flo
ated
.In t
his
scen
ario
, th
e cu
rren
t M
DG
sare
re
tain
ed b
ut r
efin
ed t
o ad
dres
s ne
w p
riorit
ies
iden
tifie
d by
citi
zens
acr
oss
the
wor
ld, i
nclu
ding
Eth
iopi
ans.
For e
xam
ple,
qua
lity
of e
duca
tion
shou
ld b
e th
e to
p pr
iorit
y si
nce
Ethi
opia
has
don
e re
ason
ably
wel
l in
inc
reas
ing
acce
ss.
Adu
lt ed
ucat
ioni
s on
e of
the
area
s ne
glec
ted
in th
e pr
evio
us M
DG
s.The
re is
a s
trong
ca
se t
o in
clud
eit
in t
he n
ext
phas
e be
caus
e ev
en i
f pe
ople
are
lib
erat
ed f
rom
ex
trem
e hu
nger
and
pov
erty
they
stil
l rem
ain
with
out e
duca
tion.
25Fi
gure
2 is
a
sim
plifi
ed il
lustr
atio
n of
the
MD
G P
lus o
ptio
n.
Figu
re 2
. A si
mpl
ified
illu
strat
ion
of M
DG
+26
SO
URC
E. B
ased
on
disc
ussio
n in
this
pape
r
25A
dult
Educ
atio
n fo
r Dev
elop
men
t: Po
st 20
15 (D
VV
Inte
rnat
iona
l, 20
13) p
rese
nts s
trong
cas
e fo
r in
clud
ing
adul
t and
life
-long
edu
catio
n as
par
t of
the
MD
Gs.
It ar
gues
that
ther
e ar
e nu
mer
ous
glob
al a
gree
men
ts on
edu
catio
n in
gen
eral
and
adu
lt ed
ucat
ion
in p
artic
ular
tha
t ca
n be
re
invi
gora
ted
and
mai
nstre
amed
int
o M
DG
s. Ex
ampl
es i
nclu
de e
duca
tion
for
all
(Dak
ar 2
000)
; Be
lem
Fra
mew
ork
for A
ctio
n (B
razi
l 200
9) a
nd th
e A
gend
a fo
r the
Fut
ure
(199
7).
26Th
e U
nite
d N
atio
ns H
igh
Leve
l Pan
el (U
nite
d N
atio
ns, 2
013)
has
dev
elop
ed 1
2 ill
ustra
tive
goal
s fo
r Pos
t 201
5 w
hich
take
into
acc
ount
stre
ngth
and
lim
itatio
ns d
iscus
sed
in th
is pa
per.
Thes
e ar
e (1
) End
Pov
erty
(2) E
mpo
wer
Girl
s and
Wom
en a
nd A
chie
ve G
ende
r Equ
ality
(3) P
rovi
de Q
ualit
y Ed
ucat
ion
and
Life
long
Lea
rnin
g (4
) En
sure
Hea
lthy
Live
s (5
) En
sure
Foo
d Se
curit
y an
d G
ood
Nut
ritio
n (6
) Ach
ieve
Uni
vers
al A
cces
s to
Wat
er a
nd S
anita
tion
(7) S
ecur
e Su
stain
able
Ene
rgy
(8)
Crea
te J
obs,
Susta
inab
le L
ivel
ihoo
ds, a
nd E
quita
ble
Gro
wth
(9) M
anag
e N
atur
al R
esou
rce
Ass
ets
Susta
inab
ly (
10)
Ensu
re G
ood
Gov
erna
nce
and
Effe
ctiv
e In
stitu
tions
(11
) En
sure
Sta
ble
and
Peac
eful
Soc
ietie
s an
d (1
2) C
reat
e a
Glo
bal
Enab
ling
Envi
ronm
ent
and
Cata
lyse
Lon
g Te
rm
Fina
nce.
New
prio
ritie
s:
Bette
r/qua
lity
educ
atio
n (in
clud
ing
adul
t edu
catio
n )
Be
tter j
ob o
ppor
tuni
ties
Be
tter/q
ualit
y he
alth
car
e
A
nd o
ther
s +
MD
Gs

121123
Conclusions and recommendations As 2015 approaches, countries everywhere are assessing their progress and short falls as a prelude to setting priorities for the post-2015 agenda. The successes so far are not insignificant. Without MDGs, we may still find millions of children out of school, millions hungry and millions dying of HIV/AIDS. Thanks to MDGs,citizens are able to speak with one voice on the most pressing development issues. MDGs have also influenced the launchof CAADP with a specific aim of accelerating the MDG achievements in Africa.
The review and expert consultation revealed that Ethiopia faces considerable challenges as it strives to achieve MDGs. The government and development partners should pay attention to these challenges and limitations if Ethiopia is to continue making progress in its overall development endeavours. MDGs have shown the way. They have demonstrated that countries can focus their energy on solving economic and social problems. Should Ethiopia wait for the global community to hand down goals for the next 15 years? I think not. The gaps are known, the priorities are identified through the global process. MDGs should be used to galvanise local institutions in the same way they galvanised the global community. To this end, it is crucial to: Initiate an overhaul of polices and strategies in a genuinely participatory
way. This gives the Government the opportunity to incorporate lessons from the MDG process.
Enhance confidence in national statistics. It is important to strengthen the data collection and analysis capacity at national and sub-national levels. Maintain the professionalism and independence of the statistical agencies. Encourage the development of an independent local agency to complement the national statistical system.
Take priorities identified by citizens into account in national development planning in general and settingpost-MDG targets in particular.Potential areas where the country lagged behind or did not pay attention to include: (i) quality of education and health services (ii) inclusive education (children with various disabilities and adult education) (iii) secondary education (iv) genuine political participation; and (v) balanced regional development (pastoral and remote areas).
Development Programs and the Post-MDG Agenda
121
The priorities
As the 2015 deadline for the MDGs approaches, there is a frantic effort to identify priorities. The most comprehensive effort is the global surveylaunched by the UN Special Task Team.Citizens of the world are required to vote for their six top priorities among the 16 identified by the Taskforce. The survey is completed online as well as by post. At the time of writing, 1,225,176 people (of which 12,092 are Ethiopians) from 194 countries have voted for their most pressing development issues that should be the focus of national and global efforts.
Table 7is an extract of results for six African countries. It compares their priorities with world priorities. Accordingly, (i) good education, (ii) better job opportunities, (iii) better health care, (iv) an honest and responsive government, v) access to clean water and sanitation and (vi) affordable and nutritious food are the top six most pressing development priorities for citizens of the world in the Post 2015 period. For Ethiopia, the top four are consistent with world priorities and the top three priorities for five African countries arealso consistent with world rankings.

122
Amdissa Teshome
124
Acronyms
ADLI Agricultural Development Led Industrialisation
ATA Agricultural Transformation Agency
AUC Africa Union Commission
CAADP Comprehensive African Agriculture Development Programme
CDM Carbon Development Mechanism
CRGE Climate Resilient Green Economy
EPRDF Ethiopian People’s Revolutionary Front
FDRE Federal Democratic Republic of Ethiopia
GDF GRIPS Development Forum
GTP Growth and Transformation Plan
HABP Household Asset Building Programme
MDG Millennium Development Goals
NSA Non-State Actors
ODI Overseas Development Institute
PANE Poverty Action Network
PASDEP Plan for Accelerated and Sustained Development to End poverty
PRSP Poverty Reduction Strategy Paper
PSNP Productive Safety Net Programme
SDPRP Sustainable Development for Poverty Reduction Paper
TGE Transitional Government of Ethiopia
UNCT United Nations Country Team
UNDP United Nations Development Programme
UNECA United Nations Economic Commission for Africa

123125
References Africa Union Commission (AUC) 2009.Frameworkand Guidelines on Land
Policy in Africa, Draft March 2009, Addis Ababa. Agricultural Transformation Agency (ATA) 2012. Annual Report. Addis Ababa. Aklilu Amsalu. 2012. Eradicating Extreme Poverty and Hunger in Ethiopia: A
Review of Development Strategies, Achievements, and Challenges in Relation WithMDG1. NCCR North-South Dialogue 45 (Working Paper, Special Research Project 4 – Beyond the MDGs). Bern, Switzerland: NCCR North-South.
AmdissaTeshome 2010.Synopsis of Selected Development Policies, Strategies and Programmes in Ethiopia. Unpublished paper prepared for CARE-Ethiopia. Addis Ababa.
______2008a.Review of Education Sector policy, Strategies and Programmes. In Taye Assefa (ed) Digest of National Policies, Strategies and Programmes, Forum for Social Studies.Addis Ababa.
_______2008b.‘Towards the Third Generation PRSP’, The Ethiopian Herald, September 23 & 24th, 2007, Addis Ababa.
_______2006 Agriculture, Growth and Poverty Reduction in Ethiopia: policy process around the new PRSP (PASDEP), Policy Brief No. 05(www.future-agricultures.org), Institute of Development Studies, UK
______ 2003.Policy Review for the Destitution Study.In Sharp. K. Devereux, S. and Amare, Y. Destitution in Northern Highlands Ethiopia, a consultancy study for SC-UK, Addis Ababa.
AsnakeKefale and FanaGebresenbet 2014.The Expansion of the Sugar Industry in Pastoral lands and the Political Economy of State Managed Industrial Development in Ethiopia. In DessalegnRahmato, MeheretAyenew AsnakeKefale and Birgit Habermann (eds)Economic Development in Ethiopia: Changing Trends, Sustainability and Challenges. Forum for Social Studies, Addis Ababa.
Brown, T. &Amdissa Teshome 2005.‘Implementing Policies for Chronic Poverty in Ethiopia. Background paper for the Chronic Poverty Report, Chronic Poverty Centre, London and Manchester.
Chamberlin, J and E. Schmidt 2012.‘Ethiopian Agriculture: the Dynamic Geographic Perspective’. In Paul Dorosh and Shahidur Rashid (eds) Food and Agriculture in Ethiopia: Progress and Policy Challenges pp 21-52. International Food Policy Research Institute, University of Pennsylvania Press, Philadelphia.
Development Programs and the Post-MDG Agenda
121
The priorities
As the 2015 deadline for the MDGs approaches, there is a frantic effort to identify priorities. The most comprehensive effort is the global surveylaunched by the UN Special Task Team.Citizens of the world are required to vote for their six top priorities among the 16 identified by the Taskforce. The survey is completed online as well as by post. At the time of writing, 1,225,176 people (of which 12,092 are Ethiopians) from 194 countries have voted for their most pressing development issues that should be the focus of national and global efforts.
Table 7is an extract of results for six African countries. It compares their priorities with world priorities. Accordingly, (i) good education, (ii) better job opportunities, (iii) better health care, (iv) an honest and responsive government, v) access to clean water and sanitation and (vi) affordable and nutritious food are the top six most pressing development priorities for citizens of the world in the Post 2015 period. For Ethiopia, the top four are consistent with world priorities and the top three priorities for five African countries arealso consistent with world rankings.

124
Amdissa Teshome
126
Coll-Black, S. D., O Gillinghan, J. Hoddinott, Kumar, Alemayehu SeyoumTafesse, and W. Wiseman 2011.‘Targeting Food Security Interventions in Ethiopia: the Productive Safety Net Programme’.In Paul Dorosh and Shahidur Rashid (eds) Food and Agriculture in Ethiopia: Progress and Policy Challenges pp 280-317. International Food Policy Research Institute, University of Pennsylvania Press, Philadelphia.
Degol Hailu and R. Tsukada 2012. Is the Distribution of Foreign Aid MDG-Sensitive? DESA Working Paper No. 111ST/ESA/2012/DWP/111. February 2012. United Nations Department of Economic and Social Affairs (http://www.un.org/en/development/desa/papers/)
DessalegnRahmato. 2008. ‘Ethiopia: Agriculture Policy Review’. In TayeTafesse (ed.) Digest of Government Policies, Strategies and Programmes, pp 143-144. Forum for Social Studies, Addis Ababa.
DVV International 2013. Adult Education for Development: Post 2015. Issue no. 80. Bonn, Germany.
Environmental Protection Authority (EPA) 2012. National Report of Ethiopia Submitted to United Nations Conference on Sustainable Development (Rio+20), Addis Ababa.
FDRE 1995 Constitution of the Federal Democratic Republic of Ethiopia.Proclamation No. 1, Negarit Gazeta 1st Year, No. 1. 21st August 1995. Addis Ababa.
------- 2013 Council of Ministers Regulation No. 283/2013 to establish the Ethiopian Agricultural Investment Land Administration Agency. Federal Negarit Gazeta, 19th Year No. 32, Addis Ababa, March 2013.
Fuad Ibrahim 2011. Ethiopian Ministry of Education Presentation for International Literacy Day - September 8, 2011 at USAID, Addis Ababa.
GDF.2009.http://www.grips.ac.jp/forum-e/af-growth/support_ethiopia/support_ethiopia.htm
Graham, J. et.al, 2012 Disaster Response and Emergency Risk Management in Ethiopia. In Paul Dorosh and Shahidur Rashid (eds) Food and Agriculture in Ethiopia: Progress and Policy Challenges pp 256-279. International Food Policy Research Institute, University of Pennsylvania Press, Philadelphia.
Hagen-Zanker, J. and R. Mallett.2013. How to do a rigorous, evidence-focused literature review in international development: A Guidance Note. Working Paper September 2013, Overseas Development Institute, London.

125
Development Programs and the Post-MDG Agenda
127
Ministry of Agriculture (MoA) 2014 Next Generation Design Document for the Rural Productive Safety Net.DRAFT 18 April 2014. Addis Ababa.
Ministry of Agriculture (MoA) 2011.Social & Environmental Code of Practice for Agricultural Investment.May 2011, Addis Ababa.
Ministry of Agriculture and Rural Development (MoARD) 2009a. Food Security Programme2010-2014: Productive Safety Net, August 2009, Addis Ababa.
----------2009b. Food Security Programme2010-2014: Household Asset Building, August 2009, Addis Ababa.
Ministry of Education (MoE) 2012.Educational Statistics Abstracts. Educational Management Information System, Addis Ababa.
Ministry of Federal Affairs (MoFA) .N.d. Emerging Regions Development Programme (ERDP), Addis Ababa.
Ministry of Finance and Economic Development (MoFED) 2012.Growth and Transformation Plan (2010/11-2014/15) Annual Progress Report for F.Y. 2010/11, June 2012, Addis Ababa.
_____ 2010.Ethiopia: 2010 Millennium Development Goals Report. Addis Ababa
Overseas Development Institute (ODI) N.d. Millennium Development Goals Report Card: Learning from Progress, London (www.odi.org).
PANE 2006.The Impact of Food Aid in Ethiopia August 2006, Addis Ababa, Ethiopia.
Samuel G/Selassie 2006. Land, Land Policy andSmallholder Agriculture inEthiopia: Options andScenarios. Discussion Paper 008, Future Agricultures Consortium, Institute of Development Studies, Brighton, UK.
Tabatabai, H. 2007. MDG Targets: Misunderstood or Misconceived? Poverty Centre, One Pager, April 2007.
TGE 1991. Transitional Period Charter of Ethiopia, Negarit Gazeta 50th Year, No. 1, 22nd July 1991, Addis Ababa.
United Nations 2013.A New Global Partnership: Eradicate Poverty and Transform Economies through Sustainable Development. The Report of High-Level Panel of Eminent Persons on the Post-2015 Development Agenda, New York.
UN Millennium Project 2005.Investing in Development: A Practical Plan to AchievetheMillennium Development Goals. New York.

126
Amdissa Teshome
128
UNCT2011. Ethiopia: United Nations Development Assistance Framework2012 to 2015, Addis Ababa.
UNDP 2013.Assessing Progress in Africa towards the Millennium Development Goals, 2013.
UNECA/AUC 2012. Note for the High Level Panel Discussion on “Articulating a Post-2015 MDG Agenda”, Addis Ababa.
UN Task Team. N.d. My World Survey (see http://www.myworld2015.org/). USAID2004.Ethiopia Land Policy and Administration Assessment.ARD, Inc.,
USA Vandemoortele. J. 2009.Taking the MDGs Beyond 2015: Hasten Slowly
Millennium Development Goals (http://en.wkpedia.org/wki/mdg Vandemoortele, J. 2007. “MDGs: Misunderstood Targets?”International Poverty
Centre and UNDP.One Pager, No. 28.January, 2007. Vandercasteelen, J., M. Dereje, B.Minten, and Alemayehu SeyoumTaffesse
2013 Scaling-up adoption of improved technologies: The impact of the promotion of row planting on farmers’ teff yields in Ethiopia, ESSP WORKING PAPER 60, International Food Policy Research Institute and Ethiopian Development Research Institute, October 2013, Addis Ababa.
World Bank. 2013. World Bank–Civil Society Engagement: Reviewof Fiscal Years 2010-12. World Bank: Washington, DC. License: Creative Commons Attribution CC BY 3.0
Yihenew Zewde, Amdissa Teshome and Kassahun Berhanu 2013.CAADP Drivers of Success Study.Consultancy report for TANGO International. Addis Ababa.
Yisak Tafere and Tassew Woldehanna 2012.Rural youth aspiring to occupations beyond agriculture: Evidence from Young Lives Study in Ethiopia. A Paper Presented at the Young People, Farming and Food Conference. Accra, Ghana. From 19-21 March, 2012

127
129
Ann
ex 1
. Chr
onol
ogy
of E
thio
pia’
s po
licie
s, s
trat
egie
s an
d pr
ogra
mm
es b
y m
ajor
cat
egor
ies
Bro
ad c
ateg
orie
s Sp
ecif
ic p
olic
ies/
stra
tegi
es
Yea
r pr
omul
gate
d I
Con
stit
utio
nal b
ase
for
econ
omic
and
soc
ial d
evel
opm
ent
1.
T
he T
rans
ition
al C
hart
er
1991
2.
The
FD
RE
Con
stitu
tion
1995
3.
Prog
ram
me
of th
e E
PRD
F 19
95
4.
Act
ion
Plan
of t
he E
PRD
F fo
r Dev
elop
men
t, Pe
ace
and
Dem
ocra
cy
1995
II A
gric
ultu
re a
nd r
ural
dev
elop
men
t
5.
A
gric
ultu
ral D
evel
opm
ent L
ed In
dust
rial
isat
ion
1992
6.
Eco
nom
ic P
olic
y fo
r the
Tra
nsiti
onal
Per
iod
1992
7.
T
he N
atio
nal A
gric
ultu
ral R
esea
rch
Polic
y an
d St
rate
gy
1993
8.
Eco
nom
ic D
evel
opm
ent S
trat
egy
for E
thio
pia
19
94
9.
Rur
al D
evel
opm
ent P
olic
y an
d St
rate
gy
2001
10
. Fe
dera
l Pro
clam
atio
ns o
n R
ural
Lan
d A
dmin
istr
atio
n an
d U
se
2005
11.
Reg
iona
l Pro
clam
atio
ns o
n R
ural
Lan
d A
dmin
istr
atio
n an
d U
se
2006
-200
8
12.
SDPR
P (1
st P
RSP
) 20
01/0
2
13.
PASD
EP
(2nd
PR
SP)
2005
/06
14.
GT
P 20
10/1
1
III
Clim
ate
chan
ge a
nd e
nvir
onm
enta
l thr
eats
15.
The
Env
iron
men
t Pol
icy
of E
thio
pia
19
97
16
. T
he
Con
serv
atio
n St
rate
gy
of
Eth
iopi
a (A
pril
1997
) in
clud
ing
9 R
egio
nal
Stat
es’
Con
serv
atio
n St
rate
gies
19
97
17
. T
he N
atio
nal P
olic
y on
Bio
dive
rsity
Con
serv
atio
n an
d R
esea
rch
19
98
Dev
elop
men
t Pro
gram
s and
the
Post
-MD
G A
gend
a
121
The
prio
ritie
s
As
the
2015
dea
dlin
e fo
r th
e M
DG
s ap
proa
ches
, th
ere
is a
fra
ntic
effo
rt to
id
entif
y pr
iorit
ies.
The
mos
t com
preh
ensiv
e ef
fort
is th
e gl
obal
sur
veyl
aunc
hed
by th
e U
N S
peci
al T
ask
Team
.Citi
zens
of t
he w
orld
are
requ
ired
to v
ote
for t
heir
six
top
prio
ritie
s am
ong
the
16 i
dent
ified
by
the
Task
forc
e. T
he s
urve
y is
co
mpl
eted
onl
ine
as w
ell a
s by
post.
At t
he ti
me
of w
ritin
g, 1
,225
,176
peo
ple
(of
whi
ch 1
2,09
2 ar
e Et
hiop
ians
) fro
m 1
94 c
ount
ries
have
vot
ed f
or t
heir
mos
t pr
essi
ng d
evel
opm
ent
issue
s th
at s
houl
d be
the
foc
us o
f na
tiona
l an
d gl
obal
ef
forts
. Tabl
e 7i
s an
ext
ract
of r
esul
ts fo
r six
Afri
can
coun
tries
. It c
ompa
res
thei
r pr
iorit
ies
with
wor
ld p
riorit
ies.
Acc
ordi
ngly
, (i)
good
edu
catio
n, (
ii) b
ette
r jo
b op
portu
nitie
s, (ii
i) be
tter h
ealth
car
e, (i
v) a
n ho
nest
and
resp
onsi
ve g
over
nmen
t, v)
acc
ess t
o cl
ean
wat
er a
nd sa
nita
tion
and
(vi)
affo
rdab
le a
nd n
utrit
ious
food
are
th
e to
p six
mos
t pre
ssin
g de
velo
pmen
t prio
ritie
s fo
r citi
zens
of t
he w
orld
in th
e Po
st 2
015
perio
d. F
or E
thio
pia,
the
top
four
are
con
siste
nt w
ith w
orld
prio
ritie
s an
d th
e to
p th
ree
prio
ritie
s fo
r fiv
e A
frica
n co
untri
es a
real
so c
onsis
tent
with
w
orld
rank
ings
.
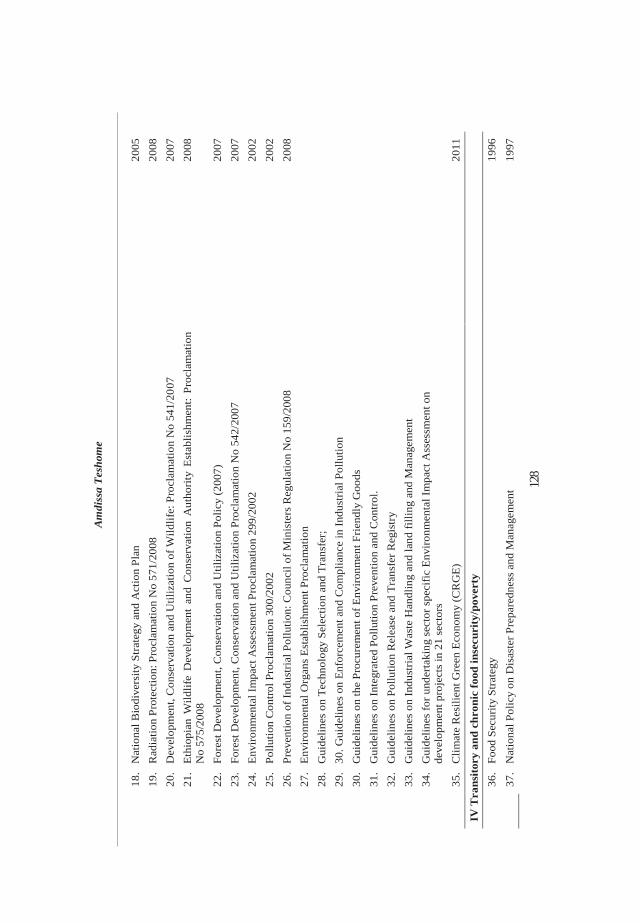
128
Am
diss
a Te
shom
e
130
18
. N
atio
nal B
iodi
vers
ity S
trate
gy a
nd A
ctio
n Pl
an
2005
19.
Rad
iatio
n Pr
otec
tion:
Pro
clam
atio
n N
o 57
1/20
08
2008
20.
Dev
elop
men
t, C
onse
rvat
ion
and
Util
izat
ion
of W
ildlif
e: P
rocl
amat
ion
No
541/
2007
20
07
21
. Et
hiop
ian
Wild
life
Dev
elop
men
t an
d C
onse
rvat
ion
Aut
horit
y Es
tabl
ishm
ent:
Proc
lam
atio
n N
o 57
5/20
08
2008
22
. Fo
rest
Dev
elop
men
t, C
onse
rvat
ion
and
Util
izat
ion
Polic
y (2
007)
20
07
23
. Fo
rest
Dev
elop
men
t, C
onse
rvat
ion
and
Util
izat
ion
Proc
lam
atio
n N
o 54
2/20
07
2007
24.
Envi
ronm
enta
l Im
pact
Ass
essm
ent P
rocl
amat
ion
299/
2002
20
02
25
. Po
llutio
n C
ontro
l Pro
clam
atio
n 30
0/20
02
2002
26.
Prev
entio
n of
Indu
stria
l Pol
lutio
n: C
ounc
il of
Min
iste
rs R
egul
atio
n N
o 15
9/20
08
2008
27.
Envi
ronm
enta
l Org
ans
Esta
blis
hmen
t Pro
clam
atio
n
28
. G
uide
lines
on
Tech
nolo
gy S
elec
tion
and
Tran
sfer
;
29
. 30
. Gui
delin
es o
n En
forc
emen
t and
Com
plia
nce
in In
dust
rial P
ollu
tion
30.
Gui
delin
es o
n th
e Pr
ocur
emen
t of E
nviro
nmen
t Frie
ndly
Goo
ds
31.
Gui
delin
es o
n In
tegr
ated
Pol
lutio
n Pr
even
tion
and
Con
trol.
32.
Gui
delin
es o
n Po
llutio
n R
elea
se a
nd T
rans
fer R
egis
try
33.
Gui
delin
es o
n In
dust
rial W
aste
Han
dlin
g an
d la
nd fi
lling
and
Man
agem
ent
34.
Gui
delin
es fo
r und
erta
king
sec
tor s
peci
fic E
nviro
nmen
tal I
mpa
ct A
sses
smen
t on
deve
lopm
ent p
roje
cts
in 2
1 se
ctor
s
35
. C
limat
e R
esili
ent G
reen
Eco
nom
y (C
RG
E)
2011
IV T
rans
itory
and
chr
onic
food
inse
curi
ty/p
over
ty
36
. Fo
od S
ecur
ity S
trate
gy
1996
37.
Nat
iona
l Pol
icy
on D
isas
ter P
repa
redn
ess
and
Man
agem
ent
1997

129
Deve
lopm
ent P
rogr
ams a
nd th
e Pos
t-MDG
Age
nda
131
38.
Disa
ster R
isk M
anag
emen
t Pol
icy
2013
39.
The N
ew C
oalit
ion f
or fo
od S
ecur
ity
2003
40.
The F
ood S
ecur
ity P
rogr
amm
e 20
02-
V Ad
dres
sing s
ocia
l ine
quali
ties
41
. W
omen
’s Po
licy
1993
42
. He
alth P
olicy
19
93
43.
Educ
ation
& T
rain
ing P
olicy
19
94
44.
Deve
lopm
ental
Soc
ial W
elfar
e Pol
icy
1996
45.
Yout
h Pol
icy
2004
46
. So
cial P
rotec
tion P
olicy
and S
trateg
y 20
14?
VI A
ddre
ssin
g reg
iona
l ine
quali
ties
47
. Pa
stora
l Dev
elopm
ent P
olicy
Stat
emen
t (M
oFA)
20
08
48.
Prog
ram
mes
for D
evelo
ping
Reg
iona
l Stat
es (M
oFA)
20
11
49
. M
DG pr
ojec
t/pro
gram
me f
or P
asto
ral A
reas
(MoA
) 20
12
SOUR
CE. A
utho
r’s co
mpila
tion

PART II
DECENTRALIZATION AND REVENUE SHARING


135
5 Tegegne Gebre-Egziabher
Decentralization and Regional and Local Development: Trends and Policy Implications Introduction Regional development has gained significant attention in Ethiopia with territorial decentralization introduced in 1991. Not only does this decentralization recognizes regions and sub-regions based on their ethnic identities, but transfers substantial power, authority and resources to them in a manner that enables them to formulate their own social and economic policies and execute development projects. This has been undertaken under two waves of decentralization. The first wave that took place in the early 1990s devolved powers and authorities to regional governments. The second wave beginning from early 2000 devolved power and authority to the woreda administration.
Decentralized governance structures facilitates local and regional development particularly by helping regions and localities enhance their resource capacity, facilitate local planning and participation, strengthen human capacity and service delivery, and enhance policy formulation processes at local level. Past observations have made it clear that though decentralization has brought some progress in regional and local development, it has not been to the desired level (Tegegne 1998). In particular, studies made in late 1990s and early 2000s noted deficiencies in local planning and participation, local revenue raising and human capacities (Tegegne 1998; Asmelash 2000). This may be due to the country's lack of experience in decentralized governance. Now that two decades have passed since the launching of the first phase of decentralization and it has been more than a decade since woreda decentralization has taken place, it is appropriate to take stock of decentralization and regional and local development by examining trends in some key issues of decentralization relevant for regional development. The objective of this chapter is to examine the trends in key issues of decentralization, namely resource availability and local capacity in order to record changes and derive policy implications. The specific objectives are: to examine trends in resource availability among regions and woredas; to look at

134
Tegegne Gebre-Egziabher
136
trends in human capacity, local planning and participation; and to make policy suggestions with regard to decentralization and regional and local development.
In order to achieve the above objectives, the chapter uses secondary data from government offices and makes a desk review of relevant studies. The rest of the chapter is structured as follows: the next section provides a theoretical exposition of decentralization and regional development; following that is a brief overview of regional and woreda decentralization. The next two sections deal with trends in resource availability at local and regional levels, and the situation in human capacity and local planning. The policy implications and conclusions of the chapter are discussed in the last two sections.
Decentralization and regional development: theoretical exposition In general decentralization and regional development have evolved independently. Decentralization is demanded in order to protect regional and local identities, history, culture and traditions especially in multinational and big countries (Horowitz 1985; de Winter and Tursan 1998). On the other hand, regional development is seen as a state prerogative to be delivered by national and local government. The new regionalist framework, however, sees decentralization not only for preserving identity but more prominently to foster economic development in every territory (Rodriguez-Pose, 2008; Rodriguez-Pose and Ezcurra, 2010). The theoretical literature on the relation between decentralization and regional development, however, advances both positive and negative perspectives.
The positive influences of decentralization on local and regional development are assumed to be realized via the principles of fiscal and political decentralization. Fiscal decentralization deals with the vertical structure of the public sector by addressing the assignment of functions and instruments and the way the different levels of government relate to each other through instruments such as inter-government fiscal transfer (Gunatilaka 2001). Fiscal decentralization brings allocative and producer efficiency, sub national competition and policy innovation (Martinez Vazquez and McNab 2001). These efficiencies and innovations are assumed to positively influence economic growth and regional and local development. Political decentralization, on the other hand, in addition to ensuring citizenship and social inclusion positively influences economic development by enhancing firm competitiveness. This is because the latter depends on not only on firms themselves, macro economic conditions and active national policies but also on the capacity of each locality to tackle its own development through processes of concerted public-social-private decisions (Finot 2005). In order for this to happen, it is essential that local areas have greater autonomy (Finot 2005).
135
Decentralization and Regional and Local Development: Trends and Policy Implications
137
The negative perspective advances that decentralized governance or local and regional governments have lesser comparative advantage than national governments in satisfying the basic needs of the population. In this regard Prud’homme (1995) suggests that the matching of policy and needs which is one of the positive attributes of decentralization may not be realized because basic needs such as access to food, education, and health are universal showing little difference among jurisdictions. Second, even if there are differences among jurisdictions, there is less evidence that local and regional governments have clear comparative advantage over the national governments in uncovering those differences. National governments benefit from greater economies of scale and resources that may allow them to better satisfy the basic needs of the population (Prud’homme 1995). Furthermore, poor localities and regions are disadvantaged in delivering efficient policies and strategies due to lack of human and technical capacities while national governments with better and efficient administration and better salary can offer better services (Rodriguez-Pose 2008).
Notwithstanding the forgoing theoretical perspectives, the empirical literature is not also conclusive, hinting at the difficulty of empirically determining the impact of decentralization on local and regional development due to the varying nature of countries’ context, the difficulty of measuring decentralization and the absence of counterfactual arguments that provides the trajectory of regional and local development without decentralization (Rodriguez-Pose 2008).
While the theoretical and empirical inconclusiveness hints at the need for further study and research on the subject, the popular perception is that decentralization can stimulate local and regional development (Rodriguez-Pose 2008). This happens through the opportunity decentralization creates for more resource availability, improved capacity and improved planning practices at local and regional levels.
Regional and woreda decentralization under the EPRDF regime: A brief overview Decentralization as practiced today in Ethiopia began with the establishment of an ethno-federal state first created in the early 1990s and codified in the Constitution of 1995 (Dickovick and Tegegne 2009). This decentralization underlies the premise that the country has a multi-ethnic structure. The outcome was a federal structure that created nine regional self governments and two city administrations1. While all the regional self governments and the Addis Ababa
1 The nine regional self governments are the Amhara National Regional State, the Tigray National Regional State, the Oromiya National Regional State, the SNNP National Regional State, the Gambella National Regional State, the Afar National Regional State, the Somali National Regional

136
Tegegne Gebre-Egziabher
138
city administrations are established by the Federal Constitution, the Dire Dawa Administration is an exception in that it is not recognized in the Federal Constitution. The Dire Dawa Administration Charter (Article 51(1)), however, indicates that the City Administration shall be part of the Federal Government and it shall be accountable to the Federal Government. In addition, article 51 (2) of the Charter specifies that the Ministry of Federal Affairs shall, as an agent of the Federal Government, follow up the performance of the City Administration and shall support the capacity-building undertakings of the City.
The motive for regional decentralization was political in that it was designed to ease the tension between the country’s nationalities (Dickovick and Tegegne 2010, Asmelash 2000) and to counter the age old concentration of power at the center (Assefa 2007). These necessitated the establishment of the three branches of government at regional level: legislative, judicial and executive. Regions have robust political authorities that emanate from the Federal Constitution. These include the power to establish a State administration, to enact and execute the State constitution and other laws, to formulate and execute economic, social and development policies, to administer land and other natural resources, to levy and collect taxes and duties on revenue sources reserved to the States, to enact and enforce laws on the State civil service and to establish and administer a State police force and to maintain public order (FDRE 1995). In addition to the political and administrative power, regions enjoy fiscal powers in the forms of revenue raising authority and expenditure responsibilities.
Notwithstanding the country’s experience of decentralization that devolved power and authority to regional governments, in the early to late 1990’s, the Government embarked on the second wave of decentralization namely woreda (district) decentralization. Woredas are established by the Regional Constitutions. Woreda decentralization was less motivated by questions of ethnic identity, and more by the motivation to extend governing authority down to local levels (Dickovick and Tegegne 2010). As a consequence, the stated aims of woreda decentralization included improved service delivery, deeper and more participatory governance, and promotion of economic development (Dickovick and Tegegne 2010). The consequences of woreda decentralization, however, have political implications as the increasingly centralized partisan structure of the EPRDF has penetrated to the local level as a result of the decentralization process (Dickovick and Tegegne 2010). Similar to the regional governments, woreda administrations have woreda councils, woreda courts and woreda executives. The woreda council is the highest authority and has the power of approving woreda budgets and overseeing the State, the Benishangul Gumuz National Regional State, the Harari National Regional State. The two City Administrations are the Addis Ababa City Administration and the Diredwaa City Administration

137
Decentralization and Regional and Local Development: Trends and Policy Implications
139
executive. The fiscal authority of woredas is mainly limited to expenditure responsibility as they have no revenue raising power. Instead they are delegated to collect revenues on behalf of the regional government, but not allowed to spend it before regional allocation.
Resource availability Trends in regional revenue Resource availability is critical for local and regional development. In Ethiopia, regional governments derive resources from different sources: taxation, federal subsidy and foreign assistance. The latter, however, is netted out of the federal subsidies regions receive. Netting out is done from multilateral and bilateral assistance though it does not include technical assistance, rehabilitation projects and assistance in kind regions may receive. The taxation powers of regional governments derive from Articles 97 and 98 of the Federal Constitution. Historical data show that tax revenues account for 79.8 percent of the total regional revenue and non-tax revenue account for 21.8 percent of the total regional revenue. Regional revenues, however, are concentrated on a few items. Figure 1 shows that nine tax and non-tax items account for 83 percent of the regional revenues. It can easily be understood that payroll tax, accounting for about 41 percent of the total revenue, is the main source of income for regions. Payroll tax by nature, however, is not very yielding and fast growing and it depends on public sector employment. Trends in regional revenue performance shows regional revenue has increased from 1.5 billion birr to 20 billion birr over 15 years (1997/98-2011/12) (Table 1). At the same time, the Federal Government revenue has increased from 6.7 billion birr to 83 billion birr. In general, the Federal government collects the bulk of the revenue. The Federal Government revenue as a share of general government2 revenue over the 15 year period is 81.1 per cent and regions were able to collect only 18.9 per cent. This trend has remained constant as depicted in Figure 2.
2 General Government refers to both the Federal Government and the Regional Governments
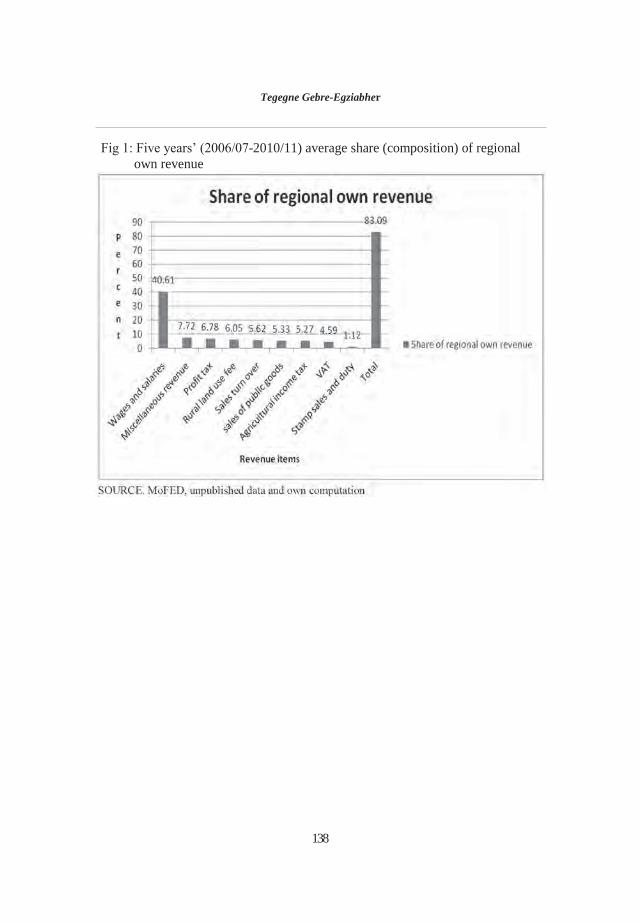
138
Tegegne Gebre-Egziabher
140
Fig 1: Five years’ (2006/07-2010/11) average share (composition) of regional own revenue
SOURCE. MoFED, unpublished data and own computation

139
141
Tab
le 1
. Tr
ends
in re
venu
e pe
rfor
man
ce: R
egio
nal,
Fede
ral a
nd g
ener
al g
over
nmen
t (m
illio
n bi
rr)
R
egio
nal
Fede
ral
Gen
eral
Gov
ernm
ent
Ta
x re
venu
e N
on ta
x re
venu
e To
tal
reve
nue
Tax
reve
nue
Non
tax
reve
nue
Tota
l re
venu
e Ta
x re
venu
e N
on ta
x re
venu
e To
tal r
even
ue
1997
/98
1087
.8
505.
6 15
93.4
42
04.4
25
83.5
67
87.9
52
92.2
30
89.1
83
81.3
1998
/99
1079
.5
460.
17
1539
.7
4456
.4
3561
.4
8017
.8
5535
.9
4021
.6
9557
.5
1999
/00
1248
.9
520.
0 17
68.9
50
95.3
31
19.1
82
14.4
63
44.2
36
39.1
99
83.3
2000
/01
1364
.2
510.
5 18
74.7
60
28.0
27
33.8
87
61.7
73
92.2
32
44.2
10
636.
4
2001
/02
1346
.1
530.
1 18
76.2
65
12.1
20
42.3
85
54.4
78
58.2
25
72.4
10
430.
6
2002
/03
1448
.2
584.
2 20
32.4
67
46.1
29
20.9
96
67.0
81
94.3
35
05.0
11
699.
3
2003
/04
1947
.3
999.
9 29
47.2
84
54.0
19
41.2
10
395.
2 10
401.
0 29
41.1
13
342.
1
2004
/05
2686
.0
883.
6 35
69.6
93
50.4
23
73.4
11
733.
7 12
046.
3 32
57.0
15
303.
3
2005
/06
2635
.9
585.
0 32
20.9
11
303.
8 38
29.2
15
132.
9 13
939.
6 44
14.2
18
353.
8
2006
/07
3234
.1
1150
.6
4384
.7
1411
9.5
3293
.2
1741
2.7
1735
4 44
44
2179
7
2007
/08
4091
.7
1395
.6
5487
.3
1970
9 45
97.7
24
306.
7 23
801
5993
29
794
2008
/09
5792
.5
2468
.3
8260
.8
2321
5 87
07.8
31
922.
8 29
007
1117
6 40
184
2009
/10
8007
.9
1827
.3
9835
.1
3531
0.2
8718
.7
4402
8.9
4331
8 10
546
5386
4
2010
/11
1024
9.8
2501
.4
1275
1.2
4873
6.6
7637
.6
5637
4.2
5898
1 10
139
6912
0
2011
/12
1565
9.3
4472
.7
2013
2 70
081.
2 12
651.
1 82
732.
3 85
740
1712
4 10
2864
SOU
RC
E. M
oFED
, unp
ublis
hed
data
Dec
entr
aliz
atio
n an
d R
egio
nal a
nd L
ocal
Dev
elop
men
t: Tr
ends
and
Pol
icy
Impl
icat
ions
149
Tigr
ay a
nd D
ire D
awa
wer
e on
ave
rage
abl
e to
cov
er 3
6 pe
rcen
t of
the
ir ex
pend
iture
. Th
ose
regi
ons
whi
ch c
over
ed b
etw
een
19 –
23
perc
ent
incl
uded
A
mha
ra,
Oro
miy
a, S
NN
P, H
arar
. T
he f
our
emer
ging
reg
ions
, ho
wev
er,
can
cont
ribut
e a
very
sm
all
shar
e of
the
ir ex
pend
iture
; th
eir
perc
enta
ge s
hare
is
belo
w 1
6 pe
rcen
t with
Ben
ishan
gul c
ontri
butin
g 15
.7 p
erce
nt, A
far 1
1.4,
Som
ale
10.5
, and
Gam
bella
con
tribu
ting
12.7
per
cent
. The
hea
vy d
epen
denc
e of
thes
e re
gion
s on
inte
rgov
ernm
enta
l fis
cal t
rans
fer i
s the
refo
re c
lear
. Th
e co
effic
ient
of
varia
tion
has
mor
e or
less
rem
aine
d co
nsta
nt o
ver
the
perio
d 20
06/0
7-20
11/1
2 ex
cept
for
200
9/10
whe
n th
e co
effic
ient
of
varia
tion
show
ed a
n in
crea
se. T
he
cons
tant
coe
ffici
ent o
f var
iatio
n is
an in
dica
tion
that
ther
e is
littl
e ch
ange
in th
e va
riatio
n am
ong
regi
ons r
egar
ding
the
cont
ribut
ion
of o
wn
reve
nue.
Tabl
e 7.
Tre
nds i
n re
gion
s’ o
wn
reve
nue
as a
shar
e of
tota
l exp
endi
ture
20
06/0
7 20
07/0
8 20
08/0
9 20
09/1
0 20
10/1
1 20
11/1
2 A
vera
ge
Tigr
ay
29.2
5 26
.65
38.3
5 41
.41
39.7
8 41
.12
36.1
Afa
r 15
.39
8.49
7 12
.20
9.40
9.
07
13.7
2 11
.38
Am
hara
18
.92
14.1
9 20
.58
18.6
1 23
.36
23.3
7 19
.84
Oro
miy
a 21
.20
15.8
2 19
.76
22.3
6 26
.45
22.6
4 21
.37
Som
ale
9.21
8.
08
9.62
1 13
.14
12.0
6 10
.74
10.4
8
BSG
9.
53
15.4
3 15
.12
17.3
9 19
.14
17.5
5 15
.7
SNN
P 16
.07
15.7
3 21
.13
20.6
1 23
.72
20.1
8 19
.57
Gam
bella
9.
42
11.6
9 13
.61
13.1
9 14
.91
13.4
9 12
.72
Har
ar
26.7
5 21
.15
24.0
3 20
.33
25.4
4 19
.08
22.8
AA
83
.89
46.2
2 68
.02
101.
5 10
2.7
124.
36
87.7
8
DD
33
.47
25.7
9 36
.04
47.7
9 41
.47
35.6
5 36
.7
Tota
l 32
.75
24.5
32
.52
34.7
8 34
.68
35.9
6 32
.53
CV o
f reg
ions
ex
clud
ing
AA
0.
46
0.40
0.
46
0.55
0.
45
0.45
SOU
RCE:
MoF
ED u
npub
lishe
d da
ta a
nd o
wn
com
puta
tion
Tren
ds in
inte
r-go
vern
men
tal f
iscal
tran
sfer
: Fe
dera
l –Re
gion
al f
iscal
tra
nsfe
r Th
e Fe
dera
l gr
ant
syst
em w
hich
tra
nsfe
rs r
esou
rces
to
regi
ons
invo
lves
blo
ck
and
spec
ific
purp
ose
gran
ts. T
he b
ulk
of th
e tra
nsfe
rs a
re m
ade
as b
lock
gra
nts.
Ther
e ar
e tw
o m
ajor
cha
nges
in th
e bl
ock
gran
t tra
nsfe
rs to
reg
ions
. Th
e fir
st
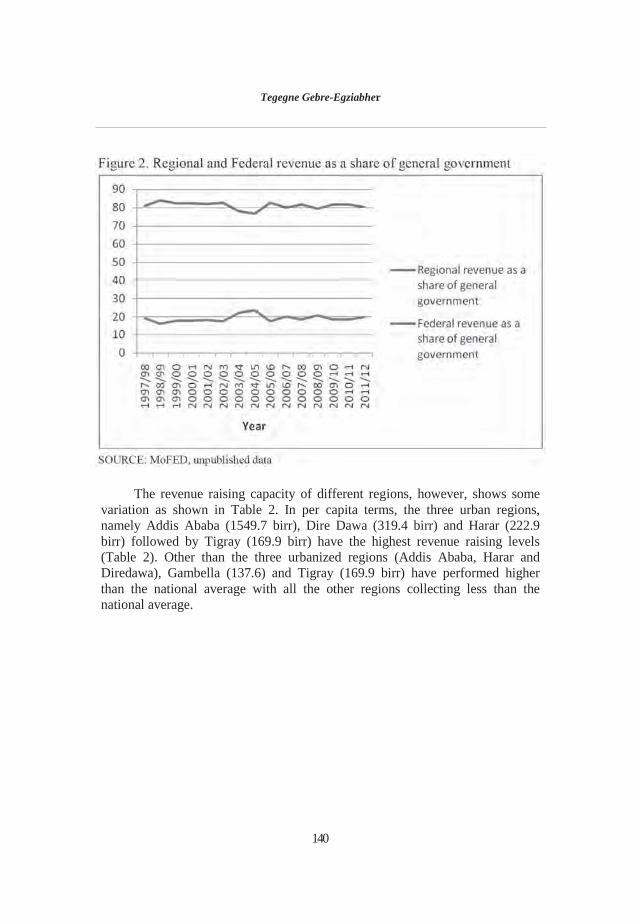
140142
Figure 2. Regional and Federal revenue as a share of general government
SOURCE: MoFED, unpublished data
The revenue raising capacity of different regions, however, shows some
variation as shown in Table 2. In per capita terms, the three urban regions, namely Addis Ababa (1549.7 birr), Dire Dawa (319.4 birr) and Harar (222.9 birr) followed by Tigray (169.9 birr) have the highest revenue raising levels (Table 2). Other than the three urbanized regions (Addis Ababa, Harar and Diredawa), Gambella (137.6) and Tigray (169.9 birr) have performed higher than the national average with all the other regions collecting less than the national average.
Tegegne Gebre-Egziabher
156
Management Institutes established for purposes of providing short term training have also played roles in this regard.
The Government launched a National Capacity Building Program (NCBP) in 2001 targeting 14 sectors with their own reform programs4. The programs were designed to address different stakeholders: public sector, private sectors and civil society. In the course of time, the Government introduced various governance and public sector reform projects. The list of these projects is indicated below (World Bank 2013):
The Public Sector Capacity Building Program (PSCAP, FY 2004-FY 2012). The PSCAP covers six large sub programs namely district level decentralization program (DLDP), Urban Management Program (UMP), Civil Service reform program (CSRP), Information and communication technology (ICT), Justice System Reform Program (JSRP), including court reform and parliamentary support; Tax System & Customs Reform Program (TSRP).
Protection of Basic Services (PBS, FY 2006-FY 2012), which focuses on protecting basic services, transparency, and accountability. It contains four sub programs: support to delivery of basic services, health MDG support facility, transparency and accountability, and monitoring and evaluation (M&E). It also includes Local Investment Grant (LIG), a specific purpose grant for capital investments in rural areas.
Capacity Building for Decentralized Service Delivery (CBDSD, 2002-2008) that deepened decentralization in urban local Governments.
Urban Local government Development program (ULGDP, starting FY 2009), which supports improved performance in the planning, delivery, and sustained provision of priority municipal services and infrastructure.
Democratic Institution Program (DIP) in five institutions namely Institute of Ombudsman, Ethiopian Human Rights Commission, Anti-corruption and Ethics Commission, House of Peoples Representatives, and House of Federation.
PSCAP is the largest public sector capacity building program. Within PSCAP, DLDP and UMP were specifically aimed at local governments. This is because of the assumption that democratically elected local governments, when they exist, often serve as the fulcrum for decentralized governance and therefore, top
4 The 14 targeted sectors and their reforms were civil service reform, tax reform, justice reform, district decentralization, information and communication technology, private sector, construction sector, urban management, cooperatives, textile and garments, agricultural training of vocational and technical levels, industrial training of vocational and technical levels, civil society, and higher education

141
Decentralization and Regional and Local Development: Trends and Policy Implications
143
Table 2. Trends in per capita revenue by regions (birr) 2007 2008 2009 2010 2011 2012 Average per capita
revenue
Tigray 57.49 76.18 129.7 169.15 216.3 370.81 169.938
Afar 26.86 29.45 45.98 47.826 95.4 119.8 60.886
Amhara 20.53 26.57 52.3 55.425 85.77 137.01 62.9342
Oromiya 29.59 30.69 47.77 58.399 88.88 102.34 59.6115
Somale 13.7 18.42 21.35 41.799 55.08 74.677 37.5043
BSG 42.64 66.48 68.91 77.133 117.2 187.56 93.3205
SNNP 22.2 29.78 41.91 56.083 82.42 115.25 57.9405
Gambella 70.51 103.8 94.14 123.88 185.9 247.26 137.582
Harari 127.2 156.2 193.1 212.78 288.7 359.95 222.988
AA 768 945.7 1441 1574.1 1649 2920.7 1549.75
DD 142.2 169.8 276.6 371.91 399.7 555.95 319.36
Total region 56.85 69.27 103.9 119.79 151.2 232.43 122.24
SOURCE: MoFED unpublished data and own computation
In a similar way, the growth rates of revenue raising capacity by regions
shows that Tigray has the highest average annual growth rates over the period 2006/07-2011/12 (22.33 percent) followed by Benishangul Gumuz, Somale and Amhara (Table 3). All the relatively less developed regions (Benishangul, Gambella, Somale and Afar) have shown higher than the total regional average growth rate which is an indication that the poor regions are increasing their own resource capacity in time.
Table 3. Annual growth rates of revenue collection
2006/07-2007/08
2007/08 2008/09
2008/09 2009/10
2009/10 2010/11
2010/11 2011/12
Average annual growth rate
Tigray 16.6 31.9 15.9 14.6 32.7 22.33
Afar 5.73 27 4.17 43.2 13.7 18.77
Amhara 15.2 33.3 3.97 25.5 27.5 21.11
Oromiya 3.25 28.4 11.8 25.2 8.88 15.5
Somale 17.5 9.47 43.9 16.6 18.3 21.16
BSG 26.4 7.8 19.5 44.1 13.3 22.21
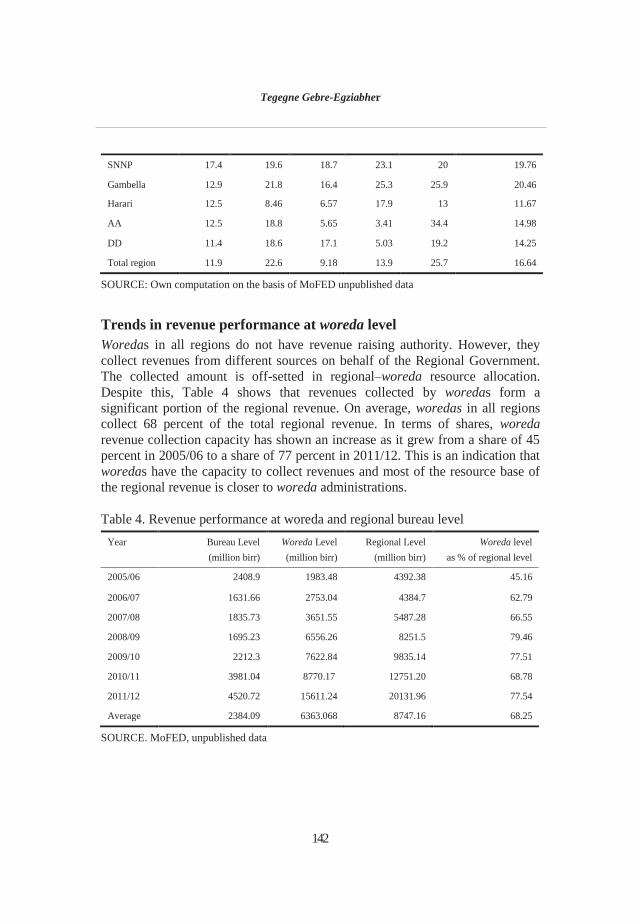
142
Tegegne Gebre-Egziabher
144
SNNP 17.4 19.6 18.7 23.1 20 19.76
Gambella 12.9 21.8 16.4 25.3 25.9 20.46
Harari 12.5 8.46 6.57 17.9 13 11.67
AA 12.5 18.8 5.65 3.41 34.4 14.98
DD 11.4 18.6 17.1 5.03 19.2 14.25
Total region 11.9 22.6 9.18 13.9 25.7 16.64
SOURCE: Own computation on the basis of MoFED unpublished data
Trends in revenue performance at woreda level Woredas in all regions do not have revenue raising authority. However, they collect revenues from different sources on behalf of the Regional Government. The collected amount is off-setted in regional–woreda resource allocation. Despite this, Table 4 shows that revenues collected by woredas form a significant portion of the regional revenue. On average, woredas in all regions collect 68 percent of the total regional revenue. In terms of shares, woreda revenue collection capacity has shown an increase as it grew from a share of 45 percent in 2005/06 to a share of 77 percent in 2011/12. This is an indication that woredas have the capacity to collect revenues and most of the resource base of the regional revenue is closer to woreda administrations.
Table 4. Revenue performance at woreda and regional bureau level Year Bureau Level
(million birr) Woreda Level (million birr)
Regional Level (million birr)
Woreda level as % of regional level
2005/06 2408.9 1983.48 4392.38 45.16
2006/07 1631.66 2753.04 4384.7 62.79
2007/08 1835.73 3651.55 5487.28 66.55
2008/09 1695.23 6556.26 8251.5 79.46
2009/10 2212.3 7622.84 9835.14 77.51
2010/11 3981.04 8770.17 12751.20 68.78
2011/12 4520.72 15611.24 20131.96 77.54
Average 2384.09 6363.068 8747.16 68.25
SOURCE. MoFED, unpublished data

143
Decentralization and Regional and Local Development: Trends and Policy Implications
145
Trends in expenditure Table 5 shows the trends for recurrent and capital expenditure performance. It reveals that the regional governments’ recurrent expenditure grew from 3 billion Birr in 1998/99 to 32 billion birr in 2011/12, a more than 10 fold increase. The capital expenditure also grew from 1.7 billion birr to 23.2 billion birr in 2010/11. The data for latter years shows expenditure only from domestic sources. There will thus be a slight increase if external loan and assistance are included. It is however interesting to note that regions are mainly responsible for recurrent expenditure while their role in capital expenditure is limited. The regional share in the recurrent expenditure of general government has grown from 21 percent in 1999/00 to 64 percent in 2011/12. Figure 3 shows the recurrent expenditure has shown a steep increase while the increase in capital expenditure is relatively small. The share of regional capital expenditure grew to 40 percent in 2011/12. This shows that regions are also showing more and more involvement in capital projects.

144
146
Tabl
e 5.
Tre
nds i
n re
curr
ent a
nd c
apita
l exp
endi
ture
per
form
ance
of F
eder
al a
nd R
egio
nal G
over
nmen
ts
R
ecur
rent
exp
endi
ture
C
apita
l exp
endi
ture
G
ener
al
Gov
ernm
ent
(mill
ion
birr
Fede
ral
Gov
ernm
ent
(mill
ion
birr
)
Reg
iona
l G
over
nmen
t (m
illio
n bi
rr)
Reg
iona
l exp
endi
ture
as
a sh
are
of G
ener
al
gove
rnm
ent e
xpen
ditu
re
Gen
eral
G
over
nmen
t Fe
dera
l G
over
nmen
t R
egio
nal
Gov
ernm
ent
Reg
iona
l exp
endi
ture
as
a s
hare
of G
ener
al
gove
rnm
ent
expe
nditu
re
1998
/99
1109
9.49
80
84.8
6 30
14.6
4 27
.16
4144
.16
2394
.87
1749
.29
42.2
1
1999
/00
1436
9.36
11
351.
38
3017
.98
21
4038
.56
2541
.9
1496
.66
37.0
6
2000
/01
1241
1.88
87
87.3
5 36
24.5
4 29
.2
6082
.01
4196
.01
1886
31
.01
2001
/02
1190
2.63
77
21.5
5 41
81.0
8 35
.13
6134
.12
4517
17
60.5
2 28
.70
2002
/03
1203
2.05
69
09.7
3 51
22.3
2 42
.57
6392
.59
4582
.32
1810
.28
28.3
2
2003
/04
1399
9.1
8463
.29
5535
.81
39.5
4 85
29.7
5 62
49.4
6 22
80.2
9 26
.73
2004
/05
1495
7.14
86
19.1
1 63
38.0
3 42
.37
7695
.6
5194
.72
2500
.88
32.5
0*
2005
/06
1596
7.32
76
71.1
83
99.5
5 52
.6
1178
5.31
87
88.3
3 29
96.9
8 25
.43*
2006
/07
1797
6.95
82
59.3
4 97
17.6
1 54
.06
1827
6.9
1242
3.8
5853
.1
32.0
2*
2007
/08
2279
4 87
61.2
14
032.
8 61
.56
2271
2.6
1419
2.1
8520
.5
37.5
1*
2008
/09
2717
6 10
306.
9 16
868.
7 62
.07
3068
5 20
992.
2 96
92.8
31
.59*
2009
/10
3253
7 12
515.
8 20
021.
4 61
.53
3832
6.1
2725
3.9
1107
2.2
28.8
9*
2010
/11
4066
0 14
959.
9 25
700.
5 63
.21
5743
9.1
3421
4.4
2322
4.7
40.4
3*
2011
/12
5144
5 18
679.
5 32
766
63.6
9
Ave
rage
46.8
3
32.4
9
SOU
RC
E. M
oFED
, unp
ublis
hed
data
N
OTE
*re
fers
to o
nly
dom
estic
reso
urce
and
exp
endi
ture
is p
re a
ctua
l
Tege
gne
Geb
re-E
gzia
bher
156
Man
agem
ent I
nstit
utes
esta
blish
ed fo
r pur
pose
s of
pro
vidi
ng s
hort
term
trai
ning
ha
ve a
lso
play
ed ro
les i
n th
is re
gard
. Th
e G
over
nmen
t lau
nche
d a
Nat
iona
l Cap
acity
Bui
ldin
g Pr
ogra
m (N
CBP)
in
200
1 ta
rget
ing
14 s
ecto
rs w
ith t
heir
own
refo
rm p
rogr
ams4 .
The
prog
ram
s w
ere
desi
gned
to
addr
ess
diffe
rent
sta
keho
lder
s: pu
blic
sec
tor,
priv
ate
sect
ors
and
civi
l so
ciet
y. I
n th
e co
urse
of
time,
the
Gov
ernm
ent
intro
duce
d va
rious
go
vern
ance
and
pub
lic s
ecto
r re
form
pro
ject
s. Th
e lis
t of
the
se p
roje
cts
is in
dica
ted
belo
w (W
orld
Ban
k 20
13):
Th
e Pu
blic
Sec
tor
Capa
city
Bui
ldin
g Pr
ogra
m (
PSCA
P, F
Y 2
004-
FY
2012
). Th
e PS
CAP
cove
rs s
ix la
rge
sub
prog
ram
s na
mel
y di
stric
t lev
el
dece
ntra
lizat
ion
prog
ram
(DLD
P), U
rban
Man
agem
ent P
rogr
am (U
MP)
, Ci
vil S
ervi
ce re
form
pro
gram
(CS
RP),
Info
rmat
ion
and
com
mun
icat
ion
tech
nolo
gy (
ICT)
, Ju
stice
Sys
tem
Ref
orm
Pro
gram
(JS
RP),
incl
udin
g co
urt r
efor
m a
nd p
arlia
men
tary
supp
ort;
Tax
Syst
em &
Cus
tom
s Ref
orm
Pr
ogra
m (T
SRP)
.
Prot
ectio
n of
Bas
ic S
ervi
ces
(PBS
, FY
200
6-FY
201
2), w
hich
foc
uses
on
pro
tect
ing
basic
serv
ices
, tra
nspa
renc
y, a
nd a
ccou
ntab
ility
. It c
onta
ins
four
sub
pro
gram
s: s
uppo
rt to
del
iver
y of
bas
ic s
ervi
ces,
heal
th M
DG
su
ppor
t fa
cilit
y, t
rans
pare
ncy
and
acco
unta
bilit
y, a
nd m
onito
ring
and
eval
uatio
n (M
&E)
. It
also
inc
lude
s Lo
cal
Inve
stm
ent
Gra
nt (
LIG
), a
spec
ific
purp
ose
gran
t for
cap
ital i
nves
tmen
ts in
rura
l are
as.
Ca
paci
ty B
uild
ing
for
Dec
entra
lized
Ser
vice
Del
iver
y (C
BDSD
, 200
2-20
08) t
hat d
eepe
ned
dece
ntra
lizat
ion
in u
rban
loca
l Gov
ernm
ents
.
Urb
an L
ocal
gov
ernm
ent
Dev
elop
men
t pr
ogra
m (
ULG
DP,
sta
rting
FY
20
09),
whi
ch s
uppo
rts im
prov
ed p
erfo
rman
ce in
the
plan
ning
, del
iver
y,
and
sust
aine
d pr
ovisi
on o
f prio
rity
mun
icip
al se
rvic
es a
nd in
frastr
uctu
re.
D
emoc
ratic
In
stitu
tion
Prog
ram
(D
IP)
in
five
inst
itutio
ns
nam
ely
Inst
itute
of
Om
buds
man
, Et
hiop
ian
Hum
an R
ight
s Co
mm
issi
on, A
nti-
corru
ptio
n an
d Et
hics
Com
mis
sion
, Hou
se o
f Pe
ople
s Re
pres
enta
tives
, an
d H
ouse
of F
eder
atio
n.
PSCA
P is
the
larg
est p
ublic
sec
tor
capa
city
bui
ldin
g pr
ogra
m. W
ithin
PSC
AP,
D
LDP
and
UM
P w
ere
spec
ifica
lly a
imed
at l
ocal
gov
ernm
ents
. Thi
s is
bec
ause
of
the
ass
umpt
ion
that
dem
ocra
tical
ly e
lect
ed l
ocal
gov
ernm
ents
, w
hen
they
ex
ist, o
ften
serv
e as
the
fulc
rum
for d
ecen
traliz
ed g
over
nanc
e an
d th
eref
ore,
top
4 The
14
targ
eted
sec
tors
and
thei
r re
form
s w
ere
civi
l ser
vice
ref
orm
, tax
ref
orm
, jus
tice
refo
rm,
distr
ict d
ecen
traliz
atio
n, in
form
atio
n an
d co
mm
unic
atio
n te
chno
logy
, priv
ate
sect
or, c
onstr
uctio
n se
ctor
, urb
an m
anag
emen
t, co
oper
ativ
es, t
extil
e an
d ga
rmen
ts, a
gric
ultu
ral t
rain
ing
of v
ocat
iona
l an
d te
chni
cal l
evel
s, in
dustr
ial t
rain
ing
of v
ocat
iona
l and
tech
nica
l lev
els,
civi
l soc
iety
, and
hig
her
educ
atio
n

145147
Figure 3. Trends in regional recurrent and capital expenditure as a share of general government
SOURCE: MoFED unpublished data and own computation
The average regional per capita expenditure grew from 174 birr (2007) to
646 birr (2012) with an average growth rate of 14 percent (table 6). This is way above the regional per capita revenue which has grown only from 57 birr (2007) to 122 birr (2012) (see Figure 4). Regions with higher than the national average per capita expenditure include Addis Ababa (1764.11 birr), Gambella (1057.7 birr), Dire Dawa (858.7 birr), Harar (1014.1 birr), Afar (555.2 birr), Benishangul (576.3 birr), and Tigray (445.7 birr). It can be seen that expenditure is highest in the urban regions and in the emerging regions, the latter due to the need to catch up. The relatively big regions (Oromiya, Amhara and SNNP) have lower per capita expenditure.
Table 6. Trends in regional per capita expenditure Regions 2007 2008 2009 2010 2011 2012 Average per
capita revenue Aver
age GR
Tigray 196.5161 285.8795 338.229 408.397 543.6743 901.778 445.7457 16.6
Afar 174.4781 346.5422 376.8572 508.2874 1052.024 873.0772 555.211 19.3
Amhara 108.4988 187.3222 254.0233 297.7273 367.126 586.2018 300.1499 18.7
Oromiya 139.5806 193.9947 241.732 261.1611 336.1062 451.9938 270.7614 12.5
Decentralization and Regional and Local Development: Trends and Policy Implications
149
Tigray and Dire Dawa were on average able to cover 36 percent of their expenditure. Those regions which covered between 19 – 23 percent included Amhara, Oromiya, SNNP, Harar. The four emerging regions, however, can contribute a very small share of their expenditure; their percentage share is below 16 percent with Benishangul contributing 15.7 percent, Afar 11.4, Somale 10.5, and Gambella contributing 12.7 percent. The heavy dependence of these regions on intergovernmental fiscal transfer is therefore clear. The coefficient of variation has more or less remained constant over the period 2006/07-2011/12 except for 2009/10 when the coefficient of variation showed an increase. The constant coefficient of variation is an indication that there is little change in the variation among regions regarding the contribution of own revenue.
Table 7. Trends in regions’ own revenue as a share of total expenditure
2006/07 2007/08 2008/09 2009/10 2010/11 2011/12 Average
Tigray 29.25 26.65 38.35 41.41 39.78 41.12 36.1
Afar 15.39 8.497 12.20 9.40 9.07 13.72 11.38
Amhara 18.92 14.19 20.58 18.61 23.36 23.37 19.84
Oromiya 21.20 15.82 19.76 22.36 26.45 22.64 21.37
Somale 9.21 8.08 9.621 13.14 12.06 10.74 10.48
BSG 9.53 15.43 15.12 17.39 19.14 17.55 15.7
SNNP 16.07 15.73 21.13 20.61 23.72 20.18 19.57
Gambella 9.42 11.69 13.61 13.19 14.91 13.49 12.72
Harar 26.75 21.15 24.03 20.33 25.44 19.08 22.8
AA 83.89 46.22 68.02 101.5 102.7 124.36 87.78
DD 33.47 25.79 36.04 47.79 41.47 35.65 36.7
Total 32.75 24.5 32.52 34.78 34.68 35.96 32.53
CV of regions excluding AA
0.46 0.40 0.46 0.55 0.45 0.45
SOURCE: MoFED unpublished data and own computation
Trends in inter-governmental fiscal transfer: Federal –Regional fiscal transfer The Federal grant system which transfers resources to regions involves block and specific purpose grants. The bulk of the transfers are made as block grants. There are two major changes in the block grant transfers to regions. The first

146
Tegegne Gebre-Egziabher
148
Somale 148.6949 227.932 221.9089 317.8841 456.5461 694.7913 344.6262 17.1
BSG 447.5625 430.8232 455.7112 443.4764 612.2403 1068.333 576.3578 9.8
SNNP 138.102 189.3064 198.3555 272.1142 347.5045 570.975 286.0596 15.5
Gambella
748.2213 888.4018 691.6225 939.1434 1246.67 1832.37 1057.738 10
Harar 475.3202 738.5167 803.4188 1046.488 1134.762 1885.907 1014.069 15.2
AA 915.443 2045.872 2117.574 1550.842 1606.37 2348.581 1764.114 11.9
DD 424.9757 658.3879 767.4513 778.1963 963.6951 1559.443 858.6916 14.3
Total 173.5623 282.6855 319.2655 344.3404 436.1056 646.4416 367.0668 14.4
SOURRCE: MoFED unpublished data and own computation
Figure 4. Trends in per capita revenue and per capita expenditure (all regions)
SOURCE: MoFED unpublished data and own computation
Regions’ own revenue versus expenditure One measure of fiscal decentralization is the ability of regions to finance their expenditure from own sources. Table 7 shows that on average, regions are able to cover about 33 percent of their expenditure from own sources. There is a slight increase in the trend as it has increased from 33 percent in 2007 to 36 percent in 2011/12. Regions in general therefore have to rely on external sources to finance their expenditure. The contribution of own revenue for total expenditure varies between regions. For instance, for the years 2006/07-2011/12,

147
Decentralization and Regional and Local Development: Trends and Policy Implications
149
Tigray and Dire Dawa were on average able to cover 36 percent of their expenditure. Those regions which covered between 19 – 23 percent included Amhara, Oromiya, SNNP, Harar. The four emerging regions, however, can contribute a very small share of their expenditure; their percentage share is below 16 percent with Benishangul contributing 15.7 percent, Afar 11.4, Somale 10.5, and Gambella contributing 12.7 percent. The heavy dependence of these regions on intergovernmental fiscal transfer is therefore clear. The coefficient of variation has more or less remained constant over the period 2006/07-2011/12 except for 2009/10 when the coefficient of variation showed an increase. The constant coefficient of variation is an indication that there is little change in the variation among regions regarding the contribution of own revenue.
Table 7. Trends in regions’ own revenue as a share of total expenditure
2006/07 2007/08 2008/09 2009/10 2010/11 2011/12 Average
Tigray 29.25 26.65 38.35 41.41 39.78 41.12 36.1
Afar 15.39 8.497 12.20 9.40 9.07 13.72 11.38
Amhara 18.92 14.19 20.58 18.61 23.36 23.37 19.84
Oromiya 21.20 15.82 19.76 22.36 26.45 22.64 21.37
Somale 9.21 8.08 9.621 13.14 12.06 10.74 10.48
BSG 9.53 15.43 15.12 17.39 19.14 17.55 15.7
SNNP 16.07 15.73 21.13 20.61 23.72 20.18 19.57
Gambella 9.42 11.69 13.61 13.19 14.91 13.49 12.72
Harar 26.75 21.15 24.03 20.33 25.44 19.08 22.8
AA 83.89 46.22 68.02 101.5 102.7 124.36 87.78
DD 33.47 25.79 36.04 47.79 41.47 35.65 36.7
Total 32.75 24.5 32.52 34.78 34.68 35.96 32.53
CV of regions excluding AA
0.46 0.40 0.46 0.55 0.45 0.45
SOURCE: MoFED unpublished data and own computation
Trends in inter-governmental fiscal transfer: Federal –Regional fiscal transfer The Federal grant system which transfers resources to regions involves block and specific purpose grants. The bulk of the transfers are made as block grants. There are two major changes in the block grant transfers to regions. The first

148
Tegegne Gebre-Egziabher
150
relates to the formula used to transfer resources and the second is in the amount of resources transferred.
Formulas used in the transfer In the years 2003/04-2007/08, a two stage allocation was made to transfer resources to regional governments. The first is that each region will receive a minimum amount of recurrent allocation as in 2002/03; second, a formula will be used to distribute additional resources across regions (Garcia and Rajkumar 2008). The latter is what used to be known as the ‘three-parameter’ grant allocation formula. The variables considered in the formula were, population size with a weight of 65 percent, poverty and development level with a weight of 25 percent, an index of revenue effort and sectoral performance with a weight of 10 percent.
The three parameter formula is found wanting in several respects. First, it does not address the service delivery needs of different localities with a consequence of creating disincentive to expanding service delivery. Second, it makes small localities benefit more in per capita terms, in a manner that may not be equitable. With regard to the latter, small and large localities will receive similar per capita on the basis of their population and similar gross amount on the basis of development level if they are at the same level of development (Garcia and Rajkumar 2008). The consequence of this is that it results in the allocation of higher per capita for the small region (Garcia and Rajkumar 2008). In addition to this, the formula does not consider the capacity of regions to raise revenue in the allocation of resources.
Owing to the above deficiency of the three parameter approach, the Federal government resorted to a fiscal equalization approach in 2006/07 addressing the expenditure need and revenue capacity of each region. The formula used actual revenue in computing fiscal equalization. The formula served up to 2009 and some criticisms were levelled at it. The following were some of the deficiencies noted (Tegegne, Tassew and Meheret 2009):
1. The use of actual revenue to assess revenue penalizes well performing regions;
2. The revenue assessment has identified six income sources, all of which except land use fee are taxable income and hence do not assess non-tax income properly and show deficiency in estimating revenue raising capacity;
3. Unit cost differentials and disabilities were not adequately considered in the expenditure need assessment.

149
Decentralization and Regional and Local Development: Trends and Policy Implications
151
4. In 2009, the Federal government came up with a new formula that uses the potential revenue raising capacity and expenditure need assessment. The representative revenue raising capacity and representative expenditure need were used as the best way to approximate potential revenue and expenditure needs. The fiscal gap of each region is determined on the basis of the difference between the expenditure need and the potential revenue raising capacity. The equalization transfer is then determined by computing the regional fiscal gap as a share of the total gap among all regions. The representative system worked up to 2012 and a new formula which relied on the same principles was designed to serve 2013-2017.
The usual practice in the allocation of resources from federal to regional government is that there is a 100 percent offsetting of expected donor funding from grant allocation but there is no offsetting of each region’s own revenue collection from the region’s block grant allocation. The regional budget is then composed of own revenue and block grant transfers.
Trends in the amount of Federal-Region transfers The Federal government has been giving subsidy to regions since 1993. The Federal government first determines the envelope for regional subsidy which is set annually by proclamation. The envelope grew from 2.9 billion Birr in 1996/97 to 35.5 billion in 2012 showing a 12 fold increase (MoFED, undated and unpublished data). Such an increase is an indication that regions are receiving more and more finance to support their expenditure requirements.
Once the envelope is determined the formula described above is used to determine the shares of each region. Table 8 shows the regional shares of the transfer for 1997/98, 2006/07, 2008/09 and 2012/13 together with the regional population share. The 1997/98 is a period when the three parameter formula was used. The 2006/07 is a period when the fiscal equalization formula was applied and the 2008/09 marks a period when the principle of fiscal gap was applied. During 2008/09, the emerging regions received some additional resource in order to compensate their historical marginalization and their lack of implementation capacity. This was achieved through political negotiation in which a decision to deduct one percent of the envelope was made in order to distribute it among the emerging regions. Such practice is not seen in the 2012/13 allocation. The correlation coefficient between the transfer shares in 2012/13 and the population share is 0.99. This indicates that population share could be a significant predictor of the regional shares of the transfers. The reason for such a very high correlation between the two is because on the expenditure side, the number of service users are mostly used as a base to estimate the

150
Tegegne Gebre-Egziabher
152
expenditure needs and on the revenue side, the number of farmers is used to estimate the revenue potential for agricultural and land use fees.
The trends in the shares indicate that the shares of the emerging regions were high in the three parameter approach period and declined thereafter. The reason is that the emerging regions used to benefit from the level of development indicator that had higher values for them. The shares of Oromiya, Amhara and SNNP show an increasing trend while the share for Tigray has shown a slight decrease. Dire Dawa and Harari on the other hand have maintained a constant share.
Table 8. Regional shares of the transfer for selected years
1997/98* 2006/07* 2008/09** 2012/13*** Population share(2012/13)***
Tigray 7.8 7.16 7.04 7.18 6.07
Afar 6.9 3.81 3.34 3.15 1.97
Amhara 22.20 23.17 23.33 23.17 23.63
Oromia 25.30 32.27 32.53 32.5 38.51
Somali 8.60 6.73 8.43 8.14 6.24
B.G 4.90 2.62 1.96 2.10 0.96
SNNP 17.00 19.51 19.90 20.10 21.43
Gambela 3.90 1.92 1.57 1.5 0.46
Harari 2.40 1.24 0.89 1.00 0.26
Dire Dawa 1.00 1.56 1.01 1.16 0.48
Total 100 100 100 100 100
SOURCE. :*Dom, Lister and Antoninis, (2010),p.79; ** FDRE, House of Federation (2010), p.55 ***FDRE, House of Federation (2012), p.172
The actual allocation of the transfer to different regions for selected years
is shown in Table 9. The table shows a wide variation among regions on per capita basis. The highest recipients in 2012/13 are Harari, Dire Dawa, Gambella, Benishangul, Afar, and Somale. In terms of disparity, the variation is higher for absolute amount than for the per capita as indicated in the values of the coefficient of variation. The overall trend for the absolute value is an increase and then a decrease while on per capita basis, regional disparity has decreased and then increased.

151
153
Tabl
e 9.
Tre
nds i
n ab
solu
te a
nd p
er c
apita
tran
sfer
Regi
onal
St
ates
A
bsol
ute
amou
nt (m
illio
n bi
rr)
Per c
apita
(birr
)
2000
/01
2004
/05
2008
/09
2012
/13
2000
/01
2004
/05
2008
/09
2012
/13
Tigr
ay
297.
3 40
7.9
1109
.0
2474
.4
80.4
8 96
.59
237.
77
488.
83
Afa
r 20
5.5
204.
2 49
9.5
1131
.2
168.
99
150.
25
334.
29
685.
61
Am
hara
76
9.5
1224
.2
4138
.5
8212
.5
47.2
2 65
.72
227.
79
427.
46
Oro
miy
a 10
47.6
17
80.7
55
71.2
11
575.
4 46
.86
68.9
7 18
7.34
35
9.26
Som
ale
295.
1 35
1.2
1153
.0
2908
.6
79.7
9 83
.26
244.
61
546.
93
Beni
shan
gul
148.
0 15
2.8
268.
3 74
6.1
275.
60
250.
49
364.
83
725.
85
SNN
P 57
7.1
1102
.6
3301
.2
7187
.9
46.1
1 76
.09
206.
34
401.
85
Gam
bella
12
1.8
108.
5 17
7.0
541.
4 57
7.25
45
2.08
49
4.27
11
76.9
5
Har
ari
51.8
77
.2
135.
4 36
1.0
323.
75
406.
31
680.
74
1679
.07
Add
is A
baba
0.
0 0.
0 0.
0
0.0
0.0
0 0
0
Dire
Daw
a 33
.9
88.0
20
1.6
417.
2 10
6.60
22
39.1
6 54
5.45
10
56.2
0
Tota
l 35
47.7
54
97.3
16
554.
8 35
555.
8 55
.87
75.2
6 20
8.35
41
0.51
CV
0.95
1.
08
1.18
1.
12
1.07
0.
76
0.48
0.
56
MoF
ED, u
npub
lishe
d da
ta
Dec
entr
aliz
atio
n an
d R
egio
nal a
nd L
ocal
Dev
elop
men
t: Tr
ends
and
Pol
icy
Impl
icat
ions
149
Tigr
ay a
nd D
ire D
awa
wer
e on
ave
rage
abl
e to
cov
er 3
6 pe
rcen
t of
the
ir ex
pend
iture
. Th
ose
regi
ons
whi
ch c
over
ed b
etw
een
19 –
23
perc
ent
incl
uded
A
mha
ra,
Oro
miy
a, S
NN
P, H
arar
. T
he f
our
emer
ging
reg
ions
, ho
wev
er,
can
cont
ribut
e a
very
sm
all
shar
e of
the
ir ex
pend
iture
; th
eir
perc
enta
ge s
hare
is
belo
w 1
6 pe
rcen
t with
Ben
ishan
gul c
ontri
butin
g 15
.7 p
erce
nt, A
far 1
1.4,
Som
ale
10.5
, and
Gam
bella
con
tribu
ting
12.7
per
cent
. The
hea
vy d
epen
denc
e of
thes
e re
gion
s on
inte
rgov
ernm
enta
l fis
cal t
rans
fer i
s the
refo
re c
lear
. Th
e co
effic
ient
of
varia
tion
has
mor
e or
less
rem
aine
d co
nsta
nt o
ver
the
perio
d 20
06/0
7-20
11/1
2 ex
cept
for
200
9/10
whe
n th
e co
effic
ient
of
varia
tion
show
ed a
n in
crea
se. T
he
cons
tant
coe
ffici
ent o
f var
iatio
n is
an in
dica
tion
that
ther
e is
littl
e ch
ange
in th
e va
riatio
n am
ong
regi
ons r
egar
ding
the
cont
ribut
ion
of o
wn
reve
nue.
Tabl
e 7.
Tre
nds i
n re
gion
s’ o
wn
reve
nue
as a
shar
e of
tota
l exp
endi
ture
20
06/0
7 20
07/0
8 20
08/0
9 20
09/1
0 20
10/1
1 20
11/1
2 A
vera
ge
Tigr
ay
29.2
5 26
.65
38.3
5 41
.41
39.7
8 41
.12
36.1
Afa
r 15
.39
8.49
7 12
.20
9.40
9.
07
13.7
2 11
.38
Am
hara
18
.92
14.1
9 20
.58
18.6
1 23
.36
23.3
7 19
.84
Oro
miy
a 21
.20
15.8
2 19
.76
22.3
6 26
.45
22.6
4 21
.37
Som
ale
9.21
8.
08
9.62
1 13
.14
12.0
6 10
.74
10.4
8
BSG
9.
53
15.4
3 15
.12
17.3
9 19
.14
17.5
5 15
.7
SNN
P 16
.07
15.7
3 21
.13
20.6
1 23
.72
20.1
8 19
.57
Gam
bella
9.
42
11.6
9 13
.61
13.1
9 14
.91
13.4
9 12
.72
Har
ar
26.7
5 21
.15
24.0
3 20
.33
25.4
4 19
.08
22.8
AA
83
.89
46.2
2 68
.02
101.
5 10
2.7
124.
36
87.7
8
DD
33
.47
25.7
9 36
.04
47.7
9 41
.47
35.6
5 36
.7
Tota
l 32
.75
24.5
32
.52
34.7
8 34
.68
35.9
6 32
.53
CV o
f reg
ions
ex
clud
ing
AA
0.
46
0.40
0.
46
0.55
0.
45
0.45
SOU
RCE:
MoF
ED u
npub
lishe
d da
ta a
nd o
wn
com
puta
tion
Tren
ds in
inte
r-go
vern
men
tal f
iscal
tran
sfer
: Fe
dera
l –Re
gion
al f
iscal
tra
nsfe
r Th
e Fe
dera
l gr
ant
syst
em w
hich
tra
nsfe
rs r
esou
rces
to
regi
ons
invo
lves
blo
ck
and
spec
ific
purp
ose
gran
ts. T
he b
ulk
of th
e tra
nsfe
rs a
re m
ade
as b
lock
gra
nts.
Ther
e ar
e tw
o m
ajor
cha
nges
in th
e bl
ock
gran
t tra
nsfe
rs to
reg
ions
. Th
e fir
st

152154
Trends in region – sub-region transfer Block grant transfers to woredas and sub-cities began in 2002 with woreda decentralization. The aim was to transfer a general purpose grant in a transparent way. The practice was first adopted in Amhara, Tigray, SNNP and Oromiya, but was later taken up by other regions as well.
The Regional Constitutions, similar to the Federal Constitution, imply the need for the transfer from regions to sub-regions in their various articles. Similarly, about two years after woreda decentralization, many regions recognized urban administration with woreda status and they also became recipients of block grant transfers. In many cases, urban administrations receive block grants to run their state functions while they use local revenue to finance their municipal functions. Urban centers with no urban administrations status, however, do not receive block grants since they do not run state functions.
Similar to the Federal-region transfer, the region-sub region (woredas/sub cities) transfer has seen an evolution in the formula adopted. At the start of woreda decentralization, almost all regions used the three parameter approach similar to the Federal government. Gradually, however, regions adopted different approaches in disbursing resources. All regions use the basic needs approach. In addition to this, SNNP uses revenue raising capacity, while Gambella uses per capita approach.
Table 10 shows the trends in regional subsidy for the nine regions for 2009/10 and for 2010/11. Woredas or sub-regions in the nine regions received on average 52 percent in 2009/10, and 51 percent in 2010/11. This indicates that regions transfer half of their budgets to sub-regions indicating the importance of Woreda governments in delivering services. In the case of transfers from region to woredas, however, the own revenue is 100 percent off-setted while expenditure from donor specific project funding is off-setted in some regions while not in others (Garcia and Rajkumar 2008)
Table 10. Region - Woreda transfers
2009/10 2010/11
Region Federal block grant
Woreda block grant
Ratio Federal block grant
Woreda block grant
Ratio
Tigray 1326.1 839.5 63.3 1656.6 969.3 58.5
Amhara 4520.3 2714.3 60.0 5501.0 2781.7 50.6
Oromia 6406.5 3619.4 56.5 7641.6 4416.7 57.8
SNNPR 3929.6 2529.4 64.4 45684.6 3050.5 65.1
Afar 639.9 275.5 43.1 792.5 420.0 53.0
Somali 1665.8 636.4 38.2 1991.6 912.7 45.8
Tegegne Gebre-Egziabher
156
Management Institutes established for purposes of providing short term training have also played roles in this regard.
The Government launched a National Capacity Building Program (NCBP) in 2001 targeting 14 sectors with their own reform programs4. The programs were designed to address different stakeholders: public sector, private sectors and civil society. In the course of time, the Government introduced various governance and public sector reform projects. The list of these projects is indicated below (World Bank 2013):
The Public Sector Capacity Building Program (PSCAP, FY 2004-FY 2012). The PSCAP covers six large sub programs namely district level decentralization program (DLDP), Urban Management Program (UMP), Civil Service reform program (CSRP), Information and communication technology (ICT), Justice System Reform Program (JSRP), including court reform and parliamentary support; Tax System & Customs Reform Program (TSRP).
Protection of Basic Services (PBS, FY 2006-FY 2012), which focuses on protecting basic services, transparency, and accountability. It contains four sub programs: support to delivery of basic services, health MDG support facility, transparency and accountability, and monitoring and evaluation (M&E). It also includes Local Investment Grant (LIG), a specific purpose grant for capital investments in rural areas.
Capacity Building for Decentralized Service Delivery (CBDSD, 2002-2008) that deepened decentralization in urban local Governments.
Urban Local government Development program (ULGDP, starting FY 2009), which supports improved performance in the planning, delivery, and sustained provision of priority municipal services and infrastructure.
Democratic Institution Program (DIP) in five institutions namely Institute of Ombudsman, Ethiopian Human Rights Commission, Anti-corruption and Ethics Commission, House of Peoples Representatives, and House of Federation.
PSCAP is the largest public sector capacity building program. Within PSCAP, DLDP and UMP were specifically aimed at local governments. This is because of the assumption that democratically elected local governments, when they exist, often serve as the fulcrum for decentralized governance and therefore, top
4 The 14 targeted sectors and their reforms were civil service reform, tax reform, justice reform, district decentralization, information and communication technology, private sector, construction sector, urban management, cooperatives, textile and garments, agricultural training of vocational and technical levels, industrial training of vocational and technical levels, civil society, and higher education

153
Decentralization and Regional and Local Development: Trends and Policy Implications
155
Benishangul-Gumuz
377.1 188.9 50.1 462.9 206.6 44.6
Gambella 341.2 133.0 42.3 374.0 125.9 33.6
Average 52.23 51.12
SOURCE. Demmelash, Furtado and Samuel 2011
Within City administrations however, sub-cities and kebeles receive less
amount of transfers. In Addis Ababa, the transfers to sub-cities averaged 17% between the years 2011/12 and 2013/14. Similarly in Diredawa the transfers to kebeles between 1998-2002 averaged 15% of the total budget (Maeruf, 2013). This indicates that at the city administration level, kebeles or sub-cities have less fiscal capacity.
Local capacity Regional and local development requires the building of capacities in local communities in order to maintain and strengthen development processes and help them own such processes (Totemeyer 2000). At the same time, decentralization entails not only the devolution of power and authority to the local level but also the strengthening of local institution’s capacity to accommodate such devolution (Totemeyer 2000). As a result, the capacity of local government in management, planning, administration and service delivery is an essential part of the governance structure at local/regional level. One of the consequences of decentralization is therefore to strengthen the capacity of sub-national governments in formulating and implementing strategies, laws and regulations.
In Ethiopia, various studies have shown that there is a clear capacity gap of local governments in running and managing different responsibilities under the decentralized system (Meheret 2007, World Bank 2001). Woredas in particular face shortages of manpower and as a result suffer from poor administrative, oversight and planning functions (Diskovick and Tegegne, 2010)
Efforts to build capacity The Government has taken steps to overcome capacity constraints by implementing different programs. The earliest attempt was the establishment of the Ethiopian Civil Service College (ECSC)3 which was mandated to provide short term training and education for civil servants mainly from the regional governments. The College has provided training for many civil servants at different levels. The Ethiopian Management Institute and the regional
3 The Civil Service College has now changed into Civil Service University
154
Tegegne Gebre-Egziabher
156
Management Institutes established for purposes of providing short term training have also played roles in this regard.
The Government launched a National Capacity Building Program (NCBP) in 2001 targeting 14 sectors with their own reform programs4. The programs were designed to address different stakeholders: public sector, private sectors and civil society. In the course of time, the Government introduced various governance and public sector reform projects. The list of these projects is indicated below (World Bank 2013):
The Public Sector Capacity Building Program (PSCAP, FY 2004-FY 2012). The PSCAP covers six large sub programs namely district level decentralization program (DLDP), Urban Management Program (UMP), Civil Service reform program (CSRP), Information and communication technology (ICT), Justice System Reform Program (JSRP), including court reform and parliamentary support; Tax System & Customs Reform Program (TSRP).
Protection of Basic Services (PBS, FY 2006-FY 2012), which focuses on protecting basic services, transparency, and accountability. It contains four sub programs: support to delivery of basic services, health MDG support facility, transparency and accountability, and monitoring and evaluation (M&E). It also includes Local Investment Grant (LIG), a specific purpose grant for capital investments in rural areas.
Capacity Building for Decentralized Service Delivery (CBDSD, 2002-2008) that deepened decentralization in urban local Governments.
Urban Local government Development program (ULGDP, starting FY 2009), which supports improved performance in the planning, delivery, and sustained provision of priority municipal services and infrastructure.
Democratic Institution Program (DIP) in five institutions namely Institute of Ombudsman, Ethiopian Human Rights Commission, Anti-corruption and Ethics Commission, House of Peoples Representatives, and House of Federation.
PSCAP is the largest public sector capacity building program. Within PSCAP, DLDP and UMP were specifically aimed at local governments. This is because of the assumption that democratically elected local governments, when they exist, often serve as the fulcrum for decentralized governance and therefore, top
4 The 14 targeted sectors and their reforms were civil service reform, tax reform, justice reform, district decentralization, information and communication technology, private sector, construction sector, urban management, cooperatives, textile and garments, agricultural training of vocational and technical levels, industrial training of vocational and technical levels, civil society, and higher education
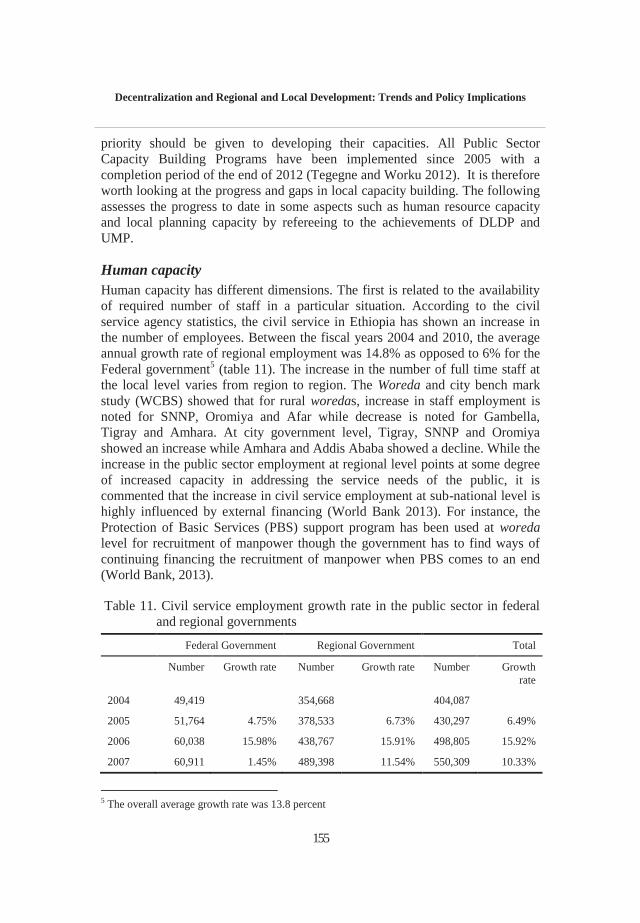
155
Decentralization and Regional and Local Development: Trends and Policy Implications
157
priority should be given to developing their capacities. All Public Sector Capacity Building Programs have been implemented since 2005 with a completion period of the end of 2012 (Tegegne and Worku 2012). It is therefore worth looking at the progress and gaps in local capacity building. The following assesses the progress to date in some aspects such as human resource capacity and local planning capacity by refereeing to the achievements of DLDP and UMP.
Human capacity Human capacity has different dimensions. The first is related to the availability of required number of staff in a particular situation. According to the civil service agency statistics, the civil service in Ethiopia has shown an increase in the number of employees. Between the fiscal years 2004 and 2010, the average annual growth rate of regional employment was 14.8% as opposed to 6% for the Federal government5 (table 11). The increase in the number of full time staff at the local level varies from region to region. The Woreda and city bench mark study (WCBS) showed that for rural woredas, increase in staff employment is noted for SNNP, Oromiya and Afar while decrease is noted for Gambella, Tigray and Amhara. At city government level, Tigray, SNNP and Oromiya showed an increase while Amhara and Addis Ababa showed a decline. While the increase in the public sector employment at regional level points at some degree of increased capacity in addressing the service needs of the public, it is commented that the increase in civil service employment at sub-national level is highly influenced by external financing (World Bank 2013). For instance, the Protection of Basic Services (PBS) support program has been used at woreda level for recruitment of manpower though the government has to find ways of continuing financing the recruitment of manpower when PBS comes to an end (World Bank, 2013).
Table 11. Civil service employment growth rate in the public sector in federal and regional governments
Federal Government Regional Government Total
Number Growth rate Number Growth rate Number Growth rate
2004 49,419 354,668 404,087
2005 51,764 4.75% 378,533 6.73% 430,297 6.49%
2006 60,038 15.98% 438,767 15.91% 498,805 15.92%
2007 60,911 1.45% 489,398 11.54% 550,309 10.33%
5 The overall average growth rate was 13.8 percent
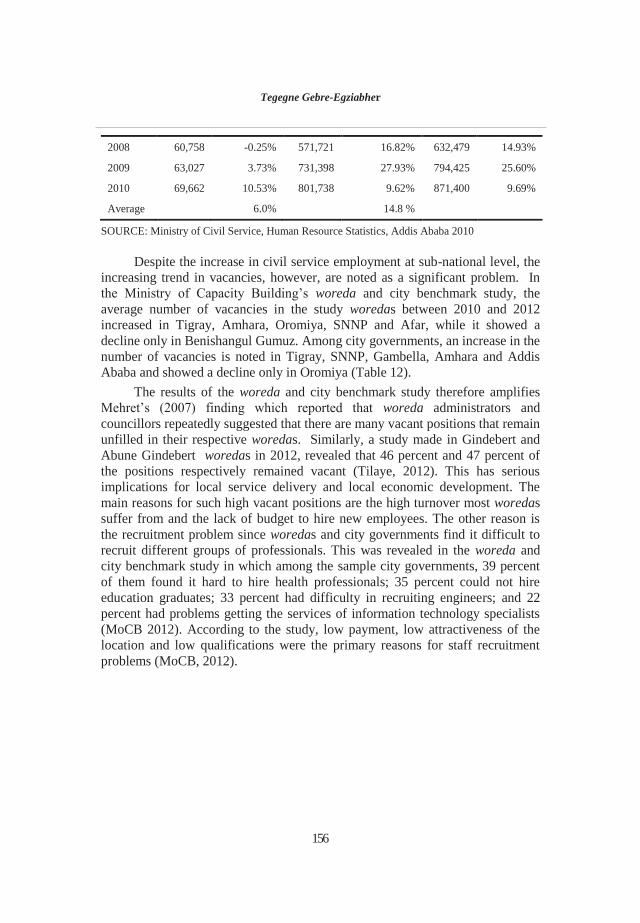
156
Tegegne Gebre-Egziabher
158
2008 60,758 -0.25% 571,721 16.82% 632,479 14.93%
2009 63,027 3.73% 731,398 27.93% 794,425 25.60%
2010 69,662 10.53% 801,738 9.62% 871,400 9.69%
Average 6.0% 14.8 %
SOURCE: Ministry of Civil Service, Human Resource Statistics, Addis Ababa 2010
Despite the increase in civil service employment at sub-national level, the increasing trend in vacancies, however, are noted as a significant problem. In the Ministry of Capacity Building’s woreda and city benchmark study, the average number of vacancies in the study woredas between 2010 and 2012 increased in Tigray, Amhara, Oromiya, SNNP and Afar, while it showed a decline only in Benishangul Gumuz. Among city governments, an increase in the number of vacancies is noted in Tigray, SNNP, Gambella, Amhara and Addis Ababa and showed a decline only in Oromiya (Table 12).
The results of the woreda and city benchmark study therefore amplifies Mehret’s (2007) finding which reported that woreda administrators and councillors repeatedly suggested that there are many vacant positions that remain unfilled in their respective woredas. Similarly, a study made in Gindebert and Abune Gindebert woredas in 2012, revealed that 46 percent and 47 percent of the positions respectively remained vacant (Tilaye, 2012). This has serious implications for local service delivery and local economic development. The main reasons for such high vacant positions are the high turnover most woredas suffer from and the lack of budget to hire new employees. The other reason is the recruitment problem since woredas and city governments find it difficult to recruit different groups of professionals. This was revealed in the woreda and city benchmark study in which among the sample city governments, 39 percent of them found it hard to hire health professionals; 35 percent could not hire education graduates; 33 percent had difficulty in recruiting engineers; and 22 percent had problems getting the services of information technology specialists (MoCB 2012). According to the study, low payment, low attractiveness of the location and low qualifications were the primary reasons for staff recruitment problems (MoCB, 2012).
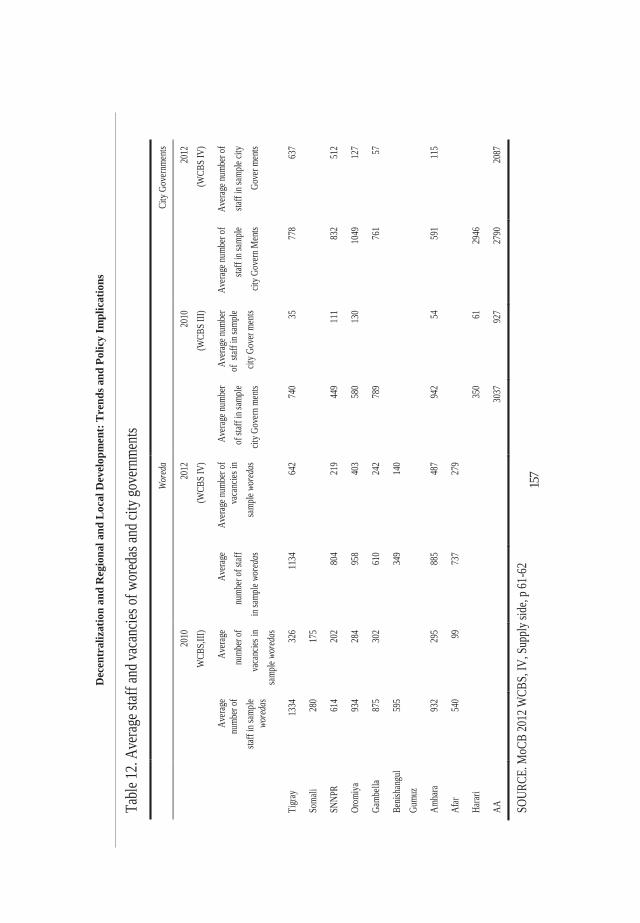
157
159
Table
12. A
verag
e staf
f and
vaca
ncies
of w
ored
as an
d city
gove
rnme
nts
W
ored
a Ci
ty Go
vern
ments
20
10
WCB
S,III
) 20
12
(WCB
S IV
) 20
10
(WCB
S III
) 20
12
(WCB
S IV
)
Av
erage
nu
mber
of
staff
in sa
mple
wore
das
Avera
ge
numb
er of
va
canc
ies in
sa
mple
wore
das
Avera
ge
numb
er of
staff
in
samp
le wo
reda
s
Avera
ge nu
mber
of
vaca
ncies
in
samp
le wo
reda
s
Avera
ge nu
mber
of
staff
in sa
mple
cit
y Gov
ern m
ents
Avera
ge nu
mber
of s
taff i
n sam
ple
city
Gove
r men
ts
Avera
ge nu
mber
of
staff
in sa
mple
city
Gove
rn M
ents
Avera
ge nu
mber
of
staff
in sa
mple
city
Gove
r men
ts
Tigr
ay
1334
32
6 11
34
642
740
35
778
637
Soma
li 28
0 17
5
SNNP
R 61
4 20
2 80
4 21
9 44
9 11
1 83
2 51
2
Orom
iya
934
284
958
403
580
130
1049
12
7
Gamb
ella
875
302
610
242
789
76
1 57
Benis
hang
ul Gu
muz
595
34
9 14
0
Amha
ra 93
2 29
5 88
5 48
7 94
2 54
59
1 11
5
Afar
54
0 99
73
7 27
9
Harar
i
35
0 61
29
46
AA
3037
92
7 27
90
2087
SOUR
CE. M
oCB
2012
WCB
S, IV
, Sup
ply si
de, p
61-6
2
Dec
entr
aliz
atio
n an
d R
egio
nal a
nd L
ocal
Dev
elop
men
t: Tr
ends
and
Pol
icy
Impl
icat
ions
149
Tigr
ay a
nd D
ire D
awa
wer
e on
ave
rage
abl
e to
cov
er 3
6 pe
rcen
t of
the
ir ex
pend
iture
. Th
ose
regi
ons
whi
ch c
over
ed b
etw
een
19 –
23
perc
ent
incl
uded
A
mha
ra,
Oro
miy
a, S
NN
P, H
arar
. T
he f
our
emer
ging
reg
ions
, ho
wev
er,
can
cont
ribut
e a
very
sm
all
shar
e of
the
ir ex
pend
iture
; th
eir
perc
enta
ge s
hare
is
belo
w 1
6 pe
rcen
t with
Ben
ishan
gul c
ontri
butin
g 15
.7 p
erce
nt, A
far 1
1.4,
Som
ale
10.5
, and
Gam
bella
con
tribu
ting
12.7
per
cent
. The
hea
vy d
epen
denc
e of
thes
e re
gion
s on
inte
rgov
ernm
enta
l fis
cal t
rans
fer i
s the
refo
re c
lear
. Th
e co
effic
ient
of
varia
tion
has
mor
e or
less
rem
aine
d co
nsta
nt o
ver
the
perio
d 20
06/0
7-20
11/1
2 ex
cept
for
200
9/10
whe
n th
e co
effic
ient
of
varia
tion
show
ed a
n in
crea
se. T
he
cons
tant
coe
ffici
ent o
f var
iatio
n is
an in
dica
tion
that
ther
e is
littl
e ch
ange
in th
e va
riatio
n am
ong
regi
ons r
egar
ding
the
cont
ribut
ion
of o
wn
reve
nue.
Tabl
e 7.
Tre
nds i
n re
gion
s’ o
wn
reve
nue
as a
shar
e of
tota
l exp
endi
ture
20
06/0
7 20
07/0
8 20
08/0
9 20
09/1
0 20
10/1
1 20
11/1
2 A
vera
ge
Tigr
ay
29.2
5 26
.65
38.3
5 41
.41
39.7
8 41
.12
36.1
Afa
r 15
.39
8.49
7 12
.20
9.40
9.
07
13.7
2 11
.38
Am
hara
18
.92
14.1
9 20
.58
18.6
1 23
.36
23.3
7 19
.84
Oro
miy
a 21
.20
15.8
2 19
.76
22.3
6 26
.45
22.6
4 21
.37
Som
ale
9.21
8.
08
9.62
1 13
.14
12.0
6 10
.74
10.4
8
BSG
9.
53
15.4
3 15
.12
17.3
9 19
.14
17.5
5 15
.7
SNN
P 16
.07
15.7
3 21
.13
20.6
1 23
.72
20.1
8 19
.57
Gam
bella
9.
42
11.6
9 13
.61
13.1
9 14
.91
13.4
9 12
.72
Har
ar
26.7
5 21
.15
24.0
3 20
.33
25.4
4 19
.08
22.8
AA
83
.89
46.2
2 68
.02
101.
5 10
2.7
124.
36
87.7
8
DD
33
.47
25.7
9 36
.04
47.7
9 41
.47
35.6
5 36
.7
Tota
l 32
.75
24.5
32
.52
34.7
8 34
.68
35.9
6 32
.53
CV o
f reg
ions
ex
clud
ing
AA
0.
46
0.40
0.
46
0.55
0.
45
0.45
SOU
RCE:
MoF
ED u
npub
lishe
d da
ta a
nd o
wn
com
puta
tion
Tren
ds in
inte
r-go
vern
men
tal f
iscal
tran
sfer
: Fe
dera
l –Re
gion
al f
iscal
tra
nsfe
r Th
e Fe
dera
l gr
ant
syst
em w
hich
tra
nsfe
rs r
esou
rces
to
regi
ons
invo
lves
blo
ck
and
spec
ific
purp
ose
gran
ts. T
he b
ulk
of th
e tra
nsfe
rs a
re m
ade
as b
lock
gra
nts.
Ther
e ar
e tw
o m
ajor
cha
nges
in th
e bl
ock
gran
t tra
nsfe
rs to
reg
ions
. Th
e fir
st

158160
The other aspects of capacity is related to administrative and implementation capacities of woreda administrators, experts and professionals. An earlier assessment of implementation capacity indicated the presence of limited professional and technical skills in almost all departments at woreda level (World Bank, 2001).
The training component of the DLDP is meant to improve the implementation capacities of rural woredas while that of the UMP focuses on improving the skill level of urban actors. Short and long term trainings were given heavy emphasis to overcome capacity deficiency in both programs. Under the DLDP program, short term trainings were provided through the Federal and regional management institutes and Training of Trainers (TOTs) program. Trainees included experts, the leadership, teachers, communities and civil societies. The focus of training for communities and civil societies has been mostly on different government packages such as good governance package, youth development package and women development packages and these were provided in bulk. In terms of experts, the DLDP program has provided training for 860 TOTs and those in leadership in the Ethiopian Management Institute on issues that strengthen basic skills such as auditing, planning, monitoring and evaluation, government finance and change management. A total of 5688 trainees have been supported at regional and local level. This has helped improve operational practices such as auditing and reporting (Tegegne and Worku 2012a). In terms of long term training, a total of 9,847 individuals were trained in five regions under DLDP (Afar 165, Amhara 212, Oromiya 9333, Benishangul Gumz 12 , and SNNP 125). These trainings were at diploma, first and second degree levels (Tegegne and Worku 2012a).
The human resource component of the Urban Management Program (UMP) also had long and short term training programs. The long term training component was conducted at Federal level by the Civil Service University particularly in the chosen field of urban management. The aim is to train individuals who will be able to manage and lead cities at local level. Accordingly, a total of 2621 professionals have been trained on urban management at a post graduate level, though the initial program was to train 1000 between the years 2008-12 (Tegegne and Worku 2012b). Of these, 2102 trainees (80.2 percent) were from regions and 268 (12.8 percent) were women. The training was delivered in five rounds between 2008 and 2012 at the Civil Service College.
Short term trainings were also provided both at Federal and regional levels for urban actors. The federal level short term trainings focused on councillors, civil servants, mayors, managers and contractors. Specifically, it was reported that (Tegegne and Worku 2012b)
Tegegne Gebre-Egziabher
156
Management Institutes established for purposes of providing short term training have also played roles in this regard.
The Government launched a National Capacity Building Program (NCBP) in 2001 targeting 14 sectors with their own reform programs4. The programs were designed to address different stakeholders: public sector, private sectors and civil society. In the course of time, the Government introduced various governance and public sector reform projects. The list of these projects is indicated below (World Bank 2013):
The Public Sector Capacity Building Program (PSCAP, FY 2004-FY 2012). The PSCAP covers six large sub programs namely district level decentralization program (DLDP), Urban Management Program (UMP), Civil Service reform program (CSRP), Information and communication technology (ICT), Justice System Reform Program (JSRP), including court reform and parliamentary support; Tax System & Customs Reform Program (TSRP).
Protection of Basic Services (PBS, FY 2006-FY 2012), which focuses on protecting basic services, transparency, and accountability. It contains four sub programs: support to delivery of basic services, health MDG support facility, transparency and accountability, and monitoring and evaluation (M&E). It also includes Local Investment Grant (LIG), a specific purpose grant for capital investments in rural areas.
Capacity Building for Decentralized Service Delivery (CBDSD, 2002-2008) that deepened decentralization in urban local Governments.
Urban Local government Development program (ULGDP, starting FY 2009), which supports improved performance in the planning, delivery, and sustained provision of priority municipal services and infrastructure.
Democratic Institution Program (DIP) in five institutions namely Institute of Ombudsman, Ethiopian Human Rights Commission, Anti-corruption and Ethics Commission, House of Peoples Representatives, and House of Federation.
PSCAP is the largest public sector capacity building program. Within PSCAP, DLDP and UMP were specifically aimed at local governments. This is because of the assumption that democratically elected local governments, when they exist, often serve as the fulcrum for decentralized governance and therefore, top
4 The 14 targeted sectors and their reforms were civil service reform, tax reform, justice reform, district decentralization, information and communication technology, private sector, construction sector, urban management, cooperatives, textile and garments, agricultural training of vocational and technical levels, industrial training of vocational and technical levels, civil society, and higher education
159
Decentralization and Regional and Local Development: Trends and Policy Implications
161
Councillors were trained on the 12 competencies; Civil servants were given on-the-job training in different areas such as
micro and small enterprises; About 1000 mayors, managers and experts were trained in planning and
sanitation in two batches with each batch containing about 500 trainees in 2010/11 and 2011/12;
Experts were given on-the-job training on land registry and related issues; and
Skill based training has been delivered to 900 local private contractors with the purpose of building the capacity of the construction sector.
An impact analysis study on trainings for the first phase of PSCAP (2005-09) found that 92 percent of the trainees, most of the supervisors and agencies believed that the training was useful (David, Habtu and Bewket, 2009). Despite this, 43 percent of the trainees reported that either they did not use the skill or used it occasionally. This suggests that there is a need to plan the implementation of the knowledge gained through training. The study also found that though some agencies were happy with the training programs, most felt that PSCAP courses were supply driven, determined by the central authorities to be conducted on a mass basis, such as the good governance package, change management, and strategic planning (David, Habtu and Bewket 2009).
With regard to training in the urban management field, though the bulk of the trainees have been able to work in cities and urban centres in different capacity, some misallocations and problems of recruitment were raised as concerns (Tegegne and Worku 2012b). Despite the above observation, there is no doubt that in recent years there has been a relative progress in the implementation capacity of local authorities both in rural and urban localities. The issue of capacity at local level, however, remains to be a problematic area due to high turnover and inability of localities to retain trained individuals and hire new ones at a desired level.
Local planning and participation One of the objectives of the DLDP is the promotion of local planning and participation. Woredas have mandates to conduct local planning. In order to realize this, there were some initiatives by the Federal and regional governments to support woredas. For instance the Ministry of Finance and Economic Development has prepared a local government development planning guide on local level planning, budgeting, monitoring and evaluation for the purposes of guiding woreda level staff in local level planning process and implementation (Tegegne and Worku 2012a). The guideline is helpful in order to synchronize Federal and regional plans with woreda plans and ascertain the participation of

160
Tegegne Gebre-Egziabher
162
communities in decision making processes at all levels and the accountability of elected and appointed officials prescribed in the Constitution. The document indicates the processes of strategic plan preparation and preparation of annual plans by kebeles and sub-kebeles and project cycles. Other initiatives included public sector project appraisal, expenditure management and control, participation manual and minimum service standards.
Woredas now prepare multiyear plans. They prepare strategic plans and annual plans. The main actors involved in local planning at woreda level are the woreda council, woreda cabinet, woreda sector offices, while at kebele level the main actors involved in kebele planning are the kebele council, kebele cabinet, kebele level sector representatives and the community. The planning process at local level (woreda and kebele level) is both bottom-up and top-down. At woreda level, woreda plans are consolidated with inputs from zonal and regional levels, woreda sectors and kebele levels (See Box 1 for planning exercise in Wolisso woreda). At kebele level, planning is compiled by kebele managers with inputs from sector representatives, but in the light of the woreda plan as a framework. The compiled kebele plan is then submitted to the kebele cabinet which is later forwarded to the kebele council for final approval (see Box 2 for kebele planning in the Amhara region).
Box 1. Plan preparation in Wolisso woreda
Source. Tegegne and Worku, 2012a, P.45
Kebele plans begin by identifying the needs of the people. These needs will be compiled by kebele manager, health extension expert, development agent and education representative and they together prepare a kebele plan. The plan after being approved by the kebele Council will be submitted to woreda. The woreda Finance and Economic development office receives, zonal plan, kebele and woreda sector plans and prepares woreda plan. This will be discussed by woreda cabinet. The plan will then be submitted to woreda finance standing committee to improve upon the plan. The Plan will be finally approved by woreda Council and upon approval of the Plan, the woreda budget will be proclaimed.

161
Decentralization and Regional and Local Development: Trends and Policy Implications
163
Box 2. Kebele level plan preparation in Yenebrena kebele of Gozamin woreda
and Debrgubaye kebels of Hulet ejun nessie woreda, Amahra region Source. Tegegne et al, 2011, p.74 The space for popular participation in planning and budgeting gets
expression at kebele level. The community in the kebeles take part in deliberations during meetings with heads of the field sector offices. The meetings are held for the purpose of soliciting information on priority needs and identification of gaps. There also exists a practice of discussing proposed plans in public meetings prior to finalization. The specifics of the processes and the form and extent of community involvement, vary, however, from region to region and even from site to site within the same region (Tegegne et al 2011). For instance in Gelebabu kebele, of Shirka woreda of the Oromiya region, residents mentioned that the plan after its preparation will be disclosed to the people in order to convince people and get their commitment for its implementation. In Berketu kebele, of Digelunatijo woreda of the Oromiya region residents mentioned that they do not participate in kebele plan preparation (Tegegne et al, 2011). In Debregubye kebele of the Amhara region, it was disclosed that the approved plan will be later discussed by the people and implementation will follow (see Box 2 above). In all cases therefore it is very difficult to conclude that planning is participatory. The only indication of people’s involvement is in supplying information to the sectors and in discussing the approved plans in preparation for implementation.
In both Yenebrena and Debregubaye kebeles, kebele managers play a key role in the preparation of kebele plans. In Yenebrena kebele, plan preparation starts from the gote level. Residents in the village (gote) discuss and identify what needs to be done or what they can do with their own labor. Such discussion is facilitated by experts at kebele level. In addition to this, the four main committees (development, education, health and justice committees) and the council prepare their own plans. The kebele planning committee prepares the plan and submits the same to the cabinet and later to the council for approval. In Debregubaye kebele, plan preparation involves both top-down and bottom-up process. Kebele sectors receive woreda plan which serves as a framework for kebele plan. The sectors collect information from gotes and prepare their own plans by keeping in mind the woreda framework. The kebele manager will put together the sector plans and produce kebele plan. This will be discussed by the cabinet and approved by the kebele council. The approved plan will be later discussed by the people and implementation will follow.
162
Tegegne Gebre-Egziabher
164
Policy implications Decentralization is not a panacea for regional and local development but there is a need to maximize its positive effects since it has a positive relation with development. The followings emanate from the trends highlighted above and they need to be considered to improve the situation.
The design of fiscal decentralization Fiscal decentralization, which is the transfer of fiscal authority to lower levels, has two components in the Ethiopian case: the Federal -regional level and regional-sub regional level. With regard to the Federal regional level, the trends reveal that revenue continues to be highly centralized at the Federal level while expenditure is decentralized. This will give rise to the condition of unfunded mandates and also to heavy dependence of regions on fiscal transfers from the Federal government with implications on regional autonomy. The latter is evident as it is found that trends on fiscal dependency remain high. On the other hand, the data show that payroll tax which is less yielding is the main source of income for regions and they have little control on profit tax and other revenue sources which are more yielding. It is therefore imperative that regions should be strengthened in their revenue raising capacity by designing a system that allows them to tap more of their resources. This however has to be done in a manner that does not reduce the Federal government’s power to redistribute resources to address inequality among regions.
Currently woredas collect a substantial portion (68 percent) of regional revenues only as delegated units. Woredas thus do not have the power to use the resources at their own discretion. The lack of such discretionary power makes woredas to continuously rely on regional governments and live in a state of uncertainty. This has to change and woredas, as constitutionally recognized administrative units, need their own resources over and above what they receive from the regional governments in the form of subsidy.
The sub-regional transfer formula Owing to the lack of revenue raising authority by woredas, regions use only woredas’ expenditure need to allocate resources. This hints at the deficiency of region - sub region transfer formula since it does not address both fiscal capacity and expenditure needs which are necessary for attaining full equalization. It is therefore imperatives that regions should design ways of attaining full equalization.
163
Decentralization and Regional and Local Development: Trends and Policy Implications
165
Revenue raising capacity of regions Beyond the design of fiscal decentralization, regions have shown disparity in their revenue raising capacities. Some regions such as Tigray and Somale have performed well while other regions have lagged behind in this regard. There is a need to investigate the lag in some regions and address the causes.
Regional spending mix The foregoing discussion on regional spending shows that the regional share of recurrent spending is increasing but not the capital spending. This constraints infrastructural expansion and undermines the equalizing effects of the Inter-Governmental Fiscal Transfer (IGFT) since equalization in development comes largely from the gap filling part of the IGFT. On the other hand, the fact that capital spending is dominated by the Federal government hints at the dominating role the Federal government enjoys in deciding and influencing the patterns of development in the country. It is therefore imperative that regions should be enabled to increase their capital spending by drawing resources for capital expenditure use.
A need to improve administrative capacity The study has shown that there are a number of initiatives to strengthen the manpower needs of regions and woredas. These include redeployment and training. Despite this however, woredas are still deficient in their capacity and suffer from lots of vacancies and problems of recruitment. There has to be a mechanism to reduce the turnover and retain the employed. This might include designing appropriate carrier structure and developing incentive systems.
Local planning needs to improve Local planning is critical in guiding the local development process. Local planning is being exercised in the country as woredas now prepare annual and multiyear plans. The plan preparation process however is not participatory and local people are made to provide information and participate in implementation. Decision making in local planning however needs to be participatory if real change is to be brought about. Planning organs also need to have adequate information on budgets to make their plans.
Conclusion The decentralization process in Ethiopia has been characterized as a big push by some authors (Dickovick and Tegegne 2010). Such decentralization is expected to have pervasive impacts on different issues such as service delivery, poverty
164
Tegegne Gebre-Egziabher
166
reduction and political autonomy. One influence of decentralization is on local development process since decentralization influences local resource availability, local capacity and local planning. As decentralization takes time to influence local process, it is appropriate to examine trends. Trends depicted in this study show that regional revenues have increased though the Federal government still collects the lion’s share. In this regard, some regions have better performance than others. Woredas are also becoming significant actors in the regional revenue collection effort since the bulk of regional revenues are collected by them. The trends in regional expenditures have shown that regions are now having more and more recurrent spending though this is not true of capital spending. An interaction between revenue and expenditure at regional level showed that there is an increasing gap between per capita revenue and expenditure, necessitating fiscal transfer from the Federal government. The Federal government has discharged this responsibility by transferring resources to regions which has grown at a magnitude that registered a 12-fold increase between the years 1996/97 and 2012. The Federal government has also experimented with different types of formulae in a bid to bring about fairness in resource allocation. Since woreda decentralization, region to sub-region transfer has also become part of the intergovernmental fiscal transfer in the country. Regions also experiment on different formulae to transfer resources to woredas.
With regard to local capacity, the study revealed that there have been efforts to overcome the problems with some positive impacts. A lot, however, remains to be done in order to reduce the problems of turnover and vacant positions particularly at woreda level. In terms of local planning, localities are now preparing annual and multi year plans but in a less participatory manner. The initiatives by the Federal and regional governments have to continue to ensure participation in planning.
On the basis of the above discussion, it can be concluded that key issues in decentralization, namely resource availability and local capacity, show similar trends and patterns in time, though their levels have increased. In terms of policy, though regions are gaining strength in the areas of fiscal decentralization and woredas are becoming important players, there is a need for continuous reform in order to enable regions and woredas fully benefit from the fiscal arrangements. Secondly, despite the central government’s initiative to improve local capacity, regions and localities need to engage in own capacity building efforts as well. Regions and localities also need to design incentive mechanisms to reduce vacancies and turnovers. In addition, the involvement of local actors in local planning needs to be given attention and bring such practice to acceptable levels.

165
Decentralization and Regional and Local Development: Trends and Policy Implications
167
References Asmelash Beyene 2000. Decentralization as a Tool for Resolving the
Nationality Problem: the Ethiopian Experience. Regional Development Dialogue 21(1): 123-147.
Assefa Fiseha 2007. “Theory versus Practice in the Implementation of Ethiopia’s Ethnic Federalism,” in David Turton, ed. Ethnic Federalism: the Ethiopian Experience in Comparative Perspective, pp. 131-164. Oxford: James Currey.
David Ma, Habtu Hiwot and Bewketu Moges 2009. Report on PSCAP Funded Training, Report Prepared for the World Bank Ethiopia
de Winter, L., Tursan, L., (eds.) 1998. Regionalist Parties in Western Europe. London: Routledge
Demmelash Alem, Furtado,X and Samuel Mulugeta 2011. Woreda Block Grant Transfers: Current Practices and Challenges. Report from a Workshop organized by the PBS Secretariat, Addis Ababa
Dickovick, J.T and Tegegne Gebre-Egziahber 2010. African Decentralization Assessment: Ethiopian desk study. 2010. Report prepared for USAID, Addis Ababa
Dom, C, Lister,S and Antoninis, M 2010. An analysis of decentralization in Ethiopia. Report prepared for the Worldbank Ethiopia. Addis Ababa
FDRE House of Federation 2010 Federal subsidy distribution formula. Addis Ababa (in Amharic)
FDRE House of Federation 2014 Federal subsidy distribution formula, Addis Ababa (in Amharic)
Finot, Ivan 2005. Decentralization, territorial transfer and local development. CEPAL Review, 86,available at www.eclac.cl/cgi-bin/getProd.asp?xml=/revista/
Garcia, M and Rajkumar A.S 2008. Achieving better service delivery through decentralization in Ethiopia’ World Bank working paper, no 131.
Gunatilaka. R 2001. Fiscal decentralization, rural development and poverty reduction: A Sri Lankan perspective. Paper prepared for the international seminar on Monetary and Fiscal Policy and Poverty and Public Policy, Institute for Social and Economic Change, Bangalore, India. Available at http://www. info.world bank.org/etools/docs/library/128843/Sri%20Lanka.pdf
Horowitz, D. L. 1985. Ethnic Groups in Conflict. Berkeley: University of California Press

166
Tegegne Gebre-Egziabher
168
Martinez Vazquez, J and McNab, R.M (2001) Fiscal decentralization and economic growth. Georgia State Andrew Young School of Policy (ISP), working paper No 01-01. Available at SSRN:http:// ssrn.com/abstract=259281
Maeruf (2013) Addis Ababa city subcity transfer, Unpublished report prepared for the Worldbank Ethiopia, Addis Ababa
Mehert Ayenew 2007. A rapid assessment of woreda decentralization in Ethiopia. In Taye Assefa and Tegegne Gebre-Egziabher (eds) Decentralization in Ethiopia. Addis Ababa: Forum for Social Studies
Ministry of Capacity Builiding (MoCB) 2010. Woreda and city administrations benchmarking survey III, Addis Ababa
Ministry of Capacity Builiding (MoCB) 2012. Woreda and city administrations benchmarking survey IV, Addis Ababa
Ministry of Civil Service 2010. Human Resource Statistics. Addis Ababa Prudhomme, R. 1995. The dangers of decentralisation. World Bank Research
Observer 10: 201-220. Rodríguez-Pose, Andrés 2008. Decentralization and local and regional
development, CAF Working papers, No 2008/04 Rodriguez-Pose, A and Ezcurra, R 2010. Does decentralization matter for
regional disparities? A cross-country analysis’ Journal of Economic Geography, V 10, pp 619-644,
Tegegne Gebre-Egziabher 1998. The Influences of Decentralization on Some Aspect of Local and Regional Development Planning in Ethiopia. Eastern Africa Social Science Research Review, 14 (1)
Tegegne Gebre-Egziabhe and Tassew Woldehanna 2013. Region-sub region transfer: A review and assessment. Report prepared for the Worldbank, Addis Ababa.
Tegegne Gebre-Egziabhe, Tassew Woldehanna and Mehret Aynew 2010. Federal block grant and regional socio-economic development in Ethiopia: 1995-2008, A report submitted to the House of Federation, Republic of Ethiopia, Addis Ababa
Tegegne Gebre-Egziabher and Worku Yewalashet 2012a. Review of the implementation of district level decentralization sub-program (DLDP), Report Prepared for the World Bank Ethiopia, Addis Ababa
Tegegne Gebre-Egziabher and Worku Yewalashet 2012b. Review of the Implementation of the Urban Management Capacity Building Program), Report Prepared for the World Bank Ethiopia, Addis Ababa

167
Decentralization and Regional and Local Development: Trends and Policy Implications
169
Tegegne Gebre-Egziabher, Kassahun Berhanu, Biraj Swain and Habtu Gebre Hiwot 2011 Review of the Implementation of the Good Governance Package with emphasis on participation. Report prepared for the World Bank Ethiopia, Addis Ababa
Tilaye Fekadu 2012. A study on capacity building for decentralized local governance: The case of Gindeberet and Abuna Gindebert woredas in Oromiya nationl regional state, Masters thesis in Department of Public Administration and Management, Addis Ababa University
Totemeyer, G.K.H 2000. Decentralization for empowerment of local units of governance and society: A critical analysis of the Namibian case’ Regional Development Dialogue, V 21, No. 1 pp 95-118
World Bank 2013. Building the Developmental State – A Review and Assessment of the Ethiopian Approach to Public Sector Reform, Report no ACS3695, Washington DC


171
6 Solomon Negussie
Inter-governmental Transfers and the Problem of Imbalances in Regional Development: The Need for a Human Rights Approach Introduction Inter-governmental fiscal relations in Ethiopia started as a result of the change in government in 1992 which later on was affirmed through the Federal arrangement established under the 1995 constitution. Inter-governmental fiscal relation is intertwined with the fact that expenditure responsibilities are decentralized as opposed to taxing responsibilities. As a result, fiscal transfers are used to mitigate the challenges emanating from financial imbalances, thereby the assumption is that each level of government fulfills the obligation to respect, protect and fulfill socio-economic and political rights. Accordingly, human rights become a central element of government expenditure. In Ethiopia, the major fiscal transfer mechanisms involve the transfer of Federal grants to states and from states to their local governments (Tegegn and Kassahun 2007; Solomon 2008). Like many other federations, it is the general-purpose grant (with few specific-purpose grant) which is used as an optimal transfer mechanism primarily based on equity and efficiency considerations. But such considerations may not adequately give attention to the political considerations of public participation, accountability to local people and to individual rights and liberties. In the absence of proper legal and institutional mechanisms, even the fulfillment of economic objectives could be frustrated. Further, as Liu and Webb (2011) observed, the economic rationales may not be fulfilled due to tax collection inefficiency, a sense of ‘free-ridership’ or fiscal profligacy leading to regional development imbalances. This kind of behavior by some regional governments can be a liability to others. Thus, there should be a mechanism to ensure that inter-governmental transfers are utilized to change the realty on the ground by improving the level of development in the region or locality. As indicated below, human rights instruments provide safeguards to use the available resources wisely and responsibly. This study aims to broaden the conceptual analysis of fiscal transfer in Ethiopia to include human rights perspectives and create a strategic interaction between them. To do so, first, it

170
Solomon Negussie
172
analyzes the nature and objectives of inter-governmental fiscal relations vis a vis the principles of a Human Rights Approach (HRA)1. Second, it argues for the merits of benchmarking the human rights-based approach for a better implementation of inter-governmental transfers in the effort to address regional imbalances.
Organization of the study Many studies (such as Tegegn and Kassahun 2007; Solomon 2008; Abu 2013)2 on inter-governmental fiscal relations in Ethiopia have focused on the economic, administrative and politico-legal implications of federal–state relations. Especially, the analysis has focused on whether meaningful fiscal and political powers devolved to sub-national levels within the federal arrangement, and the challenges of economic disparity among the regions. However, human rights aspects remain insufficiently addressed. Particularly, there is a lack of use of the human rights approach in order to make each level of government accountable to the people and to ensure public participation in governance in general, and in the proper utilization of fiscal transfers in particular. This is because, as it will be analyzed in detail below, human rights are a valuable tool for evaluating the realization of economic, social and cultural rights in an interrelated manner with political rights. This study therefore makes a legal and theoretical analysis of the principles of a human rights approach for the proper utilization of fiscal transfers (that are aimed at addressing regional imbalances) in Ethiopia. The study design includes the use of secondary sources such as tax records and expenditure analysis for a brief investigation of the nature of inter-governmental fiscal relations in Ethiopia. In addition, Federal and regional constitutions and other laws, policy documents and related publications have been used.
This study is organized as follows. The next section provides an introductory overview of the main features of inter-governmental fiscal relations in Ethiopia. The section that follows provides a theoretical analysis of benchmarking and the human rights approach. Its first sub-section discusses the nature and purpose of benchmarking in a federal system and demonstrates how it can build partnership between the Federal and regional governments for better utilization of transfers. The second sub-section describes the principles of human rights approach and how they link governance, human rights and development. The next two sections deal with the basic principles of a human rights approach 1 In this study, a human rights approach (HRA) is used similar to a human rights-based approach (HRBA) which encompasses the full spectrum of human rights concerning both the process as well as the outcome of development. 2 Tegeng and Kassahun (2007) provides a detailed list of available sources until 2006, and Masters thesis are also available in the graduate studies library of the Addis Ababa University
171
Inter-governmental Transfers and the Problem of Imbalances in Regional Development: The Need for a Human Rights Approach
173
and how such an approach is relevant to Ethiopia and its Federal arrangement. A conclusion is given in the last section.
Main features of inter-governmental fiscal relations in Ethiopia
Expenditure and revenue assignments The assignment of powers and functions to sub-national levels of government (decentralized fiscal arrangements) has generated little interest in scholarly studies3 in the 1990s although the process began immediately after the demise of the Derg regime in 1991. The process of according autonomy (through fiscal powers) began through the promulgation of the Transitional Charter in 1991, which affirms the political commitment to the rights of ‘nations, nationalities and peoples’ and the establishment of the administrative division of the country into 14 units. In addition, Proclamation No. 7/1992 defined the powers and functions of the central and regional governments as well as those of Zones, weredas and kebelles. In 1995, the Federal Constitution came into force defining the powers and functions of the Federal government and the states (Art 51 and Art 52 respectively). A multi-tiered federal system which seeks to achieve the objectives of decentralization has to properly determine which level of government has what type of expenditure responsibility, and whether local governments have the power to tax and spend, and, at the same time, how they become accountable to the citizens.
With regard to expenditure assignments, the Federal Constitution follows a dual structure where each government has legislative and executive powers on matters that fall under their respective jurisdictions (Art 50/2). Accordingly, the Federal government assumes responsibility over the major functions listed under Art 51 such as defence, national security, foreign affairs and international trade, financial and monetary policies. States hold all residual powers in addition to those explicitly listed in the Constitution, such as the responsibility for executing economic and social development policies, strategies and plans of the region, and establishing and administering a regional police force and maintaining public order (Art 52/1).4 And both the Federal government and the States have to cover the costs of their respective financial expenditures but if the Federal government allocates grants to the States, it has the power to audit and inspect their proper utilisation (Art 94/1&2). The Constitution also provides that
3 After decentralization began in 1991, the major scholarly study on fiscal decentralization in Ethiopia was Eshetu (1994) 4 However, it should be noted that the extent of power assigned to both levels of government is not always clear
172
Solomon Negussie
174
adequate power shall be granted to the lowest administrative units to enable the people to directly participate in their own affairs.5 With regard to taxation power, the Constitution divides it into three categories, namely ‘the federal power of taxation’ (Art 96), ‘the state power of taxation’ (Art 97) and ‘concurrent power of taxation’ (Art98). Those listed under Federal and State powers are the exclusive revenue sources for the Federal and regional governments respectively. The concurrent taxes are levied and administered by the Federal government whereas the states share the revenue on the basis of a formula designed by the House of Federation (HoF 2003).6
Imbalances Scholars acknowledge that almost all multi-level governments face two kinds of fiscal imbalances: vertical and horizontal imbalances (see Shah 2007; Watts 2002; Ahmad and Craig 1997). The Federal Constitution provides for the allocation of grant subsidy (Art 94/2), as well as the sharing of joint tax sources (Art 62/7) as measures to correct both the vertical and horizontal imbalances. In Ethiopia, the extent of vertical fiscal imbalance is considerably high. As shown in Table 1 below, states were able to generate around 19 percent of their total expenditure while the rest was covered through Federal transfers. Though there are slight variations between fiscal years, the vertical imbalance in Ethiopia still remains high. Such kind of imbalance occurs for the reason that the major sources of revenue are reserved to the Federal government, while the states assume the bulk of expenditure responsibilities such as health, education and social services. The states also have limited administrative and technical capacity to levy taxes and collect revenue (Solomon 2008: 172).
Furthermore, all the regions have fiscal deficits and they also have widely divergent revenue-raising capacities. As can be seen from Table 1, the fiscal disparity between the states is high, ranging from 9 percent of total expenditure to over 29 percent. This disparity can be attributed primarily to the fact that 5 The amendment of state Constitutions in 2002 devolved power to lower levels of administration, introduced check & balance between the legislature and the executive, reduced the power of Zones, and district level (wereda) grant transfer was introduced. 6 According to Art 62(7) of the Constitution, the Mandate to determine the revenue sharing arrangement and design grant formula is bestowed upon the HoF. The current arrangement, as per the 2nd ordinary meeting of the HoF, March 13, 2003, is set to divide revenue generated from concurrent taxes as per the following scheme: direct taxes from companies in the proportion of 50:50 and indirect taxes in the proportion of 70:30 between the federal and the states respectively. Similarly, direct taxes from large-scale mining and petroleum operations are divided in proportion of 50:50, whereas royalties are divided in proportion to 60:40. As per the 2010 report from ERCA, revenue sources are unevenly distributed among the regions. In general, the arrangement will have to be scrutinized on how it is implemented and whether it is feasible in future.

173
Inter-governmental Transfers and the Problem of Imbalances in Regional Development: The Need for a Human Rights Approach
175
regional governments vary considerably in their resource endowments, as well as in population and territorial size. They also have differences with regard to management and administrative capacities as a result of relative variations in infrastructure, skilled manpower and the characteristics of urbanization, as well as their economic environment for private as well as public investment (Ibid). This asymmetry causes problems in measuring the imbalances between the regional governments. Also the impact of corruption, absence of supervision, control and local accountability, lack of commitment and dependency on grants cannot be underestimated (Abu 2013: 26-27).

174 17
6 Ta
ble 1.
Rev
enue
and E
xpen
ditur
es of
Reg
ional
Gove
rnme
nts—
2006
/7-20
10/11
Re
gions
(2
006/7
) (2
007/0
8)
(200
8/9)
(200
9/10)
(2
010/1
1)
Re
v (in
Mill
ions)
Exp.
(in
mi
llion
s)
%ag
e Re
v/exp
Re
v.
(in
Mill
ions
Exp
(in
Mill
ions
%ag
e Re
v.
(in
milli
ons
Exp.
(in
Mi
%
Rev.
Exp.
%
Rev.
Exp.
%
Tigra
y 25
5.76
874.3
29
.3 34
7.78
1245
.14
27.9
605.0
6 15
77.5
38.4
812.4
19
61.49
41
.4 10
66.11
26
80.26
39
.8
Afar
38.09
24
7.41
15.4
42.58
39
1.42
10.9
68.64
56
3.1
12.2
74.56
79
2.42
9.4
152.9
1 16
83.29
9.0
8
Amha
ra
402.9
1 21
29.18
18
.93
535.0
9 37
82.77
14
.15
950.1
1 46
15.07
20
.6 10
26.96
55
16.56
18
.6 16
18.14
69
29.20
23
.36
Orom
ia 80
8 38
11.11
21
.2 86
1.36
5778
.18
14.9
1420
.49
7188
.48
19.76
17
75.20
79
38.75
22
.4 27
81.64
10
518.3
9 26
.44
Soma
li 60
.87
660.8
9.2
1 83
.98
1026
.28
8.18
100.6
4 10
46.03
9.6
20
8.41
1584
.97
13.2
283.5
8 23
50.71
12
.06
B.Gu
muz
27.29
28
6.44
9.53
43.61
32
1.16
13.6
50.68
33
5.13
15.12
72
.42
416.3
8 17
.4 11
5.08
601.2
2 19
.14
SNNP
R 34
0.10
2115
.86
16.07
46
8.81
2679
.99
17.5
670.5
8 31
92.52
21
94
4.88
4584
.58
20.6
1430
.69
6032
.33
23.7
Gamb
ela
17.84
18
9.3
9.42
22.74
23
3.50
9.74
33.71
24
7.67
13.6
45.70
34
6..45
13
.2 71
.75
481.0
9 14
.9
Harar
i 25
.82
96.49
26
.76
32.65
14
0.02
23.3
38.41
15
9.8
24.0 3
43.62
21
4.53
20.3
60.63
23
8.3
25.4
D.Da
wa
58.6
175.0
9 33
.47
72.68
27
0.25
26.9
102.2
4 28
3.65
36.04
14
0.21
293.3
8 47
.8 15
4.68
372.9
5 4.4
7
1:Tota
l 20
35.32
25
11.28
40
47.70
51
44.36
77
35.21
2:Tota
l
1058
6
15
868.7
2
19
208.9
0
23
649.5
31
887.9
3:Tota
l %
19
.22
15.82
21
.07
21.7 5
24.3
SOUR
CE: c
ompu
ted fr
om da
ta M
FEDb
, Dec
embe
r 201
2
Solo
mon
Neg
ussie
174
adeq
uate
pow
er s
hall
be g
rant
ed to
the
low
est a
dmin
istra
tive
units
to e
nabl
e th
e pe
ople
to
dire
ctly
par
ticip
ate
in t
heir
own
affa
irs.5
With
reg
ard
to t
axat
ion
pow
er,
the
Cons
titut
ion
divi
des
it in
to t
hree
cat
egor
ies,
nam
ely
‘the
fede
ral
pow
er o
f ta
xatio
n’ (
Art
96),
‘the
state
pow
er o
f ta
xatio
n’ (
Art
97)
and
‘con
curre
nt p
ower
of
taxa
tion’
(A
rt98)
. Th
ose
liste
d un
der
Fede
ral
and
Stat
e po
wer
s ar
e th
e ex
clus
ive
reve
nue
sour
ces
for
the
Fede
ral
and
regi
onal
go
vern
men
ts r
espe
ctiv
ely.
The
con
curre
nt ta
xes
are
levi
ed a
nd a
dmin
ister
ed b
y th
e Fe
dera
l gov
ernm
ent w
here
as th
e sta
tes
shar
e th
e re
venu
e on
the
basis
of
a fo
rmul
a de
sign
ed b
y th
e H
ouse
of F
eder
atio
n (H
oF 2
003)
.6
Imba
lanc
es
Scho
lars
ack
now
ledg
e th
at a
lmos
t all
mul
ti-le
vel g
over
nmen
ts fa
ce tw
o ki
nds
of
fisca
l im
bala
nces
: ve
rtica
l an
d ho
rizon
tal
imba
lanc
es (
see
Shah
200
7; W
atts
2002
; A
hmad
and
Cra
ig 1
997)
. Th
e Fe
dera
l Co
nstit
utio
n pr
ovid
es f
or t
he
allo
catio
n of
gra
nt s
ubsid
y (A
rt 94
/2),
as w
ell a
s th
e sh
arin
g of
join
t tax
sou
rces
(A
rt 62
/7) a
s m
easu
res
to c
orre
ct b
oth
the
verti
cal a
nd h
oriz
onta
l im
bala
nces
. In
Ethi
opia
, the
ext
ent o
f ver
tical
fisc
al im
bala
nce
is co
nsid
erab
ly h
igh.
As
show
n in
Tab
le 1
bel
ow, s
tate
s w
ere
able
to g
ener
ate
arou
nd 1
9 pe
rcen
t of
thei
r to
tal
expe
nditu
re w
hile
the
rest
was
cov
ered
thro
ugh
Fede
ral t
rans
fers
. Tho
ugh
ther
e ar
e sli
ght v
aria
tions
bet
wee
n fis
cal y
ears
, the
ver
tical
imba
lanc
e in
Eth
iopi
a sti
ll re
mai
ns h
igh.
Suc
h ki
nd o
f im
bala
nce
occu
rs f
or t
he r
easo
n th
at t
he m
ajor
so
urce
s of
rev
enue
are
res
erve
d to
the
Fed
eral
gov
ernm
ent,
whi
le t
he s
tate
s as
sum
e th
e bu
lk o
f ex
pend
iture
res
pons
ibili
ties
such
as
heal
th,
educ
atio
n an
d so
cial
serv
ices
. The
stat
es a
lso
have
lim
ited
adm
inist
rativ
e an
d te
chni
cal c
apac
ity
to le
vy ta
xes a
nd c
olle
ct re
venu
e (S
olom
on 2
008:
172
). Fu
rther
mor
e, a
ll th
e re
gion
s ha
ve fi
scal
def
icits
and
they
als
o ha
ve w
idel
y di
verg
ent
reve
nue-
raisi
ng c
apac
ities
. A
s ca
n be
see
n fr
om T
able
1,
the
fisca
l di
spar
ity b
etw
een
the
state
s is
hig
h, ra
ngin
g fr
om 9
per
cent
of t
otal
exp
endi
ture
to
ove
r 29
per
cent
. Th
is d
ispa
rity
can
be a
ttrib
uted
prim
arily
to
the
fact
tha
t
5 The
am
endm
ent o
f sta
te C
onsti
tutio
ns in
200
2 de
volv
ed p
ower
to lo
wer
leve
ls of
adm
inist
ratio
n,
intro
duce
d ch
eck
& b
alan
ce b
etw
een
the
legi
slatu
re a
nd t
he e
xecu
tive,
r
educ
ed t
he p
ower
of
Zone
s, an
d di
stric
t lev
el (w
ered
a) g
rant
tran
sfer
was
intro
duce
d.
6 Acc
ordi
ng t
o A
rt 62
(7)
of t
he C
onsti
tutio
n, t
he M
anda
te t
o de
term
ine
the
reve
nue
shar
ing
arra
ngem
ent a
nd d
esig
n gr
ant f
orm
ula
is be
stow
ed u
pon
the
HoF
. The
cur
rent
arra
ngem
ent,
as p
er
the
2nd o
rdin
ary
mee
ting
of t
he H
oF, M
arch
13,
200
3, i
s se
t to
div
ide
reve
nue
gene
rate
d fro
m
conc
urre
nt ta
xes
as p
er th
e fo
llow
ing
sche
me:
dire
ct ta
xes
from
com
pani
es in
the
prop
ortio
n of
50
:50
and
indi
rect
taxe
s in
the
prop
ortio
n of
70:
30 b
etw
een
the
fede
ral a
nd th
e sta
tes r
espe
ctiv
ely.
Si
mila
rly, d
irect
taxe
s fro
m la
rge-
scal
e m
inin
g an
d pe
trole
um o
pera
tions
are
div
ided
in p
ropo
rtion
of
50:
50, w
here
as ro
yalti
es a
re d
ivid
ed in
pro
porti
on to
60:
40. A
s per
the
2010
repo
rt fro
m E
RCA
, re
venu
e so
urce
s are
une
venl
y di
strib
uted
am
ong
the
regi
ons.
In g
ener
al, t
he a
rrang
emen
t will
hav
e to
be
scru
tiniz
ed o
n ho
w it
is im
plem
ente
d an
d w
heth
er it
is fe
asib
le in
futu
re.

175177
1: Total Regions Revenue (excluding Addis Ababa) 2: Total Regions Expenditure (excluding expenditure financed by foreign
loan and assistance) 3: Percentage of Regions revenue to expenditure
Inter-governmental transfers To overcome imbalances, federal constitutions mandate the transfer of revenue in the form of sharing tax bases, sharing tax revenues and allocation of grants (Shah 2007:21, 25). However, the processes, extent and nature of transfers to reach the desired level of equalization vary widely across federations. Inter-governmental transfers in Ethiopia7 are the primary source of sub-national levels and comprise both revenue sharing and grant instruments. Revenue sharing refers to the sharing of revenue generated mostly through the federal administration of taxes, but shared with the states based on a certain principle: either the derivation/origin principle or the redistribution/equity principle (Ter-Minassian 1997: 11-12).8
Federal unconditional grants distributed on a formula basis represent about one-third of the Federal budget and cover 80 to 85 percent of regional expenditures (See Tables 2 and 3 below). Since 1995, the HoF decided on grant formulas in 2000, 2003, 2007, 2009 and 2012 with several revisions on the formulas in between those years. In developing grant formulas, the HoF (2012) declares that it strives to equitably distribute financial resources so that regional governments will be able to provide citizens equal access to publicly funded social services. However, it is not only the details in the formula that addresses regional disparity, but also the proper spending of grants for the fulfillment of socio-economic needs. Besides the provision of grant subsidies, other policy measures such as promoting balanced growth of regional economies, changing tax bases, controlling disincentive effects of grants, ensuring fiscal discipline, creating the link between budget and human rights perspectives are all essential.
The need for conditional grants in Ethiopia has also become clear. Since 2006 the Federal government along with its development partners have implemented the project known as ‘Protection of Basic Services’, using direct budget support to weredas to spend only in selected areas such as education, health, agriculture, water supply and rural roads (Dereje 2011; World Bank 2011). Although it is mainly provided in the form of block grants to weredas to depen transparency and accountability in service delivery, it also paved the way for ‘the implementation of multi-sector Specific Purpose Grant for capital
7 For details, see Solomon 2008 8 For its application in Ethiopia, see note 6 above.
Inter-governmental Transfers and the Problem of Imbalances in Regional Development: The Need for a Human Rights Approach
175
regional governments vary considerably in their resource endowments, as well as in population and territorial size. They also have differences with regard to management and administrative capacities as a result of relative variations in infrastructure, skilled manpower and the characteristics of urbanization, as well as their economic environment for private as well as public investment (Ibid). This asymmetry causes problems in measuring the imbalances between the regional governments. Also the impact of corruption, absence of supervision, control and local accountability, lack of commitment and dependency on grants cannot be underestimated (Abu 2013: 26-27).

176
Solomon Negussie
178
investment’ (World Bank 2011: vi). Later on, the federal government exclusively assigned grants to meet the Millennium Development Goals (MDGs). For instance, in the 2011/12 fiscal year (see Table2), of the total Federal budget, 39.38 percent was allocated to the regions in the form of general and MDGs grants. Of which, 12.73 percent was allocated in the form of MDGs grant and the remaining 26.65 percent was allocated in the form of block grant. Similarly, for the 2012/13 fiscal year, 41.03 percent of the Federal budget was allocated to regions in the form of block and MDGs grants, of which 14.51 percent was aimed at meeting the aims of the MDGs. According to the budget laws, MDGs grants can be provided to regions only for capital expenditures after an agreement is signed between the federal and regional governments and the federal government reserves the power to supervise and control the spending. So, a new trend has been observed, shifting from a vague inclusion of specific grants, such as safety net programs, to specific allocation of funds for MDGs or Urban Local Development Programs. The overall outcome of such grants depends upon how it is spent for the intended purposes and how adequately administered.
Table 2. The percentage share of grant subsidy to the total Federal budget: 2005/6 – 2013/14
Fiscal Year Total Federal budget (millions)
Grant subsidy to regions
MDGs grants
Amount Percentage to the federal
budget
Amount Percentage to the Federal
budget
2005/06 30044.4 7832.81 26.07
2006/07 35444.7 9879.7 27.87
2007/08 43947.7 14261.22 32.45
2008/09 54277.9 17438.3 32.13
2009/10 64508.4 20932.96 32.45
2010/11 77228 24000.2 31.33
2011/12 117810.3 31393.4 26.65 15 billion 12.73
2012/13 137000. 8 36000.5 26.4 20Billion 14.51
2013/14 154903.3 43051.56 27.8 15billion 9.7
SOURCE: The Federal government’s budget proclamations for the respective years (1998-2006EC)

177
Inter-governmental Transfers and the Problem of Imbalances in Regional Development: The Need for a Human Rights Approach
179
Table 3. Percentage share of federal grant to each region –1993-2011/12
Regions
Fiscal Years
1993/4 1998/9-2000/01
2001/2 2006/7-2010/11
2011/12 2014/15
Tigray 10.58 7.61 7.68 7.58 7.18 Afar 4.92 6.85 4.72 3.81 3.15 Amhara 20.09 21.80 21.58 23.16 23.17 Oromiya 32.25 27.34 30.14 32.25 32.50 Somali 3.09 9.00 7.33 6.72 8.14 Benishangul-Gumuz 3.29 4.76 3.68 2.62 2.10 SNNPRs 15.85 16.07 17.95 19.13 20.10 Gambella 2.77 3.97 2.80 1.92 1.50 Harari 0.83 1.76 1.49 1.24 1.00 Addis Ababa 6.27 0.01 0.85 0.0 0.00 Dire Dawa 0.06 0.82 1.78 1.56 1.16
SOURCE: MFED 2012b; HoF 2007; HoF 2012
In the theory of fiscal federalism, it is usually argued that horizontal imbalances should be addressed by equalization transfers through the use of general as well as conditional grants (Shah 2007; Ter-Minassian 1997). To achieve the purpose, there must be a desired response from all levels benefiting from the use of the grants. The spending of grants should aim at promoting the socio-economic rights and citizens should also exercise their civil and political rights to ensure that the grants will be spent for the intended purposes. This implies that civil and political rights should be exercised in an integrated manner with socio-economic rights.9
Theoretical discussion Benchmarking in a federal system Introduction The concept of benchmarking originated in the private sector and has taken various forms. It can be classified into internal or external, strategic or operational, performance or competence, and it can be explained in a broader or 9 For further details on the interrelatedness of human rights, see below the section which discusses the principles of HRA

178
Solomon Negussie
180
narrower sense (Watson 1994:5-10). In its broader sense, benchmarking is understood as a comparative measurement of performance which is used as an ‘assessment tool’. But in its narrower sense it means the use of comparative performance measurement ‘as a tool for identifying and adopting more efficient or effective practices’ (ibid:5). In this sense it is used as a ‘learning tool’. Whether benchmarking is done in its loose or strict sense or in an internal or external form, ‘the evident value of performance comparison, identification of best practice and commitment to learning and improvement makes benchmarking an attractive proposition for the public sector as for the private’ (ibid:6). However, benchmarking in the public sector is not driven by profit and improving efficiency is not merely targeted to quantitative output but to impact the process as well. Benchmarking as a means to enhance the performance of governance in a federal system has received greater interest in recent years (Fenna and Knüpling 2012). As each federation is unique in many respects, benchmarking can be used to increase the quality of governance within the particular form of government. Federalism is an opportunity to test various policy options to remedy various challenges such as asymmetry between states or local governments in the socio-economic development of their societies (what is called ‘laboratory federalism’). With regard to the relationship between federalism and benchmarking, Alan Fenna argues that ‘both are about utilizing multiple experiences to identify better ways of doing things; and formalized benchmarking may offer ways to harness the policy learning potential of federalism’ (Fenna 2010:11). Benchmarking enables each sphere of government and the citizens to compare the performance of one government against the other within a federation and devise appropriate mechanisms to enhance better performance.
Benchmarking in inter-governmental fiscal relations
One of the challenges related to inter-governmental transfers is the asymmetry between the regional or local governments in terms of discharging expenditure needs, the capacity to raise revenue, and the level of infrastructures and socio-economic services – in general the level of development. The horizontal disparity is attributed to several causes, but the difference in performance below their potential has significant impact. If regions or local governments depend too much on grants, such grants could lead to ‘fiscal dependency’ and may undermine local accountability. Incidences of dependency normally entail inefficiency leading to development asymmetry among regional or local governments. Such tendencies could over time lead to fiscal conflicts especially in cases where some regional governments feel that they are the major source of national revenue and the others are dependent on their sources. Moreover, as Spahn argues, dependency can aggravate fiscal rivalries between different

179
Inter-governmental Transfers and the Problem of Imbalances in Regional Development: The Need for a Human Rights Approach
181
factions of the population (Spahn 2008:51). A good system of inter-governmental fiscal transfers is crucial for both political stability and economic development of a country. If fiscal conflicts are elicited from inefficiency, benchmarking the fulfillment of socio-economic rights through a rights based approach is relevant. Thus, benchmarking helps in identifying various mechanisms of doing things better. Some of these mechanisms are discussed below.
First, learning from each other: As has been explained in the preceding section, benchmarking enables an enterprise or institution to engage in a comparative assessment of performance to draw lessons of ‘best practices’. In a federal system, each constituent unit of a federation ‘can act like improvement-seeking enterprise, perpetually gauging their performance against fellow governments and incorporating lessons of experience’ (Fenna 2010:11). Such an approach is expected to create an opportunity for governments to focus on, for instance, identifying various ways of efficient service delivery. In this regard, the best option would be if governments voluntarily enter into benchmarking through forums of inter-governmental relations (IGR)10 and set their targets on how to enhance learning outcomes. Particularly, with regard to inter-governmental transfers, learning the actual reason for regional disparities and designing the remedies for narrowing the development gap among the regions could be one the advantages of benchmarking. Further, it can help to identify the problems attributed to institutional inefficiency and lack of resources.
Second, collaboration for better performance: As a result of division of power, sub-national governments are primarily accountable to their electorate not to the federal government. Normally, sub-national governments are expected to fulfill the priorities of citizens and remain accountable to them in their jurisdictions. But it may not bring about the intended results due to limited fiscal or administrative capacity. In many federations ‘there is a constructive role for the central government in encouraging experimentation, promoting and coordinating comparative performance measurement, and facilitating learning’ (Fenna 2010:12). But the most widely accepted approach is developing collaboration through inter-governmental forums which have effective frameworks, instruments for performance monitoring, evaluating the causes and degree of asymmetry, and designing proper legal, institutional and technical instruments. For instance, recently many countries are engaged in benchmarking and implementing ‘fiscal responsibility laws’ towards ensuring fiscal discipline at all levels (see Lui and Webb 2011). 10 IGR refers to various forms of interactions between the federal, regional and sub-regional levels of government. One example in Ethiopia is the joint forums of Federal and Regional Revenue Administrative Authorities to enhance their revenue collecting capacity

180
Solomon Negussie
182
Human rights approach (HRA): concepts and principles Introduction Recently, the works of human rights advocates, academicians, donor communities and international institutions, have featured a commitment to link development with the human rights-based approach (Twomey 2007: 45; Sengupta 2007: 9). This is after the adoption of the UN Declaration on the Right to Development on Dec.4, 1986, and the consensus among member states affirming the right to development as a human right at the 1993 Vienna Second UN World Conference on Human Rights.11
The 1986 Declaration on the right to development adopted by the UN General Assembly defines development as ‘a comprehensive economic, social, cultural and political process, which aims at the constant improvement of the wellbeing of the entire population and of all individuals, on the basis of their active, free, and meaningful participation and in the fair distribution of benefits resulting there from’ (UN 1986: Para2). Development as articulated in the Declaration refers to participation in development and equitable distribution of benefits to all, which according to Sengupta (2007;11), are the two main characteristics of a right-based approach consistent with human rights standards. It is also widely argued that the definition covers all areas of life such as health, environment, housing, education, distribution of resources, enhancement of people’s capabilities, and widening of people’s choices (Twomey 2007:48). Thus, development appears to be a composite of economic, social, cultural, civil and political human rights, which are embodied in the contents of important international human rights conventions.12 According to Twomey (ibid:49), the human rights approach ‘seeks to ensure that human rights are a central frame of reference in policy-making and political choices by ensuring people have the political, institutional, and material means to demand, exercise, and monitor their human rights, and to participate actively in decisions-making process.’ The HRA differs from the traditional definition of development which was understood primarily in terms of economic growth. The human rights approach requires the process of development to be carried out in a manner consistent with human
11 Various studies on HRBA have been developed by UN Agencies and other scholarly works. See for instance, Marks and Andreasan 2007 12 Civil and political rights are embodied in the UDHR- Universal Declaration on Human Rights, and political rights in the ICCPR-International Convention on Civil and Political Rights; social and cultural rights are found in the ICESR-International Convention on Economic Social and Cultural Rights; and participation and non-discrimination are included in the CRC-Child Rights Convention; CEDAW-Convention on the Elimination of Discrimination Against Women. Ethiopia is a party to these conventions.

181
Inter-governmental Transfers and the Problem of Imbalances in Regional Development: The Need for a Human Rights Approach
183
rights standards. By definition, therefore, the human rights approach gives emphasis to the processes as well as the outcomes of development policies and programs.
The link between HRA and development got international commitment through the introduction of the MDGs program which was unanimously adopted by UN member states in 2000. This program required strong commitment from the international community as a whole for its fulfillment, and the developing countries were expected to integrate the HRA in their strategies and programs to achieve the goals (Schmidt-Traub 2009). The principles which form the core of the human rights approach are interdependence of rights, participation, accountability, and non-discrimination and prioritization of marginalized groups.
Principles of HRA Interdependence of rights Although the study of human rights has been predominantly focused on civil and political rights, through time it has evolved to embrace policies, guidelines and commitments for the realization of economic, social and cultural rights (Ishay 2004). Using UDHR as a philosophical underpinning, several international human rights instruments (such as ICCPR, ICESCR, CEDAW) have been adopted which later on were tuned to the advancement of the human rights-based approach to development –for the fulfillment of economic, social and cultural rights. Albeit categorizing human rights13, the Vienna Declaration (1993) recognized that human rights are universal, inalienable, interrelated and interdependent. While discussing the indivisibility of human rights in relation to poverty reduction strategies, the UN Office of High Commissioner for Human Rights (2006: Para27) asserted that:
Although poverty may seem to mainly economic, social and cultural rights, the human rights framework highlights the fact that the enjoyment of these rights may be crucially dependent on the enjoyment of civil and political rights. The human rights approach thus dispels the misconception that civil and political rights and freedoms are luxuries relevant only in relatively affluent societies, and that economic, social and cultural rights are merely aspirations and not binding obligations
Civil and political rights are important not only because enforcement requires substantial government expenditure but also because they guarantee citizens’ participation in the prioritization and implementation of government 13 Human rights are categorized into civil, political, economic, cultural and social; Sometimes (though outdated) they are categorized into first, second and third generation rights, or into positive and negative rights.

182
Solomon Negussie
184
expenditure. This obligation requires the government to ensure that rights are fully enjoyed, whether through adopting appropriate legislative, administrative, budgetary, judicial or other measures (Tewomy 2007:47). Particularly, government compliance with the obligation to enforce economic, social and cultural rights requires not only to respect these rights but also to appropriate public funds to fulfill these rights. The interrelationship between the rights implies that the enjoyment of a particular right depends on the level of realization of the other rights.
Participation The participation of citizens in public affairs is a hallowed principle of HRA and is the basis of democracy. Public participation is commonly understood in a broader sense to encompass transparency, openness, and voice in both public and private spheres (Stiglitz 2002:166).14 Participation is important not only for the fact that it is a means for political legitimacy, but it is also a practical necessity of public administration. As J. Stiglitz points out, ‘participation does not refer simply to voting. [A] participatory process must entail open dialogue and broadly active civic engagement, and it requires that individuals have a voice in the decisions that affect them’ (ibid: 165). Of course, one may argue that a freely elected government cannot be required to establish and consult participatory mechanisms for each and every one of its decisions (Bengoa 2005:3). But the experiences in many countries have shown that the decisions of public authorities in a democratically elected government have over time significantly affected the interests of a number of citizens or undermined the interests of minorities (Addink et al 2010:65-66).
Highlighting the importance of participation, the 1986 UN Declaration on the Right to Development (Preamble, Para2) stated that ‘the process of development must be genuinely participatory, promoting the active, free and meaningful participation of the entire population and of all individuals.’ Thus, the right to participation is strongly dependent on the realization of other human rights such as freedom of expression, freedom of information, the right to association, and the right to assembly. These are the platforms that ensure the informed and active participation of individuals and groups in relation to the formulation, implementation and monitoring of the consequences of inter-governmental fiscal relations in general, and in prioritizing expenditures at all
14 Jose Bengoa (2005:3) said “If participation is understood as nothing more than ‘consultation’, this is called ‘passive participation’. People are consulted on decisions taken earlier by authorities. ‘Active participation’ refers to the entire decision-making process, from project design to implementation, follow up, oversight and evaluation.”

183
Inter-governmental Transfers and the Problem of Imbalances in Regional Development: The Need for a Human Rights Approach
185
levels of government. As the same Declaration on the Right to Development stated above (Art 2/3) put it, ‘active, free and meaningful participation requires significant community involvement to ensure that there is a fair distribution of the benefits of development and not for a particular segment of the population’. Thus, social participation is important to ensure appropriate and transparent utilization of resources.
Accountability The concept of accountability can be analyzed broadly or narrowly. It can also be analyzed in terms of political, social, financial, administrative or legal accountability, and in terms of internal or external accountability (Addink 2010:95-100). Accountability in the human rights sense is about translating commitment into action for the benefit of citizens. This creates a relationship where government at all levels becomes duty bearer with respect to the rights of citizens within the respective jurisdiction (Sengupta 2006). The government’s duty to fulfill the rights of citizens can be controlled through political, fiscal, administrative and legal accountability. Accountability creates a legal relation between right-holders and duty-bearers whereby the duty-bearers will be answerable for their failures in relation to their duties. When it comes to government spending, accountability requires strengthening institutional mechanisms for effective, transparent and accessible government decisions and ensuring effective community participation.
Non-discrimination and empowerment of marginalized groups The human rights approach requires non-discrimination and empowerment of vulnerable and marginalized groups. Giving access to marginalized and vulnerable groups to public decisions is also an important aspect of participation. These groups include women, minorities, indigenous peoples and peoples with disabilities, but there is no universal checklist of who is most vulnerable in a given context (Hansen and Sano 2006:50). Who is vulnerable and how one answers the question at national and local level is usually a challenge. This is because the answer depends on available official data, disaggregated by race, religion, language, sex, age, migrant or other status. Discrimination is often caused by political, social, cultural or institutional practices. Federalism is usually adopted to redress the problem of discrimination and to protect minorities at national or local levels.
184
Solomon Negussie
186
Principles of HRA in Ethiopia: benchmarking and implications
Human rights norms in Ethiopia The Constitution of the Federal Democratic Republic of Ethiopia (FDRE) provides robust provisions of civil and political rights the contents of which are more or less in line with international recognized conventions. Moreover, under its supremacy clause (Art 9/4), the constitution provides that all international treaties ratified by Ethiopia are an integral part of the law of the land.15 It further incorporates provisions for the protection of economic, social and cultural rights (Art 41), and the right to development (Art 43). The National Policy Principles and Objectives enshrined under Articles 89 and 90 add emphasis to this protection by requiring any government organ at Federal and regional level to develop policies that ensure the enjoyment of these rights by citizens. The economic objectives (Art 89/1 and 2) dictate that the government has the duty to, among others, formulate policies that ensure equal benefit from the country’s legacy of intellectual and material resources, and ensure equal opportunity for all to improve their economic conditions. The social objectives provide all Ethiopians access to public health and education, clean water, housing, food and social security to the extent the country’s resource permit (Art 90). The constitutionally guaranteed rights and principles should play a significant role in the prioritization and implementation of budgets acquired through inter-governmental transfers.
The need for a meaningful participation The Federal Constitution (Art 89(6,7) affirms ‘government shall at all times provide the participation of the people in the formulation of national development policies and programs; shall have the duty to support the initiation of people in their development effort; shall ensure the participation of women in equality with men in all economic and social development endeavors.’ It also guarantees those rights and freedoms relevant for the effective participation of individuals and groups in general such as freedom of expression, freedom of association, right to assembly (Art 29,30,31).
At the sub-national level, regional, zonal, wereda and kebelle structures bring government closer to the household level. In most of the regions, there are also sub-kebele structures such as atbias, one to five –and leamist-arrangements, and mass-based associations (women, youth, farmers, workers) which are
15 As to the status of international human rights instruments in Ethiopia and the issue of justiciability, see Sisay Yeshanew (2008)

185
Inter-governmental Transfers and the Problem of Imbalances in Regional Development: The Need for a Human Rights Approach
187
alleged to be affiliates to the ruling party – EPRDF.16 It is also argued that such forums are primarily used to ensure implementation without dissent at every level of government (See Emmenegger, Keno & Hagmann 2011; Human Rights Watch 2010). Besides the Constitution, there are several legal and policy documents to increase the participation of disadvantaged groups such as women, children, disabilities, etc. (see National Youth Policy 2004; National Policy on Women 1993; Disability plan 2011). For instance, women associations are found at all levels in Ethiopia. However, their participation at the local level to influence policies or expenditure priorities is not meaningful. Yilmaz and Venugopal (2008:8) found that ‘women’s participation in community planning and decision making was found to be almost non-existent. Women were not equally represented with men at community discussions, especially at local community initiatives’
Accountability and monitoring mechanisms It is indicated above that the government’s duty to fulfill the rights of citizens can be monitored through various political, administrative, fiscal and legal instruments. Political accountability in Ethiopia is related to the decentralized governance structure where federal, regional and wereda levels have executive, legislative and financial powers. The letter of the law ensuring accountability through a ‘check and balance’ mechanism is clear, but its implementation seems compromised at all levels. One can easily observe lack of exercises of power of oversight and control by the legislature over the executive.17 Similarly, sub-regional level structures have forums for ensuring social participation in order to promote public accountability. But periodic assemblies held in kebeles or weredas are meant to enforce decisions or programs designed and directed from higher authorities. Yilmaz and Venugopal (2008: 12) argue that ‘cases where the kebele community tries to hold the kebele or wereda authorities accountable for service delivery are rare.’ Further, it is widely observed that corrupt practices related to urban land, government procurement, financial spending, civil service employment are some of the serious concerns of accountability. Many studies (Plumer 2012, Transparency International 2012) have shown that the manifestation of corruption implies weakness in public accountability and it has become a serious social problem.
16 The main opposition party, Andinet, in public rallies it recently held in Addis Ababa and in some regions openly criticized the government using these forums to silence the public. 17 For instance, recently the speaker of Parliament was on television interview to challenge the public perception that legislature is inferior to the executive
186
Solomon Negussie
188
Accountability is especially relevant to inter-governmental fiscal relations. If inter-governmental fiscal relation is also meant to ‘build one economic community’ or if its purpose is also to build solidarity among the constituent units, there should be separate and collective accountability. As Abu (2013:11) argues, ‘unless the consolidated government sector exercises fiscal discipline and limit the disincentive effects of excessive taxation, it would have adverse effects on the performance of the economy and on macroeconomic stability.’
Lack of financial accountability has emerged as one source of fiscal conflicts in many federations (Spahn 2008). In Ethiopia, although the legal instruments to ensure internal and external fiscal accountability are in place, there are serious concerns of financial mismanagement at all levels.18 With regard to local government plans and spending, one study has shown that financial accountability is weak because of ‘lack of clear budget preparation, lack of link between strategic plans and performance agreements, and lack of a formal review of activities in the strategic plan by the weredas’ (Yilmaz and Venugopal). The commitment incorporated in the Constitution requires the government to translate it into practice in order to ensure proper accountability to the public.
Non-discrimination and empowerment of marginalized groups Equality and non-discrimination are guaranteed under the Federal Constitution and have become very much relevant in inter-governmental fiscal relations. As part of economic, social and cultural rights, the Constitution (Art 41/3,5) recognizes that ‘every Ethiopian national has the right to equal access to publicly funded social services; the state shall, within available means, allocate resources to provide rehabilitation and assistance to the physically and mentally disabled, the aged, and to the children who are left without parents’. The Constitution (Art 89/3,4) also provides that the government shall ensure that all Ethiopians get equal opportunity to improve their lives, and it shall provide special assistance to nations, nationalities and peoples most disadvantaged in terms of economic and social development. In an effort to use objective criteria, the above principles have been included in the recent grant formulas. Additionally, laws have been issued to support less developed regions (and pastoralist areas).19 However, it is not clear whether government budgets at all levels are allocated to fulfill policies
18 For instance, the Federal Auditor General Report to the House of Peoples representatives, May 2013 19 See, Council of Ministers Regulation No. 103/2004 to Establish the Federal Board to Provide Affirmative Support for Less Developed Regions.

187
Inter-governmental Transfers and the Problem of Imbalances in Regional Development: The Need for a Human Rights Approach
189
aimed at avoiding non-discriminatory practices against women, children and the disabled. That is why explicit reference to a human rights approach is necessary.
Why benchmarking HRA: additional remarks In the preceding sections it was pointed out that HRA developed as a means to impose legal and moral obligations on governments to enforce the full spectrum of economic, social, cultural, and political rights. The following section discusses the values that can be added through adopting the human rights approach in Ethiopia.
To promote the fulfillment of socio-economic and political rights in an integrated manner Several government reports (MFED and UN 2013)20 and some donors (see World Bank 2011) have indicated that Ethiopia has shown a lot of progress in the economic, social and cultural fields, although the UNDP Human Development Index (HDR 2013) still ranks her at the bottom of the list (173 out of 186 countries). The government claims that the country is said to have one of the fastest growing non-oil economies in Africa with a more than 10 percent annual growth record (though the figure is contested) (MFED 2013) . She is even tipped to fulfill many of the MDGs by 2015, especially in improving primary health service coverage, securing universal access to primary education, improving maternal health care and reducing child mortality.21 In terms of expansion of infrastructure such as roads, telecom and energy, the government claims significant growth (ibid) . Food security has increased and the number of people living below the poverty line has decreased from 38.7 to 29 percent (MFEDa 2012). Overhauling the tax system and increasing the administration capacity is also another area of improvement (MFED 2013).22
20 Also see MFED and UN Country Team Ethiopia. 2012. Assessing Progress Towards MDGs: Ethiopia MDGs Report 2012. Addis Ababa 21Capital News Paper. ‘Child Survival Ethiopia Meets MDG4’ http://capitalethiopia.com/index.php?option=com, accessed on Tuesday, 17 September 2013; UNICEF, ‘Ethiopia Commits to Meet MDG in Water and Sanitation by 2015,’ www.unicefethiopia.wordpress.com/2014ethiopia-commits-to-meet-millenium-development-goals-in-water-and-sanitation-by-2015/, accessed April 20,2014; But still there is a problem in terms of quality distribution of services, retention of children in the school, eradicating extreme poverty 22 For details, also see FDRE Government Communication Affairs Office. 2010. Annual Book –Ametawi Mestehaf . BSPP, Addis Ababa, 2010.

188
Solomon Negussie
190
Owing to these achievements, one may ask what objectives will be achieved by using the human rights approach. Of course, in a country like Ethiopia, economic growth by itself is an achievement, however, care has to be taken not to undermine the importance of the human rights approach which gives emphasis to the process of development as well. Moreover, the utilization of grant subsidies and revenue sharing did not bring about comparable levels of development among the regions (Tegegn et al 2010). As indicated in the earlier section, the implementation of the principles of HRA, which are very much linked to civil and political rights, are constrained. The country was also classified as ‘less free’ by many international institutions (See Freedom House 2011; Human Rights Watch 2010; The Economist Intelligence Unit 2010). Thus, less commitment to the process of development may imply that there is a tendency to prioritize economic growth as against freedom - an argument presented by those who see Singapore and Korea (before the 1990s) as models of authoritarian developmental state (Thornton 2008: 41-43).23
The practical implication of the above argument seems to favor the standpoint that economic growth (and poverty alleviation) must be secured before civil and political rights are enforced. However, this argument contradicts the principles of HRA. This is because the full realization of political rights is an important component of the principle of HRA. Furthermore, a claim by the ruling party - EPRDF – that it follows (at least on paper) a ‘democratic developmental state’ implies that it is committed to both economic growth and democratic ideals in an integrated manner. Such a claim may not contradict the argument which emphasizes the interdependence between the socio-economic rights and civil and political rights, i.e. the level of realization of socio-economic rights depends on the enjoyment of civil and political rights. That is why Amartya Sen, in his seminal work on development, put the perspective on freedom, emphasizing ‘an integrated analysis of economic, social and political activities, involving a variety of institutions and many interacting agencies’ (Sen 1999: xii). He stressed the inherent interrelatedness of freedom and economic development. He further emphasized that economic growth and social welfare can better be addressed through a more democratic system, and democratic accountability is an incentive to avert famine and related catastrophes.
23 According to Thornton and Thornton, Singapore under Lee Kuan Yew and South Korea under General Park Chung Hee and Chun Doo-hwan were not only considered as developmental state but also authoritarian regimes.

189
Inter-governmental Transfers and the Problem of Imbalances in Regional Development: The Need for a Human Rights Approach
191
To enforce autonomy within accountability The political rationale of self-rule in a federal system took the very assumption that sub-national governments have legislative and administrative autonomy to set priorities in light of local preferences and to allocate revenues accordingly. Thus, defining the roles and responsibilities of various levels of government is a step towards establishing responsible and accountable public governance at all levels. The fundamental principle is that political, administrative and fiscal autonomy have to be exercised by each level of government. However, various studies have concluded that the autonomy of sub-national units under the Federal system in Ethiopia is undermined due to centralized policy making by a dominant ruling party (Merera 2002; Paulos 2007; Meheret 2007, Assefa 2012). Many policies generated at the Federal level (such as civil service reform, water preservation projects, condominium constructions) have been implemented in the regions without local considerations. Inter-governmental fiscal relation is also highly dependent on the Federal government. In general, policies and projects designed at the Federal level have become blue prints at regional and sub-regional levels. This undermines the decision-making power at sub-national levels. As Assefa (2012:458) argues, democratic institutions which are expected to reflect the will of the people and to ensure accountability are reduced to ‘approval of party programs and party nominees.’ In short, the autonomy of sub-national governments is severely limited, creating upward accountability which renders local institutions of participation and accountability ineffective. By implementing the principles enshrined in the Constitution, sub-national governments should be autonomous and citizens should be able to constrain the behavior of public authorities.
To improve governance and service delivery In a federal system, government institutions are not only important for discharging day-to-day responsibilities, but are also important for maintaining stability. In relation to this, using a human rights framework can improve the performance of governance in general and the delivery of services in particular. It can strengthen accountability in various ways, and sharpens aspects of planning and evaluation through participation. It can help governments to identify and address inequity and promote non-discriminatory practices more effectively. This is because ‘human rights standards have the force and precision of law, and the framework offers distinctively precise legal and political instruments for measuring performance and achieving change’ (ICHRP 2005:6). In short, it can improve performance in distinctive ways. For instance, first, prioritizing expenditure needs and allocating budgets for economic decisions should be scrutinized from the perspective of human rights. Budget review from
190
Solomon Negussie
192
a human rights perspective can in fact help elected representatives and officials to assess the consequences of their decisions and assist in allocating resources in a non-discriminatory manner. Second, it is necessary to integrate budgeting with human rights so that in the end the performance of the budget vis a vis the progress of achievements in service delivery can also be measured (Dikono 1999). Third, human rights recognize the possibility that power can be abused by those in authority. It therefore applies safeguards, such as participation and accountability, at local as well as national levels to guarantee human dignity, prevent competition for power and constrain abuses of power for personal gain.
Conclusion Devolution of power, individuals and groups as right holders, empowerment of marginalized groups and participation, equitable distribution of resources, efficiency and accountability are some of the principles emphasized in the Constitution which gives prominence to the relevance of respecting the human rights approach to development. In general, the human rights approach is an indispensable component of deepening democracy and development. It offers an approach to move from basic electoral democracy to embracing government accountability and participation of citizens in development programs. In particular, it has the potential to foster pro-poor development efforts and it plays a role in securing good governance in every sphere of government. The scope and purpose of this study is limited to showing the legal obligations and the practical importance of benchmarking HRA. It analyzed the normative principles of the right- based approach and its practical significance to the proper utilization of intergovernmental transfer in an effort to reduce regional imbalances. In doing so, it imposes obligation on governments to maintain transparency, accountability, non-discrimination and equitable distribution of resources. It also implies the relevance of benchmarking HRA in developing policies and programs, and improving efficiency and institutional development. However, there is a need for caution: promoting the human rights approach does not imply that it is a panacea for all governance and development efforts. Rather, by respecting, protecting and fulfilling the rights as guaranteed by the Constitution, the quality of governance can be improved thereby making development sustainable.

191
Inter-governmental Transfers and the Problem of Imbalances in Regional Development: The Need for a Human Rights Approach
193
References
Abu Girma. 2013. Fiscal Federalism in Theory and Practice. Ethiopian e-Journal, Vol.5 No.1:6-32
Addink, Hekn et al. 2010. Human Rights and Good Governance. SIM special No. 34: Utrecht
Ahmad, Ehtisham and Jon Craig. 1997. Intergovernmental Transfers. In Fiscal Federalism in Theory and
Practice, edited by Teresa Ter-Minassian, Washington DC.: International Monetary Fund, 73-107.
Assefa Fiseha. 2012. Ethiopia’s Experiment in Accommodating Diversity: 20 Years’ Balance sheet. Regional & Federal Studies, 22:4, 435-473
Bengoa, Jose. 2005. Participation, Development and Human Rights, working Paper, UN Commission on Human Rights, E/CN.4/sub.2/SF/2005/3
Capital Newspaper. Child Survival Ethiopia Meets MDG4’ http://capitalethiopia.com/index.php?option=com, (accessed 17 September 2013) CEDAW – Convention on the Elimination of Discrimination Against Women. CRC – Child Rights Convention Dereje Feyissa. 2011. Aid negotiation: the uneasy “partnership” between EPRDF
and the donors. Journal of Eastern African Studies, 5:4, 788-817 Diokon, Maria Socoro I. 1999. A Right-based Approach Towards Budget
Analysis. International Human Rights Internship Program: Quezon, Philippines Emmenegger, Rony, Sibilo Keno & Tobias Hagmann. 2011. Decentralization to
the household: expansion and limits of state power in rural Oromiya. Journal of Eastern African Studies,
5:4, 733-754 Eshetu Chole, ed., 1994. Fiscal Decentralization in Ethiopia. Addis Ababa,
AAU Printing Press. Fenna, Alan. 2010. Benchmarking in Federal Systems. Occasional Paper series
No. 6: Ottawa: Forum of Federations Fenna, Alan and Felix Knüpling. eds. 2012. Benchmarking in Federal Systems:
Roundtable Proceedings. Commonwealth of Australia: Forum of Federations
FDRE. 1995. Constitution
192
Solomon Negussie
194
FDRE. Proc. No. 251/200, A proclamation to Consolidate the House of Federation of the FDRE and to Define its Powers and Responsibilities, Federal Negarit Gazette, 7th year No. 41, 6th July 2001
FDRE, Ministry of Finance and Economic Development. 2012. Ethiopia’s Progress Towards Eradicating
Poverty: An Interim Report on Poverty Analysis Study (2010/11). March 2012, Addis Ababa
FDRE, Government Communication Affairs Office. 2010. Annual Book –Ametawi Mestehaf. BSPP,
Addis Ababa FDRE, Council of Ministers Regulation No.103/2004 to Establish the Federal
Board to Provide Affirmative Support for Less Developed Regions. FDRE, Federal Auditor General Report to the House of Peoples
Representatives, May 2013 Freedom House. 2011. Freedom in the World- Ethiopia 2011. http://www.freedomhouse.org/report/freedom-world/2011/ethiopia (Accessed
September 25, 2013) Hansen, J.K. and H. Sano. 2007. The Implications and Value Added of a Rights-
Based Approach. In Development as a Human Right: Legal, Political, and Economic Dimensions, edited by Stephen P. Marks and B. Andreasan, Cambridge, Mass: Oxford UP
HoF. 2003. Minutes of the 2nd Ordinary Meeting, March 13, 2003. Addis Ababa, HoF Archive
HoF. 2007. The New Federal Budget rant Distribution Formula. Addis Ababa. HoF. 2012. The Federal Budget Grant distribution Formula: 2012/13-2016/17.
Addis Ababa Human Rights Watch. 2010. Development without Freedom: How Aid
Underwrites Repression in Ethiopia. New York: Human Rights Watch ICCPR - International Convention on Civil and Political Rights ICESR- International Convention on Economic Social and Cultural Rights ICERD - International Convention on the Elimination of All forms of Racial
Discrimination International Council on Human Rights Policy (IHRP). 2005. Local
Government and Human Rights. Versoix, Geneva Switzerland: CHRP

193
Inter-governmental Transfers and the Problem of Imbalances in Regional Development: The Need for a Human Rights Approach
195
Ishay, Micheline. 2004. What are Human Rights: Six Historical Controversies. Journal of Human Rights 3:3, 359-371
Jannelle Plumer. ed. 2012. Diagnosing Corruption in Ethiopia: Perceptions, Realities, and the Way Forward for Key Sectors: Washington DC: The World Bank
Liu, Lili and Steven Webb. 2011. Laws for Fiscal Responsibility for Sub-national Discipline
International Experience. The World Bank, Research Working Paper no. 3309 Marks, Stephen P. and B. Andreasan.eds. 2007. Development as a Human Right:
Legal, Political, and Economic Dimensions. Cambridge, Mass: Oxford UP
Meheret Ayenew. 2007. A Rapid Assessment of Wereda Decentralization in Ethiopia. In
Decentralization in Ethiopia, edited by Taye Assefa and Tegegne Gebre-Egziabher, Addis Ababa: Forum for Social Studies, 69-101.
Merera Gudina. 2002. Ethiopia: Competing Ethnic Nationalisms and the Quest for Democracy,
1960-2000. Maastricht: Shaker Publishing MFED. 2010. Growth and Transformation Plan (GTP) Vol I Main Text: Addis
Ababa MFEDa. 2012. Ethiopia’s Progress Towards Eradicating Poverty: An Interim
Report on Poverty Analysis Study (2010/11). MFED, Addis Ababa MFEDb. 2012. Revenue and Expenditure Distribution of the Regions: 2006/7-
2010/11. Department of Macroeconomics, December 2012 MFED. 2013. Annual Progress Report for F.Y. 201/12 Growth and
Transformation Plan. Addis Ababa. MFED and UN Country Team Ethiopia. 2012. Assessing Progress Towards
MDG: Ethiopia MDGs Report 2012. Addis Ababa National Youth Policy, FDRE. 2004 National Policy on Women, TGE. 1993 National Disability Inclusive Plan, FDRE. 2011 Paulos Chanie. 2007. What one Hand Giveth the Other and Taketh Away:
Ethiopia’s Post-1991 Decentralization Reform Under Neo-Patrimonialism. Netherlands: Shaker Pub
Schmidt-Traub, Guido. 2009. The Millennium Development Goals and human rights-based approaches: moving towards a shared approach. The International Journal of Human Rights, 13:1 72-85

194
Solomon Negussie
196
Sen, Amartya. 1999. Development as Freedom. Random House, New York Sengupta, Arjun. 2007. The Human Right to Development. In Development as a
Human Right: Legal, Political, and Economic Dimensions, edited by Stephen P. Marks and B. Andreasan: Cambridge, Mass: Oxford UP
Shah, Anwar. ed. 2007. The Practice of Fiscal Federalism: Comparative Perspective. Montreal: Forum of Federation, MQUP
Sisay, Yeshanew. 2008. The constitutional Protection of Economic, Social and Cultural Rights in the Federal Democratic republic of Ethiopia. Journal of Ethiopian Law, vol 22, no.2
Solomon Negussie. 2008. Fiscal Federalism in the Ethiopian Ethnic-based Federal System. WLP, Nijmegen.
Spahn, Paul B. 2008. Managing Fiscal Conflicts. In Emerging Issues in Fiscal Federalism, edited by Ron Wattts and Rupak: Forum of Federations; Viva Books, New Delhi: 51 -76
Stigltiz, Joseph. 2002. Participation and Development: Perspective from the Comprehensive Development Paradigm. Review of Development Economics, 6 (2): 163-182
Taye Assefa and Tegegn Gebre-Egziabher.eds. 2007. Decentralization in Ethiopia. Addis Ababa: Forum for Social Studies
Tegegn G/Egziabher et al. 2010. Federal Block Grant and Regional Socio-Economic Development in Ethiopia: 1995-2008. A report Submitted to the House of Federation: Addis Ababa
Tegegn G/Egziabher and Kassahun Berhanu. 2007. A literature Review of Decentralization in Ethiopia.
In Decentralization in Ethiopia, edited by Taye Assefa & Tegegne Gebre-Egziabher, Addis Ababa: Forum for Social Studies
Ter-Minassian, Teresa. 1997. ‘Intergovernmental Fiscal Relations in a Macroeconomic Perspective: An Overview.’ In Fiscal Federalism in Theory and Practice. Edited by Teresa Ter-Minassian, Washington DC.: International Monetary Fund, 3-24.
TGE, A proclamation to Provide for the Establishment of National/Regional Self-Governments,
No.7/1992, Negarit Gazeta, 51st year No. 2, Addis Ababa, 14th January 1992. The Economist Intelligence Unit. 2010. Democracy Index 2010: Democracy in
Retreat. Quoted in

195
Inter-governmental Transfers and the Problem of Imbalances in Regional Development: The Need for a Human Rights Approach
197
Abebe, A. 2012. Rule by law in Ethiopia: Rendering constitutional limits on government power nonsensical’, CGHR Working Paper 1, Cambridge: University of Cambridge Centre of Governance and Human Rights, p. 3
Thornton, Songok Han and William Thornton. 2008. Development without Freedom: The Politics of
Asian Globalization. Aldershot: Ashgate pub Transparency International. 2012. http://www.transparency.org/country#ETH
(accessed September 25, 2013) Twomey, Patrick. 2007. Human Rights-Based Approaches to Development:
Towards Accountability. In Economic, Social and Cultural Rights in Action, edited by Mashood A. Badrin and R. McCorquodale: Oxford: Oxford Univ. Press:. 45-69
UDHR - Universal Declaration on Human Rights UN. 1986. Declaration to the Right to Development. General Assembly Res
41/128, 4 Dec 1986 UN. 1993. Vienna Declaration and Program of Action. Adopted by World
Conference on Human Rights, UN Doc. A/CONF. 157/23 UN Office for High Commissioner for Human Rights (UN,OHCHR). 2006.
Principles and Guidelines for a Human Rights Approach to Poverty Reduction Strategies, (HR/PUB/06/12)
UNDP. 2013. Human Development Index (HDR 2013) UNICEF Ethiopia. 2014. Ethiopia Commits to Meet MDG in Water and
Sanitation by 2015. www.unicefethiopia.wordpress.com/2014ethiopia-commits-to-meet-millenium-
development-goals-in-water-and-sanitation-by-2015/ (accessed April 20, 2014)
United Nations High Commissioner for Human Rights (UNHCHR). 2006. Prinicples and Guidelines for a Human Rights Approach to Poverty Reduction Strategies. Geneva: Switzerland (HR/PUB/06/12)
Viswanathan, Renuka. 2008. Fiscal Federalism and Regional Equity. In Emerging Issues in Fiscal Federalism, edited by Watts, Ron and Rupak: Forum of Federations, Viva Books: New Delhi,77-102
Watson, George H. 1994. A Perspective on Benchmarking. Journal of Benchmarking for Quality Management & Technology, vol. 1 No. 1: 5-10

196
Solomon Negussie
198
Watts, R. 2002. The Distribution of Powers, Responsibilities and Resources in Federations. In Handbook
of Federal Countries, 2002, edited by Ann Griffiths, ed. Montreal and Kingston: McGill-Queens University Press, 448-471
World Bank. 2011. Ethiopia - Additional Financing for the Second Phase of the Protection of Basic Services Project. Washington, DC: World Bank.
http://documents.worldbank.org/curated/en/2011/01/13711886/ethiopia-additional-financing-second-phase-protection-basic-services-project (accessed August 25, 2011)
Yilmaz, Serdar and Varsha Nenugopal. 2008. Local Government Discretion and Accountability in Ethiopia. Working Paper 08-38: Andrew Young School, Georgia

PART III
THE RURAL SECTOR


203
7 Jeffrey Bookwalter and Peter H. Koehn
Post-dependent Rural Development: Engaging and Assessing Subjective Well-Being Introduction Improving the lives of people should be the primary objective of any post-dependent development strategy and sustainable-development policy. However, defining and assessing life improvement is a challenging and controversial task. Amartya Sen’s work on development (see, for instance, 1999) argues that life improvements are about expanding a person’s functionings and capabilities – things they are able to ‘do’ and ‘be’ -- and their set of available options, respectively.
In this chapter, we are interested in exploring ways to understand what matters in people’s lives and which functionings and capabilities have the highest values in rural Ethiopia through innovative and contextually based assessment methods that are independent of external pressures. As a backdrop to our efforts, we first critique prevailing evaluation approaches. The next section introduces the theory of the “capability set.” This is followed by a discussion of measurable empirical proxies for capabilities and functionings and application of the identified measures using data from rural household surveys in Ethiopia. The final section aims to provide additional insight of value in designing an inclusive post-dependent framework for evaluating rural well-being through a focus on the educational dimension. In many respects, education provides the foundation for advances in human well-being and sustainable development.
Evaluating development
Evaluation generally involves rigorous and systematic collection, analysis, and interpretation of information to answer specific questions. In development contexts, it should provide assessments of what is important, what works, and why in particular situations and provide strategic lessons to guide decision makers and inform stakeholders. Evaluation is carried out for several purposes: shared learning, results improvement, and accountability for outputs, outcomes, impacts, and resources used. As David Mosse (2004) demonstrates with
200
Jeffrey Bookwalter and Peter H. Koehn
204
reference to a rural-development project in India, “success” and “failure” can be policy-validating narratives primarily constructed by powerful “interpretive communities” composed of donors, project managers, and consultants that obscure the actual reasons and contextual relationships that are responsible for outcomes and impacts. Pressure to borrow customized, externally determined, indicators narrows opportunities to conduct contextually based evaluations (Esther Mebrahtu, 2002, p. 510; Rosario Leon, cited in Eyben, 2013, p. 5), reduces the likelihood that empowering processes will be set in motion, undermines efforts to pursue “locally owned and transformative development” (Eyben, 2013, pp. 4-5, 17), and diverts attention from the complexity of interests, relationships, and institutional practices that shape how sustainable development is pursued (Mosse, 2004).
Many prevailing evaluations of development policies, strategies, outcomes, and impacts rely on macroeconomic indicators of well-being. These approaches imply the existence of some universal metric for evaluating well-being and often equate incomes with well-being. Another frequently encountered assumption is that economic indicators are transformed into well-being at the same rate across nations, regions, households, and individuals. Income, in particular, is different from the capability to function at some level. Sen (1999, p. 20) argues that “precisely because income deprivations and capability deprivations often have considerable correlational linkages, it is important to avoid being mesmerized into thinking that taking note of the former would somehow tell us enough about the latter.” In addition, the weight placed on each indicator varies across regions, groups, and individuals, depending in large measure on the particular set of values used in defining and assessing well-being. China, for instance, has moved decisively to expand human capability through public investment in education and health care while, in India, the majority of schools are of low quality and “the poor have to rely on low-quality – and sometimes exploitative – private medical care, because there isn’t enough decent public care” (Sen, 2013).
Donors, including international NGOs, tend to share “a particular understanding of causality, efficiency and accountability” (Eyben, 2013, p. 6). Rosalind Eyben (2013, pp.7-24) provides an insightful critical analysis of the results and artefacts of the development-evaluation methods popular with Northern donors, including logical frameworks, payment by results, randomized-control trials, and cost-effectiveness analysis. Consistent with these “dependent” ways of knowing and claims that only through quantitative research can issues of impact and causality be credibly established (Henry, 2009), some funders favor the use of pre-defined quantitative indicators in development evaluations. However, a number of studies reveal substantial shortcomings in evaluations that are exclusively quantitative. Evaluations are diminished by the frequent selection
201
Post-dependent Rural Development: Engaging and Assessing Subjective Well-Being
205
of inappropriate indicators and “inadequate attention to [and lack of substantiation of] project impacts and outcomes (as compared to inputs and outputs …)” (Chapman and Moore, 2010, pp. 560, 562; also Pain, 2009, pp. 105, 108). Further, the long-term, multidimensional, and interdependent contexts that envelop sustainable-development initiatives complicate efforts “to isolate particular variables and identify specific effects attributable to individual interventions or policies” (Schuller and Desjardins, 2007, pp. 22, 44). Process is critically important and correlations do not explain how sustainable-development connections and results occur (Colclough, 2012, p. 6).
Qualitative outcome and impact measures engage quality-of-life considerations. Individual outcomes are measured in relation to asset building as reflected in “health, family life and social capital” (Schuller, 2004, p. 12; Colclough, 2012, pp. 10-11). These learning assets can be used to generate “social outcomes that benefit others and future generations” (McMahon, 2009, pp. 5, 38). Qualitative investigations emphasize context and culture and illuminate the multiple relationships and processes that shape human capabilities and assets over time (Schuller, 2004, p. 14). Ethnographic inquiries and narrative studies, for instance, uncover key contextual relationships, indigenous and marginalized voices, movement (or lack thereof) toward and pathways to desired social and economic changes, political and institutional connections and incentives that shape prospects for change (Mosse, 2004, pp. 656, 664), and grass-roots impacts that are not fully recognized or revealed by quantitative methods (Schuller and Desjardins, 2007, p. 23; Boydell and Rugkasa, 2007, p. 219).
Ideally, therefore, sustainable-development evaluations need to be broadened beyond externally imposed quantitative measures and global metrics. Social indicators, including the creation of employment opportunities (Tarabini, 2010, p. 209), the reduction of poverty and inequality (Singh, 2007, p. 76; Bailey, 2010, p. 44), and contributions to the strengthening of civil society (McMahon, 2009, p. 34; Schuller and Desjardins, 2007, pp. 68, 88), should receive attention. Who is directly and indirectly better off and worse off (Thabrew, Wiek, and Ries, 2009, p.71) and why?
In this chapter, we explore the application of contextually derived measureable proxies for capabilities and functionings. Inclusion of qualitative methods and indicators facilitates the cross-checking of findings through triangulated perspectives, thereby enriching evaluation as a meaningful explanatory exercise (Stern, 2004, pp. 38-39).
202
Jeffrey Bookwalter and Peter H. Koehn
206
Sen and the capability set Sen has long argued for broad definitions of development and well-being that include not simply access to resources and income, but the sort of lives people manage to live (see for example, Sen 1992). Standard conceptions of most quantitative welfare economics contain only a part of the components of well-being and focus on the choices people and households make. In contrast, well-being depends on functionings – the ability to ‘do’ and ‘be’ certain things – and capabilities – the set of available functionings and the ability to achieve them.
Expanding that notion, lives are comprised of a vector of functionings chosen from a set of feasible vectors, the capability set. While commodities purchased with income certainly are important, these commodities are desired for their ability to add to a person’s ‘being.’ Many other factors, which are less related to income, are also important. For example, it makes more sense from a well-being perspective to look at health outcomes (the ability to be healthy) instead of overall spending on health care. These health outcomes depend on health-care spending, but also the quality of sanitation, the existence of basic health services and infrastructure, and weather events, among others. Thus, outcome depends in part on public goods and other factors the household has little control over, and the choices they make out of the options within their capability set.
In other work, Sen (1999) equates functionings to freedom, and argues that the whole of economic development should be about expanding available freedoms. Some of these freedoms include civil rights, social and economic opportunities, and the ability to be safe (Sen 1999, p. 39). Emphasizing more than just income measures of well-being requires both additional data and a more nuanced understanding of the components of well-being and the ways in which they are combined.
While there are many proponents of Sen’s theoretical treatment of development and well-being, many have argued that his framework is empirically inoperable, in part due to data limitations (e.g. Srinivasan, 1994, Sugden, 1993). The information required for an exploration of functionings, capabilities, and freedoms is certainly more substantial than well-being measures that focus on income or expenditure. However, the World Bank’s Living Standard Measurement Surveys and other recent household surveys provide that information for a growing list of countries. The Ethiopian Rural Household Surveys (ERHS) are a particularly valuable example of the types of household surveys that allow for a more nuanced look at development.
There have been many empirical responses to Sen’s criticisms of traditional, income-based welfare and well-being research. In these analyses of well-being and quality of life, most empirical work adopts a methodology

203
Post-dependent Rural Development: Engaging and Assessing Subjective Well-Being
207
similar to the “Scandinavian Approach” outlined by Erikson and Uusitalo (1987). This methodology emphasizes a component approach, whereby overall well-being is divided into separate measurable indicators. Additionally, it associates the level of living to a broadly defined measure of command over some broadly defined set of resources. These resources include money, property, knowledge, education, rights, freedoms and others “…by which [one] can control and purposely direct [one’s] living conditions.” (Erikson and Uusitalo, 1987, p. 189; emphasis in original). There are numerous studies exploring empirically the notion of well-being and its relationship to various objective and subjective criteria. Allardt (1981) used the Scandinavian Welfare Study to relate basic-needs indicators to dissatisfaction and happiness. He found only weak relationships between particular individual basic-need indicators and well-being. From the weakness of these individual relationships, he argues that there is not a clearly defined path to welfare improvements, that basic-needs components are highly interdependent, and that they all need to be promoted.
Møller and Saris (2001) study the relationship between overall subjective well-being and satisfaction in particular aspects of people’s lives (domain satisfaction) in South Africa. In two separate studies using South African data, Klasen (2000, 1997) explores the relationships between poverty, deprivation, and well-being. In his earlier paper, Klasen (1997) references Sen’s notions that development and well-being are about functionings and capabilities, and ultimately, the freedom to pursue a good life. To this end, Klasen develops a deprivation index using twelve measures, including income and measures of health, safety, transportation, housing, sanitation, and perceptions of well-being, among others. He finds that a broader measure of deprivation identifies a group of particularly deprived people that are missed using simple income or expenditure measures. Klasen (2000) uses a similar model to compare expenditure poverty with more broad conceptions of deprivation. Expenditure poverty measures access to one means of achieving well-being, while a more broad deprivation measure actually examines outcomes directly. While he finds considerable correspondence between the two measures, many of the most deprived would not be identified by expenditure measures alone and may be missed in policy targeting.
The last decade has seen a large increase in the number of papers utilizing measures of well-being or life satisfaction to evaluate development outcomes. Helliwell (2003), for example, uses a large international sample with individual responses to a subjective well-being question (SWB) as a dependent variable in an OLS regression. His analysis includes not only economic indicators, but measures of social integration, religious beliefs, infant mortality, quality of governance, and income relative to the United States. One of his interesting findings is that benefits derived from well-functioning economic and social

204
Jeffrey Bookwalter and Peter H. Koehn
208
institutions are far larger than those that flow from rising individual income or general economic growth.
Bookwalter and Dalenberg (2004) find that modest additions to income or household expenditure in post-apartheid South Africa add little to household perceptions of well-being. They argue that this occurred because small income increases do not allow people to make major changes in the actual conditions under which they live. Similar to Helliwell (2003), they find that the largest contributors to household SWB were things that had a substantial public-good component (e.g., transportation mode and water sources) that were unavailable for purchase without relocating. Findings like these suggest that while income and economic growth matter, a wide range of other non-market factors are at least as important.
Moving from the theory of the capability set to measureable indicators
Sen has chosen not to speculate about what might comprise a comprehensive and universal set of functionings and capabilities. Many others have. Martha Nussbaum, for example, posits a ‘universalist’ list of capabilities with a threshold below which life would be so impoverished as to be inhuman (Nussbaum, 2000). Her list includes things as varied as respect and concern for other species, living to the end of a normal life, and being able to use one’s senses. Others take a ‘basic needs’ or minimum capabilities approach (Streeten, 1991 and Desai, 1995, respectively). These approaches posit some core indicators of capabilities and imply some measurable functionings. For example, Streeten looks in particular at health, education, food security, water supply and sanitation. Desai looks more broadly at the capability to stay alive, to ensure biological reproduction, and to have knowledge and freedom of expression, among others. While Nussbaum’s ideas about a minimally acceptable life are more philosophically grounded, those put forth by Streeten, Desai, and others are more useful for empirical study.
While functionings and capabilities are not something that can be directly observed, many household surveys have questions that provide data on useful proxies. The ERHS surveys individuals and households about their demographic characteristics, livelihood creation, level and type of assets, and agricultural output, among others. In addition, most years have a community questionnaire where community leaders provide information on infrastructure, community amenities, available services, health care facilities, NGO activities, and more. Use of these data is illustrative at this point. The survey covers a subset of only Ethiopia’s rural population and is not a representative sample. The 2009 data used in this paper surveyed nearly 1500 households in 15 different villages across the country, chosen to account for the diversity of farming systems. A

205
Post-dependent Rural Development: Engaging and Assessing Subjective Well-Being
209
full accounting of the villages and sampling methodology is found in Dercon and Hoddinott (2011).
Some analyses of the capability set require a more nuanced understanding of the available data. For example, the ability to be healthy requires adequate nutrition, access to health care providers and facilities, public investment in transportation infrastructure, clean water and sanitation, and freedom from excessive mortality risks at a job or home, among others. The ERHS data provides information on many these aspects, but some make a difference on their own (adequate nutrition) while others matter largely in combinations (transportation infrastructure and health care facilities). Well-being and the Ethiopian Rural Household Survey
The 2009 ERHS provides a detailed statistical snapshot of rural life in Ethiopia and includes measures of income and assets, livelihood creation, educational participation and attainment and many other demographic characteristics. We look in more detail at some of the characteristics of the rural Ethiopian population that are important for our analysis.
Economists look at education as an investment in human capital. A rational household would look at the additional cost of child attending school and weigh that against the current and discounted future benefits of that additional schooling. Despite a strong consensus that returns to most education are high and exceed costs, enrollment rates in rural Ethiopia were quite low at the time of the 2009 survey. However, data from a wide variety of sources, including UNDP and UNICEF show that the trend in enrollment is strongly upward. The most recent data from UNICEF (2001) shows the basic primary school enrollment rates stands at 87 percent, up from less than 50 percent as recently as 1998.
Another factor that matters for our analysis of happiness and well-being is exposure to risk. Rural populations in Ethiopia face numerous risks to income generation and asset levels. For example across multiple waves of the ERHS, Dercon (2002) finds rural Ethiopians reporting substantial risk-related economic hardship.

206
Jeffrey Bookwalter and Peter H. Koehn
210
Table 1. Risk-related economic hardship.
Event Percentage of households reported to have been severely affected in the past 20 years
Harvest Failure 78 Policy Shock 42 Oxen problems 39 Other livestock problems 35 War 7 Crime 3
SOURCE: Adapted from Dercon (2002) The data suggest a large majority of Ethiopia’s rural population finds themselves at substantial risk of falling incomes that arise from a variety of sources. These income risks are something that many rich countries manage to mitigate from much of their populations. A general lack of resources in Ethiopia, and rural Ethiopia in particular, make the social safety net much less safe.
In addition to demographic and economic characteristics, the ERHS and similar datasets ask respondents to evaluate their lives in a number of ways. There are nearly 20 of these subjective evaluation questions in the ERHS. Some get at general happiness and life satisfaction, including:
Question (Q)1. Taken all together, how would you say things are for you these days; would you say you are? Possible answers: Very happy, pretty happy, not too happy.
Q2. Suppose we say that the top of a ladder represents the best possible life for you, and the bottom represents the worst possible for you. Where on the ladder do you feel you personally stand at the present time? Possible Answers: 10, the best possible life, to 0, the worst possible life.
Other questions are intended to provide insight on a person’s absolute or relative economic standing or satisfaction, including:
Q3. (Absolute) Just thinking about your household circumstances, would you describe your household as: Possible Answers: Very Rich, Rich, Comfortable, Can manage to get by, Never have quite enough, Poor, Destitute.

207
Post-dependent Rural Development: Engaging and Assessing Subjective Well-Being
211
Q4. (Relative) Compared to other households in this village, would you describe your household as:
Possible Answers: Richest in the village, Amongst the richest, About average, A little poorer than most, Amongst the poorest, Poorest.
Other survey questions get into specifics of clothing, shelter, or food, ask a household to compare their current situation with the recent or more distant past, or evaluate the household’s ability to withstand social or economic adversity. Using answers to these questions allows us to understand how household characteristics, access to infrastructure, and achievement of basic needs affects individual and household welfare, life satisfaction and happiness.
For our purposes, we are most interested in understanding the responses to the general happiness question (Q1) and the ladder question (Q2). Table 2 shows the answer to happiness question. Table 2. Responses to the happiness question.
Freq. Percent
Pct. Cum. Very happy 4,925
15.29 15.29 15.29
Pretty happy 19,377 60.17
60.17 75.46 Not Too Happy 7,903
24.54 24.54 100.00
Total 32,205 100.00
100.00
Table 3 shows responses to the 10-step ladder question, where zero is the worst possible life and 10 is the best possible life. Table 3. Life satisfaction ladder
Freq. Percent Cum. 0 201 0.63 0.63 1 1,362 4.24 4.86 2 2,869 8.92 13.78 3 5,032 15.65 29.43 4 5,178 16.10 45.53 5 7,755 24.11 69.64 6 5,080 15.80 85.44 7 2,430 7.56 93.00

208
Jeffrey Bookwalter and Peter H. Koehn
212
8 1,756 5.46 98.46 9 446 1.39 99.84 10 50 0.16 100.00 Total 32,159 100.00
At first look, rural Ethiopians most frequently report being in the middle
of the happiness scale and on the middle rung of the satisfaction ladder. However, those responses vary widely by individual, household, and community characteristics. Finding what drives variation in these responses is an important step in understanding what makes people better off. What is particularly attractive about these measures is that they are not externally derived or imposed. A person’s response to the question is meant to elicit a general feeling about their life, without fixating on any particular aspect or relying on externally imposed standards.
As an example, Table 4 shows the percentage responses to the happiness question by different levels of education.
Table 4. Happiness responses by education level
No Education
Elementary Education
Some Secondary Education
High School Diploma or
Higher Very happy 12.6 15.8 17.5 24.2 Pretty happy 56.8 63.7 61.5 44.6 Not Too Happy 30.6 20.5 21.0 32.1 Total 100 100 100 100
These responses to the happiness question illustrate several points. First,
individuals with higher levels of education are more likely to report being very happy with their lives. Given the psychic and economic benefits that accrue to those with higher levels of education, this result is not surprising. However, those reporting the lowest reported happiness category (Not Too Happy) are concentrated in the highest and lowest educational attainment. While seemingly counter-intuitive, these results support a logical narrative. Those with no education suffer from low productivity and fewer economic opportunities than their more educated peers, and are less happy for it. Those with the highest levels have correspondingly higher aspirations, which when unmet, leave people feeling ‘not too happy.’

209
Post-dependent Rural Development: Engaging and Assessing Subjective Well-Being
213
There are many other factors that matter in a household’s happiness or life satisfaction perception. For example, households that have the ability to withstand some family or economic shock would have lower stress levels and fewer reasons to worry about the future. One indicator of household resilience to shocks is the ability to access money in an emergency. Table 5 shows the percentage responses to the happiness question by the ability to access money.
Table 5. Happiness responses by ability to obtain 200 Birr in an emergency, all
income categories
Household could obtain 200 Birr
Household could not obtain 200 Birr
Very happy 18.0 9.2 Pretty happy 63.8 51.7 Not Too Happy 18.2 39.1 Total 100 100
These responses highlight several facets of happiness and life satisfaction.
First, households that are wealthier tend to be happier –in part because of their general ability to withstand unexpected economic hardships. However, among poorer rural households, the differences are even more stark. Table 6. Happiness responses by ability to obtain 200 Birr in an emergency,
poorest income quartile
Household could obtain 200 Birr
Household could not obtain 200 Birr
Very happy 22.2 4.2 Pretty happy 50.8 41.6 Not Too Happy 27.0 54.2 Total 100 100
The data in Table 6 suggest that even the poorest rural Ethiopian
households can be fairly happy when they have economic safety net. A safety net might come from the government in a number of different possible forms: crop insurance programs, income-support policies, minimum wages, transfers to low-income households, among others. In Addition, the private sector and non-profits or community groups might provide employment opportunities, organized rotating savings clubs or other types of risk-reducing institutions.
Using OLS or ordered categorical models is a next step in understanding the things that most contribute to a person’s perception of their happiness or life

210
Jeffrey Bookwalter and Peter H. Koehn
214
satisfaction. These types of models are important to disentangle numerous interrelated causes and correlates of happiness. For example, those with a secondary or college education report the highest levels of happiness. However, we don’t know to what extent those high levels come from more income – which tends to increase with education – or from other, non-economic benefits of higher education levels. More sophisticated models are the next step to understanding these issues.
Toward an inclusive post-dependent framework for evaluating rural well-being
In this chapter, we used household survey data to demonstrate one basic post-dependent method of evaluating rural well-being and to provide preliminary insights into how health, or infrastructure, or family structure/relationships, or income, or other measures affect peoples’ happiness or life satisfaction. An inclusive framework for assessing post-dependent outcomes and impacts of various variables in rural Ethiopia would engage additional quality-of-life and capability indicators and employ multiple methods of qualitative as well as quantitative analysis. Elaborating the full scope of a post-dependent framework, and applying it, is an undertaking that merits further attention.
In this section, we outline one dimension of a comprehensive quality-of-life evaluation approach that focuses on human capabilities. Our focus is on educational outcomes, particularly capability development. The approach elaborated here is consistent with “the need to develop a more holistic, imaginative and generous attitude to education’s benefits” (Schuller, Hammond, and Preston, 2004, p.192). It emphasizes contextual indicators of achievements and vulnerabilities rather than global metrics. The approach is multidimensional, participatory, and social-justice focused. A post-dependent approach to human-capabilities evaluation should pursue mixed-method and complementary evaluation strategies and collect qualitative and quantitative data related to key variables (Singh, 2007, p. 76; Uitto, 2011, p. 479; Agunias and Newland, 2012, p. 60). The use of mixed methods “generates important synergies” and “provides additional layers of explanation and insight that single-method studies are denied” (Colclough, 2012, p. 6; also see Jeffrey, 2012, pp. 172-174). Available methods include collecting primary (interview, focus-groups, direct-observation, field-visit, household-survey) and secondary (desk-reviews, meta-evaluation, content-analysis) data. Optimally desired impacts reflect community-identified and stakeholder-defined needs (Nordtveit, 2010, p. 112), are sustainable over the foreseeable future, and avoid imposing new and onerous financial burdens or other negative side effects (Smith, 2000, p. 216). Educational assessments should ensure that the synthesis and application of local/indigenous knowledge and ways of learning are included.

211
Post-dependent Rural Development: Engaging and Assessing Subjective Well-Being
215
In 2009, UNESCO identified skills as an educational priority (see McGrath, 2010). Human-capabilities evaluation should consider outcomes in terms of changes in functional competencies (Schuller and Desjardins, 2007, p. 41; Koehn and Rosenau, 2010). This approach requires baseline assessments as well as attention to asset building and long-term outcomes (Colclough, 2012, p. 2). The linked technical and interpersonal performance of inhabitants needs to be evaluated periodically from multiple perspectives, using a variety of methods, by socio-culturally diverse observers, collaborators, and community members.. When assessing behavioral competence, the extent of demonstrated improvement from the initial starting point (“added value”) and remaining shortcomings (Frenk, 2010, p. 1943) constitute the principal indicators. Functionally skilled citizens should be able to demonstrate ability to leverage knowledge, innovation, advocacy “into usable and accessible solutions” to specific sustainable-development challenges (Wamae, 2011; also Koehn and Rosenau, 2010, chapter 9).
Post-dependent evaluators expect education to matter in terms of societal impact. Education must enhance “the agency and capabilities of individuals” (Schuller and Desjardins, 2007, p. 59). In the interest of social justice, inhabitants should exercise their capabilities “in ways that further social transformation” (Walker, et al., 2009, p. 568) and promote sustainable development (Wiek, et. al., 2011, p. 214). Eliciting the perceptions of poor and marginalized community members should be incorporated as a critical component of development-competency evaluations (Jeffery, 2012, pp.172-174). On-going community-based evaluations of educational impact should integrate multiple data-collection methods that include pre- and post-project needs-assessment exercises, structured and semi-structured interviews, household-survey data similar to those analyzed in this chapter, local-government records and reports, focus-group discussions (where culturally appropriate), periods of observation, and analysis of personal and institutional life histories (see Jeffery, 2012, pp. 172-174).
In determining levels of proficiency, capability-building-program evaluations should allow room for future skill development and life-long, life-wide, learning through the interactive effects of experience and continuous training (Schuller and Desjardins, 2007, pp. 10, 18, 68-69; McMahon, 2009, p. 260). Assessing the “cumulative and interactive impacts of learning that occur in multiple contexts (lifewide learning) over the lifespan (lifelong learning)” is a challenging task (Schuller and Desjardins, 2007, p. 37). Competencies developed or diminished after mastering literacy, school graduation, or completion of a specific training program should be documented through follow-up studies (Hallak, 2000, p. 35). Demonstrated commitment to the training of trainers also is relevant in assessing the cumulative sustainable-development impact of

212
Jeffrey Bookwalter and Peter H. Koehn
216
human-capability interventions (Gedde, 2009, p. 35). In addition to skill-based assessments, human-well-being evaluators need to ask whether rural inhabitants are able to maximize their freedoms “as human personalities, as confident citizens of their countries, [and] as empowered members of their communities …” (Singh, 2007, p. 76).
Conclusion Ethiopia has an opportunity to be a leader in pursuing a promising post-dependent approach to assessing development. Building on the work of Amartya Sen, we applied the concept of development as freedom to the Ethiopian context by reference to data on rural subjective well-being data drawn from the latest round (2009) of the ERHS. To move beyond dependent development, Ethiopia can seize opportunities to adopt subjective well-being as an important guiding principle of rural development and design and implement a compelling new framework for evaluating rural subjective well-being. Adding subjective well-being to other measures of development (e.g., health outcomes, per-capita GDP) incorporates individual- and household-based assessments of the state and process of development.
Data from the 2009 ERHS illustrate the potential of this approach. Analyzing measures drawn from available ERHS data that are not externally derived or imposed provides one important step forward in a post-dependent understanding of rural development. Using responses to questions about happiness, life satisfaction, or subjective well-being allows researchers to gain insight into the types of goods, services, infrastructure, education, social networks, and other things that make rural people better off.
Ethiopia also can move forward to adapt and implement a more inclusive evaluation process. We argue for an adaptable framework for assessment that will enable evaluators to understand and convey individual- and community-capabilities outcomes and impacts and illustrated its potential with reference to education. The evaluation approach we advocate for assessing post-dependent development incorporates mixed methods, both quantitative and qualitative, and emphasizes attention to capability-building outcomes and sustainable-development impacts (also see Koehn and Uitto, 2013). By using multiple, contextually derived and applied evaluation methods that build on limited as well as rich data sets, outcomes and impacts can be “qualitative or quantitative depending on data availability and the nature of the impact.” The mixed-method approach promises to “encourage stakeholder commitment and cooperation towards developing joint programs and projects which fit well with community needs and aspirations, available resources, and adoptable technologies” (Thabrew, Wiek, and Ries, 2009, pp. 73-75). Harnessing the potential found in the ERHS subjective measures of well-being, expanding the geographic
213
Post-dependent Rural Development: Engaging and Assessing Subjective Well-Being
217
coverage of the rural household survey, incorporating complementary qualitative methods of evaluation, and improving people’s functionings and capabilities based on learning from outcome and impact results are steps forward that offer Ethiopia an opportunity to be in the vanguard of post-dependent rural development.
References
Agunias, Dovelyn R.; and Newland, Kathleen. 2012. Developing a Road Map for Engaging Diasporas in Development : A Handbook for Policymakers and Practitioners in Home and Host Countries. Geneva: International Organization for Migration.
Allardt, Erik. 1981. “Experiences from the Comparative Scandinavian Welfare Study, with a Bibliography of the Project.” European Journal of Political Research 9:101-111.
Bailey, Tracy. 2010. “The Research-Policy Nexus: Mapping the terrain of the Literature.” Paper prepared for the Higher Education Research and Advocacy Network in Africa (HERANA). Wynberg, UK: Center for Higher Education Transformation.
Bookwalter, Jeffrey & Dalenberg, Douglas. 2004. “Subjective Well-Being and Household Factors in South Africa.” Social Indicators Research, 65(3):333-353.
Boydell, Leslie R.; and Rugkasa, Jorun. 2007. “Benefits of Working in Partnership: A Model.” Critical Public Health 17 (3):217-228.
Chapman, David W. and Moore, Audrey S. 2010. “A Meta-look at Meta-studies of the Effectiveness of Development Assistance to Education.” International Review of Education 56:547-565.
Cohen, John M. and Koehn, Peter H. 1977. "Rural and Urban Land Reform in Ethiopia." African Law Studies 14 (1):3-62.
Cohen, John M. and Koehn, Peter H. 1980. Ethiopian Provincial and Municipal Government: Imperial Patterns and Post-Revolution Changes. Monograph No. 9. East Lansing: Michigan State University, African Studies Center.
Colclough, Christopher. 2012. “Investigating the Outcomes of Education: Questions, Paradigms and Methods.” In Education Outcomes and Poverty: A Reassessment, edited by Christopher Colclough. London: Routledge. Pp.1-15.
Comim, Flavio. 2001. “Operationalizing Sen’s Capability Approach.” Unpublished manuscript.

214
Jeffrey Bookwalter and Peter H. Koehn
218
Crespo, Ricardo. 2008. “Operationalizing’ Sen’s Capability Approach: A Theory of Practical Reason.” Jornadas de Epistemología de las Ciencias Económicas XIV.
Crocker, David A. 2009. The Ethics of Global Development: Agency, Capability and Deliberative Democracy. Cambridge: Cambridge University Press.
Dercon, Stefan. 2002 “Income Risks, Coping Strategies and Safety Nets” The World Bank Research Observer, 17 (2).
Dercon, Stefan and Hoddinott, John. 2011. “The Ethiopian Rural Household Surveys 1989-2009: Introduction.” ERHS Documentation.
Desai, Meghnad. 1995. ”Poverty and Capability: Towards an Empirically Implementable Measure.” In Poverty, Famine and Economic Development: The Selected Essays of Meghnad Desai, Volume II, edited by ,. U.K: Edward Elgar. Pp. 185-204.
Erikson, R. and Uusitalo H. 1987. “The Scandinavian Approach to Welfare Research.” In Erikson, R., Hansen, E., Ringen, S. and Uusitalo, H. (eds.): The Scandinavian Model, Welfare States, and Welfare Research. New York: ME Sharpe. Pp. .
Esther Mebrahtu. 2002. “Perceptions and Practices of Monitoring and Evaluation: International NGO Experiences in Ethiopia.” Development in Practice 12 (August):501-517.
Eyben, Rosalind. 2013. “Uncovering the Politics of `Evidence’ and `Results’: A Framing Paper for Development Practitioners.” www.bigpushforward.net
Frenk, Julio; and 18 co-authors. 2010. “Health Professionals for a New Century: Transforming Education to Strengthen Health Systems in an Interdependent World.” Lancet 376 4 December):1923-1958.
Fukuda-Parr, Sakiko. 2003. “The Human Development Paradigm: Operationalizing Sen’s Ideas on Capabilities.” Feminist Economics, 9:2-3.
Gedde, Maia. 2009. The International Health Links Manual: A Guide to Starting Up and Maintaining Long-term International Health Partnerships. London: Tropical Health and Education Trust.
Hallak, Jacques. 2000. “Globalisation and its Impact on Education.” In Globalisation, Educational Transformation and Societies in Transition, edited by Teame Mebrahtu, Michael Crossley, and David Johnson. Oxford: Symposium Books. Pp.21-40.
Helliwell, John F. 2003. “How’s Life? Combining Individual and National Variables to Explain Subjective Well-Being.” Economic Modeling, 20(1):331-360.
Henry, Gary T. 2009. “When Getting It Right Matters: The Case for High-Quality Policy and Program Impact Evaluations.” In What Counts as

215
Post-dependent Rural Development: Engaging and Assessing Subjective Well-Being
219
Credible Evidence in Applied Research and Evaluation Practice?, edited by Stewart I. Donaldson, Christina A. Christie and Melvin M. Mark. Thousand Oaks: Sage. Pp. 32-50.
Jeffery, Roger. 2012. “Qualitative Methods in the RECOUP Projects.” In Education Outcomes and Poverty: A Reassessment, edited by Christopher Colclough. London: Routledge. Pp.170-189.
King, Kenneth. 2009. “Higher Education and International Cooperation: The Role of Academic Collaboration in the Developing World.” In Higher Education and International Capacity Building: Twenty-five Years of Higher Education Links, edited by David Stephens. Oxford, UK: Symposium Books. Pp.33-49.
Klasen, Stephan. 1997. “Poverty, Inequality and Deprivation in South Africa: An Analysis of the 1993 SALDRU Survey.” Social Indicators Research 41:51-94.
Klasen, Stephan. 2000. “Measuring Poverty and Deprivation in South Africa.” Review of Income and Wealth 46(1):33-58.
Koehn, Peter H. 1979. "Ethiopia: Famine, Food Production, and Changes in the Legal Order." African Studies Review 22 (April):51-71.
Koehn, Peter H.; and Rosenau, James N. 2010. Transnational Competence: Empowering Professional Curricula for Horizon-Rising Challenges. Boulder: Paradigm Publishers.
Koehn, Peter H.; and Uitto, Juha I. 2013. “Evaluating Sustainability Education: Lessons from
International Development Experience.” Higher Education (29 September 2013). DOI
10.1007/s10734-013-9669-x Koehn, Peter H. and Waldron, Sidney R. 1978. Afocha: A Link Between
Community and Administration in Harar, Ethiopia. Foreign and Comparative Studies, African Series XXXI. Syracuse: Maxwell School of Citizenship and Public Affairs, Syracuse University.
McGrath, Simon. 2010. “The Role of Education in Development: An Educationalist’s Response to Some Recent Work in Development Economics.” Comparative Education 46, No. 2 (May):237-253.
McMahon, Walter W. 2009. Higher Learning, Greater Good: The Private and Social Benefits of Higher Education. Baltimore: Johns Hopkins University Press.
Møller, Valerie and Saris, Willem. 2001. “The Relationship Between Subjective Well-Being and Domain Satisfactions in South Africa.” Social Indicators Research 55:97-114.

216
Jeffrey Bookwalter and Peter H. Koehn
220
Mosse, David. 2004. “Is Good Policy Unimplementable? Reflections on the Ethnography of Aid Policy and Practice.” Development and Change 35(4):639-671.
Nordtveit, Bjorn. 2010. “Development as a Complex Process of Change: Conception and Analysis of Projects, Programs and Policies.” International Journal of Education and Development 30:110-117.
Nussbaum, Martha C. 2000. “In Defense of Universal Values.” In Women and Human Development: The Capabilities Approach, edited by , Cambridge: Cambridge University Press. Pp.
Pain, Adam. 2009. “Economic Development and Sustainable Livelihoods.” In Higher Education and International Capacity Building: Twenty-five Years of Higher Education Links, edited by David Stephens. Oxford: Symposium Books. Pp.95-114.
Saith, Ruhi, 2001. “Capabilites: The Concept and its Operationalisation.” QEH Working Paper Series, Working Paper 66, Oxford Department of International Development.
Schuller, Tom. 2004. “Three Capitals: A Framework.” In The Benefits of Learning: The Impact of Education on Health, Family Life and Social Capital, edited by Tom Schuller, John Preston, Cathie Hammond, Angela Brassett-Grundy, and John Bynner. London: RoutledgeFalmer. Pp.12-33.
Schuller, Tom, and Desjardins, Richard. 2007. Understanding the Social Outcomes of Learning. Paris: Organization for Economic Co-operation and Developmwent (OECD).
Schuller, Tom; Hammond, Cathie; and Preston, John. 2004. “Reappraising Benefits.” In The Benefits of Learning: The Impact of Education on Health, Family Life and Social Capital, edited by Tom Schuller, John Preston, Cathie Hammond, Angela Brassett-Grundy, and John Bynner. London: RoutledgeFalmer. Pp.179-193.
Sen, Amartya. 1999. Development as Freedom. New York: Anchor Books. Sen, Amartya. 2013. “Why India Trails China.” New York Times, 20 June, p.
A25. Singh, Mala. 2007. “Universities and Society: Whose Terms of Engagement?” In
Knowledge Society vs. Knowledge Economy: Knowledge, Power, and Politics, edited by Sverker Sorlin and Hebe Vessuri. Hampshire: Palgrave Macmillan. Pp.53-78.
Smith, Harvey. 2000. “Transforming Education through Donor-funded Projects: How Do We Measure Success?” In Globalisation, Educational Transformation and Societies in Transition, edited by Teame Mebrahtu,

217
Post-dependent Rural Development: Engaging and Assessing Subjective Well-Being
221
Michael Crossley, and David Johnson. Oxford: Symposium Books. Pp.207-218.
Srinivasan, T.N. 1994. “Human Development: A New Paradigm or Reinvention of the Wheel.” American Economic Review 84(3):238-243.
Stern, Elliot. 2004. “Evaluating Partnerships.” In Evaluation & Development: The Partnership Dimension, edited by Andres Liebenthal, Osvaldo N. Feinstein, and Gregory K. Ingram. New Brunswick, NJ: Transaction Publishers. Pp.29-41.
Sugden, Robert. 1993. “Welfare, Resources and Capabilities: A Review of Inequality Reexamined by Amartya Sen.” Journal of Economic Literature 31 (4):1947-1962.
Tarabini, Aina. (2010). Education and poverty in the global development agenda: Emergence, evolution and consolidation. International Journal of Education and Development 30, 204-212.
Thabrew, Lanka; Wiek, Arnim; and Ries, Robert. 2009. “Environmental Decision Making in Multi-stakeholder Contexts: Applicability of Life Cycle Thinking in Development Planning and Implementation.” Journal of Cleaner Production 17:67-76.
Uitto, Juha I. 2011. “Sustainable Development of Natural Resources in Laos: Evaluating the Role of International Cooperation.” Asian Journal of Environment and Disaster Management 3 (4):475-490.
Walker, Melanie; McLean, Monica; Dison, Arona; and Peppin-Vaughn, Rosie. 2009. “South African Universities and Human Development: Towards a Theorisation and Operationalisation of Professional Capabilities for Poverty Reduction.” International Journal of Educational Development 29: 565-572.
Wamae, Watu. 2011. “Continent Needs Its Own Science Indicators.” University World News 179 (July).
Wiek, Arnim; Withycombe, Lauren; Redman, Charles L. 2011. “Key Competencies in Sustainability: A Reference Framework for Academic Program Development.” Sustainability Science 6:203-218.

218
Jeffrey Bookwalter and Peter H. Koehn
222
Acknowledgements The ERHS have been made available by the Economics Department, Addis Ababa University, the Centre for the Study of African Economies, University of Oxford, and the International Food Policy Research Institute. Funding for data collection was provided by the Economic and Social Research Council (ESRC), the Swedish International Development Agency (SIDA), and the United States Agency for International Development (USAID). The preparation of the public-release version of these data was supported, in part, by the World Bank. AAU, CSAE, IFPRI, ESRC, SIDA, USAID and the World Bank are not responsible for any errors in these data or for their use or interpretation.

225
8 Dessalegn Rahmato
Large-Scale Land Investments Revisited
Introduction
This chapter examines Ethiopia’s program of large-scale land investments with special emphasis on the rapid expansion of these investments between 2008 and 2011 when huge tracts of agricultural land were leased out to foreign and domestic investors over a short period of time and at what one astonished Indian investor who had just received 25,000 ha of fertile land called throw-away prices. The scale of the land transfers and the low land prices was unprecedented and aroused serious concerns among citizens and civil society groups in the country. This dramatic land rush was driven by the government which thought it would benefit by what it considered to be golden opportunities opened up by the global food price and food supply crisis of 2007/2008, and at the same time, steal a march on its competitors, African countries in the region, which were also scrambling to attract foreign capital. The government believed that Ethiopia had better resources to offer and what was required was an attractive package of concessionary terms to lure foreign investors, particularly from the emerging economic power houses of east Asia and the capital-rich but food-poor countries of the Middle East1. Land transfers to investors had been going on for over a decade prior to the period in question, but at that time the pace of expansion was slow, the investors were almost always domestic ones, and the plots leased were relatively small in size (Dessalegn 2011 for details).
There is no consensus on the definition of the phenomenon we are concerned with, nor is there a common terminology to refer to it- terms such as “land grabbing”, “land deals”, “land acquisitions” and, sometimes, “land rushes” are widely employed in the literature as well as by international advocacy
1 Documents posted on MOARD’s website in 2008/09 spoke of competition with other African countries, but were full of high expectations from foreign land investment. All early MOARD documents have since been removed. NOTE. Acronyms are listed at the end of the paper

220
Dessalegn Rahmato
226
organizations campaigning against it2. What we are dealing with in this work is the makings of a property and production regime in which rights over large-scale rural resources are transferred to private-individuals, corporate or sovereign business interests, allowing them to engage in mechanized farming for the purpose of producing agricultural goods either for the international market or for economies far removed from the local communities where the investment are based. In either case, local communities receive very little benefit. What has been “grabbed” is not just land but also water, forest and biodiversity resources, most of which are claimed or customarily used by, or are important to the livelihoods of peasant farmers, herders and other small rural producers.
While it is too early to call for a postmortem at the moment, it is quite evident that the program is facing severe difficulties, which I believe are harbingers of an evolving crisis from which it is unlikely to emerge in a sound state. As we shall see later in this work, the immediate causes of its predicament are diverse: they include agricultural, financial and environmental factors as well as growing opposition from local communities regarding the loss of their land and other resources. It was evident from the beginning that the program and its hasty execution carried the seeds of its own contradiction, but I shall argue that at another level, the crisis looming over it is a product of the strategy of development from above and the “ideology” of state-led development.
In what follows I shall first present a brief discussion of the land investment program in the context of the government’s grand strategy of state-led development, and this will be followed by an examination of the serious difficulties the program is presently facing, showing why these difficulties are not a passing phenomena but in fact harbingers of a deeper crisis. In the final section I shall suggest that the answer to the question, what needs to be done -a question that, in many different forms, has aroused strong debate in the literature and among different interest groups- does not lie in adopting or tinkering with the “code of conduct” approach favored by the World Bank and its partner organizations, but rather in thinking through democratic alternatives that empower local communities and lead to the sustainable use of the land and resources in question for the greater good of these communities.
2 Much of the debate on land grabbing has been conducted in the pages of the Journal of Peasant Studies; see the special collection in Vol. 39, Nos. 3&4, 2012. Advocacy groups that have been highly critical of Ethiopia’s land deals include GRAIN, Human Rights Watch, and the Oakland Institute.

221
Large-Scale Land Investments Revisited
227
Land deals and state accumulation3 A brief note on some features of rural Ethiopia is necessary to put the discussion that follows in context. As a result of complex historical processes as well as high population growth and increasing resource degradation over the years, shortage of arable land is acute in most of the countryside. In the cereal farming complex of the northern highlands, per capita family holdings are less than one hectare, while in the enset culture complex in the south of the country (in SNNP in particular), a family that works half a hectare is considered fortunate. Agriculture is dominated by hard working peasant cultivators, but rural society has often been plagued by severe food shortages, catastrophic famines and endemic hunger since the 1950s. As recently as 2002/03, there was widespread starvation in many parts of the country affecting more than 13 million rural people, and it required large inflows of international food aid to avert a tragedy on the scale of the famine of 1985/86 when hundreds of thousands of peasants and pastoralists perished in the worst tragedy in the country’s history. Malnutrition is endemic in the countryside as well as in the urban areas, and diseases associated with poor nutrition and scarcity of clean water are common. In 2009, over 22 percent of the rural population was dependent on a combination of emergency food aid and safety net programs financed by Western countries and international agencies. While the number of people seeking emergency food assistance has decreased since then, nearly eight million rural people continue to be supported by donor financed safety net programs4. On the other hand, there has been a fairly high rate of economic growth in the last ten years and improvements in health services have been registered, nevertheless this has not made a significant impact on real rural poverty nor has it helped to ensure food security to a great number of farming households.
Extent of transfers Land leasing to private investors was in progress in many parts of the country long before the new global land rush was under way. Indeed, one of the first acts of the present government soon after establishing itself in power in 1991, after the overthrow of the military regime (the Derg), was to open up opportunities for agricultural investment by providing private interests access to farm land which was not available to them under the economic policy of the Derg. We can distinguish three phases of the land investment program under the present 3 This section is based in part on the findings of field work and interviews carried out in 2010 for an earlier study (Dessalegn 2011). See also Fouad 2012; Lavers 2012; Cortula et al 2009 has some discussion on Ethiopia 4On food security, see the recent collection of papers in Dessalegn et al (eds.) 2013; on land and landownership, Dessalegn 2009

222
Dessalegn Rahmato
228
regime. The first phase covers the period from the mid-1990s to 2000 when the size of land transferred was relatively small, less than 500 ha, and the investors were almost exclusively domestic businesses and individuals. The second phase extends from 2001 to 2007 – a period in which the government’s investment proclamation of 2002, providing generous incentives and sweeteners to foreign investment was issued, and the horticultural sector registered a boom in exports of cut flowers to European and other markets. The floriculture business, in particular, which acquired fertile crop land in peri-urban areas and near transport corridors at the expense of peasant farmers, became the darling of decision-makers and was given a free hand and a good deal of support to expand and flourish (Ayelech and Helmsing 2010). The size of land leased out was small to medium scale, but while the majority of the land transfers was made to domestic investors, the period saw growing interest by foreign investors as well as investors from the Ethiopian Diaspora. During the first and second phases, the great majority of investors held the land idle because many simply did not have the resources to put the land to use, and some used it for purposes for which it was not approved (MOARDb).
The third phase, from 2008 to 2011 was a period of unprecedented land rush by foreign companies attracted by the country’s investment climate, and when the government became particularly keen to promote the production of agricultural and agro-industrial goods for the export market. The first three years, in particular, witnessed what may be described as mega-land deals, in which the government ceded huge stretches of land measuring 25,000 to 50,000 ha, and in one case, 100,000 ha to foreign investors. The lands were to be used to grow three categories of crops: food crops for export, notably rice, oil seeds, soya, and maize; bio-fuel crops such as palm oil, jatropha curcas and castor beans; and industrial crops, especially, sugar cane and cotton5. It was also in this period that an ambitious plan for public sector investment in sugar production was launched requiring huge land allocations in various parts of the country. The rental fees for agricultural land are astonishingly low, perhaps one of the lowest in the world: in most parts of the country investors pay less than 10 USD for a hectare of land per year. Indeed, land rents are so low that many foreign investors apply for more land than they can possibly manage (Dessalegn 2011 for details).
The government has made highly exaggerated claims of the availability of unused land suitable for all kinds of crops that can be given out to investors without risking the livelihoods of small farmers. The country’s “investment potential” has, at various times, been put at ten million hectares or more (MOARD 2008; Reporter interview). Accurate figures of the extent of land 5 See Dessalegn 2011. Other works include Lavers 2011, and Malik 2011

223
Large-Scale Land Investments Revisited
229
transferred over all phases of the program or in any one of them are not available. Such is the poor state of record keeping that even in cases of individual transfers the size of the land registered is an estimate and not an accurate measure, and what is entered in the records is different from what appears on the ground. Government officials occasionally admit that the figures they put out in official documents are based on estimates derived from satellite imagery or aerial photographs, in most cases not supported by surveys on the ground6.
In 2008, the government designated the Federal MOARD as a lead agency for large-scale land deals with foreign and local investors. The Ministry’s responsibility included preparing information and other technical inputs to attract investors, signing contracts with and transferring lands to those eligible and undertaking follow-up and oversight. EPA’s responsibility in regard to environmental impact assessment and oversight, vested in it by law (FDRE 2002b), was transferred to MOARD in 2009 by means of an exchange of letters and a memorandum of understanding between the two agencies, even though MOARD did not have the technical and institutional capacity to carry out the duties involved. MOARD was to receive and administer all consolidated investment lands measuring 5000 ha or more from the Killils7. These lands were to be put into what was called a Federal land bank to be accessed by investors through MOARD. This decision deprived the Killils some of the powers vested in them by the 1995 Constitution with respect to land administration, and some Killil authorities were initially reluctant to comply. While all aspects of the land deals were to be concluded by and through MOARD, the income from the transactions, namely land rent, income tax, and other payments were to be utilized for the benefit of the Killils concerned. This change of procedure and division of responsibility was formally endorsed by a directive issued by the Council of Ministers in early 2010 (FDRE 2010). The Killils were to continue to allocate land to investors as they had done prior to this decision but the lands in question were those measuring less than 5000 ha and not part of the land they had submitted to the Federal land bank. Some Killils were said to possess enormous land potential, and the transfer of some of it to the Federal land bank was not seen as depriving them of the power of making land deals themselves. Thus Beni-Shangul for example, is estimated to have as much as 1.4 million
6 Interview with BizualemBekele, coordinator at the Agricultural Investment Support Directorate, MOA, in Reporter 8 September 2013. MOARD is previous name of MOA. UNDP 2012 gives much higher figures 7 Under the Federal system the country is divided into 9 major ethnic-based administrative units called KillilsinAmharic (rendered as Region in English, but I prefer the Amharic term). The lowest unit is the kebelle (equivalent to a sub-district), and above it is the woreda (district).

224
Dessalegn Rahmato
230
hectares potentially available for investors, Gambella 1.2 million, SNNP 500,000 and Oromia1.7 million (MOARD 2008; 2009). These lands were subsequently transferred to the Federal land bank in 2009.
The Growth and Transformation Plan (GTP), which was launched in the last quarter of 2010 and expected to run to 2015, has set ambitious targets for the expansion and development of sugar production in the country. At present the country has four medium-sized sugar factories but what they produce is not sufficient to meet domestic demand. The goal at the end of the plan period is not only to fully cover domestic needs but to export 1.2 million tons of sugar earning 662 million USD per year. To meet this goal, the plan calls for the expansion of the existing facilities as well as the establishment of eight new large factories with a combined plantation area of over 200,000 ha (MOFED 2010b). For this purpose the government established the Sugar Corporation in October 2010, a semi-autonomous body with a substantial annual budget which replaced the earlier Ethiopian Sugar Development Agency. The Corporation has embarked on a massive construction and land acquisition program in SNNP, Amhara, Tigrai and Afar Killils. According to information recently posted on its website. it is constructing 12 new large-scale factories of which seven are in the south Omo valley of SNNP with a total land area of 175,000 ha, three in Tana Beles (western Amhara) with 44,000 ha, and one in Wolkait (northeast Tigrai) with 75,000 ha8. It is also responsible for the Kessem sugar factory (which has a 21,000 ha plantation) and Tendaho (50,000 ha) in Afar in the Awash valley, which have been under construction since 2005 but still unfinished at present.
In 2012, the Corporation acquired, through purchase, the property of a Pakistani company which had leased 28,000 ha of land to establish a sugar enterprise in the Arjo Didessa valley in Oromia, western Ethiopia. The company was unable to proceed with the project and decided to pull out transferring all its assets to the Corporation. The Arjo Didessa sugar project now owns over 72,000 ha of land on which the Corporation is building a dam on the Didessa river, a major tributary of the Nile, which is expected to inundate about 13,000 ha of land and to displace many thousand peasant farmers, though the exact number is not clearly known9. The Corporation thus controls under its new projects launched since 2010 a total land area of over 437,000 ha on which it is undertaking dam building, irrigation canal construction, construction of housing for laborers and staff, and planting of cane sugar for the factories. Some of the
8www.etsugar.gov.et Accessed November 2013. Information posted earlier, in 2011, but since removed, provides different figures 9 According to press reports, it may be 100,000 or more (Reporter 8 April 2012, and 13 January 2013); the Corporation’s website provides the most minimal information and no word on displacements

225
Large-Scale Land Investments Revisited
231
land under development in south Omo, its largest project so far, lies well within the boundary of the Omo National Park, one of the two important wildlife parks in the area established over four decades ago. The government body responsible for managing the country’s parks and nature reserves, the Ethiopian Wildlife Conservation Agency, is aware of the encroachment but has kept silent about it (Dessalegn 2011, Ensermu et al 2009).
All the new projects will involve the displacement of pastoralists, agro-pastoralists and peasant cultivators from their land, and pose a risk to their livelihoods. The massive project in the Omo valley, for example, may displace 50 to 70 thousand people or more, according to reports in the local press, though other sources put the figure much higher (See below). While accurate figures are not available, theTana Beles, Wolkait in Tigrai and Arjo Didessa projects have displaced tens of thousands of peasant farmers from their land (Reporter, ibid, and 25 March 2013; EOC 2012). The Corporation says all displaced people, including pastoralists in the Awash and south Omo valleys will be resettled in purpose built villages, and provided irrigated land for their livelihood. It claims that the new projects will provide employment for over 162,000 people. Critics of the Corporation, not least international advocacy groups, argue however that the project in the lower Omo threatens the unique ecosystem of the valley, and has been accompanied by large-scale human rights abuses, forcing indigenous people from their ancestral lands, using violence and arbitrary arrests to do so. It is argued that the lives of between 200,000 to 500,000 people are endangered as a consequence of their displacement as well as severe disruptions to their livelihoods. A recent article in Bloomberg News reports that indigenous people that were interviewed were very unhappy with the loss of their land and water resources and were fearful that the project will eventually put at risk their livelihoods and the future of their communities10.
How much land has actually been transferred to investors over the three phases of the investment program may not be accurately known. One of the earliest documents released by MOARD (2009a) shows that in the period between 1996 and the end of 2008, some 8000 applications for land were approved by the Killils with the total land committed measuring over three million hectares. Other sources give different figures though for different time periods. The World Bank (2010), for example, puts the total land transferred to investors in Ethiopia between 2004 and 2008 at 1.2 million hectares. Recently, in the interview noted above, the senior official at the Agricultural Investment Support Directorate (AISD) of MOA, which until recently was responsible for managing the land investment program, suggested a rough estimate of 2.2 10 The higher figure is in HRW 2012b, the lower in OI 2011,2013. William Davison, “Development, rights, and restrictions in Ethiopian’s South Omo”, 16 September 2013.

226
Dessalegn Rahmato
232
million hectares as the total land leased out to investors up to the present but stressed that this estimate was not based on any reliable measurement. Furthermore, the GTP has set a target of 3.3 million hectares of land to be transferred to investors in the five-year period (MOFED 2010). On the other hand, recent figures posted on MOA’s website indicate that between 2008 and 2012, some 500,000 hectares of land was leased out to investors both by MOARD and the Killils11. All in all, taking into account the figures given, I estimate that the total land ceded to investors from the mid-1990s to 2012 may be in the order of 3.00 to 3.5 million hectares. Looking ahead, it now looks highly unlikely that the government’s target of leasing out an additional 3.3 million hectares to investors in the period up to 2015 will be met.
What was ceded and to whom? What kind of land was transferred and were these lands indeed unused as the government claims? The wide diversity of lands leased out to investors, both private and public, include crop land, pasture and rangeland, woodland and forest as well as wetlands. Moreover, as we found out during our field work in 2010, lands in designated national parks, protected areas and wildlife habitats have also been given out, posing a serious threat to the country’s ecological and biodiversity resources. A critical resource that has been given away almost free but which is often not mentioned in the land deals discourse is water. Indeed, the term land deals should be replaced by land and water deals because the two often go together. All these resources are vital to the livelihood of peasants, herders and small producers in the rural areas, and the claim by the government that they are unused is not supported by the reality on the ground.
There is finally the matter of population relocation in Gambella and BeniShangul, two Killils that have been the main target of large-scale land deals. The Killil governments are responsible for the implementation of the resettlement program (or villagization as it is sometimes called) but have been supported by the Federal government in the form of special budget allocations. They deny that the program is connected in any way with the land deals but the timing of the program (at the end of 2010) and the fact that the people relocated were living in areas close to where investors had been allocated land suggests that there is certainly a strong link. Village residents living close to land leased to a Saudi-financed rice project called Saudi Star in Gambella that we interviewed in 2010 told us that they were convinced they were being moved to enable Saudi Star, which had requested for additional land, to expand its rice project (Dessalegn 2011). Human Rights Watch claims, in its report on
11 See www.moa.gov.et

227
Large-Scale Land Investments Revisited
233
Gambella, that people were forcibly relocated and there was a high degree of human rights abuses (HRW 2012a).
The dominant actors in the land rush in Ethiopia are not transnational companies based in the West, as was the case in the past, but new players from Asia and the Middle East, of which the most prominent have been Indian investors. Indian capital is by far the largest both in terms of the number of investors involved and the extent of farm land acquired. Some of the biggest acquisitions have been made by Indian firms; the following is a sample of the largest beneficiaries: Karuturi, a company based in Bangalore, India, was initially given 300,000 ha of land in Gambella but this was subsequently reduced to 100,000 ha; it has also leased 11,000 ha in Bako Tibee woreda in Oromia. Emami Biotech acquired 80,000 ha in Oromia for bio-fuel crops; Shamporji, a subsidiary of the giant Indian conglomerate, Tata Group, received 50,000 ha in BeniShangul also for bio-fuel crops; BHO leased 27,000 ha in Gambella for rice and sesame seeds; and Ruchi Soya was ceded 25,000 ha also in Gambella to grow soya and palm oil for export. At the end of 2011, there were about 25 to 30 Indian agricultural investors holding among them between 450,000 and 500,000 ha of land in various parts of the country. In view of the dominance of Indian capital, the land rush of 2008 to 2011 may well be described as the Indian Scramble for Ethiopia. Other investors worthy of note include Saudi Arabia, the Gulf countries and Malaysia12.
State accumulation and development from above13 We need to pause here and ask: what was the central objective behind the land investment program, and what specifically did the government expect the country to benefit by it? The government’s economic policy formulated in the mid-1990s, called Agriculture Development-Led Industrialization (ADLI), placed high hopes on agriculture, making it the engine of economic growth, and small-holder farming as the dynamic force within it (MOPED 1994). For the next ten years or so, peasant farming, which was and remains the dominant occupation for the rural population, received increased extension services and new technologies such as modern inputs and high yield seeds (Kassahun 2012). Despite the fact that rural society was frequently battered by severe environmental stresses, and, occasionally, catastrophic disasters, and despite doubts among expert opinion as to whether ADLI was capable of delivering
12Based on MOA and MOARD websites, and local press reports (Reporter and Fortune). Some of the companies have since pulled out 13 For the purposes of this work, I shall use the terms “development from above” and “state-led development” to mean more or less the same thing

228
Dessalegn Rahmato
234
growth, the importance given to smallholder production was welcomed by many, including civil society and development practitioners. However, by the turn of the new millennium there was a shift in government thinking away from the earlier emphasis, and by the middle of the first decade of the millennium family farming was no longer the darling of decision makers. Instead, large-scale land investment was seen as one among several initiatives to bring about not just growth but “growth and transformation”, which was to be achieved by a substantial inflow of foreign investment. In an influential policy-framing document first issued in Amharic in 2001 and translated into English in 2003, the government argued that foreign capital in agriculture would serve as a catalyst in the transformation of the rural economy, driving the inevitable shift from subsistence farming to large-scale commercial agriculture (MOFED 2003:52).The document went on to emphasize that while there would be no discrimination against domestic investment, the focus of attention should be on attracting foreign investors because they are better endowed with investment capital, technology and market expertise (ibid). This turn towards large-scale agriculture driven by foreign capital was made real by several institutional reforms such as the 2002/03 investment laws, greater openness to foreign investment, beginning with the floriculture sector and culminating in the accelerated land leases in 2008 and after. Along with its transformative role, land investment was also expected to enable the country to expand and broaden its exports of agricultural commodities, and increase its foreign earnings. Other benefits included creating employment opportunities, construction of social assets such as health facilities, schools, and access to clean water for local communities, and opportunities for technology transfer to the rural areas.
The land deals in Ethiopia were driven by the state: the state has been the sole actor all through the various stages of the land “grabbing” process, from the initial task of publicity and investor attraction to the final stage of allocation of specific farm plots. This is an important point to bear in mind, one that perhaps sets the country apart from others in Africa and elsewhere. Another way of putting it is that it is the state that has been the real land grabber with foreign and domestic investors willing beneficiaries. This land grab has been made possible by the system of land tenure in place in the country which gives the state rights of legal ownership and land users rights of usufruct only, subject to expropriation and displacement at any time. The implementation of the land certification program in the last ten years has provided land users with an increased sense of assurance but by no means full security of tenure (Dessalegn 2009). Land transfers have occurred despite the program and peasants with title certificates have been expropriated for a variety of reasons including private and public investment projects. That rights of ownership are vested in the state has given public authorities considerable power over land users and rural

229
Large-Scale Land Investments Revisited
235
communities. The leasing out of large tracts of land to investors in a process based on the exclusion of the local people and their communities further reinforces state power leaving small land users greatly weakened and increasingly vulnerable.
As noted above, an important aim of the land investment program has been to contribute to state accumulation which in turn was meant to serve the ambitious goals of state-led capitalist development. This economic model, state “developmentalism”, if we may call it that, which evolved as government policy at the turn of the millennium, has the following characteristics: a) development is based on heavy public sector investments on a variety of projects, some of which are aimed eventually at gaining export earnings; b) state investment relies on heavy public borrowing from domestic financial institutions; c) this has placed serious impediments on the activities of the private sector not least because it has been crowded out of the credit market with much less space for growth; and d) this has led to a skewed and non-inclusive growth path measured in terms of access to resources, markets, and opportunities as well as in terms of the regional balance (IMF 2012). Equally important is the fact that decision-making is also not inclusive because all major economic decisions are made by the power elite and do not include public consultation nor participation by stakeholders. The state is the dominant actor in the economy in terms of investment and asset ownership (not least rural land), as well as a significant player in the production of goods and services.
There are a number of medium to large enterprises still under public control, the largest of which, the Metals and Engineering Corporation, a giant engineering and construction conglomerate established under the Ministry of Defense, has become the sole contractor for massive government construction projects such as dams, irrigation schemes, factories and other large-scale public undertakings. At the end of 2012, the government established the Chemical Industries Corporation under the Ministry of Industry with a budget of over one billion USD. This Corporation was given the mandate to establish and run enterprises producing a range of chemical products, fertilizers, and cement for the export and domestic market. To this list must be added a number of businesses and investments controlled by four to five quasi-government organizations attached to the ethnic-based ruling Parties of the major Killils in the country. While a number of public enterprises inherited from the previous Derg regime, of which some were loss making and a few others in state of decline, had been transferred to the private sector, the state’s commanding role in the economy has not been diminished in any way. On the contrary, the large-scale investment it has undertaken over the last ten years, and its long standing control of such key sectors as telecommunications, power, shipping and air transport, banking and insurance continue to reinforce its dominant position.
230
Dessalegn Rahmato
236
The GTP, the centerpiece of the state-led development strategy, which was launched without meaningful public consultation or serious debate in Parliament, provides a dominant role for the state and only a junior role for non-state actors. A criticism of some of the country’s international partners is that the state has embarked on far too many mega investment projects, some of which have not been judiciously prioritized nor based on a sound financial basis. The Renaissance Dam on the Nile, for instance, is estimated to cost 10 percent of the country’s GDP (IMF 2012). The World Bank (2013) cautiously points to the need for sound public investment management, but management shortfalls, frequently reported in the local press, remain a persistent problem at a number of projects, not least the Gibe dams, and a good number of the Sugar Corporation’s enterprises which have failed to meet their completion targets causing costs to spiral. The strategy is also fuelling inflation, which is hitting the poor very hard, and constraining private financial institutions. The annual inflation rate has remained in double digits for the better part of the decade, and in 2010 and 2011, food inflation had soared well over 50 percent (CSA 2005-2012), squeezing the living standards of most income groups but particularly those in the lower income brackets. While government data suggest that there has been a reduction in the number of people living below the poverty line in recent years , the same data indicate that there has been an increase in the severity of poverty in the same period, which means that the poor are worse off in 2012 than they were in 2005 (CSA 2012). On the other hand, government expenditure on education has been commendably high over the decade, nevertheless, the largest share of public expenditure did not go to those sectors that support poverty reduction (excluding education), but went instead to national defense, public debt, and public order and security. Expenditure on health is below the target set by the Abuja Declaration, which requires African governments to spend at least 15 percent of their public budget allocations on health (DI 2013: 14-18). The GTP in fact cannot be said to be particularly pro-poor: it gives only a passing glace at the problem of food security and has only a few things to say about long-term efforts at ending hunger and malnutrition, the country’s enduring problem.
In brief, state-led development has meant giving the state a dominant role and promoting growth through public investment financed through heavy domestic borrowing. There are risks associated with the choice of investments and this, according to the IMF, include the build-up of a heavy and unsustainable public debt burden, making a number of public enterprises and banks highly vulnerable, and causing a significant draw-down of the country’s foreign reserves creating severe difficulties for private businesses and investments. The IMF argues that growth in the years ahead is expected to decelerate due, it believes, to the limited opportunities for the private sector which has been hampered not just by limited access to credit but also by restrictive regulations

231
Large-Scale Land Investments Revisited
237
and the worsening business climate (IMF 2012). The World Bank also expects the growth rate to slow down but gives different reasons for it (World Bank 2013). According to IMF’s analysis, the relatively high growth rate achieved so far has been due in part to large-scale public investments and not primarily because of significant productivity growth.
At the same time, state-led development has had significant implications for the political realm as well. The country is effectively a one-party state and political power is concentrated at the top. State developmentalism combined with the non-inclusive land investment program has contributed to greater elite power concentration and state hegemony. We have already noted above the transfer of the power of the Killils to the Federal MOA in regard to land administration. The years 2008 and 2009 saw a spate of anti-democratic and almost draconian laws issued restricting the freedom of the press, crippling the activities of civil society organizations, and creating fear and uncertainty among citizens due to the increased powers given to security and law enforcement agencies in connection with the prevention of terrorist act (FDRE 2008, 2009a,b).
The emerging crisis of land investments The rush to acquire land in the period under discussion has not been accompanied by a similar move to utilize the land. Indeed, it became evident shortly after the investment program was launched aggressively in 2008 that the program had attracted not only commercial farming interests but speculators as well. A few years into the program, nearly a dozen foreign investors that had acquired large estates for bio-fuel crops in BeniShangul, Oromia and SNNP terminated their leases and pulled out, citing financial difficulties and doubts about the profitability of the business scheme, and alleging that the global recession had made bio-fuel production a less attractive investment. Since then other foreign investors, including several from India with large leases have also withdrawn for a variety of reasons including shortage of capital, lack of support from the government and conflicts with local officials and communities14.
Moreover, a serious concern of the government in the last two years has been the low utilization of land by investors. A major assessment of land investment projects in the country for the period from the 1990s to the end of 2011, undertaken for UNDP and MOA by an international consultant (UNDP 2012), shows that by the end of 2011 only a small percentage of investors had undertaken farm activities on their land. The assessment report provides
14Reporter 22 April 2012, Ministry of Mines quoted in Reporter 27 May 2012; Fortune 8 April 2012; The Hindu 1 June 2013 and 5 November 2013

232
Dessalegn Rahmato
238
evidence for a catalogue of failings and incompetence inclusive of the following: poor performance by investment projects, of high rates of underutilization of land, low levels of farm expertise, and low levels of productivity. It found that among the 112 sample investors selected for case study, the rate of land utilization among those with leases greater than 10,000 ha was one percent; and those with 3000 ha or more was nine percent. Overall, the finding was that the average domestic and foreign investors were farming 11 percent and eight percent, respectively, of the land that is registered in their names (p. vii). In other words, 89 percent and 91 percent respectively of leased land was idle. What is more revealing is the finding regarding agricultural performance. The assessment found that average yield figures for similar crops grown in the same region and under the same climatic conditions showed that investors had a much lower rate of performance than peasant farmers for 80 percent of the crop yield comparisons (p. 89). Moreover, comparison of domestic and foreign investors revealed two important facts that are worthy of note. First regarding project implementation, domestic investors were found to be better than their foreign counterparts in converting leased land into farm land by a wide margin. Secondly, regarding productivity, yield figures for seven crops grown by both kinds of investors showed that except for cotton, domestic investors had a higher level of productivity for all other crops, namely coffee, maize, rice, sesame, sorghum and soya (p. 103). These findings must have come as an embarrassment to government officials who had frequently argued that foreign investors have much better advantages than domestic investors not only in terms of access to capital and technology but also in terms of land-use efficiency and agricultural performance.
The view in the government at present is that while the investment program has performed below expectations there is still hope that proper and centralized management and supervision by a public agency can improve matters and enable the program to achieve its objectives (MOA 2013). The real verdict, I believe, is that the program is on the verge of a crisis and the technocratic remedy proposed for its recovery seriously underestimates the severity of the difficulties it is facing. To begin with, because of the urgency created by the 2008 global food crisis and the haste with which investors rushed to “grab” land in “uncharted territories”, many investors were saddled with a host of problems for which they were ill prepared and which they were not able to easily overcome. In many instances, proper land and environmental impact assessment was not undertaken before land deals were concluded; the UNDP report notes that 84 percent of investors had not used any environmental impact assessment document (p.50). In a number of cases, project staff lack farming expertise, employ poor land management practices, and have limited, if any, knowledge of the specific agro-ecological conditions of the localities concerned. The UNDP

233
Large-Scale Land Investments Revisited
239
document for instance notes that crop failures due to water-logging and flooding, which had damaged crops in a number of projects, should have been predictable and avoidable with proper on-farm water management. The following quote from a recent news report is indicative of the lack of knowledge of local conditions which a good discussion with the surrounding communities would have helped to overcome:
Eighty percent of the Bangalore-based company’s land in the southwestern Gambella region is on a flood plain, meaning its 100,000-hectare (247,100-acre) concession is inundated by the Baro River for as much as seven months of the year, according to Managing Director Ramakrishna Karuturi. The company was unaware of the extent of the flooding when it leased the land, he said15.
To give another example: Karuturi’s other farm in Bako, some 250 kms west of Addis Ababa, which we investigated for an earlier study, was flooded during its first year and the maiden maize crop was badly damaged as a result. It was evident that the damage could have been prevented if the project’s senior staff, all of whom were from India, had employed simple protection measures which local farmers often used. Peasants we interviewed near the project were scornful of the farming methods used by the management (Dessalegn 2011).
Secondly, there is also the matter of governance of large-scale investments by local and Federal authorities. Governance was not only inadequate and poor but also irresponsible: the authorities had placed too much confidence on foreign investors to do the right thing because it was believed they had better access to capital and technology and were thus better farmers. Moreover, it was clear from the beginning that both at the Federal level and lower levels, from the Killil to the local kebelle, there was a severe deficit of governance capacity: competent staff, expertise, technical equipment, planning and preparedness were all lacking (MOARD 2009, Reporter interview, 2013, UNDP 2012). An even more serious flaw has been the non-inclusive and non-transparent manner in which the investment program was undertaken from the beginning in the 1990s to the present. The government has been unwilling to invite public dialogue on the program and has employed a top-down and undemocratic approach in which decisions are made at the top and passed down to local officials to implement. A significant shortcoming, one that is an important contributing factor to the emerging crisis has been the failure to consult the most important stakeholders in the whole program, namely peasant farmers, herders and their communities. The government has proceeded to implement the program without their participation or consent and without even informing them. On many occasions peasants and 15William Davison, Ethiopia’s Push to Lure Farm Investment Falters on Flood Plains, Bloomberg News, 25 November 2013

234
Dessalegn Rahmato
240
herders learned of the transfer of land in their community to an investor only when the investor appeared on the scene, together with local officials, to claim his land (Dessalegn 2011).
Thirdly, the reactions of local communities to the expropriation of their land and deprivation of their ancestral rights, and the security concerns this is raising, especially in Gambella, needs to be taken into account. Sporadic protest and agitation by local communities in opposition to the land deals has occurred in a number of rural areas, and in several cases protest action has had an impact on investor performance. The form of protest has varied from angry complaints made to local authorities by groups of peasants, low level activism, and violent protest. The following are examples from several areas where large-scale land transfers have been made. In 2012, there were two violent incidents in Gambella causing loss of life and serious injuries to people and property. While the perpetrators did not give any statement indicating their reasons for the attacks, opposition to the investment program and the large inflow of outsiders into the area cannot be ruled out as important factors. In the first incident, which took place in March of that year, a bus carrying students and heading to Gambella city was attacked by gunmen and, according to authorities, 19 people were killed and many others were injured. In the second incident, in April, gunmen attacked a Saudi Star worksite in Abobo woreda where men were working on a water diversion scheme in which four Ethiopian staff and one Pakistani were killed. The perpetrators in both cases were said by the authorities to be from a secessionist group called the Gambella Nilotic Union Movement; some of them were apprehended a few months later across the border in South Sudan (Reporter 2012, various issues).
Other dissident groups, not least among the Gambellan Diaspora, have also made strong criticism of the investment program in the Killil. A different kind of protest has occurred to the west of the Killil in Godere woreda, which is noted for its forest cover and lush vegetation. The Godere forest has been designated as one of the 58 protected forests in the country, and the people living here depend on forest resources for their livelihood and have protected the forest since time immemorial. In 2010, a large stretch of the forest, 5000 ha of it, was leased to an Indian investor called Verdanta Harvest against strong protest not only by the local communities but the President of the country (see Zelalem 2009; Dessalegn 2011). It turned out that Verdanta Harvest (part of a large Indian company called Lucky Group), which was given the land to establish a tea plantation, had a different agenda: it was reported by the local authorities that it was engaged in the timber trade and was harvesting the wood from the forest for that purpose. In October 2013, an unidentified group of people set fire to the company’s property destroying and damaging machinery, fuel, vehicles and

235
Large-Scale Land Investments Revisited
241
buildings. The authorities sent a police force and arrested several people said to be responsible for the arson and also set up an investigating committee16.
Other violent protests have occurred in the Arjo Didessa valley where the Pakistani-held plantation was torched by irate peasants who were resentful of losing their land. According to press reports, the fire that was started by unidentified individuals but most probably by angry peasants in the community was said to have raged for three days destroying plantation property and causing severe damage to crops (Reporter 22 February 2012). In 2010, peasants in BakoTibee woreda in western Oromia, where we did field work, took part in a violent agitation against a domestic investor who had recently received 3000 ha of land. Informants told us that the peasants were angry because they considered the land to belong to the community and had been used for generations for grazing, for access to water, and as a venue for traditional social and religious services. Our informants said the authorities had to call in the Federal police to quell the disturbances. The projects under construction by the Sugar Corporation have also been put under pressure by strong reaction in the south Omo valley, in Wolkait in Tigrai as well as in Tendaho in the Awash valley. There is not much information about activism on the part of the indigenous communities in south Omo but the project is guarded by a large detachment of armed troops, and international advocacy organizations have reported a number of arrests of people suspected of being opposed to the project and agitating against it (HRW 2012b, OI 2013) . In Wolkait, there was serious agitation by a large number of priests and community people because the construction of the dam there was said to threaten the integrity of an ancient monastery located nearby. The agitation appears to have calmed down because of assurances given by the project, though according to the report prepared by the Ethiopian Orthodox Church (EOC), three of the churches closely linked with the monastery will be inundated. The report criticizes the Corporation for not consulting with the clergy and the community before launching project activities (EOC 2012). One of the reasons behind the long delay in the completion of the Tendaho project has been persistent dispute with the surrounding pastoralist communities which are concerned the project will deprive them access to their customary sources of pasture and water.
There are also what James C Scott (1985) has called “everyday forms of resistance”, such as driving cattle to graze inside investor plantations, damaging crops and plantation property, or stealing plantation assets. Examples of such activities have appeared in the local press from time to time (Reporter 31 October 2012). At the time of our visit to Bako in 2010, Karuturi’s farm was
16 Both the arson attack and the Gambella authorities complaints against Verdanta are covered in Reporter 28 October and 11 December 2013; also in the Indian paper, The Hindu 5 November 2013

236
Dessalegn Rahmato
242
partially fenced with barbed wire and there were guards on duty carrying automatic rifles. Asked about the armed guards, peasants interviewed said it was to deter people from breaching the fence and grazing their livestock inside the farm which had happened several times in the past. It is not uncommon to see armed guards protecting investor projects elsewhere in the country; in some instances, armed men stand guard over heavy farm machinery out in the field for fear of attacks against them.
In 2012, MOA temporarily suspended land allocations pending a review of the program, the outcome of which was a series of new “reform” measures and institutional changes. A new body, the Agricultural Investment Land Administration Agency, which incorporates the AISD, was set up in June 2013 tasked with the responsibility of improving program governance. Some of its duties include undertaking proper land assessment, setting up strict guidelines for land allocations, closely monitoring investment projects, and ensuring investors employ environmentally sustainable agricultural practices. The Agency will be responsible for managing all lands leased to investors both by the Killils and the Federal MOA as well as land transferred to the Federal land bank (MOA 2013). This enhanced power by a Federal Agency will certainly further erode the authority of the Killils regarding land administration. It is evident that the Killils will now have hardly any role in land investment which has become the sole preserve of the Agency. The Agency is also charged with administering the Agricultural Economy Zones, to be set up in 2013 with an initial land fund of 285,000 ha spread over several Killils. The government is to provide basic infrastructure in the Zones and lease the land to investors for a much higher rent than previously. The reforms also call for scaling down the amount of land allotted to new investors who will now be offered, initially, 500 ha (or even less), though this could be raised up to a maximum of 3000 ha under certain circumstances. The UNDP assessment report noted above recommended the establishment of a cap on leases in each Killil at a level shown to be most efficient in terms of investor land use, advising a maximum limit of 2000 ha. There are also plans to establish some sort of criteria for determining land use efficiency which will be followed by land repossessions (in whole or in part) from investors who fail to meet the criteria. The AISD and Killil authorities had already revoked the leases of a number of foreign investors (in BeniShangul, Gambella and Oromia) on account of failing to use the land they had acquired and breach of contract (FDRE 2013; MOA 2013; Reporter interview 8 Sept 2013; UNDP 2012).
The conclusion to be drawn from all this is that the country’s land investment program, launched in the 1990s but more vigorously pursued with the participation of foreign capital in the last six years, has been a failure, and all the indications are that it is unlikely to achieve its major objectives in the years

237
Large-Scale Land Investments Revisited
243
ahead. The assessment commissioned for UNDP and MOA does not provide a comprehensive picture of the investment program, focusing mainly on investor performance, land use efficiency and related issues. The broader questions of the program’s impact on the environment, whether or not there is a role for democratic governance, and the choice of large-scale agriculture driven by foreign capital as a vehicle for sustainable development have not been given due consideration and the remedy that is proposed focuses essentially on technocratic change and improvements in investor management.
What is to be done? The wave of land acquisitions in Africa and elsewhere, in the past five to six years, has elicited varied reactions and concerns from a wide diversity of regional and international organizations, advocacy groups, development practitioners and the academic and research communities. Some of these reactions have been strong. The African Union Commission, for example, expressed deep concern over what it called the “new scramble for Africa” - an apparent reference to the historical Scramble for Africa when the continent was carved up among a small number of European colonial powers in the 19th century (AUC 2009). The Eastern Africa Farmers Federation, in its Entebbe Declaration of 2010, was highly critical of foreign land grabbing, declaring that securing the land rights of small farmers, pastoralists and fisher folk remains the best option not only for addressing hunger and poverty but also for wealth creation (EAFF 2010). The response of such advocacy groups as GRAIN, Human Rights Watch and the Oakland Institute has been equally robust: they have claimed that these acquisitions are unjust and have been accompanied by human rights abuses and heightened the vulnerability of small producers in most of the host countries.
Closer to home, long before the global outcry about land grabbing, Ethiopian civil society organizations, notably environmental advocacy groups, had expressed serious concern about the ecological and economic impact of the land rush taking place in the country in 2007 and 2008. They were particularly concerned about the program of “agrofuel development” pursued by the government, and the large stretches of land being ceded, without adequate environmental safeguards, to foreign companies claiming to help the country achieve energy security (Ensermu et al 2009, MELCA Mahiber 2008, Tibebwa and Negusu 2008). They saw and pointed to the dangers hanging over critical natural resources and wildlife in a number of national parks and protected areas which were being threatened by investor encroachment. They raised the alarm when, for example, land in a protected area in southeastern Ethiopia which was the habitat of a unique species of elephant found only there was given to a

238
Dessalegn Rahmato
244
German company growing castor beans for biofuel. Similar concern was expressed when lands in SNNP which were part of or very close to Omo and Mago national parks, and forest land in Gambella were offered to investors. These concerns are still valid today
On the other hand, international organizations such as the World Bank (2010), FAO (2010) and others have adopted a conciliatory approach, arguing that in the best of circumstances land investments could lead to a “win-win situation” in which all parties concerned, not least governments, local communities and investors, could benefit. The World Bank (2010) in particular has maintained that African countries have considerable “underutilized” land but they lack the requisite capital and technology to develop it and hence must attract foreign investment. It accepts however these governments lack adequate capacity for sound and effective investment governance and to help them make up this deficit and create a win-win situation the Bank, along with its other partners, have proposed what is known as the principles of responsible agricultural investment. These principles call on governments to establish clear laws on tenure security and to respect these laws, conduct land deals in a transparent manner, and ensure that investment governance includes measures for environmental protection and sustainable land management. Businesses are required to be guided by widely accepted norms of corporate social responsibility and self-regulation. All these measures, however, are to be put into practice on a voluntary basis (ibid).
This “code of conduct” approach, if we may call it that, has been widely criticized17. Critics have argued that the underlying assumptions are flawed. The approach does not question whether there are other viable options to large-scale land investments, or indeed whether such investments are desirable. It merely recommends that all parties concerned should follow best practices and be governed by mutually beneficial regulations. Many of the countries where land grabbing has occurred do not have good credentials regarding democratic governance and respect for the law. They often lack a strong and independent judiciary, and small producers and the poor in general do not believe they can get justice or a fair hearing for their grievances. An additional factor in Ethiopia is that civil society and advocacy groups which would have played an important role in raising awareness and supporting the demands of small producers have been seriously crippled by a recent law (FDRE 2009a). To expect investors, such as those that have leased land in this country, to voluntarily adopt self-regulation
17 See Borras and Franco (2011), and De Schutter (2011), White et al (2012) for the criticism

239
Large-Scale Land Investments Revisited
245
and corporate social responsibility is unrealistic. The farm projects set up here or elsewhere in Africa are capitalist enterprises whose sole aim is to make profit for their owners in a short period of time. In many instances, investors will be driven by a “get-the-maxim-profit-quick” approach because of uncertainties regarding political stability in the host country and concerns having to do with volatility in the global agricultural and financial markets. These pressures will, in all likelihood, drive many to employ environmentally unsustainable land management methods and to refrain from long-term economic or social investments.
Some critics have gone further and questioned whether large-scale land investment is a viable option or desirable for countries dominated by small holders and family-based farming systems. One such critic is De Schutter (2011) who has argued that giving away large tracts of land has immense opportunity costs because it will lead to a type of farming which will have less poverty reduction impacts compared to revitalizing small farmers, and will direct agriculture towards the export market, thus increasing the country’s vulnerability to price shocks. Moreover, the experience of countries such as India and China in the recent past, countries with predominantly family-based farming systems is instructive. These countries were able to register high rates of agricultural productivity and meet domestic demand for food and other agricultural goods without foreign capital or without shifting to large-scale farming systems. India’s successful green revolution which enabled the country to attain self-sufficiency in many food crops and to become a net exporter of rice was based on strong public sector support to its small and medium farmers through a variety of targeted programs. Similarly, China’s agricultural breakthrough in the 1980s came thanks to land tenure reforms and the implementation of what was called the household responsibility system, which transferred responsibility for land management from the commune, which was inefficient and wasteful, to the individual household (see Quizon 2013).
In our case, the real criticism of the land investment program must focus, not merely on issues of inadequate governance and lack of management capacity, but rather on fundamental issues of policy choice and principle. As was noted above, state-led development is inherently undemocratic, eschewing consultation and public dialogue in the decision-making process and attributing almost divine omniscience to the state elite. Among the fundamental democratic principles that the investment program has flouted with detrimental effects are the following: a) the right of local communities to have an informed say in matters having to do with the utilization and disposal of land and other natural resources in their locality; b) the right of informed consent by communities without which: i) local natural resources cannot be ceded away to outsiders, and ii) community residents cannot be moved from their ancestral lands. Other

240
Dessalegn Rahmato
246
significant limitations have been the lack of transparency in program design and management, blind faith in what decision makers thought was the transformative power of large-scale farming and foreign capital, and the failure to incorporate the goals of food security and poverty reduction as important objectives of the program. It is quite evident that the new policy review and the changes initiated as a result have not provided any improvements in this regard.
The choice made by decision makers to promote land deals and entice foreign capital to promote agricultural development has been counter-productive. The assumption held by decision-makers that agricultural transformation would be achieved through the instrumentality of foreign capital is proving illusory, and, if not seriously reconsidered in the light of the current experience, will cause immeasurable damage in the long run. The more judicious policy option would be to invest in a program of what I wish to call internally-driven agrarian transformation. Such a program would involve, among other things, not only channeling greater resources into modernizing smallholder agriculture, but also, importantly, encouraging, through a variety of support mechanisms, the growth and development of resident farmer-investors from among the peasantry and other land users. The goal would be to enable such farmer-investors to operate large-scale farms so that they can play an important role in the modernization of agriculture. There are already a good number of dynamic and entrepreneurial peasant farmers in the rural areas but they face, at present, a host of financial, institutional and technical road blocks inhibiting their efforts and the chances for progress. Enabling these farmers to grow and become investors will take time but it is an investment worth the effort and the resources expended in the medium to long term. Such farmer-investors have the advantage of extensive practical knowledge of farming and local conditions combined with respect for the environment and natural resources. These farmers live in the rural areas among their own communities and are more likely to be more eco-friendly and more responsible in their enterprise than external investors. What indigenous farmers lack in access to capital and technology, which can be remedied without too much difficulty by prudent and timely financial and technical support, can be compensated by their greater practical know-how, social responsibility, and sense of accountability.

241
Large-Scale Land Investments Revisited
247
Acronyms AISD: Agricultural Investment Support Directorate CSA: Central Statistical Agency DI: Development Initiatives (Nairobi) EOC: Ethiopian Orthodox Church EPA: Environmental Protection Authority FAO: Food and Agricultural Organization FDRE: Federal Democratic Republic of Ethiopia GTP: Growth and Transformation Plan Ha: Hectare(s) HRW: Human Rights Watch IMF: International Monetary Fund MOA(RD): Ministry of Agriculture (and Rural Development). MOFED: Ministry of Finance and Economic Development MOPED: Ministry of Planning and Economic Development OI: Oakland Institute SNNP: Southern Nations, Nationalities and Peoples USD: United States Dollar(s) References
NOTE. Following customary usage, Ethiopian authors are listed alphabetically by first name.
African Union Commission 2009. Framework and Guidelines on Land Policy in Africa. African Development Bank and Economic Commission for Africa. Addis Ababa
Ayelech Tiruwha Melese and A,H.J Helmsing 2010. Endogenisation or Enclave Formation? The Development of the Ethiopian Cut Flower Industry. Journal of Modern African Studies 48,01: 35-66
Borras Jr. S M and Jennifer Franco 2010. Towards a Broader View of the Politics of Global Land Grab. Rethinking Land Issues, Reframing Resistance. ICAS Working Paper Series No. 001. Initiatives in Critical
242
Dessalegn Rahmato
248
Agrarian Studies, Land Deals Politics Institute and Transnational Institute. Accessed by web search]
Central Statistical Agency (CSA) 2005 – 2012. Consumer Price Index Reports. Addis Ababa, CSA
____ 2012. The 2010/11 Ethiopian Households Consumption – Expenditure (HCE) Survey. Statistical Report. Addis Ababa, December
Cotula, L, S. Vermeulen, R. Leonard and J. Keely 2009. Land Grab or Development Opportunity? Agricultural Investment and International Land Deals in Africa. London: International Institute for Environment and Development
De Schutter, Olivier 2011. How not to Think of Land-Grabbing: Three Critiques of Large-scale investments in Farmland, Journal of Peasant Studies, 32,2: 249-279
Dessalegn Rahmato 2009. The Peasant and the State: Studies in Agrarian Change in Ethiopia 1950s – 2000s. Addis Ababa: Addis Ababa University Press
_____201l. Land to Investors. Large-Scale Land Transfers in Ethiopia. Addis Ababa: Forum for Social Studies.
Dessalegn Rahmato, Alula Pankhurst and Jan-Gerrit van Uffelen (eds) 2013. Food Security, Safety Nets and Social Protection in Ethiopia. Addis Ababa: Forum for Social Studies.
Development Initiatives 2013. Ethiopia. Resources for Poverty Eradication: A Background Paper. By Peace Nganwa. Africa Hub, Nairobi, February
Eastern Africa Farmers Federation 2010. The Entebbe Declaration on Large Foreign Land Acquisitions. www.eaff.org Accessed 2012.
Ensermu Kelbessa, Negusu Aklilu and Tadesse Woldemariam (eds) 2009. Agrofuel Development in Ethiopia: Findings of an Assessment. Addis Ababa, Forum for Environment
Ethiopian Orthodox Church (EOC) 2012. Report of the Dispute between Waldiba Monastery and Wolkait Sugar Project. Mahibere Kidusan, Addis Ababa.
Federal Democratic Republic of Ethiopia 2002a. Re-Enactment of the Investment Proclamation. Proclamation No. 280, Negarit Gazeta, Addis Ababa, July
_____2002b. Environmental Impact Assessment Proclamation. Proclamation No. 299, Federal Negarit Gazeta, Addis Ababa, December
_____2010. Council of Ministers Directive regarding the Administration of Agricultural Investment Land. [Unpublished], Addis Ababa, March

243
Large-Scale Land Investments Revisited
249
_____2008. Freedom of the Mass Media and Access to Information Proclamation. Proclamation No. 590, Negarit Gazeta, 4 December. Addis Ababa
_____2009a. Proclamation to Provide for the Registration and Regulation of Charities and Societies. Proclamation No. 621, Negarit Gazeta, Addis Ababa, February
_____2009b. Anti-Terrorism Proclamation. Proclamation No. 652, Negarit Gazeta, Addis Ababa, August
_____2013. Council of Ministers Regulation to Establish the Ethiopian Agricultural Investment Land Administration Agency. Council of Ministers Regulation No. 283/2013. Federal Negarit Gazette, March 4, Addis Ababa
Food and Agricultural Organization (FAO) 2010. Eastern and Anglophone Western Africa Regional Assessment: FAO Voluntary Guidelines on Responsible Governance of Tenure of Land and Other Natural Resources, Addis Ababa, Ethiopia, 20-22 September, 2010
Fortune 2012-2013. English language business weekly, various issues. Fouad Malik 2012. Power and Property: Commercialization, Enclosures, and the
Transformation of Agrarian Relations in Ethiopia. Journal of Peasant Studies, 39,1: 81-104
GRAIN 2010-2012. www.grain.org ______ Land Grab Threaten Annuak. www.grain.org Accessed 2012 Human Rights Watch 2012a. “Waiting Here for Death”. Forced Displacement
and “Villagization” in Ethiopia’s Gambella Region. www.hrw.org Accessed 2012
____ 2012b. “What Will Happen if Hunger Comes”. Abuses against Indigenous Peoples of Ethiopia’s Lower Omo Valley. www.hrw.org Accessed 2012
International Monetary Fund (IMF) 2012. The Federal Democratic Republic of Ethiopia. Staff Report for 2012 Article IV Consultation. Washington, D.C., 27 August
Journal of Peasant Studies 2011 and 2012. Various issues in Volumes 38 and 39 Kassahun Berhanu 2012. The Political Economy of Agricultural Extension in
Ethiopia: Economic Growth and Political Control. Working Paper 042, Future Agricultures, University of Sussex, Brighton
Lavers, Tom 2012. “Land Grab” as Development Strategy? The Political Economy of Agricultural Investment in Ethiopia. Journal of Peasant Studies, 39,1: 105-132

244
Dessalegn Rahmato
250
MELCA Mahiber 2008. Rapid Assessment of Biofuels Development Status in Ethiopia and Proceedings of the National Workshop on Environmental Impact Assessment and Biofuels. Addis Ababa, September
Ministry of Agriculture (MOA). www.moa.gov.et Accessed in 2012 _____2013. Agricultural Investment Land Administration Agency
Implementation Manual. [Amharic] Addis Ababa, Draft. August Ministry of Agriculture and Rural Development (MOARD). www.moard.gov.et
Accessed in 2010 _____2008. Agricultural Investment Potential of Ethiopia. Addis Ababa,
November ____ 2009a. List of Investment Projects in Agriculture Sector from July 1992 –
February 6, 2009 (Compiled from Killil investment data), Addis Ababa _____2009b. Planned System for Administration of Investment Land [Amharic].
Addis Ababa, June Ministry of Finance and Economic Development (MOFED) 2003. Rural
Development Policy and Strategies. Addis Ababa, April ------2010a. Updated 2nd PASDEP Agric. Sec. Plan (2003- 2007) [2011-2015].
PDF file. _____2010b. PASDEP – 2011 Plan. Final. PDF file _____2010c. Growth and Transformation Plan (GTP) 2010/11 – 2014/15. Draft.
Addis Ababa, September Ministry of Planning and Economic Development. (MOPED) 1994. Agricultural
Development Led Industrialization. A Development Strategy for the Future. Addis Ababa, June
Oakland Institute 2010. Mismanagement in Agriculture. The Role of the International Finance Corporation in Global Land Grabs. www.oaklandinstitute.org Accessed 2011
_____2011. Understanding Land Investment Deals in Africa. Country Report: Ethiopia. www.oaklandinstitute.org Accessed 2011
____ 2013. Omo: Local Tribes Under Threat. A Field Report from the Omo Valley, Ethiopia. www.oaklandinstitute.org Accessed 2013
Quizon, Antonio B. 2013. Land Governance in Asia. Understanding the Debates on Land Tenure Rights and Land Reforms in the Asian Context. Series No. 3, International Land Coalition, Rome.
Reporter 2012 and 2013. Twice weekly independent Amharic newspaper. Various issues for these years.

245
Large-Scale Land Investments Revisited
251
_____2013. Interview with Ato Bizualem Bekele, Coordinator, Agricultural Investment Support Directorate in MOA, [Amharic], Addis Ababa, 8 September
Scott, James C 1985. Weapons of the Weak: Everyday forms of Peasant Resistance. New Haven: Yale University Press
Tewolde Woldemariam and Fana Gebresenbet 2013. Socio-political and Conflict Implications of Sugar Development in Salamago Wereda, Ethiopia. Unpublished paper, Addis Ababa
Tibebwa Heckett and Negusu Aklilu (eds) 2008. Agrofuel Development in Ethiopia: Rhetoric, Reality and Recommendations. Addis Ababa: Forum for Environment
UNDP 2012. An Assessment of Factors Affecting the Performance of Ethiopian Commercial Farmers. Report of Mission for UNDP-Ethiopia; May-June 2012. AA International Ltd, Ceredigion, Wales
White, Ben, S.M Borras Jr., Ruth Hall, I. Scoones, and Wendy Wolford 2012. The New Enclosures: Critical Perspectives on Corporate Land Deals. Journal of Peasant Studies, Vol. 39,3-4: 619-47
World Bank 2010. Rising Global Interest in Farmland. Can It Yield Sustainable and Equitable Benefits? Washington, D.C., September
_____2013. Ethiopia. Economic Update II. Laying the Foundations for Achieving Middle Income Status. Washington, D.C. June
Zelalem Temesgen 2009. Godare Forest and Possible Impacts of its Conversion to Oil Palm Plantation. In Ensermu et al (eds), pp. 133-151


253
9 Asnake Kefale and Fana Gebresenbet
The Expansion of the Sugar Industry in the Southern Pastoral Lowlands
Background
The Growth and Transformation Plan (GTP) which covers the period 2010/11-2014/15 advocates a geographically differentiated agricultural development in the country. The document emphasizes scaling up of best practices, expanding irrigation development and improving natural resource management and production of high value crops in the highlands and irrigation, livestock development, and resettlement in pastoral lowlands. According to the Ministry of Finance and Economic Development (MoFED), while smallholders in the highlands are expected to commercialize and intensify their production, land in peripheral lowlands will be leased to investors (2010).
Given the geography of Ethiopia, it is understandable that most of the lands transferred to investors and apportioned for the ongoing project of massively expanding the sugar industry are by and large found in the lowlands. According to the MoFED, much of the 3.3 million hectare (ha) of land slotted for transfer to agricultural investment between 2010/11 and 2014/2015 is found in peripheral lowlands (2010). These lowlands are inhabited by ethnic groups subsisting on livelihood systems which depend on expansive utilization of natural resources: shifting cultivation in southwestern lowlands and (agro-) pastoralism in southeastern lowlands. The logic of these livelihood strategies is not legible to the political and economic elite, which is mainly drawn from the highlands, not least because the lowland economy is not commoditized and thus the state extracts little revenue, if any. Geography, however, is not only juxtaposed with livelihood strategies: it is also overlaid on center-periphery political relations between the politically powerful highlanders1 and marginalized lowlanders. Thus, these land transfers, mainly designed and
1 The highlander category is not homogenous; the northern highlanders constitute the political and historical center. The southern highlanders, however, fare much better than the lowland periphery in political as well as economic terms (Markakis 2011).

248
Asnake Kefale and Fana Gebresenbet
254
implemented from the political center, follow the historic center-periphery divide in Ethiopia (Makki 2011).
The Federal government manages the transfer of land to foreign as well as domestic investors. It has created what it called a Land Bank, to which regional states transfer ‘unsettled’ land which could be utilized for commercial agriculture. Furthermore, through the Agricultural Investment Support Directorate of the Ministry of Agriculture and Rural Development (MoARD), the Federal government gives permit to all foreign agricultural companies after reviewing their applications. Domestic investors will fall under the purview of the Directorate only if the land area to be put under cultivation is larger than 5,000 ha.2 The state is not solely limited to facilitating and regulating land transfers, and controlling progress on committed investment, but through the Sugar Corporation and the Ethiopian Chemical Industries Corporation, it acts as an investor too. These Corporations are establishing sugar cane and rubber plantations respectively.
In this chapter, we are interested in examining the expansion of the sugar industry, and the political and economic implications of such state-managed industrialization. The remaining part of the chapter is divided into six sections. In the first, we trace the evolution of the politics of development governance. Then we trace the contours of change in development policy from Agricultural Development Led Industrialization (ADLI), a policy that gives heavy emphasis to agricultural development, to GTP’s goals of bringing industry to play the major role in the economy. Third, we provide an overview regarding the magnitude of the ongoing projects of sugar development based on the GTP document as well as data from the Sugar Corporation. Fourth, we explore the impacts of the sugar cane plantations in pastoral lowlands by considering the case of the Kuraz Sugar Development Project (KSDP) in South Omo. Finally, brief remarks are made by way of conclusion.
The politics of development governance The role that the state plays in the economy has been one of the long standing questions of political economy. Different strands of political/economic thought emerged in a bid to identify the right role the state should play in the economy (Tanzi 1997; Chang 2003). Without delving into the historical and philosophical debates about liberalism and socialism/statism, in this section, we will trace how ideas/theories about
2 Interview with an Expert of Agricultural Investment Support Directorate of the MoARD, January 2013.

249
The Expansion of the Sugar Industry in the Southern Pastoral Lowlands
255
the governance of development in Africa as well as Ethiopia have been shifting in the last few decades.
Since independence, Africa has been a testing ground of many models of development. The first generation of African leaders ‘adopted State-led development strategies whereby governments played a pivotal role not only as facilitators and regulators but also as producers, traders and bankers’ (ECA 2011: 1). Indeed, immediately after independence, many of the African countries adopted a model of development that vested the responsibility of leading the economy in the state (Rempel 2008; Mkandawire 2001). Many African countries (including Ethiopia) adopted various forms of socialism – which advocated the control of the vital sectors of the economy and undermined private initiative. Even if this approach could be credited for its emphasis on social justice, it failed to bring economic transformation.
While policies of interventionism that spanned from the 1960s till the beginning of the 1980s were informed by the idea of ‘market failures’, starting from the 1980s African development discourse began to be dominated by the idea of ‘state failure’ (van de Walle 2003). Consequently, under the rubric of structural adjustment programs (SAPs), African countries used fiscal, monetary and trade policies to correct macroeconomic imbalances and stimulate growth (Cassen, 1994). The underlying assumption of the new policy shift had been the need to radically reduce the role of the African state in the economy and provide incentives to the private sector. By making aid and loans conditional on structural adjustment, western governments and the international financial institutions, notably, the World Bank and the International Monetary Fund (IMF), forced the now infamous SAPs on African countries. As part of SAPs, many African countries not only privatized para-statals which were draining their economics, but also severely reduced funding to basic social services like education and health resulting in adverse socio-economic consequences (ILO 1993; Adepoju 1993).
In tandem with economic liberalization, western powers and their institutions promoted the good governance project. The absence of good governance was blamed as one of the key causes for the lack of progress in the continent (World Bank 1989). The project was intended to infuse Weberian principles and practices of rational bureaucracy. By undertaking good governance reforms, African governments and bureaucracies were expected to adopt some of the basic standards of Weberian bureaucracy which, among others, includes transparency, accountability and the rule of law (Dahlstrom et al, 2012).
After the onset of the 21st century, there is a growing consensus that the reform measures that were forced upon African states by and large failed to

250
Asnake Kefale and Fana Gebresenbet
256
produce the desired results. In the political front, reforms that were undertaken in much of Africa have not really led to genuine democratization (Lynch and Crawford 2012). Across Africa, with the exception of a few countries, multiparty democracy has failed to materialize. In the wake of the third wave of democratization, the principle of multiparty democracy found its way into the constitutions of almost all African countries. But in the majority of these countries, conditions that would allow the realization of genuine multiparty democracy are simply nonexistent. While it is true that democracy is a work in progress and needs time to bear fruit, in much of Africa the processes of democratization, which were initiated at the beginning of the 1990s, have disappeared. In fact, the little gains that were accrued during the heyday of the third wave of democratization in many African countries were reversed. Regimes and leaders, who like to preach about the indispensability of democracy for the survival of their nations, routinely stifle dissent in practice. One can say, in many African countries, there is no level playing field for both incumbent regimes and the political opposition to allow multiparty democracy to function. Consequently, elections are routinely rigged and civil society and political opposition parties are intimidated by regimes headed by strong men. Ethiopia is not an exception from this wider continental trend.
In the economic front, there is an impending consensus that SAP was a failure. As a result, policymakers and scholars are currently engaged in exploring alternative paths of development. Once again, the role that the state should play in steering the development of the continent has been given focal attention. While the discourse and policy direction since the beginning of the 1980s was about withdrawing the state from the economy, the focus presently is about the centrality of the state in bringing about development (Mkandawire 2001). By borrowing ideas from the experiences of East Asia, a few African regimes are now branding themselves as champions of developmental state. This move has been also endorsed by such international organs like the UN Economic Commission for Africa (ECA). According to the ECA, the failure of earlier approaches, both State-led and market-driven, points in the direction of a developmental state that uses the market as an instrument rather than a ‘mechanism’ for fostering long-term investment, rapid and sustained economic growth, equity and social development, and does this in the context of a democratic, inclusive and comprehensive national development framework (2011: 2).
In recent years, Ethiopia has become one of the champions of the developmental state model in Africa. The ruling party, the Ethiopian Peoples’ Revolutionary Democratic Front (EPRDF), at least since 2006/7 follows what it calls a ‘democratic developmental state’. The late Prime Minster, Meles Zenawi was critical of what he dubbed the neo-liberal approach to development and
251
The Expansion of the Sugar Industry in the Southern Pastoral Lowlands
257
argued the indispensability of the developmental state model for Africa. To allay fears that the developmental state model abets and promotes authoritarianism, the late Prime Minister named his strategy of development ‘democratic developmental state’ (see de Wall, 2013). While the attempt to marry developmental state to democratic norms could be lauded, in practice, the little progress that was achieved in Ethiopia at the beginning of the 1990s in terms of freedom of speech, and associational life, be it political or civil society, has been reversed after the EPRDF was shocked by the strong showing of the opposition parties in the 2005 national and regional elections. Since the controversial elections of 2005, the EPRDF has put greater emphasis on its developmental credentials. The GTP of the Ethiopian government which was issued in 2010 puts the vision of the country as ‘extricating itself from poverty to reach the level of a middle-income economy as of 2020-2023’ (MoFED 2010: 21).
One of the natural outcomes of the policy of developmentalism has been the massive expansion in the role of the state in the economy. The government continued to own strategic and key sectors of the economy like telecommunications, electricity and finance. On the top of these, new government owned large corporations, namely, the military run Metals and Engineering Corporation (MetEC), Sugar Corporation and Chemical Industries Corporation were established.
There is, of course, not a mutually agreed definition of what constitutes a developmental state. As mentioned above, however, developmental states share one similar feature, namely, the expansive role that the state plays in the economy. Nonetheless, if the experiences from East Asia, from where the idea of the developmental state has been derived, give us any indication about the key attributes of a developmental state, the following factors need to be underscored. Implementing the projects of the developmental state requires: first, the presence of a capable, autonomous bureaucracy (Evans cited in Routley 2012: 8); second, a political leadership oriented and committed to promote development (Musamba; Fritz and Menocal cited in Routley 2012: 8); third, a close, often mutually beneficial symbiotic relationship between some state agencies (often discussed as pilot agencies) and key industrial capitalists (Johnson cited in Routley 2012: 8); and fourth, successful policy interventions which promote growth (Wade; Beeson cited in Routley 2012: 8).
When we consider the Ethiopian situation in light of the above four features, there are a few but crucial elements missing in the organization of the developmental state. More worryingly, there is no capable bureaucracy. This has

252
Asnake Kefale and Fana Gebresenbet
258
been openly admitted by the government on several occasions.3 The development of an autonomous and capable bureaucracy has been frustrated in Ethiopia due to a host of factors. First, there is a high degree of skills deficiency in the bureaucracy due to limited educational preparation. Second, the established bureaucratic culture within government organizations is historically characterized by inertia and benefiting from those who seek the services of the government rather than efficiently providing services. Third, appointments to key positions of the bureaucracy, or, these days, even employment to the rank and file of the bureaucracy have been increasingly used as instruments of patronage by the ruling party and its affiliates. Fourth, petty and grand corruption is becoming a major problem. In particular, there is a strong belief about the presence of systemic and widespread corruption relating to tax administration, land management and government contracts (See FEACC 2012: 28-33). While the government now and then undertakes a wave of arrests of officials alleged to have been involved in corruption, the problem of corruption in the country is growing. All these undermine the autonomy and capability of the bureaucracy to provide the required services in implementing the projects of the developmental state.
In addition to the poor state of the bureaucracy, there is little progress in the development of mutually beneficial and symbiotic relationship between agencies of the government and the private sector. Some positive steps have been taken by the government by establishing government agencies that help to steer the support of the government to the leather and textile sector. Notwithstanding this, relationships between the private sector and the government are not based on mutual trust and confidence. The EPRDF has a dualistic view of the players of the private sector – those who seek rent (benefit by using their connection with the government) and developmental investors. And it vows to control the rent seekers and support the developmental investors (EPRDF, 2006). But in reality, it is difficult to identify which investors are rent seekers and which are not. Because of all these, one can conclude that the Ethiopian developmental state is not in a position to unleash the full potential of the private sector. This would definitely hamper the prospects for growth and overall development. At the same time, it is too early to talk of either the success or failure of the new government corporations in meeting their goals; the experiences of the existing monopolies of telecommunications and electricity do not provide a reassuring message. In what follows, we examine the shift in
3 For example, the most recent Congress of the EPRDF, from March 2013, highlighted the progress made as well as the remaining difficult task of building the skill of the leadership as well as professional staff of the civil service (see EPRDF, 2013).
253
The Expansion of the Sugar Industry in the Southern Pastoral Lowlands
259
development policy from agriculture to industry envisaged by the developmental state.
Transforming the Ethiopian agrarian economy: from ADLI to GTP Ethiopia’s economy is predominantly agrarian. In the densely populated highlands, where the majority of the population of the country lives, smallholder subsistent agriculture is still the dominant source of livelihood to millions of farmers.4 In the lowlands, which are sparsely populated, nomadic pastoralism, agro-pastoralism and shifting cultivation are widely practiced. A great majority of the population, 83.9% according to the latest census (Central Statistical Agency [CSA] 2008), resides in rural areas subsisting on primary economic activities. In the past two decades, the government has adopted and implemented policies which first and foremost are geared towards increasing agricultural productivity, with the aim of exploiting the excess labor in the sector, meeting nutritional requirements of the population and contributing towards the launching of an industrial economy from the surplus thereof (MoFED 2003). Thus, the ADLI strategy encourages the adoption and implementation of agricultural technologies which are labor intensive and with little capital requirement.
The Ethiopian government on several occasions reiterated the success of ADLI in yield increment. But yield increment reported by the Ethiopian government is much higher than those recorded during the Green Revolutions of India, China and Vietnam. Indeed, a ‘nationally representative, but small, household survey’ (Dercon and Vargas Hill 2009) and estimates from satellite imagery indicate that there is an apparent overestimation of cereal yield increment on the part of the Ethiopian Central Statistical Agency (ibid). As there was no significant increase in agricultural input use in the period in question, the reported yield increment, if correct, could not be explained by use of agricultural inputs (ibid), but possibly explainable by increasing labor hours and productivity.5 The success of the agricultural extension service is also questionable, with reports of dis-adoption of agricultural technologies being not uncommon (Spielman, et al. 2013).
4 In the first two decades of post-1991 Ethiopia, the contribution of the manufacturing sector to the economy stalled at five percent, while increase in the service sector made up for the decline in agriculture (Tilman 2010). 5 Alemayehu, et al. (2013) assert that most of the increase in agricultural production in the 1990s was from expansion in agricultural land, but in the 2000s rate of expansion dropped and productivity picked up to 3.5 %. Furthermore, Dorosh and Thurlow (2013) attribute two-third of increase in cereal yield to increase in cultivated land.
254
Asnake Kefale and Fana Gebresenbet
260
Despite self-reported success of ADLI, the Ethiopian government seems to be shifting its development as well as food security strategies. Now primacy is given to build the manufacturing sector, not from surplus from the agriculture sector, and the country’s food security strategy is trade based (Lavers 2012). Lavers also adds that ADLI is maintained in official discourse for political reasons, not economic. Dorosh (2013) has a more favorable assessment of the success of ADLI. Contrary to findings of most contributions to the book he co-edited, he gave the generous judgment that ADLI has succeeded ‘to a large extent.’ Looking at the future, Dorosh too agrees that the agriculture sector could not be relied upon to build a vibrant economy.
As Lavers (2012) noted, the continued dependence of the country on food aid is a good indicator that ADLI did not bear the expected fruits. As much as seven million ‘chronically food insecure’ individuals are supported by donor-funded Cash/Food-for-Work Productive Safety Net Program (PSNP) (MoARD 2009), with additional millions getting emergency food aid. For example in mid-2011, about 4.5 million people were declared as in need of humanitarian assistance by the government.6 Even if there was an increase in productivity, extreme poverty in rural households would mean that the gains in yield increment will end up being consumed rather than getting marketed and increasing demand for manufactured consumer goods (Dercon and Vargas Hill 2009).
Therefore, the prominence of ADLI is declining and there is a shift to commercial agriculture and industry. In the past few years, little mention of ADLI is made in official public discourse. There is a clear shift of policy towards ‘value creating’ sectors like manufacturing and agro-processing. Ethiopia’s developmentalism is being implemented by a state which is increasingly assuming roles in the market under the guise of punishing rent-seeking and rewarding value-creating investments.
The rhetoric of building a democratic developmental state7 took center stage in Ethiopian politics in 2006,8 as the 2005 post electoral violence 6 See the Horn of Africa Update from WFP at http://www.fao.org/crisis/28468-0f4867a04e5f616834829d544ce27de20.pdf 7 Ohno (2009: 4) explains that developmental state is a paradigm Ethiopia strives to attain (thus, Ethiopia is not there yet) and defines it as “a political regime in which a developmental party remains in power for a long time by consecutively winning free elections which permit multiple parties, under which policies that punish rent seeking and encourage productive investment are implemented with a strong state guidance.” 8 It was in 2006 that excerpts from the late PM Meles Zenawi’s work about development was posted online, but De Waal (2012) informs us that the very excerpt published online in 2006 was part of Meles’ MA thesis prepared in 1998, stopped short of completion by the Ethio-Eritrea war. Mention of intention to build a developmental state was also made after the split in the TPLF

255
The Expansion of the Sugar Industry in the Southern Pastoral Lowlands
261
discredited the ‘good governance/democratic’ agenda of the government. Currently, the paramount paradigm followed by the government in all aspects is developmentalism, which the Ethiopian government presents as only a ‘shift in emphasis’ within the comprehensive and flexible scope of ADLI (Ohno 2009: 25). Moreover, Ohno (2009) argues that ADLI and the developmental state are not mutually exclusive, and cover economic and political aspects of development respectively. The World Bank, however, considers the adoption of the developmental state agenda as a directional change from ADLI (Ohno 2009: 25).
The premise of the developmental paradigm in Ethiopia is that the neo-liberal imposition of reducing the African state to a non-interventionist ‘night watchman’ capacity has failed to bring rapid and sustained development and democratization to Africa (Meles 2011).9 An ideal political structure of a developmental state strives to stave-off pervasive market failures, institutional inadequacies, patronage networks and ‘socially wasteful rent-seeking’ and deploys ‘its authority, credibility and legitimacy’ to effect transformation and diversification of the economy (ECA 2011: 7) by providing disincentives (sticks) and incentives (carrots) to discourage rent-seeking and promote value-creating investment by widening its policy space and capability (Ohno 2009).
Building a developmental state of course is not new; it has been pursued by different states to various degrees of success and has resulted in the East Asian economic miracle, the most successful being South Korea, Taiwan, Singapore and Hong Kong. But unlike the authoritarian governments which successfully, to various degrees, implemented the paradigm in Asia and elsewhere, the Ethiopian version at least in theory will comply with democratic norms. In practice, however, EPRDF has been monopolizing power in elections which are little disputed and the chance for fair and free elections is increasingly getting diminished. The transformation of the economy and the ideal of building a developmental state are central in the current economic plan under implementation. The GTP is different, compared to previous five-year development plans—the Sustainable Development Poverty Reduction Programme (SDPRP; 2002-2005) and the Plan for Accelerated and Sustainable Development to End Poverty (PASDEP; 2005-2010)—as it promises to transform the country’s economy into an industry-based economy and to work leadership in 2001 (Vaughan 2012), but we contend that it took center stage only after the 2005 elections. 9 Ethiopia’s developmentalism, as an ideology and policy, seemed to have been crafted and implemented as per the directions of the late PM Meles Zenawi. He argued against the assumptions and theoretical foundations of the neo-liberal state and in favor of an African developmental state in a book chapter he authored (Meles, 2011). A 2011 report of the United Nation’s Economic Commission for Africa (ECA 2011) also recommends African states to become developmental.
256
Asnake Kefale and Fana Gebresenbet
262
towards putting Ethiopia among middle income countries in two decades time. Major grand projects of the GTP and which are now under construction include: ten sugar factories, and a national railway network. The Grand Ethiopian Renaissance Dam (GERD),10 which will be the largest hydroelectric power plant in Africa is another mega project under construction.
Agro-industrialization: sugar cane plantations and mills in the lowlands With the understanding that the private sector in Ethiopia is weak and cannot undertake large industrial investments,11 the government has been establishing and using state corporations to steer the development of the industrial sector in areas that are defined as strategic. The new State-Owned Enterprises (SOEs) will not significantly change the ownership structure of the manufacturing sector as SOEs already have a predominant share in ownership composition in the sector (European Union cited in Altenburg 2010). These corporations will only further embolden the share of SOEs in the manufacturing sector from the already high proportions,12 and increase the risk of ‘crowding out’ the private sector. But the establishment of the new SOEs constitutes a major shift in government policy. In accordance with policies of economic liberalization that were introduced after 1991, the Ethiopian government has been engaged in the process of privatizing SOEs. Since the beginning of privatization in 1994, hundreds of SOEs were transferred to domestic and foreign investors.
The three most important corporations that were recently created and are engaged in the manufacturing sector are the Sugar Corporation, Metal and Engineering Corporation (MetEC), and Chemical Industries 10 The GERD project was not explicitly put as part of the electric power generation aims of the GTP. The GTP document aims to generate an additional 10,000 MW by 2014/15. In his recent report (24 April 2014) to the House of Peoples Representatives, PM Hailemariam Dessalegn includes the 6,000 MW to be generated from GERD as part of the 10,000 MW to be generated as part of the GTP plans (see http://www.ertagov.com/amharic/index.php? option=com_ webplayer&view=video&wid=2396). 11 Brig. General Kinfe Dagnew’s, the CEO of Metal and Engineering Corporation, response to Parliament over concerns regarding negative consequences of huge government involvement in manufacturing sector makes this point more vivid. He stressed that there is no major private sector as such to push out of business (Walta 2013). Ohno (2009) agrees with this assessment and argues that the government took the only available option—charging SOEs with strategic manufacturing sectors—as it could not practice what was pursued in East Asian countries (i.e. protecting infant industries and attracting foreign direct investment). 12 A recent assessment by the World Bank shows that the Ethiopian government is among the top three governments in the size of total investments it makes, while the private sector is among the least six.

257
The Expansion of the Sugar Industry in the Southern Pastoral Lowlands
263
Corporation.13 Even if the Industrial Development Strategy and the GTP commit to a private-sector driven industrial development—of course with strong government guidance and directive—in actual terms there is a widespread belief that the space that is left for the private sector has been narrowing. The government claims that the newly created SOEs are dedicated to work on large scale industries for which the private sector does not have both the capacity and the capital. It has been evident, however, that the newly created SOEs like MetEC are expanding their activities from strategic industries to businesses like hotels and assemblage of electronics which can be better handled by private businesses. The private sector has, however, a freer hand in the textile and leather sector.
These SOEs further shorten the distance between politics and business in Ethiopia, and in some specific sectors merge the two. Moreover, these corporations are led by top leaders of the ruling coalition and the military. MetEC is managed by the military, although it reports to the Ministry of Industry, as per its organizational structure. The highest managerial positions in these corporations are political appointments, not technocratic positions.
Sugar development embodies the spirit of the GTP and developmental intentions of the state in various forms: promoting exports after fulfilling domestic sugar deficit,14 linking agriculture with industry, generation of ‘greener’ energy sources (ethanol and electricity) and creation of employment opportunities.
The Sugar Corporation, which emerged as a major player in the economy, plans to convert hundreds of thousands of hectares of land in the lowlands into plantations and produce sugar, ethanol, electricity and other byproducts. As is the case in most projects of the GTP, what the Sugar Corporation intends to do is ambitious. The total cost of the plantations and factories is about 100 billion Ethiopian Birr (about 5.5 billion USD), with 40% being financed by the Corporation from sugar sales, and the rest being ‘equally split between Ethiopian state banks and external lenders.’15 When all ten new factories start production, Ethiopia will become one of the top 10 sugar exporters in the world.
13 The first two Corporations were established in 2010, while the latter joined only in the first week of January 2013. 14 The GTP envisages that the ten factories built by 2015 will make up for the 200,000 ton sugar deficit in the market and produce an additional 1.25 million ton for export, which will put Ethiopia among the top ten world sugar exporters (MoFED 2010). 15 See Asfaw Dingamu’s (deputy general manager of Sugar Corporation) interview with Bloomberg: http://www.bloomberg.com/news/2012-09-26/ethiopia-sugar-signs-500-million-deal-with-china-s-cdc-bank.html

258
Asnake Kefale and Fana Gebresenbet
264
The Sugar Corporation is charged with the responsibility of establishing 200,000 hectares of sugar cane plantation, building of 10 new factories, with the potential of raising sugar annual production to 2.25 million tons (about half of which will be exported to generate 661.7 million USD), produce 304,000 m3 of ethanol and generate 607 MW of electricity per year within the GTP framework. The Corporation, moreover, plans to create about 200,000 jobs16 and also raise productivity in the other plantations and factories, especially Wonji-Shoa and Metehara (MoFED 2010). However, sugar development projects currently being implemented by the Sugar Corporation cover a much larger land area and the expected production will be significantly higher than the targets set in the GTP (see Table 1 for details).
Table 1. Summary of the sugar development projects undertaken by the Sugar Corporation
Sugar Development Project
Plantation (ha)
Factories (No.)
Region Production capacity
Sugar (ton/year)
Ethanol (m3/year)
Kessem 20,000 1 Afar 153,000 12,500 Kuraz 175,000 5* SNNP*** 1,946,000 183,134 Tendaho 50,000 1 Afar 619,000 55400 Tana Beles
75,000 3 Benishangul-Gumuz
852,000** 80,250**
Welkaiyt 45,000 1 Tigray 284,000 26,750 TOTAL 365,000 11 3,854,000 358034
Compiled from the Ethiopian Sugar Corporation http://www.etsugar.gov.et/index.php/en/) * Two of the factories to be erected under the Kuraz Sugar Development Project will have a
crushing capacity which is double of the other factories. ** These figure is calculated from crushing capacity provided on the Corporation website. *** SNNP stands for Southern Nations, Nationalities and People’s regional state.
The project of expanding the sugar industry has sparked controversies and disputes. In the north, the establishment of the Welkaiyt plantation in the Tekeze valley created uproar upon claims that it would encroach on the historic Waldba
16 Actual employment opportunities expected to be created by the plantations, factories and associated socio-economic endeavors are much higher.

259
The Expansion of the Sugar Industry in the Southern Pastoral Lowlands
265
monastery. The Tendaho plantation in the Afar valley was started in 2005. But the completion of the project was delayed by a host of factors including disputes over land with the local Afar clans. In South Omo, where five of the new sugar factories are to be established, there are concerns on how the scheme is going to impact on the livelihoods of the several minority groups living in the area.
It is worth considering the potential contributions of the sugar industry to the national economy, its place in the GTP and the political economy of such state-led industrialization. One of the most important factors in this regard is the expected high export earnings. Sugar prices have been steadily increasing in the global market.17 Currently the price of sugar is at a 25 year high (Little et al. 2010). In contrast, the price of coffee, Ethiopia’s primary foreign currency earner, has displayed a declining trend in the international market over the past decades (Petit 2007) and according to Baffes (2003) coffee’s price is among the most volatile of all commodities. Furthermore, if GTP plans are realized, reliance of the national economy on coffee will decline and coffee will lose its current position. Even if coffee exports are expected to increase from 319,647 to 600,970 tons/year during the GTP period, sugar production is expected to increase at a much higher pace. By end of the GTP period, 661.7 million USD per year is expected to be gained from the export of 1,246,300 ton of sugar (MoFED 2010). However, if we consider sugar development projects currently under the purview of the Sugar Corporation (see Table 1), sugar production is planned to be increased to 3,854,000 tons when the ten sugar factories which are at different stages of construction are fully functional. Most of the additional production (above the GTP target), i.e., 1,604,000 ton/year, will be for export and our calculations (at constant prices) show that export earnings from the sector will reach 851,614,218 USD per year. Adding this to the expected export earnings from sugar exports within the GTP period, Ethiopia is set to get more than 1.5 billion USD per year from the export of sugar only. Unlike the other state corporations established recently, the Sugar Corporation will likely be among the primary export earners in the near future. Moreover, the sugar industries will contribute to the effort to build a green economy through production of electricity and ethanol.
In addition to its contribution to the expansion of the national economy, the sugar cane plantations and sugar industries will create job opportunities for hundreds of thousands of individuals. The GTP document estimates that a single job will be created for every hectare of land put under plantation (MoFED 2010). However, figures from the Ethiopian Sugar Corporation indicate that the sector and associated urbanization is to generate more jobs than anticipated by the GTP document. The KSDP alone is expected to create jobs for more than 400,000 17 See FAO’s food price index: http://www.fao.org/worldfoodsituation/FoodPricesIndex/en/
260
Asnake Kefale and Fana Gebresenbet
266
individuals,18 and Welkaiyt Sugar Development Project is projected to create jobs for more than 80,000 individuals.19 Therefore, from the perspective of the government, one of the good attributes of the sugar sector will be its capacity to absorb a large number of unemployed youth.
Local impacts of the expansion of sugar industries: some observations from South Omo20 The expansion of sugar industries will have different ramifications at national and local levels. At the national level as mentioned above, it could have huge economic and political benefits. But in the localities where the projects are going to be implemented, there are fears that the industry is going to undermine the livelihoods of the local communities. If the current expansion of sugar industries promises national economic gains, it is South Omo which ‘holds nation’s sweet promise’.21 Five of the 11 sugar development projects under the purview of the Corporation are located in South Omo Zone, covering 175,000 ha (from the total of 365,000 ha slotted for sugar cane plantation at national level, see Table 1). These projects fall within two Wereda of the Zone, 50,000 ha in Salamago and the remaining 125,000 ha in Nyangatome Wereda.
These Wereda are home to ethnic groups predominantly engaged in pastoralism. Although the cattle economy is given more prestige, local livelihoods also rely on flood retreat and rain-fed agriculture (for the case of the Mursi see Turton 1985). Life in these parts of the South Omo Valley remained, for all practical purposes, unchanged for several centuries. Historically, the state had a weak presence and the provision of social services is next to nonexistent. The state did not get any significant revenue from these lowlands, as the local economy is not monetized and is largely subsistence and prestige oriented.
Large development projects on the Omo-Gibe basin started with the construction of the Gilgel-Gibe hydro-power dams upstream over the past decade. These development projects had little direct impact on the lives and livelihoods of the population living downstream, save for hindrance of uncontrolled floods by Gilgel-Gibe III dam. However, the sugar plantation will be on their land and will attract hundreds of thousands people from the highlands
18 Interview: Experts of Ethiopian Sugar Corporation (January 2013) and officials of South Omo Zone Administration (February 2013). While 400,000 is the lowest estimate we got, the highest was 700,000. 19 According to the website of the Sugar Corporation. 20 This part of the paper is based on empirical data gathered during two fieldwork periods in May 2011 (both authors) and February 2013 (Fana and Tewolde Woldemariam). 21 Borrowed from http://www.waltainfo.com/index.php/others/articles-and-features/5578-south-omo-zone-holds-nations-sweet-promise

261
The Expansion of the Sugar Industry in the Southern Pastoral Lowlands
267
to work in the sugar industries. Because of the introduction of the sugar industry, sooner or later, the pastoral economy in South Omo is going to decline or vanish altogether. Unless adequate safeguards are put in place, the expansion of the industry will bring hardships to the local pastoral communities.
The government and the Sugar Corporation pledge that they will not repeat development-induced impoverishment of pastoral communities, as was the case of the Karrayu in the Awash Valley (Buli 2006). When sugar plantations (Wonji Shoa and Metehara) were established during the 1960s in the Awash valley, pastoralists were simply evicted and their land was enclosed (Bahru 1984; Buli 2006). The government plans to provide livelihoods to the affected communities by expanding settled agriculture and by providing job opportunities in the new industries. In this regard, the government is implementing villagization and skills training. These policies and practices reaffirm the view that Ethiopian government’s development policy does not recognize the role pastoralism plays in the economy and wishes to ‘transform’ the sector into settled agriculture. This is despite the adoption of a pastoral development policy in 2002 (FDRE 2002).
In South Omo, villagization is being implemented in all Wereda where pastoralism is practiced. Local officials present this as a sign of government’s intention to bring ‘development’ to pastoral areas and ensure that local people benefit from it, irrespective of the expansion of the sugar industry. But the new villages in Salamago (for the Bodi and Bacha ethnic groups) have progressed much faster than the others and are paid for by the KSDP. Three villages each with different social services (primary school, clinic, and veterinary clinic, grain mills, and drinking water points), government offices (Kebele office, police post) and housing units for teachers, agricultural development agents and health professionals were established. The drive to villagize locals is spearheaded by educated local elite, whom Markakis (2011) would call ‘subordinate elite.’ Skill training (such as carpentry, masonry and others) is offered in Jinka (capital of the South Omo zone), while training to operate heavy machinery is offered in Chancho in North Shoa Zone, Oromia region (near the capital, Addis Ababa). However, unemployment figures for the Zone are very small (only 2,892 according to CSA 2008), compared to the job opportunities that will be created. Thus, this would entail labor migration from elsewhere, particularly from the southern highlands,22 with the attendant socio-economic and political consequences.
22 Labor migration to sugar cane plantations was predominantly from the southern highlands some 60 years ago too (Kloos 1982).

262
Asnake Kefale and Fana Gebresenbet
268
In these lowlands, pastoral life could not continue without some sort of assistance after the establishment of the plantations. Thus, on the face of it, it is appreciable that the government is engaged in building irrigation canals, tilling the farms of the local community by use of tractors, and providing inducements to take up farming. Each household23 is entitled to a hectare of land, and it is expected that through intensive training locals would take up irrigated farming, transform their lives and become beneficiaries of the development project.24 This, according to one official of the Agriculture and Pastoral Affairs Bureau of the South Omo Zone, is a monumental task of converting a group practicing a ‘backward and subsistent’ form of agriculture to ‘intensive irrigated’ farming.
Would the government and KSDP be effective in helping local communities make this big leap? Given the difficulty of the task at hand, it seems that success depends on consistent and unrelenting effort, and also adapting plans to local realities. This would be contingent on a number of factors, the most important being the priority given to the success of this scheme from higher officials. The likelihood of success dims if one considers that extension services met little success in the highlands over the past two decades (Spielman, Dawit and Dawit 2013) and distribution of improved cattle breeds25 is insignificant at national level (Asfaw et al. 2013).26
Political economy of sugar industrialization The benefits of sugar industrialization will accrue more at national level, than at local levels. It has also political objectives. It provides the EPRDF the much needed legitimacy to prolong its stay in power. Indeed, developmentalism, for the EPRDF, is a source of legitimacy as much as a political tool to promote economic development. Accordingly, the ruling coalition promises to bring about ‘development’ that will benefit the rural population which the EPRDF hinges on to get elected in consecutive elections. To be sure, what is meant by 23 Each of the second and third wives of a polygamous man are considered as heads of a separate household, and get a hectare of land. 24 The KSDP covered the cost of the villagization. Furthermore, the expected urbanization would create high demand for local produces. 25 Although emphasis is on irrigated farming, villagization will be followed by reduction of herd size and use of improved breeds and in due time start ranches. 26 One might argue that, given the success in settling the Karrayu recently, the same could be done in South Omo. The exposure the Karrayu had to urban life and the market (due to the sugar industries for the past six decades as well as the major transport route from Addis Ababa to Ethiopia’s export outlets /import inlets, Assab before 1998 and Djibouti afterwards) appears to have given them the chance to weigh the benefits and costs of sedentary life as well as slowly adapting their culture. It is thus very difficult to replicate the success story in South Omo, no matter the well intentions the implementers might have. Success recorded in Karrayu areas also does not seem as high and homogenous as the government portends (Fekadu, 2014).

263
The Expansion of the Sugar Industry in the Southern Pastoral Lowlands
269
‘rural’ in such pronouncements refers to the smallholder farmer in the highlands of the four regional states (Amhara, Oromiya, SNNP and Tigray) which members of the EPRDF coalition administer.
As a tropical crop, sugar cane performs better in hot climates, which in Ethiopia are primarily restricted to the sparsely populated lowlands. Three sugar development projects (Kessem, Tendaho and Tana-Beles) are in regional states administered by political organizations that are affiliated with the EPRDF. The remaining two sugar development projects (Kuraz and Welkaiyt) are in the lowland parts of SNNP and Tigray regional states respectively. Thus, assuming that the EPRDF is more concerned in gaining the loyalty and votes of the densely populated parts of the regions ruled by its coalition partners, it follows that gains (rents, taxes, profits, jobs, foreign currency) from these investments will be transferred up to the highlands where these people live.
To be sure, population groups in the lowlands stand to benefit from the projects; what is being argued here is that most of the benefits will trickle up to the highland populations. First, the highlands would benefit significantly from the projects in terms of job opportunities. It is expected that hundreds of thousands of unemployed youth will migrate to the lowlands to work in the new plantations. This will reduce the population pressure in the highlands, in addition to reducing landlessness and the need for further redistribution of land. Second, the government will use revenues that will be generated by the sugar industry to implement other mega-projects, from which the highland population is more likely to benefit from. Third, increase in capital accumulation and re-investment will benefit the highlands, where there is already better social and physical infrastructure than the lowlands. Thus, as has been the case over the past two decades too, the highland population will benefit more from the increase in the national pie than the lowland population.
Conclusion What role should the state play in the economy has been one of the enduring questions of political economy. As shown in this chapter, there have been shifts in the role the African state has played in the economy in the last three decades. Presently, there are calls from many quarters for the African state to take an increased role in the economy.
In the Ethiopian case, the development policy of the regime has shown major shifts since the beginning of the 1990s. Like many other countries of the continent, at the beginning of the 1990s, the EPRDF sought to liberalize the economy except for its continued ownership of the telecom and energy sectors and the prohibition of international actors in the financial sector. In a much pronounced move from a command economy to ‘free market’, the government

264
Asnake Kefale and Fana Gebresenbet
270
has also privatized hundreds of government owned businesses to local and international investors.
The main policy pillar of economic development was ADLI. ADLI’s main focus was bringing efficiency to smallholder agriculture by providing better technologies and support. These policy dispositions were, however, gradually changed. Particularly, after the mid of the 2000s, the strong emphasis that was put on transforming the country’s smallholder agriculture gave way to expansion of commercial agriculture and the industry. The government, moreover, redefined its broader economic aims by adopting a developmental state strategy. While the discourse in the 1990s was about the reduction in the role of the state in the economy, after the official pronouncement of the developmental state orientation in 2006/07, the government is massively expanding its role in the economy. In light of this, new mega parastatal corporations – Sugar, Chemical Industries, and Metal and Engineering were established. The ongoing massive expansion of the sugar industry by the government can be seen as an aspect of the government’s desire to expand commercial agriculture. At the same time, there is a big push to expand large scale private investment. Indeed, Ethiopia has become one of the top destinations of large scale agricultural investment (which in the negative sense is known as land grabbing) in the continent.
The reasons behind the reorientation of development policy and the adoption of the developmental state approach are both economic and political. The main economic justification of the government for establishing new parastatals is that the Ethiopian private sector is not yet in a position to engage in such capital demanding ventures. The political rationale hinges on EPRDF’s desire to bolster its legitimacy by providing economic benefits to its multilevel and varied clients. First, the new SOEs provide jobs, influence and power to personnel who are close to the ruling coalition. For instance, MetEC which could be termed as a mega conglomerate of industries is run by the country’s defense forces. Second, the new SOEs provide lucrative contracts to firms which are affiliated to the ruling party like companies under the Endowment Fund for the Rehabilitation of Tigray (EFFORT). Third, the sugar industry is going to produce hundreds of thousands of jobs to the unemployed youth. But the expansion of the sugar industry could have adverse implications on the local populations. It is extremely important for the government to put the necessary social safeguards to protect the rights and wellbeing of the host communities of the new investments.
The other crucial problem that needs closer attention is the role the private sector plays in the development of the country. If the recent experiences of East Asian countries or even China teach us anything, the active participation of private sector is indispensable for building a vibrant economy with sustained
265
The Expansion of the Sugar Industry in the Southern Pastoral Lowlands
271
growth. Risks of ‘crowding out’ and further enfeebling the private sector by SOEs will be counter-productive in the long term.
It is also important to point out that the Ethiopian developmental state lacks some crucial elements which are required to achieve the desired goals. As mentioned above, these include, lack of capable and autonomous bureaucracy and cooperative and symbiotic relationships between government agencies and the private sector. Moreover, the problem of corruption which is increasing from time to time will undermine the developmental objectives of the government, unless firm and consistent actions are taken to control the problem.
References Adepoju, Aderanti. 1993. ‘Introduction’ in A. Adepoju (ed.), The Impact of
Structural Adjustment on the Population of Africa. London: James Currey Alemayehu Seyoum Taffesse, Dorosh, Paul and Sinafikeh Asrat Gemessa.
2013. ‘Crop Production in Ethiopia’. In Dorosh, Paul and Shahidur Rashid (eds.) Food and Agriculture in Ethiopia: Progress and Policy Challenges. Philadelphia, PA: University of Pennsylvania Press.
Altenburg, Tilman. 2010. Industrial Policy in Ethiopia. Discussion Paper 2/2010. Bonn: DIE.
Asfaw Negassa, Rashid, Shahidur, Berhanu Gebremedhin and Kennedy, Adam. 2013. ‘Livestock Production and Marketing’. In Dorosh, Paul and Shahidur Rashid (eds.) Food and Agriculture in Ethiopia: Progress and Policy Challenges. Philadelphia, PA: University of Pennsylvania Press.
Baffes, John. 2003. ‘Tanzania’s Coffee Sector: Constraints and Challenges in a Global Environment’. Africa Region Working Paper Series 56. Washington: World Bank.
Bahru Zewde. 1984. ‘Environment and Capital: Notes for a history of the Wonji-Shoa sugar estate (1951-1974)’. Paper presented at the Sixth Eastern Africa History Conference, Ambo (Ethiopia). 14-21 (March, 1984).
Buli Edjeta. 2006. The Socio-Economic Dimensions of Development-Induced Impoverishment: The Case of the Karrayu Oromo of the Upper Awash Valley. Vol. 12, Social Anthropology Dissertation Series, Addis Ababa University, Ethiopia.
Cassen, Robert.1994. ‘The Origins and Progress of Structural Adjustment’, in Willem van Der Geest (ed.), Negotiating Structural Adjustment in Africa. New York: UNDP in association with James Currey and Heinemann
266
Asnake Kefale and Fana Gebresenbet
272
Central Statistical Agency (CSA). [Ethiopia]. 2008. The 2007 Population and Housing Census of Ethiopia. Statistical Summary Report at National Level. Addis Ababa, Ethiopia: Central Statistical Agency.
Chang, Ha-Joon. 2003. Globalization, Economic Development and the Role of the State, London: Zed Press
Dahlstrom, C., V. Lapuente and J. Teorell, ‘Public administration around the world’ in S. Holmberg and B. Rothstein, (eds), Good Government: The Relevance of Political Science. Cheltenham: Edward Elgar publishing Ltd.
Davison, W. 2010. Ethiopia plans to rent out Belgium-sized land area to produce cash crops. Bloomberg News. Available from: http://www.bloomberg.com/news/2010-10-26/ethiopia-plansto-rent-out-belgium-sized-land-area-to-produce-cash-crops.html [Accessed on 20 January 2011].
Dercon, S. and Vargas Hill, R. 2009. Growth from Agriculture in Ethiopia: Identifying Key Constraints. Paper prepared as part of a study on Agriculture and Growth in Ethiopia, DFID. (May 2009).
Dorosh, A. Paul. 2013. ‘The Evolving Role of Agriculture in Ethiopia’s Economic Development’. In Dorosh, Paul and Shahidur Rashid (eds.) Food and Agriculture in Ethiopia: Progress and Policy Challenges. Philadelphia, PA: University of Pennsylvania Press.
Dorosh, A. Paul and Thurlow, James. 2013. ‘Implications of Accelerated Agricultural Growth for Household Incomes and Poverty in Ethiopia’. In Dorosh, Paul and Shahidur Rashid (eds.) Food and Agriculture in Ethiopia: Progress and Policy Challenges. Philadelphia, PA: University of Pennsylvania Press.
De Waal, Alex (2013). ‘Review Article: The Theory and Practice of Meles Zenawi’, African Affairs, 112/446
Economic Commission for Africa (ECA). 2011. Economic Report on Africa 2011: Governing Development in Africa-The Role of the State in Economic Transformation. Addis Ababa, Ethiopia.
Ethiopian People’s Revolutionary Democratic Front (EPRDF). 2013. Report of the 9th EPRDF Congress.
_____. 2006. Development, Democracy and Revolutionary Democracy. (Limat democracy ena Abiyotawi Democracy). Addis Ababa: Birhanena Selam Printing Press.
FEACC, Federal Ethics and Anti-Corruption Commission (2012). Ethiopia: Second Corruption Perception Survey (Volume 1 – Main Report), Addis Ababa: Kilimanjaro International Corporation Limited
267
The Expansion of the Sugar Industry in the Southern Pastoral Lowlands
273
Federal Democratic Republic of Ethiopia (FDRE). 2002. Statement on Pastoral Development Policy. Addis Ababa: Ministry of Federal Affairs.
Fekadu Beyene. 2014. ‘The Challenges to Pastoral Transformation to Sedentary Farming: The Case of Karrayyu Pastoralists.’ In Mulugeta Gebrehiwot Berhe (ed.) A Delicate Balance: Land Use, Minority Rights and Social Stability in the Horn of Africa. Institute for Peace and Security Studies, Addis Ababa University, Ethiopia.
ILO.1993. Report of the Director-General, Geneva: International Labour Office Kloos, Helmut. 1982. ‘Farm Labour Migration in the Awash Valley’.
International Migration Review, 16(1): 133-168. Lavers, Tom. 2012. ‘“Land grab” as development strategy? The political
economy of agricultural investment in Ethiopia’, Journal of Peasant Studies, 39(1): 105-132.
Little, P.D., Behnke, R., McPeak, J and Getachew Gebru. 2010. Future Scenarios for Pastoral Development in Ethiopia, 2010-2025. Report Number 2, Pastoral Economic Growth and Development Policy Assessment, Ethiopia.
Lynch, G and G. Crawford (2012), ‘Democratization in Africa 1990-2010: An assessment’, in Lynch, G and G. Crawford (eds), Democratization in Africa: Challenges and Prospects, London: Routledge
Makki, Fouad. 2011. ‘Power and property: commercialization, enclosures, and the transformation of agrarian relations in Ethiopia’, Journal of Peasant Studies, 39(1), 81-104.
Markakis, John. 2011. Ethiopia: The Last Two Frontiers. James Currey, UK. Meles Zenawi. 2011. States and Markets: Neoliberal Limitations and the Case
for a Developmental State. In Norman, Akbar, Kwesi Botchwey, Howard Stein and Joseph E. Stiglitz (eds.) Good Growth and Governance in Africa: Rethinking Development Strategies. Oxford University Press, UK.
Ministry of Agriculture and Rural Development (MoARD). 2009. Food security programme, 2010–2014. Addis Ababa: MoARD.
Ministry of Finance and Economic Development (MoFED) 2003. Rural development policy and strategies. Addis Ababa: MoFED
____ 2010. Growth and Transformation Plan (2010/11-2014/15). Volume I: Main Text. Federal Democratic Republic of Ethiopia. (November, 2010).
Mkandawire, T. (2001) ‘Thinking about Developmental State in Africa,’ Cambridge Journal of Economics, Vol. 25, no. 3
268
Asnake Kefale and Fana Gebresenbet
274
Ohno Kenichi. 2009. Ethiopia: Political Regime and Development Policies. A draft prepared for the policy dialogue between Ethiopia and Japan in June 2009, GRIPS, Tokyo.
Petit, Nicolas. 2007. ‘Ethiopia’s Coffee Sector: A Bitter of Better Future?’ Journal of Agrarian Change, 7(2), 225-263.
Rempel, Ruth. 2008, ‘Periodizing African Development,’ African Economic History, Vol. 36
Routley, Laura. 2012. Developmental states: a review of the literature, Effective States and Inclusive Development Research Centre (ESID), Working Paper No. 03, Manchester. Available at [http://r4d.dfid.gov.uk/PDF/ Outputs/ESID/esid_wp_03_routley.pdf], Accessed 22.10.2012
Spielman, J. David, Dawit Mekonnen and Dawit Alemu. 2013. Seed, Fertilizer, and Agricultural Extension in Ethiopia. In Dorosh, Paul and Shahidur Rashid (eds.) Food and Agriculture in Ethiopia: Progress and Policy Challenges. Philadelphia, PA: University of Pennsylvania Press.
Tanzi, Vito. 1997. The Changing Role of the State in the Economy: A Historical Perspective, Washington, DC. IMF
Turton, David. 1985. ‘Mursi response to drought: some lessons for relief and rehabilitation’. African Affairs, 84, 331-46.
Van de Walle, N. (2003), ‘Introduction: The State and African Development’, in N. van de Walle, N. Ball and V. Ramachandran (eds). Beyond Structural Adjustment: The Institutional Context of African Development. New York: Palgrave, Macmillan
Vaughan, Sarah. 2012. ‘Revolutionary Democratic State-building: Party, State and People in EPRDF’s Ethiopia’, Journal of Eastern African Studies, 5(4), 619-640.
World Bank. 1989. Sub-Saharan Africa: From Crisis to Sustainable Development, Washington, DC: World Bank.

10 Melaku Bekele and Habtemariam Kassa
Governance Challenges of Dry Woodlands Introduction Dry lands contain diverse vegetation types that include woodland proper, bush land, thicket and wooded grasslands1 (Chidumayo and Emmanuel 2010). These landscapes are not just rich in biodiversity, they also provide a large number of resources that support the livelihoods of people, particularly vulnerable households living in them (Sunderland 2011). They provide bush-meat and mushrooms, fruits, leafy vegetables and edible herbs, woody foliage, roots and tubers, wild cereals and grains, seeds, nuts and kernels (Grosskinsky 2000; Shackleton and Gumbo 2010) commonly known as famine foods. An important component of dry land resources are trees2. People use wood from trees for fuel, poles, simple furniture and utensils, and some trees are valued for their medicinal properties.
1 Woodland is a continuous stand of trees with a crown density of between 20 - 80%. Mature trees are usually single storied, although there may be layered under-stories of immature trees, and of bushes, shrubs and grasses/forbs. Maximum height of the canopy is generally not more than 20 meters.. (WBISPP 2004). Bush land is an area with fairly continuous layer of herbaceous plants, especially grasses. Woody plants occur singly well separated from each other although locally there may be areas of dense woody plant tickets (Chamshama and Vyamana, 2010). Grasslands are areas where grass is more dominant than trees. 2 A study conducted in Somali Regional State concluded that in a normal rainfall year browse from trees supplies approximately 20 percent of feed for cattle, 25 to 40 percent for sheep, 45 to 60 percent for goats and 90 to 100 percent for camels (Somali Regional State 2003).

270
Melaku Bekele and Habtemariam Kassa
278
Table 1. Woodland areas of Ethiopia
Region Area (ha) As % of total woodland
Oromiya 9,823,163 34 SNNR 1,387,759 5 Gambella 861,126 3 Amhara 1,040,064 4 Tigray 254,455 1 Benishangul 2,473, 064 8 Afar 163,667 1 Somali 13,199,662 45 Total
SOURCE: WBISPP 2004
In addition, dry land trees provide various benefits, such as protection, shade, amenity and cultural uses. Raw materials like gums, resins, tannin, and fiber are used in cottage industries and generate income as export items. Honey bee products tend to be relatively important in drylands of eastern and southern Africa (Walter 2001). In Ethiopia, most national parks are located on the drier part of the country, and many of the animals depend on the tree leaves to feed. Above all, the drylands support millions of pastoralists whose livestock are dependent on tree leaves, fruits and seeds, particularly during the dry seasons (Mohammud 2004). Important dryland resources in Ethiopia. Firewood and charcoal extraction Most of fire wood and charcoal coming from dry woodlands fulfill basic needs for domestic energy and help to generate income from sale of such products by poor people. The contribution of biomass fuels in national energy utilization in many dry woodland countries range between 35–75 percent in Senegal, Togo, Ivory Coast and Angola, and over 75 percent in others like Sudan, Ethiopia, Kenya, Tanzania, Mozambique, Zambia, Democratic Republic Congo and Nigeria (Malimbwi et al. 2010). Income from fuelwood sale and other woodland resources has been increasing markedly within the livelihood strategies of many pastoralists in Ethiopia, as the number of ‘drop outs3’ of the pastoral system grew 3 “drop-outs” are those people who have abandoned the pastoralist way of life due to various reasons mainly depletion of livestock numbers due to drought or disease; such people often
271
Governance Challenges of Dry Woodlands
279
due to resource depletion (Ridgewell and Getachew 2007). The study conducted in Borana by Eyasu and Feyera (2010 ) showed that trading in charcoal is practiced by some 14 percent of the poorer pastoralists around major urban centers such as Yabello and Negelle. The trade often increases during times of hardship caused by drought.
A four day charcoal survey of Addis Ababa showed that nearly 98 percent of charcoal entering the city (over 94,000 sacks, each weighing about 50 kg) come from the Afar and Awash areas. In these regions one finds areas dominated by dry woodlands constiting of acacia, a tree preferred for charcoal making. It is preferred because high–density woods like acacia produce charcoal of higher density and lower fragility, which burns more slowly at a higher temperature than charcoal from low-density wood (Uhart 1975). Recently however, charcoal production has shifted to Prosopis juliflora, an invasive tree species taking over large grazing areas in Afar (Melaku and Zenebe 2013). According to FAO (2010b) charcoal was exported from Ethiopia on a small scale. The four year charcoal export between 1961 and 1974 amounted only to 800 tons. Export of charcoal from Afar region to Djibouti has also been reported. However, significant amount of charcoal is being exported from some districts in Somali Region to Somaliland (Seid 2007). According to Hagmann (2006), Oxfam GB calculated that around 63,000 sacks of charcoal was harvested in 2005 from Harshin woreda (Somali region) alone and transported across the border to Hargeiysa on a monthly basis utilizing 27,300 trees. FAOSTAT database (FAO 2010b) shows that between 2000 and 2009, Ethiopia produced over 32 million tons of charcoal. Although there is a lack of information about how many people derived their living from charcoal production and trade in Ethiopia, very many people must have been involved in the charcoal chain starting from its production to distribution and retailing (Melaku and Zenebe 2013).
One of the problems linked to firewood and charcoal production in Ethiopia is that extraction is made mainly from state-owned forests and woodlands free of charge with little regulated utilization. As is the case in many African countries, charcoal producers prefer tree species that yield dense, slow-burning charcoal. Such tree species are slow-growing and are thus particularly vulnerable to overexploitation (NL Agency 2010). There are no known plantations in Ethiopia that are designated for charcoal production. The intensive exploitation of a few species with a high density can adversely affect biodiversity and also tree regeneration. Moreover, wastage from the traditional earth and pit kilns of charcoal production is high in Ethiopia. Thus, it may be concluded that next to clearance of trees for agriculture charcoal production is
engage themselves in petty trade, charcoal making, and also small scale agriculture (Getachew 2007; Lemlem and Yemane 2007)

272
Melaku Bekele and Habtemariam Kassa
280
responsible for large scale tree felling and degradation. (Kammen and Lew 2005).
Gum and resin Gum (gum arabic) and resin, myrrh, hagar and frankincense producing trees are common in most parts of the drylands of Ethiopia. Ethiopia is one of the countries well endowed with various species of Acacia, Boswellia and Commiphora that are known to produce gum arabic, frankincense and myrrh, respectively ( Mulugeta et al. 2011). Over 60 gum and resin bearing species are found in the country. The total areas of oleo-gum resin bearing woodlands cover about 2.9 million hectares of land in the country, with over 300,000 metric tons of natural gum production potential. Boswellia papyrifera is the chief gum resin producing tree species in Ethiopia. In the three years from 2001 to 2003, Ethiopia exported US$2.8 million, 3.3 million and 4.1 million worth of gum and resin products respectively (Wubalem et al. 2007). The authors also showed that natural gum tapping and collection activities create seasonal employment opportunities for 20,000–30,000 people.
However, a study conducted about incense woodlands in Ethiopia (Metema, Abergelle, Wogdi) and five sites in bordering Eritrea (Abrham et al. 2010) showed lack of regeneration of Boswellia trees due to various anthropogenic and natural factors. Open grazing and cultivation of agricultural crops were identified as the major reasons for lack of regeneration and absence of younger trees in the above areas.
Pastoralists and dry land trees The total population of pastoralists in Ethiopia is estimated to be at about 10 million. They make up nearly 14 percent of the total population and their land covers over 60 percent of the total area of the country. (PFE, IIRR and DF 2010). The same source indicates that pastoralists live in more than 133 woredas and come from about 29 ethnic groups. The areas they occupy are known for their harsh weather, unreliable rainfall, high temperatures and prone to frequent drought and food insecurity (Beruk 2003). Trees are an important component of the rangelands. Pastoralists’ use tree leaves for much needed fodder particularly during drier seasons (Mohammud 2004 ). It was estimated that in a normal rainfall year browse from trees supplies approximately 20 percent of feed for cattle, 25 to 40 percent for sheep, 45 to 60 percent for goats and 90 to 100 percent for camels. On this basis, it is estimated that browse from trees provides nearly 28 percent of the total energy requirements of pastoralists’ livestock. In drought years this proportion can rise considerably, and thus browse provides a “safety net” of livestock in drought years (Mohammud 2004).

273
Governance Challenges of Dry Woodlands
281
Pastoralist communities have developed the knowledge and institutional capacity to manage rangeland resources, including trees, sustainably (Gufu 1998). For example, in order to use trees, the Afar pastoralists require permission from the clan leaders. Although they do not plant trees, they do not log trees either, and making charcoal is a taboo believed to cause infertility (PFE, IIRR and DF 2010). Trees that serve as browse for animals or as a source of edible fruits for humans are not cut, but pruned (PFE, IIRR and DF 2010). The Somalis are prohibited from cutting trees, and offenders are punished. They are fined in livestock depending on the extent of the damage and if they had a previous record (PFE, IIRR and DF 2010). Hamer elders (in South Omo) take time to advise the younger generation regarding the advantages of taking care of trees. Collecting firewood and cutting of trees cannot be done without permission by the elders (PFE, IIRR and DF 2010). Among Guji pastoralists’ trees are well protected for their economic and cultural uses (Flintan 2007). In Metama area, according to Tesfaye et al. (2010), people particularly protect such trees like Potamogeton lucens for its use to heal their emaciated animals.
However, not all traditional resource management, including tapping for gum and resin, is without impact on the resources used. Abrham et al. (2010) showed that seeds from tapped trees have a low germination rate, for example as low as 14 percent in Eritrea. Tefera (2011) pointed out that intensive tapping weakens the tree strength through reduced carbon storage required for essential functions such as reproduction. Diress (2010) studied one of the more valuable woody species in Afar, Dobera glabra. He found the tree to be under threat due to lack or poor rate of regeneration. According to the same author, D. glabra is highly valued by the Afar as source of food for people and as well as livestock feed. The tree is found scattered in the area, but with little seedlings and saplings. Diress (2010) also observed that lack of recruitment of D. glabra and absence of young seedlings in Afar has become a serious concern among Afar pastoralists. In Borana multi-purpose trees such as Uddaito (Balanites aegyptica), Merderto (Cordia sinensis) and Kusraito (Zizyphus spina-christi) are declining in number due to the introduction of more competitive species such as Woyane, prosopis juliflora (PFE, IIRR and DF 2010).
Agriculture Ethiopia’s dry wood land areas cover over 60 percent of the land area of the country, and are relatively sparsely populated. Most of the country’s rivers also cross over these areas and flow over the border into neighboring countries. These conditions have given rise to the idea that the woodland areas are ideal for agricultural activities, particularly for commercial farming once their infrastructures are improved.

274
Melaku Bekele and Habtemariam Kassa
282
Probably the most serious challenge to the survival forests and woodlands comes from the rapid and unfettered expansion of small and large-scale commercial agriculture (Boahene 1998; Mulugeta et al. 2011) over lands under traditional customary management especially since the 1950s (Desallegn 2007). Crop farming, particularly large scale agriculture, requires the complete clearance of trees from the field. Shifting cultivation that requires slash-and-burn practices also entails the removal of all trees including stems in a particular area. In the past few years, Ethiopia has leased-out over 2.8 millions of land for national and international investors, and that figure will reach 3.2 million in the coming years in both humid and dry forest areas (Friis and Reenberg 2010). This shows the scale of agricultural expansion and its negative impact on forest ecosystems.
Table 2. Land use/land cover change in Afar (1973-2003)
Land use/land cover change
1973 1986 2003
Area (km2) % Area (km2) % Area (km2) %
Bush land 80 20 100 25 115 28.8 Bushed-grassland 134 33.5 161 40.3 198 49.5 Grasslands 173 43.3 106 26.5 24 6 Croplands 13 3.3 33 8.3 63 15.8
Total 400 100 400 100 400 100
SOURCE. Sintayehu at al. 2006
Small scale agricultural settlers from nearby highlands and state sponsored settlements4 together with large scale commercial agriculture are resulting in permanent land use changes making natural regeneration of trees impossible.
4 The land use changes in the drylands are linked to official resettlements of highland farmers into traditionally pastoral areas of the country (Mullugeta et al., 2012). Successive governments believed that resettlement would help solve food insecurity problems of the rural poor farmers in the long term (Woube, 2005). For instance, the present government envisaged to settle a total of seven million people starting from year 2000. In actual terms some 180,000 households with about a million people resettled between 2003 and 2005 (Stellmacher and Eguavoen 2011). Individual and family based immigrations also occurred through private decisions to similar places. Individual (private) enclosure of common holdings by local people themselves in pastoralist areas are also becoming common as a response to shrinking customary rights as a result of external pressure (PFE, IIRR and DF, 2010; Pantuliano and Wekesa 2008), and also to protect some important dry time fodder trees (Tefera and Flintan 2007),

275
Governance Challenges of Dry Woodlands
283
The impact of the growing practice of enclosure by local community
members is yet to be seen if it could be considered as the general course for future forest policy to save trees by encouraging individual management. Individualization of rangelands is seriously limits mobility, one of the key elements of the pastoralist production system. The mobility balances the use of resources, sustains the environment and assures pastoralist livelihoods (PFE, IIRR and DF 2010).
In Afar (table 2) the most notable changes between 1972 and 2007 were reductions in woodland (97%) and grassland cover (88%), and increase in bush land (281%) and cultivated land (776%) cover (Diress 2010). Although cultivated area covered about 3% of the landscape in 2007, it amounted to about 24% of the alluvial dry-season grazing lands in the same year (Diress 2010). As rangeland resources decline, pastoralists are forced to overgraze the remaining land and they are also pushed to marginal lands, further aggravating the problem. These actions are also causing degradation of multipurpose fodder trees like the Yicib (Cordeauxia edulis) in Somali region and intensify soil erosion and flooding (PFE, IIRR and DF 2010) as a result of the removal of vegetation cover of the soil.
Dry woodlands under current policy framework Various biophysical and socio-economic studies (Abeje 2002; Bongers and Tennigkeit 2010; Abraham et al. 2010; Tefera 2011; Teshale 2011; Mulugeta et al. 2012) show that the dry woodlands of Ethiopia are under huge pressure from a range of factors. Various resource users with diverse objectives work hard to enhance their individual interest. . Some of the above studies concluded that if such type of exploitation continued, the dry forest resources would enter a state of total depletion with far-reaching consequences to the more fragile dry-land eco-system and community’s livelihood in the not distant future. Many research results commonly conclude that the dry woodland resources in Africa receive less policy and development attention compared to humid forest systems. As a consequence, the ecosystems are trapped in ever mounting of deforestation, fragmentation, degradation and desertification (Sunderland 2011; FAO 2010b). This observation also works for Ethiopia.

276
Melaku Bekele and Habtemariam Kassa
284
Table 3: General state of dry woodlands of Ethiopia
The major setback of natural resource and environmental protection in
Ethiopia has not primarily been lack of policies and legislation, but the enforcement of them (Melaku 2008). For example, in the forestry sector Ethiopia has issued at least six proclamations over the past 40 years. Except the 2007 forest policy, the implementation of which is yet to be seen, none of these proclamations were implemented with some scale to improve the forestry situation in the country.
Description Outcome/effect Area (ha) Over 60 percent of the country
-
Vegetation woodland proper, bush land, thicket and wooded grasslands
-
Extractive products
Gum/resin, fuelwood, animal feed, bush-meat, farm products,
little regeneration, disease, overgrazing, illegal hunting, resource depletion
Ownership State; access rights to local community
Near open access; uncertainty among users; individualization
Management regimes
Settlement; small & large scale farming; gum resin, fuelwood, etc. extraction; livestock rearing;
Unregulated access; technical knowledge gap; market constraint; lack of investment on forest resource; uncertainty among users
Stakeholders Government agencies; private companies; cooperatives; local community; new settlers
Conflict of interest; marginalized local community;
Legal frameworks to And informal institutions regulate resource use
Federal Constitution (1995); Environmental policy (1997); Forest Policy & Law (2007); Wildlife Policy & Law (2005); Environment Impact Assessment (2002) National Energy Policy (1994); other regional laws, pastoral programs; traditional institutions
Clear & detailed guidelines; weak enforcement; local institutions undermined
Regulatory bodies
Federal & regional governmental agencies; forest coops and users groups
Inefficient & understaffed; not fully empowered
Common trend Intensive use of resources depletion of tree & other resources

277
Governance Challenges of Dry Woodlands
285
The guiding principles governing Ethiopia’s natural resources (land, forest, wildlife, water, etc) emanate from the 1995 Federal Constitution. The other relevant legal documents related to forests include: The Ethiopian National Energy Policy (1994); the Environmental Policy (1997); Rural Land Administration and Land Use Proclamation (456/2005); Management and Utilization of Wildlife Resources Proclamation (No. 541/2007); and Development Conservation and Utilization of Forest Proclamation 542/2007. These documents, in one way or another, are meant to protect the country’s natural resources particularly the forest and tree resources. However, none of these, including the forestry proclamation, refer to the dry woodlands in particular.
Among the policies listed, the Environmental Impact Assessment (EIA) Proclamation (No.299/2002) is particularly important. The EIA proclamation can be seen as a consummate legal paper with explicit articles to protect the environment against any type of environmentally un-friendly investments and acts. For example, the proclamation requires the approval of all investments in the country and denies permission to those that are thought to have negative environmental impact by the office delegated with such responsibility. In Article 18 of the proclamation, the commencement of projects without obtaining authorization from the relevant environmental agency and making of false statements in the EIA document is considered a criminal act punishable by law.
However, the most overriding policy document currently implemented with all seriousness is the Growth and Transformation Plan (GTP) 2010/11-2014/15 which constitutes a comprehensive development courses of action for five years starting from 2010. One sentence that refers to forestry in the GTP document reads: forestry development, protection and utilization will be done with increased effectiveness by the participation of communities (GTP, 2010/11-2014/15: 22). The government is now running a program to scale up participatory forest management in state-owned forests in various regions mainly in humid forest areas. However, there seems to be little plan concerning the management of dry woodlands found in all regions of the country.
Thus, Ethiopia’s dry woodlands not only suffer from a misconception of their value, but also from lack of explicit legal recognition as resources that stand alone by their own significance. As field realities indicate, it seems that these resources have been destined to give way for agricultural production. Although it is difficult to present empirical evidence that the government is consciously moving towards that goal, field level reality, such as the program of land lease, i.e. giving out land to investors at incredibly low prices (Desallegn (2011) do not indicate otherwise.
278
Melaku Bekele and Habtemariam Kassa
286
Looking for rational explanation The immediate causes given for resources depletion and lack of rational management of the dry woodlands of Ethiopia (over-exploitation for fuel and gum and resin, overgrazing by domestic animals, agricultural expansion, lack of regeneration, and weak forestry management) are not enough to explain the long-standing decline in dryland resources. There are deep-rooted factors rather that operate at local, national and global levels. To understand the events that are taking place in the drylands of Ethiopia it is important to focus on the interconnectedness of these underlying factors.
The National Factor: The current policy “neglect” of the dry woodlands of Ethiopia seems to have emanated from: a) the old and deep-rooted notion of looking at the drylands as vacant and unoccupied (IIED 2009); b) nomadic population are considered as having divided allegiance, and settled agricultural occupation is being taken to be a solution, as Desallegn (2003) concludes; c) standing trees (forests, woodlands) are considered as obstacles for high priority agricultural production and food security (Melaku 2003); c) pastoralist occupation and the common pool resources are looked at as non-viable economic activities and property regimes; and d) pastoral mobility is regarded as a potential source of political volatility in the areas concerned (Mohammud 2004). On top of such conceptual flaws about the drylands, the socio-economic necessity, ( i.e. creating job opportunities and generating most needed foreign currency), and also of the political exigency for economic growth on the part of the government are further aggravating the environmental depletion of dryland resources. The International Factor: There is thus a huge, unprecedented and ever-growing demand for agricultural lands by global capital that coincided with the government’s ambitious plan (GTP) to transform the economy in a relatively short period of time. Since 2007/08, due to the global financial crisis, inflated oil prices, and food shortages, demand for land for bio-fuel and food crop production has escalated. These events coincided with the desire by many African governments, including Ethiopia, to attract investors. The Local Factor: At this level, the reference is to national actors who are actively engaged in curving out a part out of the dry land regions of the country. These can be national agricultural investors, highland settlers5 and local community members who are intensively engaged in making gains in land holding in the country’s dry land areas. 5 For example, Benishangul Gumuz is one of the regions with large number of new settlers; According to Maru’s (2011) study over 42% of them are settlers from other places.

279
Governance Challenges of Dry Woodlands
287
Conclusion At the national level the driving forces are a complex set of social, economic and political elements very much intertwined and difficult to differentiate at a glance. Here, although the discourse is dominated by the economics of growth and transformation, it is obvious that the social and political exigencies to “satisfy” society through impressive economic growth, thus stabilizing political atmosphere, are in full swing. The international factors at play are less complex because what global capital wants from national states is obvious: fewer environmental controls, inexpensive land prices and cheap labor, less bureaucratic procedures to lease land, less control of the markets for products, and tax incentives. The coincidence between the need for more global capital and the global companies to invest once conditions are in place is apparent. It is this “coalition” between the national interest and global capital looking for attractive investment space that is difficult to push aside and “save” the forest resource. The interest of the local actors, except probably the local community, rests in the expansion and legalization of their holdings. Those local community members who look at the events that are taking place (land lease for investors) as endangering their traditional rights have entered the land race by building enclosures and in this one way their interest may coincide with the other national actors. It is within this policy and practical limits that one needs to look for some openings.
Several dry woodland research reports on Sub-Saharan Africa, including Ethiopia, finish with the common commendation of the need to empower communities, strengthen traditional institutions, and initiate improved land tenure (Mwangi and Dohrn 2008; Chidumayo and Emmanuel 2010; Teshale 2011). In the Ethiopian case, the request for establishment of a more effective and efficient forestry organization is regularly put forth as a necessary prelude to halt woodland depletion and rehabilitate the resource. Tieguhong and Ndoye (2004) argue that the sure way to minimize African deforestation rests with enforceable policies addressing tenure issues. There could be little dispute against except that, when put in context (as shown above) the viability of such good propositions depends on adequate policies and the removal of impediments to enforcing even those existing policies that have a positive impact. Empowering communities, revitalizing the fading local institutions, and improving rights over land are political in nature and extremely difficult, if not impossible, to execute particularly in the context of current events that are taking place in and around the dry woodlands of Ethiopia.
Finally, it needs to be noted that the Ethiopian government appears highly committed to continue with its ambitious economic growth and transformation plan. Agricultural extensification in areas under discussion is still the major

280
Melaku Bekele and Habtemariam Kassa
288
development direction. Therefore, at this time in point there is little alternative to alter the trend. The available options which are probably within the policy grip of the regional authorities and experts to protect the remaining woodlands of the country include: First, as the number of legally settled and encroaching small-scale farmers is growing, it is important to establish and provide more effective extension services to enable individual farmers to develop farm level biodiversity by maintaining trees already on the farm and plant new farm trees. Second, in Somali, Borana, South Omo and Afar regions, individualization of woodlands, in many cases for non-farming purposes, is growing as a result of local community’s response to external take-over of lands. This development needs a closer study in relation to its impact on resource ownership and management. It should serve as a policy outlet by encouraging individual tree ownership and management. Third, the identification of biodiversity hot-spots from among the dry woodlands should be possible without disrupting the government’s general plan for agricultural development, a good quantity of forests and woodlands can be preserved by state agents. Fourth, government owned gum-resin extracting companies should be able to re-invest some of their profits in the protection and development of the resource base, and introduce better tapping techniques. Fifth, one shall not also exclude the possibility of looking for collaboration with the big commercial agricultural investors to participate in or contribute to some kind of conservation work.
References Abeje Eshete 2002. Regeneration Status, Soil Seed Banks and Socio-economic
Importance of B. papyrifera in two woredas of North Gonder Zone, Northern Ethiopia. MSc Thesis, Swedish University of Agricultural Sciences, Skinnskatteberg, Sweden.
Abraham Abiyu, F. Bongers, Abeje Eshete, Kindiya G/Hiwot, Mengistie kindu, Mulugeta
Limneih,Yitebitu Moges, Woldeselassie Ogbazghi and Sterck, F. J. 2010. Incense
Woodlands in Ethiopia and Eritrea: Regeneration Problems and Restoration Possibilities. London, Earthscan,
Beruk Yemane 2003 Food Security Situation in the Pastoral Areas of Ethiopia. Ethiopia: National Pastoral Programme.

281
Governance Challenges of Dry Woodlands
289
Boahene, K. 1998. The Challenge of Deforestation in Tropical Africa: Reflections on its Principal Causes, Consequences and Solutions. Land Degradation and Development, 9 (3): 247-258.
Bongers, F., and Tennigkeit, T. (eds.) 2010. Degraded Forests in Eastern Africa: Management and Restoration. The Earthscan Forest Library. London: Earthscan Ltd
Chamshama, S.A.O and Vyamana, V. G. 2010. Forests and Forestry in Tanzania. In Frans Bongers and Timm Tennigkeit, eds., Degraded Forests of in eastern Africa. Management and Restoration. London, Washington, Earthscan.
Chidumayo, E. and Emmanuel, C. M. 2010. Dry Forests and Woodlands in Sub-Saharan Africa: Context and Challenges. In: Chidumayo, N and Gumbo, D.J (eds), The Dry Forests and Woodlands of Africa: Managing for Products and Services. Earthscan, London. pp 1-10
Desallegn Rahmato 2007. Customs in Conflict: Land Tenure Issues among Pastoralists in Ethiopia. Forum for Social Studies, Addis Ababa.
Desallegn Rahmato. 2011. Land to Investors: Large-Scale Land Transfers in Ethiopia. Forum for Social Studies. Addis Ababa
Diress Tsegaye 2010 Afar pastoralists in a changing rangeland environment. Philosophiae Doctor (PhD) Thesis, Department of Ecology and Natural Resource Management, Norwegian University of Life Sciences, Thesis number 2010: 33.
Eyasu Elias and Feyera Abdi 2010 Putting Pastoralists on the Policy Agenda: Land Alienation in Southern Ethiopia. Gate keeper Series 145, International Institute for Environment and Development, London.
Federal Democratic Republic of Ethiopia 2007. Conservation and Utilization of Forest Proclamation 542/2007, Ministry of Agriculture and Rural Development, Addis Ababa
______1995. Constitution of the Federal Democratic Republic of Ethiopia Proclamation No. 1/1995. Addis Ababa
______ 1997. Environmental Policy of Ethiopia. Ethiopian Environmental Authority, Addis Ababa
______2002. Environmental Impact Assessment (EIA) Proclamation (No.299/2002). Ethiopian Environmental Authority, Addis Ababa
______2010. Growth and Transformation Plan (GTP) 2010/11-2014/15, Ministry of Finance and Economic Development, Addis Ababa.
______2007. Management and Utilization of Wildlife Resources Proclamation (No. 541/2007), Addis Ababa.

282
Melaku Bekele and Habtemariam Kassa
290
______1994. National Energy Policy. Ministry of Mines and Energy, Addis Ababa.
______2005. Rural Land Administration and Land Use Proclamation (456/2005); Ministry of Agriculture and Rural Development, Addis Ababa
FAO. 2010a. Guidelines on sustainable forest management in drylands of sub-Saharan Africa. Arid Zone Forests and Forestry Working Paper No. 1. Rome.
FAO 2010b. Export Quantity of Wood Charcoal in Ethiopia PDR - 1961-2009. http://data.mongabay.com/commodities/category/5-Forestry/15-Forestry/1630-Wood+Charcoal/91-Export+Quantity/62-Ethiopia+PDR (Accessed, May 2012)
Flintan, F. 2007. A Sharing of Past Experiences. In A. Ridgewell, Getachew Mamo, F. Flintan, eds., Gender & Pastoralism. Rangeland & Resource Management in Ethiopia. Ethiopia, SOS Sahel . Vol 1: pp. 1-14.
Friis, C. and Reenberg, A. 2010. Land Grab in Africa: Emerging Land System Drivers in a Tele-connected World. GLP Report No. 1. GLP-IPO, Copenhagen.
International Institute for Environment and Development (IIED) (2009) ‘Land Grabs’ in Africa: Can the Deals work for Development? IIED briefing note, September 2009. http://www.iied.org/pubs/pdfs/17069IIED.pdf. (Accessed on May,2012)
Getachew Mamo 2007. “Community?”Forest Management in Borana. In Andrew Ridgewell, Getachew Mamo, Fiona Flintan, eds., Gender & Pastoralism. Rangeland & Resource Management in Ethiopia, SOS Sahel, Ethiopia. Vol 1: 15-30
Grosskinsky, B. 2000. ‘Nutritional Contribution of IWFP, in B. Grosskinsky and C. Gullick (eds.). Exploring the Potential of Indigenous Wild Food Plants in Southern Sudan. Proceedings of a workshop held in Lokichoggio, Kenya, USAID, Nairobi
Gufu Oba 1998. Assessment of Indigenous Range Management Knowledge of the Boran Pastoralists of Southern Ethiopia. GTZ, Borana Lowland Pastoral Development Programme.
Hagmann, T. 2006. ‘Pastoral Conflict and Resource Management in Ethiopia’s Somali Region’. Doctoral thesis, University of Lausanne.
Kammen, D. M. and Lew D.J. 2005. Renewable and Appropriate Energy Laboratory. Review of Technologies for the Production and Use of Charcoal Energy and Resources Group & Goldman School of Public Policy. Berkeley, University of California..

283
Governance Challenges of Dry Woodlands
291
Lemlem Aregu & Yemane Belete 2007. Coping with Drought in the Borana Rangelands. In Andrew Ridgewell, Getachew Mamo, Fiona Flintan, eds., Gender & Pastoralism. Rangeland & Resource Management in Ethiopia, SOS Sahel, Ethiopia. Vol 1: 15-30
Malimbwi, R., Chidumayo, E., Zahabu, E., Kingazi, S., Misana, S., Luoga, E. and Nduwamungu, J. 2010. Wood Fuel. In Chidumayo, E.N. and Gumbo, D.J., eds, The Dry Forests and Woodlands of Africa: Managing for Products and Services. Center for International Forestry Research, Earthscan, Washnigton, DC, Pp. 155-177.
Maru Shete 2011.Implications of Land Deals to Livelihood Security and Natural Resource Management in Benshanguel Gumuz Regional State, Ethiopia. Paper presented at the International Conference on Global Land Grabbing
Melaku Bekele 2003. Forest property rights, the role of the state, and institutional exigency: the Ethiopian case. PhD Dissertation, SLU, Uppsala, Sweden.
Melaku Bekele 2008 Environmental Policies, Strategies and Programs. Digest of Ethiopian Policies, Strategies and Programs. Forum for Social Studies. Addis Ababa, FSS.
Melaku Bekele and Zenebe Girmay 2013. Reading Through the Charcoal Industry: Production, Marketing, Consumption and Impact of Charcoal in Ethiopia. Forum for Social Studies. Addis Ababa
Mohammud Abdulahi 2004 Pastoral Development Strategies/Policies in Ethiopia. In Yonas Admasu, ed., A Critical Analysis and Evaluation in Pastoral Development in Ethiopia. Pastoralist Forum Ethiopia, Addis Ababa.
Mulugeta Limenih, Habtemariam Kassa, Girma Kassie, Dagne Abebaw, and Work Teka 2012. Resettlement and Woodland Management Problems and Options: A Case study from a Resettlement District in Northwestern Ethiopia. Land Degradation & Development. doi: 10.1002/l dr.
Mulugeta Lemenih & Habtemariam Kassa 2011. Opportunities and Challenges for Sustainable Production and Marketing of Gums and Resins in Ethiopia. CIFOR, Bogor, Indonesia.
NL Agency 2010. Making Charcoal Production in Sub Sahara Africa Sustainable. Ministry of Economic Affairs, Agriculture and Innovation. BTG Biomass Technology Group BV.
Pantuliano S. and Wekesa, M. 2008. Improving Drought Response in Pastoral Areas of Ethiopia, Somali and Afar Regions and Borena Zone of Oromiya Region. Humanitarian Policy Group Overseas Development Institute,

284
Melaku Bekele and Habtemariam Kassa
292
London Prepared for the CORE Group (CARE, FAO, Save the Children UK and Save the Children US)
Seid Oumer 2007. ‘The ‘Privatization’ of Somali Region’s Rangelands’. In: A. Ridgewell, G. Mamo and F. Flintan, ‘Gender and Pastoralism Vol 1: Rangeland and Resource Management in Ethiopia’, 33-44. Addis Ababa; SOS Sahel Ethiopia.
Ridgewell, A. and Getachew Mamo 2007 Gender and Cultural Change among the Hamar of Southwestern Ethiopia. Draft. Unpublished research report.
Shackleton and Gumbo 2010. Contribution of Non-wood Forest Products to Livelihoods and Poverty Alleviation. In Emmanuel N. Chidumayo and Davison J. Gumbo, eds., The Dry Forests and Woodlands of Africa Managing for Products and Services, Erathscan, London
Sintayehu Mesele, Heluf Gebrekidan, Coppock, D.L. 2006 . Changes in Land Cover and Soil Conditions for the Yabelo District of the Borana Plateau, 1973-2003. Research Brief 06-06- PARIMA. Global Livestock Collaborative Research Support Program. University of California, Davis.
Stellmacher, T.and Eguavoen, I. 2011 The Rules of Hosts and Newcomers. Local Forest Management after Resettlement in Ethiopia. Center for Development Research (ZEF), University of Bonn/ Germany http://www.nai.uu.se/ecas-4/panels/101-120/panel-103/Till-Stellmacher-full-paper.pdf (Accessed June 2013)
Somali Regional State 2003. A Strategic Plan for Sustainable Conservation and Management of the Woody Biomass Resources. Final Report. www.eap.gov.et/sites/default/files/Somali-St.plan_.pdf (Accessed, October 2013)
Sunderland, T. 2011. Forests, Biodiversity and Food Security. Second World Biodiversity Congress. Presentation Transcript. CIFOR, Thinking Beyond the Canopy
Tefera S. and Flintan, F. 2007. Dynamics of Rangeland and Water Management in Afar. In: Ridgewell, A., Mamo, G. and Flintan (eds.). Gender and Pastoralism: Rangeland & Resource Management in Ethiopia. SOS Sahel Ethiopia, Addis Ababa. pp.59-68.
Tefera Mengistu 2011. Physiological Ecology of the Frankincense Tree. Thesis submitted in fulfillment of the requirement for the degree of doctor at Wageningen University, Wageningen, the Netherlands.
Tesfaye Desalew, Azage Tegegne, Lisanework Nigatu and Worku Teka 2010. Rangeland Condition and Feed Resources in Metema District, North Gondar Zone, Amhara Region, Ethiopia Improving Productivity and Market Success of Ethiopian Farmers Project (IPMS)–International
285
Governance Challenges of Dry Woodlands
293
Livestock Research Institute (ILRI), Addis Ababa, Ethiopia. Working Paper No. 25.
Teshale Woldamanual 2011. Dryland Resources, Livelihoods and Institutions Diversity and Dynamics in Use and Management of Gum and Resin Trees in Ethiopia. Submitted in fulfillment of the requirements for the degree of doctor at Wegeningen University.
Uhart, E. 1975. Report on Charcoal Production and Marketing in Ethiopia. Ministry of Agriculture. Addis Ababa.
Walter, S. 2001 Non-wood Forest Products in Africa: A Regional and National Overview, FAO, Rome
Woody Biomass Inventory and Strategic Planning Project (WBISPP) 2004. Forest Resources of Ethiopia. Addis Ababa, Ethiopia: Ministry of Agriculture and Rural Development (MOARD).
Wubalem Tadesse, Desalegn, G. and R. Alia 2007. Natural Gum and Resin Bearing Species of Ethiopia and their Potential Applications. Investigación Agraria: Sistemas y Recursos Forestales 16(3), 211-221.


This volume brings together a select number of studies which give a broader picture of the country’s development program, examining not just the progress that has been made so far but also the challenges and pitfalls that are evident. This, we believe, makes the volume all the more topical and hence of interest to many readers. The book provides a good starting point for a balanced assessment of economic development in the last two decadesdecades with the primary purpose of stimulating informed debate on the Ethiopia’s economy and development endeavor in this period. The authors of the collection are based in academia, civil society organizations, and independent research institutions, and the contributions have come from economists as well as researchers in several other disciplines. As the diversity of the subject matter in the collection indicates, the work is not meant to bebe for economists only but is intended to attract a wider readership. We believe the book will be of interest to experts in government departments, development practitioners in civil society, academics, independent researchers, and people who have a special interest on Ethiopia and its future.
Printed @ Eclipse 251 115572222/23