ETHIOPIA - International Trade Centre
32
SPICES SECTOR INVESTMENT PROFILE ETHIOPIA
-
Upload
khangminh22 -
Category
Documents
-
view
1 -
download
0
Transcript of ETHIOPIA - International Trade Centre
SPICES SECTORINVESTMENT PROFILE
ETHIOPIA
© s
hutte
rsto
ck.c
om
SPICES SECTORINVESTMENT PROFILE
ETHIOPIA
2020
4
SP
ICE
S S
EC
TOR
INVE
STM
EN
T P
RO
FILE
: ETH
IOP
IA
ACKNOWLEDGEMENTS
Designed and produced under the framework of Supporting Indian Trade and Investment for Africa (SITA), this profile has been updated under the framework of Partnership for Investment and Growth in Africa (PIGA) project. Both PIGA and SITA are funded by the United Kingdom’s Foreign, Commonwealth and Development Office (FCDO) and are implemented by the International Trade Centre. SITA and PIGA are South-South Trade and Investment projects operational in Ethiopia and Kenya (SITA and PIGA); Mozambique and Zambia (PIGA); Rwanda, Tanzania and Uganda (SITA). SITA focuses on partnerships between Indian businesses and institutions and its African partner countries. PIGA aims to contribute to job creation and sustainable growth by supporting these countries to attract foreign direct investment, specifically Chinese investment, in the agroprocessing and light manufacturing sectors.
Special contributions to writing this report have been provided by:
Ministry of Industry
Ministry of Foreign Affairs
Ministry of Finance and Economic development
National Bank of Ethiopia
Ethiopian Pulses, Oilseeds and Spices Processors - Exporters Association
Addis Ababa Science and Technology University
Teppi Spices Research Institution
Quality Assurance:
International Trade Centre (ITC), Trade Facilitation and Policy for Business Section (TFPB)TCA Ranganathan, External consultant, Rajesh Aggarwal, Chief (TFPB), Andrew Huelin, Associate Programme Advisor (TFPB)
Author: Atsede Assefa Mekuria
Design: Iva Stastny Brosig, Design plus d.o.o.
Editor: Vanessa Finaughty
Updated for PIGA by Mallika Deepak
The views expressed in this report are those of the authors and do not represent the official position of the International Trade Centre, Ethiopian Investment Commission and the Government of the United Kingdom.
© International Trade Centre 2020

5
SP
ICE
S S
EC
TOR
INVE
STM
EN
T P
RO
FILE
: ETH
IOP
IA
Table of Contents
ETHIOPIA: AN OVERVIEW 7KEY FACTS 7
POLITICAL CONDITIONS 8
MACRO ECONOMY 8
IMPORT AND EXPORT REVIEW 9
Imports Exports
MANAGEMENT OF INFLATION 10
BANKING, INSURANCE AND CREDIT AVAILABILITY 10
TAXATION POLICIES, SYSTEM AND PROCEDURES 12
Registration of tax identification number (TIN)
WHY ETHIOPIA? 15POLITICAL AND SOCIAL STABILITY 15
STABLE ECONOMIC ENVIRONMENT AND RAPID ECONOMIC GROWTH 15
ADEQUATE FARMING LAND 15
INVESTMENT GUARANTEE AND PROTECTION 16
ABUNDANT LABOUR AND REASONABLE WAGE RATES 16
WIDE MARKET ACCESS 17
IMPROVED LOGISTICS AND INFRASTRUCTURE 17
Electricity supply Water availability Road transportRailways and ports Air transport Telecommunication International cooperation
ETHIOPIAN SPICES SECTORAL OVERVIEW 19
ETHIOPIA’S GRANULAR SECTORAL TRADE BEHAVIOUR 19
SPICES SUBSECTOR ECONOMY 19
PRODUCTION BEHAVIOUR OF SPICES IN ETHIOPIA 20
SPICES PRODUCTION INVESTMENT 21
GROWTH TRENDS OF DOMESTIC DEMAND FOR SPICES 21
SECTOR INVESTMENT PROMOTION MEASURES 22
Attractive investment incentivesCustoms duty exemptionIncome tax exemptionLoss carried forward Export trade duty incentives schemeRemittance of funds
INVESTMENT OPPORTUNITIES 25PRIMARY PRODUCTION 25
CONTRACT FARMING AND OUTGROWER SCHEMES 25
VALUE –ADDED PROCESSING 25
USEFUL CONTACTS 27
ANNEXES 28ANNEX I: INSTITUTIONAL SUPPORT FOR INVESTORS 28
ANNEX II: PROCEDURES FOR INVESTMENT START-UP 29
BIBLIOGRAPHY 30
5
SP
ICE
S S
EC
TOR
INVE
STM
EN
T P
RO
FILE
: ETH
IOP
IA
Abbreviations & Acronyms
ITC International Trade CentreAU African Union AGOA African Growth and Opportunity ActACP African, Caribbean and Pacific GroupCOMESA Common Market for Eastern and Southern AfricaDBE Development Bank of EthiopiaECA Economic Commission for AfricaEIA Ethiopian Investment Agency GDP Gross Domestic ProductICC International Chamber of CommerceMOFED Ministry of Finance and Economic DevelopmentNBE National Bank of Ethiopia UN United Nations
WTO World Trade OrganizationVAT Value-Added TaxTIN Taxpayer Identification NumberFDI Foreign Direct InvestmentECX Ethiopian Commodity ExchangeEPOSPEA Ethiopian Pulses, Oilseeds and Spices Processors - Exporters AssociationIZDC Ethiopian Industrial Zones Development CorporationIZ Industrial Zone
List of Figures
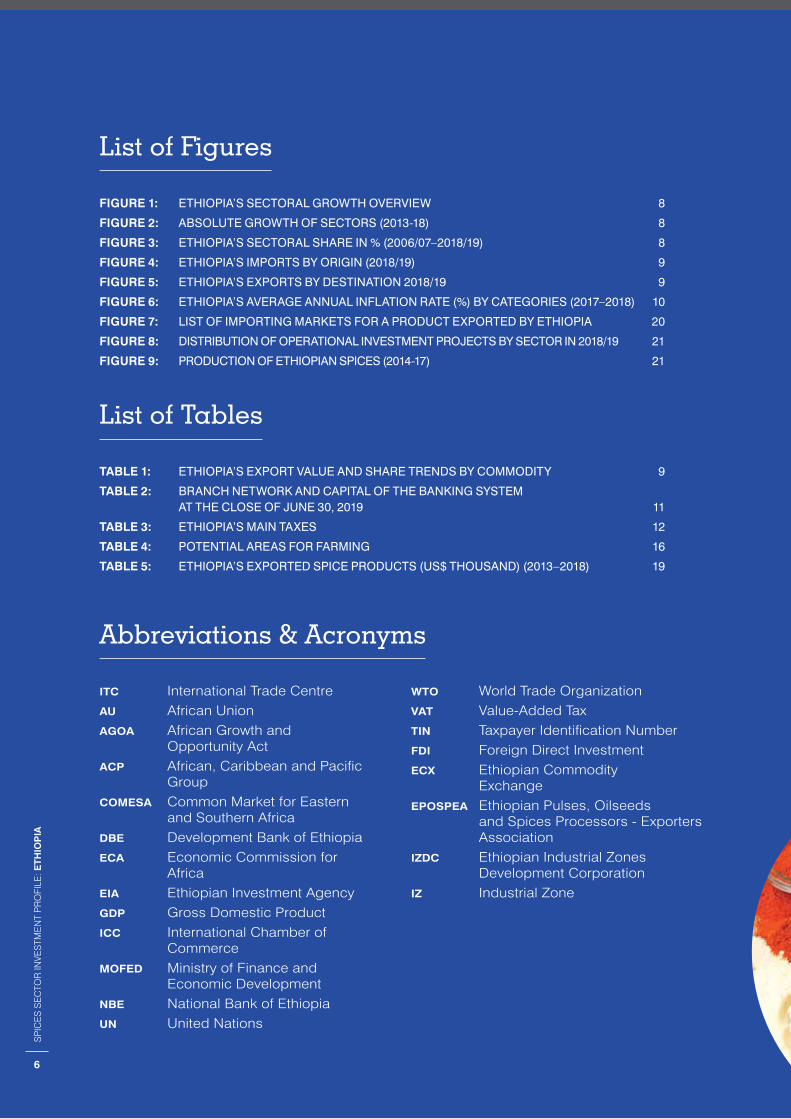
FIGURE 1: ETHIOPIA’S SECTORAL GROWTH OVERVIEW 8
FIGURE 2: ABSOLUTE GROWTH OF SECTORS (2013-18) 8
FIGURE 3: ETHIOPIA’S SECTORAL SHARE IN % (2006/07–2018/19) 8
FIGURE 4: ETHIOPIA’S IMPORTS BY ORIGIN (2018/19) 9
FIGURE 5: ETHIOPIA’S EXPORTS BY DESTINATION 2018/19 9
FIGURE 6: ETHIOPIA’S AVERAGE ANNUAL INFLATION RATE (%) BY CATEGORIES (2017–2018) 10
FIGURE 7: LIST OF IMPORTING MARKETS FOR A PRODUCT EXPORTED BY ETHIOPIA 20
FIGURE 8: DISTRIBUTION OF OPERATIONAL INVESTMENT PROJECTS BY SECTOR IN 2018/19 21
FIGURE 9: PRODUCTION OF ETHIOPIAN SPICES (2014-17) 21
List of Tables
TABLE 1: ETHIOPIA’S EXPORT VALUE AND SHARE TRENDS BY COMMODITY 9
TABLE 2: BRANCH NETWORK AND CAPITAL OF THE BANKING SYSTEM AT THE CLOSE OF JUNE 30, 2019 11
TABLE 3: ETHIOPIA’S MAIN TAXES 12
TABLE 4: POTENTIAL AREAS FOR FARMING 16
TABLE 5: ETHIOPIA’S EXPORTED SPICE PRODUCTS (US$ THOUSAND) (2013–2018) 19
6
SP
ICE
S S
EC
TOR
INVE
STM
EN
T P
RO
FILE
: ETH
IOP
IA
7
SP
ICE
S S
EC
TOR
INVE
STM
EN
T P
RO
FILE
: ETH
IOP
IA
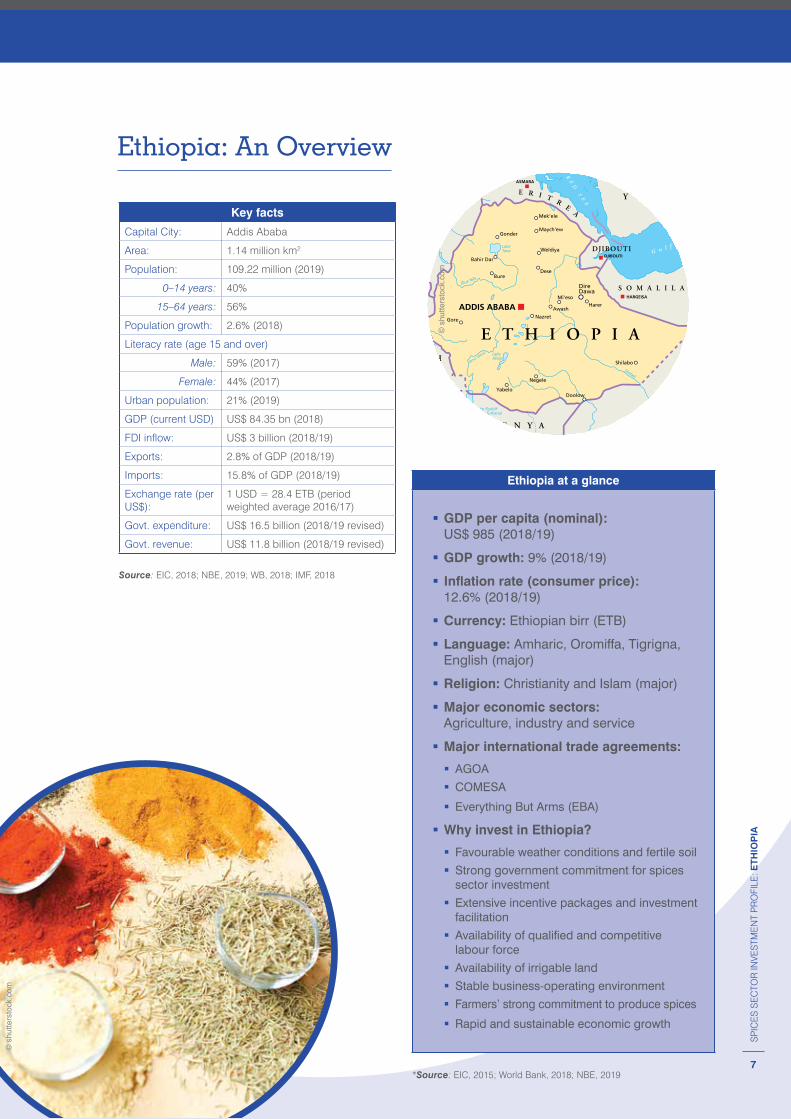
Ethiopia: An Overview
Ethiopia at a glance
� GDP per capita (nominal): US$ 985 (2018/19)
� GDP growth: 9% (2018/19)
� Inflation rate (consumer price): 12.6% (2018/19)
� Currency: Ethiopian birr (ETB)
� Language: Amharic, Oromiffa, Tigrigna, English (major)
� Religion: Christianity and Islam (major)
� Major economic sectors: Agriculture, industry and service
� Major international trade agreements:
� AGOA
� COMESA
� Everything But Arms (EBA)
� Why invest in Ethiopia?
� Favourable weather conditions and fertile soil
� Strong government commitment for spices sector investment
� Extensive incentive packages and investment facilitation
� Availability of qualified and competitive labour force
� Availability of irrigable land
� Stable business-operating environment
� Farmers’ strong commitment to produce spices
� Rapid and sustainable economic growth
*Source: EIC, 2015; World Bank, 2018; NBE, 2019
© s
hutte
rsto
ck.c
om
© s
hutte
rsto
ck.c
om
Key facts
Capital City: Addis Ababa
Area: 1.14 million km2
Population: 109.22 million (2019)
0–14 years: 40%
15–64 years: 56%
Population growth: 2.6% (2018)
Literacy rate (age 15 and over)
Male: 59% (2017)
Female: 44% (2017)
Urban population: 21% (2019)
GDP (current USD) US$ 84.35 bn (2018)
FDI inflow: US$ 3 billion (2018/19)
Exports: 2.8% of GDP (2018/19)
Imports: 15.8% of GDP (2018/19)
Exchange rate (per US$):
1 USD = 28.4 ETB (period weighted average 2016/17)
Govt. expenditure: US$ 16.5 billion (2018/19 revised)
Govt. revenue: US$ 11.8 billion (2018/19 revised)
Source: EIC, 2018; NBE, 2019; WB, 2018; IMF, 2018
8
SP
ICE
S S
EC
TOR
INVE
STM
EN
T P
RO
FILE
: ETH
IOP
IA
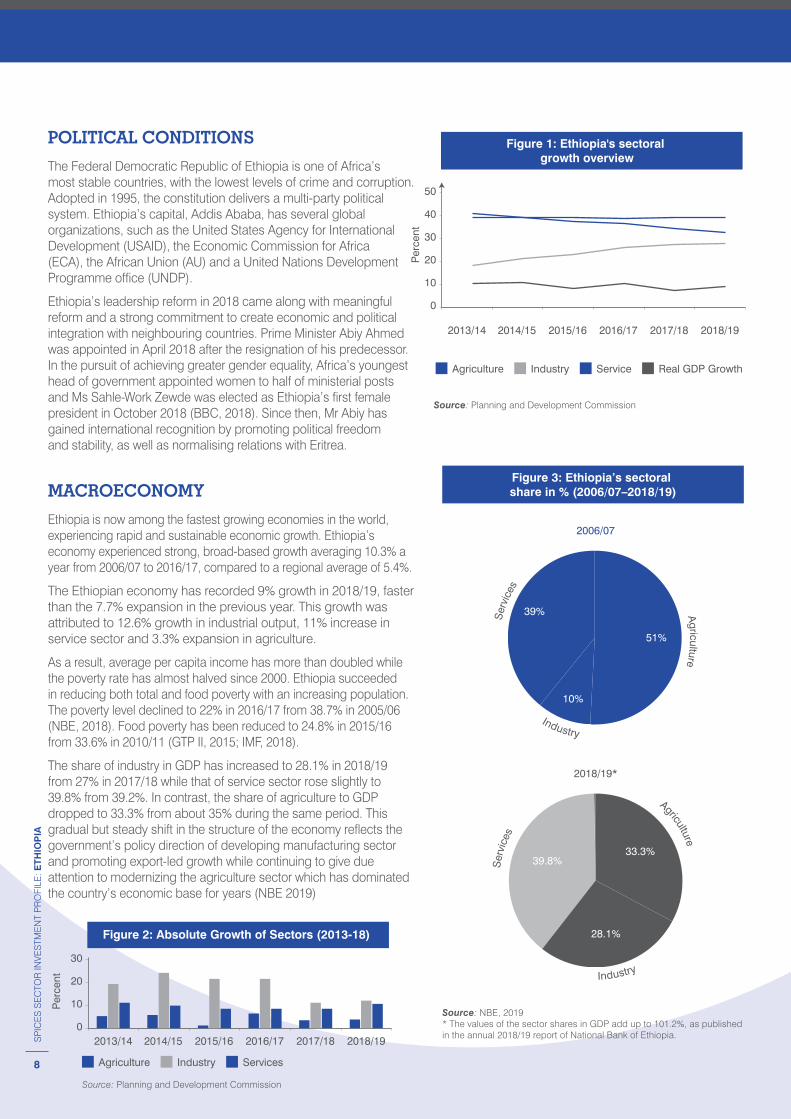
POLITICAL CONDITIONS
The Federal Democratic Republic of Ethiopia is one of Africa’s most stable countries, with the lowest levels of crime and corruption. Adopted in 1995, the constitution delivers a multi-party political system. Ethiopia’s capital, Addis Ababa, has several global organizations, such as the United States Agency for International Development (USAID), the Economic Commission for Africa (ECA), the African Union (AU) and a United Nations Development Programme office (UNDP).
Ethiopia’s leadership reform in 2018 came along with meaningful reform and a strong commitment to create economic and political integration with neighbouring countries. Prime Minister Abiy Ahmed was appointed in April 2018 after the resignation of his predecessor. In the pursuit of achieving greater gender equality, Africa’s youngest head of government appointed women to half of ministerial posts and Ms Sahle-Work Zewde was elected as Ethiopia’s first female president in October 2018 (BBC, 2018). Since then, Mr Abiy has gained international recognition by promoting political freedom and stability, as well as normalising relations with Eritrea.
MACROECONOMY
Ethiopia is now among the fastest growing economies in the world, experiencing rapid and sustainable economic growth. Ethiopia’s economy experienced strong, broad-based growth averaging 10.3% a year from 2006/07 to 2016/17, compared to a regional average of 5.4%.
The Ethiopian economy has recorded 9% growth in 2018/19, faster than the 7.7% expansion in the previous year. This growth was attributed to 12.6% growth in industrial output, 11% increase in service sector and 3.3% expansion in agriculture.
As a result, average per capita income has more than doubled while the poverty rate has almost halved since 2000. Ethiopia succeeded in reducing both total and food poverty with an increasing population. The poverty level declined to 22% in 2016/17 from 38.7% in 2005/06 (NBE, 2018). Food poverty has been reduced to 24.8% in 2015/16 from 33.6% in 2010/11 (GTP II, 2015; IMF, 2018).
The share of industry in GDP has increased to 28.1% in 2018/19 from 27% in 2017/18 while that of service sector rose slightly to 39.8% from 39.2%. In contrast, the share of agriculture to GDP dropped to 33.3% from about 35% during the same period. This gradual but steady shift in the structure of the economy reflects the government’s policy direction of developing manufacturing sector and promoting export-led growth while continuing to give due attention to modernizing the agriculture sector which has dominated the country’s economic base for years (NBE 2019)
Source: NBE, 2019 * The values of the sector shares in GDP add up to 101.2%, as published in the annual 2018/19 report of National Bank of Ethiopia.
Figure 3: Ethiopia’s sectoral share in % (2006/07–2018/19)
2006/07
2018/19*
Agriculture
Agriculture
Ser
vice
sS
ervi
ces
Industry
Industry
51%
33.3%39.8%
28.1%
10%
39%
Source: Planning and Development Commission
Figure 2: Absolute Growth of Sectors (2013-18)
Agriculture ServicesIndustry
2013/14 2014/15 2015/16 2016/17 2017/18 2018/19
30
Per
cent 20
10
0
Source: Planning and Development Commission
Figure 1: Ethiopia's sectoral growth overview
40
50
Agriculture Service Real GDP GrowthIndustry
30
Per
cent
20
10
0
2013/14 2014/15 2015/16 2016/17 2017/18 2018/19
9
SP
ICE
S S
EC
TOR
INVE
STM
EN
T P
RO
FILE
: ETH
IOP
IA
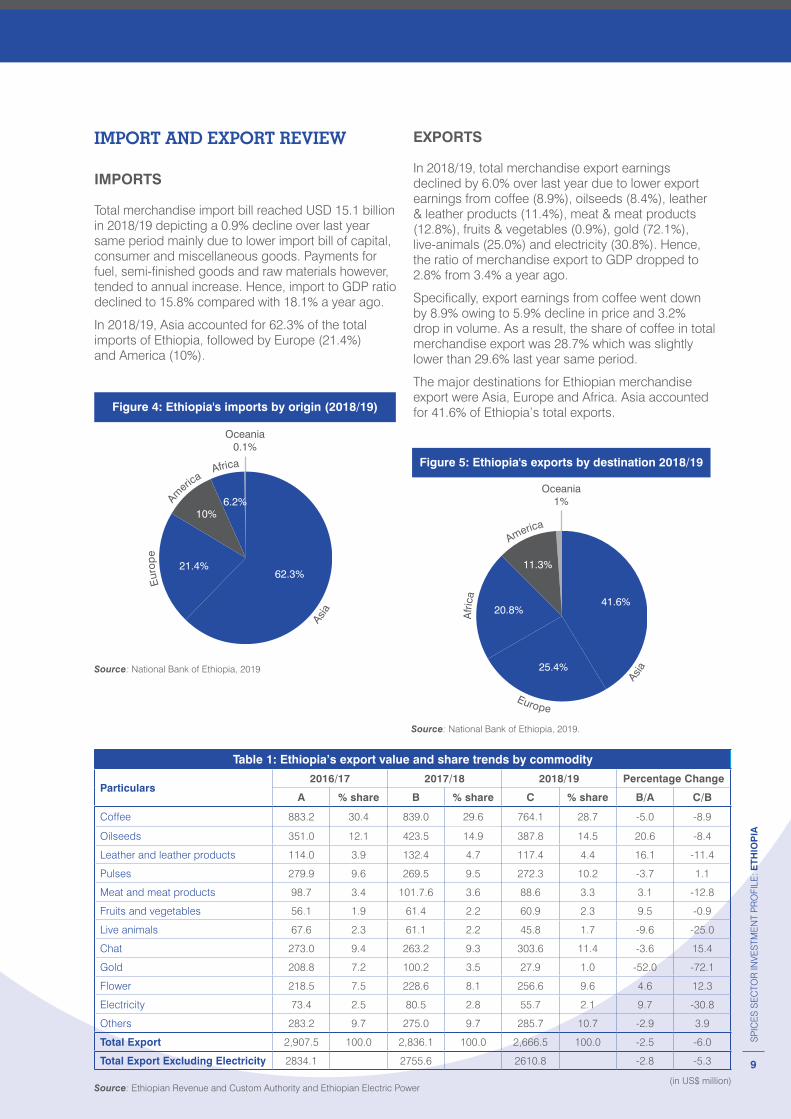
IMPORT AND EXPORT REVIEW
IMPORTS
Total merchandise import bill reached USD 15.1 billion in 2018/19 depicting a 0.9% decline over last year same period mainly due to lower import bill of capital, consumer and miscellaneous goods. Payments for fuel, semi-finished goods and raw materials however, tended to annual increase. Hence, import to GDP ratio declined to 15.8% compared with 18.1% a year ago.
In 2018/19, Asia accounted for 62.3% of the total imports of Ethiopia, followed by Europe (21.4%) and America (10%).
EXPORTS
In 2018/19, total merchandise export earnings declined by 6.0% over last year due to lower export earnings from coffee (8.9%), oilseeds (8.4%), leather & leather products (11.4%), meat & meat products (12.8%), fruits & vegetables (0.9%), gold (72.1%), live-animals (25.0%) and electricity (30.8%). Hence, the ratio of merchandise export to GDP dropped to 2.8% from 3.4% a year ago.
Specifically, export earnings from coffee went down by 8.9% owing to 5.9% decline in price and 3.2% drop in volume. As a result, the share of coffee in total merchandise export was 28.7% which was slightly lower than 29.6% last year same period.
The major destinations for Ethiopian merchandise export were Asia, Europe and Africa. Asia accounted for 41.6% of Ethiopia’s total exports.
Table 1: Ethiopia’s export value and share trends by commodity
Particulars2016/17 2017/18 2018/19 Percentage Change
A % share B % share C % share B/A C/B
Coffee 883.2 30.4 839.0 29.6 764.1 28.7 -5.0 -8.9
Oilseeds 351.0 12.1 423.5 14.9 387.8 14.5 20.6 -8.4
Leather and leather products 114.0 3.9 132.4 4.7 117.4 4.4 16.1 -11.4
Pulses 279.9 9.6 269.5 9.5 272.3 10.2 -3.7 1.1
Meat and meat products 98.7 3.4 101.7.6 3.6 88.6 3.3 3.1 -12.8
Fruits and vegetables 56.1 1.9 61.4 2.2 60.9 2.3 9.5 -0.9
Live animals 67.6 2.3 61.1 2.2 45.8 1.7 -9.6 -25.0
Chat 273.0 9.4 263.2 9.3 303.6 11.4 -3.6 15.4
Gold 208.8 7.2 100.2 3.5 27.9 1.0 -52.0 -72.1
Flower 218.5 7.5 228.6 8.1 256.6 9.6 4.6 12.3
Electricity 73.4 2.5 80.5 2.8 55.7 2.1 9.7 -30.8
Others 283.2 9.7 275.0 9.7 285.7 10.7 -2.9 3.9
Total Export 2,907.5 100.0 2,836.1 100.0 2,666.5 100.0 -2.5 -6.0
Total Export Excluding Electricity 2834.1 2755.6 2610.8 -2.8 -5.3
Source: Ethiopian Revenue and Custom Authority and Ethiopian Electric Power
Oceania1%
Figure 5: Ethiopia's exports by destination 2018/19
Asia
Europe
America
41.6%
25.4%
20.8%
11.3%
Afri
ca
Source: National Bank of Ethiopia, 2019.
Source: National Bank of Ethiopia, 2019
Figure 4: Ethiopia's imports by origin (2018/19)
Oceania0.1%
Asia
Eur
ope
Am
erica
Africa
62.3%21.4%
10%6.2%
(in US$ million)
10
SP
ICE
S S
EC
TOR
INVE
STM
EN
T P
RO
FILE
: ETH
IOP
IA
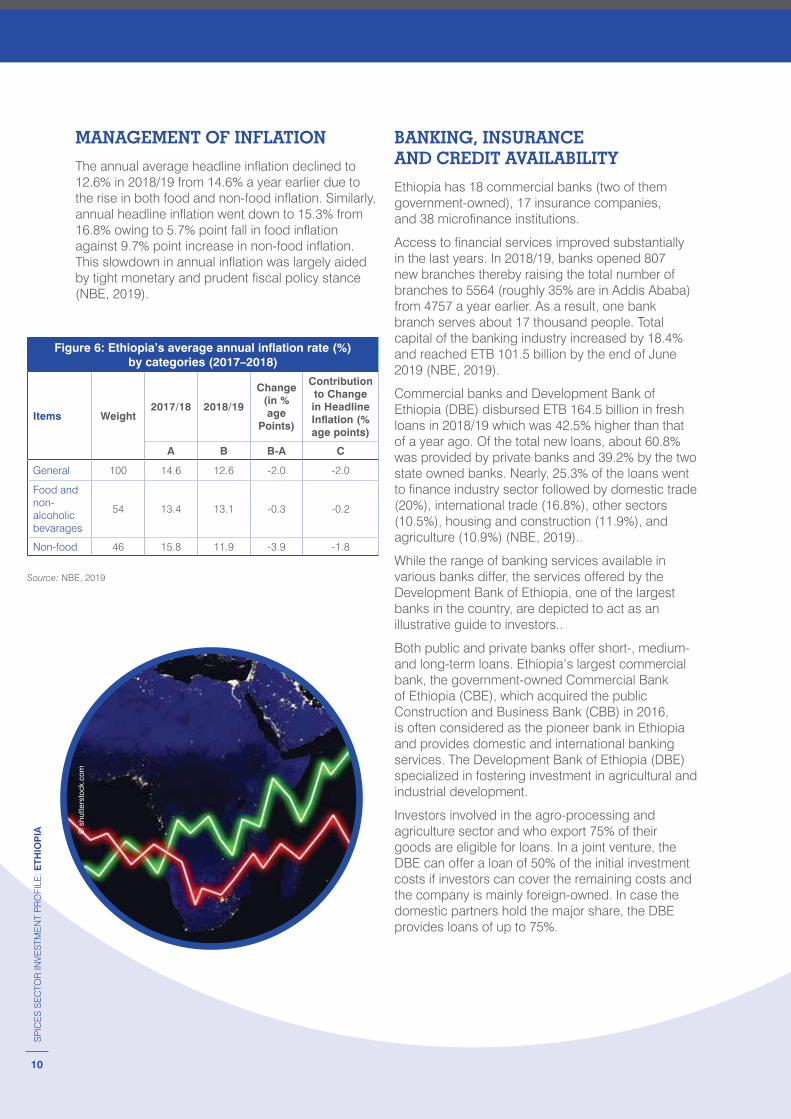
MANAGEMENT OF INFLATION
The annual average headline inflation declined to 12.6% in 2018/19 from 14.6% a year earlier due to the rise in both food and non-food inflation. Similarly, annual headline inflation went down to 15.3% from 16.8% owing to 5.7% point fall in food inflation against 9.7% point increase in non-food inflation. This slowdown in annual inflation was largely aided by tight monetary and prudent fiscal policy stance (NBE, 2019).
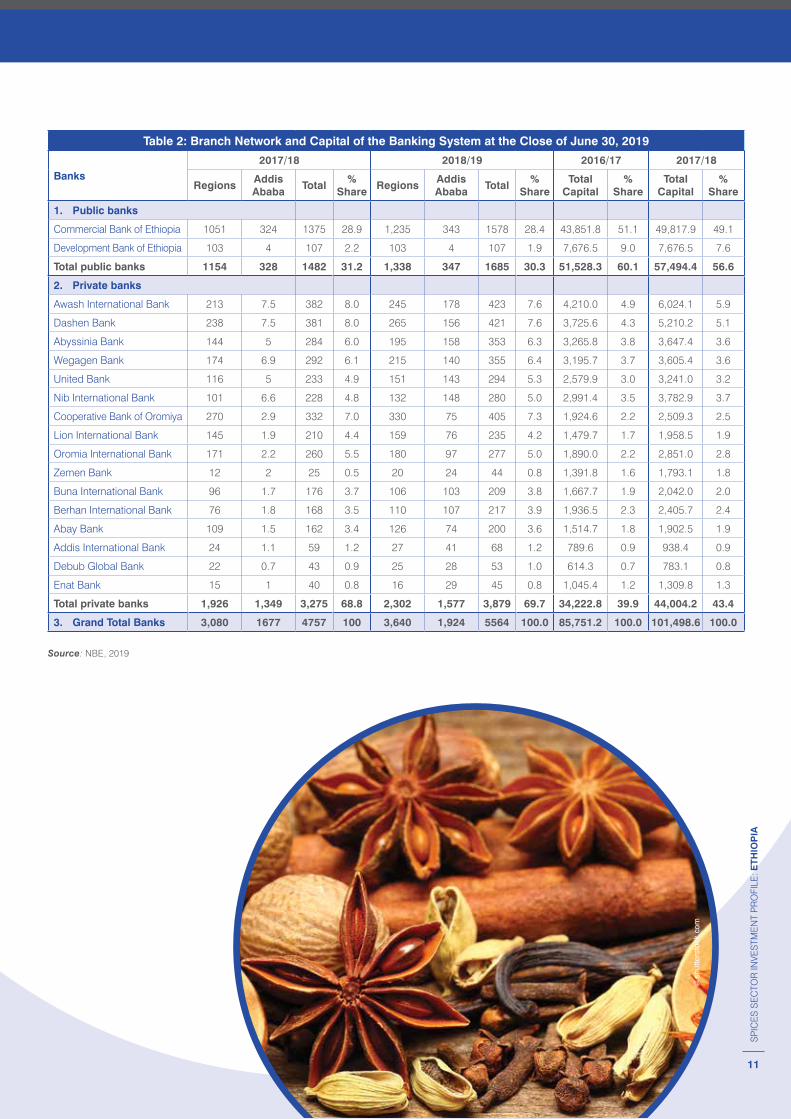
BANKING, INSURANCE AND CREDIT AVAILABILITY
Ethiopia has 18 commercial banks (two of them government-owned), 17 insurance companies, and 38 microfinance institutions.
Access to financial services improved substantially in the last years. In 2018/19, banks opened 807 new branches thereby raising the total number of branches to 5564 (roughly 35% are in Addis Ababa) from 4757 a year earlier. As a result, one bank branch serves about 17 thousand people. Total capital of the banking industry increased by 18.4% and reached ETB 101.5 billion by the end of June 2019 (NBE, 2019).
Commercial banks and Development Bank of Ethiopia (DBE) disbursed ETB 164.5 billion in fresh loans in 2018/19 which was 42.5% higher than that of a year ago. Of the total new loans, about 60.8% was provided by private banks and 39.2% by the two state owned banks. Nearly, 25.3% of the loans went to finance industry sector followed by domestic trade (20%), international trade (16.8%), other sectors (10.5%), housing and construction (11.9%), and agriculture (10.9%) (NBE, 2019)..
While the range of banking services available in various banks differ, the services offered by the Development Bank of Ethiopia, one of the largest banks in the country, are depicted to act as an illustrative guide to investors..
Both public and private banks offer short-, medium- and long-term loans. Ethiopia’s largest commercial bank, the government-owned Commercial Bank of Ethiopia (CBE), which acquired the public Construction and Business Bank (CBB) in 2016, is often considered as the pioneer bank in Ethiopia and provides domestic and international banking services. The Development Bank of Ethiopia (DBE) specialized in fostering investment in agricultural and industrial development.
Investors involved in the agro-processing and agriculture sector and who export 75% of their goods are eligible for loans. In a joint venture, the DBE can offer a loan of 50% of the initial investment costs if investors can cover the remaining costs and the company is mainly foreign-owned. In case the domestic partners hold the major share, the DBE provides loans of up to 75%.
© s
hutte
rsto
ck.c
om
Figure 6: Ethiopia’s average annual inflation rate (%) by categories (2017–2018)
Items Weight2017/18 2018/19
Change (in % age
Points)
Contribution to Change in Headline Inflation (% age points)
A B B-A C
General 100 14.6 12.6 -2.0 -2.0
Food and non-alcoholic bevarages
54 13.4 13.1 -0.3 -0.2
Non-food 46 15.8 11.9 -3.9 -1.8
Source: NBE, 2019
11
SP
ICE
S S
EC
TOR
INVE
STM
EN
T P
RO
FILE
: ETH
IOP
IA
Table 2: Branch Network and Capital of the Banking System at the Close of June 30, 2019
Banks2017/18 2018/19 2016/17 2017/18
RegionsAddis Ababa
Total%
ShareRegions
Addis Ababa
Total%
ShareTotal
Capital%
ShareTotal
Capital%
Share
1. Public banks
Commercial Bank of Ethiopia 1051 324 1375 28.9 1,235 343 1578 28.4 43,851.8 51.1 49,817.9 49.1
Development Bank of Ethiopia 103 4 107 2.2 103 4 107 1.9 7,676.5 9.0 7,676.5 7.6
Total public banks 1154 328 1482 31.2 1,338 347 1685 30.3 51,528.3 60.1 57,494.4 56.6
2. Private banks
Awash International Bank 213 7.5 382 8.0 245 178 423 7.6 4,210.0 4.9 6,024.1 5.9
Dashen Bank 238 7.5 381 8.0 265 156 421 7.6 3,725.6 4.3 5,210.2 5.1
Abyssinia Bank 144 5 284 6.0 195 158 353 6.3 3,265.8 3.8 3,647.4 3.6
Wegagen Bank 174 6.9 292 6.1 215 140 355 6.4 3,195.7 3.7 3,605.4 3.6
United Bank 116 5 233 4.9 151 143 294 5.3 2,579.9 3.0 3,241.0 3.2
Nib International Bank 101 6.6 228 4.8 132 148 280 5.0 2,991.4 3.5 3,782.9 3.7
Cooperative Bank of Oromiya 270 2.9 332 7.0 330 75 405 7.3 1,924.6 2.2 2,509.3 2.5
Lion International Bank 145 1.9 210 4.4 159 76 235 4.2 1,479.7 1.7 1,958.5 1.9
Oromia International Bank 171 2.2 260 5.5 180 97 277 5.0 1,890.0 2.2 2,851.0 2.8
Zemen Bank 12 2 25 0.5 20 24 44 0.8 1,391.8 1.6 1,793.1 1.8
Buna International Bank 96 1.7 176 3.7 106 103 209 3.8 1,667.7 1.9 2,042.0 2.0
Berhan International Bank 76 1.8 168 3.5 110 107 217 3.9 1,936.5 2.3 2,405.7 2.4
Abay Bank 109 1.5 162 3.4 126 74 200 3.6 1,514.7 1.8 1,902.5 1.9
Addis International Bank 24 1.1 59 1.2 27 41 68 1.2 789.6 0.9 938.4 0.9
Debub Global Bank 22 0.7 43 0.9 25 28 53 1.0 614.3 0.7 783.1 0.8
Enat Bank 15 1 40 0.8 16 29 45 0.8 1,045.4 1.2 1,309.8 1.3
Total private banks 1,926 1,349 3,275 68.8 2,302 1,577 3,879 69.7 34,222.8 39.9 44,004.2 43.4
3. Grand Total Banks 3,080 1677 4757 100 3,640 1,924 5564 100.0 85,751.2 100.0 101,498.6 100.0
Source: NBE, 2019
© s
hutte
rsto
ck.c
om
12
SP
ICE
S S
EC
TOR
INVE
STM
EN
T P
RO
FILE
: ETH
IOP
IA
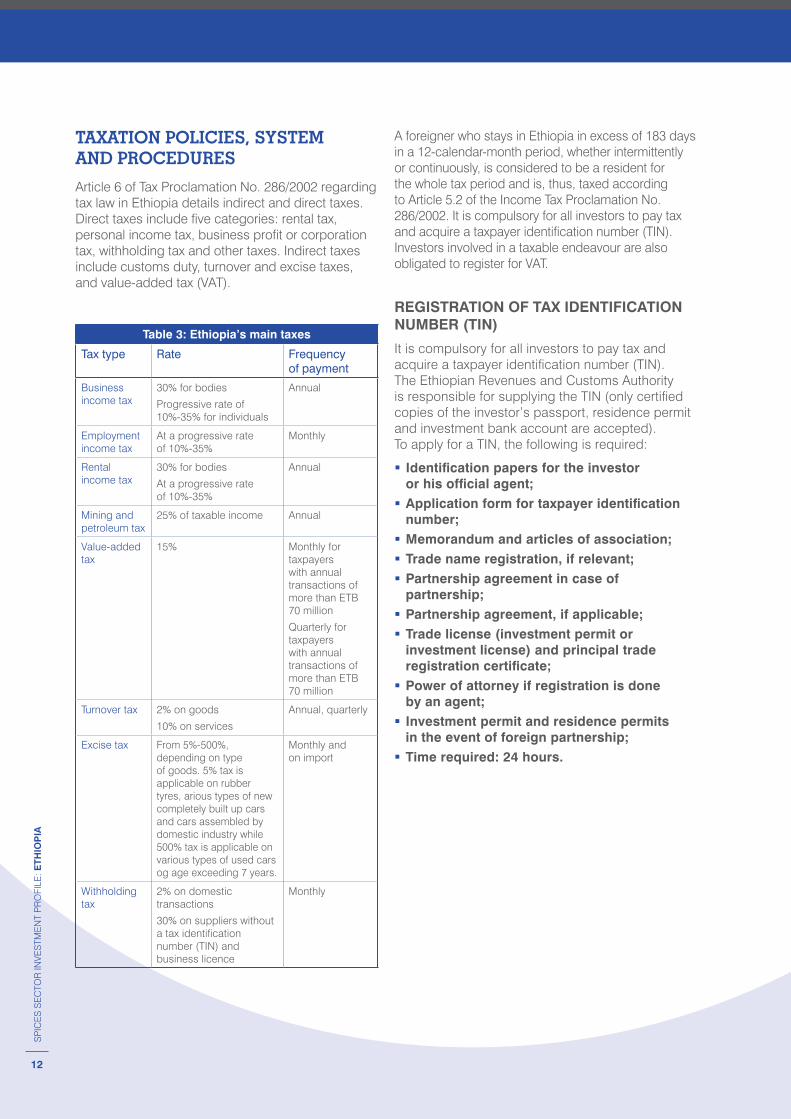
TAXATION POLICIES, SYSTEM AND PROCEDURES
Article 6 of Tax Proclamation No. 286/2002 regarding tax law in Ethiopia details indirect and direct taxes. Direct taxes include five categories: rental tax, personal income tax, business profit or corporation tax, withholding tax and other taxes. Indirect taxes include customs duty, turnover and excise taxes, and value-added tax (VAT).
Table 3: Ethiopia’s main taxes
Tax type Rate Frequency of payment
Business income tax
30% for bodies
Progressive rate of 10%-35% for individuals
Annual
Employment income tax
At a progressive rate of 10%-35%
Monthly
Rental income tax
30% for bodies
At a progressive rate of 10%-35%
Annual
Mining and petroleum tax
25% of taxable income Annual
Value-added tax
15% Monthly for taxpayers with annual transactions of more than ETB 70 million
Quarterly for taxpayers with annual transactions of more than ETB 70 million
Turnover tax 2% on goods
10% on services
Annual, quarterly
Excise tax From 5%-500%, depending on type of goods. 5% tax is applicable on rubber tyres, arious types of new completely built up cars and cars assembled by domestic industry while 500% tax is applicable on various types of used cars og age exceeding 7 years.
Monthly and on import
Withholding tax
2% on domestic transactions
30% on suppliers without a tax identification number (TIN) and business licence
Monthly
A foreigner who stays in Ethiopia in excess of 183 days in a 12-calendar-month period, whether intermittently or continuously, is considered to be a resident for the whole tax period and is, thus, taxed according to Article 5.2 of the Income Tax Proclamation No. 286/2002. It is compulsory for all investors to pay tax and acquire a taxpayer identification number (TIN). Investors involved in a taxable endeavour are also obligated to register for VAT.
REGISTRATION OF TAX IDENTIFICATION NUMBER (TIN)
It is compulsory for all investors to pay tax and acquire a taxpayer identification number (TIN). The Ethiopian Revenues and Customs Authority is responsible for supplying the TIN (only certified copies of the investor’s passport, residence permit and investment bank account are accepted). To apply for a TIN, the following is required:
� Identification papers for the investor or his official agent;
� Application form for taxpayer identification number;
� Memorandum and articles of association; � Trade name registration, if relevant; � Partnership agreement in case of partnership;
� Partnership agreement, if applicable; � Trade license (investment permit or investment license) and principal trade registration certificate;
� Power of attorney if registration is done by an agent;
� Investment permit and residence permits in the event of foreign partnership;
� Time required: 24 hours.
13
SP
ICE
S S
EC
TOR
INVE
STM
EN
T P
RO
FILE
: ETH
IOP
IA
13
SP
ICE
S S
EC
TOR
INVE
STM
EN
T P
RO
FILE
: ETH
IOP
IA
14
SP
ICE
S S
EC
TOR
INVE
STM
EN
T P
RO
FILE
: ETH
IOP
IA
© s
hutte
rsto
ck.c
om
14
SP
ICE
S S
EC
TOR
INVE
STM
EN
T P
RO
FILE
: ETH
IOP
IA

15
SP
ICE
S S
EC
TOR
INVE
STM
EN
T P
RO
FILE
: ETH
IOP
IA
Why Ethiopia?
The Ethiopian Government’s political will, policy coherence, geographic access and low cost of doing business are attractive factors for investors. There are a number of reasons to invest in Ethiopia, a few of which are listed below.
POLITICAL AND SOCIAL STABILITY
� Stable socio-economic governance with sustained peace and security
� High level political commitment for investment promotion and protection; investment policy making is led by the Ethiopian Investment Board chaired by the Prime Minister
� Wide-ranging incentive packages for priority sectors and export-oriented investments.
STABLE ECONOMIC ENVIRONMENT AND RAPID ECONOMIC GROWTH
� An average of about 11% annual GDP growth for the last 14 years, one of the fastest growing economies in the world during the same period (World Bank Global Economic Prospects).
� Inflation is a single-digit figure and there is a stable exchange rate of foreign currency.
� Secure living and working environment, recognized by the International Chamber of Commerce (ICC) and the United Nations (UN) as a vital advantage for investors.
� Government commitment to private sector.
ADEQUATE FARMING LAND
� Land in Ethiopia is public property. Companies, other organizations and individuals are only entitled to utilize the land.
� Investors can apply for land procurement during a field visit and upon acquiring an investment license. Rural and urban land is obtainable on a leasehold basis.
� Land lease rights can be mortgaged, subleased or transferred, together with on-build amenities. Leaseholders are permitted to utilize urban land for as much as 60 years in Addis Ababa and as much as 80 years in smaller towns. Leasehold renewal is allowed – in Ethiopia, this usually ranges from 50 to 99 years, contingent on location and purpose.
� The Ethiopian Investment Commission is responsible for facilitating the land allocation for foreign direct investment (FDI) ventures countrywide, especially for manufacturing, and the Ministry of Agriculture (MoA) has a mandate to allocate farmland to foreign investors for agriculture.
� Construction works were completed recently at national level for 199,304 hectares of land in medium- and large-scale irrigation, and mediumand large-scale irrigation design works have been conducted for 679,352 hectares of land.
16
SP
ICE
S S
EC
TOR
INVE
STM
EN
T P
RO
FILE
: ETH
IOP
IA
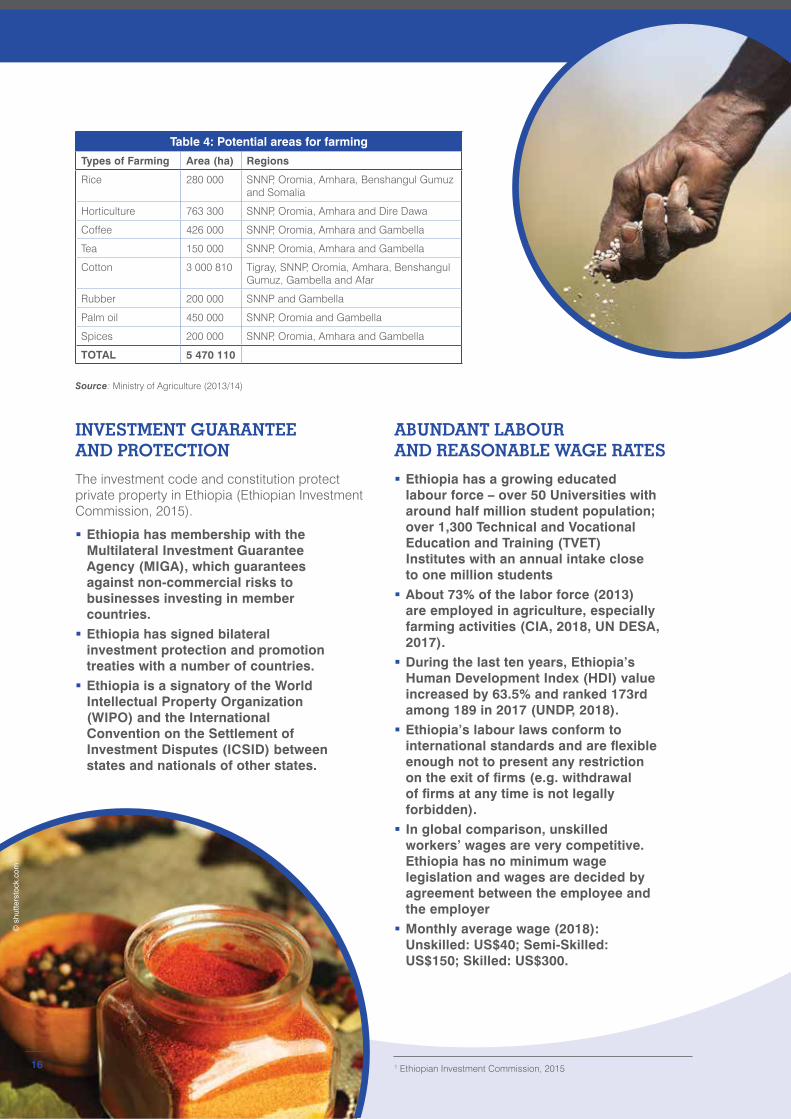
INVESTMENT GUARANTEE AND PROTECTION
The investment code and constitution protect private property in Ethiopia (Ethiopian Investment Commission, 2015).
� Ethiopia has membership with the Multilateral Investment Guarantee Agency (MIGA), which guarantees against non-commercial risks to businesses investing in member countries.
� Ethiopia has signed bilateral investment protection and promotion treaties with a number of countries.
� Ethiopia is a signatory of the World Intellectual Property Organization (WIPO) and the International Convention on the Settlement of Investment Disputes (ICSID) between states and nationals of other states.
ABUNDANT LABOUR AND REASONABLE WAGE RATES
� Ethiopia has a growing educated labour force – over 50 Universities with around half million student population; over 1,300 Technical and Vocational Education and Training (TVET) Institutes with an annual intake close to one million students
� About 73% of the labor force (2013) are employed in agriculture, especially farming activities (CIA, 2018, UN DESA, 2017).
� During the last ten years, Ethiopia’s Human Development Index (HDI) value increased by 63.5% and ranked 173rd among 189 in 2017 (UNDP, 2018).
� Ethiopia’s labour laws conform to international standards and are flexible enough not to present any restriction on the exit of firms (e.g. withdrawal of firms at any time is not legally forbidden).
� In global comparison, unskilled workers’ wages are very competitive. Ethiopia has no minimum wage legislation and wages are decided by agreement between the employee and the employer
� Monthly average wage (2018): Unskilled: US$40; Semi-Skilled: US$150; Skilled: US$300.
Table 4: Potential areas for farming
Types of Farming Area (ha) Regions
Rice 280 000 SNNP, Oromia, Amhara, Benshangul Gumuz and Somalia
Horticulture 763 300 SNNP, Oromia, Amhara and Dire Dawa
Coffee 426 000 SNNP, Oromia, Amhara and Gambella
Tea 150 000 SNNP, Oromia, Amhara and Gambella
Cotton 3 000 810 Tigray, SNNP, Oromia, Amhara, Benshangul Gumuz, Gambella and Afar
Rubber 200 000 SNNP and Gambella
Palm oil 450 000 SNNP, Oromia and Gambella
Spices 200 000 SNNP, Oromia, Amhara and Gambella
TOTAL 5 470 110
Source: Ministry of Agriculture (2013/14)
© s
hutte
rsto
ck.c
om
16 1 Ethiopian Investment Commission, 2015

17
SP
ICE
S S
EC
TOR
INVE
STM
EN
T P
RO
FILE
: ETH
IOP
IA
WIDE MARKET ACCESS
� The fast-growing, sizeable domestic market presents good possibilities for investment and expansion of consumer goods industries like tobacco, beverages, food, glass and ceramics, plastic products, paper and paper products, soap and detergents, chemical and chemical products, electrical and electronic products, and medicine and pharmaceuticals.
� Situated in the Horn of Africa at the junction between Asia, the Middle East and Africa, Ethiopia has strategic market access..
� Common Market for Eastern and Southern Africa (COMESA): COMESA is a regional economic community of 21 Member States. Ethiopia is in the process of joining COMESA’s Free Trade Agreement by 2021 to access its large regional trade union.
Cotonou Partnership Agreement: The Cotonou Agreement, also known as African Caribbean Pacific European Union (ACP-EU) Partnership Agreement, provides for the transition of the non-reciprocal Lomé type trade preferences to WTO-compatible Economic partnership agreements (EPAs) between the European Union and African, Caribbean and Pacific countries and regions (ACP). The Government of Ethiopia signed the Cotonou Agreement in 2000 and the EPA with eastern and southern African states is open for accession to Ethiopia.
World Trade Organization (WTO): Ethiopia applied for accession to the World Trade Organization in 2003 and is, as of April 2019, still in the process of becoming a full member. Being a member of the WTO implies that Ethiopian products have access to more than 90% of world markets at most favoured nation (MFN) treatment.
African Growth and Opportunity Act (AGOA): AGOA is a non-reciprocal trade preference agreement offering 6,500 products from 40 eligible Sub-Saharan African countries duty-free market access to the United States of America. AGOA has been approved by the U.S. Congress in 2000 and renewed until September 2025.
The country enjoys further privileged duty treatment and Generalized System of Preferences (GSP) from countries like Australia, Canada, Japan, Finland, Russia, Switzerland, and Turkey (EIC, 2018).
Everything But Arms (EBA): EBA is a European Union initiative under which all imports from Least Developed Countries (LDCs) to the European Union are duty-free and quota-free, with the exception of armaments.
African Continental Free Trade Agreement (AfCFTA): AfCFTA will be the world’s largest free trade area, with the goal of creating a single continental market followed by free movement and a single currency union. It has the potential to double intra-African trade by eliminating import duties and reducing non-tariff barriers. As of April 2019, the trade agreement is signed by 52 and ratified by 22 of the 55 African Union member states, effectively meeting the minimum threshold for the agreement to come into force.
IMPROVED LOGISTICS AND INFRASTRUCTUREEthiopia’s social indicators are favourable. Social services and infrastructure development have rapidly expanded; however, improving the quality of services delivered and increasing access continues to be a major focus of the government..
ELECTRICITY SUPPLY
The Ethiopian Electric Power Corporation (EEP), formerly known as Ethiopian Electric Light and Power Authority, is a state-owned and main electricity producer in Ethiopia. EEP is engaged in the production, transmission, distribution, and sale of electrical energy. In addition, there are small and isolated self-contained power generation systems unattached to the national power grid.
According to the EEP, the country has an estimated hydro-power potential of 45,000 MW, geothermal 10,000 MW and wind farm 1.3 million MW. The country’s generating capacity is largely based on hydropower reservoirs as nine of its major rivers are suitable for hydroelectric power generation. Considering the increasing demand for power and the importance of having a better power generation mix, the country has been venturing to diversify its production of renewable energy to wind and geothermal sources.
The amount of electric power generated during 2018/19 was about 13.8 billion KWH, which was slightly lower than that of last year. Of the total electric power production, 95.5% was generated from hydropower, 4.2% from wind and 0.3% from biomass sources.
WATER AVAILABILITY
Though Ethiopia has great groundwater and run-off potential, it only makes use of a small percentage of these resources. About 93% of Ethiopia’s water withdrawals are for agricultural use, much higher than the global average of 70%, which represent only about 4% of Ethiopia’s total available renewable water resources. More to the point, 2.6 billion cubic metres of ground water and 122 billion cubic metres of surface water are available, which could easily be used for irrigation. However, due to rapid population growth over the last decade, Ethiopia is considered ‘water stressed’.
© s
hutte
rsto
ck.c
om
18
SP
ICE
S S
EC
TOR
INVE
STM
EN
T P
RO
FILE
: ETH
IOP
IA
During 2018/19, the proportion of people having access to potable water supply improved by 4.8% point to 76% (79% rural and 66% urban population); from the 71% (74% rural and 60% urban people) coverage the year before. This indicates that the rural areas had a relatively better access than the urban areas.
ROAD TRANSPORT
Major public investments led to a steady improvement of the road network over the last years. During 2018/19, total road network reached 138,127 Km, depicting 9% annual growth. Asphalt road network accounted for about 11.5% of the road network which was lower than 15% GTPII target set for the fiscal year. In the Growth and Transformation Plan (GTP), a further expansion of the country’s road network to 220,000 kilometres and improved access to all-weather roads by 2020 is anticipated, comprising the recently completed express way connecting Addis Ababa to Adama, which is an important route for the facilitation of import and export trade (NBE, 2019).
RAILWAYS AND PORTS
Under the National Logistics Development (NLD) strategy, the government plans to expand its railway network to roughly 1,545 kilometres to link all major dry ports and towns of the country. With the goal to alleviate trade logistic hurdles and enhance Ethiopia’s export competitiveness, significant advancements have already been achieved in recent years.
As a landlocked country, Ethiopia has no direct access to seaports and the port of Djibouti serves as the primary gateway for 90% to 95% of its internationally traded goods. However, the reopening of diplomatic relations with the neighbouring country Eritrea creates the potential for operations via the Eritrean ports of Assab and Massaewa.
AIR TRANSPORT
To meet the growing demand for air transportation, both passenger and cargo, the Ethiopian aviation sector expanded at an average 20% growth rate.
The Ethiopian Airports Enterprise (EAE) set the goal of increasing the number of national and international airports to 25 by 2020. After the expansion of Addis Ababa Bole International Airport, inaugurated in January 2019, the annual airport capacity tripled from 7 million to 22 million passengers. Future major projects involve a new airport 50 kilometres outside of Addis Ababa with an annual capacity of 80 million passengers at a cost of US$ 4 billion, whose lower elevation promises reduced jet fuel consumption and flights of a greater distance.
TELECOMMUNICATION
Telecommunication is one of the prime support services needed for rapid growth and modernization of the economy as well as for attracting investment, consequently the Ethiopian government has made huge investments to improve service quality, coverage and institutional capacity. As a result, the state-owned Ethio Telecom, Ethiopia’s only and Africa’s second largest telecom service provider, has set ambitious targets to enhance customer acquisition, customer satisfaction and provision of quality services to customers. During 2018/19, total telecom subscribers reached 43.6 million depicting 5.6% growth over last year as the number of mobile voice subscribers rose by 5.3% while that of internet and data subscribers and fixed voice service subscribers surged by 26.4% and 8.4%, respectively. Of the total subscribers, mobile voice constituted 42 million (96.1%) followed by fixed voice service (1 million or 2.8%) and internet and data (502 thousand or 1.2%) (NBE, 2019).
INTERNATIONAL COOPERATION
� Ethiopia is an ECA member, a charter member of the United Nations (UN) and a member of all the non-regional specialized organizations.
� Ethiopia is an African Development Bank (AfDB) participant, and participates in the international economic forums G-24 (group of 24 countries) and G-77 (group of 77 countries).
� Ethiopia is a founding member of the AU and the Organization of African Union (OAU), and has WTO observer status. The country is part of New Partnership for Africa’s Development (NEPAD), the ACP, COMESA and the Intergovernmental Authority on Development, which is a Horn of Africa regional alliance.
19
SP
ICE
S S
EC
TOR
INVE
STM
EN
T P
RO
FILE
: ETH
IOP
IA
Ethiopian Spices Sectoral Overview
ETHIOPIA’S GRANULAR SECTORAL TRADE BEHAVIOUR
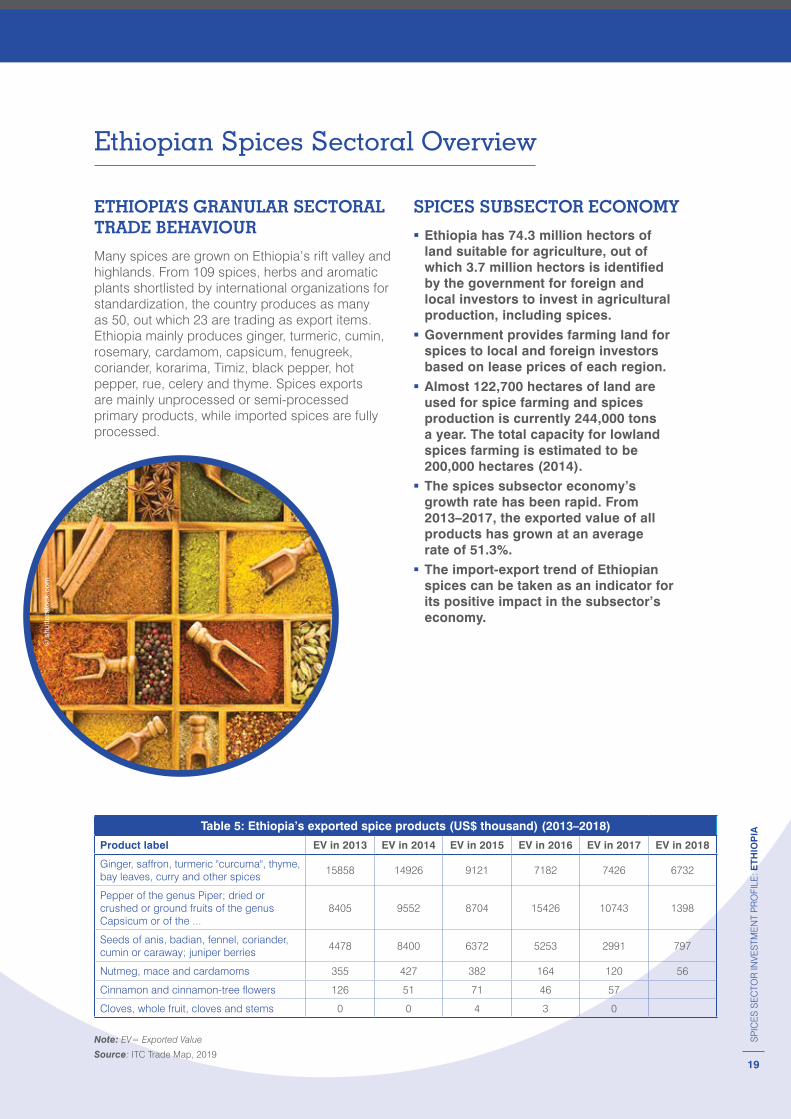
Many spices are grown on Ethiopia’s rift valley and highlands. From 109 spices, herbs and aromatic plants shortlisted by international organizations for standardization, the country produces as many as 50, out which 23 are trading as export items. Ethiopia mainly produces ginger, turmeric, cumin, rosemary, cardamom, capsicum, fenugreek, coriander, korarima, Timiz, black pepper, hot pepper, rue, celery and thyme. Spices exports are mainly unprocessed or semi-processed primary products, while imported spices are fully processed.
SPICES SUBSECTOR ECONOMY
� Ethiopia has 74.3 million hectors of land suitable for agriculture, out of which 3.7 million hectors is identified by the government for foreign and local investors to invest in agricultural production, including spices.
� Government provides farming land for spices to local and foreign investors based on lease prices of each region.
� Almost 122,700 hectares of land are used for spice farming and spices production is currently 244,000 tons a year. The total capacity for lowland spices farming is estimated to be 200,000 hectares (2014).
� The spices subsector economy’s growth rate has been rapid. From 2013–2017, the exported value of all products has grown at an average rate of 51.3%.
� The import-export trend of Ethiopian spices can be taken as an indicator for its positive impact in the subsector’s economy.
Table 5: Ethiopia’s exported spice products (US$ thousand) (2013–2018)
Product label EV in 2013 EV in 2014 EV in 2015 EV in 2016 EV in 2017 EV in 2018
Ginger, saffron, turmeric "curcuma", thyme, bay leaves, curry and other spices
15858 14926 9121 7182 7426 6732
Pepper of the genus Piper; dried or crushed or ground fruits of the genus Capsicum or of the ...
8405 9552 8704 15426 10743 1398
Seeds of anis, badian, fennel, coriander, cumin or caraway; juniper berries
4478 8400 6372 5253 2991 797
Nutmeg, mace and cardamoms 355 427 382 164 120 56
Cinnamon and cinnamon-tree flowers 126 51 71 46 57
Cloves, whole fruit, cloves and stems 0 0 4 3 0
Note: EV= Exported Value
Source: ITC Trade Map, 2019
© s
hutte
rsto
ck.c
om
20
SP
ICE
S S
EC
TOR
INVE
STM
EN
T P
RO
FILE
: ETH
IOP
IA
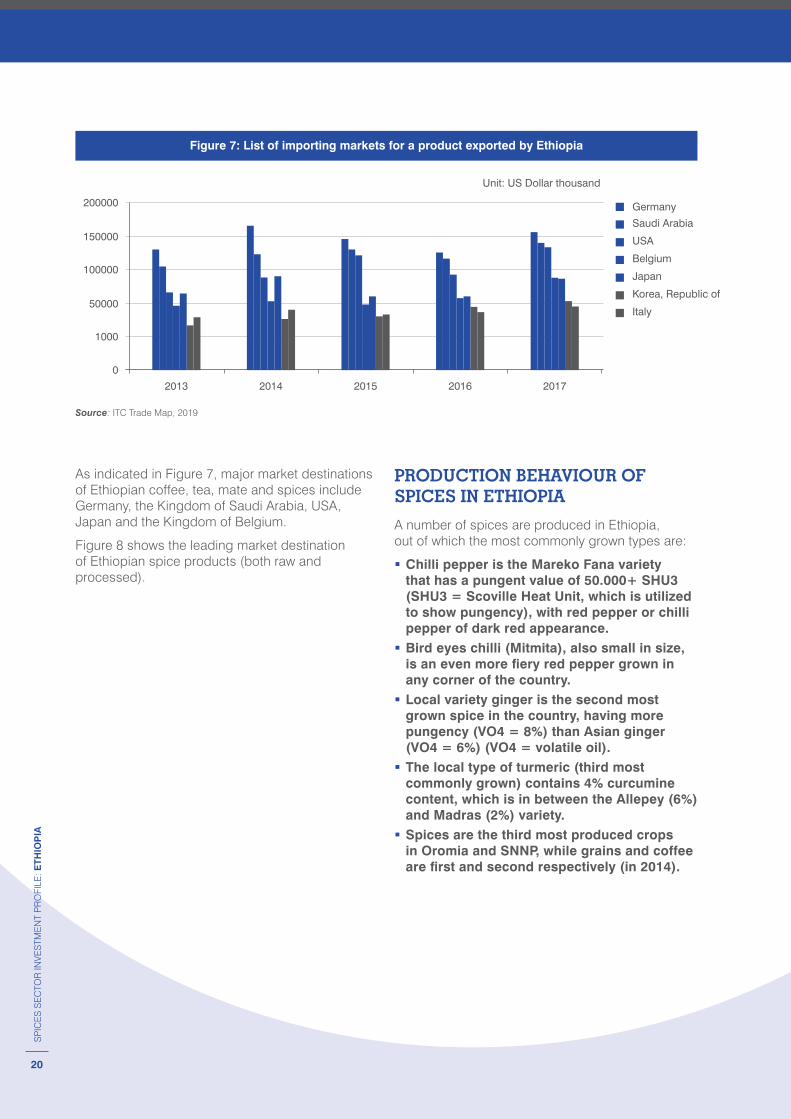
As indicated in Figure 7, major market destinations of Ethiopian coffee, tea, mate and spices include Germany, the Kingdom of Saudi Arabia, USA, Japan and the Kingdom of Belgium.
Figure 8 shows the leading market destination of Ethiopian spice products (both raw and processed).
PRODUCTION BEHAVIOUR OF SPICES IN ETHIOPIA
A number of spices are produced in Ethiopia, out of which the most commonly grown types are:
� Chilli pepper is the Mareko Fana variety that has a pungent value of 50.000+ SHU3 (SHU3 = Scoville Heat Unit, which is utilized to show pungency), with red pepper or chilli pepper of dark red appearance.
� Bird eyes chilli (Mitmita), also small in size, is an even more fiery red pepper grown in any corner of the country.
� Local variety ginger is the second most grown spice in the country, having more pungency (VO4 = 8%) than Asian ginger (VO4 = 6%) (VO4 = volatile oil).
� The local type of turmeric (third most commonly grown) contains 4% curcumine content, which is in between the Allepey (6%) and Madras (2%) variety.
� Spices are the third most produced crops in Oromia and SNNP, while grains and coffee are first and second respectively (in 2014).
Source: ITC Trade Map, 2019
Figure 7: List of importing markets for a product exported by Ethiopia
2013
0
1000
50000
100000
150000
200000
2014 2015 2016 2017
Germany
Saudi Arabia
USA
Belgium
Japan
Korea, Republic of
Italy
Unit: US Dollar thousand
21
SP
ICE
S S
EC
TOR
INVE
STM
EN
T P
RO
FILE
: ETH
IOP
IA
SPICES PRODUCTION INVESTMENT
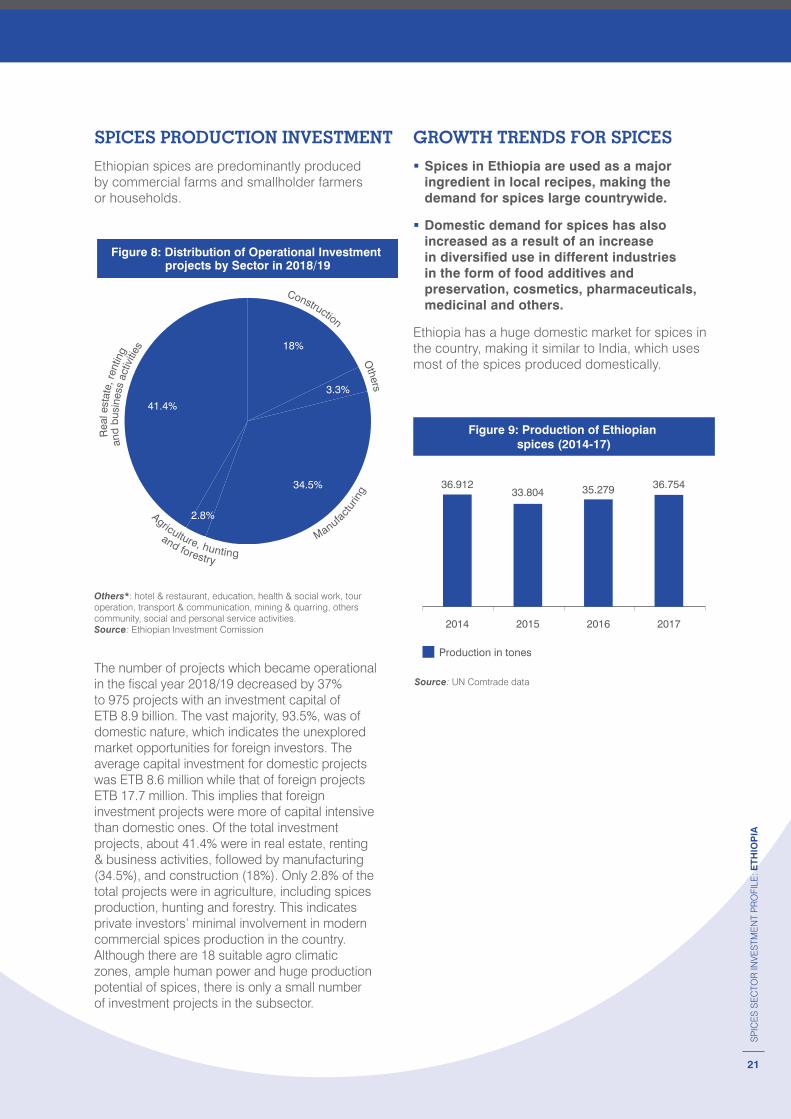
Ethiopian spices are predominantly produced by commercial farms and smallholder farmers or households.
The number of projects which became operational in the fiscal year 2018/19 decreased by 37% to 975 projects with an investment capital of ETB 8.9 billion. The vast majority, 93.5%, was of domestic nature, which indicates the unexplored market opportunities for foreign investors. The average capital investment for domestic projects was ETB 8.6 million while that of foreign projects ETB 17.7 million. This implies that foreign investment projects were more of capital intensive than domestic ones. Of the total investment projects, about 41.4% were in real estate, renting & business activities, followed by manufacturing (34.5%), and construction (18%). Only 2.8% of the total projects were in agriculture, including spices production, hunting and forestry. This indicates private investors’ minimal involvement in modern commercial spices production in the country. Although there are 18 suitable agro climatic zones, ample human power and huge production potential of spices, there is only a small number of investment projects in the subsector.
GROWTH TRENDS FOR SPICES
� Spices in Ethiopia are used as a major ingredient in local recipes, making the demand for spices large countrywide.
� Domestic demand for spices has also increased as a result of an increase in diversified use in different industries in the form of food additives and preservation, cosmetics, pharmaceuticals, medicinal and others.
Ethiopia has a huge domestic market for spices in the country, making it similar to India, which uses most of the spices produced domestically.
Others*: hotel & restaurant, education, health & social work, tour operation, transport & communication, mining & quarring, others community, social and personal service activities. Source: Ethiopian Investment Comission
Source: UN Comtrade data
Figure 8: Distribution of Operational Investment projects by Sector in 2018/19
18%
41.4%
34.5%
3.3%
2.8%
Construction
Others
Manufactu
ring
Agriculture, hunting
and forestry
and
busi
ness
act
iviti
es
Rea
l est
ate,
rent
ing
Figure 9: Production of Ethiopian spices (2014-17)
2014 2015 2016 2017
36.75435.27933.80436.912
Production in tones

22
SP
ICE
S S
EC
TOR
INVE
STM
EN
T P
RO
FILE
: ETH
IOP
IA
SECTOR INVESTMENT PROMOTION MEASURES
ATTRACTIVE INVESTMENT INCENTIVES
To promote private investment, the Government of Ethiopia has created an incentives package across a range of sectors under Regulations No. 84/2003 for local and foreign investors involved in expansions and new endeavours..
CUSTOMS DUTY EXEMPTION
� A 100% exemption on all investment capital goods imports and imports of construction supplies needed for setting up new organizations or for the upgrading and expansion of existing organizations, including spare parts valued at a maximum of 15% of the imported investment capital goods, as well as exemption for imported raw materials necessary producing goods for export.
� Packing materials and raw materials needed for producing export goods are granted exemptions from customs duty and other taxes imposed on imports. Duties and taxes paid on packing materials and raw materials are drawn back when the final products are exported. The bonded manufacturing warehouse facilities and voucher system are also available.
� All services and goods intended for export are exempt from all export tax and other taxes imposed on exports.
INCOME TAX EXEMPTION
� Income earned from agricultural investments, new agribusiness and manufacturing investments, or information and communication technology (ICT) development, is entitled to an income tax holiday of two to seven years (this varies, dependent on the export volume, location and area of investment).
� Income earned from upgrading or expanding an existing agricultural, agribusiness or manufacturing business is entitled to a twoyear income tax exemption if a minimum of 50% of the products produced are exported and if the company increases its production value by 25%.
� Investors who invest to establish a new business in some parts of SNNP, Afar, Benshangul Gumuz and Gambela regions are eligible for a 30% income tax deduction for three successive years after the income tax exemption period has expired.
LOSS CARRIED FORWARD
Companies that have borne losses during this “holiday” are allowed to carry them forward for half the exemption period after that exemption has expired.
23
SP
ICE
S S
EC
TOR
INVE
STM
EN
T P
RO
FILE
: ETH
IOP
IA
EXPORT TRADE DUTY INCENTIVES SCHEME
Investors who supply or export at least 60% of their services or products to an exporter as service or production inputs are eligible for a two-year income tax exemption over and above the exemption period offered. The following are the most important incentives schemes.
� Duty Drawback scheme: Duty paid on raw materials and accessories, such as packaging, used in the production of commodities are refunded upon exportation of the commodity processed.
� Voucher scheme: Eligible producer exporters and raw material suppliers can request a voucher passbook from the Ethiopian Revenues and Customs Authority (ERCA). In the voucher passbook is written an amount of duty and taxes that is supposed to be paid upon the business’ annual planned procurement which is recurrently deducted from the originally given sum. The passport records and controls the used amount of duty incentives on raw materials imported and for fabrication of export commodities.
� Bonded Factory and Manufacturing Warehouse scheme: Eligible producer exporters with a manufacturing plant, which meets the standards set by the Ethiopian Revenues and Customs Authority, who are not benefitting from the voucher scheme, can be granted an exemption from customs duties and other taxes imposed on imports of raw materials and packing materials required for the manufacture of export goods.
� Industrial Zone scheme: Imported raw materials for eligible industries setup within an industrial zone shall be transported from a customs post to the factory without being subject to payment of duty. As of December 2018, nine industrial zones are operational or planned.
� External credit and supplier’s credit directive: The NBE can authorize investors to request a bank guarantee for interim short term financing by a foreign partner or supplier for export-oriented investments.
� Franco Valuta Import Facility: Franco-valuta refers to a process of importing goods by a person permitted to do so by using foreign currency from his own source. To benefit from this facility for importing of raw material and other essential production inputs for export commodities, exporters can obtain a permit from the National Bank of Ethiopia (NBE).
� Right to hire expatriates: Foreign investors are allowed to employ expatriate management staff and experts with a view to developing local capacity. The number of expatriates that may be recruited is subject to factors such as availability
of local professionals, complexity of the investment and need for high-skilled professionals.
� Investment loans: Investors who export 75% of their goods and are involved in the agro-processing and agriculture sector are eligible for investment loans. If investors are able to provide 30% of their initial cost, the Development Bank of Ethiopia can offer loans for the remaining 70% of the investment cost.
� Preferential rates for land lease and/or factory lease: Ethiopia’s land is government-owned and can be provided to investors at competitive lease prices.
REMITTANCE OF FUNDS
Foreign investors are permitted to make the following convertible foreign currency remittances out of Ethiopia at the existing exchange rate on the date of remittance:
� Interest and principal payment on external loans;
� Dividends and profits from investment; � Payments associated with a transfer of technology agreement;
� Compensation paid to an investor; � Income from the liquidation or sale of a company; � Income from the transfer of partial ownership of or shares in a company to a local investor;
� In convertible foreign currency, expatriate employees can remit unspent salaries and other income accruing from their work in hard currency.
GOVERNMENT SUPPORT
� The Ethiopian Government is encouraging agro-industrial ventures and has stated that spices are a main area for development.
� Provision of policy incentives that facilitate exporters’ implementation of modern machinery and processing techniques, including post- and pre-harvest processing.
� In some of its semi-specialized and specialized research centres, the Ethiopian Institute of Agriculture Research (EIAR) is doing research relevant to the spices subsector.
� Government commitment in delivering the 10- year spice industry strategic plan.
� Promotion of FDI-initiated commercial farming by government policy.
� The spices subsector is one of the main subsectors that fit within the commercialization of agriculture strategy.
© s
hutte
rsto
ck.c
om

24
SP
ICE
S S
EC
TOR
INVE
STM
EN
T P
RO
FILE
: ETH
IOP
IA
24
SP
ICE
S S
EC
TOR
INVE
STM
EN
T P
RO
FILE
: ETH
IOP
IA
© s
hutte
rsto
ck.c
om
25
Investment Opportunities
There are several avenues open for investment in the Ethiopian spices sector, as its population of 109.22 million constitutes one of Africa’s biggest markets for spices, apart from the international market requirements. Accordingly, a growing amount of market participants (traders, buyers, pharmaceutical manufacturers and oleoresin extraction companies, etc.) are finding it attractive to operate in Ethiopia. Given the domestic consumption and export potential, investors might consider the following investment options..
PRIMARY PRODUCTION
There is opportunity to expand spices production in Ethiopia. Ethiopian conditions are suitable to grow 6,000 vascular plant species, out of which 12% are endemic. The government is keen to promote FDIinitiated commercial farming, with spices farming land provided to investors based on the regions’ lease prices, and foreign investors are encouraged to invest in the spices sector as sole proprietors with total equity ownership.
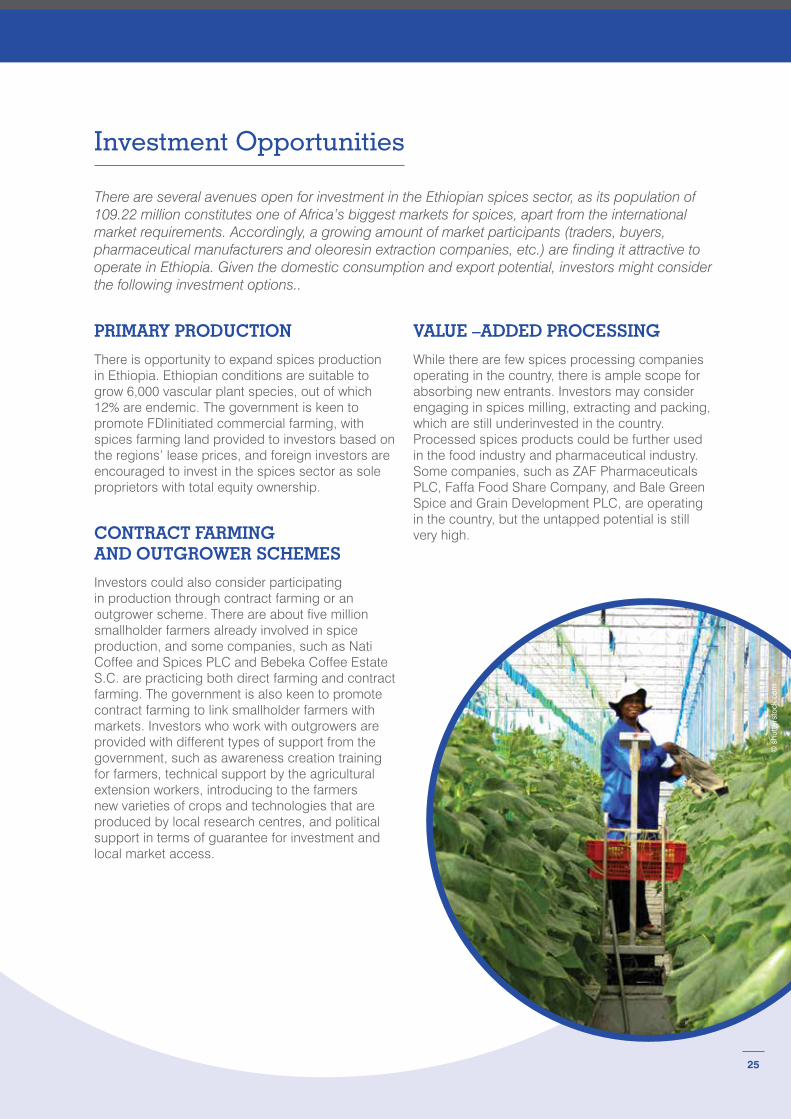
CONTRACT FARMING AND OUTGROWER SCHEMES
Investors could also consider participating in production through contract farming or an outgrower scheme. There are about five million smallholder farmers already involved in spice production, and some companies, such as Nati Coffee and Spices PLC and Bebeka Coffee Estate S.C. are practicing both direct farming and contract farming. The government is also keen to promote contract farming to link smallholder farmers with markets. Investors who work with outgrowers are provided with different types of support from the government, such as awareness creation training for farmers, technical support by the agricultural extension workers, introducing to the farmers new varieties of crops and technologies that are produced by local research centres, and political support in terms of guarantee for investment and local market access.
VALUE –ADDED PROCESSING
While there are few spices processing companies operating in the country, there is ample scope for absorbing new entrants. Investors may consider engaging in spices milling, extracting and packing, which are still underinvested in the country. Processed spices products could be further used in the food industry and pharmaceutical industry. Some companies, such as ZAF Pharmaceuticals PLC, Faffa Food Share Company, and Bale Green Spice and Grain Development PLC, are operating in the country, but the untapped potential is still very high.
© s
hutte
rsto
ck.c
om

26
SP
ICE
S S
EC
TOR
INVE
STM
EN
T P
RO
FILE
: ETH
IOP
IA
26
SP
ICE
S S
EC
TOR
INVE
STM
EN
T P
RO
FILE
: ETH
IOP
IA
27
SP
ICE
S S
EC
TOR
INVE
STM
EN
T P
RO
FILE
: ETH
IOP
IA
Useful Contacts
PUBLIC SECTOR
Federal Cooperative Agency
Telephone: +251 115 518 040E-Mail: [email protected]: www.fca.gov.et
Ministry of Trade
Telephone: +251 115 518 025Website: www.mot.gov.et/home
Ethiopian Investment Commission
Telephone: +251 115 510 033E-Mail: [email protected]: www.investethiopia.gov.et
Ministry of Agriculture
Telephone: +251 115 518 040E-Mail: [email protected]: www.moa.gov.et
PRIVATE SECTOREthiopian Chamber of Commerce and Sectoral Association
Telephone: +251 115 518 240E-Mail: [email protected]: www.ethiopianchamber.com
Addis Ababa Chamber of Commerce and Sectoral Associations
Telephone: +251 115 518055E-Mail: [email protected]: www.addischamber.com
Development Bank of Ethiopia
Telephone: +251 115 518 889E-Mail: [email protected]: www.dbe.com.et/home
Ethiopian Horticulture Producer Exporters Association
Telephone: +251 11 6636750E-Mail: [email protected]: https://ehpea.org/
28
SP
ICE
S S
EC
TOR
INVE
STM
EN
T P
RO
FILE
: ETH
IOP
IA
Annexes
ANNEX I: INSTITUTIONAL SUPPORT FOR INVESTORS
1. Ethiopian Commodity Exchange (ECX): To improve the export sector, the Government of Ethiopia launched ECX at the end of 2008 and beginning of 2009. ECX is a marketplace in which sellers and buyers get together and trade, with guaranteed quality and payment delivery. ECX is working on other cash crops, but there is a hope that it will start dealing with spices and spices products in 2016.
2. Exporters Association: Ethiopian Pulses, Oilseeds and Spices Processors - Exporters Association (EPOSPEA) was established in 1998 with the objective of building the capacity of its members to make them competitive in the global market. EPOSPEA has the following activities.a) Delivering the latest foreign and local
market information;b) Delivering advocacy services to
create an enabling environment;c) Creating international business
opportunities;d) Providing members with business
development services.
3. Ethiopian Industrial Parks Development Corporation (IPDC): The Ethiopian Industrial Parks Development Corporation (IPDC) was established in 2014, as one of the public enterprise. Inspired from the full support of government, IPDC is becoming an engine of rapid industrialization that nurture manufacturing industries, to accelerate economic transformation, promote and attract both domestic and foreign investors. To activate both pre and post investment servicing, it avails serviced industrial land, pre-built sheds equipped with all-encompassing utilities and infrastructural facilities that fit international standards, with no compromise on workers’ security and environmental safety. IPDC, in collaboration Ethiopian Investment commission and Ethiopian Revenue and Custom Authority and more institutions provides one-stop-shop service for investors investing in designated industrial parks.

29
SP
ICE
S S
EC
TOR
INVE
STM
EN
T P
RO
FILE
: ETH
IOP
IA
ANNEX II: PROCEDURES FOR INVESTMENT START-UP
The investment proclamation (769/2012) allows foreign investors to apply for investment in Ethiopia. The procedure for investment start-up takes approximately two to five days, from reserving the company’s trade name to the final installation of a cash register machine, with a total average cost of 5,500 ETB. The Ethiopian Investment Commission has also started a “one-stop shop” service to its customers to avoid delay of time and unnecessary expenses (World Bank, 2016).
Investment license
Before starting any production activity, an investor should get an investment (business) license and register a minimum capital required for his investment. More information can be found on the Ethiopian Investment Commission website.
Visa and immigration requirements
An Ethiopian entry visa can be obtained from Ethiopia’s diplomatic missions on other continents. Foreign investors are required to have an Ethiopian visa, except for nationals of the Republic of Kenya, the Republic of South Sudan and Republic of Sudan.
Health requirements
Before applying for a visa, foreign visitors must have a valid yellow fever certificate and cholera vaccination. An individual who has entered a cholera-infected region is obliged to have a cholera vaccination within six days prior to arrival in Ethiopia.
Residence permit
The residence permit for foreign investors will be issued by the Department of Immigration and Nationality Affairs upon submission of an investment permit request by the investor. An expatriate staff member in possession of a work permit and a foreign investor who is a shareholder of a business or a branch business are also allowed to possess a residence permit.
© s
hutte
rsto
ck.c
om
30
SP
ICE
S S
EC
TOR
INVE
STM
EN
T P
RO
FILE
: ETH
IOP
IA
Bibliography
� BDS (2011), “The Implication of Joining COMESA-EAC-SADC Tripartite FTA on Ethiopia”, research report submitted to the Ministry of Trade and UNDP, Addis Ababa, Ethiopia.
� Commercial Bank of Ethiopia (CBE), Annual report 2017/18
� CBE, Annual Report 2012, monthly reports through January to June, 2013
� Ethiopian Spices Industry sub-sector Development Strategic Plan (2015-2025), 2015
� Ethiopian Growth and transformation Plan II (GTP-II), 2015
� EPOSPEA (2015), Pulses and spices export trend Ethiopia.
� Ethiopia, Ministry of Water, Irrigation and Energy, Annual report 2013/14
� Ethiopia, Ministry of Education, Annual Report 2013/14
� Ethiopia, Ministry of Finance and Economic Development (MoFED), Annual report 2013/14
� Ethiopian Roads Authority, Annual Report 2013/14 � Ethiopian Electric Power Authority, Annual Report 2013/14
� Ethiopian Revenue and Customs Authority, Annual publications 2012/13 & 2013/14
� Ethiopian Investment Commission, Factor Cost (Ethiopian), Annual publication 2015
� Ethiopian, Ministry of Finance & Economic Development, Annual report 2013/14
� Ethiopian Ministry of Water, Irrigation & Energy, Annual report 2015
� Ethiopian Investment Commission (2015), Investment Guide.
� Ethiopian Electric Utility Authority, Annual report 2014 � Ethiopian Central Statistics Agency (2014), Urban Employment & Unemployment Survey.
� Ethiopian Disaster Prevention and Preparedness Agency, Annual Report 2013/14
� Federal Negarit Gazeta, of the Federal Democratic Republic of Ethiopia, Investment proclamation No. 769/2012, page 6572.
� Federal Negarit Gazeta, of the Federal Democratic Republic of Ethiopia, Investment Incentives and Investment areas reserved for domestic investors Council of Ministers Regulation, Regulation No. 270/2012, page No. 6646 & 6653.
� Herms S. (2015), Business Opportunities Report Spices #6 in the series written for the “Ethiopian Netherlands business event”, 5–6 November 2015, Rijswijk, The Netherlands.
� ITC (2019), by Country Report Ethiopia � Netherlands-African Business Council (NABC) & FME-CWN (2015). The oilseeds and pulses Business opportunity report.
� National Bank of Ethiopia (NBE), Annual report 2017/18 and 2018/19
� Sandrey, R. and Jensen, H. (2011), “Intra-Africa trade in eastern and southern Africa and the role of South Africa”, In Sandrey, Jensen, Vink, Fundira and Viljoen (eds.): Cape Town to Cairo- An assessment of Tripartite Free Trade Area, Trade Law Center for Southern Africa, National Agricultural Mar keting Council, South Africa.
� Seid Nuru, (2015), Prospects and challenges of structural transformation in Ethiopia: Assesing the performance of GTP-I and reflecting on GTP-II.
� Spice Sector Strategy Coordinating Committee (2010), Spice Sub-Sector a strategy for Ethiopia.
� UNCTAD (2009), Economic Development in Africa Report 2009, Strengthening Regional Economic Integration for Africa’ Development, New York and Geneva.
� UNCTAD (2011), Economic Development in Africa Report 2011, Fostering industrial development in Africa in the new global environment (special issue), New York and Geneva.
� UNCTAD, ICC (2004). An Investment Guide to Ethiopia.
� UNDP (2014), Analysis issue No.1, Feb. 2014 � Weldegiorigis, T. (2010), “Domestic Resource Mobilization in Sub-Saharan Africa: The Case of Ethiopia”, the North-South Institute.
� Weldegiorigis, T. et al., (2010), “The challenges and prospects of creating a competitive export sector in Ethiopia”, Addis Ababa, Ethiopia.
� World Bank (2019). Doing Business database. � World Economic Outlook, April 2013, April 2014 and July 2014
� World Economic Forum (2013). Global Competitiveness Report 2013–2014.

31
SP
ICE
S S
EC
TOR
INVE
STM
EN
T P
RO
FILE
: ETH
IOP
IA

© s
hutte
rsto
ck.c
om