CATHOLIC RELIEF SERVICES/ETHIOPIA - DEVELOPMENT ...
69
1 FINANCIAL SERVICE PROVIDERS CAPACITY ASSESSMENT January 2019 CATHOLIC RELIEF SERVICES/ETHIOPIA
-
Upload
khangminh22 -
Category
Documents
-
view
4 -
download
0
Transcript of CATHOLIC RELIEF SERVICES/ETHIOPIA - DEVELOPMENT ...

1
FINANCIAL SERVICE PROVIDERS CAPACITY
ASSESSMENT
January 2019
CATHOLIC RELIEF SERVICES/ETHIOPIA

2
Acknowledgments
We would like to acknowledge CRS EARO Technical Advisor for Microfinance, Anthony Mang’eni, and
the CRS Ethiopia Microfinance team (Fetiya Ahmed, Tamrat Woldegiorgis and Sisay Temesgen) who
played significant role in this work starting from the preparation of assessment tools, data collection,
analysis and report preparation and CRS Ethiopia MEAL, Betel Mekbeb, for her support for MFI data
cleaning and analysis. Gratitude also goes to the MCS and HCS staff for their unlimited support during
data collection at kebele level. Had it not been for the dedication and support of the CRS and MCS staff,
this assessment would have not been conducted. Finally, our gratitude is extended to the beneficiaries,
MFIs heads, SACCO union and RuSACCOs leaders and stakeholders who gave us their time to interview
them.

3
List of Acronyms and Abbreviations
Local Names
Kebele A geographic area (village) under woredas
Region The higher Administrative Structure embracing zones and woredas
Woredas The lowest Government Administration Unit
CRS Catholic Relief Services
DFS Digital Financial Services
DFSA Development Food Security Activity
FSP Financial Service Providers
FGD Focus Group Discussion
GRAD Graduation with Resilience to Achieve Sustainable Development
HABP Household Asset Building Program
HCS Hararghe Catholic Secretariat
LG Livelihood Group
LGF Loan Guarantee Fund
LRO Livelihoods Resilience of Oromia
MCS Meki Catholic Secretariat
MFI Micro Finance Institution
MIS Management Information System
MSE Micro and Small Enterprise
OCAT Organizational Capacity Assessment Tool
OCSSCO Oromia Credit and Saving Share Company
OSHO Oromia Self Help Organization
PSNP Productive Safety Net Program
RuSACCO Rural Saving and Credit Cooperatives
SILC Savings and Internal Lending Communities
SHG Self Help Groups
SPM Social Performance Management
VSLA Village Savings and Loan Associations
WVA World Vision Ethiopia
WASH Water Sanitation and Health

4
Table of Contents
List of Acronyms and Abbreviations ............................................................................................................................................3
EXECUTIVE SUMMARY .................................................................................................................................................................5
INTRODUCTION ............................................................................................................................................................................6
CRS Background on Financial Inclusion ..................................................................................................................................6
Livelihoods Resilience of Oromia (LRO) ................................................................................................................................6
Development Food Security Activity (DFSA) .......................................................................................................................6
General Objective .............................................................................................................................................................................8
Specific Objectives .......................................................................................................................................................................8
Scope and Limitation of the Assessment ................................................................................................................................8
METHODOLOGY ............................................................................................................................................................................9
Desk Review ..................................................................................................................................................................................9
Organizational Capacity Assessment Tool (OCAT) Administration...............................................................................9
Focus Group Discussions ...........................................................................................................................................................9
Key Informant Interviews ...........................................................................................................................................................9
DATA COLLECTION .................................................................................................................................................................. 10
Sampling ....................................................................................................................................................................................... 10
Assessment tools....................................................................................................................................................................... 10
FINDINGS ....................................................................................................................................................................................... 11
1. Organizational Capacity Assessment for Microfinance Institutions ..................................................................... 11
2. Organizational Capacity Assessment for RuSACCO Unions and RuSACCOs ................................................. 12
3. Demand side Analysis: Livelihood Group Members ................................................................................................ 14
4. Supply-side: Financial Services Providers .................................................................................................................... 15
5. FSP Experience with Loan Guarantee Fund Utilization ........................................................................................... 18
Conclusion (Strength, Opportunities, Challenges and key capacity gaps) ................................................................... 20
RECOMMENDATIONS ............................................................................................................................................................... 23
Annexes ............................................................................................................................................................................................ 26
Annex 1: DETAILED RESULTS FOR ORGANIZATIONAL CAPACITY ASSESSMENT ........................................ 26
Annex 2: CRS Ethiopia Financial Linkages Guidelines ...................................................................................................... 40
Annex 3: MFIs Assessment questionnaire (for head office) ............................................................................................ 49
Annex 4: MFIs Assessment questionnaire (branch Offices) ............................................................................................ 56
Annex 5: RuSACCO and RuSACCO unions Capacity Assessment questionnaire ................................................... 62
Annex 6: Livelihood Groups FGD checklist ....................................................................................................................... 66
Annex 7: Key Informant Interview (stakeholders) ............................................................................................................ 68

5
EXECUTIVE SUMMARY
Catholic Relief Services (CRS), in partnership with Hararghe Catholic Secretariat (HCS) and Meki
Catholic Secretariat (MCS), is currently implementing USAID’s Feed the Future (FtF) funded Ethiopia
Livelihoods for Resilience of Oromia (LRO) and USAID’s Office of Food for Peace (FFP) funded
Development Food Security Activity (DFSA). These Activities focus on food, nutrition and livelihoods
security of Productive Safety Net Program (PSNP IV) households (HHs). They operate in fourteen
woredas and overlap in four woredas in MCS. LRO overlaps in one woreda with World Vision Ethiopia
(WVE). Financial services are key to reaching the development goal improving the livelihoods of PSNP
HHs. The two Activities are working to increase beneficiaries’ access to and usage of financial services
that will enhance the economic well-being of PSNP IV HHs. The Financial Services Capacity
Assessment exercise was commissioned by CRS Ethiopia to enable the Activities work with reliable
information in structuring financial linkages between FSPs and PSNP HHs by addressing identified
capacity gaps. And hence enhance Activity outcomes at the households while creating sustainable
relationships between FSPs and PSNP HHs.
Two types of FSPs were assessed: Microfinance Institutions (MFIs) and RuSACCOs/ RuSACCO
Unions. Five RuSACCO Unions which are operating in the Activities operation areas of MCS and HCS
were considered in the assessment. Duro Shala in West Arsi Zone, Biftu Batu and Awash Unions from
East Shewa Zone, Kalata union from Arsi Zone, and Burka Gudina of Babile woreda. Overall, 67
RuSACCOs (35 in MCS and 32 in HCS areas) were included in the assessment. The assessment
identified all MFIs in target woredas whose capacity was assessed. The following results and
recommendations were concluded from this exercise.
1. While most MFIs had strong indications of operational and financial capacity, they had (except for
one) poor management information systems (MIS) and no (except for two) Digital Financial
Services (DFS) to make up for their low presence in geographically remote areas where PSNP HHs
are mostly located;
2. RuSACCOs and RuSACCO Unions, while comparatively closer to PSNP HHs than MFIs, had weak
savings mobilization capacity coupled with poor loan performance that affected their capacity to
serve increasing demand from PSNP HHs and other community members due to lack of loanable
fund;
3. A good number of RuSACCOs and MFIs had experience in working with NGO projects and
savings groups. This was a key factor in determining FSPs to work with under these Activities.
Selected FSPs included: Metemamen MFI; Keleta RuSACCO Union; Vision Fund MFI; OCSSCO
MFI; Meklit MFI; Awash RuSACCO union; and Doro Shalla RuSACCO Union in MCS Activity areas.
Under HCS Activity areas, the following FSPs were identified: OCSSCO MFI; Dire MFI; Burka
Gudina.
Finally, the assessment concluded that while FSPs faced a number of challenges while having strengths
in different areas, the challenges affected each FSP differently depending on the area of operation and
the intervention focus that the project was interested to work in. Recommendations are therefore
made in the report to provided focused capacity building activities on a needs basis while increasing the
risk appetite of FSPs to serve PSNP HHs through the loan guarantee fund.

6
INTRODUCTION
CRS Background on Financial Inclusion
Catholic Relief Services (CRS) currently has activities focusing on relief assistance, household and
community resilience building, agriculture and natural resources management, health and nutrition,
Water, Sanitation and Hygiene (WASH), and Microfinance. Two activities of CRS Ethiopia that
contribute to these program areas are Livelihoods Resilience of Oromia (LRO) and Development Food
Security Activity (DFSA). These Activities are being implemented in partnership with Hararge Catholic
Secretariat (HCS) and Meki Catholic Secretariat (MCS). The Feed the Future (FtF)-funded Ethiopia
(LRO) and USAID’s Office of Food for Peace (FFP)-funded DFSA focus on community resilience
building of Productive Safety Net Program IV (PSNP IV) beneficiary households (HHs).
Livelihoods Resilience of Oromia (LRO)
LRO aims to enable PSNP IV HHs to improve and ensure they sustain their economic wellbeing. CRS
implements LRO in collaboration with its partner MCS in Oromia Regional State. This Activity has nine
target woredas (districts): Arsi Negelle, Shalla, Siraro, Adami Tulu Jido Kombolcha (ATJK), Ziway
Dugda, Dodota, Sire, Heben Arsi and Boset. The Activity runs from February 1, 2017 through January
31, 2022 and aims to reach 24,500 PSNP HHs. The key objectives of the Activity are:
• Increasing income and diversification through Crop and Livestock opportunities;
• Increasing income and diversification of Off-farm Livelihood options;
• Increasing income from gainful employment; and
• Increasing innovation, scaling and sustainability of livelihood pathways.
Development Food Security Activity (DFSA)
CRS’ DFSA is an initiative to sustain and build upon the previous food security improvements achieved
under the Government of Ethiopia’s (GoE) framework of the PSNP. The goal of the Activity is to
improve and sustain food, nutrition and livelihoods security of households and communities. The
lifespan of Activity is from September 30, 2016 through September 29, 2021. It has three purposes and
one cross-cutting sub-purpose on gender and youth:
• Purpose 1: GoE and community systems respond to reduce communities' and households'
vulnerability to shocks;
• Purpose 2: Households improve their sustainable livelihood and economic wellbeing;
• Purpose 3: Pregnant and lactating women and children under five have improved nutritional
status; and
• Cross Cutting: Women and youth have increased access to and control of community and HH
resources.
DFSA is implemented by CRS in collaboration with Mercy Corps, MCS and HCS. It is implemented in
Oromia Regional State and Dire Dawa Administrative Council. CRS’ DFSA operates in four livelihoods
zones and plans to serve 48,125 PSNP HHs under Purpose 2.

7
DFSA and LRO overlap in four woredas - Arsi Negelle, Shalla, Heben Arsi and Ziway Dugda. In
addition to geographical overlap, the two Activities have technical overlaps in thematic areas such as
livelihoods, gender, nutrition and market systems. The two Activities are closely working together to
manage these overlaps within MCS operational areas. LRO overlaps in one woreda with World Vision
Ethiopia (WVE).
The two Activities base their interventions on establishment of livelihood groups (LGs) and these
groups implement the Savings and Internal Lending Communities (SILC) methodology for savings
mobilization. The two Activities are establishing LGs and implementing SILC methodology). The
groups have started mobilizing savings from members and have started to lend to members.
The Activities have also conducted a barrier analysis on access to financial services. The purpose of the
assessment was to identify key determinants of two selected behaviors: borrowing money and timely
repayment of loans from FSPs. The two behaviors were studied through observation of PSNP IV
beneficiaries’ behavior in five woredas in MCS. The findings of the assessment are in a separate report.
In the Activities’ operational areas, MFIs and RuSACCO/RuSACCO unions are the most available
Financial Service providers (FSPs) serving poor households. MFIs that have significant operations in the
project area are Oromia Credit and Saving Share Company (OCSSCO), Metemamen MFI, Gasha MFI,
Meklit MFI, Vision Fund MFI and Busa Gonofa MFI.
Woreda Name of Partner and MFI
HCS MCS
Deder OCSSCO
D/D Dire MFI
Midega Tola OCSSCO
Babile OCSSCO
M/belo
Ziway Dugda • OCSSCO
• Metemamen
Adami Tulu J/K • OCSSCO
• Metemamen
Arsi negele • OCSSCO
• Metemamen
Heben Arsi • OCSSCO
Shala • Metemamen
• OCSSCO
Siraro • OCSSCO
Boset • OCSSCO
• VisionFund MFI
• Gasha MFI
Sire • OCSSCO
• Metemamen
• Meklit
Dodota • OCSSCO
• Meklit

8
General Objective
The Financial Services Providers (FSP) capacity assessment was conducted for both Activities to
identify potential financial services partners to be considered for structuring viable financial linkages for
the target project areas of Oromia and Dire Dawa Administration Council of Ethiopia. This was done
in order to increase access to financial services (i.e. savings, loan and micro-insurance) for Livelihoods
Group members.
Specific Objectives
i. To conduct a capacity assessment of potential FSPs with regards to providing sustainable
financial services to Activity participants.
ii. To examine product features in terms of appropriateness (quality, terms and conditions) and
whether these meet PSNP client needs.
iii. To identify growth potential in terms of outreach (both financial and geographic) of the FSPs
and willingness to address PSNP clients, with emphasis on women and youth, based on agreed
terms and conditions with CRS/MCS/HCS.
iv. To identify community and stakeholders’ perception on the MFIs/RuSACCOs.
a. Examine organizational structures and functions of FSPs with regards to their: governance
structures and their strategic focus with priority given to:
b. physical and human capacity gaps that may affect effectiveness and efficiency of the FSPs
branch in servicing the target beneficiaries, and
c. capacity gaps in accessing and managing government conditional capacity building grants.
v. To explore FSPs’ experience on loan guarantee fund utilization and identify any best (or
emerging) practices in the management of loan guarantee funds.
Scope and Limitation of the Assessment
Scope: The assessment covered 14 Woredas of Oromia Region and Dire Dawa Administration where
implementing partners (HCS and MCS) of the two Activities are operating.
Limitations: Data was collected from RuSACCOs operating in PSNP kebeles and only PSNP
beneficiaries (LG members) were targeted hence possible bias in perception of FSPs in the target areas.
There were instances where RUSACCO Unions, RuSACCOs, and MFIs were reluctant to provide
data, mainly on financial performance and profitability of their institutions. This affected completeness
of analytical information on FSP performance that would enable comparison on institutions. Hence,
further examination might be required to get this data as a condition for contracting potential FSP
project partners.

9
METHODOLOGY
Desk Review
Prior to the field assessment CRS DFSA and LRO project documents were reviewed to provide the
necessary background information and data for the assignment and preparation of data collection tools
– questionnaires and FGD guides. Other relevant literature was also reviewed focusing on the general
financial services landscape in Ethiopia such as Federal Cooperative Agency Capacity Gap Assessment
and Mapping of Financial Institutions under Food Security Program: Household Asset Building Program
(HABP) Areas conducted in 2012 and CRS Ethiopia Graduation with Resilience to Achieve Sustainable
Development (GRAD-I) project reports. CRS Tanzania’s U.S. Department of Agriculture (USDA) Soya
Ni Pesa project’s Financial Linkages Report was also reviewed to provide additional background
information on CRS approaches and guidelines to financial linkages.
The Desk Review led to mapping of FSPs, being undertaken by CRS Ethiopia and partners. The mapping
exercise led to a document that provided useful information on how FSPs are operating in the areas of
interest for the Activities, and their financial status leading to decisions on who to include in the
assessment.
Organizational Capacity Assessment Tool (OCAT) Administration
A comprehensive OCAT was adapted and administered to collect information on management and
organizational structure, outreach, operations, human resources, growth, experience, reporting and documentations of MFIs (headquarters and their branches), SACCO unions and RuSACCOs. (See
Annexes 1 for the OCAT Tool).
Focus Group Discussions
Interviewees under focus group discussions (FGDs) were mostly members of LG groups that had been
exposed to FSPs products or had not had any experience. Their perceptions on different category of
FSPs was also assessed and the type of products and/or services they felt were of high demand to them.
Key Informant Interviews
Key informants Interviews (KIIs) constituted a major source of strategic information for the assessment
given their perceived critical roles in project implementation, strategic oversight and management of the
financial linkages between project groups and linkage structures (MFI branches and
RuSACCOs/RuSACCO Unions). KIIs were done with woreda-level stakeholders and CRS Partners,
focusing on senior management teams of these institutions to understand the objectives underlying
strategic decisions for initiating financial linkages with the project beneficiaries. KIIs were not done at
individual level rather all relevant woreda sector office representatives participated as a group. The
participant sector offices were Cooperative Promotion Office, Agriculture Office, Food Security Office
and Women and Children Affairs office.

10
DATA COLLECTION
Sampling
Purposive sampling was used to get participants for RuSACCOs and Focus Group Discussions. However,
for MFIs and RuSACCO unions, all MFIs with their branches and all Unions at DFSA and LRO operational
woredas were included in the assessment hence a census approach. Out of the total number of
RuSACCOs that exist in DFSA and LRO operational woredas, 20-30% RuSACCOs per woreda were
taken as sample based on availability of MFI operation in the woreda. That is, if more than one MFIs were
available in the woreda and addressing PSNP kebeles, 20% of the RuSACCOS were taken as sample and
If one MFI or MFI were not available in the woreda 30% of RuSACCCOs were taken as a sample. With
regards to FGD, the sampling was for kebele selection and 10% of kebeles from the total PSNP kebeles
in the woreda were selected as samples while one FGD was conducted from each of the sample kebeles.
As per this sampling method the samples selected and participated in the assessment from 14 woredas
were 6 MFI head offices and 22 Branches of these 6 MFIs, 31 Kebeles (31 FGDs) from 320 kebeles, 5
RuSACCo unions, 66 RuSACCOs and 14 Key Informant Interviews.
Figure 1 Sample size distribution by woreda
Assessment tools
Assessment tools that were developed and used for the assessment included a separate questionnaire
for each of the following categories:
a. MFI senior management team at the Head Office;
b. MFI branches;
c. RuSACCO Unions;
d. RuSACCOs;
e. A guide and checklist for FGD participants from LGs and;
f. Questionnaire and checklist for Key Informant Interviewees.
Woredas
Babile Deder Melka
Bello
Midega
Tola
Dire
dawa
Zuria
Siraro ShallaArsi
Negele
Hebe
n Arsi
Zeway
DugdaATJK Boset Dodota Sire Total
PSNP Kebeles 20 30 20 20 40 20 30 30 10 20 30 10 20 20 320
1
SACCO
Unions
Burka
Gudina
Doro
Shalla
Doro
Shalla
Doro
Shalla
Doro
Shalla
Biftu
Batu
Awash
Unin
Keleta
union
Keleta
Union
2
Number of
RuSACCO
5 7 6 5 8 5 6 3 1 6 8 1 2 3 66
3 FGD 2 3 2 2 4 2 3 2 1 2 3 1 2 2 31
4 MFIOCSSC
O
OCSSC
O OCSSCO Dire
OCSSC
O
OCSSC
O,
Mete
mame
OCSSCO,
Metema
men
OCSSC
O
OCSSC
O,
Metem
amen
OCSSC
O,
Mete
mame
OCSSC
O,
Vision
Fund,
OCSSCO,
Meklit
OCSSCO,
Metema
men ,
Meklit
6
5
MF Branch
institution
1 1 1 1 1 2 2 1 2 2 3 2 3 22
6 Stekeholders 1 1 1 1 1 1 1 1 1 1 1 1 1 1 14
HCS MCS

11
FINDINGS
1. Organizational Capacity Assessment for Microfinance Institutions
Key Challenges and Opportunities of MFI Head and Branch Offices
Report from the assessed MFIs show the following areas of challenges and opportunities faced by these
institutions in Activity areas.
Head Office Branch offices
Key Challenges • Community reluctance to repay loans and bad
experience with loans in some areas.
• Liquidity problems (shortage of loanable funds);
• Geographic remoteness and associated logistical
problems.
• Areas prone to frequent drought leading to poor
loan performance
• Loan diversion to other unintended use
• Lack of hardware and logistical support for
remote low-density areas
• Unrest and insecurity from the past years has
affected loan performance
• Seasonality of income affects cash flow for
frequent loan repayments
• NGOs have infused dependency syndrome that
misguides loan clients when receiving loans from
FSPs linked to NGO partners. Poor
communication to clients who think loans are a
donation from NGOs;
• Agricultural loans are high risk due to natural
calamities;
• Low securitization on loans through group
lending;
• High operational costs to reach remote PSNP
clients.
• Clients lack of commitment/willingness
to repay loan
• Shortage of loanable fund-liquidity
• Market fluctuation affecting loan
repayment-default
• Drought, low productivity of the area
• Dependency syndrome
• Inadequacy of branch facilities -
transportation, office rooms, office
equipment (computer)
• Un-planned loan and investment by
borrowed money by clients
• Weak support from /integration with
woreda stakeholders
• Security and stability in the area
• Some program interventions, loan
disbursements without enforcement of
repayments
• Household indebtedness-double loan
• Communities lack of awareness on
loan repayment
• Low demand to borrow
• Remoteness and weak infrastructure
facility.
Key
Opportunities • Potential to roll out different loan products
depending on favorable weather patterns.
• Adequate market for product diversification.
• High demand for loan (and other financial
services?). Large customer base
• Favorable business opportunities in the woredas
(political stability?)
• Good reputation of some FSPs from the
community.
• Opportunities for collaboration with some
NGOs.
• Adequate market for product
diversification
• High demand for loan
• Partnership and collaboration with
NGOs and government stakeholders
• Adequacy of loanable fund
• Entrepreneurial knowledge of target
market- women (Babile),
• Promising saving culture

12
• Partnership with MCS to implement loan
guarantee fund
• Growing savings culture among clients in savings
groups.
Key challenges and opportunities had different significance depending on the MFI assessed. Generally,
most MFI had the right management and operational structures. Different branch offices had different
challenges and opportunities. Capacity gaps in the areas of Management Information System (MIS),
logistics, and training varied depending on MFI and also depending on head office or branch office.
Additionally, a challenge in some woreda may not be the same in another, and it could as well be
identified as key opportunity. OCSCO, Metamamen and Vision Fund MFIs demonstrated strong
indicators in most of the areas assessed as compared to other MFIs.
2. Organizational Capacity Assessment for RuSACCO Unions and RuSACCOs
Five RuSACCO unions which are operating in the Activities operation areas of MCS and HCS were
considered in the assessment. Duro Shala in West Arsi Zone, Biftu Batu and Awash Unions from East
Shewa Zone, Kalata union from Arsi Zone, and Burka Gudina of Babile woreda. Of these, Duro Shala
and Awash unions have the highest membership.
Overall, 67 RuSACCOs (35 in MCS and 32 in HCS areas) were included in the assessment. A total of
18,158 community members were organized under the RuSACCOs as at July 2010 Ethiopian Calendar
(EC) with average membership ranging from 63 to 531 per RuSACCO.
All RuSACCOs have members who are PSNP beneficiaries. Majority of them have youth in their
membership and allow two or more members from a household to participate. In some RuSACCOs, in
Arsi Negele, Midega Tola and Melka Belo, youth constitute 24 - 35% of the membership. There are
RuSACCOs where female constitute 100%, and most of them have more than 70% of the total
members are female. As per the assessment results, most of RuSACCOs showed that their
membership had increased during the last two years.
Trainings need mentioned by the RuSACCOs are principles of cooperatives, loan management,
product development and marketing, promotion skills, cooperative management and leadership,
business skill, credit risk management auditing and preparing balance sheet statement are areas of
training recommended by RuSACCOs.
Some of the RuSACCOs operating in MCS areas have prior work experience with different NGOs
(Catholic, MCS, OSHO, child fund, Rift Valley Women and Children Development, Self Help Africa).
Most RuSACCOs reported poor savings mobilization and high arrears rates that affected their loanable
fund and general performance in Activity areas. The section below highlights areas that need capacity
building in relation to these challenges as shown below.

13
Factors affecting
regularity of savings in
RuSACCOs
• Seasonality of income due to smallholder dependence on rainfed agriculture.
• Weaknesses in management committee (specify)
• Lack of trust in management committee
• Lack of support from management committee
• Lack of interest from members
• Drought
• Some new members do not respect by-laws
• Lack of capacity to save
• Some new members take too long before they start savings (some haven’t
started saving yet)
Type of trainings
needed
• Record keeping
• Credit Management
• Cooperative By-Laws
• Financial Education
• Entrepreneurship training
• Business Plan/Strategic Plan preparation
• Savings mobilization
• RuSACCO management including member mobilization
• Financial Management
• Micro-insurance

14
3. Demand side Analysis: Livelihood Group Members
To understand PSNP beneficiaries needs, financial service preferences and their perception of FSPs, 31
FGDs were conducted with PSNP beneficiaries in 31 PSNP kebeles with the following results:
a. PSNP clients’ product preference
PSNP beneficiaries have a high preference for loans that enable them to stock up their livestock. This is
followed by business start-up loans and loans for agricultural production. FSP providers may not have
loans for start-ups and hence business planning exercises under the Activities play a leading role in
assessing sources of capital for these start ups in a financial landscape that does not provide business
start-up loans. Such clients should mobilize low risk sources of credit such as individual savings through
SILC groups. This reinforces the point that LG members should be part of savings groups to address
such borrowing needs.

15
b. Factors that affect Borrowing Decisions for PSNP Beneficiaries
The results indicate that proximity of the institution (13%) loan size (15%), loan product (10%) and
interest rate (13%) are the most prominent factors that PSNP beneficiaries consider in making
borrowing decisions. While proximity of institution plays in favor of RuSACCOs, the rest of the
prominent factors play in favor of MFIs. Strong MFIs are those that combine these factors while being
as close to the client as possible. MFIs that have introduced Digital Financial Services (DFS) have an
added advantage of increasing efficiency while expanding outreach through a combination of the above
factors.
4. Supply-side: Financial Services Providers
The assessment compared feedback from LG and other community members (demand-side) with FSP
response on similar questions. The results are captured below.
a. FSP Product Rating Demand in Target Woredas
a. Loan repayment period
15%
b. Interest rate13%
c. Loan size15%
d. Loan product being offered
10%
e. Friendliness of staff7%
F. Nearness of the institution
13%
g.Collateral/security requirements
9%
h. Loan disbursement timing
7%
i. Loan disbursement efficiency
4%
J. Loan repayment modality
7%

16
It was interesting to note similarities between priority products on demand-side and FSP understanding
of the same. The question then becomes, why are FSPs not developing products that respond to
demand-side needs? The organizational capacity report on Annex 1 reveals a number of reasons
ranging from human, operational and financial capacity that limit FSPs ability to respond to known
product preferences on the demand-side. This makes most FSPs operate below capacity or sub-
optimal. While MFIs have ability to respond given support from the Activity through loan guarantee
funds, RuSACCOs and RuSACCOs Unions have very low capacity to respond and will need more time
for capacity building which may delay project deliverables given the timeline.
b. Factors to be considered before clients take up a loan: FSP perspective
The assessment further considered factors that need consideration to ensure a healthy product
portfolio. FSPs were required to provide responses to key factors that they would advise PSNP clients
to consider before making borrowing decisions. The below chart highlights the responses.

17
As per responses from clients in (b) demand-side factors that affect borrowing decisions, there was no
significant deviation between demand-side and supply-side responses to this question. In conclusion,
while demand-side and supply-side have similar positions on product preferences and considerations
for borrowing, other sections of the report reveal that FSPs and PSNP clients have different
perceptions towards each other. This demonstrates very little interaction between FSPs and PSNP
clients hence poor communication or awareness meetings that lead to poor perceptions and
unwarranted client behavior once loans have been disbursed. Financial Education by the Activity can be
used to address knowledge gaps and perception issues between PSNP clients and FSPs thereby
enhancing product uptake and improve loan performance.

18
5. FSP Experience with Loan Guarantee Fund Utilization
Below table shows responses from 5 MFIs and 1 Cooperative Union1 that were interviewed during the
MFI/RuSACCO capacity assessment. Comments from CRS indicate possible project interventions or
recommendations
Issue MFI Response(s) CRS
Recommendations/Intervention
Experience in utilization of
loan guarantee fund
Apart from Gasha and Dire MFI,
all respondents had experience
with loan guarantee fund
Individual capacity and lessons from each
respondent should determine action plan
for the project (see responses to best
practices and challenges in the excel
sheet)
Best practices vs challenges in
administration of loan
guarantee fund
Best Practices (summary):
• Facilitated increase in depth of
outreach to previously
underserved populations.
• Continuous monitoring and
periodic evaluation by
partners
• Risk-sharing and identification
of credit-worthy clients
through partners helps to
deepen outreach.
CRS needs to build more on the gains
made from previous LGF experiences.
Most FSP claim that the remoteness of
PSNP clients (LGs) is an operationally
challenge and prefer support in
monitoring these groups.
Another point: FSPs want CRS to
participate in identification of credit-
worthy clients to help disburse quality
loans. A meeting to discuss the process
and expectations between selected FSPs
and CRS is necessary as part of the
outreach process.
Challenges (summary):
• Less productive loans in terms
of size coupled with high risk.
• MFI still covers part of the
risk in a high-risk market.
• Remoteness of PSNP clients.
• ‘Donation’ mentality by clients
who know that this is part of
NGO intervention.
• Rush to give loans by NGOs
without proper assessments
led to poor quality loans and
defaults.
• Loans have to be matched by capacity
as seen in savings behavior in a SILC
meeting. Clients who are not savings
within an LG-SILC are obviously high-
risk. The nature of a LGF is to
encourage an MFI to depend outreach
and not to transfer the entire risk to
the guarantor.
• Loans should be seen as part of MFI
products and not CRS. Client
orientation is critical to address this
issue. CRS and MFI should share
messaging approaches to this during
their client onboarding process.
• Due diligence still has to be followed
to get good loans out. CRS does not
intend to rush MFIs to give out loans
to LGs without following MF Best
Practices.
1MFIs interviewed included: Metemamen; Vision Fund; OCSCO; Meklit; Gasha and Dire.

19
Interest (willingness) in long-
term partnership and
expectations.
FSPs are willing to partner and
engage in long-term partnerships
to serve PSNP clients if the
following conditions are met:
• NGOs do not interfere in
client selection process;
• Clear risk-sharing modalities;
• Capacity building in terms of
software and hardware
development including
logistical support; and
• Client groups are mature
enough and protected from
over-indebtedness;
• While the client group is defined
(LGs/PSNP beneficiary) MFIs have the
right to determine credit worthiness of
the individual clients within LGs. We
understand that not all LGs members
are legible for MFI loans but CRS will
try as much to prepare LG households
to be low-risk. This includes financial
education training, training on business
planning, ensuring participation in SILC
to build savings as an asset etc).
• Agreement between MFI and CRS on
LGF should include risk-sharing
modalities and capacity building
commitments.
• CRS Guidelines for Financial Linkages
already exist and should be used in
guiding this process. See Annex 2
Key challenges faced by MFI
and its branches • Agricultural loans are high risk
due to natural calamities;
• Low securitization on loans
through group lending;
• Liquidity problems (shortage
of loanable funds);
• NGO mind-set of clients leads
to poor portfolio
performance;
• High operational costs to
reach remote PSNP clients;
• Poor communication to
clients who think loans are a
donation from NGOs;
• Capacity gaps (MIS, logistics,
training)
• Bad experience with loans in
some areas
• Agricultural loans are important to the
households we serve. Their risk profile
is high but other factors can be
considered to make the client low risk,
e.g. other IGAs that the client is
involved in.
• While there is no other option to
securitize the loan apart from group
guarantee, the risk of a member
defaulting affects the entire group fund.
The other weakness is that SILC
members will not want to commit their
loan fund as security because they want
to deposit and borrow from it in every
meeting throughout the cycle.
• Capacity needs should be specifically
addressed once the MFI partner has
been selected.
Key Opportunities for the
MFI and its branch networks • Political stability and good
weather condition;
• Existence of partners like
WEDP and projects like LRO
helps to expand outreach;
• Growing entrepreneurship
mindset of communities;
• Increased partnership
requests from different
stakeholders;
• Opportunities to increase
client outreach and loan
• After selection of MFI partner, we
need to conduct a stakeholder analysis
to understand which other partners
are involved with the MFI and in the
area of interest. How then do we build
synergies?

20
portfolio besides expansion of
operational areas;
• High demand for MFI loans
against a backdrop of
improving economic growth
coupled with infrastructural
development; and
• Availability of skilled
manpower.
CONCLUSION
Conclusion (Strength, Opportunities, Challenges and key capacity gaps)
FSPs in target woredas demonstrate good capacity albeit in varying levels. The level of effort engaged in
building their capacity will vary depending on where they are in the Financial Linkages journey and special
focus on PSNP clients. CRS appreciates that there are key challenges and limitations that require focused
intervention in order to make linkages functional and productive on both sides. Similarly, MFI branches
and RuSACCOs have their own strengths and gaps depending on the area assessed.
Strength and opportunities of MFIs
The MFIs assessed have institutionalized management and organizational structures and have all the
required management staff required with the necessary professional experience in the industry. They
have also good partnership experience of working with NGOs and GOs.
The MFIs are in good position in terms of outreach. Majority of them have options to provide all services
like loan disbursement and repayment, savings collection and withdrawal at satellite offices or kebeles.
Majority of the MFIs branch offices have presence at remote rural areas. All MFIs have been operational
in the country for more than 5 years and they offer range of products and services like on-farm, off-farm,
MSE loans, saving, credit life insurance.
OCSSCO and Dire MFIs have Sharia-compliant loan products and other MFIs have commitment to the
pro-poor approach and have additional services that focus on women empowerment, youth, integrated
approach like adult literacy and health programs.
Concerning working with marginalized communities, majority of the MFIs assessed have social
performance management (SPM) in place and they have interest to work with them. Metemamen, Vision
Fund, OCSSCO and Meklit (except Gasha and Dire MFI) had experience of loan guarantee fund utilization
with different organizations.
The MFIs assessed have experience of working with saving groups (VSLA, SILC, SHG) and all MFIs have
similar lending methodologies that can apply to work with poor community. They also apply Social
Performance Management (SPM) in place and willing to serve PSNP beneficiaries.

21
The MFIs are financially growing over the last two years with a positive portfolio growth and reasonable
portfolio quality as measured by portfolio at risk. They have positive net income, are financial and
operationally self-sufficient and have good Return on Asset value.
The MFIs have good staff productivity as measured by clients to loan officers ratios which is within the
standard and they send staff to external and external trainings to build their knowledge and skill in the
sector. Majority of the MFIs also implement performance-based incentive.
Capacity gaps and challenges of MFIs
Among those that were assessed, most MFIs were weak in terms of Digital Financial Services like mobile
money, agency banking and mobile banking. Some MFI branch offices also provide only partial services at
sites.
MFIs are weak in terms of coverage where most branch offices of the MFIs cover only less than 1% of
the total population of the woreda. It is only OCSSCO that covers majority PSNP kebeles while others
cover limited number of PSNP kebeles. In addition, they had no experience in providing loans and loan
products to RuSACCOs and RuSACCO Unions.
MFI branch offices had capacity gaps in areas of logistics gaps including office furniture. There were few
motorbikes with one assigned to more than one staff.
Low liquidity was an issue affecting most MFIs in target areas. OCSSCO, Vision Fund and Dire MFIs were
the only institutions that seem not to have problems with liquidity. Besides liquidity, a good number of
these institutions did not have a fully computerized MIS system. Apart from Vision Fund which had a
fully computerized MIS system, all other MFIs used a manual MIS system.
Communities reluctance to pay loan on time coupled with geographic remoteness forced MFIs to incur
high operational costs discouraging MFIs to reach PSNP clients that reside in remote areas.
Frequent drought and market fluctuation leading to poor loan performance, seasonality of clients’
income, loan diversion and household indebtedness.
RuSACCOs and RuSACCO unions
Strength of RuSACCOs/RuSACCO unions
The RuSACCOs and the unions’ leadership had a vision, mission and operational plan for their businesses.
Majority of the unions and RUSACCOs had accountants /bookkeepers/ to maintain financial recordings
and they have been audited during for the last three years.
Almost all unions gave priority for women membership and the total membership show increasing trends
over the last three years prior to the assessment. All RuSACCOs had members who are PSNP
beneficiaries and allowed two or more members from a household to participate. Majority of

22
RUSACCOs had youthful membership and in some RuSACCOs, such as in Arsi Negele, Midega Tola and
Melka Belo, youth constituted 24% to 35% of the membership.
The assessment revealed that RuSACCOs used mainly savings as source of loan to members but there
were also some RuSACCOs that used loans from unions and revolving funds as additional source of
credit for their members. On top of this, to increase their loan fund, the unions had also experience of
borrowing from external sources.
The assessment also showed that RUSACCOs provide loans both for on-farm and off-farm activities and
fattening, agricultural input purchase, small ruminant rearing (goat and sheep), grain trading and petty
trade.
The unions had offices, office furniture and supplies except Burka Gudina union. They also have adequate
number of staffs assigned except Burka Gudina and Awash unions.
Capacity gaps of RuSACCOs and RuSACCO unions
The RuSACCOs had capacity gaps in strategic plan preparation while there were cases of bookkeepers
having limited capacity to manage records. Although most RuSACCOs had office space, they were mostly
old and inadequate. Business plan preparation capacity was also a key gap in RuSACCOs that required
technical support.
RuSACCOs had a problem in mobilizing savings which affected their loanable funds. This was exacerbated
by poor loan repayment by members. None of the RuSACCOs got MFI or bank loans as source of loan
fund to their members, though the unions had experience of taking loan from banks.
Understandably, due to low savings mobilization and a poor loan repayment culture, loan disbursements
to RuSACCO members was low for the last three years. Except Kalata union, the other unions were
not able to provide loan to their member RuSACCOs in the last three years. Lack of loanable fund and
delayed repayment from RuSACCOs were the reasons mentioned by the respondents. Shortage of
loanable fund is the major limiting factor for all RuSACCOs arising from infrequent savings by members,
poor repayment of loans, and weak resource mobilization capacity.
Except some committees and bookkeepers of some RuSACCOs, majorities of the RuSACCOs
management reported that they did not receive any type of training.

23
RECOMMENDATIONS
1. FSP prioritization
To address PSNP beneficiaries’ financial services gap in the two Activities (DFSA and LRO) operational
woredas, the following FSPs were selected considering the following factors: operational and financial
performance; willingness to serve PSNP communities; availability of services at kebele level; prior
experience of FSPs working with CRS and its partners on serving PSNP clients; and the PSNP client’s
perception and preferences.
Intervention
area
FSPs
recommended
Remark/ reason for prioritization Recommended for
Woredas
MCS
1. Metemamen
MFI
- Operational capacity
- Willingness to serve PSNP clients
and prior experience with CRS and
its partners during GRAD-1
- leveraging the loan guarantee fund
provided during GRAD – 1
- Branches presence and willingness
to open new branches if agreed on
terms and conditions
- Shalla, Arsi Negele, Sire,
Zeway Dugda, Heben
Arsi and ATJK
2. Keleta
RuSACCO
unions
- Willingness to serve PSNP clients
- Member RuSACCOs presence in
Most of Dodota and Sire woredas
- Proximity to members and
community’s preference
- Sire
- Dodota
3. Vision Fund MFI - Financial and operational capacity
(Liquidity is not a problem)
- Willing to serve PSNP clients and
prior experience of serving PSNP
clients
- Dodota,
- Boset
- Siraro
4. OCSSCO MFI - Woreda level presence
- Financial and operational capacity
(Liquidity is not a problem)
- Willing to serve
- Experience of loan guarantee fund
(GRAD 1) and youth revolving fund
- Experience of digital finance
- All operation woredas
5. Meklit MFI - Willing to serve
- GRAD 1 experience of Loan
Guarantee fund
- ATJK
6. Awash
RuSACCO
union
- Financial capacity
- Willing to serve
- Presence in the operation area
- Proximity to members
- Boset

24
7. Doro Shalla
RuSACCO
union
- RuSACCOs presence at most of
the PSNP kebeles
- Proximity to members and
community’s preference
- Siraro
- Arsi Negele
HCS
1. OCSSCO MFI - Woreda level presence
- Financial and operational capacity
(Liquidity is not a problem)
- Willing to serve
- Experience of loan guarantee fund
(GRAD 1) and youth revolving fund
- Experience of digital finance
- All operation woredas
2. Dire MFI - Operational capacity
- Presence in Diredawa zuria kebeles
- Willing to serve
- Dire Dawa
3. Burka Gudina - Presence in Babile woreda
- Leveraging loanable fund from PSNP
-3
- Experience of serving PSNP clients
- Proximity to members
- Babile
4. Potential
Primary
RuSACCOs
- Financial capacity- few of them have
- Initially formed to serve PSNP-3
beneficiaries
- Leveraging loanable fund from
PSNP -3
- Proximity to members
- Melka Belo
- All HCS- DFSA
operation woredas
2. Capacity Gap Intervention
Major gaps identified during assessment include liquidity management; geographic remoteness of the
PSNP beneficiaries and associated logistical problems; poor infrastructure including limited
transportation and office facilities; and staff’s skill in customer care. Other areas were client
mobilization skills, credit management and promoting a savings culture. These were the major training
gaps that were key challenges shared by FSPs. Hence, considering these gaps and DFSAs’ and LRO’s
scope and mandate to build partner FSP capacity, the following intervention areas were identified.
a. Improving liquidity management of both MFIs and RuSACCOs. As indicated by FSPs, this
problem mainly emanated from capacity of FSPs on savings mobilization and delaying loan repayment
by communities, where in some cases loan defaulting was the major cause. Therefore, DFSA and
LRO could support FSPS through:
• Introducing targeted savings in LGs and use FSP accounts for safe custody;
• Identification of credit worthy clients within LGs but without affecting group dynamics;
• Consistent monitoring of loan utilization and reminding borrowers to pay their loans on time
using a computerized MIS;
• Increasing FSPs risk appetite by availing loanable funds through the loan guarantee fund.

25
b. Improve logistics/ transportation services. Lack of logistics mainly, means of transport affected
proximity of services to clients and monitoring support by FSPs.
Providing motorbikes to branch offices and to Unions will reduce traveling of PSNP HHs to branch
offices of respective FSPs, improve loan and client monitoring, enhance saving mobilization and
increase support from the Union to its RuSACCOs,
c. Support office furniture, office supplies and computer equipment: This would improve
quality of reporting, service delivery and efficiency and staff morale.
d. Improve technical capacity of the staff through training and experience sharing: Staff are
a central part of the service delivery to the poor. For this reason, the following trainings (not in order
of priority) were recommended.
• Record keeping
• Credit Management
• Cooperative By-Laws
• Financial Education
• Entrepreneurship training
• Business Plan/Strategic Plan preparation
• Savings mobilization
• RuSACCO management including
member mobilization
• Financial Management
• Micro-insurance
• Experience sharing to branches,
RusSACCOs, management and board
e. FSPs to improve the work environment and incentives for the staff: Guide FSPs, mainly
RuSACCOs to recruit experienced staffs and to implement performance monitoring as well as
incentivizing well performing staffs help them reduce staff dropouts.
f. Support development of Computerized MIS: Automated transactions’ management is crucial
for FSPs to help them manage daily routines and maintain long-term partnership with CRS and its
partners. Support in this regard, enhances the MFI’s services delivery to its partners and to upscale
itself allied with partners’ requirement.
g. Motivating FSPs to introduce Digital Financial Services: PSNP clients are geographically
remote and financially excluded. MFIs can enhance outreach through DFS structures such as agency
banking and mobile money platforms. This has proven to deliver results and increase competitive
advantage of FSPs. However, significant capacity building needs to be done for FSPs to move to this
level. CRS can study how Vision Fund has introduced DFS in its operations and share lessons with
other selected FSPs.
h. Contextual Approach: Finally, while limitations, challenges, and capacity gaps of each FSPs varies
from one to another, it is important to understand/ identify the specific limitation/ gaps of selected
individual FSPs prior to linking LGs to FSPs to better manage the implementation of the capacity
building interventions.

26
Annexes
Annex 1: DETAILED RESULTS FOR ORGANIZATIONAL CAPACITY ASSESSMENT
SECTION 1: Microfinance Institutions
a. MFI Head Office
Management and Organizational Structure
In terms of the management and organizational structure, the senior management of all MFIs have
experience in the industry:
• All MFIs have key management staff assigned to each structure
• All MFIs assessed have working experience with NGOs and GOs
• All MFIs explained that they had good experience in their previous engagement with
NGOs/GOs, (management integrity)
Outreach and Operation
Outreach
In reference to outreach, MFIs (Dire, Meklit, Metemamen, and OCSSCO) have options to provide all
the services (loan disbursement and repayment, savings collection and withdrawal) at satellite offices or
kebeles. Other MFIs (e.g. Gasha and Vision Fund) only provide part of the services at field level.
The number of borrowers for MFI products ranged from 4,000 to 1million. OCSSCO and Vision Fund
are the largest FSPs in terms of outreach and coverage. The rest have very small number of borrowers.
Similarly, loan portfolio ranges from 45m to 8 billion. OCSSCO is the largest portfolio owner followed
by Vision Fund. Furthermore, the average loan portfolio of MFIs is 10,500 birr.
Outreach and Financial Performance of MFIs
MFI
Number of
borrowers Saving balance
Total outstanding
loan
Average loan portfolio
balance
Dire 10,491 240,184,867 255,338,085 24,339
Gasha 4,100 28,000,000 45,000,000 10,976
Meklit 20,000 42,000 110,000,000 5,500
Metemamen MFI 21,037 103,000,000 188,000,000 8,937
OCSSCO 1,096,815 4,261,562,034 8,325,767,911 7,591
Vision fund 165,000 476,918,000 1,030,000,000 6,242
The assessment also revealed the following indicators:
• All MFIs have more savers than borrowers;
• As indicated in the above table, all MFIs are licensed to mobilize savings;

27
• Vision Fund has additional services that focus on women empowerment, integrated approaches
such as adult literacy and health programs; and loan services to the youth. Other MFIs also have
services that focus on women and youth;
• All MFIs have commitment to the pro-poor approach.
Operations
It was found that all MFIs have been operational for more than five years. They also follow the Know
Your Customer (KYC) procedures and requirements, in which the KYC documentations and process
of credit officer works are crosschecked by second person (branch manager/supervisor). Range of
products and services offered by most MFIs are: on-farm, off-farm, MSE loans, saving, credit life
insurance. On top of this, OCSSCO and Dire MFIs have Sharia-compliant loan products.
With the exceptions of Dire and Gasha MFIs, all have experience of working with saving groups (VSLA,
SILC, SHG). Additionally, all MFIs have similar lending methodologies that apply solidarity group and
individual lending. All MFIs also use group collateral to lend to groups, however in some cases they also
require personal guarantor for loans above given limits. Interest rate of the assessed MFIs ranges from
8-24%. MFIs charging 8% are focused on Youth Revolving Fund. Average lending rate of the assessed
MFIs is 18.5%. In most cases agricultural loans have higher interest rates.
The assessment further found that MFIs have some additional charges, such as application fees that
ranges from 2 - 3%, credit life insurance ranging from 1 - 2.5% charged on approved loan amounts. All
MFIs have different terms for loans (short, medium and long-term) ranging from 3 months to 5 years.
Most rural agricultural loans are provided for one year or less. They have both balloon (one time
repayment) loans and installment loan options. MFI’s loan sizes also vary. Specifically, there are
different options for loan sizes. As small as 500 birr to as high as 3 million birr. First cycle loans on
average range from 4,000 to 10,000 birr. As it can be seen from branch responses, majority of the MFI
branches first cycle loan is less than 6,000 birr. All MFIs have responded that they have systems and
policies to manage their day to day portfolio activities and associated risks. In cases of default the MFI
have closer follow up procedures for portfolio management. Source of financing for loan portfolio of all
MFIs assessed is savings mobilized (deposits). Further, except for Dire and Meklit, other MFIs uses
commercial sources to finance their operation. However, liquidity is an issue to finance their operation
(loan). As per the response from MFIs, except for OCSSCO, Vision Fund and Dire MFIs, the other
MFIs’ bases on their disbursement plan to address loan requests from clients. Apart from Vision Fund
which has a fully computerized MIS system, all MFIs use manual MIS system. However, there is some
initial work, in these MFIs to adopt fully computerized MIS systems. E.g. OCSSCO in Boset,
Metemamen in Sire, Meklit in Dodota. In addition, Metemamen MFI has an MIS system that works loan
performing system. Except Meklit MFI, all MFIs have associated non-financial services, like financial
education, group management, bookkeeping, and Business Development Services.

28
Human resource
With regards to staff productivity, all MFI staff; and savings and credit officers are found productive as
measured by clients to loan officers ratios. Loan clients per staff and Loan Clients per Savings and Credit
officer is >138 and >262 respectively which is within the standard.
It was found that MFIs send their staff often to external trainings and they also provide internal trainings
to their staff. The MFIs have low staff turnover of <12% and they have also performance related incentive
mechanism for staff and it is said that it is practically implemented by the MFIs for human resource
management purpose.
Branch facilities
Concerning facilities, all MFIs except Metemamen have adequate office furniture and equipment at the
Head office. All MFIs have adequate motorbikes for staff. The staff of Meklit, Metemamen and Vision
Fund use on average one motorbike for two staff while the other MFIs have one motorbike per loan
officer.
Signs of growth
All MFIs assessed had positive net income and the financial self-sufficiency ranged from 80% - 100%. In
addition, the MFIs were operationally self-sufficient with an operational self-sufficiency of >100%. The
Return of Asset value also indicates that all MFIs are in a good performance as measured by the industry
standard (>3%...reference). However, the Operational Efficiency Ratio for all MFIs assessed is within the
range of 20-30% which is below the preferred industry standard (<20%...reference).
Concerning portfolio growth rate, the average portfolio growth rate for all MFIs is 30% in between 2009
and 2010 EC while Vision Fund and Meklit MFIs grown by 47% and 36%, respectively. All MFIs have also
growth targets (plan), in-terms of client outreach and portfolio.
Three MFIs had a loan repayment rate of above 95%, whereas two MFI indicated that the rate is less
than 95%. Except one MFI, all MFIs were within acceptable rates in terms of Portfolio at Risk (PAR) ratio
as measured by 30 days (less than 5%) and majority of the MFIs’ asset is allocated for loan. Except two
MFIs, Gasha and OCSSCO, the rest all MFIs allocated more than 80% of their asset for loan portfolio).
Experience in financial inclusion
Regarding working with marginalized communities, majority of the MFIs assessed have Social
performance management (SPM) in place and replied that they are willing to initiate and implement SPM.
However, they had no experience in providing loans and loan products to RuSACCOs and RuSACCO
Unions and only Metemamen and OCSSCO had experience working with the implementing partners of
the projects (MCS and HCS).
Concerning loan guarantee fund (LGF) utilization, Metemamen, Vision Fund, OCSSCO and Meklit
(except Gasha and Dire MFI) had experience of LGF utilization with different organizations. See appendix
on page …for results on loan guarantee fund

29
b. MFI Branch Office
Outreach
Number of branches assessed
22 branch offices of the six MFIs are assessed, those are operational in the Activities area
MFI # of branches assessed Total
HCS woredas MCS woredas
1 Meklit 2 2
2 OCSSCO 3 9 12
3 Vision Fund 1 1
4 Dire 1 1
5 Metemamen 5 5
6 Gasha 1 1
Total 4 18 22
MFI Branch Office presence
As it is shown in the table below, OCSSCO has branch offices in all the assessed woredas except at
Dire Dawa. Except Sire and Boset woredas, the rest have two or less MFI branch offices.
MCS HCS
1 2 3 4 5 6 7 8 9 10 11 12 13 14
Sirar
o
Shall
a
A/Nege
le
Hebe
n
Arsi
ATJ
K
Zew
ay
Dugd
a
Dodo
ta
Sir
e
Bos
et
Dire
Daw
a
Ded
er
Mide
ga
tola
Babil
e
Mel
ka
belo
OCSSCO X X X X X X X X X X X X
Metemam
en
X X X X X
Meklit X X
Vision
Fund
X
Gasha X
Dire X
Total # of
branches
1 2 2 1 2 2 2 3 3 1 1 1 1 0
Coverage
OCSSCO branches cover majority of the woreda kebeles. Nine branches of OCSSCO cover about
75% of the kebeles in the woreda they operate.
% of kebeles covered
75% 50-75% 25-50% <25% Total # of branches

30
OCSSCO
branches
9 1 1 1 12
Metemamen 1 3 1 5
Meklit 1 1 2
Vision Fund 1 1
Gasha 1 1
Dire 1 1
22
Coverage in-terms of number of borrowers as percentage of total population of the woredas is very
small. Most branch offices of the MFIs cover only less than 1% of the total population of the woreda.
Proximity
Majority of MFIs branch offices (55%) are found at a distance of 15-30 km from the target kebeles and
32% of the branch offices are far by more than 30 km from the target beneficiaries.
Proximity of microfinance services
(How far is the average distance of branch office from the
target client?)
# of branches
%
>30 KM 7 32%
15-30km 12 55%
<15km 3 14%
Total 22
Services delivery at kebele sites
Out of the assessed MFIs, only Metemamen MFI (at Shall and Zeway Dugda), and OCSSCO (at Boset,
Babile and Deder branch offices) have satellite offices where they disburse loan, and collect
repayments, savings collection and withdrawals take place. While some other MFI branch offices
provide partial services at sites.
Digital financial services
OCSSCO, Vision Fund and Gasha MFIs were the only FSPs that had started offering Digital Financial
Services (DFS) such as mobile money, agency banking and mobile banking.
PSNP coverage of branch offices
PSNP kebeles coverage of branch offices. Most of the OCSSCO branches cover, majority of the PSNP
kebeles.
75% 50-75% 25-50% <25% Total # of branches
OCSSCO
branches
7 3 2 12
Metemamen 1 4
5
Meklit 1 1 2
Vision Fund 1 1
Gasha 1 1
Dire
1 1
22

31
Geographic distribution of loan clients of the branch
Majority of the MFIs branch offices have presence at remote rural areas. 16 out of 22 branches (73%)
have remote rural operation.
Number of active borrowers: Ranges from 379 to 3371. New branches of Metemamen MFI do not
have clients yet.
<500 500-1000 1000-2000 >2000
# of Branches 7 4 4 7 22
Branch offices of OCSCCO
have wider outreach in
terms of number of loan
client
Loan portfolio: Ranges from 2.4 to 33.5 million birr. New branches of Metemamen MFI do not have
portfolio
<2.5m 2.5-5m 5-10m 10-20m >20m
# of branches 2 2 6 7 5 23
OCSSCO branches have
wider outreach in terms
of portfolio
Average portfolio balance per borrower ranges from 1,915 to 40,000 birr.
Number of savers
Majority of the branches (18) have savers more than the number of borrowers. And Saving balance
ranges from 25,000 to 22 million birr, with average saving per branch 3.8 million birr. To be checked
for OCSSCO ATJK data
Targeting the poorest-refer above ‘c’ coverage
As their respective MFI strategy, majority of the branches have focus in serving women (proportion of
women > 50%). Some MFIs have women specific products: Vision Fund, OCCSCO, Meklit MFIs. Except
Meklit MFI which has youth specific saving, product, other MFIs do not have either loan or saving
product specific to youth.
Human resources
As per the response of branch offices, almost all branch offices of the MFIs have adequate staff
assigned. In terms of branch staff productivity, except some branches (3), is good as measured by
clients per staff and per savings and credit officer. Branch staffs have microfinance experiences that
enable them to manage the day to day activity. Majority of the branches are trained with internal
resources, while about some branch offices reported that they have participated external trainings
32
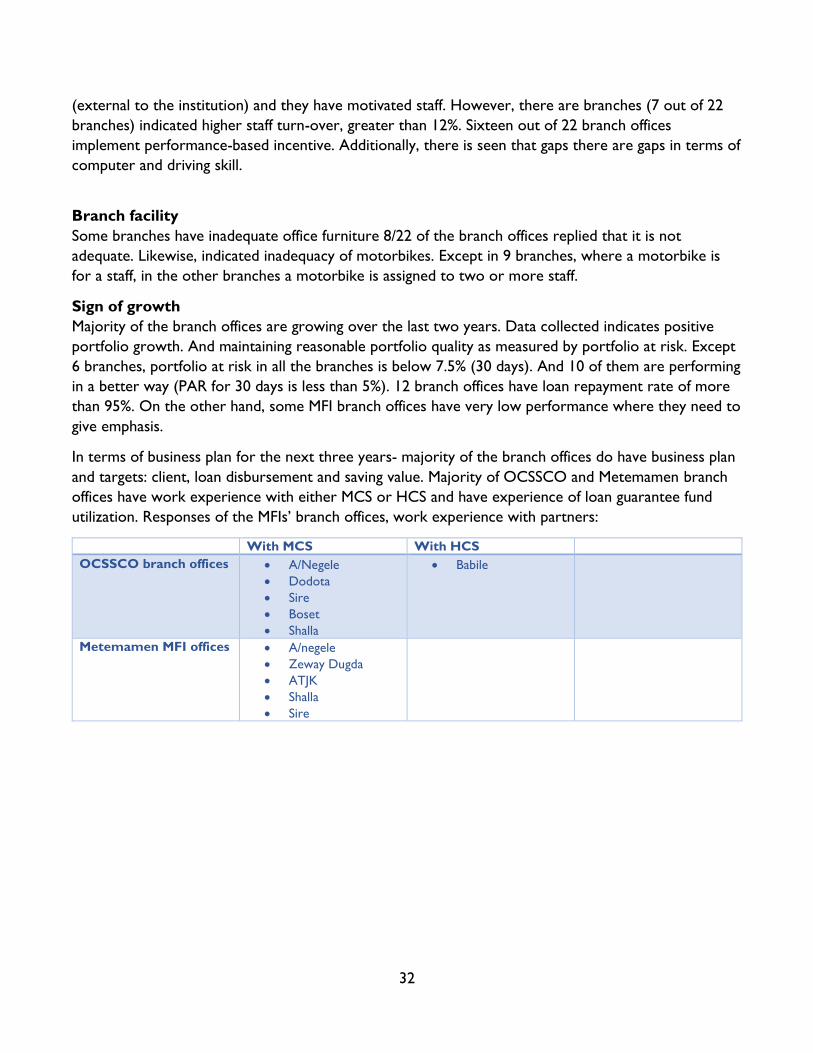
(external to the institution) and they have motivated staff. However, there are branches (7 out of 22
branches) indicated higher staff turn-over, greater than 12%. Sixteen out of 22 branch offices
implement performance-based incentive. Additionally, there is seen that gaps there are gaps in terms of
computer and driving skill.
Branch facility
Some branches have inadequate office furniture 8/22 of the branch offices replied that it is not
adequate. Likewise, indicated inadequacy of motorbikes. Except in 9 branches, where a motorbike is
for a staff, in the other branches a motorbike is assigned to two or more staff.
Sign of growth
Majority of the branch offices are growing over the last two years. Data collected indicates positive
portfolio growth. And maintaining reasonable portfolio quality as measured by portfolio at risk. Except
6 branches, portfolio at risk in all the branches is below 7.5% (30 days). And 10 of them are performing
in a better way (PAR for 30 days is less than 5%). 12 branch offices have loan repayment rate of more
than 95%. On the other hand, some MFI branch offices have very low performance where they need to
give emphasis.
In terms of business plan for the next three years- majority of the branch offices do have business plan
and targets: client, loan disbursement and saving value. Majority of OCSSCO and Metemamen branch
offices have work experience with either MCS or HCS and have experience of loan guarantee fund
utilization. Responses of the MFIs’ branch offices, work experience with partners:
With MCS With HCS
OCSSCO branch offices • A/Negele
• Dodota
• Sire
• Boset
• Shalla
• Babile
Metemamen MFI offices • A/negele
• Zeway Dugda
• ATJK
• Shalla
• Sire

33
SECTION 2: RUSACCOs and RUSACCO Unions
a. SACCO Unions
Five SACCO unions which are operating in the Activities operation areas of MCS and HCS were
considered in the assessment: Duro Shala in West Arsi Zone, Biftu Batu and Awash Unions from East
Shewa Zone, Kalata union from Arsi Zone , and Burka Gudina of Babile woreda. Of these, Duro Shall
and Awash unions have the highest membership.
MCS HCS
Unio
n
Nam
e
Year
establish
ed
LRO/DFSA
Woreda
covers
# of
RuSACC
Os
# of
Membe
rs
Union
Name
DFSA
Wored
a
covers
Year
establish
ed
3 of
RuSACC
Os
# of
Membe
rs
Biftu
Batu
2008 • ATJK 30 5779
(F=566
7)
Burka
Gudin
a
Babile 2014 19 2790
(F=276
1)
Duro
Shall
a
2009 • A/Nege
le
• Shalla
• Siraro
• Heben
Arsi
150 13523
(F=875
8)
Kalat
a
2005 • Sire
• Dodota
26 6206
(F=412
5)
Awas
h
2005 • Boset 108 12225
(F=622
0)
Organizational Knowledge, Management and Leadership
Leadership of the unions have vision, mission and operational plan with some (Burka Gudina and Biftu
Batu unions) lacking strategic plan. Except the two unions, all unions have accountants to maintain
financial recordings, maintaining appropriate financial recordings and audited during the last three years.
Membership
The analysis result showed that the number of RuSACCOs and kebeles served per union ranges from
30 to150. Whereas Duro Shalla and Awash unions have the highest number 150 and 108 respectively.
The total number of members of the unions ranges from 2,790 to 13,523 where the highest is in Duro
Shalla. Almost all unions give priority for women membership and the membership is increasing over
the last three years. They also serving RuSACCOs with PSNP beneficiaries. Majority of the leadership
members of the unions can read and write.
34
Financial service performance (saving, borrowing, lending, loan and saving features)
Saving
The unions have different level of saving balance that ranges from 921,000 to 22 million birr.
Cooperative bank of Oromia and Commercial bank of Ethiopia are their partners to deposit unions’
savings. As per the assessment result the unions have worked on awareness creation activities to
mobilize savings. The average saving per RuSACCO deposited at unions ranges from 5,000 to 50,000
birr.
Borrowing
Internal saving is the source of loanable fund for all the unions to lend for their member RuSACCOs.
On top of this, since the amount from internal saving may not satisfy members’ request, unions also
borrowed from external sources (Development Bank of Ethiopia and Cooperative Bank of Oromia).
Physical collateral is not required, except support letter from government to access loan from external
sources. Amount of loan a union can access is also linked with the amount of saving the union deposits
in the lender account and required to submit business plan. Currently, except Duro Shalla and Burka
Gudina unions have outstanding loan from the institutions, borrowed within the range of interest rate
from 6 to 16.5% on declining basis and paying loans on time except one of the unions. To date, no
union has accessed loan from Microfinance Institutions.
Lending and loan features
Except Kalata union, the rest were not able to provide loan to their RuSACCOs in the last three years.
Lack of loanable fund and delayed repayment from RuSACCOs were the reasons mentioned by the
respondents. The amount of loan disbursed in the fiscal year 2010 EC by the unions, ranges from
76,000 to 49 million for 2 to 70-member RuSACCOs. And major proportion of these disbursement is
outstanding. Member RuSACCOs are repaying their loan, except few.
Fattening, agricultural input purchase, small ruminant rearing (goat and sheep, and petty trade) are the
major activities that loans are provided for. Except Awash union, the rest of the unions require 6
months saving for a new RuSACCO to access loan. However, Awash union requires only 3 months.
Unions are providing to a RuSACCO, on average, 26,000 to 6 million and for 6-36 months and
charging interest rate within the range of 7.55 to 15%. Unions provide some kind of support to their
community. For instance, Kalata, DuoShalla and Awash support children on school fees
Physical and financial structure and staffing
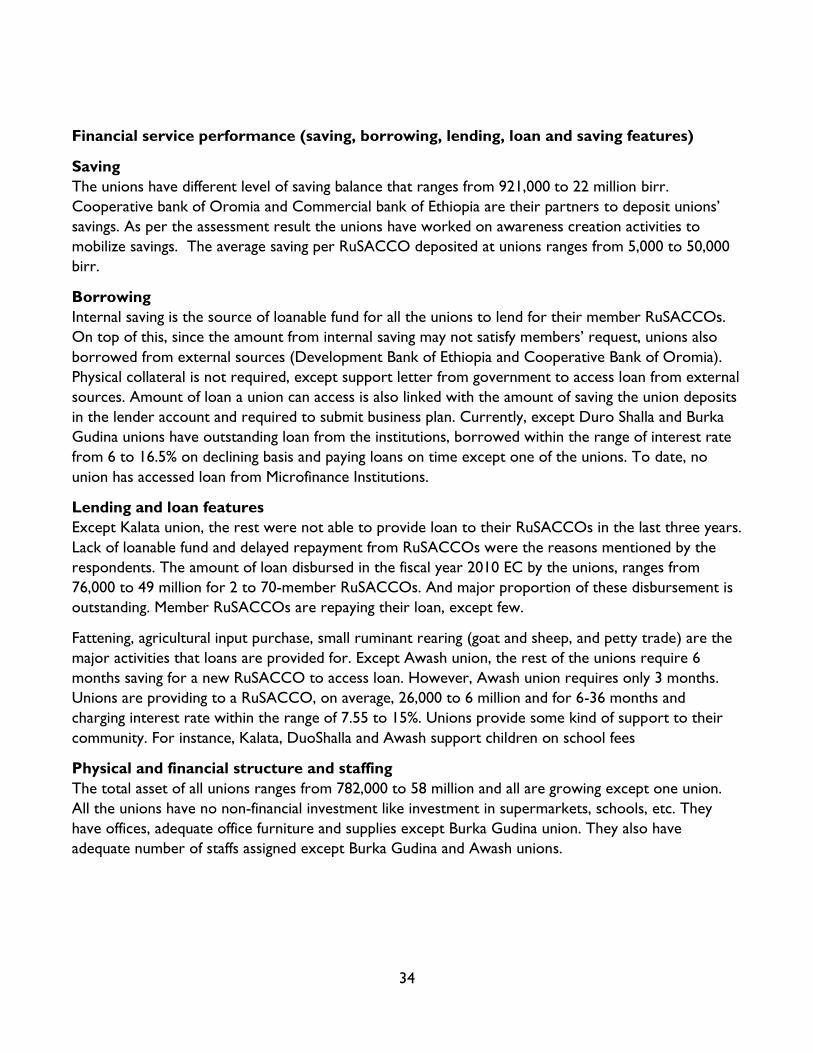
The total asset of all unions ranges from 782,000 to 58 million and all are growing except one union.
All the unions have no non-financial investment like investment in supermarkets, schools, etc. They
have offices, adequate office furniture and supplies except Burka Gudina union. They also have
adequate number of staffs assigned except Burka Gudina and Awash unions.

35
Stakeholders support
Government is supporting these unions through auditing services and trainings (financial
management/education, microinsurance, record keeping, credit product development, loan
management/repayment and member mobilization). Currently, the unions and their member
RuSACCOs are accessing capacity building supports from government, except Biftu Batu. In addition,
they were benefitted from the HABP program and MCS. They supported the unions through
organizing training on financial education, software and material support (motorbike, seed money,
office supplies).
b. RuSACCOs
Overall, 67 RuSACCOs: 35 in MCS and 32 in HCS areas, were included in the assessment.
HCS MCS
Wo
red
a n
am
e
Melk
a
Belo
Deder
Mid
ega
Tola
Dir
edaw
a Bab
ile
Shal
la
Zew
ay
Dugd
a
AT
JK
Sira
ro
Heben
Ars
i
A/N
ege
le
Bo
set
Sire
Dodota
# of
RuSACCC
Os assessed
6 7 5 8 6 5 6 8 6 1 3 1 3 2
Age range 9-6 26-2 9-1 2-1 11-9 8-3 13-8 14 - 5 11- 4 6 9-6 10 14- 4 9
Total
members
3184 1384 368 20
41
887 743 546 895 1053 63 310 18
5
676 913
Membershi
p ranges
319 -
653
136 -
260
20-73 11
7 -
56
3
102 -
185
67-
231
59 -
151
46 -
307
44 -
264
63 91-
110
18
5
110-
421
91-
822
% of
Women
41 30 58 56 99 74 74 100 71 97 68 54 65 94
%PSNP
members
53 91 38 38 33 41 5 27 43 3 80 11 31 1
% Youth 24 14 25 19 21 20 6 7 11 20 35 11 8 1
Organizational Knowledge, Management and Leadership
Leadership of almost all (97%) of assessed RuSACCOs understand their vision. mission and goals of
RuSACCOs. They have also adequate number of committee and each RuSACCOs has its own by-law
that is respected by majority of its members. About half (48%) of the RuSACCOs’ do not have
strategic plan while 80% of the RuSACCCOs assessed have operational plan. One of the main reasons
mentioned by the respondents is lack of capacity. They also have bookkeeper, maintain proper
recording, and audited in the last two years. However, it was observed that some bookkeepers have
limited capacity in managing records. Secretary or a committee member keeps records in those
RuSACCOs that do not have bookkeeper. Some RuSACCOs reported that half of their members are
literate, while few members of the majority RuSACCOs can read and write.
Membership

36
Overall, 67 RuSACCOs: 35 in MCS and 32 in HCS areas, were included in the assessment. A total of
18,158 community members were organized under the RuSACCOs as at July 2010 Ethiopian Calendar
(EC) with average membership ranging from 63 to 531 per RuSACCO.
All RuSACCOs have members who are PSNP beneficiaries. Majority of them have youth as
membership and allows two or more members from a household to participate. In some RuSACCOs,
in Arsi Negele, Midega Tola and Melka Belo, youth constitutes 24 - 35% of the membership. There are
RuSACCOs where female constitutes 100%, and most of them have more than 70% of the total
members are female. As per the assessment result most of RuSACCOs showed that their
membership had increased during the last two years. while among those RuSACCOs reported
decreasing trend (20), dropout is significant in 11 RuSACCOs).
Financial service performance (saving, borrowing, lending, loan and saving features)
HCS MCS
Woreda
Name Melk
a
Belo
Deder
Mid
ega
Tola
Dir
eda
wa
Bab
ile
Shal
la
Zew
ay
Dugd
a
AT
JK
Sira
ro
Heben
Ars
i
A/N
ege
l
e
Bo
set
Sire
Dodota
Average
saving
64,4
62.0
0
29,6
25.0
0
90,0
00.0
0
36,3
66.0
0
84,6
43.0
0
106,1
54.0
0
152,2
79.0
0
104,0
00.0
0
153,0
00.0
0
65,1
64.0
0
154,0
00.0
0
201,0
00.0
0
198,7
00.0
0
358,7
00.0
0
Average
RuSACCOS
debt
(Borrowing) 0
0
0
0
41,0
00
168,7
16
0
243,0
00
65,5
00
0
80,0
00
0
519,1
22
353,0
00
Average
Outstanding
loan
(Lending) 615,9
33
36,6
67
99,1
60
9000
781,0
00
172,0
00
177,5
22
155,0
00
72,1
73
33,0
00
76,0
00
155,6
00
509,0
00
1,8
23,4
08
Interest rate
on lending
(Range)
10%
10%
5-1
0%
6-2
0%
7.5
11-1
8%
8-1
0%
10-1
8%
10-2
5%
15%
10-1
5%
12%
15%
16%
Number of
RuSACCOs
with loan
6 5 5 2 1 6 6 6 3 1 3 1 3 2
Members
with
outstanding
loan
903 170 75 15 317 188 307 823 302 50 124 60 626 744
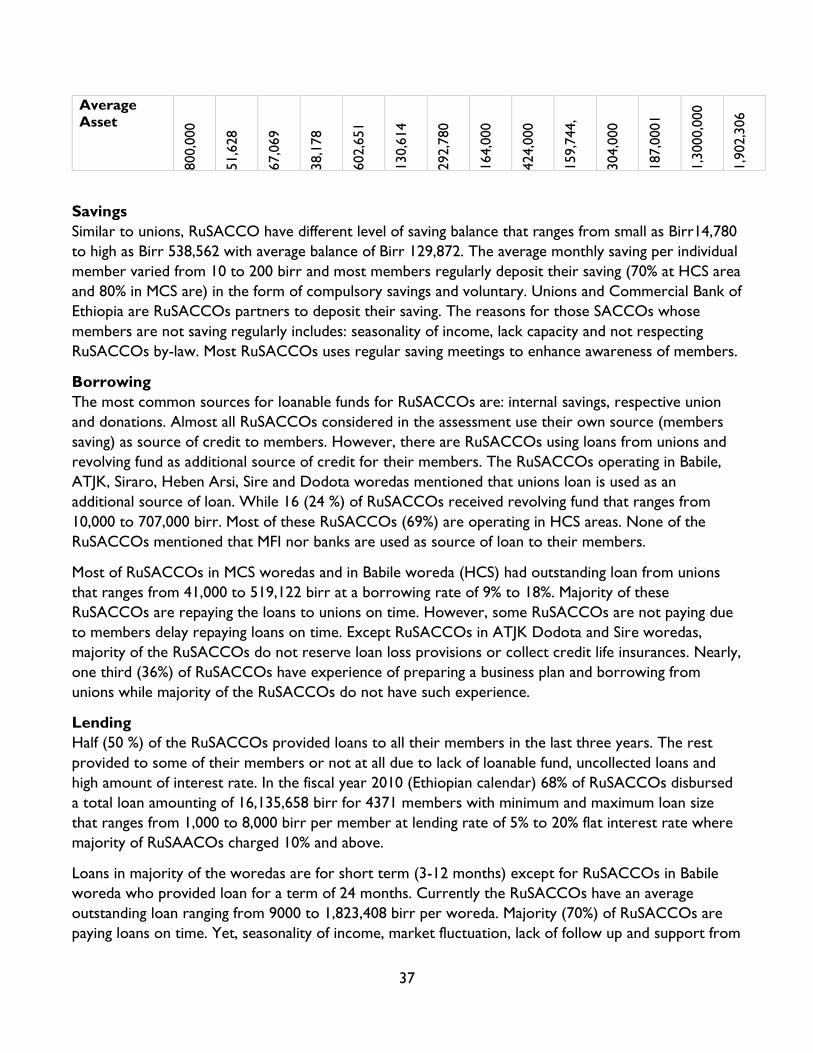
37
Average
Asset
800,0
00
51,6
28
67,0
69
38,1
78
602,6
51
130,6
14
292,7
80
164,0
00
424,0
00
159,7
44,
304,0
00
187,0
001
1,3
000,0
00
1,9
02,3
06
Savings
Similar to unions, RuSACCO have different level of saving balance that ranges from small as Birr14,780
to high as Birr 538,562 with average balance of Birr 129,872. The average monthly saving per individual
member varied from 10 to 200 birr and most members regularly deposit their saving (70% at HCS area
and 80% in MCS are) in the form of compulsory savings and voluntary. Unions and Commercial Bank of
Ethiopia are RuSACCOs partners to deposit their saving. The reasons for those SACCOs whose
members are not saving regularly includes: seasonality of income, lack capacity and not respecting
RuSACCOs by-law. Most RuSACCOs uses regular saving meetings to enhance awareness of members.
Borrowing
The most common sources for loanable funds for RuSACCOs are: internal savings, respective union
and donations. Almost all RuSACCOs considered in the assessment use their own source (members
saving) as source of credit to members. However, there are RuSACCOs using loans from unions and
revolving fund as additional source of credit for their members. The RuSACCOs operating in Babile,
ATJK, Siraro, Heben Arsi, Sire and Dodota woredas mentioned that unions loan is used as an
additional source of loan. While 16 (24 %) of RuSACCOs received revolving fund that ranges from
10,000 to 707,000 birr. Most of these RuSACCOs (69%) are operating in HCS areas. None of the
RuSACCOs mentioned that MFI nor banks are used as source of loan to their members.
Most of RuSACCOs in MCS woredas and in Babile woreda (HCS) had outstanding loan from unions
that ranges from 41,000 to 519,122 birr at a borrowing rate of 9% to 18%. Majority of these
RuSACCOs are repaying the loans to unions on time. However, some RuSACCOs are not paying due
to members delay repaying loans on time. Except RuSACCOs in ATJK Dodota and Sire woredas,
majority of the RuSACCOs do not reserve loan loss provisions or collect credit life insurances. Nearly,
one third (36%) of RuSACCOs have experience of preparing a business plan and borrowing from
unions while majority of the RuSACCOs do not have such experience.
Lending
Half (50 %) of the RuSACCOs provided loans to all their members in the last three years. The rest
provided to some of their members or not at all due to lack of loanable fund, uncollected loans and
high amount of interest rate. In the fiscal year 2010 (Ethiopian calendar) 68% of RuSACCOs disbursed
a total loan amounting of 16,135,658 birr for 4371 members with minimum and maximum loan size
that ranges from 1,000 to 8,000 birr per member at lending rate of 5% to 20% flat interest rate where
majority of RuSAACOs charged 10% and above.
Loans in majority of the woredas are for short term (3-12 months) except for RuSACCOs in Babile
woreda who provided loan for a term of 24 months. Currently the RuSACCOs have an average
outstanding loan ranging from 9000 to 1,823,408 birr per woreda. Majority (70%) of RuSACCOs are
paying loans on time. Yet, seasonality of income, market fluctuation, lack of follow up and support from

38
local (kebele) administration and lack of members commitment to repay loans are the major factor for
members defaulted loans.
RuSACCO members uses loan to engage on off-farm and on-farm activities: Animal fattening, purchase
of agricultural inputs, petty trading, grain trading, small ruminants rearing and poultry. Majorities of
RuSACCOs required members to submit a business plan to get loan. Group guarantee was required
beyond the saving amount and there was no credit life insurance paid for loans except for RuSACCOs
in Sire and Dodota woedas. RuSACCOs do not have interest-free loan and saving products, except
few RuSACCOs in Diredawa, Midega Tola, Shalla and Zeway Dugada woredas and there are requests
in few kebeles for the same product
Shortage of loanable fund is the major limiting factor for all RuSACCOs. Hence, RuSACCOs are
planning to increase internal savings and looking for external finances to address members loan
demand. Significant proportion (94 %) of RuSACCOs required a new member to save for 6 months to
access to loan. The rest required 3 and 12-month savings and can access 2-4 folds of their saving. None
of the RuSACCOS are currently providing community support.
Liquidity Issues for RuSACCOs arise from: infrequent savings by members, poor repayment of loans,
shortage of loan fund, weak resource mobilization capacity.
Physical, financial structure and staffing
Assets possession of RuSACCOs include income from different sources such as share, savings,
revolving funds and other incomes. Average assets per woreda ranges from 38,178 to 1.9 million. Some
of the RuSACCOs have significant asset balance (more than half a million) where sizable part of it
constituted from loan and revolving grant funds. The smallest asset holding RuSACCOs are operating
in HCS area (Dire Dawa) while the largest asset holding RuSACCOs are operating in MCS area (Sire
and Dodota woredas). A share costs between 50-200 birr and the total asset has been increasing for
majorities of the SACCOs which indicates positive income (profitable) of the RuSACCOs. None of the
RuSACCOs have investments in non-financial activities
Stakeholders support
Woreda Cooperatives Promotion Office is closely supporting RuSACCOs on record keeping, auditing,
technical trainings, provision of inputs for office construction and support on loan repayment activities
Local administration (kebele) supported RuSACCOs through provision of land for office construction,
community mobilization and support on loan repayments. Moreover, some of RuSACCOs received
trainings, technical support, material and financial support from different organizations such as MCS,
ATA in the last five years.
Capacity and work experience with different organizations/NGOs
Except some committees and Bookkeepers of some RuSACCOs, majorities of the RuSACCOs
management reported that they did not receive any type of training.
Trainings need mentioned by the RuSACCOs are principles of cooperatives, loan management,
product development and marketing, promotion skills, cooperative management and leadership,

39
business skill, credit risk management auditing and preparing balance sheet statement are areas of
training recommended by RuSACCOs.
Apart from financial service, none of the RuSACCOs provided non-financial services to its members.
Some of the RuSACCOs operating in MCS areas have prior work experience with different NGOs
(Catholic, MCS, OSHO, child fund, Rift Valley Women and Children Development, Self Help Africa)
Physical Infrastructure and Support received
Most RuSACCOs have office space but most are old and inadequate. So far, some RuSACCOs have
reported that they received physical office equipment and stationary, technical support in form of
trainings and land to construct office from Kebele leaders

40
Annex 2: CRS Ethiopia Financial Linkages Guidelines
Introduction
CRS Ethiopia is integrating financial services interventions in its Development Food Security
Activity (DFSA) and Livelihoods Resilience of Oromia (LRO) projects. Financial Services in the
context of these projects means opening up new savings and internal lending communities (SILCs),
layering activities on existing savings groups (SILCs, Village Savings and Loan Associations – VSLAs,
or Village Economic and Social Associations – VESAs), financial education training, and linkages to
financial services providers for value-chain financing or other products and services that benefit
project participants. In the context of the country program, there is Cash Transfers programming
that is taking place within the Joint Emergency Operation Plan (JEOP) project that uses mobile
money platforms hosted by financial services partners that are in some cases working with
development programs (DFSA and LRO).
These guidelines provide the process map, the tools and work plan that prepares project teams in
crafting strategies for successful linkages and collaboration among projects and partners with
beneficiary interests in mind.
The Linkages Process
LITERATUE REVIEW
The following literature was reviewed to provide the background and framework for conducting in-
house capacity assessment of financial services providers in the project area:
1. Capacity Gap Assessment and Mapping of Financial Institutions under Food Security Program –
Household Asset Building Program (HABP) Areas. Ministry of Trade – Federal Cooperative
Agency, 2012.
Literature Review for contextual issues and Make decision to link or not to
link. If insufficient information, conduct own
assessment
Development of framework and tools
Meet-Up with CRS technical teams and partners to review
tools
Data Collection (Pilot testing of
Tools and Roll Out)
Data Analysis and Report Writing
41
2. CRS Tanzania Soya Ni Pesa Financial Linkages Guidelines
3. A Practitioner’s Guide to Facilitate Linkage between Village Savings and Loans Associations and
Financial Institutions. Access Africa Technical Document Series. CARE ACCESS AFRICA.
The literature review is not exhaustive2 but sets the ground for understanding best practices and past
experiences in financial linkages. Most of the organizational capacity assessments are conducted in
order to identify capacity gaps of FSP and strengthen them in preparation to expand their outreach in
areas where their sponsors are interesting to serve. CARE International has done substantial work in
linking VSLAs to financial institutions in its ACCESS AFRICA program. CRS has done significant work
in linking SILC groups to financial services providers in most of its country programs. However, CRS is
yet to develop agency guidelines to provide operational and technical direction to country programs
and partners in steering successful linkages between its microfinance programs and financial services
providers. This therefore is the first step towards shaping up guidelines for financial linkages for
country programs and benefits from literature in the industry on the same subject.
LINKAGE PREPARENESS SAVINGS GROUP ASSESSMENT FRAMEWORK
Group and Member Level Information
As part of debt management, it is important for CRS microfinance staff to understand the group and its
membership in regard to areas that are relevant for successful linkages. This will ensure project staff
done initiate linkages that lead to members of groups getting into debt that depletes their savings and
reduces their resilience to shocks. There are many different aspects to understand both groups and
members. It is helpful to distinguish these categories by how the data will be used. The following are
four categories for grouping savings groups and member data to understand potential impact of
linkages:
1. Group Architecture
2. Financial Performance of Groups (and support organizations)
3. Outreach Data on Groups
4. Social Performance (Group or Member Level)
The following chart shows more detail about the differences between the categories as well as how
the data is typically used.
Category of Data Examples of data observed Typical use of data
Group Architecture
Group norms (constitution);
group composition (gender,
age etc.); nature of
distribution
Can be helpful market research to
design services/products or improve
upon savings groups
2 Agencies supporting DFSAs have done some studies on financial linkages and so it is important to consider such studies in your literature review. Other critical documents are reports from Value Chain Finance Assessments.

42
Financial performance of
groups
Return on assets at group
level; % of members with
loans outstanding; loan
losses, average loan amounts
and any relevant information
from SAVIX)
Support groups in making informed
decisions; understand factors that affect
quality and survival of groups, make
CRS make informed decision on linkage-
readiness.
Outreach
Number of members
reached; number of groups
reached; socio-economic
profile of members (gender,
age, economic activities)
Determine the nature of group
outreach and whether funds have been
well-used against alternatives;
understand if the area provides critical
mass for MFI operations
Social Performance
Understanding the group’s
vision, mission or the reason
they exist. Any special focus
on youth, disabled persons
etc.
Important to understand the foundation
of the group, the reason it exists and if
members appreciate that the group is a
vehicle to help them reach their
personal goals.
a. Group Architecture
The following are some useful questions to ask to help you understand the group structure and
how it operates as a financial or investment vehicle:
a) Indigenous Groups. How does the current group structure and methodology compare to the
traditional microfinance model of group behavior/expectations where no external influences
are involved? What anticipated changes will occur before and after being linked?
b) Group composition. Who are the members? Are they homogenous or heterogeneous? How
many are in the group, on average? How do the members determine who gets in? What
happens in the event that a member wants to leave the group early? Focus on the
constitution and how this can adapt member exit in the context of external relationships.
c) Role of Group and Use of Funds. What is the main purpose of the group? What are they
trying to achieve? How have they used their profits the last few times? How is profit
distribution handled? Group’s vision and Personal Objectives.
d) Cold/Hot Money. What are the various sources of funds? In %? What % of sources of funds
are external, if any? What % of this money is subsidy? What % is external capital? What are
the obligations and requirements of external money? Can the group handle these
relationships? Can the group handle additional relationships? What are the various uses of
external funds and how is this distributed within the groups?
e) Group governance. Is there a leader or a leadership team? What are their roles? How are
they chosen? Is there rotation? How is transparency and accountability ensured? How does
a general member know the situation of the finances?

43
f) Group norms. Is there a formal constitution (oral or written)? What are the rules for entry,
savings payments, loan distribution, late payment, profit distribution? (if any?) What types of
sanctions or controls does the group use if norms are not followed? Can the constitution
be used as-is in the context of external linkages?
g) Group recordkeeping. Is it a written or an oral bookkeeping system? How do they keep track?
How does the group know that it is doing well or not? How does the group ensure
transparency and accountability of transactions for illiterate/innumerate members and how
is this likely to change in the context of linkages to external financial services provider?
h) External Relationships. What types of external (non-financial) relationship does the group
have? To what extent is there an exit strategy for the external bodies? How does the group
value the external relationship?
b. Outreach
Outreach relates to the number of members benefiting from the services by which the groups
were formed. It may also relate to which members are being reached and which are not especially
in the context of mixed groups – in terms of gender/age/target beneficiary.
There are six aspects to consider when talking about outreach: cost; length; breadth; depth;
scope; worth. All these aspects require member input as part of organizational learning on effects of
linkages.
Below are sample questions:
a. Cost- What are the costs of accessing these financial services for members? Consider both
financial and opportunity costs (transactional). What factors affect cost (e.g. distance, gender,
economic activity etc)?
b. Length- What is the sustainability of this program? Consider both the financial sustainability
and the ability of the program to self-generate through replication. Why are some groups doing
well? Why are some groups having difficulties? Why have some groups dissolved? Is there a
problem with the safety of savings in the groups? How are members using their profits?
c. Breadth- How many members overall is this program reaching? What factors affect breadth?
Why are groups spreading well in some areas and not others? Why are certain types of groups
spreading well?
d. Depth- How far down (poor, gender, rural, other equity considerations) is the program
reaching? What factors affect depth? How can depth be improved in the program? What is the
impact of this program on groups or group members? This seems to be already defined since we
are working with PSNP beneficiaries but what about LRO groups?
e. Scope- How does the range of services provided compare to other products and services
from FSPs? What factors affect scope? Is there a demand for external linkages for larger loans or other services?

44
f. Worth – What is of value to members in terms of particular products and services? For
example, what do members value about savings? Financial and non-financial services? What
types of financial or other literacies do members seek? What factors are important to them in
products? In which types of decisions should members be involved? What are the key
governance challenges facing groups? Are members really able to hold their leaders
accountable? Do members view ownership the same way that staff view ownership?

45
Focus Group Discussions with Members
Institutional capacity assessment highlights the types of data that we might collect on institutions to understand
areas of strength that will serve the goals on the linkage. But it is important to go beyond institutions and focus
on the demand-side as the core business of the agency. The focus is on SILC members and groups. This section
is going to review one of the more common methods used for understanding or communicating with members
to understand their needs so we manage effective linkages.
In order to get feedback from groups and members, field staff go to the communities and talk with the groups.
More traditional forms of market research such as Key Informant Interviews are obviously not practical in this
context.
There are many methods for seeking feedback from groups. Focus groups are an efficient way to meet with
several members (usually between 7 and 10) at once. Depending on the research question(s) being asked, it may
be possible to use existing groups as the focus group.
A focus group is an appropriate method to have an open discussion about a topic. Given that there are different
members with potentially different responses to a question, it is not useful to use a focus group if member-level
information is being sought. Group level information can, however, be explored through focus groups.
Step 1: Find the right question
Usually, the most difficult part of field research is ensuring that you have the right question in the first place.
What is it that you are trying to understand from members? The question should be clear, easy to translate, and
relevant to ongoing operations. Ask yourself how the results and responses to these questions may translate
into operational change and improvements.
The question should be a manageable scope. Too large a question may not be feasible to ask with existing
resources: what is the intra-household impact on savings of every member of the program? Too small a
question may not yield broad enough results to be useful for operations. i.e. what is this group doing with its
profits?
Step 2: Determine which groups/members need to be asked
Once the question is determined, you will need to determine your sampling methodology. It is unlikely that you
will have the time and resources to meet with all members and all groups. Which groups, then, should be met?
The groups should make up a representative sample of all groups in the organization. The key is to determine
which factors of representation matter. Some common factors of representation include: gender composition;
location/how rural they are; age of group; type of agent who formed the group. Once you have decided which
factors matter in your context, based on the number of overall members you can determine your sample size.
You can use this website to get a recommended sample size:
http://www.raosoft.com/samplesize.html
Click to open it in a new window then type in the total number of members as the total population.
For example, if you have 4,000 groups and you type this into the population size, it will give you a sample size of
351 groups that should be interviewed. This gives you a 5% margin of error and a 90% confidence level. Sample
size can be calculated either for groups or members depending on what makes sense for your organization and
research question.
See Annex 3 on focus group discussion

46
AN OVERVIEW OF ORGANIZATIONAL CAPACITY ASSESSMENT TOOL (OCAT)
FOR FINANCIAL SERVICES PARTNERS
This tool is broken into nine categories, each with a number of criteria that must be substantially met
for the organization to consider itself ready to initiate linkages with project beneficiaries.
Each category has a number of criteria that describe what capacity, systems or processes should be in
place and routinely used well for effective financial linkages with project beneficiaries. See Annex 5 for
a detailed OCAT and Annex 2 for a light rapid assessment version.
GOVERNANCE STRUCTURE
1. Board members: The board members have relevant experience, qualifications and leadership
skills in areas that will serve the linkages initiative and demonstrate capacity to support.
2. Frequency of meetings: How frequent does the board and/or senior management team
meet? What is the agenda in general that the SMT discusses during the meetings? who attends the meeting?
3. Policy involvement: Is the board involved in policy development?
4. Social Focus: Organization has a clear vision, mission and core values. The strategic and
business plan of the organization shows readiness to commit resources in developing products
and services that meet the needs of this market. This includes committing staff and structures
to develop and manage financial linkages with household in Livelihood Groups (LGs).
The top management team appreciates the organizations role and challenges in providing
financial services to very low-income households and supports initiatives by other stakeholders
in meeting these goals. The management team actively or is willing to invest time and resources
to build strong systems that support extension of financial services to very low-income groups
(e.g. PSNP beneficiaries in Livelihood Groups).
ORGANIZATIONAL AND MANAGEMENT STRUCTURE
1. Organizational Chart: The organizational structure and national and branch level is detailed
and covers all relevant functions including but not limited to: Board, CEO, HR function,
Operations function, Finance function and MIS functions.
2. Policy Framework: Organization has policies that support each critical function of the
organization and can support anticipated relationships.
HUMAN RESOURCES
1. Staffing: The organization shows sufficient staffing capacity in relation to its portfolio plans.
Staff have strong job descriptions that relate to the goals and mission of the organizations and
can support anticipated partnerships. Required level of skills and technical capacity exist to
support the mission of the organization. Performance incentives.
2. HR Policies: Existence of human resources policies, guidelines and tools that support the
vision, mission and growth plans of the organizations and can accommodate new structures that
support anticipated partnerships. System encourages recruitment and retention of staff with
high competencies and can effectively meet staffing needs in anticipated linkage relationships.

47
3. Career Plan: Staff learning and development plans allows for new knowledge and skills in line
with anticipated linkage relationships. Organization has clear career path for staff and supports
organizational learning through participation in external learning and other courses.
FINANCIAL MANAGEMENT
1. Financial systems and policies are in line with CRS Finance Policies and donor guidelines on
loanable fund management and/or credit guarantee reporting mechanisms.
2. Operations are adapted to suit desired controls appropriate to the amount of loanable
fund/credit, the degree of risk and are in line with microfinance best practices.
3. Financial Reporting requirements are in line with anticipated reporting requirements
arising out of the linkage partnerships. Financial reporting followings microfinance standard
reporting and covers Profitability (P), Efficiency (E) and Asset Quality as per industry reporting
standards.
4. Financial management practices support the business plan and in line with potential
growth plans of the institution including supporting new relationships, structures and
management of external resources.
OUTREACH INDICATORS
1. Branch Network: Organization has sufficient branch network and structures that supports its
mission to deepen and broaden outreach of services to low and very low-income households.
Performance of each branch is assessed individual in terms of operation and financial self-
sufficiency. Assessment of number of kebeles served in a particular region, distance between
clients and the nearest outlet, number of active borrowers per branch in relation to optimal
capacity demonstrates that the organization can support new linkage relationships.
2. Innovations in extending financial services: Where there are no physical branches, the
institution uses mobile banking (vehicle) options, satellite offices, agency banking, or mobile
money platforms to extend services to hard-to-reach clients in marginalized rural areas.
PERFORMANCE INDICATORS
1. Financial and Operational Self-Sufficiency: The organization’s portfolio performance
indicators show industry best practices on critical areas such as Repayment Rates, Arrears
Rates, Portfolio at Risk (PAR), Return on Assets etc.
2. Loan Portfolio:
a. Loan products (terms and conditions);
b. Loan performance;
c. Portfolio at risk (> 1 day (if available), > 30 days, > 60 days, >90 days etc.);
d. Portfolio growth;
e. Challenges and opportunities; and
f. CRS loan guarantee (purpose, alternative, suggestions for future).
PERSPECTIVES OF LONG-TERM PARTNERSHIP WITH CRS
1. Interest in long-term partnership;
2. Focus;
3. Potential expectations; and
4. Terms and Conditions.
48
SOCIAL PERFORMANCE INDICATORS
1. Review of the Mission Statement and Vision to ensure it is client-centric and clearly identifies
the social mission.
2. Evidence of understanding and application of the Universal Standards for Social Performance
Management (USSPM)
3. Evidence of board, senior management and staff training on USSPM
4. Evidence of a social audit not more than 2 years old or a recent self-assessment using the SPI4
tool.
EXTERNAL RELATIONS
1. Demonstrates capacity to prioritize new relationships that fit within the mission of the agency.
2. Relationships with local organizations, financial and non-financial service providers, donors and
other partners exist and can benefit anticipated partnership

49
Annex 3: MFIs Assessment questionnaire (for head office)
The tool is derived from different sources those engaged on assessing financial service providers for
various objectives. It focuses on criteria for; management and organizational structure, outreach,
operations, human resources, growth, experience and reporting and documentations.
The objective is to assess capacity of and engage with potential MFIs in reaching and creating financial
linkage to target beneficiaries of the program- Feed the Future Ethiopia Livelihoods for Resilience-
Oromia (LRO).
The tools, (Head office and branch level) are in the form of a checklist which, when completed will
give a total score out of 100 for the specified criteria. Average of similar indicators under head office
and branch checklist will be used. Branch level assessment will be done, although the first portion
(Management and Organizational Structure) is common to branches in an MFI. In some instances,
figures for indicators under ‘Signs of Growth’ may not be available at branch level, hence, MFI figure
will be considered in such cases.
Name of the Institution: _____________________
Date: __________________________
SN Parameter/Sub-Parameter Indicator/s Maxim
um
Points
Award
ed
Points
Remar
k
1. Management and Organizational
Structure (filled at Head Office)
a. Management experience,
ability, vision, and leadership to
lead the MFI to achieve its
mission
• Industry experience of key
senior managers,
1
b. Organizational structure to
support effective management
oversight
• If all necessary departments,
particularly Operation, have
personnel (managers) (HQ,
Area, Branch)
1
c. Institutional associations with
other development agencies, • If it has experience working
with GOs and NGOs and other
1
d. Management’s integrity and
commitment to work with
partners
• Previous engagement feedback
(existing), and any experience
in the past (for new)
2
e. Management’s vigilance and
readiness to resolve issues
arose partnership
• Previous engagement feedback
(existing), and any experience
in the past (for new)
2
Sub Total
2. Outreach (branch specific)

50
2.1. a. What other infrastructure is
used to reach out to clients? • If it has sites at kebele or
satellite office where services
(loan disbursement and
repayment, savings collection
and withdrawal, etc) take place
=2
• If only part of the services is
provided at the sites/clusters=1
• If no outlet, service site =0
2
b. What are other infrastructures
than stated under ‘b’ used to
reach and provide services to
clients?
• 1. Mobile Money
• 2. Agency banking
• 3. Mobile banking
• All = 2
• Two or one of the three =1
• None=0
2
2.2. Number of borrowers (active) • Total number =
_____________
• % of borrowers per total
population of the operation
woreda3
o >2% =3, 1-2% =2, <1%
=1
3
2.3. Total outstanding Loan
Average Loan portfolio balance
(weak measures)
=_______________________
__
=_______________________
__
2.4. Number of savers (both voluntary
and compulsory) • Above the number of
borrowers = 2
• Less or equals to the number of
borrowers=1
2
2.5. Saving balance _______________________
_________
2.6. Commitment to Pro-
poor/inclusive approach
• Focus on empowering women
(>50% of the borrowers) =1
• Integrated approach (eg with
adult literacy, health programs,
etc) =1
• Focus on, services related to,
youth (15-29 year) =1
• Product and services specific to
Women:
__________________
3
3 Key facts: Microfinance in Ethiopia, mftransparency.org (2011), country average = 2% and average Portfolio Balance = USD 140

51
• Product and services specific to
Youth:
__________________
3. Operations
3.1. How long has the MFI operated in
the country? • Over 5 years =2, 2-5 years =1,
<2 years =0
2
3.2. Know Your Customer (KYC)
procedures and requirements • If Branch uses KYC documents
like ID and others and Branch
Manager/supervisor reviews
and approves the group
formation=2
• If only KYC documentation by
Credit officer and no review by
branch manager = 1
• Otherwise = 0
2
3.3. Range of Products and Services
offered by the MFI/branch • If it has full package of loan
products (rural on-farm, off-
farm, MSE Loans and Sharia
Compliant products), Savings
and Credit Life Insurance =2
• If it has partial package = 1
• Percentage of Loan Portfolio
for Off-Farm activities: _____
2
3.4. Work/Service experience with
saving groups • If it has with VSLAs, SILC,
SHGs, etc
1
3.5. Lending methodology and
Collateral requirement • Group Individual
other____________
• Collateral requirement for
group, if any,
___________________
3.6. Interest Rates and other fees • Range of Interest Rate from
_______to _______
• Application fee
______________
• Insurance
_______________
2
3.7. Loan term and Repayment
methodology for its different
products and services
• Range from ______ to
____months
• Repayment method
(Balloon, Installment etc.)
2

52
3.8. Loan Size for its different products
and services for first cycle
borrowers
• Range from ______ to
____birr
1
3.9. Systems and Procedures in Credit
and portfolio risk management • Operation Policies and Manuals
in place = 2
• Inadequate manual and
amendments =1
2
3.10. Source of Loan fund • If total saving/portfolio > 50%, =
1,
• Diversification of Commercial
borrowings (more than one
source of borrowing) = 1
2
3.11. Liquidity Management • Availability of cash flow for
operations =1
• If the branch uses cash
disbursement plan =1
2
3.12. Management Information System • Fully computerized system
(banking system) =2
• Adequate manual system = 1
• Inadequate manual system 0
2
3.13. Portfolio Risk management (how
many days does it take a Branch
manager to become aware of a
missed loan payment? Rural loan)
• < 5 days =2, 6-10 days =1,
> 10 days =0
2
3.14. Provision of non-
financial/promotional services (eg
skills training, financial education,
group management, bookkeeping
training, BDS, etc)
• If there exist =2
• If not = 0
2
Sub-Total
4. Human Resources and Branch Logistics and Facilities
4.1. •
4.2. Loan Clients per staff • >138 = 1 2
Loan Clients per Savings and
Credit officer • > 262 =1
4.3. Scope of upgradation of skill • Staff sent to external trainings
often =2
• staff only have internal trainings
= 1
• no training to staff = 0
2
4.4. Staff turnover (in the last 6-12
months) • <12% (Low) = 1, >12%
(High) = 0
1
4.5. Is there Performance-linked
incentives to staff and
implemented?
• Yes = 1
• No =0
1

53
4.6. Adequacy of Office furniture
/chair, tables, computers,…/ • Adequate =1
• Not adequate = 0
1
4.7. Adequacy of Motorbikes for field
staff (ratio of motorbike per credit
officer)
• 0.5 = 1
• < 0.5 =0
1
Sub-Total
5. Signs of Growth
5.1. Profitability (P) and Efficiency (E)
a. Net income (recent previous
year) • +ve = 1, -ve =0 1
b. P-Operational Self Sufficiency
(OSS) • >135% =2, 100-135% = 1,
<100% =0
2
c. P-Financial Self Sufficiency (FSS) • >100% =2, 80-100% = 1,
<80% =0
2
d. P-Return on Asset (ROA) • >3% =2, 2-3% = 1,
<3% =0
2
e. E-Operational Efficiency Ratio
(OER) • <20% =2, 20-30% = 1,
>30% =0
2
f. E-Total Cost Ratio (TCR) • <30% =2, 30-40% = 1, >40% =0
2
g. Growth in Loan Portfolio in
the last two years • End of 2009 EC:___________
birr
• End of 2010 EC:___________
birr
2
5.2. Asset Quality
a. Portfolio Quality (>30 Days) • <5% =2, 5-7.5% = 1,
>7.5% =0
2
b. Repayment Rate (recent) • >95% = <95% =
c. Asset Allocation (Loan
Portfolio as % of total Asset) • >80% =2, 60-80% = 1,
<60% =0
2
d. Targets of Business Plan for the
next three years, • Plan Exists? Yes =1, No =0
• If yes (Year 1 figures)
o # of Loan Clients =
________________
o Value of Disbursement
=_____________
o Value of Savings
=_________________
_
1
Sub-Total
6. Others
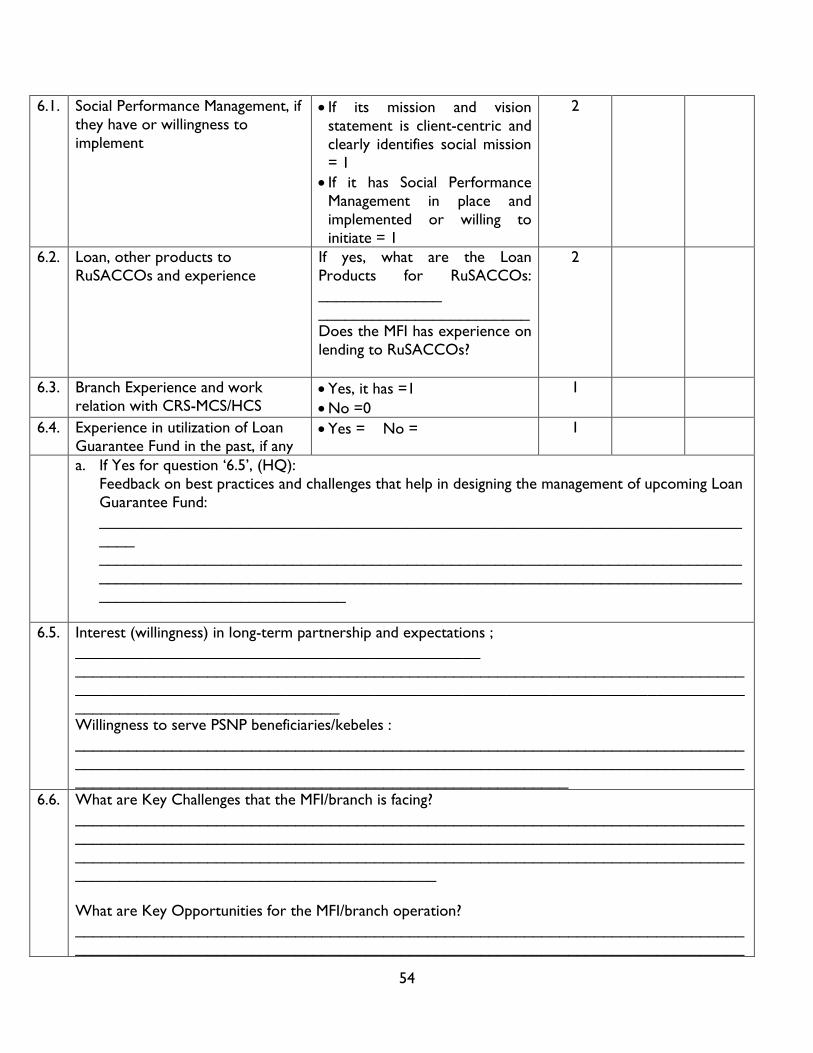
54
6.1. Social Performance Management, if
they have or willingness to
implement
• If its mission and vision
statement is client-centric and
clearly identifies social mission
= 1
• If it has Social Performance
Management in place and
implemented or willing to
initiate = 1
2
6.2. Loan, other products to
RuSACCOs and experience
If yes, what are the Loan
Products for RuSACCOs:
______________
________________________
Does the MFI has experience on
lending to RuSACCOs?
2
6.3. Branch Experience and work
relation with CRS-MCS/HCS • Yes, it has =1
• No =0
1
6.4. Experience in utilization of Loan
Guarantee Fund in the past, if any • Yes = No = 1
a. If Yes for question ‘6.5’, (HQ):
Feedback on best practices and challenges that help in designing the management of upcoming Loan
Guarantee Fund:
_________________________________________________________________________
____ _________________________________________________________________________
_________________________________________________________________________
____________________________
6.5. Interest (willingness) in long-term partnership and expectations ; ______________________________________________
____________________________________________________________________________
____________________________________________________________________________
______________________________
Willingness to serve PSNP beneficiaries/kebeles :
____________________________________________________________________________
____________________________________________________________________________
________________________________________________________
6.6. What are Key Challenges that the MFI/branch is facing?
____________________________________________________________________________
____________________________________________________________________________
____________________________________________________________________________
_________________________________________
What are Key Opportunities for the MFI/branch operation?
____________________________________________________________________________
____________________________________________________________________________

55
____________________________________________________________________________
______________
Sub-Total
Grand Total

56
Annex 4: MFIs Assessment questionnaire (branch Offices)
The tool is derived from different sources those engaged on assessing financial service providers for
various objectives. It focuses on criteria for; management and organizational structure, outreach,
operations, human resources, growth, experience and reporting and documentations.
The objective is to assess capacity of and engage with potential MFIs in reaching and creating financial
linkage to target beneficiaries of the program- Feed the Future Ethiopia Livelihoods for Resilience-
Oromia (LRO).
The tools, (Head office and branch level) are in the form of a checklist which, when completed will
give a total score out of 100 for the specified criteria. Average of similar indicators under head office
and branch checklist will be used. Branch level assessment will be done, although the first portion
(Management and Organizational Structure) is common to branches in an MFI. In some instances,
figures for indicators under ‘Signs of Growth’ may not be available at branch level, hence, MFI figure
will be considered in such cases.
S
N
Parameter/Sub-Parameter Indicator/s Maxim
um
Points
Award
ed
Points
Remar
k
3. Outreach (branch specific)
1.1 Proximity of microfinance services
to people
c. How far is the branch office on
average from the target client?
• <15km=2, 15-30 km=1; >30km
= 0
2
d. What other infrastructure is
used to reach out to clients? • If it has sites at kebele or
satellite office where services
(loan disbursement and
repayment, savings collection
and withdrawal, etc) take place
=2
• If only part of the services is
provided at the sites/clusters=1
• If no outlet, service site =0
2
e. What are other infrastructures
than stated under ‘b’ used to
reach and provide services to clients?
• 1. Mobile Money
• 2. Agency banking
• 3. Mobile banking
• All = 2
• Two or one of the three =1
• None=0
2
1.2 Number of kebeles served, out of
the woreda total
• More than 75% of the kebeles =
3
• 50-75% of the kebeles =2
• 25-50% of the kebeles =1
• <25% of the kebeles = 0
3

57
1.3 Geographic distribution of client
groups • Targeting in remote rural areas
=2
• Confined to nearby rural and
town clients =1
2
1.4 Number of borrowers (active) • Total number =
_____________
• Branch # of borrowers as a
percentage of total population
of the woreda4 o >2% =3, 1-2% =2, <1%
=1
3
1.5 Total outstanding Loan of the
branch
Average Loan portfolio balance (weak measures)
=______________________
__________
=________________________________
1.6 Number of savers (both voluntary
and compulsory) • Above the number of
borrowers = 2
• Less or equals to the number of
borrowers=1
2
1.7 Saving balance _______________________
_________
1.8 Targeting the poorest (operation
in PSNP kebeles) • More than 75% of the kebeles =
3
• 50-75% of the kebeles =2
• 25-50% of the kebeles =1
• <25% of the kebeles = 0
3
1.9 Commitment to Pro-
poor/inclusive approach
• Focus on empowering women
(>50% of the borrowers) =1
• Integrated approach (eg with
adult literacy, health programs,
etc) =1
• Focus on, services related to,
youth (15-29 year)=1
• Product and services specific to
Women:________________
__
• Product and services specific to
Youth:__________________
3
7. Operations
7.1. How long has the MFI operated in
the woreda/branch? • Over 5 years =2, 2-5 years =1,
<2 years =0
2
4 Key facts: Microfinance in Ethiopia, mftransparency.org (2011), country average = 2% and average Portfolio Balance = USD 140

58
7.2. Know Your Customer (KYC)
procedures and requirements • If Branch uses KYC documents
like ID and others and Branch
Manager/supervisor reviews
and approves the group
formation=2
• If only KYC documentation by
Credit officer and no review by
branch manager = 1
• Otherwise = 0
2
7.3. Range of Products and Services
offered by the MFI/branch • If it has full package of loan
products (rural on-farm, off-
farm, MSE Loans and Sharia
Compliant products), Savings
and Credit Life Insurance =2
• If it has partial package = 1
• Percentage of Loan Portfolio for Off-Farm activities:
__________
2
7.4. Work/Service experience with
saving groups • If it has with VSLAs, SILC,
SHGs, etc
1
7.5. Lending methodology and
Collateral requirement • Group Individual
other____________
• Collateral requirement for
group, if any, ________
7.6. Interest Rates and other fees • Range of Interest Rate from
_______to _______
• Application fee
______________
• Insurance
_______________
2
7.7. Loan term and Repayment
methodology for its different
products and services
• Range from ______ to
____months
• Repayment method
• Balloon, Installment
2
7.8. Loan Size for its different products
and services for first cycle
borrowers
• Range from ______ to
____birr
1
7.9. Systems and Procedures in Credit
and portfolio risk management • Operation Policies and Manuals
in place = 2
• Inadequate manual and
amendments =1
2

59
7.10. Source of Loan fund • If total saving/portfolio > 50%, =
1,
• Diversification of Commercial
borrowings (more than one
source of borrowing) = 1
2
7.11. Liquidity Management • Availability of cash flow for
operations =1
• If the branch uses cash
disbursement plan =1
2
7.12. Management Information System • Fully computerized system
(banking system) =2
• Adequate manual system = 1
• Inadequate manual system 0
2
7.13. Portfolio Risk management (how many days does it take a Branch
manager to become aware of a
missed loan payment? Rural loan)
• < 5 days =2, 6-10 days =1,
> 10 days =0
2
7.14. Is the branch effectively measuring
and monitoring portfolio at risk? • Yes= 1
• No=0
1
7.15. Provision of non-
financial/promotional services (eg
skills training, financial education,
group management, bookkeeping
training, BDS, etc)
• If there exist =2
• If not = 0
2
Sub-Total
8. Human Resources and Branch Logistics and Facilities
8.1. Does the number and type of staff
(Branch Manager or Supervisor or
Senior Credit Officer, Accountant,
Cashier and Saving and Credit
officer) at the branch match levels
of responsibilities and delegated
authority?
• Yes =1
• No=0
1
8.2. Loan Clients per staff • >138 = 1 2
Loan Clients per Savings and
Credit officer • > 262 =1
8.3. Are staff functions assigned
properly? • Yes = 1, No = 0
8.4. Knowledge of staff on
microfinance operation (check
with a Credit officer vs an
operation process (eg. group
formation process)
• Good =2, Moderate= 1,
Low =0
2
8.5. Skill set of staff • Do all staff have computer skill?
=1
2

60
• Do all credit officers have
motorbike driving skill? =1
8.6. Scope of upgradation of skill • Staff sent to external trainings
often =2
• staff only have internal trainings
= 1
• no training to staff = 0
2
8.7. Attitude level of staff towards
work (Does the branch have
motivated staff to implement its
mission?)
• High =2
• Moderate = 1
• Low =0
2
8.8. Staff turnover (in the last 6-12
months) • <12% (Low) = 1, >12%
(High) = 0
1
8.9. Is there Performance-linked
incentives to staff and
implemented?
• Yes = 1
• No =0
1
8.10. Adequacy of Office furniture /chair, tables, computers,…/
• Adequate =1
• Not adequate = 0
1
8.11. Adequacy of Motorbikes for field
staff (ratio of motorbike per credit
officer)
• 0.5 = 1
• < 0.5 =0
1
Sub-Total
9. Signs of Growth
9.1. Profitability (P) and Efficiency (E)
h. Net income (recent previous
year) • +ve = 1, -ve =0 1
i. Growth in Loan Portfolio in
the last two years • End of 2009 EC:___________
birr
• End of 2010 EC:___________
birr
2
9.2. Asset Quality
e. Portfolio Quality (>30 Days) • <5% =2, 5-7.5% = 1,
>7.5% =0
2
f. Repayment Rate (recent) • >95% = <95% =
g. Targets of Business Plan for the
next three years, • Plan Exists? Yes =1, No =0
• If yes (Year 1 figures)
o # of Loan Clients =
________________
o Value of Disbursement
=_____________
o Value of Savings
=_________________
_
1

61
Sub-Total
10. Others
10.1. Quality of Reporting and
Documentation • Good =1, Not good =0 1
10.2. Branch Experience and work relation with CRS-MCS/HCS
• Yes, it has =1
• No =0
1
10.3. Experience in utilization of Loan
Guarantee Fund in the past, if any • Yes = No = 1
10.4. a. What are Key Challenges that the MFI/branch is facing?
_________________________________________________________________________
_________________________________________________________________________
_________________________________________________________________________
______________________________________________
b. What are Key Opportunities for the MFI/branch operation?
___________________________________
____________________________________________________________________________
____________________________________________________________________________
____________________________________________________________________________
______________
Sub-Total
Grand Total

62
Annex 5: RuSACCO and RuSACCO unions Capacity Assessment questionnaire
1. General
a. Name of the Union ______________________
b. Number of Woredas where member RuSACCOs are operating _____ and name of the
woredas _______
c. Year of establishment _______________
2. Organizational knowledge, Management and Leadership
a. Do Board and management of the Union know vision, mission, goals and values of the union?
Yes No
b. Does the board and management meet regularly? Yes No
c. Does the Union have strategic Plan? Yes No
• If No, what is/are the reason/s? ______________
d. Does the Union have Operational Plan? Yes No
• If No, what is/are the reason/s? ______________
e. Does the Union maintain appropriate recording? Yes No
f. Does Union have appropriate financial recording system in place (eg computer spreadsheet)?
Yes No
g. Is the Union audited in the last three years? Yes No
h. Is there accountant? Yes No
• If Yes, is the accountant capable enough to manage the recordings? Yes No
3. Membership
a. Number of member RuSACCOs _______________
b. Number of kebeles where member RuSACCOs are operating
____________________________
c. Total Number of members: Total__________ Male______ Female_____
d. Are there member RuSACCOs from PSNP kebeles? Yes No
e. In a household with husband and wife, who will be given priority for registration as member in a
RuSACCO? ___________
f. Is the total number of members(individuals) increasing, no change or reducing in the last two
years? ___
• Is there significant members’ dropout? Yes No.
g. Literacy level of Board and management of the Union. How many of them read and write? All
Half, Few, None of them
h. Literacy level of management of member RuSACCOs. How many of them read and write? All
Half, Few, None of them

63
4. Savings
a. Total saving balance, current: ____________________
• Saving amount at bank __________ (name of the bank ______________)
• Other ________________
b. Average saving per RuSACCO _______________
c. Is there minimum and maximum monthly saving amount set? Yes No,
• If Yes, How much Minimum: _____________ Maximum: _____________
d. Do all member RuSACCOs save regularly? Yes, No.
• If no what is/are the reason/s? ____________________________________
e. What percent of RuSACCO members’ saving is deposited at the Union? __________
f. How does the Union mobilize savings? _____________________________________
_________________________________________________
5. Borrowings and Lending
a. Union’s borrowing
i. Source of credit for the Union in the last 3 years
• Internal Saving/Member RuSACCOs’ share Yes No,
• Bank Yes No, if Yes, name of the bank/s________
• MFI Yes No, if Yes, name of the MFI________
• Other, specify _________________
ii. Does the Union required to provide collateral to borrow? Yes No
• If Yes, how much? ______________________________________
iii. Is amount borrowed linked with saving amount the Union deposited in the lender? Yes No
iv. Does the Union has outstanding debts/amounts not repaid to the lenders, currently? Yes
No
Source 1 Source 2 Source 3 Source 4
How much?
Interest Rate?
Flat or Declining?
Application/Service
charge?
v. Do the Union repaying the loan in time? Yes No
• If No, what is/are the reason/s ____________________________
vi. Is there provision for loan loss? Yes No
• What percent? __________
vii. Is there insurance (credit life insurance)? Yes No
viii. Does the Union prepare business plan to borrow? Yes No
ix. Does the management able to prepare business plan to borrow from the indicated sources?
Yes No

64
x. Can the Union access interest free loan from the lenders? Yes No
b. Union’s Lending
i. Do all member RUSACCOs received loan from the Union in the last 3 years? Yes No
• If No, what is/are the reason/s ____________________________
ii. Amount of loan disbursed in this fiscal year _______________
• How many RuSACCOs received? __________
iii. Amount of Outstanding loan, current __________________
iv. How many of the RuSACCOs are currently having outstanding debt? _________
v. Do the RuSACCOs repaying the loan in time? Yes No
• If No, what is/are the reason/s ____________________________
vi. Is there provision for loan loss? Yes No
• If Yes, what percent _________
vii. What are major activities that the loan is provided for?
• ______________ _____________ _______________
• ______________ _____________ _______________
viii. Do RuSACCOs required to submit business plan to borrow? Yes No
ix. Does the Union have sufficient loanable fund to serve its members? Yes No
• If No, what is plan to serve members’ application? __________________
x. Is there interest free loan the Union is providing to RuSACCOs? Yes No
xi. How long will it take for a new RuSACCO to access loan from the Union? _____
xii. Loan Features
• Types of loan products: ________ _______ ___________ __________
• How much is the minimum and maximum loan amount per RuSACCO? _____
• What is the loan term (minimum and maximum number of months a loan is provided to
a RuSACCO)? ____________________
• How much is the interest rate? _________ Flat or declining? __________
• Any application/service charge ____________
• Is there micro insurance (credit life insurance)? Yes No
• Is there collateral or Guarantee required to borrow? Yes No
6. Union’s services to the community, if any________________
7. Physical and Financial Structure and Staffing
Financial Structure
a. Total asset of the Union (birr) ____________
b. Is the Union’s total asset increasing, no change or reducing? __________
c. Does the Union has non-financial investment (like in supermarkets, schools, etc) Yes No
d. Liability-member RuSACCO’s saving maintained at the Union. __________
Physical Structure
a. Does the Union have own office? Yes No
• If Yes, new or old, space adequate or not _____________

65
b. Does the Union have adequate office furniture? Yes No
• If No, what furniture and office equipment most required, currently? (list them in priority
order) ___________ ____________ ___________ ___
c. Does the office have communication tools (like telephone,)? Yes No
d. Does the RuSACCO have sufficient office supplies? Yes No
• If No, what office supplies are mostly required, currently? (list them in priority order)
___________ ____________ ___________ ___
Staffing
a. Does the Union have staff appropriate number to manage the day to day activity? Yes No
8. Support received:
a. List support you received from the woreda, Zone (cooperative promotion office and
others) ________ ___________________________________________________
b. List support you received from other organizations in the last 3 years, (name of the
organization, NGO) ______________________________________________
c. Does the Board, management, accountant of the Union taken any training in this year from
any organization (government and/or NGO)? Yes No
• List them ___________ ____________ _____________
d. What kinds/topics of training are required for the management, accountant, and others? (list
them) ________________ ____________________ ________________
9. What are services, other than financial services, provided by Union to its members
______________
10. Does the Union & its members accessed the current Capacity Building opportunities from
government? Yes No
• If Yes, what and how? ____________________________
11. Does the Union have work experience with NGOs? Yes No
a. List them _______________________

66
Annex 6: Livelihood Groups FGD checklist
CRS and its partners are responsible to ensure financial and non-financial linkages only happen as a
need from households in SILC groups/LGs and not supply-side driven. It is not enough to assess
capacity of financial service providers without conducting a Linkage Readiness assessment of the
demand-side (beneficiaries in the project). Apart from conducting a Value Chain Finance Assessment
which shows the value chains households are involved in and their financial needs, a focus group
discussion with beneficiaries will reveal other needs, pain-points and aspirations that, if addressed, will
enrich the linkage experience.
An example of a focus group discussion tool is below:
SECTION B: DEMAND-SIDE (Pre-linkage pull factors)
Respondents: Livelihoods groups
Please rate the following products in terms of levels of demand for your household
3: Very High 2: High 1: Low 0: I don’t need it
Service and product 3 2 1 0
Loan to purchase inputs
(seeds, fertilizers etc.)
Loan to purchase farm
equipment
Loan to purchase livestock
Loan to buy food or clothing
Loan to start a business
Loan to expand my business
Loan to pay school fees
Other products that you need but are not mentioned in the above list can be listed below
and rated with the same matrix.
____________________________________________________________________________________
________________________________________________________________________
1. What formal financial service providers is found in your locality? Please
mention their names ( RuSACCO, microfinance institution)
______________________________________________________________________________

67
______________________________________________________________________________
____________________________________________________________
3. Of the above financial service providers, which one is your primary preference?
______________________________________________________________________________
__________________________________________________________________
4. When selecting the financial institution, which one of the following had the most
influence in your decision?
a. Recommendation from a friend or associate ___ b. Location of the facility ___
c. Quality of the service ___ d. Price of the product
e. Any other, please explain
______________________________________________________________________
______________________________________________________________________
______________________________________________________________________
______
5. How far does it take you to reach the nearest financial institution?
• Less than 30 minutes
• 30 minutes to 1 hour
• 1 – 2 hours
• More than 2 hours
6. What do you consider before taking up a loan from an external financial institution
other than your SILC group?
Loan repayment period
Interest rate
Loan size
Loan product being offered
Friendliness of staff
Nearness of the institution
Collateral/security requirements
Loan disbursement timing
Loan disbursement efficiency
Loan repayment modality
Other (specify)
If you were previously linked to FSP, what do you recommend to be improved?

68
Annex 7: Key Informant Interview (stakeholders)
CRS and its partners are responsible to ensure financial and non-financial linkages only happen as a
need from households in SILC groups/LGs and not supply-side driven. It is not enough to assess capacity of financial service providers without conducting a Linkage Readiness assessment of the
demand-side (beneficiaries in the project). Apart from conducting a Value Chain Finance Assessment
which shows the value chains households are involved in and their financial needs, a focus group
discussion with beneficiaries will reveal other needs, pain-points and aspirations that, if addressed, will
enrich the linkage experience.
An example of a focus group discussion tool is below:
SECTION B: DEMAND-SIDE (Pre-linkage pull factors)
Respondents: Government stakeholders
2. Please rate the following products in terms of levels of demand in your woreda
3: Very High 2: High 1: Low 0: not needed
Service and product 3 2 1 0
Loan to purchase inputs
(seeds, fertilizers etc.)
Loan to purchase farm
equipment
Loan to purchase livestock
Loan to buy food or clothing
Loan to start a business
Loan to expand my business
Loan to pay school fees
Other products that you think is need but are not mentioned in the above list can be
listed below and rated with the same matrix.
____________________________________________________________________________________
________________________________________________________________________
3. What formal financial service providers is found in the Woreda ? Please mention
their names ( RuSACCO, microfinance institution)
______________________________________________________________________________
______________________________________________________________________________
____________________________________________________________

69
7. Of the above financial service providers, which one is most preferred by
community? why?
______________________________________________________________________________
__________________________________________________________________
________________________________________________________________________
Which one do you recommend? Why?
________________________________________________________________________
________________________________________________________________________
8. What do you think communities should consider before taking up a loan from an
external financial institution ?
Loan repayment period
Interest rate
Loan size
Loan product being offered
Friendliness of staff
Nearness of the institution
Collateral/security requirements
Loan disbursement timing
Loan disbursement efficiency
Loan repayment modality
Other (specify)
9. Is there any financial linkage experience between communities and formal financial
service providers in the woreda? If yes,
a. . What lesson did you learned from this experience?_________________________
___________________________________________________________________________
___________________________________________________________________________
_______________________________
b. . What challenges/problems did you observe? ______________________________
___________________________________________________________________________
_______________________________________________________________
c. What do you recommend to be improved for the future linkages?
______________
_____________________________________________________________________