Le fonctionnement du marché du travail en Algérie : population active et emplois occupés

New Moscovian palaeomagnetic pole from the Edjeleh fold(Saharan craton, Algeria)
M. E. M. Derder,1 B. Henry2, B. Bayou,1 H. Djellit1 and M. Amenna1
1 Centre de Recherche en Astronomie Astrophysique et Geophysique (C.R.A.A.G.), B.P. 63, 16340 Bouzareah, Alger, Algeria.
E-mail: [email protected] Geomagnetisme et Paleomagnetisme, IPGP and CNRS, 4 avenue de Neptune, 94107 Saint Maur cedex, France. E-mail: [email protected]
Accepted 2001 June 6. Received 2001 May 16; in original form 1999 July 14
SUMMARY
A palaeomagnetic study was carried out in the Moscovian (y305 Ma) formation in theEdjeleh anticline, the only area where important dips can be observed in the UpperPalaeozoic series of the Illizi basin (Algeria). This study shows the existence of threemagnetization components. Two of them are interpreted as Cenozoic and Permianremagnetizations; their poles are 88.8uN, 164.0uE, K=262, A95=3.3u and 43.4uS,61.7uE, K=93, A95=5.9u, respectively. The third component is determined by both well-defined ChRMs and remagnetization circles analysis. Its associated fold test is positiveand significant. Because the folding started before or during the Autunian, this thirdcomponent was acquired very early and is very probably the primary magnetization. Itscorresponding palaeomagnetic pole (28.3uS, 58.9uE, K=157, A95=4.2u) is close to thepoles from the Saharan platform obtained from neighbouring periods. The positive foldtest of this study thus validates these previous Upper Palaeozoic poles.
This new result is in agreement with the geodynamical model (Matte 1986; Henry et al.1992), which proposed the occurrence of a large clockwise rotation of Africa during theCarboniferous; such a motion agrees with the Permian Pangaea A2 reconstruction.
Key words: Africa, apparent polar wander path, fold test, Moscovian, palaeomagneticpole, Saharan craton.
I N T R O D U C T I O N
In order to improve the African palaeomagnetic database for
Palaeozoic times, which is still poor, we have undertaken, during
the last 10 years, systematic palaeomagnetic studies of the dated
tabular formations of the Illizi basin (SE Algeria, Fig. 1a).
Levels of various ages, ranging from the Silurian to the Albian,
were analysed. These studies led to the determination of five
new African palaeomagnetic poles. The first, determined in the
‘El Adeb Larache’ area, is of Moscovian age (Henry et al. 1992),
the second is of Stephano–Autunian age from the Tiguentourine
Formation (Derder et al. 1994a), the third is from the Middle
Zarzaıtine Formation of Liassic–Dogger age (Derder et al.
1994b), the fourth, determined in the ‘la Reculee’ area from the
Lower Zarzaitine is of Triassic–Liassic age (Kies et al. 1995), and
the fifth is of Bashkirian age from the Oubarakat Formation
(Derder et al. 2001a). These studies also showed the existence of
Cenozoic and Permian remagnetization events.
However, as in most of the palaeomagnetic studies in hori-
zontal tabular areas, the age of the magnetization acquisition
has not been demonstrated. Indeed, in all cases, geological and
geophysical constraints did not permit palaeomagnetic tests,
except a reversal test in the Lower Zarzaıtine Formation of
Triassic–Liassic age (Kies et al. 1995). Such a reversal test is not
absolute proof of the primary character of the magnetization,
but indicates that the magnetization consists of a single com-
ponent. The only argument in favour of the primary character
of the magnetization is the variation of its direction from one
formation to another, while the magnetic overprints (Permian and
Cenozoic) observed at some levels have the same orientation in
the different geological formations.
To validate the previous results by a fold test, a new study
was carried out 60 km SE of In Amenas city, in the Edjeleh
region (27.4uN, 9.5uE, Fig. 1a), where important dips can be
observed in Upper Palaeozoic formations of the Illizi basin
(Fig. 1b). The Edjeleh anticline affects the Moscovian and the
Stephano–Autunian formations, but only the Moscovian facies
(El Adeb Larache Formation) appeared to be suitable for
palaeomagnetic study.
G E O L O G I C A L S E T T I N G
The Edjeleh area is an anticline with a N–S axis that shows in its
central part the northern outcrops of the Saharan Palaeozoic
Geophys. J. Int. (2001) 147, 343–355
# 2001 RAS 343

series of the Illizi basin. These series include the Moscovian
marine formation of El Adeb Larache and the Stephano–
Autunian Tiguentourine Formation, and are covered by the
Triassic Zarzaıtine Formation (Figs 1b and c). This anticline
has an asymmetrical shape. The western limb shows beds with
very low dip values (0u–6u). The outcropping series of the
eastern limb are more reduced and are affected by a reverse
fault; the observed dip values are high (20u–80u).The Moscovian series contain (de Lapparent 1949) many
fossils: Spirifer, Goniatites and Bellerophon (Durif 1959; Legrand-
Blain 1980) of Moscovian age (y305 Ma; Odin 1994). Two
principal parts can be distinguished (Figs 1b and d): the
bottom is characterized by centimetric levels of blue–violet
limestones and the upper part consists from the base to the top
of blue limestones, blue marly limestones with slumps and rich
fossiliferous levels (‘Lumachelle with Goniatites’), bioturbated
green calcareous beds (thickness 0.3–0.5 m) with thinly bedded
sandstones, and finally green calcareous rocks (Fig. 1d). All the
upper series also contain many levels of rubefied red clay
horizons.
The Moscovian is covered conformably by the Stephano–
Autunian Tiguentourine Formation. The abnormal overlapping
of several levels of the Moscovian by the Tiguentourine at
Edjeleh is due to a later local backthrusting movement connected
to the major fault (Fig. 1c).
The Moscovian levels and the Stephano–Autunian
Tiguentourine Formation (Attar et al. 1981) were affected by
folding (Figs 1b and c). The Lower Zarzaitine Formation of
Upper Triassic age (Achab 1970) lays unconformably over the
folded Tiguentourine Formation (Fig. 1d); therefore the main
part of the deformation at least occurred before the Upper
Triassic.
(a)Figure 1. (a) Simplified geological map of Illizi basin (from the modified geological Illizi map, CRZA & CNRS 1965) showing the locations of the
different geological formations studied in previous palaeomagnetic studies. (b) Locations of the studied Moscovian formation (from the modified
geological Illizi map, CRZA & CNRS 1965) and of the sampling sites (stars). Locations of the different sedimentary basins in the Algerian Sahara.
(c) Geological cross-section A–B (see b) of the Edjeleh area. (d) Stratigraphic column of the geological formation studied showing the locations of the
sampling sites.
344 M. E. M. Derder et al.
# 2001 RAS, GJI 147, 343–355

(b)
(c)Figure 1. (Continued.)
New Moscovian palaeomagnetic pole 345
# 2001 RAS, GJI 147, 343–355

However, as the Upper Tiguentourine levels are also locally
discordant (Fig. 1d) on the Lower Tiguentourine levels (Attar
et al. 1981), and as the Lower Tiguentourine is very reduced in
thickness or even missing at the Edjeleh anticline, the folding
started before or during the Stephano–Autunian.
S A M P L I N G A N D A N A L Y S I SP R O C E D U R E
The sampling sites were located in the Edjeleh region, in the
eastern part of the Illizi basin (Fig. 1a), approximately 70 km
east of the El Adeb Larache locality where the previous
Moscovian study was undertaken (Henry et al. 1992).
All the Moscovian outcropping levels at Edjeleh have been
sampled (Fig. 1b): sites 1–6 in the green calcareous rocks, 7–10
in the rubefied red clay levels, sites 11–13 in the blue limestones,
and sites 14–16 in the blue–violet limestones. 175 samples from
14 sites were collected in the western limb of the anticline, where
the dip is low. Because of the bad outcrop conditions (the
major part of the formation is buried by Stephano–Autunian,
Triassic and Quaternary deposits), only 27 samples from two
sites were sampled on the eastern limb.
One–three specimens were cut from each core in order to
have additional specimens for pilot studies and rock magnetic
analysis. Prior to any demagnetization analysis, the specimens
were put in a zero field for at least one month, in order to
reduce existing viscous components. The Natural Remanent
Magnetization (NRM) of the specimens was measured using
a JR4 spinner magnetometer (Agico, Brno). Several pilot
specimens from each site were subjected to a stepwise alter-
nating field (AF) (up to 180r10x3 T) or thermal (up to 660 uC)
demagnetizations in order to characterize their magnetic
behaviour.
The results of the pilot studies were used to discriminate and
discard specimens from sites showing only Cenozoic (such as
site 6) or Permian (such as site 2) remagnetizations and those
from sites (such as site 3) that show unstable remanent
magnetization during the demagnetization process. Finally,
132 samples were demagnetized in this study.
The results of the pilot studies showed also that the AF
procedure did not allow complete demagnetization. Thermal
demagnetization was applied to the remaining specimens. The
thermal demagnetization was performed using a cylindrical
furnace with a fast heating level while forced air enhanced the
cooling. In order to isolate correctly and identify the com-
ponents of magnetization, numerous steps were performed with
increments ranging from 150 uC at the lowest temperatures to
25 uC at the highest temperatures. Demagnetization data analysis
was carried out using classical methods: the directions of the
magnetization components were plotted on orthogonal vector
plots (Wilson & Everitt 1963; Zijderveld 1967); the remaining
vectors and vectorial differences of the magnetization were
(d)Figure 1. (Continued.)
346 M. E. M. Derder et al.
# 2001 RAS, GJI 147, 343–355

plotted on equal-area projections; the remagnetization circles
methods (Halls 1976; Halls 1978; McFadden & McElhinny 1988)
were also used. The mean directions of the different com-
ponents were computed using principal component analysis
(Kirschvink 1980), Fisher (1953) statistics and a bivariate form
of Fisher statistics (Le Goff 1990; Le Goff et al. 1992). For
progressive unfolding, the parameters k (Fisher 1953) and
kd (the value of the precision parameter from the elliptical
confidence zone in the direction perpendicular to the fold axis;
Henry & Le Goff 1994) were used.
R O C K M A G N E T I S M
Hysteresis loops were obtained for small cores (cylindrical
samples of 1 cmr1 cm) using a laboratory-made translation
inductometer within an electromagnet capable of reaching 1.6 T.
For the blue–violet limestones, saturation of the magnetization
is not reached (Fig. 2a) and the coercive force and the remanent
coercive force are relatively strong (Hc=0.21 T, Hcr=0.29 T).
This indicates that the main carrier of the magnetization is
haematite or goethite.
The hysteresis loops for the rubefied red clays (Fig. 2b) and
the blue–green facies also show that saturation is not reached.
The coercive forces are lower (Hc=0.045 T, Hcr=0.096 T)
for the rubefied clays than for the blue–violet limestones
(Hc=0.071 T, Hcr=0.36 T). In most cases the loops show a
wasp-waisted shape, indicating the existence of at least two
different magnetic components, haematite or goethite, and
another component with lower coercivity (possible magnetite).
Thermomagnetic curves (low-field susceptibility as a function
of temperature) have been determined by heating in air using
the CS2 equipment, Kappabridge KLY2 (Agico, Brno). Despite
the occurrence of strong mineralogical alteration during the
heating in many samples, the Curie curves, in favourable cases,
give more precise information about the magnetic carrier. They
confirm the presence in the blue–green limestones and in the
rubefied red clay facies of haematite and magnetite. Haematite
is also shown by blocking temperatures higher than 580 uC. In
the example of Fig. 3, the mineralogical alteration revealed by
a decrease of susceptibility cannot be due to the formation of
magnetite. The observed Curie point at 580 uC, with a small
Hopkinson peak, is therefore related to pre-existing magnetite.
Figure 2. Hysteresis loop: (a) blue–violet limestone; (b) rubefied red clays (Hc: coercive force; Hcr: remanent coercive force).
Figure 3. Example of variation of the normalized magnetic susceptibility during a cycle of progressive heating and cooling in air of a sample from the
blue and green facies, showing, in addition to a ‘Hopkinson’ peak related to magnetite, the presence of haematite.
New Moscovian palaeomagnetic pole 347
# 2001 RAS, GJI 147, 343–355

At temperatures higher than 580 uC, the magnetic susceptibility
continues to decrease until temperatures of approximately
670–680 uC, thus confirming the existence of haematite.
The presence of magnetite in the blue–violet limestones is
not clearly demonstrated, and the main carrier is haematite.
Because of the reversibility of the heating and cooling curves,
this haematite is a pre-existing mineral.
Two main magnetic carriers have thus been revealed in the
formation studied. Haematite is present in the blue–violet
limestones, and both magnetite and haematite are present in
the blue–green limestones and in the rubefied red clays.
P A L A E O M A G N E T I C R E S U L T S
The NRM directions are distributed on a girdle (Fig. 4). This
girdle is elongated between the present Earth magnetic dipole
field direction and a SSE direction. This arrangement suggests
a superimposition of at least two components in the NRM.
NRM intensities values range from 6 to 2373r10x4 A mx1,
with a mean of 227r10x4 A mx1 (Fig. 5).
During demagnetization, after eventual elimination of a
small viscous component, the analysis of the magnetization
directions of the samples gives two different kinds of results: a
stable magnetic direction characteristic of an apparently single
component, or directions evolving along a great circle, which
shows the superimposition of unblocking temperature spectra
for at least two components. The analysis of the data indicates
that the stable characteristic remanent magnetizations (ChRMs)
have different orientations, allowing their separation into three
groups (A, of normal polarity only, and B and C, of reversed
polarity only).
ChRM analyses
ChRM A
The first ChRM (A), isolated at seven sites, has mean directions
defined by D=359.8u, I=44.7u, k=178, a95=4.5u and D=3.4u,I=44.9u, k=54, a95=8.3u, before and after dip correction,
respectively (Table 1). This direction is better grouped in geo-
graphical coordinates (for progressive unfolding, the maximum
k-value is obtained for x5 per cent unfolding) and is very close
to that of the present Earth’s magnetic field at the site. The
palaeomagnetic pole corresponding to this component before
dip correction (88.8uN, 164uE, K=262, A95=3.3u) is close to
that from some sites of other formations of the Illizi basin that
show Cenozoic remagnetization (82.6uN, 97.6uE, Henry et al.
1992; 74.6uN, 73.3uE, Derder et al. 1994a). This direction is
thus interpreted as a total remagnetization, which occurred
during Cenozoic times.
Figure 4. Equal-area plot of the NRM directions for all samples
(crosses: positive inclinations; open circles: negative inclinations). Open
star: present magnetic field direction.
Figure 5. NRM intensity histogram (n, number of samples versus the NRM intensity).
348 M. E. M. Derder et al.
# 2001 RAS, GJI 147, 343–355

ChRM B
The second orientation of the ChRM (B) was isolated at
six sites: D=145.0u, I=9.7u, k=58, kd=53, a95=8.9u and
D=145.0u, I=7.9u, k=38, kd=44, a95=11.1u, before and after
dip correction, respectively (Table 1). These two directions are
not very different and the fold test is of little significance
because all the corresponding sites are in the same weakly
dipping limb of the fold (taking into account only the precision
parameter values, the deformation should be older than the
magnetization). The directions are very close to that determined
in some sites of the Moscovian El Adeb Larache formation,
which show Permian remagnetization directions (Henry et al.
1992). In geographical coordinates, this second orientation also
yielded a palaeomagnetic pole (43.4uS, 61.7uE, K=93, A95=5.9u)very close to previous poles of Permian remagnetization deter-
mined at El Adeb Larache (42uS, 65.1uE; Henry et al. 1992) and
in other areas of the Saharan craton, for example at Hassi
Bachir (35.5uS, 60uE; Daly & Irving 1983) and at Beni-Abbes
(49.5uS, 42.2uE; Aifa 1987). Thus, this component is probably a
total magnetic overprint, which was acquired during Permian
times.
ChRM C
The third component (C) was isolated from two types of
magnetic behaviour. With the first, after the elimination of
a small component probably of viscous origin, only a stable
orientation of the magnetization (Fig. 6) is observed during the
demagnetization process. In the second, the magnetization
directions (vectorial differences and /or the remaining vectors)
are evolving along great circles (Fig. 7) towards the SE and
reach a stable direction C only at the highest temperatures. The
ChRM direction defined by this C component, computed from
32 specimens and distributed over six sites, has the following
directions: D=134.8u, I=34.2u, k=96, kd=66, a95=6.9u and
D=133.7u, I=32.6u, k=254, kd=332, a95=4.2u, before and
after dip correction, respectively (Table 2). The maximum
value of the precision parameter during progressive unfolding
is obtained for 92 per cent unfolding (kd=341). The differ-
ence between kd values for 92 and 100 per cent unfolding
is statistically not significant, and the simple and stringent
McElhinny (1964) fold test is positive and significant at the
99 per cent level.
Direction of the C component from great-circles analyses
For most of the samples that show an evolution along great
circles of their magnetization directions during demagnetization
(superimposition of unblocking temperature spectra for at least
two components), a stable direction was not reached, even at
high temperatures (Fig. 8), and only the great-circles data are
available. The analysis of remagnetization circles using Halls’
method (Halls 1976, 1978) was thus applied. The intersection
direction obtained appears to be relatively similar in the three
sites (Table 3). There is a coincidence between these inter-
sections and the ChRM directions determined in other samples
of the same sites (Table 2). A similarity also exists between
the direction obtained from all the ChRM data (Fig. 9 and
Table 2) and that obtained by the best intersection using all the
available circles (Figs 10a and c). This result shows that the
McFadden & McElhinny (1988) approach is therefore useable
here to integrate great circles and ChRM data within each site
(Table 4).
The confidence zone of the best intersection direction
(Henry 1999) for all the great circles is much smaller after
dip correction than before (Figs 10b and d). This is another
argument in favour of a positive fold test (Fig. 11).
Table 1. ChRMs A and B (Cenozoic and Permian overprints): mean directions (D, I in degrees) obtained for each site (N: number of samples);
palaeomagnetic pole: Lat. (uS), Long (uE); and corresponding Fisher parameters (k, a95, K, A95; a95 and A95 in degrees).
Before dip correction After dip correction Palaeopole
Site N D (u) I (u) k a95 D (u) I (u) k a95 Lat (uS) Long (uE) K A95
Cenozoic total overprint
02 2 0.0 50.0 – – 355.0 55.0 – –
05 8 1.9 47.5 77 6.4 1.9 47.4 77 6.4
06 5 356.4 37.0 612 3.1 356.4 37.0 612 3.1
08 1 359.0 41.0 – – 354.0 38.0 – –
11 7 0.4 49.7 149 5.0 358.6 52.8 149 5.2
12 7 1.2 37.7 213 4.1 14.4 34.9 213 4.1
13 1 0.0 50.0 – – 22.0 46.0 – –
Mean 31 0.2 44.1 82 2.9 3.6 44.5 48 3.8
Mean 7 sites 359.8 44.7 178 4.5 3.4 44.9 54 8.3
Mean 7 sites x88.8 x196.0 262 3.3
Permian overprint
01 3 149.8 6.5 64 15.5 150.3 2.5 52 17.2
02 2 144.1 x6.1 – – 143.4 x8.3 – –
09 1 148.7 15.7 – – 148.7 15.7 – –
14 2 148.1 13.5 – – 148.1 13.5 – –
15 6 147.2 11.7 139 5.7 147.2 11.7 139 5.7
16 1 131.9 16.5 – – 131.9 16.5 – –
Mean 15 146.5 9.2 64 4.8 146.5 9.2 53 5.3
Mean 6 sites 145.0 9.7 58 8.9 145.0 7.9 38 11.1
Mean 6 sites 43.4 61.7 93 5.9
New Moscovian palaeomagnetic pole 349
# 2001 RAS, GJI 147, 343–355
Direction of the C component from the ChRM and thegreat circles
There is a remarkable coincidence in the results obtained with
different approaches. For example, after dip correction, the
mean direction is
D= 134.9u, I= 32.6u, k= 62, a95= 3.3u (32 samples) for
ChRM C (Table 2);
D=134.5u, I=35.8u (21 circles from five sites) for the great
circles only (Table 3);
D=135.7u, I=32.6u, k=70, a95=2.4u for a combination of
the ChRM and the great circles (McFadden & McElhinny 1988).
Finally, the mean direction for all seven sites has been calcu-
lated (using the mean ChRM for sites 14 and 16, the mean
ChRM combined with great circles for sites 1, 5, 8 and 13, and
the mean from the great circles only for site 12): D=138.0u,I=33.7u, k=59, kd=58, a95=6.9u and D=136.1u, I=31.2u,k=130, kd=424, a95=4.6u, before and after dip correction,
respectively (Fig. 12). The fold test for these data (Fig. 13) is
again positive and significant (at the 99 per cent level for kd;
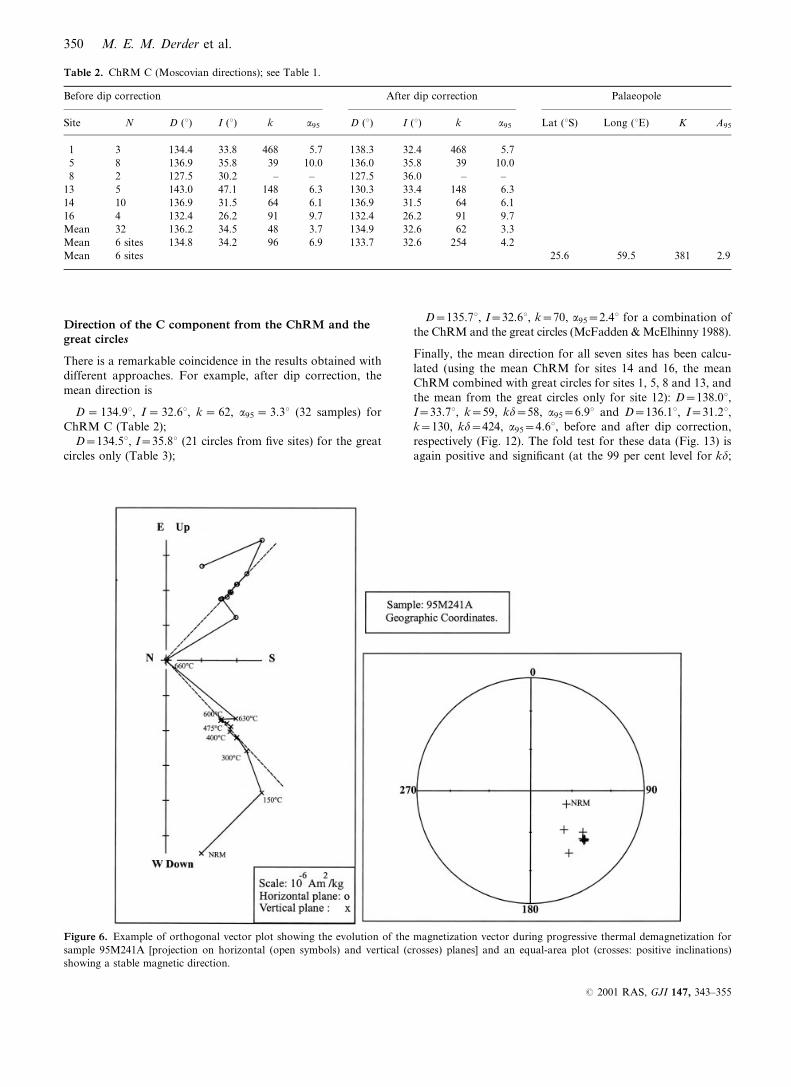
Figure 6. Example of orthogonal vector plot showing the evolution of the magnetization vector during progressive thermal demagnetization for
sample 95M241A [projection on horizontal (open symbols) and vertical (crosses) planes] and an equal-area plot (crosses: positive inclinations)
showing a stable magnetic direction.
Table 2. ChRM C (Moscovian directions); see Table 1.
Before dip correction After dip correction Palaeopole
Site N D (u) I (u) k a95 D (u) I (u) k a95 Lat (uS) Long (uE) K A95
01 3 134.4 33.8 468 5.7 138.3 32.4 468 5.7
05 8 136.9 35.8 39 10.0 136.0 35.8 39 10.0
08 2 127.5 30.2 – – 127.5 36.0 – –
13 5 143.0 47.1 148 6.3 130.3 33.4 148 6.3
14 10 136.9 31.5 64 6.1 136.9 31.5 64 6.1
16 4 132.4 26.2 91 9.7 132.4 26.2 91 9.7
Mean 32 136.2 34.5 48 3.7 134.9 32.6 62 3.3
Mean 6 sites 134.8 34.2 96 6.9 133.7 32.6 254 4.2
Mean 6 sites 25.6 59.5 381 2.9
350 M. E. M. Derder et al.
# 2001 RAS, GJI 147, 343–355

McElhinny 1964) and the maximum values of kd and k are
obtained for unfolding of 111 per cent (kd=452) and 98 per
cent (k=131), respectively. These values are not statistically
different from those obtained at 100 per cent unfolding. The
associated palaeomagnetic pole is situated at 28.3uS, 58.9uE,
K=157, A95=4.2u.
D I S C U S S I O N
This positive fold test confirms the early character of
magnetization C, which was acquired before the first tectonic
episode. This episode is older than the Upper Triassic, and
started before or during the Stephano–Autunian (Attar et al.
1981). The rather negative fold test obtained for the Permian
Figure 7. Same as Fig. 6 for sample 95M117A, showing a partial overlap of blocking temperature spectra of two components of magnetization.
Table 4. Mean direction (D, I in degrees) obtained from each site using a combination of remagnetization circles and ChRM (McFadden &
McElhinny 1988) (N: number of great circles; n: number of ChRMs). Palaeomagnetic pole: Lat. (uS), Long (uE) and corresponding Fisher parameters
(k, a95, K and A95; a95 and A95 in degrees).
Before dip correction After dip correction Palaeopole
Site N n D (u) I (u) k a95 D (u) I (u) k a95 Lat (uS) Long (uE) K A95
01 2 3 132.2 32.6 210 5.7 135.9 31.6 211 5.7
05 4 8 136.8 35.5 38 7.2 136.8 35.5 38 7.2
08 3 2 127.6 29.3 172 6.7 128.5 35.1 172 6.7
12 5 – 155.8 31.2 – – 147.6 22.6 – –
13 3 5 147.2 47.8 139 4.9 133.4 34.8 140 4.8
Mean 17 sp. 32 138.4 35.0 40 3.3 135.7 32.6 70 2.4
Mean 6 sites 139.6 35.7 46 9.3 136.7 32.1 99 6.3
Mean 6 sites 28.2 58.0 116 5.8
Table 3. Mean direction (D, I in degrees) obtained from each site
(N: number of samples) using the remagnetization circles analysis of
Halls (1976, 1978).
Before dip correction After dip correction
Site N D (u) I (u) k a95 D (u) I (u) k a95
05 4 125.3 46.3 125.3 46.3
12 5 155.8 31.2 147.6 22.6
13 3 158.8 30.5 149.6 22.0
Mean 21* 1.3 44.7 134.5 35.8
Mean 3 sites 148.3 36.9 23 16.8 142.3 30.7 21 10.1
* For the calculation of the best intersection using all the great circles, twocircles from site 4 and two circles from site 11 have been integrated.
New Moscovian palaeomagnetic pole 351
# 2001 RAS, GJI 147, 343–355

component also argues for an Upper Carboniferous or Early
Permian age for the folding. The isolation of this Permian
overprint (B) in part of the samples shows that component C
cannot be the result of this widespread Permian remagnetization.
Component C thus represents the primary magnetization of
these Moscovian rocks. Since it was obtained from several
levels of the Moscovian, it therefore constitutes a new and
significant contribution for Moscovian times.
Ignoring the ‘Dwyka pole’ (McElhinny & Opdyke 1968) of
doubtful age (see Henry et al. 1992), the palaeomagnetic pole
associated with the primary component of this study (28.3uS,
58.9uE) is in good agreement with the corresponding segment
of the African apparent polar wander path (Besse et al. 1996;
Chen et al. 1994; Smith et al. 1994). Indeed, it is very close
to the palaeomagnetic poles for stable Africa (Table 5) from
the same period and for neighbouring periods (Fig. 14): the
Table 5. Middle and Upper Carboniferous palaeomagnetic poles for stable Africa.
Symbol Age Rock unit Lat (uS) Long (uE) A95 Reference
HB Upper Namurian–Lower Moscovian Hassi Bachir 26.8 56.6 3.7 Daly & Irving (1983)
AIN1 Lower Moscovian Aın Ech Chebbi 22.9 51.8 6.3 Daly & Irving (1983)
EAL Moscovian El Adeb Larache 28.7 55.9 2.9 Henry et al. (1992)
RN Namurian Reouina 28.4 56.9 1.7 Merabet et al. (1999)
MK Lower Stephanian Merkala 32.4 56.6 2.3 Henry et al. (1999)
OB Bashkirian Oubarakat 28.2 55.5 3.4 Derder et al. (2001a)
AIN2 Middle Carboniferous Aın Ech Chebbi 26.5 44.7 4.7 Derder et al. (2001b)
EDJ Moscovian Edjeleh 28.3 58.9 4.2 this study
Figure 8. Same as Fig. 6 for sample 95M117B, showing a total overlap of blocking temperature spectra of two components of magnetization.
Figure 9. Equal-area plot of ChRM C (Moscovian directions), before
and after dip correction (crosses: positive inclinations).
352 M. E. M. Derder et al.
# 2001 RAS, GJI 147, 343–355

Upper Namurian–Lower Moscovian pole (26.8uS, 56.6uE;
Daly & Irving 1983) at Hassi Bachir (Ahnet basin), the Lower
Moscovian pole (22.9uS, 51.8uE; Daly & Irving 1983) of Aın
Ech Chebbi (Reggane basin), the Moscovian pole (28.7uS,
55.9uE; Henry et al. 1992) at El Adeb Larache (Illizi basin), the
Namurian pole (28.4uS, 56.9uE; Merabet et al. 1999) at Reouiana
(Tindouf basin), the Lower Stephanian pole (32.4uS, 56.6uE;
Henry et al. 1999) at Merkala (Tindouf basin) and the Bashkirian
pole (28.4uS, 57.1uE; Derder et al. 2001a) at Oubarakat (Illizi
Figure 10. Remagnetization circles (a, c) and their corresponding
confidence zones at 63 per cent and 95 per cent (Henry 1999) for their
best intersection (b, d) obtained from 21 specimens distributed over five
sites (equal-area plot, lower hemisphere), in geographical (a, b) and
stratigraphic (c, d) coordinates.
Figure 11. Variation of ky and kx (Le Goff 1990; Le Goff et al.
1992) parameters from great circles (Henry 1999) during progressive
unfolding. The kx values are of little significance because of the
scattering of the best intersections within the plane corresponding to
most of the great circles.
Figure 12. Equal-area plot of the mean ChRM direction with
associated 95 per cent confidence zone at each site, in geographical
and stratigraphic coordinates (Tables 3 and 4). The direction without
confidence zone is that obtained from site 12 using Halls’ (1976)
method (Table 3).
Figure 13. Variation of kd (Henry & Le Goff 1994) and k (Fisher
1953) parameters during progressive unfolding.
New Moscovian palaeomagnetic pole 353
# 2001 RAS, GJI 147, 343–355

basin). However, unlike all these poles, the age of the Edjeleh
pole is constrained by a palaeomagnetic test. These new results
thus confirm the reliability of the previous poles and validate
them.
This datum is not far from a new pole (with both positive
reversal and fold tests) of Middle Carboniferous age (26.5uS,
44.7uE, K=383, A95=4.7u; Fig. 14) determined recently (Derder
et al. 2001b) in the Bled El Mass region (near the Ain Ech Chebbi
area, Reggane basin).
It should be noted that all the African Upper Carboniferous
poles are in fact obtained from the Saharan platform. The
coherence observed between these data obtained from distant
places of this wide platform (Illizi basin is situated in the
eastern part of this platform, Ahnet and Reggane basins in the
central part and Tindouf basin in the western part; Fig. 1b)
leads to a very good knowledge of the Namuro–Westphalian
part of the apparent polar wander path for Africa, and in
particular for the North African craton (Ricou & Besse 1998).
C O N C L U S I O N S
As in most of the previous palaeomagnetic studies of the
Saharan platform, the results obtained in the well-dated marine
Moscovian formation at Edjeleh show the existence of Cenozoic
and Permian remagnetization events. The primary remanent mag-
netization was also isolated and its acquisition age confirmed
by a positive fold test. The corresponding palaeomagnetic
pole (28.3uS, 58.9uE, K=157, A95=4.2u) thus constitutes, with
the recent datum of Bled El Mass, the first African Upper
Carboniferous pole with an age constrained by a statistical
positive fold test. Because it is in good agreement with the
previously published African poles for neighbouring periods
determined without palaeomagnetic tests, it confirms their
reliability.
When combined with previous Gondwana poles, the new
datum deduced from this study reinforces the recent result of
Derder et al. (2001a), which shows that a better reconstruction
is obtained for Gondwana for this interval of time if Ricou’s
parameters (Ricou et al. 1990) are used rather than those from
the classical model of Du Toit (1937).
This new result also confirms the model of Matte (1986)
and Henry et al. (1992), which stipulates that the latitudinal
displacement of Africa during the Carboniferous was mainly
related to a large clockwise rotation (about 25u). This model,
which explains the evolution of the main collision area between
Gondwana and Laurussia during the Carboniferous, is more
compatible with the Permian Pangaea A2 reconstruction
(Van der Voo 1981).
The results obtained in this study and in that undertaken in
the Bled El Mass region (Reggane basin; Derder et al. 2001b)
underline the value of investigating folded areas in cratonic
regions. This is why the folded Hassi Bachir Formation of
Upper Namurian–Lower Moscovian age (Ahnet basin) must
be revisited in order to determine a more reliable Upper
Carboniferous African pole by studying this geological formation
in more detail than in the Daly & Irving (1983) study.
A C K N O W L E D G M E N T S
We are very grateful to the Sonatrach Production Department,
especially Mr Sahar and Mr Benslama (head of In Amenas
base) and to Mr Touba for his help with the fieldwork. Our
Figure 14. African Middle to Upper Carboniferous palaeomagnetic poles (see Table 5).
354 M. E. M. Derder et al.
# 2001 RAS, GJI 147, 343–355

thanks also go to Mansour Bina and Henri Rouvier for their
help in measurement of the samples and to Haydar Aziz Baker
for help with the manuscript. Thanks also to Heinrich Soffel
and an anonymous referee for their constructive reviews.
R E F E R E N C E S
Achab, A., 1970. Le Permo-Trias saharien, Associations palynologiques
et leurs applications en stratigraphie, Thesis, Algiers University,
Algiers.
Aifa, T., 1987. Paleomagnetisme en zones de collision: deformations
recentes dans l’arc Tyrrhenien et raccourcissement crustal hercynien
en Afrique, Thesis, Paris 7 University, Paris.
Attar, A., Fabre, J., Janvier, P. & Lehmann, J.P., 1981. Les vertebres de
la formation de Tiguentourine (Permo-Carbonifere, bassin d’Illizi,
Algerie), Bull. Museum Natl d’Histoire Naturelle Paris, 4eme Serie, 3C,
301–309.
Besse, J., Theveniaut, H. & Courtillot, V., 1996. Apparent polar
wandering paths for North America, Africa, Laurussia and
West Gondwana since the Upper Carboniferous: a review, in
Tethys Paleoenvironments, Ocean Basins and Margins, pp. 71–97,
ed. Nairn, A.E.M., Plenum Press, New York.
Chen, Z., Li, Z.H., Powell, C.M. & Balme, B.E., 1994. An Early
Carboniferous paleomagnetic pole for Gondwanaland: new results
from the Mount Eclipse Sandstone in the Ngalia Basin, central
Australia, J. geophys. Res., 99 (B2), 2909–2924.
CRZA & CNRS, 1965. Geological Map of Illizi (Fort de Polignac),
Carte geologique de l’Algerie, Map NG 32 NO-NE, 1: 500 000.
Daly, L. & Irving, E., 1983. Paleomagnetisme des roches carboniferes
du Sahara central; analyse des aimantations juxtaposees; configurations
de la Pangee, Ann. Geophys., 1, 207–216.
de Lapparent, A.F., 1949. Premiere description geologique de l’Edjeleh
Tan In Azzaoua (N.E de l’Ajjers, Sahara), Ann. Soc. Geol. Du Nord,
69, 86–89.
Derder, M.E.M., Henry, B., Merabet, N. & Daly, L., 1994a.
Paleomagnetism of the Stephano–Autunian Lower Tiguentourine
Formations from stable Saharan craton (Algeria), Geophys. J. Int.,
116, 12–22.
Derder, M.E.M., Henry, B. & Merabet, N., 1994b. Paleomagnetism of
the Middle Zarzaıtine formation of Liassic-Dogger age from the
stable Saharan craton (Illizi Basin, Algeria), in XIXth Gen. Assemb.
EGS, p. 121, Grenoble, France.
Derder, M.E.M., Henry, B., Merabet, N., Amenna, M. & Bourouis, S.,
2001a. Upper Carboniferous palaeomagnetic pole from stable Saharan
craton and the Gondwana reconstructions, J. African Earth Sci.,
in press.
Derder, M.E.M., Smith, B., Henry, B., Yelles, A.K., Bayou, B.,
Djellit, H., Ait Ouali, R. & Gandriche, H., 2001b. Juxtaposed
and superimposed paleomagnetic primary and secondary com-
ponents from the folded Middle Carboniferous sediments in
the Reggane Basin (Saharan craton, Algeria), Tectonophysics, 332,
403–422.
Durif, P., 1959. Observations micropaleontologiques (foraminiferes)
sur le Carbonifere marin du bassin de Fort de Polignac (Sahara
oriental), Bull. Soc. Geol. Fr., 7, 163–165.
Du Toit, A.L., 1937. Our Wandering Continents, an Hypothesis of
Continental Drifting, Oliver and Boyd, Edinburgh.
Fisher, R.A., 1953. Dispersion on a sphere, Proc. R. Soc. Lond., A217,
295–305.
Halls, H.C., 1976. A least squares method to find a remanence direction
from converging remagnetization circles, Geophys. J. R. astr. Soc.,
45, 297–304.
Halls, H.C., 1978. The use of converging remagnetization circles in
paleomagnetism, Phys. Earth planet. Inter., 16, 1–11.
Henry, B., 1999. Confidence zone from remagnetization circles: a new
possibility for the fold tests, Euro. Un. Geosci., Vol. 10, Strasbourg,
France.
Henry, B. & Le Goff, M., 1994. A new tool for palaeomagnetic
interpretation: the bivariate extension of the Fisher statistics, XIXth
Gen. Assemb. EGS, p. 123, Grenoble, France.
Henry, B., Merabet, N., Yelles, A., Derder, M.E.M. & Daly, L., 1992.
Geodynamical implications of a Moscovian palaeomagnetic pole
from the stable Sahara craton (Illizi basin, Algeria), Tectonophysics,
201, 83–96.
Henry, B., Merabet, N., Bouabdallah, H. & Maouche, S., 1999.
Nouveau pole paleomagnetique stephanien inferieur pour le craton
saharien (Formation de Merkala, bassin de Tindouf, Algerie), C. R.
Acad. Sci. Paris, 329, IIa, 161–166.
Kies, B., Henry, B., Merabet, N., Derder, M.M. & Daly, L., 1995. A
new Late Triassic–Liassic palaeomagnetic pole from superimposed
and juxtaposed magnetizations in the Saharan craton, Geophys. J.
Int., 120, 433–444.
Kirschvink, J.L., 1980. The least-squares line and plane analysis of
palaeomagnetic data, Geophys. J. R. astr. Soc., 62, 699–718.
Le Goff, M., 1990. Lissage et limites d’incertitude des courbes de
migration polaire; ponderation des donnees et extension bivariate de
la statistique de Fisher, C. R. Acad. Sci. Paris, 311 (II), 1191–1198.
Le Goff, M., Henry, B. & Daly, L., 1992. Practical method for drawing
a VGP path, Phys. Earth planet. Inter., 70, 201–204.
Legrand-Blain, M., 1980. Le Carbonifere marin du bassin d’Illizi
(Sahara algerien oriental), Mise au point stratigraphique, C. R.
Somm. Soc. Geol. Fr., 3, 81–83.
Matte, P., 1986. La chaıne varisque parmi les chaınes paleozoıques
peri-atlantiques, modele d’evolution et position des grands blocs
continentaux au Permo-Carbonifere, Bull. Soc. Geol. Fr., 8, 9–24.
McElhinny, M.W., 1964. Statistical significance of the fold test in
paleomagnetism, Geophys. J. R. astr. Soc., 8, 338–340.
McElhinny, M.W. & Opdyke, N.D., 1968. The paleomagnetism of
some Carboniferous glacial varves from Central Africa, J. geophys.
Res., 73, 689–696.
McFadden, P.L. & McElhinny, M.W., 1988. The combined analysis of
remagnetization circles and direct observations in palaeomagnetism,
Earth planet Sci. Lett., 87, 161–172.
Merabet, N., Henry, B., Bouabdallah, H. & Maouche, S., 1999.
Paleomagnetism of the Djebel Reouiana Namurian formation
(Tindouf Basin, Algeria), Stud. Geophys. Geodaet., 43, 376–389.
Odin, G.S., 1994. Geological time scale, C. R. Acad. Sci. Paris, 318,
59–71.
Ricou, L.E. & Besse, J., 1998. Improving the fit of Gondwana,
J. African Earth Sci., 27, 159.
Ricou, L.E., Besse, J., Marcoux, J. & Patriat, P., 1990. Une
reconstruction du Gondwana revisee a partir de donnees pluri-
disciplinaires, C. R. Acad. Sci. Paris, 311, 463–469.
Smith, B., Moussine-Pouchkine, A. & Ait Kaci Ahmed, A., 1994.
Paleomagnetic investigation of Middle Devonian limestones of Algeria
and the Gondwana reconstruction, Geophys. J. Int., 119, 166–186.
Van der Voo, R., 1981. A paleomagnetic comparison of various
reconstructions of the Atlantic bordering continents which have
implications for the origin of the Gulf of Mexico, Houston geol. Soc.
Continuing Edu. Ser., Proc. Symp., pp. 19–20.
Wilson, R.L. & Everitt, C.W.F., 1963. Thermal demagnetization of
some carboniferous lavas for palaeomagnetic purposes, Geophys. J.
R. astr. Soc., 8, 149–164.
Zijderveld, J.D.A., 1967. AC demagnetization of rocks: analysis
of results, in Method in Paleomagnetism, pp. 254–286, eds
Collinson, D.W., Creer, K.M. & Runcorn, S.K., Elsevier, Amsterdam.
New Moscovian palaeomagnetic pole 355
# 2001 RAS, GJI 147, 343–355
Copyright © 2022 FDOKUMEN