Prediction of the volumetric and thermodynamic properties of some refrigerants using GMA equation of...
7
Fluid Phase Equilibria 268 (2008) 61–67 Contents lists available at ScienceDirect Fluid Phase Equilibria journal homepage: www.elsevier.com/locate/fluid Prediction of volumetric and thermodynamic properties of two aromatic–alcohol mixtures using GMA equation of state Elaheh K. Goharshadi ∗ , Maryam Abareshi Department of Chemistry, Ferdowsi University of Mashhad, Mashhad 91779, Iran article info Article history: Received 28 May 2006 Received in revised form 13 March 2008 Accepted 21 March 2008 Available online 8 April 2008 Keywords: Excess properties GMA equation of state Isobaric thermal expansion coefficient Isothermal compressibility coefficient Internal pressure Tait equation abstract In this work, we have calculated the densities of two mixtures composed of 1-propanol + toluene and ethanol + toluene at different temperatures, pressures, and compositions using GMA equation of state (EoS). We have also calculated some thermodynamic properties of these mixtures such as isobaric thermal expansion coefficient, isothermal compressibility coefficient, internal pressure, and excess functions such as the excess volumes, excess Gibbs free energy, excess enthalpy, excess entropy, excess internal energy, and excess Helmholtz free energy. A wide comparison with the experimental data shows the ability of this equation of state to reproduce and predict different thermodynamic properties. The composition dependence of the parameters of this equation of state has been assumed as quadratic functions of mole fraction. Using these quadratic mixing rules, the excellent agreement has been obtained between the calculated values and experimental data. To assess the validity of GMA EoS, the density of studied mixtures has been calculated based on this equation of state and Tait equation and compared using statistical parameters. The lower values of statis- tical parameters obtained by GMA EoS for these mixtures confirm the ability of this EoS to reproduce and predict the density of mixtures. © 2008 Elsevier B.V. All rights reserved. 1. Introduction The ability of aromatic compounds to act as electron donors with their electrons has been investigated by several researchers [1–4]. Because of this ability, weak intermolecular interactions, such as hydrogen bonding, can be formed in mixtures composed of aromatic compounds and polar or associating compounds. In the recent investigation using FTIR spectroscopy, Brinkley and Gupta [4] found a clear evidence for the formation of hydrogen bond- ing between aromatic hydrocarbons and alcohols. They studied qualitatively the degree of hydrogen bonding formation by adding aromatic hydrocarbons to alkane + alcohol mixtures having a very low content of alcohol in order to avoid any influence of self- association of the alcohol [5]. In petroleum and gasoline fluids, aromatic hydrocarbons are important constituents. With the addition of polar compounds, such as ethanol, to these systems, and as a result of the ability of aromatic compounds to act as electron donors, intermolecular interactions between the electrons of the aromatic hydrocar- ∗ Corresponding author. Tel.: +98 511 8797022; fax: +98 511 8796416. E-mail address: [email protected] (E.K. Goharshadi). bons and the hydroxyl group of, e.g. ethanol can occur, resulting interesting and complex behaviors of the mixtures [1–4]. The binary mixtures containing alcohols and aromatics have been studied with a considerable interest because these mixtures exhibit varying molecular interactions and are important from a practical point of view. Alcohols and aromatics are widely used in variety of industrial and consumer applications, such as perfumes, cosmetics, paints, varnishes, drugs, fuels, explosives, fats, waxes, resins, plastics, rubbers, detergents, DDT, and etc. [6]. A new equation of state (EoS) has been recently intro- duced for liquids by Goharshadi et al. [7–11] (Goharshadi– Morsali–Abbaspour “GMA EoS”). It has been used to calculate differ- ent thermodynamic and volumetric properties for a wide range of fluids including polar, nonpolar, refrigerants, and hydrogen-bonded fluids [7–11]. The EoS has been also applied for liquid mixtures properly [12,13]. It has been known that the GMA EoS can reproduce the differ- ent volumetric and thermodynamic properties for all these fluids within experimental errors [7–13]. The purpose of the present paper is to predict and reproduce some thermodynamic and volumetric properties such as isobaric thermal expansion coefficient, isothermal compressibility coeffi- cient, internal pressure, and excess properties of two mixtures 0378-3812/$ – see front matter © 2008 Elsevier B.V. All rights reserved. doi:10.1016/j.fluid.2008.03.016
Transcript of Prediction of the volumetric and thermodynamic properties of some refrigerants using GMA equation of...
Fluid Phase Equilibria 268 (2008) 61–67
Contents lists available at ScienceDirect
Fluid Phase Equilibria
journa l homepage: www.e lsev ier .com/ locate / f lu id
Prediction of volumetric and thermodynamic properties of twoaromatic–alcohol mixtures using GMA equation
of stateElaheh K. Goharshadi ∗, Maryam AbareshiDepartment of Chemistry, Ferdowsi University of Mashhad, Mashhad 91779, Iran
culatent tted shermcess Ge eneprod
dence. Usinlues
f GMAequatby GMtures
a r t i c l e i n f o
Article history:Received 28 May 2006Received in revised form 13 March 2008Accepted 21 March 2008Available online 8 April 2008
Keywords:Excess propertiesGMA equation of stateIsobaric thermal expansion coefficientIsothermal compressibility coefficientInternal pressureTait equation
a b s t r a c t
In this work, we have calethanol + toluene at differ(EoS). We have also calculaexpansion coefficient, isotas the excess volumes, exand excess Helmholtz frethis equation of state to re
The composition depenfunctions of mole fractionbetween the calculated va
To assess the validity oequation of state and Taittical parameters obtainedpredict the density of mix
1. Introduction
The ability of aromatic compounds to act as electron donorswith their � electrons has been investigated by several researchers[1–4]. Because of this ability, weak intermolecular interactions,such as hydrogen bonding, can be formed in mixtures composed ofaromatic compounds and polar or associating compounds. In therecent investigation using FTIR spectroscopy, Brinkley and Gupta[4] found a clear evidence for the formation of hydrogen bond-ing between aromatic hydrocarbons and alcohols. They studiedqualitatively the degree of hydrogen bonding formation by addingaromatic hydrocarbons to alkane + alcohol mixtures having a verylow content of alcohol in order to avoid any influence of self-association of the alcohol [5].
In petroleum and gasoline fluids, aromatic hydrocarbons areimportant constituents. With the addition of polar compounds,such as ethanol, to these systems, and as a result of the abilityof aromatic compounds to act as electron donors, intermolecularinteractions between the � electrons of the aromatic hydrocar-
∗ Corresponding author. Tel.: +98 511 8797022; fax: +98 511 8796416.E-mail address: [email protected] (E.K. Goharshadi).
0378-3812/$ – see front matter © 2008 Elsevier B.V. All rights reserved.doi:10.1016/j.fluid.2008.03.016
ed the densities of two mixtures composed of 1-propanol + toluene andemperatures, pressures, and compositions using GMA equation of stateome thermodynamic properties of these mixtures such as isobaric thermalal compressibility coefficient, internal pressure, and excess functions suchibbs free energy, excess enthalpy, excess entropy, excess internal energy,
rgy. A wide comparison with the experimental data shows the ability ofuce and predict different thermodynamic properties.of the parameters of this equation of state has been assumed as quadratic
g these quadratic mixing rules, the excellent agreement has been obtainedand experimental data.
EoS, the density of studied mixtures has been calculated based on thision and compared using statistical parameters. The lower values of statis-
A EoS for these mixtures confirm the ability of this EoS to reproduce and.
© 2008 Elsevier B.V. All rights reserved.
bons and the hydroxyl group of, e.g. ethanol can occur, resultinginteresting and complex behaviors of the mixtures [1–4].
The binary mixtures containing alcohols and aromatics havebeen studied with a considerable interest because these mixturesexhibit varying molecular interactions and are important from apractical point of view. Alcohols and aromatics are widely used invariety of industrial and consumer applications, such as perfumes,cosmetics, paints, varnishes, drugs, fuels, explosives, fats, waxes,resins, plastics, rubbers, detergents, DDT, and etc. [6].
A new equation of state (EoS) has been recently intro-duced for liquids by Goharshadi et al. [7–11] (Goharshadi–Morsali–Abbaspour “GMA EoS”). It has been used to calculate differ-ent thermodynamic and volumetric properties for a wide range offluids including polar, nonpolar, refrigerants, and hydrogen-bondedfluids [7–11]. The EoS has been also applied for liquid mixturesproperly [12,13].
It has been known that the GMA EoS can reproduce the differ-ent volumetric and thermodynamic properties for all these fluidswithin experimental errors [7–13].
The purpose of the present paper is to predict and reproducesome thermodynamic and volumetric properties such as isobaricthermal expansion coefficient, isothermal compressibility coeffi-cient, internal pressure, and excess properties of two mixtures

uid Phase Equilibria 268 (2008) 61–67
ln T) + RT2�(5)
n T)(6)
Bmix = x21B11 + 2x1x2B12 + x2
2B22 (15)
The parameters A11, A22, B11, and B22 can be obtained from exper-imental P–V–T data of pure fluids. The values of A12 and B12 havebeen calculated using one binary mixture.
3. Results and discussions
We have tested the GMA EoS for two different mixturesof ethanol + toluene and 1-propanol + toluene. Fig. 1 shows the
typical isotherms of (2Z − 1)V3m versus � (Eq. (1)) for
ethanol + toluene. Table 1 represents the minimum and maxi-mum values of square of correlation coefficient (R2) of Eq. (1),
62 E.K. Goharshadi, M. Abareshi / Fl
composed of ethanol + toluene and 1-propanol + toluene using anew equation of state called GMA equation of state at the extendedranges of temperature and pressure.
2. GMA EoS and derived properties
The GMA equation of state is based on the average potentialenergy and is given as
(2Z − 1)V3m = A(T, X) + B(T, X)� (1)
where Z, Vm, and � are compressibility factor, molar volume, anddensity, respectively. The intercept and slope of this equationdepend on temperature via the equations:
A(T, X) = A0 − 2A1
RT+ 2A2 ln T
R(2)
B(T, X) = B0 − 2B1
RT+ 2B2 ln T
R(3)
where A0 − A2 and B0 − B2 are constants for each composition. Touse the equation of state for a liquid, the A and B parameters must beknown. To find these parameters, we may plot (2Z − 1)V3
m versus �for different isotherms. The slope and intercept of the straight linescan be fitted to Eqs. (2) and (3) from which A0 − A2 and B0 − B2 canbe found, respectively.
The density can be calculated based on the GMA EoS using thefollowing equation:
B(T, x)�5 + A(T, x)�4 + � − 2p
RT= 0 (4)
Isobaric expansion coefficient, ˛P = (1/V)(∂V/∂T)P, isothermal com-pressibility coefficient, �T = −(1/V)(∂V/∂P)T, and internal pressure,Pi = (∂U/∂V)T, can be calculated using the GMA EoS from the follow-ing equations:
˛P = (2B1 + 2B2T)�5 + (2A1 + 2A2T)�4 + 2P
5�5(RT2B0 − 2B1T + 2T2B2 ln T) + 4�4(A0RT2 − 2A1T + 2A2T2
�T = 2�RT + 4�4(RTA0 − 2A1 + 2TA2 ln T) + 5�5(B0RT − 2B1 + 2B2T l
Pi = (B1 + B2T)�5 + (A1 + A2T)�4 (7)
The values of the excess molar volume, VEm, can be calculated from
the following equation:[xM + (1 − x)M
] [xM (1 − x)M
]
VE = 1 2�− 1
�1+ 2
�2(8)
where � and �i are the densities of liquid mixture and pure com-ponents, respectively. Mi stands for the molar masses of purecomponents i (i = 1, 2).
Other excess properties can be calculated using the followingequations:
GE =∫ P
0
VE dp (9)
HE =∫ p
0
(VE − T
(∂VE
∂T
))dP (10)
SE = HE − GE
T(11)
UE = HE − PVE (12)
AE = UE − TSE (13)
In order to obtain reliable predictions of mixture thermodynamicproperties from equations of state, the suitable mixing rules are
Fig. 1. Isotherms of (2Z − 1)V3m versus � for a mixture of ethanol (1) + toluene (2)
(xethanol = 0.5) [14].
required. In this work, the composition dependence of the param-eters can be assumed as the quadratic functions of mole fraction:
Amix = x21A11 + 2x1x2A12 + x2
2A22 (14)
pressure and temperature ranges of the data, and the number of
Table 1The minimum and maximum values of square of correlation coefficient (R2) of Eq.(1), pressure and temperature ranges
x1 R2min
− R2max �P (MPa) �T (K) NP
Ethanol (1) + toluene (2) [14]0.000 0.9999–1.0000 0.1–45 283.15–353.15 800.125 0.9998–0.9999 0.1–45 283.15–353.15 800.250 0.9997–0.9999 0.1–45 283.15–353.15 790.375 0.9998–0.9999 0.1–45 283.15–353.15 790.500 0.9998–0.9999 0.1–45 283.15–353.15 790.625 0.9998–0.9999 0.1–45 283.15–353.15 790.750 0.9999–1.0000 0.1–45 283.15–353.15 790.875 0.9998–1.0000 0.1–45 283.15–353.15 791.000 0.9959–0.9999 0.1–45 283.15–353.15 79
1-Propanol (1) + toluene (2) [5]0.0 0.9999–1.0000 0.1–30 303.15–333.15 280.2 0.9999–1.0000 0.1–30 303.15–333.15 280.4 0.9999–1.0000 0.1–30 303.15–333.15 280.6 0.9998–1.0000 0.1–30 303.15–333.15 280.8 0.9997–1.0000 0.1–30 303.15–333.15 281.0 0.9999–1.0000 0.1–30 303.15–333.15 28

E.K. Goharshadi, M. Abareshi / Fluid Phase Equilibria 268 (2008) 61–67 63
ary m
2
.99983
.99995
.99989
.99970
.99992
.99993
.99978
.99975
.99942
.99996
.99926
.99977
.99766
Table 2Values of constants of GMA EoS and correlation coefficient of Eqs. (2) and (3) for bin
x1 A0 (L3 mol−3) A1 (L4 atmmol−4) A2 (L4 atmmol−4 K−1) R
Ethanol (1) + toluene (2) [14]0.000 0.58852 3.56997 −0.00303 00.125 0.24032 2.35438 −0.00104 00.250 0.15573 1.73815 −0.00063 00.375 0.03816 1.15419 0.00000 00.500 0.01120 0.83241 0.00011 00.625 0.05771 0.68300 −0.00023 00.750 −0.04095 0.31423 0.00033 00.875 −0.01356 0.23191 0.00013 01.000 0.01426 0.18748 −0.00006 0
1-Propanol (1) + toluene (2) [5]0.0 −0.97191 0.46076 0.00639 00.2 −1.32442 −0.75055 0.00842 00.4 −1.53275 −1.58892 0.00959 00.6 −0.79461 −0.50679 0.00504 0
0.8 −0.03411 0.66970 0.00036 1.000001.0 0.73137 1.90555 −0.00435 0.99879points of studied mixtures. As Fig. 1 and the values of the square ofcorrelation coefficient of Table 1 show the linearity of (2Z − 1)V3
mversus � hold very well for these mixtures. Table 2 shows thevalues of the constants of Eqs. (2) and (3) for tested mixtures. As ananother test, the density of two mixtures at different temperatures,pressures, and compositions has been calculated using GMA EoSand the results compared with their corresponding experimentaldata using statistical parameters (Table 3).
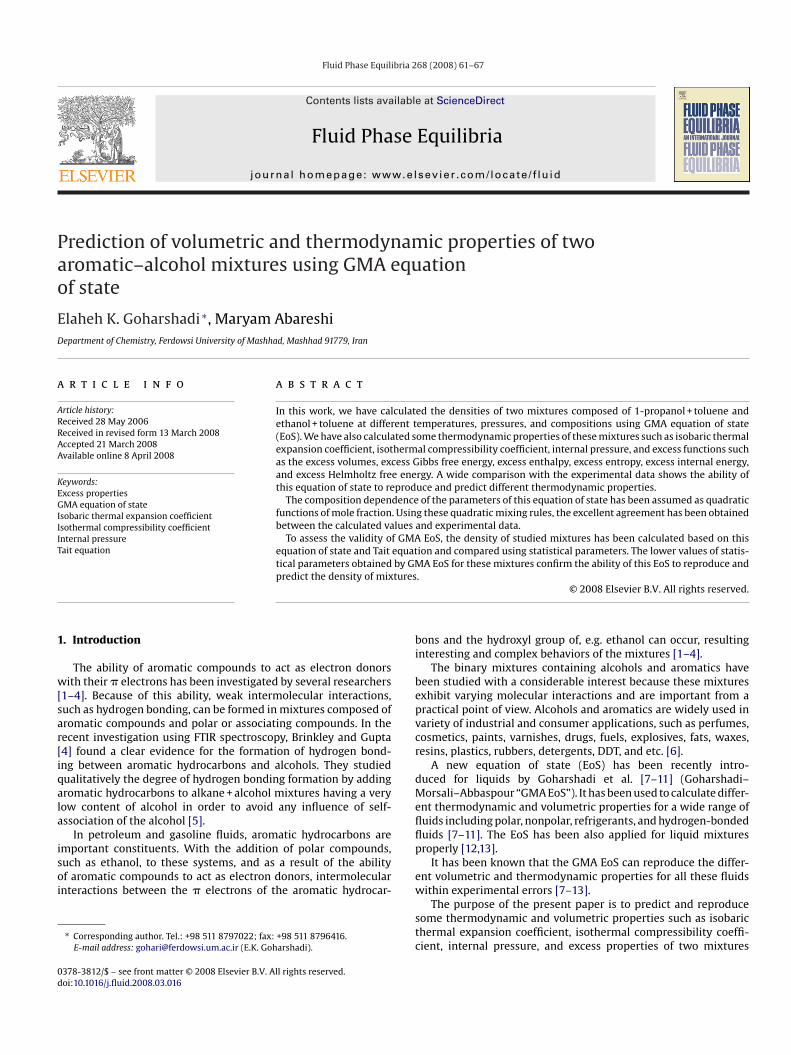
Figs. 2 and 3 show isothermal compressibility coefficient ver-sus mole fraction for 1-propanol + toluene and isobaric thermalexpansion coefficient versus mole fraction for ethanol + toluene atdifferent temperatures and pressures.
The statistical parameters correspond to calculation the density,isobaric thermal expansion coefficient, isothermal compressibilitycoefficient, internal pressure, and the number of points for twomixtures have been calculated and given in Table 3. The values
Table 3Absolute average deviation AADa and average percentual deviation biasb of calculated apressibility coefficient, and internal pressure for two binary mixtures
� �T
x1 AAD bias NP AAD bias NP
Propanol (1) + toluene (2) [5]0.0 0.005 −0.004 28 0.667 0.074 280.2 0.007 −0.006 28 0.959 −0.294 280.4 0.006 −0.005 28 0.923 −0.223 280.6 0.007 −0.006 28 0.695 −0.054 280.8 0.007 −0.006 28 1.248 0.126 281.0 0.005 −0.004 28 0.924 0.024 28
Ethanol (1) + toluene (2) [14]0.000 0.009 −0.008 80 1.338 0.369 400.125 0.012 −0.011 80 1.321 0.291 400.250 0.012 −0.011 79 1.480 0.345 400.375 0.012 −0.012 79 1.488 0.629 400.500 0.013 −0.012 79 1.526 0.688 400.625 0.013 −0.011 79 1.579 0.642 400.750 0.011 −0.010 79 1.602 0.619 400.875 0.014 −0.013 79 1.676 1.081 401.000 0.022 −0.004 79 2.050 0.554 40
a AAD = 1N
N∑i=1
100∣∣ xexp−xcal
xexp
∣∣.
b Bias = 1N
N∑i=1
100(
xexp−xcalxexp
).
ixtures
B0 (L4 mol−4) B1 (L5 atmmol−5) B2 (L5 atmmol−5 K−1) R2
−0.03747 −0.29219 0.00019 0.99976−0.00632 −0.17241 0.00001 0.99992−0.00473 −0.12303 0.00001 0.99982
0.00293 −0.07422 −0.00003 0.999560.00307 −0.05000 −0.00003 0.99988
−0.00222 −0.04063 0.00001 0.999900.00383 −0.01555 −0.00003 0.999670.00128 −0.01124 −0.00001 0.999620.00035 −0.00700 0.00000 0.99932
0.12967 0.04056 −0.00082 0.999930.14768 0.13312 −0.00092 0.998870.15224 0.18618 −0.00094 0.999620.07336 0.06620 −0.00046 0.99652
0.00392 −0.04257 −0.00003 0.99999−0.05538 −0.13789 0.00033 0.99822
of statistical parameters show GMA EoS can predict these ther-mophysical properties very well in accord to the correspondingexperimental data.
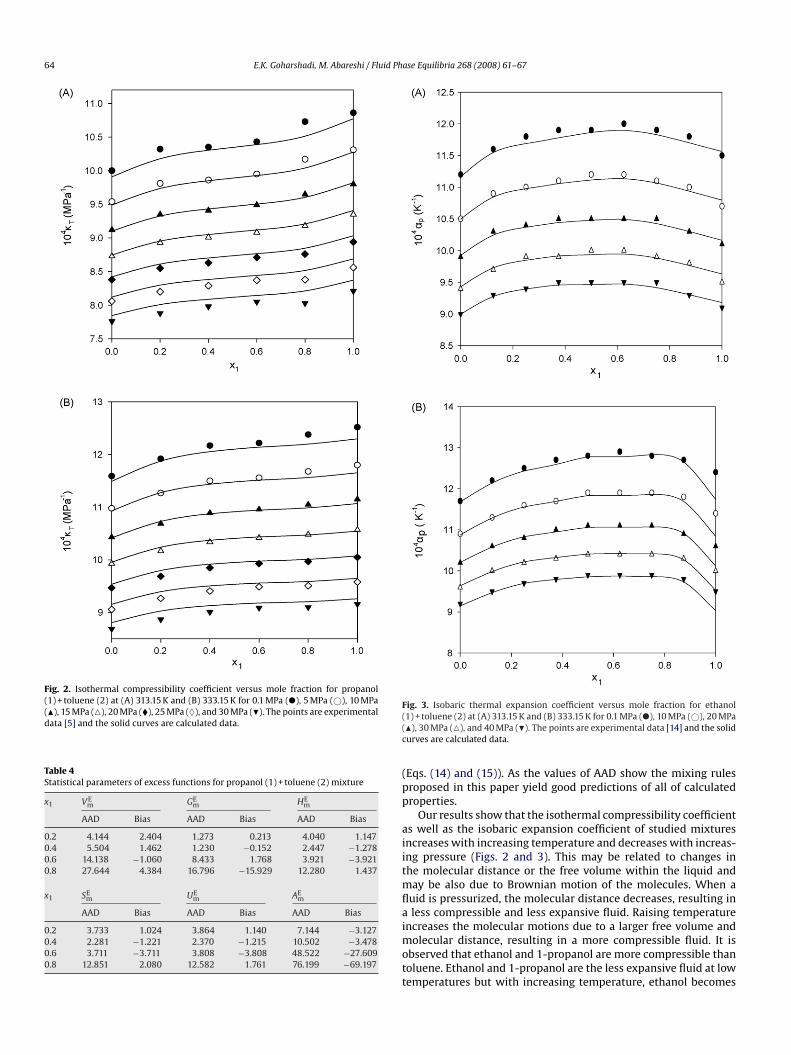
Fig. 4 represents a typical plot of excess molar volume versusmole fraction of 1-propanol at different temperatures and pressuresfor mixtures of 1-propanol + toluene.
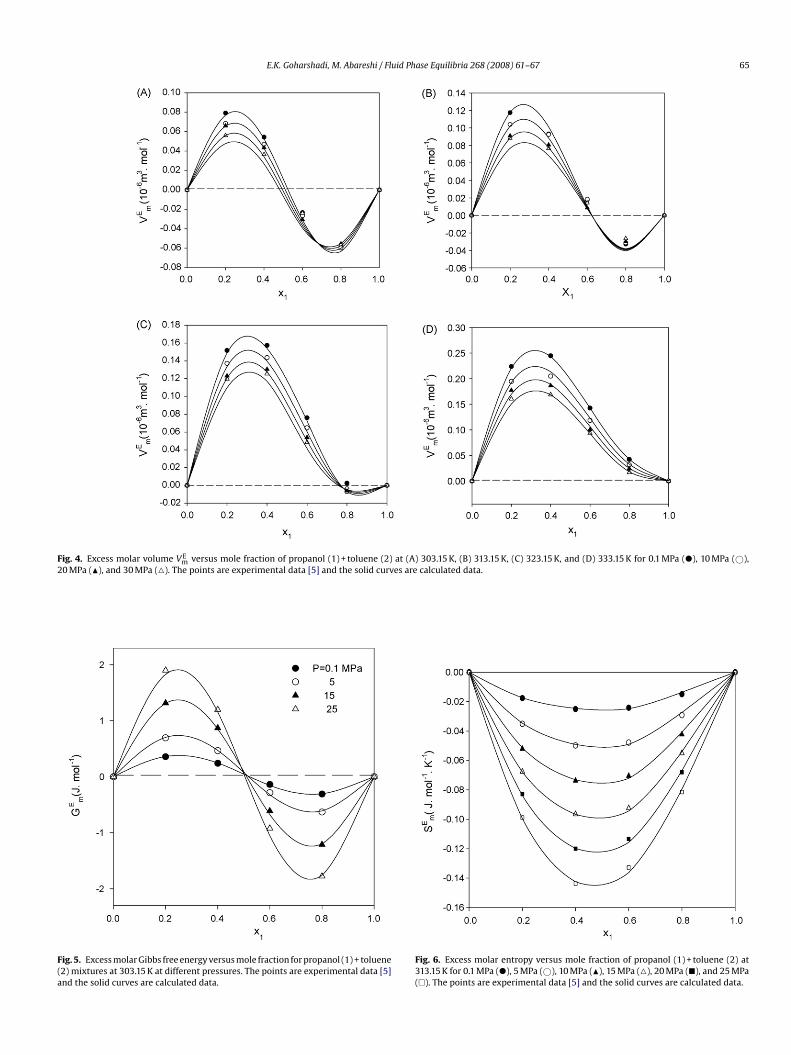
Typical graphs for excess molar Gibbs free energy and excessmolar entropy for mixtures of 1-propanol + toluene are given inFigs. 5 and 6, respectively. The statistical parameters for excess func-tions for mixtures of 1-propanol + toluene and ethanol + toluenehave been calculated and given in Tables 4 and 5, respectively.
We have examined the quadratic composition dependence ofthe parameters A and B (Eqs. (14) and (15)) using experimental datafor binary fluid mixtures. The accuracy of the prediction can bedescribed by AAD and bias. Table 6 shows the values of AAD and biasof calculated all thermodynamic properties using the mixing rules
nd experimental density, isobaric thermal expansion coefficient, isothermal com-
.˛P Pi
AAD bias NP AAD bias NP
0.484 −0.236 28 0.765 −0.145 281.048 −0.223 28 1.338 0.096 281.632 −0.448 28 1.968 −0.220 282.208 −0.614 28 2.407 −0.571 282.497 −0.120 28 2.750 −0.239 282.615 0.187 28 0.765 −0.145 28
0.376 0.168 30 1.369 0.326 240.343 0.063 30 1.260 0.288 240.386 0.288 29 1.399 0.359 240.370 0.171 29 1.121 −0.066 240.385 0.256 29 1.442 0.041 240.350 0.259 30 1.274 0.135 240.480 0.322 29 1.426 0.289 240.320 0.151 29 1.389 −0.645 244.444 −0.803 29 5.002 −0.544 24
64 E.K. Goharshadi, M. Abareshi / Fluid Phase Equilibria 268 (2008) 61–67
Fig. 2. Isothermal compressibility coefficient versus mole fraction for propanol(1) + toluene (2) at (A) 313.15 K and (B) 333.15 K for 0.1 MPa (�), 5 MPa (©), 10 MPa(�), 15 MPa (�), 20 MPa (�), 25 MPa (♦), and 30 MPa (�). The points are experimentaldata [5] and the solid curves are calculated data.
Table 4Statistical parameters of excess functions for propanol (1) + toluene (2) mixture
x1 VEm GE
m HEm
AAD Bias AAD Bias AAD Bias
0.2 4.144 2.404 1.273 0.213 4.040 1.1470.4 5.504 1.462 1.230 −0.152 2.447 −1.2780.6 14.138 −1.060 8.433 1.768 3.921 −3.9210.8 27.644 4.384 16.796 −15.929 12.280 1.437
x1 SEm UE
m AEm
AAD Bias AAD Bias AAD Bias
0.2 3.733 1.024 3.864 1.140 7.144 −3.1270.4 2.281 −1.221 2.370 −1.215 10.502 −3.4780.6 3.711 −3.711 3.808 −3.808 48.522 −27.6090.8 12.851 2.080 12.582 1.761 76.199 −69.197
Fig. 3. Isobaric thermal expansion coefficient versus mole fraction for ethanol(1) + toluene (2) at (A) 313.15 K and (B) 333.15 K for 0.1 MPa (�), 10 MPa (©), 20 MPa(�), 30 MPa (�), and 40 MPa (�). The points are experimental data [14] and the solidcurves are calculated data.
(Eqs. (14) and (15)). As the values of AAD show the mixing rulesproposed in this paper yield good predictions of all of calculatedproperties.
Our results show that the isothermal compressibility coefficientas well as the isobaric expansion coefficient of studied mixturesincreases with increasing temperature and decreases with increas-ing pressure (Figs. 2 and 3). This may be related to changes inthe molecular distance or the free volume within the liquid andmay be also due to Brownian motion of the molecules. When afluid is pressurized, the molecular distance decreases, resulting ina less compressible and less expansive fluid. Raising temperatureincreases the molecular motions due to a larger free volume andmolecular distance, resulting in a more compressible fluid. It isobserved that ethanol and 1-propanol are more compressible thantoluene. Ethanol and 1-propanol are the less expansive fluid at lowtemperatures but with increasing temperature, ethanol becomes
E.K. Goharshadi, M. Abareshi / Fluid Phase Equilibria 268 (2008) 61–67 65
Fig. 4. Excess molar volume VEm versus mole fraction of propanol (1) + toluene (2) at (A) 303.15 K, (B) 313.15 K, (C) 323.15 K, and (D) 333.15 K for 0.1 MPa (�), 10 MPa (©),
20 MPa (�), and 30 MPa (�). The points are experimental data [5] and the solid curves are calculated data.
Fig. 5. Excess molar Gibbs free energy versus mole fraction for propanol (1) + toluene(2) mixtures at 303.15 K at different pressures. The points are experimental data [5]and the solid curves are calculated data.
Fig. 6. Excess molar entropy versus mole fraction of propanol (1) + toluene (2) at313.15 K for 0.1 MPa (�), 5 MPa (©), 10 MPa (�), 15 MPa (�), 20 MPa (�), and 25 MPa(�). The points are experimental data [5] and the solid curves are calculated data.

66 E.K. Goharshadi, M. Abareshi / Fluid Ph
Table 5Statistical parameters for excess functions for ethanol (1) + toluene (2) mixture
atures and pressures considered in this work, the excess volume
x1 VEm GE
m HEm
AAD Bias AAD Bias AAD Bias
0.125 4.413 2.289 1.669 0.763 7.435 −3.1540.250 5.665 2.006 2.568 0.264 6.883 5.3650.375 4.744 0.672 2.622 2.421 3.387 1.0200.500 5.201 −1.045 3.521 −1.090 12.892 10.2080.625 4.715 0.021 2.028 0.370 3.311 1.6390.750 4.616 0.463 2.330 −0.314 3.561 0.0320.875 5.001 −1.780 2.983 −1.307 6.642 4.454
x1 SEm UE
m AEm
AAD Bias AAD Bias AAD Bias
0.125 6.403 −2.604 6.194 −2.241 16.095 6.7620.250 11.892 10.563 26.176 24.874 16.789 0.9820.375 3.308 1.169 3.322 1.271 21.268 3.6960.500 9.777 7.311 8.899 6.535 20.123 −10.7540.625 3.350 1.511 3.434 1.521 13.210 −2.5520.750 3.670 −0.285 3.733 −0.330 34.577 18.6680.875 7.278 5.185 7.971 5.772 17.285 −6.171
more expansive than toluene. An explanation may be relatedwith the formation of hydrogen bonds, which keeps the alco-hol molecules stronger together, making the fluid less expansivethan if it could not have self-associated. As temperature increasesthese hydrogen bonds become weaker or are broken, makingalcohols more expansive. When only dispersive molecular inter-actions exists, the fluid with the lowest molecular weight will,in general, be the most expansive and compressible fluid [14].The isothermal compressibility coefficient increases with thecomposition of 1-propanol but as pressure increases, the isother-mal compressibility coefficient of the mixtures becomes moresimilar.
For two mixtures of studied, the excess molar volume increaseswith raising temperature but as pressure increases its valuedecreases. The largest numerical values of the excess volume arefound at lowest pressure, namely 10 MPa. The results in a crossingof the excess volume isobars when the excess volume of a mixturegoes from negative to positive values with increasing temperature,as it can be seen for the mixture containing 80 mol% 1-propanol.Fig. 4 shows a sigmoid behavior of the excess molar volume with
Table 6AAD and bias of calculated and experimental density, isobaric thermal expansion coefficienbased on mixing rule
x1 � �T
AAD Bias AAD Bias
Propanol (1) + toluene (2) [5]0.0 0.005 −0.004 0.669 −0.100.2 1.337 1.337 3.529 −3.520.4 1.899 1.899 5.479 −5.470.6 1.414 1.414 4.273 −4.270.8 0.007 −0.006 1.248 0.121.0 0.005 −0.002 0.923 0.03
Ethanol (1) + toluene (2) [14]0.000 0.009 −0.007 1.338 0.360.125 2.671 2.671 6.745 −6.740.250 4.912 4.912 14.321 −14.320.375 6.391 6.391 19.995 −19.990.500 6.624 6.624 21.688 −21.680.625 4.841 4.841 15.782 −15.780.750 0.011 −0.009 1.601 0.610.875 6.903 −6.903 20.770 20.771.000 0.022 0.002 2.050 0.55
ase Equilibria 268 (2008) 61–67
Table 7Comparison between statistical parameters of calculated densities based on theGMA EoS and Tait equation
x1 GMA EoS Tait equation [20] NP
AAD Bias AAD Bias
Propanol (1) + toluene (2) [5]0.0 0.005 −0.004 0.052 0.079 280.2 0.007 −0.006 0.020 0.046 280.6 0.007 −0.006 0.020 0.049 281.0 0.005 −0.004 −0.177 0.211 28
Ethanol (1) + toluene (2) [14]0.00 0.008 −0.007 0.086 0.039 700.25 0.012 −0.011 0.107 0.048 700.50 0.012 −0.012 0.234 0.026 700.75 0.012 −0.010 0.221 0.040 701.00 0.022 −0.002 0.121 0.040 70
composition at 303.15 K. Similar behavior has been found for sev-eral alcohol + toluene systems [15–18]. As temperature increases,this behavior disappears. In the toluene-rich region for all temper-
t, isothermal compressibility coefficient, and internal pressure for studied mixtures
˛P Pi
AAD Bias AAD Bias
0 3.641 3.445 4.223 3.7629 2.332 1.008 4.681 4.5939 3.301 0.851 6.391 6.2733 3.342 0.055 4.872 4.3433 2.486 −0.123 2.749 −0.2398 4.775 4.367 5.437 4.622
951582004
is positive whereas in the 1-propanol-rich region, the excess vol-ume is negative but as temperature increases, the excess volumebecomes positive.
Although the isobaric expansion coefficient of the mixtures of1-propanol and toluene is higher than for pure 1-propanol, indi-cating that a volume expansion in the mixtures occurs because ofthe breaking of hydrogen bonds in 1-propanol. The negative excessvolumes found in the 1-propanol-rich region may be qualitativelyexplained as the result of the formation of weak hydrogen bond-ing interactions between 1-propanol and toluene due to electrondonor–acceptor type interactions between the hydroxyl group ofthe alcohol and the � electrons of the aromatic hydrocarbon ringstructure. In the toluene-rich region, the positive values are theresult of volume expansion due to the breaking of the hydrogenbonds within the self-associating alcohol molecules. Similar dis-cussions and explanations of the sigmoid behavior of the excessvolume with composition for this binary system as well as otherbinary alcohol + toluene systems can be found in the literature[16–19]. The explanation for the increase in the excess volume withincreasing temperature is due to the increase in the isobaric expan-

uid Ph
E.K. Goharshadi, M. Abareshi / Flsion coefficient as a result of the enlargement of the free volumeand also to Brownian motion, which will result in the weakeningor breaking of hydrogen bonds in alcohol multimers as well asthe interactions between alcohol and toluene molecules, leadingto a larger volume of the mixture. Furthermore, the physical forcesstart to prevail over the chemical interactions (hydrogen bonding),which are short-range forces. The decrease in the value of the excessvolume with increasing pressure is due to the fact that when a fluidis pressurized its compressibility decreases with increasing pres-sure because of a reduction in the free volume within the liquid asa result of a decrease in the molecular distance.
To show the validity of the GMA EoS, the density of the mixtureshas been calculated using the GMA EoS and Tait equation [20] andcompared with the statistical parameters, namely AAD and bias.The values of AAD and bias have been given in Table 7.
The generalized Tait equation has the following form:
� = �0
1 − B4 ln(B + P/B + P0)(16)
where
�0 = B1 + B2T + B3T2 (17)
B = B5 exp(−B6T) (18)
where the Bi (i = 1–6) are constants that are independent of T andP. The value of P0 is 0.1 MPa and �0 is the density at P0.
The values of statistical parameters of the GMA EoS are muchlower than those of calculated by Tait equation. Therefore, the GMAEoS can predict and reproduce densities better than those of calcu-lated based on Tait equation.
4. Conclusions
It has been shown that the GMA equation of state canpredict and reproduce some volumetric and thermodynamic prop-erties of two mixtures of composed of ethanol + toluene and1-propanol + toluene in wide ranges of temperature and pressurewithin experimental errors.
[
[[
[
[
[
[
[[
ase Equilibria 268 (2008) 61–67 67
It seems to us the GMA EoS contains the following of particularinterest:
(1) The form of the GMA EoS is generalized and very simple. Theevaluation of the coefficients is very easy.
(2) It can predict the thermodynamic properties of the liquid mix-tures of studied at any temperature, pressure, and composition.
(3) The calculated volumetric properties of liquid mixtures of stud-ied assuming the composition dependence of the parameters ofthe equation of state as quadratic functions of mole fraction arein an excellent agreement with experiment.
(4) The statistical parameters in prediction of density of these mix-tures based on the GMA EoS are much lower than those ofcomputed based on Tait equation.
References
[1] L.H. Jones, R.M. Badger, J. Am. Chem. Soc. 73 (1951) 3132–3134.[2] M. Tamres, J. Am. Chem. Soc. 74 (1952) 3375–3378.[3] Y. Ioki, H. Kawana, K. Nishimoto, Bull. Chem. Soc. Jpn. 51 (1978) 963–966.[4] R.L. Brinkley, R.B. Gupta, AIChE J. 47 (2001) 948–953.[5] C.K. Zeberg-Mikkelsen, S.I. Andersen, J. Chem. Eng. Data 50 (2005) 524–528.[6] P.S. Serbanovic, M.L. Kijevcanin, I.R. Radovic, B.D. Djordjevic, Fluid Phase Equilib.
239 (2006) 69–82.[7] E.K. Goharshadi, A. Morsali, M. Abbaspour, Fluid Phase Equilib. 230 (2005)
170–175.[8] E.K. Goharshadi, A.R. Berenji, J. Nucl. Mater. 348 (2006) 40–44.[9] E.K. Goharshadi, F. Moosavi, Fluid Phase Equilib. 238 (2005) 112–119.10] E.K. Goharshadi, F. Moosavi, Int. J. Refrig. 30 (2007) 377–383.
[11] A.R. Berenji, E.K. Goharshadi, Polymer 47 (2006) 4726–4733.12] E.K. Goharshadi, M. Moosavi, Ind. Eng. Chem. Res. 44 (2005) 6973–6980.13] E.K. Goharshadi, M. Moosavi, M. Abareshi, Int. J. Therm. Sci. 46 (2007)
944–952.14] C.K. Zeberg-Mikkelsen, L. Lugo, J. Carcia, J. Fernandez, Fluid Phase Equilib. 235
(2005) 139–151.15] P.S. Nikam, B.S. Jagdale, A.B. Sawant, M. Hasan, J. Chem. Eng. Data 45 (2000)
559–563.16] G.N. Swamy, G. Dharmaraju, G.K. Raman, Can. J. Chem. 58 (1980) 229–230.
[17] B.L. Yadav, S. Maken, K.C. Kalra, K.C. Singh, J. Chem. Thermodyn. 25 (1993)1345–1350.
18] K.C. Singh, K.C. Kalra, S. Maken, B.L. Yadav, J. Chem. Eng. Data 39 (1994)241–244.
19] R. Tanaka, S. Toyama, J. Chem. Eng. Data 42 (1997) 871–874.20] A.C. Colin, R.G. Rubio, A. Compostizo, Polymer 41 (2000) 7407–7414.