Segmentation of volumetric MRA images by using capillary active contour
13
Segmentation of volumetric MRA images by using capillary active contour Pingkun Yan, Ashraf A. Kassim * Department of Electrical and Computer Engineering, National University of Singapore, 10 Kent Ridge Crescent, 119260 Singapore, Singapore Received 25 January 2005; received in revised form 15 December 2005; accepted 21 December 2005 Available online 7 February 2006 Abstract Precise segmentation of three-dimensional (3D) magnetic resonance angiography (MRA) images can be a very useful computer aided diagnosis (CAD) tool for clinical routines. Level sets based evolution schemes, which have been shown to be effective and easy to imple- ment for many segmentation applications, are being applied to MRA data sets. In this paper, we present a segmentation scheme for accurately extracting vasculature from MRA images. Our proposed algorithm models capillary action and derives a capillary active con- tour for segmentation of thin vessels. The algorithm is implemented using the level set method and has been applied successfully on real 3D MRA images. Compared with other state-of-the-art MRA segmentation algorithms, experiments show that our method facilitates more accurate segmentation of thin blood vessels. Ó 2006 Elsevier B.V. All rights reserved. Keywords: Magnetic resonance angiography; Vessel segmentation; Capillary action; Deformable models; Geodesic active contour; Level set 1. Introduction Magnetic resonance angiography (MRA) is a non- invasive medical imaging modality that produces three- dimensional (3D) images of vessels and cavities. Accurate extraction of 3D vascular structures from MRA images has become increasingly important for diagnosis and quantification of vascular diseases. Currently, MRA data sets are usually evaluated on two- dimensional (2D) maximum intensity projections (MIPs), which are useful because the overall shapes and paths of the vessels become visible (Orkisz et al., 1997). However, it is known that the MIP may lead to an underestimation of vessel widths and a decreased signal-to-noise ratio (SNR) resulting in poor visualization of blood vessels (Yim et al., 2000). Hence, more sophisticated solutions are needed to extract vasculature from 3D MRA images for better visualization results and a number of methods have been developed. Existing techniques can be broadly divided into two categories: skeleton based and non-skele- ton based. Skeleton-based techniques are those indirect methods which segment and reconstruct the vessels by first detecting the centerlines of the vessels. Several methods have been developed based on this principle (Frangi et al., 1999; Wink et al., 2000; Yim et al., 2000; Krissian et al., 2000; Aylward and Bullitt, 2002; Sorantin et al., 2002). In these approaches, the centerline models can be generated explicitly, implicitly or via postprocessing by ves- sel modeling methods. Non-skeleton based techniques, on the other hand, are those that extract the vessels in 3D directly. In this category, deformable model based methods have received considerable attention and success. The deformable model is first introduced by Kass et al. (1987) as the active contour model or ‘‘snake’’. Since then, a multitude of powerful deformable models for medical image segmentation have been proposed (McInerney and Terzopoulos, 1996). Klein et al. (1997) proposed to recon- struct 2D vessel boundaries or 3D vessel walls using deformable surface models represented by B-spline 1361-8415/$ - see front matter Ó 2006 Elsevier B.V. All rights reserved. doi:10.1016/j.media.2005.12.002 * Corresponding author. Tel.: +65 68742277; fax: +65 67791103. E-mail address: [email protected] (A.A. Kassim). www.elsevier.com/locate/media Medical Image Analysis 10 (2006) 317–329
Transcript of Segmentation of volumetric MRA images by using capillary active contour

www.elsevier.com/locate/media
Medical Image Analysis 10 (2006) 317–329
Segmentation of volumetric MRA images by usingcapillary active contour
Pingkun Yan, Ashraf A. Kassim *
Department of Electrical and Computer Engineering, National University of Singapore, 10 Kent Ridge Crescent, 119260 Singapore, Singapore
Received 25 January 2005; received in revised form 15 December 2005; accepted 21 December 2005Available online 7 February 2006
Abstract
Precise segmentation of three-dimensional (3D) magnetic resonance angiography (MRA) images can be a very useful computer aideddiagnosis (CAD) tool for clinical routines. Level sets based evolution schemes, which have been shown to be effective and easy to imple-ment for many segmentation applications, are being applied to MRA data sets. In this paper, we present a segmentation scheme foraccurately extracting vasculature from MRA images. Our proposed algorithm models capillary action and derives a capillary active con-tour for segmentation of thin vessels. The algorithm is implemented using the level set method and has been applied successfully on real3D MRA images. Compared with other state-of-the-art MRA segmentation algorithms, experiments show that our method facilitatesmore accurate segmentation of thin blood vessels.� 2006 Elsevier B.V. All rights reserved.
Keywords: Magnetic resonance angiography; Vessel segmentation; Capillary action; Deformable models; Geodesic active contour; Level set
1. Introduction
Magnetic resonance angiography (MRA) is a non-invasive medical imaging modality that produces three-dimensional (3D) images of vessels and cavities. Accurateextraction of 3D vascular structures from MRA imageshas become increasingly important for diagnosis andquantification of vascular diseases.
Currently, MRA data sets are usually evaluated on two-dimensional (2D) maximum intensity projections (MIPs),which are useful because the overall shapes and paths ofthe vessels become visible (Orkisz et al., 1997). However,it is known that the MIP may lead to an underestimationof vessel widths and a decreased signal-to-noise ratio(SNR) resulting in poor visualization of blood vessels(Yim et al., 2000). Hence, more sophisticated solutionsare needed to extract vasculature from 3D MRA imagesfor better visualization results and a number of methods
1361-8415/$ - see front matter � 2006 Elsevier B.V. All rights reserved.
doi:10.1016/j.media.2005.12.002
* Corresponding author. Tel.: +65 68742277; fax: +65 67791103.E-mail address: [email protected] (A.A. Kassim).
have been developed. Existing techniques can be broadlydivided into two categories: skeleton based and non-skele-ton based. Skeleton-based techniques are those indirectmethods which segment and reconstruct the vessels by firstdetecting the centerlines of the vessels. Several methodshave been developed based on this principle (Frangiet al., 1999; Wink et al., 2000; Yim et al., 2000; Krissianet al., 2000; Aylward and Bullitt, 2002; Sorantin et al.,2002). In these approaches, the centerline models can begenerated explicitly, implicitly or via postprocessing by ves-sel modeling methods. Non-skeleton based techniques, onthe other hand, are those that extract the vessels in 3Ddirectly. In this category, deformable model based methodshave received considerable attention and success.
The deformable model is first introduced by Kass et al.(1987) as the active contour model or ‘‘snake’’. Since then,a multitude of powerful deformable models for medicalimage segmentation have been proposed (McInerney andTerzopoulos, 1996). Klein et al. (1997) proposed to recon-struct 2D vessel boundaries or 3D vessel walls usingdeformable surface models represented by B-spline

318 P. Yan, A.A. Kassim / Medical Image Analysis 10 (2006) 317–329
surfaces. However, it is hard to employ parameterizeddeformable models to effectively deal with the whole vascu-lature, as the structure of the vasculature is complex(Ayache et al., 1996) and these models are not able tochange topologies during evolution. Yim et al. (2003) pro-posed a deformable surface model based on triangulatedmeshes for vessel construction in 3D. Nevertheless, it maybe problematic to apply these methods (Klein et al., 1997;Yim et al., 2003) for segmentation of vessels from low con-trast MRA images. Geometric deformable models based onlevel set theory, which can freely adapt into complex topol-ogies of objects, were then proposed and applied to MRAimage segmentation. Level set methods were initially for-mulated by Osher and Sethian (1988), and first applied tocomputer vision and image processing problems by Malladiet al. (1995). Level set methods, which have been widelyused for image segmentation, provide an elegant solutionto adapting the initial model’s topology as well as model ini-tialization (Caselles et al., 1997a,b; Chen and Amini, 2004;Descoteaux et al., 2004; Yezzi et al., 1997; Sethian, 1999;Lorigo et al., 2000, 2001). Caselles et al. (1997a) proved thatthe classical snake of Kass et al. (1987) can also be imple-mented through level sets as geodesic active contour. Inthe area of 3D vasculature extraction, Nain et al. (2004)proposed a shape driven flow method for MRA segmenta-tion by combining image statistics and shape information toderive a region-based geometric deformable model. Chenand Amini (2004) employed a hybrid model using bothparametric and geometric deformable models for segmenta-tion of an entire vascular tree. However, these methods havedifficulty in extracting tiny vessels from 3D images. Smallvessels and their branches, which exhibit much variability,are very important in planning and performing neurosurgi-cal procedures. More precise navigation and localizationinformation for computer guided procedures can beachieved with greater detail of vasculature. Lorigo et al.
Liquid
Capillarytube
a
Fig. 1. Capillary action. (a) Capillary tube a
(2000, 2001) proposed the ‘‘CURVES’’ algorithm to extractthin vessels, which uses a geodesic active contour based onthe codimension two level set method introduced byAmbrosio and Soner (1996). More detailed literaturereviews on vessel extraction techniques can be found in(Suri et al., 2002) and (Kirbas and Quek, 2002).
In this paper, we propose an automated segmentationalgorithm to extract whole vasculature from 3D MRAimages with the capability to recover thin vessels andobtain segmentation results that are as accurate as possible(Yan and Kassim, 2005). Our algorithm is inspired by thecommon physical phenomenon of capillary action associ-ated with capillary tubes as shown in Fig. 1(a), in whichfluid climbs up to some height without any external pullingforce. The thinner the tube, the higher the liquid level in thetube. If thin blood vessels are considered as capillary tubes,it may be possible to employ this mechanism for segment-ing thin vessels in low contrast situations. Capillary effectshave been widely studied from the point of computationalfluid dynamics (CFD), which is an area where the level settheory is widely applied (Sussman et al., 1998; Sussmanand Puckett, 2000; Sethian and Smereka, 2003). Zhaoet al. (1996) studied the interface of incompressible fluidsunder multiphase motion. More recently, Perigaud andSaurel (2005) simulate capillary effects with a compressiblemodel. However, little work has been done on applying thecapillary effects to segmentation of blood vessels from angi-ographies. In this paper, by modeling the capillary effectswith incompressible fluid, we obtain an efficient capillaryactive contour method for segmenting blood vessels.
The paper is organized as follows. Section 2 providesbackground information about the proposed capillaryactive contour while the details are presented in Section3. Section 4 discusses the implementation issues and theexperimental results are presented in Section 5. Finally,our conclusions are provided in Section 6.
Unwettedrigid
boundary
Wettedsurface
Freesurface
b
nd (b) surfaces of a three-phase system.

P. Yan, A.A. Kassim / Medical Image Analysis 10 (2006) 317–329 319
2. Background
2.1. Capillary action
Capillarity is a broad subject in physics (Finn, 1986) andincludes capillary action which occurs in capillary tubes.Capillary effects are due to surface tension, which includescohesion and adhesion. Cohesion is the attraction betweenmolecules of the fluid and adhesion is the attractive forcebetween molecules of fluid and solid boundary. For a gen-eral (three-phase) system consisting of fluid, gas and rigidbounding walls in a natural environment, the surface offluid can be divided into several parts as shown inFig. 1(b). Free surface, Sf, denotes the part of the fluid sur-face, which is not in contact with the solid boundaries.Wetted surface, Sw, denotes the part of fluid surface thatcomes into contact with the solid boundaries.Consequently, the energy of equilibrium capillary surfacecan be expressed as
E ¼ rcSf þ raSw þZ
cqdxþ cV . ð1Þ
The terms on the right side of (1) are as follows:
(i) Free surface energy: This is the cohesion energybetween elements of a fluid in the free surface sepa-rating two media, fluid and gas. The energy associ-ated with removal of fluid from the surface isproportional to the surface area, which is
Ef ¼ rcSf ;
where rc is known as the cohesion coefficient and de-fined as the energy needed to resize unit area of thefree surface.
(ii) Wetting energy: This is the adhesion energy betweenthe fluid and the bounding walls, and is analogousto the surface energy:
Ew ¼ raSw;
where ra is the adhesion coefficient and defined as theenergy needed to resize unit area of the wettedsurface.
(iii) Gravitational energy: This potential energy is due togravity. Assuming a more general potential energy cper unit mass, depending on position within themedia, the resultant energy is
Ec ¼Z
cqdv;
where q is local density.(iv) Volume constraint: As the model of compressible flow
(Perigaud and Saurel, 2005) is too complex andbeyond the scope of this paper, the fluid is consideredincompressible in our model, which is sufficient forour needs. Thus, the deformation of the fluid surfaceis constrained by the volume V of the fluid (Sussmanet al., 1998; Sussman and Puckett, 2000). A naturalway to apply this volume constraint is to introducean energy Ev in the form of:
Ev ¼ cV ;
where c is a Lagrange multiplier.
2.2. Geodesic active contours
The task of finding a curve that best fits the object bound-ary can be posed as a minimization problem over all closedplanar curves CðqÞ : ½0; 1� ! R2 (Caselles et al., 1997a,1993; Kichenassamy et al., 1995). Starting from the classicalsnakes approach first introduced by Kass et al. (1987), inwhich the curve C associated with an energy given by
EðCÞ ¼ aZ 1
0
jC0ðqÞj2 dqþ bZ 1
0
jC00ðqÞj2 dq
� kZ 1
0
jrIðC0ðqÞÞjdq; ð2Þ
where a, b, and k are real positive constants, andI : ½0; a� � ½0; b� ! Rþ is a given target image, Caselleset al. (1997a) obtained a minimal path representation ofthe energy,
EðCÞ ¼Z 1
0
gðjrIðCðqÞÞjÞjC0ðqÞjdq; ð3Þ
where g : ½0;1� ! Rþ is a strictly decreasing function suchthat g(r)! 0 as r!1.
To minimize this energy functional by steepest descent,consider curve C to be a function of time t. The Euler–Lagrange equations yield the curve evolution equation
~Ct ¼ gðIÞj ~N� ðrg � ~NÞ ~N; ð4Þwhere j is the Euclidean curvature, and ~N is the unit nor-mal vector of the surface.
2.3. Level set methods
Level set methods are numerical techniques for analyzingand computing interface motion, which are now standardapproaches for solving partial differential equations (PDEs)(Osher and Sethian, 1988; Malladi et al., 1995; Sethian,1999). Since level set methods use implicit representationfor the evolving curves, they enable topological changesto occur without incurring any additional computationalcosts. When solving a problem, the level set methodincreases the dimensionality of the problem to a higherone. For example in curve evolution problems, instead ofevolving the 2D curves, the method deforms a 3D surface,where the 2D objective curve is embedded as its zero levelset. Then different topologies of the 2D curve can be repre-sented by a constant topology of the 3D surface.
Let W : R2 ! R be the signed distance function to curveC, which makes C the zero level set of W. If C is evolvedaccording to
~Ct ¼ F ~N; ð5Þwhere F is a speed function, it can be shown that it is equiv-alent to evolving W according to
320 P. Yan, A.A. Kassim / Medical Image Analysis 10 (2006) 317–329
Wt ¼ F jrWj. ð6ÞThe evolving curve C is then obtained as the zero level setof W. Since implicit representation is used in level set, thelevel set update Eq. (6) also applies to 3D surfaceevolution.
2.4. CURVES
To recover low contrast thin vessels from angiographies,Lorigo et al. (2000, 2001) proposed the CURVES scheme.The main idea is to regularize a geometric flow in 3D usingthe curvature of 1D curve, rather than the classical meancurvature, which tends to annihilate thin structures. How-ever, the above level set method cannot be applied forevolving a 1D curve in 3D space. Let W : R3 ! Rþ be anauxiliary function whose zero level set is exactlyCðpÞ : ½0; 1� ! R3. Ambrosio and Soner (1996) proved thatevolving C in 3D according to (5) is equivalent to evolvingW according to
Wt ¼ GðrW;r2WÞ; ð7Þ
where function G is defined as the smaller non-zero eigen-value of matrix P$W$2WP$W. Matrix Pq is defined as
P q ¼ I � q� q
jqj2; q 6¼ 0;
where I is the identity matrix.Based on this work, Lorigo et al. (2000, 2001) derived
the geodesic active contour speed function with codimen-sion two curvature for curve evolution
~Ct ¼ j ~N�rgg
P HrIjrI j
� �;
and represented its level set update equation as
Wt ¼ GðrW;r2WÞ þ qðrW � rIÞ g0
grW �H rI
jrI j ; ð8Þ
by incorporating a multiplier q($W Æ $I) to make the evolu-tion curve stop at object boundaries.
3. The capillary active contour method
One of the difficulties in segmentation of MRA images isaccurate extraction of small vessels. To deal with this prob-lem, we propose a new capillary action based geodesicactive contour method, which is modeled on the physicalphenomenon of capillary action. According to the theoryof capillarity, the surface of the evolving fluid consists ofthe free surface and the wetted surface (Finn, 1986). Thefree surface does not come into contact with solid bound-aries while the wetted surface is the part of the liquid sur-face that is in contact with the solid boundary. Ourcapillary active contour method essentially involves obtain-ing the surface evolution equation of fluid by modeling andminimizing the energy functional associated with the freeand wetted surfaces, and the volume constraint.
3.1. Free surface energy
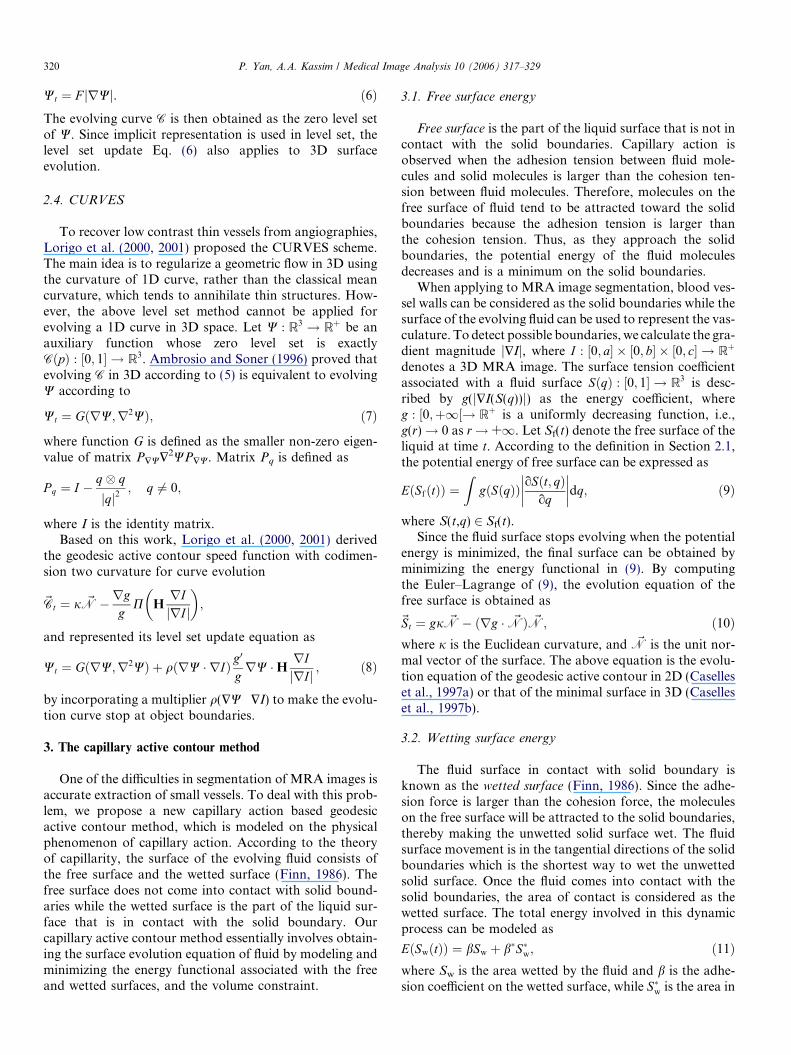
Free surface is the part of the liquid surface that is not incontact with the solid boundaries. Capillary action isobserved when the adhesion tension between fluid mole-cules and solid molecules is larger than the cohesion ten-sion between fluid molecules. Therefore, molecules on thefree surface of fluid tend to be attracted toward the solidboundaries because the adhesion tension is larger thanthe cohesion tension. Thus, as they approach the solidboundaries, the potential energy of the fluid moleculesdecreases and is a minimum on the solid boundaries.
When applying to MRA image segmentation, blood ves-sel walls can be considered as the solid boundaries while thesurface of the evolving fluid can be used to represent the vas-culature. To detect possible boundaries, we calculate the gra-dient magnitude j$Ij, where I : ½0; a� � ½0; b� � ½0; c� ! Rþ
denotes a 3D MRA image. The surface tension coefficientassociated with a fluid surface SðqÞ : ½0; 1� ! R3 is desc-ribed by g(j$I(S(q))j) as the energy coefficient, whereg : ½0;þ1½! Rþ is a uniformly decreasing function, i.e.,g(r)! 0 as r! +1. Let Sf(t) denote the free surface of theliquid at time t. According to the definition in Section 2.1,the potential energy of free surface can be expressed as
EðSfðtÞÞ ¼Z
gðSðqÞÞ oSðt; qÞoq
��������dq; ð9Þ
where S(t,q) 2 Sf(t).Since the fluid surface stops evolving when the potential
energy is minimized, the final surface can be obtained byminimizing the energy functional in (9). By computingthe Euler–Lagrange of (9), the evolution equation of thefree surface is obtained as
~St ¼ gj ~N� ðrg � ~NÞ ~N; ð10Þwhere j is the Euclidean curvature, and ~N is the unit nor-mal vector of the surface. The above equation is the evolu-tion equation of the geodesic active contour in 2D (Caselleset al., 1997a) or that of the minimal surface in 3D (Caselleset al., 1997b).
3.2. Wetting surface energy
The fluid surface in contact with solid boundary isknown as the wetted surface (Finn, 1986). Since the adhe-sion force is larger than the cohesion force, the moleculeson the free surface will be attracted to the solid boundaries,thereby making the unwetted solid surface wet. The fluidsurface movement is in the tangential directions of the solidboundaries which is the shortest way to wet the unwettedsolid surface. Once the fluid comes into contact with thesolid boundaries, the area of contact is considered as thewetted surface. The total energy involved in this dynamicprocess can be modeled as
EðSwðtÞÞ ¼ bSw þ b�S�w; ð11Þwhere Sw is the area wetted by the fluid and b is the adhe-sion coefficient on the wetted surface, while S�w is the area in

P. Yan, A.A. Kassim / Medical Image Analysis 10 (2006) 317–329 321
contact with the outer medium (e.g. gas) and b* is the cor-responding adhesion coefficient. Variational calculus isused to analyze this dynamic energy. When making the var-iation, only those values of Sw and S�w in an immediateneighborhood of the contact line need to be taken into ac-count. The contact line is the intersection of the fluid sur-faces. Neglecting the constant terms and noting thatDSw ¼ �DS�w, we write
EðSwðtÞÞ ¼ aS�w; ð12Þwhere
a ¼ b� � b; ð13Þis the relative adhesion coefficient. Here S�w includes aneighborhood of the contact line. The area of S�w changeswhen the contact line evolves. According to (12), the min-imization of the wetted surface energy is equivalent to min-imizing the surface S�w. It can be done by evolving thecontact line. However, solving this problem directly in3D is not straightforward, because the 3D surface to beminimized is not enclosed by the contact line. Since theevolution of the contact line only influences its immediateneighborhood, it is always possible to find some view pointthat all the surface area is under the contact line (seeFig. 2). In addition, a 3D surface can be ‘‘cut’’ along a lineand then stretched to become a 2D plane as shown inFig. 2(b). This idea comes from the world map, wherethe surface of the earth is flattened to get a 2D atlas.
Through the above operation, the problem of minimiz-ing a 3D surface can be solved as a 2D one. IfCðt; xÞ : ½0; 1� ! R2 denote the contact line of the surfaces,then the area of the enclosed unwetted surface isR
Cðt; xÞdx. Now we need to minimize the surface areaunder curve C (see Fig. 2). To keep the contact line smooth,its length
RjCxðt; xÞjdx is considered as a regularization
term. Thus, the energy associated with the wetted surfacein (12) can be rewritten as
EðSwðtÞÞ ¼ a
�ZCðt; xÞdxþ k
ZjCxðt; xÞjdx
�; ð14Þ
where k is a Lagrange multiplier (acting as constant c inEq. (1)) for controlling the influence of surface area regu-
a b
Fig. 2. 3D tubular surface stretched to get 2D surface. Minimizing lowerarea through evolving contact line.
larization. To minimize the energy functional, the Euler–Lagrange of (14) is computed and the 2D evolution equa-tion of the contact line C obtained is
~Ct ¼ að1þ kjÞ ~NC; ð15Þwhere j and ~NC are the Euclidean curvature and the unitnormal vector of the contact line in 2D, respectively. Sincethe derivation is done in 2D, the resulting evolution equa-tion needs to be extended before it can be applied to evolv-ing 3D surfaces. In 3D, the curvature j of the 2D contactline becomes a codimension two curvature j2 (Ambrosioand Soner, 1996; Lorigo et al., 2000, 2001) in 3D. Further-more, as we are considering the evolution of liquid alongvessel walls, the direction of evolution should be parallelto the wall at each point, i.e., along the tangential directionof the wall. Hence, the normal ~NC of the contact line in(15) should actually be the tangential component of the li-quid surface’s normal vector at that point ~Tsb, as shown inFig. 3 so that (15) becomes
~Ct ¼ að1þ kj2Þ~Tsb. ð16ÞSince blood vessels in MRA images appear brighter thanthe background, the directions of gradients near the vesselboundaries in the image can be easily computed and thetangential subvector ~T sb is obtained as follows:
~T sb ¼ ~N� rgjrgj cos h; ð17Þ
where
cos h ¼ ~N � rgjrgj .
Thus, the overall evolution equation describing the energyof wetting surfaces can be written as
~St ¼ að1þ kj2Þ ~N� rgjrgj cos h
� �. ð18Þ
3.3. Volume constraint
In our process of modeling capillary action, the fluid isassumed to be incompressible. Hence, the volume of thegiven fluid is constant and this constraint needs to be
I N
sbT
Fluid surface
Solid boundary
11fS
wS *wS
Fig. 3. The evolving direction of the contact line is the tangentialsubvector of the surface normal.

322 P. Yan, A.A. Kassim / Medical Image Analysis 10 (2006) 317–329
considered in the fluid surface evolution equation. As inSection 2.1, volume constraint is considered as an energyterm E(V) = cV, which can be expanded as
EðV Þ ¼ cZ
Sðt; qÞdq;
where S is the whole surface area of the fluid. By applyingthe gradient descent method for minimization, we have thesurface evolution equation
~St ¼ c ~N;
which is a constant velocity for minimizing the volume en-closed by the surface. Since liquid is bounded by solidwalls, the fluid surface will snap to the boundaries finally.Thus, the constant velocity is multiplied by function g
and then the evolution equation becomes
~St ¼ gðSðqÞÞc ~N. ð19Þ
3.4. Evolution equation
The final evolution equation of our proposed capillaryactive contour algorithm is obtained by combining theabove results
Fig. 5. Illustration of the effects on varying capillary force coefficient a. (a) Ge(e) a = 0.5. (f) a = 0.75.
0 0.2 0.4 0.6 0.8 1
0
0.1
0.2
0.3
0.4
0.5
0.6
0.7
0.8
0.9
1 a=0.01
a=0.05
a=0.1
a=0.2 a=0.3
a
Fig. 4. Illustration of various parameter settings for the sigmoid function f (a = 0.05.
~St ¼ gðjþ cÞ ~N� ðrg � ~NÞ ~N
þ að1þ kj2Þ ~N� rgjrgj cos h
� �; ð20Þ
where the relative adhesion coefficient a balances contribu-tions due to propagation, advection force and the capillaryaction. The constant terms c and k in (20) act like balloonforces (Cohen, 1991), which facilitate evolving surfacessnapping to solid boundaries. Comparing the new evolu-tion Eq. (20) with those of the geodesic active contour(Caselles et al., 1997a) and its 3D correspondence minimalsurface (Caselles et al., 1997b), the first two terms are samebut the third term in (20) is new which comes from the cap-illary action.
The evolution equation in the CURVES algorithm(Lorigo et al., 2000, 2001) is derived from the geodesicactive contour by using the codimension two curvature.The first term at the right side of the CURVES evolutionEq. (8) makes the tubular structure surfaces smooth, whilethe second term, which controls the evolution, becomesdominant near the possible object boundaries. As a conse-quence, the curve evolves towards the vessel structuresunder the attraction of the edges. However, the evolvingcurve may not stop at the vessel boundaries. Compared
nerated cylinder. (b) Initialization of the algorithm. (c) a = 0. (d) a = 0.25.
0 0.2 0.4 0.6 0.8 1
0
0.1
0.2
0.3
0.4
0.5
0.6
0.7
0.8
0.9
1
b=0.2 b=0.35 b=0.5 b=0.65 b=0.8
b
x). (a) Effects of varying a under b = 0.5; (b) effects of varying b under

P. Yan, A.A. Kassim / Medical Image Analysis 10 (2006) 317–329 323
with the CURVES, the first two terms in the evolution Eq.(20) of the proposed capillary active contour algorithmmake the evolving surface smooth and ‘‘snap’’ it to the ves-
Fig. 6. MIP of the cerebral MRA data set
Fig. 7. MRA segmentation results of
sel boundaries, while the capillary action term helps thesurface evolve in the tangential direction of the blood ves-sels which results in better segmentation performance.
A. (a) MIP and (b) region of interest.
MRA image A using CURVES.

324 P. Yan, A.A. Kassim / Medical Image Analysis 10 (2006) 317–329
4. Implementation
In this section, we discuss the implementation of thecapillary active contour for vessel segmentation in MRAimages. We show that the proposed capillary active con-tour is able to adapt to the complex topology of vascula-ture. The level set method, which is used to implementthe capillary active contour, is able to handle sharp cornersand cusps, as well as topological changes.
4.1. Level sets evolution equation
The fluid surface is embedded as the zero level set of alevel set function W. According to the level set theory (Osherand Sethian, 1988; Sethian, 1999) and noting the fact that
~N ¼ � rWjrWj ;
evolving a surface S under the evolution Eq. (20) is equiv-alent to updating a volume map W with
Wt ¼ gðjþ cÞjrWj þ rg � rWþ að1þ kj2ÞjrWj� f ð1� cos2 hÞ; ð21Þ
Fig. 8. MRA segmentation results of MRA
where S is the zero level set embedded in W and
cos h ¼ rW � rgjrWjjrgj . ð22Þ
Eq. (21) is the level set speed function with capillary force.Function f(x) in (21) is incorporated into the updating equa-tion just to make the evolution faster and more robust. f(x)can be any monotonically increasing function which variesbetween values zero and one so that it is able to facilitate thesurface evolution in the tangential direction of the bound-ary. According to (20), when the angle between the surfacenormal and the boundary normal $g is small, the capillaryforce will become very weak. This often occurs during theevolution process, while the capillary force is expected tocontribute to the surface evolution. In addition, noise inmedical images may produce large values of cosh, whichcould lead to computation errors. Taking into account thesefactors, function f(x) is chosen to be a sigmoid function
f ðxÞ ¼ 1
1þ e�x�b
að Þ� � ; ð23Þ
where a decides the slope of the output curve and b definesthe point around which the output window is centered.
image A using capillary active contour.

P. Yan, A.A. Kassim / Medical Image Analysis 10 (2006) 317–329 325
Effects of varying parameters a and b in function (23) areillustrated in Fig. 4. The mean curvature j in (21) isj ¼ div rW
jrWj
� �and the codimension two curvature j2 is cal-
culated according to (7) which is introduced by Ambrosioand Soner (1996).
Fig. 11. Segmentation results of MRA image B
Fig. 10. Segmentation results of MRA image B using th
Fig. 9. MIP of the 3D MRA image B.
4.2. Discretization and implementation
A 3D MRA image containing vasculature is initiallythresholded to obtain an initial segmentation estimatewhich is used to generate an initial signed distance func-tion, which has negative values inside objects and positivevalues at outside. Then level set function W is iterativelyupdated according to
Wnþ1 ¼ Wn þ DWnDt; ð24Þwhere DW is calculated using (21). Convergence isachieved when volumetric change is very small over someiterations.
Before applying the algorithm, the image is smoothed byusing a small isotropic Gaussian. Further, the level set mapW is periodically reinitialized to be a signed distance func-tion: the zero level set S is extracted from W, and then thevalue at each point is set to be its distance to S. This isneeded because W is defined as the signed distance mapof S, which, however, cannot be ensured during the evolv-ing process.
using the capillary active contour method.
e fuzzy connectedness method (Udupa et al., 2002).

326 P. Yan, A.A. Kassim / Medical Image Analysis 10 (2006) 317–329
5. Results and discussion
The proposed capillary active contour is applied on bothsynthetic image and MRA data sets. The equationsdescribed in this paper have been coded for 3D segmenta-tion based on the Insight Segmentation and RegistrationToolKit (ITK) (Ibanez et al., 2003). The 3D segmentationresults are visualized using the Visualization ToolKit(VTK) (Schroeder et al., 2002).
5.1. Capillary force
We first study the performance of the capillary force intubular objects segmentation. Fig. 5 shows the applicationof the capillary active contour in a computer generated cyl-inder, which illustrates the effect of the capillary force.Starting from the initialization shown in Fig. 5(b), evolu-tion progresses according to the level set speed functionin (21). In our experiments, all parameters are fixed exceptfor a. The evolution results with different parameter set-tings after 50 iterations are visualized in Fig. 5.
If a is set to zero, the capillary active contour evolveslike the geodesic active contour (Caselles et al., 1997a).The evolution of the free surface in the axial direction of
Fig. 12. MIP of the MRA image C.
Fig. 13. Segmentation results of the 3D MRA imag
the tubular object is driven by the constant speed c in(21). Because of the monotonically decreasing function g,contribution of the propagation will be small when the sur-face is near the object boundary, and becomes zero whenthe surface is on the edges. Hence, the free surface is convexas shown in Fig. 5(c). When the tubular object becomesmuch thinner, the evolution may stop because of the smallvalue of g. After incorporating the capillary force, the freesurface is attracted by the unwetted surface when near thesolid boundaries and meniscus (Finn, 1986) can beobserved as shown in Fig. 5(d)–(f). The capillary action iscaused by adhesion between elements of solid boundaryand liquid molecules. Adhesion of liquid to the vessel wallscauses an upward force on the liquid at the edges andresults in a meniscus which turns upward. The surface ten-sion acts to hold the surface intact, so instead of just theedges moving upward, the whole liquid surface is draggedupwards. With larger value of a, the surface evolutionalong the object boundary will be stronger and faster.Therefore, the capillary force can facilitate the evolutionof the free surface even when the vessels are very thin.
5.2. MRA segmentation
The capillary active contour method has been appliedon more than ten sets of 3D MRA images. In this section,we present some typical results. In the first example, 3DMRA image of cerebral vasculature is used. The image Aconsists of 512 · 512 · 120 voxels with voxel spacing0.43 mm · 0.43 mm · 1.2 mm. Fig. 6 shows the MIP ofdata set A. To make the results clearer, a region of interest(ROI) is specified (Fig. 6(b)) and only vessels inside theROI will be processed.
We compare our proposed capillary active contourmethod with the state-of-the-art CURVES algorithm(Lorigo et al., 2000, 2001). Identical parameter settings inthe evolution equations are used for both methods exceptfor the capillary force coefficient a (set to 0.5) which is specificto the capillary active contour. Different views of the segmen-tation results of CURVES and capillary active contour areshown in Figs. 7 and 8. The CURVES algorithm successfully
e C using our capillary active contour method.
P. Yan, A.A. Kassim / Medical Image Analysis 10 (2006) 317–329 327
extracts much of the vasculature but fails to identify someparts when compared with the capillary active contour.
Image B consists of 3D MRA image of liver and lungs ata resolution of 384 · 320 · 80 voxels with voxel spacing0.43 mm · 0.43 mm · 1.2 mm. Fig. 9 shows that the MIPof image B has a low signal to noise ratio and that theintensities vary greatly from left to right. In addition, thevoxel intensities of other tissues are quite similar to thoseof the blood vessels. For comparison, the fuzzy connected-
ness segmentation method (Udupa et al., 2002) is alsoapplied on the image. Different views of the segmentationresults of fuzzy connectedness method and our capillaryactive contour method are visualized in Figs. 10 and 11.From Fig. 10, we can see that the main vessels areextracted. However, because of image intensity variation,the end of the vessel in Fig. 9 is not extracted. In addition,the extracted vessel surface using fuzzy connectednessmethod is not smooth, due to the presence of strong noiseas shown in Fig. 10. When our capillary active contourmethod is used, the segmentation result is much improvedas shown in Fig. 11. The whole vessel is extracted success-fully and the surface of the vessel is smooth. The reason isthat the evolving surface is attracted toward the boundariesand moves along the boundaries under the capillary force.Thus, it is not sensitive to intensity variations. Further-more, the curvature term j in the evolution equation keepsthe evolving surface smooth, while there is no such regular-ization in fuzzy connectedness method.
Image C consists of 3D MRA image of liver and lungs ata resolution of 384 · 320 · 64 voxels with voxel spacing0.43 mm · 0.43 mm · 1.2 mm. The MIP of image C isshown in Fig. 12 while the segmentation results using ourcapillary active contour method are shown in Fig. 13 withdifferent views. Clearly, the whole vessel is extractedsuccessfully.
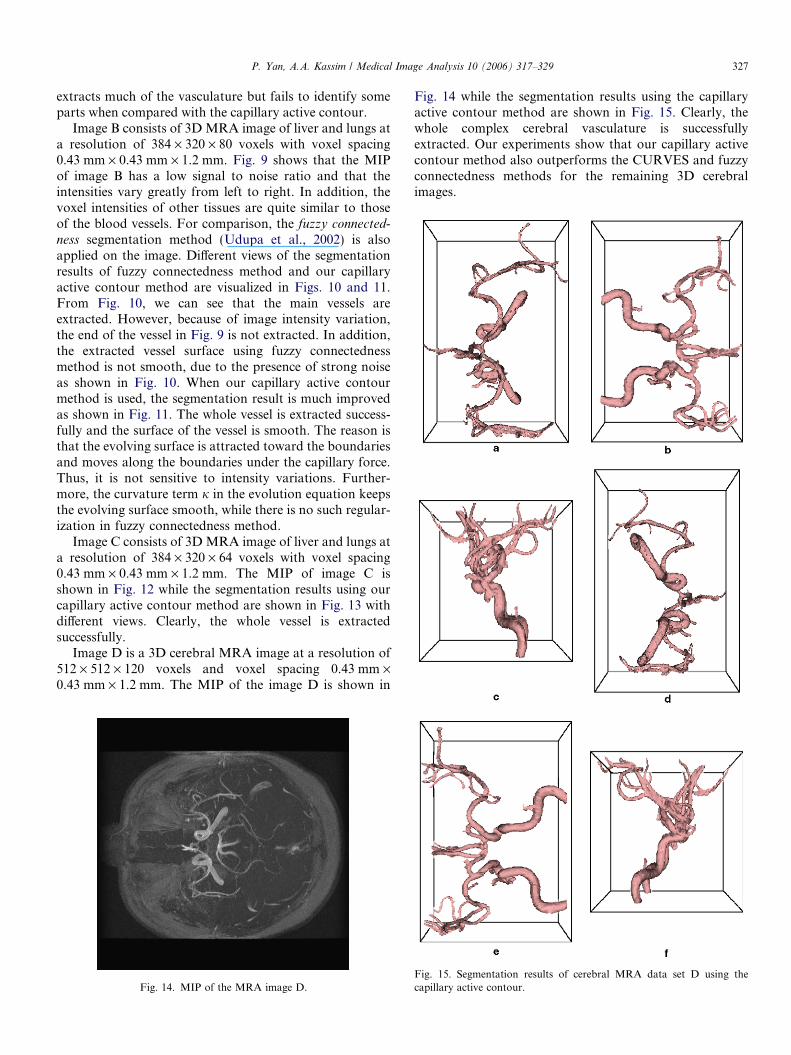
Image D is a 3D cerebral MRA image at a resolution of512 · 512 · 120 voxels and voxel spacing 0.43 mm ·0.43 mm · 1.2 mm. The MIP of the image D is shown in
Fig. 14. MIP of the MRA image D.
Fig. 14 while the segmentation results using the capillaryactive contour method are shown in Fig. 15. Clearly, thewhole complex cerebral vasculature is successfullyextracted. Our experiments show that our capillary activecontour method also outperforms the CURVES and fuzzyconnectedness methods for the remaining 3D cerebralimages.
Fig. 15. Segmentation results of cerebral MRA data set D using thecapillary active contour.

328 P. Yan, A.A. Kassim / Medical Image Analysis 10 (2006) 317–329
6. Conclusions
In this paper, we introduce the capillary geodesic activecontour which is successfully applied to both 3D syntheticimages and MRA images. The incorporated capillary forceadapts the evolution surface into very thin branches ofblood vessels and obtains more accurate segmentation asdemonstrated in our experiments. Compared with othertechniques, the capillary active contour can achieve greaterdetails of vasculature. Our approach is geometric in natureand topology adaptable due to that implicit representationof the evolution curves is used.
Acknowledgements
The authors would like to thank Dr. Shih-Chang Wangand Dr. Borys Shuter of the National University Hospitalin Singapore for providing the 3D MRA data sets. Theyalso thank the anonymous reviewers for their valuablecomments to improve the presentation of the paper.
References
Ambrosio, L., Soner, H.M., 1996. Level set approach to mean curvatureflow in arbitrary codimension. Journal of Differential Geometry 43,693–737.
Ayache, N., Cinquin, P., Cohen, I., Cohen, L., Leitner, F., Monga, O.,1996. Segmentation of complex three-dimensional medical objects: Achallenge and a requirement for computer-assisted surgery planningand performance. In: Taylor, R., Lavallee, S., Burdea, G., Mosges, R.(Eds.), Computer-Integrated Surgery. The MIT Press, Cambridge,MA, pp. 59–74 (Chapter 4).
Aylward, S.R., Bullitt, E., 2002. Initialization, noise, singularities, andscale in height ridge traversal for tubular object centerline extraction.IEEE Transactions on Medical Imaging 21 (2), 61–75.
Caselles, V., Catte, F., Coll, T., Dibos, F., 1993. A geometric model foractive contours. Numerische Mathematik 66, 1–31.
Caselles, V., Kimmel, R., Sapiro, G., 1997a. Geodesic active contours.International Journal of Computer Vision 22 (1), 61–79.
Caselles, V., Kimmel, R., Sapiro, G., Sbert, C., 1997b. Minimal surfacesbased object segmentation. IEEE Transactions on Pattern Analysisand Machine Intelligence 19 (4), 394–398.
Chen, J., Amini, A.A., 2004. Quantifying 3-D vascular structures in MRAimages using hybrid PDE and geometric deformable models. IEEETransactions on Medical Imaging 23 (10), 1251–1262.
Cohen, L.D., 1991. On active contour models and balloons. CVGIP:Image Understanding 53 (2), 211–218.
Descoteaux, M., Collins, L., Siddiqi, K., 2004. Geometric flows forsegmenting vasculature in MRI: theory and validation. In: Proceedingsof the Medical Image Computing and Computer-Assisted Intervention(MICCAI). Saint-Malo, France, pp. 500–507.
Finn, R., 1986. Equilibrium Capillary Surfaces. Springer Verlag, NewYork.
Frangi, A.F., Niessen, W.J., Hoogeveen, R.M., van Walsum, T.,Viergever, M.A., 1999. Model-based quantitation of 3-D magneticresonance angiographic images. IEEE Transactions on MedicalImaging 18, 946–956.
Ibanez, L., Schroeder, W., Ng, L., Cates, J., 2003. The ITK SoftwareGuide. Kitware Inc., URL http://www.itk.org.
Kass, M., Witkin, A., Terzopoulos, D., 1987. Snakes: Active contourmodels. International Journal of Computer Vision 1 (4), 321–331.
Kichenassamy, S., Kumar, A., Olver, P.J., Tannenbaum, A., Yezzi, A.J.,1995. Gradient flows and geometric active contour models. In: IEEEInternational Confernce on Computer Vision, pp. 810–815.
Kirbas, C., Quek, F., Nov. 2002. A review of vessel extraction techniquesand algorithms. Tech. rep., VisLab Wright State University, Dayton,OH, USA. URL http://vislab.cs.vt.edu/review/extraction.html.
Klein, A.K., Lee, F., Amini, A.A., 1997. Quantitative coronary angiog-raphy with deformable spline models. IEEE Transactions on MedicalImaging 16, 468–482.
Krissian, K., Malandain, G., Ayache, N., Vaillant, R., Trousset, Y., 2000.Model based detection of tubular structures in 3D images. ComputerVision and Image Understanding 80 (2), 130–171.
Lorigo, L.M., Faugeras, O., Grimson, W.E.L., Keriven, R., Kikinis, R.,Nabavi, A., Westin, C.-F., 2000. Codimension-two geodesic activecontours for the segmentation of tubular structures. In: IEEEComputer Society Conference on Computer Vision and PatternRecognition, vol. 1, pp. 444–451.
Lorigo, L.M., Faugeras, O., Grimson, W.E.L., Keriven, R., Kikinis, R.,Nabavi, A., Westin, C.-F., 2001. CURVES: Curve evolution for vesselsegmentation. Medical Image Analysis 5, 195–206.
Malladi, R., Sethian, J.A., Vermuri, B.C., 1995. Shape modeling withfront propagation: A level set approach. IEEE Transactions on PatternAnalysis and Machine Intelligence 17 (2), 158–174.
McInerney, T., Terzopoulos, D., 1996. Deformable models in medicalimage analysis: a survey. Medical Image Analysis 1 (2), 91–108.
Nain, D., Yezzi, A., Turk, G., 2004. Vessel segmentation using a shapedriven flow. In: Proceedings of the Medical Image Computing andComputer-Assisted Intervention (MICCAI), pp. 51–59.
Orkisz, M.M., Bresson, C., Magnin, I.E., Champin, O., Douek, P.C.,1997. Improved vessel visualization in MR angiography by nonlin-ear anisotropic filtering. Magnetic Resonance in Medicine 37, 914–919.
Osher, S., Sethian, J.A., 1988. Fronts propagating with curvature-dependent speed: Algorithms based on Hamilton-Jacobi formulations.Journal of Computational Physics 79, 12–49.
Perigaud, G., Saurel, R., 2005. A compressible flow model with capillaryeffects. Journal of Computational Physics 209, 139–178.
Schroeder, W., Martin, K., Lorensen, B., 2002. The VisualizationToolkit: An Object-Oriented Approach To 3D Graphics, third ed.Kitware Inc.
Sethian, J.A., 1999. Level Set Methods and Fast Marching Methods:Evolving Interfaces in Computational Geometry, Fluid Mechanics,Computer Vision, and Materials Science. Cambridge University Press,New York.
Sethian, J.A., Smereka, P., 2003. Level set methods for fluid interfaces.Annual Review on Fluid Mechanics 35, 341–372.
Sorantin, E., Halmai, C., Erdohelyi, B., Palagyi, K., Nyul, L., Olle, K.,Geiger, B., Lindbichler, F., Friedrich, G., Kiesler, K., 2002. Spiral-CT-based assessment of tracheal stenoses using 3-D-skeletonization. IEEETransactions on Medical Imaging 21 (3), 263–273.
Suri, J.S., Liu, K., Reden, L., Laxminarayan, S., 2002. A review on MRvascular image processing: skeleton versus nonskeleton approaches:part II. IEEE Transactions on Information Technology in Biomedicine6 (4), 338–350.
Sussman, M., Puckett, E.G., 2000. A coupled level set and volume-of-fluidmethod for computing 3D and axisymmetric incompressible two-phaseflows. Journal of Computational Physics 162 (2), 301–337.
Sussman, M., Fatemi, E., Smereka, P., Osher, S., 1998. An improved levelset method for incompressible two-phase flows. Computers and Fluids27, 663–680.
Udupa, J.K., Saha, P.K., Lotufo, R.A., 2002. Relative fuzzy connected-ness and object definition: theory, algorithms, and applications inimage segmentation. IEEE Transactions on Pattern Analysis andMachine Intelligence 24, 1485–1500.
Wink, O., Niessen, W.J., Viergever, M.A., 2000. Fast delineation andvisualization of vessels in 3-D angiographic images. IEEE Transac-tions on Medical Imaging 19 (4), 337–346.
Yan, P., Kassim, A.A. 2005. MRA image segmentation with capillaryactive contours. In: Proceedings of the Medical Image Computing andComputer-Assisted Intervention (MICCAI), Palm Springs, CA, USA,pp. 51–58.

P. Yan, A.A. Kassim / Medical Image Analysis 10 (2006) 317–329 329
Yezzi, A.J., Kichenassamy, S., Kumar, A., Olver, P., Tannenbaum, A.,1997. A geometric snake model for segmentation of medical imagery.IEEE Transactions on Medical Imaging 16 (2), 199–209.
Yim, P.J., Choyke, P.L., Summers, R.M., 2000. Gray-scale skeletoniza-tion of small vessels in magnetic resonance angiography. IEEETransactions on Medical Imaging 19 (6), 568–576.
Yim, P.J., Boudewijn, G., Vasbiner, C., Ho, V.B., Choyke, P.L., 2003.Isosurfaces as deformable models for magnetic resonance angiogra-phy. IEEE Transactions on Medical Imaging 22 (7), 875–881.
Zhao, H.-K., Chan, T.F., Merriman, B., Osher, S., 1996. A variationallevel set approach to multiphase motion. Journal of ComputationalPhysics 127, 179–195.